B A N K I N D O N E S I A - Sea-Delt
287
B A N K I N D O N E S I A REPORT FOR THE YEAR 1957 - 1958 * G. KOLFF & Co. INDONESIA
-
Upload
khangminh22 -
Category
Documents
-
view
2 -
download
0
Transcript of B A N K I N D O N E S I A - Sea-Delt

B A N K I N D O N E S I A
REPORTFOR THE YEAR
1957 - 1958
*
G. KOLFF & Co. INDONESIA

R E P 0 R T
OF THE GOVERNOR OF BANK INDONESIAFOR THE FINANCIAL YEAR 1957-1958

B A N K I N D O N E S I A
Head Office:DJAKARTA
Branch Office:AMSTERDAM
Representative:NEW YORK
Agencies:DJAWA
BANDUNG, DJEMBER, JOGJAKARTA, KEDIRI, MALANG,SEMARANG, SOLO, SURABAJA, TJIREBON
SUMATERAMEDAN, PADANG, PALEMBANG
KALIMANTANBANDJARMASIN, PONTIANAK
SULAWESIMAKASAR, MENADO
LOMBOKAMPENAN
MALUKUAMBON

1
Report of the Governor
1. GENERAL REVIEW
From the time when colonial domination was broken and lndonesia emerged as anindependent and sovereign national state, our country has never gone through so manydifficulties in multifarious fields as in the year under review. The national economy de-veloped in an unsatisfactory atmosphere. It is beyond dispute that progress and pros-perity have not, or have not yet, been achieved and that there are even symptoms ofdeterioration to an alarming extent. This downward trend must be stopped in the short-est possible time.
The factors that cause the above developments must, first of all, be looked for ininternal conditions, though it must be admitted that external factors continue to play animportant role in economic developments in Indonesia.
As discussed elsewhere in this Annual Report, economic activity in Western Eu-rope and in the United States did not maintain the high level of 1954, l9S5 and 1956, andmoved into a recession of which the end has not yet come into view. A recession in suchimportant industrial centres constituted an external factor which inevitably affected theeconomy of Indonesia. Our agricultural and mining products were largely sold to West-ern Europe, which absorbed about 40% of our total exports, while our exports to theUnited States also amounted to 40% (including our exports to Singapore for re-exportto the United States) . A recession in the countries that constitute our chief exportmarkets will generally tend to reduce our exports, while at the same time industrial coun-tries will intensify their efforts to increase the volume of their sales to this country.Meanwhile, declining exports will be a burden on our trade and payment balances.
In point of fact, the equilibrium in Indonesia’s balance of payments was disturbedbefore there were overt symptoms of recession. Prices of raw materials continued theirdownward trend even though the economic cycle was on a high level (see table on nextpage). This downward trend, which became apparent in the last few months of 1955,was temporarily reversed during the Suez crisis. Since then, however, the market for rawmaterials has been in a state of depression, which has remained unrelieved till the presentmoment.

2
Thus, two external factors endangered economic development of such underde-veloped countries as Indonesia, namely, the decline of raw material prices over the lastfew years, and the recession now enveloping Western Europe and the United States,which will inevitably further weaken Indonesia’s export markets.
The above two facts have influenced, and will continue to influence economicdevelopments in Indonesia. Declining exports brought reduced imports in their wake.As long as import reductions affect daily consumer goods, the level of consumption ofsuch goods will be lowered. However, if import restrictions involve capital goods orauxiliary goods and materials the sectors of production’ agriculture and industry—which are dependent on such imports—will be incapable of fulfilling their functionsproperly. And such untoward developments can only be prevented, or at least limited, ifthere are large foreign exchange holdings to resort to.
Comparing the present position with conditions at the end of the Korean War,when prices of raw materials also slumped, the following difference must be noted:Whereas our present foreign exchange holdings are marginal, the position at the end ofthe Korean War was satisfactory, thanks to the boom in raw material prices when the

3
war was in full swing. The satisfactory foreign exchange position at that time couldabsorb the shocks the raw material market had to withstand.
The reduction in imports for the consumer and/or the productive sector causedeconomic life to fall to a lower level, which was the chief result of the movements in thebalance of payments due to external factors as illustrated above.
Another effect of the movements in the balance of payments is to be seen in themonetary field, revenue in Indonesia being greatly dependent on international trade. Adecrease of imports and exports means a reduction in revenue from indirect taxes suchas T.P.I. (import surcharges), import and export duties, and the like.
At the same time, it is very difficult to retrench on short term on planned expendi-ture and therefore the outcome is that the final budgetary deficit exceeds the originalestimate. Up to the present such deficits have been covered by short- term loans fromBank Indonesia. This results in an increased supply of money not accompanied byincreased production (upward trend of the trade cycle), but the volume of money incirculation rises while economic activity is low because of reduced imports. Inflationarycharacteristics are inherent in such a situation, thus endangering the development ofproduction which at the moment is hampered by the short supply of capital goods,auxiliary goods and raw materials.
Such is the picture of our economy insofar as it is influenced by external factors asillustrated above.
Indonesia’s economic development in the year under- review did not solely or pri-marily encounter difficulties arising from external events. Internally. events came to passwhich greatly affected the development and position of our economy. In other words,external and internal events combined and interacted to aggravate the pressure retardingIndonesia’s economic development.
Internal events hinged on two basic issues:
l) strained relations between the Central Government and certain Regions and2) the West Irian issue between Indonesia and the Netherlands.

4
Relations between the Central Government and the Regions grew strained at theend of 1956 as mentioned in the 1956/57 Annual Report. The tensions increased in thecourse of 1957 and came to a head at the beginning of 1958 when a counter-governmentwas initiated in West Sumatra under the name of the Revolutionary Republic of Indo-nesia Government, which appeared to be backed by North Sulawesi only. The dissen-sions between the Central Government and the Regions caused several Regions to chan-nel their foreign trade outside the trade system and organs applying to Whole Indonesia.They engaged in “barter” trade, which simply means that their foreign exchange pro-ceeds were withheld from the Central Government, while at the Same time the barteringRegions continued to apply to the Central Government for foreign exchange to financetheir imports. Thus, the balance of payments was put under pressure from two sides—firstly, due to the curtailed flow of export proceeds of these Regions (Which were interms of foreign exchange) into the foreign Exchange Fund; secondly, due to the for-eign Exchange Fund’s continued financing of regional imports.
The adverse development of the balance of trade, payments resulted in a drop inthe Rupiah revenue of the Central Government and a subsequent increase of the Gov-ernment debt with Bank Indonesia. This inflationary trend could not be restrained byreducing expenditure for the Regions, which continued to demand outlays on the partof the Central Government to finance their own expenditure. The Central Governmentonly stopped allocating foreign currency and rupiahs to West Sumatra and North Sulawesiwhen they formed a counter-government.
Barter on a large scale was conducted by several Regions as from May/June 1957,and total export proceeds for 1957 (excluding oil) were recorded at Rp 6.8 billion againstRp 7.4 billion in 1956—a drop by about Rp 600 million or by about Rp 1 billion ifcomputed on an annual basis. Evidently this figure is merely an estimate since the de-cline was not caused by barter transactions exclusively, but also by other factors, such asthe recession, weak prices for raw materials, low productivity etc., but barter remainedthe major factor.
The conflict with the Netherlands on West Irian came to a head in December 1957,when the Dutch were not disposed to accept the Indonesian proposal to hold negotia-tions under United Nations supervision. Feelings ran so high that the Government

5
deemed it necessary to ensure continued production of Dutch enterprises in Indonesiaby placing them under supervision. For all practical purposes, these measures did notaffect economic development in 1957 as they were taken in the last month of the year.The year 1958 will give a clearer picture of our economic position after placing theDutch enterprises under supervision. Fundamentally, the consequences of the mea-sures taken by the Government can be viewed from the short-term and from thelong-term aspect. This view involves two considerations—production and exports. Upto the end of March 1958, production and exports from estates under Governmentsupervision do not appear to show any large-scale decline; in some instances (as in thecase of rubber) they showed the same development as in 1957. As stated above, how-ever, a true picture of production and exports can only be given at the end of l958. Thepresent review must be restricted to the short term. The production and export of someestate products are revealed in the tabulation given below.
It can be visualized that, on the short term, production and exports from estatesunder Government supervision might drop due to difficulties arising from lack of ex-perts, materials and transportation, unless such shortages could be supplied at shortnotice. With this possibility in view, care should be taken that, should productivity andexports fall off in the long run, the difficulties causing such decline should be metimmediately, thereby limiting losses.
In summary, the above may demonstrate that the economic climate of Indonesiain the year under review was affected by external factors (weakening prices for raw

6
materials, recession in Western Europe and the United States), as well as by internalfactors such as, particularly the dissension between the Central Government and theRegions. The consequences of the West Irian conflict were not yet felt economically in1957 since measures against Dutch enterprises were taken only in December of thatyear. Thus, the economy of Indonesia developed in an unsatisfactory atmosphere whichcontained elements which hampered and lowered economic activity in various sectors.
Foreign exchange reserves dropped by about Rp 1 billion in 1956. From Rp 1,566million per January 1, 1957, foreign exchange holdings dropped to Rp 1,295 million perMarch 1957, and continued to fall to Rp 967 million per June 1957—a drop by 40% in6 months’ time. Had this development continued, our foreign exchange reserves wouldpractically have been depleted by the end of 1957. In the middle of 1957, reserves wereonly sufficient to finance about 11/2 months’ imports, if the level of l956 imports(amounting to Rp 9.3 billion) were taken for 1957.
Meanwhile the volume of money in circulation rose from Rp 13.4 billion at the endof 1956 to Rp 15.1 billion per June 1957—an increase by 13%. The public sector ap-peared to be the biggest source of money creation since it caused the money supply toincrease by about Rp 2.4 billion in the first 6 months of 1957, against an increase by Rp0.9 billion in the private sector.
It is self-evident that the above conditions were not conducive to economic activ-ity. So as to conserve foreign exchange reserves temporarily, the Government at onetime (April 1957) was compelled to suspend imports. At that time economic life couldcontinue (though not as smoothly as it should), thanks to the substantial volume ofimports in 1956 so that commodities were in fairly sufficient supply, and the import-stop did not cause prices to jump, as witness the following index numbers:

7
This temporary import-suspension should be seen as the first step the authorities hadto take with a view to the very low position of foreign exchange reserves, though, of course,it could not last indefinitely. The foreign exchange position, on the other hand, precludedresumption of imports, unless other measures were taken simultaneously. The volume ofmoney in circulation was exceptionally large and buying power so great that foreign ex-change holdings would have been exhausted in a short time. Likewise, the supply of goodscarried over from 1956 would soon be exhausted if no new purchases were made. Priceadvances were unavoidable if imports were not resumed on an adequate scale.
Such was Indonesia’s economic position in the first half-year of 1957. The Gov-ernment was confronted with a short-supply of commodities, which was bound to forceprices up since the foreign exchange reserves were very low, while foreign exchangeproceeds were inadequate due to stagnant exports. Stagnancy in exports was caused, asstated above, by dull markets for raw materials, while inflationary conditions increaseddomestic costs. Moreover, only part of the country’s actual export proceeds flowed intothe coffers of the state when barter grew rampant.
Any measures to be taken should satisfy the three-fold purpose of contracting thevolume of money in circulation, of re-activating exports, and of eliminating barter trading.
To cope with the increasing volume of money in circulation, the Government re-stricted through the Monetary Board, the credit facilities of private banks as from May 1957.Bank Indonesia, charged with implementing monetary restrictions, made it compulsory forprivate banks with deposits and clearing balances totalling Rp 75 million or more, to convert10% of their ready money into treasury notes and bills, and further to observe a ratio of aleast 30% between their ready money and their aggregate deposit and current accounts.
A further measure taken by the Government revised the foreign exchange systemincluding imports and exports. For the details of this system the relevant chapters in thisReport may be referred to: this survey may suffice by examining the main features of thenew foreign exchange system, known as the “Export Certificate” system. The value ofthe Rupiah vis-a-vis a foreign currency is, in essence, determined by the relation ofsupply and demand for that foreign currency. The demand for a foreign currency isexpressed in Rupiahs, in other words: essentially the money circulating in the countryconstitutes the buying power vis-a-vis the foreign currency. The supply of foreign cur-

8
rency consists of the country’s foreign exchange holdings, export proceeds and otherforeign exchange revenue. As mentioned above, the volume of money in circulation inthis country at the end of May was of the order of about Rp 1 5 billion, net foreignexchange reserves amounted to Rp 994.8 million, while foreign exchange proceeds fromexports stagnated. As the result of this position, the value of the Rupiah was far lowerthan the parity officially fixed in 1952, when U.S. $ 1 was made the equivalent of Rp11.40. At that time, the volume of money in circulation was Rp 5,107.7 million, theforeign exchange reserves Rp 988.7 million, while exports were moving far better thanin May 1957. It would have been unrealistic, in the changed circumstances, to maintain aRupiah rate of Rp 11.40 to the U.S. $, thereby imposing a heavy burden on exportswhich would only receive Rp 11.40 to the U.S. $, while actually the value of foreigncurrency was at a much higher level than the official rate of exchange. On the otherhand imports were subsidized seeing that they only paid Rp 11.40 for every U.S. $ pur-chased to finance imports. This subsidy was borne at the cost of exports since theforeign currency originated with them, and at the cost of the Government insofar asforeign exchange reserves were utilized to finance importers’ applications for foreignexchange. Thus, the official Rupiah rate of exchange had become unrealistic— it ham-pered exports and stimulated imports.
Seeing that exports needed a boost, the Government decided on June 20, 1957 toabandon the official Rupiah rate of exchange and to permit the Rupiah to find its ownvalue on the basis of controlled supply and demand (implying, for instance, that onlyholders of import licences could buy foreign exchange, while foreign exchange pur-chases for capital transfers were not permitted). The Government held out the hopethat exports would advance enough for imports to be resumed. Moreover, the Govern-ment hoped that bartering would cease seeing that exports through the regular channelswould be more profitable for the Regions.
Imports automatically became more expensive. While previously standing at Rp11.40, the U.S. $ was valued at about Rp 22.80 on the Export Certificate market at thetime of the inception of the new system. This sacrifice had to be made, seeing thatunder the old system imports benefited at the cost of the export (and public) sectors,which would eventually have led to both reduced exports and reduced imports. Con-tinuation of imports on the basis of Rp 11.40 to the U.S. $ would—in view of theattenuated foreign exchange holdings and receding export proceeds—have resulted in

9
an import-squeeze and a subsequent import- stop followed by a dwindling supply ofcommodities and soaring prices, even though officially the Rupiah rate of exchangevis-a-vis the U.S. $ would have stood at 11.40: 1.
Another expedient to maintain the rate of exchange at 11.40: 1, might have beenGovernment subsidies to exporters (in fact, this would have meant subsidies to import-ers), by paying out more than the official rate for dollars from exports flowing into theForeign Exchange Fund, while selling dollars to importers at the official rate of Rp11.40: 1. This was impracticable because of the implied inflation of the Governmentbudget and the ultimate swelling of the volume of money to such proportions as tomake normal economic activity impossible.
Government endeavours to improve conditions, as embodied in the new system,were not fully realized because the Regions continued bartering under various pretexts,in some cases even expanding barter transactions after May. And so, the new foreignexchange system never included overall exports from Indonesia.
In spite of the fact that the barter regions did not participate in the new system,and continued to keep the greater part of their foreign exchange earnings for them-selves, the new system enabled exports to be resumed so that foreign exchange holdings,which stood at Rp 967 million in June, rose to Rp 1,432 million in September. Thedevelopment of our foreign exchange position is illustrated from the following data onour cash balance in million U.S. $, compiled in the United States.
1956, 31 December 1861957, 31 March 145
30 June 12831 July 13931 August 16730 September 17931 October 19030 November 1873I December 151
1958, 31 January 138(Source: Federal Reserve Bulletin).

10
Thanks to the new foreign exchange system, our foreign exchange holdings in-creased up to October. Since then and up to the present, our foreign exchange reservesagain showed a downward tendency.
Many factors contributed to this untoward development. The price levels of pri-mary materials on the world market sank deeper, a fact certainly not unconnected withthe inception of the recession in Western Europe and the United States. Peaceful rela-tions did not reign yet over the islands of Indonesia. Instead, the tensions between theCentral Government and the Regions aggravated while bartering became more wide-spread. Furthermore, though the measures taken against Dutch enterprises in the begin-ning of December will only show their full effects in 1958, the stir at that time impededexports, to say the least, especially as shipping space and other transportation to carryexport cargoes ran very short. Besides impeding exports, the measures against the Dutchenterprises required extraordinary outlays on the part of the Government to ensure thelivelihood of the workers in several enterprises which had been put under supervisionand could not run at capacity. Finally, the Government was compelled to spend largesums in connection with the regional tensions followed by rebellions in Central Sumatraand North Sulawesi.
Self-evidently, the increase in the volume of money in circulation exercised infla-tionary pressure. As a case in point: the domestic price of rubber (sheet I) rose from Rp925 per qt. in May 1957 to Rp 1,369 per September and Rp 1,430 per December 1957,while in the first quarter of 1958 prices were January Rp 1,367, February Rp 1,454 andMarch Rp 1,668 per qt. In contrast, the prices for R.S.S. I and Crepe I showed lowerprice levels on foreign markets: R.S.S. I was quoted at Rp 734 per qt. in May, Rp 694 inSeptember, and Rp 651 in December 1957.
(Export Price—f.o.b. price on the basis of the official rate (at par) without ExportCertificates).
Exports, facing obstacles both at home and abroad, inevitably dropped Indonesia’seconomic position at the end of the year can be gathered, in a nutshell, from the follow-ing figures.

11
Firstly: export figures (excluding oil) in million of Rupiahs:1957 1957 March June September October November December6,876 611 514 593 679 517 313
The overall export figure for 1956 (excl. oil) was Rp 7,381 million.Secondly : foreign exchange reserves dropped from Rp 1,432 million per September
to Rp 1,231 million per December 1957, and from Rp 1,109 million perJanuary 1958 to Rp 977 per February 1958.
Thirdly : the volume of money increased continuously as follows (in billions of ru-piahs):
1956 Dec. 1957 March June Sept. Dec. 1958 Jan. Febr. March13.4 13.4 15.1 16.9 18.2 19.0 19.2 18.2
Fourthly : As mentioned before, the volume of money in circulation, which steadilyincreased by nearly Rp 5 billion or about 37% in the period January/March1957 through March l958, could not but exercise an inflationary pressureon prices, including the price of foreign currency on the official (ExportCertificate) market as weld as on the curb exchange market.
As set forth above, the Government was largely responsible for the increased vol-ume of money in circulation. To finance its expenditure the Government had to borrowfrom Bank Indonesia. Advances to the Government from Bank Indonesia amounted toRp 5,372 million in 1957 against Rp 2,302 million in l956. In the aggregate the publicsector (Government + autonomous regions + Government enterprises and founda-tions) accounted for an increase in the money supply by Rp 5,833 million in 1957 againstRp 2,267 million in 1956. The private sector also was a source of inflation to the tune ofRp 2,237 million in 1957 against Rp 989 million in 1956. This increased inflationaryeffect of the private sector was not caused by money creation on the part of the banks,but by refunds on the part of the Government of prepayments to the amount of Rp2,662 million to importers. In fact, money creation by banks dropped by Rp 423 millionin 1957—a decrease which was brought about (as discussed above) by credit restrictionsas from May l957, which were further tightened as from September 1957.

12
Prices advanced. Among other things it was the advanced price of rice, caused bythe annual period of scarcity beginning in September 1957, speculative activities andregulations devised by certain districts, hampering a smooth rice distribution, whichcaused the average price of twelve foodstuffs in the countryside of Djawa and Madurato rise by 66% (December l957 as compared with December 1956). Further, prices of44 import commodities rose by 30%, textiles by 43%, rubber (sheet I) by 30 %, whitepepper by 35%, coffee (Robusta) by l5O%, tea by 11% and so forth. The Export Cer-tificate price, standing at about Rp 22.80 for U.S. $ 1 at the start, also rose and graduallyreached a level of Rp 33 for U.S. $ 1 representing a rise by 200% compared with theerstwhile rate of exchange (Rp 11.40). On the curb market the price of the U.S. $ rosefrom Rp 42 in June to Rp 62 in March 1958—a rise by 50%.
In view of the increase in the money supply by about 37%, the drop of the Rupiahvalue by about 200% vis-a-vis the U.S. $, the rise of the Export Certificate price by 50%(originally standing at Rp 22.40 = U.S. $ 1, the Export Certificate price advanced to Rp33 = U.S. $ 1), the price level of commodities did not rise to the extent that might havebeen expected. Prices of import commodities, for instance, only rose by 30% those ofexport commodities such as rubber also advanced by 30%, while tea and pepper showedprice increases by 11% and 35 % respectively. Thus, it would appear that the flight ofmoney into goods—as often occurs in an inflationary atmosphere— did not take placeon a large scale. The ban on hoarding, which was implemented by the Army, was one ofthe factors accountable for this phenomenon. Only a few commodities such as wood,scrap iron, weaving yarns (which can easily be stored) were possible targets for dispos-ing of some of the surplus money.
Seeing that the prices of goods did not advance as rapidly as the increase in thevolume of money, it was feared that commodity prices would soar in the absence ofstrict control, because the volume of money was very substantial and rose at a relativelyhigher rate (+ 37%) than did the volume of goods originating from production andimports. It would appear that cash is kept in rather large amounts, which is also demon-strated by the high liquidity of banks in the last few months.
Indonesia’s economic position as briefly summarized above in four items, shows ahighly unsatisfactory picture. A foreign exchange position which, in March 1958, only

13
sufficed to finance about 1 month’s imports, is far from satisfactory, the less so in viewof the continuing dullness of exports. Meanwhile the revenues of the National Exche-quer decreased, while outgoings continued at the same rate and even increased. In spiteof aid from Japan (war reparations), from Russia (credits), and from the Chinese People’sRepublic (credits), the economic position remained critical.
In contrast with the past, the present difficulties cannot be solved by economicmeasures only. First and foremost a solution must be sought in the political and militaryfields. So long as national unity has not been restored, economic measures cannot befully effective, as witness the failure of the new foreign exchange system to becomeeffective for the whole of Indonesia. At the close of the financial year it was clear thatthe Government was firmly resolved to make the country one and united again.
Pending the outcome of Government measures in the political and military fields,it is appropriate and necessary to consider what economic measures ought to be takenforthwith to bring about an overall improvement of the economy of Indonesia, includ-ing the economies of the Regions. The Government is prepared to give the fullest con-sideration to the interests of the Regions within the framework of national unity. TheRegions, so I believe, will also be found prepared to cooperate in attaining the prosperityto which we all aspire.
The above survey may have been helpful in establishing the conviction that the resus-citation of our export trade is of vital importance in the present circumstances, seeing thatthis will enable us to increase imports and to rebuild our depleted foreign exchange reserves.Furthermore, the revival of our international trade will augment revenue from both indirectand direct taxes, so that the budgetary deficit, which so far has been the chief source ofinflation can be reduced. Also, if the Government is successful in its endeavours in thepolitical and military fields, Government expenditure can be reduced. It is clear that anall-out export drive is a task of the utmost urgency and importance.
The return of the Regions to national unity will put a stop to the barter trade,which has been responsible for export proceeds for the whole country not flowing intothe National Exchequer. The volume of barter transactions is not known exactly, but itis estimated to have amounted to no less than Rp 1,300 million.
14
Though looking to the cessation of barter trading as a means of increasing foreignexchange revenue, we should realize that the export trade will not automatically resumesmooth functioning. Bartering has reduced direct supply to the traditional export mar-kets of Indonesia; barter goods were generally sent to Singapore, whence they reachedthe ultimate consumers by devious ways. Indonesian rubber and copra, for instance,have been sold abroad as originating from other sources. In other words, products ofIndonesian origin have become less well known in foreign markets and will have to bere-introduced if we are to recapture those markets.
In fact, barter has severely harmed both Indonesia as a whole and the barteringRegions. It all boils down to the fact that Indonesia—and its component Regions—must conduct the sales of their agricultural and mining products in the markets thatoffer the highest prices, and make their purchases in the markets that offer the mostadvantageous conditions. In short, Indonesia must sell dear and buy cheap. Barter trans-actions as conducted by the Regions have been in direct opposition to this principle,since sales of Indonesian products are tied to purchases that are not free, but must bemade in bartering centres like Singapore and Hong Kong. In other words, Indonesia hasbeen selling cheap and buying dear. Furthermore, barter trade completely ignores thebalance of payments where the services sector is concerned. In a manner far fromperfect, barter spends export proceeds on imports and does not provide for the servicessector. Barter has doubtlessly been highly lucrative for merchants in Singapore and HongKong, while the profits should, by right, have flowed to the business community and thepeople of Indonesia and its component Regions. Singapore and Hong Kong merchantshave managed to buy our commodities at the lowest possible price, while selling usgoods at the highest possible price. Apart from the direct losses entailed by bartering,this system has left us with a number of problems, such as, the doubt created aboutIndonesia’s capacity as a regular supplier: doubt about the standard of quality of ourexport products; doubt about the skill and capacity of Indonesian exporters. The timehas therefore come for a reconsideration of our export framework.
In fact, the time has come to subject our economic philosophy to a thorough andexhaustive examination, since Indonesia will enter upon a new era if and when thepresent political crisis is overcome as anticipated.

15
Generally speaking, Indonesia’s economic development has inadvertently gone theway of individual enterprise and has followed individual lines of thought. The liquida-tion of the colonial economy has been interpreted as a replacement of Dutch entrepre-neurs by their Indonesian counterparts. The fact has been overlooked that the Indone-sian people are poor and lack experience. In fact, it is doubtful whether national devel-opment can cope with a great many obstacles if it is entrusted to individual enterprisewhich lacks capital and skill. In actual practice, entrepreneurs in need of capital take theview that the Government is duty bound to provide them with their requirements. Thisoccurred in the past and the oddness of this attitude should be realized, since Govern-ment money is public money, which, if utilized, should benefit the whole public and notthe individual. Supplying capital to individual entrepreneurs implies that any loss willcome to the charge of the public as a whole, while any profit will be to the advantage ofthe entrepreneur concerned. Such a policy—which, I reiterate, has generally not beenpursued intentionally actually leads to the growth of a national capitalist group, whichdoes not come into being through its own efforts and through carrying its own risks, butthanks to Government aid.
I doubt whether our revolution had as an object the creation of a group of indi-vidual entrepreneurs living on the money of the people—the creation of a small, thoughnational, group growing prosperous by the sweat of people. I also doubt whether thesystem of bringing our country to development through individual energy and effort isin keeping with our condition. It has become clear that the individual is weak in Indone-sia and he needs the support of the Government, while the Government has to bear thelosses and does not share in the advantages reaped. It is obvious that Governmentsupport is indispensable in present conditions. This, however, poses the question why,if this is actually the case, the Government itself should not undertake national develop-ment. Of course, there are risks. But then, Government support to private enterprisesdoes not eliminate such risks, while any profits will fully come to the benefit of theGovernment—that is, to the benefit of the public in general and not to the benefit of asmall group—if the Government engages in such enterprises for its own account. Thiswill bring the Government implemented work of development closer to the fifth prin-ciple of Pantja Sila, the ideology of our State. Furthermore, 1 think it more in line withthe conditions in our State if the work of development is implemented by the Govern-ment. The skill our people lack due to century-long colonial domination, can more easily

16
be acquired by the Government than by individual entrepreneurs since the necessaryforeign experts prefer Government guarantees to the guarantees of a private entrepre-neur. Thus, the Government is in a better position to overcome the shortages of capitaland skills. For this reason I firmly believe that the Government must play the leadingrole in the work of national development.
Besides, conditions abroad have developed in such a manner that private enterprisein the sense of the 19th century liberal capitalist philosophy has practically disappeared.The economy in socialist countries is obviously in the hands of the Government, whileprivate entrepreneurs in Western countries have associated into large units, such as theEuropean Coal and Steel Community, the gigantic enterprises in the United States, etc.In this connection it should be remembered that as an outcome of the experience gainedin the European Coal and Steel Community, six Western European countries have agreedto set up a Common Market. This implies that trade between those six countries (TheNetherlands, Belgium, Luxembourg, West Germany, France, and Italy) will be conductedon a free basis, unhampered by import duties and similar obstacles. All this will beaccomplished in 11 to 15 years. It is only a matter of great regret that this effort to attaina larger marketing area than the national market has been used to establish a commonimport tariff against non-member countries. Import duties at a rate of 30% will beimposed on agricultural products such as tobacco—a discrimination strongly to thedisadvantage of non-member countries such as Indonesia, if compared with the mem-ber countries or with countries having special relations with the common market. Italianor Congo tobacco, for instance, will freely enter the Common Market, while Indonesiawill have to pay 30% import duty. This high rate of duty is a striking form of protection,which runs counter to the basic objects of the G.A.T.T. It also counters the trend toincrease world trade by removing various obstacles. A common tariff of import dutiesis a less desirable result of the idea of association which is steadily gaining ground.Indonesia and the other countries that stand to be harmed by this measure must makeassociated efforts to remove the obstacles created by the European Common Marketcountries.
This is one more reason why it would seem inexpedient to me if Indonesia, as yetweak, should counter the formidable foreign economic units—in the west as well as inthe east—by insignificant units based in individual enterprise still lacking strength due toinadequate capital, skill and experience.

17
If Indonesia aims at rapid and sound development, it must supersede the smallunits which so far have been the vehicles of economic development.
I do not mean that all economic activity in Indonesia should be in the hands of theGovernment. But, it is my strong belief that the Government must play the leading rolein national upbuilding, while private enterprise should only be carried on if those smallunits are run on cooperative lines, or combined into large-scale associations.
As a matter of fact, the economic philosophy just set forth is supported by aprinciple that has been alive in our society for centuries and forms part of the Indone-sian national identity. I refer to the principle of “gotong rojong” (mutual help). Anyweakness has always been overcome in Indonesia by combining potentials under the“gotong rojong” principle. Our sovereign national Government has been the most out-standing achievement of the “gotong rojong” system of our people. This very same“gotong rojong” can be applied in such a manner that minuscule units of private enter-prise work with greater efficiency, thus counterbalancing the large-scale foreign units.As the training of private entrepreneurs generally takes time, the Government would dowell to take the lead in the present state of emergency.
If the above conclusions should be made the basis for the solution of the exportproblem after the return of the Regions into the Unitary State, I would suggest thatexport centres be established in each region, in cooperation with the Central Govern-ment. Such centres, jointly owned by the Central Government and the Regions con-cerned, would collect agricultural products for export. Further, the export centres mustfind export channels abroad. I hold the view that the centres would be in a better posi-tion to find such channels than individual exporters. Such centres can also be used forimport purposes.
It is my conviction that exports can be increased and imports facilitated if suchregional export and import centres are established. This will have the added advantageof enabling the Regions to take an active part in the export and import business.
Next to the highly important export problem, the question of rice supply andtransportation requires a solution at short notice. On the average, Indonesia expends

18
U.S. $ 75 million annually on rice imports. Increased rice production is an absolute must.If production could be raised by 10%, there would be no need for rice imports. Thiswould also mean strengthening the balance of payments position. Once increased pro-duction has been accomplished, the paddy purchase system must be improved so as toprotect both the interests of the smallholder and of the consumer. Purchases should bearranged in such a manner that the Government can store supplies against periods ofscarcity and also with a view to checking speculative operations.
It is not a matter for argument that a solution must be found for the transportproblem. Indonesia being an archipelago, inter-regional communications must be safe-guarded in the interest of exports, imports, and industrial and cooperative activities,—inshort, in connection with economic activity in several fields.
At present our country is passing through multifarious difficulties and confrontedwith an alarming economic situation. The political tensions between the Central Gov-ernment and the Regions must be liquidated. Attempts in that direction are now goingforward. Our hopes are pinned to the restoration of national unity in the shortest pos-sible time.
A start can be made with improving economic conditions when the dissensionsbetween the Central Government and the Regions have been settled. Measures of widescope must be taken in the economic sphere, particularly in the export sector. I believethat Indonesia is capable of weathering the present economic crisis. I base this belief onthe wealth of our natural resources, whose products are still in demand on the worldmarket in spite of the recession. We only need to dig them up. For this reason, legisla-tion governing investment of foreign capital, agrarian affairs, mining and oil, must beenacted within a reasonable time.
Finally, I have confidence that our moral strength will be capable of converting by“gotong rojong” our weaknesses as individuals into our strength as a society, if ourpotential is focussed on the Government, the cooperative movement, or any form ofassociation which can build up Indonesia more rapidly, more effectively and more effi-ciently than has been done in the past.

19
II. INTERNATIONAL ECONOMIC DEVELOPMENTS
lntroductory
Much concern was caused late in 1956 by the Suez Canal crisis and by political develop-ments in Poland and Hungary. Fortunately, the countries concerned were not paralyzedeconomically as this would have caused economic repercussions throughout the world. Owingto the short duration of the political crisis, which lasted through the last quarter of 1956 andfirst quarter of 1957, losses could be minimized by utilizing monetary reserves or by creditsconcluded bilaterally or through international agencies. Nevertheless, the damage done wasconsiderable, and even though economic activity was maintained at not too low a level, arecession was feared in the course of 1957. Now that the year 1957 has passed, it wouldappear that world economy, including the economies of the countries involved in the politi-cal crisis of late l956, have not been affected in such a manner as to show retrogression ascompared with conditions prior to the crisis.
Progress might have been greater in the absence of the crisis, but this presumptionis purely academic as it would seem that the above events have brought about a revisionof the economic organization of, for instance, Hungary and Poland, which seems tohave borne good fruit.
Apart from the political events referred to above, the international economy con-fronted other difficulties inherent in the economic cycle. The achievement of a highlevel of economic activity including full employment, yielding a steadily increasing na-tional income, but not to be accompanied by a disturbance in the monetary stability, isthe aim that every country has set itself. Yet monetary disequilibrium was hardly avoid-able seeing that the danger of inflation was rampant in several countries, in the form ofboth demand pulls and cost pushes. This caused prices to spiral up steadily and everycountry was concerned that at a certain moment the race between prices and wageswould come to a point where economic levels must be lowered. Inflationary pressuresbecame undeniably clear as shown by the deficits on the balance of payments of suchcountries as France, the United Kingdom and Poland. The Governments of severalcountries were compelled to take steps to curb inflation. The United Kingdom, theUnited States and other countries issued regulations aimed at guiding and restrictingmoney supply. The measures taken, partly concerned taxes and the budget, and partly

20
were related to the monetary field through higher rates of interest of the central banksand/or direct credit restrictions. Balance of payments difficulties came to a head inSeptember when the French franc was devalued. It was generally Deteriorating eco-nomic conditions in the underdeveloped countries will inevitably reduce the export vol-ume of the industrialized countries.
The improvement of economic conditions in the underdeveloped countries wouldseem the obvious course to help stem the recession. It is to be hoped that the industri-alized countries, who, so far, have been indifferent to the disastrous effects of strongfluctuations in raw material prices may realize how beneficial the effects of stabilizationmight be, also to themselves.
The establishment of the European Common Market, officially signed in Rome inMarch 1957 and afterwards ratified by some of the parliaments of the signatory coun-tries is too young yet to make its influence felt. The European Common Market and theFree Trade Area, which is still under negotiation, will be reviewed at greater lengthelsewhere in this report.
United States of America
The Gross National Product (G.N.P.) proved to have risen in the United Statesfrom $ 414.7 billion in l956 to $ 434.4 billion in 1957. In terms of value, the l957 G.N.P.showed an increase by $ 19.7 billion an all-time record. Even if l957 price increases aretaken into account, the l957 G.N.P. was still on a very high level, namely, $ 434.4 billionagainst $ 430.3 billion in 1956 (computed on the basis of l957 prices).
The above figures are emphasized to avoid misinterpretation of the phenomenaof the United States business cycle. In 1957 the United States was still passing througha period of prosperity. Personal income aggregated $ 343.4 billion against $ 326.9 billionin 1956. The net disposable income (after deduction of taxes) totalled $ 300.6 millionand $ 287.2 billion respectively. Computed on the basis of 1957 prices, disposable in-come amounted to $ 300.6 billion for 1957 and $ 297.0 billion for 1956, or still moremoney to spend in 1957 than in 1956.

21
When approached more closely, however, the G.N.P., though still showing improve-ment in 1957, did not rise by 5% but by only l % (against 7% in l955 and 3% in 1956). 4/5 part of this increase appeared to be due to enhancement of prices, so that it wouldseem to imply that improvement in economic conditions, which started slackening offin l956, continued this trend in 1957.
A more thorough analysis might even leave the impression that the United Stateseconomy was slipping off its high level. While the greater part of the G.N.P. compo-nents still showed increases, a decline became noticeable in one item. Gross privatedomestic investments dropped from $ 65.9 billion in 1956 to $ 64.4 billion in 1957. Aquarterly breakdown of G.N.P. shows an upward trend from the 2nd half-year 1956onwards, which only tended to slip back from the 3rd quarter of 1957. This is shown byfigures of the G.N.P. below (on annual basis and in billions dollar) :
Gross National Product1956
3rd quarter 416.74th quarter 426.0
19571st quarter 429.92nd quarter 435.53rd quarter 440.04th quarter 432.6
19581st quarter 424.0 (estimate)
Further examination shows that, actually, all the components of G.N.P. showedsetbacks since the 3rd quarter of l957. Only the expenditure of the State governmentscontinued to rise.
The trend of the above figures shows that economic conditions started to leveldown since the 3rd quarter of 1957. The greatest setback was suffered by the sectorPrivate investments, which decreased by $ 5.2 billion from the 3rd till the 4th quarter1957 to drop further by $ 7.8 billion in the 1st quarter 1958. This was due in the firstplace to movements in the inventories of enterprises which dropped by $ 2.7 billion inthe 4th quarter 1957 by $ 7.5 billion in the 1st quarter l958—a movement which ac-

22
counted for more than half of the setback to the amount of $ 7:8 billion. In the secondplace, this was due to the decline in capital investments for the manufacture of produc-ers’ durable equipment from $ 30.0 billion in the 4th quarter 1957 to $ 27.3 billion in the1st quarter 1958—a drop by $ 2.7 billion. Noteworthy in this connection is the indexnumber for industrial production ( 1947-1949 = 100), which, standing at 143 in 1956and well into 1957, dipped from September 1957 and continued to drop till March 1958:August 145; September 144; October 142; November 139; December 135; January 133;February 130; March 128.
A slowdown of such dimensions obviously had an impact on employment figures.The number of unemployed rose from 3.3 million in December 1957 to 5.2 million inMarch 1958, representing about 7% of the total of employed persons (December 1957:5%).
Such high unemployment figures should normally have shown a repercussion inPersonal Income. However, this was not the case: aggregate personal income only de-creased from $ 343.6 billion in December 1957 to $ 341.1 billion in March 1958, thanksto social welfare provisions and a rise in agricultural production. As it turned out per-sonal income was spent not so much on durable goods, but rather on non- durables andservices. The figures for purchases of durable goods dropped (4th quarter 1957: $ 34.4billion—1st quarter 1958: $ 31.5 billion), while those for non-durables rose (4th quarter1957: $ 140.8 billion—1st quarter 1958: $ 141.5 billion). The figures for services alsoshowed a rise from $ 107.2 billion in the 4th quarter of 1957 to $ 108.0 billion in the 1stquarter 1958.

23
The shift in the outlay of personal income as shown above did not promote capitalinvestment in the industrial field, which besides, did not obtain the regular orders formaintaining inventories. On the contrary, inventories were much reduced as to be ad-justed to reduced selling.
Foreign trade, though still showing a surplus (4th quarter 1957 $ 3.2 billion; 1stquarter 1958—$ 1.5 billion) nevertheless declined due to a recession in Western Europeand in underdeveloped countries.
With a view to balancing the budget the Federal Government reduced defenseexpenditure (2nd quarter 1957—$ 46.3 billion; 4th quarter 1957 — $ 45.0 billion Istquarter 1958 — $ 45.0 billion) and did not contribute to preservation of buying power.The Governments of the States, however, increased purchases so that eventually theFederal Government had to increase the money supply from $ 86.4 billion in 1957 to $88 billion in the Ist quarter of 1958.
After examining all the factors that may be set as a standard, there is no gainsayingthe fact that the United States business cycle has entered upon the 3rd recession sinceWorld War II (1948/1949, 1953/1954, and 1958/ ).
As in Western Europe, the boom could not be freed from inflation which seemedto endanger economic development. All through 1956 and during the greater part of1957 inflation was considered a danger that had to be warded off. The Governmentendeavoured to use the budget as a means of reducing the volume of money it circula-tion. The 1956/1957 budget, though on a high level, showed a surplus of about $ 1.6billion. Obviously the budget policy was essentially aimed at reducing expenditure (suchas in the defence sector) and at increasing revenue, including taxes.
In line with the measures taken by the Government, the central bank endeavouredto restrict credit facilities through banks by raising the discount rate and engaging inopen market operations. The rate of the Federal Reserve Bank of New York, whichstood at 2 3/4% in April 1956, was successively raised to 3% in August 1956 and onAugust 23, 1957 to 3 1/2%. Thanks to this policy, demand deposits which stood at $111,391 million at the end of 1956, dropped to $ 105,000 million in September 1957.

24
Meanwhile the level of prices could not be said to have dropped. The index num-ber for consumer goods (1947/1949 = 100) stood at 120.2 in 1957 against 116.2 in1956, while the index numbers for January and February 1958 were 122.3 and 122.5respectively. The index numbers for wholesale prices stood at 114.3 in 1956; 117.6 in1957; and 119.7 in March l958. Higher price levels were largely due to increased pricesof foodstuffs, agricultural products, house rents, etc.
Labour wages in several industries amounted to $ 82.39 a week in 1957 against $79.99 in 1956. However in 1958, the level of the same wages dropped to $ 81.27 inJanuary, $ 80.64 in February, and $ 80.65 in March 1958.
As the result of an analysis of the figures reflecting economic conditions in theUnited States, the following conclusions may be drawn:
1) A recession set in the 4th quarter of 1957 which had not come to a standstill on thedate of closing this Report.
2) The component Inventories suffered the greatest setback — inventory purchases in1955 and 1956 were roughly $ 4.5 billion, for 1957 they stood at $ 0.8 billion with acontinuing downward trend. Here an inventory recession might well be spoken of.
3) Prior to the recession, the Government and the Central Bank successfully levelledoff the business cycle by checking money supply, but this failed to check price in-creases.
A recession in the United States, the foremost economic unit of the world, alwaysgive rise to serious concern in other countries too. The repercussions of a recession inthe United States are manifold and farreaching both in the United States itself andoutside. The slump which hit the New York Stock Exchange in the thirties and whichbrought distress to millions all over the world, is vividly recalled by many. Beyond theUnited States borders, develop meets are watched with keen interest both by the pro-ducers of primary raw materials, for which the United States is the largest market, andby the industrialized countries of Western Europe, who need United States dollars tofinance their necessary imports and to build their dollar reserves. As it happens, thisrecession in the United States coincides with a decline of the business cycle in WesternEurope and a situation in the underdeveloped countries which might be classified as a

25
depression rather than a mere recession It can only be hoped that the recession willsoon disappear and genuine recovery will set in — this will save both the chief marketfor raw materials and the trade of Western Europe.
It is obvious that the United States Government does not remain idle in view of theabove-sketched developments. It has shown its readiness to revise its budgetary policy. Ac-tually the United States will have to face increased defence expenditure in face of the strikingprogress made by the Soviet Union, as witness the launching of the Sputniks. Those progresseswere made possible as the Soviet Union was able to extend and improve their methods ofeducation. The necessity of greater expenditures on technical education and technologicaland nuclear research is now regarded seriously in the United States. This has led to theabandonment of the budget policy with a surplus so that a small deficit is expected for the1958 fiscal year, as can be seen in the following figures (in billions U.S. dollar):
Net Revenue Net Expenditure Balance1957 71.0 69.4 + 1.61958 72.4 72.8 - 0.4
The Central Bank also promptly revised its tight money policy, and credits havebecome casier. The Federal Reserve System lowered its rate of interest from 3l/2 % inAugust 1957 to 3% on November 15, 1957 and to 2 3/4% on January 24,1958. Theopen market operations of the Federal reserve System now aim at providing the bankswith funds to facilitate credits to business.
Developments in 1958 will show the efficacy of the measures of the United StatesGovernment, both in the sphere of Government-planned capital investments and inthe sphere not directly aimed at capital investment. The policy of the United StatesCentral Bank is aimed at easier capital to enable business to implement its projects asplanned. United States business seems to have adjusted itself to prevailing conditions byreducing the construction of new plants and equipment from an aggregate of $ 37billion in 1957 to $ 32.07 billion in 1958, the latter amount being considered sufficient inview of substantial investments made previously.
Agriculture seems to be a sector that has remained untouched by the recession. Asmentioned above, foodstuffs remained in brisk demand while prices maintained their

26
upward trend. The index number for wholesale prices of agricultural commodities whichstood at 90.9 in 1957 (1947/1949 = 100), rose in 1958 to 93.7 and to 96.1 in January andFebruary l958, and to 100.5 in March.
Thus, there are a number of indications that, although economic conditions in theUnited States are in decline, a levelling up might occur in the not too far distant future. Infact, the Government is amply provided With powers and means to boost economic condi-tions, which so far have not been employed. Reduction of taxes, and construction of high-ways, schools, hospitals and other building projects could be carried out if it should becomenecessary to improve buying power. Exports could be stepped up by ions term credits,particularly to the underdeveloped countries where conditions are very dull. Vigilance on thepart of the United States Government, together with quick and positive measures mayshorten the life-span of the recession and prevent it from developing into a depression.
Western Europe
The impact of the Suez Canal crisis on economic development in Western Europewas still hard to assess in the beginning of 1957. The bulk of Western European im-ports and exports which usually travelled by way of the Suez Canal, had to make themore expensive detour round the Cape. The Middle East was no longer capable ofsupplying oil, which had to be imported from the United States. The comparative im-port figures over the final 6 months of 1956 and the first six months of 1957 demon-strate how costly the crisis had been in the case of France and the United Kingdom:
Imports in millions U.S. dollarFrance United Kingdom
1956,2nd half-year 2,874.3 5,355.51957,1st half-year 3,409.8 5,876.6
In the end the impact of the Suez Canal issue on economic development was notso great as might have been anticipated, since actual hostilities only lasted for a shortwhile, and repairs on the Canal were complete more rapidly than expected.
Production and the business cycle increased again. The G.N.P. rose from US in1956 to 120, representing an increase by 3.4% (1953 = 100). Yet it was interesting to

27
note that the G.N.P. increase tended to grow less as compared with foregoing rises.While improvements by 5% and 5.7 % were recorded for 1953/54 and l954/55 respec-tively, the increase for l955/56 amounted to 3.6% and now 3.4%.
Actually economic activity had been slowing down in Western Europe since thebeginning of 1956. Gradually it was becoming apparent that the idea of keeping thebusiness cycle on a high, or even on an increasingly higher level, without inflation, couldnot be carried through in 1956. As noted in the 1956/57 Annual Report, Western Euro-pean countries were compelled to take strict measures to ease the tension between thecirculation of goods and of money. The threat of inflation was palpable during thegreater part of 1957. While formerly the business cycle required a boost by way ofstimulating demand and buying power, opposite measures became necessary after 1956with the price index persistently rising both as regards Consumption goods and Invest-ments, as the following figures show:
Such price increases threatened economic activity and might, if further persisting, even-tually bring economic machinery to a standstill. The balance of payments was one of thefirst victims of the inflation. Internal high price levels hampered exports. Competition wastoo keen and manufacturers became more inclined to sell in their own countries. On theother hand, higher prices at home were a strong incentive to import. These conditions andthe rush into large-scale imports as a hedge against shortages due to the Suez hostilities,obviously put the balance of payments under very high pressure. Many Western Europeancountries were faced with a deficit, causing their monetary reserves to shrink.

28
The following figures, compiled by the Economic Commission for Europe, clearlyshow how slight the monetary reserves of several countries were becoming for importneeds.
The countries concerned had to face the facts and take steps to conserve their mon-etary reserves and improve their balances of payments. They were fully aware that by doingso they were actually slowing down economic development which, in the long run, wouldhave to be stepped up to absorb the pressure of population. On short term, however, theyfaced the still worse alternative that if the business boom were not checked, a slump mightset in and move downwards at a still greater speed. At any rate, the volume of money incirculation and buying power had to be cut back to conserve the balance of payments. Fiscaland budgetary measures were taken with this end in view. Existing taxes were revised andnew taxes introduced and Governments tried, within the scope of possibilities, to reducestate . In the monetary field, central banks raised their rates of interest and often expendi-ture. In accompanied this by other restrictions. Belgium increased the bank rate from 3%:per June 1956 to 3.5%. per December 1956, and to 4 % per July 1957; France from 3% perJune 1956 to 4% in April 1957 and 5% in August l957; Holland from 3% per June 1956 to3.25% per August 1956, 3.75% per October 1956, 4.25% per July 1957, and 5% per August1957. Most striking was the advance of the bank rate in the United Kingdom from 5% perFebruary 1957 to 7% per September 1957.

29
Thus the cyclical movement in Western Europe was wilfully levelled off to curbinflation as an immediate threat to payment balances. A noteworthy exception is shownby the figures set out in the above table for West Germany, which was not hit by infla-tion as the other countries, the increase in the volume of money being caused by steadilyincreasing exports. The trouble with the German balance of payments was not a deficitbut a surplus which aggravated the deficit of the other countries. The measures taken byGermany were therefore in diametrical opposition to the credit squeeze applied by theother countries. West Germany stimulated imports and in line with this policy facilitatedmoney circulation by lowering the bank rate from 5.5% per June 1956 to 5% per Sep-tember 1956, to 4.5% per January 1957, and to 4% per September 1957. This low in theGerman bank rate was coordinated with the 7% high in the British bank rate so as to puta stop to exchange speculations on the possibility of the £ Sterling being devalued andthe German Mark revalued.
And yet, the deliberately levelled off Western European economic cycle could notmaintain its level and went into a decline in the second half of 1957. In other words, arecession set in which became more marked after £ Sterling had weathered the crisis inSeptember 1957.
The figures on industrial production supply the evidence:

30
A downward trend demonstrated itself practically all-round, with a few exceptionssuch as Greece and Yugoslavia, the latter country showing considerable industrial progress(117 on the base of 1956— 100), although here too quarterly figures slipped off.
So Western Europe faced the third recession since World War II the former twoslump’s dating from 1949 and 1953. During the first postwar recession economic condi-tions in Western Europe, which was still in the process of rehabilitating its war-tornproductive capacity, were affected by the slump in the United States.
This recession in the United States was only of a short duration. In spite of declin-ing exports to the United States and other countries — the latter due to reduced pur-chasing power on account of decreased exports to the United States —, Western Euro-pean countries were able to overcome the recession by devaluation of the currency, aswas done in the United Kingdom, Belgium and the Netherlands in order to stimulateexports.
The 1953 recession in the United States did not affect Western Europe to a greatextent. At that time the Western European economy was in a stage of expansion. Itsinternational trade was hit by the United States recession, it is true, but Western Euro-pean foreign exchange holdings were adequate to finance imports of the materials re-quired for completion of development projects.
In contrast with l953, the current recession in the United States found Europe lesswell prepared to withstand the impact. In 1953, the condition of Western Europe wassound and expanding, and the only problem was whether the economy was sound enoughto continue expanding in the face of the depression in the United States. At present,Western Europe itself is passing through a depression. Except for West Germany, mon-etary reserves are lower than they were in 1953. Moreover, the demand for WesternEuropean manufactures also largely depends on surrounding countries and onnon-Western European countries such as the underdeveloped countries in Asia, Africaand Latin America. International trade is not only important in itself, lout its ups anddowns find an immediate repercussion in capital investment in industrial enterprises.
In other words, increased industrial production is largely dependent on improve-ment in international trade. Research by the Economic Commission for Europe has

31
shown that increase in G.N.P. depends for 25 % in several countries on increased ex-ports. A recession in the United States has usually as a consequence a decline in exportsto that country. The underdeveloped countries, which accounted for 25 % of WesternEuropean exports in 1956 (U.S.$ 9,915 million out of the total of U.S. $ 37,753), findprice movements on the world market for primary products going against them day byday and will have to withdraw as importers if left to their own resources.
Thus, conditions outside Western Europe (apart from Eastern Europe) would seemto preclude the possibility for a revived demand of export goods which would implythat the third postwar recession will be harder to overcome than its two predecessors.
The problems facing the Governments of the various Western - European coun-tries have executed a remarkable about-face. Prior to September 1957, inflation wascurbed by such measures as restrictions in the monetary field. When it turned out after-wards that economic conditions were on the level of recession, restrictions were as-suaged and the bank rates lowered—the United Kingdom from 7% per September 1957to 6% per March 1958; Holland from 5% per August 1957 to 4.5% per February 1958.By lowering the cost of capital it is hoped to stimulate business spending on capitalgoods even though the tension between the cost of living and wages has not yet relaxed(as in the United Kingdom for instance).
Endeavours to combine Western European markets into one large and free com-mon market cannot help out present economic conditions since plans are still in theearly stage of implementation. In fact, implementation may even be retarded if exportsdo not improve and if foreign exchange holding are further reduced. Trade and mon-etary policies of Western European countries often run crisscross while timing is oftenat fault. The position in E.P.U., for instance, of West Germany as a creditor and Franceas a debtor, would seem to call for coordinated measures.
Such coordination is not only required for steps within their own sphere and shouldnot be hard to achieve thanks to the existence of such coordinating bodies as the Orga-nization for European Economic Cooperation and the European Payments Union, butwhen recession in the U.S. is getting more severe, an agreement of approach about tradebetween West European countries and the U.S., has to be reached too. Another item fora joint international effort to coordinate measures against recession, which so far has

32
had no consideration, would be the position of underdeveloped countries. Several WesternEuropean countries, such as the United Kingdom have been able to improve their termsof trade by prices of raw materials dropping at a greater rate than prices of manufac-tured goods. It is obvious that this state of affairs cannot last since Western Europeanexports will drop as the underdeveloped countries lose their buying power. Activatinghome demand is not enough. International measures are called for to shore up thedwindling buying power of potential foreign markets.
Eastern Europe
The disturbances in Poland and Hungary carried in their wake the destruction ofmachinery of production, thereby placing a heavy burden on those countries to recoupthe damage to their economies in the shortest possible time. Capital being a pre-requisitefor reconstruction, credits were granted by the Soviet Union, other East European coun-tries and the Chinese People’s Republic, while Poland also succeeded in concluding acredit agreement with the U.S. From October 1956, Hungary received credits totalling1,577 million Rubles, of which 1,150 from the Soviet Union. Out of this total, 340million Rubles’ worth was in foreign currency (240 million from the Soviet Union and100 million from the Chinese People’s Republic) for use in Western countries. Polandalso received loans from various Eastern European countries —2,440 million Rubles inall, of which 1,580 million Rubles from the Soviet Union. These credits were used forpurchasing several kinds of consumer goods, such as wheat, and raw materials such ascotton, coal, rubber, while machinery was also imported. Moreover, East Germany availeditself of the loans to participate in the project for expanding coal mining in Poland.
Besides attracting capital from abroad, Poland and Hungary revised their systemsof organization of production in agriculture and industry. The increased number offarmers now permitted to work on their own without being bound by cooperative orcollectivist ties is one of the features. In fact a great number of agricultural cooperativeswere eliminated in Poland. Compulsory sales were assuaged and prices advanced on asupply and demand basis, wherever possible. Where cooperative and collectivist farm-ing still exist, a greater measure of freedom has been given to farmers.
Similar changes were introduced in other East European countries though not onthe same scale, pressure not having made itself felt as in Poland and Hungary. In fact,

33
since Stalin’s death, the Soviet Union has re- examined its system and methods of pro-duction with a view to greater productivity and more equilibrium.
Centralization has been relaxed and responsibility delegated in a measure to the actualproducing bodies and agencies. Endeavaurs have been made, for instance, to delegate man-agement in agricultural affairs to Regional Economic Councils. The same development isreported for industry and building. The plan to permit collective farms to buy their owntractors and other necessary equipment shows the way the wind is blowing.
The trend toward decentralization has also hit central planning. Planning used tobe vertical and all-inclusive. At present, policy seems to be to plan only the main linescentrally and leave it to the lower bodies to work out the details. Greater efficiency anda better check on first costs are envisaged under the new system.
While the above changes have been or are being carried into effect in the field ofproduction, the nature and object of production have also been under reconsideration.Targets have been simplified so as not to overburden capital and raw material demandby the various branches of production. Consumer goods are more to the fore. Heavyindustry, so it would seem, is considered to be sufficiently developed and the productiondrive can be given a different slant. This new evolutionary phase the Soviet Union andthe East European countries are passing through is worth watching—only the futurecan show the outcome.
The economic development of Eastern Europe in 1 9 5 7 again showed progressin various fields. While planning for 1957 was on a lower scale than for 1956, achieve-ment was on a higher scale than in 1956—except where Hungary was concerned. In theSoviet Union industrial activity showed a 10.6% increase in 1956; the planning for 1957aimed at an increase of 7.1%, while actual implementation showed an increase by 10%for 1957. The respective percentages for Czechoslovakia were 91/2%, 8% and 10%; forEast Germany 6% ,6 % and 71/2%; for Roumania 11%, 4% and 81/2%, for Bulgaria l5%, 8% and l5% for Poland 10%, 3 1/2% and 9 1/2%. Due to the disturbances in Hun-gary, which caused serious damage, the improvement in that country for 1956 was 9%,but that for 1957 was 17% (for planning no figures are available).

34
Greater attention to the production of consumer goods had for a result that in theSoviet Union and Poland four times more washing machines were produced, while theproduction of refrigerators was doubled. In Hungary and Poland, twice as many radios andmotorcycles were made. Motor car production was up by 25% in each producing country,while house building rose by 30% in the Soviet Union, 50% in Hungary, and 20% in Poland.In the Soviet Union the production of radios declined. Other industries producing con-sumer goods also showed greater activity, for instance textiles and footwear.
Industrial progress was in the first place made possible by greater imports of rawmaterials, which possibility was opened by smaller imports of foodstuff thanks to in-creased agricultural output (for which see below). Moreover the proceeds of the sales ofgold by the Soviet Union seem to have been used to finance purchases of raw materialsby East European countries on the free market. Thus imports of cotton, rubber andhides rose. Further, imports of iron ore, steel, plates also increased in such countries asEast Germany, Czechoslovakia, Poland and Hungary. It is evident that purchases of rawmaterials, whether within their own sphere or without, largely with credits from theSoviet Union, mean a burden for future years since such loans will have to be repaid.
For industrial activity as a whole it may be said that although the targets for 1957were improved on, the targets for 1957 were on a lower level than those for l956 so that,on balance, industrial activity over 1957 was not so great as in the foregoing year.
Production in the agricultural field on the other hand rose substantially and ex-ceeded 1956 figures. Exceptionally favorable weather conditions were the first cause, towhich the revision of the organizations as discussed above may have contributed itsshare. Foodcrops in Eastern Europe (excl. the Soviet Union) totalled 47,148 thousandtons in 1957, against 38,494 thousand tons in 1956 and against the yearly average of39,038 thousand tons for 1951/55. In the Soviet Union foodcrops were not so abun-dant, since the reclamation of new lands ran into several difficulties such as short sup-plies of fertilizers, harvesters and the like. Neither East Germany nor Czechoslovakiaachieved anything like the figures of their neighbour countries, due, so it is reported, tolabour shortage both in the fields and at the machine and tractor centres.
Beet sugar is a product of primary importance. The l957 production in the SovietUnion amounted to 38.4 million tons (30.7 million tons in 1956). The other East Euro-

35
pean countries also showed substantial increases in 1957: Poland 1,059 thousand tons(777 thousand tons in 1956); Czechoslovakia 792 thousand tons (593 thousand tons in1956); East Germany 767 thousand tons (506 thousand tons in 1956); Hungary 300thousand tons (216 thousand tons in 1956). The cotton, potato, and flax harvets did notreach the level of 1956 in tile Soviet Union.
Overall, production in the agricultural sector showed a significant increase particu-larly in regard to foodstuffs.
Progress in industrial and agricultural production in Eastern Europe, as well aschanges in the organization of production (realized or as yet to be realized) and aimingat greater freedom for the producers (farmers and labour), resulted in advanced per-sonal income in 1957. Wages and pensions moved upwards as did prices paid to farmers.Personal income rose in the Soviet Union and East Germany by 8 to 9% in Czechoslo-vakia, Poland and Roumania by 12 to 13% while Hungary recorded a high by a 20% rise.
Rising income and the resultant greater buying power automatically brought pres-sure to bear on the balances of trade and payments, which also had to absorb the impactof the replacements that came as the aftermath of the civil commotions in Poland andHungary. Practically all the Eastern European countries (with the exception of Bulgariaand East Germany, figures for the Soviet Union are not yet available) show deficits ontheir balance of payments: Czechoslovakia U.S. $ 44 million; Hungary U.S. $ 185 millionPoland U.S. $ 162 million for the period January/September 1957 incl. And this is aremarkable reversal of the position since 1953 when building up surpluses on the bal-ance of payments was a first consideration with a view, to the repayment of credits,while in l957 new credit arrangements were entered into.
Meanwhile the share of Eastern Europe in world trade rose from about 61,4% in1950 to 73/4% in 1956 (figures for 1957 are not yet available), while trade relations withWestern countries also became closer, as the following figures show.
Exports from Eastern Europe (excl. Soviet Union) within their own sphere amountedto 77% in 1953, and dropped to 75%, 70% and 68% in 1954, l955 and l956. Imports amountedto 77%, 74%, 69% and 69% in 1953, l954, 1955 and 1956 resp. Exports from the SovietUnion to Eastern Europe also dropped from 79% in 1955 to 74% in 1956, while importsslipped from 78 % in 1955 to 7 5% in 1956.

36
Economic conditions as prevailing in 1957 contain a threat to monetary equilib-rium. This was partly checked by price controls and partly by additional saving, as perthe following figures (in national currencies and in billions).
1956 1957Soviet Union 63.7 80.5East Germany 6.06 9.0Czechoslovakia 5.32 8.29Hungary 1.5 0.58Poland 2.23 5.1Bulgaria 2.68 3.3
As known, the volume of money in circulation in East Germany was reduced perthe end of 1957 from 5.6 billion to 3.5 billion marks.
Summarizing economic development in Eastern Europe, it would seem that the coun-tries in this sphere managed to overcome the economic consequences of the commotionsin Hungary and Poland, while making progress in various sectors. A number of difficultiescame to the fore, such as the deficit on the balance of payments, the inability to maintainmonetary equilibrium, the hampering effect of deficiencies in transportation, and shortsupplies of oil and electric power. Despite improvement in the production of consumergoods, supplies could not yet achieve the regular level of other countries.
On the other hand, Eastern European countries have not yet fully realized their productivecapacities, which leaves scope for further progress. This is what the Soviet Union aims at when itenvisages for 1975, the level of production of the U.S. in l956, or wishes to overtake the U.S. in theproduction of coal, oil, electric power, steel, footwear, wool, and cement.
Asia
General
Though still showing improvement, industrial production in Asian countries regis-tered a slower rate of progress in 1957 as compared with 1956. Overall industrial andmining production in Asian countries was 11.4% higher in the first 9 months of 1957than during the corresponding period of 1956. The rate of progress in Japan, India and

37
the Chinese People’s Republic — the most advanced industrial countries in Asia—ap-peared to have fallen off due to less new capital being invested. Japan and India encoun-tered difficulties in their balances of payments and had to retrench their monetary andinvestment policies to check the deficits. In India, the difficulties were aggravated bycatastrophes in nature necessitating substantial imports of foodstuffs on top of in-creased imports of capital goods under the Second 5-year Plan. The rate of industrialprogress slackened in Pakistan, South Korea and the Philippines, while industrial devel-opment was seriously hampered in Indonesia, Burma and Ceylon due to a weakeningforeign exchange position.
Food production rose by about 4% in 1957 as compared with the foregoing year,but still the majority of Asian countries had to import foodstuffs in increasing quanti-ties. Rice production did not decline, except in Thailand, Burma and India were weatherconditions—either severe droughts or floods—affected crops adversely.
Foreign exchange holdings dropped materially in practically all Asian countries,particularly so in Japan (U.S. $ 680 million or 30%) and in India (U.S. $ 480 million or36%). Japan managed to check a further decline by import and credit restrictions, whichwere made more stringent in the middle of 1957. India borrowed U.S. $ 200 millionfrom the International Monetary Fund to improve its foreign exchange position, but inspite of this loan, the downward trend continued. In the case of Japan, heavy importsof capital and auxiliary goods for the benefit of Japan’s rapidly developing industry,


39
explain the drain on the country’s foreign exchange reserves. In the case of India, theimplementation of the Second 5-year Plan strained the country’s reserves to the utmost.In the Philippines foreign exchange reserves dwindled and economic conditions gener-ally deteriorated in the course of 1957.
Foreign trade was far from favorable in 1957. With the exception of Indonesia, allAsian countries had unfavorable trade balances, even more so than in 1956. Japan, India,Hongkong and South Korea made the worst showing, though several countries, includ-ing Hongkong, managed to offset the import surplus by proceeds from invisibles, whereasthe South Korean deficit was covered by United States aid.
Table 6 demonstrates a continuing upward trend of total world exports. Exportsof Asian countries, however, slipped as compared with 1956 both in terms of proceedsand proportional share vis-a-vis world exports. Asian exports dropped by U.S. $ 800million to U.S. $ 5,100 million, or from 6.3% to 5.1% of world export. Lower rawmaterial prices throughout 1957 may be listed as the main cause.
Asian countries produced 1,721,400 long tons of rubber in the year under report,or 1% less than in 1956 (1,740,900 long tons). Higher production in Malaya and Ceylondid not offset reduced output in Indonesia and South Viet Nam.
Asian countries exported 1,825,000 long tons of rubber in 1957 against 1,785,000,-long tons in 1956, or 2% more in 1957 than in 1956 though still below the level of l955.Indonesia, Thailand and Sarawak registered lower export volumes. The tea productionof India and Pakistan was estimated to be lower in l957 than in 1956; production inIndonesia and Ceylon was higher.

40
Total production of Asian countries, as the preliminary data would seem to indi-cate, rose slightly in 1957 compared with 1956. Copra production in the Philippines andIndonesia was up, while that of Malaya and Ceylon was down. Sugar production (Indo-nesia, Taiwan, the Philippines and India) was up slightly (about 5 %), jute production(India, Pakistan) was expected to decline in l 957.
Inflationary pressures proved to have become stronger in Asian countries in 1957.Table 7 shows that the index numbers for the cost of living and for wholesale prices rosesteadily—expenditure on foodstuffs tended to dominate in the cost of living. Thanks toforeign aid, however, such as foodstuffs supplied under the S.A.C. Agreement and the ex-change of export products for food, the shortage could be reduced and the spiral of foodprices could be checked, as in Indonesia, India and Ceylon. Generally speaking, and apartfrom the demand for consumer goods exceeding supply, the excessive growth of the Gov-ernment debt to the Central Banks (Indonesia, India, Ceylon, and the Philippines), togetherwith the credit facilities granted to the private sector, underlay inflationary development.
In the majority of Asian countries, the volume of money in circulation at the endof the year under report exceeded that per end 1956, especially so in Indonesia (+41.2%). In contrast, Burma and Ceylon succeeded in reducing the volume of money.
As in the preceding years, several Asian countries continued to receive aid fromsuch organizations as the Colombo Plan, the International Cooperation Administra-tion, the World Bank and the Eximbank. A new organization in this field is the United

41
States Development Loan Fund, which set aside U.S. $ 300 million for the 1958 financialyear. Besides the Chinese People’s Republic, other Asian countries were made recipientsof Soviet Union loans India received Rs 1,230 million for its heavy machinery industry,mining engineering works etc. Indonesia ratified a loan for U.S. $ 100 million for indus-trial development, while Burma also received a loan from the Soviet Union.
Japan made available Yen 97 million for economic and technical aid to other coun-tries in l957 (Yen 58.5 million in 1956).
The loans granted by the World Bank to Asian countries in 1957 totalled U.S.$ 342.1 million, against U.S. $ 150 million in 1956. India had the largest share (U.S.$ 161.7 million) . Eximbank extended loans to a total of $ 248.4 million, of whichU.S. $ 185.3 was granted to Japan, and US. $ 3.3 million to Pakistan.
The following pages give a survey of economic development in various Asiancountries in greater detail.

42
Pakistan
In the year under report, the National Economic Board authorized the PlanningBoard to revise the 5-year plan l955 —1960. Overall expenditure under the Plan wasreduced from Rs 11.6 billion to Rs 10.8 billion, of which Rs 7.5 billion is earmarked forreconstruction projects in the public sector and the balance of Rs 3.3 billion for theprivate sector. The revised 5- year Development Plan envisages an increase of nationalincome by 15% against the 20% of the original plan. Circumstances made retrenchmentof expenditure inevitable. Capital expenditure involved in the original plan proved toogreat in view of larger outlay of capital by the Government than initially estimated.Administrative difficulties and a shortage of experts further hampered implementation.The Planning Board estimated that expenditure for reconstruction purposes in the finaltwo years would be Rs 2.88 billion only. It is a moot point, however, whether this amountcan be made available since, at that time, substantial outlays on imported foodstuffswere not anticipated, while estimated annual imports amount to Rs 280 million. Theclosing of the Suez Canal seriously affected Pakistan since 70% of the country’s importsand 55% of its exports pass through the Canal. Domestic savings were also lower thanoriginally estimated due to advancing prices and the higher cost of living. The cost ofliving index was higher by 12% at the end of 1957.
Despite the heavy weather the 5-year plan encountered, 1957 showed progress in theeconomic field. Agricultural production rose by 14%, industrial output by 8%, mining by 5%while national income (Rs 20.785) was higher by 6%, as compared with 1956 (Rs 19.516).Agricultural production, however could not yet catch up with increased consumption and tocover short-supply foreign exchange reserves had to be used for Rs 212 million to financeimports of 243,000 tons of rice and 252.000 tons of wheat. Furthermore Pakistan received173.000 tons of rice and 335,000 tons of wheat from the U.S. under the Surplus CommodityAid Program. In fact, U.S. relief has been flowing into Pakistan since l953 for the flood-strickenareas. Overall aid totalled 1.3 million tons of wheat and about 600,000 tons of rice to thevalue of U.S. $ 126.2 million and U.S. $ 59.4 million respectively, 60% in the form of grantsand the balance as loans redeemable in local currency. In addition other kinds of aid, in theshape of agricultural produce to the value of U.S. $ 38.7, have been forthcoming. Over thepast three years Pakistan imported 2 million tons of foodstuffs to the value of Rs 1,100million, of which Rs 450 million’s worth was financed from Pakistan’s foreign exchangeholdings while the balance came from outside aid.

43
With a view to reducing the need for imported foodstuffs, a U.N. mission is work-ing in Pakistan on a Multi-Purpose Plan covering the whole of East Pakistan. This planenvisages improved irrigation for 11 million acres of land as well as irrigation for 3.5million acres of hitherto uncultivated land. The Plan further includes a 800,000 KWelectric power station and the outlay of a polder work to reclaim 725,000 acres of low-lying land. The successful completion of this Plan could make East Pakistan the granaryfor South East Asia. With a view to stimulating agriculture and to improving local mar-keting conditions, the National Assembly passed an Agricultural Bank Bill, under whichFarmers’ Banks will give special credit facilities to farmers and farmers’ cooperatives.
By the successful implementation of the plans as above, Pakistan hopes to be ableto build up its balance of trade which has been in the red for years. Imports amountedto Rs 2,089 million in 1957, against Rs 1,986 million in 1956, while exports stood at Rs1,604 million in 1957, against Rs 1,620 million in l956, which leaves a deficit for 1957 ofRs 485 million.
The deficit on the balance of payments was Rs 259 million against Rs 9 million inthe foregoing year. Foreign exchange holdings diminished, as foreign exchange expendi-ture rose and foreign exchange income dropped. A reduced volume of exports at lowerworld market prices was the main contributing factor to this deteriorating foreign ex-change position. The Government made efforts to boost exports by, for instance, ex-tending the number of exportable items under general open licence.
The volume of money in circulation rose by 6.3% in l957 against an increase of 8%in 1956 (Rs 494 million in 1956 against Rs 525 in 1957). Due to the credit squeezeimposed on the banks this relatively small increase in the volume of money in circula-tion can only be attributed to Government Net Debt to banks.
In connection with development plans Pakistan received loans totalling U.S. $ 133.4million from July 1957 to June 1957 incl. from which 67 projects have been or are beingfinanced. Since l954, Pakistan further received aid totalling U.S. $ 171.3 million under aNon-Project Commodity Aid Program to finance highly essential imports. Pakistan alsoreceived U.S. $ 152.9 million and an additional U.S. $ 10 million from the AmericanInternational Cooperation Administration for imports of equipment and machineryunder a special Machinery and Aid Program. Aid also came from Canada ($ 29.3 mil-

44
lion), Australia (A. £ 5.2 million), New Zealand (£ 0.3 million), the Ford Foundation ($4.7 million), and the World Bank ($ 112.5 million). The World Bank also granted a loanof $ 4.2 million to the Pakistan Industrial Credit and Investment Corporation — estab-lished by private corporations (Pakistan, British, U.S., and Japanese), to promote privateindustrial undertakings in Pakistan and to start operations in November 1957. This loanis guaranteed by the Pakistan Government and has a 15 year maturity at 5 3/4%. Finally,Pakistan International air Lines signed a loan agreement for U.S. $ 3.3. million withEximbank in October last for 2 Constellation aircraft from Lockheed Aircraft Corpora-tion and Curtiss Wright Corporation.
India
With the year under report, India completed the 7th year of its economic recon-struction plan. One year after the inception of the 2nd Five- Year Plan it became appar-ent that the financial estimates for the projects had been too low. Foreign capital did notflow into the country at the anticipated rate and large-scale imports of capital goods hadto be financed from India’s own foreign exchange holdings. Furthermore, catastrophesin nature struck the country so that foodstuffs had to be imported. The FoodgrainEnquiry Committee estimated that for the next few years India will have to importfoodstuffs at the rate of two to three million tons a year. Even in normal conditions, therequirements for wheat in 1960/1961 would come close to 79 million tons whereashome production only approaches 77 million tons, which would still leave a shortage of2 million tons a year. To meet the acute food problem, India could buy surplus agricul-tural commodities from the U.S. in Rs. The balance of trade, due to the above causes,showed a deficit of Rs 3,049 million per the end of 1957, against a deficit of Rs 2,104per the end of 1956.
The balance of payments, also due to the above causes and the additional burdenof higher rates of freight due to the Suez Canal developments and the redemption ofthe silver loan from the U.S., was also in poor shape. The shipment of 3 million ouncesof silver to the U.S. was the first stage of the redemption of a loan obtained duringWorld War II for coining silver money. At the time the Government of India received aloan of 226 ounces of silver under a lend-lease agreement redeemable 5 year after thesigning of the peace treaty. When India became independent, it was agreed that 172

45
million ounces (U.S. $ 157 million) were to be for India’s account. The silver coins struckin 1940 have gradually been withdrawn from circulation over the past ten years to beused for redemption. Depending on shipping facilities, 47 million ounces will be re-turned in the form of bars and 122 million ounces in coins.
To ease the pressure on the balance of payments and to implement the 2nd Five-YearPlan, India entered into several loan agreements. An I.M.F. Loan for U.S. $ 200 millionwas obtained in February, U.S. $ 127.5 million being drawn immediately, while the bal-ance of U.S. $ 72.5, intended as a stand-by credit, was utilized on June 12, l957. On July12, 1957 a loan agreement with the World Bank was approved for purchasing new andmodernizing existing railway equipment in 1957/1958. This loan consists of variouscurrencies: Y 8,640,000,000 (U.S. $ 24 million); £ 6,825,000 (U.S. $ 19.1 million);7,000.000,000 Italian Liras (U.S. $ 11.2 million); the balance is in various European cur-rencies and U.S. $, totalling U.S. $ 35.7 million. The loan totals U.S. $ 90 million; it has amaturity of 15 years and carries interest at 55/8 % (incl. l % commission), while the firstredemption is due on July 1, 1961.
India’s railway system, whose modernization is financed by the World Bank, takesthe fourth place internationally and covers nearly 36,000 route miles. The railways areGovernment property and are run by a Railway Board under the Ministry of Railways.Under the 2nd Five-Year Plan the capacity of the railways is to be stepped up by 40%for goods and by 15 % for passengers. Expenditure will total Rs 11,250 million (U.S. $2,363 million), including Rs 4,200 million (U. S. $ 893 million) in foreign currency forpurchasing essential equipment abroad. The loan mentioned above is the second WorldBank Loan for railway development; the first, signed in August 1949, was for U.S. $ 34million and was used for purchasing 418 locomotives and other equipment.
The World Bank also granted a loan of U.S. $ 32,5 million to the Tata Iron andSteel Works for extension of enterprises under the 2nd Five-Year Plan. From the Eco-nomic Development Fund India is to receive a loan of U.S. $ 300 million to financeindustrial projects. Eximbank is to take charge of this loan.
With the Soviet Union a credit agreement was signed in November 1957, coveringan amount of Rs 620 million (£ 46 million) at an annual rate of interest of 2.5% andredeemable in 12 equal installments, the first redemption being due one year from the

46
date of delivery of the machinery and equipment concerned. Out of this loan, Rs 265million will be for heavy industry equipment and a coal mine engineering works at Korba;Rs 160 million for a 250,000 kw power plant; Rs 8.5 a glass project. These projects formpart of the 2nd Five-Year Development Plan.
In spite of the several loans to ease the pressure on the balance of payments and toimplement the 2nd Five-Year Plan, the official gold and foreign exchange reserves, £311.8 million at the end of 1956, fell to £ 175.1 at the end of l957. This drop by 56%also implies that the prescribed statutory minimum cover of £ 310 million has been leftfar behind, and that this could happen while both foreign and domestic resources werestrained to the utmost. At home all kinds of taxes were raised, nonessential expenditureretrenched, and individual foreign travel reduced Import restrictions were rigidly main-tained; import prohibitions were even extended in September and allocations to import-ers reduced. Permits for imports of essential and capital goods continued to be grantedto maintain the level of industrial production. The 2nd Five-Year Plan was revised andprojects classified by priority. Projects aiming at increased production of iron and steeland at improved communications (railways, ports) were given high priority as well asprojects underway and nearing completion. Obviously the implementation of the 2ndFive-Year Plan contributed largely to the dwindling gold and foreign exchange reserves.
On April 1, 1957, India adopted the decimal system and the Rupee was dividedinto 100 units called “naya paisa”—the old currency (annas & pies) remain in use for atransitional period of 3 years.
The cost of living in 1957 rose by 6%, as did the wholesale price index. The Gov-ernment aims at curbing further price advances by stepping up the production of con-sumer goods and of other commodities.
Ceylon
The foreign trade of Ceylon showed a less favorable development over 1957. Thedecline in exports, which set in 1956, persisted in l957, while imports rose. Ceylon’sexports amounted to U.S. $ 353 million in 1957—a setback by U.S. $ 11 million (3%)when compared with 1956. Payments for imports, in contrast, increased from U.S. $ 342million to U.S. $ 379 million (+ 11%). The continuous drop of world market prices for

47
raw materials throughout 1957—among others of tea and rubber which are Ceylon’schief exports—was the main cause of deterioration. Moreover, import expenditure rosebecause of greater imports of capital goods, and 1957 saw a balance of trade deficit ofU.S. $ 26 million, in contrast with surpluses of U.S. $ 22 million in 1956 and U.S. $ 100million in 1955. Severe drought in the dry season affected copra production in 1957,and, even though world market quotations for copra were at a higher level in 1957 thanin the previous year, export proceeds of copra and other coconut products fell substan-tially, namely, from U.S. $ 44.7 million to U.S. $ 3 1.8 million. Fortunately, tea and rubberproduction were not affected by the unfavorable weather conditions. The export vol-ume of these two estate products increased—tea exports rose from 157,600 tons to166,700 tons, rubber from 85,200 tons to 93,800 tons, thus mitigating the effect ofreceding prices on the balance of trade. The setback in foreign trade was also reflectedin the development of the terms of trade — the index, standing at 140 in 1956, droppedto 120 in l957.
Ceylon’s foreign exchange holdings and gold reserves were U.S. $ 183 million at theend of 1957, or U.S. $ 38 million less than at the end of l956.
As regards the volume of money in circulation, money supply fell by about 8% perthe end of 1957, amounting to Rs 1,040 million, compared with the position per the endof 1956 (Rs 1,127 million).
The cost of living edged upward throughout l957 and was, on an average, 2.6%higher than in 1956. Weather conditions—severe drought in the dry, and floods in thewet season—were the principal reasons for advancing prices of foodstuffs.
Public finance showed a deficit of Rs 196 million, caused by increased outlay onfood subsidies, and expenditure in the fields of public health, education and social wel-fare. The budgetary deficit in 1958 is expected to be still higher as the result of unavoid-able expenditure in connection with the great floods of December 1957. Furthermore,rice will have to be imported to meet the shortage of foodstuffs, aggravated by thedestruction of rice plantings by the floods.
In October 1957, Ceylon renewed its barter agreement with the Chinese People’sRepublic. Under this new trade agreement, effective as from January 1, 1958—30,000

48
tons of rubber are to be bartered against 200,000 tons of rice. Furthermore Ceylon is toreceive a loan of Rs 75 million from the Chinese People’s Republic to rehabilitate itsrubber plantations.
On February 7, l958, Ceylon and the United States entered upon an agreementunder which the United States are to supply technical aid for six projects to the totalvalue of U.S. $ 819,000, within the framework of the Economic and Technical Coopera-tion Program. These projects comprise hydro-electrical research and training, malariacontrol, artesian wells, expansion of agriculture, research and education, and road con-struction.
On February 8, 1958, Ceylon and Russia concluded a trade and payments agreementfor one year and automatically renewable unless either of the parties expresses a wish to thecontrary. Under this agreement Ceylon will sell tea, rubber, coconut oil, copra, dessicatedcoconut, coir and coir products, citronella oil, spices etc, while Russia will supply oil prod-ucts, iron and steel products’ chemicals, fertilizers, cement, sawed timber, cellulose, textiles,various kinds of machinery and tools etc. The agreement stipulates that it is to be imple-mented in line with the Ceylon Government policy to “Ceylonize” its foreign trade. Thepayments agreement provides for a swing credit of £ 300,000, and, if the swing is exceeded,the amount in excess of £ 300,000 has to be paid within one month.
Burma
1t was a disappointing economic year for Burma. The latest estimates asses teh1957/1958 rice crop at a total of 5,148,300 tons - a drop of about 20% compared withthe overall 1956/1957 crop (6,362,000 tons). This decline must primarily be attributedto the severe drought, rice pests being an aggravating factor. Rice exports over the first10 months of 1957 were higher than in the corresponding period of the precedingyear—i.e. 1,589,000 tons against 1,575,000 tons—owing to the carry-over from 1956. Asubstantial drop, however, is anticipated for 1958.
As to other exports, it is notable that teak exports over the first nine months of1957 added up to about 60,000 tons, against 55,000 tons over that same period in l956.Nevertheless, this higher figure still lags far behind the prewar level, when the annualexport volume averaged 200,000 tons.

49
Burma’s balance of payments showed less favourable development over the yearunder report. Gold and foreign exchange reserves steadily fee, amounting to U.S. $ 93million per the end of 1957—a deterioration by 23% compared with the position at theend of 1956 (U.S. $ 121 million). The decline of foreign exchange reserves may mainlybe attributed to rising payments for imports, both in the private and in the public sector.In addition, the world market price of rice declined steadily in the course of 1957, from£ 37.2 per ton at the end of January to £ 33 per ton per ult. September 1957.
The volume of money in circulation gradually decreased. At the end of Decemberit amounted to 1,116 million kyats, or 17% less than at the end of the foregoing year.
The cost of living index rose during the first 7 months of 1957 principally as theresult of the rising prices for foodstuffs. After showing a downward trend in the periodfrom August to October, the index increased again in the last two months of 1957.
The 1957/1958 fixed budget estimates, which the Minister of Finance submittedto Parliament at the end of August 1957, showed a deficit of 6.4 million kyats. Nationalrevenue is estimated at 410.6 million kyats, while expenditure will require 417 millionkyats. First priority is given to outlay calculated to reinforce the armed forces and thepolice force, enabling them to cope more effectively with security disturbances whichseriously hamper economic reconstruction. This, together with the foreign exchangeproblem, has made the Government convert the 8-year development plan (started in1952 and estimated to require an overall outlay of 1 to 1 1/2 billion dollars) into a 4-yearplan. The new development plan stresses increased agricultural and estate production,namely, of rice, rubber, groundnuts, wheat, tea, cocoa and forest products. Further, astart has been made under this 4-year plan with the implementation of several industrialprojects, the principal items being: a fertilizer, a rubber type, a paint and an alcohol plant,each capable of producing 50,000 tons superphosphate, 2,400 tons tyres, 40,000 gallonspaint and varnish, and 1 million gallons alcohol.
A loan agreement was signed between Burma and the United States in March 1957,under which Burma was to receive $ 25 million from Eximbank. This amount will beutilized for expanding the agricultural area in the Irawaddy Delta by 1,236,000 acres,from which an increased rice output by 600,000 tons is anticipated, in addition to higherproduction of groundnuts, gunny fibres, sugar cane, etc. Furthermore, Burma is receiv-

50
ing United States aid in the form of foodstuffs under the “Surplus Agricultural Com-modities” agreement running to a total of U.S. $ 17.3 million. It is worthy of note thatthe above two agreements are long-term loans, having a currency of 40 years each. Witha special view to the expansion and modernization of industry, transport and mining,the Burmese Government has brought into being the Union Development Bank, thefunds for the implementation of this project to be obtained from Government as wellas from private sources.
Thailand
Thailand’s rice exports reached a high record in 1957, namely, 1.6 million cons at avalue of U.S. $ 175.8 million (1956 — 1.2 million tons and U.S. $ 139.1 million). Thefavourable export proceeds from rice counterbalanced the setback in the sectors ofindustry, trade and agriculture. The 1957/1958 rice crop is estimated at 7.5 to 8 milliontons or lower than the 1956/1957 crop at 8.3 million tons, though still above the averageannual level. This drop is ascribed to poor rainfall during the planting season.
Exports of rubber, the second largest export commodity, dropped from U.S. $73.9 million to U.S. $ 68.2 million due to the weaker demand and lower prices on theworld market.
Although overall export proceeds for l957 were higher than for 1956, import expendi-ture rose at a higher rate so that the deficit on the balance of trade (1956 U.S. $ 30.8 million)is anticipated to increase in 1957. In the first 11 months of 1957 export proceeds were U.S.$ 293 million, while import expenditure amounted to U.S. $ 335.6 million.
Gold and foreign exchange holdings of the Bank of Thailand were stable in 1957and amounted to U.S. $ 329 million at the end of December. This means an increase of9% as compared with the position per the end of 1956 (U.S. $ 311 million) .
The cost of living index edged up during the first 8 months of 1957, the rise beingmost marked in July and August. A reaction set in afterwards and prices edged downduring the rest of the year. On an average, the cost of living index was 6% higher thanin 1956. The index number for wholesale prices, in contrast, was steadier and practicallyon the same level as the average for 1956.

51
The short supply of electrical power hampered industrial development in Thai-land. A big project is now being put in hand at Yanhee to improve conditions in thisrespect. The Government signed a loan agreement (U.S. $ 66 million) with the WorldBank in August 1957 to be used for the first stage implementation of the Yanhee multi-purpose project. This first stage, which is expected to be completed in 1960, covers thegeneration of 140,000 kw for Bangkok and environs, and the irrigation of 2 millionacres which is estimated to increase agricultural output by U.S. $ 15 million.
Another project, still in the stage of research, is the Mekong river project -research willoccupy 5 years at a cost of U.S. $ 9.2 million. This project aims at generating electric power,expanding irrigation, and improving communications by way of the Mekong. This projectwill not only benefit Thailand, but also the neigbouring countries like Viet Nam, Laos andCambodia.
Viet Nam, Cambodia and Laos
The economic reconstruction of South Viet Nam made no apparent headway in the pastthree years. The biggest problem this State has had to cope with since its establishment has been therehabilitation of 700,000 displaced persons in agriculture. This problem was succesfully tackled bythe Ngo Dinh Diem Government, under whose land-reform policy landowners with more than100 hectares had to sell the excess at the prevailing price. On April 1, 1957, the Governmentestablished a National Agricultural Credit Institute for granting low-interest loans to farmers andcooperatives engaged on primary production and to village craftsmen. The annual rate of interestwas 1% to 5% for short-term credits, and 5% to 8% for long-term loans. The restoration ofinternal security brought about an improvement in agricultural production. The 1957 yield of rice,rubber, tobacco, sugar and coffee exceeded thee of 1939. However, production of maize, tea,groundnuts and copra was still below prewar level.
Viet Nam’s main export products were rubber and rice. Rubber export proceeds inthe period January—September l957 incl. were 1,100 million plasters, against 976 mil-lion plasters in the corresponding period of l956. For the first time after World War IIrice could be exported again. Proceeds from rice exports in the first 9 months of l957amounted to P 589 million. VietNam’s exports in l957 were greater than in the preced-ing year (P 2,790 million and P 1,579 million respectively), while imports also rose sub-stantially, that is, from P 7,618 million to P 10,090 million.

52
The cost of living index, which showed a rising tendency in the first 9 months ofl957, edged down again. The index for wholesale prices, which showed the same ten-dency in the first 3 quarters of l957, has apparently levelled out again.
Viet Nam’s budget for l958, as approved by the Viet Nam National Assembly,estimates expenditure at VN$ 14.37 billion and revenue at VN$ 8.7 billion, leaving adeficit of VN$ 5.67 billion. Non-military expenditure is estimated at VN$ 7.8 billion, ora rise by 2.8% in comparison with 1957.
U.S. aid is expected to aggregate VN$ 2.68 billion.
The Viet Nam Government has announced a development plan covering the pe-riod l957-1961. This first 5-year plan—almost entirely financed by foreign aid from theU.S., France, and Japan—gives highest priority to the agricultural sector (includingplantings of high grade rubber trees). Rehabilitation of Viet Nam industries cannot yetbe taken in hand—output has slumped year by year.
In its efforts to raise industrial production, the Government approved several de-velopment projects whose implementation will be started in 1958. The principal indus-trial projects include a paper mill in Dran with an annual capacity of 7,000 tons; a cottonspinning mill (20,000 spindles); a glassworks with an annual production of l 5,000 tons;the modernization of the Hiep Hua sugar mill envisaging a yearly production of 20,000tons; the erection of a new sugar mill in Tay Hoa (l 0,000 tons); four fish canning plants,and four pharmaceutical plants. An overall expenditure of P 352 million will be involvedThe mining industry, namely the coal mines in Nong Son and the phosphate mines onthe Paracel Islands, will also be put into production. Rehabilitation of communicationsand transport is underway and a start has been made with repairs on the main roads, andP 77 million have been earmarked for repairing damaged bridges, railway stations andrailway tracks. It is expected that the Trans Viet Nam Railways will be able to startoperations again in 1959.
The main object of the economic development plan of North Viet Nam is torehabilitate industries which have suffered badly from the war that ended only in June1954. The target is to raise coal production to the 1939 level, that is, 2,300,000 tons. Of

53
overall Government investments, the industrial sector has taken the major share (38%),while the agricultural, forestry and fisheries sectors accounted for 20%, communica-tions for 23%, and the housing and education sectors for 19%. In 1957, seven irrigationprojects were completed capable of irrigating 120,000 acres of rice fields in severalprovinces. The construction of a large-scale irrigation project in South East Hanoi isunderway, capable, when completed, of irrigating an area of 370,000 acres.
The balance of trade of Cambodia showed a deficit of 203 million riels from January/November 1957 included. Export proceeds totalled 1,670 riels, while imports required 1,873million riels. In comparison with 1956—when the unfavourable balance amounted to 722million riels—some improvement is to be noted. This improvement can largely be attributedto greater rice exports —from 225 million riels over 11 months in 1956 to 638 million rielsin 1957. Rubber exports also improved from 446 to 519 million riels. Next to rubber andrice— 38% and 31% resp. of total export proceeds—Cambodia also exported other pro-duce such as maize, timber, kapok and soy beans. Rubber production in 1957 amounted toabout 30,700 tons, or 4% less than in the preceding year, which was ascribed to unfavourableweather conditions. Cambodia is to receive aid to an amount of Yen 1,500 million fromJapan to set up an agricultural research centre.
Laos’ 5-year plan emphasizes stabilization of foodstuff production with a view ofeconomizing foreign exchange on rice imports. As regards industrial development nosignificant improvement is noticeable as yet in Laos. The projected plywood and pulpplants are still in an experimental stage, while the number of saw mills has increased. Tocheck speculation in kip (Laos currency), the Government announced in October 1957the setting up of a Foreign Exchange Stabilization Fund where foreign currencies couldbe freely bought at prices to be fixed by a Government Committee.
Philippines
The gold and foreign exchange holdings of the Philippines gradually fell off in thecourse of 1957, reaching an alarmingly low level at the end of the year, namely $ 71million as compared with $ 161 million per the end of 1956. This sharp decline inforeign exchange holdings was caused by increased expenditure on imports (from $ 597million in 1956 up to $ 727 million in 1957, a rise by 22%), while exports dropped from$ 437 million to $ 429 million. The deficit on the Philippine balance of trade thus rose

54
from $ 160 million to $ 298 million (+ 170%), the highest deficit so far. The greatermostpart of foreign exchange expenditure went on imports of raw materials for industry. Inthe first 11 months of 1957, raw materials were imported to the value of about P 670million, or 58,9% of overall imports; capital goods and consumer goods requiring only19.6% and 21.5% respectively. For the same period of l956 the percentages were 54.8,%,22% and 23.2°% respectively.
To stimulate economic development, the Philippine Government granted tax andcredit facilities, subsidies and protection to industrial enterprises, while investments weremostly focused on capital intensive project. The substantial imports of raw materialsand capital goods involved, appear to have exceeded the capacity of the country, deplet-ing foreign exchange holdings as illustrated above. Moreover, advanced prices of im-ports and barter trade (exports below world market price levels and imports of luxuryand non-essential goods) were contributing factors. All this, with increasing consumers’demand due to over-investment, accounted for the slump in foreign exchange reservesand for heavier inflationary pressure.
To ward off inflation and further deterioration of economic conditions, a drasticretrenchment policy was introduced by the Government. In August a credit squeeze wasimposed on the Banks, while the Central Bank increased the discount rate. From theincrease of 11/2 to 2% in April 1957, the discount rate was put up to 41/2% as fromSeptember 1957. Foreign exchange allocations for the first quarter of 1958 were re-duced.
The indices for cost of living and wholesale prices were, on average, 2% and 4%higher than in 1956. The volume of money in circulation also was higher by 7% than perult. 1956 (P 1,599 million against P 1,449 million per the end of December 1956) .
Improved agricultural output is the silver lining to the dark clouds of dwindlingforeign exchange holdings and the weakening monetary position. Food crops and yieldsof the principal export products were on a higher level than in 1956. Output of timber,leaf tobacco and abaca rose by 45%, 34% and 7% respectively, while the production ofcopra, coffee and cocoa increased by 11 ,% each. However, production of coconut oiland sugar dropped by 13 ,% and 6% respectively.

55
For the fiscal year 1957, the Government has set aside 506 million pesos for eco-nomic development (1956—456 million pesos). Various projects were put in hand—steel, iron ore smelting, rami, highway construction. Progress was made with the exten-sive hydro-electric projects at Binga (Luzon), Ambuklao and Maria Cristina, while smallerprojects in various places, capable of generating a total of 30,300 KW were completedin 1957. Several industrial projects were authorized—reconstruction and modernizationof the cement works at Naga and the steel works at Iligan, construction of anotherfertilizer plant at a cost of 15 million pesos, and several iron ore smelting works at a totalcost of 50 million pesos.
Taiwan
The close of 1956 also marked the termination of Taiwan’s First 4-year EconomicDevelopment Plan. The targets set in the Plan were achieved generally speaking, par-ticularly with regard to industrial development. Industrial production has been climbingyear by year, 1957 being 17% higher than 1956. Fertilizers, paper, electrical appliances,for instance were up by more than 20%; textiles, chemicals and metal products by 10 to20%, and foodstuffs by 10%. Petroleum products did not contribute to the general risedue to reduced imports of crude oil. In 1957 a start was made in the production of lighttrucks and nitrophosphate.
In May 1957, the Government approved the Second 4-year Plan which emphasizeslong-term industrial development. Of the total of 20 billion N.T. dollars earmarked forinvestment, 8.5 billion is to go to industry, mining and electric power generation; 4billion to the agricultural, forestry and fisheries sectors; 2.5 billion to expansion of com-munications, the remaining 5 billion being set aside to finance various smaller projects.Under the Second 4-year Plan a start has been made on two multi-purpose projects,namely the Shihmen and Ta Chia Chi dams, envisaging the irrigation of 54,300 and51,500 ha of rice fields and an increased rice production of 132,000 tons annually. Thehydro-electric power to be generated at the two dams and to be employed for industrialpurposes is calculated at 120,000 and 543,000 kw respectively.
Progress in the agricultural sector has not been marked as in industry, a fact whichis ascribed to short supply of fertilizers. The construction of the 3 fertilizer plantsprojects in the First 4-year Plan encountered difficulties, and their completion has now

56
been included in the Second 4- year Plan. The 3 plants should be capable of stepping upagricultural output to 420,000 tons annually, to which the expansion of the sulphate ofammonia plant at Raoshiung is to add another 108,000 tons annually. Other major projectsare coal mines, a steel works with an annual capacity of 200,000 tons, and buildingmaterials (cement and timber). Furthermore there is a highway which is to connect theWestern and Eastern sections of Taiwan. This project, started in 1956, is financed withU.S. aid.
Taiwan’s balance of trade still showed a deficit (US$ 64 million against US$ 75.5million in 1956). Export proceeds increased from US$ 118.3 million to US$ 148.3 mil-lion, while expenditure on imports rose from US$ 193.8 million to US$ 212.3 million,the latter figure including imports financed with U.S. aid (U.S. $ 80.6 million in 1956 andUS$ 83.5 million in 1957). Sugar exports. Taiwan’s chief export commodity, rose by 50%with proceeds to an amount of US$ 92.7 million against US$ 62 million in 1956, whichis accounted for by better marketing conditions for sugar. Rice and tea exports alsoshowed increases by US$ 1.3 million (8%) and US$ 0.9 million (19%) respectively.
Taiwan’s gold and foreign exchange holdings gradually rose in the year under re-port—from US$ 79 million at the end of 1956 to US$ 108 million per the end ofDecember 1957. The volume of money in circulation showed a rising trend from N.T. $3,260 million to N.T. $ 3,940 million. The index numbers for the cost of living and forwholesale prices were both higher by 8 % as compared with l 9 5 6.
Japan
Economic developments in Japan gave a rather gloomy picture in 1957. The bal-ance of payments showed a deficit of $ 533 million in contrast with a surplus of $ 293million in 1956. Foreign exchange revenue amounted to $ 3,642 million and expenditureto $ 4,175 million (1956: $ 3,224 and $ 2,931 million). Increased imports explained thedeficit over the 1st half of 1957 to an amount of $ 399 million. From July, however,imports were down and, in the 4th quarter, foreign exchange revenue was higher thanexpenditure. The shrinking volume of imports in the 2nd half of 1957 was mainly to beattributed to the increased Bank of Japan official rates in May and a series of othermeasures to restrict imports, such as, reduced sterling expenditure, increased importguarantee money and retrenchments in the foreign exchange budget. Exports have been

57
steadily increasing since 1954, which is explained by steadily expanding production, greatercompetitiveness, well-conducted propaganda campaigns and increasing demand fromforeign countries. In comparison, however, with foregoing years, the increase in exportswas lower in l957.
In June 1957, the Japanese Cabinet approved an economic policy aiming at strength-ening the deteriorating balance of payments, expressed in 9 points:
1) Promotion of exports; there will be no credit restrictions on exports; efforts will bemade to step up revenue from services abroad.
2) Control of imports.3) Restriction of Government capital investments.4) Postponement of carrying out public works by the Government.5) Cessation of investments in equipment by private industry.6) Advanced rates of interest for long-term loans.7) Stabilization of prices.8) Stimulating savings and reduction of expenditure; promotion of the use of home
made goods; higher interest rates for deposits.9) Employment of foreign capital; efforts will be made to put to immediate use the
loans received from I.M.F., the World Bank and from the Eximbank.
Thanks to this economic policy, imports were reduced while exports were higher in1957 than in ]956. The Bank of Japan reduced credit facilities to commercial banks byincreasing rates of interest and the commercial banks in turn had to restrict credit facili-ties to their clients, and, working capital becoming scarce, production went down.
Index numbers of industrial production (base l955 = 100) for March, June, Sep-tember and December were 154, 148, 143 and 142. Employment index numbers forregular workers (base average 1951 = 100) dropped from 121.1 at the end of the 1st halfyear to 119.6 at the end of the 2nd half year 1957. As a consequence of decreasingdomestic demand for goods, stocks went up and prices fell down. Index numbers forwholesale prices of all kinds of goods (base average 1952 = 100) were 107 for the 1stquarter, 106 for the 2nd, 104 for the 3rd, and 103 for the 4th quarter 1957. The indexnumbers of textile prices were 84, 80, 79 and 76 for the corresponding quarters.

58
The 1957 balance of trade showed the following developments: exports $ 2,858million (Yen 1,028 billion); imports $ 4,283 million (Yen 1,542 billion); import surplus $1,425 million (Yen 514 billion). The corresponding figures for 1956 were: $ 2,501 mil-lion (Yen 900 billion); $ 3,230 million (Yen 1,163 billion); import surplus $ 729 million(Yen 263 billion).
In the export list textiles took first place ($ 1,015 million or 35.6%), while machinerytook second place ($ 625 million or 21.9%). The major share of exports went to the UnitedStates ($ 596 million), Liberia ($ 283 million— ships), Hongkong ($ 120 million), India ($113 million). In the import list textile materials came first ($ 825 million or 19.3%), followedby metal ores and sheet iron ($ 693 million or 16.2%), fuel ($ 680 million or 15.9%). importsprimarily originated from the United States ($ 1,617 million), followed by Australia ($ 362million), Saudi Arabia ($ 190 million) and Canada ($ 167 million).
In June 1957, Eximbank granted loans to the amount of $ 175 million to financepurchases of United States surplus agricultural commodities. Besides, Japan drew $ 125million from I.M.F. on June 27, 1957, an amount equivalent to 50% of Japan’s share in thisFund. In 1953 Japan bought sterling to the value of $ 124 million in yens. In that same year,the yens were repurchased to an amount of $ 61.6 million, while the balance of $ 62.4million was bought back in 1955. From the World Bank, Japan received a loan to the amountof $ 7 million in August 1957. This loan was mainly used to finance imports of heavymachinery for the construction of a dam, canal and water reservoir in the Aichi district.
In the course of the visit of India’s Prime Minister to Japan in October 1957,discussions were held on the promotion of trade relations and economic cooperationbetween the two countries. The discussions included a proposed agreement for ship-ment of iron ore from India to Japan on a regular and long-term basis. Further, Japanoffered assistance for setting up a Project Consultant Centre for small scale and mediumsized industries in India. In February 1958, an agreement was signed between the twocountries under which Japan is to give a loan to the amount of Yen 18,000 million ($ 80million) within a 3-year period. This loan is redeemable within 10 years, while the rate ofinterest is to be equal to the usual I.B.R.D. rate. The money loaned is to be utilized forthe purchase of Japanese goods, including plant and equipment for railways and ports,ships, industrial machinery, equipment for the construction of dams and for such otherpurposes as arc to be determined later.

59
Japanese enterprises invested capital abroad to the total amount of $ 62.4 millionfrom 1951 to the end of 1957. Japan was most interested in capital investments in LatinAmerican countries, especially Brazil. An agreement was reached for establishing a steelworks there, Japan to supply the capital and technical experts. Negotiations are alsounderway for the construction of a shipyard and an automobile plant.
A war reparations agreement was signed with Sweden in September 1957. underwhich Japan is to pay Yen 505 million as reparations to Swedish nationals in compensa-tion for World War II Losses. A war reparations agreement was also reached with Indo-nesia in December 1957, under which Japan is to pay $ 225 million within 12 years. Forthe first 11 years Japan is to pay $ 20 million annually, the balance to be paid in the 12thyear. Furthermore, Indonesia’s trade debt to Japan ($ 174.5 million) is to be cancelled,while there will be economic cooperation to the value of $ 400 million for a 20-yearperiod, the implementation of which is to be left to private initiative.
Korea
In its efforts to rehabilitate its war-devastated economy. the South Korea Governmentachieved favourable results. Industrial and mining production rose though agricultural out-put was still far below the pre- Korea War level and the country still depended largely onimports of foodstuffs. The pressure of population greatly increased the demand for food-stuffs—in 1957 South Korea had about 22.1 million inhabitants against 21.5 million for thewhole country in 1937. The influx of war evacuees from North Korea contributed to thepressure of population in South Korea.
Economic development without foreign aid would be inconceivable for South Korea.Aid granted through the U.N. Korea Reconstruction Agency and by the U.S. since 1953totalled over U.S. $ 1 billion. The U.N. aid project is now completed and in the comingyears South Korea will practically only receive aid from the U.S. In this connection theI.C.A. approved aid to the amount of U.S. $ 303.5 million for the 1957 fiscal year, whilethe same amount is expected for 1958. Out of this total, U.S. $ 100 million will be usedfor reconstruction projects: purchases of materials and industrial machinery for theimplementation of such projects; development of shipping, communications, agricul-ture and mining. An amount of U.S. $ 198 million will be used for imports of essentialmaterials and commodities, such as fertilizers (U.S. $ 50 million), foodstuffs under theS.A.C. agreement (U.S. $ 45 million) and petroleum (U.S. $ 18 million).

60
The South Korea budget showed a deficit of 165.6 billion hwans, against 90.9billion hwans in 1956. Though revenue rose from 47.8 billion hwans to 145.2 billionhwans, expenditures rose at a greater rate, namely by 122.3 billion hwans to 310.7 billionhwans. This deficit on public finance was largely covered by U.S. aid.
The foreign trade of South Korea presented a gloomy picture in the year under review.Exports gradually fell off, while imports showed a steadily rising trend. Exports amountedto U.S. $ 21.5 million in l957, against U.S. $ 25.2 million in 1956, while imports rose from U.S.$ 369.1 million to U.S. $ 431. 5 million. The fall in exports was primarily brought about bydecreased exports of tungsten (from U.S. $ 9 million to U.S. $ 3.6 million). The proceedsfrom other exports went up. The deficit on the balance of trade, going by the above figures,went up from U.S. $ 343.9 million in 1956 to U.S. $ 410 million in 1957.
The upward trend in the volume of money in circulation, apparent in foregoingyears, persisted in 1957. Amounting to 136.1 billion hwans at the end of 1956, it rose to158.4 million hwans in l957, an increase by 17%.
The index number for wholesale prices was continually increasing during the first half-year.An improvement set in afterwards and the index receded in the second half-year. Nevertheless theindex for l957 is still higher by 43% compared with 1956. The index number for the cost of livinggenerally showed a rise also, and the Government did not succeed in controlling inflationary pres-sures, which assumed alarming proportions. The rate at which prices were rising could be abated bythe increased imports under U.S. aid as referred to above.
On January 31,1958 an agreement was signed with West Germany for the con-struction of a fertilizer works at Naju with a capacity of 85,000 tons annually and ex-pected to start operations in 1960. The cost of this project is estimated at U.S. $ 23.5million and 2.5 billion hwans. This works, together with the one now in construction atChungju, is to supply 20% of overall fertilizer requirements, computed at 835,000 tonsannually. Plans for the construction of a further fertilizer works also with a capacity of85,000 tons are now under consideration.
Like the majority of Asian countries, North Korea has its Economic Develop-ment Plan. The First 5-year Plan, covering the period 1957/1961 was submitted by theState Planning Committee. Industrial production is to be raised by 21.5% annually aim-

61
ing at a production level in 1961 of 700,000 tons iron, 670,000 tons steel, 630,000 tonsfertilizers, 1,750,000 tons cement, 9.5 million tons coal, and 9.7 million kwh electricalpower. National income is estimated to increase by 100% of that for 1957. North Koreawill cooperate with the Soviet bloc in the implementation of this 5- year plan.
Chinese People’s Republic
The close of 1957 marked the reportedly successful completion of the First 5-yearPlan of the Chinese People’s Republic. All targets set in this economic developmentplan were realized and in many cases even exceeded. Capital was invested without caus-ing the volume of money in circulation and the amount of credits granted to swellexcessively, thanks to strict price control and the controlled distribution of essentialconsumer goods, as well as appropriate taxation. As a result, price levels were fairlystable and inflationary pressures could be avoided over this 5-year period.
State revenue and expenditure (in millions Yuans) were as follows:

62
On February 1, 1958, the Minister of Finance of the Chinese People’s Republicsubmitted to the National People’s Congress his report on the 1957 State Budget to-gether with the estimates for 1958. According to the above figures, a surplus of 153million Yuans was realized during 1957, though actually revenue and expenditure ex-ceeded estimates by 4.5 % and 3.9% respectively. In comparison with 1956, revenue forl957 had increased by 948 million Yuans, while expenditure had decreased by 25 millionYuans. Expenditures for economic development become smaller proportionately, namely,48.6% compared with 52.5%. Expenditure for defence also dropped from 20 % to18.4% while the allocation for this item was further cut back to about 1 5% of theestimates.
The rate of economic development in 1958—the first year of the Second 5-yearPlan (1958/1962) is expected to be greater than in 1957. Targets for industrial and agri-cultural production were raised by 14.6% and 6.1 % respectively (the increases reportedfor l957 over 1956 were 6.9% and 3.5% respectively). To implement this improvement,it was necessary that estimated total revenue and expenditure he raised by 7.6% and8.2% for 1958 in comparison with 1957.
Industrial development, particularly in the sector of heavy industries, is the maintarget. In the Second 5-year Plan, the rate of progress aimed at for the electric powergenerating industries, the coal and fertilizer industries will be raised, while the steel andoil industries will not aim so high. Medium and small-scale factories would seem to bemore in the limelight at the expense of heavy industries, though the latter item will stillbe receiving a great deal, of attention.
Industry seems to have made great strides under the First 5-year Plan. The fertil-izer, steel, and oil industries seem to have achieved outstanding results. Figures for in-dustrial output for 1957, compared with 1956, would show that the heavy industriesincreased output by 5 tic (cement) to 24% (oil), while the light industries showed adecline in the case of cotton and weaving yarns and textiles by 1 l % and 9 % respec-tively, ascribed to unfavourable cotton crops in 1956. The estimate of sugar productionfor 1957, which initially stood at 1,100,000 tons, was reduced to 870,000 tons later in theyear. Actually only 840,000 tons of sugar were produced which is explained by disap-pointing sugar cane yield.

63
In the final year of the First 5-year Plan, gross industrial production was computedat 14% higher than in 1956. Production of capital goods rose by 32.4%, while consumergoods and handicraft products only achieved rises by 4 % and 9% respectively. Incomparison with the increases reported for 1956 (gross industrial production + 45%over the level of 1955; capital goods + 80.1%; consumer goods + 32.7%; handicrafts +21.6%), the rate of progress was lower than in the foregoing years.
From 1952 up to the end of September 1957, a railway network of 4,920 kilome-ters was completed, 80% being main lines, the target set had been 4,084 km. The Second5-year Plan aims at another 8,000 a 9,000 km in South-West and Central China — rich innatural resources such as oil in Kansu. Besides the railway network, the systems ofhighways and navigable rivers have also been expanded.
The First 5-year Plan stressed expansion in the industrial and communicationssector rather than in agriculture, the latter being allotted only 8% out of total expendi-ture. Heavy industries were developed at the cost of agriculture. Production of food-stuffs (incl. rice, wheat, potatoes) amounted to 185 million tons in 1957, or only 2.5million tons more than in the preceding year. In comparison with 1952, however, thisincrease was 27.2 million tons or 12%.
Malaya Federation
1957 was a historic year for Malaya as on August 31, 1957 the Malaya Federationbecame the tenth member of the British Commonwealth with a government of its own,thus terminating British domination which commenced in 1874.
For the development of its economy Malaya aims at diversification of its exportlines so as not to be entirely dependent on rubber and tin. Hopeful in this respect arecopra (with an annual production of about 150,000 tons), palm oil, sisal and pepper.Although export proceeds from rubber and tin were still satisfactory—about 59$ and18% of the overall proceeds—plans are to shift the stress from the two major lines toother natural resources as to mitigate adverse effects of being entirely dependent on twoexport items only.

64
Under the First 5-year Plan (1956-1960) first priority is given to the replanting ofrubber estates, agriculture, mining, industry and ports. M$ 160 million have been set aside torejuvenate rubber plantations, while it is worthy of note that since World War II 750,000acres or 21.5% of the overall acreage in rubber have already been rejuvenated. In the agricul-tural sector reclamation and irrigation are the major projects; M$ 40 million is to be laid outon carrying out new projects and the improvement of existing schemes.
As national revenue declines due to lower export proceeds, the Government isfaced with the possibility of being unable to carry out the First 5 -year Plan (involving anestimated M$ 1,381 million) completely, unless expenditure is cut back drastically or thegaps can be bridged by foreign aid.
The 1958 budget estimates show a deficit of M$ 119.2 million, against M$ 111million in 1957. Revenue is estimated at M$ 783.4 million expenditure M$ 902.6 million.
The balance of trade of Malaya and Singapore showed a deficit OT US$ 68 millionin 1957, against a surplus of US$ 4 million in the foregoing year. Imports rose by 6%while export proceeds remained practically unaltered. Proceeds from rubber exportsdropped slightly, while proceeds from tin despite lower world market prices, maintainedtheir previous level, thanks to a greater volume of exports.
British Colonies in South East Asia
Exports from Hongkong experienced a setback in 1957 as compared with l956.Proceeds dropped by 6% (from HK$ 3,210 million to HK$ 3,016 million). Imports, incontrast, rose from HK$ 4,566 to HK$ 5,150 thus increasing the deficit on the balanceof trade from HK$ 1,356 million to HK$ 2,134 million. This rather large deficit, how-ever, was offset by invisibles, such as receipts from insurance, shipping, tourism etc.
The main causes for decreased exports were reduced purchases by Indonesia, Thai-land and Japan. Exports to the United Kingdom and the United States showed an im-provement. Indonesia, the second largest export destination after the United Kingdom,only imported to a total of HK$ 312.5 million in 1957 which is HK$ 188.9 million or38% less than in the foregoing year. Exports to Thailand and Japan totalled HK$ 188.2

65
million and HK$ 228.3 million respectively, against HK$ 319.6 million and HK$ 318 millionin l956. The falling off of Hongkong’s position as an entrepot will undoubtedly becomemore marked as normal trade movements are resumed, as after the restoration of regulartrade relations between Indonesia and Japan following the signing of the war reparationsagreement and the resumption of direct shipments between the two countries.
Industrial development made rapid progress in Hongkong though hampered by ashortage of level sites for factory building; the demand for suitable sites skyrocketedland prices. Shortage of water and electric power constituted additional difficulties, butample supplies of manpower more or less counterbalanced these setbacks. The head-way made by industry is illustrated by the following figures—number of enterprises inl957—3,071 (1956—2,874); labour force in 1957— 139,700 (1956— 133,350). The largestconcentration of enterprises is in textile factories—856 plants with 55,570 workers in1957.
The other British colonies in South-East Asia are Brunai, Serawak and North Borneo.
Serawak’s economic development plan covering 1957-1960 and approved by theState Council in September 1957, is estimated to involve M$ 105.4 million in expendi-ture and M$ 102.9 million in revenue. The largest portion, M$ 41.8 million, is allotted toexpansion of the system of communication, while M$ 11 million is earmarked for theagricultural sector. Rice production is to be increased by stepping Up the yield per acre.
Replanting rubber trees will be effected under a separate budget, now totalling M$12 million, rubber being Serawak’s principal export product. Exports of Serawak roseslightly in 1957, proceeds totalling US$ 163 million, or US$ 4 million more than in 1956.Imports were practically on the same level and amounted to US$ 151 million. Besidesrubber, Serawak exports pepper, oil and timber. No new oil wells were sunk in the yearunder report but prospecting operations are still continuing. Serawak started to exportbauxite in 1958, the chief destination being Japan.
North Borneo reported progress in foreign trade in 1957 as compared with 1956.Even though export proceeds from rubber were lower than last year, proceeds fromcopra, timber and sisal, were higher.

66
Australia and New Zealand
Australia
The balance of payments of Australia improved in the 1956/1957 financial year(which terminates on the 30th of June), thanks to increased exports, improved terms oftrade and import restrictions. The balance of current transactions showed a surplus of£ 80 million against deficits of £ 235 million and £ 259 million in the financial years1955/1956 and 1954/l955. Moreover, the inflow of capital was at about the same levelas in the foregoing years. Export proceeds amounting to £ 980 million - against £ 772million in 1955/1956 —were the highest since l950/1951. Wool exports were mainly tobe thanked for this improvement, representing 75 % of the overall export increase.Exports of wheat, wheat flour, sugar, iron, steel and means of conveyance were alsohigher. On the other hand, exports of dairy produce and fruit dropped. The importlicensing system forced down imports to £ 717 million, against £ 819 million in 1955/1956. Import restrictions were eased in January, February, and .April! 1957 successivelyto prevent the domestic market from running dry; moreover, the foreign exchange po-sition had improved. The above relaxation of import restrictions envisages an importscheme involving £ 775 million for 1957/1958.
The gold and foreign exchange reserves, totalling £ 567 million at the end of the1956/1957 financial year, had increased by £ 212 million in that year.
In the 1956/1957 financial year Australia obtained two new loans: $ 50 millionfrom the World Bank and another $ 27 million for expanding the fleet of Qantas Em-pire Airways Ltd. Of the latter loan $ 9 million came from the World Bank and thebalance from the New York capital market.
The volume of money in circulation showed a continuous slightly upward trend in theperiod 1950-1957. From £ 1,254 million in 1950 it rose to £ 1,673 million in l 9 5 7. Inanalogy, prices also showed a slight upward tendency, in particular prices for primary goods.
Wool production increased by about 11% while wheat production drop pea, being thelowest since 1946/1947. This drop was ascribed to unfavourable weather conditions, whichalso affected fruit production. Industrial production generally tended upwards.

67
Rapid progress was made in the construction sector. The Snowy River Project iswell in hand; it involves the construction of several power stations and a giant dam forirrigation purposes.
New Zealand
New Zealand’s export proceeds rose by £ 4.2 million, bringing the total for l957 to£ 328.6 million. Imports increased by £ 41.8 million and stood at £ 298.6 million. Thebalance of trade showed a deficit of £ 32.2 million in 1957, in contrast with a surplus of£ 8.9 million in 1956. In the period December 1956—December 1957 the assets ofNew Zealand’s foreign exchange banks abroad dropped by £ 3I million to £ 45.5 mil-lion, the lowest level since World War II.
The substantial demand for import commodities and the resultant increase in im-ports was attributed to the increase in the Governments’ cash deficit and the utilizationof credits from the Reserve Bank. The anticipated import restrictions were as addedinducement to importers to lay in large stocks of import commodities. Anxiety over theposition of the NZ £ and the possibility of devaluation to improve the balance ofpayments gave a further impetus to imports.
On January 1, 1958 the New Zealand Government promulgated new import con-trol regulations. In a radio address the Prime Minister stated that the control of importsdoes not change the fact that essential import requirements must be met. Requirementsof industrial raw materials will be met to the greatest possible extent, but no foreignexchange will be allocated for imports of goods that can be produced in New Zealand.

68
III. MONETARY DEVELOPMENTS
Introductory
As in the report for the financial year 1956-1957, the monetary analysis in thisreport was drawn up on the basis of figures received from such institutions which areconsidered as money-creating bodies, i.e. the Central Government, Bank Indonesia, BankNegara Indonesia, Bank Rakjat Indonesia and eleven other foreign exchange banks.Beside these fourteen foreign exchange banks there are other general, nonforeign-exchange banks which, in point of fact, also create money and should, there-fore, be included in the present analysis. So far, however, this has not been done becausethe banks concerned have not yet been in a position to produce regular reports comingup to the required standards, so that inclusion of their figures in a monetary statisticalrecord would have led to technical accounting difficulties. At the same time it should beobserved that, according to the balance sheets received, the aggregate money-creatingcapacity of the 49 general, non foreign-exchange banks appears to amount to 9% ofthat of the 14 foreign exchange banks.
Table 9 sets out the sectors and items causing movements in money supply. Itshould be noted that the indication “ i n c r e a s e = + ” after an item signifies that anincrease of that item will cause the money supply to increase, while the indication “ i nc r e a s e = — ” signifies that an increase of that item will bring about a reduction of thesupply of money.
In substance, the movements in the volume of money throughout 1957 were pri-marily caused by movements in the following four sectors (in millions of rupiahs):
1956 1957A. Public sector + 2,267 + 5,833B. Private sector + 989 + 2,237C. Foreign sector — 1,815 — 1,02 3D. Miscellaneous — 2 8 2 — 1,5 27
+ 1,159 + 5,520
69
The above figures show that the supply of money increased by Rp 5,520 million in1957, against Rp 1,159 million in 1956. The average monthly increase was Rp 460 million.
As in the foregoing year, the public sector was again the greatest source of inflation.Of the total inflationary effect caused by the public sector, the increase in “Government’snet debt with Bank Indonesia” by far accounted for the greater part, namely Rp 5,372 mil-lion. The final quarter saw the steepest increase of Government debt with Bank Indonesia,when indebtedness rose by Rp 2,469 million—- that is, only Rp 434 million less than thetotal increase of indebtedness in the preceding three quarters.
The item “Credits granted by other Banks” to the Government increased by Rp 213million. Inasmuch this item shows a debit balance, this movement actually means that Gov-ernment claims on the other foreign exchange banks fell by that same amount. If the move-ments in the items “Government notes and coins” and “Net transfers from the counterpartaccount to the Treasury account” (which rose by Rp 87 million and Rp 94 million respec-tively) were included, the Central Government caused, in all, an inflationary effect to theamount of Rp 5,766 million. The “Autonomous ressorts” proved to have reduced the moneysupply by Rp 6 million. On the other hand, the credits granted to “Government enterprisesand foundations” expanded, swelling the volume by Rp 73 million.
This expansion by Rp 73 million of credits to Government enterprises and foun-dations represents the movement of total credits granted by Bank Indonesia and theother foreign exchange banks. Bank Indonesia alone granted a total increase in creditsof Rp 54 million to such organizations. It should be noted that Jajasan Kopra was oneof the Government foundations whose liquidation was completed on July 12, 1957.
As the result of the movements as above, the public sector caused, on balance, aninflationary effect to the tune of Rp 5,833 million, which represents the cash deficit ofthe Central Government for 1957 (see further Chapter IV).
The Private sector, too, was responsible for an inflationary effect, to an amount,namely, of Rp 2,237 million, as against Rp 989 million in 1956. As explained in theforegoing Annual Report, the items grouped under the heading “Private sector” attemptto give a picture of the part played by private enterprise and by individuals in affectingthe volume of money in circulation. Three of the five items classified under this sector,

70

71
namely, the items “Private enterprises predominantly financed by the Government”,“Prepayments by Importers”, and “Time deposits”, accounted for an expansion of thevolume of money by respectively Rp 53 million, Rp 2,662 million, and Rp 10 million.On the other hand, the items “Other private enterprises and individuals” and “Guaran-tee deposits” accounted for the contraction of the volume of money by respectively Rp423 million and Rp 65 million. As the above figures show, the greatest movementsoccurred in the items “Other private enterprises and individuals” and “Prepayments byImporters”.
The deflationary effect due to other private enterprises and individuals, came pri-marily from the sharp drop in credits granted to importers (in the shape of advancefinancing and post financing), sugar estates and other agricultural estates. The specifica-tions of debtors of thirteen foreign exchange banks (the specification of Bank RakjatIndonesia is not available), show that the volume of credits to importers fell from Rp1,367 million per the end of December 1956 to Rp 996 million per ult. December 1957,while credits to sugar- estates and other agricultural estates dropped from Rp 318 mil-lion to Rp 218 million and from Rp 241 million to Rp 130 million respectively.
Developments of the item “Prepayments by importers” were, on balance, respon-sible for an inflationary effect to an amount of Rp 2,662 million, thus completely offset-ting the deflationary effect achieved under the heading “Other private enterprises andindividuals . As a matter of fact, the former item was still increasing in the first quarterof 1957, persisting in its deflationary effect. This movement, however, was reversed inthe subsequent quarters, with inflationary effects of respectively Rp 1,703 million, Rp695 million, and Rp 321 million.
The decline in the volume of importers’ prepayments ran parallel, to all intents andpurposes, with the smaller amounts of prepayments made as compared with refundsmade on actual importation. The drop in importers’ prepayments in the second quarterwas immediately connected with the temporary close-down per the end of April 1957of the Biro Devisen Perdagangan ‘Bureau Commercial Foreign Exchange), which im-plied that no further import permits could be applied for. As from June I, 1957, importsof raw materials and auxiliary goods from Japan were permitted again on the so- called“Open account”. Furthermore, industrial enterprises that could secure “Declarations

72
of urgency” were also permitted to import essential raw materials and auxiliaries. Gen-eral imports, however, were not actively resumed until the new (B.E.) import and exportregulation came into operation on June 20, l957.
The new export and import regulations -—better known as the “Peraturan B.E.”(Export Certificate System) —see Appendix “K”—also influenced the above develop-ments to some extent. First of all, the guarantee deposits—to be made by importerswhen lodging applications for import permits (P.I.I. s—Permintaan Izin Impor - Im-port Permit Applications) —were lower than the prepayments that had to be paid underthe old system, while furthermore the demand for imports showed a steadily downwardtrend.
The drop in gold and foreign exchange holdings during the year under report byRp 412 million had a deflationary effect—in l956 the drop was Rp 1,057 million. Thegreatest drop occurred in the first quarter, namely amounting to Rp 435 million. Devel-opments during the further three quarters as a whole led to a net increase by Rp 2 3million. In particular the third quarter proved to be the most favorable, showing anincrease by Rp 620 million.
The items “Amounts credited to counterpart accounts” and “Rurni balances” werealso deflationary in effect, since they increased by Rp 597 million and Rp 14 millionrespectively in 1957. As no further movements took place in the monetary relationsbetween Indonesia and I.M.F., the foreign sector, on balance, caused a deflationary ef-fect to an amount of Rp 1,023 million.
On balance, the sector “Miscellaneous” also had a deflationary effect to the extentof Rp 1,527 million, that is, the sum total of movements in the three items “Capital,reserves and profit & loss accounts”, “Inter-bank transitory accounts”, and “Others”,each of which accounted for a reduction in the volume of money in circulation by Rp446 million, Rp 242 million, and Rp 839 million respectively.
In comparison with foregoing years, the item “Others” underwent a great numberof fluctuations, primarily due to the fact that movements in the total balance from B.E.s (Export Certificates) receivable from and payable into the Foreign Exchange Fund by

73
the foreign exchange banks were included in the item. With B.E. receivable from For-eign Exchange Fund by Foreign Exchange Banks, should be understood as the foreignexchange that will be paid to countries abroad for imports. B. E. payable to ForeignExchange Fund represents the payments in foreign exchange from countries abroad asthe proceeds of Indonesian exports. The item “B.E.” should be seen as a correctionitem, which implies that the increase in the amount of B.E. receivable from the ForeignExchange Fund causes inflationary effects, while the amount of B.E. Foreign Exchangepayable to the Foreign Exchange Fund has deflationary effects. At the end of the thirdand fourth quarters of 1957, movements in the B.E. items were responsible for defla-tionary effects to amounts of Rp 431 million and Rp 330 million respectively.
Monetary balance sheet
The Monetary Balance Sheet has been drawn up on the basis of the balance sheets of14 foreign exchange banks and figures originating from the Ministry of Finance. The debitside of the balance sheet (Table 10) is divided into four headings. The first heading givesfigures concerning the Government net debt with banks and the community, that is, creditsreceived from banks, notes and coins put into circulation by the Government, Treasurynotes and bills, and Government securities bought by the banks. The second heading repre-sents the sum total of credits granted by banks to the private sector, while the third andfourth headings show gold and foreign exchange holdings and sundries respectively.
The above classification is analogous to the four sectors into which the monetaryanalysis is divided, the difference being that the figures in each sector of the monetaryanalysis represent movements, while the figures in the monetary balance sheet show theposition of the Government debt, the private sector, the gold and foreign exchangeholdings and sundry items. It deserves note that the grand total of the debit side of themonetary balance sheet does not represent the volume of money in circulation, sinceso-called non-monetary liabilities are also included.
Non-monetary liabilities are liabilities that need not immediately be met and forthis reason are not considered monetary. The amount of non-monetary liabilities isshown on the credit side, namely, Rp 5,731 million at the end of 1957. This amount hasbeen arrived at by computing the positions of the item, Capital, Reserves, Profit andLoss Accounts, Time deposits, Rurni balances, Guarantee deposits, Prepayments,

74
Amounts credited to E.C.A. and S. A.C. counterpart accounts, and I.M.F. and I.B.R.D.accounts. Besides the volume of money in circulation and its component parts, thecredit side of the monetary balance sheet further shows the actual amount of currencyin circulation and its parts kept with Government offices and banks, and therefore notincluded in the volume of money in circulation.
Money supply
As shown by the monetary analysis, money supply increased by Rp 5,520 million in1957. This increase primarily took place in the current sector, which accounted for a riseof Rp 4,719 million. Deposits grew by only Rp 801 million. This development is notunusual in lndonesia. As the following table shows the major part of the money supplyhas up to now consisted of currency.
At the end of December 1957, currency constituted 74.5% of the overall moneysupply, against 70% at the end of December 1956. On the basis of the relative figuresthe conclusion can be drawn that the share of deposits in the volume of money rela-tively decreased in 1957.

75
Table 11 shows that the volume of money in circulation steadily rose in 1957. Abreakdown of developments month by month shows that marked increases occurred inApril, July and December 1957—by Rp 1,056 million. Rp 1,176 million and Rp 1,287million respectively —these advances being far in excess of the monthly average in-crease of Rp 460 million.
Special conditions prevailing during those months explain the advances indicated.In April, for instance, the traditional bonuses in view of the coming lebaran (end of theMoslem month of fasting) were paid out. The expansion of the volume of money inJuly was mainly caused by the rise in Government net debt with Bank Indonesia ( + Rp75,3 million) and the drop in importers’ prepayments (—Rp 562.2 million). The rise inGovernment debt was inter alia due to increased Government expenditure resultingfrom price advances caused by the B.E. (Export Certificate) system. Prices of importgoods under this news system, namely, being considerably higher than prices of importsunder the previous system, the Government permitted price levels to be adjusted on thebasis of an Export Certificate price of 200%. But revaluation of the majority of import

76
goods was allowed by a price of at most 50%. the degree of the price advance beingdetermined by the category in which the goods belonged. The drop in importers’ pre-payments set in when B.D.P. (Bureau Commercial Foreign Exchange) was closed downper the end of April (see—Monetary Analysis). The expansion of December was mainlydue to the political developments in that period.

77
IV. PUBLIC FINANCE
General review
Section 114 of the Provisional Constitution of the Republic of Indonesia providesthat the Government shall introduce a bill for the estimates of the general budget to theHouse of Representatives before the commencement of the period covered by thebudget. The predecessors of the “Karya” Cabinet (as the Djuanda cabinet is called)could not comply with this provision and lacked a solid and lawful foundation for imple-menting their policies. The second Ali Sastroamidjojo cabinet tried to incorporate the1957 and 1958 budgets in one Draft Appropriation Bill, thereby observing the budgetrights of Parliament and arranging a legal foundation for carrying out their policies. Theplan to submit the Draft Appropriation Bill in May 1957 could, however, not be carriedinto effect since this cabinet returned its mandate to the Head of State before the dead-line it had set itself. Meanwhile, the second Ali Sastroamidjojo cabinet had completedpreparations for the 1957 draft estimates and the preparation of the 1958 estimates hadto be left to the “Karya” cabinet.
The Act initiated by Parliament (Act No 24/1957) and providing that the draftestimates for 1957 and 1958 had to be submitted to Parliament not later than July I, 1957and August 17, 1957 resp., gave the “Karya” cabinet about 4 months’ time to prepare 2budgets since this cabinet commenced its duties on April 9, 1957. Actually, the “Karya”cabinet did not find the 1957 revenue estimates, as drafted by its predecessor as a guidefor the latter’s expenditures, in keeping with conditions prevailing at that time. Never-theless, pressure of time compelled the “Karya” cabinet to adopt its predecessor’s esti-mates by submitting them to Parliament with the provision that they would be followedby a supplementary memorandum of revision.
The 1957 State Budget as fixed by the former cabinet showed a deficit in the amountof Rp 1,020 million, being the balance of expenditure and revenue in the respectiveamounts of Rp 20,277 million and Rp 19,257 million. this budget did not as yet includesuch inevitable items of additional expenditure as Public Security, Revision of SalaryScales of Government Servants, Extra Allowances for Experts, Lebaran (end of theFast) Bonuses, Revision of Armed Forces Salary Scales, which totalled about Rp 2,000million, and caused the estimated deficit to rise to Rp 3,020 million.

78
Since a deficit of this size was considered unjustifiable in view of the prevailingfinancial capacity of the State, revenue had to be increased by the “Karya” cabinet, byintroducing new taxes, raising existing taxes wherever possible and expansion of theproductive sector, while implementing economy and simplification in all sectors. Finally,a national budget for 1957 was submitted to Parliament showing expenditure at Rp20,776 million and revenue at Rp 19,177 million, thus leaving a deficit of Rp 1,599million.
This estimated deficit was reduced to Rp 1,402 million when the supplementarymemorandum of revision was submitted to Parliament and in which expenditure wasestimated at Rp 22,274 million and revenue at Rp 20,872 million. The following tableshows expenditure and revenue as revised, and specified in ordinary and capital account(in millions of Rps):
According to preliminary realization figures from the Ministry of Finance, the actualbudgetary deficit in the year under report amounted to Rp 5,300 million or Rp 3,898 millionin excess of the estimates, in contrast with actual deficits since l952 which were within therange of Rp 1,000 million above or under the estimates. The descrepancy for 1957 is of theorder of + Rp 3,347 million for expenditure and—Rp 55l million for revenue.
The improvement in the ordinary account for l956—which, in contrast to the preced-ing years, showed a surplus—was maintained in the 1957 budget. However, the upwardtrend in expenditure also continued in 1957. This upward trend was classified as alarming inthe previous Annual Report. If this development should continue and the rise in ordinaryexpenditure not be counter balanced by a rise in revenue to at least the same amount, therelative surplus would dwindle and eventually turn again into a deficit. And there is everylikelihood that this development will take place—the 1957 surplus was smaller than that of

79
1956 —seeing that revenue cannot be expanded indefinitely: taxpayers must becapable of paying higher taxes; the Government must be capable of collecting taxesmore efficiently; home and foreign trade must prosper. A surplus on the ordinaryaccount is urgently needed to reduce the deficit on the capital account, which in thecoming years is sure to remain on a high level due to the implementation of devel-opment plans, thus adding to the inflationary pressure caused by the budgetarydeficit, considering that such deficits can usually be financed only by inflationarymeans.
About 30% of the total State expenditure was absorbed by payment of sala-ries of Government officials. To check a further increase of this item, no newofficials were hired during the year under report, except experts. This notwith-standing, expenditure for Government officials increased, due to the larger numberof Ministries in 1957, increments in salaries, and allowances to experts.
The ax was also applied to capital expenditure. No new buildings were erected,unless urgently needed (such as the offices for the Provincial Administrations at Ambonand Soasiu—the capital of the Province of West- Irian), or necessary to increase Staterevenue (offices for Customs and the Inland Revenue Service). The building programfor houses of Government officials was also drastically restricted to housing connectedwith the performance or official duties (houses for harbor masters, police barracks, etc.).
In the middle of January 1958, the Minister of Finance submitted a SupplementaryMemorandum to the 1958 Financial Note, which had been submitted to Parliamentpreviously. This Supplementary Memorandum had become necessary seeing that theDraft estimates for the 1958 Budget had been submitted to Parliament prior to theintroduction of the Export Certificate System and no longer reflected actual conditions.This Memorandum computed the available data and took account of economic devel-opments during the last few months of 1957.
The revisions in the items expenditure for Government officials, goods, and capi-tal expenditure were based on the following price advances:

80
Besides affecting price developments, the Export Certificate system also affectedrevenue derived from T.P.I. (import surcharges) and P.B.E. (export certificate payments),originally estimated to total Rp 10,200 million or 45% of overall revenue.
Reductions were also applied to the estimated revenue from: company taxes’ salestaxes, aliens tax, customs duties, transfer surcharges and J.U.B.M. (Food Foundation)receipts.
The above revisions resulted in a practically new budget with a deficit of Rp 4.7billion. To reduce this deficit, retrenchments were made to an amount of Rp 2,308million on: goods expenditure Rp 806 million, capital expenditure Rp 657 million, mis-cellaneous expenditure Rp 843 million, leaving an overall deficit of Rp 2.4 billion.
The Supplementary Memorandum to the 1958 Financial Note stated that severalfactors, which might materially affect the estimates, had not been taken into account,such as:
— exigencies, particularly in the field of public security;— developments in connection with the West Irian campaign;— barter transactions and their adverse impact on revenue in foreign exchange and
from T.P.I., P.B.E. and import duty;— shortage of shipping space;— shift of foreign markets for Indonesian exports :— reduced output of such manufactures as require specialized processing formerly run
by the Dutch.

81
If these factors had been calculated in the estimates the deficit would have becomeconsiderably higher, the more so if the economies as planned could not be carried intoeffect.
So far, the advances of Bank Indonesia to the Government have been the mainsource for financing the deficits on the successive budgets. Section 19, paragraph 2, ofthe Bank Indonesia Act provides that such advances must not exceed 30% of the Staterevenue in the year previous to the budget year in which the Government applies forsuch advances to the Bank. Under this provision, the size of the advance the Govern-ment could apply for to Bank Indonesia in 1957 was about Rp 5 billion. At the end of1957, the advances drawn by the Government amounted to about Rp 15 billion, whichis far in excess of the maximum stipulated. In the absence of legal grounds for thisoverdraft, the Minister of Finance still requires the approval of Parliament for financingthe expenditure under the 1957 budget with advances of Bank Indonesia. It is to beforeseen that the advances the Government will apply for to Bank Indonesia for 1958will be on a higher level still, particularly if the possibility of lower revenue from T.P.I.,P.B.E. etc. is taken into account. At this moment these advances amount to Rp 18,647million already. The following is a more detailed tabulation of actual State expenditureand revenue in 1957.
The Government cash deficit
As set forth in the Monetary Analysis (chapter III), the creation of money to theamount of Rp 5,833 million for the public sector in 1957 meant a Government cashdeficit for that same period. The following survey gives a more detailed picture of thecash deficit, its component parts and the method of its financing.
Government net expenditure abroad totalled Rp 1,781 million. In computing theinternal monetary effects of public finance, external net expenditure must be deductedfrom the above cash deficit. On the one hand, namely, the above amount falls undertotal Government expenditure and is an additional cause for the Government cash defi-cit and thereby has an inflationary effect. On the other hand, however, the utilization ofthat amount for foreign payments diminishes foreign exchange reserves and thus has adeflationary effect. The monetary effect of Government expenditure abroad is there-fore neutral.

82
The Government cash deficit is computed from the balance of budgetary revenueand expenditure, movements in the amounts of net Government loans from home andforeign capital markets, and the movements in treasury notes and bills with the privatesector. As table 12 shows, the State budget of 1957 showed a deficit of Rp 5,711 million.Net borrowings from the home capital market increased by Rp 1 million, while thosefrom the foreign capital market decreased by Rp 201 million. As the amount of treasurynotes and bills with the private sector rose by Rp 78 million, the Government cashdeficit stood, on balance, at Rp 5,833 million. This was Rp 3,566 million more than thecash deficit in 1956, which amounted to Rp 2,267 million. Preliminary figures from theMinistry of Finance indicate a budgetary deficit for 1957 of Rp 5,300 million. Thedifference between the figures of the Ministry of Finance and the data used in themonetary analysis is caused by transitory items and by the provisional character of theMinistry’s figures.
Table 12 further shows that a deficit occurred each quarter in the Governmentcash position. Most striking was the deficit in the 4th quarter of 1957 when it amountedto Rp 2,579 million, which is more than the overall Government cash deficit in 1956.The monthly cash deficit averaged Rp 486 million in the period under review.
The Government’s cash deficits discussed above were financed by drawings onbanks and the issue of currency. Bank Indonesia advances to the Government rose byRp 8,321 million in 1957 compared with a rise by Rp 2,420 million in 1956. Partly, thissubstantial increase is explained by the drop of Rp 2,834 million in the item Prepay-ments by Importers in the period under review.
There was an import stop in April 1957. The ban was lifted with the introductionof the new foreign exchange system, better known as the B.E. system, on June 20, 1957,but it was not before the beginning of August that imports were actually resumed. Theimport story called a halt to prepayments which have to be mad by importers whenpermits are actually granted, in fact, refunds of prepayments had to be made to import-ers. Especially in the 2nd quarter of 1957 prepayments fell off steeply (Rp 1,671 mil-lion), which forced up Government debt with Bank Indonesia. Actually, Bank Indonesiaadvances to the Government increased by Rp 8,321 million in 1957 against Rp 2,420million in 1956.

83
The item Net Transfers from Counterpart Accounts rose by Rp 94 million in 1957.This item is meant to correct movements occurring in Government debt with BankIndonesia. As explained in the previous Annual Report, the decrease in the Governmentdebt with Bank Indonesia caused no deflationary effect since this decrease was merelycaused by transfer entries and not by an actual movement of money.

84
The amount of treasury notes and bills with banks increased by Rp 501 million, whichwas mainly the result of the Decree of the Monetary Council No 28/1957 (appendix “H”)which made it incumbent on private banks showing overall balances of current and depositaccounts to an aggregate of at least Rp 75,000,000, to convert part of their ready cash intotreasury notes and bills. The relative movement shows that the money drawn by the Govern-ment from banks increased by Rp 501 million in 1957. The increase by Rp 174 million in theamount of bank notes with Government pay offices means that the amount of bank notesheld and not brought into circulation increased by that same volume. On the other hand, theamount of paper and metallic currency issued by or on behalf of the Government increasedby Rp 87 million. Further, it is worthy of note that various Government debts with banksdecreased by Rp 229 million in l957. Finally, the total balance of autonomous resorts withbanks increased by Rp 6 million, while the balance of Government enterprises and founda-tions with banks decreased by Rp 73 million.
On the basis of the above developments it may be inferred that the Government cashdeficit in the year under report was financed by advances from Bank Indonesia to the Gov-ernment, which amounts to the creation of money and an inflationary system of finance.
Government expenditure
Table 13 shows that the actual budgetary deficit over 1957 was higher by Rp 3,760million than that over the preceding year. It should be noted that, under the revisedfigures of the Ministry of Finance, net expenditure in 1956 decreased from Rp 18,031million to Rp 17,273 million, while net revenue remained unaltered. The actual deficitover 1956 therefore amounted to Rp 1,540 million, or Rp 758 million less than set out inthe previous Annual Report.

85
Compared with 1956, net expenditure in the year under report proved to have in-creased by Rp 4,900 million, while net revenue showed an increase by Rp 1,140 million only.
Table 14 (provisional figures) sets out actual gross expenditure, specified according tothe various sectors. Overall, actual expenditure proved to be higher by Rp 3,596 million thanoriginally estimated. Mainly responsible for increased outlays were the Security Sector (Min-istry of Defence to the amount of Rp 1,098 million), the Economic Sector (primarily theFinancing Service to the amount of Rp 1,306 million , and the Foreign sector (to the amountof Rp 667 million). Gross expenditure of the Ministry of Home Affairs, Security Sector,actually showed a lower figure than the estimates (Rp 95 million) . Expenditure of the newMinistries created in 1957 (the Ministries of Industry, Inter Territorial Relations, Navigator,Mobilization of the People’s Potentials for Reconstruction, Veteran Affairs) proved to belower than estimated and totalled Rp 89 million less.
Actual gross expenditure of the Ministry of Commerce was Rp 31.8 million higher,that of the Ministry of Industry was Rp 27.9 million lower than the estimates.
As compared with 1956, actual gross expenditure in 1957 increased by Rp 5,121.4million.
Government revenue
Government net revenue over 1957 provisionally stood at Rp 16,873 million againstRp 15,733 million in 1956. Since budgetary net revenue was estimated at Rp 17,424million for 1957, actual revenue stayed Rp 550 million below the estimates.
Table 15 shows that actual revenue from direct taxes totalled Rp 3,525 million—Rp 843 million below the estimates, but Rp 410 million higher than in 1956. As com-pared with 1956, revenue from all kinds of direct taxes showed a rise; transition andother direct taxes in particular increased appreciably.
In the sector of indirect taxes, excise duties and other indirect taxes improved byRp 716 million and Rp 67 million resp. on the 1956 figures. The other indirect taxesshowed lower receipts, especially so turnover/sales taxes and export duties. Overall,revenue from indirect taxes rose by about Rp 360 million as compared with 1956.

86

87
The budgetary estimates were taken as the provisional revenue of the so- calledI.B.W. enterprises since it has not yet been possible to compute their actual net revenue.The figures for the 1955 revenue of I.B.W. enterprises however, are the actual net rev-enue.
Revenue under “Sundries” totalled Rp 7,281 million, or Rp 402 million more thanthe original estimate. As compared with the preceding year, revenue under this heading

88
rose by about Rp 490 million. This rise was primarily caused by the gratifying increase in“Miscellaneous” receipts, namely, by Rp 1,244 million. Receipts from T.P.I. and T.P.T.Ievies, and those connected with mining concessions, showed rather disappointing de-creases.
The Share of Profits received by the Government only amounted to 47% of thebudgetary estimate. L.A.A.P.L.N. (Foreign Exchange Institute) receipts improved mostgratifyingly since 1955. The unspecified “Miscellaneous” receipts totalling Rp 2,545 million(higher by Rp 1,244 million as compared with 1956) include P.B.E. (Export CertificatePayments) receipts to the amount of Rp 1,587 million, the countervalue of loans re-ceived from Eximbank to the amount of Rp 56 million, and transfers from I.C.A.countervalue accounts to the amount of Rp 97 million.
Public Debt
The public debt rose by Rp 5,953 million in the period under review. A survey ofpublic debt developments since 1952 (table 16) shows that the greatest increase oc-curred in 1957. To a large extent this was due to the Government floating debt, whichrose by Rp 6,247 million in 1957.
The development and component parts of the floating debt are outlined in table 17.
Bank Indonesia advances to the Government increased by Rp 8,415 million. Theamount of money (including subsidiary money) issued by or on behalf of the Govern-ment rose by Rp 87 million. The amount of treasury bills and notes issued increased by

89
Rp 579 million, of which Rp 78 million was taken up by the private sector and thebalance by banks (see cash Deficit of the Government) .
Debt to importers—un account of prepayments on imports—dropped by Rp 2,834million.
The external consolidated debt amounted to Rp 2,778 million, or Rp 201 millionless than at the end of the preceding year.
The internal consolidated debt lelf by Rp 93 million. This was due to the incre-ment of 3% Republic Indonesia 1950 loan by Rp 1 million, and the decrease of theGovernment consolidated debt to Bank Indonesia by Rp 94 million.
On the whole, Government consolidated debt fell by Rp 294 million comparedwith a decrease by Rp 2,180 million in l956.

90
The development in actual budgetary expenditure and revenue in the years 1954through 1957, classified by sectors, may be seen from Chart I.

91

92
V. BANKING AND CREDIT
Supervision of the Credit System
A number of 28 licenses for operating general banking businesses was granted inthe course of the year under report. This number includes permanent licenses issued toprivate general banks who lodged applications in the course of the previous year (4), aswell as private general banks who were granted temporary licenses in 1956 and whofulfilled the requirements of Government Ordinance No. I/l955, so that their tempo-rary licenses were converted into permanent licenses (11). So, actually, 13 new bankswith a permanent license were established, which is far less than the previous year.
The situation per the end of December 1957 as regards the number and regions ofoperations of private general banks and Government Banks are set out in the followingtabulation:
As demonstrated by the above figures, the majority of the new general banks wereestablished in Djakarta, and a far smaller number in Sulawesi --the number of privategeneral banks even diminished in certain districts. This must partly be ascribed to thefact that several banks were converted into “Desa” (village) banks’ which are exempted

93
from the rules laid down in Government Ordinance No. 1/1955 (this occurred in NusaTenggara). Other banks moved their Head Offices to other locations (as happened inCentral Djawa).
Our or the total of 104 private general banks, 60 operate under permanent li-censes, 36 under temporary licenses, while 8 have not yet qualified for a license to oper-ate a banking business.
As stated above 11 banks succeeded in fulfilling the requirements and acquiredpermanent licenses. However, a larger number failed to obtain their permanent licenses.Their principal difficulty was the question of capital; they were as yet unable to satisfythe requirement of Government Ordinance No. 1/19 55 on this point.
For this reason, the Monetary Board resolved in its meeting of February 2 3, 1958,to extend the life of temporary licenses by one year, anticipating that the banks whichactually filled a need in their sphere of activity would eventually be in a position tosatisfy the requirement of the Government Ordinance referred to.
Moreover, incidental checks at several private general banks operating under a per-manent license to carry on banking business revealed that the required statement onpayment in full of their paid-up capital (as stipulated in the articles of association ofsuch banks) did not tally with the actual position. Examination showed that capital hadnot yet been fully paid-up, in spite of the banks’ statements to the contrary. For thisreason Bank Indonesia stipulated early in October 1957 that the paid-up capital to theamount of Rp 2. 5 million which was made a requirement under Government Ordi-nance No. I/1955, had to be paid into Bank Indonesia, Djakarta, or one of its branches,by the bank making application, to prevent recurrence of this possibility and as a checkon unsound development of private general banks. Such deposits made with Bank In-donesia must be covered by a letter from the bank concerned that the amount depositedconstitutes its capital as paid up by shareholders under the requirements as laid down inGovernment Ordinance No. 1/1955. The amount so deposited is blocked till the datewhen the bank concerned receives a license and starts operations.
Such banks are permitted to deduct initial expenditure, for floating the enterprise,purchasing inventory, purchasing or building bank premises, provided the total of such

94
expenditure does not exceed Rp 500,000,- proofs have to be produced. So as to ease theconsequences of blocking their funds, the depositing general banks are permitted toinvest their funds in Treasury bills.
Furthermore such general banks are required to submit biographies of their Man-agements and Board of Directors; their registers of shareholders: the certificates ofIndonesian nationality of members of their boards and shareholders who are not au-tochthonous Indonesians; entry permits or certificates of residence of such individualsas do not have Indonesian nationality.
Since the above stipulations went into effect, many banks have withdrawn theirapplications for carrying on general banking business or have stopped operations alto-gether. Thus a start was made towards a sound development of banking. Furthermore,notice was given to banks which have been grantee permanent licenses on the strengthof incorrect statements, to put their house in order, since noncompliance with the regu-lations will make them liable to withdrawal of their licenses.
In the year under review the number of private savings banks was 18 — only onemore than in the previous year.
As set forth in the previous annual report, Bank Indonesia needs an efficient appa-ratus — in this case a body of experts—if it is to discharge effectively the supervisoryduties referred to in Government Ordinance No. 1/1955. About the middle of 1957Bank Indonesia established a Credit Supervisory Department (Bagian Pengawasan UrusanKredit) whose duty is to supervise and check the activities of all general banks andsavings banks — private as well as Government — under the stipulations of Govern-ment Ordinance No. 1/1955.
The first task which this Credit Supervisory Department set itself was to organizea training program for the supervisory personnel required, and it is expected that in thecourse of 1958 several bank officials will be ready to undertake active scrutiny work. Inthe year under report, actual checking in the field was still limited although direct exami-nation could be more effected than in the foregoing year.

95
A notable development towards the close of 1957 was that, as the outcome of theaction for the restoration of West Irian, all Dutch banks were placed under the controlof the Military Authority (Decree of the Army Chief of Staff in his capacity of MilitaryAuthority no. KPTS/PM/080/1957 dated December 8, 1957). This Decree was pro-mulgated under the regulations of the prevailing State of Emergency. Control of theactivities of Dutch banks was brought under the charge of a Central Supervisory Boardfor Banks (Badan Pengawas Bank2 Pusat), which Board was made up of FINEK (/S.H.P.M. Coordinator (Coordinator for Financial and Economic Affairs, and the Execu-tive of the Military Authority) as Chairman and Member; a representative of Bank In-donesia as Deputy Chairman and Member; representatives of the Ministry of Financeas members; several representatives of the Executive of the Military Authority as Mem-bers. Furthermore Regional Military Authorities set up Regional Supervisory Boards forBanks (Badan Pengawas Bank2 Daerah) composed along the same lines of the CentralBoard, in every region where a Dutch bank or a branch of a Dutch bank was in opera-tion. For purposes of direct control on Dutch banks, the Central Board, or RegionalBoards also had powers to station supervisory teams with such banks. By these mea-sures the run on Dutch banks which had started early in December l957 was checked.
As a further measure and with a view to carrying on activities vital to the economyof the country, a further Decree of the Military Authority made it obligatory for allDutch banks to extend credits granted in the fields of production, transportation, distri-bution, exports and imports, except imports of nonessential consumer goods (DecreeNo. KPTS/DM/089/1957 dated December 16, 1957). To secure the continuation ofthe financial relations between the Dutch enterprises brought under control and theDutch banks as before, the Army Chief of Staff in his capacity of Central MilitaryAuthority issued Decree of the Central Military Authority No Prt/Peperpu/05/1958dated March 5, 1958. Under this Decree, Dutch enterprises were permitted to continuedrawing on their deposits or credits with the Dutch banks or/and to deposit moneywith these banks.
Credit facilities granted by foreign exchange banks
Credit facilities in the year under report were primarily extended to the importsector and particularly concerned advances for the prepayments due on imports. Priorto June 20, 1957, the date on which the new export/import system, known as the B.E.

96
system, came into operation, Bank Indonesia extended prepayment credit facilities toforeign exchange banks, to national banks, and to Bank Indonesia’s own clients/import-ers, up to a specified percentage of the import value plus T.P.I. (Tambahan PembajaranImpor — Import Surcharges), or of the prepayment that had to be deposited with theForeign Exchange Fund after the issuance of the foreign exchange permit. Noteworthyof the credit policy of that period was the adjustment of the above percentage to theneed for imports.
After the introduction of the B.E. system, credit facilities in a new form wereextended for prepayments on imports for the benefit of national banks and importers,as follows:
a) for imports of general goods, 60% of the nominal value of the B.E. certificates thathad to be purchased;
b) for raw materials and auxiliary goods for industrial enterprises, 75% of the nominalvalue of the B.E. certificates.
As from January 14, 1958, banks were asked to withdraw credit facilities forpost-financing of all imports and for advanced financing of imports of consumer goods,while for auxiliary goods and raw materials advances were not to exceed 50%, of thenominal value of B.E.s to be purchased. The amounts of advances for capital goods areleft to the discretion of the banks concerned.
In its session of February 17, 1958, the Monetary Board decided that banks are notallowed to grant credits for advanced financing exceeding 25% of the B.E. value bought,for the import of raw and auxiliary materials.
In view of the above decision of the Monetary Board, credits granted by BankIndonesia for the advanced financing of the import of raw and auxiliary materials up to75% of the nominal B.E. value are incompatible with the decision of the MonetaryBoard. Thus credits for the import of raw and auxiliary materials for industrial purposesare to be cut down from 75% to 60% of the nominal B.E. value.
The combined balance sheet of Bank Indonesia and the other 13 foreign exchangebanks is set out in table 19. As the figures show, the sum total of capital, reserves, profit


98
and loss account of these 14 banks rose by Rp 447 million (30%) over 1957. The bal-ances of demand deposits and bills payable rose by Rp 801 million (19.9%), while timedeposits from the private sector fell by Rp 10 million (5.6%).
Prepayments by importers dropped from Rp 3,343 million at the end of l956 to Rp681 million at the end of 1957—a fall by Rp 2,662 million or 79.6%. In substance, thisdrop in importers’ prepayments meant that the volume of importers, prepayments intothe banks was smaller than the volume of prepayments refunded to importers in thecase of import applications being rejected or the imports effected.
The total of the amount of importers’ prepayments received by the Foreign Ex-change Fund from the foreign exchange banks is shown by the debit item “Advances tothe Government from Importers”. As table 19 further shows, the credit item “Prepay-ments by Importers” exceeded the debit item “Advances to the Government from Im-

99
porters”. The total of the prepayments made to the foreign exchange banks was higherin certain periods, than the total of prepayments received by the Foreign ExchangeFund. The balance of these two items amounted to Rp 166 million in the first, Rp 134million in the second, Rp 440 million in the third, and Rp 432 million in the fourthquarter of 1957. The average of these balances—which forms a source of money cre-ation for the foreign exchange banks—was higher than the average of the correspond-ing balances in 1956.
The credit facilities extended by banks in the course of l957 were marked by somefluctuations, as shown by the item “Advances and domestic bills discounted” on thedebit side of the combined balance sheet. This item stood at Rp 363 million less than atthe end of 1956. The specification of debtors of tile foreign exchange banks (exceptBank Rakjat Indonesia) in table 20 shows that this decrease of credits was due to smallercredit facilities to importers (less Rp 371 million), sugar estates (less Rp 100 million),and other estates (less Rp 111 million).
The drop in the amount of credits to importers resulted from a reduced volume ofimports. Even so, the share of importers in total credits was the largest (Rp 996 millionor 28.2%) when compared with the other groups, as was the case in the foregoing year

100
when the corresponding figure stood at Rp I .367 million or 35 %. Credits to exporters,on the other hand, rose by Rp 5 9 million and amounted to Rp 434 million or 12.3 % ofthe aggregate. The credits to Government enterprises and foundations, enterprisespredorminantly financed by the Government, and to industries in general also rose,namely by Rp 19 million, Rp 52 million and Rp 29 million respectively, and amounted toRp 426 million (12.1%), Rp 100 million (2.8%) and Rp 383 million (10.8%) at the end of1957.
Table 21 shows the specification of credits granted by 7 foreign and 6 nationalforeign-exchange banks to private enterprises and individuals. The figures show that atthe end of 1957, Rp 1,422.9 million or 40.2% of the overall amount of credits grantedby 13 foreign exchange banks (excl. Bank Rakjat Indonesia) originated from the 7 for-eign banks, against Rp 1.768,7 million or 51% in 1956. Of the above credit facilities, Rp553.7 million or 39% went to Indonesian enterprises and individuals, against Rp 643.9million or 36% per the end of 1956. This shows that the share received by Indonesianenterprises and individuals increased relatively. Out of the total credit facilities extendedby the 6 national banks, 90% went to Indonesian enterprises and individuals (at the endof 1956 : 88%).
A comparison of the total amounts of credits granted by the 7 foreign and 6national foreign-exchange banks to private enterprises and individuals shows the fol-lowing picture:
The credit facilities extended by the 6 Indonesian foreign exchange banks increasedsteadily, being nearly 100% higher per the end of 1957 when compared with ult. 1955.The 7 non-Indonesian foreign exchange banks in contrast showed a downward trend,

101
particularly in 1957. A proportional comparison of the credits granted by the two cat-egories of foreign exchange banks shows that the percentage for the 7 non-Indonesianforeign exchange banks dropped from 59.2% per the end of l955 to 51% per ult. 1956,

102
and declined even further to 40.3% per the end of 1957. In contrast, the percentage ofthe 6 national foreign-exchange banks steadily rose from 40.8% per the end of 1955 to59.7% per ult. l957.
The liquidity position of the 13 foreign exchange banks (excluding Bank Indone-sia) as set out in table 22, compares cash assets (cash plus balances of the foreign ex-change banks with Bank Indonesia) and demand liabilities (current accounts plus otherdebts on demand). As the figures show, the liquidity of the foreign exchange banks—onthe whole—steadily rose from the beginning of the year under report to drop again atthe end of 1957. The decline at the end of December l957 was chiefly caused by internalpolitical developments which led a great many customers to withdraw their balancesfrom the Dutch owned banks. Noteworthy nevertheless is that the overall liquidity ofthe foreign, exchange banks was greater in 1957 than in the preceding year
Table 23 gives a further specification of the current account balances of variouseconomic groups. The totals of these current accounts increased continuously from thebeginning to the end of 1957.
State Banks
Bank Negara Indonesia
The paid-up capital of the bank (Rp 100,000,000,-) underwent no changes in thecourse of 1957. The money supplied by the Government amounted to Rp 440 million,that is, Rp 255 million in time deposits and the remainder in ordinary loans. The currentaccount balances of the bank totalled Rp 665 million per the end of 1957, against Rp394 million per ult. l956 The Government share in this total was 39.6%, that of theAutonomous resorts 2.3% and that of Government enterprises and foundations in-clude enterprises predominantly financed by the Government 8.2%, while the share ofsundry items was 49.9%. Guarantee deposits showed an increase by Rp 52 million, thustotalling Rp 85 million. As regards credits granted by the bank, only Government enter-prises and foundations accounted for considerable movements, namely a rise by Rp 41million.

103
The bank has 16 branch offices in various locations in Indonesia as well as a branchin Singapore.
Bank Industri Negara
The figures of the balance sheets of the bank, rising from Rp 1,465 million per theend of l956 to Rp 1,735 million at the end of 1957 demonstrate increasing activity in thecourse of 1957. Paid-up capital and reserves rose by Rp 133.6 million per the end ofDecember 1957, to Rp 617.6 million. Current account balances totalled Rp 483.9 mil-lion, against Rp 340.2 million at the end of the preceding year. An amount of Rp 21.3million out of this total was for account of the Government, Rp 437.5 million foraccount of enterprises predominantly financed by the Government, and Rp 25.1 millionfor account of other enterprises.
The amount granted in credits rose from Rp 1,060.7 million to Rp 1,288 millionper the end of 1957. In comparison with the foregoing year credits granted to Govern-ment enterprises and foundations dropped by 37%, while those granted to enterprisespredominantly financed by the Government and other enterprises rose by 56% and15% respectively. In the total of credits to other enterprises, industrial enterprises andsugar estates took the largest share, namely 63.5% and 12.1% respectively.

104
Finally it is deserving of mention that participations in enterprises aggregated Rp219 million, or a rise by Rp 57 million.
Bank Rakjat lndonesia
Up to the present Bank Rakjat Indonesia operates 112 branches all over the coun-try. In comparison with the end of the previous year current account balances withBank Rakjat Indonesia rose by Rp 445 million per the end of 1957, thus standing at Rp1,202 million. It is of interest to note that this item includes the headings: Government,Autonomous resorts, Government enterprises and foundations, enterprises predomi-nantly financed by the Government, and sundries. The rise in the total was largely caused
by increased balances of the headings Sundries, and Government. Loan capital and timedeposits aggregated Rp 399 million, against Rp 457 million per the end of 1956.
Table 24 shows that credits increased by Rp 107 million in 1957, which is lowerthan the corresponding rise in l956 (Rp 171 million). As to the distribution of credits, itis interesting to note that agricultural credits steadily dropped, while credits under theheading middle-class and current account loans showed a rise. Relatively, the total ofcredits granted to the middle- class did not change though when taken on its own it washigher.

105
The number of desa (village) banks has steadily decreased since 1956. Credits out-standing, however, showed an upward trend (see table 25). Credit issued during 1957totalled Rp 232.6 million, while redemptions stood at Rp 231.9 million. On an average,the village banks granted loans to a total of Rp 50,000.— each in the course of 1957.
National Private Banks
The figures listed in table 26 were compiled from the quarterly balance sheets of49 banks (national private banks which have become foreign exchange banks not in-cluded) which submitted returns regularly. The other banks were not yet in a position,due to technical accounting difficulties, to send in regular returns.

106
As known, the Government has been giving substantial credits to national privatebanks since 1956, in the form of advances, and liquidity credits. The advances should beunderstood to mean credits granted by the Government to reinforce the financial posi-tion of such banks. Liquidity credits are such credits as given by the Government tocertain enterprises through national private banks. In 1957, advances and liquidity cred-its aggregated Rp 40 million and Rp 77 million respectively. Since September l957 nofurther liquidity credits have been granted, this in connection with the financial positionof State finance, and as laid down in the announcement of the Ministry of Finance ofSeptember 22, 1957 concerning Credits under Government Guarantee.
Apart from the above credits supplied by the Government, Bank Indonesia also grantedcredits to national private banks for the benefit of certain enterprises. All such credits re-quired collateral security of stocks and shares, promissory notes, bills, and export goods.
Table 26 sets out the combined balance sheet of all the national private banks thatsent regular returns to Bank Indonesia, as well as the combined balance sheet of the 20largest banks among them. Obviously, the composition of these 20 banks was not thesame in 1957 as it was in l956.
As the table shows, the combined figures for the 20 largest banks do not differgreatly from the total figures of all the banks that sent in regular returns. This would

107
seem to justify the conclusion that the potential of the banks outside the 20 largestis not significant. An overall survey of all these national banks and a comparisonof their position at the end of December 1956 and l957 shows that the items Bal-ances with Banks, Debtors and Domestic bills, on the debit side rose by Rp 82.1million and Rp 291.8 million respectively. Treasury bills totalled Rp 3.99 million perthe end of 1957, against Rp 0.37 million per ult. 1956. The items: Capital andcurrent account balances (Demand deposit) and bills payable, on the credit sidealso increased by Rp 41.2 million and Rp 212.3 million respectively. The rise in theitem Capital was caused by the increase in the payments of additional paid-up capi-tal of national private banks per the end of December 1957. It may further bementioned that the number of banks included in the combined balance sheet ofnational private banks rose by 7 per the end of 1957, resulting in a total number of49.
Out of the grand total of credits granted by national private banks per the end of1957, 48% went to the trade sector and 30% to the industrial sector—comparing with69% and 21% at the end of 1956. This would indicate a setback in the trade sector andan improvement in the industrial sector.

108
Table 28 specifies the current account balances of national private banks.
In comparison with the previous year, the trade sector shows a considerable in-crease per the end of 1957, rising as it did by Rp 66 million or 73%.
Pawnshop service
The number of pawnshops in Indonesia rose by 8 in 1957. A survey of develop-ments since the end of 1951 shows that on an average the number of pawnshops in-creased by 10 annually.
In comparison with the foregoing year, the number of pawns dropped by 11,000while the amount of loans rose by Rp 76 million. The number of pawns redeemed wasthe same as per the end of 1956, though repayments rose to Rp 2,081 million. Loansoutstanding decreased from Rp 752 million per end 1956 to Rp 711 million per end1957. The average period of “A” pawns (valued from Rp 0.50 to Rp 25.—) was 95 days- the same as in 1956

109
Savings Banks
The number of branches of the Post Office Savings Bank was 853 per the end of1957, against 808 per ult. 1956. The number of savings books in circulation per end
December 1957 was 1,273,503, while the average total per book worked out to Rp 232.23.The number of savings books over 1956 amounted to 796,279, and the average balanceper book to Rp 282.61. This shows an increase in the number of books but a decreasein the average amount of savings.
Overall savings with the Post Office Savings Bank and the 6 largest private savingsbanks showed an increase by Rp 79 million in 1957.
Jajasan Lembaga Djaminan Kredit (L.D.K.)
The reorganization of “Jajasan Kredit” (Credit Foundation) got underway in theyear under report. The lines of reorganization were laid down in the Decree of theMinister of Economic Affairs No. 2110/M of February 28, 1956 (see previous report).The name of “Jajasan Pemusatan Djaminan Kredit Rakjat” (the then official name ofthe “Jajasan Kredit”) was changed into “Jajasan Lembaga Djaminan Kredit”. abbrevi-ated L.D.K. (Foundation Credit Guarantee Institute). At the same time the characterand position of L.D.K. was made more explicit, namely, a credit guarantee board for


111
risks and/or liquidity in cases of applications for credits which bankers are not in aposition to accommodate. The rules for the setup and working-system of L.D.K. weregiven their final shape in July l957 and implementation in the districts got underway inAugust 1957.
In line with the simplification aimed at, the organization of L.D.K. branch man-agements underwent considerable change. Unlike the former Regional “Jajasan Kredit”,branches are managed by a Board of but three members, presided by the Governor/Regional Head of a Province or a person nominated by him. The two members aremanagers of branches of Bank Indonesia or persons nominated by them, while thethird member is an official in the Ministry of Agriculture, Industry, or Trade, nominatedby the Governor,’ Regional Head of the Province concerned. The inclusion of a bankerin the Regional Managing Board as part of the implementation of the reorganizationscheme was meant to ensure that credit granted under L.D.K. guarantee would be justi-fied from a business and banking view.
Doing away with the former Regional Supervisory Boards further had the advantagethat L.D.K. branches would be under the direct control and supervision of the CentralManaging Board, the latter board in its turn owing responsibility to a Supervisory Board.
A further aim of the reorganization was greater efficiency and speedier procedurein dealing with credit applications. Applications not exceeding Rp 100,000,- are generallyleft to the decision of the Branch Managements, the explanations submitted by the bankconcerned mostly supplying sufficient data for a decision. This implies that, to someextent, the burden of investigation of credit application was shifted from the “Govern-ment Services” to the bank forwarding the application. The Central Managing Boarddecides applications exceeding Rp 100,000.— being largely guided in its decisions by therecommendations of the Services concerned.
The ceiling of credits given by Bank Indonesia to L.D.K., under GovernmentGuarantee, remained fixed at Rp 93,000,000.— in the year under review.
Table 31 sets forth the development of credit granted under L.D.K. guarantee inthe year under review.

112
Credit applications decreased in number by 35% in comparison with 1956. In thefirst place this must be ascribed to cooperative societies being moved out of the sphereof activity of L.D.K. This was done to prevent duplication, since the Cooperative Ser-vice had also been allotted funds for promoting cooperatives.
Though the number of applications under L.D.K. decreased over 1957, the aver-age amount of credit applied for rose from Rp 203,000.— in 1956 to Rp 286,000.— in1957. This rise, explained by the steadily mounting level of prices, was also largely due tothe increasing number of applications for financing agricultural estates.
The number of applications rejected in 1957 was 50% less than in 1956, which ispartly explained by the smaller number of applications received. In all, 209 applicationswere turned down in 1957, the ratio of applications received to applications rejectedbeing 2: 1, in comparison with 1956 when this ratio was 5: 4. Looked at from this angle,it would appear that the preliminary screening and preparation of applications was up toa higher standard in the year under review.
The smaller number of applications received also partly explains the smaller numberof credits granted in the course of 1957. The average amount of credit granted rose byabout 100%, namely, from Rp 64,000.— in 1956 to Rp 134,000.— in 1957. Enterprises inthe sphere of the Ministry of Industry in particular showed a rise in the average amount ofcredit granted, namely from Rp 64,000.— to Rp 143,000.—, a rise by approximately 150%.
The year under review did not show any favourable development yet in repaymentson credit, as table 31 shows. Expressed in percent, the increase in arrears would seemgratifyingly low (3%), which is lower than in the preceding year. However, the actualoverall increase of arrears (by Rp 15 million), does not speak well for the awareness ofdebtors of the obligation they have undertaken to discharge debts promptly, nor doesthis justify as yet the expectation implied in the principles basic to a sound credit system,which underlie the reorganization of L.D.K.
Stock Exchange—B.E. Exchange
ln the year under review a beginning was made in employing the services of theStock Exchange for obtaining long-term capital. Bank Industri Negara issued two of

113
the four lines—of Rp 25 million each—of 5 1/2% debenture loans redeemable in 1972.This loan was open for public subscription, unlike earlier Bank Industri Negara loanswhich were exclusively open to holders of Rupiah Accounts of Non-Residents in Indo-nesia (abbreviated RURNI Accounts). The lines issued were for the most part sub-scribed by insurance companies, savings banks and other institutional investors.
Since the import Levy on Securities (Tambahan Pembajaran Impor Efek — T.P.I.Efek — 33 1/3% of the Rupiah value), came into effect in February 1955 the totalrevenue from T.P.l. Efek up to the end of 1957 was Rp 52 million, so that from February1955 to April 1958 securities were imported to an actual value of Rp 156 million. Im-ports were largely made up of repatriating 3% B.I.N. bonds exported by holders ofRURNI accounts, under a general permit of the Foreign Exchange Institute, to liquidatetheir Rupiah balances in this country.

114
Table 32 illustrates dealings in securities and the price development of some of theprincipal items on Djakarta Stock Exchange. Overall dealings in Rupiah securities (ex-cluding Government loans or loans under Government guarantee) amounted to Rp 8 7million in 1957 against Rp 7.9 million in the foregoing year. The prices of Governmentloans and loans under Government guarantee achieved new heights reflecting the briskdemand for high class securities at fixed interest rates as well as their short supply. Thislively demand, so it may be assumed, originated with institutional investors with exces-sive liquid means on their hands due to the unexpected redemption of private loans.The yield of 5 to 6% of this class of security seemed to be a big attraction for investors,and prices increased accordingly.
Outside the Stock Exchange, bonds were still sold offering rates of interest as highas 12 to 18%, sometimes even with the added attraction of a share of the profits on topof the fixed interest.
Prices of shares, in general, moved on a lower level than in the foregoing year—insome cases they plummeted down to abnormal depths. This was primarily due to theexodus of Netherlands nationals who bodily unloaded their holdings of securities, to-gether with the gloomy outlook for future dividends from enterprises in Indonesia. Therestrictions imposed by the Military Authority and the Foreign Exchange Institute ondealings in securities may also have contributed to this landslide.
After the implementation of the B.E. Regulations (see Chapter VI Foreign ex-change system and measures, and Appendix K) prices of Export Certificates (B.E.)mounted steadily, and U.S. securities were in strong demand apparently with a view topreserving the buying power of the money so invested. The short supply of U.S. secu-rities caused their prices to rise even though the threatening recession in the U.S. made adistribution of dividends on the preceding year’s levels illusory.
The price of B.E.s depends on supply and demand. Transactions in B.E.s are handledexclusively by the foreign exchange banks and for such dealings an exchange market wascreated in Djakarta under the name of “B.E. Call”. Direct dealings outside the marketare not allowed. Prices at this B.E. Call are quoted in percent of the nominal exchangevalue of the Rupiah. Once a price has been quoted on that Call-day no more transac-

115
tions will be concluded (there is no later call). Members of the B.E. Exchange informthe Call Leader, nominated by themselves, of all their buying and selling orders —values of B.E.s and the corresponding quotations —. Going by the list compiled forthat day, the Call Leader announces the price at which the largest turnover of certificatescan be achieved. Under the present B.E. market rules, members are not permitted to askor bid & price differing more than 5 points from the price fixed the preceding day. Theprice finally arrived at is the current B.E. price for that day. As It turned out, the demandfor B.E.s has always greatly surpassed the supply. Holders of B.E.s were consequently ina strong bargaining position and usually asked the highest price possible. Prospectivebuyers (importers) have continually been in a weak position and bid “best possible”, thatis, the highest price permitted, if they wish to obtain the desired B.E.s, and the B.E. pricesteadily mounted. To check this upward course, the validity period of B.E.s, which hadbeen 2 months, was reduced to 6 weeks as from October 4, 1957. This implies thatholders of B.E.s (exporters) have to sell within 28 days after the date of issue of theB.E., seeing that on the date of sale the certificates muse still have a currency of 2 weeks,unless explicitly otherwise agreed between buyer and seller. Finally, it was made a rulethat the B.E. price of the day must not rise more than 2 points (February 10, 1958),which was eventually reduced to I point (March 27, 1958). At that time the B.E. pricehad reached a height of 320%, to which 1 point a day has been added since, until finallythe Government checked the rise of the B.E. price on April 19, 1958. Since then theB.E. price has been fixed at 332% , namely its price on April 18, 1958.

116
VI. FOREIGN TRANSACTIONS AND ARRANGEMENTS
Introductory
The introduction of the Export Certificate System (Bukti Ekpor/B.E. system) onJune 20, 1957, which will be discussed at greater length below (see also—Foreign Ex-change System and Measures, and appendix “K”) drew a sharp line between the foreignpayments position in the first and second half of 1957.
As table 33 shows, the shrinkage of foreign exchange holdings (by Rp 1,112 mil-lion in 1956) continued practically unabated in the first half of 1957, which showed afurther drop by Rp 599 million. Thanks to the B.E. system, the position took a turn forthe better in the second half of 1957, showing a surplus balance of Rp 263 million,which left a reasonable overall deficit for l957 (Rp 336 million).

117
The 1956 and 1957 balances of payments show (see table 34) the impact of theB.E. system on expenditure, especially in the import sector. Outlays in the second halfof 1957 were considerably smaller than in the first half of 1957, and in the two halvesof 1956. In the other expenditure sectors—the services and capital sectors—the impactwas far less noticeable.
Seeing that the issue of foreign exchange permits for imports or other expenditurewas not systematically restricted in the 2nd half of 1957 as compared with 1956, themeasure of the impact of the B.E. system on the various expenditure sectors must beput down to differing elasticity of demand for the various kinds of expenditure. Thiswas further demonstrated by the continuing rise of the B.E. price—while an averageprice of 220% was quoted in June 1957, the price was as high as 250% by the end ofDecember.
The elasticity of demand for import goods proved to be greater than the demandfor foreign exchange in the other sectors. Despite the stimulating effect of the greatervelocity of domestic monetary circulation on the import trade, advancing prices ofgoods due to the steadily mounting B.E. price tended to reduce popular demand forcertain lines, which caused imports of such lines to taper off correspondingly. Demandin the other sectors of foreign exchange expenditure proved to be far less elastic, whichis understandable inasmuch as they largely concerned payments of interest and redemp-tions on foreign loans, fulfillment of other obligations, outlays for diplomatic postsabroad and the like, so that increased Rupiah costs did not result in a reduction of thoseexpenditures.
The impact of the B.E. system on the revenue side of the balance of payments—practically entirely made up of proceeds from export products—is difficult to assess byitself. The fact that export proceeds (excluding petroleum export to which the B.E.system does not yet apply owing to special agreements with the respective oil compa-nies) were lower in the second half of 1957 than in the first, while overall exports in1957 were lower than in the foregoing year (1st half 1957—Rp 3,497 million; 2nd half1957 -—Rp 3,381 million; whole 1956—Rp 7,381 million) would not warrant the con-clusion that the B.E. system fell short of the expectation that it would increase thevolume of exports. Several developments which had made themselves felt in this fieldfor some months prior to the introduction of the B.E. system were not absorbed by the

118
system. The tension between the Central Government and the Regions, arising at theend of 1956 and referred to in the previous report, grew in intensity in 1957. Deteriorat-ing relations between the Central Government and the Regions concerned, preventedthe B.E. system from functioning properly in such Regions and sometimes paralyzedthe system altogether. Moreover, barter trade with foreign countries, carried on illegallyby the above Regions under Local provisions deviating from the official regulations.grew rampant.
However, as set forth in the chapter “General Review” of this annual report:,although the Regions did not cooperate in this new system and held the greater part oftheir foreign exchange earnings for themselves, exports were made possible again andeven to such an extent that foreign exchange reserves increased from Rp 967 million inJune to Rp 1,432 million in September. Owing to the new foreign exchange systemexchange reserves kept increasing till October to show a declining trend again after thatmonth.
In drawing the broad conclusion that, in terms of the balance of payments, theB.E. system proved to be successful last year, it should also be realized that absolutedependence of economic policy — in its widest sense —on a perfect balance betweenrevenue and expenditure (the principle underlying the system) can only be justified ifequilibrium is achieved on the lowest level that still enables the minimum requirementsof the State to be filled. Such minimum requirements include the need for essentialconsumer goods, raw materials, semi- manufactures or capital goods necessary to keepthe existing machinery of production running. In the services sector, besides the outlaysmentioned above which are hardly or not at all elastic, private enterprise also has certainrequirements which need to be filled if proper functioning of domestic economic ma-chinery is not to be jeopardized.
If reduced revenue would make it impossible to maintain the aforementioned mini-mum level, adherence to the principle of balanced revenue and expenditure would betantamount to assuming the risk of declining domestic production and consumption,and aggravating inflationary pressures which might involve far- reaching consequences.Here again the regional issue comes to the fore. If this issue cannot be brought tosolution in the shortest possible time, export proceeds are sure to fall far below l957

119
level. If bartering continues on the same level as in l957, it is to be foreseen that nationalrevenue from exports will very likely be reduced to or less than the minimum levelreferred to above.
Furthermore, general improvement of economic and monetary conditions cannotbe realized solely by easing the pressure on the balance of payments. As repeatedlyunderlined in preceding annual reports, a reduction of the volume of money in circula-tion is a prerequisite for attaining general improvement. As discussed elsewhere in thisreport, the volume or money expanded in an alarming degree. Seeing that this increasein the volume of money was primarily caused by deficits on the Government budget,the deterioration of relations between the Central Government and the regions consti-tuted, in this connection, a serious obstacle towards a reduction of the volume of moneythrough retrenchment in Government finance.
As anticipated, the year 1957 was a gloomy and crucial year in the economic and mon-etary affairs of the nation. Even if the B.E. system could prevent further unfavorable devel-opment of the balance of payments, the deterioration of relations between the CentralGovernment and several Regions hampered, to a more serious extent, the improvement ofinternal monetary conditions. Internal inflationary pressures were felt more strongly in 1957than in the foregoing years. However, since the supply of goods was, for the time being,sufficient to meet the demand—due to the expansion of imports in the previous year—thispressure did not yet tend to cause large-scale speculation. Moreover, stricter control on thepart of the Government of speculation and hoarding—through the exercise of authorityunder the State of Emergency Act—still ensured regular distribution, within certain limits,of the regular requirements of society and industry.
However, it is self-evident that this cannot go on indefinitely. If the supply ofgoods is no longer capable of meeting demand, the increased buying power of societywill multiply inflationary pressure. In such a situation, it would seem unlikely thatlarge-scale speculation or economic panic can be prevented. no matter how strict Gov-ernment control may be.
It is obvious that settlement of the regional issue in the shortest possible time is thefirst requisite for arriving at a solution of the present economic and monetary difficulties.

120
Balance of Payments
Table 34 sets forth Indonesia’s balances of payments for 1956 and 1957 and givesa complete picture of foreign exchange payments and receipts between Indonesia andforeign countries in the past two years.
So as to show explicitly movements in debts payable by, and debts receivable fromforeign countries, the items debts payable and debts receivable have been entered sepa-rately in the capital sector of the balance of payments. This procedure is more in linewith common practice, though it departs from our practice heretofore. The capital bal-ance in this report is therefore more extensive as compared with previous annual re-ports, where the items debts payable and receivable are combined in the item “Capital”.
Quite different from the previous year, when the extraordinary increase in importexpenditure caused the surplus in the balance of trade to become too marginal to coverthe structural deficit in the balance of services, the balance of payments over the year1957 shows a more normal equilibrium of the component balance sheets when viewedfrom the structural angle of national economy. The structural deficit in the servicesbalance sheet can be covered for a substantial part—sometimes even completely, whenexternal factors such as world market price developments were favourable—out of thesurplus on the balance of goods.
Developments in the component balance sheets for 1956 and l957, compared be-low, show that the surplus on the 1956 balance of goods covered the deficit on theservice balance for about 12 % only, while the negative services balance for 1957 couldbe covered for 60% out of the surplus on the balance of goods.
Developments in component balance sheets for 1956 and l957 (in million. rupiah)are as follows:
l956 1957Balance of goods + 266 + 1,385Balance of Services (incl. donations) — 2,040 — 2,243Balance of Capital (incl. items nottaken into account) + 662 + 522Total Balance of Payments — 1,112 — 336

121
The surplus in the balance of goods in 1957 to the amount of Rp 1,385 millionwas attained in the second half of 1957 and was solely caused by reduced imports. Inthat period import expenditure only amounted to Rp 3,569 million, or Rp 1,089 millionless than in the first half year (Rp 4,656 million). As stated above, the drop in imports inthe second half year was primarily caused by the operation of the B.E. system.
A comparison of the overall figures for 1956 and l957 shows that import: droppedby Rp 1,117 million in 1957. If imports by oil companies are not taken into account (soas to examine the effect of the B.E. system, since this system does not yet apply to theoil companies), imports in 1957 dropped by Rp 1,339 million as compared with theforegoing year (total 1956 imports— Rp 8,576 million; total 1957 imports—Rp 7,237million). A further examination shows that substantial drops were recorded in importsof rice, other foodstuffs and textiles—the very commodities which showed markedlyincreased imports in 1956 (see 1956/1957 Annual Report page 106). The outlays forthose commodities in 1956 and l957 were as follows (in millions rupiah):
From the figures mentioned the conclusion may be drawn that, where the aboveconsumer goods were in such liberal supply as to exceed domestic demand in 1956 andin the beginning of 1957, advanced prices in the 2nd half of 1957 (as the result ofincreased B.E. prices) forced down imports to a level more in keeping with actual do-mestic demand. On the other hand, imports of several kinds of capital goods showed asignificant rise in 1957; they were evidently intended for Government developmentprojects and for private enterprises. Imports of metal goods, for instance, mounted toRp 1,166 million in 1957 against Rp 811 million in 1956. During the 2nd half of 1957 —when the B.E. regime was in operation, imports in this sector also dropped as comparedwith the Ist half of 1957 from Rp 735 million to Rp 431 million.

122
Excluding petroleum, export proceeds for the 2nd half of 1957 amounted to Rp3,381 million, or Rp 116 million less than in the 1st half of 1957 when exports totalledRp 3,497 million. Leaving out petroleum, overall exports for 957 stood at Rp 503 mil-lion less than in 1956 (Rp 7,381 million).
Tin exports dropped by about 117 million, due to slackness on the world market ascompared with 1956. The decline in proceeds from exports of the other products—espe-cially rubber and copra—was, for all practical purposes, primarily attributable to the bartertrade conducted by the dissident Regions, which undid any boosting effect of the B.E.system on exports. As the result of barter trade, export proceeds from rubber declined byRp 186 million, from copra and copra cakes by Rp 110 million. Particularly in the case ofcopra the impact of barter was striking. While proceeds still stood at Rp 188 million in the1st half of 1957, exports dwindled to Rp 39 million in the 2nd half of 1957.
Increasing expenditure on the balance of services—showing a deficit of Rp 2,250million in 1957, against Rp 2,057 million in 1956—must be attributed to increased ex-penditure of oil companies. Profit transfers by these companies rose by Rp 141 million,while outgoings under the item “Miscellaneous” (item 8.2) showed a deficit of Rp 146million in 1957, which means a rise by about Rp 110 million as compared with theprevious year. This increase had a bearing on higher costs of exploration and soil exami-nation undertaken by the oil companies in the course of 1957 in connection with newinvestments.
If expenditure by the oil companies is excluded, payments for services showed aslight decrease in 1957 as compared with 1956 (1957—Rp 1,101 million; 1956 — Rp1,193 million). This decrease is explained by the items profit transfers, outlays for for-eign workers, and insurance being lower. Profit transfers for foreign enterprises, exceptoil companies dropped by about Rp 60 million as compared with 1956, after retrench-ment to the tune of Rp 144 million in 1956 (see Annual Report 1956/ 1957 page 107) .
Retrenchment in the item outlays for foreign workers — about Rp 60 million lessin 1957 than in 1956—was mainly found by revaluation of superannuation allowances—on the basis of the official rate of exchange after the devaluation of the Rupiah in1952—for officials employed by the Government before the transfer of sovereignty.

123
The item Insurance was reduced by Rp 30 million in 1957 as compared with 1956,because transfers of insurance premiums for motor insurance were withdrawn as fromMarch 1957, while marine insurance had to be written in Rupiahs as from October 1957,with the additional obligation that underwriters had to reinsure 60% of the cover writ-ten with a national reinsurance company.
Although expenditure on the above three items was cut back successfully, outgo-ings for the item Government (item 7) increased. The deficit of Rp 125 million in 1956rose to Rp 201 million in 1957 or by about 60%.
As explained above, the capital balance was drawn up in a manner differing fromforegoing Annual Reports. The items Debts payable and Debts receivable are no longercombined into one item (the item Capital), but are now entered separately. Furthermore, thesystem of accounting for purchases in 1956 and 1957 under the S.A.C. Agreement wasrevised in the balances of payments for both 1956 and 1957. Whereas 20% of the receiptsunder S.A.C. used to be entered as short-term liabilities and the balance as longterm liabili-ties (see Annual Report 1956/ 1957 page 110 and 111), all transactions under S.A.C. are nowentered as short-term liabilities, in compliance with a suggestion of I.M.F.
The data concerning “B” and “C” credits were supplemented in 1957 and therelative figures entered in the 1956 balance sheet were revised.
Inflow of capital took place in 1957 in the form of investments by oil companies(Rp 502 million against Rp 466 million in 1956), loans from Eximbank (Rp 42 millionagainst Rp 94 million in 1956), and receipt from “B” and “C” credits (Rp 21 million andRp 181 million respectively against Rp 30 million and Rp 63 million respectively in1956). The above three kinds of loans are classified under long-term liabilities (item 15),though “B” and “C” credit might be called medium-term loans. Further, receipts underS.A.C. (item 16.2) amounted to Rp 120 million in 1957 against Rp 420 million in 1956.
Investments by foreign enterprises other than oil companies caused a minor move-ment in item 11.2 (other long-term debts).


126
Outflow of capital consisted of depreciation of oil companies (item 11.1 debitside) and Government repayments of foreign loans (item 15). Depreciation of oil com-panies totalled Rp 435 million, which was practically the same as the 1956 amount (Rp440 million). Other depreciations were made only by K.P.M., which is shown in item11.2. Repayments by the Government concerned loans from American Surplus Credits(Rp 24 million), Eximbank (Rp 55 million), I.C.A. (Rp 10 million), Australian SettlementRp 29 million), “B” credits (Rp 9 million) and “C” credits (Rp 102 million).
An instalment of the Netherlands loan under the name of ‘Nederland 1950" wasmade in the 1st half of 1957 (Rp 42 million). The instalment due per end 1957 waspostponed due to a moratorium having been made by the Government on transfers tothe Netherlands in December 1957.
Further, Rp 23 million of item 15 is a payment of compensation to the national-ized electricity supply companies. Item 15 also includes Rp 8 million in repayment of aBank Industri Negara debenture loan.
A movement of fairly large proportions took place in Debts Receivable (item 17)because of Subscription payments by the Government to the International FinanceCorporation and for funds under the tin buffer stock agreement.
Table 35 shows payment transactions between Indonesia and certain monetaryareas, classified in goods, services and capital, with the exclusion of oil company trans-actions.
The net result (in Rp millions) of payment transactions between Indonesia and thevarious monetary areas can be summarized as follows:
1956 1957U.S. and Canada + 618 + 645E.P.U. countries (exclusive the United Kingdom). — 1.187 + 909Sterling area — 758 — 34Other countries. — 726 — 713
— 2.053 — 1.011

127
The overall payment position with the U.S. and Canada in 1957 differed only slightlyfrom 1956. The surplus was small both in 1956 (Rp 287 million) and in 1957 (Rp 274million). The volume of trade also diminished—exports dropped by 17%, while im-ports fell by 20% as compared with l956. The capital sector did not show material move-ments. While the total amount received under S.A.C. rose by Rp 100 million, receiptsfrom Eximbank dropped by Rp 52 million.
The deficit in Indonesia’s payments traffic with E.P.U. countries and the Sterlingarea was reduced substantially, primarily due to reduced imports from those areas duringthe 2nd half of 1957. A marked decline took place in relation to the Sterling area, im-ports falling off by Rp 800 million or about 30% of the 1956 total, mainly due toreduced imports of textiles.
While imports from E.P.U. countries were smaller, the capital sector showed higherreceipts in 1957 compared with 1956, due to increases in “C” credits, particularly fromthe Federal Republic of Germany, Italy and France.
Balance of Trade
The balance of trade showed a substantial surplus in 1957 as compared with theforegoing year. According to data from the Central Bureau of Statistics—computed ona transaction basis, while data for the balance of payments are calculated on a cashbasis—exports totalled Rp 11,0 5 2 million, while imports came to Rp 9,086 million,thus leaving a surplus of Rp 1,966 million (see table 36). Exports greater by Rp 1 billion(10%) and imports less by Rp 670 million (7%), accounted for this surplus. However, ifthe oil companies are excluded, exports and imports show a fall by Rp 120 million andRp 1,494 million respectively. Exports of oil and oil products rose from Rp 2,560 mil-lion in 1956 to Rp 3,677 million in 1957, an increase of 44%.
Expressed in percent of the total value of imports, export proceeds rose by 19% inthe year under review, namely, from 103% in 1956 to 122% in 1957.
Development and composition of exports and imports are reviewed below.

128
Exports
Compared with the previous year, exports rose both in volume and in proceeds.Volume increased by 4,960,000 tons, proceeds by Rp 997 million. However, if exportsof oil and oil products are excluded, volume dropped from 2,508,000 tons to 2,379,000tons, while proceeds fell from Rp 7,495 million to Rp 7,375 million.
As table 37 shows, drops were registered in the following export products: estaterubber (—Rp 49 million); tin (—Rp 107 million); copra and copra cakes (— Rp 27million); coffee (— Rp 9 million); forest products (— Rp 4 million); hard rope fibres (—Rp 24 million); shells (—Rp 3 million); sago and sago products (—Rp 2 million).
In terms of volume (see table 38), exports of estate rubber, copra and copra cakeswere higher in 1957 than in the preceding year. On the whole, the volume of the princi-pal export products was up as compared with 1956. Due to unfavourable price develop-ments in the world markets, proceeds were lower than the year before.

129
A comparison of the figures for exports (excluding oil and oil products) as com-piled by the Central Bureau of Statistics and the Balance of Payments Bureau, showsthat the difference between these two compilations was far greater in 1957 (Rp 497million) than in 1956 (Rp 114 million). This is mainly due to barter transactions notbeing included in the figures of the Balance of Payments Bureau. When leaving thecountry barter shipments are cleared and recorded by the Customs at the ports of exitand returns made to the Central Bureau of Statistics, but as such transaction are nothandled by a foreign exchange bank they do not show in the bank returns.

130
Notable rises in export volume recorded for estate rubber (l1.5%), oil and oil prod-ucts (48%, from l0.5 million tons to 15.6 million tons), tea (17.6%), tobacco (36%),tapioca (152.9%), groundnuts and groundnut oil (150%), rattan (10%), cattle (150%),coal (241.7%, from 12,000 tons in 1956 to 41,000 tons in 1957).
In order of value, rubber and oil and oil products occupied first and second placeand a shift is to be noted in comparison with the foregoing year. In 1956 rubber ac-counted for 40% of total exports and in 1957 only 36%. Oil and oil products rose from25% in 1956 to 33.3% in 1957 (see chart II).
According to destinations, 44% of the total export value found its way to Asiancountries in l957, exports to Europe, the U.S., Australasia and Africa accounting for33%, l5.8%, 5%, and 0.6% respectively, (see table 39). Exports to Australasia rose by28% (from Rp 432 million to Rp 553 million in l957), to Asian countries by 25%. Strik-ing is the rising export value to Hongkong—from Rp 38 million in 1956 to Rp l956million in 1957 or by 413 %. Exports to China and the Philippines also rose substantially— by ll5% and 58% respectively. Exports to Japan dropped by 46%, from Rp 840million in 1956 to Rp 457 million in l957.

131
Export regulations introduced during the year under report were as follows:Developments in the foreign exchange reserves were unfavourable during the first
half year of 1957 (see the Chapter on the Balance of Payments). With a view to this theGovernment issued the Export Certificate System (see the Chapter on the Foreign Ex-change System and Measures and Appendix K), which among other things was aimed atthe improvement of the foreign exchange position by stimulating exports.
The Export Certificate System was designed to adjust the buying power of theRupiah (based as it was on a fixed, official rate of exchange).
A further Government measure aiming at the promotion of exports were the creditfacilities extended to national exporters under a Decree of the Monetary Council of theend of March 1957 and referred to in the foregoing Annual Report. The ceiling for thetotal amount of credits to be granted by Bank Indonesia under Government guaranteewas fixed at Rp 100 million and credits could be drawn on for 90% of the f.o.b. price.After the Export Certificate System, actually a new foreign exchange system, came intooperation, credits could be drawn against up to 80% of twice the f.o.b. value (which is interms of the nominal exchange rate) provided certain conditions had been fulfilled. OnFebruary 3, 1958 this percentage was increased to 95% and on March 15, 1958 reincreasedto 110%.

132
The steady flow of exports was interrupted towards the end of the year underreview as the result of the West Irian campaign: shipping space was in short supply;marketing channels to Holland had to be shifted to other countries, and there was anexodus of Dutch technicians engaged in the production sector. The first shock of thedrastic changes has been absorbed and a final solution of remaining problems is lookedforward to in the course of next year.
barter transactions, which reached a wide scope in the latter part ot the periodunder review, have officially been prohibited since the beginning of 1958, and all regula-

133

134

135
tions, decrees and provisions promulgated by local military or civil authorities in thefield of foreign trade in contravention of Central Government regulations have beendeclared void.
Imports
The ban on imports, in the beginning of 1957, of commodities considered insufficient supply in Indonesia, was followed by a general import stop on April 29, 1957,except for:
a) Government orders;b) Imports under “B” and “C” credits;c) Imports under the Surplus Agricultural Commodities Agreement with
the U.S.;d) Imports of wheat flour from Australia under certain conditions;e) Imports under the Informational Media Guarantee Program;f) Imports of such commodities as can only be effected under the B.P.E. system.
As from June 3, 1957, The Commercial Foreign Exchange Bureau (B.D.P.) againaccepted applications for import permits under the proviso that for the time being onlyimports of raw materials, auxiliary materials and capital goods would be approved, inso-far as such goods were required for keeping existing industries running, for the upkeepof existing plants, and for completing new plants in the course of construction. Appli-cations for imports in connection with new projects would not be taken into consider-ation. B.D.P. would only consider applications if accompanied by a Certificate of Ur-gency issued by the Ministry concerned, however such Certificates would not be re-quired for imports of raw materials and auxiliary goods from Japan.
Since the implementation of the B.E. regulations implied an all-round advance ofprices of import goods, the Minister of Commerce permitted importers to raise theirprices for old stocks by 331/3 % and 5O% of the difference between the prices com-puted according to the old regulations and the prices computed in accordance with thenew regulations. The revaluation percentage of 33 1/3% applied to commodities suchas baby foods, automobile and bicycle tyres, newsprint, foreign books and magazines,cotton and weaving yarn; the percentage of 50 to all other commodities. As from No-

136
vember 1957, imports of several essential goods are subsidized by the Government,such as for baby foods, importers only have to pay 125% of the landed price, while theremaining value (i.e. the B.E. rate minus 125%) will be paid by the Government. Forimports of scientific books and newsprint importers only had to pay 120% and 150%of the landed value.
A survey of import figures as listed in table 40 (imports classified by country of origin)shows a declined of imports in 1957 all along the line in comparison with the foregoing year.Imports from Holland slumped marked from Rp 1,038 million in 1956 to Rp 892 million in1957. This was, among other things, due to the Irian campaign at the end of 1957. Importsfrom Burma, Japan, Hongkong and the U.S. also dropped substantially by Rp 190 million,Rp 150 million, Rp 138 million and Rp 89 million respectively. Imports from British NorthBorneo, Singapore, Belgium & Luxembourg however, rose by Rp 80 million, Rp 80 millionand Rp 63 million respectively. Surveying the overall value of imports country by country,the U.S. took first place with Rp 1,520 million (incl. Rp 238 millions’ worth of rice). Japanwas a good second with imports totalling Rp 1,371 million (incl. Rp 238 millions’ worth ofweaving yarn). West Germany took third place with Rp 957 million (incl. Rp 128 million ofindustrial machinery and equipment).

137

138
Table 41 lists imports by groups of commodities. Consumer goods dropped by29% (from Rp 4,081 million in 1956 to Rp 2,5954 million in 1957); raw materials andauxiliaries, in contrast, rose by Rp 533 million (14%), that is 47% of the overall value ofimports. However, if Oil companies’ imports are excluded, the balance of raw materialsand auxiliaries show a decline by Rp 54 million. Imports of capital goods stayed practi-cally On the same level as in the foregoing year.
Appendices “H”, “1'’, and “J give a breakdown of the total import for consumergoods. raw materials and auxiliaries, and capital goods. As the. breakdown for consumergoods shows .rice imports dropped by 26% (from 763,00), tons valued at Rp 1,281million, to 563,000 tons at a value of Rp 956 million). Imports of cotton piece goodsand wheat flour dropped by Rp 147 million and Rp 17 million respectively. Bicycleimports went up by Rp 57 million. but bicycle tires fell off by Rp 44 million. The break-down for raw material land auxiliaries shows substantial increases for iron and rolledsteel products, cotton and fertilizers by Rp 196.8 million, Rp 97.6 million, and Rp 42. 5million respectively. Imports of cotton yarns, on the other hand, decreased by Rp 137.3million (46%), unbleached cotton by Rp 36.3 million (45%), cloves by Rp 53.4 million(41%). In the breakdown for capital goods, motor vehicles registered a considerabledrop by Rp 60 million, from Rp 279 million for 1956 to Rp 219 million in 1957. Impor-tation of stationary combustion engines also dropped by Rp 41 million.
Terms of trade
The Terms of trade as listed in table 42 are computed by the ‘Paache” method (See1956/57 Annual Report, page 123).
Compared with 1956, the terms of trade for 1957 dropped by 2 points— from 87in 1956 to 85 in the following year. This is explained by export prices dropping relativelymore than import prices. The index numbers for import prices tended to rise in the firsthalf of 1957, while they dropped in the second half-year. The index numbers for exportprices fluctuated in the first 3 quarters of 1957, while they rose in the 4th quarter. Asurvey of monthly averages shows that in the year under report the terms of tradetended to fall till the end of the 3rd quarter and rose till the end of the year, this risebeing due to the decline in the index numbers of import prices for capital goods. Thefigures of five months’moving averages illustrate that the terms of trade tended to fall.

139
Table 43 lists the price index numbers of several of the main export and importcommodities. In 1957, the price index numbers of the main export commodities such asrubber, copra, petroleum products and tin ore were lower than in the foregoing year. Incontrast, the price index numbers of several import commodities, such as, raw materials,auxiliary goods and consumer goods (wheat flour, cotton piece goods) increased.

140
Foreign Exchange System and Measures
The Export Inducement Certificate system (Bukti Pendorong Ekspor abbreviatedB.P.E. system) came into effect on August 6, 1956 (see previous Report 1956/57, page125). Developments of the country’s foreign exchange reserves led to applications forimport permits being stopped by B.D.P. (Biro Devisen Perdagangan — Bureau Com-mercial Foreign Exchange) as from April 29, 1957, except for Government orders, forimports under ‘B’ and ‘C’ credits, for imports under the S.A.C. agreement with the U.S.and under the Informational Media Guarantee Program, for imports of flour fromAustralia, and for imports of such goods as could only be effected under the B.P.E.system. As from June 3, 1957 restrictions were relaxed for imports of raw materials,auxiliaries, and capital goods insofar as required for keeping existing industries running,for the upkeep of industries already in operation and for continuing construction workon new industries in the course of erection.
As from June 20, 1957 a new foreign exchange system, the so-called Export Cer-tificate system (Bukti Ekspor—abbreviated B.E. system) came into effect —DecreeMonetary Council No. 30 of June 18, 1957, see Appendix K. The B.E. certificatesissued under this system have a face value in Rupiahs equivalent to deposits of foreignexchange made with a foreign exchange bank, at the price prevailing on June 19, l957.(On this date the prices of U.S. dollar and pound sterling were respectively Rp 11.40 andRp 31.92, while one kilogramme of pure gold was valued at Rp 12,465). B.E. certificates-- expressed in Rupiahs and having a validity period of two months --- can only be soldby the holder through a foreign exchange bank, the bank transacting the sale of thecertificates on the B.E. Exchange market called into being for this purpose and helddaily in Djakarta. Prospective buyers of B.E. certificates, namely imports holding for-eign exchange permits and individuals who have obtained a transfer permit, can onlybuy through a bank, which has to transact its purchases on the B.E. exchange market asabove.
A 20% P.B.E. Levy is made on all proceeds from exports or services (PembajaranBukti Ekspor—abbreviated P.B.E.), which the banks deduct from the proceeds of thesales of B.E. certificates.
The following features of the B.E. regulations in the fields of exports. imports,services, and travel are worthy of note:

141
In the field of exports, an export permit is required which is not granted until theapplication has been approved. The total export value of the application must be expressedin foreign currency and the Export Office checks the proposed selling price with currentworld market prices, together with the desirability of the description of foreign exchange tobe realized. Generally, speaking, there are no restrictions as to destination except in caseswhere the Export Office night consider a certain export to the disadvantage of Indonesia orinconsistent with existing trade agreements. All foreign exchange proceeds from exportsmust be surrendered to a foreign exchange bank. Since irrevocable documentary bank cred-its have to be opened by foreign buyers, while sight drafts are drawn by the exporter throughhis bankers this procedure offers no difficulties. Furthermore, shipping, companies are notpermitted to surrender negotiable shipping documents to exporters but must deliver themto the foreign exchange banks concerned. After shipment has been effected, the exporterreceives from his foreign exchange bank a B.E. certificate in payment for his export whenhanding his sight draft to the bank.
Only officially recognized importers can engage in import trade. As from June 20,1957, imports have been classified into six groups, each group with its appropriate per-centage of Import Surcharge (Tambahan Pembajaran lmpor abbreviated T.P.I.) :
Group I : absolutely essential 0%Group II : essential 20%Group III : essential 50 %Group IV : semi-essential l 00%Group V : semi-essential 1 40 %Group Vl : luxury goods 175%
The composition of any group can be altered, while terms can be shifted at anytime front one group to the other by the Government. The absolutely essential groupincludes such items as rice, cotton and textbooks.
Goods not classified in any of these groups cannot be imported, while for itemsincluded in the above six groups an import permit issued by B.D.P. is required. Theimport application must contain in accurate description of the goods to be imported,quantity, quality, price, terms of delivery etc. If the application is accepted, the prospec-tive importer receives a preliminary foreign exchange permit. This preliminary permit is

142
converted into a regular foreign exchange permit after the importer has, within a time ofthree weeks, purchased the required B.E. certificates and paid the corresponding importsurcharges. At this point a Letter of credit can be opened in favor of the foreign sup-plier, against which payment can only be effected by a foreign exchange bank in Indone-sia or its correspondents abroad after evidence has been produced that the goods-coveredby the foreign exchange license have actually been shipped to Indonesia.
The general and special regulations of the Foreign Exchange Institute permit pay-ments for services to be made abroad. Permits are generally granted for expendituredirectly connected with exports and imports, such as bank charges, cables, postage andrevenue stamps. Foreign residents in Indonesia are permitted transfers within certainlimits find on the basis of their assessable incomes, in the form of so-called foreignexchange packages. These social transfers may- be utilized for private expenditures abroad,such as costs of maintenance of families living abroad, School fees for children, andallowances made to indigent relatives. However, as from December 6, 1957 social trans-fers and transfers of profits and dividends for account of Dutch nationals and enter-prises belonging to Dutch nationals have been suspended. Special permits are requiredfor transfers for advertisements, film rentals, registration charges for patents and trademarks, subscription fees for newspapers and magazines etc. Transfers for this class ofservices can only be effected by purchasing B.E. certificates through a foreign exchangebank. Unlike import transactions, however, no T.P.I. is levied on transfers for services.Payments by residents to recipients abroad must be made through a foreign exchangebank in the currency stated on the permit. Payments by residents to non-residents forwhich no permit can be obtained forthwith must be deposited with a foreign exchangebank and carried on the “Non-residents Rupiah Account”.
Imports and exports of Indonesian currency are prohibited.
All imports of foreign currency must be declared at the Customs Office by per-sons arriving in this country, while exports of foreign currency can only be effected withthe permission of the Foreign Exchange Institute. Foreign visitors planning to stay inIndonesia for less than three months are permitted to keep their foreign currency andtake it out of Indonesia when leaving. Such foreign currency may only be sold to anauthorized bank at the rate of exchange which is subject to alteration at any time and isfixed by Bank Indonesia. If unforeseen circumstances should delay short-term visitors

143
to Indonesia, the facilities as above may be extended beyond three months. Foreignvisitors planning to stay in Indonesia for longer than three months are considered for-eign exchange residents of Indonesia from their date of arrival until their departure.This implies that they have to sell their foreign currency to a foreign exchange bank.Trading in foreign currency is strictly prohibited, except through the specified banks andtravel agencies.
A Bill on Foreign Investments and the proceeds therefrom has been introduced toParliament but still awaits ratification.
As regards the Rupiah holdings of non-residents, these are carried in NonresidentRupiah Accounts (Rekening Rupiah Bukan Penduduk — R.R.B.P. or R.U.R.N.I. — Ru-piah Rekening van Niet Ingezetenen) with the banks concerned, and are controlled bythe Foreign Exchange Institute. Private individuals are also permitted to have aNon-Residents Proceeds Account (Rekening Penghasilan Bukan Penduduk—R.R.B.P.-P)or/and a Non-Resident Capital Account (Rekening Modal Bukan Penduduk—R.R.B.P.M).Transfers abroad of income from rents, dividends, interest on securities etc. are coveredby a general regulation of the :Foreign Exchange Institute, which permits non-residentprivate individuals to make transfers to their countries of residence up to an annualamount of Rp 30,000.—A special Foreign Exchange Institute permit, however, is re-quired for other balances and for transfers by Companies. Finally there are special regu-lations for the transfers of pensions and maintenance allowances. Such transfers mustbe carried to R.R.B.P.P accounts and must not exceed Rp 900.— a month. Capital trans-fers have been suspended for the time being, although within certain limits, exceptionmay be granted to nonresidents, private individuals in straitened circumstances. Generalregulations, to be implemented by the banks concerned, govern the use of balances ofnonresident private individuals for paying family allowances, life insurance premiums,taxes, etc.
Trade and payments agreements with foreign countries
As mentioned in the Annual Report for 1956, several payments agreements withforeign countries were terminated since they were no longer considered in the interestof this country.

144
Continuing in this line the following bilateral clearing agreements were terminatedin the year under report: with Poland (as from May 1,1957), and with Japan (as from July1, 1957). Payments traffic with those countries has been in transferable pounds sterlingsince those dates.
At the time of writing, only two clearing agreements are still in force, namely, withthe Chinese People s Republic and with Egypt.
International Monetary Fund, International Bank for Reconstruction and Development, and Interna-tional Finance Corporation
In the relations of this country with the above bodies no developments took placedeserving special mention.
Over the year no steps were taken yet to arrive at an official I.M.F. parity for theRupiah so that, up to the time of writing, the rate of exchange of the Rupiah vis-a-visthe U.S. Dollar is still based on the provisional agreement fixing U.S. $ 1 at Rp 11.40.

145
VII. PRODUCTION, PRICE AND SOClAL. DEVELOPMENT
Food producing agriculture
Production and food situation
Overall rice production in 1957 was estimated at 7,442,000 tons dry, which was133,000 tons or 2 % more than in 1956. Increased production was mainly reported fromregions outside Djawa—Kalimantan and Sumatra showing increases by 25% and 5%respectively.
The same difficulties that beset food growing in the course of the foregoing yearsrecurred in the year under review, namely, weather conditions (excessive rains, floods, land-slides, whirlwinds); pests (rats, caterpillars, boars) short supply and/or too highly pricedfertilizers. Import of fertilizers stagnated in the last few months of 1957, 20,000 tons beingheld up in October. It is feared that the resultant shortage, coinciding with the sowing sea-son, will affect 1958 production. To meet future contingencies the Government planned toimport 50,000 tons of fertilizers for 1958, while preparations are underway for establishinga fertilizer plant at Palembang. A loan for $ 30 million has been negotiated with Eximbankfor constructing this plant, which has a planned capacity of 100,000 tons annually. Theresultant saving in foreign exchange would be considerable.
The regional service for Indigenous Agriculture in Central Djawa is conducting acampaign for the increased use of green manure, 1,000 ha having been planted inCrotalaria Juncea which are expected to produce 4,000 quintals of seed in August 1958.This quantity is estimated to suffice for a cover crop of 20,000 ha of rice fields and toincrease paddy production by 100,000 quintals. Furthermore the Central Djawa Provin-cial Administration expended Rp 6 million for improvement of village irrigation sys-tems, with a view to curbing flood damage. The Government further set aside Rp 0.6million for the repair of embankments in flood areas of East Priangan. An amount ofRp 6 million has also been requisitioned for 1958 for repairs of 59 irrigation systemsdamaged by catastrophes in West Djawa -— Banten (5 works); Bogor (9 works); Indramaju(8 works); Tjeribon (8works); East Priangan (2 works) and West Priangan (14 works). InEast Djawa preparations are underway for the digging of a canal in the Tulungagungarea to divert excessive water from the Brantas river into the Indian Ocean, thus pre-

146
venting the perennial floods. This project will involve Rp 270 million. Another largescale canalisation plan is underway for the Tuban area to protect about 20,000 ha ofricefields against floods from the Solo river; this plan is estimated to involve Rp 12million.
From tables 44 and 45 it will be seen that maize production dropped substantiallyin the Year under review, namely by 8% (1956: 1,964,000 tons, 1957: 1,800,000 tons) forwhich lower production in Djawa (— 10%), and in the Outer Islands (— 5%’) wasresponsible. Floods were reported as the main cause for this development in Java—according to data from the Central Bureau of Statistics, maize crop failures affected115,000 ha of which 80% is accountable to floods (1956 - - 103,000 ha).

147
Production of cassava and groundnuts rose by 8% and 5% in 1957, while batatasand soy beans were down by 1% and 8% respectively . Djawa had no share in the lowerproduction of batatas, while the lower output of soy beans involved both Djawa and theOuter Islands. For Djawa this lower production was attributed to floods, the damagedarea totalling 39,400 ha against 21,600 ha in 1956.
Table 46 sets out the rice position in Indonesia: the 1956 figures have been revised,while the l957 figures are preliminary estimates. According to the above figures, thevolume of rice available for domestic consumption dropped by 263,000 tons ( - 4,%) in1957 (from 8,199,000 tons to 7,936,000 tons) .
Appendix “O” lists data concerning production, exports and consumptions ofother foodstuffs (the 1957 figures are provisional). As shown, the volume of maize andsoy beans available for consumption in 1957 dropped by 8% and 9% respectively due tolower production. The volume of cassava and cassava products as well as groundnutsincreased by 7% and 5% as compared with l956. In the case of cassava and products theincrease was attributable to increased production and decreased exports; in the case ofgroundnuts, to higher production. Batatas showed no substantial change.
The reaped area of irrigated and non-irrigated paddy increased by l% and 5%respectively at the end of 1957 as compared with 1956, while the harvested area of

148
maize was smaller by 6%. For the other foodstuffs, increases were 6% for cassava andproducts, 5% for batatas and 6% for groundnuts. The area in soy beans showed nochange.
Government Measures to Promote Food Production.
For promoting food production the Government has drawn plans which can bedivided into:
1 ) A short-term plan — Under this plan, the Government is to expend Rp 76 millionimmediately with a view to increasing agricultural production. This extra develop-ment expenditure is expected to increase the yield of 1958 crops to the followingextent: rice by 342.000 tons. maize grain by 190,000 tons; cassava by 330,000 tons.
2) A long term plan - which covers :a) An intensification plan, primarily to be carried into execution where arable land is
limited in extent. The implementation of this plan is expected to return a yield ofat least 750,000 tons of rice and 100,000 tons of maize grain within five years.
b) Development of 250,000 ha of arable land in Sumatra and Kalimantan which isexpected to be completed in 5 years’ time and to yield 250,000 tons of rice. More-over, canals will be dug in Sumatra and Kalimantan with a total length of 820 kmand 760 km respectively.
c) Large-scale development of dry lands. It is hoped that 20 mechanical rice cultiva-tion centres with l 0,000 ha of rice lands each can be established within a periodof 5 years.
The Rice research Institute at Krawang, established by the Ministry of Agriculturelast year, has now been completed for 50%. Unlike the Rice Institute at Bogor, whererice producing techniques are studied, the Rice Research Institute at Karawang special-izes in techniques of storage, grading and processing. For technological research Krawangreceived rice milling equipment with a capacity of 3/4 ton/hour. This modern equip-ment achieves the very low “breaking percentage” of 12% (as compared with the usual“breaking percentage” of 50% or higher), enabling high quality rice to be produced. The

149
Krawang Institute has also been equipped with an installation to dry “gabah” (unhulledrice), and has a laboratory where the water content and yield of gabah can be deter-mined.
The following can be reported on the progress made in carrying out the irrigationprojects planned last year:
The first stage of the Djatiluhur multipurpose project—which, next to irrigation, alsoembraces flood control, fresh water fisheries, electric power generation—has been com-pleted. A start has been made on the second stage, the cutting of a 300 metre tunnel with anll-metre diameter. This tunnel is to be connected with a tower 110 metres in height and witha diameter of 90 metres. Six electric power generators with a total annual capacity of 600million kw are to be installed under the tower. A giant dam is also to be built, capable oflocking up 3 billion m3 water of the Tjitarum river, that is, 60% of the 5 billion m3 annualwater supply of the Tjitarum, calculated to irrigate 250,000 ha of rice fields. The entireproject is planned to be completed in 1963. The tunnel, dam and tower have an estimatedcost of U.S. $ 55 million, while the entire project will require U.S. $ 75 million.
The construction of the Tjatjaban water reservoir in Tegal (Central Djawa) is pro-ceeding according to plan. The expenditure as originally estimated (Rp 45 million) hasbeen exceeded and Rp so million has been spent due to advanced prices of constructionmaterials. It will take Rp 60 million in all to complete this project. The Tjatjaban reser-voir will be capable of storing 90 million m3 of water to irrigate 44,000 ha of rice fieldsthereby increasing paddy production by l 27,000 quintals and second crop output by45,000 quintals.
The construction of the Sempor water reservoir experienced delay due to financialdifficulties. Expenditure for this reservoir is estimated at Rp 1 00 million.
Another important irrigation project in the period under report concerns the re-moval of islands in the Rawa pening marshes, which is planned to increase the volumeof water required for irrigating tens of thousands of ha of rice fields in the Demak areaand for the water supply to the Djelok power plant. The islands cover a total area of 500ha, of which 43 ha were removed in the year under report. More manpower will bemobilized in 1958; the target set is the removal of about 150 ha.

150
The mechanization plans of the Central Smallholders Agricultural Service aim atthe clearance of land outside Djawa. As from 1958, mechanization will be carried out in20 centres (each covering 2,000 ha) in various regions, for which 700 tractors will berequired. Mechanical planting will follow after the centres have been cleared.
Besides improvement of physical conditions for agriculture—irrigation and mecha-nization— other means were adopted to raise food production, including an agriculturalcontest in Besuki residency (East Djawa) in paddy and maize planting. Results weresatisfactory — the highest yield was 79 quintals of dry paddy per ha, and 23 quintals ofdry maize grain per ha. Furthermore, a contest to fight erosion was held in Malangresidence (East Djawa).
In Central Djawa a movement was started to replant barren land. Preparationswere also made in Central Djawa for establishing a seed farm, which is to serve as acentre for the supply of high quality seed, for selecting seed and for conducting experi-ments to obtain superior new seed. This seed farm will also be a centre for training seedselection experts.
In West Djawa, smallholders are encouraged to plant “gadu” paddy on rice fieldsusually not tilled in the rainy season. It is also recommended to plant empty plots invegetables, herbs’ fruit trees and other useful plants. A “Karang Kitri” (Fruit Garden)Committee has been established in every “Katjamatan” to fight erosion. Agriculturalcontests have also been held in this region.
In South Sumatra, smallholders are recommended to plant empty plots in secondcrops. furthermore, this region attempts to raise paddy production by using high qualityseed and opening up new rice fields. The establishment of a Smallholders TrainingCentre at a cost of Rp 10 million is planned.
Agricultural Training Centres have been established in East Kalimantan, namely, 2in Kutei, 1 in Berau, and 1 in Bulongan.
In South Sulawesi 900 ha of rice fields have been opened up, while 450 ha havebeen planted in citrus, cloves and nutmeg.

151
Rice
The volume of paddy bought from growers by J.U.B.M. (Food Foundation) inDjawa, though not up to the target for 1957, was satisfactory if compared with 1956.Purchases covered 638,000 tons, or 80% of the target which was set at 800,000 tons for1957, and 127,900 tons more than total purchases in 1956. The greatest activity wasdisplayed in East Djawa where 364,900 tons or 92% of the target was secured. In Cen-tral Djawa and West Djawa 76% and 64% of-the targets were realized.
The tardiness of purchases in Central and West Djawa as compared with EastDjawa is mainly ascribed to the unwillingness of rice field owners to sell, large holders inparticular holding up sales till the period of scarcity when higher prices can be realized.The food problem being of such essential importance and bearing on every sector ofeconomic life—production as well as trade, industry, communications, health etc.—theGovernment took the view that responsibility for food affairs cannot be entrusted toone single office. The handling of this problem requiring the closest coordination amongthe various Ministries involved in the supply and distribution of staple foodstuffs, theGovernment established—under Government Ordinance No 7/1958—a FoodstuffCouncil (Dewan Bahan Makanan). This Council comprises l l Ministers whose fields ofactivity are related to staple foodstuffs, the Chairman of the Council being the 3rdDeputy Prime Minister.

152
To the Foodstuff Council the task is assigned of:
a) defining Government Policy on the food problem;b) drawing up, coordinating and controlling the implementation ofplansfor:
1) food production in its widest significance;2) importation, storage, processing, transportation and distribution of foodstuffs;3) production of the most nutritious foodstuffs4) fixation of food prices.
c) submitting regular reports to the Council of Ministers on progress made.
In carrying out its task the Foodstuff Council may call in the assistance of expertsand representatives of organizations active in the field of food production.
For 1958 the Government has decided that the quantity of paddy to be purchasedwill have to be at least 900,000 tons in Djawa — West Djawa 300,000 tons; CentralDjawa 200,000 tons; East Djawa 400,000 tons.
Each area shall be permitted to buy more, on the understanding that total pur-chases shall not exceed l5% of the overall production of the region concerned. A PaddyPurchasing Agency (Badan Pembelian Padi—B.P.P.) has been initiated in each 1st Cat-egory Autonomous Area (equivalent to a Province) for West, Central and East Djawa.In carrying out its purchasing activities BPPs will enlist such a number of smallholders’producing cooperatives as will ensure efficiency. Milling, storage, transportation andsales of rice shall also be under the charge of BPPs, under directives of the FoodstuffCouncil. The management of BPPs, will be made up of: a) the Governor of the Region,member and chairman; b) the Territorial Commander or his representative, memberand deputy chairman; c) the Chief of Regional Administration, member; d) a memberof the Regional Representative Council to be appointed by the Regional RepresentativeCouncil, member. The funds required by BPPs can be loaned under Government guar-antee from local banks to be nominated by the Government. The buying price of paddyfor each area will be fixed annually by the local BPP subject to the approval of theFoodstuff Council, the price to be based on dry paddy removed from the stalks, normalquality, delivered at the rice mill indicated by the BPP. Certain reductions can be madefor paddy deviating from the standard set. The selling price of rice obtained from localpaddy purchases is fixed by the local BPP and controlled by the Foodstuff Council. The

153
running of the local BPPs is entrusted to the local branches of the Food foundation(J.U.B.M.), acting as secretariat to the BPP and headed by a Resident attached to theGovernor of the region concerned.
The high annual rate of increase of the population, which increased production offoodstuffs didn’t yet counterbalance, makes imports of rice, which has become the staplefood of the population, inevitable. At an estimated increase of the population by 1l/2%, annually and a per capita requirement of 93 kg a year, overall rice requirements arecomputed at 8,100,000 tons for 1958, against an estimated production of 7,740,000tons. This leaves a shortage of 360,000 tons for 1958 which will have to be filled byimports, which the Government proposes to conduct on a “Government to Govern-ment” or “Government to foreign applicant” basis. Plans for 1958 also involve themeans and methods of rice distribution. They include: improved sea and land commu-nications; the repeal of all regulations and provisions hampering the distribution of rice;improved distribution to certain functional groups (army, police, government officials,workers); revision of allocations to so called minus areas; “injections” of cheap rice incentres of the population so as to keep down retail prices; rigorous measures againstspeculators.
To facilitate domestic rice distribution, the “Rice Ordinance 1948 (Statute 1948,No 253)” also came up for revision. Under Section 2 of the revised Ordinance, a storagepermit is required for all stock, exceeding 1 ton and not exceeding the volume permit-ted, of milled rice’ broken milled rice, paddy, and thrashed paddy for the period March1, 1958—March 1, 1959. The existing regulation on “Permission for the Accumulation

154
and Transportation of Rice 1948” was repealed, while the “Crisis Export Ordinance1939” continues in operation for the time being. Under the Prime Minister’s Decree No5/PM/KB 1958 all regulations promulgated by local military and civil authorities on thetransportation of rice have further become void. This Decree also liberates movementsof rice of any descriptions to and from 1st and 2nd Category Autonomous Areas in anyone island. For interinsular shipments permits will still be required.
Rice imports from the United States under the S.A.C. agreement. amounting to anallocation of 250,000 ton, were completed at the end of June 1957.
The following prices were fixed by the Government for J.U.B.M. rice in 1958:
As regards price developments in the year under report, it appears that the in-creased volume of rice imports from the United States and Burma since the period ofscarcity (September l956) kept prices down till May l957 in the large centres of popula-tion in Djawa. Since June 1957 (when the B.E. system came into effect) prices in thelarger towns in Djawa rose alarmingly up to the end of the year, despite “injections” ofcheap rice by J.U.B.M.
The highest prices were found in the larger towns in Djawa in December 1957.Sumatra (excluding Palembang and Medan) and Kalimantan (excl. Bandjarmasin) showedpractically the same development as Djawa, with Djakarta showing the highest prices..Steadily on the increase since June, the price stood at Rp 7.71/kg at the end of Decem-ber 1957. The factors that mainly caused the steady upward movement of prices over

155
the last 7 months of 1957 may be summaried as follows: deficient supplies under J.U.B.M.control; the influence of the period of scarcity commencing in September; speculativedealings; the promulgation of regional regulations hampering distribution; the introduc-tion of the B.E. system.
International Rice Situation
The data issued by the F.A.O. Agricultural Economies and Statistics Departmentconcerning world rice production of 1957/58 crop are not yet complete. From theavailable data it can be inferred that 1957/58 rice production in Burma (the chief riceexporter) dropped materially (from 6,464,000 metric tons to 5,524,000 tons, that is by940,000 tons or 15%). This decrease is due to the reduced area in rice in 1957/58 (from4,048,000 ha to 3,970,000 ha) and unfavourable weather conditions, the rainy seasonhaving set in belatedly. Production in Thailand (the second largest rice exporter) alsodropped for the 1957/58 crop year, namely, from 8,318,000 tons to 6,380,000 tons, orby 24%‘ . As in Burma, the factors responsible for the drop were the reduced area underrice cultivation (from 5,826,000 ha to 5,120,000 ha) and inadequate rainfall. In contrast,production in Japan (a large-scale importer of rice) rose by 1,248,000 metric tons or10% in the year under review (from 13,080,000 tons to 14,328,000 tons). Pakistan in-creased production from 13,718,000 tons to 14,030,000 tons in the year under review, incontrast with the foregoing years when the standing crops were badly damaged by natu-ral catastrophes. The United States, the 3rd largest rice exporter, reduced its area underrice (for the third time) from 635,000 ha to 542,000 ha, and production dropped from

156
2,243,000 tons to 1,956,000 tons. Italy also reduced the area under rice cultivation andconsequently production, from 648,000 to 598,000 metric tons in the year under report.
Although the annual export figures of the major rice exporting countries are notyet fully available, it may be assumed that total rice exports in 1957 must have beenhigher than in the preceding year in connection with increased import demand all through1957. Substantial increases in exports from Thailand, Cambodia, Vietnam and Egyptlargely absorbed this greater demand. In 1957 Thailand rice exports rose by 26% (from1,239,000 metric tons to 1,567.000 tons); exports from Cambodia in the first 9 monthsof 1957 were three times greater than in that same period of 1956. Up to November1957 exports from Vietnam rose from 5,000 metric tons to 171,000 tons. Finally, ex-ports from Egypt over the first 10 months of 1957 rose by 12% as compared with thecorresponding period of 1956. Burma also exported a greater volume of rice in the first9 months of 1957 compared with 1956. From October, however, monthly export fig-ures were lower so that overall 1957 exports were only slightly higher than 1956 exports(+ I %) . Burma exported a total of 1,877,000 metric tons in 1957 against 1,857,000metric tons in 1956. Italy showed the biggest drop in rice exports, by 60% as comparedwith 1956. Up to the middle of December 1957, Italy’s rice exports dropped from 349,000metric tons to 133,000 tons. Exports from the United States and Spain up to November1957 showed a decline by 24% and 29% respectively.
Of the twelve major rice importing countries, India, Korea, the Philippines andCuba imported more than in the preceding year. India’s rice imports up to the middle ofNovember 1957 were twice as high as compared with the same period of 1956, which isexplained by greater per capita consumption thanks to the increasing level of income.South Korea, a significant rice exporter up to 1941, and practically self-sufficient from1954 to 1956, appeared as a large importer of rice in 1957 (161,000 metric tons against1,000 tons in the preceding year). Philippine imports rose by 11 % in the year underreport, while Cuba imported 24% more in the first 11 months of 1957 than in that sameperiod of 1956. The greatest drop in rice imports occurred in Japan (from 760,000 to347,000 metric tons or 54%). In fact, over the years the dwindling import demand ofJapan has been a significant factor in the world rice trade. Over 1953/55, Japan im-ported more than 1 million tons annually, 1954 being a record year with 1,432,000 tonsor nearly one-third of overall world imports over that year. In 1956, imports droppedmarkedly to nearly half the volume of 1954. Finally, imports again fell substantially in

157
1957, amounting to about half the 1956 volume or a quarter of 1954 imports. Pakistanand Indonesia (the next major rice importers) imported 35% and 34% less in 1957. Theimport volume dropped from 620,000 metric tons to 406,000 tons in the case of Paki-stan, and in Indonesia from 832,000 to 549,000 metric tons.
The second meeting of the F.A.O. Consultative Subcommittee, held in Washing-ton on February 17, 1958, on the economic aspects of rice, made a survey of the currentrice position. The Committee took the view that the decrease in the 1957/58 rice crop inseveral of the major rice exporting countries and the small carry-over from the 1956/57crop, would make the exportable volume in 1958 smaller than that of 1957 and 1956.
The price of 100,% white rice 1st quality in Bangkok, which dropped continuouslysince August 1956 till it reached a low of £ 44.0/long ton, showed an upwards tendencyin the first 6 months of 1957, moving between £ 45.0 and £ 46.5 per long ton. The peakfor the year was reached in August when the price stood at £ 58.0/long ton. SinceSeptember the price slipped again, standing at £ 51.0 at the end of the year under report.
Forestry
The 1957 reforestation plan was equal in extent to that for 1956.At the time ofwriting this report, the Forestry Service was not yet in possession of sufficient data onthe actually reafforested area, though it may be assumed that the plan wild have goneinto completion.
The significance of forestry was accented by the conference of the AsianPacificForestry Commission held in Bandung in June 1957 and attended by 20 countries. Theissues brought up included the following:
1. Forestry Policy:a) Survey of development of national forester in the member countries;b) forestry training;c) water supply.
2) Activities in seeking guiding principles for:a) forestry and research in forestry produce;b) teak;

158
c) forest management;d) survey of timber resources and forestry;e) inventory of world forests in 1958.
3) Problems having the attention of respective Governments in the frame of interna-tional cooperation:a) forestry statistics;b) constructional timber;c) firewood;d) pulp and paper;e) evaluation and standardization.
The difficulties caused by difference in nomenclature in the timber industry of thevarious participating countries and in the world in general were also discussed.
Live Stock
The number of live stock d decreased by 483,000 or 2.9%. in 1956 as comparedwith 1955. that is, from 19,828,000 in 1955 to 19,345,000 in 1956. The decline in thestock of cows, buffaloes, goats and sheep (by 0.75% 1%; and 6.9% resp.) was not offsetby the increase in the number of pigs and horses (by 12% and 4.5% resp.). Nusa Tenggara,which accounted for 41%. Of the total stock of pigs in 1955 saw its stock decline by18.8% in 1956 (593,378 head in 1955 against 481,603 in 1956). West Kalimantan in-creased its stock of pigs by more than 100% (199,377 in 1955 against 400,000 in 1956).Sulawesi and Maluku showed increases for all kinds of live stock.
The number of live stock slaughtered in l957 decreased by 6.7% (2,501,263 in l957against 2,681,878 in 1956), after an increase by 14.2% in l956 (2,681,878 in l956 against2,347,388 in 1955).
Overall consumption of animal food amounted to 279,179,988 kg in the first halfyear (against 272,029,234 kg in the first half of l956), which represents an annual percapita average of about 7 kg, equalling 1.52 kg of animal proteins. This average falls farshort of the minimum annual requirement of 5.4 kg of animal proteins. The averageannual shortage of animal proteins amounted from 3 to 4 kg per capita.

159
Sufficient progress was made with artificial insemination to raise both the qualityand the number of live stock in l957. The plans to make Gunung Kidul into a cattledistrict have begun to be implemented; grass has been planted, and cattle breeders havebeen brought to the district. Besides stimulating the population to improvements incattle breeding, the Veterinary Service also stimulates breeders to step up the yield fromtheir stock as, for instance, by intensifying milking for the cattle breeders’ own benefit.In several areas progress is reported in this respect, as in Wonogiri where goat and sheepmilk is not only drunk, but also used as a substitute for coconut juice.
Exports of live stock, which dropped considerably in l956, recovered in 1957. Pigsaccounted for 81.870 of total exports in fact exports of pigs rose by 271% (32,848 inl957 against 8,840 in l956). Exports of cows were up by 6.7% (4,982 in 1957 against4,671 in l956). Moreover, 2,285 buffaloes were exported in l957 against none in l956.The drop in exports of pigs was ascribed to high supply prices while Bali pigs lost theirmarket now after Singapore has succeeded in breeding higher quality pigs. increasedexports in 1957 were made possible thanks to lower export prices facilitated bythe export rate devaluation, while the quality of exports has improved due to Bali pigsbeing crossed with Australian “saddle backs” and “large back” pigs.
Kalimantan, which is making good progress in pig breeding, is looked upon as thecoming export centre of pigs thanks to its physical features, which compare favourablewith Bali. European breeding pigs (Yorkshires and Nederlandse Landvarkens) have beensupplied by the Veterinary Service since 1952.

160
Fisheries
In the year under report production from fisheries totalled 721,000 tons of wetfish, against 714,000 tons in 1956 or an increase by 0.8% in 1957. Out of this total400,000 tons was from sea fisheries, the balance from inland fisheries.
Whereas the production of sea fisheries declined by 18,000 tons or 4.3%*, inlandfisheries produced 25,000 tons more or 8.4% (increase in 1956 — 37,000 tons or 14.6%).The decline in productivity of sea fisheries—in all regions except Djawa and Madura—was attributable to unfavourable weather conditions. Floods in the first half and severedrought in the second half of 1957 had an adverse effect on fresh water fisheries. Theshort supply of yarn for fishing nets was also held responsible for catches being unusu-ally small. Moreover the price of yarn for nets was high i.e. Rp 85.— to Rp 90.— per kgor 250% to 300,% of the price at the beginning of 1952.
The severe drought in the dry season made the salinity of coastal ponds rise fromthe regular 35°/oo to 60°/oo which killed many fishes.
Natural catastrophes struck 4,500 ha of fishing grounds, causing damage to a totalamount of Rp 3 million. Rehabilitation is underway with the assistance of the InlandFisheries Service, which supplied l00,000 fry and money to the amount of Rp 49,999.—.
West Djawa still ranks first as a centre for inland fisheries, the population culti-vated 34,577 ha of fish ponds (Djawa total 85,000 ha), yielding 31,000 tons yearly.

161
The following measure, were taken to raise the productivity of inland as well as ofsea fisheries: extension of the area of fish ponds; dissemination and improvement offry; extension of fishing in the free waters outside Djawa (as, for instance, in KapuasHulu in Kalimantan, in Sulawesi); training of officials and cadre. Mixed farming (thecultivation of fish on wet rice fields is gaining ground particularly in West and EastDjawa and is more generally practiced. The fish not only brings additional profit, butalso a better rice yield.
The drive to motorize and mechanize fisheries made gratifying progress. Fish trans-portation is still far from solution, particularly in interinsular shipping. The islands out-side Djawa (Kalimantan, Sulawesi and South Sumatra) have a surplus production offish, while Djawa the greatest consumer, is a minus area.
Agricultural export commodities
Rubber
According to figures published by the International Rubber Study Group, worldproduction of natural and synthetic rubber amounted to 3,162,000 long tons in 1957—an increase of 64,000 long tons compared with the foregoing year. World consumptionrose by 3%, that is, from 3,037,000 tons to 3,133,000 tons. Both natural and syntheticrubber showed increased production. This was due to improved production of naturalrubber in Malaya by 270, and increased production of synthetic in the United States by4%, in Canada by 9%, and in West Germany by 9%. The increase in world consumptionapplied to syntectic only.
World supply of natural rubber rose from 727,000 long tons per the end of 1956to 750,000 long tons per end 1957, while production of natural rubber Was higher in the2nd half of 1957 than consumption. World supply of synthetic rubber rose from, 267,500long tons to 272,500 long tons at the end of 1957.
The proportional shall of natural rubber in world production edged down from61% in 1956 to 60': in 1957, while consumption also dropped from 63% to 6l%,. Thiswould justify the conclusion that the position of natural rubber in world consumption isweakening, while the position of synthetic is growing stronger-. A comparison of the

162
consumption of natural and syntectic in the United States would seem to make this stillmore apparent - proportional shares in 1956 : 39% for natural and 61% for synthetic ; in1957: 37% for natural and 63% for synthetic.
The United States kept first place as a consumer of natural (29%) and of synthetic(74%) in 1957. Overall rubber consumption in the United States in 1958 is expected tobe lower than in l957 (1,469,000 long tons). This forecast is based on the anticipatedlower production of automobiles in the beginning of 1958 as a result of the recessionwhich set in during the 4th quarter of 1957. The large tyre factories also started loweringtheir sale estimates for 1958 from 33 million to 29 million tyres.
While production of synthetic rubber was increasing in 1957 (see table 52) plansare going forward for establishing new synthetic rubber industries in other Westerncountries, such as the United Kingdom, France, East Germany, Italy and Russia.
Lower world consumption of natural rubber in 1957 (see table 53) was due toreduced purchases by the Soviet Union and by the Chinese People’s Republic (from222,000 long tons to 190,000 tons) as well as to lower consumption of natural rubber inWestern countries. Lower consumption of natural rubber was attributed to higher con-sumption of synthetic rubber: the United States +6%; the United Kingdom + 42,%;France + 56% and Germany + 30% in 1957. This drop in world consumption was thefirst since 1952 when the United States withdrew rubber control imposed during thekorea conflict.

163
The increasingly stronger position of synthetic rubber in the future is to be in-ferred from research and experiments conducted in the United States in the year underreview. “Ameripol-SN” and “Coral Rubber” in particular were experimented with. Forheavy duty tyres they seem to have the same qualities as natural rubber, as regards crack-ing and wearing. Coral Rubber seems to have greater capacity for resisting high pres-sures at low temperatures that natural rubber. More exhaustive research on butyl rubberfor manufacturing tyres, and the discovery of Isoprene (a subsidiary product of butyl)will help to undermine the position of natural rubber in the future.
Malaya is making great efforts to improve the quality of her rubber to cope withthe increasingly stronger competition of synthetic. This includes the planting of a highquality rubber tree, the Superior Processing variety, which has the additional advantageof lower maintenance cost. Plans are to plant 40,000 ha of this variety every year. Indo-nesia is also active in trying to improve her quality of rubber by, for instance, plantinghigh quality seedlings and thereby rejuvenating smallholders’ rubber plantings within 10years.
Meanwhile, the Raw Materials Supply Committee is investigating the necessity ofrevising the strategical rubber stockpiles in the United States. According to the NaturalRubber Bureau, an office representing rubber planters in Malaya, there is every possibil-ity that the United States natural rubber stockpiles, amounting to about 1,200,000 tons,will not be reduced. Further, in spite of the recommendations of this Committee toreduce natural rubber stockpiles, the final decision will be made dependent on agree-

164
ment of the Office of Defence Mobilization, and the consideration of such Govern-ment agencies as the State Defence Commerce Agriculture Interior Departments, Gen-eral Services Administration and Civil Defence Administration, all of which take a sharein controlling strategical supplies.
The world rubber price, which rocketed up when the Suez crisis was at its height,dropped back in the 1st quarter of 1957 due to falling demand from the United Statesand Western Europe. The price of R.S.S. I quality dropped from U.S. $ cts 33.23 to U.S.$ cts 31. 79/lb in New York during that period. Some improvement followed in theperiod April through August due to the entry in the market of the Chinese People’sRepublic and the Soviet Union, moving steadily between 32.09 and 32.79 U.S. $ cts/lb.The recession, which set in during the 4th quarter caused a slump in prices, which nowmoved between 29.90 and 27.40 U.S. $ cts/lb. The International Rubber Council is tomeet in Hamburg in June 1958 to study the causes of fluctuations in world market

165
prices for rubber. The Council’s session in Jogjakarta in June 1957 did not succeed, aswill be remembered, in coming to decision on stabilization of the world market price forrubber.
Djakarta quotations for R.S.S.I quality showed a development opposite to that ofthe world market in the period under review. Dropping from Rp 10.70 to Rp 8.80/kg inthe 1st quarter the price steadily edged up later. As table 54 shows, the price rose from9.20 in June to 12.68 Rp/kg in July, and stood at Rp 14.10/kg at the end of l957.
As table 55 shows, the downward trend in estate rubber production, which com-menced in 1954, continued in 1957 and was down by 8,800 tons (3%) compared with1956. Investigations made by the Estate Agriculture Institute at Bogor led to the conclu-sion that this decline was not primarily due to superannuation of plantings, but rather tolack of care, haphazard tapping and lack of working discipline generally.
According to the Central Bureau of Statistics, the volume of rubber exports roseby 2% in 1957, while proceeds dropped by 3% due to unfavorable price development onthe world market.
The United States remained the leading buyer of lndonesian rubber in l957 with79,771 tons net or 33% of overall exports (1956 - 92,600 tons or 37%). Other majorbuyers were, in descending order: the United Kingdom (35,400 tons), West Germany(29,900 tons), the Chinese People’s Republic (29,500 tons).

166
Exports of estate rubber to the United States, the Netherlands and Japan dropped,while those to the United Kingdom, West Germany and the Chinese People’s Republicwere up. Out of the total exports of smallholders’ rubber for l957 a quantity of 173,300tons, or 26%, went to Singapore (1956 - 143,600 tons or 35%. Next came the UnitedStates with 99,300 tons, and the United Kingdom with 60,200 tons.
Exports of both smallholders’ and estate rubber to Belgium and Luxembourg(6,300 tons) and to Brazil (1,200 tons) in 1956 rose to 9,900 tons and 3,400 tons in 1957,mostly smallholders’ rubber. The possibility opened by the Government to export rub-ber to the Chinese People’s Republic and to other countries, boosted exports to theChinese People’s Republic (36,000 tons in l957; 1,400 tons in 1956), while the SovietUnion (Western part) appeared as a new buyer with 10,200 tons in 1957.
Table 56 lists exports of smallholders’ rubber from the principal production areas.It developed that West Kalimantan, which exported about 84,800 tons of dry rubber in1957, was leading, this being the highest export figure for West Kalimantan since 1950.According to the findings of the Local Smallholders’ Rubber Service this increase wasto be thanked to increased production due to:
a) new plantings, started in l954, coming into production;b) favourable weather conditions;c) the B.E. system and consequent higher prices.

167
South and East Kalimantan took second place as exporters of smallholders’ rubber.Except for Djambi, Palembang and Tapanuli, the other production areas showed improvedexports as compared with l956. In terms of proceeds West Kalimantan netted 21%, fol-lowed by South and East Kalimantan (15%), Palembang (15%), and Djambi (11%).
The composition of exports of smallholders’ rubber by qualities (see table 57)shows that shifts occurred in the year under report. In comparison with 1956, exportsof sheets, scraps and slabs increased. In sheets a shift is noticeable from low to mediumquality smoked sheets. The proportions of R.S.S. III (5%), IV (27%), and V (64%) in1956, improved into R.S.S. III (9%), IV (28%), and V (54%) in 1957. Exports of unsmokedsheets did not alter appreciably as compared with 1956. The increased export volume ofsheets was due to Kalimantan, 77% of whose exports were made up of sheets, 51%being R.S.S. V. Improved exports of slabs was due to the ban on this variety being liftedby the Government. The South Sumatra Military Authority watched for deteriorationof export quality—slabs of a thickness greater than 3 cm were rejected to reduce thepossibility of foreign matter being introduced to give extra weight. Exports of blanketsand bark crepe decreased.
The regional centres of the Smallholders’ Rubber Service continued their effortsto rejuvenate smallholders’ rubber plantings. The cultivation of high class seedlings is afirst consideration. The difficulties encountered by smallholders were finance and graft-ing techniques. There are two varieties of high quality seedlings: clones, which have thesame hereditary qualities as the parent plant, and grafts. The Smallholders’ Rubber Ser-

168
vice sent 4,155,200 clones to the regions, including South, East and West Kalimantan,South Sumatra, Bangka, Belitung and Central Sumatra. Clones require less care as theyneed no grafting, while grafts are more difficult to cultivate. 1 he plan to rejuvenatesmallholders’ rubber plantings covers 10 years (1956/1965) and involves 260,000 ha. Inthe first 5 years 91,110 ha under smallholders’ rubber are to be replanted, while this areais to be gradually extended. Plans are to set aside high quality seedlings in 1957 for newrubber plantings in 1958 to cover an area of 20,820 ha. An amount of Rp 23.9 millionwas required for replanting in 1957, the overall cost of the complete project is estimatedat Rp 877 million. The Counterpart Rubber Association supplied aid to an amount ofRp 10 million in l957.
Copra
The volume of copra bought in 1957 (134,300 tons) was 60% less than the volumeof purchases in 1956 (data from “Jajasan Kopra dalam Likwidasi”— Copra Foundationin Liquidation—and from “Induk Koperasi Kopra Indonesia”—I.K.K.I.—Central ofIndonesian Copra Cooperatives). As table 58 shows, copra purchases decreased in EastIndonesia, West Kalimantan, and Djawa by 62 %, 56 % and 46,% respectively.
The drop in copra purchases in East Indonesia was primarily due to continueddifficulties in the field of financing and transportation in the year under report.
With a view to making producing areas and coconut growers benefit from directcopra dealings, the Ministry of Economic Affairs approved a resolution of the execu-tive committee of the Committee for the Preparation of the Central of Copra Coopera-tives (Panitia Persiapan Induk Koperasi Kopra—P.P.I.K.K.) that sales of copra shouldbe decentralized as from January 15, 1957. Under this resolution, copra producing areasreceive the revenue from copra taxes and a share in profits made on copra on a scaleworked out by P. P. I. K. K. The Central Government further supplies additional capitalrequired by copra producing “kabupatens” (administrative units) for copra purchasesfrom the producers. The Central Government fixes a price ceiling which includes stor-age charges, copra taxes and profits. The amount of profit under the above price calcu-lation depends on the success of the “kabupaten” in keeping down expenditure. Thus asystem was worked out for profit sharing between the Central Government as the singleseller, and the copra producing regions as the single buyers.

169
I.K.K.I. was established on July 25, 1957 to supersede the Copra Foundation whoseliquidation was completed on July 12, 1957. The objects of I.K.K.I. are:
1. to promote the copra interests of I.K.K.I. members and to improve economic con-ditions in general;
2. to coordinate and improve copra processing and cooperativeselling centres.
To attain these objects, I.K.K.I. endeavours:
a). to make members deposit money with I.K.K.I.,b). to give credits to members for improving their enterprises,c). to sell the products of members collectively,d). to purchase the requirements of members collectively,e). to direct and supervise the activities of the organizations of members,f). to engage in all other activities found useful for attaining I.K.K.I.’s objects insofar as
such activity does not run counter to cooperative principles and current Govern-ment regulations.
Copra producing and copra selling cooperative centres, set up in regions whereI.K.K.I. operates, and recognized as corporate bodies by the Chief of the CooperativeService can be admitted to I.K.K.I., while cooperative centres which have not yet beenrecognized can be admitted as candidates for membership.

170
The working capital of I.K.K.I., is derived from: initial savings; obligatory savings,deposit account funds, reserves, loans and other lawful receipts. The amount of initialsavings to be deposited with I.K.K.I., and corresponding to the voting rights, is fixed onthe following scale: 1 vote—Rp 10,000; 2 votes— Rp 20,000; 3 votes—Rp 30,000; 4votes—Rp 40,000; s votes—Rp 40,000,-
A meeting of members decides the amount of obligatory savings to be depositedwith the centre by each member. Members can further make voluntary savings withtheir centre, either on a current or on a deposit basis. In contrast with the erstwhileCopra Foundation, any profits from copra transactions by I.K.K.I. go to the membersin the various regions. Members of I.K.K.I. as per the end of 1957, amounted to 10“kabupaten” copra cooperative centres with 173 primary cooperatives.
I.K.K.I. copra purchases are restricted for the time being to the regions where thisorganization has sole buying rights, that is, Banten, West Kalimantan, South Lampung,South Sulawesi, and South-East Sulawesi. Seeing that the Minister of Trade permittedfree copra sales in the other producing areas’ such as Central and North Sulawesi, Malukuand Nusa Tenggara, I.K.K.I. was not granted single buying rights there.
I.K.K.I can purchase about 4,500 tons of copra a month while the average monthlyconsumption of copra is about 20,000 tons, but the shortage was largely covered byEast Indonesia (abt 12,500 tons). I.K.K.I. copra was allocated to Central, East, and WestDjawa, each receiving 1,000 tons, 1,000 tons, and 1,500 tons respectively.

171
Exports of copra amounted to about 289,800 tons net in 1957, a rise by 11% ascompared with the previous year, though proceeds dropped by 2% (from Rp 441.9million to Rp 433.1 million) due to unfavourable copra prices on the world market in theyear under report. The two official copra organizations (Copra Foundation in Liquida-tion & I.K.K.I.) handled 13 % or 37,800 tons of overall 1957 exports.
Export of copra cake, in contrast with copra exports, dropped in export volume by6% (from 133,700 tons to 125,900 tons) and in proceeds (from Rp 71.1 million to Rp52.8 million).
As regards export destinations, coconut oil exclusively went to Holland in 1957,though the quantity was 10% lower than in 1956 (2,000 against 2,300 tons net). Singaporeremained the chief buyer of copra in l957 (147,900 tons against 63,300 tons in 1956).Germany, the second largest buyer in 1957, took 50,600 tons against 20,300 tons in1956), while Holland took third place with 40,000 tons against 35,600 tons in 1956.Exports to Japan, Belgium, Luxembourg and Denmark were down in 1957, while Francewas absent as a buyer. Penang took 29,000 tons in 1957 against 26,400 tons in 1956. Themost striking increase was Sweden’s—from 3,500 tons to 20,800 tons.
Hongkong appeared as a new buyer of copra though not for a large quantity. Hol-land remained the chief buyer of copra cakes (60,300 tons) followed by West Germanyfor 31,400 tons. The United Kingdom took third place with 14,700 tons (8,300 tons in1956). Since I.K.K.I. was set up in June 1957, this organization managed to export 5,000tons of copra. mainly to Sweden, Finland and Italy.
The Copra Foundation in Liquidation sold about 22,300 tons of copra to domesticcoconut oil factories in 1957, against 111,800 tons in 1956.
During the first 10 months of 1957 copra prices showed a continuous downwardtrend on the world market. The London copra quotation slipped from a level of £ 70per long ton for Straits copra c.i.f. Europe and reached a low in September with £ 63.The recovery which appeared about the middle of October was not sustained and liftedthe price to only £ 63.10.0. In November 1957, however, there was a further upwardmovement and by the end of December the price stood at £ 69.10.0.

172
In contrast with world market prices, the Djakarta price for copra rose right throughmost of 1957. The price for 95% dry, which at first stood at Rp 225 per quintal, sud-denly jumped to Rp 325 per qt. in March. After decreasing to Rp 315 per qt. in thebeginning of May and remaining at that level till the middle of June, the price increasedagain to Rp 320 per qt. to remain at that level till the year-end.
From November 11, 1957, when I.K.K.I. started operating as a single seller andbuyer for certain regions, the price of copra for producers was raised from Rp 260 to Rp290, and further adjusted, in line with prevailing market conditions, to Rp 350 per qt. onDecember 5, 1957.
In November 1957 I.K.K.I. adopted the following scale for fixing I.K.
Palm oil
Production of palm oil and palm kernels dropped by 4,400 tons (—2.7,%) and1,800 tons (—4.7%) respectively as compared with 1956, due to the persistence of thedownward trend which set in after production reached a peak in 1954. Monthly averageproduction also dropped to 13,300 tons palm oil and 3,200 tons palm kernels, against13,700 tons and 3,400 tons respectively in 1956.
Exports, however, rose by 3% for palm oil and by l % for palm kernels. Palm oilyielded foreign exchange to an equivalent of Rp 296.7 million, or 2% more than in theprevious year, while palm kernels brought in Rp 50.4 million or 8% less than in 1956.Owing to the greater export volume, however overall proceeds were slightly higher thanin 1956 (+ 0.2%) despite the persistent decline of the world market price for palm oil.
The chief markets for palm oil were Holland (85,361 tons), Japan (14,959 tons)and West Germany (10,253 tons). Exports to Holland and West Germany rose by 1870and 30% respectively, while those to Japan were down by 39%. Denmark, which reap-peared as buyer in 1956, only bought 400 tons of palm kernels this year, against 682 tons

173
in l956. Japan, the leading buyer of palm kernels in l956 (28,954 tons), imported only18,233 tons in the year under report, or 37% less.
The world market price for palm oil was on the average lower in 1957 than in l956.The price of B. frcs 12.80 per long ton in the beginning of January l956 fell off continu-ously and reached a low with B. frcs 11.75 per long ton in October. Later it tendedupward again but did not go beyond B. frcs 12.30 in the last few weeks of 1957. Pricedevelopment of palm kernels was practically along the same lines. At the beginning ofthe year they stood at £ 53 per long ton and reached a low of £ 49.10.0 in the middle ofthe year. At the end of the year, in contrast with palm oil, palm kernels reached a higherlevel with £ 54.50 per long ton in December 1957.
Despite lower world market prices and declining production of palm oil, exportsproceeds of Indonesia were apparently higher in the year under report as comparedwith l956.
Fibres
The production of hard fibres fell off by 2.222 tons (—6.5%), while exports droppedby 6,204 tons (—19%) as compared with l956. The U.S was the main buyer (6.231 tons),while Japan, which led last year with 9,576 tons, only imported 4,247 tons ( - 44%) inl957. Exports to Australia, Holland and West Germany rose by 23%, l5% and 6% re-spectively. Purchases by Belgium and Luxembourg rose strikingly from 754 tons in 1956to 1,800 tons in the year under review (+ 138%).

174
Export proceeds from hard fibres dropped from Rp 73.2 million in 1956 to Rp49.4 million in 1957—a setback by 33%. The production of fibres persisted in its de-cline: Djawa (—5.6%), other regions (—6.4%) and made itself felt in the manufactureof rope for domestic use. In order to meet this decline hemp plantations in EastKalimantan were extended by 240 ha.
The world market price for B.E.A. sisal continued the downward trend which hadmade itself felt throughout 19 5 6. Standing at £ 76/ton at the beginning of 1957, itdropped further to £ 73/ton in December 1957.
Of late, attention has been focused on planting rami and rosella, rosella in combi-nation with rami holding out great hopes of becoming a popular fabric for wearingapparel. Thousands of hectares of both irrigated and non-irrigated fields were plantedin rami or rosella in East and Central Djawa in the course of 1957. West Djawa, notwishing to lag behind, planted experimental fields and gave courses on rami, while train-ees were sent to Central Djawa. Agencies and committees established to stimulate ramiplanting tried to interest farmers, while the high price to be realized for rami (Rp 250 perquintal) constituted an added appeal. The rami plantings near Medan did not come up toexpectations, so that the rami factory which had been established at Medan had to im-port rami.

175
As table 62 shows, the volume of kapok exports in l957 experienced a further drop(—21%) as compared with the previous year, proceeds only a mounting to Rp 15 mil-lion, against 24 million in 1956 (—37.5%). As in 1956, the U.S. was the chief buyerthough for 916 tons only in comparison with 1,077 tonsin 1956 (-- 15%). The secondlargest buyer was New Zealand with increased imports from 286 to 434 tons (+ 51%).
Kapok seeds, in contrast, reached a high level of export in the period under review,namely, 19,093 tons against 9,683 tons in 1956. Foreign exchange proceeds mounted toRp 12.5 million from Rp 8.9 million in 1956. Volume and proceeds thus rose by 97 %and 40 % respectively. Exports during the last quarter of 1957 largely went to Japan, thistrade movement being stimulated by the reduced rates of freight for kapok seeds fromBr. Sh. 145/ton to Br. Sh. 130/6 per ton from November 11, 1957.
Many endevours were made in the course of l957 to promote both production andexports of kapok. Selected seed was distributed by the service for Indigenous Agricul-ture in several areas in West Djawa, and kapok planting contests were held. The success-ful campaign to free kapok trees from parasites together with the prolonged dry seasonprovide expectations of a further rise in kapok production.
Under the auspices of the Central Djawa Military Authority, “N.V. Kapok’s asplanned by the Kapok Institute since l952, was established on Sept. 1, 1957. The capitalof this limited liability company was subscribed by the Government for Rp 5.2 millionand by private interests for Rp 4.8 million. N.V. Kapok will take charge of all matters

176

177
immediately concerned with the production, storage, and local and export sales of kapok.Plantation owners, storage companies, local traders and exporters have to take shares inthe newly established company, whose head office is in Semarang. It is hoped that thisnew organization will be helpful in restoring the position Indonesia once held in theworld kapok market.
Cinchona
Production of cinchona bark rose by 1.189 tons (+ 53 %) in 1957 compared withthe foregoing year, while exports increased by 2,142 tons or 142%. The cinchona barkexported largely went to the Netherlands, namely, 3,428 tons gross at a total value of Rp9.5 million. Exports of quinine were nil, as in 1956, due to dwindling world demand,quinine being ousted by the new synthetic anti-malaria drugs. Quinine output by theBandoengsche Kinine Fabriek increased in the year under review, thanks to new equip-ment coming into operation, amounting to 41,853 Ibs in January/October included—alevel far exceeding the estimated demand of 20,000 Ibs.
Under the rejuvenation plan of the Ministry of Agriculture, the output of cin-chona bark by Government-owned estates is expected to be boosted by 1,086 tonsannually, rising to 7,000 tons in l959, as follows:

178
Year Production Scheme(in tons)
l955 2,656l956 3,742l957 4,828l958 5,914l959 7,000
On the local market greatly enhanced production costs have been reflected in asubstantial rise in the retail price of quinine tablets, from January 1, 1957, as follows:
To avoid malpractice in the sale of the popular sugar-coated sulphate of quininetablets of 0.222 grammes on the local market, the tablets for distribution on the retailmarket are plain white, while those allotted to the Ministry of Health are coloured blue,and the allotment to the Armed Services red.
Forest products
Production of lumber, firewood and charcoal, computed in the equivalent of roughtimber, totalled 3,944,000 m3 in l957, against 3,952,000 m3 in 1956— a decline of 8,000m3.

179
Production of lumber rose by about 3,000 m3; output of all kinds of timber rosefrom 643,000 m3 in 1956 to about 716,000 m3 in 1957. This rise was attributable tofavourable market conditions, particularly in Djawa where timber for the building tradewas in great demand. Kalimantan and Sumatra showed decreasing production, due tolack of shipping space and high cost of transportation, with the result that shipments toDjawa and export destinations stagnated. Production in Kalimantan and Sumatra wastherefore cut back to prevent excessive stockpiling, which would involve great risks.Output of firewood in Djawa and Madura dropped from 1,190,000 m3 in 1956 to1,117,000 m3 in 1957, which largely went to the State Railways in Djawa and Madura tofire locomotives.
Production of charcoal rose from 376,000 m3 in l956 to 423,000 m3 in l957. Forthe output of other forest products the following figures can be given: tanning bark10,700 tons; kayuput oil 37,000 liters; lacquer (crude) 15O tons; turpentine oil 50,000litres; ,,gondorukem” (pine resin) 360 tons.
The import of triplex chests rose by only 9.6% (389 tons), while woodpulp andnewsprint imports fell by 65% and 11% respectively.
Exports of timber of all kinds, including barter transactions with Singapore. droppedfrom 118,781 tons (224,000 m3) in 1956 to 100,315 tons (206,000 m3) in 1957. Thisdrop is largely accounted for by stagnation of export of ,,dolok” wood to Japan after the2nd quarter of 1957, and by lack of shipping space. Exports of teak increased from

180
8,703 m, in 1956 to 10,521 m3 in 1957. The Forestry Service succeeded in increasingexports of sawn teak (1,411 m3 in 1956; 3,301 m3 in 1957).
Endeavours were made in 1957 to continue reforestation on the same scale as in1956, when about 43,900 ha were reforested, namely: 39,500 ha in Djawa and 4,400 ha inthe other islands, particularly in the region round Lake Toba where ,,tusam” (pinusmerkusii) was planted. The reforestation plans stress the planting of those kinds ofwood which will be useful to industrial development: ,,damar” (agathis) in the regionsround Mount Slamet for paper mills; ,,tusam” (pinus merkusii) in the regions of LakeToba for paper milling acacia decurreus in the environs of Malang for a tannin factory.

181
As table 67 shows, export of copal maintained practically the same level as in 1956,falling by only 1%. Exports of damar dropped from 5,802 tons in 1956 to 4,206 in 1957,while rattans showed an increase by 2,796 tons. Over 50% of rattan exports went toHongkong and Singapore. The average prices of copal, damar and rattans dropped by2%, 8%, and 2% respectively, while the total export proceeds of these three itemsamounted to Rp 69.6 million, against Rp 73.6 million in 1956—a decrease by 6%.
Sugar
Sugar production in 1957 amounted to about 828,200 tons nett, or 32,000 tons lessthan the original crop estimate of April 1, 1957. Smaller supplies of smallholders’ caneto the mills, together with cane pests, labour troubles and continued cane thefts, werethe main reasons for this discrepancy between actual production and the original cropestimates. A large quantity of smallholders’ cane did not go to the mills but was pro-cessed into “mangkok” (cup sugar or gur) in East Djawa, particularly in the ResidencyMalang and the Southern part of Kediri. The price of cup sugar—which can reach alevel of Rp 200 to Rp 220 a quintal—is sufficiently attractive to warrant continuedproduction of cup sugar. The production of this kind of sugar increased becausesmallholders make use of diesel-driven cane mills capable of processing 8,000 quintalsof cane a day. A clearer picture of the position of cup sugar is as yet impossible to give.As it happens, in the cup sugar producing regions, the consumption of factory sugarwent up, instead of going down. This makes it impossible to draw a correlation betweencup sugar production and the consumption of factory sugar.
In comparison with the foregoing year, sugar production in 1957 increased byabout 42,800 tons (about 5%).
In 1957, 52 sugar mills were in operation while the area under cane was about53,000 hectares. The area under smallholders’ cane was about 40,000 ka at the end ofthe year. For 1958 it is expected that 52 mills will engage in production, while provisionalestimates stand at about 860,000 tons. The area under cane grown by the mills is about54,950 ha, while the area planted by smallholders is estimated at about 41,000 ha.
To replace the existing Ordinance governing the hiring and letting of land for caneplanting, a new Ordinance was promulgated by the Minister for Agrarian Affairs on
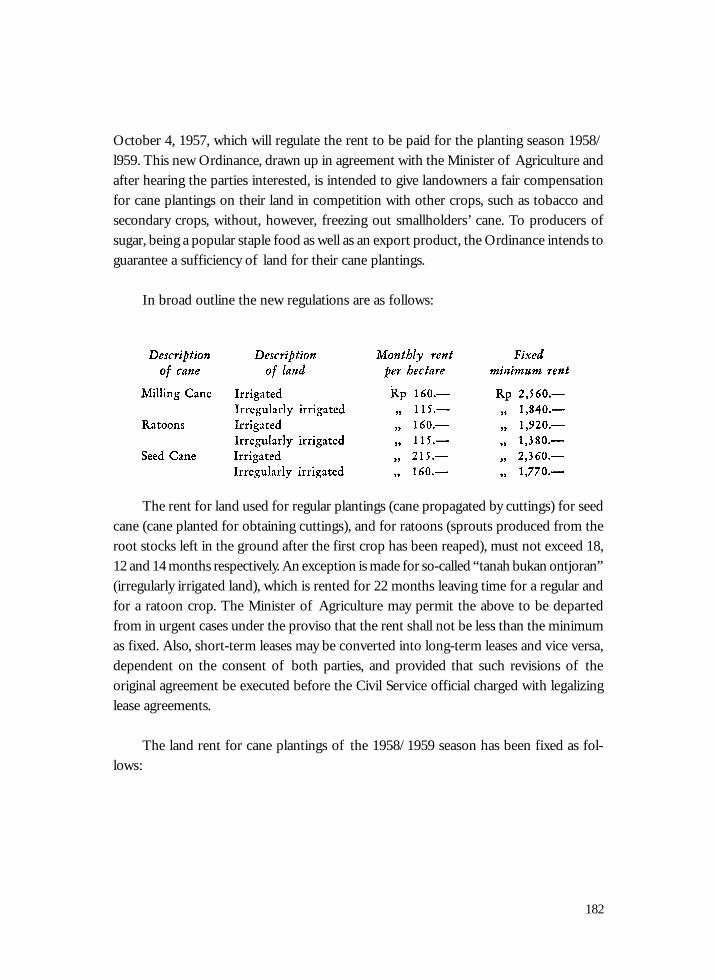
182
October 4, 1957, which will regulate the rent to be paid for the planting season 1958/l959. This new Ordinance, drawn up in agreement with the Minister of Agriculture andafter hearing the parties interested, is intended to give landowners a fair compensationfor cane plantings on their land in competition with other crops, such as tobacco andsecondary crops, without, however, freezing out smallholders’ cane. To producers ofsugar, being a popular staple food as well as an export product, the Ordinance intends toguarantee a sufficiency of land for their cane plantings.
In broad outline the new regulations are as follows:
The rent for land used for regular plantings (cane propagated by cuttings) for seedcane (cane planted for obtaining cuttings), and for ratoons (sprouts produced from theroot stocks left in the ground after the first crop has been reaped), must not exceed 18,12 and 14 months respectively. An exception is made for so-called “tanah bukan ontjoran”(irregularly irrigated land), which is rented for 22 months leaving time for a regular andfor a ratoon crop. The Minister of Agriculture may permit the above to be departedfrom in urgent cases under the proviso that the rent shall not be less than the minimumas fixed. Also, short-term leases may be converted into long-term leases and vice versa,dependent on the consent of both parties, and provided that such revisions of theoriginal agreement be executed before the Civil Service official charged with legalizinglease agreements.
The land rent for cane plantings of the 1958/1959 season has been fixed as fol-lows:

183
Whereas cane land, as the above table shows, is divided into two descriptions,Regularly, and Irregularly Irrigated, rents are broken down into four descriptions:
a) the regular monthly rent per hectare;b) the minimum rent per ha payable for one season;c) the rent payable in addition to the minimum rent (b);d) the bonus to be paid for any yield in excess of the fixed basic yield.
The minimum rent (b) must not be paid later than the date of the official executionof the contract’ while the rent in addition to the minimum rent (c) must be paid whenthe cane has actually been reaped. The bonus (d) must be paid as soon as the yield per hahas become known, as per the following table:
1 2 3Description of Basic yield Bonus for each quintal ofcane per hectare cane in excess of basic yield
in column 2
Milling cane a. Irrigated land Rp 4 for first 250 qtls in850 quintals excess of basic yield.
b. Irregularly irriga- Rp 4. 5 0 for the secondted land 600 qtl. 250 qtls in excess of basicyield; Rp 5.— for any further excess yield.
Ratoons a. Irrigated land65 0 quintals as above
b. Irregularly irriga tedland 470 qtl.
If the plot of land rented out is 4 ha or more, the bonus can be paid out to thelandowner on the basis of the crystal sugar extracted in excess of the basic yield. Sucharrangements must, however, be laid down in writing by the owners or joint-owners andlegalized before the village head concerned. Payments under the above arrangementfollows a special scale as below:
}

184
1 2 3Description Basic yield in Bonus per qtl crystal sugar inof cane crystal sugar excess of basic yield in column 2
per hectare
Milling cane a. Irrigated land 18 % of average price per qtl95 quintal crystal sugar ex godown sugar
b. Irregularly irrigated mill under officialland 70 quintals price regulation
Ratoons a. Irrigated land 22%, of average price per qtl70 quintals crystal sugar ex godown sugar
b. Irregularly irrigated mill under officialland 60 quintals price regulation
This bonus is paid out as soon as the following data have become known: caneyield of the land rented per ha; sugar content of the cane; average price per quintalcrystal sugar ex godown mill under the official price regulation.
According to returns of the Central Bureau of Statistics, about 144,216 tons netwere sold for export in l957, while about 694,440 tons were set aside for home con-sumption, 272,900 tons out of this total being a carryover from 1956 crop. The monthlyaverage for home consumption may therefore be computed at 57,870 tons gross—a rise
}}

185
by 7.5% (4,060 tons) as compared with the foregoing year. The anticipated decrease ofcane sugar consumption did not come true, though a decline in consumers’ demandbecame noticeable in July, August and September under the impact of the price advancedue to increased excise duty. When, however, adjustments had been made in the wagesector, consumers’ demand for cane sugar rose again and returned to normal in thefollowing months.
The home price for sugar, lastly fixed at Rp 271.50 and Rp 261.50 per quintal byN.I.V.A.S. in the foregoing year, for S.H.S. and H.S. respectively, was raised to Rp 370and Rp 360 due to excise duty being advanced from. Rp 0.27 to Rp 1.27 per kg, on June24, 1957.
As table 69 shows, exports dropped off in 1957 as compared with the foregoingyear. Hongkong was the chief buyer (18,300 tons, against 7,800 tons in 1956), Singaporetook second place with 17,100 tons, against 1,700 ton ; in l956. Exports to Japan, theChinese People’s Republic and Burma slumped, while Thailand did not import at all. Onthe other hand, Syria, the Lebanon. Manchuria and Korea appeared as new and substan-tial buyers.
World sugar production for 1957-1958 rose by 2,058,000 tons gross as comparedwith 1956/1957. World sugar consumption was also up, namely by 842,000 tons gross.

186
The world market price for sugar, steadily on the increase since November 19, l956(from U.S. $ cts 3.80 to U.S. $ cts 4.05 per lb f.o.b. Cuba), continued its upward trend andstood at U.S. $ cts 6.85/lb f.o.b. Cuba on April 22, l957. Since then prices have droppedto U.S. $ cts 3.85/lb f.o.b. Cuba at the end of the year under report. The followingadditional information may be given on the above price development.
Spot quotations for Cuba raws in New York, reaching a Ievel of U.S. $ cts 4.90/lbper the end of 1956, tended upward during January/February 1957 and moved betweenU.S. $ cts 5.10 and 6.38/lb f.o.b. Cuba. This upward movement was explained by mark-edly increased demand from many countries and by reports about negotiations betweenCuba and U.S.S.R. for Soviet imports of 200,000 tons of Cuba sugar. This high level wasmaintained in March/June with prices moving between U.S. $ cts 5.72 and U.S. $ cts6.85/1b f.o.b. Cuba. The height of that period—U.S. $ cts 6.85/lb f.o.b. Cuba—wasattributed to extra purchases of raws by the U.S.S.R. totalling 150,000 tons. Later on,due to cheap sugar being offered by Brazil and under the influence of the Europeanbest sugar crop, the price collapsed and a price level of U.S. $ cts 3.75 per lb f.o.b. Cubawas reached on August 19, 1957.

187
As sugar prices dropped, Cuba speculators made extra purchases of Brazil sugar tothe volume of 120,000 tons on August 21, 1957. Since these extra purchases would havea price-enhancing effect helpful in stabilizing world prices, the Cuba Sugar StabilizationInstitute aided speculators. In a further attempt to stabilize sugar prices, the Cuba Insti-tute transferred 200,000 tons of Cuba raws from the free world market quota for 1957to the United States reserve quota for that year. Since then, world prices for sugar movedup again to October 1957, between U.S. $ cts 4.02 and U.S. $ cts 4.75 per lb f.o.b. Cuba.However, stabilization attempts fell short of expectations and a drop set in movingbetween U.S. $ cts 3.50 and 4.03 up to the end of December 1957. The price advance toU.S. $ cts 4.03 was to be ascribed to political developments in Cuba.
In its meeting of January 29, 1957, the International Sugar Council resolved thatthe export quota for 1957 (previously fixed in the meeting of December 14, l956) wereto become inoperative as from June 25, 1957. This in connection with the amendedConvention which makes maintenance of quota dependent on the average spot price

188
for raw sugar being quoted at U.S. $ cts 4/lb f.a.s. or less, or U.S. $ cts 3.90 or less for 17consecutive days. Further, the amended Convention fixed Indonesia’s export quota for1957 at 350,000 metric tons, while Indonesia shared for 50,000 metric tons in the specialreserves for 1958. The Government decided on August 30, 1957 to take part in theInternational Sugar Agreement.
Under the Amended Convention, the International Sugar Council announced onNovember 12, l957 that, the average spot price for raws in New York having beenquoted at U.S. $ cts 4 per lb or less for 17 consecutive days, member countries were onlypermitted as from November 13, 1957 to, buy sugar from non-member countries up tothe volume bought in any one year between l95l/1953.
On November 18, 1957 it was announced that, the spot price as above having beenless than U.S. $ cts 3.90 for 17 consecutive days, the export quota provisions—whichhad been inoperative since January 25, 1957— automatically came into force again asfrom November 19, 1957.
The Statistical Committee estimated free world market requirements for sugar in1958 at 5,515,000 metric tons, against the estimated requirement of 6,240,000 metrictons at the beginning of July 1957.
Tea
Tea production in 1957 totalled 46,740 tons, an increase by 8.8%, (3,809 tons) overl956. The tea estates in Djawa primarily accounted for this increase, their productionrising by 8% (2,657 tons) over 1956. Production in the tea producing regions outsideDjawa also showed an improvement by about 10%, while smallholders’ tea was alsolarger though not greatly more than in 1956 (2 %) . This favourable development wasascribed to more favourable weather conditions and the improved labour situation.
As table 72 shows, the total export volume increased by 1,231 tons (3.5%) whileproceeds rose from Rp 336.6 million in 1956 to Rp 340.4 million in 1957. In l957,Holland was still the leading buyer of Indonesian tea 14.968 tons net—Rp 148 million).Other major destinations were the United Kingdom, Australia and the U.S.A.

189
Price development on the world market shows the following picture: Good m.B.O.P. quality quoted Rs 2.85/lb in Colombo at the beginning of 1957; the price slumpedand stood at Rs 1.45/lb in May; a change for the better occurred in September when theprice rose to Rs 2.l5/lb; at the end of December the price was down again to Rs 1.75/lb.
The Djakarta price for Good m. B.O.P., quoted at Rp 10.— per I/2 kg at the endof 1956, continued to edge down in 1957 and reached a low in June with Rp 6.40 per l/2 kg. Subsequently the quotation edged up again to reach a high in November with Rp11.— per 1/2 kg, followed by a drop to Rp 9.50 per 1/2 kg at the end of the year.
Over-supply on the London market accounted for the lower level of lea prices onthe Continent throughout 1957. In fact, tea supplies in London were the largest onrecord since World War II. This glut in the market was caused by the fear of short-supply, due to the outbreak of the Suez crisis at the end of 1956. The temporary priceadvance in the 4th quarter is explained by labour difficulties, the suspension of teashipments from Ceylon and concern over developments in Indonesia and the possibilityof impeded shipments from this country.
Coffee
In 1957 the production of estate grown coffee totalled 14,852 tons or 14% morethan in 1956. This increased production only applied to estates in Djawa, but did notoccur in the Outer Islands. The average monthly estate production rose from 1,060 tonsin 1956 to 1,230 tons in 1957.

190
As table 73 shows, the production of smallholders’ coffee rose by 5,000 tons or9%. In contrast with estate coffee, the increased production of smallholders’ coffee wasto be attributed to Sumatra, where output rose from 40,000 tons in 1956 to 45,000 tonsin 1957 (+ 12.5%). This increase—the largest since 1950 was attributed to exceptionallygood crops in the Lampongs and in the Palembang region.
The overall volume of coffee exports dropped by ll%, while proceeds dropped by3% (Rp 342.6 million in 1956 to Rp 333.5 million in 1957). Of the overall proceeds Rp240 million consisted of smallholders’ coffee and Rp 93.5 of estate coffee (smallholders’coffee 40,425 tons— estate coffee 11,500 tons). In comparison with 1956, volume andproceeds of smallholders’ coffee dropped by 14% and 6% respectively. Estate coffee,however, rose in volume by 8.5% and by 7.5% in proceeds. Smallholders’ coffee madeup 79% of the volume and 72% of the proceeds in 1957 ; the corresponding figures for1956 were 82% and 75%.
Italy was the main destination of coffee exports in 1957 (15,128 tons), withSingapore—the main destination in 1956—taking only 10,306 tons The New York mar-ket price for coffee remained on the same level as 1956 in the first few months of 1957,that is, about U.S. $ cts 58.30/lb. The highest price, U.S. $ cts 64/lb, was quoted in themiddle of May. From that time onwards prices edged down steadily to reach a low ofU.S. $ cts 49.25/lb in the beginning of October. Since then there has been some recov-ery and the price stood at U.S. $ cts 55.95 in December 1957.

191
Domestic price development was entirely different from price movements in theworld market, prices at home steadily rising. Standing at Rp 725 per quintal at the begin-ning of the year, coffee prices climbed to Rp 1,300 per quintal in the middle of June,while the quotation was Rp 1,850 per quintal at the end of December 1957. The mount-ing discrepancy between domestic and world market prices was one of the principalcauses for the drop in coffee exports in the year under report.
Cocoa
Cocoa production in 1957 dropped by 151 as compared with the precedingyear. The volume of exports amounted to 487 tons, representing a fall by 55 tonscompared with l956. Exports were made up of cocoa-beans (469,892 kg—Rp4,024,292) and cocoa-powder (17,488 kg = Rp 57,679).
Overall proceeds were about Rp 4.1 million, against Rp 3.8 million in l956.The world market quotation for Bahia cocoa, averaging U.S. $ cts 55.7/lb in 1954,has been dropping steadily, reaching a low of U.S. $ cts 20 per lb in the middle of1957.
In view of the excess of world production over world consumption, there isbut small hope that cocoa prices will improve markedly in the near future.

192
Tobacco
The year under review showed a marked improvement both in the extension of theacreage in tobacco and its yield, as compared with the foregoing year. The area undersmallholders’ tobacco was larger by 2,600 ha (65%) per the end of December 1957 (therespective figures for 1956 and l957 are 4,000 ha and 6,600 ha). Extension was reportedfrom Bodjonegoro, Besuki and Kendal, while in the last mentioned region rice growingseems to be giving way to the cultivation of Virginia tobacco. The overall area insmallholders, tobacco in Djawa and Madura rose from 143,000 ha in 1956 to 166,000 hain l957—an increase by 16%.
Weather conditions appear to have favoured standing crops during the year, withthe exception of Bodjonegoro where 30% of the growing crops were destroyed byfloods.
In Besuki residency smallholders and foreign-owned estates cooperate in tobaccogrowing, the principal estates being: Landbouw Mij. Oud Djember (L.M.O.D.);Besoekische Tabaks Mij. (B.T.M.); Adjung-Sukokerto, Soekowono and Djebluk. Theestates grow about 5,000 ha of tobacco a year, L.M.O.D. being the largest. The estatesrent their land to smallholders and supply them with seed, the crops being sold by thesmallholders to the estates. Also the crops from people- owned land are sold to theestates.

193
Virginia was again favoured this year, in view of the increasing demand for thisvariety and the added advantages of easy cultivation and processing. The cultivation ofthis variety is encouraged in several regions, including East Djawa, Central Djawa andSouth Sulawesi. A production of 1 5,000, 40,000 and 10,000 bales is looked forward tofrom the 3 regions mentioned, the figure for South Sulawesi including the productionplanned for Bali and Lombok.
The volume of tobacco exports rose to about 14,223 tons net valued at Rp 382.8million against Rp 331.8 million in l956. The bulk of Indonesian tobacco exports wentto the Netherlands (13,421 tons—Rp 355.4 million), the Netherlands being the tradi-tional tobacco market for the Continent of Europe, auctions being held twice a year.The leaf put up for auction is from Sumatra (Deli) which is favoured by cigar makers aswrapper material, while Djawa tobacco (from Besuki, Jogja, Lumadjang, Rembang, Keduand Banjumas) is preferred as a filler for cigars. The principal export centres for tobaccofrom Djawa are Surabaja, Semarang, Probolinggo and Pamanukan.
Indonesia tobacco has a good reputation in the world market and with a view tomaintaining quality and increasing output, the Smallholders’ Agricultural Service is ac-tive in making recommendations to growers on improved methods of cultivation andprocessing. These activities have proved successful since the proportion of tobaccounsuitable for export was only 4 to 5%, against 30% in l956.
Thanks to this advisory service, processing by smallholders was aimed at the pro-duction of ‘Hang Krosok’ in cooperation with national tobacco traders, while in 1956they mostly concentrated on ‘Kampong Krosok’, an inferior quality of Djawa krosoktobacco. The drive for improved quality Krosok included auctions and tests as well asthe supply of chemicals against tobacco pests. Concerted efforts were also made toimprove the quality of Virginia. The export programme for 1958 is 134,929 bales whichvolume would swell to 147,429 bales if the stocks now in the hands of the Besukismallholders were also made available for export.
The first drying-house for Virginia provided with imported equipment has beeninstalled in Central Lombok; ten additional drying houses have been planned for thisisland in 1958.

194
Spices
The export volume of Pepper dropped by 11%. in 1957 after a rise by 41% in l956.Exports of white pepper totalled 9,485 tons with a value of Rp 60.1 million; blackpepper totalled 8,071 tons at Rp 33.9 million. The chief export destinations wereSingapore (8,046 tons—Rp 46.5 million), the United Kingdom (5,l59 tons—Rp 46.5million), and the U.S. (2,393 tons— Rp 10.1 million). The Singapore price for Muntokwhite pepper was Str. $ 127 per picol at the beginning of January 1957 and Str. $ 94 perpicol at the beginning of December 1957, those two prices being the highest and thelowest for 1957. The corresponding prices for 1956 were Str. $ 142 and Str. $ 125; thelowest price for 1956 was Str. $ 88/picol per ultimo May 1956. The weakness of pepperprices made smallholders especially in the Lampong; region switch to cloves and coffee,which sell at better prices.
The export volume of nutmeg and mace dropped from 4,474 tons in 1956 to 3,027tons in 1957—a fall by 1,447 tons or 32%. Owing to better market prices in 1957 pro-ceeds were 98% higher: Rp 69.2 million in 1957' against Rp 34.9 million in 1956. As inthe previous year, Singapore and the Netherlands were the principal buyers.
Cassia exports totalled 6,400 tons in 1957 at a value of Rp 13.6 million, comparedwith 6,443 tons in 1956 valued at Rp 14.3 million— a drop in volume by 1% and inproceeds 5%. The bulk of the cassia exports went to the Netherlands—4,911 tons at Rp10'.5 million.

195
The production of cloves in 1957 left much to be desired. While domestic demandamounts from 8,000 to 10,000 tons a year, domestic production is only from 2,000 to3,000 tons. Almost 40% of overall production comes from Sumatra. To meet the short-age cloves were imported from Madagascar and Zanzibar.
Mining
Oil
Crude oil production has been steadily increasing since l951 and rose by 2,738thousand tons in 1957, the steepest rise since World War II. In the period under review

196
imports and exports of crude oil went up by 713,000 tons and 2,539 thousand tonsrespectively. Imports of oil products increased by 234 thousand tons, while exports ofoil products dropped by 472 thousand tons.
Consumption of gasoline and kerosene dropped by 163.7 million litres and 111.1million litres respectively in 1957. Consumption of diesel oil, in contrast. was very highin 1957, namely, 2,292 million litres against 1,547 million litres in l 956.
Tin
Tin production dropped as compared with 1956 (from 30,053 long tons to 27,794long tons). Production originated from:
Bangka approx. 17,300 long tons,Bilitung approx. 9,000 long tons,Singkep approx. 1,400 long tons.
Explorations have shown that deposits of undeveloped ore are sufficient for de-cades to come. Tin ore deposits are found in: the island of Bangka, the island of Bilitung,the island of Singkep, the island of Karimun, the island of Kundur and the Bangkinangarea (West Sumatra).

197
As from March 1, 1958, the Bilitung tin enterprise will be worked by the Govern-ment, previously the enterprise was run by a private Company in which the Governmentshared for 62 l/2 %.
Besides exported tin is also consumed locally and this domestic consumptionamounted to approximately 460 long tons in 1957.
Exports of tin ore amounted to 26,878 Jong tons in 1957 against 31,159 long tonsin 1956.
International Tin Council daca show world tin production to have dropped in l957as compared with 1956 (from 175,500 long tons to 173,500 long tons) due to the reced-ing production of Malaya and Indonesia. Malaya leads in tin production, Bolivia takessecond place. Last year Indonesia occupied the second place.

198
World commercial consumption of tin also fell from 160,000 long tons in 1956 to157,400 long tons in 1957.
World tin prices had a downward tendency in the first 11 months of 1957. Thelowest quotation for 1957 was £ 730.5 per long ton. In December the price rose to £731.5 per long ton. The downward trend on the world market, so it was stated in themeeting of the International Tin Council held in London on October 28 1957, wascaused by a surplus of about 7,000 long tons.
Other Mining Products
Besides oil and tin, this country also produces: bauxite, coal, iodine, manganese,nickel, gold, silver, platinum, copper, sulphur, mercury, phosphates, asbestos, etc.
Production and exports of bauxite decreased in 1957 as compared with 1956, al-though 1957 exports exceeded 1957 production, owing to a carry over from l956.
Coal production totalled 714,000 tons against 829,000 tons in 1956, originating from:
the Umbilin mines (West Sumatra) 90,000 tonsthe Bukit Asam mines (Tandjung Enim) 554,000 tonsthe Muara Bakah mines (Barito area) 4,000 tonsthe N.V. Sebuku mines (Samarinda) 60,000 tonsthe Loa Bukit mines (Samarinda) 6,000 tons
Total 714,000 tons
Iodine production was steadily on the increase amounting to 1,607 kg in 957 against1,216 kg in l956.
Further Manganese deposits were found in the Kalipare area (South Malang) . It isestimated that 2,000 ha in Kaliredjo and 9,000 ha in Putoredjo bear manganese, and themanganese deposits in the two villages have been worked since August l957.

199

200
Industry
The Ministry of Industry set up in March 1957 under the “Karya” cabinet, hasdrawn up an industrialization plan covering three kinds of activities:
a) a regional plan envisaging the establishment of industrial enterprises suited toregional conditions;
b) industrial enterprises falling within the competency of various Ministries will beplaced under the Ministry of Industry;
c) implementation of overall planning coordinated by the State Industrial Council.
Industrial enterprises set up by the Government are the cement factory at Gresik,the spinning mill at Tjilatjap, the glass works at Surabaja, the gunny bag factory at Surabaja,the hardboard factory at Banjuwangi, the rami spinning mill at Pematang Siantar,the”Intyrub” tyre factory at Tjililitan (Djakarta) and the “Tjemani” printing ink factoryat Djakarta. Further industries to be inaugurated include a hardboard factory in NorthSulawesi; and a tyre factory at Palembang.
The Government is also giving attention to establishing medium-sized industriessponsored by Bank Industri Negara and the Institute for Establishing Industries (LembagaPenjelenggaraan Perusahaan2 Industri). Medium-sized industries aim at filling immedi-ate needs, such as building supplies, iron forgings, textiles, ceramics and the like. Theidea is that such industries, once they have been placed in operation, should be trans-ferred to private entrepreneurs —65 projects in this field have been set up and part ofthem sold to private nterprises.

201
Small-scale industry also has the attention of the Government, and in this field tileand brick works, tanneries, saw mills, tapioca and other factories have been built with aview to transferring them to the local populations.
The fish canning project undertaken with I.C.A. aid was completed ar Golala (Am-boina) in October 1957. A start was made with a trial production of about 150 cans of265 grammes each. Working at full capacity the plant should be capable of producing stons or about 10,000 cans daily. The fish processed is the tuna, which has abounded inthe seas around Maluku from time immemorial.
The iron foundry centre at Batur (Surakarta) is in the course of completion andexpected to start production in the course of 1958. The construction of this centre hasinvolved an outlay of Rp 4 million and was undertaken by the Institute for EstablishingIndustries. The Batur area now counts at least 39 iron foundries producing machinery,and articles for household use, flatirons etc. Plans are to transfer the centre to the localiron founders associated in a cooperative society which is to pay off the cost of con-struction in instalments.
On the whole, the index numbers for imported raw materials show an increase in1957. Declines are to be noticed in the case of cotton weaving yarns, cambrics, cloves

202
and cement. The drop in imports of industrial materials such as cement and cottonweaving yarns did not entail grave difficulties since domestic spinning mills and cementplants are coming into production. Kretek and batik works were hard hit by inadequateimports of cloves and cambrics. The Association of Indonesian Batik Cooperatives isplanning a cambrics weaving mill at Jogjakarta at a cost of Rp 120 million, the capital tobe provided by obligatory savings of the members of the Association. Show supply ofcloves compelled several kretek factories to close or to reduce operations.
On the whole the production of ready-made textiles dropped in l957 as shown by the figuresfor sarongs and towels, on the other hand “sundries” showed a rise. Compared with 1956 the useof yarns showed a slight increase, while the number of mills in operation decreased.
The present annual report no longer expresses the capacity of rice mills in h.p. asin foregoing years, but in numbers of tons produced in 7 working hours. The capacityfigures returned On March 1, 1957 in the case of Djawa and on July 1, 1957 :for theother regions are basic to the capacity figures as above. As regards rice milling licensesfor Djawa, it may be noted that they are either temporary or permanent. Temporary arethe licenses issued before Government Ordinance No 42/l 954 became operative, whilethe licenses issued under the provisions of this Ordinance are permanent. All licensesfor mills outside Djawa are permanent.

203
The Capacity of spinning mills is no longer expressed in spindles, the unit em-ployed in foregoing annual reports but in spinning machines. This brings the unit forspinning, mills into line with the unit used for knitting mills textile printing works andweaving mills. The other units have remained unaltered.
As illustrated in table 85, the licensed capacity of controlled enterprises generallyrose in 1957.
The Ministry of Industry revived the “Jajasan Bahan Perindustrian”, a kind of pool forthe distribution of materials needed by industries through effective and reliable channels.
The new foreign exchange system, going by the name of the B.E. system forcedprices up in such a manner that if the Government had not stepped industrial cost ofproduction would have become excessive. to meet this situation the Government setaside a credit of Rp 100 million for industrial enterprises. ln conformity with a decree ofthe Monetary Board the realization of this credit was entrusted to Bank Indonesia. Inpassing on this credit to entrepreneurs in the industrial field, the other state banks wereallowed certain facilities in rediscounting under the conditions fixed by Bank Indonesiawhile imports of essential raw materials and auxiliaries for industrial enterprises wereexempted from duties.

204
Transport
Road traffic
It is estimated that, if the system of roads in Indonesia is to be extended by 100%within 25 years, the construction of I kilometre of roadway will require on average Rp Imillion. The following tabulation shows the needs of the respective islands:
Moreover existing roads need modernization and improvement. This project willbe implemented to the extent of 100 % in the regions outside Djawa and for 33% inDjawa. The cost is estimated at about Rp 750,000.- per kilometre.
Asphalt, an indispensable material for road building, has largely been imported upto the present. To reduce the expenditure involved, endeavours have been made to ex-tend the working of the asphalt deposits on Buton Island. The working of these depos-its was in the hands of the “Mijnbouw Maatschappij Buton”, which was taken over by

205
the Government in l954. As a first step towards stepping up production, modernizationof equipment has been planned envisaging an annual production of 12,000 tons. De-pending on the profitableness of the workings, production will further be stepped up to240,000 tons annually in the second stage. As mentioned in the previous Report anannual production of 12,000 tons was achieved in 1956.
In Djawa, roads are generally metalled and asphalted for the greater part. Roadconditions in the other regions, however, are quite different. Most of these are onlyearth roads, and for this reason the road modernization project lays its stress on theislands outside Djawa.
The road construction and improvement project for South Sumatra— comprisinga road system about 7,200 km in length—has been implemented to the extent of 50%.The entire project is expected to be completed in the not too far distant future. Further,two concrete bridges connecting Tjurup and Kepahjang are to be built to rehabilitatecommunications in Bengkulu, while the construction of the bridge connectingTeraskundjang and Air Bengkulu is underway. An initial outlay of Rp 5 million has beenmade for the implementation of these reconstruction projects.
The construction of a bridge over the river Musi is also in the course of prepara-tion. This large-scale project to be carried out in constructional steel, will be 400 X 20 mwhile the floor of the bridge will be 7 m above the surface of the river. This project ispart of the Government 5-year plan and is expected to be completed in 1962.
The construction of 350 km of highway to connect South Kalimantan with SouthEast Kalimantan is also lacing planned. The Ministry of Communications and Powerhas earmarked Rp 6.1 million for road construction throughout East Kalimantan, in-cluding the building of a road from Sambodja Kuala to Muara—the link-up between theBalikpapan-Sambodja highway and the road from Muara Djawa to Samarinda direct.
In North Sulawesi. priority is given to the construction of roads connecting Menadowith the “kabupaten” of Mongondow, Gorontalo and Poso, and leading on to Donggala.This connection will be of great importance for the Miangas district as far as Donggala,which constitutes one economic unit.

206
Under the Colombo Plan, Australia is to deliver 600 diesel buses: 200 for Djakartaand 400 for other cities. Since the spares and accessories of the buses are different fromthose of other makes, while this type of vehicle is a novelty in lndonesia, Australia willfirst send l00 buses oy way of trial. Out of these l00 buses, 75 have arrived and 54 havebeen put into operation. The Djakarta transport Coy (Perusahaan Pengangkutan Djakarta)intends to extend its routes but cannot as yet carry its plans into effect in view of thepresent condition of the roads. which are too narrow.
From I.C.A. aid US$ 8 million was received in the beginning of 1958, and is beingutilized for the construction of a 400 km road between Tarutung in the Tapanuli areaand Bukittinggi in West Sumatra, a project that will take about 3 years to complete. Thisroad will be asphalted and will have a width of 7,5 metres. When completed, it will bethe longest road of that width in Indonesia. To speed up construction, work will bestarted from both terminal points Bukittinggi and Tarutung
Railways
In contrast with the foregoing years, the Railways experienced a change for theworse during the year under report. Figures for 1957 are available only for the periodJanuary/November included but on an annual basis they show that passenger trafficedged up in comparison with 1956, while goods traffic dropped. The Ministry of Com-

207
munications reported on March 29, 1957 that the working loss of the State Railways isestimated at Rp 26 million. This is ascribed to reduced frequency of train services due tolack of coal; security conditions which necessitated the closing down of several routeseither temporarily or for longer periods; floods which caused landslides; multifariousnew rules and regulations and other conditions which forced working expenditure upbeyond the estimates for the year.
Working results in Djawa and Madura were fairly satisfactory. Improvements inDjawa were aimed in the first place at rehabilitating and extanding the main line. renewalof rails and replacement of old locomotives by diesel engines wherever possible. In theyear under report Djawa had 35 diesel and 60 dieselhydraulic engines at its disposal.
In Atjeh (North Sumatra) improvemets were carried into effect in various fieldsfrom the beginning of l957. The line Kutaradja-Seulimeuen could be travelled twice aday as from February l, l957. The line Sigli-SamalangBireuen is open to traffic threetimes a week’ old railway tracks have been relaid and stations rebuilt.
ln South Sumatra 250 tons of gauge-14 rails—out of a total of l5,000 tons orderedfrom the U.S. — have arrived for the improvement and renewal of railway tracks. Prior-ity is given to the tracks of the Kertapati—Tandjung Enim line, where traffic is veryheavy. Furthermore, South Sumatra is to receive 25 locomotives, which will be put intoservice when the new rails have been laid.
Furthermore, the State Railways envisage a 25-year modernization plan. The Gov-ernment has no definite plans yet for the nationalization of the Deli SpoorwegMaatschappij. To fulfil the need for supervision, the Government has set up a supervi-sory board as a first step towards nationalization.
Shipping
The K.P.M. fleet of 74 freighters (totalling 116,516.68 GRT) and 26 passengerships (totalling 78,464.33 GRT) ceased its interinsular operations as from December 6,1957. This gap was partly filled by PELNI and other national shipping companies with37 vessels (36,843.35 GRT) and 36 vessels (l7,899.64 GRT) respectively. The laying-upof K.P.M. vessels reduced overall interinsular tonnage (249,724 GRT) by 78%. To fill

208
this vacancy, 16 Hongkong vessels were chartered by PELNI for service in the easternpart of Indonesia. Furthermore, 10 ships were bought by the Government from theU,S.S.R.
As stated in the foregoing annual report, the expansion of national shipping byabout 150,000 tons over a period of l0 years to replace foreign shipping, is part of theGovernment 5- year plan.
Construction and extension work in several of the main ports such as TandjungPriok, Balilipapan, Belawan, Semarang and Bandjarmasin, was entrusted to the CompagnieIndustrielle de Travaux (Citra) on February 11, 1956, which has now been taken in handenergetically. This project, estimated at Rp 200 million, is expected to be completed in1960. Furthermore, the port of Kalianda (South Lampung), closed since World War II,was reopened on January 14, 1958. For port facilities and equipment at Bitung Rp Imillion has been set aside, Bitung being an important centre for shipment of producefrom the interior.
Airways
As table 87 shows, Garuda Indonesian Airways flew 5% more kilometres duringthis report period, while goods and passenger traffic rose by 0.58% and 5% respectivelyas compared with 1956.

209
This increase was caused by alteration of and/or more frequent air services, as well asthe re-establishment of routes which had been discontinued due to regional conditions. Theservice Surabaya-Balikpapan-Menado was opened mid February with a frequency of oneflight a week, while the connection Pakanbaru-Tandjungpinang was opened the followingmonth. A new air field near Gorontalo was put into commission in June, so that the firstflight between Gorontalo and Menado was made in that same month. An informationoffice was opened in Manila with a view to giving wider publicity to G.I.A. activities abroad.In July six flights were made between Djakarta and Djeddah by Convair-340 to carry a totalof 240 pilgrims. So as to meet its steadily mounting operating costs owing to the ExportCertificate system which raised expenditure on imports of goods and services from abroad,G.I.A. raised its fares by 30% as from September 2, 1957.
Plans are afoot for extending air services both at home and abroad. AMakassar-Djakarta service via Bandjarmasin will be started with a frequency of fourflights a week. Other routes to be opened are Makassar-Menado, Makassar-Ambon,Makassar- Gorontalo via Menado, Makassar-Maumere-Sumba and Den Pasar. The routeMakassar-Menado will be flown daily, Makassar-Ambon twice a week, while the otherlines, to be flown by Dakotas, will have a frequency of once a week.
The foreign routes will be extended by introducing a service to Rangoon (Burma)and Calcutta (India) by way of Singapore, while on the flights Djakarta-Bangkok a stopwill be made in Kuala Lumpur.
The composition of the G.I.A. airfleet underwent changes by the total withdrawalof Herons, while orders for new aircraft were placed, including 3 Convair-440 (arrivedin January 1958) and 3 turbo-prop Lockhead Electras (to arrive in 1960). For the rest thefleet is made up of: 8 Convair-340, 8 Convair-240; and 20 Dakotas. The flight personnelconsisted of 68 pilots, 5 air mechanics, 16 flight radio operators, and 86 stewards andstewardesses, all Indonesian nationals. Likewise, all local and foreign agencies of G.I.A.are staffed by Indonesians.
From January 26, 1958 to the end of February a number o£ 296 persons, belong-ing to the foreign personnel of G.I.A. among whom 65 pilots, gradually left Indonesia,causing G.I.A. to reduce its flight operations by 40 %. To make up for this shortageIndonesia personnel from other services are being trained

210
Prices and wages
Prices
Table 88 shows that the weighted index numbers of 12 foodstuffs in the country-side of Djawa and Madura dropped in the first 6 months of 1957 as compared with theend of 1956
Since the end of June, however, the index numbers steadily mounted till the endof the year. Marked increases were registered in the 4th quarter as the index numbersper the end of 1957 shows. In fact the index numbers at the end of the year were thehighest since 1953—namely, 250 or a rise by lOO% compared with end l956. The higherprices for rice which started since June 1957, were the prime movers in this upwardtrend, sweeping the other prices for foodstuffs along with them.
As regards the weighted price index numbers of 19 foodstuffs for several cities,the index in the first quarter 1957 was practically stable for Djakarta and Makassar whilea downward trend was noticeable for Pontianak and Medan. In the second quarter theindex showed an upward tendency for Djakarta and Makassar and remained stable forMedan. In the remainder of the year the index rose for Djakarta, Medan and Makassar

211
(the figures for Pontianak are not yet available). The higher price for rice was again theprime mover for this development in the index number for 19 foodstufts. which showeda height at the end of December 1977. Yet, although Medan—and the other towns—showed a higher index as per the end of 1957 than in the preceding year, the averageindex for 1957 was still lower than that for the previous year.
As table 89 shows, the weighted index number of the f.o.b. price of 18 exportproducts showed a downward trend in the course of 1957.
On the whole, the prices of 44 import commodities were steadily on the increasein the year under report, the greatest increase being registered in the third quarter, asdemonstrated in table 89. The average for 1957 was 22% higher than for l956. The indexnumbers per December 1957 stood 45% higher than that per December 1976.

212
Compared with the end of 1956 printed shirtings rose by 52%, years by 51% andstriped twills by 35%, while salted fish was up by l8%. Rice increased by 80%, maize by86%. So it would seem that the terms of trade favoured the farmers.
As regards the development of prices of other export products, coffee and rubber werecontinuously on the increase from February till the end of 1957. Copra and sugar were stable in thefirst 6 months of 1957, while afterwards sugar—as has been periodically the case at the beginningof the third and fourth quarter of previous years—- showed increases and copra climbed steadilyfrom August till October 1957. Domestic wholesale prices of several products were up in theperiod June through August 1957, the average price level being higher than in 1956, with theexception of citronella oil and tapioca flour.

213
At the end of the year under report tea was up by 11% compared with the end of1956, Robusta coffee by 149%, cassava flour by 7%, kapok by 10%, white pepper by35%, rice by 148%, rubber by 30%, and maize by 110%
During January and February 1957, curb market prices of foreign currency did not show anyappreciable changes as compared with the end of 1956. From March till the end of August priceswere higher all-round and after a drop in September prices did not drop significantly till the end ofNovember. A sudden change occurred in December and among the enhancements of all foreigncurrency the Dutch florin showed the highest rate, namely by 40%.
The curb market prices for good did not fluctuate appreciably in the 1st quarter1957. In April and May prices scared and after settling down in June, shot up in July atthe greatest rate of the whole year. After a drop in August, the gold price remainedstable up to the end of November. At the end of December the price rose by Rp 5 (toRp 70 per gramme), the highest year-end level since 1952.
Wages
Minimum daily wages in the various industries in Djawa generally rose at the begin-ning of 1957 as compared with the same period of 1956, as the figures in table 91 show.

214
This rise in wages was primarily caused by demands for wage increases due to therising cost of living in 1957 as compared with the preceding year.
As table 92 illustrates, the absolute wage level in the Estate Agriculture sector inDjawa and South Sumatra (figures covering nominal wages are as yet unavailable) rose atthe end of 1957 as compared with the corresponding period in 1956. The steepestincrease was seen in the sugar industry in Djawa.

215
Although in South Sumatra (unlike in Djawa) absolute wages in money did notchange at the end of the year under report as compared with the end of 1956, theabsolute wage level in Djawa was still lower than in south Sumatra. Demands for higherwages due to advancing prices of daily necessities is not uncommon, if considered fromthe viewpoint of improved conditions for labour only. As pointed out in the precedingAnnual Report, however, tension between wages and prices will continue and will boostthe inflationary tendencies created by the Government budgetary deficit and other causes,if such wage increases are not attended by increased productivity so as to restore thebalance.
It is obvious that discrepancies between the level of wages and the level of produc-tivity cannot be tolerated since this will cause domestic price levels (incl. the price ofexport commodities) to rise, thereby weakening the competitive position of this coun-try in the world market.
The regulations issued by the Government and the Military Authority in the yearunder report (covering wage increases and prohibiting strikes) may be helpful in stem-ming the difficulties referred to above due to Ieapfrogging wage demands.
It is to be hoped that the better labour relations in 1957 (as compared with theforegoing year). due to better understanding between trade unions, federations of in-dustries, the Government and the Military Authority may continue.
Labour affairs
Labour legislation
The act to supersede Emergency Act 1951 No. 16 concerning settlement of labourdisputes - whose enactment has been deferred for several years— was a last ratified byParliament on March 13, 1957, and promulgated as Act No. 22 of the year 1957, onApril 8, 1957. After wards revisions
were made and on August 10, 1957, ratified and promulgated as Act 26/l957 underthe name “Act to revise the Act on the Settlement of Labour Disputes”. Under thisrevision the words: “a representative of the Ministry of Economic Affair”, were revised

216
to read: “a representative of the Ministry of Industry”, and the words. “a representativeof the Ministry of Communications” were revised to read: “a representative of theMinistry of Communications or the Ministry of Shipping’’, the Consideration beingthat the alteration in the composition of the Ministries requires supersession of therepresentatives of the Ministry of Economic Affairs and of the Ministry of Communi-cations as members of the Central and Regional Committees for the Settlement ofLabour Disputes.
On November 18, 1957. Government Ordinance No. 50, 1957 concerning therepeal of Government Ordinance No. 63/1951 and the enactment of the rules andprocedure for the Central Committee for the Settlement of Labour Disputes was rati-fied and promulgated. On that same day, Government Ordinance No. 5l/1957 (con-cerning the appointment and discharge of the Chairman, Members and Alternate Mem-bers of the Central Committee for the Settlement of Labour Disputes) was also ratifiedand promulgated.
The draft Bill on the Employment of Foreign Workers was ratified by Parliamenton October 4, 1957, with a few amendments. Seeing that the implementation of this Actand the provisions it contains relate to the activities of other Ministries, a Committeefor the Preparation of an Act on the Employment of Foreign Workers was set up byDecree No. 13/1957 of the Minister of Labour. The terms of reference of this Com-mittee are to submit proposals to the Minister of Labour on all matters relating to theimplementation of this Act. Decree No. 17 of the Minister of Labour issued on De-cember 30, 1957, deals with social security and labour welfare, and contains provisionson the granting of aid/allowances to workers and their families in case of sickness,pregnancy, childbirth, or death.
Labour Disputes and Strikes
The figures set out in table 94 show that the frequency of strikes was lower than inthe preceding year. This was mainly due to the issue—by the Central as well as by theRegional Military Authorities — of regulations prohibiting strikes, and further to Gov-ernment measures intended to adjust wage levels both for Government and privateemploy. The Government Ordinance on this subject became operative as from Septem-

217
ber 1, 1957 and provided that the salaries of the lowest-bracket Government servantswere to be raised by Rp 1 a day, while those of the middle and higher brackets were to beraised by 5 to 6% and by 3 ro 4% of the gross income respectively.
Salaries ot workers in private enterprises were to be advanced by 10% to 20%.Strikes were also related to the volume of employment (recruitment and dismissal) andwages, which rose by 34.8% and 43.2% respectively as compared with 1956. Wage dis-putes cropped up as the result of increasing prices of daily necessities, which madethemselves most seriously felt from July l957 onwards. Every rise in the prices of com-modities means lower real wages with the corollary of labour unrest and disputes cen-tering on demands for higher wages. The number of strikers (1,031,679) and the num-ber of man-hours lost in December 1957 (7,231,200) have to be considered as an ex-traordinary exception as they were the result of the 24-hour general strike launched aspart of the West Irian campaign in which all workers in Dutch enterprises took part.This strike action was followed by a succession of events in which Dutch enterpriseswere put under control and taken over by the workers engaged in them, which washalted by a directive of the Army Chief of Staff In this directive of December 13, 1957,the Army Chief of Staff in his capacity of Military Authority prohibited the taking overof Dutch enterprises by the workers engaged in them and ordered all Military Authori-ties in their respective jurisdictions to take over such enterprises on behalf of the Gov-

218
ernment with a view to keeping them in production. To deal with the problems arisingfrom the West Irian campaign, the Minister of Labour issued a Decree on December 7,1957, under which a Central Coordination Bureau was established in the Ministry ofLabour, under the Chairmanship of the Secretary General of the Ministry of Labour.This Decree also provides for setting up Regional Coordination Offices comprising thechiefs of regions/inspections/regional offices/districts and regional labour offices. Thepolicy pursued by the Minister of Labour aims at: maintaining production and servicesand, if possible, stepping up the process of production; maintaining the volume ofemployment and labour conditions; maintaining good relations between labour and man-agement with a view to mutual understanding and cooperation.
The sectors that suffered most from labour unrest were still: industry, agriculture,cattle breeding, forestry and fisheries. A classification by regions shows that Medan,Surabaja and Semarang recorded the greatest number of disputes, North Sumatra andEast Djawa being the important plantation areas and Central Djawa having the greatestnumber of industrial enterprises.
In the 4th quarter of l957, the Djawatan Latihan Kerdja (Labour Training Service)was two years old. In places where no Labour Training Centres have been established,the Kantor Penempatan Tenaga (Labour Offices) organize regular and incidental train-ing courses, specially designed for adults and organized to teach the trainees a trade inthe shortest possible time. In connection with the exodus of many dutch skilled labourthose trainings were seriously needed. The courses given include basic vocational train-ing in house building, metal work, motor repairs, radio & electricity, commerce, clerical

219
work, agriculture and horticulture. Labour training courses have been inaugurated at PasarRebo (Djakarta), Bandung, Singosari, Semarang, Surakarta, Jogjakarta, Lembang, Klampok(Purwokerto), Wonodjati (Singosari), while incidental courses have been instituted at Medan,Djakarta, Palembang, Makassar, Modjokerto, Surabaja. The courses are attended by the un-employed and ax-soldiers. Besides, there are special courses for workers, trained to be ironworkers, sheet workers and machinists. At Bandung there is a special course for trainingdeaf-mutes to be cabinet makers. The instructors at the Labour Training Centres are thosewho have successfully completed the course for Labour Training Instructors.
Indonesia participated in the 40th I.L.O Conference held in Geneva from 5 to 27June 1957. The items of the Agenda included the following: report of the DirectorGeneral; finance and budget; exposition of and report on the implementation of con-ventions and recommendations; forced labour; weekly rest in commercial enterprises;census and integration in free countries of the autochthonous populations as are back-ward and underdeveloped; discrimination in employment; labour conditions for planta-tion workers. The following questions were also included in the Agenda: the resolutionconcerning Article 17 of the Rules of Procedure; several proposals submited by theGoverning Body to amend the Rules of Procedure for the election of Members of theGoverning Body and the Asian Advisory Committee.
This session was of importance for Indonesia in that is was to elect the full Mem-bers of the Governing Body. For the past three years Indonesia was elected a deputymember to the said Body. However, the efforts of Indonesia to be elected a full Memberwere to no avail.
In 1957 l.L.O. supplied senior fellowships for 5 trainees in the following fields:1 trainee for employment information,1 trainee for vocational training,1 trainee for Asian legislation (administration ),2 trainees for industrial relations and wages.
Further, trainees will be sent abroad with I.C.A. aid, and under the Colombo Plan.On August 10, 1957, four leaders of federations of trade unions left for London at theinvitation of the British Government to study the labour movement in the U.K. for onemonth and to meet leaders of trade unions over there.

220
From August 26 to September 6, 1957, a seminar on Rehabilitation for Asia andthe Far East was held at Solo. This seminar, which was international in character, wassponsored by various international agencies.
The Asian Advisory Committee held its 8th session in New Delhi on November11/12, 1957. Indonesia sent to this session the delegation of Government representa-tives who also served on the delegation to the 4th Asian Regional Conference, held inthat same city from November 13 to November 26, 1957. In that same month, theGovernment sent a delegation to the Tripartite Meeting on Mines other than Coal Mines.
Indonesia also sent two delegates to attend the Seminar on Vocational Guidance,entirely at the expense of I.L.O., held in New Delhi from November 27 to December21, 1957.
Unemployment
According to data of the Employment Service, fewer people registered for em-ployment in 1957 than in the previous year. While the number of registrations in 1956amounted to 169.942 including women, registrations in the year under report onlyamounted to 152,057. Employment was found for 17,168 persons including women in1956, and for 20,235 in 1957. The emergency employment service in general work,which was discontinued in 1957, was resumed though restricted to ax- student combat-ants and invalids. The funds being exhausted, no further allowances can be paid toinvalids for whom emergency work has been found.
Cooperatives
As in the preceding year, the cooperative movement gained more and more groundin Indonesia. Due to the unavailability of figures concerning 22 Kabupatens (adminis-trative units) outside Djawa, the overall figures covering cooperatives and their member-ship were 0.3% and 3.3% lower than in 1956. According to revised returns of the Gov-ernment Cooperative Service membership totalled 1,990.4 thousand at the end of l956and 1,924.1 thousand at the end of l957.

221
The registration of cooperative societies with Government Cooperative Serviceunder the Act on Cooperatives (Statute 1949/179) section 7 paragraph 5, demonstratesthat the cooperative idea is gaining ground among the various economic sectors andSocial groups.
As from July 12, 1957 (the 7th Indonesian Cooperative Day), the training of offi-cials for cooperatives has been entrusted by the Government Cooperative Service to theIndonesian Cooperative Council. The number of permanent and mobile training coursesfor officials of cooperatives was 43 and 22 respectively as in 1956. In all, 640 courseswere held, attended by about 27,000 trainees. Cooperative societies set aside 5 % of theirnet profits to finance these courses which were slatted in l951. The Asia Foundationgranted Rp 225,000 to the government Cooperative Service for the promotion of train-ing courses, specifically for establishing a building in the Province of Nusa Tenggara asa training centre.
The capital collected by cooperative societies in the form of entrance fees, com-pulsory shares purchased, voluntary and other savings (which have the character ofdemand deposits), amounted to Rp 583 million at the end of the year under report(1956—Rp 394 million or an increase by 48%). Total turnover (including credits grantedand goods sold) amounted to Rp 3,048 million (1956—Rp 2,139 million).

222
It is as yet impossible to report the structural development of cooperatives 1957,due to unavailability of figures. From the data available it may be taken that Credit andDesa (village) cooperatives increased by ll% and 5 % respectively during last year.
The number of incorporated cooperatives rose by 53% in the year under reviewagainst 42% in 1956.
The Funds of cooperative centres (reserves, deposits and other assets) amountedto Rp 405.6 million at the end of 1957 against Rp 238 million in l956.
All figures covering 1957 are very provisional in character since the basic data forthe computation of the figures for the 22 Kabupatens outside Djawa have not yet beenreceived by the Government Cooperative Service.

222
VIII. ACTIVITIES OF THE BANK
As to the position and operations of Bank Indonesia I would, primarily refer to thebalance sheet per March 31, 1958, annexed to this Report as appendix A, to the Profitand Loss account covering the period April 1, 1957— March 31, 1958, shown in appen-dix B, and to the survey covering the principal items of the weekly abridged balancesheets, given in appendix E. The following additions and elucidations may further begiven:
Balance Sheet
Issue Department
GOLD COIN AND BULLION, BALANCES IN CONVERTIBLE FOREIGNEXCHANGE AND CLAIMS ON THE GOVERNMENT ON ACCOUNT OFGOLD DEPOSITED ON ITS BEHALF WITH I.M.F. AND I.B.R.D. Rp 464,7 20.627.10
The claim on the Government on account of gold deposited on its behalf withI.M.F. and I.B.R.D. is based on article 16 of the Bank Indonesia Act, which providesthat, apart from gold and holdings in generally convertible foreign currencies, such rightsto draw on the International Monetary Fund and the international Bank for Recon-struction and Development as have been, or will be, endorsed to the Bank by law, areincluded as reserves against the Bank’s demand liabilities.
The abovementioned holdings per March 31, 1958 were as follows:Gold coin :
16,115.358,336 kg fine at Rp 12,796.05 ........Gold bullion:
18 242.168,173 kg fine at Rp 12,796.05 Convert-ible foreign exchange balancesClaims on the Government on account of gold depositedon its behalf with:
I.M.FI.B.R.D.
Rp 206,212,931.04
Rp 233,427,696.06
Rp 25,080,000.00
Rp 464,720,627.10Total

223
as compared with (on April 1, 1957)Thus the Bank’s monetary reserves decreased by
In consequence of the Republic of Indonesia’s accession to the InternationalMonetary Fund and the International Bank for Reconstruction and Development byvirtue of Act No 5/1954, Bank Indonesia made compulsory gold deposits with theseinstitutions on behalf of the Government on April 7, 1954 in amounts of $ 15,500,030.70and $ 2,200.000.— respectively (on the basis of $ 35 per troy ounce fine). A furtherdeposit was made with I.M.F. on June 22, 1956, of which $ 11,999,969.30 could beconsidered supplementary to the compulsory gold deposit to the amount of $27,500,000.—, which makes up 25% of the Republic of Indonesia quota
So long as the legal endorsement (as provided for in article 16 of the Bank Indone-sia Act) of the right to draw on the I.M.F. and the I.B.R.D. arising from membership, hasnot taken place, and insofar as the Government is entitled to reclaim this gold which, onreceipt, will have to be re-endorsed to Bank Indonesia under article 3 of Act no 5/1954,the gold deposited is substituted in the books of the Bank as a claim in gold on theGovernment. This claim is added to the reserves held as coverage for the Bank’s de-mand liabilities as referred to in article 16 of the Bank Indonesia Act.
The aforementioned claim in gold on the Government amounted to Rp201,780,349.98 at the outset, and increased to Rp 338,580,000.— in view of the supple-mentary deposit referred to above (based on the rate of U.S. $ 1 = Rp 11.40).
Since August 1954, the Government has availed itself of its drawing rights. TheGovernment withdrew dollars from the I.M.F. transferring same to the Foreign Ex-change Fund to strengthen the Fund’s ready dollar reserves. Insofar as the amountsdrawn remained within the subscriptions deposited in gold, the claim in gold of BankIndonesia on the Government decreased correspondingly, being replaced by “Claims inrupiahs on the Government on account of payment on its behalf to I.M.F.”.
The countervalue of the above Government drawings far exceeded the subscrip-tions to the I.M.F. Consequently, the claim in gold on the Government merely com-prised the countervalue of the deposit with the I.B.R.D. to the amount of Rp 25,080,000.On the other hand the claims in rupiahs amounted to Rp 313,500,000.
Rp 518,356,456.19Rp 53,635,829.09

224
FOREIGN EXCHANGE FUND, FOREIGN EXCHANGE OF.ACCOUNT .FOREIGN EXCHANGE FUND, FOREIGN LIABILITIES
The items included under the heading “Foreign Exchange Fund, foreign exchangeaccount” represented the cash foreign exchange holdings of the Foreign Exchange Fund,calculated at the official parity rate per March 31, 1958. This heading comprised thefollowing items:
Rp 1,382,518,050.09
Rp 1,868,353,277.79
Golds and convertible foreign exchange holdings ...Other foreign exchange holdings
Rp 1,278,352,135.74 Rp 104,165,914.35 Rp 1,382,518,050.09
On March 31, 1958, the gold holdings of the Foreign Exchange Fund were nil,since all gold received by the Fund was immediately transferred to the Bank.
In consultation with the Monetary Board, the generally convertible foreign ex-change holdings of the Foreign Exchange Fund - totalling Rp 1,278,352,135.74 on March31, 1958 - were considered monetary reserves of the Bank as referred to in article 16 ofthe Bank Indonesia Act.
The items comprised under the heading “Foreign Exchange Fund, foreign liabili-ties” constituted the countervalue in rupiahs, calculated at the official parity rate rulingon March 31, 1958, of the debts of the Foreign Exchange Fund on account of credittaken up under current payment agreements with foreign countries. These items con-sisted practically exclusively of the Fund’s debts on the so-called “Large A Account”with the Netherlands Bank, the U.S. $ account with the Bank of Japan, Tokyo, and theSterling Account with the Central Bank of the Chinese People’s Republic.
The movements in the assets and liabilities of the Foreign Exchange Fund duringthe calendar year 1957 are discussed in detail elsewhere in this report, which paragraphsmay be referred to.

225
Demand Liabilities of the Bank and monetary reserves
As stipulated in article 16 paragraph 1 of the Bank Indonesia Act, Indonesia musthave reserves of purchasing power in the form of gold, generally convertible foreignexchange, or rights to draw on the I.M.F. and the I.B.R.D. This provision relates the totalamount of those reserves to the volume of currency, and supply of deposit money inIndonesia, by stipulating that monetary reserves must at least be equivalent to 20% ofthe demand liabilities of the Bank. In the relative paragraph the total amount of thesemonetary reserves is related to the volume of the currency and deposits in Indonesia.
Deviation from the above provision is provided for in article 16 paragraph 3 andarticle 22 of Bank Indonesia Act, which empower the Monetary Board to depart fromthis rule in special circumstances for a period not exceeding three months and to such apercentage as the Monetary Board may deem fit.
Under these powers, the Monetary Board reduced the minimum compulsory verycover from 20% to 15% for the period July 11,1956 to October 11, 1956 inclusive (DecreeNo 17 of July 12, 1956). This reduction was withdrawn by Decree No 22 of October 6,1956, as from October 3, 1956, while the reduced cover of I 5% became operative again forthe period January 30, 1957 to April 30, 1957 (Decree No 23 of February 2, 1957).

226
On expiry of this period the cover had not yet been restored to the prescribed 20%and an Emergency Act was passed granting exemption for the period April 30, 1957 toNovember 1, 1957 (see appendix F). A draft bill had meanwhile been submitted toParliament to convert this Emergency Act into a regular Act, which up to the presenthas not yet been enacted The deadline of November 1, 1957 being long past, the draftbill provided for an extension from April 30, 1957 to November 1, l958 inclusive.
The demand liabilities of Bank Indonesia, as specified in table 97, rose by aboutRp 7,637.0 million in the period April 1, 1957 to March 31, l958 Inclusive.
Against the liabilities of the Bank aggregating Rp 18,890,040,150.95 per March 31,1958, the Bank’s holdings on that date were Rp 464,720,627.10 (consisting of gold,generally convertible foreign exchange and claims on the Government on account ofgold deposited on Government behalf with I.B.R.D.) and as holdings of the ForeignExchange Fund in generally convertible foreign exchange stood at Rp 1,278,352,135.74;the sum total amounted to Rp 1,743,072,762.84 or 9.23%., of the aforementioned de-mand liabilities.
Of the monetary reserves to the amount of Bank’sgold holdings actually present in Indonesia amounted toClaims on the Government on account of gold depositedfor the Government with I.B.R.DGenerally convertible foreign exchange holdings of the For-eign Exchange Fund
Rp 1,743,072,762.84Rp 345,447,095.69
Rp 25,080,000.--
Rp 1,278,352.135.74
Rp 1,648,879,23 1.43
CONSOLIDATED ADVANCES TO THE GOVERNMENT Rp 3.554,947,500.--
This account was opened on July 1, 1953 under article 42 paragraph 1 of BankIndonesia Act with an initial amount of Rp 3,838 million. As regards the rate of interestand redemption the Decree of the Minister of Finance No 198989/U.M.I. of Septem-ber 17, 1954 made the following provisions:

227
a) the rate of interest is fixed at 3 % per annum;b) redemption within 40 years, reckoning from 1957c) accelerated redemption is permitted from, for instance, public loans especiallyfloated for this purpose, such extra redemption to be settled pro rata parte withsubsequent redemption installmentsd) interest and redemption payments fall due annually on March 31st at the latest.
As regards the distribution of the 3 % interest the following was laid down in theDecree of the Monetary Board Nr Sekr/D.M./257 Confidential of June 29, 1955:
l/2 % to be entered into Profit and Loss Account of Bank Indonesia;21/2% to be used to redeem consolidated advances and, for that reason, not en-
tered in the Profit and Loss Account of the Bank.
In consequence of aforementioned Decree of the monetary Board the first re-demption on consolidated advances was made on March 31, 1956 employing the 2 1/2% interest due on that date.
Balance of Consolidated Advances after the second re-demption of March 31, 1957
1/39th of balance deducted by way of redemption
Balance per March 31, 1958
Rp 3,648,498,750.--
Rp 93,551,250.--
Rp 3,554,947,500.--
ADVANCES TO THE GOVERNMENT Rp 17,286,378,602.50
The above total represents the balance of advances on current account as perMarch 31, 1958 extended to the Government since July 1, 1953 under article 19 of theBank Indonesia Act.
In the course of the year under report, about Rp 3,730,000,000 was passed by theForeign Exchange Fund to the credit of the Government account, being deposits madeby importers with foreign exchange banks for import Surcharges (T.P.I. — BuktiTambahan Pembajaran Impor) to obtain import permits (under Foreign Exchange FundAnnouncement A No 79 of June 27, 1957).

228
Furthermore, an amount of about Rp 19 million was entered to the credit of theGovernment, being the proceeds from the levy on bonds and stocks imported intoIndonesia (T.P.l.E. —Tambahan Pembajaran Impor Efek) at the rate of 33 1/3 % of theStock Exchange price (under Foreign Exchange Fund Announcement A No 62 of Feb-ruary 19, l955).
The above balance further includes about Rp 56 million, being the proceeds fromthe levy on transfers (T.P.T.—Tambahan Pembajaran Transfer) paid through foreignexchange banks (under Emergency Act No 5/1954 of March 2, l954).
When considering the debit balance on the Government account the followingshould be noted:
a) importers’ prepayments amounted to about Rp 87,100,000 per March 31, 1958—they have to be refunded when actual payment for foreign exchange is due (underForeign Exchange Fund Announcement B No 680 of March 8, 1956);
b) importers’ deposits (which replaced the prepayments referred to under (a) whenthe Export Certificate System was introduced on June 20, 1957) amounted to aboutRp 495,800,000 per March 31, 1958.
The deposits have to be refunded to importers when the Export Certificatesare bought and T.P.I. is paid.
As long as imports remain at the same level, the Government debit balance will notbe affected, but a decline in imports will increase the debit balance. For a fuller discus-sion of this subject Chapter IV of this report is referred to.
CLAIM IN RUPlAHS ON THE GOVERNMENT ON ACCOUNT OF PAYMENTSMADE ON ITS BEHALF TO I.M.F.... Rp 313,500,000.--
This item has been discussed under the heading “Gold coin and bullion, balancesin convertible foreign exchange and claims on the Government on account of golddeposited on its behalf with I.M.F. and I.B.R.D.”

229
BANK NOTES IN CIRCULATION......................................... Rp 14,492,584,534.50
Movements in cash position
Table 98 gives a breakdown of the outflow from and inflow into the Bank’s officesin the period April 1, 1957 to March 31, 1958 inclusive.
The figures include Government notes. The outflow amounted to about Rp 5, 127.5 million — a much higher figure than last year when it was Rp 1,651.5 million. Substan-tial additional orders were given with a view to replacing notes taken out of circulationfor reasons of wear and tear and other causes (84 million units at a value of Rp 719million against 133 million notes at a value of Rp 2,396 million in 1956/1957)

230
The monthly outflow and inflow of bank notes .as recorded by the bank’s officesin the period under report showed peaks of outflow in April, July and December. Thispoint has been reviewed At greater length in Chapter III under the heading “Moneysupply”.
A breakdown of the circulation of bank notes and Government notes specified indenominations is given in table 99.
The shift in the composition of notes in circulation continued in the year underreport as it did in foregoing years. The volume of the denominations of Rp 0.50 up toRp 10, expressed in percent of the total paper money circulation, successively amountedto 46.7% (3 I /3’51), 37.3%. (3I/3/’52), 30.5% (31/3/’53), 28.2% (31/3/’54), 24% (31/3/’55), 22.3% (31/3/’56), 18.2%, (31/3/’57), and 14.8% (31/3/’58). On the correspond-ing dates’ the volume of denominations of Rp 25 up to Rp 1,000 accounted for thefollowing percentages of the total paper money circulation: 53.3% - 62.7% -69.5%-71.8%—76% —77.7 %— 81.8 % and 85.2 % .

231
Government -Notes
Government notes were brought into circulation by Bank lndonesia for account ofthe Government up to May 29, l954. Since then Government notes have been broughtinto circulation by the Government itself or by Bank Indonesia, at the request and foraccount of the Government. (Government Ordinance No 38 of May 19, 1954—Gov-ernment Gazette 1954 No 63). Bank Indonesia is charged with keeping the accountsand printing the notes. The volume of Government paper money in circulation, that is,the outflow from Bank Indonesia Offices, is entered as a debit item for purposes ofcalculating the Government debt.
The supplies of Government notes to circulation, which were reported in foot-notes in the abridged weekly balance sheets of the Bank, were again reported in theOfficial Gazette as from May 29, 1954 as had been the prewar custom.
The volume of Government notes in circulation on March 31, 1958 consisted ofthe following amounts and denominations:
in denominations of Rp 5. - and Rp 10.- (issued under Act No17 of October 12, 1951 Governments Gazette 195l/100); in denominations of Rp 1.- and Rp 250 (issued under Gov-ernment Ordinance No 20 of May I l, 1953, GovernmentGazette 1953/34; Decree Minister of Finance No 103141/U.U. of May 12, l953 under the aforementioned Ordinance;Government Ordinance No 38 of May 19, 1954, Govern-ment Gazette 1954/63 and Decree of the Minister of Fi-nance No 82490/U.M.I. of May 27, 1954 under the latterOrdinance);in denominations of Rp 1.- and Rp 2.50 (issued under Gov-ernment Ordinance No 22 of July 23, 1955, GovernmentGazette 1955/46; Decree of the Minister of Finance No 155033/U.M.I. of July 28, l955 under the aforementioned Or-dinance; Government Ordinance No 56 of November 18,1957, Government Gazette l957/l54, and the Decree of theMinister of Finance No 236670/U.M.I. under the latter Or-dinance..
Rp l52,000,000.--
Rp 334,000,000.--
Rp 373,000,000.--
Rp 859,000,000.--

232
CURRENT ACCOUNT BALANCES (OF THE GOVERNMENT)
This heading includes “Special Account No.1 re E.C.A.aid to the amount of .....................................representing the unspent part of the Rupiah equivalent ofE.C.A. aid received by Indonesia through the Netherlands inthe U.S. fiscal year 1948/1949.On March 31,1957 the balance of this account was ...............From which amount the following was spent in the yearunder report: :
Rp 297,888,932.75
Rp 106,663,522.60
Rp 282,438,540.80
Rp 282,438,540.80
Rp 282,438,540,80
Rp 175,775,018.20
Rp 106,663,522.60
Expenditure for experts and admi-nistrative personnel of the U.S.Operations Mission to IndonesiaAnti Malaria operationsAgricultural and fisheries projectsTrust Fund for U.S. OperationsMission to Indonesia
Carry forward
Rp 12,500,018.20Rp 50,000,000.--Rp 34,525,000.--
Rp 14.000.000.--
Rp 111,025,018.20
Brought forwardSea fisheries extension and moder-nization projectsU.S. Operations Mission to IndonesiaHousing accommodation for foreignexpertsMinistry of Home Affairs projects
Balance per March 31, 1958
Rp 111,025,018.20
Rp 17,550,000.--Rp 10,000,000.--
Rp 35,000,000.--Rp 2,200,000.--

233
This heading also includes “Special Account No 2 rel.C.A. Aid” to the amount ofcomprising the counterpart funds — notified but not yetspent—of I.C.A., T.C.A., and F.O.A. Aid allocated to Indo-nesia direct in the U.S. fiscal years 1950/51 through 1954/55.
At the beginning of the year under report the balanceamounted to
During the year under report, these counterpart fundsincreased by notification to
Balance per March 31, 1958
Rp 191,225,410.15
Rp 157,433,137.05
Rp 33,792,273.10Rp 191,225,410.15
No entries for payment of projects approved by the authorities concerned weremade on the debit side in the year under review.
The counteryart funds relating to I.C.A., T.C.A. and F.O.A. Aid received by Indo-nesia direct and not as yet notified per March 31, 1958 may be found under the heading“Sundry Accounts” on the credit side of the balance sheet.
CURRENT ACCOUNT BALANCES (I.M.F. AND I.B.R.D.) Rp 641,759,680.88
The specification is as follows:
International Monetary Fund, Account No I Rp 639,557,482.48
This amount comprises:Rupiah deposits to the amount of(representing 75% of the quota ofIndonesia) from which must be de-ducted the demand notes issued bythe Government for
Rp 940,500,000.--
Rp 927,900,000.-- Rp 12,600,000.--
Rp 12,600,000.--Carry forward
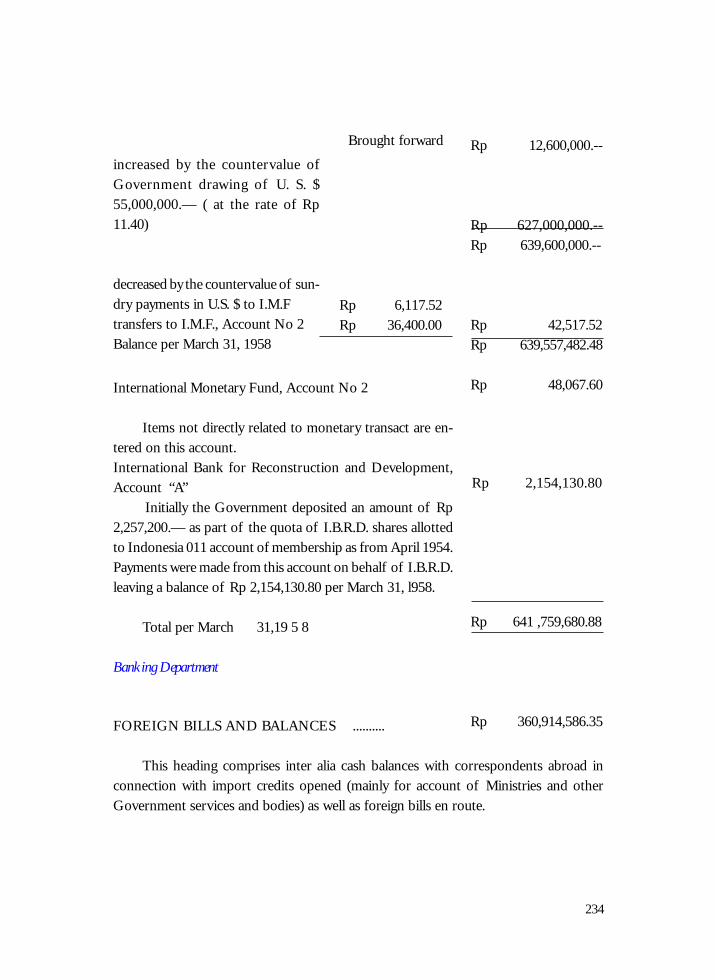
234
Brought forward Rp 12,600,000.--
Rp 627,000,000.--Rp 639,600,000.--
Rp 42,517.52Rp 639,557,482.48
Rp 48,067.60
Rp 2,154,130.80
Rp 641 ,759,680.88
Rp 360,914,586.35
increased by the countervalue ofGovernment drawing of U. S. $55,000,000.— ( at the rate of Rp11.40)
decreased by the countervalue of sun-dry payments in U.S. $ to I.M.Ftransfers to I.M.F., Account No 2Balance per March 31, 1958
Rp 6,117.52Rp 36,400.00
International Monetary Fund, Account No 2
Items not directly related to monetary transact are en-tered on this account.International Bank for Reconstruction and Development,Account “A” Initially the Government deposited an amount of Rp2,257,200.— as part of the quota of I.B.R.D. shares allottedto Indonesia 011 account of membership as from April 1954.Payments were made from this account on behalf of I.B.R.D.leaving a balance of Rp 2,154,130.80 per March 31, l958.
Total per March 31,19 5 8
Banking Department
FOREIGN BILLS AND BALANCES ..........
This heading comprises inter alia cash balances with correspondents abroad inconnection with import credits opened (mainly for account of Ministries and otherGovernment services and bodies) as well as foreign bills en route.

235
The various items have been valued at the official parity rates as per March 31,1958.
In this respect the Bank does not maintain an independent foreign exchange posi-tion since the Bank’s cash foreign exchange holdings are offset by forward contractswith clients, while all other forward contracts with clients are covered by correspondingcontracts between the Bank and the Foreign Exchange Fund.
The working capital supplied to the Bank’s branch in Amsterdam, valued at theofficial rate, is also included under this heading.
CASH (subsidiary coins) ...................... Rp 251,859.04
The nominal value of the stocks of Government and bank notes held at the Bank’soffices is not entered under this heading, nor under the heading “Bank notes in circula-tion”, the notes not actually being in circulation.
BlLLS DISCOUNTED AND ADVANCES ON COLLATERAL, PAYABLE IN RU-PIAHS Rp 1,353 ,708,306.97
The considerable increase in credits granted by the Bank is to be ascribed to addi-tional credits extended to semi-Government bodies. This increase amounts to Rp 351.6million as compared with the position on March 31, 1957. Additional credits, for in-stance, were made available to: Garuda Indonesian Airways, whose debit balance was ofthe order of about Rp 82.2 million per March 31, 1958 (Rp 9.4 million per March 31,1957); to “Jajasan Bahan2 Pertanian”, whose credit climbed from nil on March 31, 1957to Rp 64.6 million in March 31, 1958; further about Rp 397.6 million had been drawnper March 31, 1958 by “Jajasan Urusan Bahan Makanan’’ against the credit opened forrice imports, against last year’s debit balance of Rp 64.1 million. The debit of “JajasanKopra”—about Rp 104.5 million per March 31, 1957 was completely cleared due toliquidation.
The credits granted to foreign exchange banks were lower in the year under report,due to the decline of credits extended to several Government banks. Credits to nationalprivate banks, on the contrary, rose by about Rp 70.6 million.

236
Credits to private enterprises showed a decrease in the imports and industrialsectors, but an increase for the sector agricultural estates.
INVESTED CAPITAL, RESERVE FUND, SPECIAL RESERVE AND PENSIONFUND Rp 309,418,594.09
The Bank is entitled, under Article 17 paragraph 1 of the Bank Indonesia Act, toinvest its Capital, Reserve Fund and its Special Reserve.
The securities making up the invested Capital and Reserve funds will be discussedat greater length later in this report. The securities have been valued at list prices perMarch 31, 1958 or lower insofar as they are officially quoted on the Djakarta or foreignstock exchanges; valuations of securities not officially quoted have been conservative.Securities quoted in foreign currency have been converted into rupiahs at the officialrate.
The Investment of the Bank’s Capital in securities perMarch 31, 1957 amounted to .............................. increased by:purchases of securities forand advanced value of securities per March 31, 1958, enteredto the credit of the Profit and Loss Account of the 5th fi-nancial year ........
Rp 18,599,989.30
Rp 6,975,308.05
Rp 537,336.--
Rp 26,112,633.35

237
decreased by:redemptions ....................transfer to debit “Special Reserve Investment”
Balance per March 31, l 958
The investment of the Reserve Fund in securities perMarch 31, 1957 amounted to ..............................
increased by:purchases of securities for .......................................and advanced value of securities per March 31, 1958 enteredto the credit of the Profit and Loss Account of the 5th fi-nancial year ..
decreased by:redemption and transfer of securities to other investmentdeposits of the Bank
Balance per March 31, 1958
Rp 304,640.--Rp 808,852--Rp 24,999,141.35
Rp 24,999,947.40
Rp 100,247.41
Rp 1,024,686.39Rp 26,124,881.20
Rp 1,124,918.--
Rp 24,999,963.20
Advances in value of the securities in which Capital and Reserve Fund have beeninvested must be added to the Reserve Fund (Article 17 paragraph 2 Bank IndonesiaAct). Such additions no longer being possible when the Reserve Fund equals the Bank’sCapital (Article 34 paragraph 5 Bank Indonesia Act), they were passed to the credit ofthe Profit and Loss Account of the 5 th financial year.
The Investment of the Special Reserve in securities perMarch 31, 1957, amounted to .
increased by:purchases and transfer of securities from other investmentdeposits of the Bankadvanced value of securities per March 31, 1958 entered tothe credit of Special Reserve
Rp 167,458,437.40
Rp 54,389,592.21
Rp 4,831,187.99
Rp 226,679,217.60

238
decreased by:redemption of securities ....................
Balance per March 31, 1958
The Investment of The Pension Fund per March 31,l957 amounted to:
Rp 18,787,540.--
Rp 207,891,677.60
Rp 38,517,582.27
Rp 21,003,147.68Rp 1,367,450.77
Rp 60,888,180.72
Rp 9,360,368.78
Rp 51,527,811.94
Securities ...................................Mortgages .................................Advances in current account againstpromissory notes
Rp 38,426,534.70Rp 21,414.64
Rp 69,632.93
decreased by:sales and/or redemption of securi-ties and transfer of securities to otherinvestment deposits of the Bankredemptions mortgages ,,decrease advances in current accountagainst promissory notes ,,
Balance per March 31, 1958
Specified as follows:Securities ............................Mortgages ...........Advances againstpromissory notes ..................
Rp 9,282,074.45Rp 8,661.40
Rp 69,632.93
increased by:purchases and transfers of securities from other investmentdeposits of the Bank, and re-investment of redemptions ...increase in value of securities per March 31, 1958
Rp 51,515,058.70Rp 12,753.24
Rp -.-
Rp 51,527,811.94
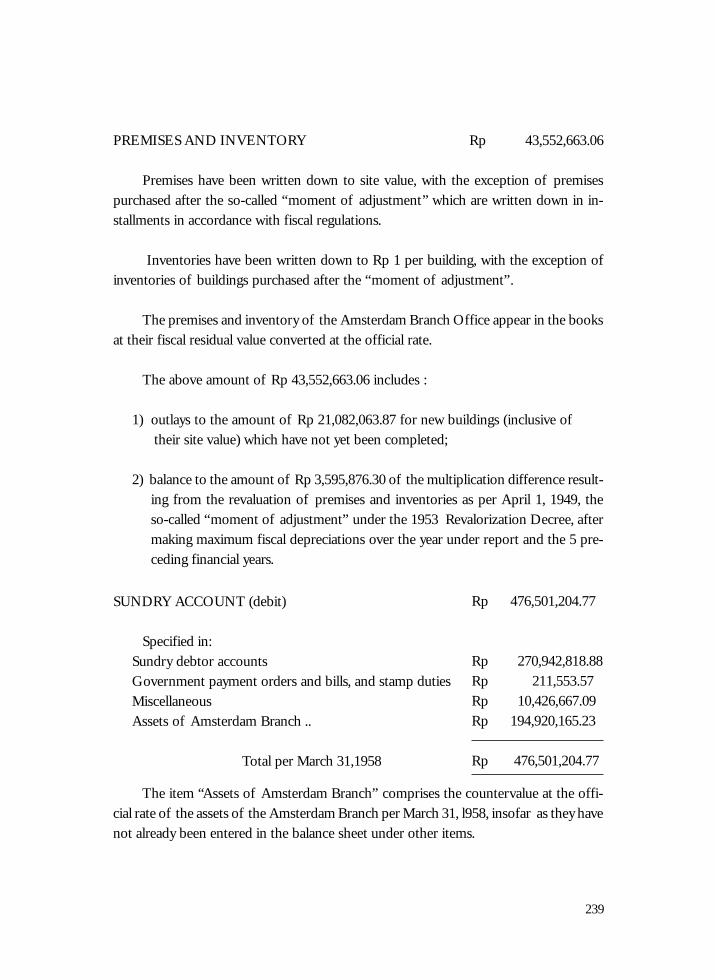
239
PREMISES AND INVENTORY Rp 43,552,663.06
Premises have been written down to site value, with the exception of premisespurchased after the so-called “moment of adjustment’’ which are written down in in-stallments in accordance with fiscal regulations.
Inventories have been written down to Rp 1 per building, with the exception ofinventories of buildings purchased after the “moment of adjustment”.
The premises and inventory of the Amsterdam Branch Office appear in the booksat their fiscal residual value converted at the official rate.
The above amount of Rp 43,552,663.06 includes :
1) outlays to the amount of Rp 21,082,063.87 for new buildings (inclusive of their site value) which have not yet been completed;
2) balance to the amount of Rp 3,595,876.30 of the multiplication difference result-ing from the revaluation of premises and inventories as per April 1, 1949, theso-called “moment of adjustment” under the 1953 Revalorization Decree, aftermaking maximum fiscal depreciations over the year under report and the 5 pre-ceding financial years.
SUNDRY ACCOUNT (debit)
Specified in:Sundry debtor accountsGovernment payment orders and bills, and stamp dutiesMiscellaneousAssets of Amsterdam Branch ..
Total per March 31,1958
Rp 476,501,204.77
Rp 270,942,818.88Rp 211,553.57Rp 10,426,667.09Rp 194,920,165.23
Rp 476,501,204.77
The item “Assets of Amsterdam Branch” comprises the countervalue at the offi-cial rate of the assets of the Amsterdam Branch per March 31, l958, insofar as they havenot already been entered in the balance sheet under other items.

240
CAPITAL Rp 25,000,000.--
The capital of the Bank amounts to Rp 25 million (article 4 Bank Indonesia Act).During the debates on the draft bill, which among various other points provided for anincrease of the capital to Rp 50 million, Parliament generally appeared to recognize thenecessity of this expansion of capital.
RESERVE FUND Rp 25,000,000.--
Under article 34 paragraph 5 of Bank Indonesia Act, 20% of the approved netprofits —after allocation to Special Reserve — must be paid annually into the ReserveFund until it equals the amount of the Bank’s Capital. No such payment was made in theyear under report since the total of the Reserve Fund equalled the total of the Bank’sCapital.
The object of the Reserve Fund is to cover possible losses on the Bank Capital(Article 5 paragraph 2 of Bank lndonesia Act).SPECIAL RESERVE Rp 251,454,041.69
The Special Reserve, referred to in article 6 of Banklndonesia Act, per March 31, 1957 stood at ...............
increased by:advanced value of securities per March 31, 1958 from in-vestments of Special Reserve Fund under article 17 para-graph 2 of Bank Indonesia Act ........................(The interest on the investments amounting to Rp7,720,937.67 was credited to the Profit and Loss Accountunder Article 1 7 paragraph 2 of Bank Indonesia Act).
Transfer to the debit of the Profit and Loss Account underArticle 34 paragraph 5 of Bank Indonesia Act ...
Balance per March 31, 1958
Rp 213,522,853.70
Rp 4,831,187.99
Rp 33,100,000.--
Rp 251,454,041.69

241
The necessity of strengthening the Special Reserve has been repeatedly stressed inforegoing reports. The results of the year under report have enabled Rp 33,100,000 tobe transferred to the Special Reserve, against Rp 38,500,000 in the 4th financial year(1956757).
Should the previously mentioned Bill aimed at raising, the Bank s capital to Rp 50million be enacted and go into operation, the need would arise for transferring Rp 25million from Special Reserve to Capital Account.
After the transfer from Profit and Loss Account of Rp 33,100,000 and the transferof Rp 25 million to Capital Account, Special Reserve would appear in the books with abalance of Rp 226,456,041.69.
PENSION FUND
The balance of this account per March 31, 1957amounted toincreased by:contributions received, less refunds ..........interest on mortgages, advances in current account againstpromissory notes and securities .................................advanced value of securities per March 31, 1958 ..payments received and other revenue from reinsurance ofpensions ...........................indemnification paid by the Netherlands Government com-pensation of contributions payable by participants and takenover by the Bank (Pension Fund)
Rp 6,583,000
Rp 50,533,000.--
Rp 1,003,444.89
Rp 2,153,405.07Rp 1,367,450.77
Rp 3,726,193.82
Rp 7,023.30
RP 17,083,354.47
Rp 75,873,872.32
allocations:from Profit and Loss Account .......from Amsterdam Branch Office .....
Rp 16,379,083.17Rp 704,271.30

242
decreased by:pensions and subsistence allowancespaidadditional allowances under the Pen-sion Fund Rules (article 56) effectiveas from August 1, 1955 .....................single premiums for reinsurance pen-sions, less refunds ...............................miscellaneous expenditure .........
Balance per March 31, 1958 Rp 10,290,872.32Rp 65,583,000.--
ln accordance with article 35 paragraph 2 of the Bank Indonesia Act the abovebalance offsets the computed cash pension obligations undertaken and predictable, to-wards the staff, excluding pension liabilities taken over by assurance companies. Theobligations not accommodated with insurance com panies include also obligations ofadditional allowances.
CURRENT ACCOUNT BALANCE (NON-GOVERNMENT) Rp 4,375,668,286.70DRAFT S ON OWN OFFICES Rp 21,787,329.75
The total of current account balances (non-Government) increased by about Rp2,456 million as compared with March 31, 1957. The balances of clearing banks ac-counted for about Rp 2,208 million of the total against Rp 753 million per March 311957.
Giro transfers
Table 101 shows the development of the giro system from April 1, 1957 March 31,1958.
The figures in the above table do not cover the complete system of transfers,seeing that the columns “Local transfers (no clearing)” and “Transfers (mail and tele-graphic)” only cover Bank Indonesia Offices and not the other banks in Indonesia.
Rp 1,982,52l.96
Rp 183,984.59
Rp 8,107,884.82Rp 16,480.95

243
The trend of the figures shows a rise in the average per transaction as comparedwith 1956,.57.
The clearing and “central settlement’’ system was extended to further banks duringthe year under report.
The Surabaja branch of the Great Eastern Banking Corp. Ltd. joined the clearingin that town, while Bank Dagang, Nasional Indonesia N.V., Bank Perdagangan Indone-sia N.V., Bank Merdeka N.V., and Bank Timur N.V., increased the number of theirbranch offices participating in the sub-clearing by one office each.
Bank Nusantara P.T. withdrew from the sub-clearing in September 1957 with twooffices. When Nationale Handelsbanls N.V. closed its branch in Tjirebon, the numberof offices participating in the clearing in that town was reduced by one.
The members of the clearing in Djakarta agreed to permit Bank Rakjat Indonesiato convert indirect into direct participation.
The total number of bank offices participating in the clearing in 9 towns in Indo-nesia was 87, while 33 of this total participating in the sub-clearing.

244
Central settlement was adopted in Menado from October 1, 1957 by Bank Indone-sia, Bank Negara Indonesia, Bank Rakjat Indonesia and Escompto bank N.V. thusbringing the number of towns with Central settlement up to six and the number ofparticipating offices to 24.
Rp 192,194,502.50
Rp 92,230,145.--
Rp 187,168,252.50Rp 279,398,397.50
Rp 87,203,895.--Rp 192,194,502.50
Rp 3,288,919,100.67
RESERVE FOR COMPANY TAX ................
On March 31, 1957 this reserve amounted towhich was increased by:................................................................
Transfer from Profit and Loss Account for companytax due over the 5th financial year (1957/58) ..........................
Which was decreased by:Company tax paid over the 4th financial year ( 1956/57)
Balance per March 31, 1958
SUNDRY ACCOUNTS (credit)
This heading comprises counterpart funds relating to E.C.A., T.C.A., I.O.A., andI.C.A. aid allocated and supplied to Indonesia in the U.S. fiscal years 1950/51 (E.C.A.);195l/52 and 1952/53 (T.C.A.); 1953/54 and 1954/55 (F.O.A.); 1955/56 (I.C.A.); but forwhich no notification has yet been received.
ln the beginning of 1957/ 1958 these accountsamounted to In the course of 1957/58 this amount increased by thecountervalue of U.S. $ received under l.C.A. aid ......
while notification was received for an amount of ...(this amount was transferred to “special Account No 2 reI.C.A. aid”, as mentioned under “Current AccountBalance-Government”)
thereby reducing the balance per March 31,1958 to
Rp 53,932,859.66
Rp 14,882,812.42Rp 68,815,672.08
Rp 33,792,273.10
Rp 35,023,398.98

245
This heading further comprises:U.S Surplus commodities Sales Account under which thecountervalue of surplus agricultural commodities (S.A.C.)delivered by the U.S.A. to Indonesia was entered AgreementMarch 2, 1956 under U.S. Publiclaw 480) .................................Treasurer of the U.S. (I.M.G.-funds) under which thecountervalue of informational media” was entered ...............(mainly books and magazines), supplied under the agreementof September 15, 1955 under the U.S.“I.M.G. program”)Sundry accounts of the Foreign Exchange Funds in rupiahsAmsterdam Branch Liabilities.....................................................the countervalue of liabilities per March 31, 1958 of theAmsterdam Branch insofar as not entered under other Bal-ance Sheet headings, valued at official rateMiscellaneous ................................................................................
Total per March 31,1958
Rp 974,474,904.--
Rp 5,636,042,08
Rp 1,471,316,695.31Rp 198.053,954.40
Rp 604,414,105.90
Rp 3,288,919,100.67
PROFIT AND LOSS ACCOUNT
The gross income of the Bank over the 5th financial year (1957/ 58) rose by aboutRp 226.0 million as compared with the income during the preceding, financial year.
The item “Interest on bills discounted and on foreign balance, profit on exchange,on coin and bullion and on sundries” fell by about Rp 2.9 million. This is to be attrib-uted to:a) a rise of about Rp 7.7 million in interest on foreign balances. This rise was due to an
increase of interest to the amount of Rp 8.8 million on the so-called Small A accountin the books of the Amsterdam Branch and paid to Head Office (calculated at therate of exchange under the Export Certificate System), .against a drop in interestearnings on U.S. Exchequer issues by Rp l.l million.
b) the fall of profits on exchange business by about Rp 11 million. The introduction ofthe export Certificate System on June 20, 1957 removed the profit margins on for-eign exchange contracts; the Bank now receives a commission on the sale/purchaseof Export Certificates --- for which the paragraph on “Commission” is referred to.

246
The item “Interest on advances to the Govermnent”amounting to Rp 381.3 mil-lion (against Rp 168.4 million in 1956/1957) represents interest to the amount of Rp18.2 million (Rp 18.7 million in the previous year) on consolidated advances to theGovernment, under article 42 of Bank Indonesia Act, (the decrease of Rp 0.5 millionemanating from the regulation mentioned on page 214) and interest to the amount ofRp 363.1 million (Rp 149.7 million in the previous year) at the rate of 3% per annum, onthe interest-bearing part of the floating debt of the Government, in pursuance of ar-ticle 19 of Bank Indonesia Act. The last mentioned interest items reflect the muchincreased average debit position of the Government as regards Bank Indonesia. duringthe period under review.
The item “interest on advances to others” (Rp 36.6 million against Rp 43 million in1956/57) represents interest on advances in current account to semi-Governmentbodies, banks and private enterprises. The drop by Rp 6.4 million was caused by thewithdrawal of some substantial credits, While the introduction of the Export CertificateSystem eliminated interest on draft against foreign credits.
The item “Commission” increased by about Rp 18.4 million thanks to the com-missions earned on Export certificate transactions.

247
The item “Interest on Securities” covers interest earned on the securities in whichCapital, Reserve Fund, and Special Reserve are invested (article 1, paragraph 2 BankIndonesia Act.).
The item “Unclaimed dividends of De Javasche Bank concerning the 124thbookycar, being lost through superannuation” amounted to Rp 3,375. Generally an itemof this description is passed to the credit of the Reserve Fund. Since, however, the totalof the Reserve Fund equals the total of the Capital Account, this item had to be passedto the credit of the Profit and Loss Account.
The item “Differences arising from the revaluation of securities in which the Bank’sCapital and Reserve Fund have been invested” was carried to the credit of the Profit andLoss Account for the reason explained under the item “Invested Capital, Reserve Fund,Special Reserve and Pension Fund”.
The returns from normal business of the Amsterdam Branch in 1957 1958 showeda decrease (Nf 4,300—Rp 12,900).
This loss was mainly due to the increased rate of interest from 3 3/16% to 43/4%on the so-called small A Account.
Thanks, however, to an addition of Nf 199,000 to the returns for the year underreport, a profit of about Nf 195,000—Rp 585,000 could still be made. This additionconsisted of Nf 148,000 from unemployed Debtors Reserve and a refund on CompanyTax of Nf 51,000.
The item “General Expenditure’7 on the debit side ot the Profit and Loss Account shows anincrease by Rp 13.5 million, mainly caused by increased personnel expenses (Rp 10.6 million),office requirements (Rp 0.6 million), and transportation of bank notes (Rp 0.2 million).
The item “Ground tax, upkeep and insurance buildings” increased by Rp l.5 mil-lion, mainly owing to increased upkeep work and higher cost of upkeep.
The item “Depreciations of inventories” represents the maximum fiscal deprecia-tion permitted under article 3 paragraph 3 of the “1953 Company Tax Exemption De-

248
cree” to the amount of Rp 1.6 million, based on the market value per April 1,1949 (theso-called “moment of adjustment”), as well as depreciation on site value (to the amountof Rp 7. 5 million, the maximum permitted under article 9 paragraph 2 of the “1953company Tax Exemption Decree”) of extensions and reconstructions carried out, andproperties acquired in the year under report.
The item “Depreciation of buildings” represents the maximum fiscal depreciationpermitted on expenditure in the year under report for the necessary renewal and exten-sion of the motorcar fleet, for office equipment and furniture.
The item “Depreciation printing cost of bank notes” amounting to Rp 91.1 mil-lion shows the expenditure on orders placed for bank notes in the year under report.
The item “Transfers to reserves for new buildings” remained blank for the yearunder report, due to the cancellation of article 10 of the “1953 Company Tax Exemp-tion Decree”, which permitted the amount of investment estimated for the next follow-ing year to be reserved.

249
The item “Transfers ro reserve to cover estimated losses Padang and MenadoBranches” provides for the losses suffered by the Bank’s Branches estimated at Rp 181million. This transfer to the debit of the Profit and Loss account has the approval of theMinister of Finance.
This reserve has pro-visionally been fixed at Rp 108 million (not exempt fromCompany Tax), on the understanding that any excess or shortage will be passed to thecredit or debit of the Profit and Loss Account of the next following financial year. Thebalance of this reserve to be included in the balance of “Sundry Accounts”, credit side.
Other expenditure, depreciations and reserves have, insofar as necessary, been re-viewed earlier in this part of the report.
Rp 33,319,306,74
Rp 33,319,306,74
Rp. 33,100,000.--
Rp. 219,306.74
NET PROFIT
The various movements referred to above resulted onbalance in a net profit ofwhich, under article 34 paragraph 5 of the Bank IndonesiaAct, is to be allocated as follows:transfer to Special ReserveThus leaving for the Treasury a share of the net profit to theamount of ......................

250
IX. PERSONALIA
Management of the Bank
In the year under report the formation of the Managing Board and of the Bank’srepresentatives abroad underwent changes.
The Cabinet of the Republic of Indonesia in its session of January 30, 1958 de-cided to discharge Dr. Sjafruddin Prawiranegara as Governor of Bank Indonesia as perJanuary 31, 1958.
In its session of April 8, 1958 the Cabinet appointed Dr. Loekman Hakim. thenManaging Director and First Deputy Governor, Governor of Bank lndonesia.
In its session of May 23, 1958 the Cabinet appointed Dr. Boerhanoedin ManagingDirector, while in its session at June l4, 1958 Dr. Indra Kasuma, when Managing Direc-tor and Second Deputy Governor and Dr. Darmawan Mangoenkoesoemo, then Manag-ing Director were respectively appointed Managing Director and First Deputy Gover-nor, and Managing Director and Second Deputy Governor of the Bank.
Besides his positions as Managing Director of the Branch Office in Amsterdamand Delegate of the Bank for Europe, on July l, l958 Dr. Khouw Bian Tie was appointedRepresentative of Bank Indonesia for Great Britain with an office in London.
P.A. van Garderen, Managing Director of the Branch Office in Amsterdam andDelegate of the Bank for Europe resigned as per June 1, 1958 and as per the same dateL. Swaan was appointed Managing Director of the Branch Office, Amsterdam.
The formation as per July 31, 1958 of the Managing Board and its Staff in thecountry as well as abroad is fully summarized in Appendix C of this report.
DJAKARTA, July 3 l, 1958
The Governor of Bank Indonesia
Dr. LOEKMAN HAKIM

Appendices

APPENDIX A

APPENDIX B

254
APPENDIX C
BANK INDONESIAManagement as at July 31st, 1958
Monetary Board
Minister of Finance, Dr. SOETIKNO SLAMET : ChairmanGovernor of Bank Indonesia, Dr. LOEKMAN HAKIM : Deputy ChairmanMinister of Trade, RACHMAT MOELJOMISENO : MemberMinister of Industry, Ir. F. INGKIRIWANG : Alternate Member
Managing Directors
Dr. LOEKMAN HAKIM :GovernorDr. INDRA KASOEMA : Managing Director and 1st Deputy
GovernorIr. DARMAWAN MANGOENKOESOEMO : Managing Director and 2nd Deputy
GovernorT.R.B. SABARUDIN : Managing DirectorDr. BOERHANOEDIN :Managing Director
Proxy in Europe and Manager of the Branch Office AmsterdamKHOUW BIAN TIE, drs, ec

255
HEAD OFFICE DJAKARTADeputy Managing Director
Mr. R.B. GANDASOEBRATA
ForeignDept.Mr. R.B. GANDASOEBRATA : ChiefR.H. DJAKOESOEMA : Deputy ChiefR. SUJANTO : Asst. ChiefTJOA SIEN KIEN : Asst. Chief
General Dept.Mr. R.HERTATIJANTO : Acting ChiefM.HOLTZ : Asst. Chief and interim
Economic-Statistical Dept.R. SOERJADI, drs. ec. : Chief ad interim
General Credit Dept.TAN TIONG DJIN : Acting ChiefTJIOE TIANG HAM : Asst. Chief and interim
Credit Supervision Dept.Mr.M.DJOEANA KOESOEMAHARDJA : ChiefR. MARATH ON WIRIJA MIHARDJA : Asst. Chief
Djakarta Credit DeptSOEJAKTO SOEPARDAN : Acting ChiefJ.TH.LEMAIRE : Asst. Chief
Bills Dept.N. KE RKHOVEN : Chief ad interimJ.A. FRANSZ : Deputy ChiefNn. ROCHANI DJAJASASMITA : Asst. ChiefD.D. RANTY : Asst. ChiefMr. R. MARKOEM DJOJOHADISOEPARTO : Asst. Chief

256
TAN TEK YONG : Asst. ChiefJ. HARAHAP : Acting Asst. Chief
Foreign Exchange FundMr. R. SULAKSANA SUPARTO : ChiefTJOA TIANG TJOEN : Asst Chief
Securities Dept.P. DE QUACK : Acting ChiefKOEN SURI ATMODJ O : Asst ChiefM. A. SOE RIADI : Asst Chief
Secretarial Dept.R. KARDANA HARDJAKUSUMAH : Chief ad interimACHMAD MARTINOES : Asst. Chief
Personnel Dept.F.O. TUMBEL : ChiefKHOE SOE LIEM : Asst. Chief
General Accounting Dept.E.E.P. POUBLON : Deputy ChiefJ. CH. E. LAMAISON : Asst. ChiefPADMI WIRAATMADJA : Asst. Chief
Building Maintenance Dept.Ir. J.A.H. ONDANG : ChiefR. ABDULSALAM WIDJOJOATMODJO : Asst. Chief
Cash Dept.AMHAR GELAR SOETAN PALEMBANG : Chief ad interimLAY SIONG KWAN : Deputy ChiefSOENTNDTJO : Asst. Chief

257
Bank Note Dept.ABDUL HAMID GELARM. PARTLINDUNGAN : Chief
Accounting Dept.H.B. VORTMAN : Chief ad interimA.U. LAOH : asst. ChiefH. THIJSSEN : asst. ChiefP. SIREGAR : asst. Chief
BRANCH OFFICE, AMSTERDAMKHOUW BIAN TIE, drs. ec. : ManagerL. SWAAN : ManagerH.R. VAN DE I.EUV : Sub-Manager
J. VAN DER MEER : Sub-ManagerJhr. Mr. E.R.D. ELLIAS : Asst. Secretary
PROXIESJ.M. PALMH. TUPPER. YAN REES VELLINGAB.H. BURGEMEESTERP. WATERDRINKERL.E. DE GRUYLH.J. VERBEEK WOLTHUYSJ.F. WIJSMULLER
AGENCY IN THE UNITED STATES (NEW YORK)
RACHMAT SALEH, drs. ec. : Temporary Representative
AGENCY IN GREAT BRITAIN (LONDON)KHOW BIAN TIE, drs. ec. : Representative

258
BRANCH OFFICES IN DJAWA
BandungJ.A. SEREH : Branch Manager ad interimWIJARDI : Deputy Branch ManagerIRLAN SOEHENDRA : CashierMAHFUD JAKILE : CashierR. ABAS : Accountant
DjemberJo TEK SOEI : Branch Manager ad interimR. MASHERMAN : Accountant
JogjakartaI. NJOMAN MOENA : Branch Manager ad interimR. ARlANTO WIRIOSAPUTRO : CashierLIE HWAY KIONG : Accountant
KediriSOEKARNO : Branch Manager ad interimTAN PING HWIE : Accountant ad interim
MalangSULWAN S. ASTRADININGRAT : Branch Manager ad interimHAN PING YAN : CashierOEI SIOK TIEN : Accountant
SemarangE. SOEKASAH SOMAWIDJAJA : Branch Manager ad interimR.R. WENAS : Deputy Branch ManagerMr. ARRO BAKSONO : CashierG.W. NAJOAN : CashierSUNJ OTO KUSUMODIDJOJO : CashierKHOE SOE KHOAN : Accountant

259
SoloR. DHOEMADI SINGOWIGOENO : Branch ManagerMr. R. SOEWIGNJO SOERJOKOESOEM : CashierR. SOENARTO : Accountant
SurabajaTAN LIANG OEN : Branch ManagerGOESTI ABDUL AZIS : 1 st Branch ManagerR. SOEJATNO SOEMARDJO : 2nd Branch ManagerR. SOEJOTO : CashierBAMBANG SUSILO : CashierHAMDANI : CashierR. OEMAR SAID : AccountantJ. ENAS : Asst. Accountant
TjirebonR.H. KAMARGA : Branch ManagerF.H. RARUNG : CashierPHOA HONG GIN : Accountant
BRANCH OFFICES IN SUMATRA
MedanR .W. L. ECHTER : Branch Manager ad interimR.P. SOEMA DI PRADJA : 1st Deputy Branch ManagerK.L. RANTY : 2nd Deputy Branch Man
agerACHMAD SIROD : CashierMr. R. MARTOJO KOENTO : Cashier ad interimLOH THIM LOOK : Accountant

260
PadangZ.J. SAHUSULAWANE : Branch ManagerNANDANG KOMAR : Deputy Branch ManagerMAHJOEDIN : Accountant
PalembangANDI FAISAL. : Branch ManagerR.S. NATALEGAWA : Deputy Branch ManagerWHIE PEK SOEI : Accountant ad interim
BRANCH OFFICES IN KALIMANTAN
BandjarmasinR. SOEMARTONO MS : Branch Manager ad interimA.R.D. RICHIR : Accountant
PontianakTRASNO KALIPROGO : Branch Manager ad interimR.M. SOEMIRAT SOERJODARMODJO : Deputy Branch ManagerOH SOEI BIE : CashierR. SOEROTO DONO : Accountant
BRANCH OFFICES IN SULAWESIMakassarM. RIFAI : Branch ManagerS. SOEDITO : Deputy Branch Manager ad
interimB.R. BOHANG : Accountant
MenadoH.P. TOAR : Branch ManagerA. NELWAN : Accountant

261
BRANCH OFFICES IN MALUKU
AmbonONG SIAN TJONG : Branch ManagerR.M.W.T. LUNGGONO : Accountant
BRANCH OFFICE IN LOMBOK
AmpenanR. SOETANDIJO : Branch Manager ad interimE.A. KOETIN : Accountant

262
Bills of Exchange with at least three signatures (minimum interest tendays ) ...............................................................................................................
Bills of Exchange and acceptances with two signatures, accepted by persons,firms or companies established in Indonesia (minimum interest ten days )
Promissory Notes with two signatures, accepted by persons, firms or compa-nies established in Indonesia (minimum interest ten days) .....................
Bills of Exchange drawn against credits opened by the Bank (minimum in-terest eight days) .............................................................................................N.B. Bills of Exchange, Promissory Notes, etc., of a currency exceed-ing ninety days or which are to be considered as extended debt andhave, therefore, a currency exceeding ninety days, 1/2% more.
Government Auction Promissory Notes if payable in places where the Bank hasits own office (with a minimum of Rp 1.—) ............................................
Ditto, if payable elsewhere in Djawa or Madura (with a minimum of Rp.1.25)Ditto, if payable elsewhere outside Djawa or Madura (ten days additional
interest with a minimum of Rp 1.50) .........................................................Bills of Exchange in local currency payable abroad (minimum interest ten
days) ................................................................................................................
LOANS AND ADVANCE IN CURRENT ACCOUNT AGAINST
Bills of Exchange .....................................................................................................Promissory Notes ....................................................................................................Government Auction Promissory Notes ...................................................................Securities : Bonds of the Government of Indonesia as well as of au-
tonomous provinces and municipalities in Indonesia ...........Bonds issued by mortgage banks established and operatingin Indonesia .....................................................................................
3 %
5 1/2 %
6 %
4 1/2 %
3 %3 %
3 %
3 %
5 %6 1/2 %3 %
3 %
3 %
APPENDIX D
INTEREST TARIFF OF BANK INDONESIA
IN FORCE AS FROM JULY Ist, 1953
Discount s :

263
All other bondsShares
Gold and silverSugar, rice, oils and fatsOther export produceImport commodities
3 1/2 %4 %3 %4 1/2 %5 %5 %

APPENDIX E

265
APPENDIX F
LAW EXEMPTING BANK INDONESIA FROM THE OBLIGATIONREFFERRED TO IN ARTICLE 16, PARAGRAPH 1, OF THE
BANK INDONESIA ACT 1953
(Emergency Law No 14, 1957; Government Gazette 1957, No 61)
THE PRESIDENT OF THE REPUBLIC OF INDONESIA,
Observing:
that by virtue of article 16, paragraph 3 of the Bank Indonesia Act, the MonetaryBoard laid down by its decree of February 2, l957, No 23 that for the period January 30,1957 up to April 30, l957 the total amount of banknotes, balances on current accountand other liabilities of the Bank shall be covered for fifteen percent by gold, gold coin,bullion, or by reserves consisting of freely convertible foreign currency, or by the rightto draw on the International Monetary Fund and the World Bank as transferred or to betransferred to the Bank by law;
Considering:
(a) that actual developments have shown that since January 30, 1957 the percentage of cover has dropped week by week so that it threatens to drop below the15% cover referred to above;
(b) that the percentage of cover had dropped to l5.14% on April 23, l957;
(c) that Bank Indonesia will nor be capable of restoring the conditions referred to inarticle 16, paragraph 1 of the Bank Indonesia Act 19 5 3 on short term; that evennow it cannot with any measure of certainty be expected that the l5% cover canbe maintained for a period of three months as referred to in article 16, paragraph5 of the Bank Indonesia Act l953;
(d) that it is not considered expedient that another cover should be fixed at less than 15%

266
(e) that, on expiry of the Decree of the Monetary Board No 23 of February 2, 1957,it is deemed necessary that for a period of six months — from April 30 to No-vember 1, l957,—Bank Indonesia shall be exempted from the obligation to re-store the gold cover as referred to in article 16, paragraph 1 of the Bank Indone-sia Act 1953;
(f) that due to considerations of urgency it is deemed necessary that this regulationshould be enacted by Emergency Law;
In view of:
article 96, paragraph I of the Constitution of the Republic of Indonesia and ar-ticle16, paragraph 3 of the Bank Indonesia Act l953;
Having heard:
The Council of Ministers in their meeting of April 29, 1957;
Has resolved
To enact::
An Emergency Law providing for the exemption of Bank Indonesia from theobligation referred to in article 16, paragraph 1 of the Bank Indonesia Act l953 for aperiod of six months upon the expiry of the decree of the Monetary Board of February2, 1957, No 23, issued by virtue of article 16, paragraph 3 of the Bank Indonesia Actl953 (Law No 11/1953; Government Gazetee 1953 No 40), as follows:
Article l
Bank Indonesia shall be exempted from the obligation referred to in article 16,paragraph l of the Bank Indonesia Act 1953 for a period of six months—from April 30,1957 up to November 1, 1957—to wit upon the expiry of the Decree of the MonetaryBoard of February 2, 1957, No 23, issued by virtue of article 16, paragraph 3 of theBank Indonesia Act 1953.

267
Article 2
This Emergency Law shall become operative on the date of promulgation andshall be retroactive to April 30, 1957.

268
APPENDIX G
DECREE OF THE MONETARY BOARD No 27dated May 27, 1957
The Monetary Board:
Considering:the necessity of extending the general conditions for granting licences to conductbanking operations as laid down in the Monetary Board Decree No 2 5 dated March11, 1957;
In view of:(a) article 7 paragraph 3, 4 and 5 of the Bank Indonesia Act 1953, article 2 paragraph 2 of Government Ordinance No l/1955;(b) Monetary Board Decree No 25 dated March 11, 1957;(c) the decision of the Monetary Board meeting of May 14, 1957;
Has decided :
to extend the general conditions under the Monetary Board Decree No. 25 datedMarch 11, 1957, by further general conditions reading as follows:
Firstly : without prejudice to the provisions referred to in the first paragraph of theMonetary Board Decree No 25 dated March 11, 1957, permanent licences forconducting banking operations or savings banks, as referred to in article 2paragraph I of Government Ordinance No l/195, can only be granted by theMinister of Finance if the paid-up capital (working-capital) as laid down inacticle 2, paragraph 2 of Government Ordinance No l/1955, consists exclusively of capital obtained from private sources and does not include capitalobtained, directly or indirectly, from the Government or from corporate bodies established by the Government under Public or Civil Law.
Secondly : applicants for permanent licences shall have to supply adequate proof thatthe paid-up (working) capital does not include capital obtained from the Gov

269
ernment or from corporate bodies established by the Government, as referredto in firstly. Whenever necessary, the Bank Indonesia Managing Board can examine into the reliability of the proof supplied.
Thirdly : this Decree shall become operative on the date of signature.

270
APPENDIX H
DECREE OF THE MONETARY BOARD No 28dated May 28, 1957
The Monetary Board:
Considering:the necessity to lay down a general regulation governing the restrictions of creditsgranted by private credit banks, in view of current monetary developments;
In view of:(a) article 9 paragraph 2 (a), 3 and 4 of Government Ordinance No 1/1955.(b) the decision of the Monetary Board meeting of May 28, l957.
H a s d e c i d e d
To establish a general regulation governing the restriction of credits granted byprivate credit banks, as follows:Firstly : all private credits banks are required to :
(a) invest part of their cash assets (cash plus balance with Bank Indonesia) in Treasury notes and bills ;(b) observe a minimum ratio between the amount of cash assets less theamount referred to under (a), and the amount of current and deposit accounts ;
Secondly : the part of the cash assets that is to be invested in Treasury notes and bills,as referred to under Firstly (a), and the minimum proportion as referred tounder Firstly (b), shall be determined by the Bank Indonesia ManagingBoard in conformity with the exigencies brought about by monetary developments
Thirdly : this regulation shall only apply to private credit banks showing overall balances of current and deposit accounts to an aggregate of at least Rp75,000,000 (seventy-five million rupiahs);
Fourthly : the implementation of this regulation is entrusted to the Bank IndonesiaManaging Board.

271
APPENDIX I
DECREE OF THE MINISTER OF FINANCE ON THE WITHDRAWALFROM CIRCULATION OF GOVERNMENT CURRENCY NOTES IN
DENOMINATIONS OF 25 SEN AND 10 SEN
dated November 8, 1956.
THE MINISTER OF FINANCE OF THE REPUBLIC OF INDONESIA
Considering :
that the circulation of Government Currency Notes in denominations of 25 senand 10 sen—issued by the erstwhile pre-federal Government under the Ordinance ofNovember 21, 1947 (Government Gazette 1947, No 205) and of November 21, 1947(Government Gazette 1949, No 343)—is no longer compatible with present condi-tions;
that, new coins having been issued since 1951, especially in the denominations of25 sen and 10 sen to replace Government Currency Notes in the same denominations,it is considered necessary to withdraw the aforesaid Government Currency Notes of 25sen and 10 sen from circulation;
that, under the provisions of article5 of the Emergency Law No 2, 1954, and Law.No. 1, 1955, the withdrawal of 25 sen and 10 sen Government Currency Notes, simul-taneously has the effect of rendering the said Notes void as legal tender;
that a period must be fixed in which the 25 sen and 10 sen Government CurrencyNotes may be exchanged for legal currency at Government Pay Offices, and at PostOffices acting as Government Pay Offices.
In view of:
article 5 and 6 of Law No 1, I 955 (Government Gazette 1955 No I0)H a s d e c i d e d :

272
Firstly : to withdraw from circulation Government Currency Notes in the denominations of 25 sen and 10 sen, issued under the Ordinance of November20, 1947 (Government Gazette 1947, No 205) and of November 21, 1949(Government Gazette 1949 No 343), as from January 1, 1 957, so that saidGovernment Currency Notes shall no longer be legal tender;
Secondly : as from January 1, 1957, no one shall be under the obligation to pass oraccept the Government Currency Notes referred to under Firstly as legaltender; Thirdly: the currency notes referred to under Firstly may be exchanged at their nominal value for legal tender at Government Pay Offices, or at Post Offices acting as Government Pay Offices and other Government bodies under instructions of the minister of Finance, up to andincluding June 30, 1957;
Fourthly : after June 30, 1957, all claims of holders of the Government CurrencyNotes, or part thereof, referred to under Firstly, shall become extinct andno exchange whatsoever shall be made;
Fifthly : to ensure common knowledge, this Decree shall be published in the Government Gazette of the Republic of Indonesia.

273
APPENDIX J
ANNOUNCEMENT OF BANK INDONESIA
dated November 22, l957
The Governor and Managing Directors of Bank Indonesia hereby announce t:hatthe currency notes in the denominations of Rp 2.50, Rp 1.00 and Rp 0.50, issued by theJavasche Bank and dated 1948, will be called in and withdrawn from circulation as fromDecember 1,1957.
Holders of the aforesaid currency notes are called upon to exchange same at theCashiers’ Departments of Bank Indonesia before December 1, 1958.
After the last-mentioned date, the currency notes referred to above can only beexchanged at the Head Office of Bank Indonesia in Djakarta. On request, however, theBranch Offices of Bank Indonesia, after receiving authorization therefor from the HeadOffice, will assist by forwarding such currency notes, free of charge, to the Head Officeto be exchanged.
Claims relating to the exchange of the aforesaid currency notes not yet handed in,will become extinct on November 30, 1988.

274
APPENDIX K
GOVERNMENT ANNOUNCEMENT
As generally known, the Government is confronted at present with a variety ofdifficulties in the monetary, financial and economic fields. The main causes are the defi-cit of the budget and the sharp decline of foreign exchange income which has broughtmonetary reserves to a level dangerous for the economy, if no measures are taken promptlyto improve conditions.
As a preliminary step in the foreign currency field, the Monetary Board restrictedforeign exchange expenditure for imports of foreign commodities some time ago.
The Monetary Board fully realizes that restrictions of imports cannot continueindefinitely, since this would have the effect of greatly diminishing supplies and woulddisturb the economy.
Recurrent budgetary deficits over the past few years, coupled with negligible im-provement in production, largely account for monetary conditions not yet having reachedequilibrium. An excessive volume of money furthermore gave rise to an extravaganteagerness to buy, particularly import goods. This handicapped the balance of paymentsposition and eventually caused foreign exchange holdings to slump.
The above developments caused the value of the rupiah to tumble down. which, inturn, was the primary cause for reduced exports and impeded foreign trade.
In connection with the above difficulties, the Monetary Board deems it necessaryto introduce changes in the current regulations, with a view to:
(a) bringing exports and imports in balance;(b) build up foreign currency holdings by promoting exports;(c) simplifying foreign exchange regulations.
In view of the considerations set forth above, the Government has sanctioned theMonetary Board Decree Nr 30, as decided on in the Board Meeting of June 18, 1957,and hereby announces the following regulation.

275
I. FOREIGN EXCHANGE REVENUE
(a) E x p o r t s
Exporters engaged in exporting Indonesian goods and produce under foreign ex-change contracts concluded with a bank on or after May 20, 1957, will receive from thebank a B.E. (Bukti Ekspor = Export Certificate) when submitting exports bill of ex-change in accordance with Form 18 signed by the Customs Service on or after June 20,1957, together with the covering shipping documents.
In the case of exports on consignment, the bank will only issue a B.E. to theconsignor when the proceeds of the consignment have been transferred to Indonesia.The B.E. will also be issued if the consignor, at the time of submitting Form 18 B signedby the Customs Service, draws a sight draft. In that case the B.E. will be issued uponsurrender of the sight draft and after the shipping documents have been received by thebank.
The B.E. gives a title to the foreign exchange obtained and the nominal value ofthe B.E. is equal to 100% of the amount of foreign currency.
Its nominal value shall not only be expressed in foreign currency but also in rupi-ahs at the current parity-rate.
B.E.s have a validity of two months and can be sold by the holder— exporter/consignor to importers or to individuals who wish to make transfers abroad for services,this only insofar as they have obtained an S.I.D. (Surat Izin Devisen = Foreign ExchangePermit) from the Biro Devisen Perdagangan (Commercial Foreign Exchange Bureau) orthe Lembaga Alat-Alat Pembajaran Luar Negeri (Foreign Exchange Institute).
Dealings in B.E.s are effected through Foreign Exchange Banks at the current B.E.price, which is dependent on supply and demand.
Exporters/consignors who sell their B.E.s pay to the Government so- calledPembajaran B.E. (Export Certificate Payment) at 20% (twenty percent) of the sellingprice (ad valorem) realized by the seller.

276
With the coming into operation of this regulation, export duties will be suspendedfor the time being.
(b) invisibles
The B.E. regulations set forth under (a) also apply to payments in foreign currencyin the sector of services. The recipients of transfers from foreign countries also receiveB.E.s from the Foreign Exchange Bank concerned at a nominal price equalling the amountof foreign currency transferred; this applies insofar as such transfers are received by aForeign Exchange Bank in Indonesia on or after June 20, l957.
This provision also applies for changing foreign paper currency, traveller’s chequesetc.
Sellers of B.E.s as referred to above are equally subject to the levy of 20%Pembajaran B.E.
Capital transfers from abroad or imports of money under foreign credits are ex-empt from the 20% P.B.E. levy, insofar as such receipts meet the requirements of theForeign Exchange Institute.
(c) Gold deposited with the Foreign Exchange Fund
The B.E. regulations equally apply to gold deposits made with Bank Indonesia orthe Foreign Exchange Fund. In this case, the party concerned receives a B.E. to a nomi-nal value equivalent to (100% of) Rp 12,465 for each kilogram of pure gold, with theproviso that 20% P.B.E. will be levied when the said B.E. is sold.
II. FOREIGN EXCHANGE EXPENDITURE
(a) I m p o r t s
With regard to S.I.D.s (Foreign Exchange Permits) issued by B.D.P. (Bureau Com-mercial Foreign Exchange) on or after June 20, 1957, it is hereby decreed that imports

277
can only be effected if the importer deposits with the Foreign Exchange Bank handlingthe transaction, a B.E. equivalent to 100% of the C & F price of the goods to be im-ported and corresponding with the amount of the S.I.D. (Foreign Exchange Permit).
This does away with the need of a prepayment and the payment of T.P.I. at thetime when putting in a P.I.I. (Application for Import Permit).
When putting in the P.I.I., the importer is bound to make a deposit to an amountof 20% (twenty percent) of the C & F value at the parity-rate.
Such a deposit is forfeited to the Foreign Exchange Fund (that is, the State) in casethe S.I.D. is not realized within the period specified by LAAPLN in a special regulation.
In case imports fall within the categories of import goods on which T.P.I. is levied,the importer is bound to pay T.P.I. when the Foreign Exchange Bank receives the S.I.D.from B.D.P.
As from June 20, 1957, six T.P.I. categories have been introduced :
Category I - 0%Category II - 20%Category III - 50%Category IV - 100%Category V - 140%Category VI - 175%
The Minister of Trade determines which imports come under T.P.I. Categories I—VI.
T.P.I. payments, at their specific percentage rates, are calculated on the basis ofactual B.E. prices, that is, the actual price paid by the importer to buy the B.E.s.
Import duties are calculated on the basis of the so-called customs value, that is, theB.E. price the importer paid, with T.P.I. added.

278
(b) Invisibles
As from June 20, 1957, Foreign Exchange Banks are only permitted to effect trans-fers to foreign countries, provided the transferor has submitted B.E.s to a nominal valueequivalent to 100% of the amount of foreign currency to be paid to the transfereeabroad in accordance with the LAAPLN foreign exchange permit, irrespective of whetherthis permit was issued by LAAPLN prior to June 20, 1957.
This regulation also applies to sales of foreign paper currency, traveller’s cheques etc.
(C) T.P.T.
A new regulation applies to the transfer of profits and dividends over the financialyears 1955 and 1956, with the proviso that, should transfer under the new regulationsturn out to be more expensive than under the old system in operation up to now, noT.P:T. payment under the old system is required.
Transfers of profits and dividends over the financial year 1957 are subject to T.P.T.at a percentage to be fixed at a later date.
Transfers of profits by enterprises, considered new investments, are exempt fromT.P.T..
III. TRANSITORY PROVISION
The old system still applies for settling transactions running before June 20, 1957,and which, under this Announcement, cannot be classified under the new regulations.
Unexpired B.P.E.s (Export Inducement Certificates) can be applied in the samemanner as B.E.s under the new regulations.
The date when this new regulation will come into force for the barter/ consign-ment areas in Sumatra will be determined later.

279
APPENDIX L

280
APPENDIX M

281
APPENDIX N

282
APPENDIX O

283