Azimuth-dependent recovery cycle affects directional selectivity of bat inferior collicular neurons...
8
Short communication Azimuth-dependent recovery cycle affects directional selectivity of bat inferior collicular neurons determined with sound pulses within a pulse train Xiaoming Zhou, Philip H.-S. Jen * Division of Biological Sciences and Interdisciplinary Neuroscience Program, University of Missouri-Columbia, 208 Lefevre Hall, Columbia, MO 65211-6190, USA Accepted 4 June 2004 Available online 17 July 2004 Abstract In our previous study, we have shown that the recovery cycle of most neurons in the inferior colliculus (IC) of the big brown bat, Eptesicus fuscus, is typically longer at ipsilateral azimuth than at contralateral azimuth under free-field stimulation conditions. The present study is to test the hypothesis that this azimuth-dependent recovery cycle may contribute to the variation of directional selectivity of IC neurons with sequential presented sound pulses within a pulse train. A 300-ms pulse train containing nine sound pulses of 4-ms with an inter- pulse interval of 33.3 ms was delivered at several selected azimuthal angles between F 80j lateral in the frontal auditory space of a bat. A family of nine directional selectivity curves was plotted with a neuron’s number of impulses in response to each individual pulse against the azimuthal angles. The type and sharpness of these directional selectivity curves were then compared in relation to pulse position within the pulse train. All 675 directional selectivity curves obtained from 75 IC neurons could be described as directionally selective (423, 63%), hemifield (220, 32%), or non-directional (32, 5%). The directional selectivity curves of 45 (60%) neurons did not vary with pulse position. However, those of the remaining neurons (30, 40%) changed from one type to another such that the number of neurons with directionally selective curves progressively increased and the number of neurons with hemifield and non-directional selectivity curves decreased with increasing pulse position within the pulse train. Among 68 IC neurons whose directional selectivity curves were compared quantitatively, directional selectivity determined with sequentially presented sound pulses significantly increased in 38 (56%) neurons; decreased in 18 (26%) neurons but did not change in 12 (18%) neurons. This change of directional selectivity was due to the variation in recovery cycle of these IC neurons with azimuthal angle as we hypothesized. D 2004 Elsevier B.V. All rights reserved. Theme: Sensory systems Topic: Auditory systems: central physiology Keywords: Bat; Directional selectivity; Inferior colliculus; Inter-pulse interval; Recovery cycle Previous studies suggested that the directional selectiv- ity of auditory neurons is one of the essential response properties underlying detection and localization of prey by insectivorous bats during hunting. These studies showed that most neurons in the inferior colliculus (IC) of bats discharged maximally or displayed lowest threshold to sounds delivered from an angle or a range of angles and their response magnitude changed significantly with a 1– 2j shift in sound direction along the midline of the frontal auditory space [2,5 – 8,11,13,19,20,24 – 26]. These studies also showed that the directional selectivity of IC neurons could be influenced by frequency, intensity, and type of sound stimulus. For example, the sharpness of directional selectivity curves of most IC neurons increased with pulse frequency [2,11,13,20]. The shape of direc- tional selectivity curve and the angle of maximal sensi- 0006-8993/$ - see front matter D 2004 Elsevier B.V. All rights reserved. doi:10.1016/j.brainres.2004.06.004 Abbreviations: AR, angular range; BA, best angle; BF, best frequency; IC, inferior colliculus; MT, minimum threshold; nAR, normalized angular range; PRR, pulse repetition rate; PST, peri-stimulus time; SPL, sound pressure level * Corresponding author. Tel.: +1-573-882-7479; fax: +1-573-884- 5020. E-mail address: [email protected] (P.H.-S. Jen). www.elsevier.com/locate/brainres Brain Research 1019 (2004) 281 – 288
Transcript of Azimuth-dependent recovery cycle affects directional selectivity of bat inferior collicular neurons...
www.elsevier.com/locate/brainres
Brain Research 1019 (2004) 281–288
Short communication
Azimuth-dependent recovery cycle affects directional selectivity
of bat inferior collicular neurons determined with
sound pulses within a pulse train
Xiaoming Zhou, Philip H.-S. Jen*
Division of Biological Sciences and Interdisciplinary Neuroscience Program, University of Missouri-Columbia, 208 Lefevre Hall,
Columbia, MO 65211-6190, USA
Accepted 4 June 2004
Available online 17 July 2004
Abstract
In our previous study, we have shown that the recovery cycle of most neurons in the inferior colliculus (IC) of the big brown bat,
Eptesicus fuscus, is typically longer at ipsilateral azimuth than at contralateral azimuth under free-field stimulation conditions. The present
study is to test the hypothesis that this azimuth-dependent recovery cycle may contribute to the variation of directional selectivity of IC
neurons with sequential presented sound pulses within a pulse train. A 300-ms pulse train containing nine sound pulses of 4-ms with an inter-
pulse interval of 33.3 ms was delivered at several selected azimuthal angles between F 80j lateral in the frontal auditory space of a bat. A
family of nine directional selectivity curves was plotted with a neuron’s number of impulses in response to each individual pulse against the
azimuthal angles. The type and sharpness of these directional selectivity curves were then compared in relation to pulse position within the
pulse train. All 675 directional selectivity curves obtained from 75 IC neurons could be described as directionally selective (423, 63%),
hemifield (220, 32%), or non-directional (32, 5%). The directional selectivity curves of 45 (60%) neurons did not vary with pulse position.
However, those of the remaining neurons (30, 40%) changed from one type to another such that the number of neurons with directionally
selective curves progressively increased and the number of neurons with hemifield and non-directional selectivity curves decreased with
increasing pulse position within the pulse train. Among 68 IC neurons whose directional selectivity curves were compared quantitatively,
directional selectivity determined with sequentially presented sound pulses significantly increased in 38 (56%) neurons; decreased in 18
(26%) neurons but did not change in 12 (18%) neurons. This change of directional selectivity was due to the variation in recovery cycle of
these IC neurons with azimuthal angle as we hypothesized.
D 2004 Elsevier B.V. All rights reserved.
Theme: Sensory systems
Topic: Auditory systems: central physiology
Keywords: Bat; Directional selectivity; Inferior colliculus; Inter-pulse interval; Recovery cycle
Previous studies suggested that the directional selectiv- that most neurons in the inferior colliculus (IC) of bats
ity of auditory neurons is one of the essential response
properties underlying detection and localization of prey by
insectivorous bats during hunting. These studies showed
0006-8993/$ - see front matter D 2004 Elsevier B.V. All rights reserved.
doi:10.1016/j.brainres.2004.06.004
Abbreviations: AR, angular range; BA, best angle; BF, best frequency;
IC, inferior colliculus; MT, minimum threshold; nAR, normalized angular
range; PRR, pulse repetition rate; PST, peri-stimulus time; SPL, sound
pressure level
* Corresponding author. Tel.: +1-573-882-7479; fax: +1-573-884-
5020.
E-mail address: [email protected] (P.H.-S. Jen).
discharged maximally or displayed lowest threshold to
sounds delivered from an angle or a range of angles and
their response magnitude changed significantly with a 1–
2j shift in sound direction along the midline of the
frontal auditory space [2,5–8,11,13,19,20,24–26]. These
studies also showed that the directional selectivity of IC
neurons could be influenced by frequency, intensity, and
type of sound stimulus. For example, the sharpness of
directional selectivity curves of most IC neurons increased
with pulse frequency [2,11,13,20]. The shape of direc-
tional selectivity curve and the angle of maximal sensi-

X. Zhou, P.H.-S. Jen / Brain Research 1019 (2004) 281–288282
tivity of IC neurons also varied with pulse intensity
[7,20].
We reported previously that the directional selectivity of
IC neurons in terms of spatial receptive field significantly
increased when a sound was paired with another one that
was delivered within a temporal window and with frequen-
cy–intensity combinations within the neuron’s inhibitory
area [25]. Furthermore, the directional selectivity of IC
neurons improved with increasing pulse repetition rate
(PRR) of temporally patterned pulse trains [24,26]. This
improvement of directional selectivity was mostly due to a
selective decline of response at the two sides of the best
angle (BA) at high PRRs [26]. These studies indicate that
the temporal sequence of sound pulses may influence the
directional selectivity of IC neurons. Thus, a neuron’s
directional selectivity determined with single pulses in
temporal isolation might not predict well its response
property in the real world where sound pulses occur in
more complex temporal conditions.
Our recent study showed that the recovery cycle of most
IC neurons of the big brown bat, Eptesicus fuscus, was
longer when determined with paired sound pulses delivered
at ipsilateral than at contralateral azimuthal angles. Presum-
ably, this azimuth-dependent recovery cycle was mainly due
to the variation in binaural interaction with sound azimuth,
although the effects of head shadowing were not disen-
tangled due to the free-field stimulus conditions [27].
Because a neuron’s recovery cycle determines its ability to
respond to closely repetitive sound pulses, we hypothesize
that this azimuth-dependent recovery cycle may contribute
to variation of directional selectivity of IC neurons with
sequentially presented sound pulses within a pulse train.
To test this hypothesis, we plotted a family of directional
selectivity curves with a neuron’s number of impulses in
response to each of nine sequentially presented sound pulses
against the azimuthal angles. We also determined the
variation of recovery cycle of these neurons with azimuthal
angle. We then compared and correlated the type and
sharpness of these directional selectivity curves in relation
to pulse position within the pulse train as well as their
azimuth-dependent recovery cycle.
Ten E. fuscus (18–22 g, body weight, b.w.) were used for
this study. Surgical procedures and the experimental setup
were basically the same as in previous studies [13,26,27].
Briefly, 1 or 2 days before the recording session, a 1.8-cm
nail was glued onto the exposed skull of Nembutal-anes-
thetized (45–50 mg/kg b.w.) bat with acrylic glue and
dental cement. During recording session, the bat was ad-
ministered the neuroleptanalgesic Innovar-Vet (Fentanyl
0.08 mg/kg b.w., Droperidol 4 mg/kg b.w.). The bat was
then placed inside a bat holder (made of wire mesh) that was
suspended in an elastic sling inside a double-wall sound-
proof room (Industrial Acoustics Company, temperature
28–30 jC). The ceiling and inside walls of the room were
covered with 3-in. convoluted polyurethane foam to reduce
echoes. After immobilizing the bat’s head by fixing the
shank of the nail into a mental rod with a set screw, its eye–
snout line was then pointed visually to 0j in azimuth and 0jin elevation of the frontal auditory space by adjusting the
mental rod. Small holes were bored in the skull above the IC
for insertion of 3 M KCl glass pipette electrodes (imped-
ance: 5–10 MV) to record auditory responses of IC neu-
rons. Additional doses of Innovar-Vet were administered
during later phases of recording when the bat became
restless. Each bat was used in one to five recording sessions
on separate days and each recording session typically lasts
for 4–6 h. These procedures were conducted in compliance
with NIH publication No. 85-23, ‘‘Principles of Laboratory
Animal Care’’ and with the approval of the Institutional
Animal Care and Use Committee (#1438) of the University
of Missouri-Columbia.
Acoustic stimuli (4 ms with 0.5 ms rise–decay times)
were generated with an oscillator (KH model 1200) and a
homemade electronic switch driven by a stimulator (Grass
S88). These stimuli were then amplified after passing
through a decade attenuator (HP 350D) before they were
fed to a small condenser loudspeaker (AKG model CK 50,
1.5 cm diameter, 1.2 g) that was placed 23 cm away from
the bat. The loudspeaker could be positioned at 0j elevation
and in any specific azimuth within F 90j in the frontal
auditory space through a remote control system driven by
two small electric motors. To avoid potential influence of
noises generated by the motors on response of a recorded
neuron, the motors were always turned off after positioning
the loudspeaker at each selected azimuthal angle. Calibra-
tion of the loudspeaker was performed with a 1/4 in.
microphone (B&K 4135) placed at the position of the bat’s
head during recording using a measuring amplifier (B&K
2607). The output of the loudspeaker was expressed in
decibels of sound pressure level (SPL) in reference to 20
APa root mean square.
Upon isolation of an IC neuron with 4 ms sound pulses
delivered at a rate of two per second from contralateral 40jrelative to the recording site, its best frequency (BF) and
minimum threshold (MT) were determined by changing the
frequency and intensity of sound pulses. At the MT, the
probability of the neuron’s response to BF sound pulses was
about 50%. The directional selectivity of an IC neuron was
studied with 32 presentations of a 300-ms pulse train
containing 4-ms BF sound pulses delivered at two trains
per second. Thus there was always a 200-ms silent period
between pulse trains. The onset-to-onset inter-pulse interval
within the pulse train was set at 33.3 ms (i.e., the number of
pulses was nine within the pulse train) and the intensity of
pulses was set at 20 dB above the neuron’s MT. The number
of impulses of a neuron discharged to pulse train at nine
selected azimuthal angles (contralateral 20j, 40j, 60j, 80j;ipsilateral 20j, 40j, 60j, 80j relative to the recording site,
abbreviated as c20j, c40j, c60j, c80j; or i20j, i40j, i60j,i80j, and the front, e.g., 0j) was recorded. A family of
directional selectivity curves of each neuron was then
plotted using the number of impulses in response to each
X. Zhou, P.H.-S. Jen / Brain Research 1019 (2004) 281–288 283
of nine sequentially presented sound pulses against these
azimuthal angles. The pulse train was presented randomly
from different azimuthal angles to avoid the potential effect
of sequential presentation of pulse train at selected azimuth-
al angles on a neuron’s response. A neuron’s BA was
defined as the angle to which the number of impulses was
maximal and at least 50% greater than that obtained at other
azimuthal angles. The sharpness of a directional selectivity
curve was expressed by half of the angular range (abbrevi-
ated as AR, see Fig. 1Ba,b) at 50% below the maximum of
each directional selectivity curve. A normalized AR (abbre-
viated as nAR) was then obtained by dividing the maximum
by the AR. The ARs and nARs of directional selectivity
curves of each IC neuron were compared statistically across
each of the nine pulses within pulse trains using repeated
measures one-way ANOVA at p < 0.01.
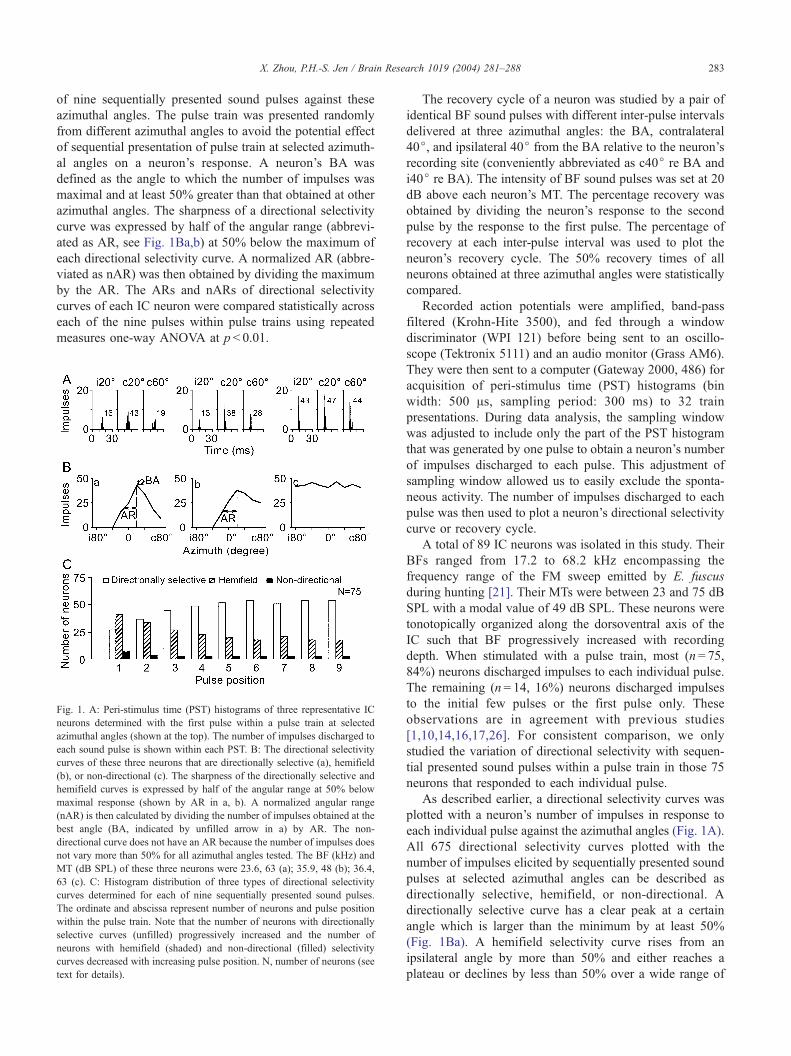
Fig. 1. A: Peri-stimulus time (PST) histograms of three representative IC
neurons determined with the first pulse within a pulse train at selected
azimuthal angles (shown at the top). The number of impulses discharged to
each sound pulse is shown within each PST. B: The directional selectivity
curves of these three neurons that are directionally selective (a), hemifield
(b), or non-directional (c). The sharpness of the directionally selective and
hemifield curves is expressed by half of the angular range at 50% below
maximal response (shown by AR in a, b). A normalized angular range
(nAR) is then calculated by dividing the number of impulses obtained at the
best angle (BA, indicated by unfilled arrow in a) by AR. The non-
directional curve does not have an AR because the number of impulses does
not vary more than 50% for all azimuthal angles tested. The BF (kHz) and
MT (dB SPL) of these three neurons were 23.6, 63 (a); 35.9, 48 (b); 36.4,
63 (c). C: Histogram distribution of three types of directional selectivity
curves determined for each of nine sequentially presented sound pulses.
The ordinate and abscissa represent number of neurons and pulse position
within the pulse train. Note that the number of neurons with directionally
selective curves (unfilled) progressively increased and the number of
neurons with hemifield (shaded) and non-directional (filled) selectivity
curves decreased with increasing pulse position. N, number of neurons (see
text for details).
The recovery cycle of a neuron was studied by a pair of
identical BF sound pulses with different inter-pulse intervals
delivered at three azimuthal angles: the BA, contralateral
40j, and ipsilateral 40j from the BA relative to the neuron’s
recording site (conveniently abbreviated as c40j re BA and
i40j re BA). The intensity of BF sound pulses was set at 20
dB above each neuron’s MT. The percentage recovery was
obtained by dividing the neuron’s response to the second
pulse by the response to the first pulse. The percentage of
recovery at each inter-pulse interval was used to plot the
neuron’s recovery cycle. The 50% recovery times of all
neurons obtained at three azimuthal angles were statistically
compared.
Recorded action potentials were amplified, band-pass
filtered (Krohn-Hite 3500), and fed through a window
discriminator (WPI 121) before being sent to an oscillo-
scope (Tektronix 5111) and an audio monitor (Grass AM6).
They were then sent to a computer (Gateway 2000, 486) for
acquisition of peri-stimulus time (PST) histograms (bin
width: 500 As, sampling period: 300 ms) to 32 train
presentations. During data analysis, the sampling window
was adjusted to include only the part of the PST histogram
that was generated by one pulse to obtain a neuron’s number
of impulses discharged to each pulse. This adjustment of
sampling window allowed us to easily exclude the sponta-
neous activity. The number of impulses discharged to each
pulse was then used to plot a neuron’s directional selectivity
curve or recovery cycle.
A total of 89 IC neurons was isolated in this study. Their
BFs ranged from 17.2 to 68.2 kHz encompassing the
frequency range of the FM sweep emitted by E. fuscus
during hunting [21]. Their MTs were between 23 and 75 dB
SPL with a modal value of 49 dB SPL. These neurons were
tonotopically organized along the dorsoventral axis of the
IC such that BF progressively increased with recording
depth. When stimulated with a pulse train, most (n = 75,
84%) neurons discharged impulses to each individual pulse.
The remaining (n= 14, 16%) neurons discharged impulses
to the initial few pulses or the first pulse only. These
observations are in agreement with previous studies
[1,10,14,16,17,26]. For consistent comparison, we only
studied the variation of directional selectivity with sequen-
tial presented sound pulses within a pulse train in those 75
neurons that responded to each individual pulse.
As described earlier, a directional selectivity curves was
plotted with a neuron’s number of impulses in response to
each individual pulse against the azimuthal angles (Fig. 1A).
All 675 directional selectivity curves plotted with the
number of impulses elicited by sequentially presented sound
pulses at selected azimuthal angles can be described as
directionally selective, hemifield, or non-directional. A
directionally selective curve has a clear peak at a certain
angle which is larger than the minimum by at least 50%
(Fig. 1Ba). A hemifield selectivity curve rises from an
ipsilateral angle by more than 50% and either reaches a
plateau or declines by less than 50% over a wide range of
X. Zhou, P.H.-S. Jen / Brain Research 1019 (2004) 281–288284
contralateral angles (Fig. 1Bb). A non-directional selectivity
curve does not show any clear maximum at a particular
angle and the number of impulses obtained from all angles
tested never differs by more than 50% (Fig. 1Bc).
Fig. 1C shows the distribution of these three types of
directional selectivity curves of 75 neurons obtained with
sequentially presented sound pulses. Directional selectivity
curves of 45 (60%) neurons did not change with pulse
position, including 25 directionally selective, 17 hemifield,
and 3 non-directional curves. Directional selectivity curves
of the remaining neurons (30, 40%) changed from one type
to another such that the number of neurons with direction-
ally selective curves progressively increased and the number
of neurons with hemifield and non-directional selectivity
curves decreased with increasing pulse position.
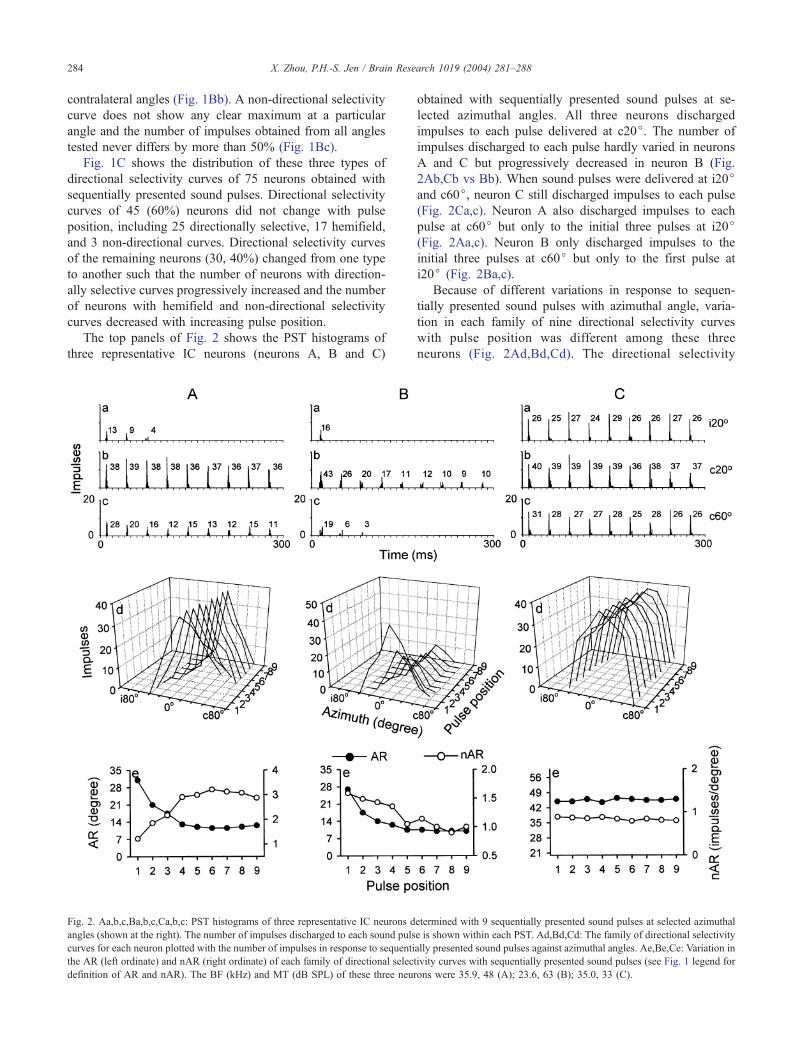
The top panels of Fig. 2 shows the PST histograms of
three representative IC neurons (neurons A, B and C)
Fig. 2. Aa,b,c,Ba,b,c,Ca,b,c: PST histograms of three representative IC neurons d
angles (shown at the right). The number of impulses discharged to each sound puls
curves for each neuron plotted with the number of impulses in response to sequenti
the AR (left ordinate) and nAR (right ordinate) of each family of directional select
definition of AR and nAR). The BF (kHz) and MT (dB SPL) of these three neur
obtained with sequentially presented sound pulses at se-
lected azimuthal angles. All three neurons discharged
impulses to each pulse delivered at c20j. The number of
impulses discharged to each pulse hardly varied in neurons
A and C but progressively decreased in neuron B (Fig.
2Ab,Cb vs Bb). When sound pulses were delivered at i20jand c60j, neuron C still discharged impulses to each pulse
(Fig. 2Ca,c). Neuron A also discharged impulses to each
pulse at c60j but only to the initial three pulses at i20j(Fig. 2Aa,c). Neuron B only discharged impulses to the
initial three pulses at c60j but only to the first pulse at
i20j (Fig. 2Ba,c).
Because of different variations in response to sequen-
tially presented sound pulses with azimuthal angle, varia-
tion in each family of nine directional selectivity curves
with pulse position was different among these three
neurons (Fig. 2Ad,Bd,Cd). The directional selectivity
etermined with 9 sequentially presented sound pulses at selected azimuthal
e is shown within each PST. Ad,Bd,Cd: The family of directional selectivity
ally presented sound pulses against azimuthal angles. Ae,Be,Ce: Variation in
ivity curves with sequentially presented sound pulses (see Fig. 1 legend for
ons were 35.9, 48 (A); 23.6, 63 (B); 35.0, 33 (C).

X. Zhou, P.H.-S. Jen / Brain Research 1019 (2004) 281–288 285
curve of neuron A changed from hemifield to the first
pulse to directionally selective to the remaining pulses
(Fig. 2Ad). The AR of directional selectivity curves
decreased drastically for the first four sound pulses and
then hardly changed for the following presented pulses
(Fig. 2Ae, filled circles). The decrease of AR was mainly
due to a selective drop in response at two sides of the BA.
Neuron B always had a directionally selective curve to
each pulse and the AR also progressively decreased with
increasing pulse position (Fig. 2Bd,Be, filled circles).
However, the decrease of AR was due to a decline in
response over the entire range of azimuthal angles includ-
ing the BA. Unlike neurons A and B, the shape and AR of
directional selectivity curves of neuron C hardly changed
with increasing pulse position (Fig. 2Cd,Ce, filled circles).
This little change in AR was due to the minor change in
response magnitude to sequentially presented sound pulses
at each azimuthal angle (Fig. 2Ca,b,c).
Because the decrease of AR with pulse position in
individual neurons (such as neurons A and B) may be due
to different ways of decline in response to sound pulses
presented at each azimuthal angle, we divided a neuron’s
maximal number of impulses to each pulse by the AR to
obtain an nAR. This normalized nAR allows us to determine
if variation in the sharpness of directional selectivity curve
of a neuron with pulse position within a pulse train is mainly
due to a change in directional selectivity or simply due to a
decrease in response over a wide range of azimuthal angles
(e.g., Fig. 2A d vs. Bd).
As shown in the bottom panel of Fig. 2, the nAR of
neuron A progressively increased with sequentially pre-
sented sound pulses indicating an increase in directional
selectivity (Fig. 2Ae, unfilled circles). Conversely, the nAR
of neuron B progressively decreased with increasing pulse
position indicating a decrease in directional selectivity as a
result of overall decline in response magnitude (Fig. 2Be,
Fig. 3. The variation of average AR and nAR of three groups of IC neurons determ
half of a standard deviation. n, number of neurons.
unfilled circles). The nAR of neuron C hardly varied with
increasing pulse position indicating little change in direc-
tional selectivity with sound position (Fig. 2Ce, unfilled
circles).
In total, the AR and nAR were obtained for 68 neurons
because the other 7 had non-directional selectivity curves.
As shown in Fig. 3, these neurons could be divided into
three groups according to the variation of AR and nAR with
sequentially presented sound pulses. The average AR and
nAR of group I (38, 56%) neurons (like neuron A of Fig. 2)
varied significantly in opposite ways with increasing pulse
position (Fig. 3Aa,b; one-way ANOVA, p < 0.0001). This
significant variation in the AR or nAR was due to the large
differences between the average values of AR or nAR
determined with the initial two or three pulses and with
the remaining ones. Both the AR and nAR of group II (18,
26%) neurons (like neuron B of Fig. 2) significantly
decreased with increasing pulse position (Fig. 3Ba,b; one-
way ANOVA, p < 0.0001). The AR and nAR of group III
(12, 18%) neurons (like neuron C of Fig. 2) hardly varied
with sequentially presented sound pulses (Fig. 3Ca,b; one-
way ANOVA, p>0.1).
To determine whether the variation of AR and nAR with
sequentially presented sound pulses might be related to the
BF or MT, we compared the average BF and MT of these
three groups of IC neurons. As shown in Table 1, these three
groups of IC neurons did not differ significantly in BF and
MT (Table 1; one-way ANOVA, p>0.1).
The recovery cycles of three neurons of Fig. 2 are shown
in the top panel of Fig. 4. Neuron A had a very fast recovery
cycle when determined at the BA (Fig. 4Aa, filled circles).
Its recovery cycle became longer when determined at two
lateral azimuthal angles, in particular at i40j re BA (Fig.
4Aa, unfilled circles and filled squares). Neuron B also had
a shorter recovery cycle at the BA than at two lateral
azimuthal angles (Fig. 4Ba). However, neuron B had a
ined with sequentially presented sound pulses. Each vertical bar represents
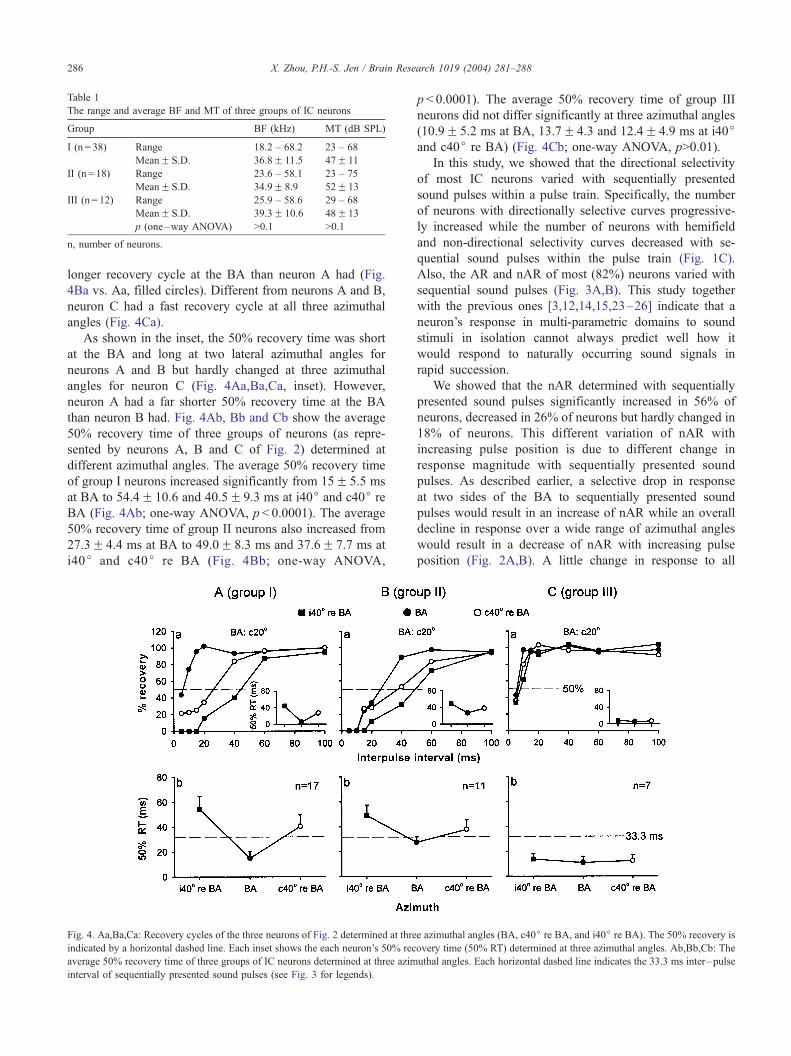
Table 1
The range and average BF and MT of three groups of IC neurons
Group BF (kHz) MT (dB SPL)
I (n = 38) Range 18.2 – 68.2 23 – 68
MeanF S.D. 36.8F 11.5 47F 11
II (n = 18) Range 23.6 – 58.1 23 – 75
MeanF S.D. 34.9F 8.9 52F 13
III (n = 12) Range 25.9 – 58.6 29 – 68
MeanF S.D. 39.3F 10.6 48F 13
p (one–way ANOVA) >0.1 >0.1
n, number of neurons.
X. Zhou, P.H.-S. Jen / Brain Research 1019 (2004) 281–288286
longer recovery cycle at the BA than neuron A had (Fig.
4Ba vs. Aa, filled circles). Different from neurons A and B,
neuron C had a fast recovery cycle at all three azimuthal
angles (Fig. 4Ca).
As shown in the inset, the 50% recovery time was short
at the BA and long at two lateral azimuthal angles for
neurons A and B but hardly changed at three azimuthal
angles for neuron C (Fig. 4Aa,Ba,Ca, inset). However,
neuron A had a far shorter 50% recovery time at the BA
than neuron B had. Fig. 4Ab, Bb and Cb show the average
50% recovery time of three groups of neurons (as repre-
sented by neurons A, B and C of Fig. 2) determined at
different azimuthal angles. The average 50% recovery time
of group I neurons increased significantly from 15F 5.5 ms
at BA to 54.4F 10.6 and 40.5F 9.3 ms at i40j and c40j re
BA (Fig. 4Ab; one-way ANOVA, p < 0.0001). The average
50% recovery time of group II neurons also increased from
27.3F 4.4 ms at BA to 49.0F 8.3 ms and 37.6F 7.7 ms at
i40j and c40j re BA (Fig. 4Bb; one-way ANOVA,
Fig. 4. Aa,Ba,Ca: Recovery cycles of the three neurons of Fig. 2 determined at thre
indicated by a horizontal dashed line. Each inset shows the each neuron’s 50% rec
average 50% recovery time of three groups of IC neurons determined at three azim
interval of sequentially presented sound pulses (see Fig. 3 for legends).
p < 0.0001). The average 50% recovery time of group III
neurons did not differ significantly at three azimuthal angles
(10.9F 5.2 ms at BA, 13.7F 4.3 and 12.4F 4.9 ms at i40jand c40j re BA) (Fig. 4Cb; one-way ANOVA, p>0.01).
In this study, we showed that the directional selectivity
of most IC neurons varied with sequentially presented
sound pulses within a pulse train. Specifically, the number
of neurons with directionally selective curves progressive-
ly increased while the number of neurons with hemifield
and non-directional selectivity curves decreased with se-
quential sound pulses within the pulse train (Fig. 1C).
Also, the AR and nAR of most (82%) neurons varied with
sequential sound pulses (Fig. 3A,B). This study together
with the previous ones [3,12,14,15,23–26] indicate that a
neuron’s response in multi-parametric domains to sound
stimuli in isolation cannot always predict well how it
would respond to naturally occurring sound signals in
rapid succession.
We showed that the nAR determined with sequentially
presented sound pulses significantly increased in 56% of
neurons, decreased in 26% of neurons but hardly changed in
18% of neurons. This different variation of nAR with
increasing pulse position is due to different change in
response magnitude with sequentially presented sound
pulses. As described earlier, a selective drop in response
at two sides of the BA to sequentially presented sound
pulses would result in an increase of nAR while an overall
decline in response over a wide range of azimuthal angles
would result in a decrease of nAR with increasing pulse
position (Fig. 2A,B). A little change in response to all
e azimuthal angles (BA, c40j re BA, and i40j re BA). The 50% recovery is
overy time (50% RT) determined at three azimuthal angles. Ab,Bb,Cb: The
uthal angles. Each horizontal dashed line indicates the 33.3 ms inter–pulse

X. Zhou, P.H.-S. Jen / Brain Research 1019 (2004) 281–288 287
presented sound pulses would hardly change the nAR value
(Fig. 2C). This different variation of nAR in three groups of
IC neurons is due to their different recovery cycles.
For example, the average 50% recovery time of the first
group of neurons was 15F 5.5 ms at BA but significantly
increased more than 33.3 ms at two lateral azimuthal angles
(Fig. 4Ab). For this reason, the response magnitude of this
group of neurons to sequentially presented sound pulses
would recover fully at the BA but not at two lateral sides of
the BA (Fig. 2Aa,b,c). Therefore, response magnitude
would only selectively drop at the two sides of the BA
but not at the BA (Fig. 2Ad). As a result, the AR and nAR
of this group of IC neurons changed oppositely with
increasing pulse position (Figs. 2Ae and 3Aa,b). The
average 50% recovery time of the second group of neurons
was 27.3F 4.4 ms at BA but was larger than 33.3 ms at two
lateral azimuthal angles (Fig. 4Bb). Thus the response
magnitude of this group of neurons would not fully recover
not only at the BA but also even less at two lateral azimuthal
angles (Fig. 2Ba,b,c). For this reason, the response magni-
tude of this group of neurons would progressively drop at all
azimuthal angles (Fig. 2Bd). As a result, the AR and nAR of
this group of IC neurons both significantly decreased with
increasing pulse position (Figs. 2Be and 3Ba,b). The aver-
age 50% recovery time of the third group of neurons was
always shorter than 14 ms at all three azimuthal angles (Fig.
4Cb). Therefore, the response magnitude of this group of
neurons would recover fully at all three azimuthal angles
such that they would discharge almost equally well to each
presented sound pulse at each azimuthal angle (Fig.
2Ca,b,c). As a result, the AR and nAR of this group of IC
neurons varied very little with sequentially presented sound
pulses (Figs. 2Ce and 3Ca,b).
Previous studies have shown that the head shadowing
effect is greater on responses of high BF than low BF
neurons because of frequency-dependent pinna transfer
functions [9,18]. In the present study, we showed that three
groups of IC neurons whose recovery cycles varied differ-
ently with sound azimuth did not differ significantly in BF
(Table 1). This observation suggests that the azimuth-de-
pendent recovery cycle of IC neurons observed in the
present study is most likely due to the binaural inhibition.
While the contribution of head shadowing effect cannot be
excluded under the present free-field stimulation conditions,
we have recently shown that the azimuth-dependent recov-
ery cycle of IC neurons in the same bat species is abolished
or greatly reduced during iontophoretic application of bicu-
culline [27]. This observation suggests that the azimuth-
dependent recovery cycle of IC neurons is mainly, if not
only, attributed to GABAergic binaural inhibition. Clearly,
future work with the combined ear-phone system and free-
field study would be necessary to determine the contribution
of head shadowing effect on azimuth-dependent recovery
cycle of IC neurons.
We showed that directional selectivity of 56% of IC
neurons increased with sequentially presented sound pulses
at inter-pulse interval of 33.3 ms. The 33.3 ms inter-pulse
interval is equivalent to that occurring during the approach
phase of hunting [4,22]. Because the effect of sound
position within a pulse train on the nAR of IC neurons is
dependent upon the change in recovery cycle with sound
azimuth, directional selectivity of IC neurons with extreme-
ly short recovery cycle would increase with sequentially
presented sound pulses even at shorter inter-pulse interval.
For example, while directional selectivity of those 18% IC
neurons with short recovery cycle was hardly affected by
pulse position at 33.3 ms inter-pulse interval, their direc-
tional selectivity would conceivably increase with sequen-
tially presented sound pulses at shorter inter-pulse intervals.
We have previously shown that response magnitude of those
IC neurons that could discharge impulses to each presented
sound pulse dropped even greater at lateral azimuthal angles
at inter-pulse intervals of 11.1 ms as that occurring during
the terminal phase of hunting [26]. It is therefore conceiv-
able that IC neurons with shorter recovery cycle would be
systematically recruited to improve directional selectivity to
increasing number of echoes throughout the course of
hunting to facilitate interception of prey.
On the other hand, natural sound signals such as vocal
communication signals of many animal species including
speech by humans, typically occur in rapid succession rather
in isolation. It is conceivable that the present findings might
contribute to the understanding of central auditory process-
ing in complex acoustic environments. For example, the
increase of responsiveness of IC neurons to sequentially
presented sound pulses might serve as a neural basis
underlying facilitation of speech processing in humans.
Acknowledgements
We thank three anonymous reviewers for reading an
earlier version of this manuscript. This work is supported by
the Research Council of the University of Missouri-
Columbia and by a Sorenson Fund.
References
[1] J.H. Casseday, E. Covey, Frequency tuning properties of neurons in
the inferior colliculus of an FM bat, J. Comp. Neurol. 319 (1992)
34–50.
[2] Z.M. Fuzessery, G.D. Pollak, Determinants of sound location selec-
tivity in bat inferior colliculus: a combined dichotic and free-field
stimulation study, J. Neurophysiol. 54 (1985) 757–781.
[3] A.V. Galazyuk, D. Llano, A.S. Feng, Temporal dynamics of acoustic
stimuli enhance amplitude tuning of inferior colliculus neurons,
J. Neurophysiol. 83 (2000) 128–138.
[4] D.R. Griffin, Listening in the Dark, Yale Univ. Press, New Haven,
1958, Reprinted by Comstock, Ithaca, 1986.
[5] A.D. Grinnell, The neurophysiology of audition in bats: directional
localization and binaural, J. Physiol. (Lond.) 167 (1963) 97–113.
[6] A.D. Grinnell, V.S. Griennell, Neural correlates of vertical localiza-
tion by echolocating bats, J. Physiol. (Lond.) 181 (1965) 830–851.
[7] B. Grothe, E. Covey, J.H. Casseday, Spatial tuning of neurons in the
X. Zhou, P.H.-S. Jen / Brain Research 1019 (2004) 281–288288
inferior colliculus of the big brown bat: effects of sound level, stim-
ulus type and multiple sound sources, J. Comp. Physiol. 179 (1996)
89–102.
[8] G. Harnischfeger, G. Neuweiler, P. Schlegel, Interaural time and in-
tensity coding in superior olivary complex and inferior colliculus of
the bat, Molossus ater, J. Neurophysiol. 53 (1985) 89–109.
[9] P.H.S. Jen, D.M. Chen, Directionality of sound pressure transforma-
tion at the pinna of echolocating bats, Hear. Res. 34 (1988) 101–117.
[10] P.H.S. Jen, P.A. Schlegel, Auditory physiological properties of the
neurons in the inferior colliculus of the big brown bat, Eptesicus
fuscus, J. Comp. Physiol. 147 (1982) 351–363.
[11] P.H.S. Jen, M. Wu, Directional sensitivity of inferior collicular neu-
rons of the big brown bat, Eptesicus fuscus, to sounds delivered
from selected horizontal and vertical angles, Chin. J. Physiol. 36
(1993) 7–18.
[12] P.H.S. Jen, X.M. Zhou, Temporally patterned pulse trains affect du-
ration tuning characteristics of bat inferior collicular neurons,
J. Comp. Physiol. 185 (1999) 471–478.
[13] P.H.S. Jen, X.D. Sun, D.M. Chen, H.B. Teng, Auditory space repre-
sentation in the inferior colliculus of the FM bat, Eptesicus fuscus,
Brain Res. 419 (1987) 7–18.
[14] P.H.S. Jen, X.M. Zhou, C.H. Wu, Temporally patterned sound pulse
trains affect intensity and frequency sensitivity of inferior collicular
neurons of the big brown bat, Eptesicus fuscus, J. Comp. Physiol. 187
(2001) 605–616.
[15] P.H.S. Jen, C.H. Wu, R.H. Luan, X.M. Zhou, GABAergic inhibition
contributes to pulse repetition rate-dependent frequency selectivity in
the inferior colliculus of the big brown bat, Eptesicus fuscus, Brain
Res. 948 (2002) 159–164.
[16] Y. Lu, P.H.S. Jen, M. Wu, GABAergic disinhibition affects responses
of bat inferior collicular neurons to temporally patterned sound pulses,
J. Neurophysiol. 79 (1998) 2303–2315.
[17] D.A. Pinheiro, M. Wu, P.H.S. Jen, Encoding repetition rate and du-
ration in the inferior colliculus of the big brown bat, Eptesicus fuscus,
J. Comp. Physiol. 169 (1991) 69–85.
[18] P.W. Poon, X.D. Sun, T. Kamada, P.H.S. Jen, Frequency and space
representation in the inferior colliculus of the FM bat, Eptesicus fus-
cus, Exp. Brain Res. 79 (1990) 83–91.
[19] P.A. Schlegel, Directional coding by binaural brainstem units of the
CF-FM bat Rhinolophus ferrumequinum, J. Comp. Physiol. 118
(1977) 327–352.
[20] P.A. Schlegel, P.H.S. Jen, S. Singh, Auditory spatial sensitivity of
inferior collicular neurons of echolocating bats, Brain Res. 456
(1988) 127–138.
[21] J.A. Simmons, A view of the world through the bat’s ear: the
formation of acoustic images in echolocation, Cognition 33 (1989)
155–199.
[22] J.A. Simmons, M.B. Fenton, M.J. O’Farrell, Echolocation and pursuit
of prey by bats, Science 203 (1979) 16–21.
[23] J.M. Smalling, A.V. Galazyuk, A.S. Feng, Stimulation rate influen-
ces frequency tuning characteristics of inferior colliculus neurons in
the little brown bat, Myotis lucifugus, NeuroReport 12 (2001)
3539–3542.
[24] M. Wu, P.H.S. Jen, Temporally patterned pulse trains affect direction-
al sensitivity of inferior collicular neurons of the big brown bat,
Eptesicus fuscus, J. Comp. Physiol. 179 (1996) 385–393.
[25] X.M. Zhou, P.H.S. Jen, Neural inhibition sharpens auditory spatial
selectivity of bat inferior collicular neurons, J. Comp. Physiol. 186
(2000) 389–398.
[26] X.M. Zhou, P.H.S. Jen, The role of GABAergic inhibition in shaping
directional selectivity of bat inferior collicular neurons determined
with temporally patterned pulse trains, J. Comp. Physiol. 188
(2002) 815–826.
[27] X.M. Zhou, P.H.S. Jen, The effect of bicuculline application on azi-
muth-dependent recovery cycle of inferior collicular neurons of the
big brown bat, Eptesicus fuscus, Brain Res. 973 (2003) 131–141.