Azaspiracid-1, a potent, nonapoptotic new phycotoxin with several cell targets
14
Azaspiracid-1, a potent, nonapoptotic new phycotoxin with several cell targets Yolanda Roma ´n a , Amparo Alfonso a , M. Carmen Louzao a , Laura A. de la Rosa a , Francisco Leira b , Juan M. Vieites b , Mercedes R. Vieytes c , Katsuya Ofuji d , Masayuki Satake d , Takeshi Yasumoto e , Luis M. Botana a, * a Departamento de Farmacologı ´a, Facultad de Veterinaria, USC, 27002 Lugo, Spain b ANFACO-CECOPESCA, Campus Universitario, Lagoas (Marcosende), 36310 Vigo, Spain c Departamento de Fisiologı ´a, Facultad de Veterinaria, USC, 27002 Lugo, Spain d Graduate School of Agricultural Science, Tohoku University, Sendai 981-8555, Japan e Japan Food Research Laboratories, Tama, Tokyo 206-0025, Japan Received 16 August 2001; accepted 20 December 2001 Abstract This paper reports on potential cellular targets of azaspiracid-1 (AZ-1), a new phycotoxin that causes diarrhoeic and neurotoxic symptoms and whose mechanism of action is unknown. In excitable neuroblastoma cells, the systems studied were membrane potential, F-actin levels and mitochondrial membrane potential. AZ-1 does not modify mitochondrial activity but decreases F-actin concentration. These results indicate that the toxin does not have an apoptotic effect but uses actin for some of its effects. Therefore, cytoskeleton seems to be an important cellular target for AZ-1 effect. AZ-1 does not induce any modification in membrane potential, which does not support for neurotoxic effects. In human lymphocytes, cAMP, cytosolic calcium and cytosolic pH (pHi) levels were also studied. AZ-1 increases cytosolic calcium and cAMP levels and does not affect pHi (alkalinization). Cytosolic calcium increase seems to be dependent on both the release of calcium from intracellular Ca 2+ pools and the influx from extracellular media through Ni 2+ -blockable channels. AZ-1-induced Ca 2+ increase is negatively modulated by protein kinase C (PKC) activation, protein phosphatases 1 and 2A (PP1 and PP2A) inhibition and cAMP increasing agents. The effect of AZ-1 in cAMP is not extracellularly Ca 2+ dependent and unsensitive to okadaic acid (OA). D 2002 Elsevier Science Inc. All rights reserved. Keywords: Azaspiracid; Okadaic acid; Saxitoxin; Lymphocyte; cAMP; Actin; Cytosolic calcium; Cytosolic pH; Potential 1. Introduction Phycotoxins constitute a large source of active phar- macological tools, with a very high variety of mechanisms of action. They can be potent phosphatase inhibitors [such as okadaic acid (OA)] [1], block sodium channels in several different receptors within the channel (such as brevetoxins [2] or saxitoxin (STX) [3]), inhibit sodium–potassium ATPase (such as the case of palytoxin) [4] or increase calcium uptake (such as the case of maitotoxin) [5]. In some cases, the particular mechanism of action of some phycotoxins renders lead structures to develop new drugs, such as conotoxins [6]. However, despite all the information already gathered about many phycotoxins, they pose a constant challenge to scientists, because new compounds are being reported with new and unknown mechanisms of actions. Examples of these are yessotoxins [7,8], which were recently discovered and still have unknown mecha- nisms of action [9]. A new and very recent group of marine toxins that were implicated in a mussel poisoning in the Netherlands in November 1995 [10] are azaspiracids (AZ) [11]. They have spiral ring assemblies, a cyclic amine and a carboxylic acid, and these characteristics make them unique within the nitrogen-containing marine toxins. So far, five different compounds have been described: AZ-1, AZ-2 (8-methyla- zaspiracid) and AZ-3 (22-dimethylazaspiracid) [12] and more recently AZ-4 and AZ-5, which are 3-hydroxy- 0898-6568/02/$ – see front matter D 2002 Elsevier Science Inc. All rights reserved. PII:S0898-6568(02)00015-3 * Corresponding author. Tel./fax: +34-982-252-242. E-mail address: [email protected] (L.M. Botana). www.elsevier.com/locate/cellsig Cellular Signalling 14 (2002) 703 – 716
Transcript of Azaspiracid-1, a potent, nonapoptotic new phycotoxin with several cell targets
Azaspiracid-1, a potent, nonapoptotic new phycotoxin
with several cell targets
Yolanda Romana, Amparo Alfonsoa, M. Carmen Louzaoa, Laura A. de la Rosaa,Francisco Leirab, Juan M. Vieitesb, Mercedes R. Vieytesc, Katsuya Ofujid,
Masayuki Sataked, Takeshi Yasumotoe, Luis M. Botanaa,*aDepartamento de Farmacologıa, Facultad de Veterinaria, USC, 27002 Lugo, Spain
bANFACO-CECOPESCA, Campus Universitario, Lagoas (Marcosende), 36310 Vigo, SpaincDepartamento de Fisiologıa, Facultad de Veterinaria, USC, 27002 Lugo, Spain
dGraduate School of Agricultural Science, Tohoku University, Sendai 981-8555, JapaneJapan Food Research Laboratories, Tama, Tokyo 206-0025, Japan
Received 16 August 2001; accepted 20 December 2001
Abstract
This paper reports on potential cellular targets of azaspiracid-1 (AZ-1), a new phycotoxin that causes diarrhoeic and neurotoxic symptoms
and whose mechanism of action is unknown. In excitable neuroblastoma cells, the systems studied were membrane potential, F-actin levels
and mitochondrial membrane potential. AZ-1 does not modify mitochondrial activity but decreases F-actin concentration. These results
indicate that the toxin does not have an apoptotic effect but uses actin for some of its effects. Therefore, cytoskeleton seems to be an
important cellular target for AZ-1 effect. AZ-1 does not induce any modification in membrane potential, which does not support for
neurotoxic effects. In human lymphocytes, cAMP, cytosolic calcium and cytosolic pH (pHi) levels were also studied. AZ-1 increases
cytosolic calcium and cAMP levels and does not affect pHi (alkalinization). Cytosolic calcium increase seems to be dependent on both the
release of calcium from intracellular Ca2 + pools and the influx from extracellular media through Ni2 + -blockable channels. AZ-1-induced
Ca2 + increase is negatively modulated by protein kinase C (PKC) activation, protein phosphatases 1 and 2A (PP1 and PP2A) inhibition and
cAMP increasing agents. The effect of AZ-1 in cAMP is not extracellularly Ca2 + dependent and unsensitive to okadaic acid (OA).
D 2002 Elsevier Science Inc. All rights reserved.
Keywords: Azaspiracid; Okadaic acid; Saxitoxin; Lymphocyte; cAMP; Actin; Cytosolic calcium; Cytosolic pH; Potential
1. Introduction
Phycotoxins constitute a large source of active phar-
macological tools, with a very high variety of mechanisms
of action. They can be potent phosphatase inhibitors [such
as okadaic acid (OA)] [1], block sodium channels in several
different receptors within the channel (such as brevetoxins
[2] or saxitoxin (STX) [3]), inhibit sodium–potassium
ATPase (such as the case of palytoxin) [4] or increase
calcium uptake (such as the case of maitotoxin) [5]. In
some cases, the particular mechanism of action of some
phycotoxins renders lead structures to develop new drugs,
such as conotoxins [6]. However, despite all the information
already gathered about many phycotoxins, they pose a
constant challenge to scientists, because new compounds
are being reported with new and unknown mechanisms of
actions. Examples of these are yessotoxins [7,8], which
were recently discovered and still have unknown mecha-
nisms of action [9].
A new and very recent group of marine toxins that were
implicated in a mussel poisoning in the Netherlands in
November 1995 [10] are azaspiracids (AZ) [11]. They have
spiral ring assemblies, a cyclic amine and a carboxylic acid,
and these characteristics make them unique within the
nitrogen-containing marine toxins. So far, five different
compounds have been described: AZ-1, AZ-2 (8-methyla-
zaspiracid) and AZ-3 (22-dimethylazaspiracid) [12] and
more recently AZ-4 and AZ-5, which are 3-hydroxy-
0898-6568/02/$ – see front matter D 2002 Elsevier Science Inc. All rights reserved.
PII: S0898 -6568 (02 )00015 -3
* Corresponding author. Tel./fax: +34-982-252-242.
E-mail address: [email protected] (L.M. Botana).
www.elsevier.com/locate/cellsig
Cellular Signalling 14 (2002) 703–716

dimethylazaspiracid and 24-hydroxy-demethylazaspiracid,
respectively [13] (Scheme 1). The toxic episodes caused
by AZs show gastrointestinal illnesses, resembling there-
fore the potential symptoms of OA and diarrhoeic shell-
fish toxins. However, despite this fact, the mouse
bioassay shows clear neurotoxic symptoms (respiratory
difficulties, spasms, paralysis of the limbs and death),
which is quite different from the typical diarrhoetic
shellfish poisoning (DSP) bioassay. AZ has been reported
to cause multiple organ damage in mice, with fluid
accumulation in the small intestine, serious affectation
of the lamina propia and liver and spleen damage as
well as damage on lymphoid tissue in both T and B
lymphocytes [14].
So far, there is no information whatsoever about either
the cellular target of these toxins or their mechanism of
action, and no study has been performed. Because these
toxins are a serious threat to human health and show a
new strategy to modify the function of biological systems,
we decided to explore the possible targets of their action.
In order to seek for AZ cellular targets, we decided to
check for modulatory activities in several systems: mem-
brane potential in excitable cells (in order to check for
possible neurotoxic mechanisms), changes in calcium lev-
els (because calcium is a signal in any mammalian cell,
and for that we used human lymphocytes, which have the
advantage of being very stable cells and provide direct
information from healthy human donors), cAMP levels
(which, in the same fashion as calcium, is a universal
signal transducer), cytosolic pH (pHi) (which is a broad
source of information about changes in cytosolic ions and
are in the end will be related to possible losses of ions and
fluid as is the case of diarrhoea), mitochodrial membrane
potential (which is a marker of apoptosis effects related to
long-term effects of the toxin) [15] and finally F-actin pool
formation (which is also related to the potential changes
that may take place in the mechanisms of phycotoxin-
induced diarrhoea) [16,17].
2. Materials and methods
2.1. Chemicals and solutions
STX was obtained as previously reported [18,19]. AZ-1
was obtained and isolated by Satake et al. [11]. Veratridine
(VTD), gramicidin, pertussis toxin (PT), wortmannin and
N 6,20-O-dibutyryladenosine 30:50-cyclic monophosphate
(db-cAMP) were from Sigma (Spain). Bis-(1,3-diethylthio-
barbituric acid) trimethine oxonol (bis-oxonol), 20,70-bis(car-
boxyethyl)-5(6)-carboxyfluorescein acetoxymethyl ester
(BCECF-AM), Oregon Green-514 phalloidin, Mitotracker
Red CMXRos, recombinant fluorescein- and rhodamine-
labelled protein kinase A (FlCRhR), Influx Pinocytic Cell-
Loading Reagent and Fura2 acetoxymethyl ester were from
Molecular Probes (The Netherlands). Percoll was from
Pharmacia (Sweden). [1-[b-[3-(4-methoxyphenyl)propoxy]-
4-methoxyphenethyl]-1H-imidazole HCl] (SKF96365),
12-O-tetradecanoylphorbol 13-acetate (PMA), OA, [40,5,
7-trihydroxyisoflavone] (genistein), forskolin (FSK), [9-(tet-
rahydro-2-furanyl)-9H-purine-6-amine] (SQ22,536) and
[N-[2( p-bromocinnamylamino)ethyl]-5-isoquinolinesulfo-
namide 2HCl] (H89) were from Alexis (Switzerland). Go
6976 was from Calbiochem (Spain). All other chemicals
were reagent grade and purchased from Sigma and Merck.
The composition of saline solution used to lymphocyte
purification (PBS) was 145.2-mMNa+, 4.7-mMK+, 8.2-mM
HPO42�, 1.5-mM H2PO4�, 141.2-mM Cl � and 2-mM
ethylenediaminetetraacetic acid (EDTA). The composition
of physiological saline solution used for microscopy experi-
ments was 142.3-mM Na+, 5.94-mM K+, 1-mM Ca2+,
1.2-mM Mg2+, 126.1-mM Cl�, 22.85-mM CO3�, 1.2-mM
PO4H2�, 1.2-mM SO4
2� and 1-mg/ml glucose, giving a final
osmotic pressure of 300 ± 5-mOsm/kg H2O. Ca2+-free solu-
tion was made by omitting Ca2+ from the medium. In all the
experiments, the incubation medium was equilibrated with
CO2 and the final pH was adjusted to 7.2.
2.2. Human lymphocytes isolation
Peripheral human lymphocytes were isolated from fresh
human blood from healthy donors. The blood was diluted
1:1 with PBS plus 2-mM EDTA and 4 ml of diluted blood
was carefully placed over 3 ml of 57.5% isotonic Percoll.
After centrifugation (25 min, 1000� g), Percoll was elim-
inated by washing three times with PBS plus 2-mM EDTA
at 400� g for 5 min. Lymphocytes purity was always higher
than 85%.Scheme 1. Structures of AZs.
Y. Roman et al. / Cellular Signalling 14 (2002) 703–716704

2.3. Measurement of intracellular cAMP levels
Image processing. Purified lymphocytes were loaded
with FlCRhR by the following protocol: 10-ml HypertonicLoading Medium (Influx Pinocytic Cell-Loading Reagent)
containing 0.4-ml FlCRhR were added to 300,000 purified
lymphocytes. After gentle resuspension, the cells were
incubated for 10 min at 37 �C. Then, 3-ml Hypotonic
Lysis Medium [water-diluted saline solution (6:4)] was
added and incubated for 1.5 min at 37 �C. Loaded cells
were quickly washed three times (400� g, 2 min) with
saline solution. Aliquots of 20-ml loaded cells were
allowed to attach to poly-L-lysine-coated 22-mm glass
coverslips for 10 min. The glass coverslips were inserted
into a 37 �C thermostated chamber (Intracell, UK) and
cells were viewed with a Nikon Diaphot 200 microscope
equipped with epifluorescence optics (Nikon 40� immer-
sion UV-Fluor objective). The chamber was used in the
open bath configuration and additions made by aspiration
and addition of fresh bathing solution. Intracellular cAMP
variations were obtained from the images collected by
duplicate emission fluorescence with Life Science Resour-
ces equipment. The light source was a 175-W xenon
lamp, and the light reached the objective through optic
fiber. The excitation wavelength for FlCRhR was 490 nm
and the emission wavelengths were 530 and 580 nm.
FlCRhR is a single-excitation dual-emission dye, similar
to native protein kinase A, whose emission spectrum
changes with cAMP binding. In this way, the FlCRhR
530/580 emission ratio increases upon intracellular free
cAMP concentration elevation [20]. db-cAMP (200 mM)
was added at the end of each experiment to test cAMP
fluorosensor functionality. Graphics represent the average
of three or four experiments done in duplicate (40 cells
per single experiment).
2.4. Cell labelling and determination of pHi and [Ca2+]i
Purified lymphocytes were incubated with the pH and
Ca2+-sensitive fluorescent dyes 0.2-mM BCECF-AM and
2-mM Fura2-AM for 10 min at 37 �C in 1 ml of Ca2+ and
BSA-containing saline solution. After incubation, cells were
washed and attached to a glass coverslip coated with
0.001% polylysine. The coverslips were mounted on a
thermostated chamber at 37 �C (Intracell) to which 500 mlof Umbreit solution was added. Drugs were added by
exchanging the bathing solution.
pHi and Ca2+ ([Ca2+]i) were simultaneously monitored
in individual cells by measuring the BCECF and Fura2
fluorescence, respectively, with the ratio imaging micro-
scopy equipment (see cAMP measurements). BCECF
fluorescence was recorded by alternating the excitation
at 490 and 440 nm and measuring the emission at 535 nm.
Fura2 fluorescence was recorded by alternating the excita-
tion at 340 and 380 nm and measuring the emission at
520 nm.
The calibration of fluorescence vs. pHi was made using
nigericin in K+ solution as per Thomas et al. [21]. Briefly, a
calibration curve was obtained with four known values of
pH, measuring the fluorescence ratio obtained in the pres-
ence of nigericin for each pH value. The [Ca2+]i was
obtained from the ratio 340/380 of the images collected
according to the method of Grinkiewicz et al. [22].
2.5. Neuroblastoma cell culture
Neuroblastoma cell line BE(2)-M17 (ATCC Number
CRL-2267) was purchased from the European Collection
of Cell Cultures (UK) and seeded in 25-cm2 flasks at a
seeding density of 4� 104 cells/cm2. Cells were cultured
on EMEM (EBSS):Ham’s F12 (1:1) with 2-mM gluta-
mine, 1% nonessential amino acids, 15% foetal bovine
serum, 50-mg/l gentamicine and 50-mg/l amphotericine B
(Biochrom KG, Germany). The culture medium was
renewed on a 2–3-day basis and the cells incubated at
37 �C/5% CO2 until 70–90% confluence was reached.
Later on, cells were subcultured by transferring cells
released by the application of 0.1% trypsin. For micro-
plate assays, the attached cells were trypsinized after
reaching optimum confluence, and the concentration of
the culture was adjusted at 12,500 cells/ml, dispensing the
cell suspension in 96-well microtiter plates at 2500 cells/
well (200 ml). Following an additional incubation of 48 h
(37 �C/5% CO2), cells grown in microtiter plates were
used for fluorimetric microplate assays.
2.6. Cell membrane potential
Changes in membrane potential of neuroblastoma cells
were monitored with the fluorescent dye bis-oxonol. Bis-
oxonol is a permeant lipophilic anion whose distribution
across the cell membrane is dependent on membrane poten-
tial. Fluorescence emission of this dye increases with
membrane depolarization. Detection of changes in the
membrane potential induced by toxins in excitable cells is
as follows. Suspension of 0.5� 106 human neuroblastoma
cells were incubated with 2 nM of the fluorescent dye bis-
oxonol. During the experiment, bis-oxonol fluorescence was
registered at 37 �C [wavelengths 540 (excitation) and 560
(emission) nm] in a stirred quartz microcuvette with a
Shimadzu RF-500 spectrofluorometer. Stabilization of the
baseline (equilibrium distribution of the probe) lasted for
5–10 min before the experiment began. Toxins were added
from stock solutions with a pipette directly into the cuvette
through a small hole on top of the cuvette lid. At the end of
each experiment, 10-mg/ml gramicidin was added to induce
complete cell depolarization.
2.7. Mitochondrial membrane potential
Changes in mitochondrial membrane potential in BE(2)-
M17 cells were evaluated in triplicate experiments using
Y. Roman et al. / Cellular Signalling 14 (2002) 703–716 705
the fluorescent probe Mitotracker Red CMXRos. Follow-
ing 1 and 24 h of drug exposure of the cells, the plates
were centrifuged, 50 ml of the culture medium were
removed and 50 ml of Mitotracker Red CMXRos diluted
in the same medium were added to each well to give a
final concentration of 1 mM.After an additional 37 �C/45-min
incubation, the plates were centrifuged, the culture medium
was removed and the cells were washed once with Hank’s
solution and centrifuged. Fluorescence was measured as
previously described, and results of triplicate experiments
were expressed as average percentages of fluorescence
values obtained in controls.
2.8. Determination of F-actin
The effect on F-actin levels in BE(2)-M17 cells was
also evaluated on triplicate experiments after 1 and 24 h
of exposure of the cells to phytoplanktonic toxin. Fol-
lowing incubation, F-actin was measured as follows: 50 mlof 18.5% formaldehyde were added to each well (except
blanks) and cells were fixed for 30 min at room temper-
ature. Following a washing step with Hank’s balanced salt
solution (200 ml), cells were permeabilized (except
blanks) with 200 ml of 0.1% Triton-X 100 for 15 min
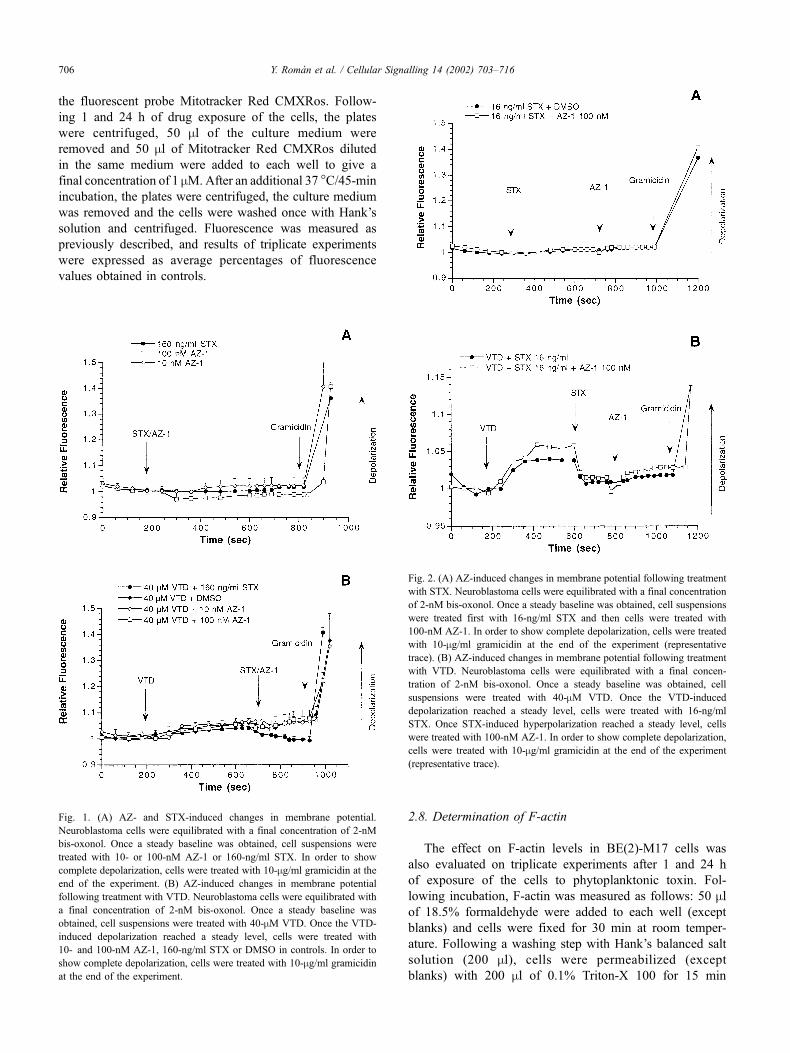
Fig. 1. (A) AZ- and STX-induced changes in membrane potential.
Neuroblastoma cells were equilibrated with a final concentration of 2-nM
bis-oxonol. Once a steady baseline was obtained, cell suspensions were
treated with 10- or 100-nM AZ-1 or 160-ng/ml STX. In order to show
complete depolarization, cells were treated with 10-mg/ml gramicidin at the
end of the experiment. (B) AZ-induced changes in membrane potential
following treatment with VTD. Neuroblastoma cells were equilibrated with
a final concentration of 2-nM bis-oxonol. Once a steady baseline was
obtained, cell suspensions were treated with 40-mM VTD. Once the VTD-
induced depolarization reached a steady level, cells were treated with
10- and 100-nM AZ-1, 160-ng/ml STX or DMSO in controls. In order to
show complete depolarization, cells were treated with 10-mg/ml gramicidin
at the end of the experiment.
Fig. 2. (A) AZ-induced changes in membrane potential following treatment
with STX. Neuroblastoma cells were equilibrated with a final concentration
of 2-nM bis-oxonol. Once a steady baseline was obtained, cell suspensions
were treated first with 16-ng/ml STX and then cells were treated with
100-nM AZ-1. In order to show complete depolarization, cells were treated
with 10-mg/ml gramicidin at the end of the experiment (representative
trace). (B) AZ-induced changes in membrane potential following treatment
with VTD. Neuroblastoma cells were equilibrated with a final concen-
tration of 2-nM bis-oxonol. Once a steady baseline was obtained, cell
suspensions were treated with 40-mM VTD. Once the VTD-induced
depolarization reached a steady level, cells were treated with 16-ng/ml
STX. Once STX-induced hyperpolarization reached a steady level, cells
were treated with 100-nM AZ-1. In order to show complete depolarization,
cells were treated with 10-mg/ml gramicidin at the end of the experiment
(representative trace).
Y. Roman et al. / Cellular Signalling 14 (2002) 703–716706

at room temperature. Triton-X was removed by washing
with Hank’s balanced salt solution (two times, 200 ml
each), and 500-nM Oregon Green-514 phalloidin solution
in Hank’s was added to each well (50 ml). Cells were
stained with the fluorochrome for 30 min at room
temperature and finally washed with Hank’s balanced salt
solution (two times, 200 ml each). Fluorescence of stained
Fig. 4. Effect of different channels blockers on the [Ca2+]i modifications
elicited by 200-nM AZ-1 in human lymphocytes bathed by a Ca2+-
containing medium. Fura-loaded cells were attached to a glass coverslip,
bathed by Ca2+-containing saline solution and cytosolic Ca2+ was
monitored (A) Effect of La3+. Cells were preincubated for 5 min in the
presence or absence of 100-mM La3+. (B) Effect of SKF96365. Cells were
preincubated for 5 min in the presence or absence of 30-mM SKF96365.
(C) Effect of Ni2+. Cells were preincubated for 5 min in the presence or
absence of 1 mM Ni2+. Mean ± S.E.M. of three experiments.
Fig. 3. Effect of AZ-1 on the [Ca2 + ]i of human lymphocytes. Fura-loaded
cells were attached to a glass coverslip, bathed by Ca2 + -containing saline
solution and cytosolic Ca2 + was monitored. (A) Effect of different
concentrations of AZ-1 in cells bathed by Ca2 + -free saline solution. Next,
the bathing solution was exchanged for a Ca2 + -containing one. (B) Effect
of 200-nM AZ-1 in cells bathed by a Ca2 + -containing medium. Mean of
three experiments.
Y. Roman et al. / Cellular Signalling 14 (2002) 703–716 707
F-actin was measured in a LS-50B fluorescence micro-
plate reader (Perkin-Elmer, UK) set at 511 (excitation)
and 528 (emission) nm. Results of triplicate experiments
were expressed as a percentage of fluorimetric values
observed in controls after blank subtraction.
2.9. Data analysis
cAMP, [Ca2 + ]i and pHi values of all cells observed in
each experiment were averaged. All the experiments were
carried out at least three times in duplicate. Results were
analysed using the Student’s t test for paired data. A
probability level of .05 or smaller was used for statistical
significance. Data were normalized and results were
expressed as the mean ± S.E.M.
3. Results
3.1. Effect on membrane potential
Our objective was to test a possible neurological effect
of AZ in human cells. The membrane potential-sensitive
dye bis-oxonol was used to examine if AZ altered mem-
brane potential in neuroblastoma cells. Negative charge of
bis-oxonol prevents accumulation in the mitochondria.
Therefore, the probe only indicates changes in membrane
potential [23]. The introduction of bis-oxonol in a cell
suspension shows an increase in fluorescence, which
becomes stable in 5–10 min. Information obtained with
bis-oxonol is qualitative. In order to plot the results, we
averaged the fluorescence values obtained each 30 s from
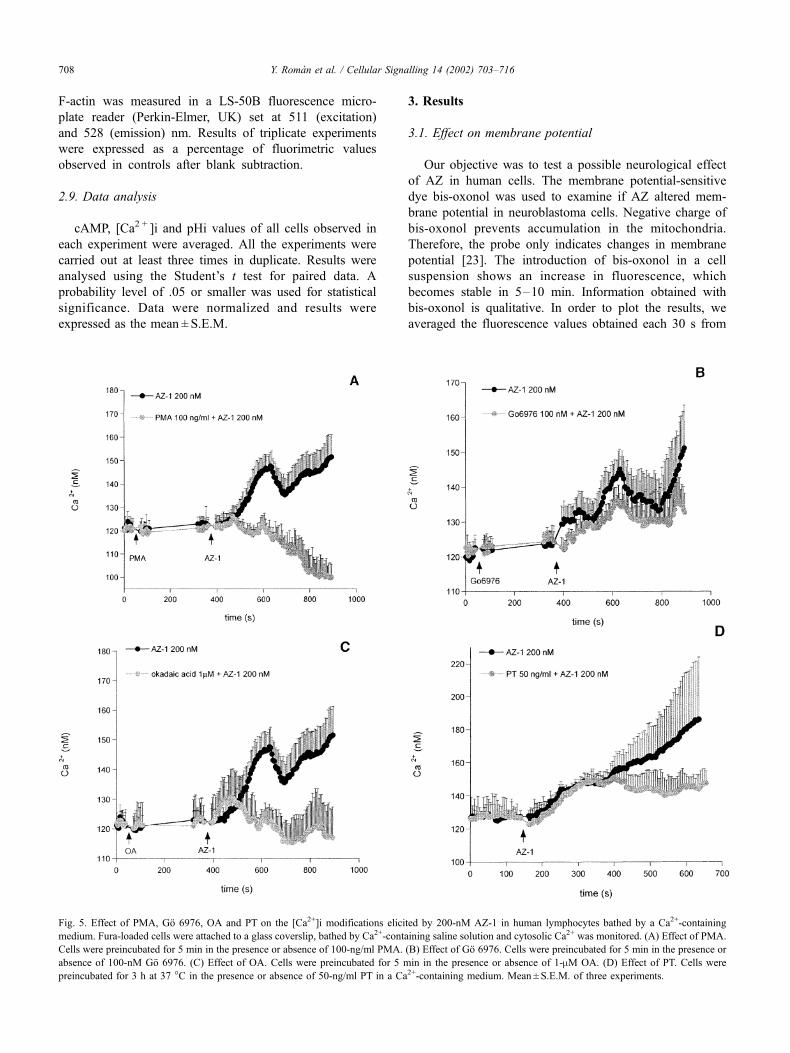
Fig. 5. Effect of PMA, Go 6976, OA and PT on the [Ca2+]i modifications elicited by 200-nM AZ-1 in human lymphocytes bathed by a Ca2+-containing
medium. Fura-loaded cells were attached to a glass coverslip, bathed by Ca2+-containing saline solution and cytosolic Ca2+ was monitored. (A) Effect of PMA.
Cells were preincubated for 5 min in the presence or absence of 100-ng/ml PMA. (B) Effect of Go 6976. Cells were preincubated for 5 min in the presence or
absence of 100-nM Go 6976. (C) Effect of OA. Cells were preincubated for 5 min in the presence or absence of 1-mM OA. (D) Effect of PT. Cells were
preincubated for 3 h at 37 �C in the presence or absence of 50-ng/ml PT in a Ca2+-containing medium. Mean ± S.E.M. of three experiments.
Y. Roman et al. / Cellular Signalling 14 (2002) 703–716708

the stability of fluorescence after adding bis-oxonol. There-
fore, all experiments show the total average using as arbitrary
values those obtained in the fluorometer and calculating each
value’s fraction using the baseline as a control. In order to
show complete depolarization, the figures below show depol-
arization obtained with 10-mg/ml gramicidin at the end of
the experiment.
Fig. 1A illustrates the effect of STX and 10- and 100-nM
AZ-1 on membrane potential in human neuroblastoma cells.
STX is a known sodium channel modulator that does not
induce any direct change in the fluorescence of membrane
potential dye [24]. AZ-1 does not induce any significant
change in this fluorescence. We next examined the AZ
effect in VTD-depolarized neuroblastoma cells. VTD is
known to depolarize excitable cells by opening the sodium
channel and by blocking its inactivation [25]. Applying to
the cells VTD in the first place and then AZ, we obtained
results presented in Fig. 1B. Addition of 40-mM VTD to
neuroblastoma cells increased the fluorescence. The later
addition of the sodium channel blocker STX selectively
reduced VTD-induced depolarization, showing a decrease
of fluorescence. However, AZ-1 did not modify the VTD-
induced depolarization.
As an initial approach to test if the effect of AZ-1 is
directly related to the site 1 of sodium channel (which is
the STX receptor [26]), we examined the action of STX on
the AZ effect in neuroblastoma cells. The association of
STX and AZ-1 does not induce any change in the fluor-
escence of membrane potential dye (Fig. 2A). As an
alternative, we examined whether STX modifies the effect
of AZ on VTD-induced depolarization. We found that in
the presence of STX, AZ-1 does not modify the effect that
STX induces in the depolarization observed in the presence
of VTD (Fig. 2B).
3.2. Effect in cytosolic calcium and pHi
The effects of AZ-1 on the basal state of [Ca2+]i and pHi
of freshly isolated human lymphocytes were also studied. In
cells maintained 10 min in a calcium-free solution and later
with the calcium concentration restored, different concen-
trations of AZ-1 induced a significant concentration-
dependent rise in [Ca2+]i (Fig. 3A). In these conditions,
no effect on pHi was observed (data not shown). As Fig. 3A
shows, concentrations of 200- and 1000-nM AZ-1 produce a
modest increase in [Ca2+]i in a calcium-free medium,
whereas an important [Ca2+]i increase is observed when
calcium concentration is restored. This seems to suggest that
AZ-1 releases Ca2+ from internal stores and also origins
Ca2+ influx.
For the rest of the assays, we selected the 200-nM
concentration because this is enough to produce a sig-
nificant effect. When this AZ-1 concentration is added to
cells in a calcium-containing medium (Fig. 3B), an
increase in [Ca2+]i of the same magnitude can be observed
as when calcium concentration is restored in a calcium-
free medium. Again, no effect in on pHi is detected (data
not shown).
With the aim of characterizing this AZ-1-induced [Ca2+]i
increase, we used different calcium channels blockers.
La3+ is an efficient and specific blocker of store-operated
Ca2+ channels [27,28]. Neither 10 nor 100 mM (Fig. 4A) of
La3+ were able to block the toxin-induced influx. A similar
result was observed with 30-mM SKF96365 (Fig. 4B), an
imidazole reagent that is a potent blocker of Ca2+ and Mn2+
uptake activated by of stores depletion [29]. Finally, we tried
Ni2+, a divalent cation known to block calcium channels
and that does not enter into the cells [30]. When the cells are
Fig. 6. Effect of wortmannin and genistein on the [Ca2+]i modifications
elicited by 200-nM AZ-1 in human lymphocytes bathed by a Ca2+-
containing medium. Fura-loaded cells were attached to a glass coverslip,
bathed by Ca2+-containing saline solution and cytosolic Ca2+ was
monitored. (A) Effect of wortmannin. Cells were preincubated for 5 min
in the presence or absence of 10-nM wortmannin. (B) Effect of genistein.
Cells were preincubated for 5 min in the presence or absence of 10-mMgenistein. Mean ± S.E.M. of three experiments.
Y. Roman et al. / Cellular Signalling 14 (2002) 703–716 709

preincubated with 1-mM Ni2+, the effect of AZ-1 is com-
pletely inhibited (Fig. 4C).
Next, we studied the signaling pathway of AZ-1 effect in
[Ca2+]i. To this purpose, we employ different modulators of
intracellular signals. Lymphocytes preincubation with the
direct protein kinase C (PKC) activator PMA [30] induces a
significant inhibition of AZ-1-induced [Ca2+]i increase
(Fig. 5A). However, as Fig. 5B shows, the PKC inhibitor
Go 6976 [31] does not modify the cellular response. In this
way, we analysed the consequences of protein phosphatases
1 and 2A (PP1 and 2A) inhibition by using OA. Fig. 5C
shows that 1-mM OA inhibits the AZ-1 effect.
To further investigate the signal transduction pathways
mediating AZ-1 action, we used PT. Preincubation of
lymphocytes with 50-ng/ml PT for 3 h at 37 �C produces
a nonsignificant decrease in the [Ca2+]i rise induced by
AZ-1 (Fig. 5D). Therefore, PT-sensitive and -insensitive G
proteins might mediate AZ-1-induced Ca2+ influx.
We used 10-nM wortmannin to block phosphoinosi-
tide-3 kinase [32] and 10-mM genistein to block tyrosine
kinases [33], as shown in Fig. 6A and B, respectively.
The results shown in this figure show that these proteins
seem not to be involved in the pathway or modulation of
AZ-1-induced [Ca2+]i increase, although results show that
the inhibition of tyrosine kinases produces a nonsignifi-
cant decrease in AZ-1 effect.
On the other hand, we studied the role of changes in
cAMP levels in the toxin effect. cAMP has been described
Fig. 7. Effect of up- and down-regulation of cAMP pathway on the [Ca2+]i modifications elicited by 200-nM AZ-1 in human lymphocytes bathed by a
Ca2+-containing medium. Fura-loaded cells were attached to a glass coverslip, bathed by Ca2+-containing saline solution and cytosolic Ca2+ was monitored.
(A) Effect of forskolin. Cells were preincubated for 5 min in the presence or absence of 30-mM forskolin. (B) Effect of db-cAMP. Cells were preincubated
for 5 min in the presence or absence of 250-mM db-cAMP. (C) Effect of SQ22,536. Cells were preincubated for 5 min in the presence or absence of 10-mMSQ22,536. (D) Effect of H89. Cells were preincubated for 5 min in the presence or absence of 1-mM H89 in a Ca2+-containing medium. Mean ± S.E.M. of
three experiments.
Y. Roman et al. / Cellular Signalling 14 (2002) 703–716710
as an important modulator in Ca2+ signals, with different
actions in transformed and normal lymphocytes. The addi-
tion of forskolin, an adenylyl cyclase (AC) activator, prior to
the stimulation of lymphocytes with AZ-1, results in a total
inhibition of AZ-1-induced [Ca2+]i elevation (Fig. 7A). A
similar inhibition is observed when cAMP is directly
increased by the preincubation of cells with 250-mM db-
cAMP (Fig. 7B), a cAMP analogue. However, in this case,
the inhibition is lower and only takes place after 800 s.
Furthermore, neither the inhibition of AC with 10-mMSQ22,536 (Fig. 7C) nor the inhibition of cAMP-dependent
kinase PKA with 1-mM H89 (Fig. 7D) has had any effect in
the toxin-induced response.
3.3. F-actin cytoskeleton
Results obtained in fluorimetric microplate assays indic-
ate that F-actin cytoskeleton is one important cellular target
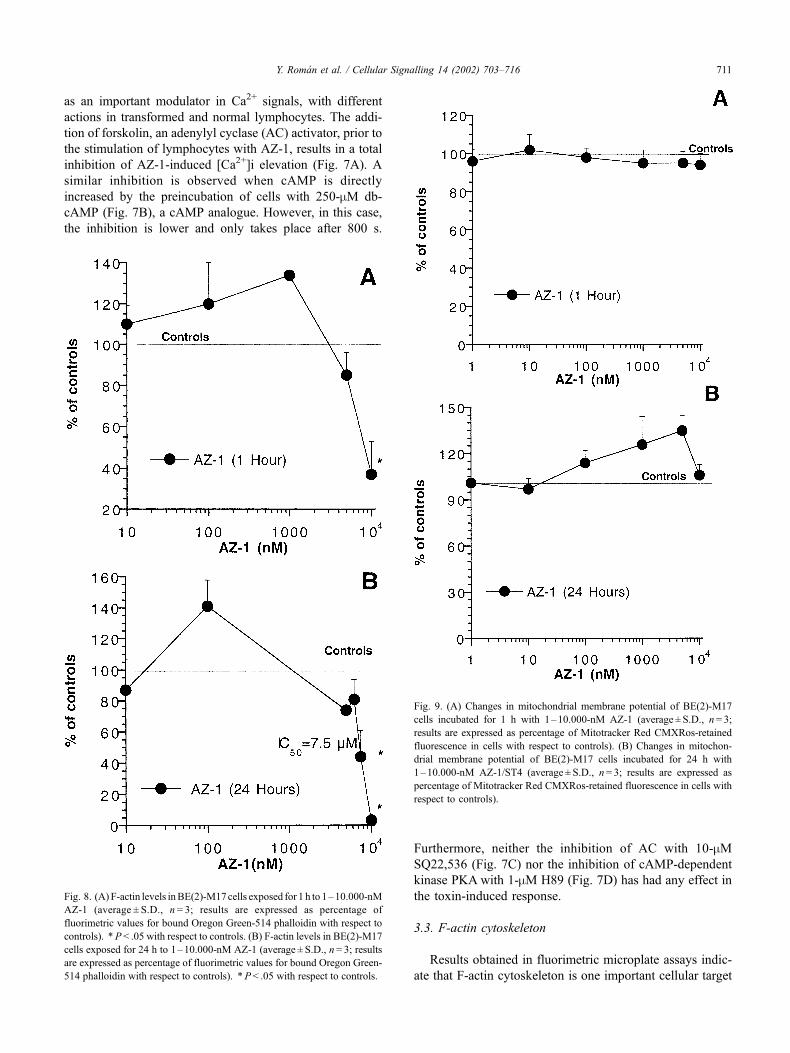
Fig. 8. (A) F-actin levels inBE(2)-M17cells exposed for 1 h to 1–10.000-nM
AZ-1 (average ± S.D., n = 3; results are expressed as percentage of
fluorimetric values for bound Oregon Green-514 phalloidin with respect to
controls). *P < .05 with respect to controls. (B) F-actin levels in BE(2)-M17
cells exposed for 24 h to 1–10.000-nM AZ-1 (average ± S.D., n= 3; results
are expressed as percentage of fluorimetric values for bound Oregon Green-
514 phalloidin with respect to controls). *P< .05 with respect to controls.
Fig. 9. (A) Changes in mitochondrial membrane potential of BE(2)-M17
cells incubated for 1 h with 1–10.000-nM AZ-1 (average ± S.D., n= 3;
results are expressed as percentage of Mitotracker Red CMXRos-retained
fluorescence in cells with respect to controls). (B) Changes in mitochon-
drial membrane potential of BE(2)-M17 cells incubated for 24 h with
1–10.000-nM AZ-1/ST4 (average ± S.D., n= 3; results are expressed as
percentage of Mitotracker Red CMXRos-retained fluorescence in cells with
respect to controls).
Y. Roman et al. / Cellular Signalling 14 (2002) 703–716 711

for AZ. Neuroblastoma cells exposed to AZ-1 show a
reproducible time- and dose-dependent decrease of F-actin
pools, as shown in Fig. 8A and B. A significant decrease
(P < .05) of F-actin levels was first observed in BE(2)-M17
cells incubated for 1 h with the highest concentration of
AZ-1 used in the assay (10 mM, 37 ± 16% of values in
controls). The IC50 values for AZ-1-induced depolymeriza-
tion of F-actin changed to 7.5 mM at 24 h, showing
significant differences with controls at concentrations higher
than 5 mM (44 ± 17% of F-actin levels in controls at 7.5-mMAZ-1), which demonstrates a time-dependent effect of the
toxin. F-actin cytoskeleton was completely disrupted after
24-h exposure of the cells at 10-mM AZ-1, showing baseline
levels for F-actin in all cases.
3.4. Mitochondrial membrane potential
Fluorimetric microplate measurements of mitochondrial
membrane potential in AZ-1-cultured cells did not show
significant differences with controls at both 1 and 24 h from
1 nM to 10 mM of AZ-1 (Fig. 9A and B), suggesting that
AZ-1 does not trigger the apoptotic cascade at these levels.
3.5. Effect on cAMP levels
The effect of AZs in cAMP levels was studied using
as a cellular model human lymphocytes. The experiments
were carried out using AZ-1. Fig. 10 shows the changes
in cAMP levels in the presence of different amounts of
AZ-1 and a clear increase in cytosolic cAMP levels can
be observed (a control of 200-mM db-cAMP is used at the
end of each experiment to check FlCRhR functionally).
This effect is dose dependent because 500-nM AZ-1
induces half the increase obtained with 1000 nM. The
effect of external calcium on the increase of cAMP levels
caused by AZ-1 was studied by eliminating calcium from
the extracellular media, as shown in Fig. 11. The increase
induced in cAMP levels by AZ-1 is slightly higher in a
Ca2 + -free medium although not significant. The implica-
tion of AC in AZ-1 effect was checked by preincubation
in the presence of 1-mM SQ22,536. This drug is a known
AC inhibitor [34]. Fig. 12 shows AZ-1 effect on cAMP
levels after SQ22,536 preincubation. In these conditions,
AZ-1 does not induce any cAMP increase and does not
modify the decrease of cAMP caused by SQ22,536 (the
initial sharp decrease after addition of AZ-1 is an artifact
caused by the addition of the liquid to the cell suspen-
Fig. 10. Dose-dependent effect of AZ-1 on cAMP levels in human
lymphocytes. The arrow indicates the addition of 0.5- or 1-mM AZ-1. The
addition of 200-mM db-cAMP indicates FlCRhR functionally.
Fig. 11. Effect of AZ-1 on cAMP levels in human lymphocytes in a
calcium-free and in a calcium-containing medium. The arrow indicates the
addition of 1-mM AZ-1. The addition of 200-mM db-cAMP indicates
FlCRhR functionally.
Fig. 12. Effect of AZ-1 on cAMP levels in human lymphocytes when AC
was inhibited. The cells were incubated for 10 min in the presence of 1-mMSQ22,536 and then 1-mM AZ-1. The addition of 200-mM db-cAMP
indicates FlCRhR functionally.
Y. Roman et al. / Cellular Signalling 14 (2002) 703–716712
sion). Although the effect seems to be a slight decrease, it
is nonsignificant.
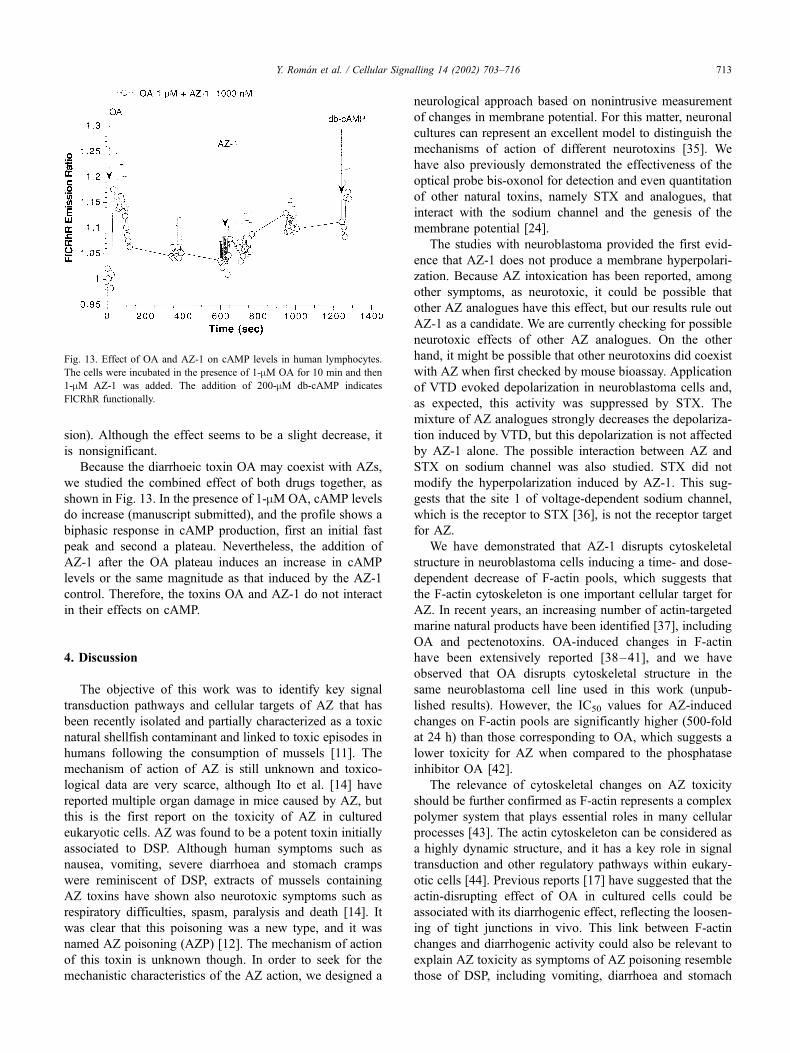
Because the diarrhoeic toxin OA may coexist with AZs,
we studied the combined effect of both drugs together, as
shown in Fig. 13. In the presence of 1-mM OA, cAMP levels
do increase (manuscript submitted), and the profile shows a
biphasic response in cAMP production, first an initial fast
peak and second a plateau. Nevertheless, the addition of
AZ-1 after the OA plateau induces an increase in cAMP
levels or the same magnitude as that induced by the AZ-1
control. Therefore, the toxins OA and AZ-1 do not interact
in their effects on cAMP.
4. Discussion
The objective of this work was to identify key signal
transduction pathways and cellular targets of AZ that has
been recently isolated and partially characterized as a toxic
natural shellfish contaminant and linked to toxic episodes in
humans following the consumption of mussels [11]. The
mechanism of action of AZ is still unknown and toxico-
logical data are very scarce, although Ito et al. [14] have
reported multiple organ damage in mice caused by AZ, but
this is the first report on the toxicity of AZ in cultured
eukaryotic cells. AZ was found to be a potent toxin initially
associated to DSP. Although human symptoms such as
nausea, vomiting, severe diarrhoea and stomach cramps
were reminiscent of DSP, extracts of mussels containing
AZ toxins have shown also neurotoxic symptoms such as
respiratory difficulties, spasm, paralysis and death [14]. It
was clear that this poisoning was a new type, and it was
named AZ poisoning (AZP) [12]. The mechanism of action
of this toxin is unknown though. In order to seek for the
mechanistic characteristics of the AZ action, we designed a
neurological approach based on nonintrusive measurement
of changes in membrane potential. For this matter, neuronal
cultures can represent an excellent model to distinguish the
mechanisms of action of different neurotoxins [35]. We
have also previously demonstrated the effectiveness of the
optical probe bis-oxonol for detection and even quantitation
of other natural toxins, namely STX and analogues, that
interact with the sodium channel and the genesis of the
membrane potential [24].
The studies with neuroblastoma provided the first evid-
ence that AZ-1 does not produce a membrane hyperpolari-
zation. Because AZ intoxication has been reported, among
other symptoms, as neurotoxic, it could be possible that
other AZ analogues have this effect, but our results rule out
AZ-1 as a candidate. We are currently checking for possible
neurotoxic effects of other AZ analogues. On the other
hand, it might be possible that other neurotoxins did coexist
with AZ when first checked by mouse bioassay. Application
of VTD evoked depolarization in neuroblastoma cells and,
as expected, this activity was suppressed by STX. The
mixture of AZ analogues strongly decreases the depolariza-
tion induced by VTD, but this depolarization is not affected
by AZ-1 alone. The possible interaction between AZ and
STX on sodium channel was also studied. STX did not
modify the hyperpolarization induced by AZ-1. This sug-
gests that the site 1 of voltage-dependent sodium channel,
which is the receptor to STX [36], is not the receptor target
for AZ.
We have demonstrated that AZ-1 disrupts cytoskeletal
structure in neuroblastoma cells inducing a time- and dose-
dependent decrease of F-actin pools, which suggests that
the F-actin cytoskeleton is one important cellular target for
AZ. In recent years, an increasing number of actin-targeted
marine natural products have been identified [37], including
OA and pectenotoxins. OA-induced changes in F-actin
have been extensively reported [38–41], and we have
observed that OA disrupts cytoskeletal structure in the
same neuroblastoma cell line used in this work (unpub-
lished results). However, the IC50 values for AZ-induced
changes on F-actin pools are significantly higher (500-fold
at 24 h) than those corresponding to OA, which suggests a
lower toxicity for AZ when compared to the phosphatase
inhibitor OA [42].
The relevance of cytoskeletal changes on AZ toxicity
should be further confirmed as F-actin represents a complex
polymer system that plays essential roles in many cellular
processes [43]. The actin cytoskeleton can be considered as
a highly dynamic structure, and it has a key role in signal
transduction and other regulatory pathways within eukary-
otic cells [44]. Previous reports [17] have suggested that the
actin-disrupting effect of OA in cultured cells could be
associated with its diarrhogenic effect, reflecting the loosen-
ing of tight junctions in vivo. This link between F-actin
changes and diarrhogenic activity could also be relevant to
explain AZ toxicity as symptoms of AZ poisoning resemble
those of DSP, including vomiting, diarrhoea and stomach
Fig. 13. Effect of OA and AZ-1 on cAMP levels in human lymphocytes.
The cells were incubated in the presence of 1-mM OA for 10 min and then
1-mM AZ-1 was added. The addition of 200-mM db-cAMP indicates
FlCRhR functionally.
Y. Roman et al. / Cellular Signalling 14 (2002) 703–716 713
cramps [14]. However, the cytoskeleton also participates in a
wide range of cellular processes such as apoptotic cell death,
F-actin being one of the substrates of the executioners of the
apoptotic cascade, a group of cysteine proteases called
caspases [45–47]. The apoptotic machinery is triggered by
different stimuli, resulting, in most cases, in the loss of
mitochondrial membrane potential. This induces the release
of proapoptotic factors to the cytoplasm and the activation of
caspases, with final disassembly of cellular structures [48].
As previously reported [15,49], the mitochondria play a
central role in the apoptotic cascade, and changes in mito-
chondrial membrane potential are a good estimate of the
apoptotic activity of different xenobiotics. In this paper, we
have demonstrated that AZ at 0.001–10 mM does not induce
apoptosis in BE(2)-M17 cells, as indicated by the mainten-
ance of mitochondrial membrane potential and opposite to
previously described changes in mitochondrial membrane
potential of BE(2)-M17 cells exposed to OA (unpublished
results). Thus, cytoskeletal changes induced by AZ can be
considered as specific events, which are not associated with
the triggering of the apoptotic process, although some
previous works [50] have reported apoptotic cell death in
the absence of mitochondrial changes, which can be con-
sidered as an exception to the general mechanism of
apoptosis. The cytoskeleton should therefore be considered
as a key target of AZ-induced toxicity in further works
related to the mechanism of toxicity of this phycotoxin.
Control of intracellular free calcium concentration is a
critical component of cellular homeostasis for all cell types.
Therefore, the [Ca2+]i increase originated by receptor stimu-
lation is necessary for some T-cell functions, and a sustained
increase in [Ca2+]i concentration induces cell death gen-
erally by apoptosis [51]. However, the mechanism of the
Ca2+ entry into electrically nonexcitable cells remains in
general unclear. It is firmly established that the store-
operated pathway is the predominant Ca2+ entry. However,
other currents have been described [52].
Our results show that AZ-1 induces a significant con-
centration-dependent increase in [Ca2+]i levels, both in a
calcium-free and in a calcium-containing medium. The
results obtained in a calcium-free medium might indicate a
Ca2+ release from internal stores. Following this Ca2+
depletion, we can observe a Ca2+ influx from the extrac-
ellular medium. We have not found that AZ-1 may to have a
direct effect on pHi.
La3+ is an important and efficient blocker of store-
operated Ca2+ entry (SOCE) [28,53]. SKF96365 is also an
effective inhibitor of this pathway but does not appear to be
not entirely specific, showing an inhibitory effect on voltage-
operable Ca2+ channels and ability to release Ca2+ from
internal stores [54]. Ni2+ is a low selective blocker involved
in SOCE [52] and also in voltage-regulated Ca2+ channels
[55] or in Ca2+ influx induced by a testosterone receptor in
plasmatic membrane [56]. Our results pointing to AZ-1-
stimulated [Ca2+]i increase seem to be mediated by Ni2+-
blockable channels, not inhibited by the effective blockers of
SOCE: SKF96365 or La3+. Therefore, AZ-1-induced Ca2+
influx seems not to be dependent on store depletion.
In the present study, PKC activation with PMA and PP1
and PP2A inhibition with OA abolish AZ-1-evoqued
[Ca2+]i increase. Therefore, a protein sensitive to PKC
phosphorylation and to PP1 and PP2A dephosphorylation
may have an inhibitory effect on AZ-1-induced response.
Several studies have demonstrated the modulatory effect of
PKC activation in Ca2+ influx. In this sense, in human
lymphocytes, an inhibitory effect of PKC in Ca2+ influx
induced by thapsigargin has been described [30]. Besides, in
Jurkat cells, this inhibitory effect is described in Ca2+ influx
and in Ca2+ release from internal stores, when cells are
stimulated with thapsigargin or through the T-cell receptor
[51]. However, this action mechanism is not yet fully
understood and the multiple targets proposed for PKC
(phospholipase C and receptors) fail to explain all the
processes observed. In addition to this controversy, it is
not clear whether PKC acts in Ca2+ efflux [57]. Consistent
with our observations, a target protein sensitive to PP1 and
PP2A dephosphorylation has been described as an inhibitor
of capacitative Ca2+ entry in rat thymic lymphocytes [58].
AZ-1 actions are not modified by genistein or wortman-
nin and only partially modified by PT. PT is a complex
structure where two subunits are separated. So, PT holo-
toxin consists of the S1 polypeptide, which contains ADP-
ribosyl transferase activity over Gi/o proteins, and the
b-oligomer, which interacts with cell surface structures
and facilitates entry of the S1 subunit. Our experiments
pointing to both PT-sensitive and -insensitive G proteins
might mediate AZ-1-stimulated Ca2+ influx. Interaction
between G proteins and Ca2+ influx has been described
intensively. Indeed, in some cell types, a G protein-activated
Ca2+ channel has been demonstrated [52]. Besides, in T-
cells, a selective loss of PT-sensitive G proteins from the
plasma membrane has been described after antibody
induced internalization, although, apparently, in this paper
the modulation process is independent of the presence of G-
protein [59]. However, recently, in some nonexcitable cell
types, PT-sensitive G proteins have been related to
agonist-induced [Ca2+]i increase [60–63]. Finally, in
our results, we must consider that PTX might directly
act through a plasmatic membrane interaction with its b
oligomer [64–66]. In any case, further studies would be
needed to clarify this point.
Finally, this report suggests a prominent role of cAMP
increasing agents in the regulation of AZ-1-induced [Ca2+]i
increase. Hence, AC, cAMP and PKA might be negative
modulatory signals of the toxin-induced response. cAMP is
an important and ubiquitous second messenger, and it is
interesting having in mind that some PKA-independent
actions have been reported [67,68]. For this reason, Ca2+
and cAMP relationship has been investigated intensively.
Despite the different results obtained, probably due to the
variety of the stimuli and cells types studied, a cross-talk
between this pathways seems to be inferred in lymphocytes.
Y. Roman et al. / Cellular Signalling 14 (2002) 703–716714
Therefore, it has been described that increases in [cAMP]
inhibit Ca2+ influx [67,69–71] and that different agonist
triggered an increase in Ca2+ influx associated with an
inhibition of AC [72,73]. All these reports are in good
agreement with our results. PKA is also presumed to be a
fine modulator of Ca2+ entry. Therefore, PKA activation and
also PKA inhibition inhibit thapsigargin-induced Ca2+ influx
[67]. In our findings, only PKA activation inhibits AZ-1-
induced Ca2+ uptake, without any effect of PKA inhibition.
In summary, we demonstrate that AZ-1 induces a [Ca2+]i
increase in human lymphocytes and has no effect in pHi.
AZ-1-induced [Ca2+]i increase consists of two parts: a
small stores depletion and Ca2+ influx from extracellular
medium through Ni2+-blockable channels. This AZ-1 effect
is negatively regulated by PKC activation, PP1 and PP2A
inhibition as well as by cAMP increasing agents. Phos-
phoinositide-3 kinases and tyrosine kinases seem not to be
involved in toxin effect, but a PT-sensitive G protein might
be part of its pathway.
AZ induces a dose-dependent increase in cAMP levels
in human lymphocytes. Human lymphocytes were used
because they were obtained from healthy humans, and
these cells withstand well the procedure to load the cAMP
indicator. This is not the case for neuroblastoma cells.
Also, the cAMP production machinery is also very active
in lymphocytes.
Cells regulate cAMP levels through a balance between
ACs (synthesis) and phosphodiesterases (hydrolysis), both
enzymatic groups including several isozyme families selec-
tively expressed. When AC was inhibited by SQ22,536
[34], AZ-1 did not induce any cAMP increase. This could
indicate that the AZ effect is due to an increase in AC
activity. Therefore, in the presence of SQ22,536, it has no
effect. It is also feasible that AZ inhibits phosphodiesterases.
No increase in cAMP is observed because in the presence of
SQ22,536 AC is inhibited, there is no cAMP synthesis, and
its intracellular levels are not increased even phosphodies-
terases could be inhibited.
On the other hand, an increase in cytosolic calcium is
often related to the inhibition of cAMP accumulation [74]. In
this case, because AZ induces an increase in cytosolic
calcium concentration, we studied the variations of cAMP
in a calcium-free medium in order to prevent any external
calcium influx. In calcium-free conditions, the effect of AZ in
cAMP accumulation was not significantly modified, which
suggests an independence of cAMP and calcium effects.
The cAMP signal is increased by OA. Our data show that
in human lymphocytes this toxin increases cAMP, an effect
that was also observed after b-stimulation in lymphoma cells
[75]. Nevertheless, in other cellular models, OA was
described as a potent phosphodiesterase stimulator [76].
Because OA and AZ may coexist in nature, we have
checked the combined effect of both toxins, and results
show that the addition of AZ after OA stimulation induces
the same increase as the control, indicating that both toxins
might interact at the same transduction level.
Acknowledgments
This work could not have been done without the
invaluable collaboration of the staff at the General Hospital
of Lugo from the Centro de Transfusion de Galicia (Drs.
Marcelo Alvarenga and Jose A. Gonzalez, Ms. Sara Gomez,
Ana Perez, Dolores Sanchez, Mr. J.M. Rodrıguez, Ms.
Dolores Atanes and Noelia Lauda). This work was funded
with grants FEDER-CICYT-1FD97-0153, Xunta Galicia
(PGIDT99INN26101 and PGIDT00MAR26101PR) and
MCYT(DGI) BMC2000-0441. L.A. de la Rosa is supported
by a scholarship from CONACYT, Mexico.
References
[1] Vieytes MR, Louzao MC, Alfonso A, Cabado AG, Botana LM. Sea-
food and freshwater toxins: pharmacology, physiology and detection.
New York: Marcel Dekker, 2000. pp. 239–56.
[2] Baden DG, Adams DJ. Seafood and freshwater toxins: pharmacol-
ogy, physiology and detection. New York: Marcel Dekker, 2000.
pp. 505–32.
[3] Shimizu Y. Seafood and freshwater toxins: pharmacology, physiology
and detection. New York: Marcel Dekker, 2000. pp. 151–72.
[4] Tosteson MT. Seafood and freshwater toxins: pharmacology, physiol-
ogy and detection. New York: Marcel Dekker, 2000. pp. 549–66.
[5] Estacion M. Seafood and freshwater toxins: pharmacology, physiol-
ogy and detection. New York: Marcel Dekker, 2000. pp. 473–503.
[6] Craik DJ, Scanlon MJ. Seafood and freshwater toxins: pharmacol-
ogy, physiology and detection. New York: Marcel Dekker, 2000.
pp. 715–40.
[7] Yasumoto T. Seafood and freshwater toxins: pharmacology, physiol-
ogy and detection. New York: Marcel Dekker, 2000. pp. 1–18.
[8] Draisci R, Lucentini L, Mascioni A. Seafood and freshwater toxins:
pharmacology, physiology and detection. New York: Marcel Dekker,
2000. pp. 289–324.
[9] de la Rosa LA, Alfonso A, Vilarino N, Vieytes MR, Botana LM.
Biochem Pharmacol 2001;61:827–33.
[10] McMahon T, Silke J. Harmful Algae News 1996;14:2.
[11] Satake M, Ofuji K, Naoki H, James KJ, Furey A, McMahon T, Silke J,
Yasumoto T. J Am Chem Soc 1998;120:9967–8.
[12] Ofuji K, Satake M, McMahon T, Silke J, James KJ, Naoki H,
Oshima Y, Yasumoto T. Nat Toxins 1999;7:99–102.
[13] Ofuji K, Satake M, McMahon T, James KJ, Naoki H, Oshima Y,
Yasumoto T. Biosci, Biotechnol, Biochem 2001;65:740–2.
[14] Ito E, Satake M, Ofuji K, Kurita N, McMahon T, James K, Yasumoto
T. Toxicon 2000;38:917–30.
[15] Green DR, Reed JC. Science 1998;281:1309–12.
[16] Hayakawa K, Okagaki T, Dobashi T, Sakanishi A, Kaneko K, Koha-
ma K. Biochem Biophys Res Commun 1992;177:1155–60.
[17] Fiorentini C, Matarrese P, Fattorossi A, Donelli G. Toxicon 1996;34:
937–45.
[18] Louzao MC, Alfonso A, Cabado AG, Botana AM, Goenaga X,
Vieytes MR, Botana LM. Fresenius’ J Anal Chem 1994;349:
465–8.
[19] Alfonso A, Louzao MC, Vieytes MR, Botana LM. Toxicon 1994;32:
1593–8.
[20] Adams SR, Harootunian AT, Buechler YJ, Taylor SS, Tsien RY. Na-
ture 1991;349:694–7.
[21] Thomas JA, Buchsbaum RN, Zimniak A, Racker E. Biochemistry
1979;18:2210–8.
[22] Grynkiewicz G, Poenie M, Tsien RY. J Biol Chem 1985;260:
3440–50.
Y. Roman et al. / Cellular Signalling 14 (2002) 703–716 715
[23] Mohr FC, Fewtrell C. J Immunol 1987;138:1564–70.
[24] Louzao MC, Vieytes MR, Baptista de Sousa JMV, Leira F, Botana
LM. Anal Biochem 2001.
[25] Ohta M, Narahashi T, Keeler R. J Pharmacol Exp Ther 1973;1984:
143–54.
[26] Ritchie JM. Ann NY Acad Sci 1986;479:385–401.
[27] Penner R, Fasolato C, Hoth M. Curr Opin Neurobiol Rev 1993;3:
368–74.
[28] Aussel C, Marhaba R, Pelassy C, Breittmayer J-P. Biochem J 1996;
313:909–13.
[29] Mason MJ, Mayer B, Hymel LJ. Am J Physiol 1993;264:C654–62.
[30] Nofer JR, Tepel M, Walter M, Seedorf U, Assmann G, Zidek W. J Biol
Chem 1997;272:32861–8.
[31] Cooper DR, Hanson-Painton O. J Clin Ligand Assay 2000;23:50–6.
[32] Yano H, Nakanishi S, Kimura K, Hanai N, Saitoh Y, Fukui Y,
Nonomura Y, Matsuda Y. J Biol Chem 1993;268:25846–56.
[33] Akiyama T, Ishida J, Nakagawa S, Ogawara H, Watanabe S, Itoh N,
Shibuya M, Fukami Y. J Biol Chem 1987;262:5592–5.
[34] Fabbri E, Brighenti L, Ottolenghi C. J Enzyme Inhib 1991;5:85–98.
[35] Beani L, Bianchi C, Guerrini F, Marani L, Pistocchi R, Tomasini
MC, Ceredi A, Milandri A, Poletti R, Boni L. Toxicon 2000;38:
1283–97.
[36] Narahashi T. J Pharmacol Exp Ther 2000;294:1–26.
[37] Spector I, Braet F, Shochet NR, Bubb MR. Microsc Res Tech 1999;
47:18–37.
[38] Baldacini O, Lutun P, Girardot R, Monteil H. Nat Toxins 1999;1:
361–8.
[39] Macıas SM, Garcıa SJ. Toxicon 1994;32:105–12.
[40] Blankson H, Holen I, Seglen PO. Exp Cell Res 1995;218:522–30.
[41] Yano Y, Sakon M, Kambayashi J, Kawasaki T, Senda T, Tanaka K,
Yamada F, Shibata N. Biochem J 1995;307:439–49.
[42] Vieytes MR, Fontal OI, Leira F, Vieites JM, Botana LM. Anal
Biochem 1997;248:258–64.
[43] Moreau V, Way M. Curr Opin Cell Biol 1999;11:152–8.
[44] Salmon ED, Way M. Curr Opin Cell Biol 1999;11:15–7.
[45] Mashima T, Naito M, Fujita N, Nogushi K, Tsuruo T. BBRC 1995;
217:1185–92.
[46] Thornberry NA, Lazebnik Y. Science 1998;281:1312–6.
[47] Suarez-Huerta N, Mosselmans R, Dumont JE, Robaye B. J Cell Phys-
iol 2000;184:239–45.
[48] Hengartner MO. Nature 2000;407:770–6.
[49] Gottlieb RA. FEBS Lett 2000;482:6–12.
[50] Gross A, McDonnell JM, Korsmeyer SJ. Genes Dev 1999;13:
1899–911.
[51] Haverstick DM, Dicus M, Resnick MS, Sando JJ, Gray LS. J Biol
Chem 1997;272:15426–33.
[52] Parekh AB, Penner R. Physiol Rev 1997;77:901–30.
[53] Guse AH. Crit Rev Immunol 1998;18:419–48.
[54] Taylor CW, Broad LM. TIPS 1998;19:370–5.
[55] Densmore JJ, Haverstick DM, Szabo G, Gray LS. FEBS Lett 1996;
312:161–4.
[56] Benten WP, Lieberherr M, Sekeris CE, Wunderlich F. FEBS Lett
1997;407:211–4.
[57] Balasubramanyam M, Gardner JP. Cell Calcium 1995;18:526–41.
[58] Marriot I, Mason MJ. J Biol Chem 1996;271:26732–8.
[59] Gerardy-Schahn R, Mittrucker HW, Schultze U, Fleischer B. J Biol
Chem 1991;266:6942–7.
[60] Alemany R, Meyer zu Heringdorf D, van Koppen CJ, Jakobs KH.
J Biol Chem 1999;274:3994–9.
[61] Inngjerdingen M, Damaj B, Maghazachi AA. J Immunol 2000;164:
4048–54.
[62] Rosskopf D, Daelman W, Busch S, Schurks M, Hartung K, Kribben A,
Michel MC, Siffert W. Am J Physiol 1998;274:C1573–82.
[63] van Koppen C, Meyer zu Heringdorf D, Laser KT, Zhang C,
Jakobs KH, Bunemann M, Pott L. J Biol Chem 1996;271:2082–7.
[64] Kolb JP, Genot E, Petit-Koskas E, Paul-Eugene N, Dugas B. Eur J
Immunol 1990;20:969–76.
[65] Chung SC, McDonald TV, Gardner P. Br J Pharmacol 1994;113:
861–8.
[66] Chaffin KE, Beals CR, Wilkie TM, Forbush KA, Simon MI, Perlmut-
ter RM. EMBO J 1990;9:3821–9.
[67] de la Rosa LA, Vilarino N, Vieytes MR, Botana LM. Cell Signalling
2001;13:441–9.
[68] Takemura H, Hatta S, Yamada K, Ohshika H. Life Sci 1995;56:
1443–54.
[69] Kaminuma O, Mori A, Ogawa K, Kikkawa H, Nakata A, Ikezawa K,
Okudaira H. Br J Pharmacol 1999;127:521–9.
[70] Rothman BL, Kennure N, Kelley KA, Katz M, Aune TM. J Immunol
1993;151:6036–42.
[71] van Tits LJ, Michel MC, Motulsky HJ, Maisel AS, Brodde O-E. Br J
Pharmacol 1991;103:1288–94.
[72] Sharp BM, Shahabi NA, Heagy W, McAllen K, Bell M, Huntoon C,
McKean DJ. Proc Natl Acad Sci USA 1996;93:8294–9.
[73] Gessi S, Varani K, Merighi S, Morelli A, Ferrari D, Leung E,
Baraldi PG, Spalluto G, Borea PA. Br J Pharmacol 2001;134:
116–26.
[74] Chiono M, Mahey R, Tate G, Cooper DMF. J Biol Chem 1995;270:
1149–55.
[75] Clark RB, Friedman J, Kunkel MW, January BG, Shenolikar S. J Biol
Chem 1993;268:3245–50.
[76] Shibata H, Robinson FW, Soderling TR, Kono T. J Biol Chem 1991;
266:17948–53.
Y. Roman et al. / Cellular Signalling 14 (2002) 703–716716