AVERTISSEMENT LIENS - Thèses
255
AVERTISSEMENT Ce document est le fruit d’un long travail approuvé par le jury de soutenance et mis à disposition de l’ensemble de la communauté universitaire élargie. Il est soumis à la propriété intellectuelle de l’auteur : ceci implique une obligation de citation et de référencement lors de l’utilisation de ce document. D’autre part, toute contrefaçon, plagiat, reproduction illicite de ce travail expose à des poursuites pénales. Contact : [email protected] LIENS Code la Propriété Intellectuelle – Articles L. 122-4 et L. 335-1 à L. 335-10 Loi n° 92-597 du 1 er juillet 1992, publiée au Journal Officiel du 2 juillet 1992 http://www.cfcopies.com/V2/leg/leg-droi.php http://www.culture.gouv.fr/culture/infos-pratiques/droits/protection.htm
-
Upload
khangminh22 -
Category
Documents
-
view
5 -
download
0
Transcript of AVERTISSEMENT LIENS - Thèses

AVERTISSEMENT
Ce document est le fruit d’un long travail approuvé par le jury de soutenance et mis à disposition de l’ensemble de la communauté universitaire élargie. Il est soumis à la propriété intellectuelle de l’auteur : ceci implique une obligation de citation et de référencement lors de l’utilisation de ce document. D’autre part, toute contrefaçon, plagiat, reproduction illicite de ce travail expose à des poursuites pénales. Contact : [email protected]
LIENS
Code la Propriété Intellectuelle – Articles L. 122-4 et L. 335-1 à L. 335-10 Loi n° 92-597 du 1er juillet 1992, publiée au Journal Officiel du 2 juillet 1992 http://www.cfcopies.com/V2/leg/leg-droi.php http://www.culture.gouv.fr/culture/infos-pratiques/droits/protection.htm

THÈSE
En vue de l’obtention du
DOCTORAT DE L’UNIVERSITÉ DE TOULOUSE
Délivré par l’Université Toulouse Capitole
École doctorale : TESC - Temps, Espaces, Sociétés, Cultures
Présentée et soutenue par
LUCENA Délio
Le 16 décembre 2020
Beyond the Dyadic Approach in Social Network Analysis: Applications to Innovation Studies and Financial Economics
Spécialité : Sciences Économiques
Unité de recherche : LEREPS - Laboratoire d'Etudes et de Recherche sur l'Economie, les Politiques et les Systèmes Sociaux
Directeur de thèse : M. Jérôme VICENTE, Professeur, Sciences Po Toulouse
JURY
Rapporteurs M. Clemens JOBST, Professor, University of Vienna M. Francesc Xavier MOLINA MORALES, Professor, University Jaume I
Suffragants Mme Elisa GIULIANI, Professor, University of Pisa Mme. Elvira UYARRA, Reader, The University of Manchester Directeur(s) de thèse
M. Jérôme VICENTE, Professeur, Sciences Po Toulouse M. Stefano UGOLINI, Maître de Conférences, Sciences Po Toulouse


“The University is not to provide any approval or disapproval regarding the opinions this PhD dissertation includes.
These opinions must be considered as being solely those of their authors”
“L’Université n’entend donner aucune approbation
ni aucune improbation aux opinions émises dans les thèses.
Ces opinions doivent être considérées comme propres à leurs auteurs.”


For Renata, Erika and Lexa
Acknowledgments
I would like to express my sincere gratitude to Jérôme Vicente. I thank him not only for giving me the opportunity to do this thesis, but also for his good advices, unconditional sincerity and his availability whenever I needed him. I am also extremely grateful to Stefano Ugolini. What began as a small collaboration resulted in a large part of this thesis, and has giving me the opportunity to learn a lot from him. I thank him also for all the support and encouragement during these years. I thank both of them for the good moments outside the lab. Furthermore, I would like to thank Olivier Accominotti, whose perfectionism has led us through unexpected research paths.
I would like to thank the members of my committee, Professors Clemens Jobst, Francesc Xavier Molina Morales, Elvira Uyarra and Elisa Giuliani for agreeing to evaluate this work.
My appreciation also extends to the all the LEREPS members, which is without a doubt a wonderful research unit. Thanks to Luis Orozco, Jean-Pierre del Corso, François Fall, Rachel Levy, Joël Carreiras, Geoffroy Labrouche, Héloïse Valette, Marie Derville Joan Crespo, Cathy Milou, Bruno De Menna, Célia Cholez, Hélène Cabanes, Isabelle Bagdassarian, Zafa Uwingabire and all the other members for sharing good moments together, the great work environment, their help and support. Special thanks to Anne-Marie Beyssen, because she makes everything easier and always finds the right solution.
Also, thanks to all those great researchers that I have met at conferences and courses (in particular, to Pierre-Alexandre Balland, Ron Boschma, Andrea Morrison and Müge Özman), who many ways have contributed to this work with their suggestions and remarks. I also thank the fellow doctoral candidates (some of whom are already doctors) that I met during the PhD courses in Nice and Utrecht, for the stimulating talks and good times.
A special thanks to the other follow researchers in Toulouse (Michel Grossetti, Marie-Pierre Bès, Béatrice Milard and Guillaume Favre) for their help and advice. Great thanks to Caterina Thomàs Vanrell, Marion Maisonobe and Nathalie Del Vecchio.
Of course, to my family, especially my parents and my sister, for their unconditional support and encouragement during my thesis process and for all of my life choices.
Finally, to whom this thesis is dedicated. Although their support to make this work easier has been very uneven, all three of them are my source of motivation and happiness. I love you.
This research has received financial support from the University of Toulouse Capitole and Sciences Po Toulouse, employing me as a teaching and research assistant in Economics.


7
Summary
General introduction 9
Chapter 1 – Chasing “Strange Animals”: Network Analysis Tools for the Study of Hybrid Organizations 19
Chapter 2 – The visible hand of cluster policy makers: An analysis of Aerospace Valley (2006-2015) using a place-based network methodology 57
Chapter 3 – Do R&D diversification policies change the cognitive structure of knowledge networks? Evidence from France using a meso-structural approach 95
Chapter 4 – The Origination and Distribution of Money Market Instruments: Sterling Bills of Exchange during the First Globalisation 127
Chapter 5 – Bank substitutability and financial network resilience: insights from the first globalization 181
General conclusions 221
General bibliography 227
List of figures 245
List of tables 247

8

9
General introduction
In real-world economies and societies, it is usual to observe the existence of formal or informal
arrangements between actors (individuals and/or organizations) aimed at achieving both common
and individual objectives. Shaped by pairwise (dyadic) interactions, these forms of collective action
generate hybrid organizational forms or “institutional structures of production” (Menard, 2013)
which situate themselves half-way between the micro and macro level and are more than the sum of
their parts – i.e., they become “higher-order” (supra-dyadic) entities (Battiston et al., 2020). Such
structures play an essential role in transforming interacting micro behaviour into aggregate (macro)
outcomes. As their boundaries are often loosely-defined and unstable, however, these hybrid
organizations still remain poorly understood and under-researched in economics to date.
Going into these “mesoscopic” structures with suited methodological tools is thus an important
challenge and the aim of this thesis. Its contribution is twofold. On the one hand, we propose new
methodologies from social network analysis (the “place-based methodology” and the “chain-based
methodology”) that allow overcoming the pitfalls of traditional, dyad-based analytical tools. On the
other hand, we perform two concrete applications of these methodologies to two different domains
(respectively, innovation studies and financial economics). In doing that, we show their distinct
advantages in capturing the structural properties of hybrid organizations and in bringing renewed
interpretations of many economic phenomena for which the structure of interactions and the very
nature of spillovers between actors matter.
Our starting point is to argue that it is convenient to represent hybrid organizations as networks, and
to develop network methodologies that allow scaling up the traditional analysis of pairwise
interactions and dyadic operators to a structural network analysis. We then distinguish between two
discrete types of hybrid organizations: “horizontal” organizations (regrouping individuals with close
functions and shared objectives) and “vertical” organizations (regrouping individuals with different
objectives and properties).
“Horizontal” hybrid organizations focus on common properties of actors arising from collective
action – viz. groups, or (more formally) sets. Indeed, group membership implies common properties
such as shared objectives, resources, outcomes, behaviours, beliefs, identity, and so on.
Collaborative research projects, technological clusters, firms’ directorate boards, co-authored

10
publications, lobbies, joint-ventures, and social clubs are just some common examples of these
“mesoscopic” structures. The intersections or overlaps among groups – actors that are involved in
several groups – are particularly relevant both for groups and actors. For groups, overlaps represent
“bridges” through which “fluids” are allowed to circulate (Owen-Smith and Powell, 2004), and
imply ways to exchange, coordinate, influence, or control. For actors, overlaps imply shared
properties – those from the groups to which they belong – but some “bridging” or “broking”
capacities. “Horizontal” hybrid organizations can be conveniently seen as affiliation networks
(Faust, 1997), but classical methodologies – viz. the analysis of individuals’ one-mode projected
networks – miss the accurate identification of these unique combinations of affiliations, and
generate an artificial clustering or cliquishness (Newman et al., 2001; Uzzi and Spiro, 2005) that
can lead to misinterpretations. To overcome these problems, we propose a simple and little-know
alternative approach – the “place-based methodology” (Pizarro, 2007).
“Vertical” hybrid organizations focus on the structure – the roles played by actors and the links
between them – and the unity of collective action. Aggregations of pairwise interactions make sense
and achieve their objectives when they form indissociable structures, where actors take roles that
regulate the interactions with the others. Supply chains, transport networks, brokerage, or financial
intermediation are just some simple examples of these “mesoscopic” structures. In these forms of
organization, the structure formed by actors and links is relevant, but also its unity, since the loss or
removal of any actor or link implies the collapse of the organization. In this thesis, we highlight the
convenience of seeing these hybrid organizations as supra-dyadic interaction network (also known
as “higher-order” interaction networks), and we focus on one form of supra-dyadic interaction unit:
relational chains. Classical and more recent approaches – single-layer single-relational and multi-
layer multi-relational networks, respectively – fail to consider the structures of hybrid organizations
as units, generating some biases that can lead to misinterpretations. In recent times, a
multidisciplinary stream of research consecrated to the study of supra-dyadic interaction networks
has emerged (Battiston et al., 2020). While scholars have mostly focused on the question of unity
and how to preserve it in the analysis (mainly using hypergraphs: Bonacich et al., 2004, Estrada and
Rodríguez-Velázquez, 2006), the proposed approaches still go by the internal interaction structure
of “higher-order” structures. To overcome this limitation, we suggest to use hyperstructures (Criado
et al., 2010), which preserve both the unity and the internal structure of supra-dyadic interaction
organization: this leads us to formulate our “chain-based methodology” for the study of relational
chains. The formulation of this original analytical tool, as well as its introduction into economics as

11
a way to preserve the unity of sequential relational chains, are another major methodological
contribution of this thesis.
This thesis is organized as follows. Chapter 1, “Chasing “Strange Animals”: Network Analysis
Tools for the Study of Hybrid Organizations” (co-authored with Stefano Ugolini and Jérôme
Vicente), introduces the theoretical framework and research opportunities for the study of hybrid
organizations, and argues for the need to develop adequate empirical methodologies in order to
analyse them. On the one hand, the use of classical tools for affiliation networks (“horizontal”
organizations) is discussed, highlighting the methodological and interpretative problems generated
by the popular one-mode projection approach. Based on the concept of structural equivalence
(Lorrain and White, 1971), the “place-based methodology” is proposed for the study of affiliation
networks. Structural equivalence stipulates that every two actors occupy a structurally equivalent
position if they connect in the very same way to the network, i.e. if they have the same structural
properties (the same relational resources and constraints). Grouping structurally equivalent
positions together as single nodes allows reducing the network to its “skeleton” (Breiger et al.,
1975; Doreian, 2009). The proposed methodology identifies structurally equivalent positions of
actors in affiliation networks – viz. places – as very unique combinations of affiliation to sets,
which can be projected as a network of places. This allows overcoming the biases and
misinterpretations associated to classical one-mode projection analyses. On the other hand, the use
of hyperstructures – a novel methodological approach based on the use of hypergraphs – is
proposed for the study of “vertical” organizations. We focus on a particular kind of supra-dyadic
interactions – viz. sequential interaction (or, “relational”) chains – where positions and links are
ordered (e.g. a buyer-broker-seller triad) and removal of any of the roles or links results in the
collapse of the entire supra-dyadic unit. Both the classical approach via single-layer single-
relational networks and the more recent approach via multi-layer networks are discussed: since they
do not preserve the unity of relational chains, these approaches present serious analytical
shortcomings. To overcome these deficiencies, the “chain-based methodology” – based on the
hyperstructure approach – is proposed, since it preserves both the unity and the substructure of
supra-dyadic interactions within the relational chain.
In the remainder of the thesis, these methodological insights are put to work in two different
domains. In Chapters 2 and 3, the “place-based methodology” is applied in the context of
innovation economics, in order to study the structural properties of one particular type of
“horizontal” hybrid organization: viz., collaborative R&D projects. Innovation studies are a not a
field chosen “at random”, since economists (Acemoglu et al., 2016), sociologists (Owen-Smith and

12
Powell, 2004) as well as economic geographers (Giuliani, 2007; Ter Wal and Boschma, 2009) have
early captured the fact that innovation processes are better understood through the mechanisms of
network formation and dynamics than through pure market interactions and competitive pressures.
Nevertheless, one of the challenges remains to explore new ways to deal with network data on R&D
collaborations in order to capture higher-order structures of interaction which may provide new
interpretations of innovation networks dynamics, such as resilience and diversification, both being
nowadays at the core of the design of innovation policies.
Chapter 2, “The visible hand of cluster policy makers: An analysis of Aerospace Valley (2006-2015)
using a place-based network methodology” (co-authored with Jérôme Vicente), suggests capturing
particular hybrid organizations in two related topics of innovations studies these last years: the
structuring of innovation networks and clusters, with a focus on the effects of networks incentives
in the organization of innovations activities and the macro-structure of knowledge spillovers. More
precisely, we focus on the effects of cluster R&D policies on collaborative knowledge networks.
Using an original hand-collected dataset of publicly-funded collaborative projects from the French
Aerospace Valley cluster (from 2006 to 2015), we build 4-cohort knowledge networks that enable
us evidencing the evolving structural properties of the cluster over time. We analyse networks
combining both places and cohesive blocks methodologies (Moody and White, 2003) in order to
extract the community structure. This allows us to evidence the meso structure of the network, and
to study both its micro and macro properties. Concretely, highly cohesive and influential groups –
which we call “elites” – are identified, and their composition – viz. the organizations and research
projects involved – are studied. We discuss the results of the community structure analyses on the
degree of convergence between the structural properties of the cluster selected by the Program and
policy makers’ objectives. Finally, we identify the actors of the structural and technological changes
observed through the period. In particular, we observe a growing role of SMEs, which move from
the periphery to central positions thanks to their research diversification – viz. cross-sectoral
projects.
Chapter 3, “Do R&D diversification policies change the cognitive structure of knowledge
networks? Evidence from France using a meso-structural approach”, goes beyond the regional level
of cluster to invest the structure of innovation networks at the national scale, still stressing on the
relevance of the “places” methodology as regard previous works on innovation network based on
public-funded R&D projects based on pure dyadic network methodologies. We examine the effects
of diversification R&D policies on sectoral collaborative knowledge networks. Diversification
R&D policies – mainly through cross-sectoral project funding – try to raise new research topics and
13
technologies in order to develop new markets, thus increasing the competitiveness and resilience of
R&D systems (Porter, 1998; Boschma and Frenken, 2012; Lämmer-Gamp et al., 2014). However,
the probability of successful emergence of new topics – diversified topics – is higher when they are
related to more cohesive/core parts of the technology/knowledge network (Boschma et al., 2014;
Crespo et al., 2014; Essletzbichler, 2015; Crespo et al., 2016) – viz., when they are well-integrated.
Using data on publicly-funded collaborative projects from the French FUI program for the period
2006-2015 (18 calls for tender), we build 31 knowledge networks by cohort and sector of activity.
We combine both places and cohesive blocks methodologies, and define “peaks” as highly cohesive
communities at the local level. This allows studying the micro and macro structural properties of the
networks at the meso-level. Additionally, we use a conceptual framework of proximity (based on
collective action – e.g. shared objectives, contributions, and outcomes – rather than on individual
attributes) to identify both the micro-dynamics of actors and the cognitive macro-structure of the
networks. Through a qualitative analysis, we confirm that “peaks” can be identified as main
research topics of the networks. Consequently, the study of “peaks” – their number and composition
– allows us obtaining the research topics portfolio and identifying the topics that come from cross-
sectoral projects – viz., diversified topics. As this methodology provides information about
cognitive structures using simple affiliation data (viz., organization-projects), we can quantitatively
examine the effect of funded cross-sectoral projects on sectors’ research portfolios. The results
point to the existence of a positive effect of diversification R&D policy incentives on the emergence
of well-integrated diversified topics. However, there is no evidence that these policies have a
positive effect on the broadening of knowledge networks’ topics portfolios. Additionally, the effect
of diversification policies on the emergence of diversified topics is unequal across sectors. The need
for more “surgical” measures regarding the nature and cycle-life of sectors is discussed.
In Chapters 4 and 5 of the thesis, we apply the “chain-based methodology” in the context of
financial economics, in order to study the structural properties of one particular type of “vertical”
hybrid organization: viz., financial intermediation chains. Since the collapse of Lehman Brothers (a
relatively small, but highly connected bank) in 2008, network analysis and simulation
methodologies have been become overwhelmingly popular in financial economics as tools to
evaluate the resilience of financial systems (Glasserman and Young, 2016; Battiston and Martinez-
Jaramillo, 2018; Caccioli et al., 2018; Iori and Mantegna, 2018). This abundant literature has been
marked by a strict dyadic approach, as it has almost constantly seen financial networks as the sum
of the bilateral credit relations existing between similar institutions (i.e., interbank loans). However,
real-world financial networks go beyond the simple interbank networks that constitute their

14
backbone (Lux, 2016). Recent research has highlighted the existence of long intermediation chains
(Adrian and Shin, 2010), that play a crucial role in overcoming information asymmetries in credit
markets (Glode and Opp, 2016). To the best of our knowledge, our contribution is the first one to
consider these chains as hybrid organizations, as well as the first one to apply novel network
analysis tools that consider the unity and substructure of these “mesoscopic” entities. To do so, we
collect an original database featuring entire intermediation chains connecting borrowing firms to
lending institutions. This database covers the global financial network not as it is today, but in a
previously unexplored period – i.e., the so-called first globalization of 1880-1914. It is therefore of
special interest as we compare it to today: as a matter of fact, such a comparison reveals to what
extent a different organization of “mesoscopic” entities may entail huge differences in terms of
macroscopic outcomes (in particular, in terms of the system’s resilience to shocks).
Chapter 4, “The Origination and Distribution of Money Market Instruments: Sterling Bills of
Exchange during the First Globalisation” (co-authored with Olivier Accominotti and Stefano
Ugolini), presents our database and looks at the determinants of the observed structure of our
“mesoscopic” entities – i.e. the origination and distribution chains of the staple money market
instruments of the time (sterling bills of exchange). Our hand-collected data set comes from a
unique archival source – the Bank of England’s Discount Ledgers – which report systematic micro-
level information of bills circulating on the London money market and on all agents involved in
their origination and distribution. For this work, we exploit all individual bills re-discounted by the
Bank of England during the year 1906 (23,493 bills). Bills of exchange always involved a drawer (a
borrower located anywhere in the world), and acceptor (a London-based actor who guaranteed the
bill’s payment in pounds sterling at maturity), and a discounter (a wholesale lender). In other words,
a bill is an origination-distribution chain involving three ordered roles by two ordered links. This
chain which must be considered as a supra-dyadic unit, since the removal of any of the roles or the
links results in the collapse of the entire chain. The data set is reduced by the removal of all
redundant drawer-acceptor-discounter triads, obtaining 8,888 non-identical bills. Then, we build a
static network of 4,970 agents. Among these, we find that the drawer role is played by 3,554 nodes,
the acceptor role by 1,439 nodes, and the discounter by 145 nodes (note that some nodes played
more than one role). Thus, we analyse the sterling money market preserving the unity of bills, so as
supra-dyadic units. Our analysis reveals a globalized market, and underscores the crucial role
played by acceptors and discounters in overcoming information asymmetries between borrowers
and final lenders. Indeed, at origination, one first guarantee of the bill’s payment is provided by the
acceptor, thus reducing credit risk before distribution to a discounter. Next, as the bill is distributed
15
to a final investor (a re-discounter or “retail” lender), the discounter adds a secondary guarantee by
endorsing the bill. Thus, discounters played two distinct functions on the money market: not only
they distributed bills, but also enhanced their creditworthiness. This complex market organization
ensured that risky private debts could be transformed into extremely liquid and safe monetary
instruments traded throughout the global financial system.
Chapter 5, “Bank substitutability and financial network resilience: insights from the first
globalization” (co-authored with Olivier Accominotti and Stefano Ugolini), investigates how the
meso structure of our “vertical” hybrid organizations (intermediation chains) impacted the macro
properties of the global financial network (its resilience to shocks). We focus on one particular
aspect of resilience: the degree of substitutability of banks. While a recent wave of research on
financial network resilience has largely focused on the interconnectedness dimension and the
identification of “too-interconnected-to-fail” actors (Freixas et al., 2000; Glasserman and Young,
2016; Battiston and Martinez-Jaramillo, 2018; Caccioli et al., 2018; Iori and Mantegna, 2018), we
remark that the substitutability dimension (yet one of the five dimensions of systemicness put
forward by the Basel Committee on Banking Supervision) has received considerably less attention.
Using the dataset introduced in Chapter 4, we study the resilience of the international financial
network during the first globalization by focusing on the substitutability of banks (acceptors and
discounters). With this purpose, we apply simple node-removal techniques to simulate the upper-
bound effects of bank defaults on firms’ access to credit. As argued above, intermediation chains
are supra-dyadic units, so the removal of any of its actors involves the collapse of the entire chain.
Then, in our framework substitutability refers to the existence for borrowing firms of alternative
paths to access the market through other the relational chains when their bank is removed.
Consequently, the network is defined as a hyperstructure in order to preserve both the unity and the
internal relational substructure of chains. Compared to nowadays’ interbank networks –
characterized by highly hierarchical structures and few very highly systemic, unsubstitutable actors
(Pröpper et al., 2008; Craig and Von Peter, 2014; Fricke and Lux, 2015) – our results show a
resilient financial network, where even individuals or groups of actors with relatively high market
share exhibit low levels of systemicness and high substitutability (both at an absolute, local, or
geographic level). This means that, in stark contrast with the findings of the literature on current-
day systems, a financial network deprived of systemic actors can exist and did actually exist at one
of the highest times of international economic development. This conclusion has important
implications for regulators, as it shows that providing banks with incentives to produce private
information (rather than merely relying on publicly-available information) can considerably

16
enhance the resilience of the financial system to shocks. From the general viewpoint of this thesis,
Chapters 4 and 5 confirm that the way hybrid organizations structure themselves may have far-
reaching effects on the macro properties of economic systems.

17
References of the introduction
Acemoglu, D., Akcigit, U., Kerr, W.R. (2016) Innovation Network. Proceedings of the National Academy of Sciences, 113(41), 11483–11488.
Adrian, T., Shin, H.S. (2010) The Changing Nature of Financial Intermediation and the Financial Crisis of 2007–2009. Annual Review of Economics, 2(1), 603–618.
Battiston, F., Cencetti, G., Iacopini, I., Latora, V., Lucas, M., Patania, A., Young, J.G., Petri, G. (2020) Networks beyond Pairwise Interactions: Structure and Dynamics. Physics Reports, 874, 1–92.
Battiston, S., Martinez-Jaramillo, S. (2018) Financial Networks and Stress Testing: Challenges and New Research Avenues for Systemic Risk Analysis and Financial Stability Implications. Journal of Financial Stability, 35, 6–16.
Bonacich, P., Holdren, A.C., Johnston, M. (2004) Hyper-Edges and Multidimensional Centrality. Social Networks, 26(3), 189–203.
Boschma, R., Balland, P.A., Kogler, D.F. (2014) Relatedness and Technological Change in Cities: The Rise and Fall of Technological Knowledge in US Metropolitan Areas from 1981 to 2010. Industrial and Corporate Change, 24(1), 223–250.
Boschma, R., Frenken, K. (2012) Technological Relatedness and Regional Branching. In Bathelt, H., Feldman, M. and Kogler, D.F. (eds.), Beyond Territory. Dynamic Geographies of
Knowledge Creation, Diffusion and Innovation. Routledge, pp. 64–81.
Breiger, R.L. (1974) The Duality of Persons and Groups. Social Forces, 53(2), 181–190.
Caccioli, F., Barucca, P., Kobayashi, T. (2017) Network Models of Financial Systemic Risk: A Review. Journal of Computational Social Science, 1(1), 81–114.
Craig, B., Peter, G. von (2014) Interbank Tiering and Money Center Banks. Journal of Financial
Intermediation, 23(3), 322–347.
Crespo, J., Suire, R., Vicente, J. (2014) Lock-in or Lock-out? How Structural Properties of Knowledge Networks Affect Regional Resilience. Journal of Economic Geography, 14(1), 199–219.
Crespo, J., Vicente, J., Amblard, F. (2016) Micro-Behaviors and Structural Properties of Knowledge Networks: Toward a ‘One Size Fits One’ Cluster Policy. Economics of
Innovation and New Technology, 25(6), 533–552.
Criado, R., Romance, M., Vela-Pérez, M. (2010) Hyperstructures: A New Approach to Complex Systems. International Journal of Bifurcation and Chaos, 20(03), 877–883.
Doreian, P. (2009) Positional Analysis and Blockmodeling. In Meyers, R.A. (ed.), Encyclopedia of
Complexity and Systems Science. Springer New York, New York, pp. 6913–6927.
Essletzbichler, J. (2015) Relatedness, Industrial Branching and Technological Cohesion in US Metropolitan Areas. Regional Studies, 49(5), 752–766.
Estrada, E., Rodríguez-Velázquez, J.A. (2006) Subgraph Centrality and Clustering in Complex Hyper-Networks. Physica A: Statistical Mechanics and its Applications, 364, 581–594.
Faust, K. (1997) Centrality in Affiliation Networks. Social Networks, 19(2), 157–191.

18
Freixas, X., Parigi, B.M., Rochet, J.C. (2000) Systemic Risk, Interbank Relations, and Liquidity Provision by the Central Bank. Journal of Money, Credit and Banking, 32(3), 611–638.
Fricke, D., Lux, T. (2015) Core-Periphery Structure in the Overnight Money Market: Evidence from the e-MID Trading Platform. Computational Economics, 45(3), 359–395.
Giuliani, E. (2007) The Selective Nature of Knowledge Networks in Clusters: Evidence from the Wine Industry. Journal of Economic Geography, 7(2), 139–168.
Glasserman, P., Young, H.P. (2016) Contagion in Financial Networks. Journal of Economic
Literature, 54(3), 779–831.
Glode, V., Opp, C. (2016) Asymmetric Information and Intermediation Chains. American
Economic Review, 106(9), 2699–2721.
Iori, G., Mantegna, R.N. (2018) Empirical Analyses of Networks in Finance. In Hommes, C. and LeBaron, B. (eds.), Handbook of Computational Economics. Elsevier, pp. 637–685.
Lämmer-Gamp, T., zu Köcker, G.M., Nerger, M. (2014) Cluster Collaboration and Business Support Tools to Facilitate Entrepreneurship, Cross-Sectoral Collaboration and Growth (Technical Report No. 1). European Cluster Observatory.
Lorrain, F., White, H.C. (1971) Structural Equivalence of Individuals in Social Networks. The
Journal of Mathematical Sociology, 1(1), 49–80.
Lux, T. (2016) A Model of the Topology of the Bank – Firm Credit Network and Its Role as Channel of Contagion. Journal of Economic Dynamics and Control, 66, 36–53.
Ménard, C. (2003) Hybrid Modes of Organization: Alliances, Joint Ventures, Networks, and Other ‘Strange’ Animals. In Gibbons, R.S. and Roberts, J. (eds.), The Handbook of
Organizational Economics. Princeton University Press, Princeton, pp. 902–941.
Moody, J., White, D.R. (2003) Structural Cohesion and Embeddedness: A Hierarchical Concept of Social Groups. American Sociological Review, 68(1), 103–127.
Newman, M.E.J., Strogatz, S.H., Watts, D.J. (2001) Random Graphs with Arbitrary Degree Distributions and Their Applications. Physical Review E, 64(2), 026118.
Owen-Smith, J., Powell, W.W. (2004) Knowledge Networks as Channels and Conduits: The Effects of Spillovers in the Boston Biotechnology Community. Organization Science, 15(1), 5–21.
Pizarro, N. (2007) Structural Identity and Equivalence of Individuals in Social Networks: Beyond Duality. International Sociology, 22(6), 767–792.
Porter, M.E. (1998) Clusters and the New Economics of Competition. Harvard Business Review, 76(6), 77–90.
Pröpper, I., Marc Van Lelyveld, Heijmans, R. (2008) Towards a Network Description of Interbank Payment Flows (Working Paper No. 177/2008). De Nederlandsche Bank.
Ter Wal, A.L.J., Boschma, R.A. (2008) Applying Social Network Analysis in Economic Geography: Framing Some Key Analytic Issues. The Annals of Regional Science, 43(3), 739–756.
Uzzi, B., Spiro, J. (2005) Collaboration and Creativity: The Small World Problem. American
Journal of Sociology, 111(2), 447–504.

19
Chapter 1 – Chasing “Strange Animals”: Network Analysis Tools for the Study of
Hybrid Organizations
Abstract: Real-life economies feature a number of hybrid organizations laying between the micro and macro
level. Aimed at dealing with spillovers, these mesoscopic structures are coordination mechanisms
with unclear and unstable boundaries. We argue that network analysis tools based on supra-dyadic
relationships can greatly improve our understanding of the structural properties of these “strange animals”. We illustrate this by focusing on two innovative tools: the “place-based methodology” (allowing to assess agents’ substitutability in horizontal affiliation networks), and the “chain-based
methodology” (allowing to assess agents’ substitutability in vertical interaction networks). We provide some example of how the application of such methodologies can concretely improve our
understanding of the resilience properties of widespread real-world hybrid organizations.
Keywords: Hybrid organizations; mesoscopic structures; affiliation networks; supra-dyadic
interaction units; place-based methodology; hyperstructures; chain-based methodology
JEL codes: B41, D85, E14, L14.
This chapter is a working paper co-authored with Stefano Ugolini and Jérôme Vicente (Lereps – Sciences Po Toulouse) which will be submitted for publication in the near future.

20
1.1. Introduction
Between micro behaviour and decision on one side and macro aggregates on the other side, many
rich and complex processes happen to develop. To date, understanding such processes and their role
in many social and non-social phenomena remains one of the biggest challenges for social sciences
(Schelling, 1978; Kirman, 1992) as for physics (Newman, 2003; Battiston et al., 2020). The tools
developed by network science have proven to be particularly appropriate in dealing with such a
challenge (Barabasi, 2002; Watts, 2004). In the recent decades, they have been introduced in many
social sciences, in order to disentangle grey areas between different branches of each discipline: for
instance, in sociology (Granovetter, 1985; Burt, 2000), to better understand social capital and its
role in determining access to resources like jobs or recognition; in management and innovation
studies (Kogut, 2000; Owen-Smith and Powell, 2004), to better capture the drivers of firm creation
and innovative performances; or in economic theory (Jackson, 2008), to better understand the role
of networks in determining individual strategies and the outcomes of coordination games.
Nevertheless, this huge wave of research, which has been applying network theories and tools to
disentangle micro-macro phenomena, has largely occulted the intermediated level of analysis.
Indeed, in this literature macro structures or aggregates are depicted as directly emerging from
pairwise (dyadic) interactions in networks, without paying particular attention to the “strange
animals” (Ménard, 2013) that do exist between the two scales and irrigate economic life. We refer
here to the concepts of meso-structure and hybrid organization, both typifying “higher-order”
structures (Battiston et al., 2020) that emerge from dyadic interactions but, in a sense, escape from
actors’ intention while influencing aggregate outcomes. Such structures have however been
identified by scholars since long. Think for example of industrial districts, originally defined by
Marshall (1919) as “organic wholes”, in which ideas and knowledge are exchanged and improved
through channels which develop beyond entrepreneurs’ intentions, and affect national growth.
Another classical example is interlocking directorates (Schoorman et al., 1981), in which large
communities of inter-linked corporate directors give rise to elite circles influencing industrial
strategy (but also policymaking) without any legal status or formal institutional frontiers.
These meso-structures are “strange” in that they have no formal existence and boundaries as
organizations typically have, making it much harder for scholars to deal with them with respect to
clearly identified micro units of analysis. Nonetheless, hybrid organizations are a fact of economic
life (Thorelli, 1986; Powell, 1990; Holmstrom and Roberts, 1998; Baker et al., 2002; Dopfer et al.,
2004; Ménard, 2013, 2014), and constitute relational matrixes and networks through which many

21
“fluids” such as information, knowledge, or other economic assets can circulate (Owen-Smith and
Powell, 2004). These matrixes and networks display different topological and structural forms, and
these offer great opportunities to analyse how spillovers matter and affect aggregate outcomes.1
Such opportunities have only very partially started to be seized to date.
Going into these hybrid organizations with suited methodological tools is thus an important
challenge, and the aim of this contribution. We argue that it is convenient to represent hybrid
organizations as networks, and to develop network methodologies that allow scaling up the
traditional analysis of pairwise interactions and dyadic operators to a truly structural network
analysis – whose aims are identifying meso-structures, detecting their structural properties, and
undercovering their role in macro-dynamics. We focus on two types of hybrid organizations in
which agents are involved, produce or benefit from spillovers. First, we consider “horizontal”
organizations, which can be conveniently seen as affiliation networks (Faust, 1997). Second, we
consider “vertical” organizations, which can be conveniently seen as supra-dyadic interaction
networks (Bonacich et al., 2004).
In recent decades, different branches of the social science literature have consistently shown that
applying network analysis to both affiliation and interaction networks can yield valuable insights
about the properties of such networks, especially for what concerns their resilience to shocks – the
substitutability of the individuals composing the network, their position or role, as well as the
statistical properties of the network (May et al., 2008; Crespo et al., 2014). However, applying
inappropriate structural analysis tools may be conducive to some errors in the modelling of social
and economic phenomena, as well as in the interpretation of empirical results. Under this respect,
we provide two distinctive contributions, as we propose the adoption of two innovative tools, one
for affiliation networks (the “place-based methodology”) and one for supra-dyadic interaction
networks (the “chain-based methodology”). Both contributions converge in their ability to overpass
the respective biases of the traditional methodologies used for each type of hybrid organization,
which may occult what is structurally going on between agents and macro-structures.
The remainder of the paper is organized as follows. Section 1.2 invests the research opportunities
that lie in treating hybrid organizations as networks, and underlines the need to develop suited
analytic tools for that purpose. Section 1.3 argues that the traditional analysis of affiliation networks
as one-mode projections of bipartite networks can be conveniently replaced by the “place-based 1 The concept of “spillover” is often rather loosely defined in the literature. In this paper, we consider as spillovers both marginal externalities (i.e., “classical” external effects) and inframarginal externalities (i.e., complementarities). For a discussion, see Liebowitz and Margolis (1994) and Hogendorn (2012).

22
methodology”. This methodology introduces the concept of structural equivalence, and allows
overpassing well-known biases related to artificial cliquishness – leading to misinterpretations in
the degree of substitutability of individuals belonging to horizontal hybrid organizations. Section
1.4 argues that the now common analysis of supra-dyadic interaction networks as multi-layer
networks can be conveniently replaced by the “chain-based methodology”. This methodology
introduces the concept of hyperstructure, and allows overpassing well-known biases related to the
lack of consideration for extra-dyadic structures – leading to misinterpretations in the degree of
substitutability of individuals belonging to vertical hybrid organizations. In both sections, we
provide some concrete examples of application of these two new methodologies, and show why
they bring added value to the analysis of real-world phenomena in many topics and subfields of
social sciences. Finally, Section 1.5 concludes that properly applying the correct structural analysis
tools may potentially yield substantial improvements in our understanding of the structural
properties of meso-economic organizations.
1.2. Hybrid organizations and network analysis: conceptual framework
1.2.1. The missing piece of coordination structures in micro-macro dynamics
Economic life involves a complex combination of entities, from individuals to states (including
firms or other intermediate bodies in between), which interact at different scales and through which
many “fluids” circulate. Therefore, an approach defining the micro-foundations of macroeconomic
phenomena only considering individuals as units of analysis (and thus, thinking about micro/macro
loops in terms of how aggregates influence directly individuals and vice versa) early appeared too
simplistic to social scientists, as it occulted important intermediate scales of coordination. Together
with sociology (Weber, 1947) and management (Mintzberg, 1979), economics has not remained on
the fringes of research on organizations, esp. with the contribution of Williamson (1985) and the
development of the New Institutional Economics (NIE) School, both inspired by the seminal
intuitions of Coase (1937, 1960). According to this view, uncertainty about the behaviour of other
agents or the very nature of exchanged goods, and the resulting transaction costs in coordination
dynamics, provide for the existence of different types of organizations in different economic
contexts. The result is a continuum of organizational forms from pure market interaction to pure
authority and hierarchy, with a large spectrum of “strange animals” in between. Such “hybrid”
organizations are characterized by unclear institutional and legal frontiers (Ménard, 2013), so that it

23
is difficult to identify where power and authority actually occur (Perrucci and Pilisuk, 1970).
Moreover, these “strange animals” appear to be aimed at dealing with spillovers otherwise than
through the classical internalization process (via the acquisition of property rights) that Coase
(1937, 1960) and Williamson (1985) famously focused on.
One good example of this problem (and one that has been highly disputed in economic geography
and innovation economics since the 1990s) is provided by the case of knowledge spillovers
(Feldman, 1994). This concept dates back to the intuitions of Marshall (1919), who famously
pointed to the role of “districts” in fostering industrial development at the end of the 19th century.
According to mainstream economics, unintended knowledge spillovers decrease incentives to
innovation, while knowledge accumulation favours economic growth (Arrow, 1972): the resulting
“knowledge dilemma” can be efficiently solved, in a second order optimum, through the
establishment of patents as property rights allowing knowledge to become a tradable good
(Antonelli, 2005). However, other scholars have shown that incentives to innovation and knowledge
accumulation mostly originated from intended knowledge spillovers: such spillovers flow through
communities, sometimes called “clusters” (Owen-Smith and Powell, 2004), which are identified as
a main source of economic growth (Vicente, 2018). The same occurs in other fields and contexts,
for instance in industrial strategy and economic policy, with the role of elite circles in the industry
(interlocking directorates), or in the interactions between “captains of industry” and policymakers –
i.e., communities of people having different institutional affiliations, roles and positions, but sharing
common interests and having close social capital built over time and traced back to their first
interactions in the top administration and business schools (Mizruchi, 1996; Van Apeldoorn and De
Graaff, 2014; Comet, 2019).Yet another example is that of clans or kinship systems, which are
loosely-defined organizations that can have far-reaching consequences in terms of economic
development (Azariadis and Stachurski, 2005).
Clusters, elite circles, clans, among others, are part of these “strange animals” for economists, i.e.
objects with no clear and stable institutional frontiers that can hardly be considered as “agents”, but
whose influence on macro-aggregates and economic dynamics remains strong. These hybrid
organizations cannot be analytically and empirically highlighted in Williamson’s (1985)
framework: even if they are intermediate structures between markets and hierarchies (Ménard,
2013), they lack formal institutional arrangements such as contracts, franchising, or so. To the
contrary, these meso-structures precisely emerge without any formal rule, through social
interactions and relational chains that overpass, and sometimes escape, the intentions of individual
agents in their own pairwise interactions. Detecting these communities and better considering these

24
hybrid organizations as higher-order actors involved in coordination dynamics remains an important
challenge. It would allow studying macro-dynamics and changes in a different (and
complementary) way with respect to traditional micro-macro causation, thus avoiding the biases
and misinterpretations stemming from mere pairwise (dyadic) interactions.
Such biases have been early identified in sociological research on the organizational foundations of
community power. Early contributions by Freeman (1968) and Perrucci and Pilisuk (1970) have
shown that power and influence are diluted through unstable interest groups, whose border
variability cannot be directly linked to common-sense classifications of formal categories of
organizations – thus revealing that the reality of power cannot be searched only in objective
organizational categories. Other structures, often broader and not directly linked to the aggregation
of formal categories of organizations (and therefore, more difficult to portray), do actually matter.
These structures allow for the circulation of different “fluids” that are essential to the determination
of many economic aggregates – which makes some of these “strange animals” even more influential
than visible, formal organizations. Economic sociology recognized this issue very early on, but was
limited at the time by the availability of suited empirical tools and methodologies. Recent
developments in social sciences based on network theory (from mathematics and physics) now
make it possible to overcome these limits and identify richer structural facts, thus opening scope for
a better understanding of the role of these higher-order actors (Battiston et al., 2020).
1.2.2. Studying hybrid organizations through network analysis tools: issues
Network theories have been often used in social sciences with two alternative goals: either 1) to
assess individual performance according to individual network strategy and position (Powell et al.,
1999), or 2) to relate some aggregates and collective behaviours to network properties and
dynamics, themselves emerging from individual behaviour (Watts, 2004; Ahuja et al., 2012). If the
question of how hybrid organizations can be identified and studied is not relevant to the first
approach, it is nonetheless central to the second approach.
So far, network properties and dynamics have been understood as the result of a set of dyadic
relations. In the case of affiliation matrixes in bipartite networks, higher-order structures are treated
as exogenous and infused top-down onto the network: think, for instance, of granted R&D consortia
in which firms are considered to be involved regardless of the actual way they participate into the
project. In the case of interaction matrixes, higher-order structures are identified through

25
exogenously-determined criteria: think, for instance, of acquaintance networks in which individuals
are considered to be involved regardless of the actual way they interact with each other.
Therefore, the analysis of the aggregate properties of these networks (such as their link-formation
behaviour or their resilience to shocks) has been performed through the application of tools
exclusively based on dyadic connections. Such tools do not allow considering higher-order groups
(these “strange animals”) as “mesoscopic nodes” that escape both the intention of microscopic
nodes and the boundaries of clear-cut institutional frontiers (do firms provide similar contributions
to R&D projects in similar ways regardless of their formal affiliation? do people play similar social
roles regardless of the way they are positioned within a web of bilateral interaction links?). Network
scientists have early developed these tools to detect parts of “mesoscopic” structures, without
however going to the point of considering them as higher-order nodes of “higher-order networks”
that can emerge independently of the direct bilateral interaction between their lower-order nodes
(Battiston et al., 2020).
For instance, think of the community detection tools for the identification of several types of
cohesive structures such as cliques (Everett and Borgatti, 1998) and blocks (Moody and White,
2003), which have been largely applied in the literature in order to explore both network dynamics
and structural properties. They have been used to analyse the outcomes of network formation and
growth mechanisms (Snijders, 2001; Barabasi, 2002) as well as the macro-structural properties of
networks, from small worlds and connectedness to assortativity and core-periphery structures
(Watts and Strogatz, 1998; Borgatti and Everett, 2000; Newman, 2002). These methodologies have
vastly contributed to improving our understanding of the way spillovers occur through complex and
evolving social structures. Yet, they do not allow identifying and studying more invisible hybrid
structures, as none of them allows dissociating the notion of group from that of the bilateral links
observed between their microscopic nodes. Mesoscopic nodes do not however necessarily originate
from formal affiliation or bilateral interaction links across microscopic nodes, but rather from
properties related to their position and their relational behaviour. This confers on mesoscopic actors
a hardly perceptible autonomy, but an unquestionable influence on many economic facts. Therefore,
the challenge is to design new methodologies to capture these higher-order nodes (Battiston et al.,
2020) and to study if their structural properties and dynamics affect aggregated outcomes in a
different way than predicted by methodologies based on pure pairwise interactions between initial
lower-order nodes.

26
1.2.3. Beyond pairwise relations: new tools for studying hybrid organizations
In the remainder of this paper, we propose to adopt new network analysis tools going beyond
pairwise relations in order to identify and analyse hybrid organizations. Following the classical
conceptual framework in industrial economics (see e.g. Williamson, 1985), we distinguish between
“horizontal” organizations (regrouping individuals with similar functions or specializations) and
“vertical” organizations (regrouping individuals with different functions or specializations).
We then focus on two types of horizontal and vertical hybrid organizations. First, we consider
horizontal hybrid organizations allowing for coordination through affiliation, as for instance firms
engaged in large R&D collaborative projects or standardization process in a particular industry.
Second, we consider vertical hybrid organizations allowing for coordination through sequential
interactions, as for instance producers of different intermediate goods in a supply chain or shipping
lines in the international shipping network.
Our distinction between affiliation and interaction networks is in line with the seminal contributions
in sociology of Nadel (1957) and Breiger (1974), according to whom these are the two main kinds
of relations. Affiliation relations consider the participation of individuals to groups or events (where
all the individuals of a group or event interact with others but not necessarily with all others), while
interaction relations consider that actors carry out actions with other actors and are defined by their
position in the sequence of the reciprocal interaction.
We then illustrate the network analysis tools that have been generally applied to the study of
horizontal affiliation networks and vertical interaction networks, and we expose their limits. To
circumvent these limitations, we propose to adopt new methodologies that go beyond traditional
dyadic-based tools: the “place-based methodology” for horizontal affiliation networks (Section 3),
and the “chain-based methodology” for vertical interaction networks (Section 4).
1.3. Horizontal hybrid organizations as affiliation networks
1.3.1. Introduction: Affiliation networks
Affiliation networks are a way to study affiliation relationships using a structural approach – i.e.,
focused on position. This means that the social features of individuals and/or sets (groups or events)

27
are defined by their position with respect to all the other individuals/sets, as well as by the relations
existing among them. An interesting property of affiliation relationships (and thus of affiliation
networks) is the so-called duality. Introduced by Simmel and formalized by Breiger (1974), the
concept of duality establishes that the features of individuals are determined by their affiliation
(participation) to sets, and the features of sets are determined by the individuals that are affiliated to
them.
Suppose a population of individuals that are members of a population of different groups. If an
individual is member of several groups, we can assume that she will be favourable to decisions that
benefit all groups in which she is a member, so she will try to influence the strategies of each of the
groups. Thus, membership influences both individuals’ and groups’ behaviour, and the behaviour of
individuals will differ according to their membership patterns (i.e., the individuals’ position).
Likewise, the behaviour of groups will be different according to the co-membership patterns of their
members (i.e., the groups’ position). As a result, if individuals’ membership patterns become more
extensive, it is legitimate to expect that the level of coordination across groups will also increase.
This is the general idea in the works of Hobson (1906), which are considered the earliest studies in
Social Network Analysis focusing on affiliation networks (Freeman, 2004). Since then, the analysis
of position, which is the core of structural analysis, has been developed both methodologically and
conceptually. One main development has been the introduction of the concept of structural
equivalence (Lorrain and White, 1971; Breiger et al., 1975). The general idea is quite simple: if
individual features in a network are determined by how individuals are connected among them (i.e.
their position), every two individuals connecting in the very same way to the rest of the network
(i.e., having the same position) will have similar features since they share the same relational
environment. In this case we say that these individuals are structurally equivalent, or that they
occupy a structurally equivalent position. Following the previous example, individuals belonging to
the very same groups will be expected to have the same behaviour (i.e., to be favourable to the same
strategic decisions). Likewise, groups featuring the very same members will be expected to have the
same strategic behaviour. The great advantage of resorting to this structural perspective consists of
the fact that it is a systemic approach, taking into account how phenomena happening in one part of
the network have an impact on the other parts.

28
1.3.2. Analytical tools: bipartite networks and their one-mode projections
One basic tool used in the analysis of affiliation networks consists of drawing bipartite networks
(also known as two-mode networks). Bipartite networks are defined here as networks where a
population of individuals are linked to a population of sets by an affiliation relationship. Formally,
elements of one population (individuals or sets) are related by binary links to elements of the other
population, but no links exists between elements of the same population (Wasserman and Faust,
1994). Mathematically, we define a bipartite network as G = (V, S, E) where V is a population of
individuals, S is a population of sets, and E is the set of edges that relies individuals to sets by an
affiliation relationship.
Figure 1.1: Affiliation, bipartite network and one-mode projection 1
Figure 1.1a represents a situation in which 25 individuals are involved in 7 different sets. Some individuals are involved in just one set (see esp. the case of all individuals involved in set S7), while others are involved in several sets (i.e., they are located at the intersection of two or more sets). Figure 1.1b is a representation of this situation as a bipartite network. Each individual (represented as a dot) is linked to the set(s) (represented as squares) in which it is involved. Note that no link exists between elements of the same population (individuals or sets). Figure 1.1c is the incidence matrix of the bipartite network, where individuals are put in rows and sets in columns (an affiliation link of an individual to a set is represented as a black square): for example, individuals from 1 to 8 are all linked to S1, and individual 3 is also linked to S2.Figure 1.1d is the
29
one-mode projection of the bipartite network. In this projection, nodes represent individuals, and individual are links if they belong to the same set. The clustering phenomenon is clearly observable in the case of the subgraph on the upper left, which corresponds to the set S7: here all actors involved in the set are linked together, thus forming a clique. In this kind of projections, the degree of a node (i.e., the number of ties reaching the node) is equal to the number of all other individuals involved in the same set. Finally, the adjacency matrix of the one-mode projection is in Figure 1.1e, in which individuals are both in rows and in columns, and a link between two individuals is represented as a coloured square; the intensity of the colour informs about the value of the link (a darker square represents a more intense relationship). Since the relationship is not oriented, the matrix is symmetric. The clustering phenomenon is also observable in this matrix.
Usually, scholars do not directly analyze bipartite networks, but rather their projections. Breiger
(1974) formalized the Simmelian concept of duality by using matrices. He proposed to project
bipartite networks as two one-mode networks, where all nodes are of the same type (or “mode”).
This result in two one-mode projections for each bipartite network: 1) one network of individuals
that are linked if they belong to the same sets, and 2) one network of sets that are linked if they
share the same individuals. Figure 1.1c represents the one-mode projection (for individuals) of the
bipartite network represented in Figure 1.1b. In this one-mode network, two nodes are linked if they
belong to at least one same set: consequently, each member of a set is directly linked to all the other
members of the same set.
1.3.3. One-mode projections of bipartite networks: analytical problems
One major problem associated to one-mode projections of bipartite networks is the clustering effect
that is artificially generated (Newman et al., 2001; Uzzi and Spiro, 2005). We call clustering the
situation where a subset of individuals fully connected with one another, usually forming a clique
(i.e., a situation in which every two actors within the subset are linked with each other). Since in a
projection as the one shown in Figure 1.1d all the individuals affiliated to a set are directly linked
between them, this generates an artificial clustering effect that can perturb classical network
metrics, especially in the case of measures based on degree or on community detection – thus
leading to misinterpretations. This problem is magnified as the range of sets’ size (in terms of
number of elements) becomes very wide.
In our example in Figures 1.1a-c, the individual at the intersection of sets S1, S2, and S3 has the
highest degree in Figures 1.1d-e (viz., 12). The individual at the intersection of sets S1 and S2 has a
degree of 10, which is also the case for the individual at the intersection of sets S1 and S4. All the

30
individuals belonging to set S7 have a degree of 6 because the set has 7 members. Now, suppose that
the size of S7 is bigger (say, 20): then the degree for each individual belonging to S7 will be equal to
19, which is the highest degree value of the one-mode network. Therefore, the degree of each
individual is directly proportional to the size of the sets to which she belongs. This means that an
individual involved in a few big sets will have a higher degree than an actor involved in more but
smaller sets. Note that bipartite networks, by construction, are not informative about how
individuals interact within a set. Consequently, the degree and other measures in one-mode
projections of bipartite networks must be interpreted according the signification of the sets. In
Figures 1.1d-e, the degree of a node corresponds to the number of other individuals with whom the
individual shares one or more sets, but this does not tell us anything about the actual way in which
individuals interact within those sets.
1.3.4. Solutions: place networks
To overcome these problems, we can mobilize the “place-based methodology” (Pizarro, 2007),
which allows obtaining a network of structurally equivalent positions within the bipartite network.
In short, a place is the lieu of all the individuals who are structurally equivalent, viz. who belong to
the very same sets (Borgatti and Everett, 1992; Pizarro, 2007). The methodology consists of
drawing a different kind of bipartite network with the respect to the “classical” one: viz., a bipartite
network connecting sets to places (rather than individuals), in which places are groups of
structurally equivalent individuals represented as single nodes (see Figure 1.2a). More formally, a
bipartite network of places and sets is a network of structurally equivalent positions, where each
node represents a unique combination of affiliations to the set mode. As shown in Figure 1.2a, all
individuals belonging to the same combination of sets are grouped in the same place, as they are all
structurally equivalent

31
Figure 1.2: Places’ network 2
Figure 1.2a represents the places’ bipartite network. For illustrative purposes, this network is superimposed onto the original bipartite network (greyed out). As we can see, each place Pi corresponds to a unique combination of affiliations to sets (no two places can be linked to exactly to the same set(s)), and all the individuals grouped together in a place Pi all belong to exactly the same set(s). Figure 1.2b is the incidence matrix of Figure 1.1c, and Figure 1.2c is the places’ incidence matrix – rows are places, columns are sets, and black squares represent links between places and sets. Note that places are observable in Figure 1.2c as identical rows (same links to sets, so structurally equivalent positions): all “redundant” rows are merged into one single row in Figure 1.2c. In Figure 1.2d the places’ network is superimposed onto the one-mode projection of individuals (greyed out) presented in Figure 1.1d. As we can see, structurally equivalent individuals are grouped into one same place (represented as a circle in this graph), and the way they are linked to the rest of the network is exactly the same. Figure 1.2e represents the places’ network obtained from the bipartite network, where nodes consist of places of structurally equivalent individuals and links between nodes represent the fact that structurally equivalent individuals share the same sets. Here the degree is related to the number of unique combination of affiliation to set(s), so the degree is a measure of the relational diversity. Figure 1.2f is the places’ adjacency matrix, where both rows and columns are places. A link between two places is represented as a coloured square; the intensity of the colour informs about the value of the link (a darker square represents a more intense relationship).
Since a network of places is a bipartite network, we can draw its one-mode projection and thus
obtain two networks: 1) a network of places, in which nodes are linked when they belong to the
same sets, and 2) a network of sets, in which nodes are linked when they include the same places.

32
The first one, i.e. the network of places (see Figures 1.2d-e), can be interpreted as a summary of the
individuals’ projection network (i.e. Figure 1.1d), i.e. the “skeleton” of the relationships across
individuals, in which all redundant information (viz., individuals’ membership to the same set) is
removed. Its advantage is that the artificial clustering problem referred above is now solved. As a
matter of fact, in a network of places the projection of a single set does not form a clique, because
all structurally equivalent individuals are grouped into one single place. This allows overcoming the
analytical problems associated with artificial clustering.
A comparison of the network of places (Figure 1.2e) with the traditional one-mode projection of the
same network of individuals (Figure 1.1d) highlights the analytical advantages of the “place-based
methodology”. In general, the degree value of nodes drops as it is now no longer associated to the
numbers of individuals in shared sets, but to the number of combinations of membership in the
shared sets. For example, the highest degree in Figure 1.1d is 12 because each individual belonging
to set S1 is connected to 7 other actors that are also in set S1, the 3 of set S2 (the actor at the
intersection of S1 and S2 is counted in set S1 memberships), and the two of set S3 (the 3 actors at the
intersection of sets S1 and S3 are also counted in set S1). In the network of places this actor occupies
alone the place P4, which has a degree of 6 because share sets with the combinations of sets S1
(place P1), S1-S2 (P2), S1-S3 (P3), S1-S4 (P5), S2 (P6), and S3 (P8). This actor has in both networks the
highest degree, even if the value is different, but the position in the rank regarding the others can
change dramatically between both networks. Good examples are the members of the set S7, which
have a degree value of 6 in the one-mode network and 0 in the places’ network.
The metrics based on geodesics are also impacted by the use of place-based methodology. A
geodesic is defined as the shortest path existing between two nodes in a network. Since in the
network of places structurally equivalent individuals are grouped, the number of geodesics that
include these nodes are reduced, and this has an effect on geodesic-based metrics of centrality as the
betweenness.2 For example, the three individuals occupying the place P7 are the second more
central ones in the network of places, but they are in the fourth position in the one-mode network.
Similarly, the individual occupying the place P4 has the third position in the betweenness rank of
the network of places, but the second one in the “classical” one-mode network.
Therefore, performing structural analysis through the “place-based methodology” improves the
assessment of the properties of affiliation networks. First, it allows purging structurally redundant
2 Formally, the betweenness of a node is the number of shortest paths (geodesics) that pass through the node regarding all the geodesics of the network. The betweenness is usually interpreted as the capacity of an individual to control the flows (e.g. information) of the network.

33
information, thus allowing for the emergence of the “skeleton” of the network. As a consequence,
the clustering problem is overcome, and metrics (degree and geodesic-based) can be interpreted
more easily since the number of ties reaching a node is unambiguous (in the sense that only ties
originating from unique combinations of sets are taken into account). Second, this methodology
provides information about structurally equivalent positions: where they are located, how they are
composed (i.e., who are the individuals involved in a same position), and how they are defined (i.e.,
what is the combination of sets defining the position). This informs us about which individuals
share the same relational resources and constraints, with who are connected, and so on.
1.3.5. Studying horizontal hybrid organization through places: some applications
The analysis of affiliation networks through the “place-based methodology” can help us improving
considerably our understanding of many real-world socio-economic phenomena. In what follows,
we provide three simple examples of possible applications: political elites (i.e., the
intersection/amalgam of political, economic, and governmental elites), interlocking directorates in
business, and collaborative projects in innovation. Each of these three examples concern one
different type of horizontal hybrid organization, in which individuals choose to collaborate in order
to reap the gains from cooperation at the local level.
1) Political elites are a classical object of study in Social Network Analysis (Knoke, 1990). Since
power is relational and positional (Weber, 1974), political systems and elites have been studied
as social networks, where the focus is on the social structure rather than on individuals and their
attributes. In this general approach to power, some scholars have proposed a definition of social
structure as a stable order or pattern of social relations among positions (Nadel, 1957;
Laumman and Pappi, 1976): this means that power can be “measured” by focusing on structural
roles (Breiger, 1979, Knoke, 1990) that go beyond individual characteristics. Furthermore,
political elites have been analysed through affiliation networks (Knoke, 1990), where
affiliations have often been extracted from biographical data (Mintz, 1975). Elites have
therefore been defined as those groups of individuals who situate themselves at the overlap
between political, economic, and social organizations (Domhoff, 1975; Freitag, 1975; Domhoff,
2006). As a result, the concept of “place” early emerged in this literature as a convenient
analytical tool for both issues. Baena and Pizarro (1985) (to our best knowledge, the very first
application of the “place-based methodology”) used it to study the Spanish political elite during
the Franco era (1939-1975), identifying a superelite of actors situated at the overlap of three

34
central groups. Similarly, Villena-Oliver (2014a, 2014b) compared the structure of two Spanish
governments (2004-PSOE and 2012-PP governments) using professional background
affiliations in order to unveil the “revolving doors” between the government and other public
and private organizations. The introduction of a “structural” approach to the study of affiliation
networks by these works has considerably improved our understanding of political elites. As a
matter of fact, the concept of “place” provides a rigorous definition for such a nebulous entity
as “power” is, and thus allows identifying power structures that would not emerge from a
traditional pure network approach.
2) Interlocking directorates are another classical object of study in SNA. It has been widely
observed that shareholders tend to nominate to the boards of directors of joint-stock companies
individuals who already sit in the boards of other companies. It is understood that shareholders
nominate individuals who cumulate many mandates in order for the company to reap the
benefits of control, coordination and social cohesion in terms of a reduction of uncertainty
(Jeidels, 1905; Schoorman et al., 1981; Knoke, 1990; Mizruchi, 1996; Davis et al., 2003). Since
these studies were mainly concerned with organizational aspects, most of them focused on the
analysis of set one-mode projections (i.e., the network of companies linked by shared directors)
and studied quantitatively the actors at the interlocks – e.g. the distribution of the number of
directors in interlocks or the inclusion of individual variables (background, age, other
affiliations, … ) in order to explain the interlocks composition. (Palmer et al., 1986; Chu and
Davis, 2016; Cronin, 2011). As in the case of political elites, also in the case of interlocks
places have naturally emerged as a convenient tool of analysis. In her study of a selection of
149 big global multinationals, the application of the “place-based methodology” allows
Herrero-Lopez (2015) to show that the control of companies is actually exercised through
interlocking shareholdings rather than through interlocking directorates. Concretely, in a
globalised world, interlocks shareholdings can control a larger number of geographically
dispersed companies, while interlocks directorates operate on a more national scale. This study
allows appreciating the advantages of the methodology. First, it allows reducing significantly
the size of networks (a big advantage when dealing with networks made of thousands of
individuals), as all structurally equivalent positions are merged into single places.. Second, it
allows identifying mesoscopic entities – communities – that derive from the structure of
overlaps (the focus of the place-based analyses) and not only on the structure of companies (the
focus of traditional analysis based on dyadic relations), and that would not emerge otherwise.

35
Indeed, she overcomes the clustering problem by the “place-based methodology” in her
community analysis, but she does not explicit this advantage of the methodology.
3) In innovation economics and policy, network analysis has often been used to typify
mesoeconomic structures of R&D. Since innovation is rarely the fruit of an isolated inventor
but the result of a collective process subjected to strong knowledge spillovers (Audretsch and
Feldman, 2004), innovation networks are one of those strange animals that position themselves
between the innovative behaviour of actors, from which they result, and the aggregates of
innovation productivity, which result from them. Much research has been carried out, at the
geographical level, with the popularization of research on clusters (Owen-Smith and Powell,
2004; Giuliani, 2007; Vicente et al., 2011) or at the level of industries and technological fields
(Roijakkers and Hagedoorn, 2006; Rosenkopf and Schilling, 2007). The same occurs in
research on innovation policies, whose public incentives have shifted from market failures to
network failures (Woolthuis et al., 2005), thus leading to the design of public incentives for
collaboration and the strengthening of networks and large R&D consortia. This innovation
policy pattern has led to a growing attention on the effects of such policies on technological
renewal and the emergence of new markets (Vonortas, 2013), as well as the resilience of
regional innovation systems (Crespo et al., 2016). This wave of investigation is based on an
analysis of the structural properties built from dyadic relationships, with the risk of bias
generated by the problem of artificial clustering linked to the size of the co-patent cliques and
research consortium that weakens the empirical results, while at the same time preventing us
from capturing how circles of actors emerge beyond formal alliances. In this area, as recently
demonstrated by Lucena-Piquero and Vicente (Chapter 2), the use of the “place-methodology”
based on the identification of blocks of structural equivalence and the way with which these
blocks interact enables circumventing these risks. In particular, this methodology allows
detecting, beyond formal cliques, different groups of actors according to their explorative or
conformist relational behaviour, and then better identifying the constituting factors of the
evolution and resilience of innovation networks.

36
1.4. Vertical hybrid organizations as sequential interaction networks
1.4.1. Introduction: sequential interaction networks
Together with affiliation relationships, interaction relationships are one of the two main families of
relationships commonly present in any social or economic phenomena. In this kind of relationships,
individuals carry out actions which involve or impact other individuals, and this defines their
position and more largely their roles. One of the most common examples of interaction
relationships are, for instance, bilateral exchange relationships: according to the position of each
individual with respect to the exchange flow, one individual will take the role of seller and the other
one the role of buyer. Traditionally, scholars have used dyads (bilateral relationships, or “low-order
interactions”) as elementary units of interaction networks, so that “classical” interaction networks
have been built as aggregation of all the dyadic links existing among a population of individuals.
See for instance Krackhardt and Hanson (1993) work about the informal organization of a
company. They study three interaction relationships (advice, trust and communication) to evidence
the informal network behind the chart. Similarly, Coleman et al. (1957) analyse interpersonal
networks among physicians to study the diffusion processes of a new drug. More recently, Kim et
al. (2011) study of three automotive supply networks in terms of materials flows and contractual
relationship. They compare the structure of the networks for the three firms and identify key central
actors.
Formally, a network G is defined as G = (V, E) where V is the set of individuals of the population
and E is the set of links (arcs or edges, depending if the relationship is oriented or symmetric)
between dyads (i.e., pairs of individuals).
As it is the case for structural equivalence in affiliation networks, a structural approach can also be
applied in interaction networks. Recall that according to the structural approach, the position of
each individual is defined by taking into account the overall structure of the network viz., the
position of an individual depends not only on all the links that she has with other individuals, but
also to all the links the other individuals have with one another. This implies that local substructures
within the network are considered as relevant to define the position of each individual beyond the
direct dyadic links that the individual actually has. Simmel (1950) was the first scholar to underline
that supra-dyadic structures (sometimes called “higher-order interactions” (Battiston et al,. 2020)
in his case, triads) reveal social phenomena that go beyond the individuals’ bilateral interactions,
thus being a germinal element of group phenomena in which the group is more than the addition

37
of its parts. According to Simmel, in a triad of individuals A, B, C the link between any couple of
individuals is influenced or determined by the presence (or absence) of links among the others. The
conceptualization of triads and other supra-dyadic structures are at the base of many important
contributions, as Heider’s balance theory about cognitive consistency3, and more largely all works
about modularity4 and communities. Simmel and his followers have highlighted that supra-dyadic
substructures are common in social and economic life, and are often integrated into common
cultural conceptualizations having a name. For example, many family roles (e.g. grandparenthood)
are roles defined by supra-dyadic kindship relations (being the parent of a parent).
Sequential interactions are special cases of supra-dyadic substructures where the positions and links
are ordered. An elemental form of sequence is an open triad of elements A, B and C where A is
linked to B by a directed tie (relation R1) and B is linked to C by a directed tie (relation R2), thus
generating one sequence of individuals (A, B, C) from the sequence of links (R1, R2). According to
the structural approach, the properties of any dyad will thus be dependent on the other dyads
belonging to the sequence. One simple example of sequential interaction is a buyer-broker-seller
triad, in which each individual’s action is defined by the position she occupies within the sequence.
An important feature of sequences is the existence of an indirect link between actors that are not
directly linked. In a buyer-broker-seller triad, an indirect link exists between the buyer and the seller
even though the two never directly interact with each other: this link is fundamental, because it
defines the triad and the economic phenomena it represents (in the example, the exchange occurring
between the buyer and the seller). Social Network Analysis has picked up the importance of indirect
links between actors by formalising them as compound relations: in a sequence of individuals (A, B,
C), it exists a compound relation (A ∘ C) indirectly linking the individuals who belong to the
sequence without being directly linked to each other. Traditionally, compound relations have been
identified ex-post (i.e., as the “artificial” sum of dyadic substructures) in order to investigate some
structural features of interaction networks: for instance, the general formulation of structural
equivalence provided by Lorrain and White (1971) is based on the ex-post construction of
compound relations. This way of proceeding is appropriate for those types of compound relations
that do not exist as ex-ante phenomena. For example, in the case of an indirect acquaintance 3 The social psychologist Heider (1958) theorized that perceptions about actors (or objects) and relations (sentiments) of an ego involved in a triad require a cognitive consistency provided by the existence of balance in the triad. Thus, a balanced triad (e.g. my two friends are friends, or my friend also dislikes this food) represents a cognitive consistency for ego. An imbalanced triad (e.g. my two friends are enemies, or my friend likes this food that I hate) creates a tension or cognitive dissonance that the ego would try to solve. 4 Modularity refers to the study of subgraphs in networks regarding their relative density or connectivity. There exist several methods to identify modules (i.e. groups, clusters, or communities) and their community structure.

38
relationship (e.g. being a friend’s friend), the dyadic directed relationships between individual 1 and
2 and between individuals 2 and 3 can exist even though the compound relation between individuals
1 and 3 (i.e., their awareness of having one friend in common) does not actually exist.
Consequently, the removal of any of the dyadic relationships belonging to the sequence does not
necessarily imply the non-existence of all the other dyadic relationships belonging to the same
sequence. However, in many real-world social and economic processes, supra-dyadic substructures
do exist as ex-ante phenomena: differently said, in order to take place, some processes require the
existence of a given sequence of several individuals bilaterally linked to each other. For example, in
the case of an intermediated transaction (the buyer-broker-seller substructure), the dyadic directed
relationships between the buyer and the broker and between the broker and the seller can not exist if
the compound relation between the buyer and the seller (i.e. the transaction itself) does not exist.
Consequently, the removal of any of the dyadic relationships belonging to the sequence does
necessarily imply the non-existence of all the other dyadic relationships belonging to the same
sequence.
In view of this fact, some scholars (see e.g. Bonacich et al., 2004) have argued that some supra-
dyadic substructures must be conceptualized as supra-dyadic units: since the underlying real-world
social or economic process is more than the addition of its parts (i.e. the dyads), the supra-dyadic
must be considered as an elementary component of the structure (i.e. as a unit). Consequently, the
analysis of these processes must be adapted in order to take into account the supra-dyadic unit
condition. This is what we propose to do through the study of “relational chains”.
1.4.2. Analytical tools: relational chains
We define a relational chain as a supra-dyadic unit composed by an ordered sequence of
individuals (connected by directed links) who participate into the same process. In order to better
understand this concept, let us consider the following toy example: a network in which 12
individuals are involved in 6 different transfer processes (see Figure 1.3a). This example is based on
two assumptions. The first one is that the order of appearance of each individual within the chain is
relevant but not binding, which means that although not all nodes might occupy any of the positions
of the chain (“roles” might not be played interchangeably), such positions are not exogenously
fixed. The second assumption is that chains may have a variable length, which means that there
does not exist an exogenously fixed constraint on the form of the chain. Note that these assumptions
may not necessarily apply for any kind of relational chain: in some cases, constraints might exist

39
both on the positions occupied by nodes within the chain and on the size of the chain. However, the
fact of adopting less restrictive assumptions allows keeping the level of analysis as general as
possible: in fact, more restrictive situations could be treated as special sub-cases of the present
analytical framework.
Figure 1.3: Chains and single-relational network 3
Figure 1.3a shows a situation where 12 individuals (black points) involved in 6 transfer processes or chains (gray arrows). Observe that some nodes are involved in more than one process, occupying different positions in each sequence, and that all chains involve 3 individuals (two steps) except the chain C5, which involves 4. Figures 1.3bc is a single-relational or single-layer network representation – the graph and its associated adjacency matrix A – of the situation seen in Figure 1.3a: here arrows (directed ties) link pairs of nodes (dyads) following the sequence observed in the transfer process. In Figure 1.3b, pairs of nodes involved in more than one sequence are linked by more than one arrow, but the position occupied by each node in each sequence (and therefore, the unity of each process) is lost in the representation.
Usually these situations are analyzed as (single-layer single-relational) directed networks, and a
simple way is to consider that the individuals are linked by a directed relation R. More formally,
suppose a set of n individuals V={v1,v2,v3, …,vn} and a relation R (also called the set of ordered
pairs or links between individuals), which defines the graph G=(V, R) / {i,j} ∊ V ⋀ (i,j) ∊ R. Then,
the network is a collection of pairs of individuals, represented as arrows between nodes. Figure 1.3b
is a traditional network representation of the situation depicted in Figure 1.3a, where actors are
linked following the chains. This network might be simplified removing or merging multiple lines,
as in the case of the pair of actors (2, 3) or the pair (4, 2).

40
1.4.3. Relational chains: analytical problems
The analysis of the traditional (single-layer single-relational) network representation as the one
illustrated in Figure 1.3b can lead to some interpretative difficulties or misinterpretations, due the
lack of information about chains and the position occupied by nodes within them. For example, a
commonly used network metrics is the betweenness centrality of nodes, which is calculated as the
number of geodesics (i.e., of shortest paths) that pass through a node: this metrics is typically
associated to the individual’s capacity to access or control fluxes between other individuals (a very
crucial property in the context of transfer processes). If we compute the betweenness centrality of
the nodes in Figure 1.3b, actor 6 results to be the most central actor in terms of betweenness.
However, the betweenness centrality of actor 6 is artificially boosted by the fact of being situated at
the end of chains C3 and C4 and at the beginning of chain C5. This means that the validity of this
metrics needs to be discussed in view of the actual properties of chains. If chains are not
interdependent (meaning that the different transfer processes have nothing to do with one another),
then it doesn’t make much sense to consider that actor 6 plays any important role in terms of flux
control, because in reality she does not play any actual “bridging” role between the individuals
involved in chains C3 and C4 and those involved in chain C5: as a result, her betweenness centrality
becomes difficult to interpret in the traditional way.
Another popular network metrics that may be artificially impacted by the existence of relational
chains is the node’s degree, defined as the number of adjacent nodes directly connected to it. In
networks where links are directed, we call input degree the number of nodes from whom the node
receives an arrow, and output degree the number of nodes to whom the node sends an arrow.
Although its meaning depends on the kind of relationship, usually the degree is associated to the
importance of a node in terms of relational resources, as power, influence or social capital. In the
type of network illustrated in Figure 13b, nodes that are located at the beginning or at the end of a
chain have a lower degree than those located at the middle of the chain (except in case they are
involved in other chains). More precisely, a node located at the beginning of one chain has degree 1,
input degree 0, and output degree 1; whereas a node located at the end of one chain has degree 1,
input degree 1, and output degree 0. However, all other nodes located along the same chain have, by
construction, at least degree 2, and input and output degrees 1. Since the degree is commonly
interpreted as an estimate of the importance of a node, the role played by nodes located at the
beginning and at the end of chains will be underestimated, while that played by nodes located at the
middle of the chain will be overestimated.

41
One possible way to overcome these problems consists of considering each step of a chain as a
different type of relation. More precisely, we consider that all the individuals who are located at
beginning of a chain are linked to the individuals in the second position of the same chain by a
relation R1; in turn, these individuals located in the second position are linked to those located in the
third position by a relation R2; and so on and so forth. More formally, the network is defined by a set
of n individuals V={v1,v2,v3, …,vn} and an ordered set of x relations between pairs of individuals
R={R1, R2, …., Rx}, where we can build an ordered set of x directed networks Gi such that G1(ij) =
(Vij,R1) / (i, j) ∊ R1; G2(jk) = (Vjk, R2) / (j, k) ∊ R2;… ; Gx(pq) = (Vpq, Rx) / (p, q) ∊ Rx. Then, we
can build a network G as the union of all the networks Gi. We can define this network as G=(V,R,D)
where D is the set of relations Rr ∊ R, so the network is the collection of the pairs (vi,vj)r that are the
directed links between actor vi and actor vj on the rn relation.
We can call this type of network a multi-layer multi-relational network. The idea of considering
various types of relationships to understand the real-world complexity has been present since early
SNA works: Freeman (2004) provides some examples of classical studies with a multi-layer
approach, such as Moreno’s contributions on 1930s (e.g. 1934), Bott’s works on 1950s (e.g. 1957) ,
or Roethlisberger’s and Dickson’s (1939) study on the Bank Wiring Room. In this tradition,
networks with several relations have been analyzed separately or merged: see for example
Wasserman and Faust (1994), Dickinson et al. (2016), or Bianconi (2018). Since these strategies
lose the real-world complexity several disciplines have been developed a corpus of methods and
techniques for the study of multi-relational networks. In recent decades, one methodology has
gained considerable popularity in the study of multi-relational networks: their representation as
multi-layer networks – i.e., as the superposition of different layers of networks, in which each layer
only includes relations of the very same type (Dickinson et al., 2016).

42
Figure 1.4: Multi-relational network 4
Figure 1.4a-b is the multi-layer multi-relational representation – graphs and matrixes – of the situation seen in Figure 1.3a. Each relation (and node pairs in relation) is stored in a layer and matrix according to the position it occupies in the sequence in the underlying processes (chains). Dotted lines link the very same individual across layers (e.g. node 2 is in layers R1 and R2, so a dotted line link both points representing this actor). With respect to the single-layer representation (Figure 1.3b), the multi-layer representation (Figure 1.4a) has the advantage of keeping track of the position occupied by each node in the sequence; however, the unity of each process is still lost in the representation.
As a result of its fast and multidisciplinary development, the corpus of terms and methods used in
the domain of multilayer networks is very diverse and lacks consensus (Kivela et al., 2014;
Bianconi, 2018). For our purposes, we define a multi-layer network G=(V, R, D) where V is the set
of nodes, R is the set of links between pairs of nodes, and D is the set of layers of the network. In
our example (see Figure 1.4a), the network has 3 layers, as there is at least one chain with a length
3. Following Bianconi (2018), this network can be considered as a multi-layer network without
interlinks (links among layers), in which corresponding nodes in different layers indicate the same
identity (e.g. the individual 2 is in layers 1 and 2, and the individual 8 is in layers 2 and 3). In this
kind of multi-layer network, the degree is computed for each layer (e.g. node 2 has degree 1 in layer
1 and degree 1 in layer 2. In-degree and out-degree are computed on the same way), and the overall

43
degree of the node is the sum of all layers’ degree. The betweenness can be computed intra-layer or
inter-layer (namely cross-betweenness centrality, where nodes in several layers are considered).
However, as in single-layer networks, these betweenness algorithms (or other algorithms based on
shortest paths) do not consider supra-dyadic structures as units, falling into similar problems as
single-relational networks. As a result, while the development of multi-layer networks has provided
many useful conceptual frames and metrics, the main shortcoming of this approach consists of
ignoring the continuity (or interdependency) of relational chains. However, it is important to
consider chains as units, in which the presence of all individuals and of the links existing between
them is indispensable to the existence of the chain.5 For example, the removal of node 3 should
imply a failure in all the transfer processes in which it is involved (C1 and C2). Consequently, node
1 would be isolated from the network since the process C1 is interrupted. Node 4 is also impacted,
because of is involved in process C2, but it is still connected to the network due its participation in
the process C3, so we said that it has an alternative access to the system. However, the removal of
node 3 has no impact in the other dyads both in single-layer and multi-layer networks. In other
words, the unity or interdependency of processes transfers is not preserved in these kinds of
networks.
1.4.4. Solutions: sequential multi-relational hyperstructures
We propose to not separate relational chains across different layers, but to keep them together. In
fact, chains are an (ex-ante) “input” of the network, in the sense that they represent indivisible units
where one part of a chain cannot exist without the rest, and should therefore be taken into account
while analysing the structure of interaction (Bonacich et al., 2004; Estrada and Rodríquez-
Velázquez, 2006). In order to do so, we propose to resort to hypergraphs. A hypergraph is a
generalization of a graph in which one or several individuals are linked to one or several edges. In
other words, a hypergraph is a bipartite network in which a set of individuals are linked to a set of
edges. More formally, a hypergraph H is a bipartite network H = (V, E) where V is a set of
individuals and E is a set of no-empty subsets of V called edges or hyperedges. Consequently, a
situation in which chains are considered as supra-dyadic units can be represented as a hypergraph
where each chain Ci is a set of actors of V linked to an edge or a hyperedge of E. Hypergraphs
5 A possible solution for this problem is introduced by Rodriguez and Shinavier (2010) who suggest the use of “filters” to ensure particular paths on multilayer networks. However, for networks as chains’ networks filters are not useful since each chain should be associated to a filter (e.g. the database employed by Accominotti et al. (Chapters 4 and 5) has 8,888 transfer processes, so this solution would require the formulation of 8,888 filters).

44
provide a simple way to represents and analyse complex situations keeping the unity of the supra-
dyadic input data. As showed by Bonacich et al. (2004), some network measures can be easily
implemented using hypergraphs. Specifically, they use the formulation of eigenvector for bipartite
graphs as a way to measure the eigenvector of individuals on the hypergraph. Similarly, Battiston et
al. (2020) provides some possibilities for the measure of the nodes’ degree in hypergraphs, showing
the flexibility provided by this approach to complex systems. However, classic hypergraph
approaches do not preserve the internal structure of supra-dyadic data (that is, the links and
positions within the individuals, and in our case the sequence and links of chains). Feng et al.
(2018) have observed this problem in situations in which the order of the actors is relevant, and they
propose the concept of partial-order hypergraph to overcome this limit. In their solution, a partial-
order hypergraph includes hyperedges which provide the order of the individuals in structural units
(supra-dyadic units in our language). Unfortunately, partial-order hypergraphs are not a solution for
chains, since they do not keep the sequence or continuity of individuals. In other words, as in
multilayer networks, the measures are unable to recognize the ordering of paths within a chain.
A more interesting solution has been provided by Criado et al. (2010) who define hyperstructures
as hypergraph networks in which hyperedges represent substructures. In their work, they use a
subway network as an example of hypergraph in which the substructures (the subway lines) are
preserved. While their definition of hyperstructures is restricted to non-oriented substructures
(symmetric relations), nothing precludes extending it to oriented substructures (asymmetric
relations).
Then, in order to preserve the unity of chains we can define a “network of chains” as a hypergraph
in which edges or hyperedges correspond to relational chains. So, we define a chain Ci as a non-
empty set of individuals (vi, vj, vk, …, vq) ∊ V where every pair is linked by a ordered sequence of
relations (R1, R2, …, Ry) such that ∃ vj / ∀ (vi,vj)Rx ⋀ (vj,vk)Rx+1. Or in other words, a chain is a set
of ordered pairs of actors where every two sequential pairs share the second and the first individual
respectively. Additionally, we define a network of chains as a hyperlink H = (V, E) / ∀ Ci ∃ Ei .
Thus, every chain Ci corresponds to an edge or hyperedge Ei. This way, every chain is considered as
a unit (see Figure 1.5a-b).

45
Figure 1.5: Hyperstructure graph 5
Figure 1.5a-b provides a representation of the transfer processes seen in Figure 1.3a as a hyperstructure. The hyperstructure graph represents the hyper-edges over the substructures (nodes and links) concerning the chains or transfer processes. The hyperstructure matrix C(S) is composed by: a) The adjacency matrix of individuals A(G) which contains all dyadic links between; b) The incidence matrixes B(H) and Bt
(H) which links groups of individuals and links (substructures) to hyper-edges. Note that Bt
(H) is the transposed matrix B(H) so it provides the same information; and c) the adjacency matrix A(H), which informs about the overlaps among hyper-edges. The lecture of the hyperstructure matrix, as all matrixes, is from rows to columns. For example, the dyad (1, 2) is represented in the A(G) matrix – row 1, column 2 – by a black square. The incidence matrix B(H) informs that the node 1 is related to the hyper-edge E1, and the incidence matrix Bt
(H) that the node 2 is related to hyper-edges E1, E2, and E3. Since the common hyper-edge is E1, the dyad is related to this hyper-edge, so the transfer process C1. Similarly, there is two dyads (2, 3) which are represented in the A(G) matrix by a unique black square (remember that this matrix is binary). The matrix B(H) shows that the node 2 is related to hyper-edges E1, E2 and E3, and the matrix Bt
(H) that the node 3 is related to E1 and E2, so one dyad (2, 3) is related to E1 and the other to E2.
Two main consequences derive from this definition of chains and network of chains as a
hypergraph. The first, is that every chain is defined by its individuals and relations. So, any
suppression of individual or links in the chain implies the failure of the entire chain. Following the
example used above, the removal of node 3 involves the failure of the hyper-edge E1, so all the
dyads associated, and the node 1 would be isolated, thus respecting the unity of the process.
The second consequence is that structural positions of individuals are defined both by the internal
structure of the chain (through the adjacency matrix A(G) and the hyper-edges (through the
incidence matrixes B(H) and Bt(H)). This implies that we can easily formulate flexible network
metrics that do keep into account the significance of chains, their internal structure, and their unity.
For example, following Battiston et al. (2020), the degree of an individual is traditionally

46
conceptualized as the number of other adjacent individuals. Following this conception, since all the
individuals in a chain are interdependent and are linked by both direct and indirect-dependent links,
we can define the degree of an individual as the number of other individuals involved in the chains
in which she is involved. So, supposing that a chain composed by 4 individuals, the degree of every
individual belonging to the chain is 3. If one of them is involved in another 4-node chain, then her
degree is 6. Alternatively, we can define the degree of an individual as the number of chains in
which she is involved, regardless the number of individuals by chain. So, an individual involved in
one chain has a degree of 1, and an individual involved in 4 chains has a degree of 4.
Following our example, the network of chains shown in Figure 1.5a should be defined as a
hyperlink network of chains H = (V, E) where E1 = C1 = (1, 2, 3); E2 = C2 = (4, ,2, 3); E3 = C3 =
(4, 2, 6); and so on. Using our first definition of the degree, individual 1 has a degree of 2 (it is
“adjacent” to individuals 2 and 3), and individual 2 a degree of 4 (it is “adjacent” to individuals 1, 3,
4, 6). And using the second definition of degree, individual has a degree of 1 (it is involved in chain
C1), and individual 2 a degree of 3 (it is involved in chains C1, C2 and C3).
1.4.5. Studying vertical hybrid organization through chains: some applications
The analysis of sequential interaction networks through the “chain-based methodology” can help us
improving considerably our understanding of many real-world socio-economic phenomena. In what
follows, we provide three simple examples of possible applications: shipping networks in logistics,
supply chains in trade, and origination and distribution chains in finance. Each of these three
examples concern one different type of vertical hybrid organization, in which individuals choose to
situate themselves within a chain in order to reap the gains from cooperation at the local level.
1) The analysis of shipping networks has gained much popularity in the logistics literature (Tran
and Haasis, 2015; Ducruet, 2020). People or goods moving from a given point in space to
another one often cannot be transported directly, but they have to pass through “third” points
(“hubs”) in order to be transferred to different means of transport. Shipping networks can
therefore be seen as organizations that coordinate different actors in the transportation sector in
order to maximize the efficiency of the system. Studying shipping networks through the “chain-
based methodology” has some distinctive advantages with respect to “classical” multi-layer
methodologies. This illustrated by the case of Calatayud et al. (2017), who study the Americas’
merchant shipping networks as an eighty-layer network, where each layer is the network of

47
countries and shipping lines of a big liner shipping company. In order to study the vulnerability
of this trade network, authors simulate attacks (node removal) over seven strategic nodes, and
conclude that the impact of attacks over shipping lines varies according the country of origin of
trade flows and the role of the nodes in the merchant network. While this study provides a
useful knowledge about shipping networks, under our perspective, the impact of attacks is
underestimated. For example, in their networks the USA is mainly a final destination of many
goods, so if its suppression will impact all flows of goods from their origin and including the
transit countries, and not only the countries directly connected to the USA by shipping lines. So,
a chain approach should provide a more accurate assessment of the weakness of merchant
shipping networks. Obviously, the possibility to apply a chain approach is dependent of the data
available. It requires detailed information about shipping lines (where they start and where they
end, as well as the ports they stop at) in order to well identify the chains.
2) The analysis of supply chains has gained much popularity in the trade literature (Hearnshaw and
Wilson, 2013; Perera et al., 2017). Goods or services are extremely seldom produced in a single
production round: much more often, final consumer goods are only the final outcome of many
different stages of transformation of intermediate goods. Supply chains can therefore be seen as
organizations that coordinate different actors in the industrial sector in order to maximize the
efficiency of production. Studying supply chains networks through the “chain-based
methodology” has some distinctive advantages with respect to “classical” multi-layer
methodologies. This is illustrated by the case of Lee and Goh (2016). They use a multilayer
(two-layer) analysis for the study of the global trade network of countries by primary and
secondary sectors, focusing on the interdependency between both sectors (operations of the
primary sectors are dependent to the demand from the secondary sector). In order to assess the
vulnerability of the network, they perform a cascade failure simulation, and shows that impact
is highly related to the interdependence between the two sectors (interlayer links). So, one of
their main conclusion is that the multilayer approach provides a more accurate analysis than
single-layer networks because the interdependence between layers (sectors) is included. Even if,
as the authors point out, their model is an oversimplification of reality, we think it is correct to
consider the interdependence between sectors in the analysis of trade networks. However, this
oversimplification does not address the complexity of productive systems, or how a final
product involves a chain of sub-products and primary goods around the world. Suppose the case
of the automobile industry, which requires components manufactured in several countries, with
primary goods from other several countries, and assemblies in third countries. That means that

48
the interdependency is not only inter-layers, but also intra-layers, and it depends of product-
dependency chains. Applying the chain-based methodology here would well-identify the
interdependencies and provides useful information about the vulnerability and resilience of the
system. Another interesting illustration is provided by Inoue and Todo (2019), who analyse the
impact and propagation of natural disasters (earthquake) in Japan’s supply chains, and build a
model (based on empirical data from the 2011 Great East Japan earthquake) to assess the
economic impact of future natural disasters. We highlight several contributions of this work.
First, they use empirical data to assess impact and build their model. Second, they address the
question of the substitutability of individual actors, i.e. the presence of suppliers who can
substitute the ones impacted by disaster and thus ensure the continuity of supply chains. Third,
they include both direct and indirect effects of shocks on supply chains, highlighting that the
effect of disaster has observable economic effects not only on directly-connected actors, but
also on indirectly-connected ones, thus underlining the role of non-separable supply chains in
the production system. While this study provides evidence of the importance of chains as an
analytical unit, the direct and indirect effects of failures, and the role of substitutability in the
resilience of the system, the study does not use chains as an elementary input data. Applying the
chain-based methodology here would complete the analysis, providing a more detailed view of
all interdependencies and a better assessment of the impact of the loss of actors in supply
chains. This might potentially help putting in place management strategies or industrial
development policies aimed at minimizing the vulnerability of chains.
3) The analysis of intermediation networks has gained much popularity in the finance literature
(Adrian and Shin, 2010; Glode and Opp, 2016). Financial assets are seldom sold directly by the
“producer” (the borrower) to the “final consumer” (the investor): much more often, they are
originated and distributed through complex processes that involve several different
intermediaries. Intermediation chains can therefore be seen as organizations that coordinate
different actors in the financial sector in order to maximize the efficiency of the origination and
distribution process. Studying intermediation networks through the “chain-based methodology”
has some distinctive advantages with respect to “classical” multi-layer methodologies. This
illustrated by the case of Accominotti et al. (Chapters 4 and 5) in their study of the London bill
market during the First Globalisation. More specifically, these works describe and analyse a
money market instrument – the sterling bills of exchange – which involves three actors or roles:
a borrower (drawer), a guarantor (acceptor), and a lender (discounter). They consider each bill
as a chain, which is treated as a supra-dyadic unit, where analyses respect the interdependence

49
of actors and the relations between them. In Accominotti et al. (Chapter 5), the authors estimate
the resilience of this financial market by using node removal simulations to assess the
substitutability of actors. The results show less hierarchical and more resilient financial network
than nowadays’. Applying a multi-layer approach would provide a distorted view: in fact, since
the unity of chains would be lost, node removal simulations would under-estimate the impact of
shocks, as some dependent actors would still remain connected to the network (as described
before in Figures 1.4 and 1.5). Additionally, as we have argued previously, classical network
measures tend to over or underestimate the relative importance of some actors (in the case study
of Accominotti et al., (Chapter 5) those in acceptor role), thus providing scope for
misinterpretations.
1.5. Summary and way forward
Properly understanding the micro-foundations of macro phenomena remains one of the biggest
challenges in social sciences in general, and in economics in particular. Real-life economies feature
a great number of hybrid organizations aimed at dealing with spillovers – i.e., “mesoscopic” entities
situated half-way between the individual and aggregate level, whose boundaries are often loosely-
defined and unstable. Over the last decades, network theory has provided social sciences with a
number of useful tools for chasing these “strange animals”. However, the tools that are commonly
applied to the analysis of real-world networks are based on dyadic relationships, and present some
limitations to the proper understanding of those higher-order (supra-dyadic) structures that play a
crucial role in real life.
This paper has argued that simple network analysis tools allowing to go beyond these limitations
exist and deserve to be applied more extensively in empirical research. We focus on two tools that
appear to bear a particularly high potential for the understanding of economic phenomena. The first
one is the “place-based methodology”, allowing to assess actors’ substitutability in affiliation
networks: this technique substantially improves our ability to assess the resilience of horizontal
hybrid organizations that are widespread in real economic life (like e.g. power elites, interlocking
directorates, collaborative R&D project, etc.). The second tool is the “chain-based methodology”,
allowing to assess structural equivalence in interaction networks: this technique substantially
improves our ability to assess actors’ substitutability in sequential interaction networks: this
technique substantially improves our ability to assess the resilience of vertical hybrid organizations

50
that are widespread in real economic life (like e.g. shipping networks, supply chains, financial
intermediation chains, etc.).
On the whole, our contribution points to the fact that much work still needs to be done in the social
sciences in order to properly understand the overlooked coordination mechanisms that connect
individual action to aggregate outcomes. Face to this enormous challenge, more refined (yet still
basically simple and intuitive) analytical tools like the “place-based methodology” and the “chain-
based methodology” can provide a great contribution to chasing those “strange animals” that lay at
the core of complex systems.

51
References of the Chapter 1
Adrian, T., Shin, H.S. (2010) The Changing Nature of Financial Intermediation and the Financial Crisis of 2007–2009. Annual Review of Economics, 2(1), 603–618.
Ahuja, G., Soda, G., Zaheer, A. (2012) The Genesis and Dynamics of Organizational Networks. Organization Science, 23(2), 434–448.
Antonelli, C. (2005) Models of Knowledge and Systems of Governance. Journal of Institutional
Economics, 1(1), 51–73.
Arrow, K.J. (1972) Economic Welfare and the Allocation of Resources for Invention. In Rowley, C.K. (ed.), Readings in Industrial Economics: Volume Two: Private Enterprise and State
Intervention. Macmillan Education UK, London, pp. 219–236.
Audretsch, D.B., Feldman, M.P. (2004) Knowledge Spillovers and the Geography of Innovation. In Henderson, J.V. and Thisse, J.F. (eds.), Handbook of Regional and Urban Economics. Elsevier, pp. 2713–2739.
Azariadis, C., Stachurski, J. (2005) Poverty Traps. In Aghion, P. and Durlauf, S.N. (eds.), Handbook of Economic Growth. Elsevier, pp. 295–384.
Baena, M., Pizarro, N. (1985) The Structure of the Spanish Political Elite 1939-1975. In More, G. (ed.), The Structure of National Elite Groups, Research in Politics and Society. JAI Press, New York, pp. 149–171.
Baker, G., Gibbons, R., Murphy, K.J. (2002) Relational Contracts and the Theory of the Firm. The
Quarterly Journal of Economics, 117(1), 39–84.
Barabási, A.L. (2003) Linked: The New Science of Networks. Basic Books.
Battiston, F., Cencetti, G., Iacopini, I., Latora, V., Lucas, M., Patania, A., Young, J.G., Petri, G. (2020) Networks beyond Pairwise Interactions: Structure and Dynamics. Physics Reports, 874, 1–92.
Bianconi, G. (2018) Multilayer Networks: Structure and Function. Oxford University Press, Oxford.
Bonacich, P., Holdren, A.C., Johnston, M. (2004) Hyper-Edges and Multidimensional Centrality. Social Networks, 26(3), 189–203.
Borgatti, S.P., Everett, M.G. (1992) Regular Blockmodels of Multiway, Multimode Matrices. Social
Networks, 14(1), 91–120.
Borgatti, S.P., Everett, M.G. (2000) Models of Core/Periphery Structures. Social Networks, 21(4), 375–395.
Bott, E. (1957) Family and Social Network. Tavistock Institute, London.
Breiger, R.L. (1974) The Duality of Persons and Groups. Social Forces, 53(2), 181–190.
Breiger, R.L. (1979) Toward an Operational Theory of Community Elite Structures. Quality and
Quantity, 13, 21–57.
Breiger, R.L., Boorman, S.A., Arabie, P. (1975) An Algorithm for Clustering Relational Data with Applications to Social Network Analysis and Comparison with Multidimensional Scaling. Journal of Mathematical Psychology, 12(3), 328–383.

52
Burt, R.S. (2000) The Network Structure Of Social Capital. Research in Organizational Behavior, 22, 345–423.
Calatayud, A., Mangan, J., Palacin, R. (2017) Vulnerability of International Freight Flows to Shipping Network Disruptions: A Multiplex Network Perspective. Transportation Research
Part E: Logistics and Transportation Review, 108, 195–208.
Chu, J.S.G., Davis, G.F. (2016) Who Killed the Inner Circle? The Decline of the American Corporate Interlock Network. American Journal of Sociology, 122(3), 714–754.
Coase, R.H. (1937) The Nature of the Firm. Economica, 4(16), 386–405.
Coase, R.H. (1960) The Problem of Social Cost. Journal of Law and Economics, 3, 1–44.
Coleman, J., Katz, E., Menzel, H. (1957) The Diffusion of an Innovation Among Physicians. Sociometry, 20(4), 253–270.
Comet, C. (2017) How Does the Inner Circle Shape the Policy-Planning Network in France? Socio-
Economic Review, 17(4), 1021–1041.
Crespo, J., Suire, R., Vicente, J. (2014) Lock-in or Lock-out? How Structural Properties of Knowledge Networks Affect Regional Resilience. Journal of Economic Geography, 14(1), 199–219.
Crespo, J., Suire, R., Vicente, J. (2016) Network Structural Properties for Cluster Long-Run Dynamics: Evidence from Collaborative R&D Networks in the European Mobile Phone Industry. Industrial and Corporate Change, 25(2), 261–282.
Criado, R., Romance, M., Vela-Pérez, M. (2010) Hyperstructures: A New Approach to Complex Systems. International Journal of Bifurcation and Chaos, 20(03), 877–883.
Cronin, B. (2011) Networks of Corporate Power Revisited. Procedia - Social and Behavioral
Sciences, 10, 43–51.
Davis, G.F., Yoo, M., Baker, W.E. (2003) The Small World of the American Corporate Elite, 1982-2001. Strategic Organization, 1(3), 301–326.
Dickison, M.E., Magnani, M., Rossi, L. (2016) Multilayer Social Networks. Cambridge University Press, New York.
Domhoff, G.W. (1975) Social Clubs, Policy-Planning Groups, and Corporations: A Network Study of Ruling-Class Cohesiveness. Insurgent Sociologist, 5(3), 171–184.
Domhoff, G.W. (2006) Who Rules America? Power and Politics, and Social Change. McGraw-Hill, Boston, Mass.
Dopfer, K., Foster, J., Potts, J. (2004) Micro-Meso-Macro. Journal of Evolutionary Economics, 14(3), 263–279.
Ducruet, C. (2020) The Geography of Maritime Networks: A Critical Review. Journal of Transport
Geography, 88, 102824.
Estrada, E., Rodríguez-Velázquez, J.A. (2006) Subgraph Centrality and Clustering in Complex Hyper-Networks. Physica A: Statistical Mechanics and its Applications, 364, 581–594.
Everett, M.G., Borgatti, S.P. (1998) Analyzing Clique Overlap. Connections, 21(1), 49–61.
Faust, K. (1997) Centrality in Affiliation Networks. Social Networks, 19(2), 157–191.

53
Feldman, M. (1994) The Geography of Innovation. Springer Netherlands Imprint Springer, Dordrecht.
Feng, F., He, X., Liu, Y., Nie, L., Chua, T.S. (2018) Learning on Partial-Order Hypergraphs. In Proceedings of the 2018 World Wide Web Conference. International World Wide Web Conferences Steering Committee, Republic and Canton of Geneva, CHE, pp. 1523–1532.
Freeman, L. (2004) The Development of Social Network Analysis : A Study in the Sociology of Science. Empirical Press BookSurge, Vancouver, BC North Charleston, S.C.
Freeman, L.C. (1968) Patterns of Local Community Leadership. Bobbs-Merrill, Indianapolis.
Freitag, P.J. (2014) The Cabinet and Big Business: A Study of Interlocks. Social Problems, 23(2), 137–152.
Giuliani, E. (2007) The Selective Nature of Knowledge Networks in Clusters: Evidence from the Wine Industry. Journal of Economic Geography, 7(2), 139–168.
Glode, V., Opp, C. (2016) Asymmetric Information and Intermediation Chains. American
Economic Review, 106(9), 2699–2721.
Granovetter, M. (1985) Economic Action and Social Structure: The Problem of Embeddedness. American Journal of Sociology, 91(3), 481–510.
Hearnshaw, E.J.S., Wilson, M.M.J. (2013) A Complex Network Approach to Supply Chain Network Theory. International Journal of Operations & Production Management, 33(4), 442–469.
Heider, F. (1958) The Psychology of Interpersonal Relations. Wiley, New York.
Herrero López, R. (2015) Dualidad, Estructura y Forma: El ‘Análisis de Redes Sociales’ y Su Contribución al Estudio Empírico Del Poder. PhD Thesis, Universidad Complutense de Madrid.
Hobson, J.A. (1906) The Evolution of Modern Capitalism: A Study of Machine Production, Second Edition. The Walter Scott Publishing, London.
Hogendorn, C. (2012) Spillovers and Network Neutrality. In Faulhaber, G.R., Madden, G. and Petchey, J. (eds.), Regulation and the Performance of Communication and Information
Networks. Edward Elgar Publishing, Cheltenham, pp. 191–208.
Holmstrom, B., Roberts, J. (1998) The Boundaries of the Firm Revisited. Journal of Economic
Perspectives, 12(4), 73–94.
Inoue, H., Todo, Y. (2019) Firm-Level Propagation of Shocks through Supply-Chain Networks. Nature Sustainability, 2(9), 841–847.
Jackson, M.O. (2011) Social and Economic Networks. Princeton Univers. Press.
Jeidels, O. (1905) Das Verhältnis Der Deutschen Grossbanken Zur Industrie: Mit Besonderer Berücksichtigung Der Eisenindustrie. Duncker & Humblot.
Kim, Y., Choi, T.Y., Yan, T., Dooley, K. (2011) Structural Investigation of Supply Networks: A Social Network Analysis Approach. Journal of Operations Management, 29(3), 194–211.
Kirman, A.P. (1992) Whom or What Does the Representative Individual Represent? Journal of
Economic Perspectives, 6(2), 117–136.

54
Kivelä, M., Arenas, A., Barthelemy, M., Gleeson, J.P., Moreno, Y., Porter, M.A. (2014) Multilayer Networks. Journal of Complex Networks, 2(3), 203–271.
Knoke, D. (1990) Political Networks : The Structural Perspective. Cambridge University Press, Cambridge.
Kogut, B. (2000) The Network as Knowledge: Generative Rules and the Emergence of Structure. Strategic Management Journal, 21(3), 405–425.
Krackhardt, D., Hanson, J.R. (1993) Informal Networks. Harvard business review, 71(4), 104–111.
Laumann, E., Pappi, F.U. (1976) Networks of Collective Action : A Perspective on Community Influence Systems. Academic Press, New York.
Lee, K.M., Goh, K.I. (2016) Strength of Weak Layers in Cascading Failures on Multiplex Networks: Case of the International Trade Network. Scientific Reports, 6(1).
Liebowitz, S.J., Margolis, S.E. (1994) Network Externality: An Uncommon Tragedy. Journal of
Economic Perspectives, 8(2), 133–150.
Lorrain, F., White, H.C. (1971) Structural Equivalence of Individuals in Social Networks. The
Journal of Mathematical Sociology, 1(1), 49–80.
Marshall, A. (1919) Industry and Trade. Macmillan, London.
May, R.M., Levin, S.A., Sugihara, G. (2008) Ecology for Bankers. Nature, 451(7181), 893–894.
Ménard, C. (2003) Hybrid Modes of Organization: Alliances, Joint Ventures, Networks, and Other ‘Strange’ Animals. In Gibbons, R.S. and Roberts, J. (eds.), The Handbook of
Organizational Economics. Princeton University Press, Princeton, pp. 902–941.
Ménard, C. (2014) Embedding Organizational Arrangements: Towards a General Model. Journal of
Institutional Economics, 10(4), 567–589.
Mintz, B. (1975) The President’s Cabinet, 1891-1912: A Contribution to the Power Structure Debate. Insurgent Sociologist, 5(3), 131–148.
Mintzberg, H. (1979) The Structuring of Organizations. Prentice Hall, Englewood Cliffs NJ.
Mizruchi, M.S. (1996) What Do Interlocks Do? An Analysis, Critique, and Assessment of Research on Interlocking Directorates. Annual Review of Sociology, 22(1), 271–298.
Moody, J., White, D.R. (2003) Structural Cohesion and Embeddedness: A Hierarchical Concept of Social Groups. American Sociological Review, 68(1), 103–127.
Moreno, J.L. (1934) Who Shall Survive? A New Approach to the Problem of Human Interrelations. Beacon House, New York.
Nadel, S.F. (1957) The Theory of Social Structure. Cohen & West, London.
Newman, M.E.J. (2002) Assortative Mixing in Networks. Physical Review Letters, 89(20), 208701.
Newman, M.E.J. (2003) The Structure and Function of Complex Networks. SIAM Review, 45(2), 167–256.
Newman, M.E.J., Strogatz, S.H., Watts, D.J. (2001) Random Graphs with Arbitrary Degree Distributions and Their Applications. Physical Review E, 64(2), 026118.
Owen-Smith, J., Powell, W.W. (2004) Knowledge Networks as Channels and Conduits: The Effects of Spillovers in the Boston Biotechnology Community. Organization Science, 15(1), 5–21.

55
Palmer, D., Friedland, R., Singh, J.V. (1986) The Ties That Bind: Organizational and Class Bases of Stability in a Corporate Interlock Network. American Sociological Review, 51(6), 781–796.
Perera, S., Bell, M.G.H., Bliemer, M.C.J. (2017) Network Science Approach to Modelling the Topology and Robustness of Supply Chain Networks: A Review and Perspective. Applied
Network Science, 2(1).
Perrucci, R., Pilisuk, M. (1970) Leaders and Ruling Elites: The Interorganizational Bases of Community Power. American Sociological Review, 35(6), 1040–1057.
Pizarro, N. (2007) Structural Identity and Equivalence of Individuals in Social Networks: Beyond Duality. International Sociology, 22(6), 767–792.
Powell, W.W. (1990) Neither Market nor Hierarchy: Network Forms of Organization. Research in
Organizational Behavior, 12, 295–336.
Powell, W.W., Koput, K.W., Smith-Doerr, L., Owen-Smith, J. (1999) Network Position and Firm Performance: Organizational Returns to Collaboration in the Biotechnology Industry. In Andrews, S. and Knoke, D. (eds.), Networks In and Around Organizations. JAI Press, Greenwich, CT, pp. 129–159.
Rodriguez, M.A., Shinavier, J. (2010) Exposing Multi-Relational Networks to Single-Relational Network Analysis Algorithms. Journal of Informetrics, 4(1), 29–41.
Roethlisberger, F.J., Dickson, W.J. (1939) Management and the Worker. Cambridge University Press, Cambridge.
Roijakkers, N., Hagedoorn, J. (2006) Inter-Firm R&D Partnering in Pharmaceutical Biotechnology since 1975: Trends, Patterns, and Networks. Research Policy, 35(3), 431–446.
Rosenkopf, L., Schilling, M.A. (2007) Comparing Alliance Network Structure across Industries: Observations and Explanations. Strategic Entrepreneurship Journal, 1(3‐4), 191–209.
Schelling, T. (1978) Micromotives and Macrobehavior. Norton, New York.
Schoorman, F.D., Bazerman, M.H., Atkin, R.S. (1981) Interlocking Directorates: A Strategy for Reducing Environmental Uncertainty. Academy of Management Review, 6(2), 243–251.
Simmel, G. (1950) The Sociology of Georg Simmel. Free Press, London.
Snijders, T.A.B. (2001) The Statistical Evaluation of Social Network Dynamics. Sociological
Methodology, 31(1), 361–395.
Thorelli, H.B. (1986) Networks: Between Markets and Hierarchies. Strategic Management Journal, 7(1), 37–51.
Tran, N.K., Haasis, H.D. (2013) Literature Survey of Network Optimization in Container Liner Shipping. Flexible Services and Manufacturing Journal, 27(2–3), 139–179.
Uzzi, B., Spiro, J. (2005) Collaboration and Creativity: The Small World Problem. American
Journal of Sociology, 111(2), 447–504.
Van Apeldoorn, B., De Graaff, N. (2014) Corporate Elite Networks and US Post-Cold War Grand Strategy from Clinton to Obama. European Journal of International Relations, 20(1), 29–55.
Vicente, J. (2018) Economics of Clusters: A Brief History of Cluster Theories and Policy. Palgrave Macmillan.

56
Vicente, J., Balland, P.A., Brossard, O. (2011) Getting into Networks and Clusters: Evidence from the Midi-Pyrenean Global Navigation Satellite Systems (GNSS) Collaboration Network. Regional Studies, 45(8), 1059–1078.
Villena-Oliver, A. (2014a) Fundamentos Estructurales de Los Gobiernos Democráticos: Cohesión Interna y Grupos de Poder. Análisis de Dos Ejecutivos Españoles: 2004 y 2012. PhD Thesis, Universidad de Málaga.
Villena-Oliver, A. (2014b) La Constitución de Un Gobierno Como Acumulación de Poder Relacional. Estudio de Dos Ejecutivos En España. Redes. Revista Hispana para el Análisis
de Redes Sociales, 25(1), 19–48.
Vonortas, N.S. (2012) Social Networks in R&D Program Evaluation. The Journal of Technology
Transfer, 38(5), 577–606.
Wasserman, S., Faust, K. (1994) Social Network Analysis: Methods and Applications. Cambridge university press, Cambridge.
Watts, D.J. (2004) The “New” Science of Networks. Annual Review of Sociology, 30(1), 243–270.
Watts, D.J., Strogatz, S.H. (1998) Collective Dynamics of `small-World’ Networks. Nature, 393(6684), 440–442.
Weber, M. (1947) The Theory of Social and Economic Organization. The Free Press and the Falcon’s Bring Press.
Williamson, O.E. (1985) The Economic Institutions of Capitalism: Firms, Markets, Relational Contracting. Free Press, New York.
Woolthuis, R.K., Lankhuizen, M., Gilsing, V. (2005) A System Failure Framework for Innovation Policy Design. Technovation, 25(6), 609–619.

57
Chapter 2 – The visible hand of cluster
policy makers: An analysis of Aerospace
Valley (2006-2015) using a place-based
network methodology
Abstract: The paper focuses on cluster policies with particular attention to the role of R&D collaborative
incentives in the structuring of knowledge networks in clusters. We disentangle the main network
failures in regional innovation systems, and discuss the selection procedures designed by policy
makers to foster knowledge collaborations. We draw evidence from the French Aerospace Valley
cluster from 2006 to 2015. The case study is based on a dataset of 248 granted research consortia,
from which we build 4-cohort knowledge networks that enable us evidencing the evolving structural
properties of the cluster over time. We suggest avoiding the bias and limitations of 1 and 2-mode
network analysis by developing an original place-based network methodology that emphasizes on
structural equivalence and groups’ behaviors. We discuss the results focusing on the convergence
degree between the structural properties of the cluster selected by the Program and the policy
makers’ objectives. Finally, the methodology allows us to identify the agents of the structural and technological changes observed throughout the period.
Keywords: Cluster policy; Networks; Collaborative incentives; Groups behaviors; Behavioral
additionality; Aerospace Valley
JEL codes: D85; O25; O30; R10
This chapter is co-authored with Jérôme Vicente (Lereps – Sciences Po Toulouse) and is published in Research Policy6.
6 Lucena-Piquero, D. and Vicente, J. (2019) The visible hand of cluster policy makers: An analysis of Aerospace Valley (2006-2015) using a place-based methodology. Research Policy, 48(3), 830-842, DOI: 10.1016/j.respol.2019.01.001

58
2.1. Introduction
The development of cluster policies relies on the growing awareness from academics and policy
makers that network failures have to be merged with traditional market ones in the design of public
innovation incentives (Woolthuis et al., 2005; Vicente, 2017). That is why cluster policies have
been implemented in many countries since the end of the 1990s (Uyarra and Ramlogan, 2012;
Maffioli et al., 2016). They coexist nowadays with innovation policies based on individual
incentives, such as research tax credit and innovation grants sponsored by public agencies
(Nishimura and Okamuro, 2011). Cluster policies aim at designing R&D collaborative incentives to
strengthen knowledge networks in order to stimulate the expected benefits of local knowledge
spillovers (Broekel et al., 2015). Cluster policies basics broadly rely on two related network
failures. First, the potentialities of knowledge spillovers from science to industry can be
inefficiently exploited due to the cultural divide and the weak absorptive capabilities between the
two communities. Considering that positive impacts of knowledge spillovers are geographically
bounded (Audretsch and Feldman, 1996), cluster policy guidelines will tend to favor local
incentives towards networks mixing public research organizations and companies. Second,
entrepreneurship matters in clusters (Rocha and Sternberg, 2005; Delgado et al., 2010). Their
effectiveness can be assessed by the rate of SMEs and spinoffs’ birth and entry. The latter is the
mark of the level of technological variety and renewal, and therefore represents a significant
indicator of the cluster long-run dynamics. Here again, these births and entries are geographically
bounded, and contained in the close perimeter of universities and big companies (Audretsch and
Lehman, 2005). But the entry dynamics is not a significant condition of cluster success per se. New
entrants sometimes need to benefit from collaborative opportunities, especially in industries in
which modularity and interoperability matter (Suire and Vicente, 2014). Then, collaborative
incentives between SMEs and big companies are also a regular means used in cluster policies to
foster regional performance.
The aim of this research is to have a deeper insight of these policy guidelines, and to find and test
adapted network methodologies to deal with (i) the links between the public micro-incentives for
knowledge collaboration and the structural properties of the network that emerge from these
incentives, and (ii) the identification of the agents at the origin of structural changes. In that respect,
the place-based network methodology and the nested cohesive block analysis are developed and
offer promising avenues. As a matter of fact, it is common in the literature to assess whether
network position increases individual innovative performance (Zaheer and Bell, 2005; Cattani and

59
Ferriani, 2008). Nevertheless, very few contributions have studied the impact of cluster
development programs not on the links between the actors’ position and performance but on the
links between the structural properties of networks these incentives produce and the patterns of
knowledge dynamics at work within the cluster (Crespo et al., 2014; Giuliani and Pietrobelli, 2016).
This question requires going beyond the different centrality degrees developed in the literature to
measure individual position in networks. It requires investigating different concepts related to
complex structural properties imported from network theories in order to better disentangle the
consequences of different properties of network connectivity on the cluster development patterns.
Moreover, it also requires overcoming methodological issues that arise when one deals with
aggregate relational data at the regional scale. To improve our knowledge on that emerging research
topic, we will focus on a single case study: the Aerospace Valley in Toulouse – France from 2006 to
2015, i.e. from the start of the policy to the year from which data are available. Aerospace Valley is
one of the leading public-funded clusters granted by the French Cluster Program, and it is also the
name of the association nurturing R&D collaborations and managing the international visibility of
the cluster. As a consequence, Aerospace Valley can be considered as a particular cluster and
knowledge network whose nodes are organizations involved in R&D projects selected by the
association, and ties are collaborations having received public incentives. Our goal is not to find
causality between the policy and the innovative performance of the organizations affiliated to the
cluster program. To do so, systematic analysis on several places should be carried out, and
counterfactual analysis required (Giuliani and Pietrobelli, 2016). Our goal is different and just as
important for whoever wants to have a better understanding of how policy makers shape the
organization of innovation processes in regions. Indeed, our basic starting assumption is related to
the fact that, in spite of their control on the selection of R&D collaborations at the micro and dyadic
levels, policy makers cannot have a perfect real-time knowledge and control of the structure as a
whole. In network theories, this type of micro-macro scales problems is typical (Watts, 2004;
Newman et al., 2006): the “macro-behavior” of the network and its structural properties, both
resulting from the aggregation of ties, can escape their own intention. Since clusters are foremost
networks (Giuliani and Bell, 2005; Vicente et al., 2011), dealing with the links between micro
incentives and macro structures can be an alternate means to discuss how innovation policies can
shape collaborative patterns and the structure of knowledge networks, as previously documented in
the context of European Framework Programs assessment (Breschi and Cusmano, 2004; Vonortas,
2013).

60
The contribution is divided as follows: Section 2.2 goes back to the structuring of R&D networks in
clusters and the design of public collaborative incentives aiming at repairing network failures.
Section 2.3 aims at exemplifying these incentives and their consequences in the evolving structure
of a particular cluster. We start by explaining the historical and technological context in which the
Aerospace Valley cluster has been selected by national authorities to be eligible to public-funded
incentives for R&D collaborations, before describing the cluster policy guideline developed in order
to sustain its development. Section 2.4 presents the data collection procedure which enables us to
build an original and complete dataset of public-funded collaborative R&D projects for this cluster.
Then we discuss the methodological issues for building networks over the period. We disentangle
the problems that generally arise for the study of networks resulting from the simple aggregation of
collaborative and multilateral R&D consortia. To circumvent them, we suggest a place-based
network methodology that focuses on structurally-equivalent relational behaviors. Section 2.5
shows how this methodology helps us identifying the evolving structural properties of knowledge
networks in the cluster over time. Section 2.6 discusses the results under a particular focus related to
the convergence degree between the network statistical findings and the objectives stated by the
policy makers, with a particular focus on the agents of the structural and technological changes over
the period.
2.2. Network failures, behavioral additionality, and the design of collaborative incentives in cluster policies
Cluster policies support the idea that an additional source of R&D productivity at the meso level
remains hidden behind the simple aggregation of the innovative capabilities of each organization
considered in isolation. Therefore, the expected economic return is directly related to the multiplier
effect induced by network incentives and collaborative subsidies. This multiplier effect is directly
associated to the particular type of additionality – named behavioral additionality – generally
expected by governments when they implement collaborative incentives in R&D activities (Fier et
al., 2006; Clarysse et al., 2009). While input and output additionalities are usually expected from
individual incentives to innovate when market failures are considered, behavioral additionality is
put forward as the main argument of policy implementation when systemic failures are observed in
regional or larger innovation systems (Luukkonen, 2000; Breschi et al., 2009; Gök and Edler,
2012). Network failures constitute a large part of these systemic failures (Woolthuis et al., 2005)
and concern the structural organization of innovation process (Vicente, 2017). Taking them into

61
account can explain why cluster policies based on collaborative R&D grants have gradually
substituted individual grants, and why the need for network-oriented methodologies to evaluate
collaborative programs is getting more and more challenging (Vonortas, 2013; Giuliani and
Pietrobelli, 2016). Fixing network failures implies a large spectrum of policy interventions and
raises the typical question of selection. Indeed, selection is the key principle as well as the key
difficulty, due to the information asymmetries between collaborative grants providers and receivers.
That is why cluster policy makers usually design filtering processes in order to reduce these
asymmetries. Moreover, by influencing collaborative behaviors of local agents, policy makers also
influence the collaborative structure as a whole. Each selected collaboration contributes to the
network structuring and connectivity. Here again, a new asymmetry occurs, since policy makers can
have difficulties to perceive the aggregate network structure that evolves over time as new agents
and new collaborations enter the network. Subsidizing a set of “good collaborations” does not
necessarily imply shaping “good networks”. Therefore, understanding cluster policies as a means to
boost innovative outputs through behavioral additionality requires working both on the selection
process of knowledge collaborations at the micro level (2.1) and on the connectivity properties of
the network as a whole (2.2).
2.2.1. Filtering and selecting knowledge collaborations in clusters
For cluster public fund raisers, repairing network failures first consists in identifying the nature of
these failures, in order to develop an oriented selection mechanism for the provision of
collaborative grants. Not all collaborations are equally relevant to sustain. Policy makers have to
grant a minimum of collaborations for a maximal-expected economic return, by ranking strategic
priorities for their collaborative incentive schemes.
2.2.1.1 Public knowledge dissemination and absorption
One of the typical network failures relies on an insufficient level of reciprocal absorptive
capabilities of knowledge between public research organizations and firms. In spite of the “public
good” property of knowledge outputs produced by universities, the regional benefit from local
knowledge spillovers does not only result from geographical proximity, but from the intentional
effort of agents to interact in multiple ways in order to improve their mutual understanding in
62
problem solving (Breschi and Lissoni, 2001; Bishop et al., 2011). A cultural gap and a weak social
mobility and proximity between the two communities are often mentioned as a source of
inefficiency (Hemmert et al., 2014). Therefore, providing incentives for knowledge exchanges
between academic and private R&D labs remains one of the main filtering mechanisms in cluster
programs. Nevertheless, this type of support is not necessarily useful for clusters that have
historically succeeded in overlapping academic and business networks. But because academic
research plays a crucial role in network during the early stage of technological domains (Owen-
Smith and Powell, 2004), this means to foster academic knowledge dissemination is more relevant
for clusters for which technological renewal matters. The economic return of cluster policy as well
as the behavioral additionality gained from collaborative incentives is expected to be higher in this
type of context in which academic research and business communities remain poorly connected
(Morrison and Rabellotti, 2007). At the reverse, for clusters involved in the upstream phases of
market development, the need for this type of public-funded collaborations is less crucial, and can
be a source of crowding-out when implemented in an excessive myopic way.
2.2.1.2 SMEs entry and connectivity
Like organic systems, cluster long-run performances depend on the renewing degree of firms’
demography. While some clusters succeed in engendering spinoffs and start-ups, others fail and
tend to concentrate knowledge relationships between big and long-established companies (Rocha
and Sternberg, 2005). Beyond the question of new entries, the issue for cluster policy makers is also
related to the growth and survival rates of nascent companies. Delgado et al. (2010) and Wennberg
& Lindqvist (2010) show that clustering effects have a higher impact on new companies birth and
survival than pure agglomeration externalities. In industrial domains in which systemic technologies
require integration between separated pieces of knowledge disseminated between different
companies, connections to the main companies holding the central part of the system are often for
the new entrants the opportunity to cross the bridge between R&D and business prospects (Suire
and Vicente, 2014). Therefore, repairing network failures in clusters consists in building selection
mechanisms that are conditional to the attendance of young or nascent SMEs in consortia.
Designing this type of incentives can decrease the homophilic relational behaviors between core-
companies that relegate new entrants in the network periphery. In terms of expected economic
returns, providing this type of collaborative incentives could be more effective than pure individual
incentives that put SMEs in a situation of public fund dependence, without any sufficient guarantees

63
that they alone might succeed in finding market opportunities. But at the reverse, this filtering
mechanism can be a source of crowding-out for clusters in which social networks between new
entrepreneurs and managers of long-established firms work well.
2.2.1.3 Local cohesiveness and global accessibility
Clusters are not closed systems. Their success depends both on their internal structuring and their
degree of embeddedness in global networks. Since the large fieldwork analysis of Storper &
Harrison (1991) and Markusen (1996), it is acknowledged that clusters strongly differ in their
balance between inward and outward knowledge relationships. Each organization manages its
relational portfolio according to its own perception of the benefits from voluntary knowledge
exchanges and the risk of unintended knowledge spillovers. Geographical proximity increases these
opportunities, but also increases these risks (Breschi and Lissoni, 2001; Boschma, 2005). When
collaborations on knowledge open new opportunities but are likely to generate distrust and
appropriation concerns (Gulati and Singh, 1998), building relationships with distant partners limits
the risks of unintended spillovers. Moreover, global relationships enlarge the variety of external
knowledge sources (Morrison et al., 2013), and are particularly strategic between distant
competitors wishing to collaborate on how to turn separated and competing technologies into
interoperable ones (Balland et al., 2013). Therefore, the balance between local and global
collaborative incentives constitutes a challenging point for cluster policy makers.
2.2.1.4 Technological relatedness, diversification and new growth paths
Cluster dynamics are not never-ending stories of specialization, nor random processes of jumping
from one industry to another. The technologies and markets on which clusters evolve over time
move along a gradient of related and unrelated diversification. In the Silicon Valley, the
photovoltaic industry in the 2000s has at first glance nothing to do with the computer industry in the
1980s. It is nevertheless noteworthy that they share knowledge on storage technologies for data and
energy on one side, and nanostructures on the other side, coming both from the semiconductors
industry which has continuously developed since the 1970s. Several factors explain these regional
diversification processes (Boschma, 2017), from skills mobility (Neffke and Henning, 2013) to
institutional agency (Borras and Edler, 2014). Among them, the dynamics of inter and intra-industry

64
collaborations plays a critical role (Broekel and Brachert, 2015), and then appears as an additional
source of network failures. In regions in which several clusters are identified as such by policy
makers, the bridging between them constitutes a source of path creation potentialities. The debates
on the superiority of related or unrelated diversification on cluster performances are far from being
over and empirical evidences are too contextual to enable the design of standard policy lessons.
However, diagnosis of the network structures of clusters can help policy makers better orientate
their collaborative incentives on particular directions. As suggested by Suire and Vicente (2014),
providing public incentives towards collaborations in closely-related industries should be more
effective for clusters that failed to set up their technologies on mass markets, while collaborative
incentives toward previously-unrelated industries and skills can favor path renewal for clusters
entering a phase of transition.
These network failures, presented separately for convenience, are not necessarily independent of
each other. For example, when there is a lack of diversification within a region, this may be the
consequence of a lack of global connectivity of the cluster, since the diversification opportunities
result from collaborations with partners outside the region (Fitjar and Rodríguez-Pose, 2011;
Morrison et al., 2013). Likewise, the connectivity of SMEs to networks is not independent from the
overlapping of academic and business networks, in particular when this concerns university spinoffs
and their need to connect the business community (Mustar, 1997; Sternberg, 2014). Relying on one
of these network failures is not without consequences on the others, and these interdependencies
must be taken into account by cluster policy makers.
2.2.2. Connectivity and the structural properties of networks in clusters
When cluster policy makers provide incentives for collaborations, they contribute to the circulation
of knowledge like a visible hand trying to take the control of the expected positive effects of
unintended knowledge spillovers. But having the perfect control of the evolving structural
properties of networks is somewhat difficult, even impossible, since all the new supported
collaborations but also the renewing and ending ones continuously modify the properties of the
structure. If failures at the dyadic level can be easily fixed, repairing structural failures is not within
policy maker’s reach. They are difficult to fix, but some of them have been identified as key
properties that matter for the long run performance of social networks (Watts, 2004; Rivera et al.,
2010; Ahuja et al., 2012) but also clusters and regions (Crespo et al., 2014; Breschi and Lenzi,
2016).

65
2.2.2.1 Connectivity vs. density
The balance between network connectivity and density is an important feature of networks, and one
of the critical parameter of their aggregate performance. Network connectivity has been considered
as an important feature of knowledge network since it enhances information flows and knowledge
spillovers (Fleming et al., 2007). A high level of relational density does not necessarily imply a
high level of connectivity. It depends on how collaborative incentives are distributed among the
organizations in clusters (Crespo and Vicente, 2016). For a given amount of relationships,
knowledge can always find a path to flow between any pairs of organizations, or, at the reverse, can
meet several breaking points. In extreme cases, when incentives are oriented toward the
reinforcement of closure into separated cliques of organizations, increasing density cannot increase
connectivity. Closure and cohesiveness in networks are important for enhancing trust and
coordination, in particular when systemic innovations require complex processes of knowledge
integration. But cluster policy makers also need to pay attention to the overall connectivity in order
to favor knowledge circulation and maintain new collaboration opportunities. Although cluster
policy guidelines generally stress on the necessity to increase the overall density of networks in
clusters (Vicente, 2017), cluster managers who are actually involved in cluster development also
have to focus more surgically on particular bridging links between cohesive groups.
2.2.2.2 Hierarchy
Knowledge networks in clusters are neither pure centralized structures of interaction nor pure “flat”
ones (Markusen, 1996). In between, clusters are typified by networks in which organizations differ
in terms of degree centrality. The extent of the relational portfolio of each organization depends on
their size and their willingness to collaborate. On the one side, monitoring large portfolio of
collaborations is not within every firm’s reach, since time and human resources are required for that
purpose. On the other side, whatever their size, the need for firms to access external knowledge is
also a critical indicator of their willingness to collaborate. Consequently, the cluster will differ
according to the level of hierarchy in the structure of knowledge interactions. A strong hierarchy,
represented by a very sloping degree distribution, is generally the sign of mature clusters in which
big and long-established organizations have developed a large portfolio of knowledge
collaborations (Brenner and Schlump, 2011). On the other hand, a weak hierarchy, represented by a
very flat degree distribution, is the sign of a burgeoning and nascent cluster which has not yet
succeeded in reaching a high level of coordination in knowledge exchanges. For markets in which

66
competition and industrial organization are based on systemic and modular products, the existence
of core-organizations able to manage the convergence and interoperability between separated pieces
of knowledge is one of the key conditions for clusters to reach a leading position on markets
(Balland et al., 2013). When clusters display hierarchy, they often exhibit a core-periphery structure
(Borgatti and Everett, 1999) in which highly-connected organizations designing technological
standards co-exist with loosely-connected ones, generally new entrants such as spinoffs and SMEs.
This topological form of networks conveys a structure in which the growing capabilities of central
organizations to manage the systemic process of innovation do not play against but co-exist with
new entries. This structure of knowledge interactions in clusters has been documented by Owen-
Smith and Powell (2004) for the biotech industry in Boston, and by Cattani and Ferriani (2008) for
the movie industry in Hollywood. Other network-based analysis of clusters document this type of
structure in developing countries, whether in mature technology-intensive industries (Giuliani et al.,
2018), or in agro-industry like wine or cheese industry (Giuliani and Bell, 2005; Giuliani, 2013;
Crespo et al., 2014). Therefore, cluster policy practitioners have to pay attention on the existing
structure of knowledge interactions. They can help some of the burgeoning organizations become
core-ones in nascent clusters or, at the reverse, provide incentives for entrepreneurship in mature
clusters.
2.2.2.3 Assortativity
Beyond the shape of the degree distribution, the shape of the degree correlation also matters. Called
assortativity in network theories (Rivera et al., 2010; Ahuja et al., 2012), the degree correlation
offers a formal view on how highly and poorly-connected organizations interact together. A
network is strongly assortative when highly-(poorly-) connected organizations tend to form
relationships with other highly-(poorly-) connected organizations, and disassortative when core-
organizations tend to interact more with peripheral ones. Therefore, assortativity is an indicator of
the knowledge pathways between big organizations and less central ones, such as spinoffs and
SMEs. As evidenced by Crespo et al. (2016), a too strong assortativity in mature clusters weakens
their endogenous capabilities on renewing themselves over time. The main challenge for successful
and mature clusters is to avoid entering into decline when the markets on which they are well-
installed also decline. Network assortativity, after a while, becomes a source of conformism and
negative lock-in (Watts, 2004), due to an excessive redundancy of knowledge flows within the core-
component of the network (Vonortas, 2013). As a corollary, fresh and explorative knowledge

67
produced by peripheral organizations has difficulties to reach and irrigate the core of the network
(Fleming et al., 2007). Accordingly, disassortative structures of knowledge interactions enable
clusters to have a higher propensity to continually overlap emergent and mature markets, by
multiplying pathways between the burgeoning ideas developed by new entrants and the market
experience acquired by core-organizations. Therefore, policy makers have to consider this network
property carefully. For that purpose, they need to pay attention to the phase of the business cycle on
which clusters are situated.
The concept of network failures is not only a pure and uncontextualized theoretical argument to
justify public incentives for knowledge collaborations in clusters. It also requires an approach
taking into account the territorial context and the historical contingencies on which these incentives
are implemented. The actual network failures can be weak or strong, and depend on a wide range of
critical parameters policy makers have to capture in order to better contextualize their intervention.
In particular, as intriguingly shown by Fleming et al. (2007), salient structural properties developed
in the literature, like small-world properties, can win and lose in significance according to the
territorial and technological contexts in which these properties are studied. In the same vein, Crespo
et al. (2016) showed that hierarchy and assortativity play differently in the performance of clusters
when the maturity and renewal stages are introduced as key controls in the search from the
significant properties of cluster performance.
2.3. The context of Aerospace Valley in Toulouse
2.3.1. Cluster context: mature markets and the need for regional diversification
and relatedness
Greater Toulouse (France) is a leading and historical place for aeronautics and space industries in
Europe (Niosi and Zeghu, 2005; Zuliani, 2008; Gilly et al., 2011). The main oligopolistic
companies of these two related industries and some of their plants are located in Toulouse (Airbus,
Airbus Defense and Space, ATR, Thales Alenia Space, Safran, among others), and the city hosts the
main French high schools of engineering and research in this technological domain (Sup’Aero,
ONERA, Federal University of Toulouse, among others) as well as the headquarter of the National
Center for Spatial Studies (CNES). This cluster displays three main characteristics: (i) its maturity,
since it leads the European aeronautics and space industries, (ii), its centrality, since it is at the

68
center of the whole of European industrial and innovation networks in the technological field; (iii)
its developing diversification, since it faces challenges related to environmental constraints and new
balances between military and civilian market opportunities. The aerospace industry displays
specific properties in terms of industrial organization. It traditionally combines a strong hierarchy
between the different firms involved in the supply chain with a systemic production process
organized around a hub and spoke network architecture. As pointed by Wink (2010), the industry
was until the end of 1980s typified by close links with the military industry implying strong
confidentiality requirements and a high share of internal R&D. Diversification was low and the high
capital intensity was at the origin of strong entry barriers, together with the government regulation.
After this period, the industry met new challenges leading to salient structural changes. On the one
side, the aircraft industry started to blur its own sectoral frontiers by looking for partners outside its
engineering-based value chain. The main incumbents built relationships with nature, informatics
and material sciences in order to find solutions for the weight reduction of airplanes and to improve
their eco-efficiency. On the other side, the space industry started to develop civilian applications
and strongly diversify its partners’ portfolio for that purpose, in particular in the transversal domain
of embedded systems. These structural changes have given birth to new industries, such as GNSS
(Global Navigation Satellite Systems), drones, and other related industries.
2. 3.2. Cluster policy guideline: a two-stage selection process
Aerospace Valley is a cluster-governance structure born in 2005, as the result of the implementation
of the still ongoing French Cluster Policy. The cluster has been selected by the French government
as one of the seven “world-wide clusters” in the French cluster classification (beside eleven
“globally-oriented clusters”, and fifty three “national clusters”). The aim of the national policy
consists in fostering innovation by selecting a set of 2-dimension vectors of regions and
technological domains that are eligible for receiving grants for R&D collaborative projects.
Aerospace Valley is one of these leading selected vectors, with “greater Toulouse and its
administrative NUTS2 region” and “aeronautic, space, and embedded systems” as vector
coordinates. The governance structure of the cluster is appointed to provide networking activities
and facilitate the emergence of R&D collaborative projects between the industry and the academia.
In particular the structure is responsible for organizing the first stage of the selection process for the
national calls for proposal launched by the FUI (Single Inter-Ministry Fund) and the ANR (French
Research Agency). This first stage consists in a certification process of the most promising R&D

69
research consortia that meet the strategic objectives of the cluster. Once this certification dealt with,
the second stage of the selection process is organized at the national level. The FUI and ANR
regularly launch calls for proposal for R&D collaborative projects for which only consortia certified
at the cluster level can apply. Collaborative incentives for cluster development are thus organized at
two levels. First, the local certification process is an incentive for firms and public research
organizations to work together in order to acquire public funds for their research activities. Second,
the national selection is a strong incentive for cluster managers to nurture synergies and
collaborations in order to get an increasing number of grants and maintain their position in the
French cluster classification.
The guideline has not been set in stone since 2005. First, it has changed at the national level over
the period. Second, cluster managers, in the limits of the French guideline constraints, have a degree
of latitude to adapt their incentives for R&D collaborations. The main persisting constraint is the
necessity for R&D collaborative projects to gather private companies and public research
organizations. At the reverse, other constraints and incentives have evolved over the period. First,
the constraint of being located in the geographical perimeter of the cluster to attend a project has
been relaxed in an early stage. Too closely-related to Porter’ ideas of cluster organization, this
constraint reduced collaborative opportunities and the influence of clusters abroad. Once relaxed, it
became possible to apply to the national grants with projects certified by more than one cluster
governance structure. This change aimed at finding a better “cluster policy mix” between inward
and outward collaborative incentives, as suggested by Morrison et al. (2013). Second, in order to
deal with the Matthew effect according to which the selection process naturally allows the rich to
get richer, strong incentives to include SMEs in R&D consortia have been designed at the national
level and absorbed at the cluster level. Lately, strong incentives have been added in order to boost
not only exploration, but also exploitation and markets, putting the concept of “factories of the
products of the future” beside the “projects factories” at the heart of the new guideline. Finally, with
the possibility given by the national constraints to grant inter-cluster collaborative projects, many
clusters including Aerospace Valley have recently provided strong incentives toward industrial
diversification, in order to better overlap mature and emerging markets.

70
2.4. Data collection and methodology
Characterizing networks in clusters using public-funded R&D collaborative projects requires
particular caution in terms of data collection, time-window definition, and adapted methodologies
of network analysis.
2.4.1. Data collection and disambiguation
Data collected on collaborative projects certified by Aerospace Valley and granted at the national
level between 2006 and 2015 constitute the material used to analyze the evolving structural
properties of the cluster. These data are extracted from Aerospace Valley website and the national
list of selected projects. They concern the FUI and ANR programs, both being the main national
programs aiming at restoring incentives to collaborate on knowledge. These data include project
scientific abstracts, and information about the consortium members (location, institutional form,
size). If the collection of projects does not suffer from limitations, that is not the case for the project
members. Indeed, an extensive effort of disambiguation was required to work with fine-grained
data. This effort focused on an appropriate targeting of departments and plants actually involved in
projects, in order to avoid the over representation of multi-plant companies and large public
research organizations. Project websites, companies activity reports and scholars affiliation have
been consulted in order to refine the database. When contradictory information remained, e-mails to
academics and engineers were sent and the answers enabled us to reach a sufficient fine-grained
extraction.
Over the period, 248 projects were granted. We split the period into four sub-periods using start
date of projects in order to affiliate projects to cohorts with comparable time window and size.
Table 2.1 presents basic statistics on collaborative projects over the period.

71
Table 2.1: Network descriptive statistics 1
#nodes #projects Mean size projects Min size projects Max size projects
Cohort#1 313 56 7,84 2 32
Cohort#2 314 52 7,88 2 22
Cohort#3 395 78 6,79 2 25
Cohort#4 323 62 6,65 2 13
The nodes have been typified according to 4 categories: Big companies, SMEs (under 100
employees), PROs (Public Research Organizations), and others (including technological platforms
and agencies, public institutions). Their location is also taken into account in a binary way by
distinguishing nodes located into the administrative area of the cluster and the others. Figure 2.1
describes the evolving demography of nodes according to these specifications.
Figure 2.1: Evolving demography of Aerospace Valley network 6

72
2.4.2. Overpassing bias and capturing groups’ behavior: the place-based network
methodology
Analyzing how public collaborative incentives drive network structuring in clusters requires
aggregating collaborative projects funded in a same time window (same cohort), and reproducing
the process for all the other time windows. Several previous empirical studies applied this
methodology in the context of regional cluster analysis (Owen-Smith and Powell, 2004; Giuliani
and Bell, 2005; Vicente et al., 2011; Levy and Talbot, 2015; Crespo et al., 2016), as well as in the
context of larger networks at the European level (Breschi and Cusmano, 2004; Breschi et al., 2009;
Balland et al. 2013; Kang and Hwang, 2016). When collaborative projects are considered, network
analysis can start by the construction of a 2-mode network, i.e. an affiliation network drawn from a
rectangular matrix and composed of one type of node (the organizations) connected to another type
of node (the projects). In this type of networks, there is no link connecting nodes of the same type.
But at the reverse, two projects can be linked by one or several organizations, and two organizations
can be tied by one or several projects. This type of network has been suggested by Breschi and
Cusmano (2004) and Balland et al. (2013) since it allows having a first view of how projects in a
same technological field can be linked together by multi-affiliated organizations. 2-mode networks
can be turned into 1-mode networks, in order to capture the structure of innovative activity in
clusters. 1-mode networks are drawn from a square matrix and are composed of a set of nodes
representing organizations and a set of ties representing knowledge flows between them. This
methodology has proven its reliability to identify critical organizations in knowledge dissemination
at the micro-level, and salient structural properties at the meso-level. Nevertheless, as pointed by
Robins and Alexander (2004), this network-based analysis is not exempt of biases and limitations.
First, when networks are drawn from the aggregation of R&D consortia, i.e. from the aggregation of
cliques of fully-interconnected organizations, different biases can occur (Uzzi and Spiro, 2005).
Most of them are related to the risk of confusion in ego-network properties such as degree centrality
and brokerage, due to the heterogeneity in the size of cliques (Breschi and Cusmano, 2004). They
can give rise to misleading interpretation in the actual role of organizations in knowledge
dissemination. To give an example, let us consider an organization that is affiliated to a 15-member
consortium, and only to this one. It will have a high degree centrality, while, as shown by Bernela
and Levy (2017), its influence and involvement in the innovation system can be very weak, in
particular if this organization does not actually interact with all the other consortium members. Let
us now consider another organization involved in 3 collaborative projects, each affiliating only 3
partners. Its degree centrality will be less significant due to a thinner relationships portfolio, while

73
one can expect a higher involvement in projects and a more strategic position in the network.
Dealing with this issue is a challenge for network-based cluster analysis, in particular when the size
of consortia strongly differs, as it is typically the case in that analysis in which the consortia go
from 2 to 32 organizations (see Table 2.1 above). Therefore, methodologies are required to correct
this bias. The idea is to better apprehend the skeleton of the network by capturing the actual
influence of nodes. For instance, Breschi and Cusmano (2004), in their network analysis built from
European collaborative programs, suggest using 1-mode “star” networks instead of considering
consortia as fully-connected cliques. They consider each consortium as a sub-network only
connecting prime contractor to participants. Vicente et al. (2011) use an alternate method based on
the diamond of Robins and Alexander (2004). A diamond appears when two organizations
connected to a project are also connected to another project. Both allow limiting these biases and
offering the means to study the backbone of networks, without the noise introduced by the
heterogeneous size of R&D consortia.
Second, as early demonstrated by Pallotti and Lomi (2011), not only nodes position and direct ties
explain knowledge dissemination in networks. Starting from the ideas on structural equivalence
developed by Lorrain and White (1971) and Burt (1987), they show that groups’ behaviors also
matter. Structural equivalent organizations have similar patterns of relations to others, and thus
share and face same resources and constraints (Stuart and Podolny, 1996; Gnyawali and Madhavan,
2001). They tend to contribute to innovation communities in a same way not only because they
influence each other by direct ties, but because they face similar dependencies and relational
contexts (Mizruchi and Galaskiewicz, 1993). Identifying groups’ behaviors based on structural
equivalence enables having a complementary way to deal with the influence organizations have in
the aggregate structure of knowledge interactions. By giving the skeleton of the network, it also
allows to better capture the changes on the structural and relational patterns (Breiger, 1976; Borgatti
and Everett, 1992; Doreian, 2012).
Rather than limiting the study to a simple 1-mode network analysis, we suggest developing an
alternate methodology that would correct the bias as well as consider groups’ behaviors, without
compromising the possibility to analyze nodes’ position in networks. To do so, we use the so-called
“network of places” approach early developed in sociology by Pizarro (2007) and now operational
for large dataset-based empirical analysis with the R-module "Places: Structural Equivalence
Analysis for Two-mode Networks" (Lucena-Piquero, D., 2017). To define a place Pi of structural
equivalent organizations, let us start by considering a finite set of organizations 𝐼 = {𝑖1, 𝑖2, 𝑖3, … 𝑖𝑝},
each affiliated to one or more projects belonging to the set of projects, noted C (in order to consider

74
each project as a fully-interconnected clique), with 𝐶 = {𝑐1, 𝑐2, 𝑐3, … 𝑐𝑛}. We can define a place Pi
of an organization 𝑖ϵ𝐼 as a subset of C such as at least one of the organizations of I belongs to every
one and only to the projects included in the subset Pi. Therefore, for 𝑖𝜖𝐼, 𝑃𝑖 = {𝑐𝑗 ∈ 𝐶: 𝑖𝑖 ∈ 𝑐𝑗}. If
two organizations i, j ϵ I have the same subsets of C, they belong to the same place. Then, they are
structurally equivalent (Borgatti and Everett, 1992). Places become the new nodes of the network,
that are connected by a relation R when 𝑃𝑖 ∩ 𝑃𝑗 ≠ ∅. Therefore, the set P of all the places defined in
C and the set R of their relations constitute the network of places. This set P can also be defined as a
set P(k,l), where k represents the number of projects in which organizations are involved together,
and l the number of organizations belonging to the place. This reduction process based on structural
equivalence and groups’ behavior gives the skeleton of the organizational 1-mode network, without
losing the organizations, which remain in the structure, but now as simple places’ constituents. In
addition, it provides a simple, accurate and fast algorithm for the study of structural equivalence
(Doreian, 2012).
Figure 2.2: A stylized construction of a network of places 7

75
Figure 2.2 highlights in a stylized way the process that turns a network of projects (cliques of fully-
connected nodes) into a network of places, where nodes are now places gathering structural
equivalent organizations. Figure 2.2a presents a structure of knowledge interactions composed of 4
collaborative projects, each of them composed (in transparency) of fully-connected cliques of
organizations. Figure 2.2b turns this structure into a simple 1-mode network. Figure 2.2c sorts
structural equivalent organizations into distinct groups, while Figure 2.2d preserves in transparency
the previous 1-mode network, and displays now the network of places.
Table 2.2: Descriptive statistics (network of places) 2
#places Mean k per place
Min k per place
Max k per place
Mean l per place
Min l per place
Max l per place
Cohort#1 118 2 1 18 2,65 1 18
Cohort#2 104 1,88 1 14 3,02 1 12
Cohort#3 150 1,85 1 14 2,63 1 17
Cohort#4 112 1,71 1 7 2,88 1 10
We turn the 1-mode network of organizations into a 1-mode network of places in order to better
focus on the groups’ behaviors of the Aerospace Valley network skeleton. Table 2.2 presents basic
statistics of this new network.
Figure 2.3 provides an actual illustration, limited here at the fourth cohort of the Aerospace Valley
cluster, in order to have a better view of how this reduction process gives the skeleton of the
network and neutralizes the bias related to the strong heterogeneity of R&D consortia size.

76
Figure 2.3: 1-mode network and network of places (Aerospace Valley cluster, cohort#4) 8
2.5. Identification of the evolving structural properties of Aerospace
Valley Cluster
By designing collaborative incentives and selection routines of R&D consortia, cluster policy
makers expect reaching their objectives related to better public knowledge dissemination, SMEs
entries, global connectedness and technological diversification. But is the visible hand of the policy
maker as dexterous as that of the juggler to repair network failures? A detailed analysis can help
dealing with this question. It consists in discussing the degree-related structural properties of the
network of places, in order to discuss whether or not the selection routines meet the policy makers’
objectives.

77
5.1. Degree distribution (hierarchy), degree correlation (assortativity)
Figure 2.4: Degree distribution and correlation over time 9
If we stick to a pure structural level, the evolving properties of hierarchy and assortativity give a
first overview of how the topological forms of the network of places have changed over the period.
Figure 2.4 summarizes these evolutions. First, hierarchy, which is measured by the gradient of the
degree distribution, remains high but has declined over the period with a slight increase from cohort
2 to 3. It means that the Aerospace Valley cluster is typified by a high but decreasing level of places
centralization. Because places represent homogenous groups’ relational behaviors, this high level of
centralization indicates the coexistence between groups of organizations with different sizes of
relational portfolio, from a couple a highly-connected organizations that collaborate with many
others to poorly-connected organizations. But over the period, the influence and coordination
capabilities of groups have been more distributed between a larger number of less central places.
Second, the network of places is typified by a bell curve of degree correlation. It indicates a
changing balance in the paths between highly and poorly-connected places and the organizations
that belong to them. Indeed, highly-connected organizations in cohort 1 tend to collaborate more
with poorly-connected organizations than in cohort 2 and cohort 3. This pattern shows that the
network tends to be more and more assortative, with an increasing tendency of highly connected
organizations to interact together. Nevertheless, the assortativity decreases in the last period,
showing a reverse tendency. The most noteworthy is that hierarchy and assortativity play together

78
in a different way from cohort 1 to cohort 2 and from cohort 3 to cohort 4. In the first period, the
decreasing hierarchy goes with an increasing assortativity, signifying that a more distributed
influence in the network has engendered more paths between places that have close degree. But this
is not the case in the last period, in which the influence has been more and more distributed in the
network, but this time with an increasing tendency of highly and poorly-connected places to interact
together.
2.5.2. Connectedness and p-cohesive blocks modeling
This result invites to go more in depth into these structural properties in order to have a better
understanding of the drivers of these changes. The idea is to highlight, in the line of Moody and
White (2003) methodological proposal, how places connect together in a nested system of cohesive
blocks and form a multiconnected network (Powell et al., 2005). A close method relying on the k-
core notion has also been implemented by Breschi and Cusmano (2004) to extract in the very large
European network of public-funded R&D consortia the areas of the network where interaction
among actors is particularly intense. In our case, for each cohort, we extract the number of p-
cohesive blocks. A cohesive block is a component defined as a subset of the network where the
associated value of connectivity p gives the strength of cohesion of the block. The value p is then
the maximal number of places in the subset, above which the block cohesion disappears. Strongest
cohesive blocks are cliques, i.e. those in which every place is directly connected to every other
place. Therefore, we can characterize the network by a hierarchical nesting of cohesive blocks. The
process consists in finding by iteration a maximal number q of p-cohesive blocks, with q > p. Once
these blocks identified, their rank-size distribution offers a relevant means to assess the “multilevel
embeddedness” (nestedness in the terminology of Moody and White) of places in the overall
network. This rank-size distribution offers a relevant means to both identify cohesive blocks and
order them according to both nested and fragmented groups. Indeed, cohesive blocks can overlap
when places belong to multiple groups. The more cohesive blocks overlap, the more they bring
closer in the distribution. Therefore, the shape of the distribution offers a relevant way to observe
how high and low-value cohesive blocks connect together, and then how hierarchy and assortativity
play together in the overall structure of knowledge flows.

79
Figure 2.5: The construction process of the p-cohesive blocks of the cohort 1 10
Figure 2.5 describes the construction of the p-cohesive blocks and the iteration process offering the
nested and hierarchical system of p-cohesive blocks for the cohort 1. For instance, the block B-1 is
a 0-cohesive block representing the entire network. The value is 0 since no place is able to give a
cohesive structure. The block B-7 is one of the subset of B-1 defined as a 3-cohesive block in which
at least 3 places offer cohesion in a subset of 87 places. The iteration process goes on until B-20,
which is the cohesive block having the highest value of cohesion. And finally, other cohesive
blocks with a decreasing p-value are extracted from the part of the network that does not include
subsets of the previous ones. The shape of the distribution displays two close peaks, i.e. two highly-
cohesive blocks (B-21 and B-20). In this cohort, these two strongest cohesive blocks overlap since
two central places belong to both, explaining why they are ranked one after the other in the

80
distribution. Therefore, for cohort 1, the distribution shows the high level of centralization of the
network and the weakly-distributed control of knowledge flows.
Figure 2.6: p-cohesive blocks (4 cohorts) 11
We repeat this process of nested construction of p-cohesive blocks for the four cohorts. Results are
summarized by the four distributions in the Figure 2.6. From cohort 1 to cohort 4, the maximal p-
value decreases while the number of blocks increases. This observation confirms the previously-
observed decreasing hierarchy over the period, but also shows that the tendency of closure between
leading places decreases as well, explaining why the number of “pockets” of influence increases in
the overall network. This finding supports the idea of a more distributed influence in the
coordination of R&D activities over the period and a gradual shift in the balance between closure
and bridging that can better explain why in the last period hierarchy decreases at the same time than
assortativity. Indeed, one can observe on Figure 2.6 that when the higher p-values decrease over the
period, the “distance” between peaks in the distribution increases, which shows that the blocks with
the highest cohesion are less and less closely interconnected by other highly-connected places. This
finding shows that more poorly-connected places bridge highly-cohesive groups, explaining the
p
# cohesive blocks
0
2
4
6
8
10
12
14
16
1 2 3 4 5 6 7 8 9
10
11
12
13
14
15
16
17
18
19
20
21
22
23
24
25
26
27
28
29
30
31
COH1
COH2
COH3
COH4

81
decreasing level of assortativity and a better connection between highly and loosely-connected
places.
2.6. Discussion of the findings
Turning these findings into more qualitative readings related to the role of public collaborative
incentives on the cluster structural change is a challenging question. As evidenced above, the
network structure has changed over time, from a highly-concentrated to a more distributed structure
of dominant cohesive blocks of places. The balance between closure and bridging has changed over
the period, and organizations seem to have reoriented their collaboration pattern toward more path-
breaking and less assortative relational behaviours. A suited solution consists in looking at the
organizational demography of places. In doing that, the composition of places and how it evolves
over time can allow identifying who the agents of structural change actually are.
2.6.1. The changing structural role of SMEs
A first way to assess the changing structural properties of Aerospace Valley is to focus on the so-
called elite component (Powell et al., 2005) of the 4-cohort networks. The elite component is
composed by the places belonging to the two highest p-cohesive blocks. This elite component
corresponds to the peaks of the multi-component distribution. Figure 2.7 provides simple statistics
of this component and how its demography evolves over time.

82
Figure 2.7: The elite component of the Aerospace Valley network 12
The first observation, as regards the organizational demography of the whole network (see Figure
2.1), reveals that the compared shares of each organizational category in the whole network and in
the elite one evolve according to a particular pattern. For big companies, as expected, due to their
intrinsic high relational capabilities, their presence in the elite network is largely superior to their
presence in the entire network, but slightly decreases in the fourth period. SMEs at the reverse are
less proportionally present in the elite network than in the entire one in the first two periods, then
they start to fill the gap during the third one, and finally succeed in reversing the pattern during the
fourth one, with a presence in the elite network slightly superior as regards the entire network.
Considering that the extent of relational portfolio is generally strongly correlated to the organization
size, this pattern raises the question not only of the SMEs entries, but also the question of their
evolving structural role in the cluster. Finally, becoming a victim of the fast growing entry of SMEs
in the elite network, the share of public research organizations decreased over the two last periods.
How to explain such a structural pattern? A first trivial answer relies on the fact that policy makers
have offered stronger incentives to involve SMEs in consortia. These incentives have produced
visible and not surprising effects on the fourth period, with a jump in the number of SMEs involved
in the entire network. But this answer does not suffice to explain why SMEs have succeeded in
0%
10%
20%
30%
40%
50%
60%
70%
80%
90%
100%
Others
PROs
SMEs
Big Firms

83
entering more than proportionally the higher p-cohesive blocks, which was a neither intentional nor
possible objective from policy makers.
The decreasing values of p and the changing distribution of p-cohesive blocks over the period find
explanations in the relational capabilities and behaviors of SMEs as regards big companies. By
entering step by step the elite network, SMEs have changed the pattern of the more central cohesive
groups. First, SMEs being more constrained in the extent of their relational portfolio than big
companies (Street and Cameron, 2007), the network hierarchy has decreased, giving rise to a core
of the network less and less focused on a couple of highly-connected monopolistic companies.
From the start to the end of the period, SMEs have progressively reinforced their role in the
connectedness and cohesiveness of the network, being less and less peripheral, and more involved
in the overall coordination of technological dynamics. Their stronger presence in the highest
cohesive groups, where triadic closure is higher than elsewhere in the network, shows that they are
not only purveyors of fresh knowledge at the margin. At the reverse, they increasingly tend to
attend the design of technological standards that drive the future market exploitation. Second, SMEs
displays an alternate pattern of collaborations as regards big companies. Literature in Geography of
Innovation has shown in an early stage that SMEs and big companies to some extent differ in terms
of innovation strategies. Audretsch and Lehman (2005) have evidenced that nascent and big
companies have different perceptions about the opportunities to turn knowledge exploration into
markets. New entrepreneurs and R&D managers of long-established companies differ in their
timorousness facing uncertainties and risks in market-oriented researches, the former being steadily
less conformist than the latter. These consistent differences in innovation management also find
their counterparts in the relational behaviors and strategies. Since they may be willing to absorb
more risks than big companies managers, new entrepreneurs tend to favor weak ties over strong
ones in order to explore new windows of opportunities. Considering the well-known inverted U-
shaped relationship between tie strength and new knowledge creation (McFadyen and Cannella,
2004; Lowik et al., 2012), these differences in relational behaviors might suggest that new firms are
certainly more numerous on the left-hand side of the curve, while big companies monopolize a large
part of its right-hand side. Therefore, between under and over-embeddedness, the evolving
composition of elite places can explain why, as SMEs enter the elite part of the network, p
decreases at the same time as the distance between the higher p-cohesive blocks increases. The
tendency of SMEs to adopt bridging strategies over closure deconcentrates the nested systems of
cohesive blocks observed when the elite groups were dominated by big companies, giving over time
a more and more decentralized structure in the distribution of influential places.
84
To illustrate this dominant pattern of network evolution in Aerospace Valley, some examples can be
provided. When we go in-depth in the database from cohort 1 to cohort 4, we observe the co-
attendance of the main big incumbents of space and aircraft industry in several projects. For
instance, over the cohort 1, Airbus and Thales are connected together in more than ten central
projects focused on the traditional space and aircraft industry. If we add firms such as Snecma or
Continental, we also find at least five projects in which the four companies are connected together.
If we turn back to the network of places, the cohesive subgraphs identified as the “elite” (the pics)
in the first cohort are mainly composed of these organizations. These projects affiliated to the
“elite” can be considered as social and cognitive centers of the network, to the extent that they are
in the confluence of the research activities, like unmissable “meeting points” in the cluster. If we
invest the pics of the fourth cohort, several changes can be observed in the elite part of the network.
As a matter of fact, the elite in the network of places consists of more subgraphs (the pics), which
are more distant and involve more SMEs. These SMEs, partly marginally involved in the first
cohorts and partly involved for the first time, are now connected in many projects but rarely
together. At the reverse, they tend to connect unconnected parts of the network. For instance,
Magellium and Airod Technologies are both prime contractors of at least three projects but only
once together. In these projects different organizations are also involved and disseminated at
different points of the network. These projects concern emerging markets such as drones for
agriculture, observation devices and consoles for irrigation management and other transversal
technologies using satellite positioning. This changing composition of the elite sheds light on how
diversification and structural properties of knowledge networks work together, as it confirms the
new organizational patterns observed by Wink (2010) in the aerospace industry. It also illustrates
but not explains how spinoffs (Magellium, born in 2003, is a spinoff of Thales) matter for the
endogenous development of clusters (Hervas-Oliver et al., 2017).
2.6.2. Cluster/pipeline structure as a driver of diversification and less assortative
knowledge networks
A second way to assess the changing structural properties of Aerospace Valley also consists in
starting again by the demography of the network, but this time in relation with the inter-clustering
dimension of selected R&D consortia. The public incentives to apply to multi-cluster projects,
which have been implemented early after the initial policy guideline, have increased the extent of
possible knowledge interactions for the organizations located in the Aerospace Valley area. The

85
evolving structural properties of knowledge network probably find explanations in the way with
which the different organizations of the cluster have benefited from these incentives.
Figure 2.8: Single & multi-granted projects and diversification 13
Figure 2.8 displays the shares between single and multi-granted collaborative projects over the
period, taking into account that the shares between the organizations affiliated to the Aerospace
Valley cluster and others affiliated in other clusters remain roughly stable over the period (see
Figure 2.1 above). The more salient observation is related to the strongly-decreasing share of single-
granted R&D consortia over time, with stabilization in the last period. Less than half of the projects
are supported only by the cluster association, while the others are sustained by at least another
French cluster. A small part concerns projects supported by other aerospace clusters, this part being
stable over the three last cohorts. But the most noteworthy evolution is related to the growing
technological diversification of the network. Firstly, we observe a growing share of collaborative
projects conjointly supported by French IT clusters during the three first cohorts. These pipelines
are typical of many clusters and industries that invest in digitalization. For Aerospace Valley, these
pipelines mainly concern both embedded systems and space industries, around the development of
GNSS (Global Navigation Satellite Systems), which require technological convergence between
telecommunications and spatial data transmission (Vicente et al., 2011). Secondly, the same occurs
0%
10%
20%
30%
40%
50%
60%
70%
80%
90%
100%
other clusters
IT clusters
other aero-clusters
AerospaceValley
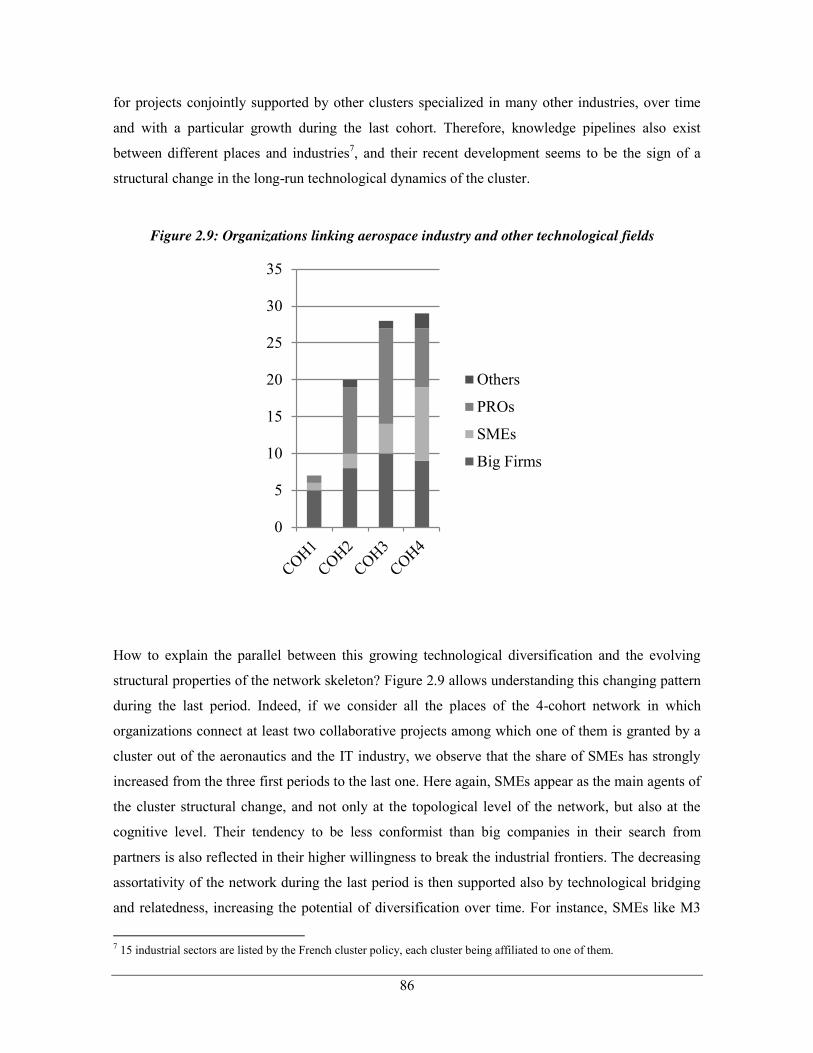
86
for projects conjointly supported by other clusters specialized in many other industries, over time
and with a particular growth during the last cohort. Therefore, knowledge pipelines also exist
between different places and industries7, and their recent development seems to be the sign of a
structural change in the long-run technological dynamics of the cluster.
Figure 2.9: Organizations linking aerospace industry and other technological fields 14
How to explain the parallel between this growing technological diversification and the evolving
structural properties of the network skeleton? Figure 2.9 allows understanding this changing pattern
during the last period. Indeed, if we consider all the places of the 4-cohort network in which
organizations connect at least two collaborative projects among which one of them is granted by a
cluster out of the aeronautics and the IT industry, we observe that the share of SMEs has strongly
increased from the three first periods to the last one. Here again, SMEs appear as the main agents of
the cluster structural change, and not only at the topological level of the network, but also at the
cognitive level. Their tendency to be less conformist than big companies in their search from
partners is also reflected in their higher willingness to break the industrial frontiers. The decreasing
assortativity of the network during the last period is then supported also by technological bridging
and relatedness, increasing the potential of diversification over time. For instance, SMEs like M3
7 15 industrial sectors are listed by the French cluster policy, each cluster being affiliated to one of them.
0
5
10
15
20
25
30
35
Others
PROs
SMEs
Big Firms

87
Systems and Nexio, involved in R&D consortia since the start of the Aerospace Valley Program,
have progressively changed their relational strategies. Mainly involved as simple participants in
single-granted projects related to space industry from cohort 1 to cohort 3, these two small
companies succeed in entering the core of the network as leading companies coordinating multi-
granted projects on the emerging markets on navigation satellite systems. The project GEOTRANS-
MD, in which M3 system is involved in cohort 4, has been certified by Aerospace Valley but also
Systematic, the central cluster of Ile de France (Paris) specialized in automation and electronic
systems. This project consisted in designing a standard applicable in the framework of the European
legislation on the tracking of hazardous materials transport. The project LOCRAY, in which Nexio
is involved in cohort 4 as prime contractor, has been certified by Aerospace Valley but also by
Systematic and Mov’eo, the main French cluster specialized in new mobility and transport of the
future. This project is dedicated to near-field measurements, electromagnetic compatibility and their
compliance with EMC standards. Being still involved in local R&D consortia, these two small
companies succeeded in acting as geographical gatekeepers (Morrison, 2008: Morrison et al.,
2013), becoming central in the knowledge pipelines related to the emerging markets using satellite
navigation or electronics as transversal technologies.
2.7. Conclusion
It is common in the literature to study the impact of cluster policies by capturing the output and
input additionality effects. These effects generally require investigating the causality between the
design of public incentives and the performance of treated organizations in terms of outputs
(patents, exports ...) and inputs (R&D expenses, absorptive capabilities …), compared to non-
treated organizations and after the treatment ends. The paper was aiming at dealing with another
complementary but too weakly-explored challenge, related to the search for behavioral additionality
effects in a particular public-supported cluster. We have investigated how the visible hand of cluster
policy makers develops micro-incentives to shape knowledge networks, and linked the expected
and unexpected changes in the macro-structure to the changing position and relational behavior of
agents.
At the methodological level, searching from the structural properties of networks composed of
R&D consortia has required avoiding the bias and overpassing the limitations of classical 1 and 2-
mode networks. The place-based network methodology has enabled us suggesting a new way to

88
capture the evolving structure of the network skeleton, centered on a clear-cut identification of
structurally-equivalent relational behaviors. This way to proceed has highlighted the evolving
structural properties of the cluster over time. The evolving indexes of degree distribution and
correlation show that the structure of knowledge interactions has changed over the period, from a
highly-hierarchical structure, centralized around a couple of long-established oligopolistic
companies, to a more democratic, less assortative, and multipolar structure of knowledge flows. The
analysis of the evolving composition of places has allowed a better understanding of who the agents
of the structural change actually are. Indeed, one of the salient findings relates to the continuing
entries of SMEs in the elite part of the network, which has changed the relational behavior of the
agents of the core-component of the network, with a stronger tendency to favor bridging strategies
over closure, at the relational as well as the cognitive levels. If we follow previous theoretical
(Rivera et al., 2010; Crespo et al., 2014) and empirical findings on the efficient properties of local
knowledge networks (Uzzi and Spiro, 2005, Breschi and Lenzi, 2016; Crespo et al., 2016), this
changing pattern in the Aerospace Valley network may involve the possibility of a more adaptive
and innovative cluster. More unexpectedly, these findings do not converge with evidence found for
geographically and institutionally larger networks. As a matter of fact, papers dealing with
European collaborative programs (Framework Programs) tend to observe an ossification of
networks and an increasing oligarchic structure of interaction (Breschi and Cusmano, 2004; Kang
and Hwang, 2016). The hypothesis that can be made is then based on the nature of incentive
schemes. As previously observed by Balland et al. (2013), the incentives underlying cluster policies
at the regional level are based on exploration logic. The challenge at European level is quite
different. Incentives are dominantly oriented towards technological exploitation, and rely on the
need to better integrate knowledge to produce dominant design for competitive global markets.
Ossification and cohesion within the networks are therefore a coherent objective, even if the risks of
lock-ins must be taken into account by the European institutions (Breschi and Malerba, 2009).
At the policy level, even if the contribution is restricted to a single-case study among the whole of
clusters supported by the French policy, some lessons about the effects of public incentives can be
drawn. At first glance, the broad objective of helping clusters to turn mature industry into
diversified markets seems to have been achieved. Under the growing constraint to apply to inter-
cluster projects, Aerospace Valley has reached a threshold in technological relatedness and
transversality during the last period of the study. The cluster association staff has succeeded in
nurturing fewer and fewer conformist collaborative projects, which have then been selected and
granted at the national level. But did the local staff as well as the national experts actually control

89
this new pattern of knowledge interactions? It is not sure. Or at least a part of this pattern has
probably escaped them. Indeed, the growing incentives oriented to SMEs were originally merely
dedicated to repair a network failure related to their difficulty to connect knowledge networks. For
policy makers, nothing could have predicted that SMEs would enter the elite network more than the
network per se, nor than they would have a stronger tendency to have non-assortative behaviors and
capabilities to blur technological frontiers. Therefore, the visible hand of cluster policy makers does
not control all the process that shapes the structural properties of knowledge networks. The
changing pattern of Aerospace Valley network took a long time. SMEs were first relegated at the
network periphery, without any significant role on the network structuring. After a while, they
succeeded in positioning themselves in the elite part of the network, without any more public
incentives, but with their own growing experience in the attendance at collaborative projects. In
terms of cluster policy economic return, this growing experience is the mark of a positive effect of
behavioral additionality. We succeed in partially capturing this effect. Indeed, by pushing large
firms into collaborating with SMEs, the latter have gained a great deal of experience enabling them
to better integrate the ecosystem and in return to succeed in establishing themselves as central
actors able to take the leadership of projects. Without this initial impetus from policy makers, these
opportunities to reach the elite part of the cluster could not have run for them. This leadership was
not the aim of public incentives, so that it clearly results in behavioral additionality effect. However,
we only partially shed light on this effect, as it would also require measuring the maintenance of
links when funding expires, which remains on the agenda for future research.
But is the growing role of SMEs in the elite network de facto a loss of control by large firms? It
may be a misleading question. Given that part of the SMEs result of spinoff process and local labor
mobility, social networks of the incumbents’ executives are not necessarily as far away as one can
imagine. It is difficult to observe such a pattern when using data composed of organizations and not
individuals. But one of the perspectives for a near future would be to couple the organizational
network to the network of individuals, to see in the line of Audretsch and Lehman (2005) or
Hervas-Oliver et al. (2017) how these leaders themselves promote the creation of new companies in
order to absorb with them the risks of market diversification. Finally, an open question still remains,
which also probably escapes the intentions of cluster policy makers. The pressures to increase the
attendance of SMEs at projects have strongly evinced public research organizations from the elite
network. It could weaken the cluster in the near future, limiting the diffusion of fundamental and
explorative knowledge through the entire network, and the long run dynamics of the cluster.

90
References of the Chapter 2
Ahuja, G., Soda, G., Zaheer, A. (2012) The Genesis and Dynamics of Organizational Networks. Organization Science, 23(2), 434–448.
Audretsch, D.B., Feldman, M.P. (1996) Innovative Clusters and the Industry Life Cycle. Review of
industrial organization, 11(2), 253–273.
Audretsch, D.B., Lehmann, E.E. (2005) Does the Knowledge Spillover Theory of Entrepreneurship Hold for Regions? Research Policy, 34(8), 1191–1202.
Balland, P.A., Suire, R., Vicente, J. (2013) Structural and Geographical Patterns of Knowledge Networks in Emerging Technological Standards: Evidence from the European GNSS Industry. Economics of Innovation and New Technology, 22(1), 47–72.
Bernela, B., Levy, R. (2017) Collaboration Networks within a French Cluster: Do Partners Really Interact with Each Other? Papers in Regional Science, 96(1), 115–138.
Bishop, K., D’Este, P., Neely, A. (2011) Gaining from Interactions with Universities: Multiple Methods for Nurturing Absorptive Capacity. Research Policy, 40(1), 30–40.
Borgatti, S.P., Everett, M.G. (1992) Regular Blockmodels of Multiway, Multimode Matrices. Social
Networks, 14(1), 91–120.
Borgatti, S.P., Everett, M.G. (2000) Models of Core/Periphery Structures. Social Networks, 21(4), 375–395.
Borrás, S., Edler, J. (2014) The Governance of Socio-Technical Systems: Explaining Change. Edward Elgar Publishing.
Boschma, R. (2005) Proximity and Innovation: A Critical Assessment. Regional Studies, 39(1), 61–74.
Boschma, R. (2017) Relatedness as Driver of Regional Diversification: A Research Agenda. Regional Studies, 51(3), 351–364.
Breiger, R.L. (1976) Career Attributes and Network Structure: A Blockmodel Study of a Biomedical Research Specialty. American Sociological Review, 41(1), 117–135.
Brenner, T., Schlump, C. (2011) Policy Measures and Their Effects in the Different Phases of the Cluster Life Cycle. Regional Studies, 45(10), 1363–1386.
Breschi, S., Cassi, L., Malerba, F., Vonortas, N.S. (2009) Networked Research: European Policy Intervention in ICTs. Technology Analysis & Strategic Management, 21(7), 833–857.
Breschi, S., Cusmano, L. (2004) Unveiling the Texture of a European Research Area: Emergence of Oligarchic Networks under EU Framework Programmes. International Journal of
Technology Management, 27(8), 747–772.
Breschi, S., Lenzi, C. (2016) Co-Invention Networks and Inventive Productivity in US Cities. Journal of Urban Economics, 92, 66–75.
Breschi, S., Lissoni, F. (2001) Knowledge Spillovers and Local Innovation Systems: A Critical Survey. Industrial and Corporate Change, 10(4), 975–1005.

91
Breschi, S., Malerba, F. (2009) ERA and the Role of Networks. In Delanghe, H., Muldur, U. and Soete, L. (eds.), European Science and Technology Policy: Towards Integration or
Fragmentation. Edward Elgar Publishing, Cheltenham, UK, pp. 160–174.
Broekel, T., Brachert, M. (2015) The Structure and Evolution of Inter-Sectoral Technological Complementarity in R&D in Germany from 1990 to 2011. Journal of Evolutionary
Economics, 25(4), 755–785.
Broekel, T., Fornahl, D., Morrison, A. (2015) Another Cluster Premium: Innovation Subsidies and R&D Collaboration Networks. Research Policy, 44(8), 1431–1444.
Burt, R.S. (1987) Social Contagion and Innovation: Cohesion versus Structural Equivalence. American Journal of Sociology, 92(6), 1287–1335.
Cattani, G., Ferriani, S. (2008) A Core/Periphery Perspective on Individual Creative Performance: Social Networks and Cinematic Achievements in the Hollywood Film Industry. Organization Science, 19(6), 824–844.
Clarysse, B., Wright, M., Mustar, P. (2009) Behavioural Additionality of R&D Subsidies: A Learning Perspective. Research Policy, 38(10), 1517–1533.
Crespo, J., Réquier-Desjardins, D., Vicente, J. (2014) Why Can Collective Action Fail in Local Agri-Food Systems? A Social Network Analysis of Cheese Producers in Aculco, Mexico. Food Policy, 46, 165–177.
Crespo, J., Suire, R., Vicente, J. (2014) Lock-in or Lock-out? How Structural Properties of Knowledge Networks Affect Regional Resilience. Journal of Economic Geography, 14(1), 199–219.
Crespo, J., Suire, R., Vicente, J. (2016) Network Structural Properties for Cluster Long-Run Dynamics: Evidence from Collaborative R&D Networks in the European Mobile Phone Industry. Industrial and Corporate Change, 25(2), 261–282.
Crespo, J., Vicente, J. (2016) Proximity and Distance in Knowledge Relationships: From Micro to Structural Considerations Based on Territorial Knowledge Dynamics (TKDs). Regional
Studies, 50(2), 202–219.
Delgado, M., Porter, M.E., Stern, S. (2010) Clusters and Entrepreneurship. Journal of Economic
Geography, 10(4), 495–518.
Doreian, P. (2009) Positional Analysis and Blockmodeling. In Meyers, R.A. (ed.), Encyclopedia of
Complexity and Systems Science. Springer New York, New York, pp. 6913–6927.
Fier, A., Aschhoff, B., Löhlein, H. (2006) Behavioral Additionality of R&D Public Funding in Germany. In OECD (ed.), Government R&D Funding and Company Behavior: Measuring
Behavioral Additionality. OECD Publishing, Paris.
Fitjar, R.D., Rodríguez-Pose, A. (2013) Firm Collaboration and Modes of Innovation in Norway. Research Policy, 42(1), 128–138.
Fleming, L., King, C., Juda, A.I. (2007) Small Worlds and Regional Innovation. Organization
Science, 18(6), 938–954.
Gilly, J.P., Talbot, D., Zuliani, J.M. (2011) Hub Firms and the Dynamics of Territorial Innovation: Case Studies of Thales and Liebherr in Toulouse. European Planning Studies, 19(12), 2009–2024.

92
Giuliani, E. (2013) Network Dynamics in Regional Clusters: Evidence from Chile. Research Policy, 42(8), 1406–1419.
Giuliani, E., Balland, P.A., Matta, A. (2018) Straining but Not Thriving: Understanding Network Dynamics in Underperforming Industrial Clusters. Journal of Economic Geography, 19(1), 147–172.
Giuliani, E., Bell, M. (2005) The Micro-Determinants of Meso-Level Learning and Innovation: Evidence from a Chilean Wine Cluster. Research Policy, 34(1), 47–68.
Giuliani, E., Pietrobelli, C. (2016) Social Network Analysis for Evaluating Cluster Development Programs. In Maoli, A., Pietrobell, C. and Stucch, R. (eds.), The Impact Evaluation of
Cluster Development Programs: Methods and Practices. Inter-American Development Bank, Competitiveness and Innovation Division, Washington DC.
Gnyawali, D.R., Madhavan, R. (2001) Cooperative Networks and Competitive Dynamics: A Structural Embeddedness Perspective. Academy of Management Review, 26(3), 431–445.
Gök, A., Edler, J. (2012) The Use of Behavioural Additionality Evaluation in Innovation Policy Making. Research Evaluation, 21(4), 306–318.
Gulati, R., Singh, H. (1998) The Architecture of Cooperation: Managing Coordination Costs and Appropriation Concerns in Strategic Alliances. Administrative Science Quarterly, 43(4), 781–814.
Hemmert, M., Bstieler, L., Okamuro, H. (2014) Bridging the Cultural Divide: Trust Formation in University–Industry Research Collaborations in the US, Japan, and South Korea. Technovation, 34(10), 605–616.
Hervas-Oliver, J.L., Lleo, M., Cervello, R. (2017) The Dynamics of Cluster Entrepreneurship: Knowledge Legacy from Parents or Agglomeration Effects? The Case of the Castellon Ceramic Tile District. Research Policy, 46(1), 73–92.
Kang, M.J., Hwang, J. (2016) Structural Dynamics of Innovation Networks Funded by the European Union in the Context of Systemic Innovation of the Renewable Energy Sector. Energy Policy, 96, 471–490.
Levy, R., Talbot, D. (2015) Control by Proximity: Evidence from the ‘Aerospace Valley’ Competitiveness Cluster. Regional Studies, 49(6), 955–972.
Lorrain, F., White, H.C. (1971) Structural Equivalence of Individuals in Social Networks. The
Journal of Mathematical Sociology, 1(1), 49–80.
Lowik, S., Van Rossum, D., Kraaijenbrink, J., Groen, A. (2012) Strong Ties as Sources of New Knowledge: How Small Firms Innovate through Bridging Capabilities. Journal of Small
Business Management, 50(2), 239–256.
Luukkonen, T. (2000) Additionality of EU Framework Programmes. Research Policy, 29(6), 711–724.
Maffioli, A., Pietrobelli, C., Stucchi, R. (eds.) (2016) The Impact Evaluation of Cluster
Development Programs: Methods and Practices. Inter-American Development Bank, Competitiveness and Innovation Division, Washington DC, US.
Markusen, A. (1996) Sticky Places in Slippery Space: A Typology of Industrial Districts. Economic
Geography, 72(3), 293–313.

93
McFadyen, M.A., Cannella, A.A. (2004) Social Capital and Knowledge Creation: Diminishing Returns of the Number and Strength of Exchange Relationships. Academy of Management
Journal, 47(5), 735–746.
Mizruchi, M.S., Galaskiewicz, J. (1993) Networks of Interorganizational Relations. Sociological
Methods & Research, 22(1), 46–70.
Moody, J., White, D.R. (2003) Structural Cohesion and Embeddedness: A Hierarchical Concept of Social Groups. American Sociological Review, 68(1), 103–127.
Morrison, A. (2008) Gatekeepers of Knowledge within Industrial Districts: Who They Are, How They Interact. Regional Studies, 42(6), 817–835.
Morrison, A., Rabellotti, R. (2007) The Role of Research in Wine: The Emergence of a Regional Research Area in an Italian Wine Production System. International Journal of Technology
and Globalisation, 3(2–3), 155–178.
Morrison, A., Rabellotti, R., Zirulia, L. (2013) When Do Global Pipelines Enhance the Diffusion of Knowledge in Clusters? Economic Geography, 89(1), 77–96.
Mustar, P. (1997) How French Academics Create Hi-Tech Companies: The Conditions for Success or Failure. Science and Public Policy, 24(1), 37–43.
Neffke, F., Henning, M. (2013) Skill Relatedness and Firm Diversification. Strategic Management
Journal, 34(3), 297–316.
Newman, M., Barabási, A.L., Watts, D.J. (2006) The Structure and Dynamics of Networks. Princeton university press.
Niosi, J., Zhegu, M. (2005) Aerospace Clusters: Local or Global Knowledge Spillovers? Industry
and Innovation, 12(1), 5–29.
Nishimura, J., Okamuro, H. (2011) Subsidy and Networking: The Effects of Direct and Indirect Support Programs of the Cluster Policy. Research Policy, 40(5), 714–727.
Owen-Smith, J., Powell, W.W. (2004) Knowledge Networks as Channels and Conduits: The Effects of Spillovers in the Boston Biotechnology Community. Organization Science, 15(1), 5–21.
Pallotti, F., Lomi, A. (2011) Network Influence and Organizational Performance: The Effects of Tie Strength and Structural Equivalence. European Management Journal, 29(5), 389–403.
Pizarro, N. (2007) Structural Identity and Equivalence of Individuals in Social Networks: Beyond Duality. International Sociology, 22(6), 767–792.
Powell, W.W., White, D.R., Koput, K.W., Owen‐Smith, J. (2005) Network Dynamics and Field Evolution: The Growth of Interorganizational Collaboration in the Life Sciences. American
Journal of Sociology, 110(4), 1132–1205.
Rivera, M.T., Soderstrom, S.B., Uzzi, B. (2010) Dynamics of Dyads in Social Networks: Assortative, Relational, and Proximity Mechanisms. Annual Review of Sociology, 36(1), 91–115.
Robins, G., Alexander, M. (2004) Small Worlds Among Interlocking Directors: Network Structure and Distance in Bipartite Graphs. Computational & Mathematical Organization Theory, 10(1), 69–94.
Rocha, H.O., Sternberg, R. (2005) Entrepreneurship: The Role of Clusters Theoretical Perspectives and Empirical Evidence from Germany. Small Business Economics, 24(3), 267–292.

94
Sternberg, R. (2014) Success Factors of University-Spin-Offs: Regional Government Support Programs versus Regional Environment. Technovation, 34(3), 137–148.
Storper, M., Harrison, B. (1991) Flexibility, Hierarchy and Regional Development: The Changing Structure of Industrial Production Systems and Their Forms of Governance in the 1990s. Research Policy, 20(5), 407–422.
Street, C.T., Cameron, A. (2007) External Relationships and the Small Business: A Review of Small Business Alliance and Network Research. Journal of Small Business Management, 45(2), 239–266.
Stuart, T.E., Podolny, J.M. (1996) Local Search and the Evolution of Technological Capabilities. Strategic Management Journal, 17(S1), 21–38.
Suire, R., Vicente, J. (2014) Clusters for Life or Life Cycles of Clusters: In Search of the Critical Factors of Clusters’ Resilience. Entrepreneurship & Regional Development, 26(1–2), 142–164.
Uyarra, E., Ramlogan, R. (2012) Cluster Policy: A Review of the Evidence. NESTA Working Paper.
Uzzi, B., Spiro, J. (2005) Collaboration and Creativity: The Small World Problem. American
Journal of Sociology, 111(2), 447–504.
Vicente, J. (2017) Network Failures and Policy Challenges along the Life Cycle of Clusters. In Fornahl, D. and Hassink, R. (eds.), The Life Cycle of Clusters: A Policy Perspective. Edward Elgar Publishing, Cheltenham, UK, pp. 56–75.
Vicente, J., Balland, P.A., Brossard, O. (2011) Getting into Networks and Clusters: Evidence from the Midi-Pyrenean Global Navigation Satellite Systems (GNSS) Collaboration Network. Regional Studies, 45(8), 1059–1078.
Vonortas, N.S. (2012) Social Networks in R&D Program Evaluation. The Journal of Technology
Transfer, 38(5), 577–606.
Watts, D.J. (2004) The “New” Science of Networks. Annual Review of Sociology, 30(1), 243–270.
Wennberg, K., Lindqvist, G. (2008) The Effect of Clusters on the Survival and Performance of New Firms. Small Business Economics, 34(3), 221–241.
Wink, R. (2010) Editorial: Structural Changes in International Aeronautics Markets: Regional, Organisational and Technological Dimensions. International Journal of Technology
Management, 50(3/4), 25–29.
Woolthuis, R.K., Lankhuizen, M., Gilsing, V. (2005) A System Failure Framework for Innovation Policy Design. Technovation, 25(6), 609–619.
Zaheer, A., Bell, G.G. (2005) Benefiting from Network Position: Firm Capabilities, Structural Holes, and Performance. Strategic Management Journal, 26(9), 809–825.
Zuliani, J.M. (2008) The Toulouse Cluster of On-Board Systems: A Process of Collective Innovation and Learning. European Planning Studies, 16(5), 711–726.

95
Chapter 3 – Do R&D diversification
policies change the cognitive structure
of knowledge networks? Evidence from
France using a meso-structural
approach
Abstract: National authorities have implemented R&D diversification policies in order to foster the
emergence of new topics, thus developing new markets and increasing the competitiveness and
resilience of R&D systems. This work explores the effects of diversification – i.e., the combination
of knowledge from different sectors of activity – on knowledge networks. It proposes a new
methodology for the identification of network meso structures, aimed at improving the detection of
their structure and of their main research topics. Using data on collaborative research projects
from funding program FUI, we analyse 31 research networks by activity sectors and cohorts. We
find that diversification incentives are actually associated to the emergence of well-integrated
diversified topics. However, there is no evidence of an effect of these policies on the enlargement of
knowledge networks’ portfolios of topics. Additionally, the effect of diversification policies on the
emergence of diversified topics is unequal across sectors. This suggests that more “surgical” measures (best suited to the technological nature or cycles of clusters and productive sectors) might
actually be needed.
Keywords: R&D diversification policies; cross-sectoral collaboration; meso-structural analysis; knowledge network and communities; place-based methodology
JEL codes: D85; O25; O30
This chapter is a single authored working paper which will be submitted for publication in the next few months. I thank "France Stratégie" for kindly providing data that have contributed to the elaboration of the database used in the analyses of this chapter.

96
3.1. Introduction
In order to improve the competitiveness and resilience of local and national innovation systems,
R&D policies have supported inter-cluster/inter-regional collaborations (Oxford Research As,
2008). Among these policies, cross-sectoral incentives for collaboration have become central,
because the combination of unrelated knowledge and technologies is considered as a source of
innovation, providing new products and solutions, and thus improving competitiveness (Porter,
1998; Boschma and Frenken, 2012; Lämmer-Gamp et al., 2014). Hence, both local and national
authorities have increasingly tended to fund R&D programs for collaborative projects targeting
cross-sectoral collaborations among clusters’ participants, with the aim of fostering the emergence
of diversified research topics (Uyarra and Ramlogan, 2012; Broekel, 2015).
This important policy turn gives rise to a number of questions. Do cross-sectoral collaborations
really generate new research topics? If so, do these new research topics enlarge existing portfolios?
And do diversification policies equally impact all technological and knowledge systems?
The rise of diversification policies echoes research on the critical role of relatedness (Frenken et al.,
2007; Hidalgo et al., 2007; Hidalgo et al., 2018). The principle of relatedness states that the
emergence of new products, technologies, industries, or research topics depends on the productive
and/or innovation resources that are already present in that geographic area. For example, mapping
the U.S. “technology/knowledge space” using patent data, Kogler et al. (2013) show that cities are
more likely to develop a technology class when they already have expertise in related technologies.
However, some scholars have pointed out that the link between relatedness and the emergence of
new technologies and knowledge is not homogeneous. Concretely, the probability of successful
emergence is higher when they are related to core or more cohesive parts of the
technology/knowledge space (Boschma et al., 2014; Essletzbichler, 2015). Moreover, the diffusion
of new topics for market changes contributing to systems’ lifecycles requires interactions and
overlaps between emerging and matures mature topics (Crespo et al., 2014; Crespo et al., 2016). In
addition, the types of proximity existing among innovative actors do play a major role in shaping
collaboration (Boschma, 2005; Bouba-Olga and Grossetti, 2008; Ozman, 2009), and an especially
relevant role is played by cognitive proximity (Nooteboom et al., 2007). This is a central issue for
cross-sectoral collaborations, where some distance among actors is implicit. Thus, the challenge of
diversification lies in the integration of the new topics into innovation systems, which requires some
relatedness and proximity to existing systems’ technological and knowledge portfolios. However,
97
few studies address the impact of policies on diversification processes. As pointed out by Mewes
and Broekel (2020), there is a gap in the literature for what concerns the effects of R&D policies on
(related) diversification.
One of the limitations of the research that has been conducted on the emergence of new
technologies and knowledge stems from its adoption of a micro structural approach (based on
pairwise relations). Since collaboration involves mainly project consortia, adopting a meso
structural perspective (based on communities) would however be more relevant, as it would allow
drawing new insights about the integration of new, cross-sectoral research topics into innovative
systems. This is what this work endeavors to do. Its first contribution is to develop and test a novel
method of community analysis for bipartite networks (as organization-project networks), where we
combine the concepts of structural equivalence and cohesion. We first mobilize the “place-based
methodology” (Pizarro, 2007) as a suited tool to build networks of communities of actors having
structural equivalent positions, and then we apply to the resulting places’ network a “cohesive
block” analysis (Moody and White, 2003) to obtain the structure of these communities. This process
allows us to identify highly cohesive and overlapped communities, which we call “peaks”. We
show that when this methodology is applied to data on collaborative projects, “peaks” can be
interpreted as networks’ main research topics: this means that their identification provides the
research topic portfolio of the system. The second contribution of this work is to explore
empirically the effect of innovation policies on diversification processes – i.e., the effect of cross-
sectoral collaborations on sectoral research topic portfolios. To do so, we use data from
collaborative projects funded France’s national FUI program across the period 2006-2015 (18 calls
for tender). We apply our methodology on a selection of 31 networks from this database, and
explore the structure of communities. Cross-checking our results with qualitative information, we
show that the way communities are structured does provide relevant information about the micro
and macro cognitive structure of the innovation systems. Finally, we quantitatively explore the
effect of public incentives for diversification on sectors’ research topic portfolios, which allows us
drawing implications for the design of R&D policies
The remainder of the paper is organized as follows. In Section 3.2, we discuss the literature on
diversification in R&D policies and the associated concepts of relatedness and proximity. In Section
3.3 we define communities and present our methodology for identifying and analysing their
structure, and discuss the micro and macro implications of this meso approach. Section 3.4 presents
our data, and explains how we construct knowledge networks on their basis. The results of our

98
qualitative and quantitative analyses are presented in Section 3.5. Finally, Section 3.6 discusses our
results, and draws some conclusions.
3.2. Literature review: innovation, cluster policies, and diversification
Since clusters are key components of national innovation systems, governments have increasingly
implemented cluster policies to strengthen knowledge flows and collaborations in productive and
innovative agglomerations (Vicente, 2018). Cluster policies often consist of local incentives
schemes aimed at repairing network failures – viz., facilitating collaboration among actors who are
poorly integrated into local dynamics (Maffioli et al., 2016; Vicente, 2020). Such incentives may
include the creation of dedicated agencies, the implementation of support programs for the
development and integration of stakeholders, and the funding of R&D activities, esp. collaborative
projects among different types of actors (Uyarra and Ramlogan, 2012; Broekel, 2015). Although
local institutions can implement local and specific policies, national institutions generally keep for
themselves the task of establishing major lines of action as well as controlling the resources
mobilized to fund monetary incentives. Thus, cluster management combines interests and tools both
at the national and at the local level (Porter, 1998; Cooke, 2002; Brenner and Schlump, 2011).
A general aim of cluster policies is to couple and balance local cohesion with global exchange. On
the one hand, local cohesion refers to the capacity of interaction across cluster participants, and has
to do with the exchange of knowledge and resources. Cohesion implies forms of proximity between
actors, which facilitates exchange and collaboration at different levels (Boschma, 2005; Bouba-
Olga and Grossetti, 2008; Ozman, 2009). The optimal level of cohesion varies across clusters
(depending, among other things, on their technological base and life cycle stage, see: Ter Wal and
Boschma, 2011; Abbasiharofteh, 2020), and the literature suggests that too much cohesion can be as
damaging as too little (Boschma 2005; Nooteboom et al., 2007; Molina-Morales et al., 2011). On
the other hand, global exchange refers to the possibility or capacity to integrate knowledge and
resources from outside the cluster. The incorporation of new knowledge resources, including from
the outside, is essential in the innovation process (Ozman, 2009). A cohesive system without
outside interactions may not be able to develop new knowledge, falling into a technological lock-in
(Boschma, 2005; Ter Wal and Boschma, 2011). Therefore, the innovative performance of a cluster
depends on the balance between its capacity to exchange and collaborate internally and its capacity

99
to absorb new knowledge resources from outside (Giuliani and Bell, 2005; Ter Wal and Boschma,
2011).
To deal with global exchange, national authorities have encouraged inter-cluster interactions under
two main respects: research coordination and diversification (Lämmer-Gamp et al., 2014). (i)
Research coordination policies aim to develop and guide interactions among clusters with the same
technological base – i.e., in the same sector of activity. This means managing key economic sectors
both at the local and national level (Houel and Daunis, 2009), to coordinate exchanges and avoid
redundant efforts. The rationale is to combine a technological lock-in with a geographical lock-out,
where local cohesion within clusters is combined with global exchange across clusters of the same
sector (Crespo et al., 2014). (ii) Diversification policies are cross-sectoral incentives aimed at
supporting and guiding interactions across clusters from diverse activity sectors or technological
fields. Diversification consists of combining knowledge and technologies that are usually unrelated
with the goal of creating new products and services, and thus developing new or underdeveloped
market niches (Powell et al., 2005; Hidalgo et al., 2007; Boschma and Frenken, 2012). At the local
level, diversification is a suitable strategy to overcome technological cycles, avoid lock-in, and
improve the cluster resilience against exogenous changes (Crespo, et al., 2014; Boschma, 2015;
Content and Frenken, 2016; Abbasiharofteh, 2020). Additionally, since mature topics display too
much inertia, diversification is an opportunity for less central or new entrant actors – as SMEs and
public research organizations – to scale up their participation into the research system, thus
capturing new niches (Powell et al., 2005; Coenen et al., 2015; Lucena-Piquero and Vicente,
Chapter 2). The limits to diversification reside in the difficulties associated with cognitive (and
sometimes geographical) distance in collaboration, as well as in the risks inherent to the exploration
of new paths of development. R&D subsidies (esp. directed towards collaborative projects) can
compensate for the risks of diversification and induce actors to explore new activities, so they are
frequently (and often, successfully) employed to establish or strengthen relations between dissimilar
actors from different regions (Mewes and Boekel, 2020).
As said, the emergence of a new knowledge or technology is conditioned by its integration into the
innovation system. Thus, successful diversification requires some relatedness or overlap between
new research topics and central/mature existing ones.8 This means that a significant number of
actors should be able to join and participate into the development of new topics. Consequently,
8 Certainly, some cross-sectoral collaborations may represent individual successes (such as the development of a new product or new uses), but we consider that the main objective of these policies is to diversify the portfolios of topics of knowledge systems.

100
integration requires forms of proximity between new diversified topics and the rest of the
knowledge network.
In research collaborations, cognitive or technological proximity (Nooteboom et al., 2007) plays a
major role, since some closeness between actors’ cognitive bases is necessary in order to
communicate, understand, coordinate, absorb, and process new knowledge. However, other forms
of proximity can also be relevant, like geographical proximity (Boschma, 2005), organizational
proximity, or social proximity. Organizational proximity does not refer to the existence of a formal
organization, but of a common space of relations for the organization of human activities; according
to some scholars, this includes cognitive proximity (Gilly and Torre, 2000; Torre, 2009).
Organizational proximity has two dimensions: affiliation (or adherence), which means the existence
of some relational closeness determining the actors’ potential to interact or undertake joint actions,9
and similarity, which means the existence of a common reference space and knowledge. Finally,
social proximity (Alba and Kadushin, 1976) refers to overlapping membership to social circles,
reducing distance between actors10. Thus, the level of proximity required for research collaboration
is not necessarily reflected at the micro level (i.e., by dyadic proximity between all pairs of actors
involved in a project), but can more significantly be captured at the meso level.
Given that diversification policies (esp. the funding of cross-sectoral R&D projects) have a relevant
place on national and local policymakers’ agendas, it seems legitimate to ask whether these efforts
really generate integrated research topics. Since research is a collective activity and integration is
defined in terms of overlapping communities and topics, we propose to answer this question
through a meso structural approach capturing the identification of integrated topics in knowledge
networks.
9 Under this respect, Gilly and Torre (2000) refer to several forms of interactions, including agent-agent relations, but also agent-innovation relations (collective innovation activities) and innovation-innovation relations (technological complementarities). 10 Alba and Kadushin (1976) define a “social circle” as one actor’s relational environment (which is treated as a set), and calculate proximity considering both the intersection and the union of social circles. In our conceptualization, we consider sets (collaborative projects) as social circles, and we keep the idea of overlap between sets as a form of proximity, regardless of the number of actors included in the overlap or the total number of actors involved in all sets.

101
3.3. Methodology: a meso-structural approach to the study of communities
3.3.1. Communities: Structural equivalence and cohesion
According to the structural perspective (Nadel, 1957), the features and dynamics of actors are
determined by the positions they occupy in a relational network. Communities are meso structures
that act at an intermediate level between micro and macro phenomena, and properties and dynamics
that go beyond individual interactions emerge from them. In this work, we opt for a
conceptualization of communities based on both structural equivalence and cohesion.
The concept of structural equivalence early appeared in the Social Network Analysis (SNA)
literature. In short, every two actors are structurally equivalent if they connect in the very same way
to the network (Lorrain and White, 1971). A structurally equivalent position can be occupied by one
node if it has an unequal adjacent neighbourhood, or by several nodes if they share the same
adjacent neighbourhood. This implies that several actors occupying the same position have access
to the same relational resources and are under the same relational constraints – i.e., they share the
same relational environment. In view of that, scholars have generally assumed that actors sharing
the same position have similar behaviours, performance, identity, etc. (e.g. Burt, 1987; Gnyawali
and Madhavan, 2001; Pizarro, 2007; Phelps et al., 2012). As a result, structurally equivalent actors
can be seen as bearing redundant structural information, and structurally equivalent positions can be
summarized as single nodes or blocks. On that basis, it is possible to construct “meta” networks
whose nodes represent structurally equivalent positions condensing all redundant information,
which allows obtaining the “skeleton” of the original network. Structural position networks,
referred by some scholars as block-networks or image-networks (e.g. Doreian, 2009), provide a
summary of network structure, and can be studied with the usual SNA metrics. These
methodologies have long been applied in economics and other social sciences (e.g. Aarstad, et al.,
2009; Pallotti and Lomi, 2011), including in the study of innovative systems (e.g. Walker et al.,
1997; Stuart, 1998; Lucena-Piquero and Vicente, Chapter 2; Yang et al., 2019).
The concept of cohesion refers to the interconnection among actors of a set and can be easily
appreciated by the number of nodes having to be removed to observe network fragmentation
(Moody and White, 2003). In terms of interpretation cohesion is often associated to phenomena like
access to resources (social capital), rules and norms, trust, identity, or constrains (Burt, 1987;
Aarstad, et al., 2009; Smith-Doerr and Powell, 2005). Several methods have been developed for the

102
study of cohesion via the identification of communities or subgroups in a network (Wasserman and
Faust, 1994; Moody and White, 2003). In innovation studies, cohesion is mainly interpreted in
terms of knowledge spillovers (Ahuja, 2000; Reagans and McEvily, 2003; Uzzi and Spiro, 2005;
Molina-Morales et al., 2011). A common finding of this literature is that cohesion favours
innovation, and is conditioned to some forms of proximity (Boschma, 2005; Nooteboom et al.,
2007; Powell et al., 2005). In the next sub-section, we explain how we combine structural
equivalence and cohesion for the study of communities in bipartite networks.
3.3.2. Places, blocks, and peaks: Revealing the topography of networks
We propose a combination of methodologies for the study of communities in bipartite knowledge
networks. First, we apply the “place-based methodology” to obtain the network of structurally
equivalent positions – the “skeleton” of the network. Second, we apply to the network of places the
“cohesive blocks” method (also known as “k-components” method), to obtain the communities’
structure. One of the outputs of this method is a graph where the communities’ structure looks like a
topographic map, and highly cohesive communities like “peaks” of the “mountains”. For illustrative
purposes, explanations are followed by a toy example. Additionally, the role of proximity and
structural features are discussed for micro, meso, and macro levels.
3.3.2.1- Places11
R&D activities in industries take the form of collaborative projects, where actors collaborate to
reach specific goals. In SNA these situations are conceptualized as bipartite networks (also known
as affiliation networks or two-mode networks), where individuals are linked to sets by an affiliation
relationship (see Figures 3.1a and 3.1b). Formally, elements of one population (individuals or sets)
are linked to elements of the other population, but no link exists between elements of the same
population (Wasserman and Faust, 1994). An example of bipartite network is an organization-
project situation, where organizations are involved in one or several research projects.
11 For expositional convenience, this section replicates the explanations of Sections 1.3.2 to 1.3.4 in Chapter 1.

103
Figure 3.1: Affiliation, bipartite network and one-mode projection 15
Figure 3.1a represents a situation of 25 actors/organizations (points or nodes) involved in 7 research projects (sets). Some actors are involved in just one project (as S7’s actors), but other are involved in several projects - those at the projects’ intersection. Figure 3.1b is a bipartite network depicting this situation. Each actor (points) is linked to the set(s) (squares) in which it is involved. Observe that no link exists between actors or between sets. Figure 3.1c is the actor’s network projection of the bipartite network. Nodes represent actors, and two actors are linked by a tie if they belong to the same set. The clustering phenomenon is clearly observable in the case of the subgraph on the left, which correspond to the set S7. Here all actors involved on the project are linked together, forming a clique. In these projections, the degree of a node (the number of ties reaching the node) is the number of all other actors involved in the same projects.
Scholars do not usually analyse bipartite networks, but rather their projected networks. Breiger
(1974) proposed to project bipartite networks into two one-mode networks (where all nodes are of
the same type, or “mode”): 1) one network of individuals that are linked if they belong to the same
sets, and 2) one network of sets that are linked if they share the same individuals (see Figure 3.1c).
Projected networks are usually analysed using common SNA metrics.
One major problem associated to this methodology is the artificial clustering it generates (Newman
et al., 2001; Uzzi and Spiro, 2005). In the projected network of individuals, all the individuals
affiliated to a set are directly linked with one another, generating an artificial clustering effect that
can disturb classical network metrics – mainly those based on degree and community detection –
and can thus lead to misinterpretations. This problem increases as the range of sets’ sizes (i.e., the
number of individuals) widens.

104
To overcome this problem, we apply the “place-based methodology” (Pizarro, 2007) to obtain a
network of structurally equivalent positions12. In bipartite networks, every two actors are
structurally equivalent if they belong to the very same sets (Borgatti and Everett, 1992; Pizarro,
2007). Consequently, a bipartite network can be summarized by grouping structurally equivalent
actors into single nodes (called “places”), thereby creating a bipartite network of places and sets.
More formally, a bipartite network of places and sets is a network of structurally equivalent
positions, where each node represents a unique combination of affiliations to the set mode. Figure
3.2a represents the bipartite network of places and sets from our example. All organizations
participating into the same combination of projects are grouped into a place, because they occupy a
structurally equivalent position.
Figure 3.2: Places’ network 16
Figure 3.2a represents the places’ bipartite network. For illustrative purposes, this network is superposed on the original bipartite network (greyed out). Each place Pi corresponds to a unique combination of affiliations to sets (there is not two places linked to exactly to the same set(s)), and all the nodes in a place Pi are linked to the very same set(s). In Figure 3.2b the places’ network is superposed on the one-mode projection (greyed out) presented in Figure 3.1c. As we can see, structural equivalent actors occupy a place (circles in this graph), and they are linked in exactly the same way to the rest of the network. Likewise, links between places (circles) follows the links between structural equivalent positions. Thus, nodes and links of the one-mode network are summarized in the places’ network. Figure 3.2c represents the places’ network obtained from the bipartite network, where all the redundant or repetitive information of the one-mode network of Figure 3.1c is summarized. Here the degree is related to the number of unique combinations of affiliation to set(s), so the degree is a measure of the relational diversity.
12 We computed places and places’ network with the R-package "Places: Structural Equivalence Analysis for Two-mode Networks" (Lucena-Piquero, D., 2017).

105
Since a network of places and sets is a bipartite network, we can project it and obtain a network of
places linked by sets’ memberships and a network of sets linked by common places. The first one
corresponds to a network image of structurally equivalent positions. The network of places is a
summary of the projection network of individuals, where all redundant information (individuals
who are members of the same sets) is removed (see Figures 3.2b and 3.2c). Consequently, the
artificial clustering problem is now solved. Indeed, in networks of places, the projections of sets do
not form cliques (i.e., groups of nodes that are all linked to one another), because all structurally
equivalent individuals are grouped in the same places. Affiliation to a set does not necessarily mean
that the individuals within the set do actually interact with one another: for instance, in a paper co-
authored by one hundred researchers, it is evident that no author will have exchanged or worked
directly with all the others. The properties of this relation are the properties of the set: common
knowledge or cognitive proximity, a similar behaviour (they worked on the subject of the paper), a
common identity (they are the paper’s authors), or even the same reputation effect (they are authors
of this widely cited paper).
Similarly, in a network of organizations affiliated to research projects, organizations having
contributed to the very same projects will be grouped into the same place: this does not mean that
they have the same knowledge or skills, but rather that they have research capabilities or innovation
resources that can lead to the same objectives, and that are necessary for the achievement of all the
projects in which they are involved. In this sense, the organizations included in the same place
contribute equally to the innovation system, and benefit from similar outputs (e.g. access to
technologies, or reputation associated to projects’ results). Thus, structurally equivalent actors
combine the two dimensions of organizational proximity (that includes cognitive proximity), i.e.
affiliation and similarity (Gilly and Torre, 2000). Consequently, in the network of places extracted
from a knowledge network, nodes can be interpreted as unique combinations of innovation
resources involved in common projects, which evidences their proximity.
3.3.2.2- Cohesive blocks
The second step of our analysis consists of the application of the “cohesive blocks” methodology to
networks of places. Proposed by Moody and White (2003), this methodology reveals the nested
hierarchical structure of the subsets (communities) of a network on the basis of the nodes’

106
connectivity.13 As in a topographic profile, the network is represented as nested slices of k-cohesive
blocks, where k refers to the number of vertices that need to be removed in order for the subgraph to
be disconnected. The highest value of k for a network corresponds to the most cohesive subgraph.
Because it is a nested system, a k-block is integrated into a bottom (the parent block), where the
members of the k-block are connected with a lower degree of connectivity to the members of its
parent block. As we have argued before, in bipartite networks the use of cohesive blocks (like other
cohesive measures based on connectivity or density) is not exempt from difficulties. The clustering
associated to one-mode projections can lead to misinterpretations. However, the application of
cohesive blocks to networks of places avoids this problem.
Previous works using the “cohesive blocks” method have focused on the most cohesive blocks of
the net, called the “elites” (Powell et al., 2005; Lucena-Piquero and Vicente, Chapter 2). These
blocks contain the most “influential” actors of the network, because they have a great coordination
capacity: since this methodology provides a nested structure, the members of the most cohesive
blocks are close to all the other actors of the network, thus forming its cores. While the study of
“elites” provides important information about the macro structure of the network and its key actors,
other communities with lower cohesion levels are not taken into consideration, although they can be
relevant at the “local” structural level. In our study, we include both the blocks with the highest
level of cohesion in the network and the blocks that show a higher level of cohesion within the sub-
graphs in which they are hosted. We call these blocks the “peaks” of the network.
3.3.2.3- Peaks
We define “peaks” as blocks that are cliques and that have a higher cohesion than the other possible
blocks hosted in the same bottom. More formally, a peak is an l-block hosted in a k-block, where (a)
the peak is a complete subgraph (a clique), (b) there are no blocks hosted in the peak, and (c) and l
> j > k, being j the minimum cohesion level possible for blocks hosted in the k-block. We also
identify as peaks all the blocks with the maximal cohesion level of the network. In short, a peak is a
community that shows a higher level of cohesion than its immediate environment. Additionally, we
consider that a peak must have a cohesion level equal or higher than 3, which implies that the peak
must have more than four nodes.
13 For the cohesive blocks analysis we use the R-module Igraph, “The Igraph software package for complex network research” (Csardi and Nepusz, 2006).

107
Figure 3.3: Cohesive blocks of places’ network 17
The result of the cohesive block analysis of the places’ network is represented in Figure 3.3a. The graph on the top is the output of the analysis, where blocks are represented by dots on the x axis and the y value is the cohesion level of the block. On the bottom, we have drawn the blocks from the places’ network. Block 5 is the most cohesive block of the net, and it is a peak (dot in black). Its cohesion level is 4, and it has 5 nodes which form a clique. Block 4 also forms a clique, but its cohesion level is 2, so it is not considered as a peak. Block 5 is hosted in block 3, which has a cohesion level of 2 and 7 nodes. In turn blocks 5, 4, and 3 are hosted in block 2, which has a cohesion level of 1 and 11 nodes. Block 1 contains the entire network, and its cohesion level is 0 because the graph is not fully connected. In Figure 3.3b, we have overlapped the sets’ diagram with the places’ network. Note that each set(s) combination is occupied by one node, a place. The comparison between the cohesive block structure of Figure 3.3a and Figure 3.3b reveals that set S1 is responsible for the cohesion of block 5, which is a peak. Additionally, the peak is at the intersection between S1 and sets S2, S3, and S4.
The combination of the two methodologies (places and cohesive blocks) allows capturing some
interesting structural phenomena associated to the overlap of sets and the connectivity among
actors. We shall argue that these have relevant implications if interpreted in terms of proximity and
relatedness. But before doing so, we need to introduce another concept, the “peak’s main
project(s)”, which connects the micro and macro levels.

108
3.3.3. Micro and macro properties of the network
At the micro level, since a peak is a clique, there is at least one set responsible for the connectivity
of the peak (it connects every actor of the peak). This the “peak’s main set”, or (in our application
to collaborative projects) the “peak’s main project(s)”.14 Other projects can contribute to the
connectivity of the peak, but a peak’s main project(s) is common to all the actors of the peak.
Besides, there are projects that overlap with the peak’s main project(s), thus being responsible for
the connectivity between the peak and other nodes in bottom blocks. A node at the intersection
between the peak’s main project(s) and other project(s) is a place occupied by at least one actor
involved in all these projects. In terms of interpretation, a peak’s main project can therefore be seen
as the combination of the innovation resources also required in other projects (those that connect the
nodes in the peak to other nodes in bottom blocks) – meaning that there is some degree of
relatedness between the peak’s main project(s) and the other projects. As for proximity, all actors of
a peak are close to one another, since they share the research subject and goals of the peak’s main
project(s); projects overlapping with the peak’s main project(s) are close to this one since they share
innovation resources; and since a peak is at the top of a nested system, its nodes are close to many
other nodes from bottom blocks – meaning that the peak’s main project(s) share(s) innovation
resources that are also close to these involved in many other projects at bottom blocks. From this it
follows that peaks’ main projects are projects that are well-integrated into the knowledge network
projects, as they are related and (cognitively) close to most other projects. This is well visible in
Figures 3.3a and 3.3b: block 5 is the only peak of the network, and S1 can be identified as its main
project because it is responsible for the connectivity inside the peak, and all actors in the peak are
involved into it. Project S1 overlaps with projects S2, S3, and S4, which connect the nodes in the
peak’ main project directly to nodes in blocks 3 and 4, and indirectly to the rest of the nodes in
block 2. Furthermore, a “diversified peak” is a peak whose main project(s) is cross-sectorial.
All this allows us to infer that the subjects present in the peaks’ main projects must be
representative of the subjects present on bottom blocks. Consequently, we consider the subjects of
the peaks’ main projects as main research topics of the knowledge network. However, two caveats
are of order. The first one is that other forms of proximity than cognitive proximity can play a major
role in determining the main research topics of a system. For example, in a sectoral knowledge
network with several peaks (so, several main topics), two structurally distant peaks can be very
cognitively close, as other forms of proximity (esp. geographic proximity) can strongly impact the
14 Usually in our dataset there is only one peak’s main project, but for generalization purposes we do not exclude the possibility that several peak’s main projects may exist.

109
configuration of communities, thus generating some research redundancy in the system. The second
caveat is that not all peaks have the same importance for the network in terms of closeness,
influence, or coordination capacity. The importance of a peak depends on (a) its relative cohesion
level (with regard to bottom blocks which also host other communities), and (b) the number of
peaks hosted in a common parent block. Thus, a unique highly cohesive peak will be more relevant
for the network than a relatively lowly cohesive peak which is hosted in a bottom block with many
other peaks.
At the macro level, the communities’ structure provides relevant information about some properties
such as the hierarchy, the disassortativity.15 These properties reveal whether one or several small
subsets of actors which are better connected to the rest of the network than the other nodes. For
some networks, as in production and innovation clusters, a significant level of hierarchy can be
associated to the level of maturity of the system (Crespo et al., 2014; Suire and Vicente, 2014;
Crespo et al., 2016; Abbasiharofteh, 2020). Actors in the well-connected subset and those that are
close to them (usually local big firms) can adsorb knowledge from the periphery or poorly
connected parts of the network, and also have the capacity to influence and coordinate production in
the system (Verspagen and Duysters, 2004; Crespo et al., 2016;). However, hierarchical systems are
at risk of lock-in (Ter Wal and Boschma, 2011; Crespo et al., 2014; Boschma, 2015). The study of
communities’ nested structure provides information about the level of hierarchy and the presence of
relevant well-connected subsets of actor (cores) that influence, coordinate, and guide the network's
activities. Thus, the number of peaks of a network as well as their cohesive level reveals
information about the hierarchy, the assortativity, and the core(s)-periphery structure. For example,
a large network with only one high cohesive peak can be considered as hierarchical and
disassortative, thus with a core-periphery structure. On the contrary, a network with several low-
cohesive peaks can be considered as low-hierarchical, assortative, and multi-cored.
In sum, applied to bipartite knowledge networks, our methodology can provide relevant information
about the micro relational dynamics among organizations and the macro structural properties of the
network. In the next section, we move on to apply this methodology to our dataset.
15 Hierarchy refers to the distribution of the nodes’ degree in a network: a network is hierarchical if a small number of actors have a significantly higher degree than most actors in the network. Disssortativity is a measure of similarity usually based on node degree correlation: a network is disassortative if nodes tend to be connected to actors with a very different degree.

110
3.4. Data: France’s FUI program for the funding of cluster activities
As many countries around the World, France has developed specific policies in order to foster the
development of local productive and innovative clusters. In 2005, the French government launched
the “Pôles de competitivité” policy (Fontagné et al. 2013). The pôles are local associations aimed at
guiding industrial clusters, improving their competitiveness, and managing spillovers across local
actors. The pôles can develop their own actions and provide support to local development through
various tools, including direct funding or access to national funding programs (Brossard and
Moussa, 2014). The main national funding program for clusters is the FUI16 program, which
supports collaborative R&D projects. To access funding, consortia must be certified by at least one
pôle de competitivité. Through the project selection process, national authorities can thus implement
major policy lines impacting both the local (pôle) level and the national one (Uyarra and Ramlogan,
2012; Lucena-Piquero and Vicente, Chapter 2).
Since 2005, national cluster policy has been shaped around four major guidelines: two of these are
aimed at including actors (like public research organizations and SMEs into the R&D activity of the
pôles, while the other two are aimed at fostering collaborations across clusters. The first of these
last two guidelines aims to foster collaboration across clusters in the same sector of activity, in
order to coordinate and give coherence to research at the national level, while the second one to
foster collaborations across clusters in different sectors of activity, in order to diversify research and
stimulate technical change within clusters.
Here, we focus on the last two policies and we use the sectors as aggregated units of reference. For
the period 2006-2015, the official classification used by French government includes 14 sectors of
activity, and each pôle is associated with at least one of these sectors. Our data gather all the
projects funded by the FUI program during 2006-2015 (18 calls for tender). This dataset include
1,408 funded projects and 6,826 actors (identified by the SIRET code in the French industry
classification). For each project, we have the name and the sectors of activity of the pôles that
certified it.
In order to reconstruct French knowledge networks from this dataset, we class data by cohorts and
sectors. Concerning cohorts, we split the ten-year period into 4 subperiods that are broadly similar
in terms of time and number of projects. Concerning sectors of activity, the French government
associated sectors to poles, but not to projects. Therefore, we develop a procedure to classify each 16 Fonds Unique Interministériel.

111
project by sector(s). For this, we use the government’s sectoral classification of the pôle(s)
certifying the project and the NAF codes17 of the actors involved in the project. We double-check
this with information on the subjects of projects whenever available from the Internet. Using this
classification, we end up with 1,002 mono-sectoral projects and 406 cross-sectoral projects. Table
3.1 provides information on each of the sectors by cohort.18
Table 3.1: Distribution of projects by sector-cohort networks 3
Sectors # Projects Cohort 1 # Projects Cohort 2 # Projects Cohort 3 # Projects Cohort 4
Aerospace 32 44 41 45
Agriculture/Agri-food 26 33 31 40
Consumer Goods 6 6 12 11
Bioresources 4 6 11 15
Biotechnology / Health 33 37 46 37
Chemistry 2 6 9 15
Ecotechnologies / Environment 8 13 26 31
Energy 13 25 33 47
Engineering / Services 10 22 39 45
Materials 19 44 51 71
Microtechnology / Mechanics 13 33 45 69
Optics / Photonics 6 13 11 16
ICT 101 115 131 151
Transports 41 58 43 40
Crossing our 4 cohorts with our 14 sectors, we construct 56 networks. In order to avoid
inaccuracies, however, we remove all small networks – i.e., all networks (25) including less than 25
projects and less than 40 places (nodes). We therefore end up with a selection of 31 networks,
which we use for the empirical analysis.
17 The Nomenclature d'Activité Française or NAF code is a French codification system for economic and social actors. The code has a tree system, and we have used the digit-3 level for this process, which contains 272 classes. Our database contains actors in 225 of these classes. 18 Note that each cross-sectorial project is counted in each of its sectors.

112
3.5. Analysis and results
3.5.1. Qualitative analysis of the sectors
In this section, we present a small selection of the cases (networks) that we have submitted to a
mixed quantitative/qualitative analysis,19 in order to show the micro and macro properties unveiled
by our meso structural methodology. First, we describe one selected network – “Transports sector”
for cohort 1 – and provide some details about its micro and macro relational and cognitive structure.
Second, we describe the evolution of this sector across the 4 cohorts. Third, we briefly present three
other relevant cases in order to highlight the diversity of structures of our sample. Finally, we
discuss some observed phenomena regarding the identification of research topics.
The network “Transports for cohort 1” is constituted by 242 organizations involved in 41 projects.
Applying the methodology described in Section 3.3, we obtain a network of 90 places structured in
18 cohesive blocks, where the highest cohesion level is 10. In this case, 3 peaks have been
identified, and an interesting feature is that the two most cohesive peaks are close to each other,
sharing the same parent block.
Figure 3.4: Transports – Cohort 1: Cohesive block structure 18
Figure 3.4 shows the cohesive block structure. Blocks are identified on the x axis, and the y gives their cohesion level. Peaks are identified by black dots. For each peak, the peak’s main project(s) is noted. A short
19 In order to verify and validate the proposed methodology, we have actually analyzed a large number of networks. The analysis of other networks is available under request.

113
description of the main topic and the poles involved is available on the side of the chart. In order to highlight the parent blocks we have drawn lines inside the chart, such that all blocks above a line are hosted in the concerned block.
To describe some micro structural and cognitive properties of the network, it is convenient to focus
on peak 18. This peak has a cohesion level of 10 and is composed by 11 places. The peak’s main
project is NadiaBio, which is focused on the development of engines for biofuels. This project is
responsible for the internal connectivity of the peak since all the 11 places are involved in it.
Among the 15 organizations involved in NadiaBio, 5 participate only into this project, so they are
grouped into one single place. The 10 other places are composed by single organizations involved
into the peak’s main project as well as other ones. For example, one of these places is a public
research lab (IFP in Rueil-Malmaison) which is involved in the projects NadiaBio, BioCarbMat,
Flex Fuel 3G, HYHIL and SIMBA. In terms of proximity, these 5 projects are close since they all
need the innovation resources provided by this lab.
The places in a peak are connected to those in the bottom block by projects that overlap with the
peak’s main project, and in some cases these projects contribute to the connectivity of the peak (see
Figure 3.3a). The project NadiaBio overlaps with other 15 projects. Most of them have subjects that
are clearly cognitively close to NadiaBio,20 and are also certified by the pôle Mov’eo (located in the
Normandy and Île-de-France regions), which suggests the existence of other forms of proximities
(esp. geographic). Therefore, a detailed analysis of the projects and their overlaps on the nested
systems shows that peaks’ main projects’ subjects are representative of their relational environment
and can be considered as main topics of the network. Similarly, peaks’ main projects are usually
certified by the same pôle(s). The analysis also confirms that the differences in the structural
properties of peaks correspond to the ones in cognitive and/or pole(s)’s affiliation. The three peaks
in Figure 3.4 correspond to well-differentiated main topics: “mechatronics”,i.e. engineering for both
electrical and mechanical systems (peak 17); improvements in engine and transmission to reduce
pollution (peak 18); and eco-friendly materials for automobile components (peak 11). As it can be
seen, the topics of peaks 17 and 18 are cognitively similar since these peaks are structurally close,
while the topic of peak 11 is more different since it is structurally more distant. We must add that
20 As EGRBoost (improvement of EGR valve for less pollution), REDNOX (pollution reduction catalyst), BioCarbMat (materials for biofuel engines), HYHIL (Engine bench software for hybrid vehicles), Flex Fuel 3G (Engines for biofuels) or SIMBA (Simulation of airflow in engines). All data concerning places, peaks, and blocks composition is available under request.
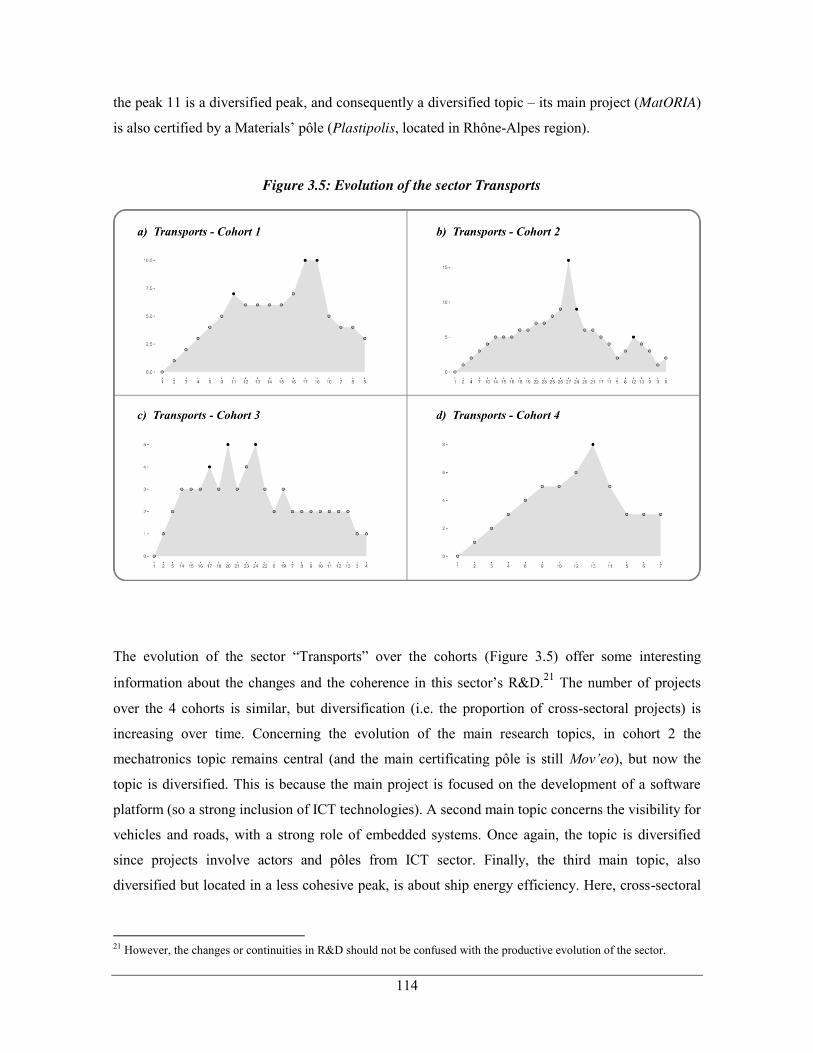
114
the peak 11 is a diversified peak, and consequently a diversified topic – its main project (MatORIA)
is also certified by a Materials’ pôle (Plastipolis, located in Rhône-Alpes region).
Figure 3.5: Evolution of the sector Transports 19
The evolution of the sector “Transports” over the cohorts (Figure 3.5) offer some interesting
information about the changes and the coherence in this sector’s R&D.21 The number of projects
over the 4 cohorts is similar, but diversification (i.e. the proportion of cross-sectoral projects) is
increasing over time. Concerning the evolution of the main research topics, in cohort 2 the
mechatronics topic remains central (and the main certificating pôle is still Mov’eo), but now the
topic is diversified. This is because the main project is focused on the development of a software
platform (so a strong inclusion of ICT technologies). A second main topic concerns the visibility for
vehicles and roads, with a strong role of embedded systems. Once again, the topic is diversified
since projects involve actors and pôles from ICT sector. Finally, the third main topic, also
diversified but located in a less cohesive peak, is about ship energy efficiency. Here, cross-sectoral
21 However, the changes or continuities in R&D should not be confused with the productive evolution of the sector.

115
projects are between Transport and Energy sectors, and the main certifying pôles of this topic are
Mer Bretagne (Bretagne and Pays-de-la-Loire regions) and EMC2 (Pays-de-la-Loire region).
Also, three main topics are identified in cohort 3, where two are diversified. One of the main topics
is about the improvement of engines (light and heavy vehicles) to reduce pollution, and the pôles
involved are mainly Mov’eo and ID4CAR (Bretagne, Poitou-Charentes and Pays-de-la-Loire
regions). The second main topic concerns embedded systems, and it involves actors and pôles from
ICT sector. The third main topic is also diversified, and focuses on new materials – composites –
for truck cabs in order to reduce weight and vibrations.
Finally, cohort 4 network is quite atypical. While diversification is high, only one peak is identified
and it is not diversified. This main research topic focuses on mechanical performance (friction and
vibration) of the engine and transmission – mainly for heavy vehicles. The main pôles are LUTB
(Auvergne-Rhône-Alpes region) and Mov’eo.
Although the description of peaks’ subjects as main topics is interesting, here we use it only to show
that there is a correspondence between the relational and cognitive structure, thus validating the
proposed method. In relation to our research questions, what is of interest is the structure of the
networks. Figures 3.6a-c represent the structure of 3 networks.
Figure 3.6: Illustrative cases of cohesive block structures 20
The comparison of these three structures highlights some significant differences. The Transports’
network for cohort 4 is a single-core network, while the other two are multi-core. In the Materials’
network for cohort 3 the peaks – cores – have similar cohesive levels, and their closeness evidence
some overlap, while the ICT’s network for cohort 2 exhibits more differences regarding the

116
structural importance of the peaks. This last structure shows some complexity since it combines
close and distant peaks. In terms of proximity, in the ICT’s network the relation between the
structural position of peaks and their cognitive distance – the similarity of topics – is clear. Peaks
that are close (e.g. the two peaks on the right or the two peaks on the top) have close topics, and are
more distinct from the more distant peaks. On the Materials’ network this relation is less evident.
Because the topics are quite different, for any pair of nearby peaks we do not easily identify what
the similarities of the topics are. The transversality of the sector may explain this apparent
dissimilarity since some knowledge and technologies can have a wide range of applications.
In sum, the qualitative analysis shows the suitability of the proposed meso methodology for
community analysis to identify the well-integrated topics of the sectors, featuring relatedness and
proximity among knowledge and technologies.
3.5.2. Diversification policies and research topics emergence
In this section we suggest a quantitative approach to the effects of diversification policies, where
diversification is defined as the proportion of cross-sectoral projects in a network. We test if
diversification policies (a) generate diversified topics in sector’s topics portfolio – measured by the
number of diversified peaks; (b) enlarge sector’s topics portfolio – measured by the number of
peaks; (c) impact equally all sectoral knowledge networks.
For the two first questions we perform two very simple linear regression models. We check if the
diversification part is related to the number of diversified peaks (Model 1) and to the overall
number of peaks (Model 2) by sector. In both models we include the size of the network – measured
by the number of nodes – as control variable, and we scale all variables. In order to avoid biases, we
remove from our sample the ICT’s networks because they are significantly bigger than the other
networks. We thus end up with 27 observations.

117
Table 3.2: Regression models results of diversification impact 4
Model 1
# Diversified Peaks
Model 2
# Peaks
Constant 1.255e-16
(0.1396)
6.964e-17
(0.1867)
Diversification Part 0.6692 ***
(0.1479)
0.3153
(0.1978)
# Places 0.1335
(0.1479)
0.1113
(0.1978)
Multiple R-squared 0.5146 0.131
Adjusted R-squared 0.4742 0.05855
Model p-value 0.000171 0.1855
Observations 27 27
Note: Standard errors are reported in parentheses. *** indicates significance <0.001
The results show that there exists a significant statistical relation in Model 1 but not in Model 2.22
Thus, the more cross-sectoral projects in a network, the greater the number of diversified topics, but
the total number of topics in the portfolio does not increase. So, when policy makers foster cross-
sectoral projects, some of these projects will usually be well-integrated, thus becoming diversified
topics. However, diversified topics are not added to the sector’s own topics, enlarging sector’s topic
portfolios, but rather seem to take the place of them.
To further investigate the link between the support to cross-sectorial projects and the presence of
both sectoral and diversified main topics, we perform a Hierarchical Cluster Analysis (HCA) across
the 31 networks in order to group cases according to the diversification part, the number of peaks,
and the proportion of diversified peaks – number of diversified peaks regarding the overall number
of peaks. The values of these measures for each network are available in the Appendix A.3. In
HCA, the observations are grouped according to their level of similarity, measured by the Euclidean
distance. Figure 3.7 represents the dendrogram of the HCA.
22 We also performed several Count Regression Models in order to confirm these results. The lack of statistical relation of Model 1 has been confirmed by a Poisson regression model. A Zero-inflated Poisson regression confirmed Model 2 results.

118
Figure 3.7: Hierarchical Clustering Dendrogram 21
From top to bottom, the first level (height level 5) divides the sample in two groups. On the left,
there are the networks without diversified peaks, and on the right, the networks with at least one
diversified peak. The group on the left is further divided into two groups, where the variable that
makes the difference is the diversification part. Of these two groups, the one of the right (Block 2)
contains the networks without diversified peaks and low diversification part. As expected, all the
networks of the first cohort are included here, and some networks of the second and third cohort
(sectors Aerospace, Agriculture/Agri-food and Biotechnology/Health). All these networks have a
significantly lower diversification part than all the other networks of the analysis. Block 1 contains
networks without diversified peaks and with a high diversification part, the three from cohort 4, so
these cases can be classified as atypical since the diversification part does not lead to diversified
main topics. Here, the network of Transports’ sector is an exceptional case since it has diversified
main topics in all the cohorts except in this one, which has a high diversification part (0,800). Note

119
that for the sectors Agriculture/Agri-food and Biotechnology/Health the diversification part does
not lead to diversified topics. Similarly, the three first cohorts of Aerospace sector have no
diversified topics and have a low diversification part.
The big group on the right is also divided in two other groups, where the group of the left – (Block
3) contains the last three cohort of the ICT sector. Here, both the diversification part and the
proportion of diversified peaks seem to play a role in the differentiation, since ICTs’ networks are
characterized by a low diversification part and a low proportion of diversified peaks. The group on
the right is further divided into two groups according to the number of peaks, where Block 4 is
characterized by a high number of them. Note that all Materials’ networks of the selection are in
this group. On the contrary, Block 5 is characterized by networks with less number of peaks. From
this group, we highlight the networks of Transports for cohort 2 and Microtechnology/Mechanics
for cohort 3 because all their peaks are diversified ones.
This Hierarchical Cluster Analysis highlights some interesting features. Even if there is statistical
evidence of the link between the diversification part and the number of diversified topics, this link
is not always expressed. Agriculture/Agri-food and Biotechnology/Health sectors have not cross-
sectoral main topics, independently of the diversification part. Certainly, cross-sectoral projects can
overcome some problems and/or rise on some products or services that contribute to the
development of the sectors, but there is no evidence that they lead to deep structural and
cognitive/technological changes. Similarly, these cross-sectoral projects may be key to the other
sectors involved, leading to diversified topics, but not for these two sectors. Thus, to support cross-
sectoral projects involving Agriculture/Agri-food and Biotechnology/Health sectors makes sense,
however it cannot be expected that these projects contribute to the emergence of new research
topics.
Materials sector is also an interesting case since its networks show a relatively high diversification
part, high number of peaks, and high diversified peaks proportion. The high number of peaks shows
that the research is not focused on few and central topics guided by a reduced number of actors, but
on several ones. Both the diversification part (between 0,569 and 0,732) and the proportion of
diversified peaks (between 0,571 and 0,667) suggest that the sector has the ability to collaborate
with other sectors while integrating the emergent topics. So, the sector seems to have a “natural”
capacity (or necessity) to collaborate with other sectors, and to easily integrate some cross-sectoral
topics, all while keeping sectoral ones.
120
In sum, the HCA shows that sectors have an unequal reactivity to cross-sectoral projects. Thus, the
support to cross-sectoral projects can lead to well-integrated cross-sectoral topics, but the
differences suggest the need of more “surgical” measures to drive the evolution of research in
sectors.
3.6. Discussion and conclusion
National and regional R&D policies have evolved into diversification policies with the aim of
generating new products and improving the resilience of innovation systems. Amid these policies,
cross-sectoral collaboration incentives across clusters have become central to foster the
diversification of topic’s portfolios and technologies. The aim of this paper was to test the
effectiveness of such diversification policies in the mid-term on the basis of a database on publicly-
funded collaborative R&D projects in France.
In order to deal with this issue, we have proposed a novel meso-structural methodology of
communities’ analysis for bipartite knowledge networks – as project-based networks – based on
structural equivalence and cohesion. The “place-based” methodology merge actors with equivalent
contributions to knowledge networks, thus overcoming the artificial clustering problem and
providing the “skeleton” of the network. The “cohesive blocks” methodology unveils the nested
communities’ structure, allowing the identification of local highly cohesive and overlapping
communities – the peaks. The combination of both methodologies reveals both micro dynamics –
how actors and their innovation resources are related – and macro properties – the structure of the
whole network.
A relevant feature of this meso-structural methodology is that it allows studying socio-cognitive
knowledge structures without systematic qualitative data on actors (e.g. innovation resources or
activity domain) and projects (e.g. main objectives or outputs). In other words, since some
proximity – mainly cognitive – is required to collaborate, the methodology provides the topics’
portfolios of knowledge networks (among other results) using only actor-project affiliation data.
This is because the methodology conceptualizes the proximity in terms of position and contribution
to collective action – rather than in individual attributes – thus linking relational to cognitive
structure.

121
An analysis of France’s FUI French funding program (from 2006 to 2015) through this meso-
structural methodology suggests that diversification policies – through cross-sectoral project
funding – successfully generate diversified topics. However, these new topics do not enlarge
sectors’ topic portfolios, and the effect of diversification policies is unequal across sectors. These
results raise a number of issues. First, diversification policies appears to use a “blind force”
strategy, funding a high number of cross-sectoral projects (for 15 of the 31 networks more than half
of the projects are cross-sectoral, reaching a maximum of 84%). Certainly, some cross-sectoral
projects can be ill-integrated in some of the sectors but well-integrated in others. Similarly, not all
cross-sectoral projects are intended to be developed as topics, but rather to provide solutions to
specific problems. However, more “surgical measures” may be considered to select projects
according to the objectives of diversification policies. Second, the FUI program appears to apply a
“one-size-fits-all” strategy, with two main implications. The first concerns the “nature” or
technological base of the sector, since not all sectors react equally to the presence of cross-sectoral
projects in order to develop well-integrated diversified topics. It may be appropriate to go deeper
into the characteristics of each sector, in order to better understand this phenomenon and thus to be
able to better target policies. The second point concerns the sectors’ lifecycles and the role of
diversification for each phase. Here, doubts arise about the advisability of fostering diversification
in all sectors, without awareness of the possible undesirable effects that may be generated. In the
end, acquiring greater knowledge of the situation in each sector may be useful in designing more
appropriate actions.

122
References of the Chapter 3
Aarstad, J., Haugland, S.A., Greve, A. (2010) Performance Spillover Effects in Entrepreneurial Networks: Assessing a Dyadic Theory of Social Capital. Entrepreneurship Theory and
Practice, 34(5), 1003–20.
Abbasiharofteh, M. (2020) Endogenous Effects and Cluster Transition: A Conceptual Framework for Cluster Policy. European Planning Studies, 28(12), 1–24.
Ahuja, G. (2000) Collaboration Networks, Structural Holes, and Innovation: A Longitudinal Study. Administrative Science Quarterly, 45(3), 425–455.
Alba, R.D., Kadushin, C. (1976) The Intersection of Social Circles: A New Measure of Social Proximity in Networks. Sociological Methods & Research, 5(1), 77–102.
Borgatti, S.P., Everett, M.G. (1992) Regular Blockmodels of Multiway, Multimode Matrices. Social
Networks, 14(1), 91–120.
Boschma, R. (2005) Proximity and Innovation: A Critical Assessment. Regional Studies, 39(1), 61–74.
Boschma, R. (2015) Towards an Evolutionary Perspective on Regional Resilience. Regional
Studies, 49(5), 733–751.
Boschma, R., Balland, P.A., Kogler, D.F. (2014) Relatedness and Technological Change in Cities: The Rise and Fall of Technological Knowledge in US Metropolitan Areas from 1981 to 2010. Industrial and Corporate Change, 24(1), 223–250.
Boschma, R., Frenken, K. (2012) Technological Relatedness and Regional Branching. In Bathelt, H., Feldman, M. and Kogler, D.F. (eds.), Beyond Territory. Dynamic Geographies of
Knowledge Creation, Diffusion and Innovation. Routledge, pp. 64–81.
Bouba-Olga, O., Grossetti, M. (2008) Socio-Économie de Proximité. Revue d’Économie Régionale & Urbaine, octobre(3), 311.
Breiger, R.L. (1974) The Duality of Persons and Groups. Social Forces, 53(2), 181–190.
Brenner, T., Schlump, C. (2011) Policy Measures and Their Effects in the Different Phases of the Cluster Life Cycle. Regional Studies, 45(10), 1363–1386.
Broekel, T. (2015) Do Cooperative Research and Development (R&D) Subsidies Stimulate Regional Innovation Efficiency? Evidence from Germany. Regional Studies, 49(7), 1087–1110.
Brossard, O., Moussa, I. (2014) The French Cluster Policy Put to the Test with Differences-in-Differences Estimates. Economics Bulletin, 34(1), 520–529.
Burt, R.S. (1987) Social Contagion and Innovation: Cohesion versus Structural Equivalence. American Journal of Sociology, 92(6), 1287–1335.
Content, J., Frenken, K. (2016) Related Variety and Economic Development: A Literature Review. European Planning Studies, 24(12), 2097–2112.
Cooke, P. (2002) Regional Innovation Systems: General Findings and Some New Evidence from Biotechnology Clusters. The Journal of Technology Transfer, 27(1), 133–145.

123
Crespo, J., Suire, R., Vicente, J. (2014) Lock-in or Lock-out? How Structural Properties of Knowledge Networks Affect Regional Resilience. Journal of Economic Geography, 14(1), 199–219.
Crespo, J., Vicente, J., Amblard, F. (2016) Micro-Behaviors and Structural Properties of Knowledge Networks: Toward a ‘One Size Fits One’ Cluster Policy. Economics of
Innovation and New Technology, 25(6), 533–552.
Doreian, P. (2009) Positional Analysis and Blockmodeling. In Meyers, R.A. (ed.), Encyclopedia of
Complexity and Systems Science. Springer New York, New York, pp. 6913–6927.
Essletzbichler, J. (2015) Relatedness, Industrial Branching and Technological Cohesion in US Metropolitan Areas. Regional Studies, 49(5), 752–766.
Fontagné, L., Koenig, P., Mayneris, F., Poncet, S. (2013) Cluster Policies and Firm Selection: Evidence from France. Journal of Regional Science, 53(5), 897–922.
Frenken, K., Oort, F.V., Verburg, T. (2007) Related Variety, Unrelated Variety and Regional Economic Growth. Regional Studies, 41(5), 685–697.
Gilly, J.P., Torre, A. (2000) Proximity Relations. Elements for an Analytical Framework. In Green, M.B. and McNaughton, R.B. (eds.), Industrial Networks and Proximity. Ashgate Pub Limited, pp. 1–16.
Giuliani, E., Bell, M. (2005) The Micro-Determinants of Meso-Level Learning and Innovation: Evidence from a Chilean Wine Cluster. Research Policy, 34(1), 47–68.
Gnyawali, D.R., Madhavan, R. (2001) Cooperative Networks and Competitive Dynamics: A Structural Embeddedness Perspective. Academy of Management Review, 26(3), 431–445.
Hidalgo, C.A., Balland, P.A., Boschma, R., Delgado, M., Feldman, M., Frenken, K., Glaeser, E., He, C., Kogler, D.F., Morrison, A., Neffke, F., Rigby, D., Stern, S., Zheng, S., Zhu, S. (2018) The Principle of Relatedness. In Morales, A.J., Gershenson, C., Braha, D., Minai, A.A. and Bar-Yam, Y. (eds.), Unifying Themes in Complex Systems IX. Springer International Publishing, pp. 451–457.
Hidalgo, C.A., Klinger, B., Barabási, A.L., Hausmann, R. (2007) The Product Space Conditions the Development of Nations. Science, 317(5837), 482–487.
Houel, M., Daunis, M. (2009) Les Pôles de Compétitivité : Bilan et Perspectives d’une Politique Industrielle et d’aménagement Du Territoire (Rapport d’information n° 40). Sénat France. Commission de l’économie, France.
Kogler, D.F., Rigby, D.L., Tucker, I. (2013) Mapping Knowledge Space and Technological Relatedness in US Cities. European Planning Studies, 21(9), 1374–1391.
Lämmer-Gamp, T., zu Köcker, G.M., Nerger, M. (2014) Cluster Collaboration and Business Support Tools to Facilitate Entrepreneurship, Cross-Sectoral Collaboration and Growth (Technical Report No. 1). European Cluster Observatory.
Lorrain, F., White, H.C. (1971) Structural Equivalence of Individuals in Social Networks. The
Journal of Mathematical Sociology, 1(1), 49–80.
Maffioli, A., Pietrobelli, C., Stucchi, R. (2016) Evaluation of Cluster Development Programs. In Maffioli, A., Pietrobelli, C. and Stucchi, R. (eds.), The Impact Evaluation of Cluster
Development Programs: Methods and Pactices. Inter-American Development Bank.

124
Mewes, L., Broekel, T. (2020) Subsidized to Change? The Impact of R&D Policy on Regional Technological Diversification. The Annals of Regional Science, 1–32.
Molina-Morales, F.X., Martínez-Fernández, M.T., Torlò, V.J. (2011) The Dark Side of Trust: The Benefits, Costs and Optimal Levels of Trust for Innovation Performance. Long Range
Planning, 44(2), 118–133.
Moody, J., White, D.R. (2003) Structural Cohesion and Embeddedness: A Hierarchical Concept of Social Groups. American Sociological Review, 68(1), 103–127.
Nadel, S.F. (1957) The Theory of Social Structure. Cohen & West, London.
Newman, M.E.J., Strogatz, S.H., Watts, D.J. (2001) Random Graphs with Arbitrary Degree Distributions and Their Applications. Physical Review E, 64(2), 026118.
Nooteboom, B., Haverbeke, W.V., Duysters, G., Gilsing, V., Oord, A. van den (2007) Optimal Cognitive Distance and Absorptive Capacity. Research Policy, 36(7), 1016–1034.
Oxford Research AS (2008) Cluster Policy in Europe: A Brief Summary of Cluster Policies in 31 European Countries (Technical Report). Europe Innova Kristiansand, Norway.
Ozman, M. (2009) Inter-Firm Networks and Innovation: A Survey of Literature. Economics of
Innovation and New Technology, 18(1), 39–67.
Pallotti, F., Lomi, A. (2011) Network Influence and Organizational Performance: The Effects of Tie Strength and Structural Equivalence. European Management Journal, 29(5), 389–403.
Phelps, C., Heidl, R., Wadhwa, A. (2012) Knowledge, Networks, and Knowledge Networks: A Review and Research Agenda. Journal of Management, 38(4), 1115–1166.
Pizarro, N. (2007) Structural Identity and Equivalence of Individuals in Social Networks: Beyond Duality. International Sociology, 22(6), 767–792.
Porter, M.E. (1998) Clusters and the New Economics of Competition. Harvard Business Review, 76(6), 77–90.
Powell, W.W., White, D.R., Koput, K.W., Owen‐Smith, J. (2005) Network Dynamics and Field Evolution: The Growth of Interorganizational Collaboration in the Life Sciences. American
Journal of Sociology, 110(4), 1132–1205.
Reagans, R., McEvily, B. (2003) Network Structure and Knowledge Transfer: The Effects of Cohesion and Range. Administrative Science Quarterly, 48(2), 240–267.
Smith-Doerr, L., Powell, W.W. (2003) Networks and Economic Life. In Smelser, N. and Swedberg, R. (eds.), The Handbook of Economic Sociology. Russell Sage Foundation and Princeton University Press, pp. 379–402.
Stuart, T.E. (1998) Network Positions and Propensities to Collaborate: An Investigation of Strategic Alliance Formation in a High-Technology Industry. Administrative Science Quarterly, 43(3), 668–698.
Suire, R., Vicente, J. (2014) Clusters for Life or Life Cycles of Clusters: In Search of the Critical Factors of Clusters’ Resilience. Entrepreneurship & Regional Development, 26(1–2), 142–164.
Ter Wal, A.L.J., Boschma, R. (2011) Co-Evolution of Firms, Industries and Networks in Space. Regional Studies, 45(7), 919–933.

125
Torre, A. (2009) Retour Sur La Notion de Proximité Géographique. Géographie, économie, société, 11(1), 63–75.
Uyarra, E., Ramlogan, R. (2012) Cluster Policy: A Review of the Evidence. NESTA Working Paper.
Uzzi, B., Spiro, J. (2005) Collaboration and Creativity: The Small World Problem. American
Journal of Sociology, 111(2), 447–504.
Verspagen, B., Duysters, G. (2004) The Small Worlds of Strategic Technology Alliances. Technovation, 24(7), 563–571.
Vicente, J. (2018) Economics of Clusters: A Brief History of Cluster Theories and Policy. Palgrave Macmillan.
Vicente, J. (2020) Unravelling the Driving Forces of Networks on Regional Resilience Capabilities. In Bristow, G. and Healy, A. (eds.), Handbook on Regional Economic Resilience. Edward Elgar Publishing, pp. 209–225.
Walker, G., Kogut, B., Shan, W. (1997) Social Capital, Structural Holes and the Formation of an Industry Network. Organization Science, 8(2), 109–125.
Wasserman, S., Faust, K. (1994) Social Network Analysis: Methods and Applications. Cambridge university press, Cambridge.
Yang, W., Yu, X., Wang, D., Yang, J., Zhang, B. (2019) Spatio-Temporal Evolution of Technology Flows in China: Patent Licensing Networks 2000–2017. The Journal of Technology
Transfer.

126
A.3. Appendix
This appendix reports descriptive statistics for the 31 selected networks.
Table 3.3: Network descriptive statistics 5
Network Nodes Project
Diversification
Part
# Peaks Maximum
Cohesion
Level
#
Diversified
Peaks
Diversified
Peaks
Proportion
Aerospace-1 74 0,1875 3 10 0 0
Agriculture/Agri-food-1 45 0,076923 1 5 0 0
Biotechnology/Health-1 57 0 2 5 0 0
ICT-1 252 0,138614 5 19 0 0
Transports-1 90 0,243902 3 10 1 0,333333
Aerospace-2 116 0,25 3 14 0 0
Agriculture/Agri-food-2 54 0,181818 2 7 0 0
Biotechnology/Health-2 62 0,189189 5 4 0 0
Materials-2 92 0,590909 7 7 4 0,571429
Microtechnology/Mechanics-2 54 0,545455 3 5 2 0,666667
ICT-2 261 0,26087 7 17 1 0,142857
Transports-2 139 0,482759 3 16 3 1
Aerospace-3 97 0,365854 4 10 0 0
Agriculture/Agri-food-3 54 0,258065 5 4 0 0
Biotechnology/Health-3 66 0,217391 2 3 0 0
Energy-3 51 0,606061 8 3 4 0,5
Engineering/Services -3 57 0,641026 4 4 3 0,75
Materials-3 104 0,568627 6 6 4 0,666667
Microtechnology/Mechanics-3 80 0,777778 3 5 3 1
ICT-3 266 0,374046 6 9 2 0,333333
Transports-3 77 0,674419 3 5 2 0,666667
Aerospace-4 79 0,644444 4 6 2 0,5
Agriculture/Agri-food-4 71 0,525 3 6 1 0,333333
Biotechnology/Health-4 48 0,459459 1 4 0 0
Ecotechnologies/Environment-4 51 0,645161 3 4 2 0,666667
Energy-4 72 0,808511 3 4 2 0,666667
Engineering/Services -4 68 0,8 8 4 6 0,75
Materials-4 128 0,732394 6 6 4 0,666667
Microtechnology/Mechanics-4 122 0,84058 4 6 3 0,75
ICT-4 272 0,456954 12 10 2 0,166667
Transports-4 78 0,8 1 8 0 0

127
Chapter 4 – The Origination and
Distribution of Money Market
Instruments: Sterling Bills of Exchange
during the First Globalisation
Abstract: This paper presents a detailed analysis of how liquid money market instruments – sterling bills of
exchange – were produced during the first globalisation. We rely on a unique data set that reports
systematic information on all 23,493 bills re-discounted by the Bank of England in the year 1906.
Using descriptive statistics and network analysis, we reconstruct the complete network of linkages
between agents involved in the origination and distribution of these bills. Our analysis reveals the
truly global dimension of the London bill market before the First World War and underscores the
crucial role played by London intermediaries (acceptors and discounters) in overcoming
information asymmetries between borrowers and lenders on this market. The complex industrial
organisation of the London money market ensured that risky private debts could be transformed
into extremely liquid and safe monetary instruments traded throughout the global financial system.
Keywords: money market, industrial organization, information asymmetry, bill of exchange
JEL codes: E42, G23, L14, N20
This chapter is co-authored with Olivier Accominotti (London School of Economics and CEPR) and Stefano Ugolini (Sciences Po Toulouse) and accepted for publication in The Economic History
Review23. We gratefully acknowledge the financial support provided by the London School of
Economics for the data collection.
23 DOI: 10.1111/her.13049

128
4.1. Introduction
At the beginning of the twentieth century, the pound sterling’s dominance over the global financial
system was at its height. The City of London hosted the world’s most important centre for
international short-term lending and borrowing24 and the main instrument for these money market
transactions was the sterling bill of exchange (or bill on London). The sterling bill of exchange was
a tradable asset originated by private agents located anywhere in the world to obtain short-term
credit from London. It was one of the most liquid financial assets of the time and was traded in all
significant financial centres.25 Just before the First World War, about half of world trade was
financed through this instrument.26 Contemporaries generally considered that the sterling bill was ‘a
kind of world currency’, ‘the same as gold’, or ‘the equivalent of a bullion certificate’.27 Many UK
and foreign financial institutions were interconnected through the London bill market, whose
importance for the international banking system was systemic.28 The sterling bill was the
cornerstone of the global financial system and its undisputed liquidity was key to the UK’s financial
dominance during the first age of globalisation.29
Why was the sterling bill of exchange considered such a liquid and safe credit instrument? And why
did the London money market prove so robust in the decades prior to the First World War? While
these questions have been asked before, any attempt to answer them has been confronted with a
lack of systematic data on bill trading. Since the bill market was of the over-the-counter type, there
was no central authority that recorded information on all London-originated bills. In this paper, we
overcome this difficulty by relying on a detailed data set constructed from a unique archival source:
the Bank of England’s Discount Ledgers. These ledgers report systematic micro-level information
on a profusion of bills circulating on the London money market and on all agents involved in their
origination and distribution. Our data set contains information on all individual bills re-discounted
by the Bank of England during the year 1906 (23,493 bills). Bills re-discounted by the Bank of
England only represented a small share of all bills issued on the London market and did not
constitute a fully representative sample. Nevertheless, the information they contain provides
invaluable insights into the microstructure of the money market. We use descriptive statistics and 24 Keynes, Treatise on Money, p. 282. 25 Jacobs, Bank Acceptances; Warburg, Discount System; Withers, Meaning of money; Flandreau and Jobst, ‘Network Analysis.’ 26 Kynaston, City of London, p. 8; Atkin, Foreign Exchange Market, p. 5. 27 Baster, International Banks, p. 13; Gillett Brothers, Bill on London, p. 16; Greengrass, Discount Market, p. 37. 28 Bills on London formed part of the liquid reserves of UK commercial banks and of the foreign currency reserves of commercial and central banks abroad (Eichengreen and Flandreau, ‘Central Banks’). 29 King, Discount Market, p. xi; Atkin, Foreign Exchange Market, p. 5.

129
network analysis to reconstruct the complete network of linkages between agents involved in the
design of these bills. Doing so allows us to describe the industrial organisation behind the
production of sterling bills in the early twentieth century.
Bills of exchange always involved a drawer (a borrower located either in the UK or abroad), an
acceptor (a London-based actor which guaranteed the bill’s payment in pounds sterling at maturity),
and a discounter (the buyer of the bill). The data that we have assembled enable identification of
how these various agents interacted on the money market.
Figure 4.1: Geographical location of borrowers (drawers) on the London bill market 22
Figure 4.1 shows the geographical location (at the city level) of all drawers of sterling bills in our data set.
Our analysis based on a new dataset confirms the true global dimension of the London bill market
at the start of the twentieth century. We show that drawers were numerous and scattered across the
world (Figure 4.1). Our data set records 3,554 different drawers, most of which were small private
firms or merchants. Since the average investor could not hold detailed information about all these

130
debtors, large information asymmetries must have existed between borrowers and lenders on the
money market. Such information asymmetries constitute market frictions, which typically result in
adverse selection and a total absence of lending.30 Data on the intermediaries involved in the
origination and distribution of bills allow us to demonstrate how these market frictions were
overcome.
We argue that the information problem inherent to the production of sterling bills was solved by a
cumulative process in which London intermediaries successively added their guarantees to the
instrument. Acceptors played the key role in producing information on borrowers and in reducing
credit risk. However, their signature was also supported by that of the discounters who purchased
the bills before distributing them to other investors. When they resold (endorsed) a bill of exchange,
discounters added their personal, secondary guarantee to it and thus enhanced its credit – a
circumstance known as the joint liability rule.
Our results therefore shed light on the complex structure of the London money market at the start of
the twentieth century and on the various mechanisms through which the information problem
inherent to the production of bills was solved. These mechanisms allowed borrowers from around
the world to access London credit facilities and ensured that risky, private debts could be
transformed into the highly liquid and safe monetary instruments that were traded throughout the
global financial system.
Our paper contributes to the historiography on the use of bills of exchange as instruments of
international credit and payment and on the evolution of the London money market.31 We integrate
perspectives from the literatures on the organisation of the London discount market,32 the business
and operations of merchant banks,33 and the role of joint liability in lending.34 We show how these
various factors jointly contributed to the high liquidity of the London money market.
The rest of our paper proceeds as follows. Section 4.2 explains how the bill of exchange functioned.
In Section 4.3 we discuss our primary source and data. Section 4.4 details the structure of the
accepting and discounting industries in London at the beginning of the twentieth century and
30 Stiglitz and Weiss, ‘Credit rationing’. 31 De Roover, Lettre de change; Scammell, London Discount Market; Nishimura, Inland Bills, Michie, British Banking; Cassis, Capitals of Capital; Mollan and Michie, ‘City of London’. 32 King, Discount Market; Scammell, London Discount Market. 33 Chapman, Merchant Banking; Roberts, Schröders; Wake, Kleinwort. 34 Ghatak and Guinanne, ‘Joint Liability’; Santarosa, ‘Long-Distance Trade’.

131
underscores the role of acceptors in reducing information asymmetries on the bill market, while
Section 4.5 focuses on the role of discounters. Section 4.6 concludes.
4.2. The sterling bill of exchange
4.2.1. The bill of exchange: Definition and functioning
From the late sixteenth until the early twentieth century, a negotiable bill of exchange was the
standard financial instrument for obtaining short-term credit and exchanging currencies.35 The bill
of exchange was defined legally in the UK as ‘an unconditional order in writing, addressed by one
person to another, signed by the person giving it, requiring the person to whom it is addressed to
pay on demand or at a fixed or determinable future time a sum certain in money to or to the order
of a specified person, or to bearer.’36 Whereas ‘sight bills’ were payable after a few days, ‘long
bills’ had a longer maturity (typically three or six months) and therefore served as short-term credit
instruments.
A bill always involved at least three agents: a ‘drawer’, an ‘acceptor’, and a ‘discounter’. The
drawer was the person who addressed the bill; the acceptor, the individual or institution to whom
the bill was addressed; and the discounter, the bill’s beneficiary. By accepting the bill, the acceptor
committed to pay the specified sum to the discounter at the specified date. Because the bill of
exchange was a negotiable instrument, a discounter’s claim on the acceptor could always be
transferred to another investor (or re-discounter) at any time before maturity.
Although its legal form remained practically unchanged for centuries, the bill of exchange proved to
be a flexible instrument that could be employed to finance diverse types of operations. Bills could
be drawn to finance domestic and international trade transactions, to raise short-term money or to
engage in purely financial operations such as security investment, currency speculation, or interest
arbitrage.37 Bills of exchange were traded in all principal cities in the world. However, bills
accepted in London largely outnumbered those drawn from London on other foreign centres.38 This
reflected the importance of the sterling bill in the global financial system; it not only served to
35 De Roover, Lettre de change; Accominotti and Ugolini, ‘International Trade Finance’. 36 Article 3 of the 1882 Bill of Exchange Act. 37 Goschen, Theory of the foreign exchange, pp. 23-42; Clare, A B C of foreign exchanges, pp. 80-87; Herger, ‘Interest parity-conditions’. 38 Clare, A B C of foreign exchanges, p. 11.

132
finance most of the UK’s trade with foreign countries, but was also used to fund various
commercial and non-commercial transactions taking place anywhere in the world.39
4.2.2. The bill of exchange: Examples
Figure 4.2 presents an illustrative example of a transaction commonly financed through sterling
bills in the early twentieth century: an export of goods from ‘city A’ to ‘city B’. The figure’s
panel A shows the operations involved when the bill is issued. An exporter in city A has agreed to
sell goods to an importer in city B (path 1 in the figure) but needs credit in order to finance
production and shipment before receiving payment. The exporter (here, the drawer) draws a bill on
a London agent (the acceptor) and asks for an engagement to pay to the bearer of the bill, at a
specified date in the future, a sum in pounds sterling corresponding to the proceeds of the sale
(path 2).40 The drawer then transfers the bill (3) to her local bank (the remitter), which arranges to
send it to a discounter in London (4). The discounter might have been pre-selected – either directly
by the drawer (if she has London correspondents other than the acceptor) or by the acceptor herself
(if she is the drawer’s only correspondent in London).
39 Ibid., pp. 11-15; Goschen, Theory of foreign exchanges, pp. 32-33. 40 In this example, the bill is ‘placed to the importer’s account’, which means that the importer authorises her exporter to draw on the acceptor with whom she is in a business relationship. However, if the drawer were in a direct business relationship with the acceptor then it would be said that the bill was ‘placed to the drawer’s account’.

133
Figure 4.2: Example of a commercial transaction financed by a sterling bill of exchange 23
Source: Authors’ schematic representation of transactions described by contemporaries (e.g., Gillett Brothers, Finance of Trade by Bills of Exchange)
Upon arrival of the bill in London, the discounter presents it to the acceptor (5); she ‘accepts’ the
bill by countersigning it, thereby confirming her commitment to pay the bearer at maturity (6).
Once the bill is accepted, the discounter credits the remitter’s account (7). The remitter, in turn,
credits the drawer’s account (8) and so provides the financial means for producing and shipping the

134
goods. The discounter can then either keep the bill until its maturity or resell (‘endorse’) it to a final
investor (the endorsee, or re-discounter) willing to lend capital until the pre-specified date (9
and 10). The bill can be re-discounted an unlimited number of times before its maturity.
Panel B of Figure 4.2 summarises the operations taking place when the bill expires. Just before
maturity, the importer – who has, by then, received delivery of the shipped goods – remits funds
directly to the acceptor (11); those funds enable the acceptor to meet the bill’s payment. On the
bill’s actual maturity date, the bearer presents it to the acceptor for payment (12 and 13). Thus the
instrument disappears at maturity, or ‘self-liquidates’ in the wording used by contemporaries.41
It should be clear from this example that a bill’s acceptor did not advance her own capital; rather,
she committed only to repaying the bearer in the expectation of receiving a monetary flow from the
importer before maturity. 42 In other words, the acceptor was just a guarantor of the bill who added
her signature to it – usually in exchange for a fee.43 In contrast, the discounter and re-discounter
immobilised their own funds in order to purchase the bill. These actors were (respectively) the first
and ultimate lender. The usual procedure was for investors (re-discounters) in sterling bills to
purchase them from a limited set of London institutions (discounters), who in turn had obtained
those bills either from their correspondents abroad (remitters) or from acceptors. These first
discounters constituted the ‘wholesale’ segment of the London discount market.44
Recall that every seller of a bill of exchange also had to ‘endorse’ it, thereby adding a secondary
guarantee to the bill. In case the acceptor failed to pay the bill at maturity, the last endorser was
liable for repaying the sum due to the bearer. By originating a bill, the drawer was thus able to
borrow from an unknown lender (the re-discounter) thanks to the guarantee provided by an acceptor
and to the intermediation – and secondary guarantee – of a wholesale discounter. The bill of
exchange was not collateralised by any financial asset or ‘physical’ goods; it was secured instead
via the guarantees provided by the successive intermediaries involved in its origination and
41 Jobst and Ugolini, ‘Coevolution’, pp. 162-3. 42 Nevertheless, acceptance houses reportedly followed certain rules in order to manage the risks of guaranteeing bills. One often cited rule was that they should not accept bills for more than three or four times the value of their paid-up capital and reserves (See Committee on Finance and Industry, Minutes of Evidence, vol.1, p. 73, par. 1204). 43 Hawtrey, Currency and Credit, p. 129. 44 Specialised wholesale discount brokers (connecting first discounters to re-discounters) had already emerged in London by the end of the nineteenth century. For instance, Sayers, Gilletts, pp. 51–52 writes that the discount house Gillett Brothers & Co. (a leading London re-discounter) used to purchase, in the 1890s, its entire portfolio of Indian-drawn bills through the intermediation of discount brokers Page & Gwyther.

135
distribution.45 These intermediaries certified the quality of the bill’s underlying debt and its
repayment upon its maturity.
The specific type of transaction described in Figure 4.2 was common in the early twentieth century;
yet bills of exchange could be mobilised in many other ways, and all these roads led to the London
money market. A detailed exposition of the manifold uses of bills can be found in a handbook
published by one of London’s foremost discount houses.46 Bills were first used to finance trade.
Especially in early times, the drawer was often the seller of some goods and the acceptor their
buyer. By signing the bill, the acceptor promised to pay the value of the sold goods after their
delivery – thus allowing the seller to raise capital and finance shipment. In that case, the bill’s
acceptor was a UK importer.47 Bills drawn directly on importers were called trade bills on the
London discount market.
From the mid-nineteenth century onward, several trading and financial houses in the City began
offering their respective signatures and allowed exporters to draw bills upon them rather than on
their importers.48 Bills accepted by reputable financial institutions were known as bank bills and
were usually considered superior to trade bills because of the acceptor’s higher standing. Hence,
contemporaries referred to such bills as ‘first class paper’ as opposed to the ‘lower class paper’
drawn on less reputable, non-financial firms. In these cases, the acceptor was not engaged in the
commercial transaction; instead it was a third party that agreed to accept bills in the importer’s
name – on the condition that the latter (privately) agree to provide the funds needed to meet the
bills’ payment at maturity.49 Bills could also be drawn directly by the importer (rather than the
exporter) on the financial house with whom she had the arrangement. In this case, the importer
raised capital herself to finance the goods’ shipment.50 Sometimes, the acceptor did not have a
direct relationship with the drawer but only with her bank, which took care of selling the bill to a
discounter and of providing the funds to the acceptor before maturity. In such cases, often the
drawer’s bank also endorsed the bill before it was accepted.51
45 Flandreau and Ugolini, ‘Lending of Last Resort’. The holder of an unpaid bill could not seize the commodities that it financed; the only recourse was to seize the acceptor’s or previous endorser’s assets. 46 Gillett Brothers, Bill on London. 47 Ibid., pp. 47-48 48 Greengrass, Discount Market, p.46. 49 Hawtrey, Currency and Credit, pp. 123-24; Gillett Brothers, Bill on London, pp. 27-29, 37-39, 41-43. In contemporary parlance, the importer engaged to ‘make provision’ and to ‘cover’ the acceptor before maturity. This particular case corresponds to the example described in Figure 4.2. 50 Gillett Brothers, Bill on London, pp. 29-31, 39-40. 51 Ibid., pp. 53-55.

136
As stated above, bills could also be used to finance activities other than trade. For instance, the
drawer might be an industrial firm that needed a short-term, blanked credit to finance production
and sought to raise capital on the London discount market with the guarantee of an acceptor.52
Should the firm’s production remain unachieved at the bill’s maturity, then the acceptor could
authorise the drawer to draw another bill so that the debt could be rolled over.53 Finally, in many
cases the drawer was a financial firm just willing to fund its own stock or bond investments or to
refinance its banking operations. By originating a bill, a financial firm could replenish its liquidity
while using the acceptor’s guarantee as collateral.54 Bills originated for purposes other than trade
were referred to as accommodation or finance bills. Although the practice of drawing bills that were
not based on ‘genuine’ commercial transactions was often decried, the distinction between ‘finance’
and ‘real’ bills was not clearly defined. For example, contemporaries debated whether bills drawn to
finance a future, expected commercial transaction should be classified as accommodation paper.55
Although certain bills provided details about the nature of the commercial transaction they financed
(e.g, details on the sold goods and their shipment), doing so was optional (and irrelevant from the
judicial standpoint) and in most cases investors could not directly recognise a ‘finance’ bill from a
‘real’ one. Hence, the standing of bills on the London discount market did not mostly depend on
their intrinsic nature but on the reputation of the intermediaries which had guaranteed them.56
4.2.3. Bills as carriers of information
The information recorded on a bill of exchange allowed bearers to reconstruct many, but not all, of
the underlying interlinkages that supported its origination and distribution. Simply looking at a bill
was not enough to reliably determine the exact nature of the transaction that stood behind it. That
said, each bill did record the name of its drawer as well as the names of all intermediaries who had
guaranteed and/or purchased it.
52 Goschen, Theory of the foreign exchanges, pp. 38-41. 53 Gillett Brothers, Bill on London, pp. 45-47. 54 Also in this case, the acceptor was not necessarily in a direct customer relationship with the drawer; thus, for example, the former might only have had an arrangement with the drawer’s correspondent. 55 Goschen, Theory of the foreign exchanges, pp. 38-41. 56 Gillett Brothers, Bill on London, p. 22.

137
Figure 4.3: Bill of exchange, 1910 24
The figure’s upper (resp. lower) portion transcribes the bill’s front (resp. back) side. Text in italics corresponds to signatures. Source: London Metropolitan Archives, CLC/B/140/KS04/13/02/006.
Figure 4.3 transcribes a typical bill of exchange found in the archives of the leading acceptance
house Kleinworts & Co. This £3,000 bill was drawn on 10 August 1910 by the Moscow-based
Société L. Bauer & Co. (the drawer) and was made payable after three months by Kleinworts & Co.
(the acceptor). After drawing the bill, the drawer immediately sold it to the Banque de Commerce
de l’Azow-Don/Azow-Don Commerzbank (the remitter), probably the drawer’s bank in Moscow.
The very same day (10 August), the remitter sold/endorsed the bill to the Union Discount Company
of London (the discounter), which thus became entitled to cash it in at maturity. Azow-Don
Commerzbank shipped the bill to London, where Kleinworts accepted it (by affixing its signature)
on 15 August before transmitting it to the Union Discount Company. The discounter kept the bill
until maturity and did not resell it to another investor. Three months later, Kleinworts therefore
repaid the Union Discount Company £3,000 through a London clearing bank (the London County
& Westminster Bank), which was responsible for pure payment services. The discounter then
returned the self-liquidated instrument to the acceptor, in whose archives it remains preserved.
The information recorded on that bill does not indicate the exact nature of the transaction it
financed. The drawer (Bauer & Cie) might have been an exporter of Russian goods. Yet because the
Pay to the order of:
Banque de Commerce de l’Azow-Don
10 August 1910
Société L. Bauer & Co.
For us at the order of:
The Union Discount Company of London Ltd., London
10 August 1910
Azow-Don Commerzbank
Moscow, 10 August 1910
For £3,000
Three months after date pay against this Bill of Exchange to our order the
Sum of Three Thousand Pounds Sterling Value in account and place it to account and
charge it to account as advised by
Messrs Kleinwort Sons & Co. Société L. Bauer & Co.
London E.C. Le Directeur-Gérant: C. Bauer
ac Fenchurch Street
AC
CE
PT
ED
15 A
UG
US
T 1
910
Pay
able
at
the
Lo
ndo
n C
oun
ty &
Wes
tmin
ster
Ban
k
Kle
inw
ort Son
s &
C
o.

138
bill makes no mention of any shipment of goods, we cannot be sure that it was used to finance
trade. Inspecting the bill itself leaves us in the dark also with regard to the exact nature of the
relationships between the various parties involved. For example, the remitter (Azow-Don
Commerzbank) might have selected the discounter (the Union Discount Company) directly;
alternatively, the acceptor (Kleinworts) might have arranged for the bill to be discounted. In that
event, Kleinworts would have instructed the Moscow bank to endorse the bill to the Union Discount
Company (the discounter) before shipping it to London.57
One must bear in mind that, even if all details of the transaction were not known, a bill’s purchaser
could always identify the most important actors involved in its production. In particular, a bill
recorded the names of all intermediaries whose signatures amounted to collateral for it. Those
agents included the drawer (or borrower; here, Bauer & Cie); the acceptor (or guarantor; here,
Kleinworts & Co.), and the discounter (or lender; here, the Union Discount Company).
The largest acceptors of bills in London were the merchant banks or acceptance houses that
specialised in offering acceptance services for their customers at home and abroad.58 Acceptors also
included UK deposit banks, branches of foreign banks, and ‘Anglo-foreign banks’ – multinational
banks based in London but whose business was concentrated in certain foreign geographical areas,
where these banks specialised and maintained a large network of correspondents.59 In addition, a
large number of UK trading or manufacturing firms also accepted bills drawn on them by their
trading partners.60
Among the largest discounters were the so-called discount houses of the City. These highly
specialised institutions purchased large amounts of bills, which they then kept in their own
portfolios or re-discounted to other investors.61 Discount houses usually funded their investments
with short-term deposits or ‘call money’ from other financial institutions (especially the large UK
deposit banks).62 However, discount houses were not the sole distributors of bills on the money
market. Foreign and Anglo-foreign banks also played that role, while trading and manufacturing 57 The Union Discount Company was a ‘discount house’ that was not actually involved in the business of correspondent banking. Thus, it is unlikely that this company was the London correspondent of Azow-Don Commerzbank. Hence we suspect that Kleinworts both accepted the bill and found a discounter (the Union Discount Company) willing to purchase it in London. 58 Greengrass, Discount Market; Chapman, Merchant Banking. 59 Jones, British Multinational Banking. Anglo-foreign banks are also often referred to as British overseas banks or British multinational banks. 60 Sayers, Gilletts. 61 Vigreux, Crédit par Acceptation, pp. 169-70; Sayers, Gilletts, pp. 37-38. 62 For a detailed description of the business of discount houses, see King, Discount Market, Scammell, London Discount
Market, Fletcher, Discount Houses, and Cleaver, Union Discount.

139
firms discounted bills as well. In contrast, UK deposit banks invested in (i.e., re-discounted) bills
but seldom served as wholesale sellers on the discount market.63
4.3. Data
4.3.1. Data Source
Through its monetary operations, the Bank of England was an influential player in the London
discount market. Large holders of bills approached the Bank – in times of monetary tension and
before publication of their balance sheets – for re-discounting and thus obtaining cash.64 The Bank
of England gathered systematic information on all the bills it re-discounted, thereby monitoring its
exposure to acceptors and discounters.65 In its Discount Ledgers, it recorded complete information
on the identity of the intermediaries (drawer, acceptor, discounter) involved in the origination and
distribution of re-discounted bills. 66
We collect information on all bills re-discounted by the Bank of England during one year.
We select a period equal to exactly one year in order to circumvent any seasonality concerns.
Because the Bank only acquired bills through standing facility lending and never through open
market operations, its bill portfolio only became sizeable in times of monetary tension.67 To ensure
our dataset captures a significant portion of the sterling bill market, it is important to select a year in
which the Bank’s discount window was rather active. The year 1906 is a good candidate here as the
UK’s external position varied throughout the year leading the Bank of England to alter its discount
rate on six different occasions even though there was no full-blown financial crisis as in 1890 or
63 Spalding, Foreign exchange, p. 200; Hawtrey, Currency and Credit, pp. 130. 64 Tensions on the money market could occur when the demand for cash was unusually high, thus putting upward pressure on market interest rates. Such circumstances could arise from concerns about the UK’s external balance or about the position of certain financial institutions, as well as from seasonal liquidity demands. UK financial institutions also re-discounted a large portion of their bills to the Bank of England just before publication of their balance sheet in order to increase the published amount of their cash reserves. This practice was known as window-dressing. 65 Flandreau and Ugolini, ‘Lending of Last Resort’ 66 Bank of England Archives, Discounters’ Ledgers (C22/46-50), Drawing Office Discounters’ Ledgers (C23/7), Bankers’ Ledgers (C24/6), Upon Ledgers (C26/72-74). 67 Ugolini, ‘Liquidity Management’.

140
1907. 68 Figure 4.4 shows the evolution in the number of bills re-discounted by the Bank of England
from 1889 to 1910, as well as the share of these re-discounted bills in the total amount of sterling
bills issued on the market as estimated by Nishimura.69 The figure shows that in 1906, the Bank re-
discounted a higher share of sterling bills issued than in any other year, although that proportion
remained limited overall (2.47 per cent). Bills re-discounted by the Bank in 1906 had an average
value of £1,346 (compared to £1,556 on average in 1900-1910), an average maturity of 44 days
(compared to 46 days), and were purchased at the average interest rate of 4.17 per cent (3.45 per
cent).
68 Flandreau and Ugolini, ‘Lending of Last Resort’ show that the quality of bills re-discounted by the Bank of England was not altered in crisis times. Nevertheless, bills rediscounted by the Bank during a full-blown financial crisis might not have been representative of the money market. 69 Nishimura, Inland Bills.

141
Figure 4.4: The Bank of England’s re-discount policy, 1889-1910 25
This figure displays the total number of bills re-discounted by the Bank of England annually from 1889 to 1910 (left axis), as well as the share of total sterling bills issued on the market (according to Nishimura’s estimate) which were re-discounted by the Bank (right axis). Source: Authors’ computations on Bank of England Archives, Comparative Statement of Discount Operations (C30/3). Estimates of total sterling bills issued are from Nishimura, Inland Bills, p. 93.
The Discount Ledgers contain the accounts of the Bank’s clients. During any re-discounting
operation, the Bank registered the bill’s information in the discounter’s account (in a column
labelled ‘with’) and also in the acceptor’s account (in a column labelled ‘upon’).70 Thus each bill re-
discounted by the Bank was recorded twice in the Ledgers. To avoid recording the bills twice in our
database, we collect only the ‘upon’ entries of the Bank’s Ledgers.71 For each bill, we record the
70 See Flandreau and Ugolini, ‘Lending of Last Resort’ for a description of the Bank’s accountability in the re-discounting of bills. 71 We prefer to collect the ‘upon’ entries because the ‘with’ entries are sometimes less detailed. Bills were usually re-discounted not individually but rather in packs known as ‘parcels’. A specific category of the Bank of England’s Discount
Ledgers includes the accounts of discount houses (Brokers’ Ledgers, C25/5). In these ledgers, the parcels of bills discounted were not always ‘unpacked’ in the ‘with’ entries. Yet in the ‘upon’ entries the parcels were unpacked – that is, under the headings of the acceptors of each bill contained in the parcel.
0.00%
0.50%
1.00%
1.50%
2.00%
2.50%
3.00%
0
5,000
10,000
15,000
20,000
25,000
30,000
188
9
189
0
189
1
189
2
189
3
189
4
189
5
189
6
189
7
189
8
189
9
190
0
190
1
190
2
190
3
190
4
190
5
190
6
190
7
190
8
190
9
191
0
Number of Bills Discounted (left axis) Share of Sterling Bill Market (right axis)

142
name and location of the three parties involved in its origination and distribution: the drawer, the
acceptor, and the discounter.
We use these data to describe relations between agents on the London money market. From our data
set for 1906, which contains 23,493 bills, we reconstruct the complete network of agents whose
names appear on the bills. In this way we obtain a static network of 4,970 agents, or ‘nodes’.
Among these we find that the drawer role is played by 3,554 nodes, the acceptor role by 1,439, and
the discounter by 145 nodes (note that some nodes played more than one role).
We record all relationships, or links, between triplets of agents in the network. We define two direct
relationships between pairs of actors: between drawers and acceptors, and between acceptors and
discounters. Thus a link exists between a given drawer and a given acceptor when the latter has
accepted at least one bill drawn by the former, and there is a link between an acceptor and a
discounter when the latter has discounted at least one bill accepted by the former. As a result, there
also exists an indirect relationship between a drawer and a discounter (through an acceptor) when
the latter has discounted at least one bill drawn by the former.
4.3.2. Representativeness
There are, of course, some limitations to our source and resulting data set. As far as we know, the
Bank of England’s Ledgers constitute the most comprehensive and detailed source on the sterling
bill market. Nevertheless, bills re-discounted by the Bank only represented a small portion of all
sterling bills issued, and this sample might not have been representative of the entire market.
For one thing, the Bank of England only re-discounted bills from a limited set of discounters that it
declared ‘eligible’. Eligible discounters were not representative of the final investor in sterling bills
(the re-discounter in Figure 4.2). Our archival source does not allow identifying whether the agents
who sold bills to the Bank of England were those bills’ first discounters or if they had themselves
bought the bills from other investors. However, eligible discounters made up the wholesale segment
of the London discount market (the discounter in Figure 4.2), and therefore included all institutions
that purchased bills through acceptors or foreign correspondents and then resold them to final
investors (or to the Bank of England). This group of institutions included discount houses, Anglo-
foreign and foreign banks, and merchant banks as well as non-financial, trading firms.

143
Biases might also have existed in the nature and quality of bills re-discounted by the Bank as
compared with bills sold on the open market. Since there was no formal rule regarding the
eligibility of drawers or acceptors, the Bank of England could in theory re-discount bills drawn or
accepted by all sorts of agents.72 However, it is possible that the Bank was a particularly cautious
re-discounter, in which case one would expect the bills it purchased to be, on average, of higher
quality than those circulating on the market. Alternatively, it is also possible that eligible
discounters exploited the Bank’s discount window strategically and re-discounted their lowest-
quality bills in order to keep the best ones on their own balance sheet. If that was the case, one
would expect the Bank’s bill portfolio to disproportionately consist of bills accepted by weaker
institutions. 73 Although a vast literature has discussed the Bank of England’s rediscount policy, no
attempt has been made so far to empirically assess the extent and direction of biases in its bill
portfolio.
We perform three series of cross-checks on our data. First, Jansson reports the aggregate amounts of
bills accepted by nine top acceptance houses. 74 We can rank these nine houses according to their
total amount of outstanding accepted bills at the end of 1906, and compare the ranking of the same
institutions in the Bank of England’s portfolio of re-discounted bills that same year (Table 4.1).75
The result is reassuring, as the two rankings almost perfectly match. The ranking of acceptors also
exhibited little year-on-year variation.76
72 There was no constraint on drawers, while the only constraint on acceptors was that they had to be based in London in order to allow for the collection of bills’ repayment at maturity. The bills accepted by intermediaries who were not among the Bank’s agreed customers were those recorded in the so-called Upon Ledgers: In 1906, they made for 23.39 per cent of all bills re-discounted. 73 Here, we use the term ‘portfolio’ to denominate the entire set of bills acquired by the Bank of England throughout the year 1906 (rather than the Bank’s bill holdings at one point in time). 74 Jansson, Finance-Growth Nexus. 75 The ranking of the selected houses in the Bank of England’s portfolio is based on the number of discounters that purchased bills accepted by them. 76 Jansson, Finance-Growth Nexus, p. 209

144
Table 4.1: Ranking of London acceptance houses in 1906 6
Our database Janson (2018, p 269)
Rank Number of discounters
Rank Amount accepted (million pounds)
Kleinworts 1 50 1 11.9 Schöders 2 45 2 10.3 Barings 3 43 4 6.7 Brandts 4 42 3 6.9 Brown Shipley 5 39 5 4.5 Rothschilds 6 33 6 3.1 Hambros 7 32 8 2.1 Morgan Grenfell 8 26 7 2.2 Gibbs 9 19 9 0.9
This table compares the ranking – in terms of their number of discounters in 1906 – of nine of our data set’s acceptance houses with the ranking of the same houses established by Jansson, Finance-Growth Nexus in
Britain, p. 269, based on their amount of outstanding accepted bills at the end of 1906, retrieved from the respective houses’ archival records.
Second, we were able to retrieve from the archives of two major acceptance houses (Kleinworts and
Barings) the list of their top 10 clients in 1906.77 We check whether these clients’ names also appear
as drawers of bills accepted by Kleinworts and Barings and re-discounted by the Bank of England.
Six (respectively, five) out of Kleinworts’ (respectively, Barings’) top 10 drawers also appear on
bills in our dataset. This suggests that at least the largest drawers of sterling bills were well
represented in the Bank’s portfolio.
77 The list of Kleinworts’ top-10 clients was constructed from London Metropolitan Archives, CLC/B/140/KS04/12. The list of Barings’ top-10 clients was constructed from the Baring Archive, 202368-202376, Credit Department Annual Report 1906-1914 (file communicated by the archivists).

145
Table 4.2: Comparison of acceptors in Gilletts’ total discounts and re-discounts to the Bank of
England, 1906 7
Type of acceptor Share in Gilletts’ total discounts
Share in Gilletts’ re-discounts to BoE
Merchant banks 49.5% 32.0%
British clearing banks 9.8% 16.4%
Anglo-foreign banks 11.9% 30.9%
Foreign banks 13.1% 0.0%
Other (non-financial firms) 15.7% 20.7%
All 100.0% 100.0%
This table compares the share of various types of acceptors in Gilletts’ 1906 total portfolio of discounted bills and in the portion of that portfolio which the firm re-discounted to the Bank of England.
Finally, the archives of one major discount house (Gillett Bros. & Co.) contain a detailed
breakdown of the bills it purchased in 1906 by each principal acceptor.78 We can thus compare the
entire portfolio of bills which Gilletts discounted on the market with the small portion of that
portfolio (0.85 per cent) which the firm re-discounted to the Bank of England. Table 4.2 shows how
different categories of acceptors feature in each sample. The two samples are broadly consistent,
even though we do notice discrepancies. In particular, bills accepted by Anglo-foreign banks are
clearly over-represented in the sample of bills re-discounted to the Bank. Gilletts also discounted a
significant amount of bills accepted by foreign banks’ London branches (13.1 per cent of its total
discounts) but did not re-discount any of those bills to the Bank of England. At the same time, there
is no evidence of a quality bias in Gilletts’ re-discounts to the Bank of England. Bills accepted by
non-financial firms (trade bills) figure in similar proportions in both samples. While merchant banks
are slightly under-represented in Gilletts’ rediscounts to the Bank, we do not find any systematic
bias in favour of the most reputable ones. Several first class signatures such as Rothschilds and
Brown Shipley are slightly over-represented at the Bank, but other equally reputable institutions
such as Kleinworts and Schroders are slightly under-represented (Figure 4.5).
78 London Metropolitan Archives, CLC/B/100/MS24688/002. Note that this ledger only covers the 135 top acceptors that Gilletts held in their portfolio. Sayers, Gilletts, p. 46 writes that in 1905, these top acceptors accounted for 73 per cent of the house’s total discounts. Jansson, Finance-Growth Nexus, pp. 252-5, relies on the same archival source to describe the evolution in Gilletts’ bill portfolio over 1892-1913, and shows there was little volatility in the acceptor composition of the portfolio.

146
Figure 4.5: Share of individual merchant banks in Gilletts’ 1906 discounts and re-discounts to
the Bank of England 26
The values on the horizontal axis show the share of various acceptors in Gilletts’ total amount of bill discounts in the year 1906. The values on the vertical axis show the share of the same acceptors in the total amount of bills which Gilletts re-discounted to the Bank of England. Only merchant banks that are present in both samples are included in the figure.
In addition, we also compare acceptors in Gilletts’ bill portfolio and in the Bank’s entire bill
portfolio (across all discounters). Out of the 127 acceptors appearing on bills discounted by Gilletts
in 1906, only 11 are absent from our dataset. These include 6 foreign banks, 1 Anglo-foreign bank
and 4 non-financial firms. Table 4.3 displays the correlation between the importance of the various
acceptors in Gilletts’ bill portfolio and in our dataset. The coefficient of correlation is 0.52 and goes
as high as 0.62 when we exclude foreign banks, which are under-represented at the Bank. The
correlation is also strongly positive and statistically significant across all categories of acceptors.

147
Table 4.3: Correlation between the size of acceptors in Gilletts’ and Bank of England’s bill portfolios, 1906 8
Type of acceptor Coefficient of correlation
All 0.52***
All (excluding foreign banks) 0.62***
Merchant banks 0.71***
British clearing banks 0.62***
Anglo-foreign banks 0.55***
Foreign banks 0.75***
Other 0.64***
This table shows the coefficient of correlation between the size of acceptors in Gilletts’ 1906 bill portfolio and their size in the Bank of England’s aggregate portfolio of re-discounted bills. The size of a given acceptor in Gilletts’ bill portfolio is measured through the total amount of bills carrying this acceptor’s signature. The size of a given acceptor in the Bank of England’s portfolio is measured through its total number of discounters. The correlation is shown for all acceptors in the sample as well as for different categories of acceptors. ***: significant at the 1 per cent level.
Existing sources do not allow systematically comparing bills re-discounted by the Bank of England
with the whole population of sterling bills circulating on the London market. It is evident that bills
re-discounted by the Bank only represented a small share of the bill market and were not randomly
selected. However, our comparison of the Bank of England’s bill portfolio with that of one
significant private actor on the money market does not reveal manifest quality differences between
the two institutions. 79 We do however identify an interesting pattern. Compared to the rest of the
discount market, the Bank re-discounted more bills accepted by Anglo-foreign banks and fewer
bills accepted by foreign banks. Contemporaries were aware of the Bank’s reluctance to re-discount
bills drawn on foreign banks. One source for example described how bills accepted by certain
foreign banks were considered ‘first class’ in the market but were ‘tabooed’ by the Bank of
England.80 This policy may have aimed at supporting British financial institutions in their
competition with foreign banks in the acceptance business.
79 We cannot conclude through a simple cross-check of our data with external sources whether biases in the Bank of England’s portfolio of re-discounted bills were due to active discrimination on the Bank’s side or to the discounters’ own choice to disproportionately re-discount certain types of bills. 80 Kynaston, City of London, p. 282.

148
4.4. Anatomy of the London money market
4.4.1. Information asymmetries and the money market
We first use our data set to document where the debts underlying sterling bills re-discounted by the
Bank of England were originated. Figure 4.1 showed how the drawers of bills were dispersed
geographically. Among all the drawers of bills re-discounted in 1906, UK drawers represented only
13.56 per cent; 17.50 per cent of drawers were located in continental Europe, 20.40 and 15.14
per cent were in (respectively) USA/Canada and Latin America, 19.78 per cent in India and the Far
East, 5.46 per cent in Africa, 2.11 per cent in Oceania, and 6.05 per cent in the rest of the world.
Not all the drawers of sterling bills were located in the world’s largest metropolises or trading
centres; many originated from cities with much smaller populations. This phenomenon is evident
from the geographical location of European drawers, which Figure 4.6 shows were scattered across
the continent. Many drawers of bills were located in smaller localities – especially in Central
Europe, Scandinavia, Spain, and Italy – from which we conclude that many foreign local firms had
access to London credit facilities. Thus it appears that, at the beginning of the twentieth century,
firms from all around the world could borrow on the London bill market.

149
Figure 4.6: Geographical location of European borrowers (drawers) on the London bill market 27
This map shows the geographical location (at the city level) of all European drawers of sterling bills in our data set.
How could such diverse and geographically widespread borrowers gain access to the London
money market and borrow through sterling bills? The investor in bills of exchange could barely rely
on hard indicators to assess the borrowing firms’ solvency (let alone their honesty), and their
geographical dispersion made it difficult for a distant investor to assess conditions in the various
markets where they operated. It follows that there must have been severe information asymmetries
between borrowing firms and final investors on the London money market. Such market frictions
could well have resulted in credit rationing for borrowers and an absence of lending.81
In order to understand how these frictions were overcome, it is essential to look at the role of
intermediaries in the production of sterling bills. Before it reached the final investor, each bill was
first accepted/guaranteed by an acceptor and subsequently distributed by a discounter.
81 Stiglitz and Weiss, ‘Credit rationing’.

150
4.4.2. The business of accepting
As we have explained, London acceptors were the guarantors of sterling bills. In case the drawer (or
her trading partner) failed to reimburse her debt, the bill remained the acceptor’s liability: she was
still obliged to repay its bearer at maturity. An acceptor was the first exposed when borrowers
defaulted, so she was strongly incentivised to gather detailed information about them.
Among the largest acceptors in the City were the specialised acceptance houses, which accepted
bills drawn by their numerous domestic and foreign clients. Archival records of the merchant bank
Kleinwort & Co. illustrate the role of these houses in producing private information about
borrowers seeking to access the London money market. Founded in 1855, Kleinwort & Co.
gradually established itself as a major acceptance house over the second half of the nineteenth
century; by 1906, it was the leading acceptor of sterling bills (see Table 4.1). The firm typically
offered credit lines under specific conditions to its customers around the globe. Under these
arrangements, Kleinwort & Co. committed to accept bills (up to a certain amount) on account of its
customers. The conditions of the credit lines – in particular, their total amount and the commission
charged for accepting bills – varied as a function of the borrowing firm’s credit standing.82 In order
to obtain information on its clients abroad, the house relied on its large network of foreign
correspondents to produce detailed reports on clients’ positions that described these firms’ origins
and commercial activities while assessing their financial situation (especially their capital) and the
owners’ personal qualities. These reports, which were often written in a foreign language, were
gathered into ‘client information books’ and updated frequently.
The type of information gathered about borrowers could be acquired only through frequent contacts
with those clients and was rarely quantifiable; thus it was ‘soft’ information.83 For example, the
information book on German customers described Heine & Fleich – a family business, located in
Altona (Hamburg), that specialised in the trade of leather, skins, and furs – as a ‘reputable firm’
whose ‘financial situation is favourable’ and is ‘considered solvent for its orders’. This report added
that, ‘on a personal note, the owners are described to us as competent and respectable merchants’.
The case of Kleinworts therefore suggests that acceptance houses acted as relationship bankers
toward their clients who wanted to borrow on the London money market. Through repeated 82 See, for example, the Client Account Ledgers at London Metropolitan Archives, CLC/B/140/KS04/12/22. 83 Stein, ‘Information Production’, p. 1892 defines soft information as ‘information that cannot be directly verified by anyone other than the agent who produces it’. In contrast, hard information is ‘verifiable information, such as the income shown on the borrower’s last several tax returns’.

151
interactions with these clients, acceptance houses gathered private information about bill market
borrowers.84
4.4.3. The special relationship between drawers and acceptors
We hypothesise that, through their information acquisition activities, acceptors made an
indispensable contribution to resolving information asymmetries between borrowers and lenders on
the money market. To provide quantitative evidence for this proposed mechanism, we rely on the
theory of relationship banking. According to this literature, firms on which little public information
is available usually borrow from only one or a small number of creditors.85 Private information
about borrowers can be acquired only through repeated transactions, and there are fixed costs
involved. Therefore, lending to such borrowers is more efficiently handled by one single
intermediary (or a small number of them). In contrast, firms whose standing and creditworthiness
are publicly known will more efficiently borrow from a large set of creditors or directly from the
capital market.86 If the activity of accepting (guaranteeing) bills required private information about
drawers (borrowers), then we should similarly expect the latter’s bills to have been guaranteed by a
small number of acceptors. Yet if the acceptor’s guarantee had solved the information problem on
the bill market, then drawers should have been able to sell their accepted bills to a larger number of
discounters. Hence we check for whether the drawers of sterling bills were, on average, connected
to more discounters than acceptors.
Our empirical strategy consists of comparing how acceptors and discounters (two different
categories of principals) established relationships (or links) with drawers (or agents) on the bill
market. We first focus on the 1,381 drawers whose names appear on at least two non-identical bills
in our data set.87 In Table 4.4, panel A reports the average number of acceptors and discounters per
drawer. Although there are 1,439 different acceptors appearing in our data set and only 145
84 See Boot, ‘Relationship Banking’, p. 10 for a definition of relationship banking. The fee charged by acceptance houses compensated them for these information acquisition activities. On the information role of acceptance houses, see Accominotti, ‘London Merchant Banks’ and ‘ ‘International banking and transmission of the 1931 financial crisis’ and Flandreau and Mesevage, ‘The separation of information and lending’. 85 Diamond, ‘Financial intermediation’; Sharpe, ‘Asymmetric Information’; Diamond ‘Monitoring and reputation’; Rajan, ‘Insiders and Outsiders’; Peterson and Rajan, ‘Benefits of lending relationships’; Berger and Udell, ‘Relationship banking and lines of credit’; Boot, ‘Relationship banking’; Boot and Thakor, ‘Can relationship banking survive competition ?’ 86 Boot and Thakor, ‘Can relationship banking survive competition ?’ 87 Drawers for which only one transaction is recorded were, by construction, linked to just one acceptor and one discounter – which prevents us from drawing any conclusions about the structure of their personal linkages. Among the total of 3,554 drawers, 1,381 appear more than once in our data set.

152
discounters, drawers of bills were on average connected to a smaller number of acceptors (2.83)
than discounters (3.33). Whereas the ratio of the acceptor population to the discounter population is
9.92, the median acceptor-to-discounter ratio of drawers is only 1.16. As shown in panel B of the
table (row ‘All>1/Observed’), about half of the 1,381 drawers whose names appear on more than
one bill had a strictly higher number of discounters than acceptors. In contrast, only 28.67 per cent
of the drawers had more discounters than acceptors. This result holds irrespective of the number of
transactions in which drawers were involved. Both small drawers (whose names appear on a limited
number of bills) and large ones (that were involved in a much higher number of transactions) had,
on average, fewer acceptors than discounters (see panel B, rows ‘Observed’).

153
Table 4.4: Acceptors and discounters per drawer 9
Panel A: Number of Acceptors/Discounters per Drawer
Mean SE Max Min
Acceptors No. of acceptors per drawer 2.83 (0.08) 38 1 % of all acceptors 0.20 (0.01) 2.64 0.07
Discounters No. of discounters per drawer 3.33 (0.08) 36 1 % of all discounters 2.29 (0.05) 24.83 0.69
Panel B: Repartition of Drawers
No. of transactions involved
Total drawers
Discounters > Acceptors
Discounters = Acceptors
Discounters < Acceptors
All > 1 Observed 1,381 50.25% 21.07% 28.67% Simulation 1 1,381 0.79% 89.28% 9.93% Simulation 2 1,381 4.26% 72.21% 23.53% 2 Observed 558 47.67% 26.70% 25.62% Simulation 1 558 0.10% 99.06% 0.85% Simulation 2 558 1.16% 94.65% 4.18% 3 Observed 239 44.35% 30.54% 25.10% Simulation 1 239 0.34% 97.20% 2.46% Simulation 2 239 3.42% 85.26% 11.32% 4 Observed 158 58.86% 13.92% 27.21% Simulation 1 158 0.55% 94.44% 5.01% Simulation 2 158 5.70% 73.00% 21.30% 5–9 Observed 286 55.59% 12.23% 32.16% Simulation 1 286 1.47% 84.39% 14.14% Simulation 2 286 9.50% 46.71% 43.79% 10+ Observed 140 50.00% 8.57% 41.42% Simulation 1 140 3.24% 40.91% 55.85% Simulation 2 140 5.71% 11.67% 82.62%
This table focuses on multi-transaction drawers, or those whose names appear on at least two non-identical bills in our data set. Panel A reports the mean, the standard error, and the maximum and minimum number of multi-transaction drawers per acceptor and discounter. Panel B (Observed) displays the share of multi-transaction drawers with more discounters than acceptors, with as many discounters as acceptors, and with fewer discounters than acceptors. The repartition is shown for all drawers in our data set who have more than one different bill (All > 1) as well as for drawers with different numbers of bills. Panel B (Simulation 1 and Simulation 2) also reports the same repartition in two simulated networks generated on the assumption that links between drawers and acceptors/discounters were formed randomly (for details, see text and the Appendix A.4.A).

154
Does this pattern reflect a true privileged relationship between drawers and acceptors, or does it
arise from pure chance? In other words, given the demography of our network (the relative number
of drawers, acceptors, and discounters), would we obtain the same result if links between agents had
been formed purely randomly? In order to check this, we follow a standard methodology in social
and banking network analysis which consists in comparing observed, ‘real world’ networks to
random ones.88 More precisely, we compare the distribution of drawers’ acceptor-to-discounter ratio
with that of a benchmark network (or ‘null model’) when link formation between drawers and
acceptors/discounters is randomised. To that end, we perform two simulation exercises in which we
generate 100 random networks (based on the Bernoulli graph model) with the same demography as
the observed one but with simulated links (see Appendix A.4.A for details). In Simulation 1,
random networks have the same number of nodes and the same number of links as the actual
network, but we assume that links between nodes were formed in a purely random way – so that
every acceptor/discounter had the same probability of forming a link with a given drawer. In
Simulation 2, we again randomly recombine links between drawers and acceptors/discounters, but
assume that each acceptor/discounter also maintained the same total number of links (with drawers)
in the simulated network as in the actual one. Simulation 2 therefore allows assessing whether the
pattern observed in the data does not arise from the individual characteristics of the nodes and,
especially, the fact that there existed certain influential acceptors/discounters with a greater
likelihood of establishing relationships with drawers. Panel B (rows ‘Simulation 1’ and ‘Simulation
2’) in Table 4.4 classifies drawers in the simulated networks according to whether they had more
acceptors or discounters; Appendix A.4.A provides full details on simulated and observed
distributions of the drawers’ acceptor-to-discounter ratio. Appendix A.4.B provides summary
statistics for various indicators describing the structural properties of the actual and simulated
networks.
If links between nodes had been formed in a random manner, then only a small minority of drawers
would have had more discounters than acceptors (0.79 or 4.26 per cent, versus 50.25 per cent in the
observed network). Some 40 per cent of the drawers in Table 4.4 appear on only two different bills.
If these small, two-transaction drawers had chosen their acceptors/discounters randomly, then an
overwhelming majority of them would have had a different acceptor and a different discounter for
each bill – and therefore as many acceptors as discounters overall. In the actual network, however,
only 26.70 per cent of the two-transaction drawers had as many acceptors as discounters whereas
88 See Wasserman and Faust, Social network analysis Methods and Applications; Nier et al., ‘Network models’; Iori et al., ‘Italian overnight money market’; Chinazzi et al., ‘International financial network’; Craig and von Peter, ‘Interbank tiering’; Martinez-Jaramillo et al., ‘Mexican banking system’s network’.

155
47.67 per cent of them had two discounters but only one acceptor. When instead focusing on the
largest drawers (those that had more than 10 transactions), we see that, in the observed network,
50.00 per cent of them had more discounters than acceptors. By contrast, if these big drawers had
formed their relationships with acceptors and discounters randomly, only a small minority of them
(3.24 or 5.71 per cent) would have had more discounters than acceptors whereas a majority (55.85
or 82.62 per cent) would have established links with a strictly higher number of acceptors than
discounters. Thus the evidence indicates that drawers tended to maintain a few relationships with
acceptors but had access to a larger pool of discounters. Most drawers of bills could deal only with
the limited number of acceptors that held information on them.
Finally, we assess the extent to which acceptors had drawers in common – that is, to what extent
they ‘shared’ drawers. Had acceptors held proprietary information about their drawers, it seems
unlikely that drawers would be shared among acceptors. Our findings support this hypothesis.
Acceptors tended to share very few drawers (and often, none) with other acceptors. In fact, 40
per cent of the acceptors in our data set did not share any of their drawers, and no acceptor shared
drawers with more than 13 per cent of the other acceptors. Yet if the links between drawers and
acceptors had formed randomly, then acceptors would be much more likely to share drawers (see
Appendix A.4.A).
The acceptors’ tendency not to share their drawers is characteristic of markets in which
intermediaries hold proprietary information about their customers. Acceptors specialised in
guaranteeing the debts of a few borrowers, on which they had acquired information and with whom
they had special relationships. The evidence therefore suggests that acceptors played an important
role in producing information about borrowers on the London money market and in overcoming
market frictions.
4.5. Market structure of the accepting and discounting industries
We next explore how information problems shaped the market structure of the accepting and
discounting industries in London. As we have described, the acceptor’s guarantee was crucial in the
investors’ willingness to purchase bills on the money market. Of course, the value of this guarantee
depended heavily on the acceptor’s reputation. Reputational effects could have resulted in a high
concentration of the accepting industry, since a few large acceptors might have been able to capture

156
the reputational rents associated with guaranteeing commercial debts. Indeed, Chapman argues that,
during the second half of the nineteenth century, the accepting business became increasingly
concentrated around a few specialised merchant banks and acceptance houses. 89 At the same time,
the acceptors’ information acquisition activities might have suffered from diseconomies of scale.
Small, decentralised institutions are widely considered to be more efficient (than are large,
hierarchical ones) at acquiring and processing soft information about borrowers.90 The reason is that
the information derived by a bank officer is often difficult for upper management to verify. For
example, the qualitative information that Kleinworts obtained about the owners of Heine & Fleich
could hardly be verified by anyone other than the agent who had produced it. These diseconomies
of scale in the acquisition of soft information could have constrained acceptors’ capacity to grow.
Table 4.5: Market concentration in accepting and discounting 10
Acceptors Discounters
HHI 116.05 422.53 Highest market penetration 9.14% 19.84%
Market share of top actors
Top 3 11.21% 23.07% Top 5 16.63% 33.72% Top 10 28.10% 55.87% Top 15 35.95% 71.69%
This table presents several indicators of market concentration for acceptors and discounters of bills re-discounted by the Bank of England: the HH index, the highest market penetration, and the market share of the top 3, top 5, top 10, and top 15 acceptors and discounters. See text for details on these indicators.
Table 4.5 presents indicators of market concentration in the accepting and discounting industries,
constructed from the sample of bills re-discounted by the Bank of England.91 The table provides
common measures of concentration: the Herfindahl–Hirschman index (HHI),92 highest market
penetration,93 and the market share
94 of the top discounters and acceptors in our data set. According
89 Chapman, Merchant Banking. 90 Stein, ‘Information Production’. 91 The construction of these indicators is based on the number of drawers per acceptor and per discounter. 92 The Herfindahl–Hirschman index is defined as the sum of the squares of the market shares of all market participants. The index ranges from 0 (in the case of a perfectly competitive market) to 10,000 (in the case of a perfectly monopolistic market). 93 A firm’s market penetration is defined as the share of potential customers it reaches. Market ‘penetration’ differs from market ‘share’ in this sense: shares cannot be appropriated by more than one firm, but any number of firms can reach the same customer(s) at the same time. The highest market penetration is the penetration of the firm that reaches the largest

157
to this evidence, the accepting industry did not exhibit a high degree of market concentration. There
is actually much greater concentration in discounting than in accepting: the HHI index is almost
four times higher for discounters than for acceptors, and the greatest market penetration is twice for
discounters what it is for acceptors. Similarly, the top 15 discounters in our data set captured more
than 70 per cent of the market share in discounting, whereas the top 15 acceptors accounted for only
a 35 per cent market share in their activity.95 These results suggest that the very nature of accepting
activities, which required maintaining personal relationships with customers abroad, resulted in
diseconomies of scale and therefore limited market concentration in the industry.
number of potential customers. This metric can range from 0 per cent (when each firm reaches only an infinitesimal share of customers) to 100 per cent (when at least one firm manages to reach all potential customers). 94 We compute the market share by treating each drawer–acceptor and drawer–discounter relationship as the unit portion of the existing market and then computing their sum. Thus we view the accepting (resp. discounting) market as consisting of 6,075 (resp. 6,758) portions. 95 The lower market concentration in accepting is due to the fact that a myriad of small and large acceptors coexisted on the money market apart from the most significant acceptance houses (or merchant banks). Although these houses stood among the most significant acceptors in London, they did not enjoy a dominant position in this market.

158
Figure 4.7: Dual structure of the accepting and discounting industries 28
This figure shows the frequency distribution of acceptors and discounters in terms of the number of drawers to which they were linked.
In Figure 4.7 we report the frequency distribution of acceptors and discounters with regard to the
number of drawers with whom they were connected in the set of re-discounted bills. Both industries
were characterised by a ‘dual’ market structure in that many small actors co-existed with a small
number of much larger ones. Most (64.42 per cent) of the acceptors in our data set were connected
to one drawer only. These small acceptors were usually trading or manufacturing firms, not
financial institutions. At the other end of the spectrum, a small minority (0.83 per cent) of acceptors
were connected with more than a hundred drawers. These included the main commercial banks and
London acceptance houses such as Kleinwort & Co. (the largest acceptor in our data set), which
accepted bills drawn by 325 different drawers.
The discounting industry also exhibited a dual market structure. Among the discounters in our data
set, 35 per cent of them were connected with only one drawer and 35 per cent were connected to
more than 10 drawers. Yet discounters, unlike acceptors, seem not to have faced diseconomies of
0
10
20
30
40
50
60
1 2-10 11-50 51-100 101-200 201-500 >500
Perc
enta
ge
of A
cce
pto
rs/D
isco
un
ters
Number of drawers
Acceptors Discounters

159
scale; those that managed to grow did so to a much greater extent than did acceptors. As a result, a
small number of large discounters dominated the market, while a large number of small ones
undertook much more limited discounting activities. These differences in market structure explain
the higher level of concentration observed in the discounting than in the accepting industry. The
largest discounters included the City’s leading commercial and merchant banks as well as
specialised discount houses such as the Union Discount Company (the largest discounter in our data
set), which purchased bills drawn by 705 different drawers.
4.5.1. The business of discounting
A consequence of the market structure just described – and of the limited market power of the large
acceptance houses – was that a significant share of the bills produced in London were accepted by
small, non-financial firms of modest reputation and on which little public information was
available. How could bills drawn on such small acceptors end up on the money market and be
brought to the final investors’ portfolio?
We argue that discounters played an important role in reducing the risk inherent to these bills. After
being accepted, sterling bills were purchased by a discounter who then distributed them to a final
investor (a re-discounter). In this process, discounters endorsed the bills and added their personal,
secondary guarantee to them – that is, in addition to that of the acceptor. Thus discounters served
two distinct functions on the money market: they not only distributed bills, but also rendered them
more creditworthy.96 In case the acceptor was not itself a well-known house with a solid reputation,
the discounter’s guarantee provided an alternative mechanism through which borrowers could sell
their bills and obtain credit in London.
To investigate this mechanism, we analyse how discounters selected their bills. The Bank of
England categorised discounters into three different types: ‘bankers’ (all commercial banks,
including mostly Anglo-foreign banks), ‘brokers’ (discount houses), and ‘[other] discounters’ (a
mixed bag, which included a variety of UK merchant banks and trading houses).97 Figure 4.8 shows
that these three types of discounters purchased similar proportions of bills drawn on small and large
96 All the discounters in our data set served these two financial functions. Bills recorded in the Bank of England’s Discount
Ledgers had all been endorsed (and thus guaranteed) by the discounter before being resold to the Bank (the re-discounter). 97 Of the 145 discounters in our database, 19 were ‘bankers’ (including three purely domestic banks, one foreign bank, and 15 Anglo-foreign banks), 19 were ‘brokers’ (i.e. discount houses), and 107 were ‘[other] discounters’.

160
acceptors.98 This means that the various discounters, whether small or large, all took part in
distributing the bills accepted by the relatively less well-known, non-financial firms.
Figure 4.8: Discounters’ portfolio of acceptors 29
This figure describes the composition of the aggregate bill portfolios of different types of discounters (discount houses, commercial banks, big ‘[other] discounters’, and small ‘[other] discounters’) by acceptor size. Small ‘[other] discounters’ are those linked to fewer than 18 acceptors, and big ‘[other] discounters’ are those linked to at least 18 acceptors. The size of acceptors (x) is defined as their total number of discounters.
That said, the different discounter types did not all obtain their bills through the same channels.
First, smaller UK trading firms and houses (included in the Bank of England’s ‘other discounter’
category) mostly discounted bills drawn or accepted by their own trading partners. They agreed to
endorse those bills because they were in a business relationship with the drawers or acceptors and
knew there was a sound commercial transaction behind them.
98 There were so many acceptors that it is not possible to identify the activities in which each was involved; also, there was no geographical variation across acceptors because all of them were based in London. Hence we can classify acceptors only in terms of their size, defined as the number of discounters who had purchased their bills. We do know that most small acceptors were merchant or industrial firms, whereas most large acceptors were established financial institutions such as commercial banks and acceptance houses.
0
100
200
300
400
500
600
700
x=1 5>x>1 15>x>5 30>x>15 x>30
Nu
mb
er
of A
cce
pto
rs in
Po
rtfo
lio
Acceptors' Size (Number of Discounters)
Discount Houses Commercial Banks
Big "[Other] Discounters" Small "[Other] Discounters"

161
The largest discounters were (on the one hand) discount houses and (on the other hand) Anglo-
foreign banks, two types that differed in how they obtained their bills. Discount houses specialised
in bill trading. They were in close contact with various acceptors and remitters of bills – London
acceptance houses, banks located in foreign countries, Anglo-foreign banks, and various UK
importers and exporters that accepted bills drawn on them by their trading partners – and purchased
bills through these agents on a daily basis.99
In contrast, foreign and Anglo-foreign banks did not focus exclusively on bill discounting, and their
business was geographically specialised. They maintained a large network of correspondents or
branches in those areas of the world where their activities were concentrated (Jones, 1993). The
correspondents shipped these banks a constant stream of bills drawn by their local customers on
reputable UK financial institutions and acceptance houses as well as on smaller acceptors,
especially trading and manufacturing firms. Foreign and Anglo-foreign banks discounted these bills
upon their arrival in London and then either kept the bills in their respective portfolios or distributed
them to other investors.100
99 Greengrass, Discount Market, pp. 62-65; Vigreux, Crédit par Acceptation, pp. 177-78; Truptil, British banks, p.126; Sayers, Gilletts, p. 37. 100 Greengrass, Discount Market, pp. 64.

162
Figure 4.9: Discounters’ portfolio of drawers 30
This figure plots the level of geographic concentration of each discounter’s portfolio as a function of its size, defined as the number of drawers to whom the discounter is linked. The level of geographic concentration is assessed via the Herfindahl–Hirschman index, defined as the sum of the squares of the market shares of the nine regions in each portfolio; HHI values can range from 1,111 (perfect repartition among the nine regions) to 10,000 (perfect concentration in one region). The graph includes only those discounters (52 of the 145 in our data set) linked to at least 10 drawers. Regions are defined in the text.
The distinction between discount houses and Anglo-foreign banks is clearly apparent when
examining bills re-discounted by the Bank of England. Figure 4.9 focuses on all discounters in our
data set which had at least 10 drawers and plots the geographical concentration of their bill
portfolios (as measured by the HHI)101 against the total number of drawers with whom they were
connected. The figure distinguishes between the three categories of discounters: it includes 12
‘commercial banks’ (including 11 Anglo-foreign banks and 1 foreign bank), 19 ‘discount houses’,
and 21 ‘other discounters’ (merchant banks and trading houses). Our measure of geographical
concentration reflects the different business models adopted by these various discounters. Discount
houses purchased bills drawn on or remitted to London agents with whom they had a relationship
(either directly or through a broker). These bills could be drawn from all around the world, so the
101 The index is constructed based on the geographical distribution of each discounter’s drawers. We classify drawers into nine different regions depending on the city in which they were located.
0
1000
2000
3000
4000
5000
6000
7000
8000
9000
10000
0 100 200 300 400 500 600 700 800
Po
rtfiolio
's G
eo
gra
phic
Co
nce
ntr
ation
(R
eg
ion
al H
HI)
Number of Drawers
Discount Houses Commercial Banks "[Other] Discounters"
Bank of Tarapaca &
Argentina
Chartered Bank of India,
Australia & ChinaUnion Discount Co
National Discount Co Ryder Mills & Co
Canadian Bank of
Commerce

163
bill portfolio of a discount house was highly diversified geographically. But since Anglo-foreign
banks purchased bills through their foreign correspondents, their portfolios were geographically
concentrated.
Figure 4.10: Discount houses versus commercial banks’ portfolios of drawers 31
This figure illustrates the geographical location (via colour key) of the drawers of bills discounted by three discount houses and three Anglo-foreign commercial banks as well as the extent of their representation (via the x-axis percentages) in each institution’s portfolio. Union Discount Co. was linked to 705 drawers, Ryder Mills & Co. to 447, National Discount Co. to 387, Canadian Bank of Commerce to 333, Chartered Bank of India Australia & China to 212, and Bank of Tarapaca & Argentina to 95.
Figure 4.10 shows the geographical composition of bills discounted by six large discounters: three
discount houses (Union Discount Co, Ryder Mills & Co., National Discount Co.) and three Anglo-
foreign banks (Canadian Bank of Commerce, Chartered Bank of India Australia & China, Bank of
Tarapaca & Argentina). We also compare the geographical composition of these discounters’
portfolios with that of the Bank of England’s portfolio (i.e., the aggregate portfolio for all
discounters in our data set). The discount houses’ portfolios did not exhibit any specific
geographical bias, and their portfolios matched the distribution of all drawers in the data set. In
contrast, nearly all the bills endorsed by Anglo-foreign banks originated in the regions where those
0% 20% 40% 60% 80% 100%
Bank of Tarapaca & Argentina
Chartered Bank of IndiaAustralia & China
Canadian Bank of Commerce
National Discount Co.
Ryder Mills & Co.
Union Discount Co.
ALL DISCOUNTERS
USA/Canada
United Kingdom
India/Ceylon
Far East
Latin America
Europe
Africa
Oceania
Other

164
banks specialised: 89 per cent of the bills discounted by the Canadian Bank of Commerce were
drawn from North America, and 85 per cent of those discounted by the Bank of Tarapaca &
Argentina and by the Chartered Bank of India Australia & China originated from (respectively)
Latin America and Asia/Oceania.
Through their wholesale activities, then, discounters helped reducing informational asymmetries by
screening a large share of the bills on the London money market; because a discounter always
endorsed the bills she distributed, their creditworthiness was enhanced by that screening. Although
discounters were generally not in direct contact with drawers, they could supply information on the
other intermediaries involved in a bill’s origination. On the one hand, discount houses endorsed
bills drawn from around the world because they knew the acceptors or remitters (either directly, or
indirectly through the brokers they used and trusted). On the other hand, Anglo-foreign banks
discounted bills originating from specific regions because they were remitted to them by their
foreign correspondents, who had previously screened the drawers. In both cases, discounters
contributed to reducing the credit risks of bills. Hence, discounters’ signatures allowed for a large
number of bills to be sold on the money market despite being drawn on small, unknown acceptors.
4.6. Conclusions
This paper has presented new insights into the structure and industrial organisation of the London
money market during the heyday of the first globalisation. The sterling bill market was a major
pillar of the global financial system and lay at the root of the UK’s financial hegemony during the
years 1875-1914. Our aim is to uncover the foundations of the sterling bill’s high liquidity and
safety and to understand why the London money market remained so robust throughout this period.
We construct an original database that tracks the complete origination and distribution chains for all
bills of exchange re-discounted by the Bank of England in 1906. Although bills re-discounted by
the Bank only constituted a small portion (and were not fully representative) of all sterling bills
issued, a detailed analysis of this sample provides new insights into the microstructure of the money
market at the beginning of the twentieth century. We first show how borrowers from practically
anywhere in the world could borrow on the London bill market. Then we describe the various
mechanisms through which information asymmetries between borrowers and lenders were reduced
on the money market. Market frictions and informational problems were solved thanks to the

165
intervention of London agents (acceptors and discounters) who guaranteed the bills. All successive
intermediaries involved in the origination and distribution of sterling bills contributed to produce
information on the debts underlying them. This ‘screening cascade’ allowed unknown borrowers
from even the most obscure parts of the globe to access money market investors in the world’s
financial capital.
Our analysis therefore reveals the crucial role of information collection – and of case-by-case
screening by intermediaries – in transforming risky private debts into liquid and almost riskless
money market instruments. The complex industrial organisation of the London discount market and
its intermediaries’ human capital and expertise were instrumental in positioning London as the
world’s money market and the UK as the dominant financial power during the first globalisation.
The liquidity and safety of the London money market remained unquestioned until the position of
bill-trading intermediaries, on which its functioning depended, was threatened by First World War’s
financial repercussions.102
102 Roberts, Saving the City.

166
References of the Chapter 4
Accominotti, O. (2012) London Merchant Banks, the Central European Panic, and the Sterling Crisis of 1931. The Journal of Economic History, 72(1), 1–43.
Accominotti, O. (2019) International Banking and Transmission of the 1931 Financial Crisis. The
Economic History Review, 72(1), 260–285.
Accominotti, O., Ugolini, S. (Forthcoming) International Trade Finance from the Origins to the Present: Market Structures, Regulation, and Governance. In Brousseau, E., Glachant, J.M. and Sgard, J. (eds.), The Oxford Handbook of Institutions of International Economic
Governance and Market Regulation. Oxford University Press.
Atkin, J. (2004) The Foreign Exchange Market of London: Development since 1900. Routledge.
Baster, A.S.J. (1935) International Bank. King, London.
Berger, A.N., Udell, G.F. (1995) Relationship Lending and Lines of Credit in Small Firm Finance. The Journal of Business, 68(3), 351–381.
Bignon, V., Flandreau, M., Ugolini, S. (2012) Bagehot for Beginners: The Making of Lender-of-Last-Resort Operations in the Mid-Nineteenth Century. The Economic History Review, 65(2), 580–608.
Boot, A.W.A. (2000) Relationship Banking: What Do We Know. Journal of Financial
Intermediation, 9, 7–25.
Boot, A.W.A., Thakor, A.V. (2000) Can Relationship Banking Survive Competition? The Journal
of Finance, 55(2), 679–713.
Cassis, Y. (2010) Capitals of Capital: The Rise and Fall of International Financial Centres 1780-2009. Cambridge University Press.
Chapman, S. (1984) The Rise of Merchant Banking. Allen & Unwin, London
Chinazzi, M., Fagiolo, G., Reyes, J.A., Schiavo, S. (2013) Post-Mortem Examination of the International Financial Network. Journal of Economic Dynamics and Control, 37(8), 1692–1713.
Clare, G. (1911) The A B C of the Foreign Exchanges: A Practical Guide. London.
Cleaver, G., Cleaver, P. (1985) The Union Discount: A Centenary Album. The Firm, London.
Committee on Finance and Industry (1931) Minutes of Evidence. HM Stationery Office.
Craig, B., Peter, G. von (2014) Interbank Tiering and Money Center Banks. Journal of Financial
Intermediation, 23(3), 322–347.
De Roover, R. (1953) L’évolution de La Lettre de Change, XIVe-XVIIIe Siècles. A. Colin, Paris.
Diamond, D.W. (1984) Financial Intermediation and Delegated Monitoring. The Review of
Economic Studies, 51(3), 393–414.
Diamond, D.W. (1991) Monitoring and Reputation: The Choice between Bank Loans and Directly Placed Debt. Journal of Political Economy, 99(4), 689–721.

167
Eichengreen, B., Flandreau, M. (2016) A Century and a Half of Central Banks, International Reserves, and International Currencies. In Bordo, M.D., Eitrheim, O., Flandreau, M. and Qvigstad, J.F. (eds.), Central Banks at a Crossroads: What Can We Learn from History? Cambridge University Press, New York, pp. 280–318.
Flandreau, M., Jobst, C. (2005) The Ties That Divide: A Network Analysis of the International Monetary System, 1890–1910. The Journal of Economic History, 65(04).
Flandreau, M., Mesevage, G.G. (2014) The Separation of Information and Lending and the Rise of Rating Agencies in the USA (1841–1907). Scandinavian Economic History Review, 62(3), 213–242.
Flandreau, M., Ugolini, S. (2013) Where It All Began: Lending of Last Resort and Bank of England Monitoring during the Overend-Gurney Panic of 1866. In Bordo, M. and Roberds, W. (eds.), The Origins, History, and Future of the Federal Reserve: A Return to Jekyll Island. Cambridge University Press, New York, pp. 113–161.
Fletcher, G.A. (1976) The Discount Houses in London: Principles, Operations and Change. Springer.
Ghatak, M., Guinnane, T.W. (1999) The Economics of Lending with Joint Liability: Theory and Practice. Journal of Development Economics, 60(1), 195–228.
Gillett Brothers Discount Company (1952) The Bill on London: Or, the Finance of Trade by Bills of Exchange. Taylor & Francis.
Goschen, G.J.G. (1876) The Theory of the Foreign Exchanges. London.
Greengrass, H.W. (1931) Discount Market in London: Its Organization and Recent Development. Issac Pitman, London.
Hawtrey, R.G. (1930) Currency and Credit. Longmans, Green, London.
Herger, N. (2018) Interest-Parity Conditions during the Era of the Classical Gold Standard (1880-1914)—Evidence from the Investment Demand for Bills of Exchange in Europe. Swiss
Journal of Economics and Statistics, 154(1).
Iori, G., Masi, G.D., Precup, O.V., Gabbi, G., Caldarelli, G. (2008) A Network Analysis of the Italian Overnight Money Market. Journal of Economic Dynamics and Control, 32(1), 259–278.
Jacob, L.M. (1910) Bank Acceptances. US Government Printing Office, Washington DC.
Jansson, T.W.K. (2018) The Finance-Growth Nexus in Britain, 1850-1913. PhD Thesis, University of Cambridge.
Jobst, C., Ugolini, S. (2016) The Coevolution of Money Markets and Monetary Policy, 1815-2008. In Bordo, M.D., Eitrheim, O., Flandreau, M. and Qvigstad, J.F. (eds.), Central Banks at a
Crossroads: What Can We Learn from History? Cambridge University Press, New York, pp. 145–194.
Jones, G. (1995) British Multinational Banking, 1830-1990. Oxford University Press, Oxford.
Keynes, J.M. (1930) Treatise on Money. In Moggridge, D.E. and Johnson, E.S. (eds.), The
Collected Writings of John Maynard Keynes. Cambridge.
King, W.T.C. (2013) History of the London Discount Market. Routledge, London.

168
Kynaston, D. (2015) The City Of London Volume 2: Golden Years 1890-1914. Random House, London.
Martinez-Jaramillo, S., Alexandrova-Kabadjova, B., Bravo-Benitez, B., Solórzano-Margain, J.P. (2014) An Empirical Study of the Mexican Banking System’s Network and Its Implications for Systemic Risk. Journal of Economic Dynamics and Control, 40, 242–265.
Michie, R.C. (2016) British Banking: Continuity and Change from 1694 to the Present. Oxford University Press, Oxford.
Mollan, S., Michie, R. (2012) The City of London as an International Commercial and Financial Center since 1900. Enterprise & Society, 13(3), 538–587.
Nier, E., Yang, J., Yorulmazer, T., Alentorn, A. (2007) Network Models and Financial Stability. Journal of Economic Dynamics and Control, 31(6), 2033–2060.
Nishimura, S. (1971) The Decline of Inland Bills of Exchange in the London Money Market 1855-1913. Cambridge University Press, Cambridge.
Petersen, M.A., Rajan, R.G. (1994) The Benefits of Lending Relationships: Evidence from Small Business Data. The Journal of Finance, 49(1), 3–37.
Rajan, R.G. (1992) Insiders and Outsiders: The Choice between Informed and Arm’s-Length Debt. The Journal of Finance, 47(4), 1367–1400.
Roberts, R. (2013) Saving the City: The Great Financial Crisis of 1914. Oxford University Press, Oxford.
Roberts, R. (2016) Schröders: Merchants & Bankers. Springer, London.
Santarosa, V.A. (2015) Financing Long-Distance Trade: The Joint Liability Rule and Bills of Exchange in Eighteenth-Century France. The Journal of Economic History, 75(3), 690–719.
Sayers, R.S. (1968) Gilletts in the London Money Market 1867-1967. Clarendon Press, Oxford.
Scammell, W.M. (1968) The London Discount Market. London: Elek, London.
Sharpe, S.A. (1990) Asymmetric Information, Bank Lending, and Implicit Contracts: A Stylized Model of Customer Relationships. The Journal of Finance, 45(4), 1069–1087.
Spalding, W.F. (1921) Foreign Exchange and Foreign Bills in Theory and in Practice. I. Pitman, London.
Stein, J.C. (2002) Information Production and Capital Allocation: Decentralized versus Hierarchical Firms. The Journal of Finance, 57(5), 1891–1921.
Stiglitz, J.E., Weiss, A. (1981) Credit Rationing in Markets with Imperfect Information. The
American Economic Review, 71(3), 393–410.
Truptil, R.J. (1936) British Banks and the London Money Market. J. Cape, London.
Ugolini, S. (2016) Liquidity Management and Central Bank Strength: Bank of England Operations Reloaded, 1889-1910.
Vigreux, P.B. (1932) Le Crédit Par Acceptation. Paris Centre Financier. Velay. Librairie des Sciences Politiques et Sociales, Paris.
Wake, J. (1997) Kleinwort, Benson: The History of Two Families in Banking. Oxford University Press, USA.

169
Warburg, P.M. (1910) The Discount System in Europe. US Government Printing Office, Washington DC.
Wasserman, S., Faust, K. (1994) Social Network Analysis: Methods and Applications. Cambridge university press, Cambridge.
Withers, H. (1920) The Meaning of Money. EP Dutton, New York.

170
A.4. Appendix A: Network simulations
This appendix provides details on the network simulations presented in Section 4.4. The purpose of
these simulations is to assess whether the pattern that emerges from our data set about the number
of links that drawers formed with acceptors versus discounters is not simply an artefact of the
network’s demography (the number of drawers, acceptors and discounters) or of the nodes’
individual properties. Our data shows that drawers on the sterling bill market tended to form fewer
links with acceptors than discounters. But does this pattern differ from what would have been
observed if links between nodes had been formed randomly? To check this, we compare the
structure of the actual network of agents with two simulated benchmarks (or null models) when link
formation between nodes is randomised.
In the first benchmark, Simulation 1, we generate 100 random networks with the same number of
nodes (1,361 multi-transaction drawers, 943 multi-transaction acceptors, and 119 multi-transaction
discounters) and the same number of links as the actual one. We randomly recombine links between
drawers on the one hand and acceptors/discounters on the other hand. This first simulation is based
on a simple conditional U/L distribution103 where the number of nodes and ties is fixed. In this
scenario, each acceptor (resp. discounter) has the same likelihood as any other acceptor (resp.
discounter) to form a link with a drawer. In other words, each acceptor/discounter appears on
roughly the same number of bills.104 Simulation 1 allows us to visualise the distribution of drawers’
acceptor-to-discounter ratios had links between nodes been generated in a purely random fashion.
In our second benchmark, Simulation 2, we generate 100 random networks with the same number
of nodes, the same number of links, and the same degree distribution (the total number of links of
each node) as the actual one. Simulation 2 (known as ‘degree preserving randomisation’ in social
network analysis) therefore better accounts for acceptors/discounters differing in their respective
abilities to form links with drawers. Thus, in the language of social network analysis, we account
103 Wasserman and Faust, Social network analysis Methods and Applications. 104 In order to produce this scenario, we divide the total number of transactions involving the 1,361 multi-transaction drawers (6,715 transactions) by the number of acceptors (943) and the number of discounters (119). We then create two columns: one listing all acceptors and one listing all discounters. In the acceptors’ (respectively, discounters’) column, each acceptor (respectively, discounter) appears as many times as in the observed network (rounded up to the nearest integer value). Thus, since the observed drawer-to-acceptor ratio is 7.12, each acceptor appears 8 times in the acceptors’ column. Since the observed drawer-to-discounter ratio is 56.43, each discounter appears 57 times in the discounters’ column. We then produce simulations through a process of column building by randomly associating drawers in the original drawers’ column with acceptors (respectively, discounters) in the newly-constructed acceptors’ (respectively, discounters’) column. Each recombination of the 6,715 rows constitutes one simulated network. We repeat this procedure 100 times in order to produce 100 different simulated networks.

171
for various nodes having different ‘relational capacities’. In the simulated networks, each node also
has the same total number of links (or degree) as in the actual data. Formally, this random model is
based on a simple U/L distribution with specified in-degree and out-degree.105 This means that each
acceptor/discounter has the same likelihood of forming a link with a drawer in the simulated
network as in the observed network.106 Simulation 2 allows us to check whether the pattern we
observe in the data about drawers’ acceptor-to-discounter ratio does not simply arise from the fact
that various acceptors/discounters had different relational capacities (total number of links).
Figure 4.A.1 plots the frequency distribution of drawers’ acceptor-to-discounter ratio in the actual
data (white bars) together with the frequency distribution of the same variable in random networks
generated according to our two simulations.107 For each of the 100 networks generated through
simulation 1 (resp., simulation 2), a grey tilde (resp., a grey line) indicates the number of drawers
with a given acceptor-to-discounter ratio.
105 Wasserman and Faust, Social network analysis Methods and Applications. 106 This scenario is also produced through a process of column building. Each actor’s likelihood to appear is unchanged with respect to the observed data. In order to produce a simulated network, we now simply recombine the original acceptors’ and discounters’ columns while keeping the original drawers’ column fixed. Hence, each acceptor and discounter has as many transactions in the simulated network as in the observed one, while the pattern of these transactions is redefined randomly. We then repeat this procedure 100 times in order to produce 100 simulated networks. 107 In order to check if the actual and simulated distributions of drawers’ acceptor-to-discounter ratios are statistically-significantly different from each other, we perform a two-sample Kolmogorov-Smirnov (KS) test. The KS test is a non-parametric test which allows comparing two cumulative distribution functions under the null hypothesis that the two distributions are equal. The test compares the unaggregated frequency distribution of our actual network with the unaggregated frequency distribution of each random network we generate. For each simulated network, the test shows p-values close to 0, indicating that the frequency distributions of the actual and random networks are statistically-significantly different from each other. The KS statistic represents the maximum distance between two compared distributions. This statistic ranges from 0.4909 to 0.5018 when comparing the actual distribution of the acceptor-to-discounter ratio to the 100 distributions generated through Simulation 1. It ranges from 0.4569 to 0.4772 when comparing the actual distribution to the 100 distributions generated through Simulation 2. This indicates that all simulated distributions are far apart from the actual distribution (even though, as expected, the distance between actual and simulated distributions is smaller in the case of Simulation 2).

172
Figure 4.A.1: Acceptor/discounter ratios: Observed versus simulated 32
The figure plots the frequency distribution of the 1,381 multi-transaction drawers according to their acceptor-to-discounter ratio (denoted by x on the horizontal axis) in the observed network (white bars) as well as in simulation 1 (grey tildes) and simulation 2 (grey lines). Drawers for whom x < 1 are linked to more discounters than acceptors. Drawers for whom x = 1 are linked to as many discounters as acceptors. Drawers for whom x > 1 are linked to more acceptors than discounters. Each tilde (line) indicates the number of drawers in the corresponding decile for each of the 100 simulations (we do not report a tilde or line when there is no drawer in the corresponding decile).
In the actual network, most drawers have an acceptor-to-discounter ratio that is strictly less than 1
(i.e., they have fewer acceptors than discounters). But if links between nodes had been generated
randomly, then (a) an overwhelming majority of drawers would have displayed an acceptor-to-
discounter ratio of exactly 1 – that is, an equal number of acceptors and discounters – and (b) a
higher proportion of drawers would have exhibited a ratio strictly greater than 1 (more acceptors
than discounters) than strictly less than 1 (more discounters than acceptors). This outcome reflects
that the network includes more acceptors than discounters. It is also worth noting that more outliers
appear in the observed network than in the simulated ones, which suggests that the determinants of
link formation behaviour varied greatly for different actors.

173
Finally, we investigate the extent to which acceptors (discounters) had drawers in common.
Figure 4.A.2 reports the frequency distribution of acceptors (panel A) and discounters (panel B)
according to the percentage (x) of fellow acceptors/discounters with whom they shared at least one
drawer.108 In each case, we report the observed distribution (white bars) in the actual network as
well as the distributions in the simulated networks obtained through simulation 1 (grey tildes) and
simulation 2 (grey lines).
108 We equally perform a KS test to compare the actual and simulated distributions of these variables. For the acceptors’ ‘shared drawers’ variable, we find p-values close to zero indicating that the actual and simulated distributions are statistically significantly different from each other; the maximum distance between the actual distribution and the 100 distributions generated ranges from 0.7400 to 0.7665 for Simulation 1, and from 0.2605 to 0.3148 for Simulation 2. In the case of the discounters’ ‘shared drawers’ variable, p-values are again close to zero; the maximum distance between the actual distribution and the 100 distributions generated is always equal to 1.000 for Simulation 1,while it ranges from 0.2206 to 0.3379 for Simulation 2.

174
Figure 4.A.2: Shared drawers: Observed versus simulated 33
This figure plots the frequency distribution of acceptors (panel A) and discounters (panel B) according to the percentage (x) of fellow acceptors/discounters with whom they share at least one drawer in the observed network (white bars) as well as in simulation 1 (grey tildes) and simulation 2 (grey lines). Acceptors/discounters for which x = 0 do not share any drawer with any of their peers, whereas acceptors/discounters for which x = 100 share at least one drawer (not necessarily the same) with all other fellow acceptors/discounters. Each tilde (line) indicates the number of drawers in the corresponding decile for each of the 100 simulations (we do not report a tilde or line when there is no drawer in the corresponding decile).

175
In the observed distributions we can see that acceptors were less likely than discounters to share
drawers with their peers: 40 per cent of the acceptors in our data set did not share any of their
drawers with other acceptors, although more than 75 per cent of the discounters shared at least one
drawer with other discounters. No acceptor shared a drawer with more than 13 per cent of the other
acceptors, but a sizable group of discounters shared drawers with more than 40 per cent of their
fellow discounters.
If links between drawers and acceptors had been formed randomly, then acceptors would (on
average) have shared more drawers among them than they actually did (Figure 4.A.2, panel A).
This means that the tendency of acceptors not to share drawers, which we observe in the data, is due
not to our network’s structural characteristics but rather to structural factors in the formation of
links between drawers and acceptors. The low amount of sharing observed among acceptors in the
actual data strongly suggests that they held private information on drawers.
In panel B of the figure we see that discounters were divided into two groups. The small discounters
in our data set shared, on average, fewer drawers than predicted by the simulations; however, large
discounters shared as many drawers as predicted for the case of randomly formed links between
drawers and discounters. These results indicate that, unlike the acceptors, large discounters did not
hold proprietary information on the drawers.

176
A.4. Appendix B: Network analysis – Descriptive statistics
This appendix provides descriptive statistics on the network of agents involved in the origination
and distribution of bills re-discounted by the Bank of England in 1906. We also provide similar
statistics for simulated, random networks (null models, see text and appendix A.4.A).
This figure provides a schematic representation of the links between a triad of nodes (or agents) appearing on a same bill of exchange.
As shown in figure 4.B.1, our relational unit is a triad involving three roles (drawer-acceptor-
discounter). A bill always involves a direct link between its drawer and its acceptor as well as a
direct link between its acceptor and its discounter. This means that an indirect relationship also
exists between its drawer and its discounter (through the acceptor). Formally, the relation between
agents forming a bill’s triad is a compound relation. This specific feature of our network has
implications for the interpretation of standard descriptive indicators used in network analysis. These
indicators assume that the relational unit of analysis is a dyad (rather than a triad). In the case of our
network, this means that standard measures do not account for the indirect relationship that exists
between drawers and discounters. This makes the interpretation of standard indicators less
straightforward. For example, since an acceptor always lays in the middle of each triad, descriptive
measures based on the degree or paths (geodesic distances) will tend to overestimate the structural
importance of acceptors in the network. The descriptive network measures presented below are
therefore not directly comparable to those produced for modern banking networks.
Drawer Acceptor Discounter
Figure 4.B.1: Links between a triad of nodes appearing on a bill of exchange 34

177
Table 4.B.1: Node centrality - Summary statistics 11
In-degree Out-degree All-degree
Min Mean Max Min Mean Max Min Mean Max
Actual 0 2.10 357 0 2.10 50 1 4.20 375
Simulation 1 0 2.10 48 0 2.10 10 1 4.20 54
Simulation 2 0 2.10 357 0 2.10 50 1 4.20 375
Closeness Betweenness Eigenvector centrality
Min Mean Max Min Mean Max Min Mean Max
Actual 0.00 0.03 0.03 0.00 0.00 0.02 0.00 0.00 0.19
Simulation 1 0.17 0.21 0.30 0.00 0.00 0.01 0.00 0.01 0.14
Simulation 2 0.00 0.14 0.43 0.00 0.00 0.01 0.00 0.00 0.34
This table reports summary statistics of various node centrality indicators for the actual network of money market agents as well as for the random networks generated through Simulations 1 and 2 (see text and appendix A.4.A for details on the simulations). For each simulation, Min (Max) correspond to the minimum (maximum) value of the indicator across all nodes in the 100 simulated random networks and Mean corresponds to the mean value of each indicator across all 100 networks generated. By construction, each node in the networks generated through Simulation 2 has the same degree as in the actual network. Sources: see text.
Table 4.B.1 reports summary statistics about the importance (or centrality) of the various nodes in
the network. A first measure of centrality is the degree which corresponds to the total number of
links each node has. A node’s in-degree is equal the total number of links received. In our network,
the in-degree corresponds to the total number of dyadic relationships in which a given node plays
the role of acceptor of bills drawn by another node or of discounter of bills accepted by another
node. A node’s out-degree is equal to the number of links sent. In our network, a node’s out-degree
is equal to the total number of dyadic relationships in which a given node plays the role of drawer
of bills accepted by another node or of guarantor of bills discounted by another node.
A second way of measuring a node’s centrality is through its distance or path to other nodes (the
number of steps the node needs to reach other nodes in the network). There exist two standard
distance-based measures of node centrality. First, closeness measures how close a node is from all
other nodes in the network. It is defined as the inverse of the sum of the lengths of the shortest
paths (or geodesic distances) between a given node and all other nodes in the network. Closeness is
usually associated to the node’s capacity to impact the rest of the network. A second distance-based
indicator is betweenness which measures the extent to which a given node acts as an intermediary
between other nodes in the network. It is computed by calculating the number of times a node lays
on the shortest path between two other nodes in the network (as a fraction of the total number of

178
shortest paths between all pairs of nodes in the network). Betweenness therefore measures a given
node’s ability to control relationships between other nodes.
Another standard indicator is eigenvector centrality, which measures a node’s centrality through the
centrality of the other nodes with which it is linked. Eigenvector centrality is a weighted degree
centrality measure as it weighs a node’s links according to their importance.
Table 4.B.1 reports summary statistics for each of these indicators in the actual network and in the
random networkq²s generated through Simulations 1 and 2.
Table 4.B.2: Network’s structural properties – Descriptive statistics 12
Actual Simulation 1 Simulation 2
Min Mean Max Min Mean Max
Clustering 0.038 0.002 0.002 0.003 0.018 0.020 0.021
Closeness centralization 0.002 0.152 0.161 0.178 0.009 0.089 0.317
Betweenness centralization 0.017 0.004 0.006 0.009 0.005 0.009 0.013
Main component 99.3 100 100 100 99.7 99.9 100
Average path length 4.819 6.194 6.973 7.726 4.047 4.253 4.496
This table reports descriptive statistics on the structural properties of the actual network of money market agents as well as of the random networks generated through Simulations 1 and 2 (see text and appendix A.4.A for details on the simulations). For each simulation, the table reports the minimum, maximum, and mean value of each indicator across all 100 simulated networks. Sources: see text.
In Table 4.B.2, we also report additional descriptive statistics on the structural properties of the
actual and random networks. Clustering (sometimes called transitivity) is an indicator of the
presence of groups of nodes exhibiting relatively more dense interconnections between them. It is
computed as the share of all possible sets of three nodes that actually display a complete
interconnection. Closeness (respectively, betweenness) centralization is an indicator of the degree
of inequality in closeness (respectively, betweenness) among nodes in the entire network.
Centralization is computed as the sum of the differences between the most central node’s centrality
indicator and that of each other node in the network. The values range from 0 to 1, where values
close to 0 indicate low inequality across nodes. A component is a set of nodes which are all
connected to each other by a path. The main component refers to the share of nodes which belong to
the largest component in the network. A main component of 100 therefore indicates that all nodes in
the network are directly or indirectly connected with each other. Finally, the network’s average

179
path distance is defined as the average geodesic distance (or number of steps) between all pairs of
nodes. This measure provides information about how relatively close nodes are.
Table 4.B.2 reports the value of each of these indicators for the actual network as well as for the
random networks. In the case of random networks, the table reports the range and mean of each
measure across the 100 generated networks. Overall, the actual network exhibits higher clustering
than the random ones, suggesting that interconnections do not emerge by chance. The actual
network also exhibits lower closeness centralization, but higher betweenness centralization than
randomly generated networks. This suggests that there were relatively few highly central agents (in
terms of closeness) on the bill market, but a few agents nevertheless exhibited strong ability to
control relationships between other nodes. The actual network’s main component takes a value of
99.3, indicating that only 0.7 per cent of nodes were isolated: this is only slightly lower than the
values found in simulated networks. Finally, the actual network’s average path length is 4.82, which
is close to the average path length in random networks generated through degree preserving
randomization (Simulation 2).

180

181
Chapter 5 – Bank substitutability and
financial network resilience: insights
from the first globalization
Abstract: The recent literature on financial network resilience has paid relatively less attention to the
dimension of substitutability than to interconnectedness. In this paper, we apply a simple technique
to simulate the upper-bound effects of bank defaults on firms’ access to credit at the global level during the first globalization (1880-1914). We find that, in stark contrast to today’s financial networks, in the early 20th century the global network displayed considerable resilience to shocks,
as the level of substitutability of all banks was relatively high. This finding has implications for
regulators, as it shows that a financial network not featuring highly-systemic banks can (and did)
actually exist.
Keywords: money market; bill of exchange; financial network resilience; substitutability; chain-based methodology
JEL codes: B40, E42, G23, L14, N20
This chapter is a working paper co-authored with Olivier Accominotti (London School of Economics and CEPR) and Stefano Ugolini (Sciences Po Toulouse), which will be submitted for publication in the near future. The London School of Economics has kindly provided the financial support for the collection of the data used in this chapter.

182
5.1. Introduction
Since the 2008 crisis, academics and policymakers have been deeply concerned with the question of
the identification of systemic actors in financial systems. Traditionally, regulators had been mostly
identifying systemic intermediaries according to their size (the “too-big-to-fail approach”), but the
catastrophic effects generated by the fall of Lehman Brothers (a relatively small bank) brought to
light the multidimensional nature of systemicness. In 2013, the Basel Committee on Banking
Supervision (BCBS) and the Financial Stability Board (FSB) jointly published new guidelines for
the assessment of systemicness, based on five different dimensions of the concept: size,
interconnectedness, substitutability, complexity, and cross-jurisdictional activity (BCBS, 2013).109
Among these five dimensions, interconnectedness is the one that has attracted larger academic
attention in the last decade or so: many scholars have been applying network analysis and
simulation techniques in order to identify “too-interconnected-to-fail” actors, thus reaching a
number of important conclusions about the structural properties and resilience of modern financial
networks. By contrast, substitutability has attracted relatively less attention to date. Assessing
substitutability has however proved particularly problematic (Benoit et al., 2019), leading regulators
to revise their guidelines under this respect (BCBS, 2018).
In this paper, we use simple network analysis and simulation techniques in order to assess more
specifically the relationship between actors’ substitutability and financial network resilience. Our
approach is straightforward: we provide an upper-bound evaluation of network disruption due to
financial shocks by looking at how many actors remain isolated once intermediaries are removed.
This is an upper-bound estimation as it rests on the (very strong) assumption that no other financial
relationship can exist except those that are actually observed – meaning that an agent will lose
market access if the intermediaries to which she is connected do default. Applying this
methodology to contemporary financial networks yields very catastrophic results: networks break
down as central nodes are removed, thus pointing to the high degree of unsubstitutability of a few
actors (see e.g. Pröpper et al., 2008). This result might be taken as a confirmation of the conclusion
(a general one for studies based on contemporary data) that financial networks inevitably feature a
few highly systemic actors. However, in this paper we apply this methodology to an historical
109 Size is defined as the total size of the bank’s liabilities. Interconnectedness consists of the network of contractual obligations that characterize the bank’s activities. Substitutability (sometimes referred to as “financial institution infrastructure”) is defined as the bank’s importance as a provider of client services. Complexity consists of the business, structural, and operational complexity of the bank (i.e., its involvement in sophisticated activities such as derivatives or other off-balance-sheet exposures). Cross-jurisdictional activity is the geographical dispersion of the bank’s activities (BCBS, 2013).

183
financial network and we reach very different conclusions: in our case study, node removal never
generates sizable damage in the network, thus pointing to low levels of systemicness for all actors.
Note that our case study does not consist of an idiosyncratic, peripheral financial market from an
obscure historical epoch, but no less than the global money market at the heyday of the first
globalization (1880-1914), when the international economy reached levels of interconnectedness
comparable to those of the late 20th century (O’Rourke and Williamson, 2002). We are therefore
able to provide, for the first time, evidence that a financial network featuring can exist and did
actually exist globally at a time of high international integration. In our view, this finding yields
potentially important implications for regulators.
The rest of the paper is organized as follows. Section 5.2 reviews the recent literature applying
network analysis and simulation techniques, and highlights the originality of our paper. Section 5.3
describes our data and details our empirical strategy. Section 5.4 presents our results. Section 5.5
concludes and offers some speculations for regulators.
5.2. Literature review
5.2.1. Financial stability and network analysis: introduction
The 2008 crisis has proved that the failure of relatively small but highly interconnected
intermediaries can lead to a large-scale breakdown of the financial system, generating huge
economic and social costs. As a result, the study of the topology of financial systems, mobilizing
network analysis techniques, has gained considerable momentum in recent years. The
“macroprudential” network perspective questions the traditional “microprudential” assumption that
the financial system is safe as long as each individual intermediary is safe, and highlights the
importance of relational structures as a driving factor of the robustness of the system. The
pioneering work of Allen and Gale (2000) has been the first to underline the role of the topology of
the financial network, and more concretely its connectivity, on default contagion. Another founding
block of this literature is the work of Freixas et al. (2000), who focused on the structural importance
that some individual actors may acquire, and urged regulators to switch from the traditional “too-
big-to-fail” approach to a “too-connected-to-fail” approach. Since then, the number of studies
taking a network perspective has increased, addressing both the effect of network structure on the
dynamics and resilience of the financial systems and the processes of network formation (Allen and
184
Babus, 2009). Useful surveys of this substantial research effort include Glasserman and Young
(2016), Battiston and Martinez-Jaramillo (2018), Caccioli et al. (2018), and Iori and Mantegna
(2018).
In this section, we do not aim to provide an exhaustive summary of this literature, but only to focus
on the aspects that are more relevant from the perspective. The first one is the question of the
availability of information about financial interlinkages – an issue that has “daunted” a large part of
the research that has been conducted so far. The second one has to do with the typologies of
network structures that the literature has been finding (or generating) while dealing with financial
networks. The third aspect we focus on is the way in which shocks are simulated in order to test the
resilience of network structures. Last (but not least), we look at the interconnection between
financial and non-financial networks, in order to see how the transmission of financial shocks to the
real economy has been tackled by the literature.
5.2.2. Data availability
The issue of the nature and treatment of data has been seldom addressed from a critical perspective.
Most financial markets, especially interbank markets, are characterized by a high degree of opacity
concerning the distribution and size of financial exposures (Espinosa-Vega and Solé, 2010; Upper,
2011; Blasques et al., 2015). As a natural strategy, researchers have often chosen to make
estimations of the exchanges when primary data were not available, inferring bilateral credit
relationships from balance sheet or payments data (Furfine, 1999; Upper and Worms, 2004; Allen
and Babus, 2009; Upper, 2011). It is through this practice that it has been possible to reconstruct the
structure of the interbank networks of e.g. Switzerland (Sheldon and Maurer, 1998), Austria (Boss
et al., 2004), Belgium (Degryse and Nguyen, 2004), Germany (Upper and Worms, 2004), the UK
(Wetherilt et al., 2010), or the US (Bech and Atalay, 2010).
Since the quality of an analysis depends on the quality of its data, these estimation practices have
been criticized (Upper, 2011). Some comparative analyses have pointed to some serious problems
in using estimated data. For instance, after comparing simulated and actual data on the Italian
interbank network, Mistrulli (2011) concluded that simulations may overstate contagion. More
recently, Anand et al. (2018) performed a ‘horse race’ between different methods for reconstructing
complete interbank networks from incomplete datasets, only to conclude that no optimal method
does actually exist. As a result, while relatively rare, original databases on actual network structures

185
are naturally superior and potentially more insightful (Iori and Mantegna, 2018, pp. 651-3). This
justifies the wealth of research that has been conducted on the Italian interbank network, which is
the only one for which complete transaction data are actually available (see e.g. Iori et al., 2008;
Fricke and Lux, 2015a, 2015b; Iori et al., 2015; Temizsoy et al., 2015).
Another important limitation of many of the researches in this literature is the fact that the nature of
the databases they rely on is actually strictly national. Papers taking an international perspective
only look at country-country linkages rather than individual linkages (Espinosa-Vega and Solé,
2010; Minoiu and Reyes, 2013; Chinazzi et al., 2013; Minoiu et al., 2015). One exception is the
research conducted on syndicated loan networks (Hale et al., 2016; Cai et al., 2018), but this is
based on data from a rather “niche” market whose representativeness of the broader interbank
network remains unclear. As a result, to the best of our knowledge, no database on the global
financial network has been available to researchers to date.
5.2.3. Network structures
Reconstructing the structural properties of financial networks is key in order to assess their
resilience to shocks and its implications for policymakers. One very relevant property is the
presence of a core-periphery structure, which can be measured through several indicators as the
degree distribution110 or the level of disassortativity.111 The idea is to identify if there exists a small
group of highly-connected actors centralizing flows and thus playing the role of “hubs”. This has
important implications in terms of the vulnerability of the network to shocks. As much as in the
general literature on networks (e.g. Albert et al., 2000; Newman, 2003), in the financial literature
core-periphery structures present a high degree of robustness to random shocks to individual actors,
but they become extremely fragile when shocks involve actors playing the role of hubs – a situation
known as the “robust-yet-fragile” tendency (Gai and Kapadia, 2010).
Empirical studies on modern financial networks generally found core-periphery structures (in some
cases referred as scale-free structures)112 with high levels of disassortativity (Craig and Von Peter,
110 The hierarchy refers to the distribution of the nodes’ degree in a network, and a network is hierarchical if a small number of actors are significantly higher than most actors in the network. 111 The assortativity is a measure of similarity usually based on node degree correlation, and a network is assortative if nodes with high/low degree are connected to actors with also high/low degree. 112 In theory, core-periphery and scale-free structures are not the same thing. In practice, however, it is difficult to discriminate between the two in empirical investigations. The reasons why this is the case are explained by Iori and Mantegna (2018, p. 645).

186
2014). This is the case of domestic interbank networks e.g. in Austria (Boss et al., 2004), Germany
(Upper and Worms, 2004), Switzerland (Müller, 2006), the UK (Wetherilt et al., 2010), or the US
(Soramäki et al., 2007). Analyses of the global country-to-country financial network (Minoiu and
Reyes, 2013; Chinazzi et al., 2013) equally found evidence of core-periphery, disassortative
networks. In the words of Fricke and Lux (2015b, p. 391), “a similar hierarchical structure […]
might be classified as a new ‘stylized fact’ of modern interbank networks”.
Only a minority of empirical studies found evidence of less hierarchical structures, featuring a
weaker core-periphery structure and lower levels of disassortativity. This was viz. the case for
domestic interbank networks in Italy (Iori et al., 2008; Fricke and Lux, 2015a), the Netherlands
(Blasques et al., 2015), and Mexico (Martinez-Jaramillo et al., 2014). These findings have led some
authors to criticize the use of scale-free models in the reconstruction of network structures from
partial data (Martinez-Jaramillo et al., 2014; Fricke and Lux, 2015a; Anand et al., 2018).
5.2.4. Shock simulations
The network approach is a useful way to represent contagion due to externalities, but different types
of mechanisms can generate financial contagion: these include defaults, distress that is not
conducive to default, the common structure of assets, or the common structure of liabilities
(Battiston and Martinez-Jaramillo, 2018, pp. 7-8). As the concern of our paper is with market
access, we limit our review to the question of defaults. As a matter of fact, this is the issue that has
been vastly dominating the literature on financial network resilience. Since the pioneering work of
Allen and Gale (2000), several papers have applied shock simulation techniques (sometimes drawn
from epidemiologic models) in order to understand if and how “epidemies” (cascades) of defaults
might develop in financial networks (see esp. Gai and Kapadia, 2010).
Two main approaches to the modelling of default cascades can be found in the literature. The most
common one has been initiated by the seminal paper of Eisenberg and Noe (2001), who modelled
default cascades in the payment network as a function of interbank exposures: every node suffers a
shock from its incoming links and spreads it proportionally through its outcoming links. Eisenberg
and Noe’s (2001) “fictitious default algorithm” has been used and developed by a number of
scholars (including e.g. Müller, 2006; Battiston et al., 2012a, 2012b; Acemoglu et al., 2015;
Glasserman and Young, 2015) in order to simulate “domino effects” in the interbank market. This
methodology yields several advantages, but it also has some drawbacks. The first one is that it

187
requires very restrictive assumptions on the way contagion spreads across the network: the
behaviour of each node is necessarily mechanical, which casts doubts on its usefulness for policy
guidance (Allen and Babus, 2009; Upper, 2011). The second drawback is that this methodology is
very much demanding in terms of information, as it requires complete interbank exposures to be
known. As such information is often unavailable, however, the precondition to its application is that
complete interbank exposures are reconstructed from partial data through some estimation
techniques (see above), which raises doubts on its adequacy to represent real-world shocks.
An alternative (and much simpler) methodology consists of merely suppressing defaulting nodes,
and thus measuring the damage that such suppressions generate to the network’s connectivity. This
methodology is quite popular in network analysis (see e.g. Albert et al., 2000; Newman, 2003;
Cohen and Havlin, 2010; Li et al., 2015), although less so in the study of financial networks (one
example is Pröpper et al., 2008). It is obviously less sophisticated than the Eisenberg-Noe approach,
but it has the clear advantage of being much less demanding in terms of information, as it only
requires the general structure of the network (and not the weight of each link) to be known. In our
study, we opt for this simpler methodology, which appears to be more suited for studies focused on
the concept of market access and actor substitutability.
5.2.5. Bank-firm networks
The overwhelming share of the network-based literature on financial contagion has focused on
interactions between financial intermediaries (bank-bank networks). Only a handful of papers have
managed to go beyond this limitation, by adding to bank-bank links also bank-firm links. As a
matter of fact, bank-firm relationships are essential to understanding the transmission of financial
contagion to the real economy, but the availability data on such relationships has been very limited
to date. The few cases for which information has been made available include Japan (De Masi et al.,
2011), Italy (De Masi and Gallegati, 2012), and Brazil (Silva et al., 2018). The “stylized facts”
retrieved from such empirical investigations have inspired the model of Lux (2016), which allows
simulating the spillovers of financial contagion from bank-bank to bank-firm relationships.
One common feature of all these papers is the fact of representing bank-bank and bank-firm links as
two different layers of the same multiplex network. This kind of representation has a number of
advantages, yet the analysis of interactions between the different layers of multiplex financial
networks still remains in its infancy (Battiston and Martinez-Jaramillo, 2018, pp. 11-3; Iori and

188
Mantegna, 2018, pp. 647-8). Moreover, representing bank-bank and bank-firm relationships as de
facto two different (albeit interconnected) networks may obfuscate the gatekeeping role often
played by financial actors. As a matter of fact, banks lending to firms are most often used to
refinancing themselves from other banks, thus only playing the role of “bridges” between the
borrower and the ultimate lender. In such a case, the “bridging” function implemented by
gatekeepers is lost in this kind of representation (on this point, also see Bonacich et al., 2004). As
we want to focus specifically on this function, we therefore opt not to represent our data through a
multiplex network, but rather through a hypergraph (see below, Section 5.3.2). To our knowledge,
we are the first ones to do so in the literature on financial contagion.
5.2.6. Literature review: summary
Our review of the network-based literature on financial contagion allows drawing a number of
considerations. a) The crucial role of network structures in determining the path and extent of
financial contagion is now universally acknowledged for contemporary financial systems. b) This
notwithstanding, only limited information on the complete structure of financial networks is
available to date, and scholars have been forced to reconstruct such structures through estimation
techniques that present some inconveniences; moreover, most papers have had to take a strictly
national perspective, as very limited information exist on global financial networks. c) Based on the
above-mentioned reconstructions, most papers have tended conclude that financial networks
inevitably assume hierarchical core-periphery structures characterized by a high level of
disassortativity; only a minority of papers have nuanced (albeit only partially) this very stark view.
d) Simulations of “default cascades” have mostly been based on a number of restrictive
assumptions, which may limit their ability to represent real-world crises. e) Only a handful of
papers have been concerned with the transmission of financial contagion from bank-bank to bank-
firm relationships; in all cases, the two types of relationships have been represented as different
layers of a multiplex network, yet this does not allow appreciating the “bridging” role (between
borrowing firms and lending banks) actually played by some banks.
Our paper is therefore original under many respects. a) To the best of our knowledge, this is the first
paper to investigate the role of network structures in financial contagion from an historical
perspective. b) It is based on observed data on actual financial connectivity rather than on estimated
data; moreover, it features data on the global financial network rather than national data. c) In
contrast to the findings of the literature on contemporary systems, we evidence the existence of a

189
financial network with a rather weak core-periphery structure and low levels of disassortativity. d)
Finally, our data features information not only on bank-bank relationships, but also on bank-firm
relationships; moreover, we are the first to focus specifically on the gatekeeping role of banks by
representing bank-bank-firm relationships as continuous chains (see below, Section 5.3.2).
5.3. Empirical strategy
5.3.1. Data
Our empirical analysis is based on an original database of global financial interlinkages at the time
of the first globalization (1880-1914). In those times, London was the unrivalled global financial
centre and the sterling-denominated bill of exchange was the staple international money market
instrument (Accominotti and Ugolini, forthcoming). Painstakingly hand-collected from archival
sources, our dataset includes information on 23,493 bills of exchange issued on the sterling money
market during the calendar year 1906. A detailed discussion on the nature and representativeness of
these data can be found in our historical companion paper (Chapter 4).
As illustrated by Figure 5.1, the origination and distribution of a bill of exchange always involved at
least three fundamental actors: one borrower (the “drawer”, a firm), one guarantor (the “acceptor”,
an intermediary), and one lender (the “discounter”, generally a bank or a money market fund). As
our archival source provides systematic information on all three roles for each bill, we are therefore
able to track all borrower-guarantor (“firm-bank”) and guarantor-lender (“bank-bank”)
relationships: this allows us drawing the complete network of interlinkages for the core global
money market of the time. We end up with a static network of 4,970 nodes: of these, only 1,680
Firm-Bank Relationship
Drawer (Borrower)
Acceptor (Guarantor)
Discounter (Lender)
Bank-Bank Relationship
Figure 5.1: The origination and distribution chain of a bill of exchange 35

190
(33.80%) were located in London, while the rest was spread throughout the five continents (Chapter
4).
5.3.2. Chains
As said (see above, Section 5.2.5), all of the papers studying the effects of financial contagion on
the real sector have treated firm-bank and bank-bank relationships as two different layers of a
multiplex network. In this paper, we make a different choice. In order to keep the unity of the
borrower-guarantor-lender relationship, we treat each bill as a three-unit chain or triad (drawer-
acceptor-discounter), which is a hyperedge of a hypergraph (forming a hyperstructure)113. (Criado
et al., 2010). More formally, within a population of individuals V, a bill is a chain Ci defined as a
non-empty set (i, j, k) ∊ V where it exists a borrower-guarantor relationship ( iTj ) and a guarantor-
lender relationship ( jUk )114: so Ci =(iTjUk) ∀ {i, j, k} ∈ V ∧ {T, U} ∈ R. Additionally, we define a
network of chains as a hypergraph H=(V, E) / ∀ Ci ∃ Ei, or in other words, every chain Ci
corresponds to an edge or hyperedge Ei. Representing chains as hyperedges of a hypergraph
(forming a hyperstructure) allows preserving the unity and configuration of the chains.
Additionally, hypergraphs provide a flexible analytical framework that allows using simple social
network measures that cannot be applied to multilayer networks without further adjustments, as e.g.
several types of degree centrality (see below).
We are not the first ones to use hypergraphs as a way to preserve supra-dyadic structures. Bonacich
et al. (2004), Estrada and Rodríguez-Velázquez (2006), and Battiston et al. (2020) all stressed that
traditional dyadic-based graphs do not provide a complete description of complex real-world
systems, and recommended the use of hypergraphs to study “higher-order” (i.e., supra-dyadic)
systems. However, common hypergraph approaches (including the ones mobilized in the three
above-mentioned works) do not allow preserving the internal configuration of supra-dyadic
structures, because they do not reproduce the links existing between individuals and the positions
occupied by nodes within such structures. This problem can be solved through the introduction of
hyperstructures, as suggested by Criado et al. (2010). To illustrate their intuition, these authors give
113 A hypergraph is a generalization of a graph in which an edge (called hyperedge) groups one or several nodes, and every node is related to a hyperedge. A hyperstructure is an association between an adjacent matrix – which indicates every dyadic link between nodes – and a hypergraph – which groups one or several nodes of the adjacent matrix by hyperedges. Thus, a hyperstructure is a hypergraph which includes every dyadic link between nodes. 114 Note that nodes’ specialization is not absolute: in theory, each actor can play all three roles. In our data, however, “hybrid” nodes are relatively rare (see below, Section 5.4.2).

191
the example of a subway network. This network is composed by the subway stations (the nodes)
and the trunks between them (the links). Stations and trunks are grouped as subway lines, which can
be considered as substructures of the subway network. Two stations may be separated by the same
number of trunks, but a traveller moving between the two will face quite a different situation if the
stations are on the same line or not. In order to take this into account, it is convenient to consider the
whole subway network as a hypergraph and the single subway line as hyperedges. Then, the
hyperstructure will consist of the combination of an adjacency matrix (representing all the stations
and the trunks between them) and a hypergraph (where each hyperedge is a subway line, grouping
all its stations and branches). Criado et al. (2010) only considered hyperstructures with symmetric
(non-oriented) relations. Our contributions extend their original intuition by considering
hyperstructures with directed (oriented) relations.
5.3.3. Shock simulations in chains
In order to test the resilience of the resulting financial network to shocks, we opt for simple node
removal simulations (see above, Section 5.2.4). Specifically, we alternatively simulate the removal
of individual upstream nodes (guarantors or lenders, i.e. the nodes situated in position 2 or 3 of each
chain), and we examine the impact of the suppression in terms of loss of market access for
downstream nodes (borrowers and guarantors, i.e. the nodes situated in position 1 or 2 of each
chain).115 Thus, the structural relevance of each removed node is measured as the number of
downstream actors who are strictly dependent on it in order to obtain market access (i.e, to be
connected to an upstream actor). A downstream actor is considered as independent if it is connected
to other nodes providing it with access market (i.e., if it has other paths to reach an upstream actor).
The number of downstream actors losing market access in case of the removal of an upstream actor
is thus taken as the indicator of the degree of substitutability of the latter.
115 Note that in using the terms “upstream” and “downstream” we do not refer to the direction of links as represented in Figure 5.1 (going from borrowers to lenders through guarantors), but rather to the direction of credit (flowing from lenders to borrowers through guarantors). This is due to our focalization on market access: under this respect, borrowers are actually “downstream” as they depend on market access provided by “upstream” lenders.

192
Figure 5.2: A fictive example of four different chains connecting six agents 36
The example provided in Figure 5.2 helps clarifying the rationale of our methodology. The figure
visualizes four different chains (i.e. four different bills of exchange, each one represented as a
coloured series of arrows). Each chain involves one borrower (position 1 from left to right), one
guarantor (position 2), and one lender (position 3). In this example, nodes A and D are specialized
as borrowers, nodes B and E are specialized as guarantors, and nodes C and F are specialized as
lenders. If we remove node C (a lender), node A (a borrower) loses market access as no alternative
upstream path exists for it. In other words, if node C disappears, all the chains in which it is
involved (blue and green arrows) also disappears, and this includes the link between A and B, thus
making borrower A isolated. By contrast, the suppression of lender C has no impact on market
access for borrower D, as the latter is linked to another lender (i.e. node F) via a compound
relationship through guarantor E (represented by the red arrows). Notice that if we had implemented
a traditional node removal without paying attention to the compound nature of the relationship, the
suppression of lender C would have had no impact on the connectivity of borrower A. This,
however, would have been oblivious of the reality of market access: as a matter of fact, in reality
lender F is unwilling to lend to borrower A, and this path is therefore actually unavailable to A. This
underlines the importance of preserving the integrity of actual chains while simulating shocks.
Concretely, we proceed as follows. In our network defined by the hypergraph H=(V, E) / ∀ Ci ∃ Ei
of chains Ci = (i,j,k) defined by (iTj ∪ jUk), consider an element x ∈ (jUk) (i.e., an upstream actor,
acceptor or discounter). Any element y ∈ Ci ∧ y ≠ x has an alternative access to the market if ∃ Cj : x ∉ Cj ∧ y ∈ Cj. On other words, we first identify all the chains in which the given element plays the
upstream role of acceptor or discounter (we call it the reference set for this element), and we single
out all the other actors involved in these chains. Then we check if each of the individual
downstream actors of the reference set is present in any other of the chains in our dataset. If an actor
is already present in at least one other chain, we consider it as having an alternative market access:
thus, the node is not strictly dependent on the upstream element, as it does not get isolated when the
latter disappears. To the contrary, if the actor is not present in any other chain, we consider it as not

193
having any alternative market access: thus, the node is strictly dependent on the upstream element,
as it gets isolated when the latter disappears.
5.4. Results
5.4.1. Results: Introduction
In order to test our network’s resilience to individual defaults, we proceed as follows. In Section
5.4.2, we provide some descriptive statistics on the network and its structure. In Section 5.4.3, we
first apply the methodology described above (Section 5.3.3) and measure the absolute impact of the
suppression of individual nodes – viz., the number of nodes that remain isolated following the
default of each intermediary. We find that the systemic damage generated by the suppression of
individual nodes is always relatively limited, which points to a low degree of unsubstitutability for
all nodes. This is our baseline result. In the subsequent sections, we perform a number of robustness
checks.
In Section 5.4.4, we ask whether some nodes might have displayed some “local” systemicness: to
tackle this question, we measure the relative impact of the suppression of individual nodes – viz.,
the share of the total downstream nodes that remain isolated. We find that some nodes did display
some local unsubstitutability, yet this was mainly the case for nodes with low rather than high
absolute impact.
In Section 5.4.5, we measure the “group” systemicness of some (exogenously-defined) groups of
intermediaries that are recognized to have played an extremely relevant role in the global financial
system. We find that, even in the most catastrophic scenarios (in which an entire segment of the
financial sector defaults), our network does not break down completely – which points to relatively
low levels of unsubstitutability even for crucial segments of the financial sector.
In Section 5.4.6, we ask whether some nodes might have displayed some “geographic”
systemicness – viz., if their removal would leave some geographic locations cut off from the global
financial network. We find that some nodes did display some local unsubstitutability, yet this was
mainly the case for nodes with low rather than high absolute impact.

194
Finally, in Section 5.4.7 we measure the degree of vulnerability of geographic locations throughout
the world to the default of financial intermediaries in London. We find that on average most cities
displayed a relatively limited level of vulnerability, and that such a level was insensitive to city size.
Therefore, all robustness checks are consistent with our baseline result, suggesting that the early-
20th-century global financial network displayed a high degree of resilience to individual defaults
and was not prone to the “robust-yet-fragile” tendency.
5.4.2. Descriptive statistics
In this section we provide some descriptive statistics concerning the population of our network, and
present its macro structure by comparing its degree distribution to simulated both random and free-
scale degree distributions.
As explained above (see Figure 5.1), each chain is formed by the sequence of the three roles, where
acceptors and discounters may be located only in London, while drawers may be located anywhere
in the world (including London). While most individuals are specialized in one role, some take
several roles (we call them “hybrids”). Table 5.1 shows the distribution of individuals by role and
location, as well as the proportion they represent with respect to the total population and to the
population of actors located in London.
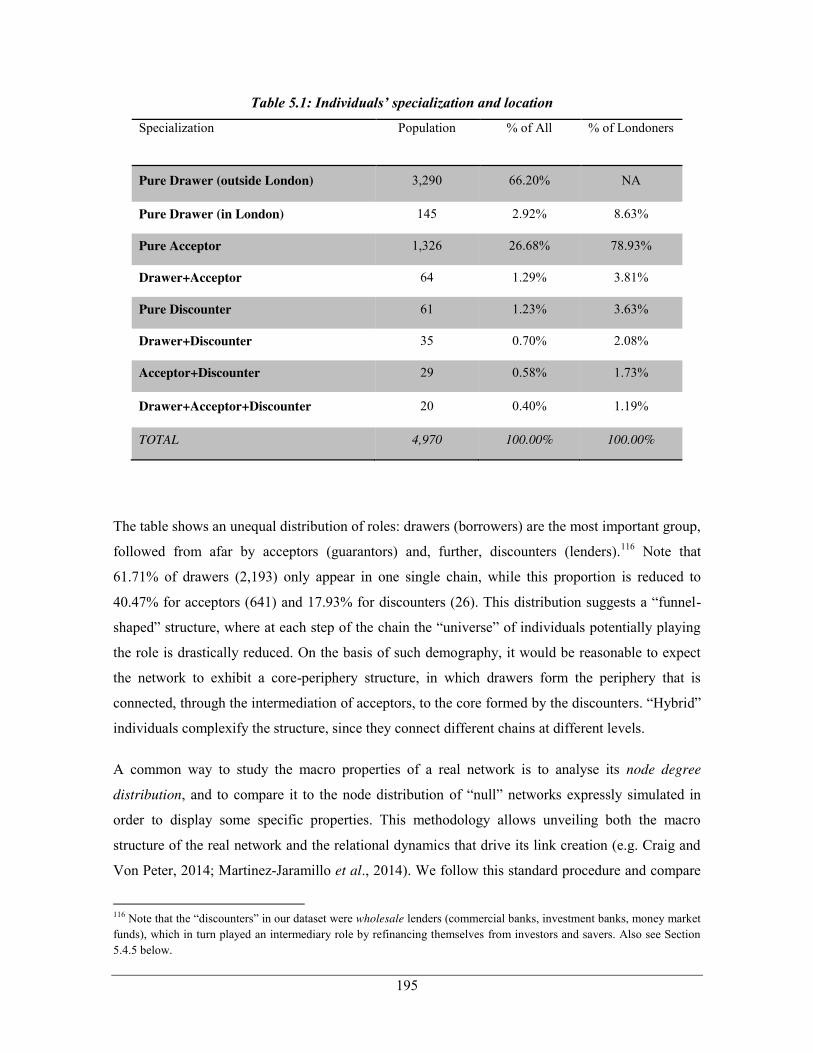
195
Table 5.1: Individuals’ specialization and location 13
Specialization Population % of All % of Londoners
Pure Drawer (outside London) 3,290 66.20% NA
Pure Drawer (in London) 145 2.92% 8.63%
Pure Acceptor 1,326 26.68% 78.93%
Drawer+Acceptor 64 1.29% 3.81%
Pure Discounter 61 1.23% 3.63%
Drawer+Discounter 35 0.70% 2.08%
Acceptor+Discounter 29 0.58% 1.73%
Drawer+Acceptor+Discounter 20 0.40% 1.19%
TOTAL 4,970 100.00% 100.00%
The table shows an unequal distribution of roles: drawers (borrowers) are the most important group,
followed from afar by acceptors (guarantors) and, further, discounters (lenders).116 Note that
61.71% of drawers (2,193) only appear in one single chain, while this proportion is reduced to
40.47% for acceptors (641) and 17.93% for discounters (26). This distribution suggests a “funnel-
shaped” structure, where at each step of the chain the “universe” of individuals potentially playing
the role is drastically reduced. On the basis of such demography, it would be reasonable to expect
the network to exhibit a core-periphery structure, in which drawers form the periphery that is
connected, through the intermediation of acceptors, to the core formed by the discounters. “Hybrid”
individuals complexify the structure, since they connect different chains at different levels.
A common way to study the macro properties of a real network is to analyse its node degree
distribution, and to compare it to the node distribution of “null” networks expressly simulated in
order to display some specific properties. This methodology allows unveiling both the macro
structure of the real network and the relational dynamics that drive its link creation (e.g. Craig and
Von Peter, 2014; Martinez-Jaramillo et al., 2014). We follow this standard procedure and compare
116 Note that the “discounters” in our dataset were wholesale lenders (commercial banks, investment banks, money market funds), which in turn played an intermediary role by refinancing themselves from investors and savers. Also see Section 5.4.5 below.

196
the node degree distribution of our observed network to the degree distribution of 100 simulated
random (Erdös-Renyi) networks and 100 simulated scale-free networks displaying the same
demography of the observed ones. On the one hand, because in random networks any two
individuals have the same probability to be linked to each other, simulated random networks are
used as baselines (e.g. Iori et al., 2015; Chinazzi et al., 2013) in order to unveil the existence of any
relational dynamics (i.e. any kind of biases) guiding link creation and the formation of the macro
structure of the network. On the other hand, simulated scale-free networks are used as baseline in
order to unveil the existence of one specific relational dynamic – viz., the preferential attachment
dynamics, which is conducive to core-periphery macro structures (e.g. Martinez-Jaramillo et al.,
2014; Iori and Mantegna, 2018). Following the preferential attachment principle, individuals tend to
connect preferentially to well-connected actors rather than to poorly-connected ones: this generates
core-periphery structures, where most of the population connect to a small group of well-connected
individuals. As said above (Section 2c), empirical investigations have mostly found core-periphery
structures in modern interbank systems.
Hypergraphs allow for great flexibility in the definition of network measures, including the node
degree (Battiston et al., 2020; Kapoor et al., 2013). In order to properly describe the macro structure
of our network, we use three different definitions of node degree: 1) the node’s in-degree, defined
as the number of its adjacent nodes linked by an input-arc; 2) the node’s hyperedge degree, defined
as the number of node’s incident hyperedges – i.e., the number of hyperedges (in our case, chains)
in which an individual is involved; and 3) the node’s hyperedge’s adjacent nodes degree, defined as
the number of nodes that belong to the same hyperedge (chain).
To build the simulated networks, we keep the original drawers-bills distribution (i.e., we consider
that the bills’ origin does not change, so each drawer preserves its original number of bills) as well
as the original number of individuals in the acceptor and discounter roles. Consequently, simulated
networks preserve the same demography and number of chains of the observed network.
Figure 5.3a-c compares (for each of our three definitions of node degree) the degree distributions of
our observed network, 100 simulated random networks, and 100 simulated scale-free networks.
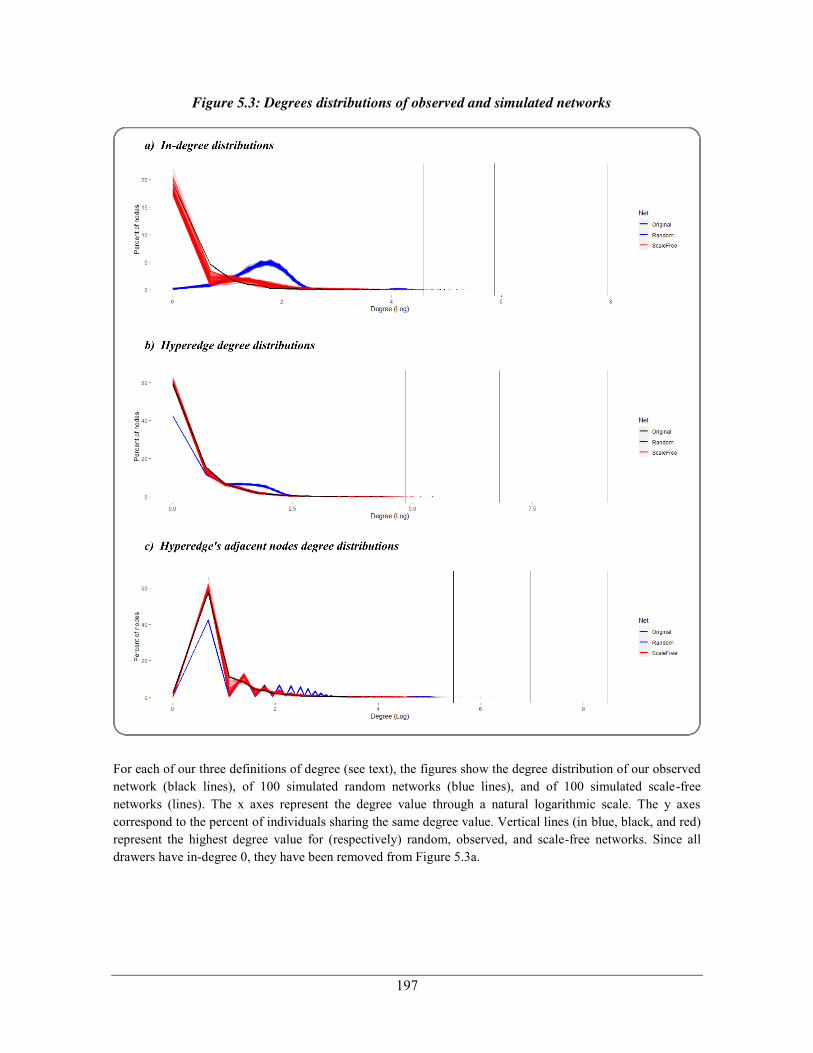
197
Figure 5.3: Degrees distributions of observed and simulated networks 37
For each of our three definitions of degree (see text), the figures show the degree distribution of our observed network (black lines), of 100 simulated random networks (blue lines), and of 100 simulated scale-free networks (lines). The x axes represent the degree value through a natural logarithmic scale. The y axes correspond to the percent of individuals sharing the same degree value. Vertical lines (in blue, black, and red) represent the highest degree value for (respectively) random, observed, and scale-free networks. Since all drawers have in-degree 0, they have been removed from Figure 5.3a.

198
Three features emerge from Figure 5.3a-c. First, the degree distributions of our observed network
are very different from those of random networks, which highlights the presence of some kind of
relational dynamics in link creation. Second, the degree distributions of the observed network are
more similar to, yet still somewhat different from those of free-scale networks. Third, regarding the
highest degree for each type of distribution (vertical lines), the ones of the observed network is
situated between those of random and those of free-scale networks. These elements suggest that,
although there do exist some relational dynamics determining the link creation behaviour, these
dynamics do not perfectly follow a preferential-attachment rule, which would be conducive to a
core-periphery macro structure.
Some interesting features emerge from a more detailed observation. Hyperedges’ adjacent nodes
degree distributions exhibit irregular shapes (peaks), esp. in simulated networks (see Figure 5.3c).
The first peak is formed by the first three degree values and is common to all types of networks.
The first value (corresponding to degree 1) represents an atypical situation in which an individual is
involved in chains (usually, one single bill) that include only one other individual – i.e., the chain
has one individual appearing twice in two different roles. This is due to the existence of “hybrid”
individuals intervening at different steps of the same chain.117 The presence of this type of
behaviour is higher (2.11% of individuals) in the observed network since some intentionality, and
not only a statistical probability, is required for this kind of combination to occur. The degree value
2 (top of the peak) is very common (57.56% of individuals in the observed network), and represents
a situation where the individual is involved in one or several chains with two other individuals. This
situation is typical for drawers, especially those involved in one only transaction. Higher degree
values necessarily require the individual to be involved in several chains. The situation where
several chains link the individual to three other ones (degree 3) is very unusual in the simulated
networks but not in the observed network. This is also the case for higher degree values.
To sum up, the demography of our network would, a first sight, suggest the existence a core-
periphery macro structure (as modern interbank networks). Although at this stage we cannot
completely reject the “null” hypothesis that link formation in our network is dictated by a
preferential attachment rule, the presence of very highly interconnected nodes (represented by the
highest degree values) is much lower in our observed network than in simulated free-scale networks
with the same demography. This suggests that the sort of “mega-hubs” found in present-day
117 In our data, this situation occurs in case the same individual plays at the same time the role of drawer (borrower) and discounter (lender) of the same bill. This apparent paradox is due to the fact that discounters were wholesale lenders, and used bills as collateral for refinancing their operations with retail lenders: in some cases, some discounters “created” bills in order to refinance themselves under the guarantee of an acceptor (Chapter 4).

199
interbank networks did not exist in the early-20th-century global financial network. In what follows,
we will address this question more specifically.
5.4.3. Absolute systemicness
As explained in Section 5.3.3, our methodology assumes that removal from the network of one
individual implies that the operations (bills) in which it is involved cannot be performed, and the
impact of this removal is measured by the number of individuals who strictly depend on those very
chains for their market access. As said, this is an upper bound estimate of the degree of
unsubstitutability of upstream actors, as it rests on the assumption that downstream actors will not
have any chance to connect to any other upstream actor – which is a very restrictive assumption
indeed. Thus, in order to assess the absolute systemicness of individuals, we remove them one by
one from the network, we identify the chains that are impacted, and we count how many individuals
are left isolated. We only focus on the absolute systemicness of individuals playing the upstream
role of acceptor (guarantor) and/or discounter (lender), which means a total of 1,535 individuals.
We do not consider individuals playing the role of drawers (borrowers): since they are located in the
beginning of chains, their systemicness is by construction equal to zero.
For each individual i, we compute: (a) the Acceptor Impact AImpi, which is the number of
individuals who remain isolated when the individual i is removed from her acceptor role; (b) the
Discounter Impact DImpi, which is the number of individuals who remain isolated when the
individual i is removed from her discounter role; (c) the Total Impact TImpi, which is the number of
individuals who remain isolated when the individual i is removed from her acceptor/discounter role;
(d) the Total Impact Rate TImpRi = (TImpi / (n-1))*100, which is percent of all actors n of the
network who remain isolated when the individual i is removed; and (e) the Market Share MSi = (ni
/ (n-1) )*100, which is the share of all the actors in the network (n) who are involved in the same
chains as individual i (ni).

200
Figure 5.4: Node removal – Absolute systemicness 38
Market Share (x axis) and Total Impact Rate (y axis) of the 1,535 individuals playing the upstream role of acceptor and/or discounter. The names of the individuals displaying a Total Impact Rate higher than 2% (13 individuals) are reported.
In Figure 5.4, we compare the Total Impact Rate and the Market Share of all 1,535 upstream actors.
Two main features emerge from the picture. The first and most important one is that the Total
Impact Rate is low for all actors: only two actors do impact more than 4% of market participants if
they are removed (i.e. Union Discount Co with 7.83%, and Anglo Foreign Banking Co with
5.41%), while as many as 597 upstream actors have no impact at all. Table 5.2 provides more
details on the 31 individuals who have a Total Impact Rate exceeding 1%. As also shown in Figure
5.4, Union Discount Co is by far the biggest actor in the network, with a market share of 21.23%.
However, its removal impacts only 7.83% of the network (389 actors), which is relatively low. The
following five individuals in the ranking are either pure discounters or hybrids who mainly play the
role of discounters. The most systemic pure acceptor, Kleinworth Sons & Co, only comes seventh
in the general ranking, with an Absolute Impact Rate of 2.92% in spite of a market share of 7.51%.

201
Thus, the ranking appears to be dominated by discounters, and esp. by discount houses (money
market funds). We shall come back to this issue in Section 5.4.5.
Table 5.2: Descriptive statistics of the 31 most systemic individuals 14
Rank Name Acceptor
Impact
Discounter
Impact
Total
Impact
Total
Impact
Rate
Market
Share Category
1 Union Discount Co 0 389 389 7.829 21.232 DH 2 Anglo Foreign Banking Co 4 265 269 5.414 11.491 AF 3 Canadian Bank of Commerce 8 192 197 3.965 9.600 AF 4 National Discount Co 0 195 195 3.924 13.141 DH 5 Lubbock Schmidt & Co 0 182 182 3.663 9.720 MB 6 B W Blydenstein & Co 9 167 175 3.522 10.928 MB 7 Kleinwort Sons & Co 145 0 145 2.918 7.507 MB 8 Samuel Montagu & Co 0 143 143 2.878 7.024 MB 9 Hohler & Co 0 119 119 2.395 11.773 DH 10 Chartered Bank of India
Australia & China 9 109 118 2.375 8.171 AF
11 Allen Harvey & Ross 0 113 113 2.274 7.466 DH 12 Ryder Mills & Co 0 111 111 2.234 12.618 DH 13 Baker Duncombe & Co 0 102 102 2.053 9.841 DH 14 King & Foa 0 99 99 1.992 8.151 DH 15 Roger Cunliffe Sons & Co 0 89 89 1.791 6.178 DH 16 Baring Bros & Co Ltd 61 27 88 1.771 5.897 MB 17 Haarbleicher & Schumann 0 79 79 1.590 6.943 DH 18 Huth & Co, F 57 13 69 1.389 5.474 MB 19 Brown Shipley & Co 66 0 66 1.328 3.763 MB 20 Ruffer & Sons 65 0 65 1.308 3.884 MB 21 Lloyd's Bank 62 0 62 1.248 3.260 CB 22 Brightwen & Co 0 60 60 1.207 5.876 DH 23 London & Hanseatic Bank 42 19 59 1.187 4.689 AF 24 Bank of Tarapaca & Argentina 27 31 57 1.147 4.307 AF 25 Parr's Bank 57 1 57 1.147 3.461 CB 26 Brandt's Sons & Co, William 55 0 55 1.107 4.307 MB 27 Lazard Bros & Co 25 31 55 1.107 3.663 MB 28 Schroder & Co, J H 55 0 55 1.107 4.387 MB 29 Alexanders & Co 0 54 54 1.087 3.723 DH 30 London City & Midland Bank 53 0 53 1.067 3.341 CB 31 Wallace Bros 23 29 50 1.006 2.495 MB
Acceptor Impact, Discounter Impact, Total Impact, and Market Share for the 31 most systemic individuals (see text). Note that the Total Impact may not be equal to the sum of Acceptor Impact and Discounter Impact, because although the same drawer may be impacted twice by the suppression of the upstream individual on

202
whom she depends both as an acceptor of her bills and as a discounter of her bills, she would not show up twice in the Total Impact of the upstream individual. For each of the 31 most systemic actors, we also indicate the category it belongs to: discount house (DH), Anglo-foreign bank (AF), merchant bank (MB), or clearing bank (CB). More on these categories in Section 5.4.5.
Therefore, our upper-bound estimates of the degree of unsubstitutability of actors in the early-20th-
century global financial network suggest that, contrary to nowadays’ interbank networks (Gai and
Kapadia, 2010), the system was not prone to the “robust-yet-fragile” tendency, as it did not feature
any “mega-hub”. This is our baseline result.
The second feature emerging from Figure 5.4 is that the vast majority of dots are situated well
below the diagonal of the graph: only individuals with very low Market Share values are close to
the diagonal. Individuals are plotted on the diagonal when, following their removal, 100% of their
downstream actors lose market access: the farther the dots are from the diagonal, the lesser the
degree of dependence of their downstream actors. The figure suggests that most upstream
individuals “punch well below their weight” in terms of their unsubstitutability for their
downstream actors. We investigate this issue in Section 5.4.4.
5.4.4. Local systemicness
We define local systemicness an individual’s degree of unsubstitutability for the downstream actors
who are connected to it through one or more chains. We compute for each individual i: (a) the
Acceptor Local Impact Rate ALocImpRi = AImpi / (Ani -1) , where AImpi is the Acceptor Impact
and Ani is the number of partners (number of actors involved in the same bills) of i when i plays the
role of acceptor; (b) the Discounter Local Impact Rate DLocImpRi = DImpi / (Dni -1) , where
DImpi is the Discounter Impact and Dni is the number of partners of i when i plays the role of
discounter; and (c) the Local Impact Rate LocImpRi = TImpi / (ni -1), where TImpi is the Total
Impact and ni is the overall number of partners of i.

203
Figure 5.5: Node removal – Absolute vs Local systemicness 39
Total Impact Rate (x axis) and Local Impact Rate (y axis) of the 1,535 upstream actors.
Figure 5.5 shows that on average, local systemicness tends to be roughly stable (24.93%) across
levels of absolute systemicness. Unsurprisingly, there is a lot of dispersion in local systemicness for
low levels of absolute systemicness. This is because these actors are involved into a limited number
of chains, so there is a size effect on the rate. A simple illustration is provided by the case of a
discounter involved into one only bill: the discounter’s absolute systemicness is always very low
(because a maximum of two downstream actors are impacted by her removal), but if both drawer
and acceptor lose market access her local systemicness will be equal to 100% – while it will be only
equal to 0% if none of the two is impacted. Interestingly, in Figure 5.5 actors involved in the
accepting business appear to display, on average, higher levels of local systemicness than pure
discounters. It is therefore legitimate to ask whether in the accepting business (i.e., in bank-firm
relationships), downstream actors’ level of dependence on upstream ones might have been higher
than in the discounting business (i.e., in bank-bank relationships).

204
Figure 5.6: Local systemicness by acceptor-discounter roles 40
Number of partners as acceptor (light blue), Acceptor Local Impact (dark blue), number of partners as discounter (light red), and Discounter Local Impact (dark red) for the 31 individuals with a Total Impact Rate exceeding 1% (ranked according to their Total Impact).
In order to answer this question, Figure 5.6 compares the Acceptor Local Impact and the Discounter
Local Impact for the 31 actors with highest absolute systemicness (see Table 5.2). In general, the
Acceptor Local Impact Rate is actually higher than the Discounter Local Impact Rate. Thus,
downstream actors appear to have displayed a relatively higher level of dependence on acceptors
than on discounters. However, some exceptions did actually exist. For instance, we can see in
Figure 5.6 that the two individuals with the second and third highest absolute systemicness, Anglo
Foreign Banking Co and Canadian Bank of Commerce (two hybrid actors), both displayed an
Acceptor Local Rate that was lower than their Discounter Local Rate.

205
Figure 5.7: Frequency distribution of Local Impact Rate – Acceptors and discounters 41
Frequency distribution of Local Impact Rate values for acceptors (Figure 5.7a) and for discounters (Figure 5.7b).
To delve deeper into this question, Figures 5.7a and 5.7b provide the frequency distribution of
Local Impact Rate values for acceptors and discounters. Figure 5.7a shows that a significant share
of acceptors displayed a Local Impact Rate that was close or equal to 50%, yet only a handful of
them surpassed the 50% threshold. On the contrary, Figure 5.7b shows that most discounters
displayed a much lower Local Impact Rate, yet a more sizable share of them surpassed the 50%
threshold. However, it must be noted that all of these locally-systemic discounters were very small.
Within the 25 discounters whose Local Impact Rate was higher than 50%, the mean size (defined as
the number of chains in which they were involved) was equal to 6.36 and the median size was equal
to 2.
To sum up, not only absolute systemicness, but also local systemicness was generally low for all
actors, except for some very small actors. This suggests that the failure of any actor would have
produced limited damage not only to the general architecture of the financial network, but also to
single regions of it. Local systemicness tended to be higher in the accepting business than in the
discounting business, whereas absolute systemicness was generally higher for discounters than for
acceptors.

206
5.4.5. Group systemicness
Table 5.2 revealed that no single actor in our network displayed high levels of absolute
systemicness. However, it also unveiled the high occurrence of some specific categories of market
participants (esp. discount houses) within the list of the relatively less substitutable actors. This
might mean that even though no single actor was systemically important per se, a shock affecting
one group of similar actors (which is often the case in real-world financial crisis) might have broken
down the entire system nonetheless. In order to test this hypothesis, we now examine the
cumulative absolute systemicness of four exogenously-defined groups (representing entire segments
of the financial sector) which may be suspected to have played a crucial role in the network: we
remove entire groups from the network, and check whether their removal causes the breakdown of
the whole network as a result.
On the basis of qualitative historical evidence, we single out four groups of potentially highly-
systemic actors: 1) the twenty discount houses eligible for rediscount at the Bank of England – i.e.,
money market funds of the time, investing big amounts of their clients’ funds into bills (Chapter 4);
2) the forty-five Anglo-foreign banks eligible for rediscount at the Bank of England – i.e., UK-based
multinational commercial banks (Jones, 1993); 3) the top ten merchant banks or “acceptance
houses” – i.e., the globally-renowned investment banks which were market leaders in the business
of guaranteeing bills (Chapman, 1984); and 4) the eleven top clearing banks which dominated the
domestic commercial banking business in the UK (Sykes, 1926).
Table 5.3: Total impact, impact by roles and market share 15
Groups Acceptor
Impact
Discounter
Impact
Total
Impact
Total Impact
Rate
Market
Share
Discount Houses (N=20)
17 2095 2094 42.141 65.656
Anglo Foreign Banks (N=45)
389 867 1053 21.191 40.609
Top10 Merchant Banks (N=10)
554 49 569 11.451 22.258
Clearing Banks (N=11)
284 1 281 5.655 11.554
Acceptor Impact, Discounter Impact, Total Impact, and Market Share for 4 exogenously-determined groups of top specialized financial intermediaries (see text).

207
The results of our simulations are reported in Table 5.3. They confirm that money market funds
(discount houses) overwhelmingly dominated the population of discounters, with a market share of
65.66%. The upper-bound estimate of the nodes becoming isolated in the (highly unlikely)
catastrophic scenario of a total destruction of this crucial segment of the financial sector is equal to
42.14%. This is quite a significant damage, but it falls short of breaking down the entire backbone
of the financial network. All other groups display a much lower Total Impact Rate: 21.19% for
Anglo-foreign banks, 11.45% for the top ten merchant banks, and 5.65% for the clearing banks.
Unsurprisingly, a linear relation appears to exist between Market Share and Total Impact Rate. On
the whole, even the removal of entire segments of the financial sector does not entail the collapse of
the network.
5.4.6. Geographic systemicness
Assessing the geographic systemicness of upstream actors is yet another way to study the resilience
of a system. Financial intermediaries in London might have been specialized along geographic
lines, and this might have been conducive to some form of dependence for some regions on some
specific actor to access to the market. Thus, if drawers from a region or a city were used to access
the market only via one acceptor and/or one discounter specialized in that particular region or city,
the failure of these actors would have implied the loss of the access to the London bills market for
this part of the world.
In order to test for this particular variant of local systemicness, we use the drawers’ location data to
test the dependence of cities around the world (617 in our database, including London itself) on
individual upstream actors to access to the London bill market. Similarly to previous analyses, we
identify the number of drawers who lose market access when an individual playing the role of
acceptor and/or discounter is removed. Naturally, all cities which are connected to London only
through one single chain are very vulnerable (257 cities), because they have an absolute dependence
on one acceptor and one discounter. Table 5.4 gives the frequency distribution of our 617 cities
according to the number of drawers they feature. It shows that

208
Table 5.4: Frequency distribution of cities according to their number of drawers 16
# Drawers # Cities Examples
1 331 Aarau; Athens (Georgia); Bayonne; Birmingham (Alabama); Botosani; La Plata; Munich; Ravilloles; Saigon; Toowoomba; etc.
2-5 172 Alicante; Barcelona; Chiasso; Coimbatore; Florence; Managua; Odessa; Potosi; Tangier; Wellington; etc.
6-10 50 Antofagasta; Bilbao; Casablanca; Foochow; Guayaquil; Marseille; Moscow; Paris (Texas); Surabaya; Zurich; etc.
11-50 52 Berlin; Cairo; Chicago; Glasgow; Manila; Melbourne; Montreal; Rangoon; Rio de Janeiro; Valparaiso; etc.
51-100 9 Alexandria; Bombay; Buenos Aires; Colombo; Hamburg; Manchester; Memphis; New Orleans; Yokohama
101-200 1 Calcutta >200 2 London; New York
For each acceptor and discounter, we compute the City Market Loss Rate CMLRi, which is the
proportion of drawers in a city who lose market access when their acceptor or discounter is
removed. Formally, CMLRi = DrwcImpi / nDrwc where DrwcImpi is the number of drawers in a city
c impacted by the removal of and individual i and nDrwc is the overall number of drawers in a city
c. We arbitrarily fix a threshold equal to 50% of the drawers of a city losing market access, beyond
which we consider the upstream actor to be geographically systemic for the given city
We find that the cases upstream actors whose removal impacts more than one half of the drawers
located in a city are 63; as some of these upstream actors are systemic for more than one city, the
total number of geographically systemic bilateral relationships is equal to 126. This means that out
of all actual 2,750 bilateral relationships between one upstream actor and one city connected
through more than one chain, only 126 relations (i.e. 4.58% of the total) pass our proposed
threshold of geographical systemicness.

209
Figure 5.8: Impact of individuals and groups removal on cities 42
The figures show on the left the acceptors or discounters, and on the right the cities impacted by their removal. The width of flux between individuals and cities represents the number of drawers who lose market

210
access, and the colour darkening the proportion of these drawers with respect to the total population of drawers in the city. Figure 5.8a illustrates the 126 geographically systemic bilateral relationships between single upstream individuals and cities. Figure 5.8b illustrates the 208 geographically systemic bilateral relationships between groups of upstream individuals (i.e. segments of the financial sector) and cities (see text).
The 126 geographically systemic actor-city relationships are represented in Figure 5.8a. The figure
shows that, for instance, if Alexanders & Co (who is connected to 3 out of the 5 drawers in
Newport) is removed, this city loses 60% of its access to the London market. Union Discount is the
most systemic actor for Boston, since 60% of the drawers depend on it. Similarly, Union Discount
Co is the most systemic actor of other cities like Curaçao or Trieste, since all drawers of these cities
depend on it. Some cities, like Yazoo City, are dependent on both an acceptor and a discounter, and
the removal of one of them makes the city lose access to the market. Figure 5.8a shows that in some
cases, some upstream actors played a geographically systemic role for some cities. This was esp. the
case for some actors who were specialized in financing trade with some specific regions of the
globe. For instance, the Anglo-foreign banks Anglo Foreign Banking Co and Canadian Bank of
Commerce appeared to play a systemic role for middle-sized (in terms of number of drawers) cities
located in Continental Europe and North America respectively, while the merchant bank C
Murdoch & Co appeared to play a systemic role for middle-sized cities located in Africa. However,
such cases of geographical “niches” appear to be the exception rather than the rule. Interestingly,
despite their huge market share, individual discount houses like Union Discount Co “punch below
their weight” in terms of geographic systemicness.
To further investigate this question, we also assess the geographic systemicness of the groups of
actors defined in Section 5.4.5 (i.e., the exogenously-defined crucial segments of the financial
sector). The results are presented in Figure 5.8b: they confirm the findings of Figure 5.8a. On the
one hand, in view of the presence of a number of individual geographical specialization niches,
Anglo-foreign banks and top merchant banks are systemic for many small-sized (in terms of
number of drawers) cities, but not for bigger ones. On the other hand, the removal of discount
houses as a group has a significant impact on 112 cities around the world, be them small, middle-
sized (such as Paris where it impacts slightly more than 50% of drawers, Manchester with more
than 75%, or Belfast with 100%), or big (such as New York where they impact 53.48% of drawers,
or Calcutta with 61.93%). This means that only 45.16% of the bilateral relationships between the
group and one city can be seen as geographically systemic. In view of the large market share of
discount houses (65.66% of bills), this result is not particularly impressive. Even in the (highly

211
unlikely) catastrophic scenario in which the whole segment of money market funds had
disappeared, most cities would still have been able to keep their access to the core of the global
financial network.
5.4.7. City vulnerability
The last robustness check we perform consists of turning the question of geographic systmicness on
its head, and computing a measure of the degree of vulnerability of each city to shocks in London.
City vulnerability is a drawer-focused measure. We consider a drawer to be vulnerable if her market
access depends on one acceptor or on one discounter only. If, on the contrary, the drawer can access
the market through several acceptors and discounters, we consider that she has alternative ways for
accessing the market in case one of her acceptors or one of her discounters does fail. Consequently,
all drawers involved in just one chain are vulnerable by construction, since they depend entirely on
one single acceptor and one single discounter. And the vulnerability of drawers involved in several
chains depends on the fact of being connected to more than one acceptor and more than one
discounter. For example, in the case of a drawer belonging to five different chains involving two
different acceptors but one discounter, we consider that the de not vulnerable regarding the acceptor
role but vulnerable regarding the discounter role.
Thus, we define the vulnerability of a city as the proportion of vulnerable drawers located in the
city. Formally, Vulc = VulDrwc / nDrwc where VulDrwc is the number of vulnerable drawers in a
city c and nDrwc is the overall number of drawers in the city c. Since cities involved in one single
chain are vulnerable by construction, we restrict our sample to the 360 cities involved in more than
one chain.

212
Figure 5.9: Cities vulnerability by acceptor and discounter roles 43
Each dot represents one city; its darkness reveals the presence of several cities with same values; the names of the cities featuring more than 30 drawers is provided. The x axis represents the number of drawers in city, and the y axis the percent of vulnerable drawers. A regression line (blue) has been included in the figure.
Figure 5.9a shows the vulnerability of cities with respect to acceptors’ shocks. In our sample of 360
cities, we consider as small cities those with 10 drawers or less (i.e., a total of 296 cities). All of the

213
144 cities having 100% of their drawers vulnerable to an acceptor belong to this category: this
represents 48.65% of all small cities. 88 small cities have half or less of their drawers vulnerable: 50
of them have no vulnerable drawer at all (most of them have only one drawer involved in several
chains with several acceptors). Figure 5.9a also shows that no city with more than 10 drawers is
completely vulnerable, and the percent of vulnerable actors tends ≈ 70% as the size of the city
increases.
Figure 5.9b shows the vulnerability of cities with respect to discounters’ shocks. It shows that in
general, cities’ vulnerability with respect to discounters is lower than their vulnerability with respect
to acceptors. On the one hand, the number of cities that are 100% vulnerable to discounters’ shocks
is lower than for acceptors’, as it is equal to 115. However, 2 of these 115 cities (Port Said and
Amsterdam) are middle-sized cities with more than 10 drawers (15 and 20 respectively). On the
other hand, the number of cities with no vulnerable drawer grows to 60 (most of them have one
only drawer involved in several chains with several discounters). Another interesting fact is that 20
cities with one single drawer are resilient to acceptors’ shocks but vulnerable to discounters’ ones.
Similarly, among the 64 cities with more than 10 drawers, 12 exhibit more vulnerability to
discounters’ shocks than to acceptors’: this is esp. the case for cities located in the UK, such as
London, Manchester, Belfast, or Bradford.
These findings confirm that in spite of the high concentration of the discounting business (in which
20 discount houses detained a market share of 65.66%), the degree of unsubstitutability of
discounters (i.e., wholesale lenders) was lower than expected. Drawers (i.e., borrowing firms) could
generally pass through many alternative paths in order to access the London market; often, they
displayed a greater degree of dependence on acceptors (i.e., guarantors), whose market share was
nonetheless generally much lower than discounters’ (see above, section 5.4.3). In a sense, a sort of
trade-off existed in the banking system: on the one hand, guarantors had a relatively higher degree
of unsubstitutability for their customers, but this was compensated by a lower market share; on the
other hand, wholesale lenders had far bigger market shares, but this was compensated by a
relatively lower degree of unsubstitutability for their customers. This trade-off appears to have
stemmed from the fundamentally different characteristics of the accepting and discounting
businesses (Chapter 4). The result was that, in spite of a “funnel-shaped” demography, the macro
structure early-20th-century global financial network did not feature the sorts of “mega-hubs” found
in present-day interbank networks, and were therefore not prone to the “robust-yet-fragile”
tendency.

214
5.6. Conclusions
We use a new database (hand-collected from archival sources) allowing to reconstruct the complete
network of financial interlinkages in the global sterling-denominated money market during the
calendar year 1906 (at the heyday of the first globalization). This database is valuable under many
respects: it consists of truly observed (and not estimated) linkages; it is one of the very first
historical databases on financial networks; to the best of our knowledge, it is the first one to cover a
core global money market; and it is one of the very few available databases covering both bank-
bank and bank-firm relationships. We apply very simple shock simulation techniques (node
removal) to obtain upper-bound estimates of the unsubstitutability of intermediaries in the network.
In contrast to the multilayer approach adopted by the literature in order to analyse the interaction
between bank-bank and bank-firm networks, this methodology allows us keeping track of actual
chains and of the role of gatekeepers in connecting borrowing firms with lending banks.
When applied to contemporary financial networks, this kind of simulation leads to a breakdown of
the network’s connectivity as central nodes are removed (Pröpper et al., 2008), thus pointing to a
high level of unsubstitutability of a few systemic actors. In stark contrast, we find that in no case the
removal of any node leads to major damages to the network structure, as only very few actors get
isolated. This result is robust to several specifications of the shock simulations. All this allows us
concluding that, in stark contrast to today, during the first globalization no intermediary had high
levels of unsubstitutability in the global financial network. This means that a financial network
deprived of systemic actors can exist and did actually exist at one of the highest times of
international economic development.
This conclusion has important implications for regulators. In our historical companion paper
(Chapter 4), we explain that the specific characteristics of the monetary instruments that was at the
basis of the global financial system (the bill of exchange) provided incentives for gatekeepers
(guarantors) to engage into information-production activities, and this generated diseconomies of
scale in their business, which was akin to relationship banking (Boot, 2000; Stein, 2002). On this
basis, we speculate that the low systemicness of intermediaries was the outcome of the specific
design of the money market instruments used in those times. As a matter of fact, 19th-century
regulators were indeed adamant about the superiority of bills of exchange from a supervisory
viewpoint (Ugolini, 2017). If regulators want to escape the “too-unsubstitutable-to-fail” trap, they
should therefore start from the microstructure of financial market and try to design instruments
providing disincentives to concentration. As always, the devil is in the details.

215

216
References of the Chapter 5
Accominotti, O., Ugolini, S. (Forthcoming) International Trade Finance from the Origins to the Present: Market Structures, Regulation, and Governance. In Brousseau, E., Glachant, J.M. and Sgard, J. (eds.), The Oxford Handbook of Institutions of International Economic
Governance and Market Regulation. Oxford University Press.
Acemoglu, D., Ozdaglar, A., Tahbaz-Salehi, A. (2015) Systemic Risk and Stability in Financial Networks. American Economic Review, 105(2), 564–608.
Albert, R., Jeong, H., Barabási, A.L. (2000) Error and Attack Tolerance of Complex Networks. Nature, 406(6794), 378–382.
Allen, F., Babus, A. (2009) Networks in Finance. In Kleindorfer, P.R., Wind, Y.R. and Gunther, R.E. (eds.), The Network Challenge: Strategy, Profit, and Risk in an Interlinked World. Prentice Hall, pp. 367–381.
Allen, F., Gale, D. (2000) Financial Contagion. Journal of Political Economy, 108(1), 1–33.
Anand, K., Lelyveld, I. van, Banai, Á., Friedrich, S., Garratt, R., Hałaj, G., Fique, J., Hansen, I., Jaramillo, S.M., Lee, H., Molina-Borboa, J.L., Nobili, S., Rajan, S., Salakhova, D., Silva, T.C., Silvestri, L., de Souza, S.R.S. (2018) The Missing Links: A Global Study on Uncovering Financial Network Structures from Partial Data. Journal of Financial Stability, 35, 107–119.
Basel Committee on Banking Supervision (2013) Global Systemically Important Banks: Updated Assessment Methodology and the Higher Loss Absorbency Requirement (Technical Report). Bank for International Settlements.
Basel Committee on Banking Supervision (2018) Global Systemically Important Banks: Revised Assessment Methodology and the Higher Loss Absorbency Requirement (Technical Report). Bank for International Settlements.
Battiston, F., Cencetti, G., Iacopini, I., Latora, V., Lucas, M., Patania, A., Young, J.G., Petri, G. (2020) Networks beyond Pairwise Interactions: Structure and Dynamics. Physics Reports, 874, 1–92.
Battiston, S., Gatti, D.D., Gallegati, M., Greenwald, B., Stiglitz, J.E. (2012a) Default Cascades: When Does Risk Diversification Increase Stability? Journal of Financial Stability, 8(3), 138–149.
Battiston, S., Gatti, D.D., Gallegati, M., Greenwald, B., Stiglitz, J.E. (2012b) Liaisons Dangereuses: Increasing Connectivity, Risk Sharing, and Systemic Risk. Journal of Economic Dynamics
and Control, 36(8), 1121–1141.
Battiston, S., Martinez-Jaramillo, S. (2018) Financial Networks and Stress Testing: Challenges and New Research Avenues for Systemic Risk Analysis and Financial Stability Implications. Journal of Financial Stability, 35, 6–16.
Bech, M.L., Atalay, E. (2010) The Topology of the Federal Funds Market. Physica A: Statistical
Mechanics and its Applications, 389(22), 5223–5246.
Benoit, S., Hurlin, C., Pérignon, C. (2019) Pitfalls in Systemic-Risk Scoring. Journal of Financial
Intermediation, 38, 19–44.

217
Blasques, F., Bräuning, F., Van Lelyveld, I. (2015) A Dynamic Network Model of the Unsecured Interbank Lending Market (Working Paper No. 491). Bank for International Settlements.
Bonacich, P., Holdren, A.C., Johnston, M. (2004) Hyper-Edges and Multidimensional Centrality. Social Networks, 26(3), 189–203.
Boss, M., Elsinger, H., Summer, M., Thurner, S. (2004) Network Topology of the Interbank Market. Quantitative Finance, 4(6), 677–684.
Caccioli, F., Barucca, P., Kobayashi, T. (2017) Network Models of Financial Systemic Risk: A Review. Journal of Computational Social Science, 1(1), 81–114.
Cai, J., Eidam, F., Saunders, A., Steffen, S. (2018) Syndication, Interconnectedness, and Systemic Risk. Journal of Financial Stability, 34, 105–120.
Chapman, S. (1984) The Rise of Merchant Banking. Allen & Unwin, London.
Chinazzi, M., Fagiolo, G., Reyes, J.A., Schiavo, S. (2013) Post-Mortem Examination of the International Financial Network. Journal of Economic Dynamics and Control, 37(8), 1692–1713.
Cohen, R., Havlin, S. (2010) Complex Networks: Structure, Robustness and Function. Cambridge University Press.
Craig, B., Peter, G. von (2014) Interbank Tiering and Money Center Banks. Journal of Financial
Intermediation, 23(3), 322–347.
Criado, R., Romance, M., Vela-Pérez, M. (2010) Hyperstructures: A New Approach to Complex Systems. International Journal of Bifurcation and Chaos, 20(03), 877–883.
Degryse, H., Nguyen, G. (2004) Interbank Exposures: An Empirical Examination of Systemic Risk in the Belgian Banking System (Working Paper No. 43). National Bank of Belgium.
Eisenberg, L., Noe, T.H. (2001) Systemic Risk in Financial Systems. Management Science, 47(2), 236–249.
Espinosa-Vega, M., Solé, J. (2010) Cross-Border Financial Surveillance: A Network Perspective (Working Paper No. 10/105). International Monetary Fund.
Estrada, E., Rodríguez-Velázquez, J.A. (2006) Subgraph Centrality and Clustering in Complex Hyper-Networks. Physica A: Statistical Mechanics and its Applications, 364, 581–594.
Freixas, X., Parigi, B.M., Rochet, J.C. (2000) Systemic Risk, Interbank Relations, and Liquidity Provision by the Central Bank. Journal of Money, Credit and Banking, 32(3), 611–638.
Fricke, D., Lux, T. (2015a) Core-Periphery Structure in the Overnight Money Market: Evidence from the e-MID Trading Platform. Computational Economics, 45(3), 359–395.
Fricke, D., Lux, T. (2015b) On the Distribution of Links in the Interbank Network: Evidence from the e-MID Overnight Money Market. Empirical Economics, 49(4), 1463–1495.
Furfine, C.H. (1999) The Microstructure of the Federal Funds Market. Financial Markets,
Institutions & Instruments, 8(5), 24–44.
Gai, P., Kapadia, S. (2010) Contagion in Financial Networks. Proceedings of the Royal Society A:
Mathematical, Physical and Engineering Sciences, 466(2120), 2401–2423.
Glasserman, P., Young, H.P. (2015) How Likely Is Contagion in Financial Networks? Journal of
Banking & Finance, 50, 383–399.

218
Glasserman, P., Young, H.P. (2016) Contagion in Financial Networks. Journal of Economic
Literature, 54(3), 779–831.
Hale, G., Kapan, T., Minoiu, C. (2016) Crisis Transmission in the Global Banking Network (Working Paper No. 16/91). International Monetary Fund.
Iori, G., Mantegna, R.N. (2018) Empirical Analyses of Networks in Finance. In Hommes, C. and LeBaron, B. (eds.), Handbook of Computational Economics. Elsevier, pp. 637–685.
Iori, G., Mantegna, R.N., Marotta, L., Miccichè, S., Porter, J., Tumminello, M. (2015) Networked Relationships in the E-MID Interbank Market: A Trading Model with Memory. Journal of
Economic Dynamics and Control, 50, 98–116.
Iori, G., Masi, G.D., Precup, O.V., Gabbi, G., Caldarelli, G. (2008) A Network Analysis of the Italian Overnight Money Market. Journal of Economic Dynamics and Control, 32(1), 259–278.
Jones, G. (1995) British Multinational Banking, 1830-1990. Oxford University Press, Oxford.
Kapoor, K., Sharma, D., Srivastava, J. (2013) Weighted Node Degree Centrality for Hypergraphs. In 2013 IEEE 2nd Network Science Workshop (NSW). pp. 152–155.
Li, D., Zhang, Q., Zio, E., Havlin, S., Kang, R. (2015) Network Reliability Analysis Based on Percolation Theory. Reliability Engineering & System Safety, 142, 556–562.
Lux, T. (2016) A Model of the Topology of the Bank – Firm Credit Network and Its Role as Channel of Contagion. Journal of Economic Dynamics and Control, 66, 36–53.
Martinez-Jaramillo, S., Alexandrova-Kabadjova, B., Bravo-Benitez, B., Solórzano-Margain, J.P. (2014) An Empirical Study of the Mexican Banking System’s Network and Its Implications for Systemic Risk. Journal of Economic Dynamics and Control, 40, 242–265.
Masi, G.D., Fujiwara, Y., Gallegati, M., Greenwald, B., Stiglitz, J.E. (2011) An Analysis of the Japanese Credit Network. Evolutionary and Institutional Economics Review, 7(2), 209–232.
Masi, G.D., Gallegati, M. (2011) Bank–Firms Topology in Italy. Empirical Economics, 43(2), 851–866.
Minoiu, C., Kang, C., Subrahmanian, V.S., Berea, A. (2015) Does Financial Connectedness Predict Crises? Quantitative Finance, 15(4), 607–624.
Minoiu, C., Reyes, J.A. (2013) A Network Analysis of Global Banking: 1978–2010. Journal of
Financial Stability, 9(2), 168–184.
Mistrulli, P.E. (2011) Assessing Financial Contagion in the Interbank Market: Maximum Entropy versus Observed Interbank Lending Patterns. Journal of Banking & Finance, 35(5), 1114–1127.
Müller, J. (2006) Interbank Credit Lines as a Channel of Contagion. Journal of Financial Services
Research, 29(1), 37–60.
Newman, M.E.J. (2003) The Structure and Function of Complex Networks. SIAM Review, 45(2), 167–256.
O’Rourke, K.H., Williamson, J.G. (2002) When Did Globalisation Begin? European Review of
Economic History, 6(1), 23–50.
Pröpper, I., Marc Van Lelyveld, Heijmans, R. (2008) Towards a Network Description of Interbank Payment Flows (Working Paper No. 177/2008). De Nederlandsche Bank.

219
Sheldon, G., Maurer, M. (1998) Interbank Lending and Systemic Risk: An Empirical Analysis for Switzerland. Swiss Journal of Economics and Statistics, 134, 685–704.
Silva, T.C., Alexandre, M. da S., Tabak, B.M. (2018) Bank Lending and Systemic Risk: A Financial-Real Sector Network Approach with Feedback. Journal of Financial Stability, 38, 98–118.
Soramäki, K., Bech, M.L., Arnold, J., Glass, R.J., Beyeler, W.E. (2007) The Topology of Interbank Payment Flows. Physica A: Statistical Mechanics and its Applications, 379(1), 317–333.
Sykes, J. (1926) The Amalgamation Movement in English Banking, 1825-1925. King, London.
Temizsoy, A., Iori, G., Montes-Rojas, G. (2015) The Role of Bank Relationships in the Interbank Market. Journal of Economic Dynamics and Control, 59, 118–141.
Ugolini, S. (2017) The Evolution of Central Banking: Theory and History. Palgrave Macmillan UK.
Upper, C. (2011) Simulation Methods to Assess the Danger of Contagion in Interbank Markets. Journal of Financial Stability, 7(3), 111–125.
Upper, C., Worms, A. (2004) Estimating Bilateral Exposures in the German Interbank Market: Is There a Danger of Contagion? European Economic Review, 48(4), 827–849.
Wetherilt, A., Zimmermann, P., Soramäki, K. (2010) The Sterling Unsecured Loan Market during 2006-08: Insights from Network Theory (Working Paper No. 398). Bank of England.

220

221
General conclusions
The main objective of this thesis was the development and application of innovative analytical tools
for the study of hybrid organizations – the “strange animals” (Ménard, 2013) that play a crucial role
in the interplay between individual action and aggregate outcomes. We have focused on two
discrete types of “hybrid” organizations – horizontal and vertical – which we have associated to
affiliation and supra-dyadic interaction structures, respectively. We have proposed two novel
methodologies to study these “hybrid” organizations (the “place-based methodology” and “chain-
based methodology”, respectively) and we have applied them to two different domains: innovation
studies and financial economics.
Although the “place-based methodology” had been used previously, this thesis has provided some
contributions. First, we have pointed out for the very first time the suitability of this methodology in
order to overcome artificial clustering problem and the analytical and interpretative problems
associated to. Second, we have introduced this methodology to economics, and more specifically on
innovation studies. Third, we have combined this tool with the cohesive blocks methodology, and
showed that the combination of the two provides a useful meso-approach for the study of
community structures in networks, sometimes not visible since having no formal institutional
borders, and which provides information on both micro dynamics and macro structural properties.
Contrary to the “place-based methodology”, the “chain-based methodology” as we design it in this
thesis has never been used before, and therefore constitutes one fully original contribution of our
work. The use of hypergraphs for the study of supra-dyadic interaction units is an emerging field, to
which scholars from many different disciplines– such as physics, mathematics, or sociology – are
currently contributing (Battistion et al,. 2020). However, while the methods that are commonly used
preserve the unity of supra-dyadic entities, their internal substructure is lost. The hyperstructure
approach is little known, and provides a complete solution for the study of supra-dyadic interaction
networks. This works has pointed to the usefulness and simplicity of hyperstructures for the study
of supra-dyadic relational units, and provided a relevant application case in the domain of financial
economics. Additionally, to the best of our knowledge, this contribution is the first one to introduce
the use of hyperstructures to oriented substructures. Indeed, hyperstructures had previously been
used for symmetric or non-oriented relations: we have been the first ones to show the flexibility of
this tool by adapting it to the analysis of oriented relations.

222
In sum, this thesis has highlighted the importance of considering hybrid organizations for a better
understanding of economic phenomena, and more broadly of social phenomena. It has also
provided methodological solutions that, to the best of our knowledge, were little known (if all) in
economics.
Several future developments may be envisaged for the issues covered in this thesis.
A number of developments can come out of our original work on places and its application to
innovation studies (Chapters 2 and 3). Certainly, the “place-based methodology” provides a useful
and well-established way to study structural equivalence in affiliation networks. However, this
methodology uses a “hard” definition of structural equivalence, since every two actors in a place
have to connect in the very same way to the rest of the network. Some applications or research
questions may require a “softer” conception of structural equivalence. For instance, suppose the
case of two authors who have co-authored ten publications, but one of whom also has one paper
with a third author: in fact, it might perhaps be legitimate to consider that the two authors are
structurally equivalent even if they did not co-author exactly the very same papers. To provide some
flexibility to the concept of places, we have developed the concept of k-places. We define it as a
place which allows a maximum divergence of k sets that define the place. A beta version of the
algorithm is included in the R-package places that we have authored,118 and it should be useful in
further applications of structural equivalence analysis in affiliation networks.
The study of horizontal hybrids organizations and their structure by the combination of places and
cohesive blocks methodologies should be developed with a better measure of the relative
importance of “peaks”. As discussed briefly in Chapter 3, the importance of a peak mainly depends
on (a) its relative cohesion level (with regard to bottom blocks which also host other communities),
and (b) the number of peaks hosted in a common parent block. The development of new measures
and indicators to better asses the relative importance of each peak should provide a more accurate
view of the community structure of networks.
The application of the “place-based methodology” in Chapters 2 and 3 evidences micro dynamics
unveiling proximities that go beyond the individual attributes of actors. Some combinations, often
repeated in several projects/consortia, can be unexpected in view of individual attributes (as e.g.
industrial classifications codes), but make sense in a collaborative context involving other actors.
This reveals the importance of forms of proximity that are not based on direct dyadic interaction,
118 "Places: Structural Equivalence Analysis for Two-mode Networks", Lucena-Piquero, D., 2017.

223
but on common objectives and collaboration with third parties. A close view of the dynamics
involved in these complex substructures can provide a better understanding of micro dynamics in
innovation.
The impact of R&D policies, and more specifically diversification policies, on innovation networks
remains a domain that requires further research (Mewes and Broekel, 2020). While this thesis did
not aim to dress an evaluation of R&D policies, its results highlight the need for more “surgical”
measures to attain their objectives (taking into account the particularities of innovation activities, as
e.g. their sectors of composition), as some policies can have a significant impact on the achievement
of the objectives of other ones.
Finally, collaborative R&D projects are just one example of “horizontal” hybrid organizations.
Many other economic phenomena can be conceptualized as affiliation relations and, consequently,
be studied using the proposed methodological approach. Chapter 1 provides some examples of
possible empirical applications, but also exposes the under-exploitation of this approach and its
analytical advantages. A larger application of the “place-based methodology” should provide a
better understanding of “horizontal” hybrid organizations, as well as of the opportunities and limits
of this analytical tool.
A number of developments can equally come out of our original work on chains and its application
to financial economics (Chapters 4 and 5). As mentioned above, a multidisciplinary effort has
emerged in recent decades to study complex phenomena as supra-dyadic units. A “higher-order”
(beyond pairwise interaction) approach seems to be a promising way to acquire a better
understanding of complex real-world phenomena. Although the use of hypergraphs has spread and
developed in recent times, it is still little used, and greater coordination and consensus in the
community is required.119 In this scenario, we advocate the promising potential of the
hyperstructure approach, in the sense of Criado et al. (2010). We consider that it is important to
preserve the interaction substructures existing in supra-dyadic units. From here, much remains to be
done, from developing new network metrics to exploring new application cases. While this work
has focused on one simple type of supra-dyadic structure (the relational chain), other more complex
types of substructures can be considered in social sciences – e.g. tree structures or valued
subnetworks. In particular, the development of standardized metrics is an issue that needs to be
tackled in this emerging field.
119 Potts (2000) is an example of this lack of consensus, as his definition of hyperstructure is different from the one commonly adopted in the literature: actually, he defines hyperstructures as nested-hierarchical systems (or nested sets of connections among components).

224
This thesis has shown the suitability of the supra-dyadic approach through hyperstructures to the
study of an historical financial network. The study of current financial markets through this
approach can contribute to their better understanding, and thus to improve regulation policy design.
Of course, finance is just one of the many possible cases of application. As we have pointed out,
several types of “vertical” hybrid organizations can be observed in the economy. For example,
supply chains can be studied in this way, thus overcoming some of the analytical biases discussed in
Chapter 1. This approach seems to meet the concerns of some scholars, who consider supply chains
as more than the sum of pairwise relations (Choi and Wu, 2009).
Finally, this thesis has operated a strict association between (on the one hand) “horizontal” hybrid
organization and affiliation networks and (on the other hand) “vertical” hybrid organizations and
interaction networks. This association responds to an analytical strategy, but it does not mean to be
exclusive. Indeed, the study of some hybrid organizations can focus on both the shared
objectives/properties (from group membership) and the interaction substructure (from supra-dyadic
units) of collective action. For example, collaborative R&D projects have been studied here as
affiliation networks, and we argued in Chapter 3 that this kind of relation does not always inform
about the internal interaction structure of groups. Consequently, interpreting affiliation networks in
terms of interaction can lead to misinterpretations. However, in some cases participation into the
R&D activity can take the form of well-defined roles – e.g., in case some developments require
specific forms of interactions implying dependencies or complementarities – thus becoming much
more similar to a supply chain. This means that, in a sense, the methodologies proposed in this
thesis may be seen as somewhat complementary, and their scope of application may potentially be
much more generalized than what has been proposed here. Many fascinating avenues for future
research are open before us.

225
References of the conclusions
Battiston, F., Cencetti, G., Iacopini, I., Latora, V., Lucas, M., Patania, A., Young, J.G., Petri, G. (2020) Networks beyond Pairwise Interactions: Structure and Dynamics. Physics Reports, 874, 1–92.
Choi, T.Y., Wu, Z. (2009) Triads in Supply Networks: Theorizing Buyer-Supplier Relationships. Journal of Supply Chain Management, 45(1), 8–25.
Criado, R., Romance, M., Vela-Pérez, M. (2010) Hyperstructures: A New Approach to Complex Systems. International Journal of Bifurcation and Chaos, 20(03), 877–883.
Ménard, C. (2003) Hybrid Modes of Organization: Alliances, Joint Ventures, Networks, and Other ‘Strange’ Animals. In Gibbons, R.S. and Roberts, J. (eds.), The Handbook of
Organizational Economics. Princeton University Press, Princeton, pp. 902–941.
Mewes, L., Broekel, T. (2020) Subsidized to Change? The Impact of R&D Policy on Regional Technological Diversification. The Annals of Regional Science, 1–32.
Potts, J. (2000) The New Evolutionary Microeconomics : Complexity, Competence, and Adaptive Behaviour. E. Elgar Pub, Cheltenham, UK Northampton, MA, USA.

226

227
General bibliography
Aarstad, J., Haugland, S.A., Greve, A. (2010) Performance Spillover Effects in Entrepreneurial Networks: Assessing a Dyadic Theory of Social Capital. Entrepreneurship Theory and
Practice, 34(5), 1003–20.
Abbasiharofteh, M. (2020) Endogenous Effects and Cluster Transition: A Conceptual Framework for Cluster Policy. European Planning Studies, 28(12), 1–24.
Accominotti, O. (2012) London Merchant Banks, the Central European Panic, and the Sterling Crisis of 1931. The Journal of Economic History, 72(1), 1–43.
Accominotti, O. (2019) International Banking and Transmission of the 1931 Financial Crisis. The
Economic History Review, 72(1), 260–285.
Accominotti, O., Ugolini, S. (Forthcoming) International Trade Finance from the Origins to the Present: Market Structures, Regulation, and Governance. In Brousseau, E., Glachant, J.M. and Sgard, J. (eds.), The Oxford Handbook of Institutions of International Economic
Governance and Market Regulation. Oxford University Press.
Acemoglu, D., Akcigit, U., Kerr, W.R. (2016) Innovation Network. Proceedings of the National
Academy of Sciences, 113(41), 11483–11488.
Acemoglu, D., Ozdaglar, A., Tahbaz-Salehi, A. (2015) Systemic Risk and Stability in Financial Networks. American Economic Review, 105(2), 564–608.
Adrian, T., Shin, H.S. (2010) The Changing Nature of Financial Intermediation and the Financial Crisis of 2007–2009. Annual Review of Economics, 2(1), 603–618.
Ahuja, G. (2000) Collaboration Networks, Structural Holes, and Innovation: A Longitudinal Study. Administrative Science Quarterly, 45(3), 425–455.
Ahuja, G., Soda, G., Zaheer, A. (2012) The Genesis and Dynamics of Organizational Networks. Organization Science, 23(2), 434–448.
Alba, R.D., Kadushin, C. (1976) The Intersection of Social Circles: A New Measure of Social Proximity in Networks. Sociological Methods & Research, 5(1), 77–102.
Albert, R., Jeong, H., Barabási, A.L. (2000) Error and Attack Tolerance of Complex Networks. Nature, 406(6794), 378–382.
Allen, F., Babus, A. (2009) Networks in Finance. In Kleindorfer, P.R., Wind, Y.R. and Gunther, R.E. (eds.), The Network Challenge: Strategy, Profit, and Risk in an Interlinked World. Prentice Hall, pp. 367–381.
Allen, F., Gale, D. (2000) Financial Contagion. Journal of Political Economy, 108(1), 1–33.
Anand, K., Lelyveld, I. van, Banai, Á., Friedrich, S., Garratt, R., Hałaj, G., Fique, J., Hansen, I., Jaramillo, S.M., Lee, H., Molina-Borboa, J.L., Nobili, S., Rajan, S., Salakhova, D., Silva, T.C., Silvestri, L., Souza, S.R.S. de (2018) The Missing Links: A Global Study on Uncovering Financial Network Structures from Partial Data. Journal of Financial Stability, 35, 107–119.

228
Antonelli, C. (2005) Models of Knowledge and Systems of Governance. Journal of Institutional
Economics, 1(1), 51–73.
Arrow, K.J. (1972) Economic Welfare and the Allocation of Resources for Invention. In Rowley, C.K. (ed.), Readings in Industrial Economics: Volume Two: Private Enterprise and State
Intervention. Macmillan Education UK, London, pp. 219–236.
Atkin, J. (2004) The Foreign Exchange Market of London: Development since 1900. Routledge.
Audretsch, D.B., Feldman, M.P. (1996) Innovative Clusters and the Industry Life Cycle. Review of
industrial organization, 11(2), 253–273.
Audretsch, D.B., Feldman, M.P. (2004) Knowledge Spillovers and the Geography of Innovation. In Henderson, J.V. and Thisse, J.F. (eds.), Handbook of Regional and Urban Economics. Elsevier, pp. 2713–2739.
Audretsch, D.B., Lehmann, E.E. (2005) Does the Knowledge Spillover Theory of Entrepreneurship Hold for Regions? Research Policy, 34(8), 1191–1202.
Azariadis, C., Stachurski, J. (2005) Poverty Traps. In Aghion, P. and Durlauf, S.N. (eds.), Handbook of Economic Growth. Elsevier, pp. 295–384.
Baena, M., Pizarro, N. (1985) The Structure of the Spanish Political Elite 1939-1975. In More, G. (ed.), The Structure of National Elite Groups, Research in Politics and Society. JAI Press, New York, pp. 149–171.
Baker, G., Gibbons, R., Murphy, K.J. (2002) Relational Contracts and the Theory of the Firm. The
Quarterly Journal of Economics, 117(1), 39–84.
Balland, P.A., Suire, R., Vicente, J. (2013) Structural and Geographical Patterns of Knowledge Networks in Emerging Technological Standards: Evidence from the European GNSS Industry. Economics of Innovation and New Technology, 22(1), 47–72.
Barabási, A.L. (2003) Linked: The New Science of Networks. Basic Books.
Basel Committee on Banking Supervision (2013) Global Systemically Important Banks: Updated Assessment Methodology and the Higher Loss Absorbency Requirement (Technical Report). Bank for International Settlements.
Basel Committee on Banking Supervision (2018) Global Systemically Important Banks: Revised Assessment Methodology and the Higher Loss Absorbency Requirement (Technical Report). Bank for International Settlements.
Baster, A.S.J. (1935) International Bank. King, London.
Battiston, F., Cencetti, G., Iacopini, I., Latora, V., Lucas, M., Patania, A., Young, J.G., Petri, G. (2020) Networks beyond Pairwise Interactions: Structure and Dynamics. Physics Reports, 874, 1–92.
Battiston, S., Gatti, D.D., Gallegati, M., Greenwald, B., Stiglitz, J.E. (2012a) Default Cascades: When Does Risk Diversification Increase Stability? Journal of Financial Stability, 8(3), 138–149.
Battiston, S., Gatti, D.D., Gallegati, M., Greenwald, B., Stiglitz, J.E. (2012b) Liaisons Dangereuses: Increasing Connectivity, Risk Sharing, and Systemic Risk. Journal of Economic Dynamics
and Control, 36(8), 1121–1141.

229
Battiston, S., Martinez-Jaramillo, S. (2018) Financial Networks and Stress Testing: Challenges and New Research Avenues for Systemic Risk Analysis and Financial Stability Implications. Journal of Financial Stability, 35, 6–16.
Bech, M.L., Atalay, E. (2010) The Topology of the Federal Funds Market. Physica A: Statistical
Mechanics and its Applications, 389(22), 5223–5246.
Benoit, S., Hurlin, C., Pérignon, C. (2019) Pitfalls in Systemic-Risk Scoring. Journal of Financial
Intermediation, 38, 19–44.
Berger, A.N., Udell, G.F. (1995) Relationship Lending and Lines of Credit in Small Firm Finance. The Journal of Business, 68(3), 351–381.
Bernela, B., Levy, R. (2017) Collaboration Networks within a French Cluster: Do Partners Really Interact with Each Other? Papers in Regional Science, 96(1), 115–138.
Bianconi, G. (2018) Multilayer Networks: Structure and Function. Oxford University Press, Oxford.
Bignon, V., Flandreau, M., Ugolini, S. (2012) Bagehot for Beginners: The Making of Lender-of-Last-Resort Operations in the Mid-Nineteenth Century. The Economic History Review, 65(2), 580–608.
Bishop, K., D’Este, P., Neely, A. (2011) Gaining from Interactions with Universities: Multiple Methods for Nurturing Absorptive Capacity. Research Policy, 40(1), 30–40.
Blasques, F., Bräuning, F., Van Lelyveld, I. (2015) A Dynamic Network Model of the Unsecured Interbank Lending Market (Working Paper No. 491). Bank for International Settlements.
Bonacich, P., Holdren, A.C., Johnston, M. (2004) Hyper-Edges and Multidimensional Centrality. Social Networks, 26(3), 189–203.
Boot, A.W.A. (2000) Relationship Banking: What Do We Know. Journal of Financial
Intermediation, 9, 7–25.
Boot, A.W.A., Thakor, A.V. (2000) Can Relationship Banking Survive Competition? The Journal
of Finance, 55(2), 679–713.
Borgatti, S.P., Everett, M.G. (1992) Regular Blockmodels of Multiway, Multimode Matrices. Social
Networks, 14(1), 91–120.
Borgatti, S.P., Everett, M.G. (2000) Models of Core/Periphery Structures. Social Networks, 21(4), 375–395.
Borrás, S., Edler, J. (2014) The Governance of Socio-Technical Systems: Explaining Change. Edward Elgar Publishing.
Boschma, R. (2005) Proximity and Innovation: A Critical Assessment. Regional Studies, 39(1), 61–74.
Boschma, R. (2015) Towards an Evolutionary Perspective on Regional Resilience. Regional
Studies, 49(5), 733–751.
Boschma, R. (2017) Relatedness as Driver of Regional Diversification: A Research Agenda. Regional Studies, 51(3), 351–364.
Boschma, R., Balland, P.A., Kogler, D.F. (2014) Relatedness and Technological Change in Cities: The Rise and Fall of Technological Knowledge in US Metropolitan Areas from 1981 to 2010. Industrial and Corporate Change, 24(1), 223–250.

230
Boschma, R., Frenken, K. (2012) Technological Relatedness and Regional Branching. In Bathelt, H., Feldman, M. and Kogler, D.F. (eds.), Beyond Territory. Dynamic Geographies of
Knowledge Creation, Diffusion and Innovation. Routledge, pp. 64–81.
Boss, M., Elsinger, H., Summer, M., Thurner, S. (2004) Network Topology of the Interbank Market. Quantitative Finance, 4(6), 677–684.
Bott, E. (1957) Family and Social Network. Tavistock Institute, London.
Bouba-Olga, O., Grossetti, M. (2008) Socio-Économie de Proximité. Revue d’Économie Régionale & Urbaine, octobre(3), 311.
Breiger, R.L. (1974) The Duality of Persons and Groups. Social Forces, 53(2), 181–190.
Breiger, R.L. (1976) Career Attributes and Network Structure: A Blockmodel Study of a Biomedical Research Specialty. American Sociological Review, 41(1), 117–135.
Breiger, R.L. (1979) Toward an Operational Theory of Community Elite Structures. Quality and
Quantity, 13, 21–57.
Breiger, R.L., Boorman, S.A., Arabie, P. (1975) An Algorithm for Clustering Relational Data with Applications to Social Network Analysis and Comparison with Multidimensional Scaling. Journal of Mathematical Psychology, 12(3), 328–383.
Brenner, T., Schlump, C. (2011) Policy Measures and Their Effects in the Different Phases of the Cluster Life Cycle. Regional Studies, 45(10), 1363–1386.
Breschi, S., Cassi, L., Malerba, F., Vonortas, N.S. (2009) Networked Research: European Policy Intervention in ICTs. Technology Analysis & Strategic Management, 21(7), 833–857.
Breschi, S., Cusmano, L. (2004) Unveiling the Texture of a European Research Area: Emergence of Oligarchic Networks under EU Framework Programmes. International Journal of
Technology Management, 27(8), 747–772.
Breschi, S., Lenzi, C. (2016) Co-Invention Networks and Inventive Productivity in US Cities. Journal of Urban Economics, 92, 66–75.
Breschi, S., Lissoni, F. (2001) Knowledge Spillovers and Local Innovation Systems: A Critical Survey. Industrial and Corporate Change, 10(4), 975–1005.
Breschi, S., Malerba, F. (2009) ERA and the Role of Networks. In Delanghe, H., Muldur, U. and Soete, L. (eds.), European Science and Technology Policy: Towards Integration or
Fragmentation. Edward Elgar Publishing, Cheltenham, UK, pp. 160–174.
Broekel, T. (2015) Do Cooperative Research and Development (R&D) Subsidies Stimulate Regional Innovation Efficiency? Evidence from Germany. Regional Studies, 49(7), 1087–1110.
Broekel, T., Brachert, M. (2015) The Structure and Evolution of Inter-Sectoral Technological Complementarity in R&D in Germany from 1990 to 2011. Journal of Evolutionary
Economics, 25(4), 755–785.
Broekel, T., Fornahl, D., Morrison, A. (2015) Another Cluster Premium: Innovation Subsidies and R&D Collaboration Networks. Research Policy, 44(8), 1431–1444.
Brossard, O., Moussa, I. (2014) The French Cluster Policy Put to the Test with Differences-in-Differences Estimates. Economics Bulletin, 34(1), 520–529.

231
Burt, R.S. (1987) Social Contagion and Innovation: Cohesion versus Structural Equivalence. American Journal of Sociology, 92(6), 1287–1335.
Burt, R.S. (2000) The Network Structure Of Social Capital. Research in Organizational Behavior, 22, 345–423.
Caccioli, F., Barucca, P., Kobayashi, T. (2017) Network Models of Financial Systemic Risk: A Review. Journal of Computational Social Science, 1(1), 81–114.
Cai, J., Eidam, F., Saunders, A., Steffen, S. (2018) Syndication, Interconnectedness, and Systemic Risk. Journal of Financial Stability, 34, 105–120.
Calatayud, A., Mangan, J., Palacin, R. (2017) Vulnerability of International Freight Flows to Shipping Network Disruptions: A Multiplex Network Perspective. Transportation Research
Part E: Logistics and Transportation Review, 108, 195–208.
Cassis, Y. (2010) Capitals of Capital: The Rise and Fall of International Financial Centres 1780-2009. Cambridge University Press.
Cattani, G., Ferriani, S. (2008) A Core/Periphery Perspective on Individual Creative Performance: Social Networks and Cinematic Achievements in the Hollywood Film Industry. Organization Science, 19(6), 824–844.
Chapman, S. (1984) The Rise of Merchant Banking. Allen & Unwin, London.
Chinazzi, M., Fagiolo, G., Reyes, J.A., Schiavo, S. (2013) Post-Mortem Examination of the International Financial Network. Journal of Economic Dynamics and Control, 37(8), 1692–1713.
Choi, T.Y., Wu, Z. (2009) Triads in Supply Networks: Theorizing Buyer-Supplier Relationships. Journal of Supply Chain Management, 45(1), 8–25.
Chu, J.S.G., Davis, G.F. (2016) Who Killed the Inner Circle? The Decline of the American Corporate Interlock Network. American Journal of Sociology, 122(3), 714–754.
Clare, G. (1911) The A B C of the Foreign Exchanges: A Practical Guide. London.
Clarysse, B., Wright, M., Mustar, P. (2009) Behavioural Additionality of R&D Subsidies: A Learning Perspective. Research Policy, 38(10), 1517–1533.
Cleaver, G., Cleaver, P. (1985) The Union Discount: A Centenary Album. The Firm, London.
Coase, R.H. (1937) The Nature of the Firm. Economica, 4(16), 386–405.
Coase, R.H. (1960) The Problem of Social Cost. Journal of Law and Economics, 3, 1–44.
Cohen, R., Havlin, S. (2010) Complex Networks: Structure, Robustness and Function. Cambridge University Press.
Coleman, J., Katz, E., Menzel, H. (1957) The Diffusion of an Innovation Among Physicians. Sociometry, 20(4), 253–270.
Comet, C. (2017) How Does the Inner Circle Shape the Policy-Planning Network in France? Socio-
Economic Review, 17(4), 1021–1041.
Committee on Finance and Industry (1931) Minutes of Evidence. HM Stationery Office.
Content, J., Frenken, K. (2016) Related Variety and Economic Development: A Literature Review. European Planning Studies, 24(12), 2097–2112.

232
Cooke, P. (2002) Regional Innovation Systems: General Findings and Some New Evidence from Biotechnology Clusters. The Journal of Technology Transfer, 27(1), 133–145.
Craig, B., Peter, G. von (2014) Interbank Tiering and Money Center Banks. Journal of Financial
Intermediation, 23(3), 322–347.
Crespo, J., Réquier-Desjardins, D., Vicente, J. (2014) Why Can Collective Action Fail in Local Agri-Food Systems? A Social Network Analysis of Cheese Producers in Aculco, Mexico. Food Policy, 46, 165–177.
Crespo, J., Suire, R., Vicente, J. (2014) Lock-in or Lock-out? How Structural Properties of Knowledge Networks Affect Regional Resilience. Journal of Economic Geography, 14(1), 199–219.
Crespo, J., Suire, R., Vicente, J. (2016) Network Structural Properties for Cluster Long-Run Dynamics: Evidence from Collaborative R&D Networks in the European Mobile Phone Industry. Industrial and Corporate Change, 25(2), 261–282.
Crespo, J., Vicente, J. (2016) Proximity and Distance in Knowledge Relationships: From Micro to Structural Considerations Based on Territorial Knowledge Dynamics (TKDs). Regional
Studies, 50(2), 202–219.
Crespo, J., Vicente, J., Amblard, F. (2016) Micro-Behaviors and Structural Properties of Knowledge Networks: Toward a ‘One Size Fits One’ Cluster Policy. Economics of
Innovation and New Technology, 25(6), 533–552.
Criado, R., Romance, M., Vela-Pérez, M. (2010) Hyperstructures: A New Approach to Complex Systems. International Journal of Bifurcation and Chaos, 20(03), 877–883.
Cronin, B. (2011) Networks of Corporate Power Revisited. Procedia - Social and Behavioral
Sciences, 10, 43–51.
Davis, G.F., Yoo, M., Baker, W.E. (2003) The Small World of the American Corporate Elite, 1982-2001. Strategic Organization, 1(3), 301–326.
De Roover, R. (1953) L’évolution de La Lettre de Change, XIVe-XVIIIe Siècles. A. Colin, Paris.
Degryse, H., Nguyen, G. (2004) Interbank Exposures: An Empirical Examination of Systemic Risk in the Belgian Banking System (Working Paper No. 43). National Bank of Belgium.
Delgado, M., Porter, M.E., Stern, S. (2010) Clusters and Entrepreneurship. Journal of Economic
Geography, 10(4), 495–518.
Diamond, D.W. (1984) Financial Intermediation and Delegated Monitoring. The Review of
Economic Studies, 51(3), 393–414.
Diamond, D.W. (1991) Monitoring and Reputation: The Choice between Bank Loans and Directly Placed Debt. Journal of Political Economy, 99(4), 689–721.
Dickison, M.E., Magnani, M., Rossi, L. (2016) Multilayer Social Networks. Cambridge University Press, New York.
Domhoff, G.W. (1975) Social Clubs, Policy-Planning Groups, and Corporations: A Network Study of Ruling-Class Cohesiveness. Insurgent Sociologist, 5(3), 171–184.
Domhoff, G.W. (2006) Who Rules America? Power and Politics, and Social Change. McGraw-Hill, Boston, Mass.

233
Dopfer, K., Foster, J., Potts, J. (2004) Micro-Meso-Macro. Journal of Evolutionary Economics, 14(3), 263–279.
Doreian, P. (2009) Positional Analysis and Blockmodeling. In Meyers, R.A. (ed.), Encyclopedia of
Complexity and Systems Science. Springer New York, New York, pp. 6913–6927.
Ducruet, C. (2020) The Geography of Maritime Networks: A Critical Review. Journal of Transport
Geography, 88, 102824.
Eichengreen, B., Flandreau, M. (2016) A Century and a Half of Central Banks, International Reserves, and International Currencies. In Bordo, M.D., Eitrheim, O., Flandreau, M. and Qvigstad, J.F. (eds.), Central Banks at a Crossroads: What Can We Learn from History? Cambridge University Press, New York, pp. 280–318.
Eisenberg, L., Noe, T.H. (2001) Systemic Risk in Financial Systems. Management Science, 47(2), 236–249.
Espinosa-Vega, M., Solé, J. (2010) Cross-Border Financial Surveillance: A Network Perspective (Working Paper No. 10/105). International Monetary Fund.
Essletzbichler, J. (2015) Relatedness, Industrial Branching and Technological Cohesion in US Metropolitan Areas. Regional Studies, 49(5), 752–766.
Estrada, E., Rodríguez-Velázquez, J.A. (2006) Subgraph Centrality and Clustering in Complex Hyper-Networks. Physica A: Statistical Mechanics and its Applications, 364, 581–594.
Everett, M.G., Borgatti, S.P. (1998) Analyzing Clique Overlap. Connections, 21(1), 49–61.
Faust, K. (1997) Centrality in Affiliation Networks. Social Networks, 19(2), 157–191.
Feldman, M. (1994) The Geography of Innovation. Springer Netherlands Imprint Springer, Dordrecht.
Feng, F., He, X., Liu, Y., Nie, L., Chua, T.S. (2018) Learning on Partial-Order Hypergraphs. In Proceedings of the 2018 World Wide Web Conference. International World Wide Web Conferences Steering Committee, Republic and Canton of Geneva, CHE, pp. 1523–1532.
Fier, A., Aschhoff, B., Löhlein, H. (2006) Behavioral Additionality of R&D Public Funding in Germany. In OECD (ed.), Government R&D Funding and Company Behavior: Measuring
Behavioral Additionality. OECD Publishing, Paris.
Fitjar, R.D., Rodríguez-Pose, A. (2013) Firm Collaboration and Modes of Innovation in Norway. Research Policy, 42(1), 128–138.
Flandreau, M., Jobst, C. (2005) The Ties That Divide: A Network Analysis of the International Monetary System, 1890–1910. The Journal of Economic History, 65(04).
Flandreau, M., Mesevage, G.G. (2014) The Separation of Information and Lending and the Rise of Rating Agencies in the USA (1841–1907). Scandinavian Economic History Review, 62(3), 213–242.
Flandreau, M., Ugolini, S. (2013) Where It All Began: Lending of Last Resort and Bank of England Monitoring during the Overend-Gurney Panic of 1866. In Bordo, M. and Roberds, W. (eds.), The Origins, History, and Future of the Federal Reserve: A Return to Jekyll Island. Cambridge University Press, New York, pp. 113–161.
Fleming, L., King, C., Juda, A.I. (2007) Small Worlds and Regional Innovation. Organization
Science, 18(6), 938–954.

234
Fletcher, G.A. (1976) The Discount Houses in London: Principles, Operations and Change. Springer.
Fontagné, L., Koenig, P., Mayneris, F., Poncet, S. (2013) Cluster Policies and Firm Selection: Evidence from France. Journal of Regional Science, 53(5), 897–922.
Freeman, L. (2004) The Development of Social Network Analysis : A Study in the Sociology of Science. Empirical Press BookSurge, Vancouver, BC North Charleston, S.C.
Freeman, L.C. (1968) Patterns of Local Community Leadership. Bobbs-Merrill, Indianapolis.
Freitag, P.J. (2014) The Cabinet and Big Business: A Study of Interlocks. Social Problems, 23(2), 137–152.
Freixas, X., Parigi, B.M., Rochet, J.C. (2000) Systemic Risk, Interbank Relations, and Liquidity Provision by the Central Bank. Journal of Money, Credit and Banking, 32(3), 611–638.
Frenken, K., Oort, F.V., Verburg, T. (2007) Related Variety, Unrelated Variety and Regional Economic Growth. Regional Studies, 41(5), 685–697.
Fricke, D., Lux, T. (2015a) Core-Periphery Structure in the Overnight Money Market: Evidence from the e-MID Trading Platform. Computational Economics, 45(3), 359–395.
Fricke, D., Lux, T. (2015b) On the Distribution of Links in the Interbank Network: Evidence from the e-MID Overnight Money Market. Empirical Economics, 49(4), 1463–1495.
Furfine, C.H. (1999) The Microstructure of the Federal Funds Market. Financial Markets,
Institutions & Instruments, 8(5), 24–44.
Gai, P., Kapadia, S. (2010) Contagion in Financial Networks. Proceedings of the Royal Society A:
Mathematical, Physical and Engineering Sciences, 466(2120), 2401–2423.
Ghatak, M., Guinnane, T.W. (1999) The Economics of Lending with Joint Liability: Theory and Practice. Journal of Development Economics, 60(1), 195–228.
Gillett Brothers Discount Company (1952) The Bill on London: Or, the Finance of Trade by Bills of Exchange. Taylor & Francis.
Gilly, J.P., Talbot, D., Zuliani, J.M. (2011) Hub Firms and the Dynamics of Territorial Innovation: Case Studies of Thales and Liebherr in Toulouse. European Planning Studies, 19(12), 2009–2024.
Gilly, J.P., Torre, A. (2000) Proximity Relations. Elements for an Analytical Framework. In Green, M.B. and McNaughton, R.B. (eds.), Industrial Networks and Proximity. Ashgate Pub Limited, pp. 1–16.
Giuliani, E. (2007) The Selective Nature of Knowledge Networks in Clusters: Evidence from the Wine Industry. Journal of Economic Geography, 7(2), 139–168.
Giuliani, E. (2013) Network Dynamics in Regional Clusters: Evidence from Chile. Research Policy, 42(8), 1406–1419.
Giuliani, E., Balland, P.A., Matta, A. (2018) Straining but Not Thriving: Understanding Network Dynamics in Underperforming Industrial Clusters. Journal of Economic Geography, 19(1), 147–172.
Giuliani, E., Bell, M. (2005) The Micro-Determinants of Meso-Level Learning and Innovation: Evidence from a Chilean Wine Cluster. Research Policy, 34(1), 47–68.

235
Giuliani, E., Pietrobelli, C. (2016) Social Network Analysis for Evaluating Cluster Development Programs. In Maoli, A., Pietrobell, C. and Stucch, R. (eds.), The Impact Evaluation of
Cluster Development Programs: Methods and Practices. Inter-American Development Bank, Competitiveness and Innovation Division, Washington DC.
Glasserman, P., Young, H.P. (2015) How Likely Is Contagion in Financial Networks? Journal of
Banking & Finance, 50, 383–399.
Glasserman, P., Young, H.P. (2016) Contagion in Financial Networks. Journal of Economic
Literature, 54(3), 779–831.
Glode, V., Opp, C. (2016) Asymmetric Information and Intermediation Chains. American
Economic Review, 106(9), 2699–2721.
Gnyawali, D.R., Madhavan, R. (2001) Cooperative Networks and Competitive Dynamics: A Structural Embeddedness Perspective. Academy of Management Review, 26(3), 431–445.
Gök, A., Edler, J. (2012) The Use of Behavioural Additionality Evaluation in Innovation Policy Making. Research Evaluation, 21(4), 306–318.
Goschen, G.J.G. (1876) The Theory of the Foreign Exchanges. London.
Granovetter, M. (1985) Economic Action and Social Structure: The Problem of Embeddedness. American Journal of Sociology, 91(3), 481–510.
Greengrass, H.W. (1931) Discount Market in London: Its Organization and Recent Development. Issac Pitman, London.
Gulati, R., Singh, H. (1998) The Architecture of Cooperation: Managing Coordination Costs and Appropriation Concerns in Strategic Alliances. Administrative Science Quarterly, 43(4), 781–814.
Hale, G., Kapan, T., Minoiu, C. (2016) Crisis Transmission in the Global Banking Network (Working Paper No. 16/91). International Monetary Fund.
Hawtrey, R.G. (1930) Currency and Credit. Longmans, Green, London.
Hearnshaw, E.J.S., Wilson, M.M.J. (2013) A Complex Network Approach to Supply Chain Network Theory. International Journal of Operations & Production Management, 33(4), 442–469.
Heider, F. (1958) The Psychology of Interpersonal Relations. Wiley, New York.
Hemmert, M., Bstieler, L., Okamuro, H. (2014) Bridging the Cultural Divide: Trust Formation in University–Industry Research Collaborations in the US, Japan, and South Korea. Technovation, 34(10), 605–616.
Herger, N. (2018) Interest-Parity Conditions during the Era of the Classical Gold Standard (1880-1914)—Evidence from the Investment Demand for Bills of Exchange in Europe. Swiss
Journal of Economics and Statistics, 154(1).
Herrero López, R. (2015) Dualidad, Estructura y Forma: El ‘Análisis de Redes Sociales’ y Su Contribución al Estudio Empírico Del Poder. PhD Thesis, Universidad Complutense de Madrid.
Hervas-Oliver, J.L., Lleo, M., Cervello, R. (2017) The Dynamics of Cluster Entrepreneurship: Knowledge Legacy from Parents or Agglomeration Effects? The Case of the Castellon Ceramic Tile District. Research Policy, 46(1), 73–92.

236
Hidalgo, C.A., Balland, P.A., Boschma, R., Delgado, M., Feldman, M., Frenken, K., Glaeser, E., He, C., Kogler, D.F., Morrison, A., Neffke, F., Rigby, D., Stern, S., Zheng, S., Zhu, S. (2018) The Principle of Relatedness. In Morales, A.J., Gershenson, C., Braha, D., Minai, A.A. and Bar-Yam, Y. (eds.), Unifying Themes in Complex Systems IX. Springer International Publishing, pp. 451–457.
Hidalgo, C.A., Klinger, B., Barabási, A.L., Hausmann, R. (2007) The Product Space Conditions the Development of Nations. Science, 317(5837), 482–487.
Hobson, J.A. (1906) The Evolution of Modern Capitalism: A Study of Machine Production, Second Edition. The Walter Scott Publishing, London.
Hogendorn, C. (2012) Spillovers and Network Neutrality. In Faulhaber, G.R., Madden, G. and Petchey, J. (eds.), Regulation and the Performance of Communication and Information
Networks. Edward Elgar Publishing, Cheltenham, pp. 191–208.
Holmstrom, B., Roberts, J. (1998) The Boundaries of the Firm Revisited. Journal of Economic
Perspectives, 12(4), 73–94.
Houel, M., Daunis, M. (2009) Les Pôles de Compétitivité : Bilan et Perspectives d’une Politique Industrielle et d’aménagement Du Territoire (Rapport d’information n° 40). Sénat France. Commission de l’économie, France.
Inoue, H., Todo, Y. (2019) Firm-Level Propagation of Shocks through Supply-Chain Networks. Nature Sustainability, 2(9), 841–847.
Iori, G., Mantegna, R.N. (2018) Empirical Analyses of Networks in Finance. In Hommes, C. and LeBaron, B. (eds.), Handbook of Computational Economics. Elsevier, pp. 637–685.
Iori, G., Mantegna, R.N., Marotta, L., Miccichè, S., Porter, J., Tumminello, M. (2015) Networked Relationships in the E-MID Interbank Market: A Trading Model with Memory. Journal of
Economic Dynamics and Control, 50, 98–116.
Iori, G., Masi, G.D., Precup, O.V., Gabbi, G., Caldarelli, G. (2008) A Network Analysis of the Italian Overnight Money Market. Journal of Economic Dynamics and Control, 32(1), 259–278.
Jackson, M.O. (2011) Social and Economic Networks. Princeton Univers. Press.
Jacob, L.M. (1910) Bank Acceptances. US Government Printing Office, Washington DC.
Jansson, T.W.K. (2018) The Finance-Growth Nexus in Britain, 1850-1913. PhD Thesis, University of Cambridge.
Jeidels, O. (1905) Das Verhältnis Der Deutschen Grossbanken Zur Industrie: Mit Besonderer Berücksichtigung Der Eisenindustrie. Duncker & Humblot.
Jobst, C., Ugolini, S. (2016) The Coevolution of Money Markets and Monetary Policy, 1815-2008. In Bordo, M.D., Eitrheim, O., Flandreau, M. and Qvigstad, J.F. (eds.), Central Banks at a
Crossroads: What Can We Learn from History? Cambridge University Press, New York, pp. 145–194.
Jones, G. (1995) British Multinational Banking, 1830-1990. Oxford University Press, Oxford.
Kang, M.J., Hwang, J. (2016) Structural Dynamics of Innovation Networks Funded by the European Union in the Context of Systemic Innovation of the Renewable Energy Sector. Energy Policy, 96, 471–490.
237
Kapoor, K., Sharma, D., Srivastava, J. (2013) Weighted Node Degree Centrality for Hypergraphs. In 2013 IEEE 2nd Network Science Workshop (NSW). pp. 152–155.
Keynes, J.M. (1930) Treatise on Money. In Moggridge, D.E. and Johnson, E.S. (eds.), The
Collected Writings of John Maynard Keynes. Cambridge.
Kim, Y., Choi, T.Y., Yan, T., Dooley, K. (2011) Structural Investigation of Supply Networks: A Social Network Analysis Approach. Journal of Operations Management, 29(3), 194–211.
King, W.T.C. (2013) History of the London Discount Market. Routledge, London.
Kirman, A.P. (1992) Whom or What Does the Representative Individual Represent? Journal of
Economic Perspectives, 6(2), 117–136.
Kivelä, M., Arenas, A., Barthelemy, M., Gleeson, J.P., Moreno, Y., Porter, M.A. (2014) Multilayer Networks. Journal of Complex Networks, 2(3), 203–271.
Knoke, D. (1990) Political Networks : The Structural Perspective. Cambridge University Press, Cambridge.
Kogler, D.F., Rigby, D.L., Tucker, I. (2013) Mapping Knowledge Space and Technological Relatedness in US Cities. European Planning Studies, 21(9), 1374–1391.
Kogut, B. (2000) The Network as Knowledge: Generative Rules and the Emergence of Structure. Strategic Management Journal, 21(3), 405–425.
Krackhardt, D., Hanson, J.R. (1993) Informal Networks. Harvard business review, 71(4), 104–111.
Kynaston, D. (2015) The City Of London Volume 2: Golden Years 1890-1914. Random House, London.
Lämmer-Gamp, T., zu Köcker, G.M., Nerger, M. (2014) Cluster Collaboration and Business Support Tools to Facilitate Entrepreneurship, Cross-Sectoral Collaboration and Growth (Technical Report No. 1). European Cluster Observatory.
Laumann, E., Pappi, F.U. (1976) Networks of Collective Action : A Perspective on Community Influence Systems. Academic Press, New York.
Lee, K.M., Goh, K.I. (2016) Strength of Weak Layers in Cascading Failures on Multiplex Networks: Case of the International Trade Network. Scientific Reports, 6(1).
Levy, R., Talbot, D. (2015) Control by Proximity: Evidence from the ‘Aerospace Valley’ Competitiveness Cluster. Regional Studies, 49(6), 955–972.
Li, D., Zhang, Q., Zio, E., Havlin, S., Kang, R. (2015) Network Reliability Analysis Based on Percolation Theory. Reliability Engineering & System Safety, 142, 556–562.
Liebowitz, S.J., Margolis, S.E. (1994) Network Externality: An Uncommon Tragedy. Journal of
Economic Perspectives, 8(2), 133–150.
Lorrain, F., White, H.C. (1971) Structural Equivalence of Individuals in Social Networks. The
Journal of Mathematical Sociology, 1(1), 49–80.
Lowik, S., Van Rossum, D., Kraaijenbrink, J., Groen, A. (2012) Strong Ties as Sources of New Knowledge: How Small Firms Innovate through Bridging Capabilities. Journal of Small
Business Management, 50(2), 239–256.
Luukkonen, T. (2000) Additionality of EU Framework Programmes. Research Policy, 29(6), 711–724.

238
Lux, T. (2016) A Model of the Topology of the Bank – Firm Credit Network and Its Role as Channel of Contagion. Journal of Economic Dynamics and Control, 66, 36–53.
Maffioli, A., Pietrobelli, C., Stucchi, R. (2016a) Evaluation of Cluster Development Programs. In Maffioli, A., Pietrobelli, C. and Stucchi, R. (eds.), The Impact Evaluation of Cluster
Development Programs: Methods and Pactices. Inter-American Development Bank.
Maffioli, A., Pietrobelli, C., Stucchi, R. (eds.) (2016b) The Impact Evaluation of Cluster
Development Programs: Methods and Practices. Inter-American Development Bank, Competitiveness and Innovation Division, Washington DC, US.
Markusen, A. (1996) Sticky Places in Slippery Space: A Typology of Industrial Districts. Economic
Geography, 72(3), 293–313.
Marshall, A. (1919) Industry and Trade. Macmillan, London.
Martinez-Jaramillo, S., Alexandrova-Kabadjova, B., Bravo-Benitez, B., Solórzano-Margain, J.P. (2014) An Empirical Study of the Mexican Banking System’s Network and Its Implications for Systemic Risk. Journal of Economic Dynamics and Control, 40, 242–265.
Masi, G.D., Fujiwara, Y., Gallegati, M., Greenwald, B., Stiglitz, J.E. (2011) An Analysis of the Japanese Credit Network. Evolutionary and Institutional Economics Review, 7(2), 209–232.
Masi, G.D., Gallegati, M. (2011) Bank–Firms Topology in Italy. Empirical Economics, 43(2), 851–866.
May, R.M., Levin, S.A., Sugihara, G. (2008) Ecology for Bankers. Nature, 451(7181), 893–894.
McFadyen, M.A., Cannella, A.A. (2004) Social Capital and Knowledge Creation: Diminishing Returns of the Number and Strength of Exchange Relationships. Academy of Management
Journal, 47(5), 735–746.
Ménard, C. (2003) Hybrid Modes of Organization: Alliances, Joint Ventures, Networks, and Other ‘Strange’ Animals. In Gibbons, R.S. and Roberts, J. (eds.), The Handbook of
Organizational Economics. Princeton University Press, Princeton, pp. 902–941.
Ménard, C. (2014) Embedding Organizational Arrangements: Towards a General Model. Journal of
Institutional Economics, 10(4), 567–589.
Mewes, L., Broekel, T. (2020) Subsidized to Change? The Impact of R&D Policy on Regional Technological Diversification. The Annals of Regional Science, 1–32.
Michie, R.C. (2016) British Banking: Continuity and Change from 1694 to the Present. Oxford University Press, Oxford.
Minoiu, C., Kang, C., Subrahmanian, V.S., Berea, A. (2015) Does Financial Connectedness Predict Crises? Quantitative Finance, 15(4), 607–624.
Minoiu, C., Reyes, J.A. (2013) A Network Analysis of Global Banking: 1978–2010. Journal of
Financial Stability, 9(2), 168–184.
Mintz, B. (1975) The President’s Cabinet, 1891-1912: A Contribution to the Power Structure Debate. Insurgent Sociologist, 5(3), 131–148.
Mintzberg, H. (1979) The Structuring of Organizations. Prentice Hall, Englewood Cliffs NJ.
Mistrulli, P.E. (2011) Assessing Financial Contagion in the Interbank Market: Maximum Entropy versus Observed Interbank Lending Patterns. Journal of Banking & Finance, 35(5), 1114–1127.

239
Mizruchi, M.S. (1996) What Do Interlocks Do? An Analysis, Critique, and Assessment of Research on Interlocking Directorates. Annual Review of Sociology, 22(1), 271–298.
Mizruchi, M.S., Galaskiewicz, J. (1993) Networks of Interorganizational Relations. Sociological
Methods & Research, 22(1), 46–70.
Molina-Morales, F.X., Martínez-Fernández, M.T., Torlò, V.J. (2011) The Dark Side of Trust: The Benefits, Costs and Optimal Levels of Trust for Innovation Performance. Long Range
Planning, 44(2), 118–133.
Mollan, S., Michie, R. (2012) The City of London as an International Commercial and Financial Center since 1900. Enterprise & Society, 13(3), 538–587.
Moody, J., White, D.R. (2003) Structural Cohesion and Embeddedness: A Hierarchical Concept of Social Groups. American Sociological Review, 68(1), 103–127.
Moreno, J.L. (1934) Who Shall Survive? A New Approach to the Problem of Human Interrelations. Beacon House, New York.
Morrison, A. (2008) Gatekeepers of Knowledge within Industrial Districts: Who They Are, How They Interact. Regional Studies, 42(6), 817–835.
Morrison, A., Rabellotti, R. (2007) The Role of Research in Wine: The Emergence of a Regional Research Area in an Italian Wine Production System. International Journal of Technology
and Globalisation, 3(2–3), 155–178.
Morrison, A., Rabellotti, R., Zirulia, L. (2013) When Do Global Pipelines Enhance the Diffusion of Knowledge in Clusters? Economic Geography, 89(1), 77–96.
Müller, J. (2006) Interbank Credit Lines as a Channel of Contagion. Journal of Financial Services
Research, 29(1), 37–60.
Mustar, P. (1997) How French Academics Create Hi-Tech Companies: The Conditions for Success or Failure. Science and Public Policy, 24(1), 37–43.
Nadel, S.F. (1957) The Theory of Social Structure. Cohen & West, London.
Neffke, F., Henning, M. (2013) Skill Relatedness and Firm Diversification. Strategic Management
Journal, 34(3), 297–316.
Newman, M., Barabási, A.L. ászló, Watts, D.J. (2006) The Structure and Dynamics of Networks. Princeton university press.
Newman, M.E.J. (2002) Assortative Mixing in Networks. Physical Review Letters, 89(20), 208701.
Newman, M.E.J. (2003) The Structure and Function of Complex Networks. SIAM Review, 45(2), 167–256.
Newman, M.E.J., Strogatz, S.H., Watts, D.J. (2001) Random Graphs with Arbitrary Degree Distributions and Their Applications. Physical Review E, 64(2), 026118.
Nier, E., Yang, J., Yorulmazer, T., Alentorn, A. (2007) Network Models and Financial Stability. Journal of Economic Dynamics and Control, 31(6), 2033–2060.
Niosi, J., Zhegu, M. (2005) Aerospace Clusters: Local or Global Knowledge Spillovers? Industry
and Innovation, 12(1), 5–29.
Nishimura, J., Okamuro, H. (2011) Subsidy and Networking: The Effects of Direct and Indirect Support Programs of the Cluster Policy. Research Policy, 40(5), 714–727.

240
Nishimura, S. (1971) The Decline of Inland Bills of Exchange in the London Money Market 1855-1913. Cambridge University Press, Cambridge.
Nooteboom, B., Haverbeke, W.V., Duysters, G., Gilsing, V., Oord, A. van den (2007) Optimal Cognitive Distance and Absorptive Capacity. Research Policy, 36(7), 1016–1034.
O’Rourke, K.H., Williamson, J.G. (2002) When Did Globalisation Begin? European Review of
Economic History, 6(1), 23–50.
Owen-Smith, J., Powell, W.W. (2004) Knowledge Networks as Channels and Conduits: The Effects of Spillovers in the Boston Biotechnology Community. Organization Science, 15(1), 5–21.
Oxford Research AS (2008) Cluster Policy in Europe–a Brief Summary of Cluster Policies in 31 European Countries (Technical Report). Europe Innova Kristiansand, Norway.
Ozman, M. (2009) Inter-Firm Networks and Innovation: A Survey of Literature. Economics of
Innovation and New Technology, 18(1), 39–67.
Pallotti, F., Lomi, A. (2011) Network Influence and Organizational Performance: The Effects of Tie Strength and Structural Equivalence. European Management Journal, 29(5), 389–403.
Palmer, D., Friedland, R., Singh, J.V. (1986) The Ties That Bind: Organizational and Class Bases of Stability in a Corporate Interlock Network. American Sociological Review, 51(6), 781–796.
Perera, S., Bell, M.G.H., Bliemer, M.C.J. (2017) Network Science Approach to Modelling the Topology and Robustness of Supply Chain Networks: A Review and Perspective. Applied
Network Science, 2(1).
Perrucci, R., Pilisuk, M. (1970) Leaders and Ruling Elites: The Interorganizational Bases of Community Power. American Sociological Review, 35(6), 1040–1057.
Petersen, M.A., Rajan, R.G. (1994) The Benefits of Lending Relationships: Evidence from Small Business Data. The Journal of Finance, 49(1), 3–37.
Phelps, C., Heidl, R., Wadhwa, A. (2012) Knowledge, Networks, and Knowledge Networks: A Review and Research Agenda. Journal of Management, 38(4), 1115–1166.
Pizarro, N. (2007) Structural Identity and Equivalence of Individuals in Social Networks: Beyond Duality. International Sociology, 22(6), 767–792.
Porter, M.E. (1998) Clusters and the New Economics of Competition. Harvard Business Review, 76(6), 77–90.
Potts, J. (2000) The New Evolutionary Microeconomics : Complexity, Competence, and Adaptive Behaviour. E. Elgar Pub, Cheltenham, UK Northampton, MA, USA.
Powell, W.W. (1990) Neither Market nor Hierarchy: Network Forms of Organization. Research in
Organizational Behavior, 12, 295–336.
Powell, W.W., Koput, K.W., Smith-Doerr, L., Owen-Smith, J. (1999) Network Position and Firm Performance: Organizational Returns to Collaboration in the Biotechnology Industry. In Andrews, S. and Knoke, D. (eds.), Networks In and Around Organizations. JAI Press, Greenwich, CT, pp. 129–159.
Powell, W.W., White, D.R., Koput, K.W., Owen‐Smith, J. (2005) Network Dynamics and Field Evolution: The Growth of Interorganizational Collaboration in the Life Sciences. American
Journal of Sociology, 110(4), 1132–1205.

241
Pröpper, I., Marc Van Lelyveld, Heijmans, R. (2008) Towards a Network Description of Interbank Payment Flows (Working Paper No. 177/2008). De Nederlandsche Bank.
Rajan, R.G. (1992) Insiders and Outsiders: The Choice between Informed and Arm’s-Length Debt. The Journal of Finance, 47(4), 1367–1400.
Reagans, R., McEvily, B. (2003) Network Structure and Knowledge Transfer: The Effects of Cohesion and Range. Administrative Science Quarterly, 48(2), 240–267.
Rivera, M.T., Soderstrom, S.B., Uzzi, B. (2010) Dynamics of Dyads in Social Networks: Assortative, Relational, and Proximity Mechanisms. Annual Review of Sociology, 36(1), 91–115.
Roberts, R. (2013) Saving the City: The Great Financial Crisis of 1914. Oxford University Press, Oxford.
Roberts, R. (2016) Schröders: Merchants & Bankers. Springer, London.
Robins, G., Alexander, M. (2004) Small Worlds Among Interlocking Directors: Network Structure and Distance in Bipartite Graphs. Computational & Mathematical Organization Theory, 10(1), 69–94.
Rocha, H.O., Sternberg, R. (2005) Entrepreneurship: The Role of Clusters Theoretical Perspectives and Empirical Evidence from Germany. Small Business Economics, 24(3), 267–292.
Rodriguez, M.A., Shinavier, J. (2010) Exposing Multi-Relational Networks to Single-Relational Network Analysis Algorithms. Journal of Informetrics, 4(1), 29–41.
Roethlisberger, F.J., Dickson, W.J. (1939) Management and the Worker. Cambridge University Press, Cambridge.
Roijakkers, N., Hagedoorn, J. (2006) Inter-Firm R&D Partnering in Pharmaceutical Biotechnology since 1975: Trends, Patterns, and Networks. Research Policy, 35(3), 431–446.
Rosenkopf, L., Schilling, M.A. (2007) Comparing Alliance Network Structure across Industries: Observations and Explanations. Strategic Entrepreneurship Journal, 1(3‐4), 191–209.
Santarosa, V.A. (2015) Financing Long-Distance Trade: The Joint Liability Rule and Bills of Exchange in Eighteenth-Century France. The Journal of Economic History, 75(3), 690–719.
Sayers, R.S. (1968) Gilletts in the London Money Market 1867-1967. Clarendon Press, Oxford.
Scammell, W.M. (1968) The London Discount Market. London: Elek, London.
Schelling, T. (1978) Micromotives and Macrobehavior. Norton, New York.
Schoorman, F.D., Bazerman, M.H., Atkin, R.S. (1981) Interlocking Directorates: A Strategy for Reducing Environmental Uncertainty. Academy of Management Review, 6(2), 243–251.
Sharpe, S.A. (1990) Asymmetric Information, Bank Lending, and Implicit Contracts: A Stylized Model of Customer Relationships. The Journal of Finance, 45(4), 1069–1087.
Sheldon, G., Maurer, M. (1998) Interbank Lending and Systemic Risk: An Empirical Analysis for Switzerland. Swiss Journal of Economics and Statistics, 134, 685–704.
Silva, T.C., Alexandre, M. da S., Tabak, B.M. (2018) Bank Lending and Systemic Risk: A Financial-Real Sector Network Approach with Feedback. Journal of Financial Stability, 38, 98–118.
Simmel, G. (1950) The Sociology of Georg Simmel. Free Press, London.

242
Smith-Doerr, L., Powell, W.W. (2003) Networks and Economic Life. In Smelser, N. and Swedberg, R. (eds.), The Handbook of Economic Sociology. Russell Sage Foundation and Princeton University Press, pp. 379–402.
Snijders, T.A.B. (2001) The Statistical Evaluation of Social Network Dynamics. Sociological
Methodology, 31(1), 361–395.
Soramäki, K., Bech, M.L., Arnold, J., Glass, R.J., Beyeler, W.E. (2007) The Topology of Interbank Payment Flows. Physica A: Statistical Mechanics and its Applications, 379(1), 317–333.
Spalding, W.F. (1921) Foreign Exchange and Foreign Bills in Theory and in Practice. I. Pitman, London.
Stein, J.C. (2002) Information Production and Capital Allocation: Decentralized versus Hierarchical Firms. The Journal of Finance, 57(5), 1891–1921.
Sternberg, R. (2014) Success Factors of University-Spin-Offs: Regional Government Support Programs versus Regional Environment. Technovation, 34(3), 137–148.
Stiglitz, J.E., Weiss, A. (1981) Credit Rationing in Markets with Imperfect Information. The
American Economic Review, 71(3), 393–410.
Storper, M., Harrison, B. (1991) Flexibility, Hierarchy and Regional Development: The Changing Structure of Industrial Production Systems and Their Forms of Governance in the 1990s. Research Policy, 20(5), 407–422.
Street, C.T., Cameron, A. (2007) External Relationships and the Small Business: A Review of Small Business Alliance and Network Research. Journal of Small Business Management, 45(2), 239–266.
Stuart, T.E. (1998) Network Positions and Propensities to Collaborate: An Investigation of Strategic Alliance Formation in a High-Technology Industry. Administrative Science Quarterly, 43(3), 668–698.
Stuart, T.E., Podolny, J.M. (1996) Local Search and the Evolution of Technological Capabilities. Strategic Management Journal, 17(S1), 21–38.
Suire, R., Vicente, J. (2014) Clusters for Life or Life Cycles of Clusters: In Search of the Critical Factors of Clusters’ Resilience. Entrepreneurship & Regional Development, 26(1–2), 142–164.
Sykes, J. (1926) The Amalgamation Movement in English Banking, 1825-1925. King, London.
Temizsoy, A., Iori, G., Montes-Rojas, G. (2015) The Role of Bank Relationships in the Interbank Market. Journal of Economic Dynamics and Control, 59, 118–141.
Ter Wal, A.L.J., Boschma, R. (2008) Applying Social Network Analysis in Economic Geography: Framing Some Key Analytic Issues. The Annals of Regional Science, 43(3), 739–756.
Ter Wal, A.L.J., Boschma, R. (2011) Co-Evolution of Firms, Industries and Networks in Space. Regional Studies, 45(7), 919–933.
Thorelli, H.B. (1986) Networks: Between Markets and Hierarchies. Strategic Management Journal, 7(1), 37–51.
Torre, A. (2009) Retour Sur La Notion de Proximité Géographique. Géographie, économie, société, 11(1), 63–75.

243
Tran, N.K., Haasis, H.D. (2013) Literature Survey of Network Optimization in Container Liner Shipping. Flexible Services and Manufacturing Journal, 27(2–3), 139–179.
Truptil, R.J. (1936) British Banks and the London Money Market. J. Cape, London.
Ugolini, S. (2016) Liquidity Management and Central Bank Strength: Bank of England Operations Reloaded, 1889-1910.
Ugolini, S. (2017) The Evolution of Central Banking: Theory and History. Palgrave Macmillan UK.
Upper, C. (2011) Simulation Methods to Assess the Danger of Contagion in Interbank Markets. Journal of Financial Stability, 7(3), 111–125.
Upper, C., Worms, A. (2004) Estimating Bilateral Exposures in the German Interbank Market: Is There a Danger of Contagion? European Economic Review, 48(4), 827–849.
Uyarra, E., Ramlogan, R. (2012) Cluster Policy: A Review of the Evidence. NESTA Working Paper.
Uzzi, B., Spiro, J. (2005) Collaboration and Creativity: The Small World Problem. American
Journal of Sociology, 111(2), 447–504.
Van Apeldoorn, B., De Graaff, N. (2014) Corporate Elite Networks and US Post-Cold War Grand Strategy from Clinton to Obama. European Journal of International Relations, 20(1), 29–55.
Verspagen, B., Duysters, G. (2004) The Small Worlds of Strategic Technology Alliances. Technovation, 24(7), 563–571.
Vicente, J. (2017) Network Failures and Policy Challenges along the Life Cycle of Clusters. In Fornahl, D. and Hassink, R. (eds.), The Life Cycle of Clusters: A Policy Perspective. Edward Elgar Publishing, Cheltenham, UK, pp. 56–75.
Vicente, J. (2018) Economics of Clusters: A Brief History of Cluster Theories and Policy. Palgrave Macmillan.
Vicente, J. (2020) Unravelling the Driving Forces of Networks on Regional Resilience Capabilities. In Bristow, G. and Healy, A. (eds.), Handbook on Regional Economic Resilience. Edward Elgar Publishing, pp. 209–225.
Vicente, J., Balland, P.A., Brossard, O. (2011) Getting into Networks and Clusters: Evidence from the Midi-Pyrenean Global Navigation Satellite Systems (GNSS) Collaboration Network. Regional Studies, 45(8), 1059–1078.
Vigreux, P.B. (1932) Le Crédit Par Acceptation. Paris Centre Financier. Velay. Librairie des Sciences Politiques et Sociales, Paris.
Villena-Oliver, A. (2014a) Fundamentos Estructurales de Los Gobiernos Democráticos: Cohesión Interna y Grupos de Poder. Análisis de Dos Ejecutivos Españoles: 2004 y 2012. PhD Thesis, Universidad de Málaga.
Villena-Oliver, A. (2014b) La Constitución de Un Gobierno Como Acumulación de Poder Relacional. Estudio de Dos Ejecutivos En España. Redes. Revista Hispana para el Análisis
de Redes Sociales, 25(1), 19–48.
Vonortas, N.S. (2012) Social Networks in R&D Program Evaluation. The Journal of Technology
Transfer, 38(5), 577–606.

244
Wake, J. (1997) Kleinwort, Benson: The History of Two Families in Banking. Oxford University Press, USA.
Walker, G., Kogut, B., Shan, W. (1997) Social Capital, Structural Holes and the Formation of an Industry Network. Organization Science, 8(2), 109–125.
Warburg, P.M. (1910) The Discount System in Europe. US Government Printing Office, Washington DC.
Wasserman, S., Faust, K. (1994) Social Network Analysis: Methods and Applications. Cambridge university press, Cambridge.
Watts, D.J. (2004) The “New” Science of Networks. Annual Review of Sociology, 30(1), 243–270.
Watts, D.J., Strogatz, S.H. (1998) Collective Dynamics of `small-World’ Networks. Nature, 393(6684), 440–442.
Weber, M. (1947) The Theory of Social and Economic Organization. The Free Press and the Falcon’s Bring Press.
Wennberg, K., Lindqvist, G. (2008) The Effect of Clusters on the Survival and Performance of New Firms. Small Business Economics, 34(3), 221–241.
Wetherilt, A., Zimmermann, P., Soramäki, K. (2010) The Sterling Unsecured Loan Market during 2006-08: Insights from Network Theory (Working Paper No. 398). Bank of England.
Williamson, O.E. (1985) The Economic Institutions of Capitalism: Firms, Markets, Relational Contracting. Free Press, New York.
Wink, R. (2010) Editorial: Structural Changes in International Aeronautics Markets: Regional, Organisational and Technological Dimensions. International Journal of Technology
Management, 50(3/4), 25–29.
Withers, H. (1920) The Meaning of Money. EP Dutton, New York.
Woolthuis, R.K., Lankhuizen, M., Gilsing, V. (2005) A System Failure Framework for Innovation Policy Design. Technovation, 25(6), 609–619.
Yang, W., Yu, X., Wang, D., Yang, J., Zhang, B. (2019) Spatio-Temporal Evolution of Technology Flows in China: Patent Licensing Networks 2000–2017. The Journal of Technology
Transfer.
Zaheer, A., Bell, G.G. (2005) Benefiting from Network Position: Firm Capabilities, Structural Holes, and Performance. Strategic Management Journal, 26(9), 809–825.
Zuliani, J.M. (2008) The Toulouse Cluster of On-Board Systems: A Process of Collective Innovation and Learning. European Planning Studies, 16(5), 711–726.

245
List of figures
Figure 1.1: Affiliation, bipartite network and one-mode projection 1 28
Figure 1.2: Places’ network 2 31
Figure 1.3: Chains and single-relational network 3 39
Figure 1.4: Multi-relational network 4 42
Figure 1.5: Hyperstructure graph 5 45
Figure 2.1: Evolving demography of Aerospace Valley network 6 71
Figure 2.2: A stylized construction of a network of places 7 74
Figure 2.3: 1-mode network and network of places (Aerospace Valley cluster, cohort#4) 8 76
Figure 2.4: Degree distribution and correlation over time 9 77
Figure 2.5: The construction process of the p-cohesive blocks of the cohort 1 10 79
Figure 2.6: p-cohesive blocks (4 cohorts) 11 80
Figure 2.7: The elite component of the Aerospace Valley network 12 82
Figure 2.8: Single & multi-granted projects and diversification 13 85
Figure 2.9: Organizations linking aerospace industry and other technological fields 14 86
Figure 3.1: Affiliation, bipartite network and one-mode projection 15 103
Figure 3.2: Places’ network 16 104
Figure 3.3: Cohesive blocks of places’ network 17 107
Figure 3.4: Transports – Cohort 1: Cohesive block structure 18 112
Figure 3.5: Evolution of the sector Transports 19 114
Figure 3.6: Illustrative cases of cohesive block structures 20 115
Figure 3.7: Hierarchical Clustering Dendrogram 21 118
Figure 4.1: Geographical location of borrowers (drawers) on the London bill market 22 129
Figure 4.2: Example of a commercial transaction financed by a sterling bill of exchange 23 133
Figure 4.3: Bill of exchange, 1910 24 137
Figure 4.4: The Bank of England’s re-discount policy, 1889-1910 25 141
Figure 4.5: Share of individual merchant banks in Gilletts’ 1906 discounts and re-discounts to the
Bank of England 26 146
Figure 4.6: Geographical location of European borrowers (drawers) on the London bill market 27149
Figure 4.7: Dual structure of the accepting and discounting industries 28 158
Figure 4.8: Discounters’ portfolio of acceptors 29 160
Figure 4.9: Discounters’ portfolio of drawers 30 162

246
Figure 4.10: Discount houses versus commercial banks’ portfolios of drawers 31 163
Figure 4.A.1: Acceptor/discounter ratios: Observed versus simulated 32 172
Figure 4.A.2: Shared drawers: Observed versus simulated 33 174
Figure 4.B.1: Links between a triad of nodes appearing on a bill of exchange 34 176
Figure 5.1: The origination and distribution chain of a bill of exchange 35 189
Figure 5.2: A fictive example of four different chains connecting six agents 36 192
Figure 5.3: Degrees distributions of observed and simulated networks 37 197
Figure 5.4: Node removal – Absolute systemicness 38 200
Figure 5.5: Node removal – Absolute vs Local systemicness 39 203
Figure 5.6: Local systemicness by acceptor-discounter roles 40 204
Figure 5.7: Frequency distribution of Local Impact Rate – Acceptors and discounters 41 205
Figure 5.8: Impact of individuals and groups removal on cities 42 209
Figure 5.9: Cities vulnerability by acceptor and discounter roles 43 212

247
List of tables
Table 2.1: Network descriptive statistics 1 71
Table 2.2: Descriptive statistics (network of places) 2 75
Table 3.1: Distribution of projects by sector-cohort networks 3 111
Table 3.2: Regression models results of diversification impact 4 117
Table 3.3: Network descriptive statistics 5 126
Table 4.1: Ranking of London acceptance houses in 1906 6 144
Table 4.2: Comparison of acceptors in Gilletts’ total discounts and re-discounts to the Bank of
England, 1906 7 145
Table 4.3: Correlation between the size of acceptors in Gilletts’ and Bank of England’s bill
portfolios, 1906 8 147
Table 4.4: Acceptors and discounters per drawer 9 153
Table 4.5: Market concentration in accepting and discounting 10 156
Table 4.B.1: Node centrality - Summary statistics 11 177
Table 4.B.2: Network’s structural properties – Descriptive statistics 12 178
Table 5.1: Individuals’ specialization and location 13 195
Table 5.2: Descriptive statistics of the 31 most systemic individuals 14 201
Table 5.3: Total impact, impact by roles and market share 15 206
Table 5.4: Frequency distribution of cities according to their number of drawers 16 208

248

249
Table of Contents
General introduction 9
References of the introduction 17
Chapter 1 – Chasing “Strange Animals”: Network Analysis Tools for the Study of Hybrid Organizations 19
1.1. Introduction 20
1.2. Hybrid organizations and network analysis: conceptual framework 22
1.2.1. The missing piece of coordination structures in micro-macro dynamics 22
1.2.2. Studying hybrid organizations through network analysis tools: issues 24
1.2.3. Beyond pairwise relations: new tools for studying hybrid organizations 26
1.3. Horizontal hybrid organizations as affiliation networks 26
1.3.1. Introduction: Affiliation networks 26
1.3.2. Analytical tools: bipartite networks and their one-mode projections 28
1.3.3. One-mode projections of bipartite networks: analytical problems 29
1.3.4. Solutions: place networks 30
1.3.5. Studying horizontal hybrid organization through places: some applications 33
1.4. Vertical hybrid organizations as sequential interaction networks 36
1.4.1. Introduction: sequential interaction networks 36
1.4.2. Analytical tools: relational chains 38
1.4.3. Relational chains: analytical problems 40
1.4.4. Solutions: sequential multi-relational hyperstructures 43
1.4.5. Studying vertical hybrid organization through chains: some applications 46
1.5. Summary and way forward 49
References of the Chapter 1 51
Chapter 2 – The visible hand of cluster policy makers: An analysis of Aerospace Valley (2006-2015) using a place-based network methodology 57
2.1. Introduction 58
2.2. Network failures, behavioral additionality, and the design of collaborative incentives in cluster policies 60
2.2.1. Filtering and selecting knowledge collaborations in clusters 61
2.2.2. Connectivity and the structural properties of networks in clusters 64
2.3. The context of Aerospace Valley in Toulouse 67
2.3.1. Cluster context: mature markets and the need for regional diversification and relatedness 67
2. 3.2. Cluster policy guideline: a two-stage selection process 68
2.4. Data collection and methodology 70
2.4.1. Data collection and disambiguation 70
2.4.2. Overpassing bias and capturing groups’ behavior: the place-based network methodology 72
2.5. Identification of the evolving structural properties of Aerospace Valley Cluster 76
5.1. Degree distribution (hierarchy), degree correlation (assortativity) 77
2.5.2. Connectedness and p-cohesive blocks modeling 78

250
2.6. Discussion of the findings 81
2.6.1. The changing structural role of SMEs 81
2.6.2. Cluster/pipeline structure as a driver of diversification and less assortative knowledge networks 84
2.7. Conclusion 87
References of the Chapter 2 90
Chapter 3 – Do R&D diversification policies change the cognitive structure of knowledge networks? Evidence from France using a meso-structural approach 95
3.1. Introduction 96
3.2. Literature review: innovation, cluster policies, and diversification 98
3.3.Methodology: a meso-structural approach to the study of communities 101
3.3.1. Communities: Structural equivalence and cohesion 101
3.3.2. Places, blocks, and peaks: Revealing the topography of networks 102
3.3.3. Micro and macro properties of the network 108
3.4. Data: France’s FUI program for the funding of cluster activities 110
3.5. Analysis and results 112
3.5.1. Qualitative analysis of the sectors 112
3.5.2. Diversification policies and research topics emergence 116
3.6. Discussion and conclusion 120
References of the Chapter 3 122
A.3. Appendix 126
Chapter 4 – The Origination and Distribution of Money Market Instruments: Sterling Bills of Exchange during the First Globalisation 127
4.1. Introduction 128
4.2. The sterling bill of exchange 131
4.2.1. The bill of exchange: Definition and functioning 131
4.2.2. The bill of exchange: Examples 132
4.2.3. Bills as carriers of information 136
4.3. Data 139
4.3.1. Data Source 139
4.3.2. Representativeness 142
4.4. Anatomy of the London money market 148
4.4.1. Information asymmetries and the money market 148
4.4.2. The business of accepting 150
4.4.3. The special relationship between drawers and acceptors 151
4.5. Market structure of the accepting and discounting industries 155
4.5.1. The business of discounting 159
4.6. Conclusions 164
References of the Chapter 4 166
A.4. Appendix A: Network simulations 170

251
A.4. Appendix B: Network analysis – Descriptive statistics 176
Chapter 5 – Bank substitutability and financial network resilience: insights from the first globalization 181
5.1. Introduction 182
5.2. Literature review 183
5.2.1. Financial stability and network analysis: introduction 183
5.2.2. Data availability 184
5.2.3. Network structures 185
5.2.4. Shock simulations 186
5.2.5. Bank-firm networks 187
5.2.6. Literature review: summary 188
5.3. Empirical strategy 189
5.3.1. Data 189
5.3.2. Chains 190
5.3.3. Shock simulations in chains 191
5.4. Results 193
5.4.1. Results: Introduction 193
5.4.2. Descriptive statistics 194
5.4.3. Absolute systemicness 199
5.4.4. Local systemicness 202
5.4.5. Group systemicness 206
5.4.6. Geographic systemicness 207
5.4.7. City vulnerability 211
5.6. Conclusions 214
References of the Chapter 5 216
General conclusions 221
References of the conclusions 225
General bibliography 227
List of figures 245
List of tables 247


Au-delà de l'Approche Dyadique dans l'Analyse des Réseaux Sociaux : Applications aux Études sur l'Innovation et à l'Économie Financière
Au cours des dernières décennies, l'Analyse des Réseaux Sociaux est devenue de plus en plus populaire en économie. Cette thèse se concentre sur les structures méso-économiques "horizontales" et "verticales", que nous associons respectivement aux réseaux d'affiliation et d'interaction. Dans le chapitre 1, nous discutons de la pertinence de la méthodologie des places pour l'étude des méso-structures "horizontales" dans les réseaux d'affiliation, tandis que les hyperstructures sont un outil approprié pour l'étude des méso-structures "verticales" dans les réseaux d'interaction. Ces idées sont en suite mises en œuvre dans deux applications empiriques concernant l'innovation et la finance. Les chapitres 2 et 3 s’inscrivent dans le domaine des études de l'innovation, et traitent de l'effet des politiques de R&D sur les réseaux d'innovation collaboratifs (qui représentent des relations d'affiliation) en utilisant la méthodologie des places, qui repose sur l'équivalence structurelle. L'approche de l'équivalence structurelle permet d'identifier les agents partageant la même position structurelle (c'est-à-dire les agents soumis aux mêmes ressources et contraintes relationnelles) et d'obtenir ainsi le "squelette" des réseaux d'affiliation. Cela nous permet de surmonter certains biais et certaines limites de l'analyse classique et de fournir de nouvelles perspectives sur l'innovation en tant qu'action collective. Les chapitres 4 et 5 s’inscrivent dans le domaine de l'économie financière, et étudient la structure du réseau financier mondial pendant la Première Mondialisation. Nous nous concentrons sur les chaînes d'origine et de distribution des instruments du marché monétaire (qui représentent les relations d'interaction), et nous montrons que l'interdépendance des rôles joués par les agents dans les chaînes a permis de surmonter les asymétries d'information et de générer un système financier très résilient. Afin d'étudier les chaînes en tant que structures supra-dyadiques, nous utilisons des hypergraphes : cette approche originale nous permet de surmonter les erreurs d'interprétation potentiellement induites par les méthodologies classiques (comme les réseaux simples ou multi-niveaux) et de souligner ainsi les propriétés structurelles du réseau financier mondial.
Mots clés : réseaux sociaux, structures méso, systèmes d'innovation, réseaux financiers
Beyond the Dyadic Approach in Social Network Analysis: Applications to Innovation Studies and Financial Economics
In the recent decades, Social Network Analysis has become increasingly popular in economics. This thesis focuses on “horizontal” and “vertical” meso economic structures, which we associate to affiliation and interaction networks respectively. In Chapter 1, we argue that the place-based methodology is a convenient tool for the study of "horizontal" meso-structures in affiliation networks, while hyperstructures are a convenient tool for the study of "vertical" meso-structures in interaction networks. These insights are henceforth put to work in two empirical applications, relating to innovation and finance respectively. Chapters 2 and 3 situate themselves within the field of innovation studies, and address the effect of R&D policies on collaborative innovation networks (which represent affiliation relationships) using the place-based methodology, which builds on structural equivalence. The structural equivalence approach allows to identify agents sharing the same structural position (viz., agents under the same relational resources and constraints) and thus to obtain the “skeleton” of affiliation networks. This enables us to overcome some biases and limitations of classical analysis and to provide new insights on innovation as collective action. Chapters 4 and 5 situate themselves in the field of financial economics, and study the structure of the global financial network during the First Globalisation. We focus on the origination and distribution chains of money market instruments (which represent interaction relationships), and show that the interdependence of the roles played by agents in chains helped overcome information asymmetries and generate a highly resilient financial system. In order to study chains as supra-dyadic structures, we use hypergraphs: this original approach allows us to overcome the misinterpretations potentially induced by classical methodologies (as e.g. simple or multilayer networks) and thus to underscore the structural properties of the global financial network.
Keywords: social networks, meso structures, innovation systems, financial networks