Automotive Seat Comfort and Vibration Performance ... - MDPI
16
Citation: Pan-Zagorski, W.; Johnson, P.W.; Pereny, M.; Kim, J.H. Automotive Seat Comfort and Vibration Performance Evaluation in Dynamic Settings. Appl. Sci. 2022, 12, 4033. https://doi.org/10.3390/ app12084033 Academic Editors: Yu Song and Neil Mansfield Received: 18 March 2022 Accepted: 13 April 2022 Published: 16 April 2022 Publisher’s Note: MDPI stays neutral with regard to jurisdictional claims in published maps and institutional affil- iations. Copyright: © 2022 by the authors. Licensee MDPI, Basel, Switzerland. This article is an open access article distributed under the terms and conditions of the Creative Commons Attribution (CC BY) license (https:// creativecommons.org/licenses/by/ 4.0/). applied sciences Article Automotive Seat Comfort and Vibration Performance Evaluation in Dynamic Settings Wu Pan-Zagorski 1 , Peter W. Johnson 2 , Missy Pereny 1 and Jeong Ho Kim 3, * 1 Seat Comfort Engineering, Lear Corporation, Southfield, MI 48033, USA; [email protected] (W.P.-Z.); [email protected] (M.P.) 2 Department of Envrionmental and Occupational Health Science, University of Washington, Seattle, WA 98105, USA; [email protected] 3 School of Biological and Population Health Science, Oregon State University, Corvallis, OR 97331, USA * Correspondence: [email protected] Abstract: An automotive seat is a key component which not only provides restraint and support for its occupant, but also mitigates vibration. Since an automotive seat is in constant contact with the vehicle occupant, its dynamic comfort is of great importance in automotive seat designs. In this study, three automotive seats with different foam firmnesses were evaluated to understand how the foam firmness, through different foam formulations, affected the seat vibration performance and perceived dynamic comfort in a laboratory (study 1) and field setting (study 2). In a repeated-measures laboratory based study, whole-body vibration (per ISO 2631-1), self-reported body discomfort, and seating comfort were measured and compared among the three automotive seats while participants were exposed to tri-axial, field-measured, automotive vibration and X-Y-Z axis 1–30 Hz sine sweeps. In a subsequent ride-and-drive field study, the two seats that received the highest comfort ratings from the laboratory study were installed in two identical vehicles and whole body vibration (WBV) and self-reported seating comfort were evaluated by the participants. The results showed that the foam firmness significantly affected WBV measures and self-reported comfort (p < 0.05). This study demonstrated that altering foam formulation can be an effective way of further improving dynamic vibration and seat comfort performance. Keywords: vibration; automotive; comfort; foam properties 1. Introduction Whether it is in conventional driving or riding in an autonomous vehicle, the auto- motive seat continuously supports the vehicle occupants and has the greatest effect on the overall ride-and-drive comfort. Of all the components within the seat, the foam consists of the most volume, has the largested contact areas as a primary interface between the seat and occupants, and provides the most direct support to the occupant. Therefore, it plays a key role in the occupants’ seating comfort. Foam mechanical properties, including density and firmness, are known to affect contact pressure, buttocks tissue oxygenation, and perceived seating comfort [1–3]. In addition, previous studies have shown that these foam properties can also mitigate vibration being transmitted from the vehicle floor to the occupants, and therefore impact the occupants’ perceptions on their riding experiences [4,5]. Extensive research has indicated that foam mechanical properties such as firmness and vibration transmissibility can significantly affect the occupants’ seating comfort and body discomfort [6–10]. However, these studies also have some notable limitations. For example, the standardized vibration testing for seat comfort evaluations specified by SAE [11] uses a sine sweep input, rather than actual field-measured vibration profiles. Therefore, such tests only measure the seat mechanical properties and do not directly translate to the occupants’ perceptions on seating comfort in real-life driving or riding scenarios. Additionally, most studies which evaluated the effects of the foam characteristics on seating comfort have Appl. Sci. 2022, 12, 4033. https://doi.org/10.3390/app12084033 https://www.mdpi.com/journal/applsci
-
Upload
khangminh22 -
Category
Documents
-
view
2 -
download
0
Transcript of Automotive Seat Comfort and Vibration Performance ... - MDPI
�����������������
Citation: Pan-Zagorski, W.; Johnson,
P.W.; Pereny, M.; Kim, J.H.
Automotive Seat Comfort and
Vibration Performance Evaluation in
Dynamic Settings. Appl. Sci. 2022, 12,
4033. https://doi.org/10.3390/
app12084033
Academic Editors: Yu Song and
Neil Mansfield
Received: 18 March 2022
Accepted: 13 April 2022
Published: 16 April 2022
Publisher’s Note: MDPI stays neutral
with regard to jurisdictional claims in
published maps and institutional affil-
iations.
Copyright: © 2022 by the authors.
Licensee MDPI, Basel, Switzerland.
This article is an open access article
distributed under the terms and
conditions of the Creative Commons
Attribution (CC BY) license (https://
creativecommons.org/licenses/by/
4.0/).
applied sciences
Article
Automotive Seat Comfort and Vibration PerformanceEvaluation in Dynamic SettingsWu Pan-Zagorski 1, Peter W. Johnson 2, Missy Pereny 1 and Jeong Ho Kim 3,*
1 Seat Comfort Engineering, Lear Corporation, Southfield, MI 48033, USA; [email protected] (W.P.-Z.);[email protected] (M.P.)
2 Department of Envrionmental and Occupational Health Science, University of Washington,Seattle, WA 98105, USA; [email protected]
3 School of Biological and Population Health Science, Oregon State University, Corvallis, OR 97331, USA* Correspondence: [email protected]
Abstract: An automotive seat is a key component which not only provides restraint and support forits occupant, but also mitigates vibration. Since an automotive seat is in constant contact with thevehicle occupant, its dynamic comfort is of great importance in automotive seat designs. In this study,three automotive seats with different foam firmnesses were evaluated to understand how the foamfirmness, through different foam formulations, affected the seat vibration performance and perceiveddynamic comfort in a laboratory (study 1) and field setting (study 2). In a repeated-measureslaboratory based study, whole-body vibration (per ISO 2631-1), self-reported body discomfort, andseating comfort were measured and compared among the three automotive seats while participantswere exposed to tri-axial, field-measured, automotive vibration and X-Y-Z axis 1–30 Hz sine sweeps.In a subsequent ride-and-drive field study, the two seats that received the highest comfort ratingsfrom the laboratory study were installed in two identical vehicles and whole body vibration (WBV)and self-reported seating comfort were evaluated by the participants. The results showed that thefoam firmness significantly affected WBV measures and self-reported comfort (p < 0.05). This studydemonstrated that altering foam formulation can be an effective way of further improving dynamicvibration and seat comfort performance.
Keywords: vibration; automotive; comfort; foam properties
1. Introduction
Whether it is in conventional driving or riding in an autonomous vehicle, the auto-motive seat continuously supports the vehicle occupants and has the greatest effect on theoverall ride-and-drive comfort. Of all the components within the seat, the foam consists ofthe most volume, has the largested contact areas as a primary interface between the seat andoccupants, and provides the most direct support to the occupant. Therefore, it plays a keyrole in the occupants’ seating comfort. Foam mechanical properties, including density andfirmness, are known to affect contact pressure, buttocks tissue oxygenation, and perceivedseating comfort [1–3]. In addition, previous studies have shown that these foam propertiescan also mitigate vibration being transmitted from the vehicle floor to the occupants, andtherefore impact the occupants’ perceptions on their riding experiences [4,5].
Extensive research has indicated that foam mechanical properties such as firmness andvibration transmissibility can significantly affect the occupants’ seating comfort and bodydiscomfort [6–10]. However, these studies also have some notable limitations. For example,the standardized vibration testing for seat comfort evaluations specified by SAE [11] uses asine sweep input, rather than actual field-measured vibration profiles. Therefore, such testsonly measure the seat mechanical properties and do not directly translate to the occupants’perceptions on seating comfort in real-life driving or riding scenarios. Additionally, moststudies which evaluated the effects of the foam characteristics on seating comfort have
Appl. Sci. 2022, 12, 4033. https://doi.org/10.3390/app12084033 https://www.mdpi.com/journal/applsci
Appl. Sci. 2022, 12, 4033 2 of 16
been conducted in static, short term, laboratory settings [11,12]. Because commonly-usedautomotive seating foams (open cell polyurethane foam) have time dependent viscoelasticmaterial properties [13–16], the existing short-term evaluations may not provide accurateimplications for longer-term dynamic comfort. Hence, it is of great importance to evaluateseating comfort with suitable time durations to account for time-dependency nature of thefoam mechanical properties.
The foam mechanical properties are known to affect the occupants’ vibration exposures.The vibration transmitted from a vehicle to the human body is defined as whole bodyvibration (WBV) [17]. WBV has long been associated with various adverse health outcomes,especially in the lower back and neck regions [18–21]. Other studies have indicated thatWBV substantially affects a vehicle occupant’s perceptions of seating comfort, fatigue, andalertness, especially for longer-term (>45 min) driving and riding scenarios [4,5,22,23].Extensive research on WBV has been carried out on commercial vehicles which widely useactive, mechanical or pneumatic suspension systems to mitigate vibration [21,24,25]. On thecontrary, passenger vehicles mostly rely on the seat cushion foam for damping and vibrationisolation [26]. Because the seat foam is a sole source for vibration mitigation in passengervehicles, it is important to understand how different mechanical properties of the seat foamaffect WBV and associated seating comfort. While previous studies evaluated the effects offoam properties on WBV and related comfort measures, those comfort studies used rigidlaboratory-built testing seats or disassembled incomplete automotive seats in laboratorysettings [8,27,28]. Such incomplete testing seats usually have inferior surface, bolstering,and body support compared to those currently in the market, which can significantly affectWBV exposures and associated comfort measures. Moreover, as occupants’ perceivedseating comfort is affected by both physical and psychologoial factors [29], the existinglaboratory studies may not accurately characterize realistic seating comfort as compared tofield-based studies on the real road. Therefore, those existing comfort study results maybe confounded with potential noises due to those unrealistic settings (i.e., laboratory andincomplete seats).
Hence, to fill these research gaps and further understand the effects of different seatfoam properties on WBV and dynamic seating comfort, it is critical to adopt comprehensiveevaluation methods that consist of a controlled study in a laboratory setting which controlspotential confounding factors, supplemented by an on-road ride-and-drive field study forrealistic validations. Thus, the goals of this study were to determine whether altering seatfoam mechanical properties had any effect on WBV exposure, perceived dynamic seatingcomfort, and desirability in both a controlled laboratory setting and subsequent field-basedlonger-term riding conditions.
2. Materials and Methods2.1. Seat Sample Preparation
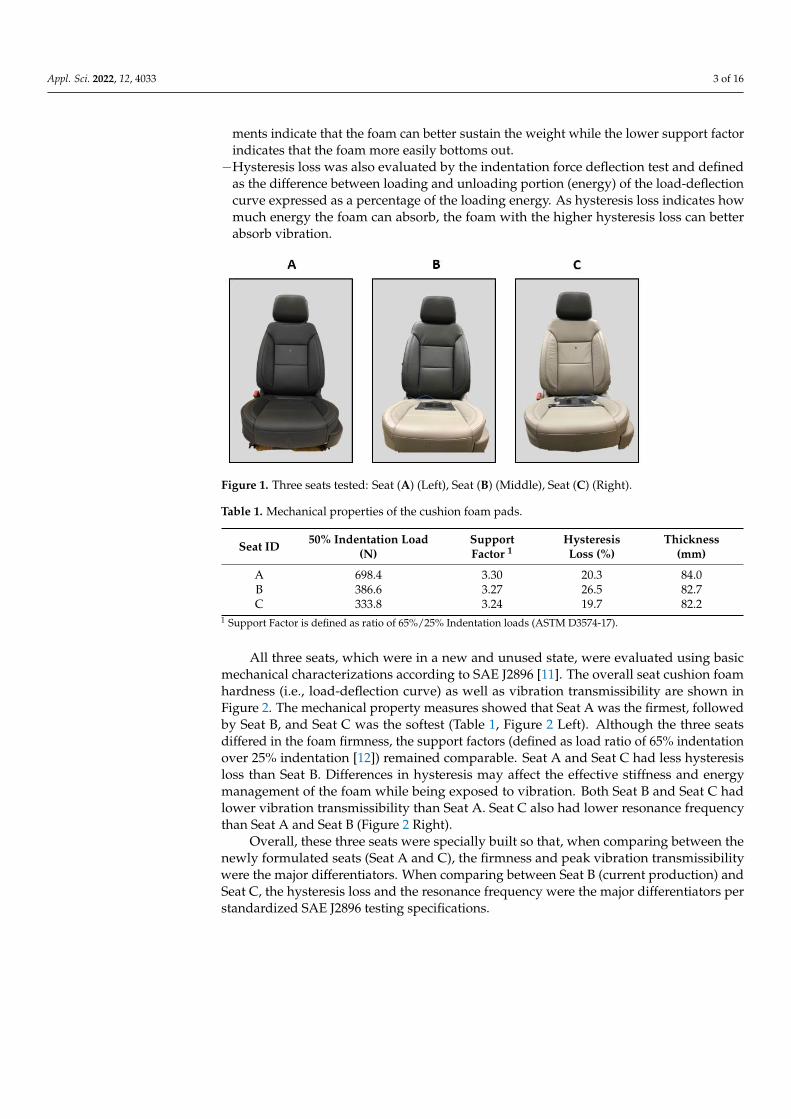
Full-size pick-up truck seats were selected for this study. Three seats were built withbase level attributes (i.e., only with simple adjustment functions, no heating, venting, orpneumatics were included) to eliminate potential bias on seating comfort perceptions(Figure 1). The three seats were identical except for the foam in the seat cushions, whichwere specially formulated for this study. Seat B used the current production foam, whereasSeat A and Seat C contained foams with different chemical formulations. All three foamshad the same density of 58 ± 3 kg/m3.
Three cushion foam pads were tested per ASTM D3574 [12] prior to being assembled intothe seats. The mechanical properties are shown in Table 1 and their definitions are as follows:
−Foam Firmness was evaluated by the indentation force (load) deflection test and summa-rized as 50% indentation load in newtons.
−Support factor (also known as compression modulus) indicates foam’s ability to supportweight. The support factor was calculated by the ratio of 65% to 25% indentation loadsobtained from the indentation force deflection test. The greater support factor measure-
Appl. Sci. 2022, 12, 4033 3 of 16
ments indicate that the foam can better sustain the weight while the lower support factorindicates that the foam more easily bottoms out.
−Hysteresis loss was also evaluated by the indentation force deflection test and definedas the difference between loading and unloading portion (energy) of the load-deflectioncurve expressed as a percentage of the loading energy. As hysteresis loss indicates howmuch energy the foam can absorb, the foam with the higher hysteresis loss can betterabsorb vibration.
Appl. Sci. 2022, 12, x FOR PEER REVIEW 3 of 16
Figure 1. Three seats tested: Seat (A) (Left), Seat (B) (Middle), Seat (C) (Right).
Three cushion foam pads were tested per ASTM D3574 [12] prior to being assembled
into the seats. The mechanical properties are shown in Table 1 and their definitions are as
follows:
− Foam Firmness was evaluated by the indentation force (load) deflection test and
summarized as 50% indentation load in newtons.
− Support factor (also known as compression modulus) indicates foam’s ability to sup-
port weight. The support factor was calculated by the ratio of 65% to 25% indentation
loads obtained from the indentation force deflection test. The greater support factor
measurements indicate that the foam can better sustain the weight while the lower
support factor indicates that the foam more easily bottoms out.
− Hysteresis loss was also evaluated by the indentation force deflection test and de-
fined as the difference between loading and unloading portion (energy) of the load-
deflection curve expressed as a percentage of the loading energy. As hysteresis loss
indicates how much energy the foam can absorb, the foam with the higher hysteresis
loss can better absorb vibration.
Table 1. Mechanical properties of the cushion foam pads.
Seat ID 50% Indentation Load我(N) Support 我
Factor 1
Hysteresis 我Loss
(%) Thickness 我(mm)
A 698.4 3.30 20.3 84.0
B 386.6 3.27 26.5 82.7
C 333.8 3.24 19.7 82.2 1 Support Factor is defined as ratio of 65%/25% Indentation loads (ASTM D3574-17).
All three seats, which were in a new and unused state, were evaluated using basic
mechanical characterizations according to SAE J2896 [11]. The overall seat cushion foam
hardness (i.e., load-deflection curve) as well as vibration transmissibility are shown in
Figure 2. The mechanical property measures showed that Seat A was the firmest, followed
by Seat B, and Seat C was the softest (Table 1, Figure 2 Left). Although the three seats
differed in the foam firmness, the support factors (defined as load ratio of 65% indentation
over 25% indentation [12]) remained comparable. Seat A and Seat C had less hysteresis
loss than Seat B. Differences in hysteresis may affect the effective stiffness and energy
management of the foam while being exposed to vibration. Both Seat B and Seat C had
lower vibration transmissibility than Seat A. Seat C also had lower resonance frequency
than Seat A and Seat B (Figure 2 Right).
Figure 1. Three seats tested: Seat (A) (Left), Seat (B) (Middle), Seat (C) (Right).
Table 1. Mechanical properties of the cushion foam pads.
Seat ID 50% Indentation Load(N)
SupportFactor 1
HysteresisLoss (%)
Thickness(mm)
A 698.4 3.30 20.3 84.0B 386.6 3.27 26.5 82.7C 333.8 3.24 19.7 82.2
1 Support Factor is defined as ratio of 65%/25% Indentation loads (ASTM D3574-17).
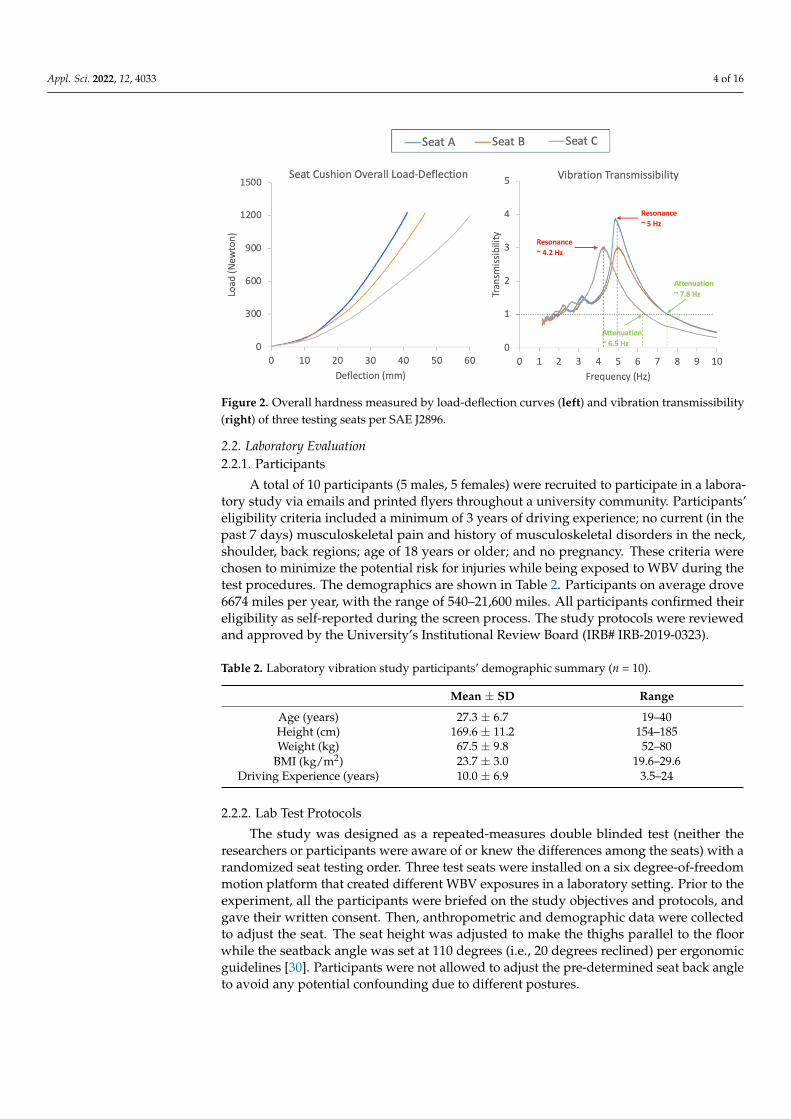
All three seats, which were in a new and unused state, were evaluated using basicmechanical characterizations according to SAE J2896 [11]. The overall seat cushion foamhardness (i.e., load-deflection curve) as well as vibration transmissibility are shown inFigure 2. The mechanical property measures showed that Seat A was the firmest, followedby Seat B, and Seat C was the softest (Table 1, Figure 2 Left). Although the three seatsdiffered in the foam firmness, the support factors (defined as load ratio of 65% indentationover 25% indentation [12]) remained comparable. Seat A and Seat C had less hysteresisloss than Seat B. Differences in hysteresis may affect the effective stiffness and energymanagement of the foam while being exposed to vibration. Both Seat B and Seat C hadlower vibration transmissibility than Seat A. Seat C also had lower resonance frequencythan Seat A and Seat B (Figure 2 Right).
Overall, these three seats were specially built so that, when comparing between thenewly formulated seats (Seat A and C), the firmness and peak vibration transmissibilitywere the major differentiators. When comparing between Seat B (current production) andSeat C, the hysteresis loss and the resonance frequency were the major differentiators perstandardized SAE J2896 testing specifications.
Appl. Sci. 2022, 12, 4033 4 of 16Appl. Sci. 2022, 12, x FOR PEER REVIEW 4 of 16
Figure 2. Overall hardness measured by load-deflection curves (left) and vibration transmissibility
(right) of three testing seats per SAE J2896.
Overall, these three seats were specially built so that, when comparing between the
newly formulated seats (Seat A and C), the firmness and peak vibration transmissibility
were the major differentiators. When comparing between Seat B (current production) and
Seat C, the hysteresis loss and the resonance frequency were the major differentiators per
standardized SAE J2896 testing specifications.
2.2. Laboratory Evaluation
2.2.1. Participants
A total of 10 participants (5 males, 5 females) were recruited to participate in a labor-
atory study via emails and printed flyers throughout a university community. Partici-
pants’ eligibility criteria included a minimum of 3 years of driving experience; no current
(in the past 7 days) musculoskeletal pain and history of musculoskeletal disorders in the
neck, shoulder, back regions; age of 18 years or older; and no pregnancy. These criteria
were chosen to minimize the potential risk for injuries while being exposed to WBV dur-
ing the test procedures. The demographics are shown in Table 2. Participants on average
drove 6674 miles per year, with the range of 540–21,600 miles. All participants confirmed
their eligibility as self-reported during the screen process. The study protocols were re-
viewed and approved by the University’s Institutional Review Board (IRB# IRB-2019-
0323).
Table 2. Laboratory vibration study participants’ demographic summary (n = 10].
Mean ± SD Range
Age (years) 27.3 ± 6.7 19–40
Height (cm) 169.6 ± 11.2 154–185
Weight (kg) 67.5 ± 9.8 52–80
BMI (kg/m2) 23.7 ± 3.0 19.6–29.6
Driving Experience (years) 10.0 ± 6.9 3.5–24
2.2.2. Lab Test Protocols
The study was designed as a repeated-measures double blinded test (neither the re-
searchers or participants were aware of or knew the differences among the seats) with a
randomized seat testing order. Three test seats were installed on a six degree-of-freedom
motion platform that created different WBV exposures in a laboratory setting. Prior to the
experiment, all the participants were briefed on the study objectives and protocols, and
Figure 2. Overall hardness measured by load-deflection curves (left) and vibration transmissibility(right) of three testing seats per SAE J2896.
2.2. Laboratory Evaluation2.2.1. Participants
A total of 10 participants (5 males, 5 females) were recruited to participate in a labora-tory study via emails and printed flyers throughout a university community. Participants’eligibility criteria included a minimum of 3 years of driving experience; no current (in thepast 7 days) musculoskeletal pain and history of musculoskeletal disorders in the neck,shoulder, back regions; age of 18 years or older; and no pregnancy. These criteria werechosen to minimize the potential risk for injuries while being exposed to WBV during thetest procedures. The demographics are shown in Table 2. Participants on average drove6674 miles per year, with the range of 540–21,600 miles. All participants confirmed theireligibility as self-reported during the screen process. The study protocols were reviewedand approved by the University’s Institutional Review Board (IRB# IRB-2019-0323).
Table 2. Laboratory vibration study participants’ demographic summary (n = 10).
Mean ± SD Range
Age (years) 27.3 ± 6.7 19–40Height (cm) 169.6 ± 11.2 154–185Weight (kg) 67.5 ± 9.8 52–80
BMI (kg/m2) 23.7 ± 3.0 19.6–29.6Driving Experience (years) 10.0 ± 6.9 3.5–24
2.2.2. Lab Test Protocols
The study was designed as a repeated-measures double blinded test (neither theresearchers or participants were aware of or knew the differences among the seats) with arandomized seat testing order. Three test seats were installed on a six degree-of-freedommotion platform that created different WBV exposures in a laboratory setting. Prior to theexperiment, all the participants were briefed on the study objectives and protocols, andgave their written consent. Then, anthropometric and demographic data were collectedto adjust the seat. The seat height was adjusted to make the thighs parallel to the floorwhile the seatback angle was set at 110 degrees (i.e., 20 degrees reclined) per ergonomicguidelines [30]. Participants were not allowed to adjust the pre-determined seat back angleto avoid any potential confounding due to different postures.
Appl. Sci. 2022, 12, 4033 5 of 16
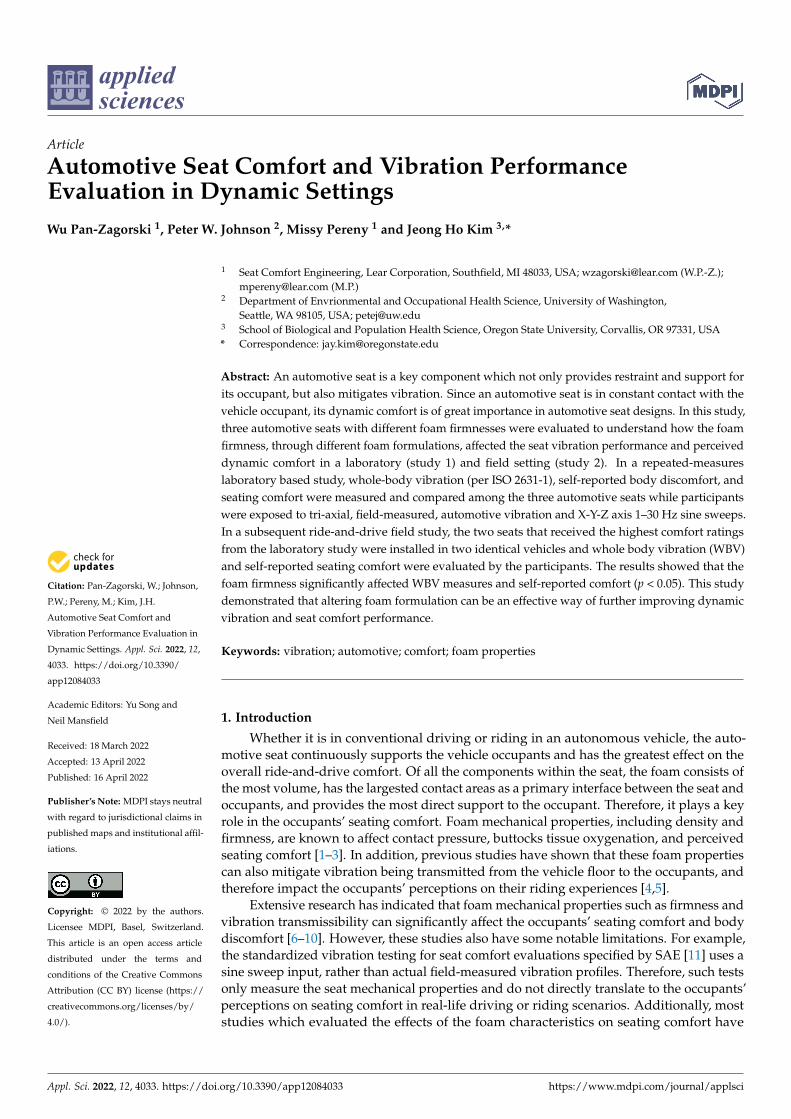
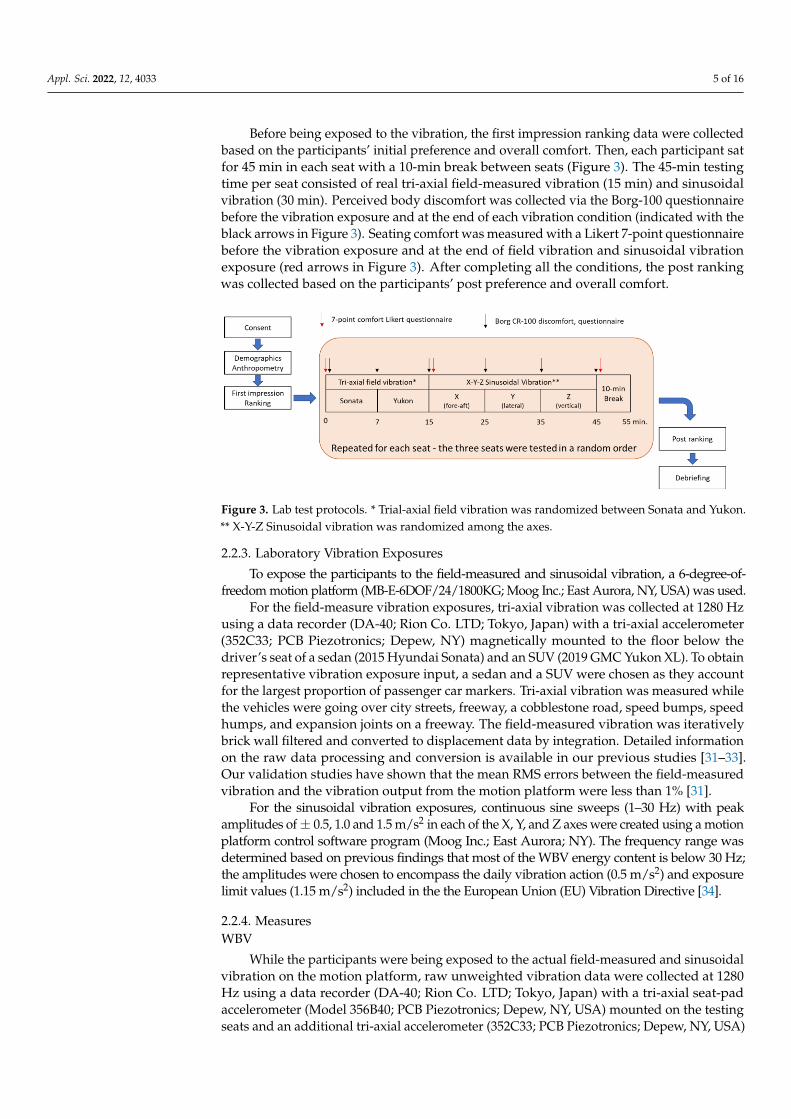
Before being exposed to the vibration, the first impression ranking data were collectedbased on the participants’ initial preference and overall comfort. Then, each participant satfor 45 min in each seat with a 10-min break between seats (Figure 3). The 45-min testingtime per seat consisted of real tri-axial field-measured vibration (15 min) and sinusoidalvibration (30 min). Perceived body discomfort was collected via the Borg-100 questionnairebefore the vibration exposure and at the end of each vibration condition (indicated with theblack arrows in Figure 3). Seating comfort was measured with a Likert 7-point questionnairebefore the vibration exposure and at the end of field vibration and sinusoidal vibrationexposure (red arrows in Figure 3). After completing all the conditions, the post rankingwas collected based on the participants’ post preference and overall comfort.
Appl. Sci. 2022, 12, x FOR PEER REVIEW 5 of 16
gave their written consent. Then, anthropometric and demographic data were collected to
adjust the seat. The seat height was adjusted to make the thighs parallel to the floor while
the seatback angle was set at 110 degrees (i.e., 20 degrees reclined) per ergonomic guide-
lines [30]. Participants were not allowed to adjust the pre-determined seat back angle to
avoid any potential confounding due to different postures.
Before being exposed to the vibration, the first impression ranking data were col-
lected based on the participants’ initial preference and overall comfort. Then, each partic-
ipant sat for 45 min in each seat with a 10-min break between seats (Figure 3). The 45-min
testing time per seat consisted of real tri-axial field-measured vibration (15 min) and si-
nusoidal vibration (30 min). Perceived body discomfort was collected via the Borg-100
questionnaire before the vibration exposure and at the end of each vibration condition
(indicated with the black arrows in Figure 3). Seating comfort was measured with a Likert
7-point questionnaire before the vibration exposure and at the end of field vibration and
sinusoidal vibration exposure (red arrows in Figure 3). After completing all the condi-
tions, the post ranking was collected based on the participants’ post preference and overall
comfort.
Figure 3. Lab test protocols. * Trial-axial field vibration was randomized between Sonata and Yu-
kon. ** X-Y-Z Sinusoidal vibration was randomized among the axes.
2.2.3. Laboratory Vibration Exposures
To expose the participants to the field-measured and sinusoidal vibration, a 6-degree-
of-freedom motion platform (MB-E-6DOF/24/1800KG; Moog Inc.; East Aurora; NY) was
used.
For the field-measure vibration exposures, tri-axial vibration was collected at 1280
Hz using a data recorder (DA-40; Rion Co. LTD; Tokyo, Japan) with a tri-axial accelerom-
eter (352C33; PCB Piezotronics; Depew, NY) magnetically mounted to the floor below the
driver’s seat of a sedan (2015 Hyundai Sonata) and an SUV (2019 GMC Yukon XL). To
obtain representative vibration exposure input, a sedan and a SUV were chosen as they
account for the largest proportion of passenger car markers. Tri-axial vibration was meas-
ured while the vehicles were going over city streets, freeway, a cobblestone road, speed
bumps, speed humps, and expansion joints on a freeway. The field-measured vibration
was iteratively brick wall filtered and converted to displacement data by integration. De-
tailed information on the raw data processing and conversion is available in our previous
studies [31–33]. Our validation studies have shown that the mean RMS errors between the
field-measured vibration and the vibration output from the motion platform were less
than 1% [31].
For the sinusoidal vibration exposures, continuous sine sweeps (1–30 Hz) with peak
amplitudes of ± 0.5, 1.0 and 1.5 m/s2 in each of the X, Y, and Z axes were created using a
motion platform control software program (Moog Inc.; East Aurora; NY). The frequency
range was determined based on previous findings that most of the WBV energy content
is below 30 Hz; the amplitudes were chosen to encompass the daily vibration action (0.5
Figure 3. Lab test protocols. * Trial-axial field vibration was randomized between Sonata and Yukon.** X-Y-Z Sinusoidal vibration was randomized among the axes.
2.2.3. Laboratory Vibration Exposures
To expose the participants to the field-measured and sinusoidal vibration, a 6-degree-of-freedom motion platform (MB-E-6DOF/24/1800KG; Moog Inc.; East Aurora, NY, USA) was used.
For the field-measure vibration exposures, tri-axial vibration was collected at 1280 Hzusing a data recorder (DA-40; Rion Co. LTD; Tokyo, Japan) with a tri-axial accelerometer(352C33; PCB Piezotronics; Depew, NY) magnetically mounted to the floor below thedriver’s seat of a sedan (2015 Hyundai Sonata) and an SUV (2019 GMC Yukon XL). To obtainrepresentative vibration exposure input, a sedan and a SUV were chosen as they accountfor the largest proportion of passenger car markers. Tri-axial vibration was measured whilethe vehicles were going over city streets, freeway, a cobblestone road, speed bumps, speedhumps, and expansion joints on a freeway. The field-measured vibration was iterativelybrick wall filtered and converted to displacement data by integration. Detailed informationon the raw data processing and conversion is available in our previous studies [31–33].Our validation studies have shown that the mean RMS errors between the field-measuredvibration and the vibration output from the motion platform were less than 1% [31].
For the sinusoidal vibration exposures, continuous sine sweeps (1–30 Hz) with peakamplitudes of ± 0.5, 1.0 and 1.5 m/s2 in each of the X, Y, and Z axes were created using a motionplatform control software program (Moog Inc.; East Aurora; NY). The frequency range wasdetermined based on previous findings that most of the WBV energy content is below 30 Hz;the amplitudes were chosen to encompass the daily vibration action (0.5 m/s2) and exposurelimit values (1.15 m/s2) included in the the European Union (EU) Vibration Directive [34].
2.2.4. MeasuresWBV
While the participants were being exposed to the actual field-measured and sinusoidalvibration on the motion platform, raw unweighted vibration data were collected at 1280Hz using a data recorder (DA-40; Rion Co. LTD; Tokyo, Japan) with a tri-axial seat-padaccelerometer (Model 356B40; PCB Piezotronics; Depew, NY, USA) mounted on the testingseats and an additional tri-axial accelerometer (352C33; PCB Piezotronics; Depew, NY, USA)
Appl. Sci. 2022, 12, 4033 6 of 16
magnetically mounted to the floor of the motion platform according to the ISO 2631-1 WBVstandard [17]. The raw unweighted acceleration data were filtered, weighted, and analyzedto calculate root-mean-square (RMS) weighted average vibration (Aw), as shown below.Aw was then normalized to daily equivalent vibration exposure measures [A(8)]:
Aw =
1T
T∫0
a2w(t)dt
12
(1)
where Aw(t): instantaneous frequency-weighted acceleration at time, t; T: the duration ofthe measurement, in seconds.
Power spectral density (PSD) analyses were also performed to determine how the foamcharacteristics of the three seats impacted the vibration energy as a function of frequency(m2/s4/Hz). A custom-built LabVIEW program (Version 2018; National Instruments,Austin, TX, USA) was used to extract and summarize the vibration energy content over thefrequency range from 0.5 to 30 Hz with a frequency resolution of 0.5 Hz.
Self-Reported Measures
Pre-/post- rankings were collected based on participants’ preferences. The Borg CR-100 scale was used to evaluate self-reported localized body discomfort in the upper andlow back, shoulders, neck, ankles/feet, knees, thighs, and tailbone (0 being no discomfortat all; 100 being maximal discomfort). Perceived seating comfort was measured using a7-point Likert scale (1 being least comfortable; 7 being most comfortable).
2.2.5. Statistical Analyses
The independent variable was ‘seat’; the dependent variables included WBV [A(8)], self-reported body discomfort, seating comfort, and seat ranking. WBV [A(8)], self-reported bodydiscomfort, and seat comfort data were analyzed via a mixed model with restricted maximumlikelihood estimation (REML) in JMP (Pro 13; SAS Institute Inc., Cary, SC, USA) to determinewhether there were differences in WBV and seating comfort measures among the three seats.To account for within-subject correlation, ‘subject’ was included as a random effect while ‘seat’was the fixed effect in the mixed model. Any statistical significance was followed up withpost-hoc multiple comparisons by adjusting type I errors (Tukey HSD). Pre-post ranking datawere analyzed using χ2 tests. Statistical significance was determined when p < 0.05.
2.3. Field Evaluation
After the laboratory study, the two seats rated more comfortable (Seat B and Seat C)were selected for a subsequent on-road field testing to evaluate the two seats in realisticriding and driving settings.
2.3.1. Participants
Twelve adult participants (8 males, 4 females) were recruited from a company campus(demographics shown in Table 3). The eligibility criteria included: being able to sit in themoving vehicle for two hours without any body pain; over 18 years old; and not beingpregnant. The participants provided their ages as age groups (7 in 20 s, 1 in 30 s, 2 in40 s, 1 in 50 s, and 1 in 60 s). The participants provided verbal consents and the studyfollowed company’s guidelines for on-road ride and drive testing with the ISO accreditedlab personnels stationed in the vehicle.
Appl. Sci. 2022, 12, 4033 7 of 16
Table 3. Field vibration study participants’ demographic summary (n = 12).
Mean ± SD Range
Height (cm) 171.7 ± 8.8 152.4–185.4Weight (kg) 76.4 ± 23.9 49.8–135.0
BMI (kg/m2) 25.7 ± 7.0 17.7–43.9Daily Commute Time 1 (mins) 27.5 ± 11.0 15.0–50.0Personal Vehicle Age (years) 5.4 ± 7.3 0.0–20.0
1 Daily commute time defined as one way between home and work.
2.3.2. Field Test Protocols
This field evaluation was based on a repeated-measures design with a randomizedseat order. The participants had no prior knowledge about the seats being tested. The twoseats were installed in two identical vehicles (2021 Chevy Silverado). Silverado was used, asthe Yukon (which vibration tested in the lab study) and Silverado share the same platformand components, including the seats. Therefore, the participants’ exposure to vibration andsitting postures were expected to be comparable. Prior to driving, the participants wereallowed to adjust the seats to their comfort preferences. Then, they drove the two vehiclesover the same test route for 50–60 min per vehicle with a 5–10 min break between testingin each vehicle. The test route consisted of two segments of highway, one segment of dirtroad, one segment of city street, and one segment of freeway. WBV was collected duringthe test ride; perceived seating comfort was collected before and after the test ride.
2.3.3. MeasuresWBV
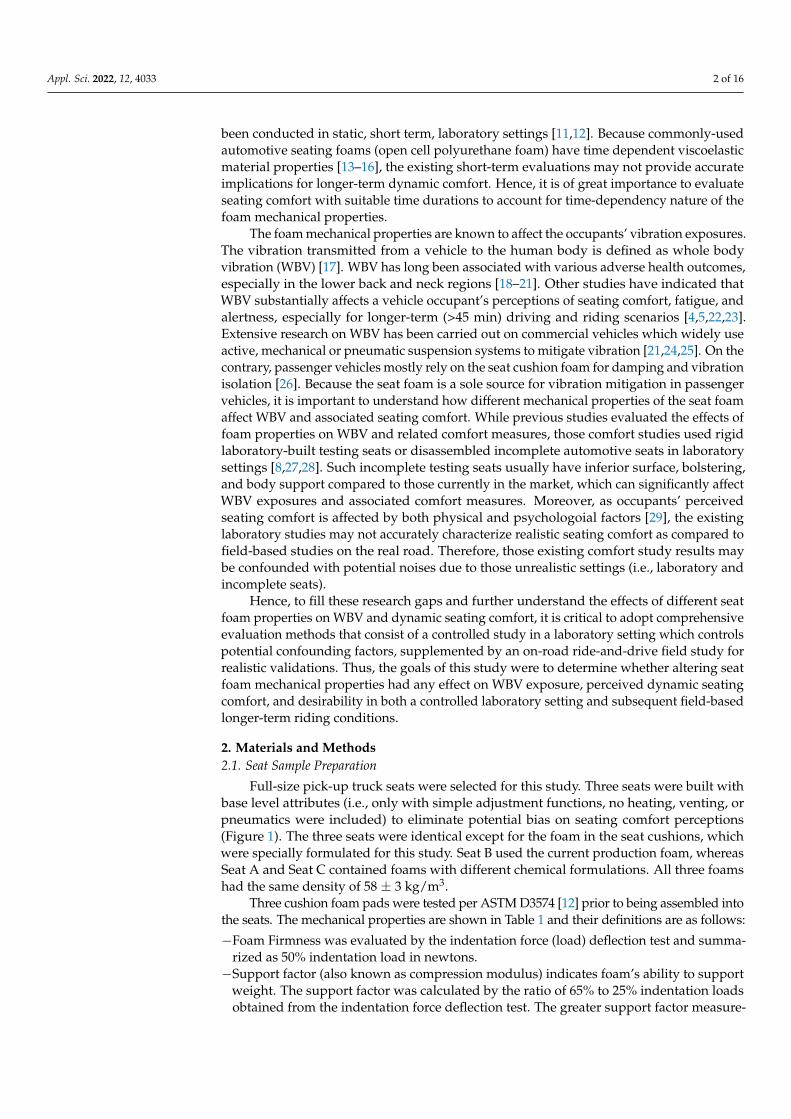
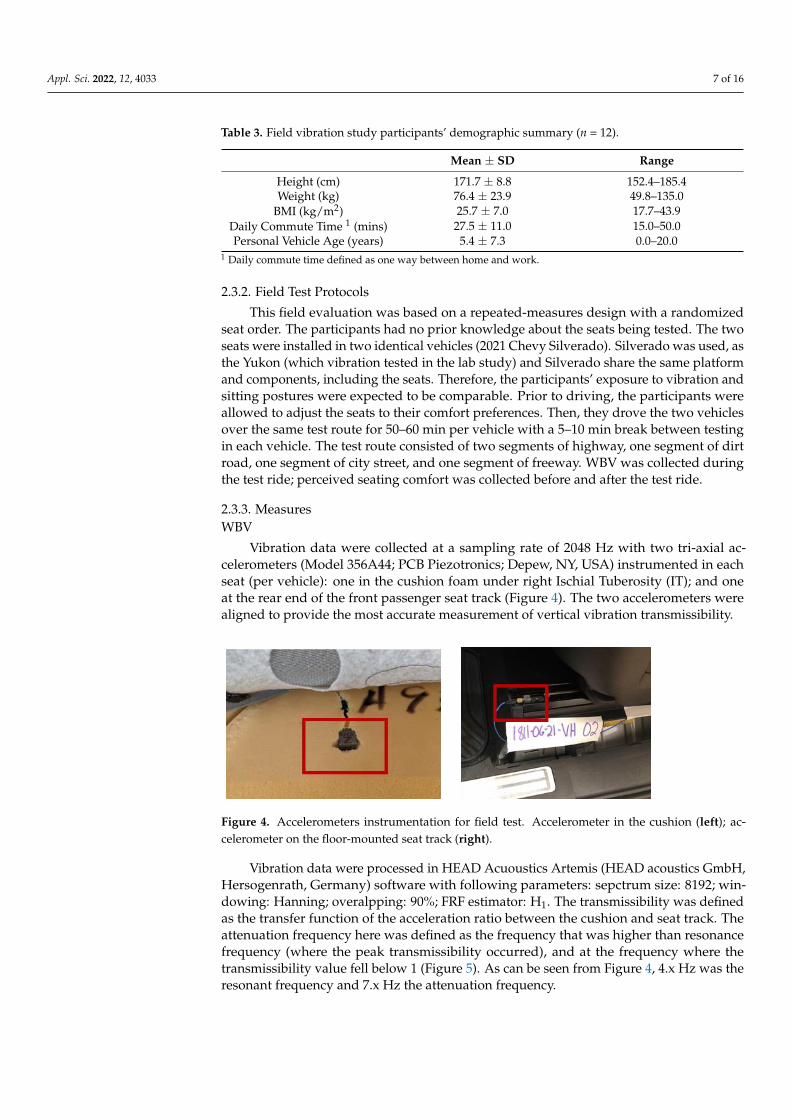
Vibration data were collected at a sampling rate of 2048 Hz with two tri-axial ac-celerometers (Model 356A44; PCB Piezotronics; Depew, NY, USA) instrumented in eachseat (per vehicle): one in the cushion foam under right Ischial Tuberosity (IT); and oneat the rear end of the front passenger seat track (Figure 4). The two accelerometers werealigned to provide the most accurate measurement of vertical vibration transmissibility.
Appl. Sci. 2022, 12, x FOR PEER REVIEW 7 of 16
2.3.1. Participants
Twelve adult participants (8 males, 4 females) were recruited from a company cam-
pus (demographics shown in Table 3). The eligibility criteria included: being able to sit in
the moving vehicle for two hours without any body pain; over 18 years old; and not being
pregnant. The participants provided their ages as age groups (7 in 20 s, 1 in 30 s, 2 in 40 s,
1 in 50 s, and 1 in 60 s). The participants provided verbal consents and the study followed
company’s guidelines for on-road ride and drive testing with the ISO accredited lab per-
sonnels stationed in the vehicle.
Table 3. Field vibration study participants’ demographic summary (n = 12).
Mean ± SD Range
Height (cm) 171.7 ± 8.8 152.4–185.4
Weight (kg) 76.4 ± 23.9 49.8–135.0
BMI (kg/m2) 25.7 ± 7.0 17.7–43.9
Daily Commute Time 1 (mins) 27.5 ± 11.0 15.0–50.0
Personal Vehicle Age (years) 5.4 ± 7.3 0.0–20.0 1 Daily commute time defined as one way between home and work.
2.3.2. Field Test Protocols
This field evaluation was based on a repeated-measures design with a randomized
seat order. The participants had no prior knowledge about the seats being tested. The two
seats were installed in two identical vehicles (2021 Chevy Silverado). Silverado was used,
as the Yukon (which vibration tested in the lab study) and Silverado share the same plat-
form and components, including the seats. Therefore, the participants’ exposure to vibra-
tion and sitting postures were expected to be comparable. Prior to driving, the participants
were allowed to adjust the seats to their comfort preferences. Then, they drove the two
vehicles over the same test route for 50–60 min per vehicle with a 5–10 min break between
testing in each vehicle. The test route consisted of two segments of highway, one segment
of dirt road, one segment of city street, and one segment of freeway. WBV was collected
during the test ride; perceived seating comfort was collected before and after the test ride.
2.3.3. Measures
WBV
Vibration data were collected at a sampling rate of 2048 Hz with two tri-axial accel-
erometers (Model 356A44; PCB Piezotronics; Depew, NY, USA) instrumented in each seat
(per vehicle): one in the cushion foam under right Ischial Tuberosity (IT); and one at the
rear end of the front passenger seat track (Figure 4). The two accelerometers were aligned
to provide the most accurate measurement of vertical vibration transmissibility.
Figure 4. Accelerometers instrumentation for field test. Accelerometer in the cushion (left); accel-
erometer on the floor-mounted seat track (right).
Vibration data were processed in HEAD Acuoustics Artemis (HEAD acoustics
GmbH, Hersogenrath, Germany) software with following parameters: sepctrum size:
Figure 4. Accelerometers instrumentation for field test. Accelerometer in the cushion (left); ac-celerometer on the floor-mounted seat track (right).
Vibration data were processed in HEAD Acuoustics Artemis (HEAD acoustics GmbH,Hersogenrath, Germany) software with following parameters: sepctrum size: 8192; win-dowing: Hanning; overalpping: 90%; FRF estimator: H1. The transmissibility was definedas the transfer function of the acceleration ratio between the cushion and seat track. Theattenuation frequency here was defined as the frequency that was higher than resonancefrequency (where the peak transmissibility occurred), and at the frequency where thetransmissibility value fell below 1 (Figure 5). As can be seen from Figure 4, 4.x Hz was theresonant frequency and 7.x Hz the attenuation frequency.

Appl. Sci. 2022, 12, 4033 8 of 16
The weighted average vibration (Aw) values were calculated per ISO 2631-1. Seat Ef-fective Amplitude Transmissibility (SEAT) values [35] were then calculated as the vibrationratio for Aw between the cushion and seat track (i.e., truck floor) in order to compare thevibration performance between the two seats.
Appl. Sci. 2022, 12, x FOR PEER REVIEW 8 of 16
8192; windowing: Hanning; overalpping: 90%; FRF estimator: H1. The transmissibility was
defined as the transfer function of the acceleration ratio between the cushion and seat
track. The attenuation frequency here was defined as the frequency that was higher than
resonance frequency (where the peak transmissibility occurred), and at the frequency
where the transmissibility value fell below 1 (Figure 5). As can be seen from Figure 4, 4.x
Hz was the resonant frequency and 7.x Hz the attenuation frequency.
Figure 5. Example of vibration transmissibility plot and the definition of resonance frequency and
attenuation frequency in this study.
The weighted average vibration (Aw) values were calculated per ISO 2631-1. Seat Ef-
fective Amplitude Transmissibility (SEAT) values [35] were then calculated as the vibra-
tion ratio for Aw between the cushion and seat track (i.e., truck floor) in order to compare
the vibration performance between the two seats.
Self-Reported Seating Comfort
Before and after each ride, self-reported seating comfort was evaluated using a cus-
tom-designed comfort questionnaire [26]. The participants were asked to rate the seat
firmness and support on a 5-point scale (i.e., too little support being −2, and too much
support being 2, with ideal being 0) and the overall comfort of the complete seat on a 10
point scale (with 1 being very uncomfortable and 10 being very comfortable). The partic-
ipants were also asked about their perception of the vibration for each of the 5 road seg-
ments at 7 different body regions (Feet/Lower legs, Thigh, Buttocks/Hips, Lower back,
Middle Back, Upeer back/Shoulder, and Neck/Head). The participant’s perception for vi-
bration on the 7 body regions was recorded as Y/N. If they felt the vibration on one body
region, it was counted as one vibration felt on that body region.
2.3.4. Statistical Analyses
Paired t-tests (Minitab 18, Minitab LLC, PA, USA) were used to determine whether
there were any differences in peak transmissibility, resonance frequency, attenuation fre-
quency, SEAT, and self-reported seating comfort ratings as well as vibration perceptions
between the two seats. Statistical significance was determined when p < 0.05.
3. Results
3.1. Laboratory Vibration Exposures
3.1.1. Simulation of Field-Measured Vibration Exposures
As no differences in WBV among the three seats were observed for the field-meas-
ured sedan and SUV profiles, the WBV data from the sedan and SUV were combined for
Figure 5. Example of vibration transmissibility plot and the definition of resonance frequency andattenuation frequency in this study.
Self-Reported Seating Comfort
Before and after each ride, self-reported seating comfort was evaluated using a custom-designed comfort questionnaire [26]. The participants were asked to rate the seat firmnessand support on a 5-point scale (i.e., too little support being −2, and too much support being2, with ideal being 0) and the overall comfort of the complete seat on a 10 point scale (with1 being very uncomfortable and 10 being very comfortable). The participants were alsoasked about their perception of the vibration for each of the 5 road segments at 7 differentbody regions (Feet/Lower legs, Thigh, Buttocks/Hips, Lower back, Middle Back, Upeerback/Shoulder, and Neck/Head). The participant’s perception for vibration on the 7 bodyregions was recorded as Y/N. If they felt the vibration on one body region, it was countedas one vibration felt on that body region.
2.3.4. Statistical Analyses
Paired t-tests (Minitab 18, Minitab LLC, PA, USA) were used to determine whetherthere were any differences in peak transmissibility, resonance frequency, attenuation fre-quency, SEAT, and self-reported seating comfort ratings as well as vibration perceptionsbetween the two seats. Statistical significance was determined when p < 0.05.
3. Results3.1. Laboratory Vibration Exposures3.1.1. Simulation of Field-Measured Vibration Exposures
As no differences in WBV among the three seats were observed for the field-measuredsedan and SUV profiles, the WBV data from the sedan and SUV were combined for the dataanalysis. The A(8) values showed that WBV exposures were predominant in the verticaldirection (Z-axis). The A(8) values on the speedbumps, speedhumps, and cobblestonesegments were higher than the EU daily vibration action limit (0.5 m/s2) [34,36] as shown in
Appl. Sci. 2022, 12, 4033 9 of 16
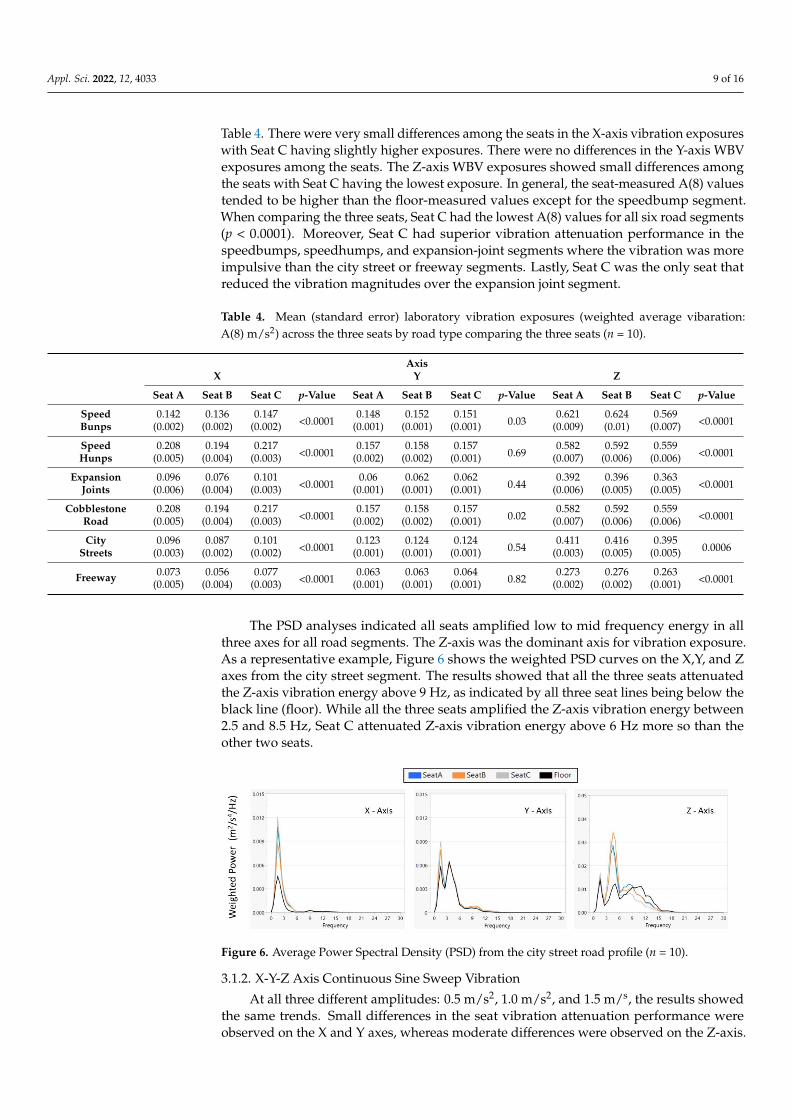
Table 4. There were very small differences among the seats in the X-axis vibration exposureswith Seat C having slightly higher exposures. There were no differences in the Y-axis WBVexposures among the seats. The Z-axis WBV exposures showed small differences amongthe seats with Seat C having the lowest exposure. In general, the seat-measured A(8) valuestended to be higher than the floor-measured values except for the speedbump segment.When comparing the three seats, Seat C had the lowest A(8) values for all six road segments(p < 0.0001). Moreover, Seat C had superior vibration attenuation performance in thespeedbumps, speedhumps, and expansion-joint segments where the vibration was moreimpulsive than the city street or freeway segments. Lastly, Seat C was the only seat thatreduced the vibration magnitudes over the expansion joint segment.
Table 4. Mean (standard error) laboratory vibration exposures (weighted average vibaration:A(8) m/s2) across the three seats by road type comparing the three seats (n = 10).
AxisX Y Z
Seat A Seat B Seat C p-Value Seat A Seat B Seat C p-Value Seat A Seat B Seat C p-Value
Speed 0.142 0.136 0.147<0.0001
0.148 0.152 0.1510.03
0.621 0.624 0.569<0.0001Bunps (0.002) (0.002) (0.002) (0.001) (0.001) (0.001) (0.009) (0.01) (0.007)
Speed 0.208 0.194 0.217<0.0001
0.157 0.158 0.1570.69
0.582 0.592 0.559<0.0001Hunps (0.005) (0.004) (0.003) (0.002) (0.002) (0.001) (0.007) (0.006) (0.006)
Expansion 0.096 0.076 0.101<0.0001
0.06 0.062 0.0620.44
0.392 0.396 0.363<0.0001Joints (0.006) (0.004) (0.003) (0.001) (0.001) (0.001) (0.006) (0.005) (0.005)
Cobblestone 0.208 0.194 0.217<0.0001
0.157 0.158 0.1570.02
0.582 0.592 0.559<0.0001Road (0.005) (0.004) (0.003) (0.002) (0.002) (0.001) (0.007) (0.006) (0.006)
City 0.096 0.087 0.101<0.0001
0.123 0.124 0.1240.54
0.411 0.416 0.3950.0006Streets (0.003) (0.002) (0.002) (0.001) (0.001) (0.001) (0.003) (0.005) (0.005)
Freeway 0.073 0.056 0.077<0.0001
0.063 0.063 0.0640.82
0.273 0.276 0.263<0.0001(0.005) (0.004) (0.003) (0.001) (0.001) (0.001) (0.002) (0.002) (0.001)
The PSD analyses indicated all seats amplified low to mid frequency energy in allthree axes for all road segments. The Z-axis was the dominant axis for vibration exposure.As a representative example, Figure 6 shows the weighted PSD curves on the X,Y, and Zaxes from the city street segment. The results showed that all the three seats attenuatedthe Z-axis vibration energy above 9 Hz, as indicated by all three seat lines being below theblack line (floor). While all the three seats amplified the Z-axis vibration energy between2.5 and 8.5 Hz, Seat C attenuated Z-axis vibration energy above 6 Hz more so than theother two seats.
Appl. Sci. 2022, 12, x FOR PEER REVIEW 9 of 16
the data analysis. The A(8) values showed that WBV exposures were predominant in the
vertical direction (Z-axis). The A(8) values on the speedbumps, speedhumps, and cobble-
stone segments were higher than the EU daily vibration action limit (0.5 m/s2) [34,36] as
shown in Table 4. There were very small differences among the seats in the X-axis vibra-
tion exposures with Seat C having slightly higher exposures. There were no differences in
the Y-axis WBV exposures among the seats. The Z-axis WBV exposures showed small
differences among the seats with Seat C having the lowest exposure. In general, the seat-
measured A(8) values tended to be higher than the floor-measured values except for the
speedbump segment. When comparing the three seats, Seat C had the lowest A(8) values
for all six road segments (p < 0.0001). Moreover, Seat C had superior vibration attenuation
performance in the speedbumps, speedhumps, and expansion-joint segments where the
vibration was more impulsive than the city street or freeway segments. Lastly, Seat C was
the only seat that reduced the vibration magnitudes over the expansion joint segment.
Table 4. Mean (standard error) laboratory vibration exposures (weighted average vibaration: A(8)
m/s2) across the three seats by road type comparing the three seats (n = 10) .
Axis
X
Y
Z
Seat A Seat B Seat C p-value
Seat A Seat B Seat C p-value
Seat A Seat B Seat C p-value
Speed 0.142 0.136 0.147 <0.0001
0.148 0.152 0.151
0.03
0.621 0.624 0.569
<0.0001 Bunps (0.002) (0.002) (0.002)
(0.001) (0.001) (0.001)
(0.009) (0.01) (0.007)
Speed 0.208 0.194 0.217 <0.0001
0.157 0.158 0.157
0.69
0.582 0.592 0.559
<0.0001 Hunps (0.005) (0.004) (0.003)
(0.002) (0.002) (0.001)
(0.007) (0.006) (0.006)
Expansion 0.096 0.076 0.101 <0.0001
0.06 0.062 0.062
0.44
0.392 0.396 0.363
<0.0001 Joints (0.006) (0.004) (0.003)
(0.001) (0.001) (0.001)
(0.006) (0.005) (0.005)
Cobblestone 0.208 0.194 0.217 <0.0001
0.157 0.158 0.157
0.02
0.582 0.592 0.559
<0.0001 Road (0.005) (0.004) (0.003)
(0.002) (0.002) (0.001)
(0.007) (0.006) (0.006)
City 0.096 0.087 0.101 <0.0001
0.123 0.124 0.124
0.54
0.411 0.416 0.395
0.0006 Streets (0.003) (0.002) (0.002)
(0.001) (0.001) (0.001)
(0.003) (0.005) (0.005)
Freeway 0.073 0.056 0.077
<0.0001
0.063 0.063 0.064
0.82
0.273 0.276 0.263
<0.0001 (0.005) (0.004) (0.003)
(0.001) (0.001) (0.001)
(0.002) (0.002) (0.001)
The PSD analyses indicated all seats amplified low to mid frequency energy in all
three axes for all road segments. The Z-axis was the dominant axis for vibration exposure.
As a representative example, Figure 6 shows the weighted PSD curves on the X,Y, and Z
axes from the city street segment. The results showed that all the three seats attenuated
the Z-axis vibration energy above 9 Hz, as indicated by all three seat lines being below the
black line (floor). While all the three seats amplified the Z-axis vibration energy between
2.5 and 8.5 Hz, Seat C attenuated Z-axis vibration energy above 6 Hz more so than the
other two seats.
Figure 6. Average Power Spectral Density (PSD) from the city street road profile (n = 10). Figure 6. Average Power Spectral Density (PSD) from the city street road profile (n = 10).
3.1.2. X-Y-Z Axis Continuous Sine Sweep Vibration
At all three different amplitudes: 0.5 m/s2, 1.0 m/s2, and 1.5 m/s, the results showedthe same trends. Small differences in the seat vibration attenuation performance wereobserved on the X and Y axes, whereas moderate differences were observed on the Z-axis.

Appl. Sci. 2022, 12, 4033 10 of 16
As shown in the Z-axis sine sweeps in Figure 7, Seat C had the lowest resonance frequency(3.2 Hz) and amplified the input by 2.1-fold at the resonance frequency. Seat A and Seat Bhad a resonant frequency of 3.5 Hz and amplified the vibration by 1.8- and 1.7- fold at theresonant frequency, respectively. Seat C also attenuated the vibration at lower frequencies(down to 6 Hz) compared to Seat A and Seat B only attenuating the vibration down to 8 Hz.The transmissibility results from this laboratory study mirrored the SAE J2896 vibrationtransmissibility results which were collected without humans sitting on the foam (Figure 2).
In addition, as shown in Figure 8, all seats amplified the low frequency X-axisvibration(1–3 Hz) and attenuated the intermediate frequency vibration (3–15 Hz). Forthe Y-axis vibration, all seats amplified the vibration over the whole frequency range withSeat B amplifying the Y-axis vibration more than Seats A and Seat C.
Appl. Sci. 2022, 12, x FOR PEER REVIEW 10 of 16
3.1.2. X-Y-Z Axis Continuous Sine Sweep Vibration
At all three different amplitudes: 0.5 m/s2, 1.0 m/s2, and 1.5 m/s, the results showed
the same trends. Small differences in the seat vibration attenuation performance were ob-
served on the X and Y axes, whereas moderate differences were observed on the Z-axis.
As shown in the Z-axis sine sweeps in Figure 7, Seat C had the lowest resonance frequency
(3.2 Hz) and amplified the input by 2.1-fold at the resonance frequency. Seat A and Seat B
had a resonant frequency of 3.5 Hz and amplified the vibration by 1.8- and 1.7- fold at the
resonant frequency, respectively. Seat C also attenuated the vibration at lower frequencies
(down to 6 Hz) compared to Seat A and Seat B only attenuating the vibration down to 8
Hz. The transmissibility results from this laboratory study mirrored the SAE J2896 vibra-
tion transmissibility results which were collected without humans sitting on the foam
(Figure 2).
Figure 7. Representative Z-axis 1.5 m/s2 sine sweep from one subject. Red dashed lines indicate res-
onant frequencies; green lines indicate frequencies from which the floor-measured vibration is at-
tenuated.
In addition, as shown in Figure 8, all seats amplified the low frequency X-axis vibra-
tion(1–3 Hz) and attenuated the intermediate frequency vibration (3–15 Hz). For the Y-
axis vibration, all seats amplified the vibration over the whole frequency range with Seat
B amplifying the Y-axis vibration more than Seats A and Seat C.
3
2
1
0
-1
-2
-3
3
2
1
0
-1
-2
-3
3
2
1
0
-1
-2
-3
m/s
2m
/s2
m/s
2
1 2 3 4 5 6 7 8 9 10 11 12 13 14 15 16 17 18
Attenuation above ~8 Hz
Attenuation above ~9 Hz
Attenuation above ~6.5 Hz
Resonance
Resonance
Resonance
Seat
Floor
Seat A
Seat B
Seat C
Frequency (Hz)
Figure 7. Representative Z-axis 1.5 m/s2 sine sweep from one subject. Red dashed lines indicate resonantfrequencies; green lines indicate frequencies from which the floor-measured vibration is attenuated.
Appl. Sci. 2022, 12, x FOR PEER REVIEW 11 of 16
Figure 8. Unweighted power spectral densities for the x-, y- and z-axes (top) and Transmissibility
(bottom) (n = 10).
3.1.3. Subjective Vibration Comfort
The first impression ranking data showed that Seat C was rated the highest (p = 0.015)
when compared to Seat A and Seat B. The post ranking data showed that Seat C was still
ranked the highest; however, the differences were no longer significant (p = 0.65).
Perceived body discomfort data showed that exposure to either field-measured or
sinusoidal vibration did not affect the perceived body discomfort measures (most discom-
fort < 10 in 0–100 scale) as shown in Table 5. Despite the limited changes, the perceived
body discomfort was consistently lower with seat C in most body parts for both the field-
measured vibration and the sinusoidal vibration exposures (Table 5).
Table 5. Mean (Standard error) perceived discomfort in eight body parts when exposed to the 15-
min tri-axial field vibration and sinusoidal vibration (10 min per each of X, Y, Z axes) (n = 10).
Body
Parts Seat
Tri-Axial Field Vibration Sinusoidal Vibration
0 min 7 min 15 min X Y Z
Pre Post Pre Post Pre Post
An-
kles我/Fe
et
A 3.9 (2.4) 2.7 (1.5) 5.2 (6.3) 5.2 (3.5) 2.4 (1.1) 2.6 (1.1) 2.5 (1.1) 1.9 (1.1) 1.8 (0.7)
B 2.8 (1.5) 1.2 (0.7) 2.4 (2.3) 1.1 (0.4) 1.1 (0.4) 1.1 (0.4) 1.2 (0.4) 1.8 (0.5) 1.3 (0.5)
C 0.7 (0.4) 0.8 (0.4) 0.9 (1.1) 3.2 (1.8) 2.2 (1.1) 2.4 (1.1) 2.2 (1.1) 0.8 (0.4) 3.4 1.6)
Knees
A 3.9 (1.8) 5.1 (3.1) 8.8 (6.3) 9.7 (7.0) 6.2 (3.5) 6.4 (3.6) 10.2 (5.2) 6.9 (4.8) 6.6 (3.5)
B 6.1 (2.0) 6.5 (1.9) 7.0 (2.3) 6.4 (2.4) 5.9 (2.1) 5.4 (2.2) 7.1 (3.1) 6.4 (2.8) 6.8 (2.8)
C 3.1 (0.9) 1.9 (0.6) 3.3 (1.1) 3.9 (1.6) 4.6 (1.8) 5.3 (2.2) 6.4 (3.2) 3.7 (1.2) 5.7 (2.1)
Thighs
A 3.1 (1.3) 2.6 (1.3) 3.1 (1.1) 3.2 (1.5) 5.9 (3.2) 5.9 (3.3) 4.6 (2.0) 3.1 (1.1) 3.3 (1.3)
B 1.5 (0.9) 3.1 (1.4) 2.6 (0.9) 1.3 (0.4) 2.8 (1.6) 3.1 (1.7) 1.4 (0.5) 2.0 (0.5) 1.9 (0.8)
C 1.0 (0.5) 1.2 (0.5) 1.2 (0.6) 1.7 (0.7) 2.3 (1.1) 3.0 (1.4) 2.6 (1.2) 1.2 (0.6) 2.4 (1.2)
Tailbones
A 1.2 (0.5) 2.4 (0.6) 3.3 (1.1) 7.2 (4.2) 7.3 (4.1) 5.7 (2.7) 8.9 (4.5) 3.4 (1.1) 5.7 (2.7)
B 2.9 (2.0) 1.7 (0.6) 2.7 (0.9) 1.6 (0.6) 2.5 (0.6) 2.9 (0.6) 3.8 (1.6) 2.0 (0.7) 2.4 (0.6)
C 1.3 (0.6) 1.8 (0.7) 1.4 (0.5) 2.7 (1.0) 3.4 (1.0) 2.7 (0.9) 7.1 (2.9) 3.8 (1.8) 5.0 (2.1)
Lower
Back
A 1.1 (0.4) 3.0 (1.3) 4.2 (1.6) 3.6 (1.5) 4.3 (1.8) 3.7 (1.5) 4.7 (1.6) 4.9 (1.7) 4.2 (1.3)
B 0.9 (0.5) 1.7 (0.7) 2.5 (1.0) 2.3 (1.1) 2.7 (0.6) 2.9 (0.8) 2.0 (0.7) 2.3 (0.7) 4.2 (1.1)
C 2.1 (0.9) 2.5 (0.9) 2.3 (0.9) 2.5 (1.1) 2.6 (1.0) 2.9 (1.0) 5.1 (2.1) 4.8 (2.1) 5.2 (2.1)
Upper
Back
A 4.7 (2.9) 2.9 (0.9) 6.6 (3.1) 7.9 (3.3) 6.7 (1.6) 5.8 (2.2) 6.1 (1.4) 5.3 (1.1) 5.9 (1.5)
B 5.4 (2.4) 4.4 (1.7) 4.7 (1.6) 3.8 (1.7) 5.2 (2.3) 4.7 (2.4) 5.2 (2.3) 6.3 (2.2) 6.3 (2.7)
C 2.9 (1.1) 3.4 (0.9) 3.1 (0.9) 4.3 (1.4) 4.7 (1.2) 4.3 (1.4) 4.7 (1.6) 3.3 (1.0) 5.3 (1.6)
Shoulders
A 2.2 (0.8) 4.2 (1.6) 5.9 (2.9) 6.7 (3.1) 5.7 (2.1) 5.4 (2.4) 8.9 (3.4) 6.9 (3.5) 5.7 (2.1)
B 5.8 (3.2) 5.6 (2.2) 5.0 (2.2) 5.2 (2.3) 5.4 (2.5) 4.4 (2.6) 5.8 (2.9) 6.4 (2.8) 6.4 (2.8)
C 1.8 (0.8) 1.8 (0.6) 3.0 (1.0) 4.1 (2.1) 5.1 (2.1) 5.2 (2.2) 6.1 (3.2) 2.8 (1.1) 4.9 (2.2)
Figure 8. Unweighted power spectral densities for the x-, y- and z-axes (top) and Transmissibility(bottom) (n = 10).

Appl. Sci. 2022, 12, 4033 11 of 16
3.1.3. Subjective Vibration Comfort
The first impression ranking data showed that Seat C was rated the highest (p = 0.015)when compared to Seat A and Seat B. The post ranking data showed that Seat C was stillranked the highest; however, the differences were no longer significant (p = 0.65).
Perceived body discomfort data showed that exposure to either field-measured or sinu-soidal vibration did not affect the perceived body discomfort measures (most discomfort < 10in 0–100 scale) as shown in Table 5. Despite the limited changes, the perceived body dis-comfort was consistently lower with seat C in most body parts for both the field-measuredvibration and the sinusoidal vibration exposures (Table 5).
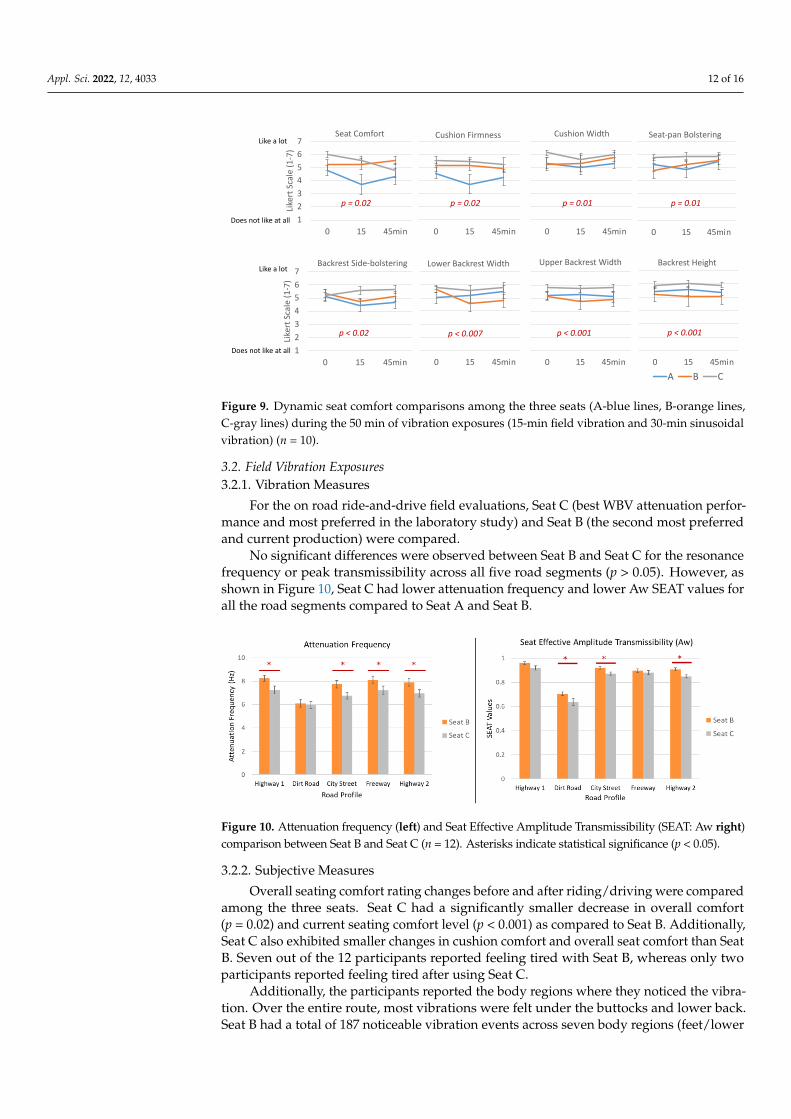
The dynamic seating comfort rating data showed that all the three seats were ratedas relatively comfortable (ratings > 4 in the 1–7 scale) as shown in Figure 9. Seat C wasconsistently and significantly rated higher for the eight criteria compared to Seat A andSeat B (Figure 9).
Table 5. Mean (Standard error) perceived discomfort in eight body parts when exposed to the 15-mintri-axial field vibration and sinusoidal vibration (10 min per each of X, Y, Z axes) (n = 10).
Body Parts Seat
Tri-Axial Field Vibration Sinusoidal Vibration
0 min 7 min 15 minX Y Z
Pre Post Pre Post Pre Post
Ankles/Feet
A 3.9 (2.4) 2.7 (1.5) 5.2 (6.3) 5.2 (3.5) 2.4 (1.1) 2.6 (1.1) 2.5 (1.1) 1.9 (1.1) 1.8 (0.7)B 2.8 (1.5) 1.2 (0.7) 2.4 (2.3) 1.1 (0.4) 1.1 (0.4) 1.1 (0.4) 1.2 (0.4) 1.8 (0.5) 1.3 (0.5)C 0.7 (0.4) 0.8 (0.4) 0.9 (1.1) 3.2 (1.8) 2.2 (1.1) 2.4 (1.1) 2.2 (1.1) 0.8 (0.4) 3.4 1.6)
KneesA 3.9 (1.8) 5.1 (3.1) 8.8 (6.3) 9.7 (7.0) 6.2 (3.5) 6.4 (3.6) 10.2 (5.2) 6.9 (4.8) 6.6 (3.5)B 6.1 (2.0) 6.5 (1.9) 7.0 (2.3) 6.4 (2.4) 5.9 (2.1) 5.4 (2.2) 7.1 (3.1) 6.4 (2.8) 6.8 (2.8)C 3.1 (0.9) 1.9 (0.6) 3.3 (1.1) 3.9 (1.6) 4.6 (1.8) 5.3 (2.2) 6.4 (3.2) 3.7 (1.2) 5.7 (2.1)
ThighsA 3.1 (1.3) 2.6 (1.3) 3.1 (1.1) 3.2 (1.5) 5.9 (3.2) 5.9 (3.3) 4.6 (2.0) 3.1 (1.1) 3.3 (1.3)B 1.5 (0.9) 3.1 (1.4) 2.6 (0.9) 1.3 (0.4) 2.8 (1.6) 3.1 (1.7) 1.4 (0.5) 2.0 (0.5) 1.9 (0.8)C 1.0 (0.5) 1.2 (0.5) 1.2 (0.6) 1.7 (0.7) 2.3 (1.1) 3.0 (1.4) 2.6 (1.2) 1.2 (0.6) 2.4 (1.2)
TailbonesA 1.2 (0.5) 2.4 (0.6) 3.3 (1.1) 7.2 (4.2) 7.3 (4.1) 5.7 (2.7) 8.9 (4.5) 3.4 (1.1) 5.7 (2.7)B 2.9 (2.0) 1.7 (0.6) 2.7 (0.9) 1.6 (0.6) 2.5 (0.6) 2.9 (0.6) 3.8 (1.6) 2.0 (0.7) 2.4 (0.6)C 1.3 (0.6) 1.8 (0.7) 1.4 (0.5) 2.7 (1.0) 3.4 (1.0) 2.7 (0.9) 7.1 (2.9) 3.8 (1.8) 5.0 (2.1)
Lower BackA 1.1 (0.4) 3.0 (1.3) 4.2 (1.6) 3.6 (1.5) 4.3 (1.8) 3.7 (1.5) 4.7 (1.6) 4.9 (1.7) 4.2 (1.3)B 0.9 (0.5) 1.7 (0.7) 2.5 (1.0) 2.3 (1.1) 2.7 (0.6) 2.9 (0.8) 2.0 (0.7) 2.3 (0.7) 4.2 (1.1)C 2.1 (0.9) 2.5 (0.9) 2.3 (0.9) 2.5 (1.1) 2.6 (1.0) 2.9 (1.0) 5.1 (2.1) 4.8 (2.1) 5.2 (2.1)
Upper BackA 4.7 (2.9) 2.9 (0.9) 6.6 (3.1) 7.9 (3.3) 6.7 (1.6) 5.8 (2.2) 6.1 (1.4) 5.3 (1.1) 5.9 (1.5)B 5.4 (2.4) 4.4 (1.7) 4.7 (1.6) 3.8 (1.7) 5.2 (2.3) 4.7 (2.4) 5.2 (2.3) 6.3 (2.2) 6.3 (2.7)C 2.9 (1.1) 3.4 (0.9) 3.1 (0.9) 4.3 (1.4) 4.7 (1.2) 4.3 (1.4) 4.7 (1.6) 3.3 (1.0) 5.3 (1.6)
ShouldersA 2.2 (0.8) 4.2 (1.6) 5.9 (2.9) 6.7 (3.1) 5.7 (2.1) 5.4 (2.4) 8.9 (3.4) 6.9 (3.5) 5.7 (2.1)B 5.8 (3.2) 5.6 (2.2) 5.0 (2.2) 5.2 (2.3) 5.4 (2.5) 4.4 (2.6) 5.8 (2.9) 6.4 (2.8) 6.4 (2.8)C 1.8 (0.8) 1.8 (0.6) 3.0 (1.0) 4.1 (2.1) 5.1 (2.1) 5.2 (2.2) 6.1 (3.2) 2.8 (1.1) 4.9 (2.2)
NeckA 6.9 (4.8) 7.9 (5.3) 9.7 (6.2) 10.4 (6.9) 7.6 (3.9) 7.5 (3.9) 10.5 (4.7) 8.7 (4.8) 7.5 (3.6)B 7.8 (4.4) 6.7 (2.6) 6.1 (2.4) 5.8 (2.7) 9.4 (3.3) 7.3 (2.7) 7.3 (2.8) 8.6 (3.5) 7.5 (3.3)C 4.2 (1.7) 3.7 (1.4) 4.4 (1.7) 5.4 (2.2) 5.2 (1.6) 6.0 (1.8) 6.5 (1.8) 4.3 (1.3) 5.1 (1.5)
Appl. Sci. 2022, 12, 4033 12 of 16
Appl. Sci. 2022, 12, x FOR PEER REVIEW 12 of 16
Neck
A 6.9 (4.8) 7.9 (5.3) 9.7 (6.2) 10.4 (6.9) 7.6 (3.9) 7.5 (3.9) 10.5 (4.7) 8.7 (4.8) 7.5 (3.6)
B 7.8 (4.4) 6.7 (2.6) 6.1 (2.4) 5.8 (2.7) 9.4 (3.3) 7.3 (2.7) 7.3 (2.8) 8.6 (3.5) 7.5 (3.3)
C 4.2 (1.7) 3.7 (1.4) 4.4 (1.7) 5.4 (2.2) 5.2 (1.6) 6.0 (1.8) 6.5 (1.8) 4.3 (1.3) 5.1 (1.5)
The dynamic seating comfort rating data showed that all the three seats were rated
as relatively comfortable (ratings > 4 in the 1–7 scale) as shown in Figure 9. Seat C was
consistently and significantly rated higher for the eight criteria compared to Seat A and
Seat B (Figure 9).
Figure 9. Dynamic seat comfort comparisons among the three seats (A-blue lines, B-orange lines, C-
gray lines) during the 50 min of vibration exposures (15-min field vibration and 30-min sinusoidal
vibration) (n = 10).
3.2. Field Vibration Exposures
3.2.1. Vibration Measures
For the on road ride-and-drive field evaluations, Seat C (best WBV attenuation per-
formance and most preferred in the laboratory study) and Seat B (the second most pre-
ferred and current production) were compared.
No significant differences were observed between Seat B and Seat C for the resonance
frequency or peak transmissibility across all five road segments (p > 0.05). However, as
shown in Figure 10, Seat C had lower attenuation frequency and lower Aw SEAT values
for all the road segments compared to Seat A and Seat B.
Figure 10. Attenuation frequency (left) and Seat Effective Amplitude Transmissibility (SEAT: Aw
right) comparison between Seat B and Seat C (n = 12). Asterisks indicate statistical significance (p <
0.05).
1
2
3
4
5
6
7
0 15 45min
Like
rt S
cale
(1
-7)
Backrest Side-bolstering
0 15 45min
Seat-pan Bolstering
0 15 45min
Cushion Width
0 15 45min
Cushion Firmness
1
2
3
4
5
6
7
0 15 45min
Like
rt S
cale
(1
-7)
Seat ComfortLike a lot
Does not like at all
p = 0.02 p = 0.01p = 0.01p = 0.02
Like a lot
Does not like at all
p < 0.02 p < 0.007 p < 0.001 p < 0.001
0 15 45min
Lower Backrest Width
0 15 45min
Upper Backrest Width
0 15 45min
Backrest Height
A B C
Figure 9. Dynamic seat comfort comparisons among the three seats (A-blue lines, B-orange lines,C-gray lines) during the 50 min of vibration exposures (15-min field vibration and 30-min sinusoidalvibration) (n = 10).
3.2. Field Vibration Exposures3.2.1. Vibration Measures
For the on road ride-and-drive field evaluations, Seat C (best WBV attenuation perfor-mance and most preferred in the laboratory study) and Seat B (the second most preferredand current production) were compared.
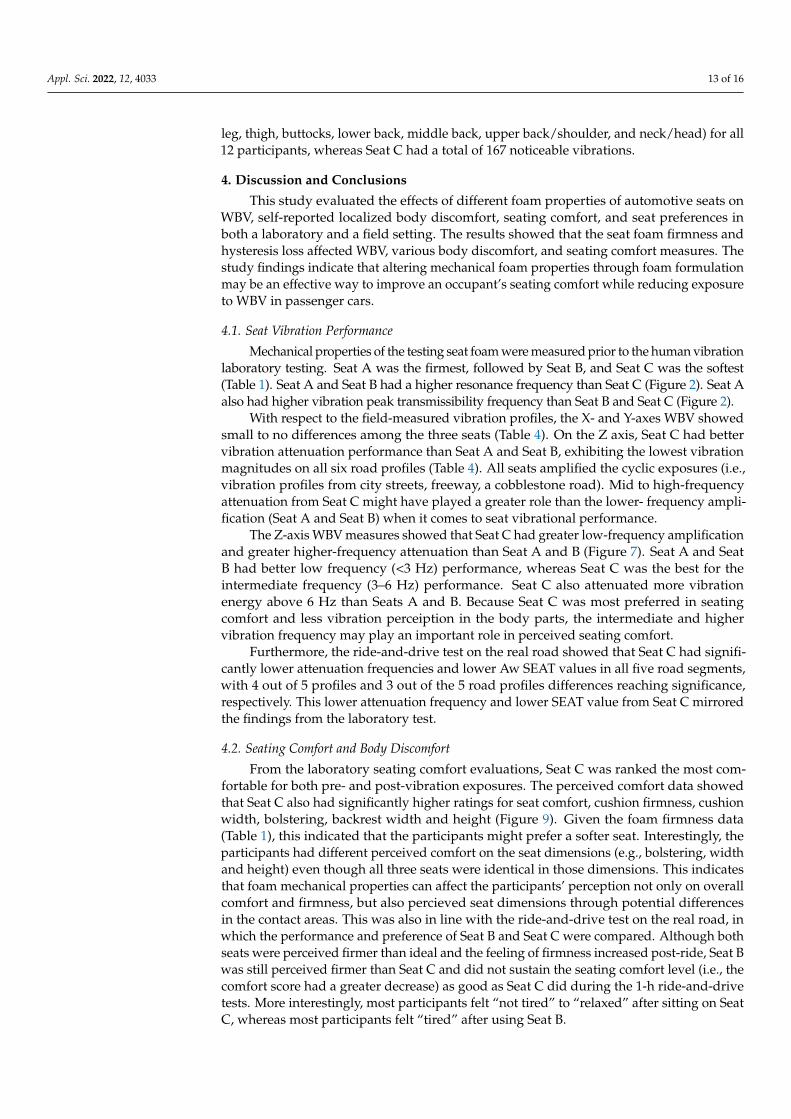
No significant differences were observed between Seat B and Seat C for the resonancefrequency or peak transmissibility across all five road segments (p > 0.05). However, asshown in Figure 10, Seat C had lower attenuation frequency and lower Aw SEAT values forall the road segments compared to Seat A and Seat B.
Appl. Sci. 2022, 12, x FOR PEER REVIEW 12 of 16
Neck
A 6.9 (4.8) 7.9 (5.3) 9.7 (6.2) 10.4 (6.9) 7.6 (3.9) 7.5 (3.9) 10.5 (4.7) 8.7 (4.8) 7.5 (3.6)
B 7.8 (4.4) 6.7 (2.6) 6.1 (2.4) 5.8 (2.7) 9.4 (3.3) 7.3 (2.7) 7.3 (2.8) 8.6 (3.5) 7.5 (3.3)
C 4.2 (1.7) 3.7 (1.4) 4.4 (1.7) 5.4 (2.2) 5.2 (1.6) 6.0 (1.8) 6.5 (1.8) 4.3 (1.3) 5.1 (1.5)
The dynamic seating comfort rating data showed that all the three seats were rated
as relatively comfortable (ratings > 4 in the 1–7 scale) as shown in Figure 9. Seat C was
consistently and significantly rated higher for the eight criteria compared to Seat A and
Seat B (Figure 9).
Figure 9. Dynamic seat comfort comparisons among the three seats (A-blue lines, B-orange lines, C-
gray lines) during the 50 min of vibration exposures (15-min field vibration and 30-min sinusoidal
vibration) (n = 10).
3.2. Field Vibration Exposures
3.2.1. Vibration Measures
For the on road ride-and-drive field evaluations, Seat C (best WBV attenuation per-
formance and most preferred in the laboratory study) and Seat B (the second most pre-
ferred and current production) were compared.
No significant differences were observed between Seat B and Seat C for the resonance
frequency or peak transmissibility across all five road segments (p > 0.05). However, as
shown in Figure 10, Seat C had lower attenuation frequency and lower Aw SEAT values
for all the road segments compared to Seat A and Seat B.
Figure 10. Attenuation frequency (left) and Seat Effective Amplitude Transmissibility (SEAT: Aw
right) comparison between Seat B and Seat C (n = 12). Asterisks indicate statistical significance (p <
0.05).
1
2
3
4
5
6
7
0 15 45min
Like
rt S
cale
(1
-7)
Backrest Side-bolstering
0 15 45min
Seat-pan Bolstering
0 15 45min
Cushion Width
0 15 45min
Cushion Firmness
1
2
3
4
5
6
7
0 15 45min
Like
rt S
cale
(1
-7)
Seat ComfortLike a lot
Does not like at all
p = 0.02 p = 0.01p = 0.01p = 0.02
Like a lot
Does not like at all
p < 0.02 p < 0.007 p < 0.001 p < 0.001
0 15 45min
Lower Backrest Width
0 15 45min
Upper Backrest Width
0 15 45min
Backrest Height
A B C
Figure 10. Attenuation frequency (left) and Seat Effective Amplitude Transmissibility (SEAT: Aw right)comparison between Seat B and Seat C (n = 12). Asterisks indicate statistical significance (p < 0.05).
3.2.2. Subjective Measures
Overall seating comfort rating changes before and after riding/driving were comparedamong the three seats. Seat C had a significantly smaller decrease in overall comfort(p = 0.02) and current seating comfort level (p < 0.001) as compared to Seat B. Additionally,Seat C also exhibited smaller changes in cushion comfort and overall seat comfort than SeatB. Seven out of the 12 participants reported feeling tired with Seat B, whereas only twoparticipants reported feeling tired after using Seat C.
Additionally, the participants reported the body regions where they noticed the vibra-tion. Over the entire route, most vibrations were felt under the buttocks and lower back.Seat B had a total of 187 noticeable vibration events across seven body regions (feet/lower
Appl. Sci. 2022, 12, 4033 13 of 16
leg, thigh, buttocks, lower back, middle back, upper back/shoulder, and neck/head) for all12 participants, whereas Seat C had a total of 167 noticeable vibrations.
4. Discussion and Conclusions
This study evaluated the effects of different foam properties of automotive seats onWBV, self-reported localized body discomfort, seating comfort, and seat preferences inboth a laboratory and a field setting. The results showed that the seat foam firmness andhysteresis loss affected WBV, various body discomfort, and seating comfort measures. Thestudy findings indicate that altering mechanical foam properties through foam formulationmay be an effective way to improve an occupant’s seating comfort while reducing exposureto WBV in passenger cars.
4.1. Seat Vibration Performance
Mechanical properties of the testing seat foam were measured prior to the human vibrationlaboratory testing. Seat A was the firmest, followed by Seat B, and Seat C was the softest(Table 1). Seat A and Seat B had a higher resonance frequency than Seat C (Figure 2). Seat Aalso had higher vibration peak transmissibility frequency than Seat B and Seat C (Figure 2).
With respect to the field-measured vibration profiles, the X- and Y-axes WBV showedsmall to no differences among the three seats (Table 4). On the Z axis, Seat C had bettervibration attenuation performance than Seat A and Seat B, exhibiting the lowest vibrationmagnitudes on all six road profiles (Table 4). All seats amplified the cyclic exposures (i.e.,vibration profiles from city streets, freeway, a cobblestone road). Mid to high-frequencyattenuation from Seat C might have played a greater role than the lower- frequency ampli-fication (Seat A and Seat B) when it comes to seat vibrational performance.
The Z-axis WBV measures showed that Seat C had greater low-frequency amplificationand greater higher-frequency attenuation than Seat A and B (Figure 7). Seat A and SeatB had better low frequency (<3 Hz) performance, whereas Seat C was the best for theintermediate frequency (3–6 Hz) performance. Seat C also attenuated more vibrationenergy above 6 Hz than Seats A and B. Because Seat C was most preferred in seatingcomfort and less vibration perceiption in the body parts, the intermediate and highervibration frequency may play an important role in perceived seating comfort.
Furthermore, the ride-and-drive test on the real road showed that Seat C had signifi-cantly lower attenuation frequencies and lower Aw SEAT values in all five road segments,with 4 out of 5 profiles and 3 out of the 5 road profiles differences reaching significance,respectively. This lower attenuation frequency and lower SEAT value from Seat C mirroredthe findings from the laboratory test.
4.2. Seating Comfort and Body Discomfort
From the laboratory seating comfort evaluations, Seat C was ranked the most com-fortable for both pre- and post-vibration exposures. The perceived comfort data showedthat Seat C also had significantly higher ratings for seat comfort, cushion firmness, cushionwidth, bolstering, backrest width and height (Figure 9). Given the foam firmness data(Table 1), this indicated that the participants might prefer a softer seat. Interestingly, theparticipants had different perceived comfort on the seat dimensions (e.g., bolstering, widthand height) even though all three seats were identical in those dimensions. This indicatesthat foam mechanical properties can affect the participants’ perception not only on overallcomfort and firmness, but also percieved seat dimensions through potential differencesin the contact areas. This was also in line with the ride-and-drive test on the real road, inwhich the performance and preference of Seat B and Seat C were compared. Although bothseats were perceived firmer than ideal and the feeling of firmness increased post-ride, Seat Bwas still perceived firmer than Seat C and did not sustain the seating comfort level (i.e., thecomfort score had a greater decrease) as good as Seat C did during the 1-h ride-and-drivetests. More interestingly, most participants felt “not tired” to “relaxed” after sitting on SeatC, whereas most participants felt “tired” after using Seat B.
Appl. Sci. 2022, 12, 4033 14 of 16
The localized body discomfort measures showed all three seats had relatively lowbody discomfort levels. Seat C consistently showed lower body discomfort ratings on mostof the body regions. The greater body discomfort observed in the tailbone regions from thelaboratory study was likely due to the participants sitting on the seat-pad accelerometers.This presumable discomfort bias was eliminated during the subsequent on-road test wherethe researchers were able to instrument the accelerometers below the surface cover (trim)of the seat but flush with cushion foam pad surface. Nevertheless, from the ride-and-drivetest, Seat C again had a lower number of noticeable vibration reportings when compared toSeat B. The majority of the noticeable vibrations were felt under the buttocks and in thelower back regions for both seats.
4.3. Conclusions, Limitations, and Future Work
This study was the first of its kind to systematically and more holistically evaluatevibrational dynamic seating comfort from the isolated foam testing to complete intact seattesting with both objective and subjective measures [37,38]. The study results showed thatthe seat firmness and hysteresis loss significantly affected WBV exposures and severalkey indicators for seat vibration performance, including resonance frequency, vibrationtransmissibility, and attenuation frequency. Moreover, the foam mechanical properties sig-nificantly affected the participants’ perception not only on overall comfort and firmness, butalso percieved seat dimensions. These results indicate that changing the foam formulationis a potential way to mitigate vibration at certain frequencies in automotive seats.
While this study has many notable strengths, there are a few potential limitationsin this study. First, although the duration of vibration exposure was over 45 min inboth the laboratory and on road ride-and-drive field studies, it may not have been longenough to characterize “long-term” comfort. While one study suggested a testing durationof 45 min as the minimum time required to quantify “long term” comfort [15], otherstudies suggested a minimum of 90–120 min of vibration exposures for evaluating long-term dynamic comfort [13,39]. Therefore, future studies aiming to evalute long-termcomfort should consider longer exposure durations. Another limitation was potentialheterogeneity between the laboratory and on-road study participants. We attempted tomatch the participant sex and body stature/mass distributions between the two studies.However, as they were not the same participants, the outcome measures may not be directlycompared between the studies. Nonetheless, the results showed relatively consistent trendsbetween the laboratory and on-road studies.
This study has provided a foundation on how to more comprehensively measurefoam mechanical properties and their effects on seat vibration performances and perceivedcomfort. Future work includes understanding how other foam chemical and mechanicalparameters might impact seat vibration performance as well as performing a larger scalestudy with longer vibration exposure times and a large sample size.
Author Contributions: Conceptualization—W.P.-Z., M.P., P.W.J., J.H.K.; methodology—W.P.-Z.,P.W.J., J.H.K..; software—P.W.J., J.H.K..; validation—W.P.-Z., P.W.J., J.H.K.; formal analysis—P.W.J.,J.H.K.; investigation—W.P.-Z., P.W.J., J.H.K.; resources—M.P., W.P.-Z., P.W.J., J.H.K.; data curation—P.W.J., J.H.K..; writing—W.P.-Z., P.W.J., J.H.K..; writing—review and editing—W.P.-Z., P.W.J., J.H.K.,.;visualization—W.P.-Z., P.W.J., J.H.K.,.; supervision—P.W.J., J.H.K.; project administration—W.P.-Z.,J.H.K.; funding acquisition—M.P., W.P.-Z., P.W.J. All authors have read and agreed to the publishedversion of the manuscript.
Funding: This research received no external funding.
Institutional Review Board Statement: The study was conducted in accordance with the Declarationof Helsinki, and approved by the Institutional Review Board of Oregon State University (protocolcode IRB-2019-0323and 11/18/2019).
Informed Consent Statement: Informed consent was obtained from all participants involved in the study.
Data Availability Statement: Not applicable.

Appl. Sci. 2022, 12, 4033 15 of 16
Acknowledgments: The authors would like to thank Kiana Kia, Hakim Ishak, Ed Lee, and KevinBriggs for their contribution in data collection and process. We want to acknowledge and thankthe participants in the study, Jennifer Ibbotson-Brown, a Research Scientist at the University ofWashington for developing the vibration analysis software, NIOSH and the Washington State MedicalAid and Accident for financially supporting the development of the vibration analysis software, andLear Corporation for developing and supplying the three seats and providing the funding to conductthe study. This work has been previously presented at the 2020 annual meeting of the Human Factorsand Ergonomic Society [37] and 2021 International Comfort Congress [38].
Conflicts of Interest: The authors declare no conflict of interest.
References1. Blair, G.R.; Milivojevich, A.; Pageau, J.-G.; van Heumen, J.D. Automotive Seating Comfort; Defining ComfortProperties in
Polyurethane Foam. SAE Trans. 1999, 108, 504–514.2. Ishii, N.; Matsumoto, T.; Ao, T. Development of High-Performance PUF and Organoleptic Evaluation of Polyurethane Foam for
Car Seat. Honda R&D Technical Review. 2014, 26, 139–149.3. Murakami, S.; Saiki, K.; Hayashi, M.; Satou, T.; Fukami, T. A Newly Developed Mdi-Based Polyurethane Flexible Foam for
Automotive Seat Cushion Having Both Superior Static and Dynamic Properties. J. Cell. Plast. 2001, 37, 249–261. [CrossRef]4. Ebe, K.; Griffin, M.J. Qualitative Models of Seat Discomfort Including Static and Dynamic Factors. Ergonomics 2000, 43, 771–790.
[CrossRef]5. Ebe, K.; Griffin, M.J. Factors Affecting Static Seat Cushion Comfort. Ergonomics 2001, 44, 901–921. [CrossRef]6. Mehta, C.R.; Tewari, V.K. Vibrational Characteristics of Tractor Seat Cushion Materials and Ride Comfort. J. Low Freq. Noise Vib.
Act. Control 2002, 21, 77–85. [CrossRef]7. Joshi, G.; Bajaj, A.K.; Davies, P. Whole-Body Vibratory Response Study Using a Nonlinear Multi-Body Model of Seat-Occupant
System with Viscoelastic Flexible Polyurethane Foam. Ind. Health 2010, 48, 663–674. [CrossRef]8. Mansfield, N.; Sammonds, G.; Nguyen, L. Driver Discomfort in Vehicle Seats – Effect of Changing Road Conditions and Seat
Foam Composition. Appl. Ergon. 2015, 50, 153–159. [CrossRef]9. Patten, W.N.; Sha, S.; Mo, C. A Vibrational Model of Open Celled Polyurethane Foam Automotive Cushions. J. Sound Vib. 1998,
217, 145–161. [CrossRef]10. Zhang, X.; Qiu, Y.; Griffin, M.J. Transmission of Vertical Vibration through a Seat: Effect of Thickness of Foam Cushions at the
Seat Pan and the Backrest. Int. J. Ind. Ergon. 2015, 48, 36–45. [CrossRef]11. SAE J2896; Motor Vehicle Seat Comfort Performance Measures; SAE International: Warrendale, PA, USA, 2012. Available online:
https://www.sae.org/standards/content/j2896_201201/ (accessed on 17 March 2022).12. ASTM D3574-17; Standard Test Methods for Flexible Cellular Materials-Slab, Bonded, and Molded Urethane Foams; ASTM
International: West Conshohocken, PA, USA, 2017.13. Sammonds, G.M.; Fray, M.; Mansfield, N.J. Effect of Long Term Driving on Driver Discomfort and Its Relationship with Seat
Fidgets and Movements (SFMs). Appl. Ergon. 2017, 58, 119–127. [CrossRef] [PubMed]14. Mansfield, N.J.; Mackrill, J.; Rimell, A.N.; MacMull, S.J. Combined Effects of Long-Term Sitting and Whole-Body Vibration on
Discomfort Onset for Vehicle Occupants. ISRN Automot. Eng. 2014, 1–8. [CrossRef]15. Na, S.; Lim, S.; Choi, H.-S.; Chung, M.K. Evaluation of Driver’s Discomfort and Postural Change Using Dynamic Body Pressure
Distribution. Int. J. Ind. Ergon. 2005, 35, 1085–1096. [CrossRef]16. Kim, D.Y.; Bang, J.H.; Lee, C.A.; Kim, H.Y.; Choi, K.Y.; Lim, B.G. Numerical Evaluation of Time-Dependent Sagging for Low
Density Polyurethane Foams to Apply the Long-Term Driving Comfort on the Seat Cushion Design. Int. J. Ind. Ergon. 2018, 64,178–187. [CrossRef]
17. ISO 2631-1: Mechanical Vibration and Shock-Evaluation of Human Exposure to Whole-Body Vibration-Par1-General Requirements;International Organization for Standardization: Geneva, Switzerland, 1997. Available online: https://www.iso.org/standard/7612.html (accessed on 17 March 2022).
18. Burström, L.; Nilsson, T.; Wahlström, J. Whole-Body Vibration and the Risk of Low Back Pain and Sciatica: A Systematic Reviewand Meta-Analysis. Int. Arch. Occup. Environ. Health 2015, 88, 403–418. [CrossRef] [PubMed]
19. Bovenzi, M.; Hulshof, C.T.J. An Updated Review of Epidemiologic Studies on the Relationship between Exposure to Whole-BodyVibration and Low Back Pain (1986-1997). Int. Arch. Occup. Environ. Health 1999, 72, 351–365. [CrossRef]
20. Troup, J.D.G. Clinical Effects of Shock and Vibration on the Spine. Clin. Biomech. 1988, 3, 232–235. [CrossRef]21. Kim, J.H.; Zigman, M.; Aulck, L.S.; Ibbotson, J.A.; Dennerlein, J.T.; Johnson, P.W. Whole Body Vibration Exposures and Health
Status among Professional Truck Drivers: A Cross-Sectional Analysis. Ann. Occup. Hyg. 2016, 60, 936–948. [CrossRef]22. Johnson, D.A.; Nève, M. Analysis of Possible Lower Lumbar Strains Caused by the Structural Properties of Automobile Seats: A
Review of Some Recent Technical Literature. J. Manip. Physiol. Ther. 2001, 24, 582–588. [CrossRef]23. Park, S.J.; Subramaniyam, M. Evaluating Methods of Vibration Exposure and Ride Comfort in Car. J. Ergon. Soc. Korea 2013, 32,
381–387. [CrossRef]
Appl. Sci. 2022, 12, 4033 16 of 16
24. Blood, R.P.; Ploger, J.D.; Johnson, P.W. Whole Body Vibration Exposures in Forklift Operators: Comparison of a Mechanical andAir Suspension Seat. Ergonomics 2010, 53, 1385–1394. [CrossRef] [PubMed]
25. Johnson, P.W.; Zigman, M.; Ibbotson, J.; Dennerlein, J.T.; Kim, J.H. A Randomized Controlled Trial of a Truck Seat Intervention:Part 1—Assessment of Whole Body Vibration Exposures. Ann. Work. Expo. Health 2018, 62, 990–999. [CrossRef] [PubMed]
26. Pan-Zagorski, W.; Pereny, M.A. Quantitative Investigation on Dynamic Comfort in Automotive Seats: A Ride and Drive Study. InProceedings of the 2019 International Comfort Congress, Delft, Netherland, 29–30 August 2019.
27. DeShaw, J. New Methodologies for Evaluating Human Biodynamic Response and Discomfort during Seated Whole-Body VibrationConsidering Multiple Postures; University of Iowa: Iowa City, IA, USA, 2013.
28. Mulder, M.; Abbink, D.A. Subjective Perception of Discomfort Due to Vehicle Vibrations in the Sagittal Plane. IFAC-PapersOnLine2016, 49, 494–499. [CrossRef]
29. Naddeo, A.; Cappetti, N.; Vallone, M.; Califano, R. New Trend Line of Research about Comfort Evaluation: Proposal of aFramework for Weighing and Evaluating Contributes Coming from Cognitive, Postural and Physiologic Comfort Perceptions.In Proceedings of the 5th International Conference on Applied Human Factors and Ergonomics AHFE 2014, Kraków, Poland,19–23 July 2014.
30. SAE J826: Devices for Use in Defining and Measuring Vehicle Seating Accommodation; SAE International: Warrendale, PA, USA, 2021.Available online: https://www.sae.org/standards/content/j826_202106 (accessed on 17 March 2022).
31. Kim, J.H.; Dennerlein, J.T.; Johnson, P.W. The Effect of a Multi-Axis Suspension on Whole Body Vibration Exposures and PhysicalStress in the Neck and Low Back in Agricultural Tractor Applications. Appl. Ergon. 2018, 68, 80–89. [CrossRef] [PubMed]
32. Marin, L.S.; Rodriguez, A.C.; Rey-Becerra, E.; Piedrahita, H.; Barrero, L.H.; Dennerlein, J.T.; Johnson, P.W. Assessment ofWhole-Body Vibration Exposure in Mining Earth-Moving Equipment and Other Vehicles Used in Surface Mining. Ann. WorkExpo. Health 2017, 61, 669–680. [CrossRef]
33. Kia, K.; Fitch, S.M.; Newsom, S.A.; Kim, J.H. Effect of Whole-Body Vibration Exposures on Physiological Stresses: Mining HeavyEquipment Applications. Appl. Ergon. 2020, 85, 103065. [CrossRef]
34. European Union Directive 2002/44/EC of the European Parliament and of the Council of 25 June 2002 on the Minimum Healthand Safety Requirements Regarding the Exposure of Workers to the Risks Arising from Physical Agents (Vibration). Off. J. Eur.Communities 2002, 177, 13–19.
35. Mansfield, N.J. Human Response to Vibration; CRC Press: Boca Raton, FL, USA, 2005; ISBN 978-0-203-48722-8.36. Pelmear, P.L.; Leong, D.K.N. EU Directive on Physical Agents—Vibration. J. Low Freq. Noise Vib. Act. Control 2002, 21, 131–139.
[CrossRef]37. Kim, J.H.; Pan-Zagorski, W.; Pereny, M.A.; Johnson, P.W. The Evaluation of Seat-Comfort, Body Discomfort and Seat Vibration
Performance in a Dynamic Testing Environment. In Proceedings of the Human Factors and Ergonomics Society Annual Meeting,Online, 5–9 October 2020; SAGE Publications Sage CA: Los Angeles, CA, USA, 2020; Volume 64, pp. 1530–1531.
38. Pan-Zagorski, W.; Kim, J.H.; Pereny, M.A.; Collins, J.G.; Johnson, P.W. Dynamic Comfort Testing of Automotive Seats in aLaboratory Setting. In Proceedings of the 2021 International Comfort Congress, Online, 2–3 September 2021.
39. Porter, J.M.; Gyi, D.E.; Tait, H.A. Interface Pressure Data and the Prediction of Driver Discomfort in Road Trials. Appl. Ergon.2003, 34, 207–214. [CrossRef]