Automatic optic disc detection from retinal images by a line operator
16
IEEE Proof IEEE TRANSACTIONS ON BIOMEDICAL ENGINEERING, VOL. 00, NO. 00, 2010 1 Automatic Optic Disc Detection From Retinal Images by a Line Operator 1 2 Shijian Lu*, Member, IEEE, and Joo Hwee Lim, Member, IEEE 3 Abstract—Under the framework of computer-aided eye disease 4 diagnosis, this paper presents an automatic optic disc (OD) detec- 5 tion technique. The proposed technique makes use of the unique 6 circular brightness structure associated with the OD, i.e., the OD 7 usually has a circular shape and is brighter than the surround- 8 ing pixels whose intensity becomes darker gradually with their 9 distances from the OD center. A line operator is designed to cap- 10 ture such circular brightness structure, which evaluates the image 11 brightness variation along multiple line segments of specific orien- 12 tations that pass through each retinal image pixel. The orientation 13 of the line segment with the minimum/maximum variation has 14 specific pattern that can be used to locate the OD accurately. The 15 proposed technique has been tested over four public datasets that 16 include 130, 89, 40, and 81 images of healthy and pathological reti- 17 nas, respectively. Experiments show that the designed line operator 18 is tolerant to different types of retinal lesion and imaging artifacts, 19 and an average OD detection accuracy of 97.4% is obtained. 20 Index Terms—Computer-aided diagnosis, line operators, optic 21 disc (OD) detection, retinal image analysis. 22 I. INTRODUCTION 23 A UTOMATIC optic disc (OD) detection from retinal im- 24 ages is a very important task in ocular image analysis 25 [1], [2] and computer-aided diagnosis of various types of eye 26 diseases [3]–[5]. It is often a key step for the detection of other 27 anatomical retinal structures, such as retinal blood vessels and 28 macula [1], [6], [7], [8]. More importantly, it helps to establish a 29 retinal coordinate system that can be used to determine the po- 30 sition of other retinal abnormalities, such as exudates, drusen, 31 and hemorrhages [9], [10]. 32 Some OD detection techniques have been reported in the liter- 33 ature. The early techniques make use of different types of OD- 34 specific image characteristics. In particular, some techniques 35 search for the brightest regions [11], [12] or regions with the 36 highest image variation [13], [14] resulting from the bright OD 37 and the dark blood vessels within the OD. The limitation of these 38 methods is that many retinal images suffer from various types of 39 Manuscript received March 16, 2010; revised July 22, 2010; accepted September 22, 2010. Date of publication; date of current version. Asterisk indicates corresponding author. ∗ S. Lu is with the Department of Computer Vision and Image Understanding, Institute for Infocomm Research, Agency for Science, Technology and Research (A*STAR), Singapore 138632 (e-mail: [email protected]). J. H. Lim is with the Department of Computer Vision and Image Understand- ing, Institute for Infocomm Research, Agency for Science, Technology and Research (A*STAR), Singapore 138632 (e-mail: [email protected]). Color versions of one or more of the figures in this paper are available online at http://ieeexplore.ieee.org. Digital Object Identifier 10.1109/TBME.2010.2086455 retinal lesion, such as drusen, exudates, microaneurysms, and 40 hemorrhage, and imaging artifacts, such as haze, lashes, and 41 uneven illumination (as illustrated in Figs. 9–11) that often pro- 42 duce brighter regions or regions with higher image variation 43 compared with the OD. 44 Several OD detection techniques make use of anatomical 45 structures among the OD, macula, and retinal blood vessels. 46 For example, some methods are based on the anatomical struc- 47 ture that all major retinal blood vessels radiate from the OD 48 [15]–[18]. Some other methods make use of the relative posi- 49 tion between the OD and the macula that often varies within a 50 small range [19], [20]. Compared with the image characteristics, 51 the anatomical structures are more reliable under the presence 52 of retinal lesion and imaging artifacts. However, the extraction 53 of either retinal blood vessels or the macula is often a nontrivial 54 task by itself. 55 This paper presents a line operator that is designed to locate 56 the OD from retinal images accurately. Line operators have 57 been used to locate linear structures from different types of 58 images. For example, Zwiggelaar et al. used a line operator to 59 detect linear structures from mammographic images [21], where 60 a line strength is evaluated by the difference between the largest 61 average image intensity along one oriented line segment and the 62 average image intensity within a local neighborhood window. 63 Ricci and Perfetti [22] used a similar line operator to detect 64 the linear structures that are associated with the retinal blood 65 vessels. 66 Our proposed line operator is designed to capture the circu- 67 lar brightness structure associated with the OD. In particular, it 68 evaluates the image variation along multiple oriented line seg- 69 ments and locates the OD based on the orientation of the line 70 segment with the maximum/minimum variation. Fig. 1(a) shows 71 an example of retinal image in DRIVE project’s dataset [16], 72 and Fig. 1(b) shows an image that simulates the circular bright- 73 ness structure associated with the OD. As shown in Fig. 1, the 74 OD has a specific brightness variation pattern where the image 75 variation along L c in Fig. 1(b) across the OD center usually 76 reaches the maximum, whereas that along L t orthogonal to L c 77 reaches the minimum. 78 The proposed method has several advantages. First, the de- 79 signed line operator is tolerant to the retinal lesion and various 80 types of imaging artifacts that most image-characteristics-based 81 methods cannot handle properly. The tolerance to the imaging 82 artifacts and retinal lesion can be explained by the proposed line 83 operator that is designed to capture the unique circular bright- 84 ness structure associated with the OD. Second, the designed line 85 operator is stable and easy for implementation. It requires nei- 86 ther the retinal blood vessel nor the macula information. Third, 87 the designed line operator can be extended for macula detection 88 0018-9294/$26.00 © 2010 IEEE
-
Upload
independent -
Category
Documents
-
view
0 -
download
0
Transcript of Automatic optic disc detection from retinal images by a line operator

IEEE
Proo
f
IEEE TRANSACTIONS ON BIOMEDICAL ENGINEERING, VOL. 00, NO. 00, 2010 1
Automatic Optic Disc Detection From RetinalImages by a Line Operator
1
2
Shijian Lu*, Member, IEEE, and Joo Hwee Lim, Member, IEEE3
Abstract—Under the framework of computer-aided eye disease4diagnosis, this paper presents an automatic optic disc (OD) detec-5tion technique. The proposed technique makes use of the unique6circular brightness structure associated with the OD, i.e., the OD7usually has a circular shape and is brighter than the surround-8ing pixels whose intensity becomes darker gradually with their9distances from the OD center. A line operator is designed to cap-10ture such circular brightness structure, which evaluates the image11brightness variation along multiple line segments of specific orien-12tations that pass through each retinal image pixel. The orientation13of the line segment with the minimum/maximum variation has14specific pattern that can be used to locate the OD accurately. The15proposed technique has been tested over four public datasets that16include 130, 89, 40, and 81 images of healthy and pathological reti-17nas, respectively. Experiments show that the designed line operator18is tolerant to different types of retinal lesion and imaging artifacts,19and an average OD detection accuracy of 97.4% is obtained.20
Index Terms—Computer-aided diagnosis, line operators, optic21disc (OD) detection, retinal image analysis.22
I. INTRODUCTION23
AUTOMATIC optic disc (OD) detection from retinal im-24
ages is a very important task in ocular image analysis25
[1], [2] and computer-aided diagnosis of various types of eye26
diseases [3]–[5]. It is often a key step for the detection of other27
anatomical retinal structures, such as retinal blood vessels and28
macula [1], [6], [7], [8]. More importantly, it helps to establish a29
retinal coordinate system that can be used to determine the po-30
sition of other retinal abnormalities, such as exudates, drusen,31
and hemorrhages [9], [10].32
Some OD detection techniques have been reported in the liter-33
ature. The early techniques make use of different types of OD-34
specific image characteristics. In particular, some techniques35
search for the brightest regions [11], [12] or regions with the36
highest image variation [13], [14] resulting from the bright OD37
and the dark blood vessels within the OD. The limitation of these38
methods is that many retinal images suffer from various types of39
Manuscript received March 16, 2010; revised July 22, 2010; acceptedSeptember 22, 2010. Date of publication; date of current version. Asteriskindicates corresponding author.
∗S. Lu is with the Department of Computer Vision and Image Understanding,Institute for Infocomm Research, Agency for Science, Technology and Research(A*STAR), Singapore 138632 (e-mail: [email protected]).
J. H. Lim is with the Department of Computer Vision and Image Understand-ing, Institute for Infocomm Research, Agency for Science, Technology andResearch (A*STAR), Singapore 138632 (e-mail: [email protected]).
Color versions of one or more of the figures in this paper are available onlineat http://ieeexplore.ieee.org.
Digital Object Identifier 10.1109/TBME.2010.2086455
retinal lesion, such as drusen, exudates, microaneurysms, and 40
hemorrhage, and imaging artifacts, such as haze, lashes, and 41
uneven illumination (as illustrated in Figs. 9–11) that often pro- 42
duce brighter regions or regions with higher image variation 43
compared with the OD. 44
Several OD detection techniques make use of anatomical 45
structures among the OD, macula, and retinal blood vessels. 46
For example, some methods are based on the anatomical struc- 47
ture that all major retinal blood vessels radiate from the OD 48
[15]–[18]. Some other methods make use of the relative posi- 49
tion between the OD and the macula that often varies within a 50
small range [19], [20]. Compared with the image characteristics, 51
the anatomical structures are more reliable under the presence 52
of retinal lesion and imaging artifacts. However, the extraction 53
of either retinal blood vessels or the macula is often a nontrivial 54
task by itself. 55
This paper presents a line operator that is designed to locate 56
the OD from retinal images accurately. Line operators have 57
been used to locate linear structures from different types of 58
images. For example, Zwiggelaar et al. used a line operator to 59
detect linear structures from mammographic images [21], where 60
a line strength is evaluated by the difference between the largest 61
average image intensity along one oriented line segment and the 62
average image intensity within a local neighborhood window. 63
Ricci and Perfetti [22] used a similar line operator to detect 64
the linear structures that are associated with the retinal blood 65
vessels. 66
Our proposed line operator is designed to capture the circu- 67
lar brightness structure associated with the OD. In particular, it 68
evaluates the image variation along multiple oriented line seg- 69
ments and locates the OD based on the orientation of the line 70
segment with the maximum/minimum variation. Fig. 1(a) shows 71
an example of retinal image in DRIVE project’s dataset [16], 72
and Fig. 1(b) shows an image that simulates the circular bright- 73
ness structure associated with the OD. As shown in Fig. 1, the 74
OD has a specific brightness variation pattern where the image 75
variation along Lc in Fig. 1(b) across the OD center usually 76
reaches the maximum, whereas that along Lt orthogonal to Lc 77
reaches the minimum. 78
The proposed method has several advantages. First, the de- 79
signed line operator is tolerant to the retinal lesion and various 80
types of imaging artifacts that most image-characteristics-based 81
methods cannot handle properly. The tolerance to the imaging 82
artifacts and retinal lesion can be explained by the proposed line 83
operator that is designed to capture the unique circular bright- 84
ness structure associated with the OD. Second, the designed line 85
operator is stable and easy for implementation. It requires nei- 86
ther the retinal blood vessel nor the macula information. Third, 87
the designed line operator can be extended for macula detection 88
0018-9294/$26.00 © 2010 IEEE

IEEE
Proo
f
2 IEEE TRANSACTIONS ON BIOMEDICAL ENGINEERING, VOL. 00, NO. 00, 2010
Fig. 1. Circular brightness structure associated with the OD. (a) Example ofretinal image in DRIVE project’s dataset with OD labeled by a bold black circle.(b) Simulated circular brightness structure: Lc crossing the OD center and Lt
orthogonal to Lc are added to illustrate the line segments along which the imagevariation reaches the maximum and the minimum.
Fig. 2. Retinal image preprocessing. (a) Lightness of the example retinalimage in LAB color space. (b) Enhanced retinal image by bilateral smoothingwhere multiple crosses along a circle label the pixels to be used to illustrate theimage variation along multiple oriented line segments.
with little adaptation. Experiments over four public datasets89
verify its superior performance.90
The rest of this paper is organized as follows. Section II
Q1
91
describes the proposed OD detection technique. Experimental92
results are then described and discussed in Section III. Some93
concluding remarks are finally drawn in Section IV.94
II. PROPOSED METHOD95
This section presents the proposed OD detection technique.96
In particular, we divide this section into four subsections, which97
deal with the retinal image preprocessing, designed line opera-98
tor, OD detection, and discussion, respectively.99
A. Retinal Image Preprocessing100
Retinal images need to be preprocessed before the OD de-101
tection. As the proposed technique makes use of the circular102
brightness structure of the OD, the lightness component of a103
retinal image is first extracted. We use the lightness component104
within the LAB color space, where the OD detection usually per-105
forms the best [23]. For the retinal image in Fig. 1(a), Fig. 2(a)106
shows the corresponding lightness image.107
The retinal image is then smoothed to enhance the circular108
brightness structure associated with the OD. We use a bilateral109
Fig. 3. Example line operator that uses 20 oriented line segments and set theline length p at 21.
smoothing filter [24] that combines geometric closeness and 110
photometric similarity as follows: 111
h(x) = k−1(x)∫ ∞
−∞
∫ ∞
−∞f(ξ)c(ξ, x)s(f(ξ); f(x))dξ (1)
with the normalization factor 112
k(x) =∫ ∞
−∞
∫ ∞
−∞c(ξ, x)s(f(ξ); f(x))dξ (2)
where f(x) denotes the retinal image under study. c(ξ;x) and 113
s(f(ξ), f(x)) measure the geometric closeness and the pho- 114
tometric similarity between the neighborhood center x and a 115
nearby point ξ. We set both c(ξ;x) and s(f(ξ), f(x)) by Gaus- 116
sian functions. The geometric spread σd and the photometric Q2117
spread σr of the two Gaussian functions are typically set at 10 118
and 1 as reported in [24]. For the retinal image in Fig. 2(a), 119
Fig. 2(b) shows the filtered retinal image. 120
B. Designed Line Operator 121
A line operator is designed to the detect circular regions that 122
have similar brightness structure as the OD. For each image 123
pixel at (x, y), the line operator first determines n line segments 124
Li, i = 1, . . . , n of specific length p (i.e., number of pixels) 125
at multiple specific orientations that center at (x, y). The image 126
intensity along all oriented line segments can thus be denoted by 127
a matrix I(x, y)n×p , where each matrix row stores the intensity 128
of p image pixels along one specific line segment. Fig. 3 shows 129
an example of line operator that uses 20 oriented line segments 130
and sets the line length p = 21. 131
As shown in Fig. 3, each line segment Li at one specific 132
orientation can be divided into two line segments Li,1 and Li,2 133
of the same length (p − 1)/2 by the image pixel under study 134
(i.e., the black cell in Fig. 3). The image variation along the 135
oriented line segments can be estimated as follows: 136
Di(x, y) = ‖ fmdn(ILi , 1 (x, y)) − fmdn(ILi , 2 (x, y)) ‖,i = 1, . . . , n (3)

IEEE
Proo
f
LU AND LIM: AUTOMATIC OPTIC DISC DETECTION FROM RETINAL IMAGES BY A LINE OPERATOR 3
Fig. 4. Image variation along multiple oriented line segments: Each graphshows the image variation vector D(x, y) of one retinal image pixel labeled bya cross along the circle in Fig. 2(b).
where fmdn(·) denotes a median function. fmdn(ILi , 1 (x, y))137
and fmdn(ILi , 2 (x, y)) return the median image in-138
tensity along Li,1 and Li,2 , respectively. D =139
[D1(x, y), . . . , Di(x, y), . . . , Dn (x, y)] is, therefore, a140
vector of dimension n that stores the image variations along141
n-oriented line segments.142
The orientation of the line segment with the maxi-143
mum/minimum variation has specific pattern that can be used144
to locate the OD accurately. For retinal image pixels, which are145
far away from the OD, the orientation of the line segment with146
the maximum/minimum variation is usually arbitrary, but for147
those around the OD, the image variation along Lc [labeled in148
Fig. 1(b)] usually reach the maximum, whereas that along Lt149
reaches the minimum. Fig. 4 shows the image variation vectors150
D(x, y) of eight pixels that are labeled by crosses along a circle151
shown in Fig. 2(b). Suppose that there is a Cartesian coordi-152
nate system centered at the OD, as shown in Fig. 2(b). For the153
retinal image pixels in quadrants I and III, the image variations154
along the 1st–10th [i.e., Lt in Fig. 1(b)] and the 11th–20th (i.e.,155
Lc ) line segments labeled in Fig. 3 reach the minimum and the156
maximum, respectively, as shown in Fig. 4. But for the retinal157
image pixels in quadrants II and IV, the image variations along158
the 1st–10th and the 11th–20th line segments instead reach the159
maximum and the minimum, respectively.160
An orientation map can, therefore, be constructed based on the161
orientation of the line segment with the maximum (or minimum)162
variation as follows:163
O(x, y) = argmaxi
D(x, y) (4)
where D(x, y) denotes the image variation vector evaluated in164
(3). In addition, a binary orientation map can also be constructed165
by classifying the orientation of the line segment with the max-166
imum variation into two categories as follows:167
Q(x, y) =
{−1, if argmax
iD(x, y) <
n
2+ 1
1, otherwise(5)
Fig. 5. Orientation map of the retinal image in Fig. 2(b). (a) Gray orienta-tion map that is determined by using (4). (b) Binary orientation map that isdetermined by using (5).
where n refers to the number of the oriented line segments used 168
in the line operator. 169
For the retinal image in Fig. 1(a), Fig. 5(a) and (b) shows the 170
determined gray orientation map and binary orientation map, 171
respectively. As shown in Fig. 5(a), for retinal image pixels in 172
quadrants I and III around the OD, the orientation map is a bit 173
dark because the orientation of the line segment with the maxi- 174
mum variation usually lies between 1 and (n/2) + 1. However, 175
for retinal image pixels in quadrants II and IV, the orientation 176
map is bright because the orientation of the line segment with 177
the maximum variation usually lies between n/2 and n. The bi- 178
nary orientation map in Fig. 5(b) further verifies such orientation 179
pattern. The OD will then be located by using the orientation 180
map to be described in the following. 181
C. OD Detection 182
We use a line operator of 20 oriented line segments because 183
line operators with more line segments have little effect on the 184
orientation map. The line length p is set as follows: 185
p = kR (6)
where R denote the radius of the central circular region of 186
retinal images as illustrated in Fig. 1(a). Parameter k controls 187
the line length, which usually lies between 1/10 and 1/5 based 188
on the relative OD size within retinal images [25]. The use of R 189
incorporates possible variations of the image resolution. 190
The specific pattern within the orientation map is captured by 191
a 2-D circular convolution mask shown at the upper left corner 192
of two peak images in Fig. 6. As shown in Fig. 6, the convolution 193
mask can be divided into four quadrants, where the cells within 194
quadrants I and III are set at −1, whereas those within quadrants 195
II and IV are set at 1 based on the specific pattern within the 196
orientation map. An orientation map can thus be converted into 197
a peak image as follows: 198
P (x, y) =x0 +m∑
x=x0 −m
y0 +m∑y=y0 −m
M(x, y)O(x, y) (7)
where (x0 , y0) denotes the position of the retinal image pixel 199
under study. M(x, y) and O(x, y) refer to the value of the con- 200

IEEE
Proo
f
4 IEEE TRANSACTIONS ON BIOMEDICAL ENGINEERING, VOL. 00, NO. 00, 2010
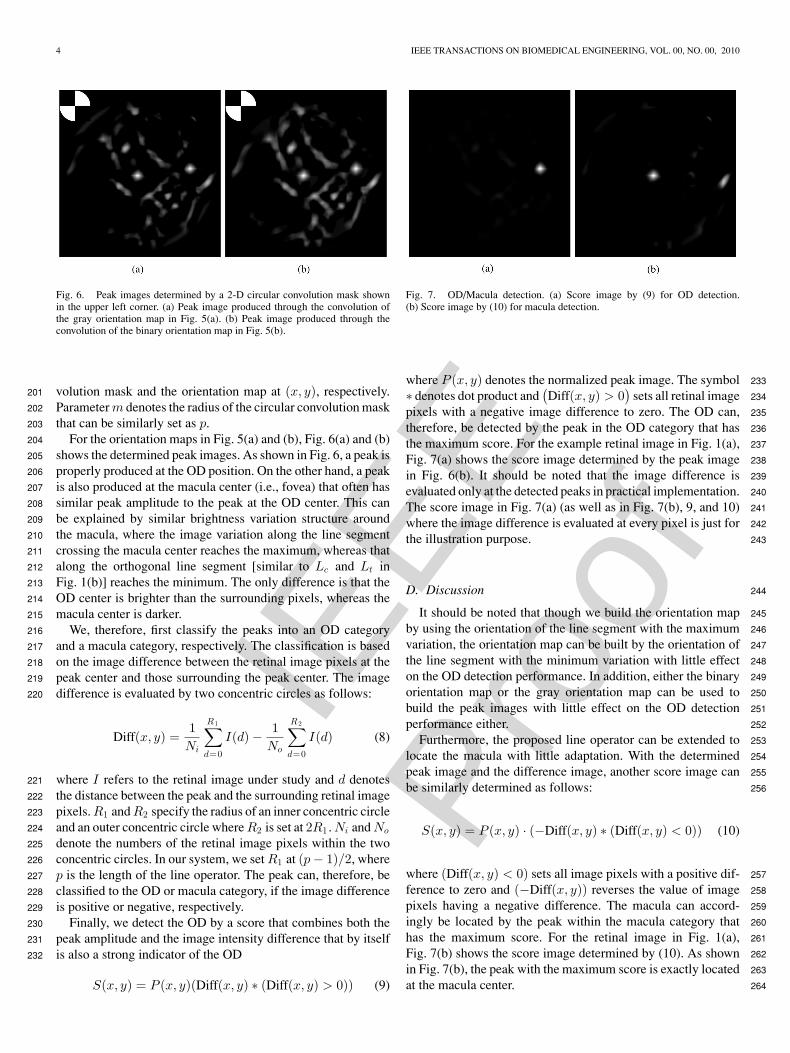
Fig. 6. Peak images determined by a 2-D circular convolution mask shownin the upper left corner. (a) Peak image produced through the convolution ofthe gray orientation map in Fig. 5(a). (b) Peak image produced through theconvolution of the binary orientation map in Fig. 5(b).
volution mask and the orientation map at (x, y), respectively.201
Parameter m denotes the radius of the circular convolution mask202
that can be similarly set as p.203
For the orientation maps in Fig. 5(a) and (b), Fig. 6(a) and (b)204
shows the determined peak images. As shown in Fig. 6, a peak is205
properly produced at the OD position. On the other hand, a peak206
is also produced at the macula center (i.e., fovea) that often has207
similar peak amplitude to the peak at the OD center. This can208
be explained by similar brightness variation structure around209
the macula, where the image variation along the line segment210
crossing the macula center reaches the maximum, whereas that211
along the orthogonal line segment [similar to Lc and Lt in212
Fig. 1(b)] reaches the minimum. The only difference is that the213
OD center is brighter than the surrounding pixels, whereas the214
macula center is darker.215
We, therefore, first classify the peaks into an OD category216
and a macula category, respectively. The classification is based217
on the image difference between the retinal image pixels at the218
peak center and those surrounding the peak center. The image219
difference is evaluated by two concentric circles as follows:220
Diff(x, y) =1Ni
R1∑d=0
I(d) − 1No
R2∑d=0
I(d) (8)
where I refers to the retinal image under study and d denotes221
the distance between the peak and the surrounding retinal image222
pixels. R1 and R2 specify the radius of an inner concentric circle223
and an outer concentric circle where R2 is set at 2R1 . Ni and No224
denote the numbers of the retinal image pixels within the two225
concentric circles. In our system, we set R1 at (p − 1)/2, where226
p is the length of the line operator. The peak can, therefore, be227
classified to the OD or macula category, if the image difference228
is positive or negative, respectively.229
Finally, we detect the OD by a score that combines both the230
peak amplitude and the image intensity difference that by itself231
is also a strong indicator of the OD232
S(x, y) = P (x, y)(Diff(x, y) ∗ (Diff(x, y) > 0)) (9)
Fig. 7. OD/Macula detection. (a) Score image by (9) for OD detection.(b) Score image by (10) for macula detection.
where P (x, y) denotes the normalized peak image. The symbol 233
∗ denotes dot product and(Diff(x, y) > 0
)sets all retinal image 234
pixels with a negative image difference to zero. The OD can, 235
therefore, be detected by the peak in the OD category that has 236
the maximum score. For the example retinal image in Fig. 1(a), 237
Fig. 7(a) shows the score image determined by the peak image 238
in Fig. 6(b). It should be noted that the image difference is 239
evaluated only at the detected peaks in practical implementation. 240
The score image in Fig. 7(a) (as well as in Fig. 7(b), 9, and 10) 241
where the image difference is evaluated at every pixel is just for 242
the illustration purpose. 243
D. Discussion 244
It should be noted that though we build the orientation map 245
by using the orientation of the line segment with the maximum 246
variation, the orientation map can be built by the orientation of 247
the line segment with the minimum variation with little effect 248
on the OD detection performance. In addition, either the binary 249
orientation map or the gray orientation map can be used to 250
build the peak images with little effect on the OD detection 251
performance either. 252
Furthermore, the proposed line operator can be extended to 253
locate the macula with little adaptation. With the determined 254
peak image and the difference image, another score image can 255
be similarly determined as follows: 256
S(x, y) = P (x, y) · (−Diff(x, y) ∗ (Diff(x, y) < 0)) (10)
where (Diff(x, y) < 0) sets all image pixels with a positive dif- 257
ference to zero and (−Diff(x, y)) reverses the value of image 258
pixels having a negative difference. The macula can accord- 259
ingly be located by the peak within the macula category that 260
has the maximum score. For the retinal image in Fig. 1(a), 261
Fig. 7(b) shows the score image determined by (10). As shown 262
in Fig. 7(b), the peak with the maximum score is exactly located 263
at the macula center. 264

IEEE
Proo
f
LU AND LIM: AUTOMATIC OPTIC DISC DETECTION FROM RETINAL IMAGES BY A LINE OPERATOR 5
Fig. 8. OD detection accuracy of the proposed technique in relation to the linelength p and the convolution mask size m.
III. EXPERIMENTAL RESULTS265
This section presents experimental results. Four public266
datasets used are first described. The performance of the de-267
signed line operator is then described and discussed.268
A. Data Description269
We evaluate our proposed technique by using four public270
datasets. In particular, the first two datasets are DIARETDB0271
[26] and DIARETDB1 [27], which are composed of 130 and 89272
retinal images and created for benchmarking diabetic retinopa-273
thy detection. The third dataset is DRIVE project’s dataset [28]274
that is composed of 40 retinal images and created for bench-275
marking retinal blood vessel extraction. The last one is STARE276
project’s dataset [16], which is composed of 50 images of patho-277
logical retina and 31 images of healthy retina. It is created for278
benchmarking OD detection and is much more challenging com-279
pared with the other three datasets.280
B. OD Localization Results281
For each retinal image within the four datasets, we first manu-282
ally label 10–30 OD boundary pixels and then fit an OD bound-283
ary ellipse. The OD is deemed as located correctly, if the detected284
OD lies within the fitted boundary ellipse.285
Fig. 8 shows the average OD detection accuracy of the four286
public datasets. As shown in Fig. 8, the average OD detection287
accuracy varies within a small range when p and m change288
within a specific range (i.e., from R/10 to R/5), and a top av-289
erage accuracy 97.4% (331 out of 340) is achieved when p and290
m are set at R/8. In addition, the top accuracies of the four291
datasets reach up to 99.2%, 98.9%, 97.5%, and 96.3%, respec-292
tively, when p and m vary between R/10 and R/5. In particular,293
most failed retinal images are among the 50 images of patho-294
logical retinas within STARE project’s dataset, many of which295
are severely degraded by different retinal lesion and imaging ar-296
tifacts as shown in Figs. 9–11 and, therefore, do not have a clear297
OD-specific circular brightness structure. Furthermore, the OD298
detection accuracy drops when p and m become too large or too299
small. The accuracy drop can be explained by the fact that bothQ3 300
p and m are set based on OD size which usually varies within a 301
specific range. 302
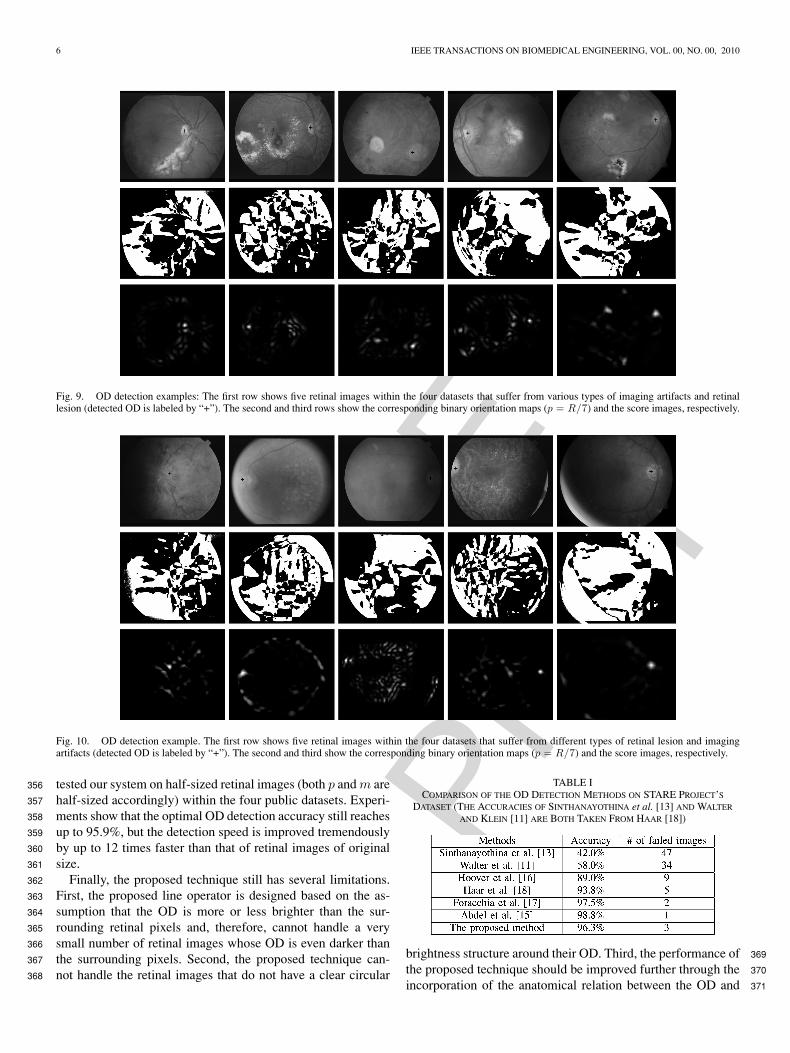
Figs. 9 and 10 illustrate the OD detection results under the 303
presence of retinal lesion and imaging artifacts. In particular, 304
the three rows in the two figures show the test retinal images 305
(detected OD is labeled by “+”), the derived orientation maps, 306
and the final score images, respectively. As shown in Figs. 9 and 307
10, the line operator is able to detect the OD under the presence 308
of retinal lesion, such as drusen (in the fifth image in Fig. 9), 309
exudates (in the second and fourth images in Fig. 9), microa- 310
neurysms (in the fifth image in Fig. 10), papillary swelling (in 311
the first image in Fig. 10), and hemorrhage (in the first image 312
in Fig. 9), and imaging artifacts, such as haze (in the 2nd im- 313
age in Fig. 10) and uneven illumination (in the third and fourth 314
images in Fig. 10), that often produce regions with higher im- 315
age brightness or image variation than the OD. Such results are 316
due to the line operator that is specially designed to capture the 317
OD-specific circular brightness structure. 318
Table I compares the accuracies of the proposed technique 319
and some earlier reported methods based on STARE project’s 320
dataset. As shown in Table I, the proposed technique signif- 321
icantly outperforms the image-characteristics-based methods 322
[11], [13] that cannot handle various types of imaging artifacts 323
and retinal lesion properly. In addition, the accuracy of our pro- 324
posed technique is close to that of the methods [15]–[18] that 325
rely on the retinal blood vessels. As a comparison, the proposed 326
technique requires no retinal blood vessels. In fact, all failed 327
retinal images reported in [15] and [17] (i.e., the fourth image in 328
Fig. 9 and the first and fourth images in Fig. 10) can be correctly 329
detected by the proposed line operator. 330
It should be noted that we only compare on STARE project’s 331
dataset because STARE project’s dataset contains up to 50 im- 332
ages of pathological retinas and is widely used for benchmarking 333
in the literature. Besides, many OD detection methods, includ- 334
ing those based on the retinal blood vessels and our proposed 335
method in this paper, are capable of detecting the OD from nor- 336
mal retinal images properly. In fact, all failed retinal images in 337
STARE project’s dataset (by our proposed method) are from the 338
50 images of pathological retinas, and the remaining 31 normal 339
ones are all correctly detected. 340
C. Discussion 341
The designed line operator can be used for macula detection 342
as described in Section II. We test the macula detection based 343
on four subdatasets including 114, 85, 35, and 39 retinal im- 344
ages that are selected from the four public datasets. The use of 345
four subdatasets is because of many retinal images in the four 346
datasets, such as the third and fourth images in Fig. 9 and the 347
first image in Fig. 10, do not have a discernible macula. Exper- 348
iments over the four subdatasets show that an average macula 349
detection accuracy of 98.2% is achieved. 350
In addition, it takes around 40 s for our system to process a 351
retinal image of original size (around 700 × 600 pixels). The 352
detection speed could be improved significantly through code 353
optimization and implementation in C. In addition, the designed 354
line operator is robust against lower image resolution. We have 355

IEEE
Proo
f
6 IEEE TRANSACTIONS ON BIOMEDICAL ENGINEERING, VOL. 00, NO. 00, 2010
Fig. 9. OD detection examples: The first row shows five retinal images within the four datasets that suffer from various types of imaging artifacts and retinallesion (detected OD is labeled by “+”). The second and third rows show the corresponding binary orientation maps (p = R/7) and the score images, respectively.
Fig. 10. OD detection example. The first row shows five retinal images within the four datasets that suffer from different types of retinal lesion and imagingartifacts (detected OD is labeled by “+”). The second and third show the corresponding binary orientation maps (p = R/7) and the score images, respectively.
tested our system on half-sized retinal images (both p and m are356
half-sized accordingly) within the four public datasets. Experi-357
ments show that the optimal OD detection accuracy still reaches358
up to 95.9%, but the detection speed is improved tremendously359
by up to 12 times faster than that of retinal images of original360
size.361
Finally, the proposed technique still has several limitations.362
First, the proposed line operator is designed based on the as-363
sumption that the OD is more or less brighter than the sur-364
rounding retinal pixels and, therefore, cannot handle a very365
small number of retinal images whose OD is even darker than366
the surrounding pixels. Second, the proposed technique can-367
not handle the retinal images that do not have a clear circular368
TABLE ICOMPARISON OF THE OD DETECTION METHODS ON STARE PROJECT’S
DATASET (THE ACCURACIES OF SINTHANAYOTHINA et al. [13] AND WALTER
AND KLEIN [11] ARE BOTH TAKEN FROM HAAR [18])
brightness structure around their OD. Third, the performance of 369
the proposed technique should be improved further through the 370
incorporation of the anatomical relation between the OD and 371

IEEE
Proo
f
LU AND LIM: AUTOMATIC OPTIC DISC DETECTION FROM RETINAL IMAGES BY A LINE OPERATOR 7
the macula, since the designed line operator is able to locate the372
macula with little adaptation. We will study these three issues373
in our future works.374
D. Conclusion375
This paper presents an automatic OD detection technique.376
A line operator is designed, which locates the OD through the377
detection of the OD-specific circular brightness structure. Com-378
pared with the reported techniques, the proposed technique re-379
quires neither the retinal blood vessel nor the macula. At the380
same time, it is tolerant to different types of retinal lesion and381
imaging artifacts. Experiments over four public datasets show382
that an accuracy of 97.4% is obtained.383
REFERENCES384
[1] K. Akita and H. Kuga, “A computer method of understanding ocular385fundus images,” Pattern Recognit., vol. 15, no. 6, pp. 431–443, 1982.386
[2] N. Patton, T. M. Aslam, T. MacGillivary, I. J. Deary, B. Dhillon, R.387H. Eikelboom, K. Yogesan, and I. J. Constable, “Retinal image analysis:388Concepts, applications and potential,” Prog. Retin. Eye Res., vol. 25,389no. 1, pp. 99–127, 2006.390
[3] T. Walter, J. C. Klein, P. Massin, and A. Erginay, “A Contribution of391Image Processing to the Diagnosis of Diabetic Retinopathy-Detection of392Exudates in Color Fundus Images of the Human Retina,” IEEE Trans.393Med. Imag., vol. 21, no. 10, pp. 1236–1243, Oct. 2002.394
[4] R. Chrastek, M. Wolf, K. Donath, H. Niemann, D. Paulus, T. Hothorn,395B. Lausen, R. Lammer, C. Y. Mardin, and G. Michelson, “Automated396segmentation of the optic nerve head for diagnosis of glaucoma,” Med.397Image Anal., vol. 9, no. 4, pp. 297–314, 2005.398
[5] A. D. Fleming, K. A. Goatman, S. Philip, J. A. Olson, and P. F. Sharp,399“Automatic detection of retinal anatomy to assist diabetic retinopathy400screening,” Phys. Med. Biol., vol. 52, no. 2, pp. 331–345, 2007.401
[6] A. Pinz, S. Bernogger, P. Datlinger, and A. Kruger, “Mapping the Human402Retina,” IEEE Trans. Med. Imag., vol. 17, no. 4, pp. 606–619, Aug. 1998.403
[7] K. W. Tobin, E. Chaum, V. P. Govindasamy, and T. P. Karnowski, “Detec-404tion of anatomic structures in human retinal imagery,” IEEE Trans. Med.405Imag., vol. 26, no. 12, pp. 1729–1739, Dec. 2007.406
[8] M. Niemeijer, M. D. Abramoff, and B. V. Ginneken, “Segmentation of407the optic disc, macula and vascular arch in fundus photographs,” IEEE408Trans. Med. Imag., vol. 26, no. 1, pp. 116–127, Jan. 2007.409
[9] W. Hsu, P. M. D. S. Pallawala, M. L. Lee, and K. A. Eong, “The Role of410Domain Knowledge in the Detection of Retinal Hard Exudates,” in Proc.411Int. Conf. Comp. Vis. Pattern Recognit., vol. 2, 2001, pp. 246–251.412
[10] Z. B. Sbeh, L. D. Cohen, G. Mimoun, and G. Coscas, “A new approach of413geodesic reconstruction for drusen segmentation in eye fundus images,”414IEEE Trans. Med. Imag., vol. 20, no. 12, pp. 1321–1333, Dec. 2002.415
[11] T. Walter and J. C. Klein, “Segmentation of color fundus images of the416human retina: Detection of the optic disc and the vascular tree using417morphological techniques,” in Proc. Int. Symp. Med. Data Anal., 2001,418pp. 282–287.419
[12] H. Li and O. Chutatape, “Automatic location of optic disc in retinal im-420ages,” in Proc. Int. Conf. Image, vol. 2, pp. 837–840, 2001.421
[13] C. Sinthanayothina, J. F. Boycea, H. L. Cookb, and T. H. Williamsonb,422“Automated localisation of the optic disc, fovea, and retinal blood vessels423from digital colour fundus images,” Br. J. Ophthalmol., vol. 83, pp. 902–424910, 1999.425
[14] S. Sekhar, W. Al-Nuaimy, and A. K. Nandi, “Automated localisation of426retinal optic disk using Hough transform,” in Proc. Int. Symp. Biomed.427Imag.: Nano Macro, 2008, pp. 1577–1580.428
[15] A. Youssif, A. Z. Ghalwash, and A. Ghoneim, “Optic disc detection from429normalized digital fundus images by means of a vessels’ direction matched430filter,” IEEE Trans. Med. Imag., vol. 27, no. 1, pp. 11–18, Jan. 2008.431
[16] A. Hoover and M. Goldbaum, “Locating the optic nerve in a netinal image432using the fuzzy convergence of the blood vessels,” IEEE Trans. Med.433Imag., vol. 22, no. 8, pp. 951–958, Aug. 2003.434
[17] M. Foracchia, E. Grisan, and A. Ruggeri, “Detection of optic disc in retinal435images by means of a geometrical model of vessel structure,” IEEE Trans.436Med. Imag., vol. 23, no. 10, pp. 1189–1195, Oct. 2004.437
[18] F. Haar, “Automatic localization of the optic disc in digital colour im- 438ages of the human retina,” M.S. thesis, Utrecht University, Utrecht, The 439Netherlands, 2005. 440
[19] H. Li and O. Chutatape, “Automated feature extraction in color retinal 441images by a model based approach,” IEEE Trans. Biomed. Eng., vol. 51, 442no. 2, pp. 246–254, Feb. 2004. 443
[20] A. P. Rovira and E. Trucco, “Robust optic disc location via combination 444of weak detectors,” in Proc. Int. Conf. IEEE Eng. Med. Bio. Soc., 2008, 445pp. 3542–3545. 446
[21] R. Zwiggelaar, S. M. Astley, C. R. M. Boggis, and C. J. Taylor, “Linear 447structures in mammographic images: Detection and classification,” IEEE 448Trans. Med. Imag., vol. 23, no. 9, pp. 1077–1086, Sep. 2004. 449
[22] E. Ricci and R. Perfetti, “Retinal blood vessel segmentation using line 450operators and support vector classification,” IEEE Trans. Med. Imag., 451vol. 26, no. 10, pp. 1357–1365, Oct. 2007. 452
[23] A. Osareh, M. Mirmehdi, B. Thomas, and R. Markham, “Comparison of 453colour spaces for optic disc localisation in retinal images,” in Proc. Int. 454Conf. Pattern Recognit., vol. 1, 2002, pp. 743–746. 455
[24] C. Tomasi and R. Manduchi, “Bilateral Filtering for Gray and Color 456Images,” in Proc. IEEE Int. Conf. Comp. Vis., 1998, pp. 839–846. 457
[25] W. Tasman and E. A. Jaeger, Duane’s Ophthalmology, 15th ed. 458Baltimore, MD: Lippincott Williams & Wilkins, 2009. 459
[26] T. Kauppi, V. Kalesnykiene, J. K. Kamarainen, L. Lensu, I. Sorri, H. 460Uusitalo, H. Kalviainen, and J. Pietila, “DIARETDB0: Evaluation 461database and methodology for diabetic retinopathy algorithms,” Tech. 462Rep., Lappeenranta Univ. Technol., Lappeenranta, Finland, 2006. 463
[27] T. Kauppi, V. Kalesnykiene, J. K. Kamarainen, L. Lensu, I. Sorri, H. 464Uusitalo, H. Klviinen, and J. Pietil, “DIARETDB1 diabetic retinopathy 465database and evaluation protocol,” Tech. Rep., Lappeenranta Univ. Tech- 466nol., Lappeenranta, Finland, 2007. 467
[28] J. J. Staal, M. D. Abramoff, M. Niemeijer, M. A. Viergever, and B. V. 468Ginneken, “Ridge based vessel segmentation in color images of the retina,” 469IEEE Trans. Med. Imag., vol. 23, no. 4, pp. 501–509, Apr. 2004. 470
Shijian Lu (M’xx) received the Ph.D. degree in elec- 471trical and computer engineering from National Uni- 472versity of Singapore, Singapore, in 2005. Q4473
He is currently a Senior Research Fellow 474at the Institute for Infocomm Research, Agency 475for Science, Technology and Research (A*STAR), 476Singapore. His research interests include document 477image analysis and medical image analysis. He has 478authored or coauthored more than 40 peer-reviewed 479journal and conference papers. Dr. Lu is a member 480of International Association of Pattern Recognition 481
(IAPR). 482483
Joo Hwee Lim (M’xx) received the B.Sc. and M.Sc. Q5484degrees in computer science from the National Uni- 485versity of Singapore, Singapore, and the Ph.D. degree 486in computer science & engineering from the Univer- 487sity of New South Wales, Sydney, Australia. 488
Since October 1990, he has been with the 489Institute for Infocomm Research (I2R), Agency 490for Science, Technology and Research (A*STAR), 491Singapore, where he is currently the Head of the 492Computer Vision and Image Understanding Depart- 493ment. He is also an Adjunct Associate Professor at 494
the School of Computer Engineering, Nanyang Technological University, Sin- 495gapore. He is also the Co-Director of Image and Pervasive Access Laboratory 496(IPAL), a French–Singapore Joint Lab (UMI 2955) for the tenure January 2007 497to December 2010, and the Director (Imaging) of a new joint lab (SAILOR) 498between I2R and Singapore Eye Research Institute for the tenure June 2009 499to June 2012, where computer scientists and clinicians collaborate closely. He 500has authored or coauthored more than 170 international refereed journal and 501conference papers. He has also coauthored 16 patents (awarded and pend- 502ing). His research interests include connectionist expert systems, neural-fuzzy 503systems, handwritten character recognition, multiagent systems, content-based 504image/video retrieval, scene/object recognition, medical image analysis. Q6505
Dr. Lim was bestowed the title of “Chevallet dans l’ordre des Palmes 506Academiques” by the French Government in 2008. 507
508

IEEE
Proo
f
QUERIES509
Q1: Author: Please spell out “DRIVE” and STARE in full, if possible.510
Q2. Author: There is discrepancy in the terms “c(ξ;x)” and “s(f(ξ), f(x))” between display equation and text. Please check and511
confirm.512
Q3. Author: The citation for Fig. 11 has been provided in text. However, there are only ten figures in the manuscript. Please check513
and confirm.514
Q4. Author: Please provide the year information in which S. Lu became a Member of IEEE.515
Q5. Author: Please provide the year information in which J. H. Lim became a Member of IEEE.516
Q6. Author: Please spell out “UMI” and “SAILOR” in full, if possible.517

IEEE
Proo
f
IEEE TRANSACTIONS ON BIOMEDICAL ENGINEERING, VOL. 00, NO. 00, 2010 1
Automatic Optic Disc Detection From RetinalImages by a Line Operator
1
2
Shijian Lu*, Member, IEEE, and Joo Hwee Lim, Member, IEEE3
Abstract—Under the framework of computer-aided eye disease4diagnosis, this paper presents an automatic optic disc (OD) detec-5tion technique. The proposed technique makes use of the unique6circular brightness structure associated with the OD, i.e., the OD7usually has a circular shape and is brighter than the surround-8ing pixels whose intensity becomes darker gradually with their9distances from the OD center. A line operator is designed to cap-10ture such circular brightness structure, which evaluates the image11brightness variation along multiple line segments of specific orien-12tations that pass through each retinal image pixel. The orientation13of the line segment with the minimum/maximum variation has14specific pattern that can be used to locate the OD accurately. The15proposed technique has been tested over four public datasets that16include 130, 89, 40, and 81 images of healthy and pathological reti-17nas, respectively. Experiments show that the designed line operator18is tolerant to different types of retinal lesion and imaging artifacts,19and an average OD detection accuracy of 97.4% is obtained.20
Index Terms—Computer-aided diagnosis, line operators, optic21disc (OD) detection, retinal image analysis.22
I. INTRODUCTION23
AUTOMATIC optic disc (OD) detection from retinal im-24
ages is a very important task in ocular image analysis25
[1], [2] and computer-aided diagnosis of various types of eye26
diseases [3]–[5]. It is often a key step for the detection of other27
anatomical retinal structures, such as retinal blood vessels and28
macula [1], [6], [7], [8]. More importantly, it helps to establish a29
retinal coordinate system that can be used to determine the po-30
sition of other retinal abnormalities, such as exudates, drusen,31
and hemorrhages [9], [10].32
Some OD detection techniques have been reported in the liter-33
ature. The early techniques make use of different types of OD-34
specific image characteristics. In particular, some techniques35
search for the brightest regions [11], [12] or regions with the36
highest image variation [13], [14] resulting from the bright OD37
and the dark blood vessels within the OD. The limitation of these38
methods is that many retinal images suffer from various types of39
Manuscript received March 16, 2010; revised July 22, 2010; acceptedSeptember 22, 2010. Date of publication; date of current version. Asteriskindicates corresponding author.
∗S. Lu is with the Department of Computer Vision and Image Understanding,Institute for Infocomm Research, Agency for Science, Technology and Research(A*STAR), Singapore 138632 (e-mail: [email protected]).
J. H. Lim is with the Department of Computer Vision and Image Understand-ing, Institute for Infocomm Research, Agency for Science, Technology andResearch (A*STAR), Singapore 138632 (e-mail: [email protected]).
Color versions of one or more of the figures in this paper are available onlineat http://ieeexplore.ieee.org.
Digital Object Identifier 10.1109/TBME.2010.2086455
retinal lesion, such as drusen, exudates, microaneurysms, and 40
hemorrhage, and imaging artifacts, such as haze, lashes, and 41
uneven illumination (as illustrated in Figs. 9–11) that often pro- 42
duce brighter regions or regions with higher image variation 43
compared with the OD. 44
Several OD detection techniques make use of anatomical 45
structures among the OD, macula, and retinal blood vessels. 46
For example, some methods are based on the anatomical struc- 47
ture that all major retinal blood vessels radiate from the OD 48
[15]–[18]. Some other methods make use of the relative posi- 49
tion between the OD and the macula that often varies within a 50
small range [19], [20]. Compared with the image characteristics, 51
the anatomical structures are more reliable under the presence 52
of retinal lesion and imaging artifacts. However, the extraction 53
of either retinal blood vessels or the macula is often a nontrivial 54
task by itself. 55
This paper presents a line operator that is designed to locate 56
the OD from retinal images accurately. Line operators have 57
been used to locate linear structures from different types of 58
images. For example, Zwiggelaar et al. used a line operator to 59
detect linear structures from mammographic images [21], where 60
a line strength is evaluated by the difference between the largest 61
average image intensity along one oriented line segment and the 62
average image intensity within a local neighborhood window. 63
Ricci and Perfetti [22] used a similar line operator to detect 64
the linear structures that are associated with the retinal blood 65
vessels. 66
Our proposed line operator is designed to capture the circu- 67
lar brightness structure associated with the OD. In particular, it 68
evaluates the image variation along multiple oriented line seg- 69
ments and locates the OD based on the orientation of the line 70
segment with the maximum/minimum variation. Fig. 1(a) shows 71
an example of retinal image in DRIVE project’s dataset [16], 72
and Fig. 1(b) shows an image that simulates the circular bright- 73
ness structure associated with the OD. As shown in Fig. 1, the 74
OD has a specific brightness variation pattern where the image 75
variation along Lc in Fig. 1(b) across the OD center usually 76
reaches the maximum, whereas that along Lt orthogonal to Lc 77
reaches the minimum. 78
The proposed method has several advantages. First, the de- 79
signed line operator is tolerant to the retinal lesion and various 80
types of imaging artifacts that most image-characteristics-based 81
methods cannot handle properly. The tolerance to the imaging 82
artifacts and retinal lesion can be explained by the proposed line 83
operator that is designed to capture the unique circular bright- 84
ness structure associated with the OD. Second, the designed line 85
operator is stable and easy for implementation. It requires nei- 86
ther the retinal blood vessel nor the macula information. Third, 87
the designed line operator can be extended for macula detection 88
0018-9294/$26.00 © 2010 IEEE

IEEE
Proo
f
2 IEEE TRANSACTIONS ON BIOMEDICAL ENGINEERING, VOL. 00, NO. 00, 2010
Fig. 1. Circular brightness structure associated with the OD. (a) Example ofretinal image in DRIVE project’s dataset with OD labeled by a bold black circle.(b) Simulated circular brightness structure: Lc crossing the OD center and Lt
orthogonal to Lc are added to illustrate the line segments along which the imagevariation reaches the maximum and the minimum.
Fig. 2. Retinal image preprocessing. (a) Lightness of the example retinalimage in LAB color space. (b) Enhanced retinal image by bilateral smoothingwhere multiple crosses along a circle label the pixels to be used to illustrate theimage variation along multiple oriented line segments.
with little adaptation. Experiments over four public datasets89
verify its superior performance.90
The rest of this paper is organized as follows. Section II
Q1
91
describes the proposed OD detection technique. Experimental92
results are then described and discussed in Section III. Some93
concluding remarks are finally drawn in Section IV.94
II. PROPOSED METHOD95
This section presents the proposed OD detection technique.96
In particular, we divide this section into four subsections, which97
deal with the retinal image preprocessing, designed line opera-98
tor, OD detection, and discussion, respectively.99
A. Retinal Image Preprocessing100
Retinal images need to be preprocessed before the OD de-101
tection. As the proposed technique makes use of the circular102
brightness structure of the OD, the lightness component of a103
retinal image is first extracted. We use the lightness component104
within the LAB color space, where the OD detection usually per-105
forms the best [23]. For the retinal image in Fig. 1(a), Fig. 2(a)106
shows the corresponding lightness image.107
The retinal image is then smoothed to enhance the circular108
brightness structure associated with the OD. We use a bilateral109
Fig. 3. Example line operator that uses 20 oriented line segments and set theline length p at 21.
smoothing filter [24] that combines geometric closeness and 110
photometric similarity as follows: 111
h(x) = k−1(x)∫ ∞
−∞
∫ ∞
−∞f(ξ)c(ξ, x)s(f(ξ); f(x))dξ (1)
with the normalization factor 112
k(x) =∫ ∞
−∞
∫ ∞
−∞c(ξ, x)s(f(ξ); f(x))dξ (2)
where f(x) denotes the retinal image under study. c(ξ;x) and 113
s(f(ξ), f(x)) measure the geometric closeness and the pho- 114
tometric similarity between the neighborhood center x and a 115
nearby point ξ. We set both c(ξ;x) and s(f(ξ), f(x)) by Gaus- 116
sian functions. The geometric spread σd and the photometric Q2117
spread σr of the two Gaussian functions are typically set at 10 118
and 1 as reported in [24]. For the retinal image in Fig. 2(a), 119
Fig. 2(b) shows the filtered retinal image. 120
B. Designed Line Operator 121
A line operator is designed to the detect circular regions that 122
have similar brightness structure as the OD. For each image 123
pixel at (x, y), the line operator first determines n line segments 124
Li, i = 1, . . . , n of specific length p (i.e., number of pixels) 125
at multiple specific orientations that center at (x, y). The image 126
intensity along all oriented line segments can thus be denoted by 127
a matrix I(x, y)n×p , where each matrix row stores the intensity 128
of p image pixels along one specific line segment. Fig. 3 shows 129
an example of line operator that uses 20 oriented line segments 130
and sets the line length p = 21. 131
As shown in Fig. 3, each line segment Li at one specific 132
orientation can be divided into two line segments Li,1 and Li,2 133
of the same length (p − 1)/2 by the image pixel under study 134
(i.e., the black cell in Fig. 3). The image variation along the 135
oriented line segments can be estimated as follows: 136
Di(x, y) = ‖ fmdn(ILi , 1 (x, y)) − fmdn(ILi , 2 (x, y)) ‖,i = 1, . . . , n (3)

IEEE
Proo
f
LU AND LIM: AUTOMATIC OPTIC DISC DETECTION FROM RETINAL IMAGES BY A LINE OPERATOR 3
Fig. 4. Image variation along multiple oriented line segments: Each graphshows the image variation vector D(x, y) of one retinal image pixel labeled bya cross along the circle in Fig. 2(b).
where fmdn(·) denotes a median function. fmdn(ILi , 1 (x, y))137
and fmdn(ILi , 2 (x, y)) return the median image in-138
tensity along Li,1 and Li,2 , respectively. D =139
[D1(x, y), . . . , Di(x, y), . . . , Dn (x, y)] is, therefore, a140
vector of dimension n that stores the image variations along141
n-oriented line segments.142
The orientation of the line segment with the maxi-143
mum/minimum variation has specific pattern that can be used144
to locate the OD accurately. For retinal image pixels, which are145
far away from the OD, the orientation of the line segment with146
the maximum/minimum variation is usually arbitrary, but for147
those around the OD, the image variation along Lc [labeled in148
Fig. 1(b)] usually reach the maximum, whereas that along Lt149
reaches the minimum. Fig. 4 shows the image variation vectors150
D(x, y) of eight pixels that are labeled by crosses along a circle151
shown in Fig. 2(b). Suppose that there is a Cartesian coordi-152
nate system centered at the OD, as shown in Fig. 2(b). For the153
retinal image pixels in quadrants I and III, the image variations154
along the 1st–10th [i.e., Lt in Fig. 1(b)] and the 11th–20th (i.e.,155
Lc ) line segments labeled in Fig. 3 reach the minimum and the156
maximum, respectively, as shown in Fig. 4. But for the retinal157
image pixels in quadrants II and IV, the image variations along158
the 1st–10th and the 11th–20th line segments instead reach the159
maximum and the minimum, respectively.160
An orientation map can, therefore, be constructed based on the161
orientation of the line segment with the maximum (or minimum)162
variation as follows:163
O(x, y) = argmaxi
D(x, y) (4)
where D(x, y) denotes the image variation vector evaluated in164
(3). In addition, a binary orientation map can also be constructed165
by classifying the orientation of the line segment with the max-166
imum variation into two categories as follows:167
Q(x, y) =
{−1, if argmax
iD(x, y) <
n
2+ 1
1, otherwise(5)
Fig. 5. Orientation map of the retinal image in Fig. 2(b). (a) Gray orienta-tion map that is determined by using (4). (b) Binary orientation map that isdetermined by using (5).
where n refers to the number of the oriented line segments used 168
in the line operator. 169
For the retinal image in Fig. 1(a), Fig. 5(a) and (b) shows the 170
determined gray orientation map and binary orientation map, 171
respectively. As shown in Fig. 5(a), for retinal image pixels in 172
quadrants I and III around the OD, the orientation map is a bit 173
dark because the orientation of the line segment with the maxi- 174
mum variation usually lies between 1 and (n/2) + 1. However, 175
for retinal image pixels in quadrants II and IV, the orientation 176
map is bright because the orientation of the line segment with 177
the maximum variation usually lies between n/2 and n. The bi- 178
nary orientation map in Fig. 5(b) further verifies such orientation 179
pattern. The OD will then be located by using the orientation 180
map to be described in the following. 181
C. OD Detection 182
We use a line operator of 20 oriented line segments because 183
line operators with more line segments have little effect on the 184
orientation map. The line length p is set as follows: 185
p = kR (6)
where R denote the radius of the central circular region of 186
retinal images as illustrated in Fig. 1(a). Parameter k controls 187
the line length, which usually lies between 1/10 and 1/5 based 188
on the relative OD size within retinal images [25]. The use of R 189
incorporates possible variations of the image resolution. 190
The specific pattern within the orientation map is captured by 191
a 2-D circular convolution mask shown at the upper left corner 192
of two peak images in Fig. 6. As shown in Fig. 6, the convolution 193
mask can be divided into four quadrants, where the cells within 194
quadrants I and III are set at −1, whereas those within quadrants 195
II and IV are set at 1 based on the specific pattern within the 196
orientation map. An orientation map can thus be converted into 197
a peak image as follows: 198
P (x, y) =x0 +m∑
x=x0 −m
y0 +m∑y=y0 −m
M(x, y)O(x, y) (7)
where (x0 , y0) denotes the position of the retinal image pixel 199
under study. M(x, y) and O(x, y) refer to the value of the con- 200
IEEE
Proo
f
4 IEEE TRANSACTIONS ON BIOMEDICAL ENGINEERING, VOL. 00, NO. 00, 2010
Fig. 6. Peak images determined by a 2-D circular convolution mask shownin the upper left corner. (a) Peak image produced through the convolution ofthe gray orientation map in Fig. 5(a). (b) Peak image produced through theconvolution of the binary orientation map in Fig. 5(b).
volution mask and the orientation map at (x, y), respectively.201
Parameter m denotes the radius of the circular convolution mask202
that can be similarly set as p.203
For the orientation maps in Fig. 5(a) and (b), Fig. 6(a) and (b)204
shows the determined peak images. As shown in Fig. 6, a peak is205
properly produced at the OD position. On the other hand, a peak206
is also produced at the macula center (i.e., fovea) that often has207
similar peak amplitude to the peak at the OD center. This can208
be explained by similar brightness variation structure around209
the macula, where the image variation along the line segment210
crossing the macula center reaches the maximum, whereas that211
along the orthogonal line segment [similar to Lc and Lt in212
Fig. 1(b)] reaches the minimum. The only difference is that the213
OD center is brighter than the surrounding pixels, whereas the214
macula center is darker.215
We, therefore, first classify the peaks into an OD category216
and a macula category, respectively. The classification is based217
on the image difference between the retinal image pixels at the218
peak center and those surrounding the peak center. The image219
difference is evaluated by two concentric circles as follows:220
Diff(x, y) =1Ni
R1∑d=0
I(d) − 1No
R2∑d=0
I(d) (8)
where I refers to the retinal image under study and d denotes221
the distance between the peak and the surrounding retinal image222
pixels. R1 and R2 specify the radius of an inner concentric circle223
and an outer concentric circle where R2 is set at 2R1 . Ni and No224
denote the numbers of the retinal image pixels within the two225
concentric circles. In our system, we set R1 at (p − 1)/2, where226
p is the length of the line operator. The peak can, therefore, be227
classified to the OD or macula category, if the image difference228
is positive or negative, respectively.229
Finally, we detect the OD by a score that combines both the230
peak amplitude and the image intensity difference that by itself231
is also a strong indicator of the OD232
S(x, y) = P (x, y)(Diff(x, y) ∗ (Diff(x, y) > 0)) (9)
Fig. 7. OD/Macula detection. (a) Score image by (9) for OD detection.(b) Score image by (10) for macula detection.
where P (x, y) denotes the normalized peak image. The symbol 233
∗ denotes dot product and(Diff(x, y) > 0
)sets all retinal image 234
pixels with a negative image difference to zero. The OD can, 235
therefore, be detected by the peak in the OD category that has 236
the maximum score. For the example retinal image in Fig. 1(a), 237
Fig. 7(a) shows the score image determined by the peak image 238
in Fig. 6(b). It should be noted that the image difference is 239
evaluated only at the detected peaks in practical implementation. 240
The score image in Fig. 7(a) (as well as in Fig. 7(b), 9, and 10) 241
where the image difference is evaluated at every pixel is just for 242
the illustration purpose. 243
D. Discussion 244
It should be noted that though we build the orientation map 245
by using the orientation of the line segment with the maximum 246
variation, the orientation map can be built by the orientation of 247
the line segment with the minimum variation with little effect 248
on the OD detection performance. In addition, either the binary 249
orientation map or the gray orientation map can be used to 250
build the peak images with little effect on the OD detection 251
performance either. 252
Furthermore, the proposed line operator can be extended to 253
locate the macula with little adaptation. With the determined 254
peak image and the difference image, another score image can 255
be similarly determined as follows: 256
S(x, y) = P (x, y) · (−Diff(x, y) ∗ (Diff(x, y) < 0)) (10)
where (Diff(x, y) < 0) sets all image pixels with a positive dif- 257
ference to zero and (−Diff(x, y)) reverses the value of image 258
pixels having a negative difference. The macula can accord- 259
ingly be located by the peak within the macula category that 260
has the maximum score. For the retinal image in Fig. 1(a), 261
Fig. 7(b) shows the score image determined by (10). As shown 262
in Fig. 7(b), the peak with the maximum score is exactly located 263
at the macula center. 264

IEEE
Proo
f
LU AND LIM: AUTOMATIC OPTIC DISC DETECTION FROM RETINAL IMAGES BY A LINE OPERATOR 5
Fig. 8. OD detection accuracy of the proposed technique in relation to the linelength p and the convolution mask size m.
III. EXPERIMENTAL RESULTS265
This section presents experimental results. Four public266
datasets used are first described. The performance of the de-267
signed line operator is then described and discussed.268
A. Data Description269
We evaluate our proposed technique by using four public270
datasets. In particular, the first two datasets are DIARETDB0271
[26] and DIARETDB1 [27], which are composed of 130 and 89272
retinal images and created for benchmarking diabetic retinopa-273
thy detection. The third dataset is DRIVE project’s dataset [28]274
that is composed of 40 retinal images and created for bench-275
marking retinal blood vessel extraction. The last one is STARE276
project’s dataset [16], which is composed of 50 images of patho-277
logical retina and 31 images of healthy retina. It is created for278
benchmarking OD detection and is much more challenging com-279
pared with the other three datasets.280
B. OD Localization Results281
For each retinal image within the four datasets, we first manu-282
ally label 10–30 OD boundary pixels and then fit an OD bound-283
ary ellipse. The OD is deemed as located correctly, if the detected284
OD lies within the fitted boundary ellipse.285
Fig. 8 shows the average OD detection accuracy of the four286
public datasets. As shown in Fig. 8, the average OD detection287
accuracy varies within a small range when p and m change288
within a specific range (i.e., from R/10 to R/5), and a top av-289
erage accuracy 97.4% (331 out of 340) is achieved when p and290
m are set at R/8. In addition, the top accuracies of the four291
datasets reach up to 99.2%, 98.9%, 97.5%, and 96.3%, respec-292
tively, when p and m vary between R/10 and R/5. In particular,293
most failed retinal images are among the 50 images of patho-294
logical retinas within STARE project’s dataset, many of which295
are severely degraded by different retinal lesion and imaging ar-296
tifacts as shown in Figs. 9–11 and, therefore, do not have a clear297
OD-specific circular brightness structure. Furthermore, the OD298
detection accuracy drops when p and m become too large or too299
small. The accuracy drop can be explained by the fact that bothQ3 300
p and m are set based on OD size which usually varies within a 301
specific range. 302
Figs. 9 and 10 illustrate the OD detection results under the 303
presence of retinal lesion and imaging artifacts. In particular, 304
the three rows in the two figures show the test retinal images 305
(detected OD is labeled by “+”), the derived orientation maps, 306
and the final score images, respectively. As shown in Figs. 9 and 307
10, the line operator is able to detect the OD under the presence 308
of retinal lesion, such as drusen (in the fifth image in Fig. 9), 309
exudates (in the second and fourth images in Fig. 9), microa- 310
neurysms (in the fifth image in Fig. 10), papillary swelling (in 311
the first image in Fig. 10), and hemorrhage (in the first image 312
in Fig. 9), and imaging artifacts, such as haze (in the 2nd im- 313
age in Fig. 10) and uneven illumination (in the third and fourth 314
images in Fig. 10), that often produce regions with higher im- 315
age brightness or image variation than the OD. Such results are 316
due to the line operator that is specially designed to capture the 317
OD-specific circular brightness structure. 318
Table I compares the accuracies of the proposed technique 319
and some earlier reported methods based on STARE project’s 320
dataset. As shown in Table I, the proposed technique signif- 321
icantly outperforms the image-characteristics-based methods 322
[11], [13] that cannot handle various types of imaging artifacts 323
and retinal lesion properly. In addition, the accuracy of our pro- 324
posed technique is close to that of the methods [15]–[18] that 325
rely on the retinal blood vessels. As a comparison, the proposed 326
technique requires no retinal blood vessels. In fact, all failed 327
retinal images reported in [15] and [17] (i.e., the fourth image in 328
Fig. 9 and the first and fourth images in Fig. 10) can be correctly 329
detected by the proposed line operator. 330
It should be noted that we only compare on STARE project’s 331
dataset because STARE project’s dataset contains up to 50 im- 332
ages of pathological retinas and is widely used for benchmarking 333
in the literature. Besides, many OD detection methods, includ- 334
ing those based on the retinal blood vessels and our proposed 335
method in this paper, are capable of detecting the OD from nor- 336
mal retinal images properly. In fact, all failed retinal images in 337
STARE project’s dataset (by our proposed method) are from the 338
50 images of pathological retinas, and the remaining 31 normal 339
ones are all correctly detected. 340
C. Discussion 341
The designed line operator can be used for macula detection 342
as described in Section II. We test the macula detection based 343
on four subdatasets including 114, 85, 35, and 39 retinal im- 344
ages that are selected from the four public datasets. The use of 345
four subdatasets is because of many retinal images in the four 346
datasets, such as the third and fourth images in Fig. 9 and the 347
first image in Fig. 10, do not have a discernible macula. Exper- 348
iments over the four subdatasets show that an average macula 349
detection accuracy of 98.2% is achieved. 350
In addition, it takes around 40 s for our system to process a 351
retinal image of original size (around 700 × 600 pixels). The 352
detection speed could be improved significantly through code 353
optimization and implementation in C. In addition, the designed 354
line operator is robust against lower image resolution. We have 355
IEEE
Proo
f
6 IEEE TRANSACTIONS ON BIOMEDICAL ENGINEERING, VOL. 00, NO. 00, 2010
Fig. 9. OD detection examples: The first row shows five retinal images within the four datasets that suffer from various types of imaging artifacts and retinallesion (detected OD is labeled by “+”). The second and third rows show the corresponding binary orientation maps (p = R/7) and the score images, respectively.
Fig. 10. OD detection example. The first row shows five retinal images within the four datasets that suffer from different types of retinal lesion and imagingartifacts (detected OD is labeled by “+”). The second and third show the corresponding binary orientation maps (p = R/7) and the score images, respectively.
tested our system on half-sized retinal images (both p and m are356
half-sized accordingly) within the four public datasets. Experi-357
ments show that the optimal OD detection accuracy still reaches358
up to 95.9%, but the detection speed is improved tremendously359
by up to 12 times faster than that of retinal images of original360
size.361
Finally, the proposed technique still has several limitations.362
First, the proposed line operator is designed based on the as-363
sumption that the OD is more or less brighter than the sur-364
rounding retinal pixels and, therefore, cannot handle a very365
small number of retinal images whose OD is even darker than366
the surrounding pixels. Second, the proposed technique can-367
not handle the retinal images that do not have a clear circular368
TABLE ICOMPARISON OF THE OD DETECTION METHODS ON STARE PROJECT’S
DATASET (THE ACCURACIES OF SINTHANAYOTHINA et al. [13] AND WALTER
AND KLEIN [11] ARE BOTH TAKEN FROM HAAR [18])
brightness structure around their OD. Third, the performance of 369
the proposed technique should be improved further through the 370
incorporation of the anatomical relation between the OD and 371

IEEE
Proo
f
LU AND LIM: AUTOMATIC OPTIC DISC DETECTION FROM RETINAL IMAGES BY A LINE OPERATOR 7
the macula, since the designed line operator is able to locate the372
macula with little adaptation. We will study these three issues373
in our future works.374
D. Conclusion375
This paper presents an automatic OD detection technique.376
A line operator is designed, which locates the OD through the377
detection of the OD-specific circular brightness structure. Com-378
pared with the reported techniques, the proposed technique re-379
quires neither the retinal blood vessel nor the macula. At the380
same time, it is tolerant to different types of retinal lesion and381
imaging artifacts. Experiments over four public datasets show382
that an accuracy of 97.4% is obtained.383
REFERENCES384
[1] K. Akita and H. Kuga, “A computer method of understanding ocular385fundus images,” Pattern Recognit., vol. 15, no. 6, pp. 431–443, 1982.386
[2] N. Patton, T. M. Aslam, T. MacGillivary, I. J. Deary, B. Dhillon, R.387H. Eikelboom, K. Yogesan, and I. J. Constable, “Retinal image analysis:388Concepts, applications and potential,” Prog. Retin. Eye Res., vol. 25,389no. 1, pp. 99–127, 2006.390
[3] T. Walter, J. C. Klein, P. Massin, and A. Erginay, “A Contribution of391Image Processing to the Diagnosis of Diabetic Retinopathy-Detection of392Exudates in Color Fundus Images of the Human Retina,” IEEE Trans.393Med. Imag., vol. 21, no. 10, pp. 1236–1243, Oct. 2002.394
[4] R. Chrastek, M. Wolf, K. Donath, H. Niemann, D. Paulus, T. Hothorn,395B. Lausen, R. Lammer, C. Y. Mardin, and G. Michelson, “Automated396segmentation of the optic nerve head for diagnosis of glaucoma,” Med.397Image Anal., vol. 9, no. 4, pp. 297–314, 2005.398
[5] A. D. Fleming, K. A. Goatman, S. Philip, J. A. Olson, and P. F. Sharp,399“Automatic detection of retinal anatomy to assist diabetic retinopathy400screening,” Phys. Med. Biol., vol. 52, no. 2, pp. 331–345, 2007.401
[6] A. Pinz, S. Bernogger, P. Datlinger, and A. Kruger, “Mapping the Human402Retina,” IEEE Trans. Med. Imag., vol. 17, no. 4, pp. 606–619, Aug. 1998.403
[7] K. W. Tobin, E. Chaum, V. P. Govindasamy, and T. P. Karnowski, “Detec-404tion of anatomic structures in human retinal imagery,” IEEE Trans. Med.405Imag., vol. 26, no. 12, pp. 1729–1739, Dec. 2007.406
[8] M. Niemeijer, M. D. Abramoff, and B. V. Ginneken, “Segmentation of407the optic disc, macula and vascular arch in fundus photographs,” IEEE408Trans. Med. Imag., vol. 26, no. 1, pp. 116–127, Jan. 2007.409
[9] W. Hsu, P. M. D. S. Pallawala, M. L. Lee, and K. A. Eong, “The Role of410Domain Knowledge in the Detection of Retinal Hard Exudates,” in Proc.411Int. Conf. Comp. Vis. Pattern Recognit., vol. 2, 2001, pp. 246–251.412
[10] Z. B. Sbeh, L. D. Cohen, G. Mimoun, and G. Coscas, “A new approach of413geodesic reconstruction for drusen segmentation in eye fundus images,”414IEEE Trans. Med. Imag., vol. 20, no. 12, pp. 1321–1333, Dec. 2002.415
[11] T. Walter and J. C. Klein, “Segmentation of color fundus images of the416human retina: Detection of the optic disc and the vascular tree using417morphological techniques,” in Proc. Int. Symp. Med. Data Anal., 2001,418pp. 282–287.419
[12] H. Li and O. Chutatape, “Automatic location of optic disc in retinal im-420ages,” in Proc. Int. Conf. Image, vol. 2, pp. 837–840, 2001.421
[13] C. Sinthanayothina, J. F. Boycea, H. L. Cookb, and T. H. Williamsonb,422“Automated localisation of the optic disc, fovea, and retinal blood vessels423from digital colour fundus images,” Br. J. Ophthalmol., vol. 83, pp. 902–424910, 1999.425
[14] S. Sekhar, W. Al-Nuaimy, and A. K. Nandi, “Automated localisation of426retinal optic disk using Hough transform,” in Proc. Int. Symp. Biomed.427Imag.: Nano Macro, 2008, pp. 1577–1580.428
[15] A. Youssif, A. Z. Ghalwash, and A. Ghoneim, “Optic disc detection from429normalized digital fundus images by means of a vessels’ direction matched430filter,” IEEE Trans. Med. Imag., vol. 27, no. 1, pp. 11–18, Jan. 2008.431
[16] A. Hoover and M. Goldbaum, “Locating the optic nerve in a netinal image432using the fuzzy convergence of the blood vessels,” IEEE Trans. Med.433Imag., vol. 22, no. 8, pp. 951–958, Aug. 2003.434
[17] M. Foracchia, E. Grisan, and A. Ruggeri, “Detection of optic disc in retinal435images by means of a geometrical model of vessel structure,” IEEE Trans.436Med. Imag., vol. 23, no. 10, pp. 1189–1195, Oct. 2004.437
[18] F. Haar, “Automatic localization of the optic disc in digital colour im- 438ages of the human retina,” M.S. thesis, Utrecht University, Utrecht, The 439Netherlands, 2005. 440
[19] H. Li and O. Chutatape, “Automated feature extraction in color retinal 441images by a model based approach,” IEEE Trans. Biomed. Eng., vol. 51, 442no. 2, pp. 246–254, Feb. 2004. 443
[20] A. P. Rovira and E. Trucco, “Robust optic disc location via combination 444of weak detectors,” in Proc. Int. Conf. IEEE Eng. Med. Bio. Soc., 2008, 445pp. 3542–3545. 446
[21] R. Zwiggelaar, S. M. Astley, C. R. M. Boggis, and C. J. Taylor, “Linear 447structures in mammographic images: Detection and classification,” IEEE 448Trans. Med. Imag., vol. 23, no. 9, pp. 1077–1086, Sep. 2004. 449
[22] E. Ricci and R. Perfetti, “Retinal blood vessel segmentation using line 450operators and support vector classification,” IEEE Trans. Med. Imag., 451vol. 26, no. 10, pp. 1357–1365, Oct. 2007. 452
[23] A. Osareh, M. Mirmehdi, B. Thomas, and R. Markham, “Comparison of 453colour spaces for optic disc localisation in retinal images,” in Proc. Int. 454Conf. Pattern Recognit., vol. 1, 2002, pp. 743–746. 455
[24] C. Tomasi and R. Manduchi, “Bilateral Filtering for Gray and Color 456Images,” in Proc. IEEE Int. Conf. Comp. Vis., 1998, pp. 839–846. 457
[25] W. Tasman and E. A. Jaeger, Duane’s Ophthalmology, 15th ed. 458Baltimore, MD: Lippincott Williams & Wilkins, 2009. 459
[26] T. Kauppi, V. Kalesnykiene, J. K. Kamarainen, L. Lensu, I. Sorri, H. 460Uusitalo, H. Kalviainen, and J. Pietila, “DIARETDB0: Evaluation 461database and methodology for diabetic retinopathy algorithms,” Tech. 462Rep., Lappeenranta Univ. Technol., Lappeenranta, Finland, 2006. 463
[27] T. Kauppi, V. Kalesnykiene, J. K. Kamarainen, L. Lensu, I. Sorri, H. 464Uusitalo, H. Klviinen, and J. Pietil, “DIARETDB1 diabetic retinopathy 465database and evaluation protocol,” Tech. Rep., Lappeenranta Univ. Tech- 466nol., Lappeenranta, Finland, 2007. 467
[28] J. J. Staal, M. D. Abramoff, M. Niemeijer, M. A. Viergever, and B. V. 468Ginneken, “Ridge based vessel segmentation in color images of the retina,” 469IEEE Trans. Med. Imag., vol. 23, no. 4, pp. 501–509, Apr. 2004. 470
Shijian Lu (M’xx) received the Ph.D. degree in elec- 471trical and computer engineering from National Uni- 472versity of Singapore, Singapore, in 2005. Q4473
He is currently a Senior Research Fellow 474at the Institute for Infocomm Research, Agency 475for Science, Technology and Research (A*STAR), 476Singapore. His research interests include document 477image analysis and medical image analysis. He has 478authored or coauthored more than 40 peer-reviewed 479journal and conference papers. Dr. Lu is a member 480of International Association of Pattern Recognition 481
(IAPR). 482483
Joo Hwee Lim (M’xx) received the B.Sc. and M.Sc. Q5484degrees in computer science from the National Uni- 485versity of Singapore, Singapore, and the Ph.D. degree 486in computer science & engineering from the Univer- 487sity of New South Wales, Sydney, Australia. 488
Since October 1990, he has been with the 489Institute for Infocomm Research (I2R), Agency 490for Science, Technology and Research (A*STAR), 491Singapore, where he is currently the Head of the 492Computer Vision and Image Understanding Depart- 493ment. He is also an Adjunct Associate Professor at 494
the School of Computer Engineering, Nanyang Technological University, Sin- 495gapore. He is also the Co-Director of Image and Pervasive Access Laboratory 496(IPAL), a French–Singapore Joint Lab (UMI 2955) for the tenure January 2007 497to December 2010, and the Director (Imaging) of a new joint lab (SAILOR) 498between I2R and Singapore Eye Research Institute for the tenure June 2009 499to June 2012, where computer scientists and clinicians collaborate closely. He 500has authored or coauthored more than 170 international refereed journal and 501conference papers. He has also coauthored 16 patents (awarded and pend- 502ing). His research interests include connectionist expert systems, neural-fuzzy 503systems, handwritten character recognition, multiagent systems, content-based 504image/video retrieval, scene/object recognition, medical image analysis. Q6505
Dr. Lim was bestowed the title of “Chevallet dans l’ordre des Palmes 506Academiques” by the French Government in 2008. 507
508

IEEE
Proo
f
QUERIES509
Q1: Author: Please spell out “DRIVE” and STARE in full, if possible.510
Q2. Author: There is discrepancy in the terms “c(ξ;x)” and “s(f(ξ), f(x))” between display equation and text. Please check and511
confirm.512
Q3. Author: The citation for Fig. 11 has been provided in text. However, there are only ten figures in the manuscript. Please check513
and confirm.514
Q4. Author: Please provide the year information in which S. Lu became a Member of IEEE.515
Q5. Author: Please provide the year information in which J. H. Lim became a Member of IEEE.516
Q6. Author: Please spell out “UMI” and “SAILOR” in full, if possible.517