
Automatic detection of vascular bifurcations in segmented retinal images using trainable COSFIRE...
12
Automatic detection of vascular bifurcations in segmented retinal images using trainable COSFIRE filters George Azzopardi ⇑ , Nicolai Petkov Johann Bernoulli Institute for Mathematics and Computer Science, University of Groningen, The Netherlands article info Article history: Available online 23 November 2012 Keywords: Gabor filters Keypoint detection Retinal fundus Trainable filters Vascular bifurcation abstract Background: The vascular tree observed in a retinal fundus image can provide clues for cardiovascular dis- eases. Its analysis requires the identification of vessel bifurcations and crossovers. Methods: We use a set of trainable keypoint detectors that we call Combination Of Shifted FIlter REsponses or COSFIRE filters to automatically detect vascular bifurcations in segmented retinal images. We configure a set of COSFIRE filters that are selective for a number of prototype bifurcations and dem- onstrate that such filters can be effectively used to detect bifurcations that are similar to the prototypical ones. The automatic configuration of such a filter selects given channels of a bank of Gabor filters and determines certain blur and shift parameters. The response of a COSFIRE filter is computed as the weighted geometric mean of the blurred and shifted responses of the selected Gabor filters. The COSFIRE approach is inspired by the function of a specific type of shape-selective neuron in area V4 of visual cor- tex. Results: We ran experiments on three data sets and achieved the following results: (a) a recall of 97.88% at precision of 96.94% on 40 manually segmented images provided in the DRIVE data set, (b) a recall of 97.32% at precision of 96.04% on 20 manually segmented images provided in the STARE data set, and (c) a recall of 97.02% at precision of 96.53% on a set of 10 automatically segmented images obtained from images in the DRIVE data set. Conclusions: The COSFIRE filters that we use are conceptually simple and easy to implement: the filter output is computed as the weighted geometric mean of blurred and shifted Gabor filter responses. They are versatile keypoint detectors as they can be configured with any given local contour pattern and are subsequently able to detect the same and similar patterns. Ó 2012 Elsevier B.V. All rights reserved. 1. Introduction Retinal fundus images provide a unique possibility to take a non-invasive look at the eye and the systemic status of the human body. Besides ocular diseases, such as age-related macular degen- eration and glaucoma that are two of the leading causes of blind- ness, other systemic diseases are also manifested in the retina. Complications of such diseases include diabetic retinopathy from diabetes mellitus (Frank, 2004), hypertension (Tso and Jampol, 1982) and atherosclerosis from cardiovascular disease (Chapman et al., 2002), as well as brain diseases and neuropathies, such as multiple sclerosis (Parisi et al., 1999) and Huntington’s disease (Paulus et al., 1993). The retina can thus be considered as a mirror of the health status of a person. Here we focus on retinal image analysis for the diagnosis of car- diovascular diseases, while for a comprehensive review on retinal image analysis we refer to Abramoff et al. (2010). The vascular geometrical structure in the retina is known to conform to struc- tural principles that are related to certain physical properties (Zamir et al., 1979; Sherman, 1981). For instance, the studies of Murray (1926a,b) revealed that the most efficient blood circulation is achieved when the blood flow is proportional to the cubed power of the vessel’s radius; this is known as Murray’s law. The branching angle between the two child vessels is also important to optimize the efficiency of the entire vascular network (Zamir et al., 1992). The analysis of the geometrical structure of the vessel tree is thus important as deviations from the optimal principles may indi- cate (increased risk of) signs for vascular pathology; a thorough re- view is given by Patton et al. (2006). The detection of junctions in the vessel tree of a retinal fundus image, commonly referred to as vascular bifurcations and crossovers, is one of the basic steps in this analysis, and it is typically carried out in a time-consuming manual procedure (Chapman et al., 2002). The automation of such a tedious process is thus important to improve the efficiency and to avoid inaccuracies due to human fatigue. 0167-8655/$ - see front matter Ó 2012 Elsevier B.V. All rights reserved. http://dx.doi.org/10.1016/j.patrec.2012.11.002 ⇑ Corresponding author. E-mail address: [email protected] (G. Azzopardi). Pattern Recognition Letters 34 (2013) 922–933 Contents lists available at SciVerse ScienceDirect Pattern Recognition Letters journal homepage: www.elsevier.com/locate/patrec
Transcript of Automatic detection of vascular bifurcations in segmented retinal images using trainable COSFIRE...
Pattern Recognition Letters 34 (2013) 922–933
Contents lists available at SciVerse ScienceDirect
Pattern Recognition Letters
journal homepage: www.elsevier .com/locate /patrec
Automatic detection of vascular bifurcations in segmented retinal images usingtrainable COSFIRE filters
George Azzopardi ⇑, Nicolai PetkovJohann Bernoulli Institute for Mathematics and Computer Science, University of Groningen, The Netherlands
a r t i c l e i n f o a b s t r a c t
Article history:Available online 23 November 2012
Keywords:Gabor filtersKeypoint detectionRetinal fundusTrainable filtersVascular bifurcation
0167-8655/$ - see front matter � 2012 Elsevier B.V. Ahttp://dx.doi.org/10.1016/j.patrec.2012.11.002
⇑ Corresponding author.E-mail address: [email protected] (G. Azzopardi)
Background: The vascular tree observed in a retinal fundus image can provide clues for cardiovascular dis-eases. Its analysis requires the identification of vessel bifurcations and crossovers.
Methods: We use a set of trainable keypoint detectors that we call Combination Of Shifted FIlterREsponses or COSFIRE filters to automatically detect vascular bifurcations in segmented retinal images.We configure a set of COSFIRE filters that are selective for a number of prototype bifurcations and dem-onstrate that such filters can be effectively used to detect bifurcations that are similar to the prototypicalones. The automatic configuration of such a filter selects given channels of a bank of Gabor filters anddetermines certain blur and shift parameters. The response of a COSFIRE filter is computed as theweighted geometric mean of the blurred and shifted responses of the selected Gabor filters. The COSFIREapproach is inspired by the function of a specific type of shape-selective neuron in area V4 of visual cor-tex.
Results: We ran experiments on three data sets and achieved the following results: (a) a recall of 97.88%at precision of 96.94% on 40 manually segmented images provided in the DRIVE data set, (b) a recall of97.32% at precision of 96.04% on 20 manually segmented images provided in the STARE data set, and (c) arecall of 97.02% at precision of 96.53% on a set of 10 automatically segmented images obtained fromimages in the DRIVE data set.
Conclusions: The COSFIRE filters that we use are conceptually simple and easy to implement: the filteroutput is computed as the weighted geometric mean of blurred and shifted Gabor filter responses. Theyare versatile keypoint detectors as they can be configured with any given local contour pattern and aresubsequently able to detect the same and similar patterns.
� 2012 Elsevier B.V. All rights reserved.
1. Introduction
Retinal fundus images provide a unique possibility to take anon-invasive look at the eye and the systemic status of the humanbody. Besides ocular diseases, such as age-related macular degen-eration and glaucoma that are two of the leading causes of blind-ness, other systemic diseases are also manifested in the retina.Complications of such diseases include diabetic retinopathy fromdiabetes mellitus (Frank, 2004), hypertension (Tso and Jampol,1982) and atherosclerosis from cardiovascular disease (Chapmanet al., 2002), as well as brain diseases and neuropathies, such asmultiple sclerosis (Parisi et al., 1999) and Huntington’s disease(Paulus et al., 1993). The retina can thus be considered as a mirrorof the health status of a person.
Here we focus on retinal image analysis for the diagnosis of car-diovascular diseases, while for a comprehensive review on retinal
ll rights reserved.
.
image analysis we refer to Abramoff et al. (2010). The vasculargeometrical structure in the retina is known to conform to struc-tural principles that are related to certain physical properties(Zamir et al., 1979; Sherman, 1981). For instance, the studies ofMurray (1926a,b) revealed that the most efficient blood circulationis achieved when the blood flow is proportional to the cubedpower of the vessel’s radius; this is known as Murray’s law. Thebranching angle between the two child vessels is also importantto optimize the efficiency of the entire vascular network (Zamiret al., 1992).
The analysis of the geometrical structure of the vessel tree isthus important as deviations from the optimal principles may indi-cate (increased risk of) signs for vascular pathology; a thorough re-view is given by Patton et al. (2006). The detection of junctions inthe vessel tree of a retinal fundus image, commonly referred to asvascular bifurcations and crossovers, is one of the basic steps inthis analysis, and it is typically carried out in a time-consumingmanual procedure (Chapman et al., 2002). The automation of sucha tedious process is thus important to improve the efficiency and toavoid inaccuracies due to human fatigue.
1 The image used in this example is named 40_manual1.gif in the DRIVE data set(Staal et al., 2004).
G. Azzopardi, N. Petkov / Pattern Recognition Letters 34 (2013) 922–933 923
The existing attempts to automate the detection of retinal vas-cular bifurcations can be categorized into two classes; geometrical-feature based and model based approaches. The former methodsare highly dependent on the segmentation and skeletonizationtechniques. They also involve extensive local pixel processingand branch point analysis (Martinez-Perez et al., 2002; Chanwim-aluang and Guoliang, 2003; Eunhwa and Kyungho, 2006; Bhuiyanet al., 2007; Ardizzone et al., 2008; Aibinu et al., 2010; Calvoet al., 2011). Incomplete bifurcations, which are commonly pro-duced by automatic segmentation techniques, are generally notdetected by such skeleton based approaches. On the other hand,model-based approaches are usually more adaptive and have smal-ler computational complexity that makes them more appropriatefor real-time applications (Ali et al., 1999; Shen et al., 2001; Tsaiet al., 2004). However, model based approaches suffer from insuf-ficient generalization ability as they are usually unable to model allthe features of interest. Consequently, these methods may fail todetect atypical bifurcations.
Besides the diagnosis of pathologies, retinal fundus images havealso been used for person verification as the geometrical arrange-ment of the vascular bifurcations is an effective biometric(Bevilacqua et al., 2009; Ortega et al., 2009). Moreover, vascularbifurcations may also be used as key features to find correspon-dences between the retinal images of the same eye taken fromdifferent views, i.e. for registration of retinal images (Beckeret al., 1998; Shen et al., 2003; Tsai et al., 2004; Chen et al., 2011).
We use the COSFIRE (Combination Of Shifted FIlter REsponses)filters, which we have introduced elsewhere (Azzopardi et al.,2012a), for the detection of bifurcations in segmented retinalimages. COSFIRE filters are trainable keypoint detection operators,which are selective for given local patterns that consist of combi-nations of contour segments. These operators are inspired by theproperties of some neurons in area V4 of visual cortex, which areselective for parts of (curved) contours or for combinations of linesegments (Pasupathy and Connor, 1999, 2002). In this work we fo-cus on one application and provide more elaborate experiments todemonstrate the robustness and generalization capability of theCOSFIRE filters.
The response of a COSFIRE filter in a given point is computed as afunction of the shifted responses of simpler filters. Using shifted re-sponses of simpler filters – Gabor filters in the concerned application– corresponds to combining their respective supports at differentlocations to obtain a more sophisticated filter with a bigger support.The specific function that we use here to combine the responses ofsimpler filters is weighted geometric mean, essentially multiplica-tion, which has specific advantages regarding shape recognition.
Two-dimensional (2D) Gabor filters (Daugman et al., 1985) thatwe use as input to our COSFIRE filters have been extensively usedto detect oriented structures (lines and/or edges) in many com-puter vision applications, including retinal image analysis. For in-stance, these filters have been found effective in detecting signsof glaucoma (Bodis-Wollner and Brannan, 1997; Sun et al., 2006;Muramatsu et al., 2009) detecting the optic nerve head of the ret-ina (Rangayyan et al., 2010), and mostly for the segmentation ofthe vessel tree in retinal fundus images (Soares et al., 2006; Li,2006; Usman Akram et al., 2009; Moin et al., 2010; Xiaojun Duet al., 2010; Yavuz et al., 2010, 2011; Fraz et al., 2011; Selvathiet al., 2011). Apart from Gabor filters, other state-of-the-art meth-ods have also been found effective for the segmentation of the ves-sel tree (Chauduri et al., 1989; Jiang and Mojon, 2003; Staal et al.,2004; Niemeijer et al., 2004; Mendonca and Campilho, 2006; Ricciand Perfetti, 2007).
The rest of the paper is organized as follows: In Section 2 wepresent our method and demonstrate how it can be used to detectretinal vessel features. In Section 3, we evaluate the effectivenessof the COSFIRE filters on manually and automatically segmented
retinal images from the DRIVE and STARE data sets. In Section 4we provide a discussion of some aspects of our approach and final-ly we draw conclusions in Section 5.
2. Method
A COSFIRE filter for the detection of local combinations of linesis conceptually simple and straightforward to implement: it re-quires the application of selected Gabor filters, blurring of theirresponses, shifting the blurred responses by specific, differentvectors, and multiplying the shifted responses. The questions ofwhich Gabor filters to use, how much to blur them and how farto shift them are answered in a filter configuration process inwhich a local pattern of interest that defines a keypoint is automat-ically analyzed. The configured COSFIRE filter can then detect thesame and similar patterns.
2.1. Overview
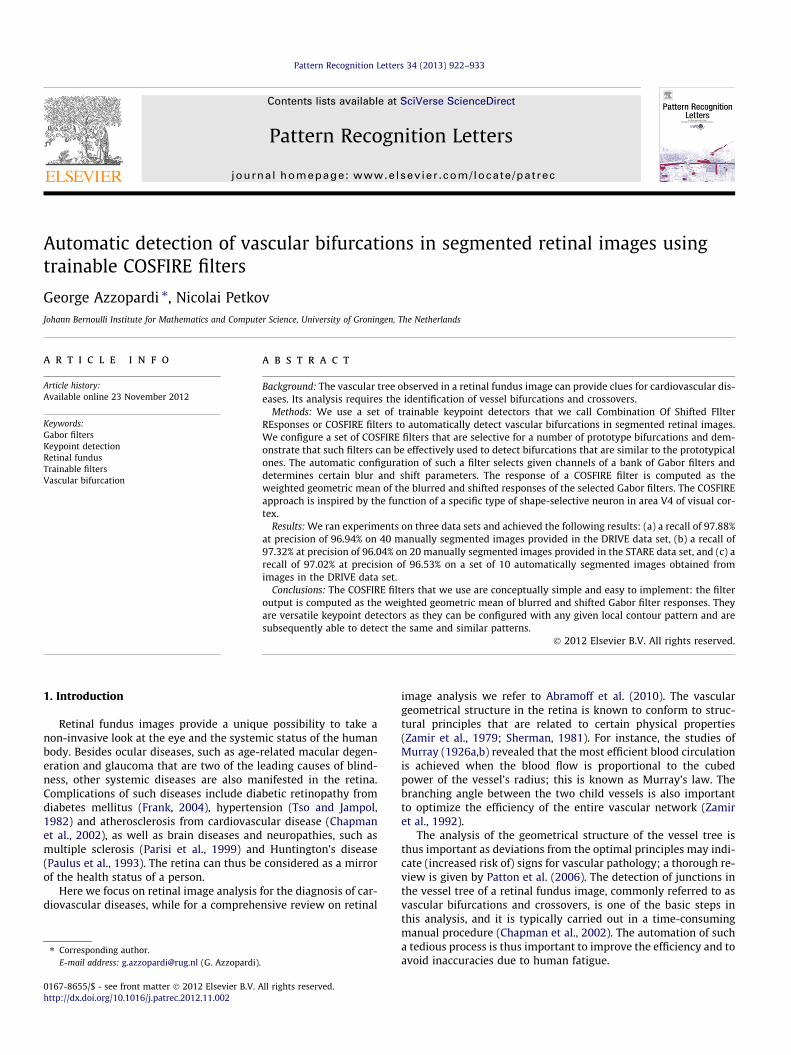
In Fig. 1a we illustrate a typical vascular bifurcation encircled ina segmented retinal fundus image.1 We use this feature as a proto-type bifurcation, which is shown enlarged in Fig. 1b, to automaticallyconfigure a COSFIRE filter that will respond to the same and similarbifurcations.
The three ellipses shown in Fig. 1b represent the dominant ori-entations in the neighborhood of the specified point of interest. Wedetect such orientations by Gabor filters. The central circle repre-sents the overlapping support of a group of such filters. Theresponse of a COSFIRE filter is computed by combining theresponses of the concerned Gabor filters by a weighted geometricmean. The preferred orientations of these filters and the locationsat which we take their responses are determined by automaticallyanalyzing the local prototype pattern used for the configuration ofthe concerned COSFIRE filter. Consequently, the COSFIRE filter isselective for the presented local spatial arrangement of lines ofspecific orientations and widths. Taking the responses of Gabor fil-ters at different locations around a point can be implemented byshifting the responses of these Gabor filters by different vectors be-fore using them for the pixel-wise evaluation of a function whichgives the COSFIRE filter output.
Such a design is inspired by electrophysiological evidence thatsome neurons in area V4 of visual cortex are selective for moder-ately complex stimuli, such as curvatures, that receive inputs froma group of orientation-selective cells in areas V1 and V2 (Pasupathyand Connor, 1999, 2001, 2002). Moreover, in a psychophysicalexperiment, Gheorghiu and Kingdom, 2009 show that curved con-tour parts are likely detected by a nonlinear operation that com-bines the responses of afferent orientation-selective filters bymultiplication. Since a COSFIRE filter makes use of such multiplica-tion, it produces a response only when all its afferent inputs fromGabor filters are stimulated; i.e. all constituent parts (in this caselines) of a vascular bifurcation are present.
In the following sections we explain the automatic configura-tion process of a COSFIRE filter that will be selective for the proto-type bifurcation shown in Fig. 1b. The configuration processdetermines which responses of which Gabor filters in which loca-tions need to be combined in order to obtain the output of the filter.
2.2. Detection of dominant orientations by 2D Gabor filters
We build the COSFIRE filter using as input the responses of 2DGabor filters, which are known to serve as line and edge detectors.
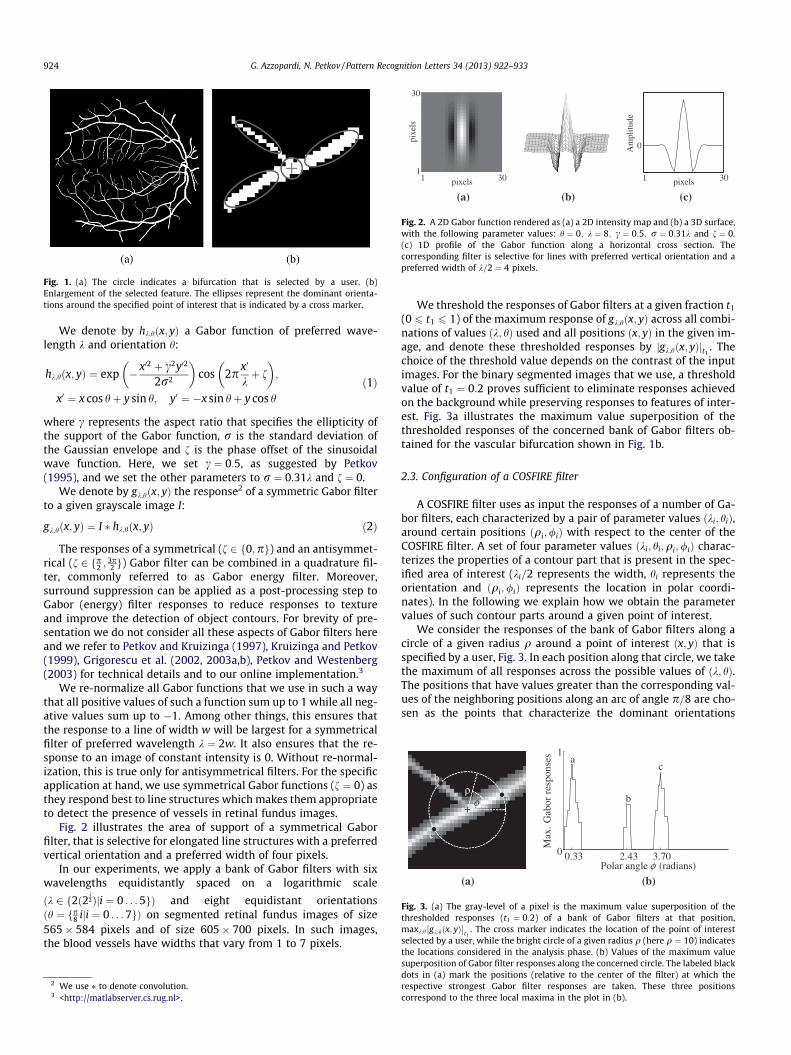
Fig. 1. (a) The circle indicates a bifurcation that is selected by a user. (b)Enlargement of the selected feature. The ellipses represent the dominant orienta-tions around the specified point of interest that is indicated by a cross marker.
1 301
30
pixels
pixels
0Amplitude
1 30pixels
(a) (b) (c)
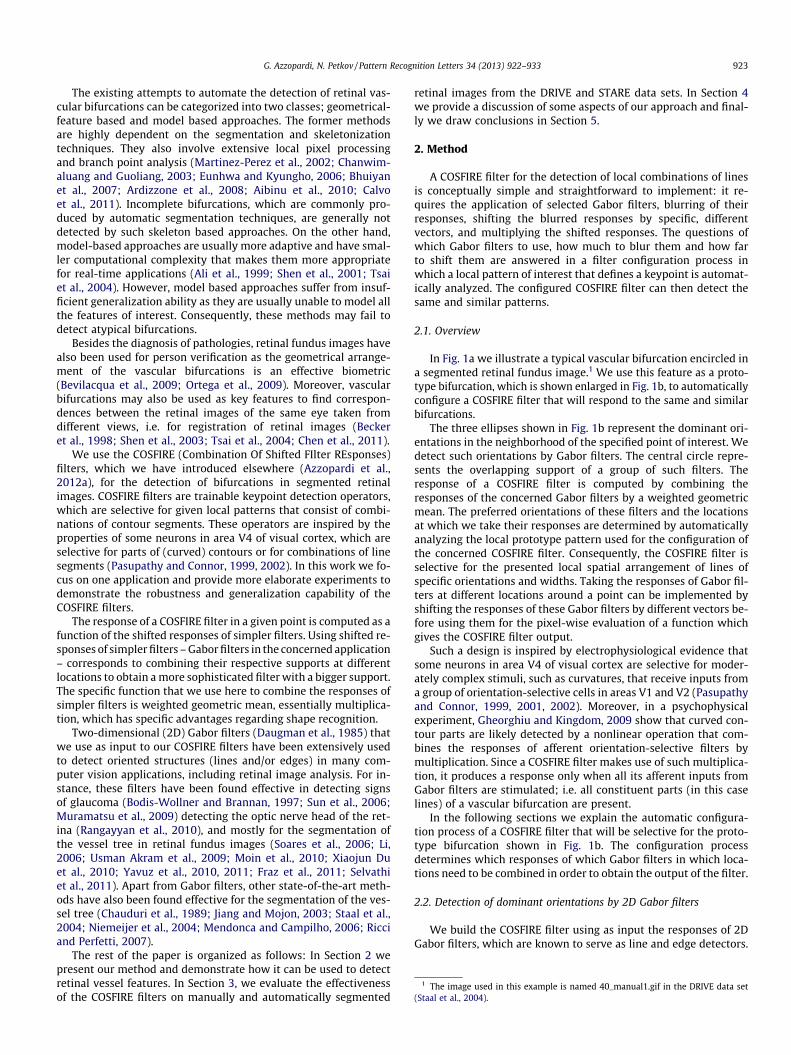
Fig. 2. A 2D Gabor function rendered as (a) a 2D intensity map and (b) a 3D surface,with the following parameter values: h ¼ 0; k ¼ 8; c ¼ 0:5; r ¼ 0:31k and f ¼ 0.(c) 1D profile of the Gabor function along a horizontal cross section. Thecorresponding filter is selective for lines with preferred vertical orientation and apreferred width of k=2 ¼ 4 pixels.
φρ
a
b
c
Max.Gaborresponses
0
1
0.33 2.43 3.70Polar angle φ (radians)
a
b
c
(b)(a)
Fig. 3. (a) The gray-level of a pixel is the maximum value superposition of thethresholded responses (t1 ¼ 0:2) of a bank of Gabor filters at that position,maxk;h gk;hðx; yÞ
�� ��t1
. The cross marker indicates the location of the point of interestselected by a user, while the bright circle of a given radius q (here q ¼ 10) indicates
924 G. Azzopardi, N. Petkov / Pattern Recognition Letters 34 (2013) 922–933
We denote by hk;hðx; yÞ a Gabor function of preferred wave-length k and orientation h:
hk;hðx; yÞ ¼ exp � x02 þ c2y02
2r2
� �cos 2p x0
kþ f
� �;
x0 ¼ x cos hþ y sin h; y0 ¼ �x sin hþ y cos h
ð1Þ
where c represents the aspect ratio that specifies the ellipticity ofthe support of the Gabor function, r is the standard deviation ofthe Gaussian envelope and f is the phase offset of the sinusoidalwave function. Here, we set c ¼ 0:5, as suggested by Petkov(1995), and we set the other parameters to r ¼ 0:31k and f ¼ 0.
We denote by gk;hðx; yÞ the response2 of a symmetric Gabor filterto a given grayscale image I:
gk;hðx; yÞ ¼ I � hk;hðx; yÞ ð2Þ
The responses of a symmetrical (f 2 f0;pg) and an antisymmet-rical (f 2 fp2 ; 3p
2 g) Gabor filter can be combined in a quadrature fil-ter, commonly referred to as Gabor energy filter. Moreover,surround suppression can be applied as a post-processing step toGabor (energy) filter responses to reduce responses to textureand improve the detection of object contours. For brevity of pre-sentation we do not consider all these aspects of Gabor filters hereand we refer to Petkov and Kruizinga (1997), Kruizinga and Petkov(1999), Grigorescu et al. (2002, 2003a,b), Petkov and Westenberg(2003) for technical details and to our online implementation.3
We re-normalize all Gabor functions that we use in such a waythat all positive values of such a function sum up to 1 while all neg-ative values sum up to �1. Among other things, this ensures thatthe response to a line of width w will be largest for a symmetricalfilter of preferred wavelength k ¼ 2w. It also ensures that the re-sponse to an image of constant intensity is 0. Without re-normal-ization, this is true only for antisymmetrical filters. For the specificapplication at hand, we use symmetrical Gabor functions (f ¼ 0) asthey respond best to line structures which makes them appropriateto detect the presence of vessels in retinal fundus images.
Fig. 2 illustrates the area of support of a symmetrical Gaborfilter, that is selective for elongated line structures with a preferredvertical orientation and a preferred width of four pixels.
In our experiments, we apply a bank of Gabor filters with sixwavelengths equidistantly spaced on a logarithmic scale
ðk 2 f2ð2i2Þji ¼ 0 . . . 5gÞ and eight equidistant orientations
ðh ¼ fp8 iji ¼ 0 . . . 7gÞ on segmented retinal fundus images of size565� 584 pixels and of size 605� 700 pixels. In such images,the blood vessels have widths that vary from 1 to 7 pixels.
2 We use ⁄ to denote convolution.3 <http://matlabserver.cs.rug.nl>.
We threshold the responses of Gabor filters at a given fraction t1
(0 6 t1 6 1) of the maximum response of gk;hðx; yÞ across all combi-nations of values ðk; hÞ used and all positions ðx; yÞ in the given im-age, and denote these thresholded responses by jgk;hðx; yÞjt1
. Thechoice of the threshold value depends on the contrast of the inputimages. For the binary segmented images that we use, a thresholdvalue of t1 ¼ 0:2 proves sufficient to eliminate responses achievedon the background while preserving responses to features of inter-est. Fig. 3a illustrates the maximum value superposition of thethresholded responses of the concerned bank of Gabor filters ob-tained for the vascular bifurcation shown in Fig. 1b.
2.3. Configuration of a COSFIRE filter
A COSFIRE filter uses as input the responses of a number of Ga-bor filters, each characterized by a pair of parameter values ðki; hiÞ,around certain positions ðqi;/iÞ with respect to the center of theCOSFIRE filter. A set of four parameter values ðki; hi;qi;/iÞ charac-terizes the properties of a contour part that is present in the spec-ified area of interest (ki=2 represents the width, hi represents theorientation and ðqi;/iÞ represents the location in polar coordi-nates). In the following we explain how we obtain the parametervalues of such contour parts around a given point of interest.
We consider the responses of the bank of Gabor filters along acircle of a given radius q around a point of interest ðx; yÞ that isspecified by a user, Fig. 3. In each position along that circle, we takethe maximum of all responses across the possible values of ðk; hÞ.The positions that have values greater than the corresponding val-ues of the neighboring positions along an arc of angle p=8 are cho-sen as the points that characterize the dominant orientations
the locations considered in the analysis phase. (b) Values of the maximum valuesuperposition of Gabor filter responses along the concerned circle. The labeled blackdots in (a) mark the positions (relative to the center of the filter) at which therespective strongest Gabor filter responses are taken. These three positionscorrespond to the three local maxima in the plot in (b).
G. Azzopardi, N. Petkov / Pattern Recognition Letters 34 (2013) 922–933 925
around the point of interest. We determine the polar coordinatesðqj;/jÞ for such point with respect to the center of the filter. Foreach such location ðqj;/jÞ, we then consider all combinations ofðk; hÞ for which the corresponding thresholded Gabor responsesjgk;hðxþ qj cos /j; yþ qj sin /jÞjt1
are greater than a fractiont2 ¼ 0:75 of the maximum of jgk;hðx0; y0Þjt1
across the different com-binations of values ðk; hÞ used and across all locations in the givenimage. The threshold parameter t2 implements a condition that theselected Gabor responses are significant and comparable to thestrongest possible response. For each value h that satisfies this con-dition, we consider a single value of k, the one for whichjgk;hðxþ qj cos /j; yþ qj sin /jÞjt1
is the maximum of all responsesacross all values of k. For each distinct pair of ðk; hÞ and locationðqj;/jÞ, we obtain a tuple ðki; hi;qi;/iÞ. Multiple tuples can thusbe formed for the same location ðqj;/jÞ.
We denote by Sf ¼ fðki; hi;qi;/iÞ j i ¼ 1 . . . nf g the set of parame-ter value combinations, where nf represents the number of contourparts which fulfill the above conditions. The subscript f stands forthe prototype bifurcation. Every tuple in the set Sf specifies theparameters of some contour part in f.
For the point of interest shown in Fig. 3a and two given valuesof the radius q (q 2 f0;10g), the selection method described aboveresults in the following set:
Sf ¼
ðk1 ¼ 8ffiffiffi2p
; h1 ¼ 5p=8;q1 ¼ 0;/1 ¼ 0Þ;ðk2 ¼ 4
ffiffiffi2p
; h2 ¼ 5p=8;q2 ¼ 10;/2 ¼ 0:3316Þ;ðk3 ¼ 4; h3 ¼ p=4;q3 ¼ 10;/3 ¼ 2:4260Þ;ðk4 ¼ 4; h4 ¼ 3p=8;q4 ¼ 10;/4 ¼ 2:4260Þðk5 ¼ 4
ffiffiffi2p
; h5 ¼ 5p=8;q5 ¼ 10;/5 ¼ 3:7001Þðk6 ¼ 4
ffiffiffi2p
; h6 ¼ 3p=4;q6 ¼ 10;/6 ¼ 3:7001Þ
8>>>>>>>>><>>>>>>>>>:
9>>>>>>>>>=>>>>>>>>>;
The second tuple in the above set Sf ; ðk2 ¼ 4ffiffiffi2p
;
h2 ¼ 5p=8; q2 ¼ 10; /2 ¼ 0:3316Þ, for instance, describes a con-tour part with a width of k2=2 ¼ 2.83 pixels and an orientation ofh2 ¼ 5p=8 that can be detected by a Gabor filter with preferredwavelength of k2 ¼ 4
ffiffiffi2p
pixels and preferred orientation of h2 ¼5p=8, at a position of q2 ¼ 10 pixels to the north east,/2 ¼ 0:3316, of the point of interest; this location is marked bythe label ‘a’ in Fig. 3. This selection is the result of the presenceof a diagonally oriented blood vessel to the north east from thecenter of the prototype bifurcation that is used for the configura-tion of the COSFIRE filter.
2.4. Blurring and shifting Gabor filter responses
The above analysis of the given prototype bifurcation f indicatesthat this pattern produces six strong responses gki ;hi
ðx; yÞ of Gaborfilters with parameters ðki; hiÞ in the corresponding positions withpolar coordinates ðqi;/iÞ with respect to the center of the COSFIREfilter. Next, we use these responses to compute the output of theCOSFIRE filter. Since the concerned responses are in different posi-tions ðqi;/iÞ with respect to the filter center, we first shift themappropriately so that they come together in the filter center. TheCOSFIRE filter output can then be evaluated as a pixel-wise multi-variate function of the shifted Gabor filter responses.
Before these shift operations, we blur the Gabor filter responsesin order to allow for some tolerance in the position of the respec-tive contour parts. We define the blurring operation as the compu-tation of maximum value of the weighted responses of a Gaborfilter. For weighting we use a Gaussian function Gr̂ðx; yÞ, the stan-dard deviation r̂ of which is a linear function of the distance qfrom the center of the COSFIRE filter: r̂ ¼ r̂0 þ aq. Here we user̂0 ¼ 0:67 and a ¼ 0:1. The choice of the linear function that weuse to determine the standard deviation r̂ of the blurring functionis explained in Section 4.
Next, we shift the blurred responses of each selected Gabor fil-ter ðki; hiÞ by a distance qi in the direction opposite to /i. In polarcoordinates, the shift vector is specified by ðqi;/i þ pÞ, while incartesian coordinates it is ðDxi;DyiÞ where xi ¼ �qi cos /i andyi ¼ �qi sin /i. We denote by ski ;hi ;qi ;/i
ðx; yÞ the blurred and shiftedthresholded response of the Gabor filter that is specified by theith tuple ðki; hi;qi;/iÞ in the set Sf :
ski ;hi ;qi ;/iðx; yÞ¼defmax
x0 ;y0fjgki ;hi
ðx� x0 � Dxi; y� y0 � DyiÞjt1Gr̂ðx0; y0Þg
ð3Þwhere �3r̂ 6 x0; y0 6 3r̂.
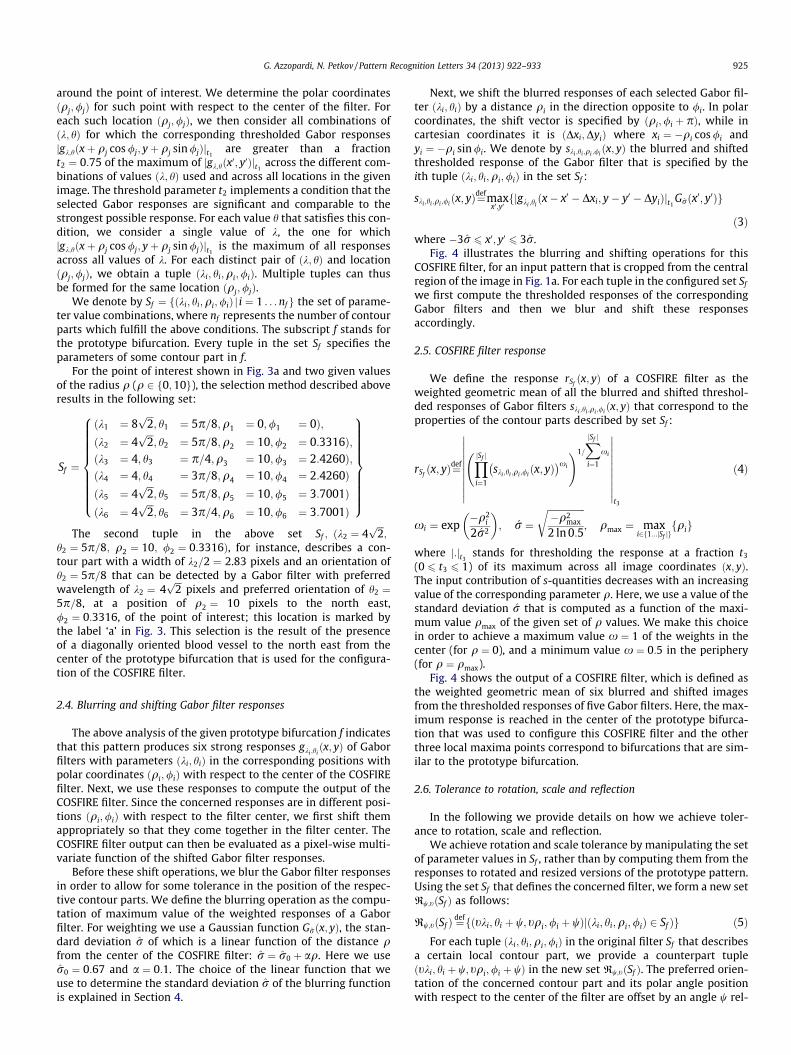
Fig. 4 illustrates the blurring and shifting operations for thisCOSFIRE filter, for an input pattern that is cropped from the centralregion of the image in Fig. 1a. For each tuple in the configured set Sf
we first compute the thresholded responses of the correspondingGabor filters and then we blur and shift these responsesaccordingly.
2.5. COSFIRE filter response
We define the response rSfðx; yÞ of a COSFIRE filter as the
weighted geometric mean of all the blurred and shifted threshol-ded responses of Gabor filters ski ;hi ;qi ;/i
ðx; yÞ that correspond to theproperties of the contour parts described by set Sf :
rSfðx; yÞ¼def YjSf j
i¼1
ski ;hi ;qi ;/iðx; yÞ
� �xi
!1=XjSf j
i¼1
xi
����������
����������t3
ð4Þ
xi ¼ exp�q2
i
2�r2
� �; �r ¼
ffiffiffiffiffiffiffiffiffiffiffiffiffiffiffiffi�q2
max
2 ln 0:5
r; qmax ¼ max
i2f1...jSf jgfqig
where :j jt3stands for thresholding the response at a fraction t3
(0 6 t3 6 1) of its maximum across all image coordinates ðx; yÞ.The input contribution of s-quantities decreases with an increasingvalue of the corresponding parameter q. Here, we use a value of thestandard deviation �r that is computed as a function of the maxi-mum value qmax of the given set of q values. We make this choicein order to achieve a maximum value x ¼ 1 of the weights in thecenter (for q ¼ 0), and a minimum value x ¼ 0:5 in the periphery(for q ¼ qmax).
Fig. 4 shows the output of a COSFIRE filter, which is defined asthe weighted geometric mean of six blurred and shifted imagesfrom the thresholded responses of five Gabor filters. Here, the max-imum response is reached in the center of the prototype bifurca-tion that was used to configure this COSFIRE filter and the otherthree local maxima points correspond to bifurcations that are sim-ilar to the prototype bifurcation.
2.6. Tolerance to rotation, scale and reflection
In the following we provide details on how we achieve toler-ance to rotation, scale and reflection.
We achieve rotation and scale tolerance by manipulating the setof parameter values in Sf , rather than by computing them from theresponses to rotated and resized versions of the prototype pattern.Using the set Sf that defines the concerned filter, we form a new setRw;tðSf Þ as follows:
Rw;tðSf Þ ¼deffðtki; hi þ w; tqi;/i þ wÞjðki; hi;qi;/iÞ 2 Sf Þg ð5Þ
For each tuple ðki; hi;qi;/iÞ in the original filter Sf that describesa certain local contour part, we provide a counterpart tupleðtki; hi þ w; tqi;/i þ wÞ in the new set Rw;tðSf Þ. The preferred orien-tation of the concerned contour part and its polar angle positionwith respect to the center of the filter are offset by an angle w rel-
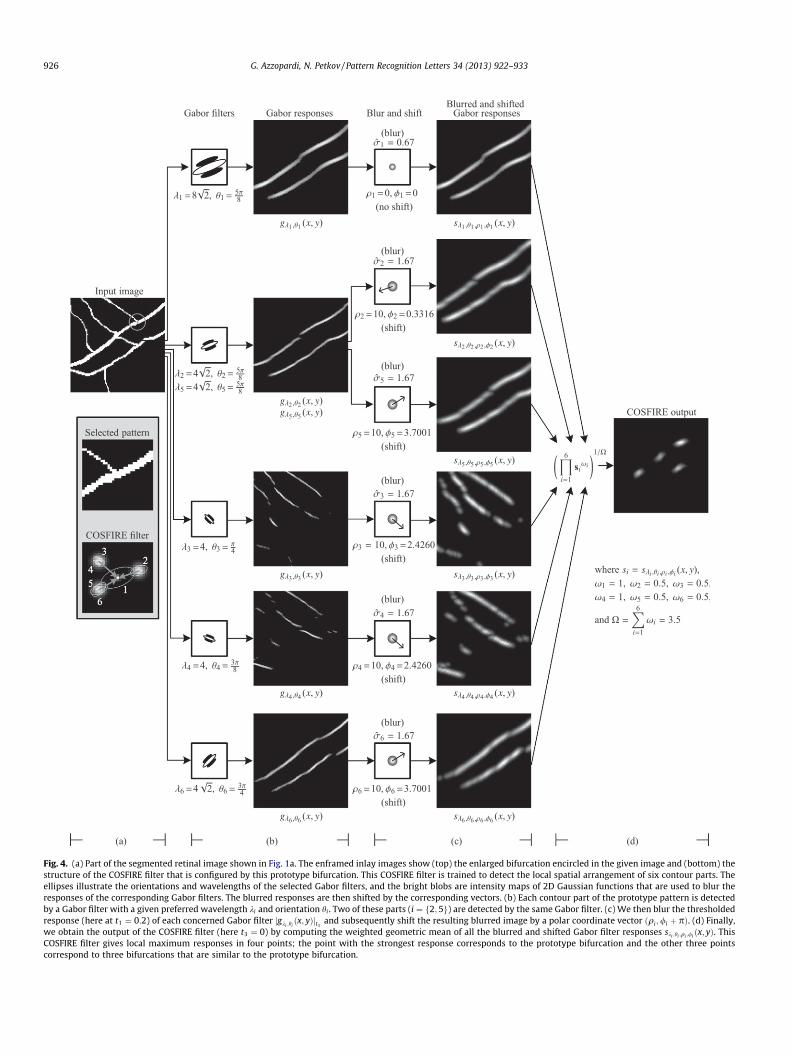
Fig. 4. (a) Part of the segmented retinal image shown in Fig. 1a. The enframed inlay images show (top) the enlarged bifurcation encircled in the given image and (bottom) thestructure of the COSFIRE filter that is configured by this prototype bifurcation. This COSFIRE filter is trained to detect the local spatial arrangement of six contour parts. Theellipses illustrate the orientations and wavelengths of the selected Gabor filters, and the bright blobs are intensity maps of 2D Gaussian functions that are used to blur theresponses of the corresponding Gabor filters. The blurred responses are then shifted by the corresponding vectors. (b) Each contour part of the prototype pattern is detectedby a Gabor filter with a given preferred wavelength ki and orientation hi . Two of these parts (i ¼ f2;5g) are detected by the same Gabor filter. (c) We then blur the thresholdedresponse (here at t1 ¼ 0:2) of each concerned Gabor filter jgki ;hi
ðx; yÞjt1and subsequently shift the resulting blurred image by a polar coordinate vector ðqi;/i þ pÞ. (d) Finally,
we obtain the output of the COSFIRE filter (here t3 ¼ 0) by computing the weighted geometric mean of all the blurred and shifted Gabor filter responses ski ;hi ;qi ;/iðx; yÞ. This
COSFIRE filter gives local maximum responses in four points; the point with the strongest response corresponds to the prototype bifurcation and the other three pointscorrespond to three bifurcations that are similar to the prototype bifurcation.
926 G. Azzopardi, N. Petkov / Pattern Recognition Letters 34 (2013) 922–933
G. Azzopardi, N. Petkov / Pattern Recognition Letters 34 (2013) 922–933 927
ative to the values of the corresponding parameters of the originaltuple. Moreover, the width of the concerned contour part and itsdistance to the center of the filter are scaled by a factor t relativeto the values of the corresponding parameters of the original tuple.
A rotation- and scale-tolerant response is then achieved by tak-ing the maximum value of the responses of filters that are obtainedwith different values of the parameters w and t:
r̂Sfðx; yÞ¼def max
w2W;t2!frRw;tðSf Þðx; yÞg ð6Þ
where W is a set of nw equidistant orientations defined asW ¼ f2p
nwij0 6 i < nwg and ! is a set of t scale factors equidistant
on a logarithmic scale defined as ! ¼ f2i2ji 2 Zg. According to Eq.
6 a COSFIRE filter will produce the same response for local patternsthat are versions of each other, obtained by rotation at discrete an-gles w 2 W and resizing by given scale factors t 2 !. As to the re-sponse of the filter to patterns that are rotated at angles ofintermediate values between those in W, it depends on the orienta-tion selectivity of the filter that is influenced by the orientationbandwidth of the involved Gabor filters and by the value of theparameter a, mentioned above. For a ¼ 0:1 that we use, nw ¼ 16equidistant preferred orientations ensure sufficient response forany orientation of the local prototype pattern that is used to config-ure the COSFIRE filter.
As to reflection tolerance, we first form a new set �Sf from the setSf as follows:
�Sf ¼deffðki;p� hi;qi;p� /iÞj8ðki; hi;qi;/iÞ 2 Sf g: ð7Þ
The new filter, which is defined by the set �Sf , is selective for areflected version of the prototype pattern f about the y-axis.
Finally, a combined rotation-, scale-, and reflection-tolerant re-sponse is computed as the maximum value of the rotation- andscale-tolerant responses of the filters Sf and �Sf that are obtainedwith different values of the parameters w and t:
�rSfðx; yÞ¼def maxfr̂Sf
ðx; yÞ; r̂�Sfðx; yÞg ð8Þ
3. Experimental results
We use the DRIVE (Staal et al., 2004) and the STARE (Hooveret al., 2000) data sets of retinal fundus images to evaluate the per-formance of the COSFIRE filters by quantifying their effectivenessin detecting vessel features.
3.1. Data sets and ground truth
The DRIVE data set, which was obtained from a screening pro-gramme of diabetic retinopathy in the Netherlands, comprises 40color images each of size 565� 584 pixels. The STARE data set con-tains 20 retinal color images each of size 605� 700 pixels, ten ofwhich are of patients with no pathology and the other ten containpathology.
These data sets are mainly used for the evaluation of algorithmsfor segmentation of the vessel tree. For this reason, next to the ori-ginal photographic images the data sets also include the corre-sponding manually segmented binary images. The ground truth4
data, which comprises the coordinates of bifurcations and crossoversof the manually segmented retinal images5 was defined by theauthors of this paper.
Fig. 5a and b show the grayscale version of the color retinal im-age with filename 40_training.tif and its segmentation in blood ves-
4 The ground truth data can be downloaded from the following website: http://www.cs.rug.nl/ imaging/databases/retina_database.
5 Named in DRIVE *_manual1.gif, and named in STARE *.ah.ppm.
sels and background, respectively, which are both taken from theDRIVE data set (Staal et al., 2004). Fig. 5b contains 101 blood vesselfeatures, shown encircled, which present Y- or T-form bifurcationsor crossovers. Fig. 5d illustrates the superposition of the threshol-ded superimposed responses (t1 ¼ 0:2) of the bank of Gabor filtersapplied to the manually segmented image shown in Fig. 5b.
3.2. Configuration of COSFIRE filters
We configure COSFIRE filters in an iterative mode. In the firstiteration, we use the prototype bifurcation f1 illustrated in Fig. 1to configure a COSFIRE filter denoted by Sf1 with three values ofthe radius parameter q (q 2 f0;4;10g). Fig. 6f illustrates the struc-ture of the filter Sf1 .
We then apply filter Sf1 to the same training image and show theobtained results in Fig. 7. We set the value of its threshold param-eter t3ðSf1 Þ to a fraction that produces the largest number of cor-rectly detected bifurcations and no false positives. For COSFIREfilter Sf1 this criterium is satisfied for t3ðSf1 Þ ¼ 0:39. The encircledregions6 are centered on the local maxima of the filter responseand if two such regions overlap by more than 75%, only the one withthe stronger response is shown.
Without provisions for rotation and scale tolerance(W ¼ f0g; ! ¼ f0g) COSFIRE filter Sf1 detects five vascular bifurca-tions, one of which is the prototype bifurcation that was used toconfigure this filter, Fig. 7a. When rotation tolerance is introduced(W ¼ fp8 iji ¼ 0 . . . 15g; ! ¼ f0g), the number of correctly detectedbifurcations is increased to 38, Fig. 7b. With the addition of scaletolerance (W ¼ fp8 iji ¼ 0 . . . 15g; ! ¼ f�1;0;1g), filter Sf1 correctlydetects 62 bifurcations, Fig. 7c. Finally, a total of 85 (out of 101)bifurcations are correctly detected when the filter is applied inrotation-, scale- and reflection-tolerant mode, Fig. 7d.
This high number of detected features illustrates the strong gen-eralization capability of our approach because 84.16% of the featuresof interest are detected by a single COSFIRE filter. Notable is the factthat for the selected threshold t3ðSf1 Þ ¼ 0:39 the filter does not pro-duce any false positive responses, which means that this result isachieved at precision of 100%. Fig. 7e–h show the features that aredetected by the concerned COSFIRE filter rendered as enlarged andisolated patterns. Each gray dot indicates the location at which filterSf1 achieves a local maximum response. Qualitatively, the indicatedlocations closely match the real branching points of interest.
In the second iteration of the training process, we randomly chooseone of the bifurcations, which we denote by f2, that has not been de-tected by filter Sf1 and use it to configure a second COSFIRE filter Sf2 .With this second filter we detect 82 features of interest of which 70coincide with the features detected by the first filter Sf1 and 12 arenewly detected features (t3ðSf2 Þ ¼ 0:21). Merging the responses ofboth filters results in the detection of 97 distinct bifurcations.
We repeat this procedure of configuring filters using featuresthat have not been detected by the previously trained filters untilall the vessel features in the training image are detected. In thiscase, a set of five filters that are configured by the prototype bifur-cations shown in Fig. 6a–e proves sufficient to detect all 101 retinalfeatures in the concerned training image. An important aspect ofthis training procedure is that the values of the threshold parame-ters t3ðSfi Þ are chosen in such a way to produce a recall of 100% and aprecision of 100%7 for the training retinal image.
6 The radius of the circle is the sum of the maximum value of the radial parameterq and blur radius used at this value of q.
7 Recall is the percentage of true bifurcations or crossovers that are successfullydetected. Precision is the percentage of correct bifurcations or crossovers from alllocal maximum filter responses that exceed the corresponding t3 threshold values.
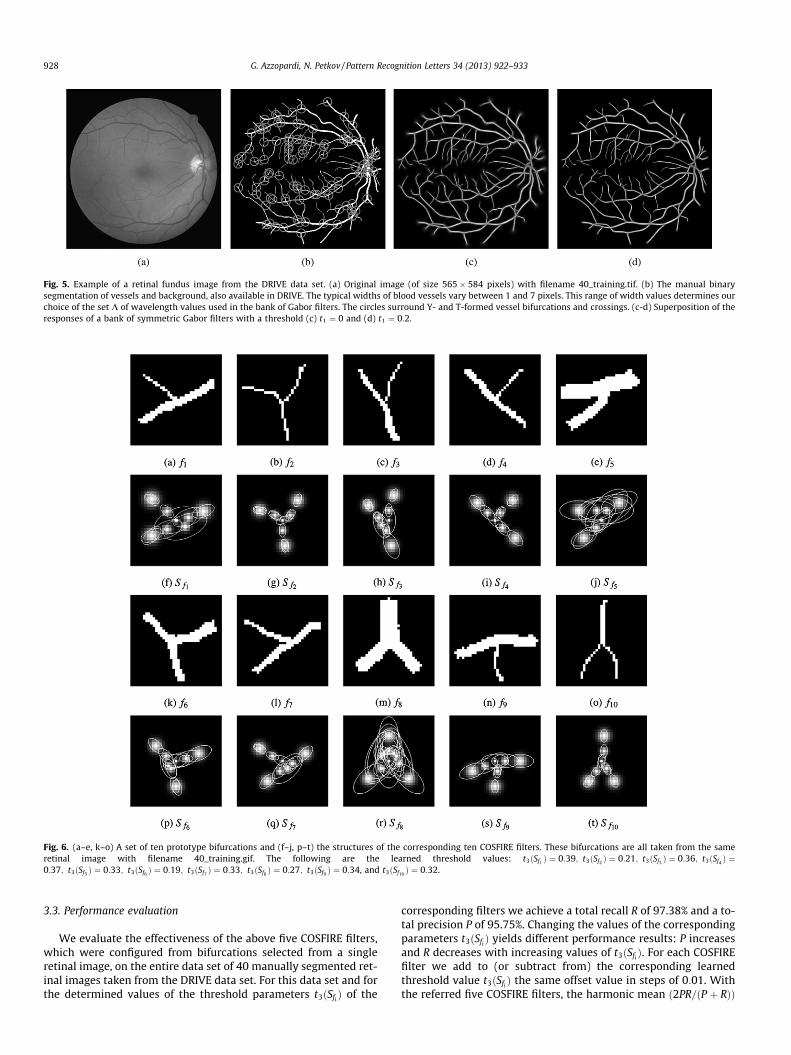
Fig. 5. Example of a retinal fundus image from the DRIVE data set. (a) Original image (of size 565� 584 pixels) with filename 40_training.tif. (b) The manual binarysegmentation of vessels and background, also available in DRIVE. The typical widths of blood vessels vary between 1 and 7 pixels. This range of width values determines ourchoice of the set K of wavelength values used in the bank of Gabor filters. The circles surround Y- and T-formed vessel bifurcations and crossings. (c-d) Superposition of theresponses of a bank of symmetric Gabor filters with a threshold (c) t1 ¼ 0 and (d) t1 ¼ 0:2.
Fig. 6. (a–e, k–o) A set of ten prototype bifurcations and (f–j, p–t) the structures of the corresponding ten COSFIRE filters. These bifurcations are all taken from the sameretinal image with filename 40_training.gif. The following are the learned threshold values: t3ðSf1 Þ ¼ 0:39; t3ðSf2
Þ ¼ 0:21; t3ðSf3Þ ¼ 0:36; t3ðSf4
Þ ¼0:37; t3ðSf5 Þ ¼ 0:33; t3ðSf6
Þ ¼ 0:19; t3ðSf7 Þ ¼ 0:33; t3ðSf8 Þ ¼ 0:27; t3ðSf9Þ ¼ 0:34, and t3ðSf10
Þ ¼ 0:32.
928 G. Azzopardi, N. Petkov / Pattern Recognition Letters 34 (2013) 922–933
3.3. Performance evaluation
We evaluate the effectiveness of the above five COSFIRE filters,which were configured from bifurcations selected from a singleretinal image, on the entire data set of 40 manually segmented ret-inal images taken from the DRIVE data set. For this data set and forthe determined values of the threshold parameters t3ðSfi Þ of the
corresponding filters we achieve a total recall R of 97.38% and a to-tal precision P of 95.75%. Changing the values of the correspondingparameters t3ðSfi Þ yields different performance results: P increasesand R decreases with increasing values of t3ðSfi Þ. For each COSFIREfilter we add to (or subtract from) the corresponding learnedthreshold value t3ðSfi Þ the same offset value in steps of 0:01. Withthe referred five COSFIRE filters, the harmonic mean ð2PR=ðP þ RÞÞ

Fig. 7. (a) Results of applying the filter Sf1 to the training retinal image (40_manual1.gif) in different modes. The number of detected true positive (TP) features increases asthe filter achieves tolerance to geometric transformations: (a,e) non-tolerant (TP ¼ 5), (b, f) rotation-tolerant (TP = 38), (c,g) rotation- and scale-tolerant (TP = 62), and (d,h)rotation-, scale- and reflection-tolerant (TP = 85). (e–f) Enlargement of the detected features in the corresponding retinal images. The gray dots indicate the positions at whichthe COSFIRE filter achieves local maximum responses. The surrounding circles correspond to the area of support of the concerned COSFIRE filter.
G. Azzopardi, N. Petkov / Pattern Recognition Letters 34 (2013) 922–933 929
of the precision and recall reaches a maximum at a recall R of98.26% and a precision P of 94.98% when each value of the thresh-old parameter t3ðSfi Þ is offset by the same value of �0.01 from thecorresponding learned threshold value, Fig. 8b.
3.4. Effects of the number of COSFIRE filters
In the above experiments we made no assumptions on the re-quired number of COSFIRE filters. The performance results may,however, change with a different number of such filters. We
1 2 3 4 5 6 7 8 9 10Number of COSFIRE filters
94.5
95.0
95.5
96.0
96.5
97.0
97.5
Max.harmonicmean(%)
85 90 95 10085
90
95
100
Recall (%)
Precision(%)
5 COSFIRE filters6 COSFIRE filters
(b)(a)
Fig. 8. (a) The plot illustrates the maximum harmonic mean achieved by usingdifferent number of COSFIRE filters. The best performance is achieved with only sixCOSFIRE filters for a maximum harmonic mean of 97:20%. This point is indicated bythe filled-in circle. (b) Precision-recall plots obtained with five and six COSFIREfilters. For each plot the threshold values of parameters t3ðSfi Þ are varied by addingthe same offset value, ranging between �0.05 to +0.05 in intervals of 0.01, to thecorresponding learned threshold values. The precision P increases and the recall Rdecreases with an increasing offset value. The harmonic mean of precision andrecall reaches a maximum at R ¼ 97:81% and P ¼ 96:60% for six filters and atR ¼ 98:26% and P ¼ 94:98% for five filters. These points are indicated by a filled-incircle and a filled-in square marker, respectively.
consider this aspect and configure more COSFIRE filters as follows.First, we use the same training retinal image and apply to it theabove set of five COSFIRE filters, but this time with the value oftheir respective threshold parameters t3ðSfi
Þ offset by +0.1. For thisoffset value the COSFIRE filters become more selective and achievea recall of 81.19% at a precision of 100% for the training retinal im-age. Then, we use the iterative training procedure described aboveto configure more COSFIRE filters until all the features of interestare detected in the training retinal image. It turns out that by con-figuring another five COSFIRE filters, Fig. 6k–t, and applying themtogether with the first five filters to the concerned image weachieve a recall of 100% at a precision of 100%.
We evaluate the effectiveness of the set of 10 COSFIRE filters byexecuting 10 experiments on the same data set of 40 retinalimages. In the first experiment we only apply the first COSFIRE fil-ter Sf1 and in the subsequent experiments we increment the num-ber of COSFIRE filters one by one, in the same order that they areconfigured, Fig. 6. For each experiment we compute the maximumharmonic mean and show it in the plot in Fig. 8a. The maximumharmonic mean is achieved with only six COSFIRE filters for a recallof 97.81% at a precision of 96.60%, Fig. 8b. This result is achievedwhen the learned value of each threshold parameter t3ðSfi Þ is offsetby the same value of +0.03. In Fig. 8b we show the correspondingprecision-recall plot for these six filters together with the one forfive filters.
3.5. Effects of the training data
We achieve the above performance results by applying six COS-FIRE filters that were configured by using bifurcations that we se-lected from a single retinal image. Here we test whether thetraining retinal image that we use has an effect on the performanceof the COSFIRE filters. For this purpose we repeat the entire exper-imental procedure for another two training retinal images.
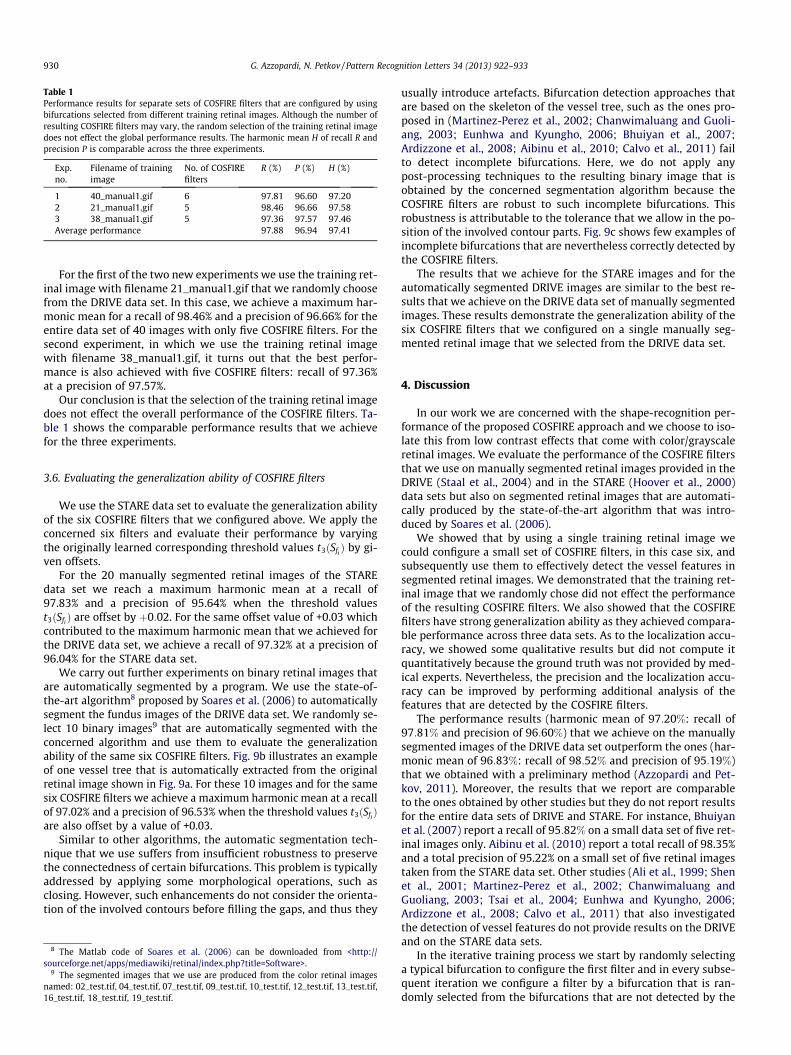
Table 1Performance results for separate sets of COSFIRE filters that are configured by usingbifurcations selected from different training retinal images. Although the number ofresulting COSFIRE filters may vary, the random selection of the training retinal imagedoes not effect the global performance results. The harmonic mean H of recall R andprecision P is comparable across the three experiments.
Exp.no.
Filename of trainingimage
No. of COSFIREfilters
R (%) P (%) H (%)
1 40_manual1.gif 6 97.81 96.60 97.202 21_manual1.gif 5 98.46 96.66 97.583 38_manual1.gif 5 97.36 97.57 97.46Average performance 97.88 96.94 97.41
930 G. Azzopardi, N. Petkov / Pattern Recognition Letters 34 (2013) 922–933
For the first of the two new experiments we use the training ret-inal image with filename 21_manual1.gif that we randomly choosefrom the DRIVE data set. In this case, we achieve a maximum har-monic mean for a recall of 98.46% and a precision of 96.66% for theentire data set of 40 images with only five COSFIRE filters. For thesecond experiment, in which we use the training retinal imagewith filename 38_manual1.gif, it turns out that the best perfor-mance is also achieved with five COSFIRE filters: recall of 97.36%at a precision of 97.57%.
Our conclusion is that the selection of the training retinal imagedoes not effect the overall performance of the COSFIRE filters. Ta-ble 1 shows the comparable performance results that we achievefor the three experiments.
3.6. Evaluating the generalization ability of COSFIRE filters
We use the STARE data set to evaluate the generalization abilityof the six COSFIRE filters that we configured above. We apply theconcerned six filters and evaluate their performance by varyingthe originally learned corresponding threshold values t3ðSfi Þ by gi-ven offsets.
For the 20 manually segmented retinal images of the STAREdata set we reach a maximum harmonic mean at a recall of97.83% and a precision of 95.64% when the threshold valuest3ðSfi Þ are offset by þ0:02. For the same offset value of +0.03 whichcontributed to the maximum harmonic mean that we achieved forthe DRIVE data set, we achieve a recall of 97.32% at a precision of96.04% for the STARE data set.
We carry out further experiments on binary retinal images thatare automatically segmented by a program. We use the state-of-the-art algorithm8 proposed by Soares et al. (2006) to automaticallysegment the fundus images of the DRIVE data set. We randomly se-lect 10 binary images9 that are automatically segmented with theconcerned algorithm and use them to evaluate the generalizationability of the same six COSFIRE filters. Fig. 9b illustrates an exampleof one vessel tree that is automatically extracted from the originalretinal image shown in Fig. 9a. For these 10 images and for the samesix COSFIRE filters we achieve a maximum harmonic mean at a recallof 97.02% and a precision of 96.53% when the threshold values t3ðSfi
Þare also offset by a value of +0.03.
Similar to other algorithms, the automatic segmentation tech-nique that we use suffers from insufficient robustness to preservethe connectedness of certain bifurcations. This problem is typicallyaddressed by applying some morphological operations, such asclosing. However, such enhancements do not consider the orienta-tion of the involved contours before filling the gaps, and thus they
8 The Matlab code of Soares et al. (2006) can be downloaded from <http://sourceforge.net/apps/mediawiki/retinal/index.php?title=Software>.
9 The segmented images that we use are produced from the color retinal imagesnamed: 02_test.tif, 04_test.tif, 07_test.tif, 09_test.tif, 10_test.tif, 12_test.tif, 13_test.tif,16_test.tif, 18_test.tif, 19_test.tif.
usually introduce artefacts. Bifurcation detection approaches thatare based on the skeleton of the vessel tree, such as the ones pro-posed in (Martinez-Perez et al., 2002; Chanwimaluang and Guoli-ang, 2003; Eunhwa and Kyungho, 2006; Bhuiyan et al., 2007;Ardizzone et al., 2008; Aibinu et al., 2010; Calvo et al., 2011) failto detect incomplete bifurcations. Here, we do not apply anypost-processing techniques to the resulting binary image that isobtained by the concerned segmentation algorithm because theCOSFIRE filters are robust to such incomplete bifurcations. Thisrobustness is attributable to the tolerance that we allow in the po-sition of the involved contour parts. Fig. 9c shows few examples ofincomplete bifurcations that are nevertheless correctly detected bythe COSFIRE filters.
The results that we achieve for the STARE images and for theautomatically segmented DRIVE images are similar to the best re-sults that we achieve on the DRIVE data set of manually segmentedimages. These results demonstrate the generalization ability of thesix COSFIRE filters that we configured on a single manually seg-mented retinal image that we selected from the DRIVE data set.
4. Discussion
In our work we are concerned with the shape-recognition per-formance of the proposed COSFIRE approach and we choose to iso-late this from low contrast effects that come with color/grayscaleretinal images. We evaluate the performance of the COSFIRE filtersthat we use on manually segmented retinal images provided in theDRIVE (Staal et al., 2004) and in the STARE (Hoover et al., 2000)data sets but also on segmented retinal images that are automati-cally produced by the state-of-the-art algorithm that was intro-duced by Soares et al. (2006).
We showed that by using a single training retinal image wecould configure a small set of COSFIRE filters, in this case six, andsubsequently use them to effectively detect the vessel features insegmented retinal images. We demonstrated that the training ret-inal image that we randomly chose did not effect the performanceof the resulting COSFIRE filters. We also showed that the COSFIREfilters have strong generalization ability as they achieved compara-ble performance across three data sets. As to the localization accu-racy, we showed some qualitative results but did not compute itquantitatively because the ground truth was not provided by med-ical experts. Nevertheless, the precision and the localization accu-racy can be improved by performing additional analysis of thefeatures that are detected by the COSFIRE filters.
The performance results (harmonic mean of 97:20%: recall of97:81% and precision of 96:60%) that we achieve on the manuallysegmented images of the DRIVE data set outperform the ones (har-monic mean of 96:83%: recall of 98:52% and precision of 95:19%)that we obtained with a preliminary method (Azzopardi and Pet-kov, 2011). Moreover, the results that we report are comparableto the ones obtained by other studies but they do not report resultsfor the entire data sets of DRIVE and STARE. For instance, Bhuiyanet al. (2007) report a recall of 95:82% on a small data set of five ret-inal images only. Aibinu et al. (2010) report a total recall of 98.35%and a total precision of 95.22% on a small set of five retinal imagestaken from the STARE data set. Other studies (Ali et al., 1999; Shenet al., 2001; Martinez-Perez et al., 2002; Chanwimaluang andGuoliang, 2003; Tsai et al., 2004; Eunhwa and Kyungho, 2006;Ardizzone et al., 2008; Calvo et al., 2011) that also investigatedthe detection of vessel features do not provide results on the DRIVEand on the STARE data sets.
In the iterative training process we start by randomly selectinga typical bifurcation to configure the first filter and in every subse-quent iteration we configure a filter by a bifurcation that is ran-domly selected from the bifurcations that are not detected by the
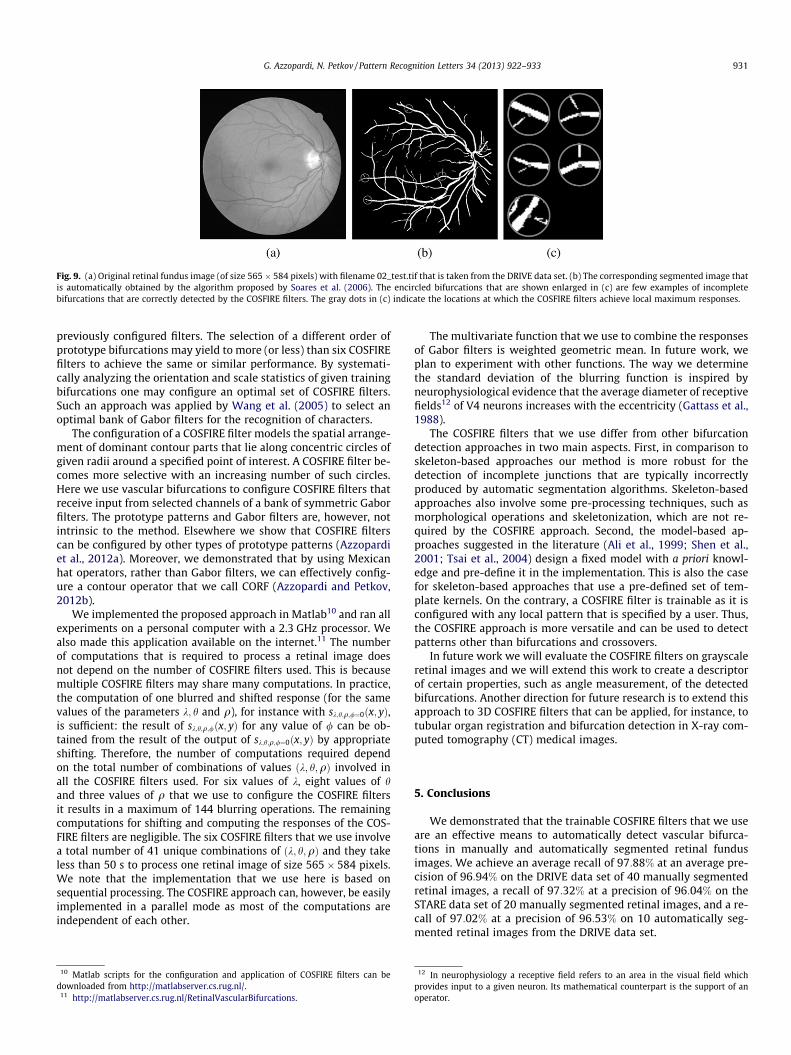
Fig. 9. (a) Original retinal fundus image (of size 565� 584 pixels) with filename 02_test.tif that is taken from the DRIVE data set. (b) The corresponding segmented image thatis automatically obtained by the algorithm proposed by Soares et al. (2006). The encircled bifurcations that are shown enlarged in (c) are few examples of incompletebifurcations that are correctly detected by the COSFIRE filters. The gray dots in (c) indicate the locations at which the COSFIRE filters achieve local maximum responses.
G. Azzopardi, N. Petkov / Pattern Recognition Letters 34 (2013) 922–933 931
previously configured filters. The selection of a different order ofprototype bifurcations may yield to more (or less) than six COSFIREfilters to achieve the same or similar performance. By systemati-cally analyzing the orientation and scale statistics of given trainingbifurcations one may configure an optimal set of COSFIRE filters.Such an approach was applied by Wang et al. (2005) to select anoptimal bank of Gabor filters for the recognition of characters.
The configuration of a COSFIRE filter models the spatial arrange-ment of dominant contour parts that lie along concentric circles ofgiven radii around a specified point of interest. A COSFIRE filter be-comes more selective with an increasing number of such circles.Here we use vascular bifurcations to configure COSFIRE filters thatreceive input from selected channels of a bank of symmetric Gaborfilters. The prototype patterns and Gabor filters are, however, notintrinsic to the method. Elsewhere we show that COSFIRE filterscan be configured by other types of prototype patterns (Azzopardiet al., 2012a). Moreover, we demonstrated that by using Mexicanhat operators, rather than Gabor filters, we can effectively config-ure a contour operator that we call CORF (Azzopardi and Petkov,2012b).
We implemented the proposed approach in Matlab10 and ran allexperiments on a personal computer with a 2.3 GHz processor. Wealso made this application available on the internet.11 The numberof computations that is required to process a retinal image doesnot depend on the number of COSFIRE filters used. This is becausemultiple COSFIRE filters may share many computations. In practice,the computation of one blurred and shifted response (for the samevalues of the parameters k; h and q), for instance with sk;h;q;/¼0ðx; yÞ,is sufficient: the result of sk;h;q;/ðx; yÞ for any value of / can be ob-tained from the result of the output of sk;h;q;/¼0ðx; yÞ by appropriateshifting. Therefore, the number of computations required dependon the total number of combinations of values ðk; h;qÞ involved inall the COSFIRE filters used. For six values of k, eight values of hand three values of q that we use to configure the COSFIRE filtersit results in a maximum of 144 blurring operations. The remainingcomputations for shifting and computing the responses of the COS-FIRE filters are negligible. The six COSFIRE filters that we use involvea total number of 41 unique combinations of ðk; h;qÞ and they takeless than 50 s to process one retinal image of size 565� 584 pixels.We note that the implementation that we use here is based onsequential processing. The COSFIRE approach can, however, be easilyimplemented in a parallel mode as most of the computations areindependent of each other.
10 Matlab scripts for the configuration and application of COSFIRE filters can bedownloaded from http://matlabserver.cs.rug.nl/.
11 http://matlabserver.cs.rug.nl/RetinalVascularBifurcations.
The multivariate function that we use to combine the responsesof Gabor filters is weighted geometric mean. In future work, weplan to experiment with other functions. The way we determinethe standard deviation of the blurring function is inspired byneurophysiological evidence that the average diameter of receptivefields12 of V4 neurons increases with the eccentricity (Gattass et al.,1988).
The COSFIRE filters that we use differ from other bifurcationdetection approaches in two main aspects. First, in comparison toskeleton-based approaches our method is more robust for thedetection of incomplete junctions that are typically incorrectlyproduced by automatic segmentation algorithms. Skeleton-basedapproaches also involve some pre-processing techniques, such asmorphological operations and skeletonization, which are not re-quired by the COSFIRE approach. Second, the model-based ap-proaches suggested in the literature (Ali et al., 1999; Shen et al.,2001; Tsai et al., 2004) design a fixed model with a priori knowl-edge and pre-define it in the implementation. This is also the casefor skeleton-based approaches that use a pre-defined set of tem-plate kernels. On the contrary, a COSFIRE filter is trainable as it isconfigured with any local pattern that is specified by a user. Thus,the COSFIRE approach is more versatile and can be used to detectpatterns other than bifurcations and crossovers.
In future work we will evaluate the COSFIRE filters on grayscaleretinal images and we will extend this work to create a descriptorof certain properties, such as angle measurement, of the detectedbifurcations. Another direction for future research is to extend thisapproach to 3D COSFIRE filters that can be applied, for instance, totubular organ registration and bifurcation detection in X-ray com-puted tomography (CT) medical images.
5. Conclusions
We demonstrated that the trainable COSFIRE filters that we useare an effective means to automatically detect vascular bifurca-tions in manually and automatically segmented retinal fundusimages. We achieve an average recall of 97:88% at an average pre-cision of 96:94% on the DRIVE data set of 40 manually segmentedretinal images, a recall of 97:32% at a precision of 96:04% on theSTARE data set of 20 manually segmented retinal images, and a re-call of 97:02% at a precision of 96:53% on 10 automatically seg-mented retinal images from the DRIVE data set.
12 In neurophysiology a receptive field refers to an area in the visual field whichprovides input to a given neuron. Its mathematical counterpart is the support of anoperator.
932 G. Azzopardi, N. Petkov / Pattern Recognition Letters 34 (2013) 922–933
The COSFIRE filters are versatile detectors of contour relatedfeatures because they can be trained with any local contour proto-type pattern and are subsequently able to detect patterns that areidentical or similar to the prototype pattern. Furthermore, they areconceptually simple and easy to implement: the filter output iscomputed as the weighted geometric mean of blurred and shiftedGabor filter responses.
Acknowledgements
We would like to thank the anonymous reviewers for the help-ful and constructive reviews that allowed us to improve the qualityof the paper.
References
Abramoff, M., Garvin, M., Sonka, M., 2010. Retinal imaging and image analysis. IEEERev. Biomed. Eng. 3, 169–208. http://dx.doi.org/10.1109/RBME.2010.2084567,ISSN 1937-3333.
Aibinu, A.M., Iqbal, M.I., Shafie, A.A., Salami, M.J.E., Nilsson, M., 2010. Vascularintersection detection in retina fundus images using a new hybrid approach.Comput. Biological Med. 40 (1), 81–89. http://dx.doi.org/10.1016/j.compbiomed.2009.11.004, ISSN 0010-4825.
Ali, C., Hong, S., Turner, J., Tanenbaum, H., Roysam, B., 1999. Rapid automatedtracing and feature extraction from retinal fundus images using directexploratory algorithms. IEEE Trans. Inform. Technol. Biomed. 3, 125–138.
Ardizzone, E., Pirrone, R., Gambino, O., Radosta, S., 2008. Blood vessels and featurepoints detection on retinal images. In: Engineering in Medicine and BiologySociety, EMBS 2008. 30th Annual Internat. Conf. IEEE, pp. 2246 –2249. http://dx.doi.org/10.1109/IEMBS.2008.4649643. ISSN 1557-170X.
Azzopardi, G., Petkov, N., 2011. Detection of retinal vascular bifurcations bytrainable V4-like filters. In: Real, P., Diaz-Pernil, D., Molina-Abril, H., Berciano,A., Kropatsch, W. (Eds.), Computer Analysis of Images and Patterns. Proc. 14thInternat. Conf. CAIP 2011, Seville, Spain, pp. 451–459. ISBN 978-3-642-23671-6.
Azzopardi, G., Petkov, N., 2012a. Trainable COSFIRE filters for keypoint detectionand pattern recognition. IEEE Trans. Pattern Anal. Machine Intell. (99), 1. http://dx.doi.org/10.1109/TPAMI.2012.106, ISSN 0162-8828.
Azzopardi, G., Petkov, N., 2012b. A CORF computational model of a simple cell thatrelies on LGN input outperforms the Gabor function model. Biological Cybernet.106 (3), 177–189. http://dx.doi.org/10.1007/s00422-012-0486-6, ISSN 0340-1200.
Becker, D., Can, A., Turner, J., Tanenbaum, H., Roysam, B., 1998. Image processingalgorithms for retinal montage synthesis, mapping, and real-time locationdetermination. IEEE Trans. Biomed. Eng. 45 (1), 105–118. http://dx.doi.org/10.1109/10.650362, ISSN 0018-9294.
Bevilacqua, V., Cambo, S., Cariello, L., Mastronardi, G., 2005. A combined method todetect retinal fundus features. In: Proc. of European Conf. on Emergent Aspectsof Clinical Data Analysis, pp. 1–6.
Bhuiyan, A., Nath, B., Chua, J., Ramamohanarao, K., 2007. Automatic detection ofvascular bifurcations and crossovers from color retinal fundus images. In: ThirdInternat. IEEE Conf. on Signal-Image Technologies and Internet-Based System(SITIS), pp. 711–718.
Bodis-Wollner, I., Brannan, J., 1997. Hidden visual loss in optic neuropathy isrevealed using Gabor patch contrast perimetry. Clin. Neurosci. 4 (5), 284–291,ISSN 1065-6766.
Calvo, D., Ortega, M., Penedo, M.G., Rouco, J., 2011. Automatic detection andcharacterisation of retinal vessel tree bifurcations and crossovers in eye fundusimages. Comput. Methods Prog. Biomed. 103 (1), 28–38. http://dx.doi.org/10.1016/j.cmpb.2010.06.002, ISSN 0169-2607.
Chanwimaluang, T., Guoliang, F., 2003. An efficient blood vessel detection algorithmfor retinal images using local entropy thresholding. In: Proc. 2003 IEEE Internat.Symposium on Circuits and Systems (Cat. No. 03CH37430) 5, pp. 21–25.
Chapman, N., Dell’omo, G., Sartini, M., Witt, N., Hughes, A., Thom, S., Pedrinelli, R.,2002. Peripheral vascular disease is associated with abnormal arteriolardiameter relationships at bifurcations in the human retina. Clin. Sci. 103,111–116.
Chauduri, S., Chatterjee, S., Katz, N., Nelson, M., Goldbaum, M., 1989. Detection ofblood-vessels in retinal images using tow-dimensional matched-filters. IEEETrans. Med. Imaging 8 (3), 263–269. http://dx.doi.org/10.1109/42.34715, ISSN0278-0062.
Chen, Li, Xiang, Yang, Chen, YaoJie, Zhang, XiaoLong, 2011. Retinal imageregistration using bifurcation structures. In: 2011 18th IEEE Internat. Conf. onImage Processing (ICIP 2011), IEEE Signal Process. Soc., 11–14 Sept. 2011,Brussels, Belgium, pp. 2169–2172. ISBN 978-1-4577-1304-0.
Daugman, J., 1985. Uncertainty relation for resolution in space, spatial-frequency,and orientation optimized by two dimensional visual cortical filters. J. Opt. Soc.Amer. A – Opt. Image Sci. Vision 2 (7), 1160–1169. http://dx.doi.org/10.1364/JOSAA.2.001160, ISSN 0740-3232.
Du, Xiaojun, Bui, T., 2010. Retinal image segmentation based on Mumford-Shahmodel and Gabor wavelet filter. In: Proc. 2010 20th Internat. Conf. Pattern
Recognition (ICPR 2010), IEEE Comput. Soc., Istanbul, Turkey, pp. 3384–3387.ISBN 978-0-7695-4109-9.
Eunhwa, J., Kyungho, H., 2006. Automatic retinal vasculature structure tracing andvascular landmark extraction from human eye image. In: Internat. Conf. onHybrid Information Technology 7.
Frank, R., 2004. Diabetic retinopathy. New Engl. J. Med. 350 (1), 48–58. http://dx.doi.org/10.1056/NEJMra021678, ISSN 0028-4793.
Fraz, M., Remagnino, P., Hoppe, A., Velastin, S., Uyyanonvara, B., Barman, S., 2011. Asupervised method for retinal blood vessel segmentation using line strength,multiscale Gabor and morphological features. In: 2011 IEEE Internat. Conf. onSignal and Image Processing Applications (ICSIPA 2011), pp. 410–415, 16–18November 2011, Kuala Lumpur, Malaysia. ISBN 978-1-4577-0243-3.
Gattass, R., Sousa, A.P., Gross, C.G., 1988. Visuotopic organization and extent of V3and V4 of the macaque. J. Neurosci. 8 (6), 1831–1845.
Gheorghiu, E., Kingdom, F.A.A., 2009. Multiplication in curvature processing. J.Vision 9 (2). Article No. 23. http://dx.doi.org/10.1167/9.2.23.
Grigorescu, S.E., Petkov, N., Kruizinga, P., 2002. Comparison of texture featuresbased on Gabor filters. IEEE Trans. Image Process. 11 (10), 1160–1167. http://dx.doi.org/10.1109/TIP.2002.804262, ISSN 1057-7149.
Grigorescu, C., Petkov, N., Westenberg, M.A., 2003a. The role of non-CRF inhibitionin contour detection. J. Comput. Graphics Visualiz. Comput. Vision (WSCG) 11(2), 197–204.
Grigorescu, C., Petkov, N., Westenberg, M.A., 2003b. Contour detection based onnonclassical receptive field inhibition. IEEE Trans. Image Process. 12 (7), 729–739.
Hoover, A., Kouznetsova, V., Goldbaum, M., 2000. Locating blood vessels in retinalimages by piecewise threshold probing of a matched filter response. IEEE Trans.Med. Imaging 19 (3), 203–210. http://dx.doi.org/10.1109/42.845178, ISSN0278-0062.
Jiang, X., Mojon, D., 2003. Adaptive local thresholding by verification-basedmultithreshold probing with application to vessel detection in retinal images.IEEE Trans. Pattern Anal. Machine Intell. 25 (1), 131–137, ISSN 0162-8828.
Kruizinga, P., Petkov, N., 1999. Non-linear operator for oriented texture. IEEE Trans.Image Process. 8 (10), 1395–1407.
Martinez-Perez, M., Hughes, A., Stanton, A., Thom, S., Chapman, N., Bharath, A.,Parker, K., 2002. Retinal vascular tree morphology: A semi-automaticquantification. IEEE Trans. Biomed. Eng. 49, 912–917.
Mendonca, A.M., Campilho, A., 2006. Segmentation of retinal blood vessels bycombining the detection of centerlines and morphological reconstruction. IEEETrans. Med. Imaging 25 (9), 1200–1213. http://dx.doi.org/10.1109/TMI.2006.879955, ISSN 0278-0062.
Moin, M., Tavakoli, H., Broumandnia, A., 2010. A new retinal vessel segmentationmethod using preprocessed Gabor and local binary patterns. In: 2010 6thIranian Conf. on Machine Vision and Image Processing (MVIP), IEEE Iran Sect.,Isfahan, Iran, 6 pp. ISBN 978-1-4244-9706-5.
Muramatsu, C., Hayashi, Y., Sawada, A., Hatanaka, Y., Hara, T., Yamamoto, T., Fujita,H., 2009. Computerized detection of retinal nerve fiber layer defects in retinalfundus images by modified polar transformation and Gabor filtering. In: Dossel,O., Schlegel, W. (Eds.), 11th International Congress of the IUPESM. MedicalPhysics and Biomedical Engineering. World Congress 2009. BiomedicalEngineering for Audiology, Ophthalmology, Emergency & Dental Medicine, 7–12 Sept. 2009, Munich, Germany, pp. 124–126. ISBN 978-3-642-03890-7.
Murray, C.D., 1926a. The physiological principle of minimum work applied to theangle of branching of arteries. J. Gen. Physiol. 9, 835–841.
Murray, C.D., 1926b. The physiological principle of minimum work: I. The vascularsystem and the cost of blood volume. Proc. Natl. Acad. Sci. USA 12, 207–214.
Niemeijer, M., Staal, J., van Ginneken, B., Loog, M., Abramoff, M., 2004. Comparativestudy of retinal vessel segmentation methods on a new publicly availabledatabase. In: Proceedings of the SPIE – The International Society for OpticalEngineering, Medical Imaging San Diego, CA, USA, pp. 648–656.
Ortega, M., Penedo, M.G., Rouco, J., Barreira, N., Carreira, M.J., 2009. Personalverification based on extraction and characterisation of retinal feature points. J.Vision Lang. Comput. 20 (2), 80–90. http://dx.doi.org/10.1016/j.jvlc.2009.01.006, ISSN 1045-926X.
Parisi, V., Manni, G., Spadaro, M., Colacino, G., Restuccia, R., Marchi, S., Bucci, M.,Pierelli, F., 1999. Correlation between morphological and functional retinalimpairment in multiple sclerosis patients. Inverst. Ophthalmol. Vision Sci. 40(11), 2520–2527, ISSN 0146-0404.
Pasupathy, A., Connor, C., 1999. Responses to contour features in macaque area V4.J. Neurophysiol. 82, 2490–2502.
Pasupathy, A., Connor, C., 2001. Shape representation in area V4: position-specifictuning for boundary conformation. J. Neurophysiol. 86, 2505–2519.
Pasupathy, A., Connor, C., 2002. Population coding of shape in area V4. Nat.Neurosci. 5, 1332–1338.
Patton, N., Aslam, T., MacGillivray, T., Deary, I., Dhillon, B., Eikelboom, R., Yogesan,K., Constable, I., 2006. Retinal image analysis: concepts, applications andpotential. Prog. Retinal Eye Res. 25, 99–127.
Paulus, W., Schwarz, G., Werner, A., Lange, H., Bayer, A., Hofschuster, M., Muller, N.,Zrenner, E., 1993. Impairment of retinal increment thresholds in Huntingtons-disease. Annal. Neurol. 34 (4), 574–578. http://dx.doi.org/10.1002/ana.410340411, ISSN 0364-5134.
Petkov, N., 1995. Biologically motivated computationally intensive approaches toimage pattern-recognition. Future Gener. Comput. Systems 11, 451–465.
Petkov, N., Kruizinga, P., 1997. Computational models of visual neurons specialisedin the detection of periodic and aperiodic oriented visual stimuli: bar andgrating cells. Biological Cybernet. 76 (2), 83–96.

G. Azzopardi, N. Petkov / Pattern Recognition Letters 34 (2013) 922–933 933
Petkov, N., Westenberg, M.A., 2003. Suppression of contour perception by band-limited noise and its relation to non-classical receptive field inhibition.Biological Cybernet. 88 (10), 236–246.
Li, Qin, You, J., Zhang, Lei, Bhattacharya, P., 2006. A multiscale approach to retinalvessel segmentation using Gabor filters and scale multiplication. In: 2006 IEEEConf. Systems, Man, and Cybernetics, Taipei, Taiwan, pp. 3521–3527. ISBN 1-4244-0099-6.
Rangayyan, R.M., Zhu, X., Ayres, F.J., Ells, A.L., 2010. Detection of the optic nervehead in fundus images of the retina with Gabor filters and phase portraitanalysis. J. Digital Imag. 23 (4), 438–453. http://dx.doi.org/10.1007/s10278-009-9261-1, ISSN 0897-1889.
Ricci, E., Perfetti, R., 2007. Retinal blood vessel segmentation using line operatorsand support vector classification. IEEE Trans. Med. Imaging 26 (10), 1357–1365.http://dx.doi.org/10.1109/TMI.2007.898551, ISSN 0278-0062.
Selvathi, D., Lalitha Vaishnavi, P., 2011. Gabor wavelet based blood vesselsegmentation in retinal images using kernel classifiers. In: Proc. 2011Internat. Conf. on Signal Processing, Communication, Computing andNetworking Technologies (ICSCCN 2011), Thuckafay, India, pp. 830–835. ISBN978-1-61284-653-8.
Shen, H., Roysam, B., Stewart, C., Turner, J., Tanenbaum, H., 2001. Optimalscheduling of tracing computations for real-time vascular landmarkextraction from retinal fundus images. IEEE Trans. Inform. Technol. Biomed. 5(1), 77–91, ISSN 1089-7771.
Shen, H., Stewart, C., Roysam, B., Lin, G., Tanenbaum, H., 2003. Frame-rate spatialreferencing based on invariant indexing and alignment with application toonline retinal image registration. IEEE Trans. Pattern Anal. Mach. Intell. 25 (3),379–384, ISSN 0162-8828.
Sherman, T., 1981. On connecting large vessels to small – The meaning of Murraylaw. J. Gen. Physiol. 78, 431–453.
Soares, J.V.B., Leandro, J.J.G., Cesar Jr., R.M., Jelinek, H.F., Cree, M.J., 2006. Retinalvessel segmentation using the 2-D Gabor wavelet and supervised classification.IEEE Trans. Med. Imag. 25 (9), 1214–1222. http://dx.doi.org/10.1109/TMI.2006.879967, ISSN 0278-0062.
Staal, J., Abramoff, M., Niemeijer, M., Viergever, M., van Ginneken, B., 2004. Ridge-based vessel segmentation in color images of the retina. IEEE Trans. Med.Imaging 23, 501–509.
Sun, H., Dul, M.W., Swanson, W.H., 2006. Linearity can account for the similarityamong conventional, frequency-doubling, and Gabor-based perimetric tests inthe glaucomatous macula. Optometry Vision Sci. 83 (7), 455–465, ISSN 1040-5488.
Tsai, C., Stewart, C., Tanenbaum, H., Roysam, B., 2004. Model-based method forimproving the accuracy and repeatability of estimating vascular bifurcationsand crossovers from retinal fundus images. IEEE Trans. Inform. Technol.Biomed. 8, 122–130.
Tso, M., Jampol, L., 1982. Path-physiology of hypertensive retinopathy.Opthalmology 89, 1132–1145.
Usman Akram, M., Tariq, A., Nasir, S., Khan, S., 2009. Gabor wavelet based vesselsegmentation in retinal images. In: 2009 IEEE Symposium on ComputationalIntelligence for Image Processing (CIIP), 30 March–2 April 2009, Nashville, TN,USA, 4 pp. ISBN 978-1-4244-2760-4.
Wang, X., Ding, X., Liu, C., 2005. Gabor filters-based feature extraction for characterrecognition. Pattern Recognition 38 (3), 369–379. http://dx.doi.org/10.1016/j.patcog.2004.08.004, ISSN 0031-3203.
Yavuz, Z., Koumlse, C., 2010. Comparing 2D matched filter response and Gabor filtermethods for vessel segmentation in retinal images. In: 2010 National Conf. onElectrical, Electronics and Computer Engineering (ELECO 2010), Bursa, Turkey,pp. 648–652. ISBN 978-1-4244-9588-7.
Yavuz, Z., Kose, C., 2011. Retinal blood vessel segmentation using Gabor filter andtop-hat transform. In: 2011 IEEE 19th Signal Processing and CommunicationsApplications Conference (SIU 2011), Antalya, Turkey, pp. 546–549. ISBN 978-1-4577-0462-8.
Zamir, M., Medeiros, J., Cunningham, T., 1979. Arterial bifurcations in the humanretina. J. Gen. Physiol. 74 (4), 537–548.
Zamir, M., Sinclair, P., Wonnacott, T., 1992. Relation between diameter and flow inmajor branches of the arch of the aorta. J. Biomech. 25 (11), 1303–1310. http://dx.doi.org/10.1016/0021-9290(92)90285-9, ISSN 0021-9290.