
Automated identification of ERP peaks through Dynamic Time Warping: An application to developmental...
9
Automated identification of ERP peaks through Dynamic Time Warping: An application to developmental dyslexia Sara Assecondi a, * , A.M. Bianchi b , H. Hallez a , S. Staelens a , S. Casarotto b,c , I. Lemahieu a , G.A. Chiarenza d a Ghent University, Department of Electronics and Information Systems, MEDISIP-IBBT-IbiTech, De Pintelaan 185, B-9000 Ghent, Belgium b Politecnico di Milano, Department of Biomedical Engineering, IIT Unit, Milan, Italy c Università degli Studi di Milano, Department of Clinical Sciences ‘‘L. Sacco”, Milan, Italy d Azienda Ospedaliera G. Salvini, Rho Hospital, Department of Child and Adolescent Neuropsychiatry, Rho, Italy article info Article history: Accepted 20 June 2009 Available online 3 September 2009 Keywords: Event-related potentials Automated identification Peak-picking Dynamic Time Warping Developmental dyslexia abstract Objective: This article proposes a method to automatically identify and label event-related potential (ERP) components with high accuracy and precision. Methods: We present a framework, referred to as peak-picking Dynamic Time Warping (ppDTW), where a priori knowledge about the ERPs under investigation is used to define a reference signal. We developed a combination of peak-picking and Dynamic Time Warping (DTW) that makes the temporal intervals for peak-picking adaptive on the basis of the morphology of the data. We tested the procedure on experi- mental data recorded from a control group and from children diagnosed with developmental dyslexia. Results: We compared our results with the traditional peak-picking. We demonstrated that our method achieves better performance than peak-picking, with an overall precision, recall and F-score of 93%, 86% and 89%, respectively, versus 93%, 80% and 85% achieved by peak-picking. Conclusion: We showed that our hybrid method outperforms peak-picking, when dealing with data involving several peaks of interest. Significance: The proposed method can reliably identify and label ERP components in challenging event- related recordings, thus assisting the clinician in an objective assessment of amplitudes and latencies of peaks of clinical interest. Ó 2009 International Federation of Clinical Neurophysiology. Published by Elsevier Ireland Ltd. All rights reserved. 1. Introduction Cognitive brain potentials are very useful and fascinating be- cause they allow us to explore in a non-invasive way the higher cognitive functions that determine the development of human behaviour and thoughts. The study of such phenomena is currently limited by several factors, such as the presence of artefacts on the recordings, the low signal-to-noise ratio and the marked inter- and intra-individual variability of the potentials. These troubles are intrinsic to biological systems and above all to the ones involved in cognitive processes. However, they can be faced by applying proper mathematical approaches and models. Event-Related Potentials (ERPs) are characterised by peaks and troughs, the amplitudes and latencies of which may represent quantitative measures useful to track functional neuronal mecha- nisms. Absence of some peaks or changes in amplitude and latency that are significant with respect to a control population, or a con- trol condition, may be a signature of the presence of a specific group or dysfunction of the brain. The manual quantification of event-related potentials continues to be the usual clinical practice and constitutes the gold standard reference for evaluating the efficacy of automatic methods. It is surely hard to replace the competency of an experimenter trained by years of clinical practice with a mathematical model. However, the identification of peaks and troughs is often doubtful because the marked variability of cognitive middle and late latency compo- nents can produce different views even in skilled experimenters. Therefore, the employment of mathematical approaches is impor- tant not only to reduce the analysis time but also to make the anal- ysis results unequivocal and more reliable. The techniques proposed in the literature to automatically score ERPs can be grouped into two categories: methods that assume a linear latency jitter between ERPs from different subjects (all the peaks have the same latency variability), and methods that assume a non-linear latency jitter (allowing different level of variability depending on the latency of the peak). The problem can be reduced to finding the optimal alignment between two time series. In the first case, that is when only a linear shift is allowed, the jitter 1388-2457/$36.00 Ó 2009 International Federation of Clinical Neurophysiology. Published by Elsevier Ireland Ltd. All rights reserved. doi:10.1016/j.clinph.2009.06.023 * Corresponding author. Tel.: +32 9 332 43 26. E-mail address: [email protected] (S. Assecondi). Clinical Neurophysiology 120 (2009) 1819–1827 Contents lists available at ScienceDirect Clinical Neurophysiology journal homepage: www.elsevier.com/locate/clinph
Transcript of Automated identification of ERP peaks through Dynamic Time Warping: An application to developmental...
Clinical Neurophysiology 120 (2009) 1819–1827
Contents lists available at ScienceDirect
Clinical Neurophysiology
journal homepage: www.elsevier .com/locate /c l inph
Automated identification of ERP peaks through Dynamic Time Warping:An application to developmental dyslexia
Sara Assecondi a,*, A.M. Bianchi b, H. Hallez a, S. Staelens a, S. Casarotto b,c, I. Lemahieu a, G.A. Chiarenza d
a Ghent University, Department of Electronics and Information Systems, MEDISIP-IBBT-IbiTech, De Pintelaan 185, B-9000 Ghent, Belgiumb Politecnico di Milano, Department of Biomedical Engineering, IIT Unit, Milan, Italyc Università degli Studi di Milano, Department of Clinical Sciences ‘‘L. Sacco”, Milan, Italyd Azienda Ospedaliera G. Salvini, Rho Hospital, Department of Child and Adolescent Neuropsychiatry, Rho, Italy
a r t i c l e i n f o
Article history:Accepted 20 June 2009Available online 3 September 2009
Keywords:Event-related potentialsAutomated identificationPeak-pickingDynamic Time WarpingDevelopmental dyslexia
1388-2457/$36.00 � 2009 International Federation odoi:10.1016/j.clinph.2009.06.023
* Corresponding author. Tel.: +32 9 332 43 26.E-mail address: [email protected] (S. Asse
a b s t r a c t
Objective: This article proposes a method to automatically identify and label event-related potential(ERP) components with high accuracy and precision.Methods: We present a framework, referred to as peak-picking Dynamic Time Warping (ppDTW), wherea priori knowledge about the ERPs under investigation is used to define a reference signal. We developeda combination of peak-picking and Dynamic Time Warping (DTW) that makes the temporal intervals forpeak-picking adaptive on the basis of the morphology of the data. We tested the procedure on experi-mental data recorded from a control group and from children diagnosed with developmental dyslexia.Results: We compared our results with the traditional peak-picking. We demonstrated that our methodachieves better performance than peak-picking, with an overall precision, recall and F-score of 93%, 86%and 89%, respectively, versus 93%, 80% and 85% achieved by peak-picking.Conclusion: We showed that our hybrid method outperforms peak-picking, when dealing with datainvolving several peaks of interest.Significance: The proposed method can reliably identify and label ERP components in challenging event-related recordings, thus assisting the clinician in an objective assessment of amplitudes and latencies ofpeaks of clinical interest.� 2009 International Federation of Clinical Neurophysiology. Published by Elsevier Ireland Ltd. All rights
reserved.
1. Introduction
Cognitive brain potentials are very useful and fascinating be-cause they allow us to explore in a non-invasive way the highercognitive functions that determine the development of humanbehaviour and thoughts. The study of such phenomena is currentlylimited by several factors, such as the presence of artefacts on therecordings, the low signal-to-noise ratio and the marked inter- andintra-individual variability of the potentials. These troubles areintrinsic to biological systems and above all to the ones involvedin cognitive processes. However, they can be faced by applyingproper mathematical approaches and models.
Event-Related Potentials (ERPs) are characterised by peaks andtroughs, the amplitudes and latencies of which may representquantitative measures useful to track functional neuronal mecha-nisms. Absence of some peaks or changes in amplitude and latencythat are significant with respect to a control population, or a con-
f Clinical Neurophysiology. Publish
condi).
trol condition, may be a signature of the presence of a specificgroup or dysfunction of the brain.
The manual quantification of event-related potentials continuesto be the usual clinical practice and constitutes the gold standardreference for evaluating the efficacy of automatic methods. It issurely hard to replace the competency of an experimenter trainedby years of clinical practice with a mathematical model. However,the identification of peaks and troughs is often doubtful becausethe marked variability of cognitive middle and late latency compo-nents can produce different views even in skilled experimenters.Therefore, the employment of mathematical approaches is impor-tant not only to reduce the analysis time but also to make the anal-ysis results unequivocal and more reliable.
The techniques proposed in the literature to automatically scoreERPs can be grouped into two categories: methods that assume alinear latency jitter between ERPs from different subjects (all thepeaks have the same latency variability), and methods that assumea non-linear latency jitter (allowing different level of variabilitydepending on the latency of the peak). The problem can be reducedto finding the optimal alignment between two time series. In thefirst case, that is when only a linear shift is allowed, the jitter
ed by Elsevier Ireland Ltd. All rights reserved.
Table 1Data description. For each task (Letter Presentation (LP), Symbol Presentation (SP),Letter Recognition Externally Paced (LRE)) and for each group (control, dyslexic) thenumber of subjects in each group, the mean number of trials averaged for eachsubject (with the standard deviation) and the mean age for the subjects in the group(with the standard deviation) are reported.
1820 S. Assecondi et al. / Clinical Neurophysiology 120 (2009) 1819–1827
between time series can be estimated using matched filters(Woody, 1967) or maximum-likelihood approaches (Jaskowskiand Verleger, 1999; Pham et al., 1987) but the inter-subject vari-ability, reflected in local contractions or extensions of the timeaxis, is not taken into account. In the second case, that is whenthe mapping is assumed to be non-linear, other techniques havebeen developed. In peak-picking (Gratton et al., 1989; Derbyshireet al., 1967), a positive (or negative) peak is identified as the globalmaximum (or minimum) in a pre-defined time interval. The mainassumption of this method is that each time range must containonly one peak. However, the time ranges are usually chosen onthe basis of a normal population and they may not be able to dealwith the large inter-subject variability of cognitive ERPs.
Techniques for non-linear time warping (Casarotto et al., 2005;Wang et al., 2001; Gupta et al., 1996; Picton et al., 1988) have beendeveloped to find the optimal alignment between curves. DynamicTime Warping (DTW) is a technique originally developed in thefield of speech processing (Sakoe and Chiba, 1978): it allows anon-linear mapping of the time axis of two series, according tomorphological characteristics, rather than to time latencies in thesignals. The two time series are mapped onto a common time axis,giving a time correspondence between samples of the referenceand samples of the signal. If meaningful peaks are known on thereference, they are, therefore, automatically identified on the signalas well.
It has already been proven that time warping approaches aresuperior to methods assuming a linear jitter between subjectsand that DTW is superior to peak-picking (Wang et al., 2001;Jaskowski and Verleger, 1999) for the detection of prominent com-ponents, such as the P300. However, to the authors’ knowledge,only Casarotto et al. (2005) have used DTW for automatic andsimultaneous identification and labelling of several peaks. Themain limitation of the work of Casarotto et al. (2005) is the useof an average of several control subjects as a reference. In this case,as a consequence of the physiological variability of the waveforms,some features may not be visible on the reference, and peaks maybe systematically missed.
The aim of this article is to propose a method to automaticallymeasure and label ERP components, that, on the one hand, uses apriori knowledge of the ERP under investigation in the DTW con-straints as well as in the computation of the reference signal; onthe other hand, it integrates two previously introduced indepen-dent approaches, achieving high accuracy and precision.
We developed a framework, referred to as ppDTW, based on theintegration of DTW and peak-picking that makes the temporalinterval for peak-picking adaptive on the basis of the morphologyof the data. We tested the procedure on experimental data re-corded from normal children and children diagnosed with develop-mental dyslexia, a neuro-behavioral disorder characterised by aspecific reading disability (World Health Organization, 2007).These recordings are particularly challenging because of the num-ber of peaks on the ERP and because of the inter-subject variability,even more accentuated when dealing with children and with cog-nitive functions. We compared our results to the classical peak-picking method, in terms of their ability to discriminate betweenseveral different peaks, elicited by the same stimulus. We showthat our hybrid method outperforms peak-picking, when dealingwith data involving several peaks.
Group Number of subjects Age (years) Task Number of trials
l� r l� r min
LP 92 ± 18 69Control 26 9.6 ± 0.7 SP 96 ± 19 68
LRE 114 ± 32 76
LP 104 ± 30 71Dyslexic 23 9.5 ± 0.7 SP 103 ± 26 68
LRE 124 ± 35 72
2. Methods
2.1. Experimental data
In this article, two samples are considered, namely a controlgroup of normal children, and children diagnosed with develop-
mental dyslexia. Data are summarised in Table 1. Each subject per-formed three different reading tasks: Letter Presentation (LP) andSymbol Presentation (SP), consisting in passive observation of let-ters or symbols displayed on a screen, respectively, and Letter Rec-ognition (LRE), consisting in reading aloud single letters. For adetailed description of the experimental protocol, we refer thereader to Casarotto et al. (2004). All subjects were previously in-formed of the experimental procedure and written consent wasobtained from parents and children. The entire experimental pro-cedure was approved by the ethic committee of the hospital (Azi-enda Ospedaliera G. Salvini, Rho Hospital, Rho, Italy). The controlgroup is a subset of the normal population used to derive a prioriinformation while the dyslexic group is an independent set.
Associated with the cognitive stages elicited by the stimulus, atotal of 11 peaks are identified on the ERP (Chiarenza and Casarot-to, 2004), as shown in Fig. 1. According to their latencies, thesepeaks can be grouped in the early, middle and late latency compo-nents. The associated variability is shown in Fig. 2, panel C.
The EEG was recorded through 10 leads located according to themodified 10–20 international system. The ElectroOculoGram(EOG) for the evaluation and removal of ocular movements andblinks was also recorded. The signals were bandpass filtered be-tween 0.02 Hz and 30 Hz and sampled at 250 Hz. The ocular andblinking artifacts were removed by means of principal componentanalysis, as described in Casarotto et al. (2004). The EEG was thensegmented into epochs of 4 s (2 s pre- and 2 s post-stimulus), aver-aged to obtain the average ERP for the single subject. At least 51trials were averaged for each subject. For further analysis, the dig-itised averaged signals were subsampled at 62.5 Hz.
2.2. Peak-picking
In the peak-picking method (Gratton et al., 1989), a positive (ornegative) peak is identified as the global maximum (or minimum)in a pre-defined time interval. The main assumption for this meth-od is that each time range can contain only one peak. The timeranges are usually chosen by an expert, on the basis of personalexperience and knowledge of the phenomenon under investiga-tion, thus being highly subjective and invariant throughout sub-jects. This last assumption may be violated by the intrinsic inter-subject variability of cognitive responses. The labelling of the peaksis achieved by assigning a specific label to each fragment. In thisimplementation, time intervals are defined as twice the mean la-tency variability for the considered peak, across channels andacross tasks, as measured in a control sample, as shown in Fig. 2,panel B, lower part and panel C.
2.3. Dynamic Time Warping
Time warping (Cohen, 1986; Sakoe and Chiba, 1978) is a proce-dure in which the time scales of two signals are stretched or
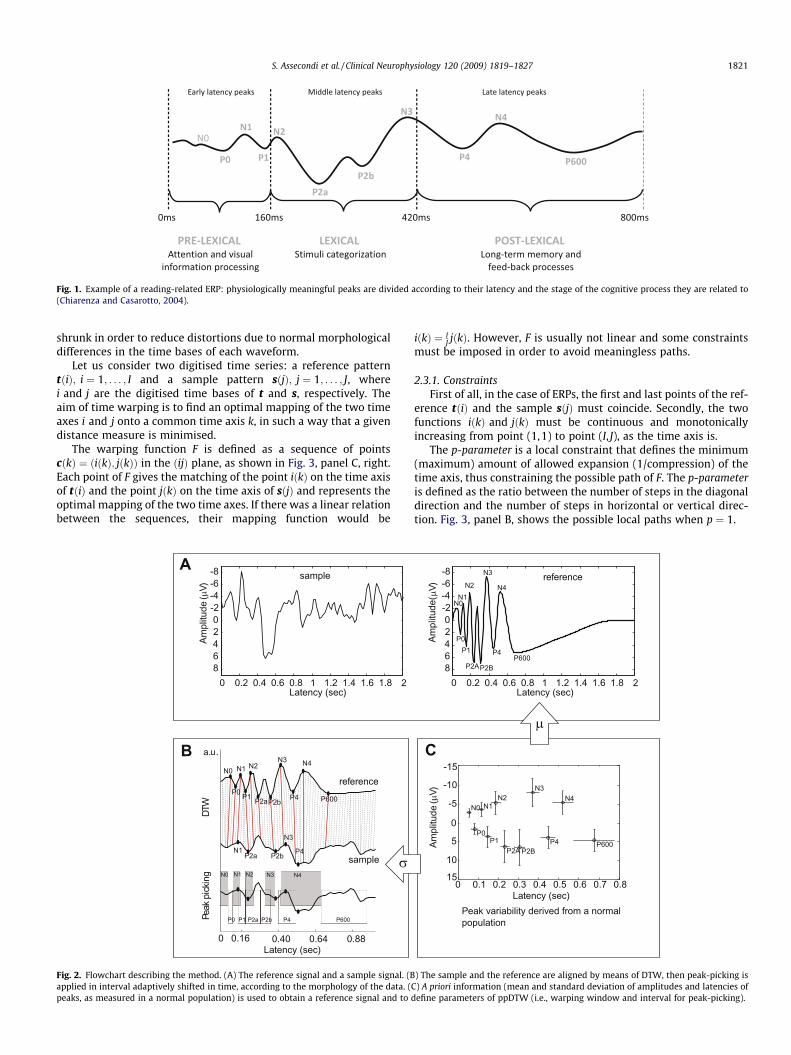
Fig. 1. Example of a reading-related ERP: physiologically meaningful peaks are divided according to their latency and the stage of the cognitive process they are related to(Chiarenza and Casarotto, 2004).
S. Assecondi et al. / Clinical Neurophysiology 120 (2009) 1819–1827 1821
shrunk in order to reduce distortions due to normal morphologicaldifferences in the time bases of each waveform.
Let us consider two digitised time series: a reference patterntðiÞ; i ¼ 1; . . . ; I and a sample pattern sðjÞ; j ¼ 1; . . . ; J, wherei and j are the digitised time bases of t and s, respectively. Theaim of time warping is to find an optimal mapping of the two timeaxes i and j onto a common time axis k, in such a way that a givendistance measure is minimised.
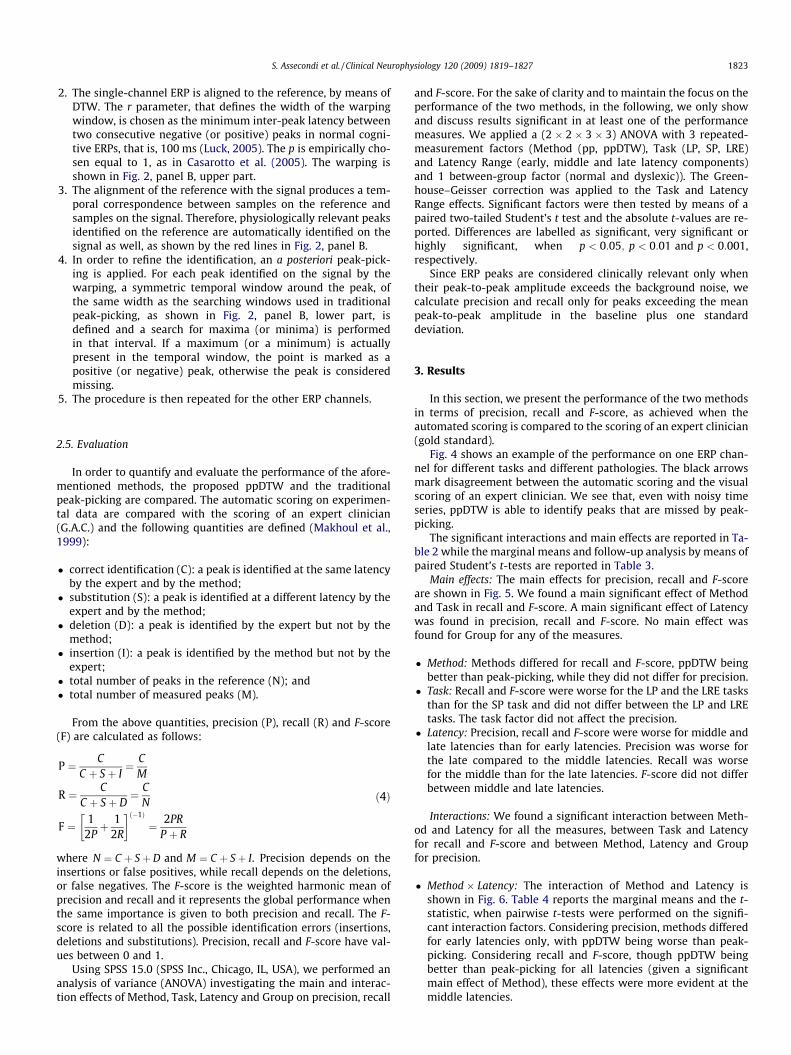
The warping function F is defined as a sequence of pointscðkÞ ¼ ðiðkÞ; jðkÞÞ in the ðijÞ plane, as shown in Fig. 3, panel C, right.Each point of F gives the matching of the point iðkÞ on the time axisof tðiÞ and the point jðkÞ on the time axis of sðjÞ and represents theoptimal mapping of the two time axes. If there was a linear relationbetween the sequences, their mapping function would be
0 0.2 0.4 0.6 0.8 1 1.2 1.4 1.6 1.8 2
-8-6-4-202468
(Am
plitu
de)V
Latency (sec)
sampleA
0.16 0.40 0.64 0.88
N1P2a P2b
N3
P4
WTDgnikcipkaeP
a u. .B
N0 N1 N2 N3
P0 P1 P2a P2b P4 P600
0Latency (sec)
N4
reference
sample
N0
P0
N1
P1
N2
P2aP2b
N3
P4
N4
P600
Fig. 2. Flowchart describing the method. (A) The reference signal and a sample signal. (Bapplied in interval adaptively shifted in time, according to the morphology of the data. (peaks, as measured in a normal population) is used to obtain a reference signal and to d
iðkÞ ¼ IJ jðkÞ. However, F is usually not linear and some constraints
must be imposed in order to avoid meaningless paths.
2.3.1. ConstraintsFirst of all, in the case of ERPs, the first and last points of the ref-
erence tðiÞ and the sample sðjÞ must coincide. Secondly, the twofunctions iðkÞ and jðkÞ must be continuous and monotonicallyincreasing from point (1,1) to point (I, J), as the time axis is.
The p-parameter is a local constraint that defines the minimum(maximum) amount of allowed expansion (1/compression) of thetime axis, thus constraining the possible path of F. The p-parameteris defined as the ratio between the number of steps in the diagonaldirection and the number of steps in horizontal or vertical direc-tion. Fig. 3, panel B, shows the possible local paths when p ¼ 1.
0 0.2 0.4 0.6 0.8 1 1.2 1.4 1.6 1.8 2
-8-6-4-202468
Ampl
itude
(
P4P600
P2BP2A
P1P0
N1N0
N2
N3
N4)V(
Ampl
itude
)V
Latency (sec)0 0.1 0.2 0.3 0.4 0.5 0.6 0.7 0.8
-15
-10
-50
5
10
15
N0
P0
N1
P1
N2
P2A P2B
N3
P4
N4
P600
reference
Peak variability derived from a normalpopulation
Latency (sec)
C
) The sample and the reference are aligned by means of DTW, then peak-picking isC) A priori information (mean and standard deviation of amplitudes and latencies of
efine parameters of ppDTW (i.e., warping window and interval for peak-picking).

Fig. 3. Dynamic Programming Algorithm: (A) Dissimilarity matrix D. (B) Left: paths allowed by a p-value of 1; right: DP equation used to compute the Cost matrix G. (C) Insidethe warping window, limited by r, the warping function F (red line) is found, giving the optimal mapping of the two time axes i and j. (For interpretation of the references tocolor in this figure legend, the reader is referred to the web version of this paper.)
1822 S. Assecondi et al. / Clinical Neurophysiology 120 (2009) 1819–1827
The r-parameter is a global constraint that limits the possibledisplacements of the warping function in the (i, j) plane, with re-spect to the diagonal, due to the fact that some points in the (i, j)plane are too far apart to possibly generate a meaningful warping(i.e., points at the beginning of the reference and points at the endof the sample). A simple warping window, shown in Fig. 3, panel C,is defined by a constant r, called window length, as follows (Sakoeand Chiba, 1978):
iðkÞ � jðkÞj j 6 r: ð1Þ
2.3.2. Distance metricAs mentioned above, the optimum warping function minimises
a certain distance measure between time series. The distance mea-sure in DTW is very important and must reflect the propertiescommon to the features one wants to match, such as amplitudeand shape (i.e., derivative). A possible distance metric, used in thiswork, accounting for amplitude and slope of the signal, is definedas follows:
dði; jÞ ¼ jtðiÞ � sðjÞj þ j_tðiÞ � _sðjÞj; ð2Þ
where the first term is the absolute value of the difference betweenthe amplitude of t and s and the second term is the absolute value ofthe difference between the first derivative of t and s.
2.3.3. Dynamic programmingOnce all the parameters (distance metric, p-parameter, and r-
parameter) are defined, the optimal path has to be found. Sakoeand Chiba (1978) proposed Dynamic Programming (Bellman and
Dreyfus, 1962) as an efficient way of solving the problem of pathfinding.
DTW is described in Fig. 3. First, a Distance Matrix D ¼ ½dði; jÞ� iscalculated, according to Section 2.3.2. Then, from D a Cost MatrixG ¼ ½gði; jÞ� is derived as follows:
gði; jÞ ¼ mink
XK 0k¼1
dðiðkÞ; jðkÞÞ �wðkÞ; ð3Þ
where gði; jÞ is the minimum cost necessary to align the first i pointsof the reference with the first j points of the sample, K0 is the lengthof the path associated to the minimum cost, wðkÞ are weightingcoefficients to avoid bias towards the diagonal.
The warping function F is found by searching in G for the min-imum cost path that joins the upper right corner (point (I, J)) withthe lower left corner (point (1,1)) and it also is the path associatedto the minimum distance.
2.4. Algorithm
A flowchart describing the proposed method is shown in Fig. 2.The procedure is applied channel-wise and involves the followingsteps:
1. A reference signal is calculated as the interpolation of meanamplitudes and latencies, across channels and across tasks, ofthose peaks one wants to identify on the signals, as derivedfrom a normal population. The reference is shown in Fig. 2,panel A, right.
S. Assecondi et al. / Clinical Neurophysiology 120 (2009) 1819–1827 1823
2. The single-channel ERP is aligned to the reference, by means ofDTW. The r parameter, that defines the width of the warpingwindow, is chosen as the minimum inter-peak latency betweentwo consecutive negative (or positive) peaks in normal cogni-tive ERPs, that is, 100 ms (Luck, 2005). The p is empirically cho-sen equal to 1, as in Casarotto et al. (2005). The warping isshown in Fig. 2, panel B, upper part.
3. The alignment of the reference with the signal produces a tem-poral correspondence between samples on the reference andsamples on the signal. Therefore, physiologically relevant peaksidentified on the reference are automatically identified on thesignal as well, as shown by the red lines in Fig. 2, panel B.
4. In order to refine the identification, an a posteriori peak-pick-ing is applied. For each peak identified on the signal by thewarping, a symmetric temporal window around the peak, ofthe same width as the searching windows used in traditionalpeak-picking, as shown in Fig. 2, panel B, lower part, isdefined and a search for maxima (or minima) is performedin that interval. If a maximum (or a minimum) is actuallypresent in the temporal window, the point is marked as apositive (or negative) peak, otherwise the peak is consideredmissing.
5. The procedure is then repeated for the other ERP channels.
2.5. Evaluation
In order to quantify and evaluate the performance of the afore-mentioned methods, the proposed ppDTW and the traditionalpeak-picking are compared. The automatic scoring on experimen-tal data are compared with the scoring of an expert clinician(G.A.C.) and the following quantities are defined (Makhoul et al.,1999):
� correct identification (C): a peak is identified at the same latencyby the expert and by the method;
� substitution (S): a peak is identified at a different latency by theexpert and by the method;
� deletion (D): a peak is identified by the expert but not by themethod;
� insertion (I): a peak is identified by the method but not by theexpert;
� total number of peaks in the reference (N); and� total number of measured peaks (M).
From the above quantities, precision (P), recall (R) and F-score(F) are calculated as follows:
P ¼ CC þ Sþ I
¼ CM
R ¼ CC þ Sþ D
¼ CN
F ¼ 12Pþ 1
2R
� �ð�1Þ
¼ 2PRP þ R
ð4Þ
where N ¼ C þ Sþ D and M ¼ C þ Sþ I. Precision depends on theinsertions or false positives, while recall depends on the deletions,or false negatives. The F-score is the weighted harmonic mean ofprecision and recall and it represents the global performance whenthe same importance is given to both precision and recall. The F-score is related to all the possible identification errors (insertions,deletions and substitutions). Precision, recall and F-score have val-ues between 0 and 1.
Using SPSS 15.0 (SPSS Inc., Chicago, IL, USA), we performed ananalysis of variance (ANOVA) investigating the main and interac-tion effects of Method, Task, Latency and Group on precision, recall
and F-score. For the sake of clarity and to maintain the focus on theperformance of the two methods, in the following, we only showand discuss results significant in at least one of the performancemeasures. We applied a (2 � 2 � 3 � 3) ANOVA with 3 repeated-measurement factors (Method (pp, ppDTW), Task (LP, SP, LRE)and Latency Range (early, middle and late latency components)and 1 between-group factor (normal and dyslexic)). The Green-house–Geisser correction was applied to the Task and LatencyRange effects. Significant factors were then tested by means of apaired two-tailed Student’s t test and the absolute t-values are re-ported. Differences are labelled as significant, very significant orhighly significant, when p < 0:05; p < 0:01 and p < 0:001,respectively.
Since ERP peaks are considered clinically relevant only whentheir peak-to-peak amplitude exceeds the background noise, wecalculate precision and recall only for peaks exceeding the meanpeak-to-peak amplitude in the baseline plus one standarddeviation.
3. Results
In this section, we present the performance of the two methodsin terms of precision, recall and F-score, as achieved when theautomated scoring is compared to the scoring of an expert clinician(gold standard).
Fig. 4 shows an example of the performance on one ERP chan-nel for different tasks and different pathologies. The black arrowsmark disagreement between the automatic scoring and the visualscoring of an expert clinician. We see that, even with noisy timeseries, ppDTW is able to identify peaks that are missed by peak-picking.
The significant interactions and main effects are reported in Ta-ble 2 while the marginal means and follow-up analysis by means ofpaired Student’s t-tests are reported in Table 3.
Main effects: The main effects for precision, recall and F-scoreare shown in Fig. 5. We found a main significant effect of Methodand Task in recall and F-score. A main significant effect of Latencywas found in precision, recall and F-score. No main effect wasfound for Group for any of the measures.
� Method: Methods differed for recall and F-score, ppDTW beingbetter than peak-picking, while they did not differ for precision.
� Task: Recall and F-score were worse for the LP and the LRE tasksthan for the SP task and did not differ between the LP and LREtasks. The task factor did not affect the precision.
� Latency: Precision, recall and F-score were worse for middle andlate latencies than for early latencies. Precision was worse forthe late compared to the middle latencies. Recall was worsefor the middle than for the late latencies. F-score did not differbetween middle and late latencies.
Interactions: We found a significant interaction between Meth-od and Latency for all the measures, between Task and Latencyfor recall and F-score and between Method, Latency and Groupfor precision.
� Method � Latency: The interaction of Method and Latency isshown in Fig. 6. Table 4 reports the marginal means and the t-statistic, when pairwise t-tests were performed on the signifi-cant interaction factors. Considering precision, methods differedfor early latencies only, with ppDTW being worse than peak-picking. Considering recall and F-score, though ppDTW beingbetter than peak-picking for all latencies (given a significantmain effect of Method), these effects were more evident at themiddle latencies.
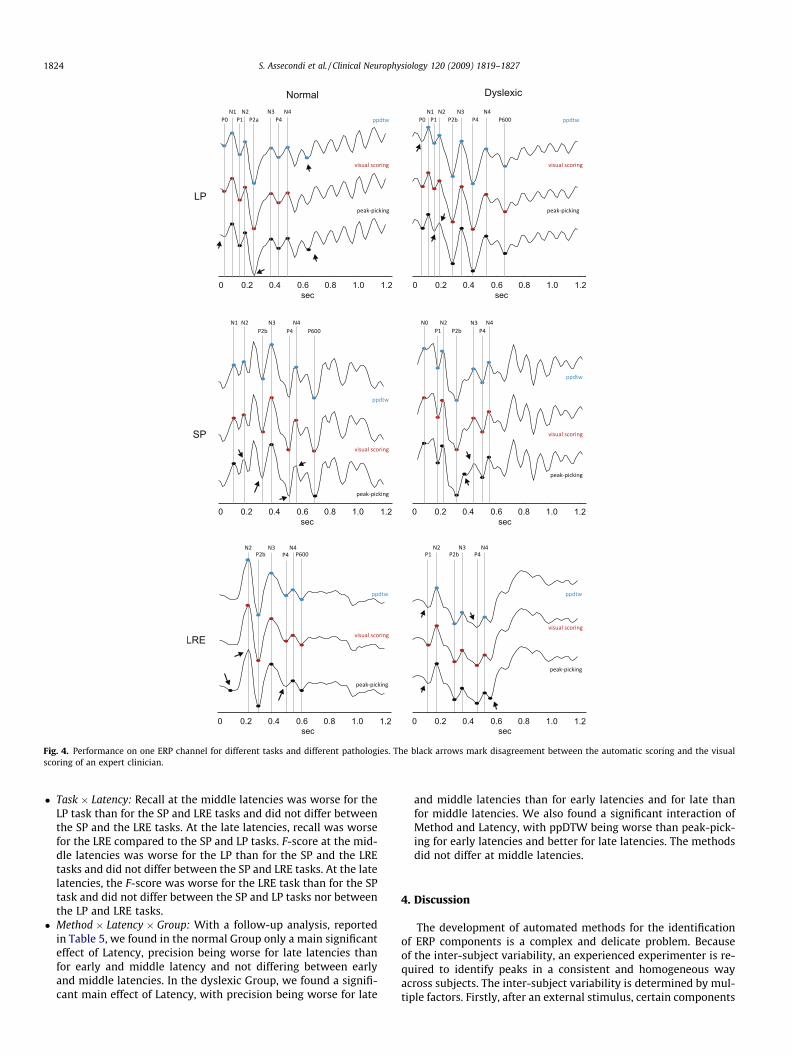
Fig. 4. Performance on one ERP channel for different tasks and different pathologies. The black arrows mark disagreement between the automatic scoring and the visualscoring of an expert clinician.
1824 S. Assecondi et al. / Clinical Neurophysiology 120 (2009) 1819–1827
� Task � Latency: Recall at the middle latencies was worse for theLP task than for the SP and LRE tasks and did not differ betweenthe SP and the LRE tasks. At the late latencies, recall was worsefor the LRE compared to the SP and LP tasks. F-score at the mid-dle latencies was worse for the LP than for the SP and the LREtasks and did not differ between the SP and LRE tasks. At the latelatencies, the F-score was worse for the LRE task than for the SPtask and did not differ between the SP and LP tasks nor betweenthe LP and LRE tasks.
� Method � Latency � Group: With a follow-up analysis, reportedin Table 5, we found in the normal Group only a main significanteffect of Latency, precision being worse for late latencies thanfor early and middle latency and not differing between earlyand middle latencies. In the dyslexic Group, we found a signifi-cant main effect of Latency, with precision being worse for late
and middle latencies than for early latencies and for late thanfor middle latencies. We also found a significant interaction ofMethod and Latency, with ppDTW being worse than peak-pick-ing for early latencies and better for late latencies. The methodsdid not differ at middle latencies.
4. Discussion
The development of automated methods for the identificationof ERP components is a complex and delicate problem. Becauseof the inter-subject variability, an experienced experimenter is re-quired to identify peaks in a consistent and homogeneous wayacross subjects. The inter-subject variability is determined by mul-tiple factors. Firstly, after an external stimulus, certain components
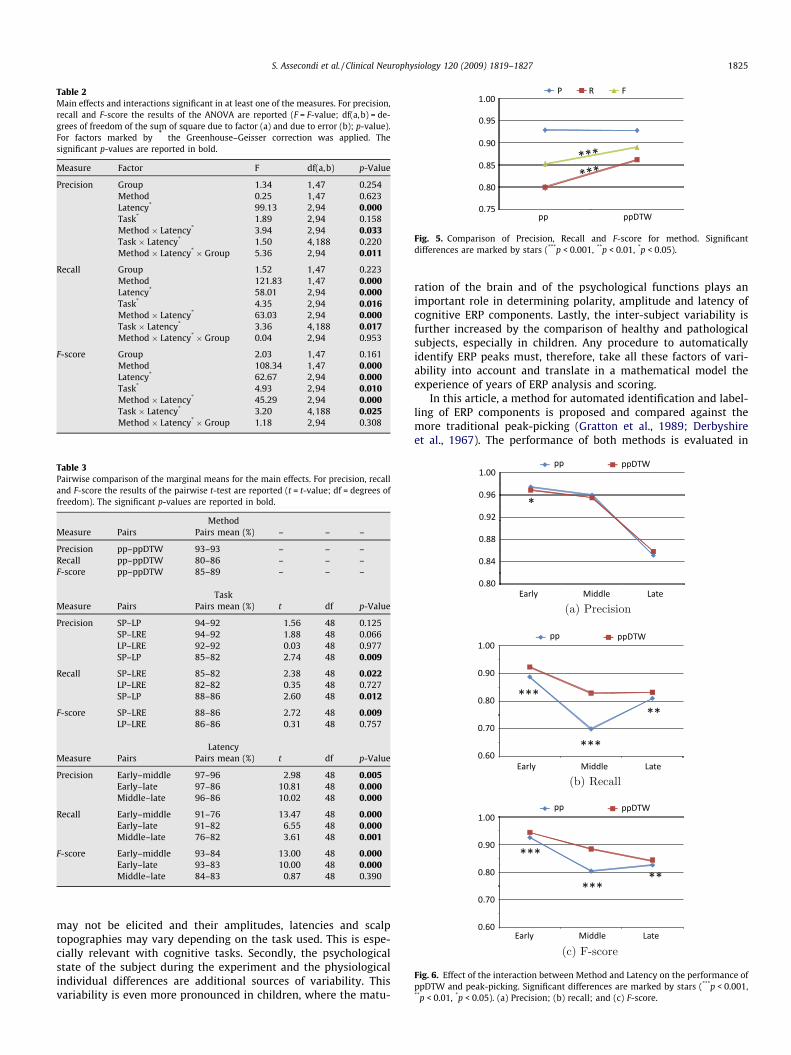
Table 2Main effects and interactions significant in at least one of the measures. For precision,recall and F-score the results of the ANOVA are reported (F = F-value; df(a,b) = de-grees of freedom of the sum of square due to factor (a) and due to error (b); p-value).For factors marked by * the Greenhouse–Geisser correction was applied. Thesignificant p-values are reported in bold.
Measure Factor F df(a,b) p-Value
Precision Group 1.34 1,47 0.254Method 0.25 1,47 0.623Latency* 99.13 2,94 0.000Task* 1.89 2,94 0.158Method � Latency* 3.94 2,94 0.033Task � Latency* 1.50 4,188 0.220Method � Latency* � Group 5.36 2,94 0.011
Recall Group 1.52 1,47 0.223Method 121.83 1,47 0.000Latency* 58.01 2,94 0.000Task* 4.35 2,94 0.016Method � Latency* 63.03 2,94 0.000Task � Latency* 3.36 4,188 0.017Method � Latency* � Group 0.04 2,94 0.953
F-score Group 2.03 1,47 0.161Method 108.34 1,47 0.000Latency* 62.67 2,94 0.000Task* 4.93 2,94 0.010Method � Latency* 45.29 2,94 0.000Task � Latency* 3.20 4,188 0.025Method � Latency* � Group 1.18 2,94 0.308
Table 3Pairwise comparison of the marginal means for the main effects. For precision, recalland F-score the results of the pairwise t-test are reported (t = t-value; df = degrees offreedom). The significant p-values are reported in bold.
MethodMeasure Pairs Pairs mean (%) – – –
Precision pp–ppDTW 93–93 – – –Recall pp–ppDTW 80–86 – – –F-score pp–ppDTW 85–89 – – –
TaskMeasure Pairs Pairs mean (%) t df p-Value
Precision SP–LP 94–92 1.56 48 0.125SP–LRE 94–92 1.88 48 0.066LP–LRE 92–92 0.03 48 0.977SP–LP 85–82 2.74 48 0.009
Recall SP–LRE 85–82 2.38 48 0.022LP–LRE 82–82 0.35 48 0.727SP–LP 88–86 2.60 48 0.012
F-score SP–LRE 88–86 2.72 48 0.009LP–LRE 86–86 0.31 48 0.757
LatencyMeasure Pairs Pairs mean (%) t df p-Value
Precision Early–middle 97–96 2.98 48 0.005Early–late 97–86 10.81 48 0.000Middle–late 96–86 10.02 48 0.000
Recall Early–middle 91–76 13.47 48 0.000Early–late 91–82 6.55 48 0.000Middle–late 76–82 3.61 48 0.001
F-score Early–middle 93–84 13.00 48 0.000Early–late 93–83 10.00 48 0.000Middle–late 84–83 0.87 48 0.390
Fig. 5. Comparison of Precision, Recall and F-score for method. Significantdifferences are marked by stars (***p < 0.001, **p < 0.01, *p < 0.05).
Fig. 6. Effect of the interaction between Method and Latency on the performance ofppDTW and peak-picking. Significant differences are marked by stars (***p < 0.001,**p < 0.01, *p < 0.05). (a) Precision; (b) recall; and (c) F-score.
S. Assecondi et al. / Clinical Neurophysiology 120 (2009) 1819–1827 1825
may not be elicited and their amplitudes, latencies and scalptopographies may vary depending on the task used. This is espe-cially relevant with cognitive tasks. Secondly, the psychologicalstate of the subject during the experiment and the physiologicalindividual differences are additional sources of variability. Thisvariability is even more pronounced in children, where the matu-
ration of the brain and of the psychological functions plays animportant role in determining polarity, amplitude and latency ofcognitive ERP components. Lastly, the inter-subject variability isfurther increased by the comparison of healthy and pathologicalsubjects, especially in children. Any procedure to automaticallyidentify ERP peaks must, therefore, take all these factors of vari-ability into account and translate in a mathematical model theexperience of years of ERP analysis and scoring.
In this article, a method for automated identification and label-ling of ERP components is proposed and compared against themore traditional peak-picking (Gratton et al., 1989; Derbyshireet al., 1967). The performance of both methods is evaluated in
Table 4Pairwise comparison of the marginal means for the interaction effects, significant inat least one of the measures. For precision, recall and F-score the results of thepairwise t-test are reported (t = t-value; df = degrees of freedom). The significant p-values are reported in bold.
Method � LatencyMeasure Pairs Pairs mean
(%)t df p-
Value
Precision (pp,early)–(ppDTW,early) 98–97 2.58 146 0.011(pp,middle)–(ppDTW,middle)
96–96 1.42 146 0.158
(pp,late)–(ppDTW,late) 85–86 1.60 146 0.111
Recall (pp,early)–(ppDTW,early) 89–92 5.81 146 0.000(pp,middle)–(ppDTW,middle)
70–83 17.79 146 0.000
(pp,late)–(ppDTW,late) 81–83 3.33 146 0.001
F-score (pp,early)–(ppDTW,early) 93–94 4.97 146 0.000(pp,middle)–(ppDTW,middle)
80–88 15.01 146 0.000
(pp,late)–(ppDTW,late) 83–84 2.95 146 0.004
Task � LatencyMeasure Pairs Pairs mean
(%)t df p-
Value
Recall (SP,early)–(LP,early) 91–90 0.55 97 0.584(SP,early)–(LRE,early) 91–91 0.30 97 0.762(LP,early)–(LRE,early) 90–91 0.98 97 0.328
(SP,middle)–(LP,middle) 78–74 4.35 97 0.000(SP,middle)–(LRE,middle) 78–77 1.20 97 0.234(LP,middle)–(LRE,middle) 74–77 2.85 97 0.005
(SP,late)–(LP,late) 85–82 1.59 97 0.114(SP,late)–(LRE,late) 85–79 3.59 97 0.001(LP,late)–(LRE,late) 82–79 1.77 97 0.079
F-score (SP,early)–(LP,early) 94–93 1.35 97 0.180(SP,early)–(LRE,early) 94–94 0.57 97 0.569(LP,early)–(LRE,early) 93–94 0.93 97 0.355
(SP,middle)–(LP,middle) 86–82 3.74 97 0.000(SP,middle)–(LRE,middle) 86–85 0.81 97 0.419(LP,middle)–(LRE,middle) 82–85 2.88 97 0.005
(SP,late)–(LP,late) 86–83 1.84 97 0.070(SP,late)–(LRE,late) 86–81 3.77 97 0.000(LP,late)–(LRE,late) 83–81 1.75 97 0.083
1826 S. Assecondi et al. / Clinical Neurophysiology 120 (2009) 1819–1827
terms of precision and recall, when the automatic scoring is com-pared to the scoring of an expert clinician, considered as gold stan-
Table 5Interaction of Method � Latency � Group for precision. The results of the follow-up ANOVAof square due to factor (a) and due to error (b); p-value, t = t-value; df = degrees of freesignificant p-values are reported in bold.
Normal gFactor F df(a,b) p-Value Pairs
Method 4.23 1,25 0.050 –Early–middl
Latency* 54.29 2,50 0.000 Early–lateMiddle–late
Method � Latency* 0.28 2,50 0.706 –
Dyslexic gFactor F df(a,b) p-Value Pairs
Method 0.67 1,22 0.421 –Early–middl
Latency* 49.85 2,44 0.000 Early–lateMiddle–late(pp,early)–(p
Method � Latency* 13.05 2,44 0.000 (pp,middle)–(pp,late)–(pp
dard. The novelty of the proposed method, when compared topreviously introduced approaches based on DTW, resides, on theone hand, in the use of a priori knowledge of the ERP under inves-tigation in the DTW constraints as well as in the computation ofthe reference signal. On the other hand, ppDTW integrates thetwo previously introduced independent approaches: DTW andpeak-picking. In our framework, DTW is followed by an a posteriorisearch for maxima and minima. This search is equivalent to apply-ing peak-picking in intervals that are adaptively shifted in time, asdetermined by the warping with a reference signal, on the basis ofthe morphology of the data. This characteristic overcomes themain limitation of peak-picking, that is, the fact that the searchinginterval are pre-defined for all subjects and, therefore, the difficultyof coping with the inter-subject variability of ERPs. The good per-formance obtained in dyslexic children, when the template is com-puted from the control group, and the lack of a significant maineffect for the factor Group show that a priori knowledge is only alittle constraint for the method.
As stated above, the alignment of the reference signal with theERP provides a temporal correspondence between samples of thereference and samples of the ERP. As a consequence, features iden-tified on the reference are automatically identified and labelled onthe ERP. Therefore, it is important that the reference presents allthe features we are interested in. However, when a reference is de-fined as the average across subjects, as in Casarotto et al. (2005),some peaks may not be visible on the reference. This is due tothe large inter-subject variability, which is characteristic for cogni-tive ERPs. In this article, we propose an alternative reference sig-nal: mean amplitudes and latencies for those peaks that we wantto identify on the signals are derived as the mean amplitude andlatency across channels and across tasks, from a normal popula-tion. These points are then interpolated, thus obtaining a referencecurve that represents the average peaks. The use of such a refer-ence signal avoids the possibility that some peaks are systemati-cally missed because they are not present on the reference. It isworth mentioning that a template can be derived from the litera-ture data, from a proper database, from theoretical models, etc.,thus making the method even more general.
The amplitudes and latencies of peaks in the normal populationwere measured by identifying a time window for each peak and sub-sequently applying peak-picking. The time window for a given peakwas determined by superimposing the single-subject averages andby taking into account the earliest and the latest peaks. Then, themeasures obtained by peak-picking were visually inspected by anexpert and, if it was the case, corrected. This kind of ‘‘informed”
and pairwise t-test are reported (F = F-value; df(a, b) = degrees of freedom of the sumdom). For factors marked by * the Greenhouse–Geisser correction was applied. The
roupPairs mean (%) t df p-Value
– – – –e 96–96 0.40 25 0.691
96–84 7.93 25 0.00096–84 7.80 25 0.000– – – –
roupPairs mean (%) t df p-Value
– – – –e 98–96 3.43 22 0.012
98–87 7.33 22 0.00096–87 7.17 22 0.000
pDTW,early) 98–97 3.36 22 0.003(ppDTW,middle) 96–95 1.12 22 0.273DTW,late) 86–88 3.65 22 0.001
S. Assecondi et al. / Clinical Neurophysiology 120 (2009) 1819–1827 1827
search allowed us to greatly reduce the time necessary to identify theamplitudes and latencies and to only correct the misdetections. Themeasures identified in this way were then used to construct the tem-plate for ppDTW. Therefore, the method is valuable even when deal-ing with new original paradigms, for which literature data arelacking but some components are expected, because of the intrinsicdesign and structure of the experiment.
Similarly, the definition of the r parameter is based on valuesmeasured in a normal population. The use of a priori informationmay guide the user during the choice of the parameters, thoughsmall changes of the value of r do not significantly affect the per-formance of the method.
We assume that the template contains all the peaks that couldpossibly arise on the ERP. However, someone may also be inter-ested in identifying a subset of peaks, representative for the mainmorphology of the ERP. In this case ppDTW would still be able tocope with the inter-subject variability, better than peak-picking,since ppDTW would still be able to exploit the morphology ofthe signal.
The performance of automated methods for the identification ofERP components is strongly affected by the inter-subject variabilityof the latencies of meaningful peaks. This effect is clearly shown bythe results of the ANOVA test performed, where a main effect ofTask and Latency was found. Better performance is achieved atearly latencies, characterised by less variability. For the same rea-son, better results are obtained in the SP task, in which late, morevariable, components are less prominent than in the LP or LREtasks.
The ANOVA study also showed that recall achieved by ppDTW isalways significantly higher than by peak-picking, meaning thatppDTW is less likely than peak-picking to miss a peak. This isdue to the fact that the searching intervals for ppDTW are shiftedin time, according to the morphology of the data, and thus notfixed as in peak-picking. The overall absence of significant differ-ences in precision is due to the fact that the a posteriori searchfor peaks, that is very efficient, is equivalent in both peak-pickingand ppDTW.
Only in early latency peaks the precision achieved by peak-picking is significantly higher than in ppDTW. This is due tothe fact that early latency peaks have a small latency variability,thus being less prone to jitter due to inter-subject variability. Inpeak-picking, the searching intervals are defined a priori: oncethey are carefully chosen, peak-picking is likely to give verygood performance with peaks with small latency variability.However, some flexibility, that is a trade-off between very highperformance at the early latencies or good performance at boththe early and the late latencies must be given to ppDTW in orderto deal at the same time with peaks with small and large latencyvariability.
5. Conclusion
We proved that taking into account the morphology of the data,prior to peak-picking significantly improves the performance of theautomated detection method. We demonstrated that the proposedmethod is successfully applied to ERPs recorded in both normaland dyslexic children, for different tasks and when applied to dif-ferent latency ranges. We show that our hybrid method achievesthe best performance.
Acknowledgments
The authors thank Jonne Oldenburg and Ruth Seurinck (Depart-ment of Experimental Psychology, Ghent University, Ghent, Bel-gium) for their contribution to the statistical analysis.
The authors thank the two anonymous referees for their usefulcomments and suggestions.
References
Bellman R, Dreyfus S. Applied dynamic programming. Princeton (NJ): PrincetonUniversity Press; 1962.
Casarotto S, Bianchi A, Cerutti S, Chiarenza G. Principal component analysis forreduction of ocular artefacts in event-related potentials of normal and dyslexicchildren. Clin Neurophysiol 2004;115(3):609–19.
Casarotto S, Bianchi A, Cerutti S, Chiarenza G. Dynamic time warping in the analysisof event-related potentials. EMB Mag 2005;24(1):68–77.
Chiarenza GA, Casarotto S. Imparare a leggere: i meccanismi psicofisiologici. Quadacp 2004;11(5):212–5.
Cohen A. Biomedical signal processing: compression and automatic recognition, vol.2; 1986 [Chapter: Time warping].
Derbyshire A, Driessen G, Palmer C. Technical advances in the analysis of singleacoustically evoked potentials. Electroenceph Clin Neurophysiol 1967;22:476–81.
Gratton G, Kramer A, Coles G, Donchin E. Simulation studies of latency measures ofcomponents of the event-related brain potential. Psychophisiology 1989;26(2):233–48.
Gupta L, Molfese D, Tammana R, Simos P. Nonlinear alignment and averaging forestimating the evoked potential. IEEE Trans Biomed Eng 1996;43(4):348–56.
Jaskowski P, Verleger R. Amplitudes and latencies of single-trial ERP’s estimated bya maximum-likelihood method. IEEE Tran Biomed Eng 1999;46(8):987–93.
Luck S. An introduction to the event-related potential technique. Cambridge(MA): MIT Press; 2005.
Makhoul J, Kubala F, Schwartz R, Weischedel R. Performance measures forinformation extraction. In: Proceedings of DARPA broadcast news workshop;1999. p. 249–52.
Pham DN, Möcks J, Kohler W, Gasser T. Variable latencies of noisy signals:estimation and testing in brain potential data. Biometrika 1987;74(3):525–33.
Picton T, Hunt M, Mowrey R, Rodriguez R, Maru J. Evaluation of brain-stem auditoryevoked potentials using dynamic time warping. Electroenceph ClinNeurophysiol 1988;71(3):212–25.
Sakoe H, Chiba S. Dynamic programming algorithm optimization for spoken wordrecognition. IEEE Trans Acoust Speech Signal Process 1978;ASSP-26(1):43–9.
Wang K, Begleiter H, Porjesz B. Warp-averaging event-related potentials. ClinNeurophysiol 2001;112:1917–24.
Woody C. Characterization of an adaptive filter for the analysis of variable latencyneuroelectrical signals. Med Biol Eng 1967;5:539–53.
World Health Organization. International statistical classification of diseases andrelated health problems, 10th ed.; 2007.