Study of candidate genes for dyslexia in Brazilian individuals
Upload
khangminh22Category
view
1download
0
A STATISTICAL STUDY OF SPECIFIC DYSLEXIA-
CHARACTERISTICS AND SYNDROME PATTERNS
A Dissertation
Presented to
The Faculty of the Department of Psychology
University of Houston
In Partial Fulfillment
of the Requirements for the Degree
Doctor of Philosophy
byClifton W. Wolf
June, 1968
463848

A STATISTICAL STUDY OF SPECIFIC DYSLEXIA
CHARACTERISTICS AND SYNDROME PATTERNS
An Abstract of a Dissertation
Presented to
The Faculty of the Department of Psychology
University of Houston
In Partial Fulfillment
of the Requirements for the Degree
Doctor of Philosophy
byClifton W. Wolf
June, 1968

AN ABSTRACT
Clinically significant variables reported in the
literature on specific dyslexia were experimentally studied
in matched group design. The experimental and control
groups consisted of 32 and 23 third and fourth grade chil
dren respectively. The children came from families in the
middle to above average socioeconomic classification. They
were free of medical problems and personality-emotional disturbances, and they had above average intelligence. Selection
variables, 10 in all, were statistically held constant with
the exception of reading and spelling. The experimental
group was one or more years below grade level on reading
and spelling and the control group was at or above grade
level on reading and spelling.
The two groups were compared on 197 variables in
the following areas: (a) intelligence (WISC); (b) education-
reading, writing, spelling, and arithmetic; (c) visual per
ception; (d) auditory perception; (e) speech; (f) psycho
neurological; (g) neurological; (h) EEG; (i) medical history;
and (j) familial history of language disability.
The data were analyzed by means of simple analysis
of variance, intercorrelation of significant variables, factor
iv

analysis, hierarchical grouping analysis, and analysis of
variance of variables used in the hierarchical grouping
analysis. These procedures produced 43 significant vari
ables, 14 factors, and three syndrome patterns of specific dyslexia.
v

Acknow1edgements
The completion of this dissertation was achieved througn
the patient and thoughtful help of many individuals. The
chairman of my dissertation committee, Dr. Shalom B. Vineberg,
devoted many hours of constructive criticism, guidance,
and editorial assistance. Acknowledgement of assistance
from other members of the committee, Drs. Genieve Arnold,
Gerald Gratch, Dale L. Johnson, and Lawrence S. Me Gaughran, is given.
The data for the dissertation were collected from
students evaluated at the Dean Memorial Pediatric Neurology
Division, Scottish Rite Hospital, Dallas, Texas. The fin
ancial support, staff help, and facilities provided by
Scottish Rite Hospital were of utmost importance. Financial
help and encouragement were also provided by Mr. Wilton
Fair, Fair Foundation, Tyler, Texas.
Personal consultation with Mrs. Sally Childs, specialist in language training, Clinton, Connecticut, and correspond
ence with Drs. Benton, Birch, and Hagm, contributed sig
nificantly to the early planning of the study.
Dr. Donald J. Veldman of the University of Texas is
given special acknowledgement for his insight in helping
vi

develop the experimental design and planning of the statist!
cal programs.
Grateful appreciation for individual help is expressed
to Mr. Mack Wilder, Mr. Rudolph Tatsch, Miss Dorothy
Jennings, Mrs. Cloe Jones, Dr. June Ford, Mrs. Peggy
Thompson, and my wife, Lorraine. Each contributed his or
her talents generously.
My deepest debt of gratitude is reserved for Dr. Lucius Waites, pediatric neurologist, Scottish Rite Hospital, He
and his staff accepted a member from amother discipline who
proposed a study involving many hours of the staff's time
and one entailing many problems of scheduling students for
evaluation. Dr. Waites conducted the neurological examina
tion, interpreted the EEG tracings, and supervised the administration of the Medical History Inventory. The
support of Dr. 'Aites and his monitoring of many technical
and practical problems, assisted by Mrs. Dorothy Colgin,
brought this study to fullest fruition.
vix
TABLE OF CONTENTS
CHAPTER PAGE
I. THE PROBLEM.................................... 1
Prevalence of Reading Disability . . . « . 2
Prevalence of Dyslexia .......... 4
Personal Adjustment Problems ..•.••• 5
Proliferation of Labels Regarding Dyslexia............... . . 8
Definitions of Dyslexia 13
Problems Associated with Dyslexic Research.................................. 27
Age of Subjects Evaluated •...«• 27
Clinical-Observational vs.Experimental Research ........ 28
Reliability and Validity of Standardized Measurement Instruments . . 29
Use of Different Instruments to Measure the Same Function ...... 30
Neurological Evaluation and Classification of Children with Dyslexia. . 33
Assumed Extraneous Variables-- Early Child-Rearing Practices, Sensory Deprivation, Impoverished Cultural and Educational Background, and Emotional-Personality Factors . . 35
Neglect of Relevant Research......... 36
Longitudinal Studies. ........ 37
Confusion in Terminology. ...... 38

CHAPTER PAGE
Limited Scope of Measurement • • • • 38
Inadequate or Incomplete Diagnostic Criteria............................ 40
Methodological Approaches to the Study of Dyslexia 41
Need for New Measurement Instruments. « • 43II. REVIEW OF THE LITERATURE................... 45
Basic Conceptions of Dyslexia ...... 46Experimental Studies. .......... 52
Cerebral Dominance. ........... 59
Relation of Dyslexia and General Reading Disability to Minimal Brain Damage and Motor Incoordination . . . . . 62
Auditory Variables. . .................... 68
Auditory Discrimination ...... 69
Auditory Memory. .......... 71
Auditory Blending. ......... 72
Auditory Attention ......... 73Auditory Intersensory Functions . . 73
Speech..................................... 76
Ophthalmological Problems ........ 78
Summary ............ 81III. METHODS AND PROCEDURES......................... 89
Selection of Subjects and Criterion Variables.............................. . 90
ix

CHAPTER PAGE
Test Battery and Testing Procedures , . • 98
Description of Measurement Instruments e • . ................. 101
General Remarks about the Language Evaluation ................... . • . 102
Gilmore Oral Reading Test (Form A)........................ 102
Wide Range Achievement Test (reading) ..••••••••• 104
Alphabet (verbal recitation). . 105
Auditory Blending Test. . . . • 105
Auditory Intersensory Integration Test. . . . ........... 105
Letter Recognition Test . . . . 106
Benton’s Revised Visual Retention Test. ......... 107
Minnesota Percepto-Diagnostic Test............................ 107
Benton’s Right-Left Discrimination Test.......... . . 108
Harris Test of LateralDominance . . . ............. . 109The A-B-C Vision Test for Ocular Dominance. ....... IllBenton’s Finger Localization Test............................ Ill
Intellectual Evaluation (WISC) . . . 112
x

CHAPTER PAGE
Neurological Evaluation ..•••• 113
Clinical Neurological Examination................... 113
EEG........................... 113
Auditory Evaluation 114
Seashore Measures of Musical Talents. 115
Sound Localization Test. . . . 115
Signal to Noise Ratio. . . . . 116
Wepman Auditory Discrimination Test. . .................. 116
Speech Evaluation ......... 117
Tempim-Darley Screening Test for Articulation, . . . . 117
Diadochokinesis. ....... 118
Group Testing................ 118
Iowa Silent Reading Test (Form 4)................ 119
SRA Primary Mental Abilities . 119
Coloured Progressive Matrices (1956).................. 119
Wide Range Achievement Test (spelling)........ . . . . 120
Wide Range Achievement Test (arithmetic)................. 120
Alphabet (written) ........... 120
xi

CHAPTER PAGE
Handwriting 120
Interview Schedules. ......... 122
Medical History Inventory . . ♦ 122Familial History of Language Disability. . ............. . . 122
Statistical Analysis of Data. ...... 123
Analysis of Variance ............... 123
Intercorrelation of SignificantVariables. ............. 124
Principal Axis Factor Analysis with Varimax Rotation. ....... 124
Hierarchical Grouping Analysis . . . 124
Analysis of Variance of the Variables Selected from the Factor Analysis for the Groups Identifiedby Hierarchical Grouping Analysis. . 125
IV. RESULTS....................................... 127
Significant Variables Identifying theExperimental Group . . . . .............. 127Intercorrelation of Significant Variables ..................................... 131
Factor Analysis of Significant Variables . . .............................. . 132
Hierarchical Grouping Analysis of theExperimental Group. ................. . . 133
Analysis of Variance of the Important Loadings from the Factor Analysis Used in the HierarchicalGrouping Analysis..................... . 134
xii

CHAPTER PAGE
V. DISCUSSION OF RESULTS.................... 134
Quantitative Differences between the Experimental and Control Groups • . . . . 204
Miscellaneous Variable 205Language . . ............. 206
Reading. ..........o... 206
Handwriting.......... 209
Spelling ............... ...... 209
Alphabet........................ 213Arithmetic............... 213
Intellectual ............ 214
Visual Perception. ......... 217
Auditory . ............. 224
Speech . ............. 228
Lateral Dominance. ......... 228Right-Left Discrimination. . . . . . 230Finger Localization............. 231
Neurological Examination ........... 232
EEG............................... 233
Medical History. ................. . 234
Familial History of LanguageDisability..................... . . 235
Statistical Characteristics of theExperimental Group. ........... 239

CHAPTER PAGE
Intercorrelation of SignificantVariables.Principal Axis Factor Analysis with Varimax Rotation............... 243
Syndrome Patterns of Specific Dyslexia. . 254Implications for Research ........ 262
VI. SUMMARY AND CONCLUSIONS...................... 267
Summary ................. 267
Conclusions 268
Recommendations . ................. . . . 269REFERENCES.............................................. 270
APPENDIX A.............................................. 289
APPENDIX ............................................... 291
APPENDIX C................. . . . 295
APPENDIX ............................................... 299
APPENDIX E.............................................. 307APPENDIX F.............................................. 311
APPENDIX G.............................................. 318
XIV

LIST OF TABLES
TABLES PAGE
1. TERMS SIMILAR IN MEANING TO THE TERM"DYSLEXIA" (from Drew, 1956) ................. 10
2. SOME CHARACTERISTICS OF SPECIFIC DYSLEXIA
AS REPORTED IN THE LITERATURE BY VARIOUS
BUT NOT ALL AUTHORITIES.......... 82
3. COMPARISON OF EXPERIMENTAL AND CONTROL GROUPSON CERTAIN CRITERION VARIABLES ............... 96
4. COMPARISON OF EXPERIMENTAL AND CONTROL CROUPS
ON THE WISC FULL SCALE IQ...................... 975. VARIABLES SIGNIFICANT AT THE .05 LEVEL OR LESS
DERIVED FROM ANALYSIS OF VARIANCE OF EXPERI
MENTAL AND CONTROL GROUPS............. 139
6. VARIABLES SIGNIFICANT BETWEEN THE .06 AND .10 LEVELS DERIVED FROM ANALYSIS OF VARIANCEOF EXPERIMENTAL AND CONTROL GROUPS........... 148
7. SIGNIFICANT VARIABLES AT THE .05 LEVEL0
OR LESS.......................................... 152
8. VARIABLES TENDING TOWARD SIGNIFICANCE (.06 TO
.10 LEVEL)..................................... 155
xv

TABLE PAGE
9. NUMBER AND PERCENT OF SIGNIFICANT VARIABLES
ACCORDING TO AREAS OF MEASUREMENT..... 15710. IDENTIFICATION OF 43 SIGNIFICANT VARIABLES
BY VARIABLE NUMBER AS THEY APPEAR IN TABLE
11.............................................. 159
11. INTERCORRELATION OF SIGNIFICANT VARIABLES
DERIVED FROM ANALYSIS OF VARIANCE ........... 162
12. SIGNIFICANT INTERCORRELATIONS OF VARIABLES. . 172
13. IMPORTANT LOADINGS IN ROTATED FACTOR ANALYSIS OF 43 SIGNIFICANT VARIABLES LISTED IN TABLE
5.............................................. 187
14. VARIABLES WITH HIGHEST LOADINGS SELECTED FROM
ROTATED FACTOR ANALYSIS FOR USE IN HIERARCHICAL
GROUPING ANALYSIS ............................ 19215. ORGANIZATION BY AREAS OF MEASUREMENT OF 14
FACTORS AND THEIR HIGHEST LOADINGS DERIVED FROM
FACTOR ANALYSIS.............................. 194
16. NAMES OF FACTORS IN ROTATED FACTOR ANALYSIS . 196
17. ASSIGNMENT OF CHILDREN IN EXPERIMENTAL GROUP
TO MUTUALLY EXCLUSIVE GROUPS ACCORDING TO
HIERARCHICAL GROUPING ANALYSIS............... 197
xvi

TABLE PAGE
18. ANALYSIS OF VARIANCE OF 14 IMPORTANT LOADINGS
FROM FACTOR ANALYSIS USED IN THE HIERARCHICAL GROUPING ANALYSIS INDICATING SYNDROME PATTERNSOF SPECIFIC DYSLEXIA............... 198
19. QUALITATIVE DESCRIPTION OF THE PERFORMANCE OF
THREE SUBGROUPS OF CHILDREN WITH SPECIFIC DYS
LEXIA ON A SELECT NUMBER OF SIGNIFICANT
VARIABLES. . . . . ........................ . . 201
20. EXAMPLES OF MISSPELLED WORDS BY EXPERIMENTAL
GROUP............................................ 212
21. READING AND SPELLING LEVELS FOR THE EXPERI
MENTAL AND CONTROL GROUPS............... 261
FIGURES
1. PROFILE OF STANDARD SCORES DERIVED FROM ANALYSIS OF VARIANCE OF THREE SYNDROME PATTERNS IDENTIFIED
BY HIERARCHICAL GROUPING ANALYSIS............. 202
2. PROFILE OF VARIABLES WITH SIGNIFICANT GROUP FRATIOS DERIVED FROM THE VARIABLES IN FIG. 1. . 203
3. HANDWRITING OF ONE SUBJECT IN THE EXPERIMENTAL
GROUP. . ........................ ....... 210
xvii

CHAPTER ITHE PROBLEM
The child or adult with a reading disability is a dis
advantaged person in our highly literate and technological
society. This disability can affect him educationally,
psychologically, socially, and economically. The person
who reads poorly is at an educational disadvantage, as
ability to read adequately is the prime requisite and basic foundation for most academic learning, whether it be at
the elementary level or the graduate level. Psychologi
cally, the poor reader learns early in life that he is
different from others, a difference that is significant to him as it often forms the basis for ridicule and rejection. Even though the disabled reader may have adequate to even
superior intelligence, his placement in the low reading group at school marks him as an inferior person. As the
child progresses through school a poor self-concept de
velops, with concommitant feelings of inferiority, inade
quacy, and worthlessness. These attitudes toward the self
begin to influence his social behavior and his style of interpersonal relations. Economically, this person as an
• adult probably will not realize his full potential, for he

2
may drop out of school. Or, he may not go on to college,
even though his level of intelligence would warrant such.
The following references in the literature are presented, therefore, as justification for the contention that
reading disability presents a serious problem to many individuals in particular and to society as a whole.
Prevalence of Reading Disability
A number of authorities in education, psychology, and medicine have estimated the prevalence of school children
who have a reading disability. Their information came from
clinical experience, per cent of children with reading prob
lems evaluated at child guidance centers, and school surveys.
The following estimates concern only the prevalence or ex
tent of reading problems; they do not refer to any particular type of reading disability.
Preston (1940) and Hallgren (1950) both were of the opinion that the incidence of children with poor reading
ability was 20%. Betts (1946) wrote that 40% of school pupils could not read text books written for use at grade
level. Robinson (1953) wrote, "Authorities estimate
that 10 to 20% of pupils in grades 2-6 fall in the category of poor readers (p. 562)." Conant (1959), after an

3
extensive survey of American education, concluded that ap
proximately 10 to 15% of children entering high school had a reading disability at the fourth to sixth grade level, and
they were not mentally retarded. Bakwin and Bakwin (1960)
stated that 10% of all school children were below grade level in reading ability. Schiffman (1962) reported that
various authorities had estimated that 20 to 40% of school
children read considerably below capacity level. Mrs. Sally
Childs (1965), past president of the Orton Society, concluded that 20 to 30% of students were deficient in reading
ability, irrespective of etiology. Cronin (1965), re
marked, "Reliable authorities estimate that retarded readers make up 24% of the school population (p. 108)."
The above-mentioned estimates on the prevalence of
reading disability vary from 10 to 40%. A median score
of these estimates is roughly 20%. To illustrate con
cretely the extent of reading disability, Gillingham and
Stillman (1956) compared the number of children with a
reading disability with the number of children in other
disability categories. They wrote:
If ten per cent of them (number of children in the United States in 1953) are children whose reading and spelling are so poor as to demand special

4
training, then those in need of remedial instruction must approximate 3,411,340 compared with the 85,000 blind, the 513,000 deaf and the 513,000 crippled children of school age (pp. 16-17).
Other sources in the literature indicated the prev
alence of reading disability based on surveys. Durrell
(1940) studied 1,130 sixth grade students who were one or
more years below grade level in reading. He found that 27%
were of average to superior intelligence. Newbrough and
Kelly (1962) evaluated all sixth graders (3,946 students) in
one school system and found that 14% of them were two or
more years below their grade level.
Prevalence of Dyslexia
Dyslexia (specific language disability) is one type of
reading disability that has received considerable attention
in recent years. It stands in contrast to other types of reading problems associated with, for example, mental re
tardation, brain damage, and lack of adequate sensory stimu
lation and cultural exposure. A number of authorities have
estimated that the prevalence of dyslexia is approximately
10% of the entire population of school children (e.g., Bryant
& Patterson, 1962; Gallagher, 1960; Gillingham & Stillman,
1956; Ketchum, 1959; Rabinovitch, Drew, De Jong, Ingram, &
Withey, 1954).

5A few investigators have studied the exact incidence
of dyslexia. Their findings, therefore, are more reliable when considering the prevalence of this form of reading
disability. Malmquist (1960) studied reading disability among first graders (399 children) and found 8.5% were dys
lexic. Faigel (1965) evaluated 256 children in grades
two through six in one e]ementary school and found that
13% were dyslexic. Of this 13%, 80% were boys. Walker
and Cole (1965) studied 225 children in a school popula
tion consisting of families from the above-average socio
economic classification. They found that 25% of the
children had dyslexia.
Personal Adjustment Problems
Prevalence is only one aspect of poor reading. There
is the experiential part that involves real life conse
quences for the child or adult who suffers from a reading
disability. Rabinovitch, et al. (1954), in a strongly
worded statement, indicated the severity of the life ad
justment problems associated with a reading disability:
Although the reported statistics of incidence vary a good deal, it is likely that at least 10 per cent of children of average intelligence at school in the

6
United States are reading so inadequately for their grade placement as to impair their total adjustment (p. 363).
Gallagher (1960) was more specific in describing the
impact of a reading disability (dyslexia) on personal ad
justment :
If the difficulty of these young people is not then recognized and remedied, not only will there be failure in school but also excessive anxiety, loss of confidence, and family discord, following which any one of a number of psychosomatic symptoms may develop (p. 4).
Other references in the literature discussed the del
eterious influence of poor reading ability on the development of the emotional and personal life of children. Bender
(1963) wrote:
Experience with the problem children at Bellevue Hospital led to the early recognition that more than 50 per cent of boys with the kinds of problems that sent them there were nonreaders or severely retarded in reading . . . . It was also recognized that this is one of the most common causes of social or emotional maladjustment, behavior disorders, delinquencies, etc., in our young people (pp. 25-26).
Dozier (1963) stated:
the child with a specific reading disability (dyslexia) has a true inferiority, and this engenders in the majority of cases a personality reaction which is likely to be a problem (p. 20).
7
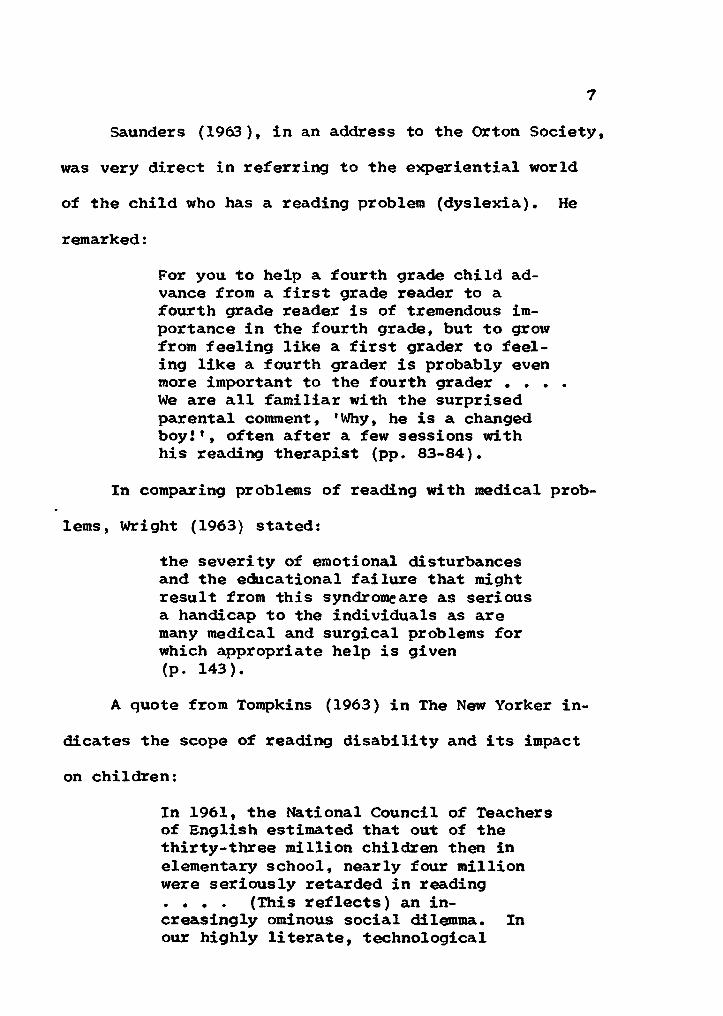
Saunders (1963), in an address to the Orton Society,
was very direct in referring to the experiential world
of the child who has a reading problem (dyslexia). He
remarked:
For you to help a fourth grade child advance from a first grade reader to a fourth grade reader is of tremendous importance in the fourth grade, but to grow from feeling like a first grader to feeling like a fourth grader is probably even more important to the fourth grader . . . . We are all familiar with the surprised parental comment, 'Why, he is a changed boy!*, often after a few sessions with his reading therapist (pp. 83-84).
In comparing problems of reading with medical problems, Wright (1963) stated:
the severity of emotional disturbances and the educational failure that might result from this syndromeare as serious a handicap to the individuals as are many medical and surgical problems for which appropriate help is given (p. 143).
A quote from Tompkins (1963) in The New Yorker in
dicates the scope of reading disability and its impact
on children:
In 1961, the National Council of Teachers of English estimated that out of the thirty-three million children then in elementary school, nearly four million were seriously retarded in reading . . . . (This reflects) an increasingly ominous social dilemma. In our highly literate, technological

8
society, the child who cannot learn to read soon realizes that he is disinherited, economically as well as socially .. . (p. 134).
In view of the estimates concerning reading disability
and the degree to which poor reading affects the emotional
life, the personal growth and development, and the self-
concept of the child, it is little wonder that many people
from various professional and lay groups are vitally con
cerned with this problem. It is reasonable to assume,
therefore, that the pervasive degree of reading disability
and its pernicious influence on children and adults con
stitute adequate justification for research involvement by the social and behavioral scientists.
Proliferation of Labels Regarding Dyslexia
The literature abounds in stat@aents explaining why
people cannot read adequately. Some individuals are men
tally retarded and are incapable of learning the symbolic significance of the printed word. Others are brain damaged
or suffer from assumed minimal brain impairment. Still
others are emotionally disturbed and do not have appropriate attention, concentrati cm, and interest for learning to read.
Cultural and educational deprivation are also indicated as
causes of reading difficulty. Some individuals have

9
peripheral sensory defects that interfere in learning. Specific dyslexia is also reported in the literature as a basis for
reading disability. About this condition much controversy
exists. Terms with similar meaning are dyslexia, develop
mental dyslexia, and specific language disability. Here
after, the terms dyslexia and specific dyslexia are used synonymously. No distinction is made between them and the
terms developmental dyslexia and specific language disability.Some of the terms with similar meaning to dyslexia are
presented in Table 1. The abundance of these terms, some
of which no longer appear in the literature, is symptomatic
of the confusion concerning the meaning of dyslexia.
Additional terms, related to but not necessarily synonomous with dyslexia, are acquired dyslexia, acquired
specific dyslexia, agnosic dyslexia, dyslexia-dysgraphia,
occipital dyslexia, parietal dyslexia, subcortical alexia
(Benton, 1962b); specific developmental dyslexia (Franklin,
1962); pure congenital visual aphasia (Cohn, 1964); and
agnosic alexia, aphasic alexia, pure alexia, visual object
agnosia, and symbolia (Critchley, 1964). Some do not give
credence to the theoretical basis assumed by the term
dyslexia and instead prefer to use the term "backward
readers'* (Vernon, 1958).

10TABLE 1
Terms Similar in Meaning to the Term '‘Dyslexia”
Note.— Terms listed by Drew (1956)
Term Source of reference
Word-blindness Kussman (1877)
Congenital word-blindness Morgan (1896)1Congenital symbol-amblyopia Claiborne (1906)Congenital typholexia Variot and Lecomte (1906)Congenital alexia Stephenson (1907)Amnesia visualis verbalis Witmer (1907)Congenital dyslexia Rutherford (1909)Developmental alexia Chance (1913)Analfabetia partialis Wolff (1916)
Bradylexia Claparede (1917)Strephosymbolia Orton (1928)Specific reading disability Orton (1928)Constitutional dyslexia Skysgaard (1942)

11
TABLE 1, continued
Term Source of reference
Specific dyslexia
Primary reading retardation
Familial dyslexia
Familial congenital wordblindness
Hallgren (1950)
Rabinovitch, et al. (1954)
Drew (1956)
Drew (1956)

12
The various terminology in the above paragraph raises
the question whether dyslexia is related to disorders of
aphasia or agnosia, whether it is part of a more general
language or visuoperceptive deficit, whether it is an as
pect of a general psychoneurological learning disability,
or whether it is a separate disorder. The answers to these
questions depend on what groups or types of patients an investigator studies and the definition he holds for dyslexia.
To some degree it also depends on the investigator’s pro
fessional identification; people in the various professions
of medicine, psychology, and education sometimes use dif
ferent conceptual frames of reference and different language systems. Therefore, one may view dyslexia from a biochemical, anatomical, neurophysiological, psychoneurological,
psychophysical, behavioral, psycholinguistic, or educational perspective. Newbrough and Kelly (1962) commented about
the complexities involved in conceptualizing dyslexia:
One of the most challenging problems in regarding research is the definition and relative meaning of reading retardation. Our recent searches of the literature have failed to disclose any very comprehensive discussion of the concept (p. 67).
13
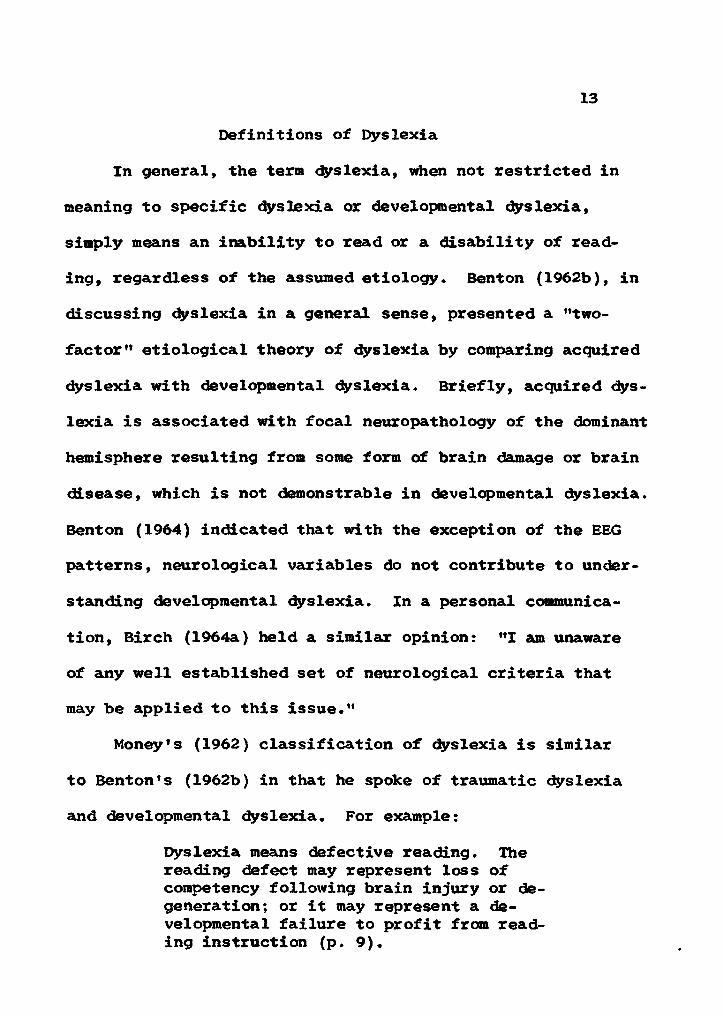
Definitions of Dyslexia
In general, the term dyslexia, when not restricted in
meaning to specific dyslexia or developmental dyslexia,
simply means an inability to read or a disability of reading, regardless of the assumed etiology. Benton (1962b), in
discussing dyslexia in a general sense, presented a ntwo-
factor” etiological theory of dyslexia by comparing acquired
dyslexia with developmental dyslexia. Briefly, acquired dys
lexia is associated with focal neuropathology of the dominant
hemisphere resulting from some form of brain damage or brain
disease, which is not demonstrable in developmental dyslexia.
Benton (1964) indicated that with the exception of the EEG patterns, neurological variables do not contribute to under
standing developmental dyslexia. In a personal communica
tion, Birch (1964a) held a similar opinion: MI am unaware
of any well established set of neurological criteria that may be applied to this issue.* 1
Money’s (1962) classification of dyslexia is similar
to Benton’s (1962b) in that he spoke of traumatic dyslexia and developmental dyslexia. For example:
Dyslexia means defective reading. The reading defect may represent loss of competency following brain injury or degeneration; or it may represent a developmental failure to profit from reading instruction (p. 9).
14
In reference to developmental dyslexia. Money said, "But it is usually the case that developmental dyslexia appears
without demonstrable early brain injury (p. 14)." Mykle-
bust and Johnson (1962) indicated a similar two-fold genesis.
Geschwind (1962) also used dyslexia in a generic sense
to mean an inability to read normally, then subsequently
classified the disorder in two major categories. He stated,
"it is therefore common practice among neurologists to distinguish acquired dyslexia or alexia from their congenitai
counterparts (p. 115)."
Prechtl (1962) discussed two categories of reading dis
ability involving brain damage. He wrote:From the neurological point of view, we may divide reading disabilities into two groups: a first group with lesions in specific cerebral structures which deal with the function of reading, e.g., the brain areas 17, 18 and 19, which subserve a visual but non-language function, and area 39, which combines both visual and language functions; and a second group with nonspecific lesions of the central nervous system in which the performance of reading is impaired in general, more or less as a side effect (p. 187).
A condition of brain damage is basic to these two groups, but as Prechtl stated, they stand in contract to disordered reading related to hereditary factors.

15
The aforementioned definitions of dyslexia involve
two major types: the first results from brain damage,
brain injury or brain disease. This represents an exog
enous assault to the brain that results in some form of
tissue damage. The second implies a nonfocal neuropatho-
logical problem resulting from an inherited, genetic, familial condition or a delay in neurophysiological
maturation.
A two-factor theory of learning difficulty which is
related to reading problems in adolescents was proposed
by de Hirsch (1963c). Although her theory is not specifi
cally about dyslexia, her point of view does offer two
broad categories of learning disabilities, one involving
psychodynamic factors, the other, psychoneurological
factors. The adolescents in the psychodynamic learning
disability group tended to be physically small and physi
ologically immature; intelligence was above average and academic achievement was good in the early school years,
however, performance was poor during the adolescent years.
The personality structure included passive and infantile traits, poor ego strength, and a superficially charming
and compliant style of relating with others. These child
ren were under-achievers and their academic difficulties

16
were related to ego impairment and were manifestations
of a severe character disorder.
The characteristics of the psychoneurological learning
group were: (a) Verbal Scale lower than Performance Scale
on the WISC; (b) speech deficiencies; (c) poor reading;
(d) hyperkinesis; and (e) immaturities in the perceptual,
motor, and visuomotor areas during the early school years.
When these children reached adolescence, a residual language disability was indicated by: inarticulate use of language;
poor spelling; poor auditory discrimination; poor writing; poor performance in perceptual, visuomotor, and motor
patterning activities; and overt hostility. As de Hirsch (1963c) stated, "What begins with a reading disorder turns
into a learning disability (p. 90)."
Hie two-factor theory of dyslexia may be expanded into a three-factor theory. This is demonstrated by the work of
Rabinovitch (1951, 1962), Rabinovitch and Ingram (1962), and
Rabinovitch et al. (1954). As Rabinovitch (1962) said, his
group has avoided using the term dyslexia, "Because its
usage has become so ambiguous . . . (p. 75)." Their re
search has produced three classification® of dyslexia, re
lated to: (a) brain damage; (b) a nonfocal neuropathologi
cal condition; and (c) an emotional disturbance.

17
The three-factor theory of the Rabinovitch group ap
parently has been a stimulus for research, as others have reported studies within this frame of reference (Fuller,
1964; Fuller & Laird, 1963a, 1963b; Silver, 1961; Silver & Hagin, 1960). For example, the Minnesota Percepto-
Diagnostic Test (MPD) developed by Fuller and Laird
(1963b) significantly categorizes children with a reading
disability in three groups: (a) primary reading retardation
(no evidence of brain damage); (b) secondary reading re
tardation (capacity to read is intact but interference is
present due to emotional factors); and (c) organic reading
retardation (evidence of brain damage). Silver and Hagin uncovered three groups of children with similar reading
disabilities.
Gallagher (1962) is another who subscribed to a three-
factor theory of reading disability. He believes children
with dyslexia may be classified in the following three
groups: (a) emotional disturbance; (b) brain damage;
and (c) specific language disability. His last group is similar to specific or developmental dyslexia and to
primary reading retardation.

18
Another approach to the definition of dyslexia may be
termed the multi-factor theory. This theory is more ex
pansive than the two-factor theory and may include any
number of etiological factors: poor reading readiness;
irregular school attendance; defective teaching; physical handicaps; speech retardation, subnormal intelligence; and
social and cultural deprivation. Monroe (1932) listed 15
factors that can produce reading problems. Jackson (1944)
wrote about the intertwining of psychological, social, and
environmental factors as responsible for reading disability.
Robinson (1946) listed the following seven factors as basic
to a disturbance in reading: visual difficulties; intellectual and maturational status; neurological and dominance fac
tors; auditory, speech, and language factors; physical diffi
culties ; emotional adjustment; and social and environmental variables. The lack of preciseness in conceptualizing the
problem of reading disability tends to be present in the
writings of some multi-factor theorists as evidenced by the
following quote from Witty and Kopel (1939):
reading disability is a complex condition involving the interaction of multitudinous phases of physical and mental growth. In every case, causation should be sought not in single factors

19
but in the complex patterns whose interrelated elements, in proper balance, are essential to maximum efficiency (p. 218).
Much of what is contained in the multi-factor theory
is unrelated to cerebral function as found in the two-
factor and three-factor theories, and there is little relevance to the concept of dyslexia as found in the medical
and psychological literature. Partly, this is due to the
fact that multi-factor theorists are educators or researchers
attached to educational-type institutions rather than to clinical and medical settings. Additionally, educators
have looked at the problem of reading retardation from a limited point of view (e.g., reading test scores) and gen
erally they have not worked intensively with severe cases
of reading disability. Neurologists, pediatricians, and
psychologists associated with clinical and medical settings
have considered reading disability from a broader perspec
tive- -educational test performance together with neurolog
ical, psychoneurological, and psychological behavior.
Reversing our field for the moment, we may now consider
single-factor theories of reading disability. The first
and foremost single-factor theory is based on emotional and personality disturbances. Much has been written concerning
20
emotional problems as the etiological basis for reading
disability (e.g., Blanchard, 1946; Blau, 1946; Fabin,
1951; Gann, 1945; Gates, 1922, 1941; Meyer, 1953; Vorhaus,
1952). Here reading disability is discussed in relation
to such concepts as feelings of guilt or dread of castration, ego impoverishment, educational impotence, lack of
rapport with the environment, neurotic symptomatology,
dynamic aspects of personal adjustment, and unfavorable
home influence. The following quotation from Pearson (1952)
illustrates how personality variables are utilized in under
standing learning and reading problems:
Essentially a diminished capacity to learn is a problem of ego psychology and therefore I intend to discuss the various factors which hinder the ego in its ability to learn. These factors may occur in the ego itself, as a result of the influence of the external world on the ego or as the result of influence which may emanate from the superego or the id (p. 323).
Blanchard’s (1946) approach was psychoanalytical and
he believed reading disability was not a primary disturbance; rather it was a secondary phenomenon or a neurotic
symptom.
Stewart (1950) related reading disability to personality problems such as poor motivation due to an insecure

21
relationship with parents or as an expression of hostility against a parent or parents with ambivalent feelings to
ward the child. Some have criticized the use of personality
as a causative factor in reading disability. Thus, Smith and Carrigan (1959) stated:
Personality structure, narrowly conceived, will probably prove sterile as a focus. For example, with regard to anxiety, clinical experience has shown that many anxious children can be made sufficiently comfortable to allow learning to occur (p. 14).
A similar view was expressed by Jastak (1946) who dis
avowed the pernicious influence of anxiety on reading. He
remarked that,"high reading and low arithmetic scores tend to
occur in abnormal states of a developmental nature and of
long standing as in neurosis and schizophrenia . . . (p. 2).**
He further stated that, "The neurotic and disorganized
child is usually more proficient in reading than in
arithmetic (p. 14)."
A statement by Kass (1962) placed the hypothesis of an emotional basis to reading disability in proper
perspective: "At present, there is no convincing evidence which differentiates between cause and effect in
emotional disturbance and reading disability (p. 11)."

22
In summary, decisive experimental research on emotion
al disturbance and reading disability is yet to be done.
Those who have emphasized the emotional basis to reading
problems have not adequately investigated or controlled the relevant variables that appear in the research of those
who have postulated a developmental, psychoneurological,
or genetic basis to reading disability. Emoticmal factors
may be correlated with or antecedent to disturbed reading,
but adequate experimental research has not yet validated
this hypothesis. The law of parsimony would suggest that
investigators look for less complicated or more simplified
hypotheses as found, for example, in Birch’s work (Birch,
1962; Birch & Belmont, 1964).
There are several other single-factor theories that
might be placed in the category of "miscellaneous one-
factor theories." Reference is made to the following investigators and their major points of emphasis: Cole
(1951), Goody and Reinhold (1961)—lack of cerebral
dominance due to heredity; Drew (1956)--defect in figure
ground recognition or configuration; Hallgren (1950)--
genetic inheritance; Hermann (1959)--constitutional factors (heredity); Hinshlewood (1895)--familial, de Hirsch
(1961)--poor perceptual integration due to inherited

23
generalized Gestalt deficiency; Bender (1957), Olson (1940)—
maturational lag; Orton (1925, 1926)--ambiguous occipital
dominance; and Smith and Carrigan (1959)—disturbance in en
docrine functioning resulting in chemical imbalance at the
point of synaptic transmission.
In summarizing the dyslexic research concerning the one-factor theory, one theoretical concept appears to be
most prominent; it is variously referred to as hereditary,
familial, constitutional, or genetic. The study by Hallgren
(1950), which is perhaps the best documented one indicating
a specific genetic factor responsible for dyslexia, implied a monohybrid autosomal dominant mode of inheritance.
There is another approach to defining dyslexia which
is worthy of careful attention; reference is made to the
work at the Institute for Research on Exceptional Children,
University of Illinois (e.g., Kirk, 1963). It is difficult
to place this approach within the aforementioned factor categories as emphasis is placed on the correlates of
reading disability rather than etiology. The Illinois group
is primarily concerned with the psycholinguistic correlates
of learning disabilities, of which reading disability is only
one aspect (Bateman, 1964a, 1964b; Kass, 1963; Kirk & Bateman,
1962; Sievers, McCarthy, Olson, Bateman, & Kass, 1963).

24The conceptual frame of reference for this work was Osgood's
model of psycholinguistic functions (Osgood, 1957a, 1957b;
Osgood & Miron, 1963). Kirk (1963) and his co-workers
(McCarthy & Kirk, 1961, 1963) have utilized the Illinois Test of Psycholinguistic Abilities (ITPA) in studying various
learning disability groups. They are concerned primarily
with assessment of behavioral symptoms and in developing
remedial programs for various learning disabilities. They
are not interested in diagnosing antecedent etiological
factors. Concerning dyslexia, Kirk and Bateman (1962) wrote:
Dyslexia is a label meaning that the person has difficulty learning to read. A dyslexic may have a lesion in the angular gyrus, or had his handedness changed, or perhaps his father rejected him. But none of these kinds of analyses tells us what to do to improve the reading of our particular subject. Our interest is in the kind and extent of diagnosis of learning problems that lead directly to a formulation of what should be done about the disability (p. 73).
One may assume from the foregoing that the Illinois
group does not view specific dyslexia as a special sub
category of reading disability, or at least concern them
selves with this problem, as do Benton (1962b), Childs
25
(1965), Cole (1951), Critchley (1961), Drew (1956),Eisenberg (1962), Fuller (1964), Gallagher (1950),Hallgren (1950), Hermann (1959), de Hirsch (1952), Rabino-
vitch (1959), Orton (1937), and Silver and Hagin (I960).Ml of these writers view specific or developmental dyslexia
as a discrete subcategory of reading disability involving
problems of psychoneurological organization and integration.
In addition to these writers, there are many others who share a similar point of view.
A concluding statement by Benton and Bird (1963)
summarizes present knowledge about the etiology of reading
disability:There is agreement that it is useful to think of reading disability as a symptom which may appear as the result of diverse antecedent conditions. It may occur as an expression of a general visuoperceptive deficit in a brain-damaged child. It may reflect a slovz rate of cerebral development, which is also shown in motor and speech retardation. It may appear as an expression of long-standing emotional disturbances. It may present as a relatively specific language disturbance without note-worthy associated deficits. Children of the last type, who are dyslexic but whose neurological, intellectual and emotional status are within normal limits, form a fairly sizable group (p. 531).

26
The literature itself, and those who review the literature, frankly indicate that considerable disagree
ment in Europe and in the United States has been present
for several decades concerning etiological factors and
clinical symptoms of reading disability in general and
dyslexia in particular. That this conflict is still pre
sent is indicated by the following statement by Gallagher
and Locke in their introduction to Hermann’s (1959) book:
we have become concerned lest the present-day tendency to blame one or another teaching method, or some emotional experience or environmental factor, obscure the fact that in many individuals a variation in the working of brain itself constitutes fundamental difficulty (pp. 5-6).
If one is allowed the privilege of presenting a ’’lineup," it seems that educators and educational psychologists
emphasize emotional, personality, environmental, and educa
tional instructional methods as major causative factors in
reading disability. On the other hand, neurologists and
related medical specialists, and clinical and experimental
psychologists, indicate that psychoneurological variables unrelated to personality-emotional and environmental fac
tors are the primary antecedent variables associated with
a large number of children with reading problems, particu
larly those with dyslexia. There are a number of reasons

27
why this conflict continues. The following 11 categories,
or points of view which represent sources of confusion,
are presented in an effort to clarify the basis of this
theoretical and scientific conflict.
Problems Associated with Dyslexic Research
Age of Subjects Evaluated
The samples of subjects evaluated in reading disability
research range from pre-school to adult ages. Generaliza
tions about dyslexia in regard to the population at large
are based on the age norms of the samples studied; a longi
tudinal consideration is therefore obscured. Many phenomena
in dyslexia are developmental: right-left orientation
(Benton & Kemble, 1960; Belmont & Birch, 1963; Harris, 1957); peripheral lateral dominance (Belmont & Birch, 1963; Zang-
will, 1962); intersensory integration (Birch & Belmont, 1965;
Birch & Lefford, 1963); finger localization (Benton, 1959b);
visual-motor performance (Bender, 1938); hierarchical or
ganization of sensory systems (Birch, 1962): and lag in devel
opment (Bender, 1957; Eisenberg, 1962; Money, 1962; Olson,
1940). Depending on the age level of the children, investi
gators have reported various results on the above-mentioned
variables. The conclusions drawn from studies using different

28
age norms tended therefore to conflict one with another in regard to the degree these developmental factors were present
or absent in the subjects studied. In discussing present re
search findings, one should make specific reference to the age
level of the subjects evaluated when attempting to generalize
to the population of dyslexic readers.
Clinical-Observational vs. Experimental Research
Much of our knowledge on dyslexia has come from clini
cal studies. As is the case in this type of research, repli
cation is most difficult. It is not known, therefore, whether
the clinical findings correctly represent the phenomena of dyslexia or whether they are artifacts of the methodological
procedures and techniques used by the clinician. A report
by Bryant, Mirlin, and Patterson (1964) is pertinent to this
consideration. In a review of the literature on the associa
tion of impaired motor development and dyslexia, they stated:
few quantitative studies appear to have been made . . . . None of the references . . . give experimental and quantitative verification to the association of poor motor development with reading disability (p. 1).
Other problems concern variability and reliability in
observational techniques used by various investigators.
This is readily recognized in psychiatric research wherein

29
reliance is placed on the psychiatric interview as a diag
nostic instrument. Part of the problem in dyslexic research
is related to the skill and training of the investigator,
his ’’built-in" norms of normal and abnormal behavior, and
his conceptual frame of reference, whether it is psychologi
cal, behavioral, neurological, or educational.
The clinical-observational approach has produced much
knowledge about dyslexia, but it is surprising that few in
vestigators have not gone further by employing the hypothetico-
deduefive or the empirical-correlational approach. The ab
sence of these methods in the literature is remarkable, par
ticularly in view of the voluminous studies on causes of reading disability. By way of illustration, the hypothetico-
deductive method of analysis is seen in Benton’s work (Benton,
1959a, 1959b; Benton & Kemble, 1960; Benton & Menefee, 1957) and in Birch’s work (Belmont & Birch, 1963; Birch, 1962;
Birch & Belmont, 1964; Birch & Lefford, 1963). The empirical-
correlational method is illustrated in Kass’ 1962 dissertation.
Reliability and Validity of Standard Measurement Instruments
A number of references were made to the use of well-
known reading tests which were employed in determining the

30
degree and nature of reading disability. The reliability and validity of some of these instruments may be questioned
in view of the reviews in Buros (1953, 1959). The selection
of measurement instruments for educational achievement also
presents problems, particularly the results in arithmetic
computation and spelling, two measurement operations often
reported in the cfyslexic literature. For example, various
achievement tests measure different aspects of arithmetic;
some measure arithmetic computation and some emphasize rea
soning and conceptual factors. In regard to spelling, some
research papers reported results based on spelling tests de
veloped as early as the 1920’s, tests that have been criticized as being unreliable and invalid. Measurement of hand
writing, another factor reported in the literature, also needs
careful scrutiny. Gross and bizarre handwriting is easily
recognized. However, there is the problem of refined mea
surement and reliability in judging handwriting. This diffi
culty will remain until more adequate instruments are utili
zed in research, unless of course one considers handwriting
on a discrete good-poor continuum.
Use of Different Instruments to Measure the Same Function
It would be well if all investigators used the same

31
"yardstick" in assessing factors associated with dyslexia;
however, this has not been the case. Nevertheless, there
is some agreement concerning the various phenomena correlated
with dyslexia, but the problem is that different researchers
go through different operations to arrive at their conclu
sions. These operations may or may not be measuring the same
(assumed) process, or they may be measuring different as
pects of the same process. A case in point is auditory discrimination which has been reported to be correlated with
poor reading. A stu<ty by Goetzinger, Dirks, and Baer (1960)
employed three tests of auditory discrimination: the Rush
Hughes recording of the Harvard PB (phonetically balanced)
word lists, the C.I.D. W-22 records, and the Wepman Test of
Auditory Discrimination. They found that the C.I.D. W-22
test did not differentiate good and poor readers, whereas
the Rush Hughes recordings and the Wepman Test did. Even
though these latter two tests differentiated the two groups
of readers, they were not significantly correlated with each other.
Another example may illustrate this problem. Diffi
culty in right-left discrimination has been reported by
some writers as characteristic of dyslexic children. Most

32
studies have utilized clinical-observational techniques
only. Others, however, have used standardized instruments
such as the Harris Tests of Lateral Dominance (Harris,
1958), the Benton Right-Left Discrimination Battery (Ben
ton, 1959b), and Belmont and Birch’s (1963) Right-Left Awareness Items adapted from Piaget (1928). The Benton
test is by far the most complete and thorough in its
analysis of right-left discrimination. The Harris test is
only a three item test, but age norms and degree of discrimina
tion are provided. The Belmont and Birch test was developed
to demonstrate growth and development in right-left dis
crimination in children.
The difficulty in interpreting the relevant correla
tion of right-left discrimination with dyslexia is that
much of the research was not reported in relation to
normative data or methods of assessment. Very few studies
used, for example, right-left discrimination tests developed by Benton (1959b), Birch (Belmont & Birch, 1963),
and Harris (1958). One cannot be sure, therefore, that the results from various studies can be equated.
Until it can be justifiably assumed that various
tests, formal or informal, measure the same function.

33
confusion will exist concerning the degree to which a function is normal or impaired.
Neurological Evaluation and Classification of Children with Dyslexia
Reitan (1962) and Reed (1963) indicated ^here is a problem involved in the measurement of the independent variables
in brain-behavior research. In regard to collaborative re
search with neurologists, Reitan stated that psychologists
should be familiar with independent neurological variables
that form the basis for assignment of subjects to research
groups. Furthermore, psychologists must be aware of prob
lems of standardization involved in the neurological examination.
Cohn (1964), a neurologist, indicated a theoretical
problem associated with the neurological examination of
dyslexic children. He wrote:
From the recent literature . . . it is evident that many neurologists believe that there are a number of minimal, or ’’soft," neurological signs in individuals who have difficulty in acquiring verbal language functions necessary for information transfer. It is implied that these minimal neurological findings can be equated with minimal brain damage, and that this minimal brain damage retards the organizational capacity of the child to synthesize and

34
classify incoming data. This writer takes exception to the equating of minimal brain damage with minimal neurological signs . . . (p. 180).
This point of view was also expressed by Benton (1962a) and
Birch (1964b).Theoretical disagreement is present concerning neuro
logical factors in dyslexia, but what is important to the
establishment of empirical findings is contained in Cohn's
(1964) comment about the methods of the neurological examination itself, as he remarked:
In a number of reported instances, neurological study consisted only of a standard initial physical examination performed by the neurologist . . . (p. 180).
This is essentially a reiteration of Drew's (1956) criticism
concerning incomplete neurological examinations as sometimes reported in the literature.
The EEG has also been used in dyslexic research. Benton
and Bird (1963) reviewed some of this literature and con
cluded :
The trend of results indicates a higher- than-expected incidence of EEG abnormality in dyslexic children. The observed incidence of abnormality has varied widely--from 88 to 28 per cent. Two major factors contributing to this discrepancy are employment of

35different criteria of EEG abnormality and the selection of cases for study. Failure to include control cases in these studies is regrettable, since such normative data might resolve some of the discrepant findings on the incidence of EEG abnormality in dyslexic children (p. 531).
Conflicting reports on the neurological basis of dyslexia will continue to exist until clinical neurological
examinations and EEG interpretations are improved, in terms
of reliability and validity.
Assumed Extraneous Variables—Early Child-Rearing Practices, Sensory Deprivation, Impoverished Cultural and Educational Background, and Emotional-Personality Factors
Little attention has been given by investigators con
cerning the control of these variables in dyslexic research.
A number of investigators who postulate a familial, heredity, congenital, or genetic basis to underlying neurological dis
organization or dysfunction do not adequately assess the above-
mentioned variables. Although the following statement by
Reinhold (1962) is rather extreme, it does, nevertheless, in
dicate the tendency to gloss over nonmedical factors in the
background history of children with reading problems. She
wrote:
A short conversation with the child on general topics will help him to relax and will help the examiner to judge

36whether the child is normally intelligent, whether he is likely to be severely disturbed emotionally, whether he sees and hears normally, and whether his education has been adequate (p. 72).
Another problem encountered is the practice of screen
ing out children with assumed neurological problems and
assigning the remaining children to a so-called what’s-left- i over category. Generally speaking, the what*s-left-over
category is considered the one containing the children with
emotional problems.
Neglect of Relevant Research
Since the publication of Birch’s work (Birch 1962;
Birch & Belmont 1964, 1965; Birch & Lefford 1963), this
writer has been unable to find studies that are concerned with his three principles of development (sensory hierarchy
organization, intersensory equivalence, and levels of per
ceptual function). Birch and Lefford indicated the importance
of intersensory equivalency in the development of normal
children, and Birch and Belmont demonstrated its relevance
in poor reading.
In regard to the ITPA developed by McCarthy and Kirk
(1963) at the University of Illinois, an instrument of con
siderable importance in diagnosing learning disabilities,

37
this writer noted only one reference in the literature to
its use with dyslexic children (Kass, 1962). A review of this
dissertation is presented in Chapter II. It is worth noting
here that Kass discovered several significant correlations be
tween various ITPA subtests and dyslexia. Interestingly, this
instrument has not been extensively used in dyslexic research
in the light of comments like this one by Money (1962)«
There is a need for new tests that are more accurate and valid in the differential diagnosis of dyslexia. Experiment and clinical study is a prerequisite for the development of these tests (p. 33).
The people at the University of Illinois do appear to have met these two criteria admirably in the construction of the ITPA.
Longitudinal Studies
Reports of longitudinal studies on dyslexic children are
not found in the literature. The importance of this research
is indicated by Benton and Bird (1963):
A meaningful system of diagnostic classification is a prerequisite for the rational treatment of dyslexic children. It seems that the basic investigative work which will disclose the relationships on which such a classification must rest has still to be done . . . . Critically designed, longitudinal studies of dyslexic children are required (p. 531).

38
De Hirsch (1964) did, however, provide information derived from predictive studies of reading success and failure. Ben
ton and Bird's (1963) suggestion on the importance of longi
tudinal research is presently valid, and until such time as
these studies are conducted, conf us ion on what constitutes
dyslexia will continue to exist.
Confusion in TerminologyAs previously indicated, some 30 terms or labels have
been used to designate dyslexia. To a considerable de
gree, these terms refer to various etiological variables, different psychoneurological factors, and various symptoms.
All of these labels are not currently in use; however,
enough are used that precise communication is not possible.
It is little wonder that research in dyslexia and reading
disability appears, at times, contradictory, ambiguous, and
unstructured. Nevertheless, it is necessary to acknowledge
the existence of the hypothesis that some children suffer
from a reading problem related to psychoneurological dis
organization or dysfunction.
Limited Scope of Measurement
Sophisticated statistical treatment of dyslexic vari
ables, which may uncover a unique pattern of signs, has

39not been published in the literature for, as Money (1962)
remarked:
no one has yet uncovered any tell-tale sign or group of signs that are exclusive to the syndrome of specific dyslexia and are not found in other conditions of reading retardation. It is not at all rare . . . that a disease should have no unique identifying sign, that uniqueness being in the pattern of signs that appear in contiguity. Out of context, each sign might also be encountered in other diseases, or, in different intensities, in the healthy (p. 16).
The few experimental-statistical studies reported have been
concerned primarily with mean differences between groups.
From the abundance of clinical-observational studies, we
now have considerable information on assumed relevant pat
terns of variables. Further studies of this nature will
not add greatly to our understanding of dyslexia.
To achieve the magnitude suggested by Money (1962)-- uncovering the uniqueness in the pattern of signs that
appear in contiguity—more elaborate statistical treatment
of data is necessary. When this occurs, the unique pat
tern of signs will be discovered. This will occur when
the researcher elaborates or extends his scope of measure
ment of dyslexia and treats the data with procedures such as factor analysis, linear regression analysis, or some

40
other form of multivariant analysis. The investigator who
views dyslexia from a limited measurement frame of refer
ence may be correct in his conclusions; however, an in
complete Gestalt of dyslexia will persist until more
relevant variables are studied and included in the statistical analysis.
Inadequate or Incomplete Diagnostic Criteria
The category of incomplete diagnostic criteria is de
pendent upon the other 10 categories concerning the con
fusion in dyslexic research. For example, it is similar
to Money’s (1962) comment on the lack of tell-tale signs
associated with dyslexia. It is also related to the problem of multiple labels of disordered reading. It is
relevant to the problem of separating developmental factors
from nondevelopmental factors. In commenting on diagnostic
criteria in dyslexic research, Drew (1956) wrote:
The diagnosis of congenital dyslexia presents many difficulties. There is no unanimity of opinion regarding diagnostic criteria . . . . It is little wonder that some authors tend to deny the existence of specific dyslexia (p. 450).
In summary, the aforementioned 11 categories were pre
sented in an effort to clarify some of the confusion in

41
dyslexic research. Furthermore, they constituted reference
points for the design of this dissertation in order to
avoid errors found in some studies of the past.
Methodological Approaches to the Study of Dyslexia
As has been indicated, much of our knowledge about
dyslexia has come from designs involving fragmented re
search. Schiffman (1962) believed this has led to con
ceptual confusion and that the answer lies in an inter
disciplinary approach to reading problems. Clemens (1961)
stated that research workers have not cultivated adequate
inter-professional communication which is necessary for
understanding complex problems in which psychological,
educational, and medical variables are related. Rabino-
vitch (1962) also supported the interdisciplinary approach to the study of dyslexia.
Clements and Peters (1962), in their paper on the
evaluation of children with minimal brain dysfunction,
emphasized the above views. Myklebust (1963) also stressed
a combined psychological-neurological research approach to the study of children with psychoneurological learning dis
orders. There is little doubt in his view, as he stated:
The validity of the concept of psychoneurological learning disorders (aphasia,

42
dyslexia, dysgraphia, and non-verbal disorders) is dependent on ascertaining precisely and specifically the exact deviation in learning vAiich is present, and the exact neurological dysfunction to which it relates (pp. 27-28).
Benton and Bird (1963) also were of the opinion that
an interdisciplinary, multidimensional evaluative approach
to the study of dyslexia is needed. They wrote:
Analysis of the interrelations among neurological findings, life history factors, psychological test performance, speech and motor development, e- motional status and BEG findings should provide the empirical data on which a classification consonant with the facts can be formulated (p. 531).
Drew (1964) suggested that a comprehensive study of dyslexia should involve a careful delineation of the type
and degree of the impairment and am investigation of vari
ables associated with auditory imperception, apraxia, and neurological history and examination.
In summary, several authorities have stressed the value
of a comprehensive, cross disciplinary approach to dyslexic
research. Dyslexia is so complex that a narrowly conceived
and fragmented evaluation approach cannot lead to an ap
preciation of the relevant variables.

43
Need for New Measurement Instruments
In order that advancement may continue in dyslexic re
search, several investigators stressed the need for new
diagnostic tests. Money (1962) commented that, "There is a need for new tests that are more accurate and valid in
the differential diagnosis of dyslexia (p. 33)." Mykle-
bust (1963) stated a similar view in regard to learning
disorders associated with neurological dysfunctions,
particularly nonverbal psychoneurological learning dis
orders. He wrote:
A limitation in the study of these concomitants (dyschronometria, dys- calculia, disturbance in orientation, in social perception, in body image and in spatial perception) of neurological dysfunction is the few standardized procedures available for their measurement. The development of such tests is an urgent need (p. 27).
Some researchers have developed experimental tests in
general and specific areas related to dyslexia (e.g., Benton,
1959b; Birch, 1962; Birch & Belmont, 1964; McCarthy & Kirk,
1961; Myklebust, 1963; Wepman, 1960, 1962). In a conference
on children with minimal brain impairment, Becker (19<S3)
summarized participants* views on new areas of measurement.

44
He stated that the views of Birch focused
our attention on exploration of the importance of testing for intersen- sory equivalence in diagnostic testing, in contrast to the current focus on input-output equivalences. The ease with which a child can move from a visual stimulus to a haptic equivalent, etc., appears to have considerable significance for methods of remedial training (p. 123).
In summary, some experimental advances in new fields
of measurement are currently being reported. Hopefully, these may represent real breakthroughs in resolving the
riddle of why some children cannot read.

CHAPTER IIREVIEW OF THE LITERATURE
As previously indicated, few experimental studies have
been reported on specific dyslexia, in contrast to the vast
amount of literature on reading disability. Myklebust and
Johnson (1962) commented:
Despite the pioneering work of Morgan (1896), Thomas (1905), Hinshelwood (1900), Orton (1937), Hallgren (1950), and Hermann (1959), only minor attention has been given to the problem of dyslexia in children. Reading specialists to a great extent have ignored this condition as a causative factor in children’s reading disabilities. Nevertheless, gradually there is a growing awareness of its importance, not only in terms of the need for appropriate diagnosis and specialized training, but because of the opportunities for expanding our knowledge of the processes whereby all children learn to read (pp. 15- 16).
There is, however, limited knowledge about dyslexia,
and it is presented in this chapter in the following sequence: (a) basic conceptions of dyslexia; (b) ex
perimental studies; (c) cerebral dominance; (d) dyslexia,
minimal brain damage, and motor incoordination; (e) audi
tory variables* (f) speech; and (g) opthalmological prob
lems .

46
Basic Conceptions of DyslexiaSeveral writers have discussed dyslexia in such terms
as perception (figure-ground relationships, form perception, directional sense), association, cognition, psycholinguistics,
etc. Benton (1962b) wrote about the perceptual and linguistic deficits in dyslexia. Rabinovitch and Ingram (1962) discussed
the problem the dyslexic child experiences in translating
perceptions and concepts into meaningful symbols. Money (1962)
considered the possibility that the dyslexic child may be a
’•nonvisile cognitional” type, a person weak in visual imagery and visual memory of all types.
Kass (1963) studied psycholinguistic factors in a group
of dyslexic children and reported:
this sample of children with reading disability tended to have more deficiencies at the integrational level than at the representational level of psycholinguistic functioning . . . . This may mean that reading requires more perceptual and memory type abilities than conceptual abilities. This sample of children was not able to integrate elements into meaningful wholes (p. 94).
Kass’ use of the term integrational level (automatic and
sequential memory aspects of communication) refers to such activities as: (a) auditory memory, as in the WISC Digit
Span subtest; (b) visual-motor sequencing (visual memory of

47pictures and geometric figures arranged in sequence); (c)
knowledge of grammar (ability to verbally reproduce plural
nouns, various verbal tenses, and comparative and superlative adjectives); and (d) visual closure tasks. In summary,
Kass indicated memory and perceptual dysfunctions in dyslexia.
Benton (1962b), Rabinovitch (1962), and Birch and
Belmont (1965) did not deny the relation of perceptual vari
ables to dyslexia, as they acknowledged the prominent role
they play during the early developmental years. Conceptual
or intellectual variables, however, assume a more prominent
role during later childhood years. Perceptual and conceptual
factors are relevant to dyslexia, but at different points in
the developmental history of the child.
Fuller (1964) believed that dyslexia is a disturbance
in association rather than perception as he wrote:
In hypothesizing about the defect in primary reading disability, it would seem that we must turn to the associative instead of the perceptual processes. When perceiving a word or letter perception per se is intact, while the ability to deal with the words and letters as symbols is impaired. This defect appears to reflect a biologic or inherent disturbed pattern of neural organization (p. 316).

48
Principles of Gestalt psychology have been used to ex
plain basic problems of dyslexia (Drew, 1956; de Hirsch,
1952, 1961, 1963a, 1963b), Others have related Gestalt
psychology to reading disabilities in general and to nor
mal visual function in reading. Specific tests have been
designed to measure certain Gestalt factors in reading
(Bender & Schilder, 1951; Fuller & Laird, 1963a; Goetzinger
et al., 1960; Krise, 1949, 1952). Interestingly, in 1937,
Wechsler and Pignatelli (1937) wrote about reading reversal errors in terms of figure-ground relationships.
Few studies since then have treated the matter so systematically.
Three examples illustrate how Gestalt psychology has been used conceptually in dyslexia. Bender and Schilder
(1951) discussed the problem of relating parts to the whole configuration in children with specific dyslexia:
Reading disability represents a clear- cut defect in the visual motor field . . . . In addition such children always show a special incapacity to relate the visual structure of a word to its auditory structure. This is probably due to the gestalt of the word as a sign (p. 147).
Drew (1956) subsumed a number of the signal dyslexic symptoms under the concept of a disturbance in Gestalten
formation when he stated-

49
The assumption that the fundamental defect in hereditary dyslexia is a disturbance in Gestalten formation not only permits the explanation of the numerous variations and inconsistencies which appear in the literature, but so suggests a theoretical basis for the monohybrid dominant type of inheritance in hereditary dyslexia (p. 657).
Referring to a previous publication which he co-authored
(Rabinovitch et al., 1954), Drew (1956) stated that the nonfamilial cases of congenital dyslexia he studied ex
hibited, in addition to the reading disability, disturbance
in directional selection, mixed hand-eye preference, abnor
mal face-hand responses, auditory-visual phonetic disinte
gration, and spatial disorientation. He wrote:
No constant neurological sign is present, but if these various findings are interpreted as Gestalten disturbances then the entire symptom complex becomes a coherent entity (p. 457).
Drew (1956) indicated in his review of the literature that others have applied the Gestalt psychology frame of
reference to diagnostic categories related to specific
dyslexia; e.g., right-left disorientation, agraphia,
acalculia, and finger agnosia in the Gerstmann syndrome
expressed a disturbance in Gestalt formation. Critchley (1964) had the same opinion, and wrote that the configura

tional approach promised the best understanding of the
Gerstmann syndrome.
50
Drew (1956)1 reported the views of Duensing (1952),
who considered three stages of visual-gnosis: (a) Gestalt
seeing, (b) Gestalt recognition, and (c) object comprehen
sion. Duensing believed that the problem of visual agnosia
was a defect in Gestalt recognition rather than perception.
In regard to Orton's (1925) views, Drew thought that:
Orton's concept of three cortical levels of integration of vision can be adapted to Gestaltic terminology. Orton believed that 'word-blindness' was the result of a deficit at the third level of cortical visual function, the level of visual association or Duensing's third stage, object comprehension (p. 456).
Though some writers considered specific dyslexia to
be a manifestation of a basic defect in Gestalt formation
or figure-ground relationships, other writers have been
concerned with the relation of specific dyslexia to other
diagnostic categories. Ingram and Reid (1956) viewed
specific dyslexia in the context of developmental aphasia
Drew's review of the article by Duensing (1952) contained incomplete bibliographic information and therefore this author was not listed under Reference m this dissertation.

51
and Wallin (1921) considered it an expression of visual
aphasia. Critchley (1964), however, denied that develop
mental dyslexia (specific dyslexia) results from an aphasic
disorder.In a review of the literature, Benton (1962b) stated
that some writers have considered dyslexia as one manifes
tation of visual agnosia. He does not, however, agree with this position. Herman and Norrie (1958) suggested that dys
lexia is a congenital type of Gerstmann’s syndrome.
Orton's (1966) views on the lack of cerebral dominance
as fundamental to dyslexia have held a prominent position
in our theoretical thinking. He stated:
I believe that this disability rests largely if not entirely on the failure to acquire the physiological habit of leading exclusively from either cerebral hemisphere and that the confusions which exist and which block progress in reading skill are due to an inadequate elision of the engrams in the nondominant side of the brain. This view . . -. implies a physiological rather than a pathological basis for the disability . . . . The physiological view seems well supported by the striking improvement in these children when taught by methods properly adapted to their needs (p. 141).
Thus, there is some uncertainty about (a) the relation
of specific dyslexia to aphasia and agnosia, (b) whether or

52
not specific dyslexia is a true language disorder, (c)
whether it is a relatively isolated condition independent
of more general language or visuoperceptive disorders, and
(d) whether the lack of cerebral dominance is basic to dis
turbed language function.
Experimental Studies
Most of our knowledge about dyslexia has come from
clinical studies rather than from controlled experimental
research. However, clinical knowledge is sufficiently ade
quate that it is now possible to conduct meaningful experi
mental research. The studies reviewed in this section were
selected for one of the following reasons: (a) relevant
clinical variables were measured; (b) control groups were
used; (c) multiple variables were studied; and (d) careful
and sophisticated experimental designs were used.
Rabinovitch et al. (1954) reported the results of their
comprehensive studies on poor readers. They categorized
reading retardation into: (a) primary reading retardation
(specific dyslexia); (b) secondary reading retardation
(emotional disturbance); and (c) brain injury with reading
retardation. In one of their studies on 20 primary and 20

53secondary reading cases, they found a significant difference between the WISC mean Verbal Scale IQ and Performance Scale
IQ. The primary readers achieved a mean verbal IQ of 82.0.
and the secondary readers achieved a mean verbal IQ of 90.9. In comparing the mean difference between the verbal and
performance IQ within each group, they found the mean dif
ference for the primary group was 22.1 and the secondary
group was 8.8, a difference significant to the .001 level.
The primary group, in addition to being significantly deficient on two measures of reading, was also significantly
below the secondary group in arithmetic computation.
Rabinovitch commented that the latter finding was contrary
to what was often reported.
On the neurological findings of the primary reading
group, Rabinovitch et al. (1954) observed a characteristic
pattern: (a) right-left confusion; (b) various extinction or inattention phenomena; (c) cortical sensory disturbances;
(d) mixed hand-eye preferences; (e) nonspecific motor awk
wardness; (f) dissociated dysgraphia; (g) speech difficul
ties; and (h) poor spelling. These symptoms were variously combined, but rarely were all of them present in a given
person.

54Silver and Hagin (1960) reported results similar to
those by Rabinovitch et al. (1954). They studied 150
children referred primarily for behavior problems and
concomitant reading disability, and 30 matched control
children. Three reading-disability categories were uncovered: (a) a syndrome indicating incomplete cerebral
dominance (71 percent of the experimental group); (b) a
group with incomplete cerebral dominance together with structural organic defects (21 percent of the experimental
group); and (c) an assumed ’’emotional** group, since the
subjects presented no evidence of incomplete cerebral domi
nance nor structural organic defects (8 percent of the ex
perimental group). Neither the Rabinovitch et al. study
nor the Silver and Hagin study adequately controlled the
problem of behavior disturbance in its samples. Benton
(1962b) suggested that the experimental group in the Silver
and Hagin study was contaminated with behavior problems,
disturbances in praxis, and a variety of visuoperceptive
difficulties. As he said, **one cannot help but wonder
whether the background reading in their cases was simply
a part expression of a gross behavioral disturbance (p.
100).” Nevertheless, these two studies are worthy of at
tention since few studies reported in the literature are
as comprehensive and systematic in research design.

55Following the diagnostic classification of Rabinovitch
et al. (1954), Fuller and Laird (1963a, 1963b) and Fuller
(1964) reported the results of studies utilizing the
Minnesota Percepto-Diagnostic test (MPD), a visual per
ceptual test developed by Fuller and Laird (1963b). All
three studies indicated that children could be differentiated
into three groups: (a) primary reading retardation (soecific dyslexia); (b) secondary reading disability (associated
with emotional disturbances); and (c) organic reading re
tardation (associated with brain damage).
Fuller (1964), in a study on dyslexic children with
a mean age of 10.61, focused attention on associative pro
cesses rather than perceptual processes. He studied three groups of children with reading disabilities and one group
of children without reading disabilities. The children
were classified by a team of psychologists, psychiatrists,
reading specialists, and social workers. Following the
classification, 287 children ranging in age from eight to
15 were given the MPD test. The children in the secondary
and organic groups produced significant rotations of their
figure drawings. There was no significant difference be
tween the normal and the primary reading groups.

56
The MFD test measures visual perception with respect to directional orientation. It was so designed since
Fuller (1964) stated that directional disorientation was the most frequently mentioned type of deficit associated
with reading disability. Directional orientation is mea
sured in degrees of rotation on two Bender-Gestalt designs
(cards A and 3), each presented on three different back
ground cards: a vertical rectangle, a horizontal rectangle,
and a diamond. This test was developed in the context of
Gestalt psychology. Its construction and the authors*
studies employing the test displayed careful and sophisti
cated experimentation, a procedure conspicuous by its ab
sence in dyslexic research. It represents a major advance
ment in the classification of children into various read
ing disability groups.
Benton (1962b) presented an excellent review of the
dyslexic research pertaining to directional sense and form
perception. About the former, he stated:
Investigation of the role of directional sense as a factor in dyslexia has proceeded along two lines. First, the ability to discriminate between different orientations of identical figures , and tendencies to reverse the conventional left-to-right orientation as well as temporal orientation in

57sequential stimulation have been assessed. Secondly, since directional sense has been related to the development of the body schema, the right-left orientation of normal and dyslexic children, with respect to their own and to those of other persons, hats been examined (p. 96).
In a series of well designed experiments, Benton care
fully investigated right-left orientation and reading dis
ability (Benton 1959b; Benton & Kemble 1960; Benton &
Menefee 1957). In view of his own studies and after review
ing some major studies of directional orientation, Benton
(1962b) concluded tentatively that the importance of this
variable in reading disability has been rather exaggerated.
He believed that directional orientation might be signifi
cant in the early school years, while a child is learning to read, but that it was attentuated in the older dyslexic
children. Although Benton believed that directional orien
tation should be investigated in younger children, he held the opinion that it accounted for only a small portion of
severe dyslexia presented by older school children.
Benton (1962b) concluded his review by stating that,
if dyslexia persisted in older children, directional
orientation might play a significant role ’'when the task
requires implicit verbal mediation for optimal performance
(p. 102)." He was implying that directional disorientation

58
in the older child might be more of a conceptual problem
than one of lateral confusion about the body schema.
According to Benton (1962b), form perception was most
often mentioned as associated with specific dyslexia, as well as with acquired dyslexia resulting from specific neuro
pathology. In his review of the literature, he examined the
thesis that dyslexia was "an attentuated form of visual
agnosia, i.e., a more or less direct consequence of expression
of impairment in form discrimination (p. 87).” He noted
that much controversy existed in the literature on the
significance of form perception. He held that inconsistent
or contradictory findings in a number of the studies might
be explained on the basis of poor research designs, the
failure to control such relevant variables as intelligence,
sample composition, and age. After reviewing the many studies
on perception, Benton stated:
My conclusion is that deficiency in visual form perception is not an important correlate of developmental dyslexia. By this I mean that, while it may be a determinant of the language disability in some cases, it is not a significant factor in the majority of cases. Thus, I should guess (and it is only a guess) that transient reading disability is often conditioned by a retardation in the development of higher- level visuoperceptive skills (pp. 94-95).

59Cerebral Dominance
The hypothesis relating cerebral dominance to reading
disability, particularly specific dyslexia or specific
language disability, has long been controversial in the
literature. Orton's (1937) name is most prominently associated with the idea that the neurological basis underlying
incomplete cerebral dominance is primary to specific language
disability, or strephosymbolia (his term). Zangwill (1962) presented a comprehensive and critical review of the litera
ture relating dyslexia to cerebral dominance. He wrote:
It has been poin'ted out over and over again that many backward readers are lefthanded, ill-lateralized, or exhibit inconsistency of preference as between hand, foot, and eye . . . . Yet opinion differs greatly as regards both the incidence and the significance of such anomalies and a few investigators have denied outright that there is any correlation between atypical laterality and backwardness in reading . . . . At all events, it is obvious that not all backward readers are ill-lateralized and that many individuals with odd or inconsistent lateral preferences learn to read normally (p. 109).
According to zangwill (1962), the available evidence
on laterality and dyslexia indicated that an appreciable proportion of children with dyslexia manifested poorly developed laterality. He did, however, indicate that it was
difficult to understand why some ill-lateralized children
60
were poor readers and others--almost certainly the majority--
were not poor readers. Though ill-lateralization seemed
to be related to dyslexia, there was a theoretical problem
concerning ill-lateralized children who were not poor read
ers .Although Zangwill (1962) did not furnish a solution
to this problem, he did offer two suggestions. First, he
believed that it would be expedient to study the differences between ill-lateralized dyslexics and fully lateralized dys- lexics. As far as he was aware, no systematic investigation
had been done on these differences. Secondly, his clini
cal experience suggested that ill-lateralized dyslexics
manifested retarded speech development, spatial perception
defects, motor clumsiness, and defective maturation, whereas
the fully lateralized dextral dyslexics were more "pure,’'
or specific, in symptomatology. About this second group
he postulated a specific genetic factor as adduced by
Hallgren (1950) and Hermann (1959).
The research findings of other investigators tended to confirm Zangwill’s (1962) conclusions. Galifret-Granjon
and Ajuriaguerra (1951), Harris (1957), Ingram (1959, 1960),
Macmeeken (1939), Orton (1937), Silver and Hagin (1960),
and Silver (1961) suggested that weak, mixed or inconsistent

61lateral preferences were present in children with reading
difficulties. Zangwill believed these studies suggested
that delayed or incomplete lateral specialization of cerebral
function was closely linked with problems of reading. In
a personal communication, however, Zangwill (1964) wrote,
”1 do not think cerebral dominance can be measured It is
possible to measure the strength and consistency of peripheral
lateral preferences in a rough way . . . The question
may be raised, therefore, about the relations between methods
of measurement and the psychoneurological process measured.
Zangwill (1964) implied that conventional methods of mea
surement assessed peripheral dominance rather than cerebral
dominance.
Zangwill (1962) offered three possible explanations
for the correlation of ill-lateralization with dyslexia.
First, an acute cerebral lesion might be present. Tnis
hypothesis was supported by the work of Ettlinger and
Jackson (1955) who found evidence of focal left hemisphere
EEG abnormality or minimal neurological lateralizing signs
in a small portion of dyslexic children. The second ex
planation was that some children with ill-defined lateralitv
had, in addition, a constitutional weakness in maturation.
This constitutional weakness in maturation was suggested

62
by the occasional incidence in dyslexia of nonspecific EEG
abnormality (Statten, 1953), or minimal signs of diffuse
neurological dysfunction (Cohn, 1961; Rabinovitch et al.,
1954). The third explanation was that children who lacked
strong and consistent lateral preferences were particularly
vulnerable to the effects of stress (Zangwill, 1960). This
hypothesis assumed that minimal brain injury at birth might more severely affect those who showed no strong tendency
toward lateral specialization. This contention was supported by Naidoo (1961), who observed that children with ambiguous
handedness had had many complications at birth, and had
come from families with a hi^h degree of sinistrality. In addition, Zangwill (1960) stated that a history of early
brain illness or minor epilepsy was not uncommon in ill-
lateralized dyslexic children.
Relation of Dyslexia and General Reading Disability to Minimal Brain Damage
and Motor Incoordination
Considerable controversy exists in the literature on the relation between reading disability in general and
minimal brain damage. Some of the previously mentioned
studies of motor incoordination and nonspecific awkwardness and ill-lateralization were suggestive of this correlation. A high correlation between reading disability and minimal

63
brain damage was also noted in a few studies based upon
medical case histories. Eames (1955), Eustis (1947), and
Kawi and Pasamanick (1958), all reported a high incidence
of pre- or paranatal complications in the history of child
ren with reading problems. Kawi and Pasamanick (1959)
studied 372 children between the ages of 10 and 14 and noted
toxemia and bleeding during pregnancy in mothers of children
with reading disorders. These same pregnancy complications also were noted in cases involving sti11-births, neonatal
deaths, cerebral palsy, epilepsy, and behavior disorders.
They wrote:Such findings have led to the formulation of a hypothesis that there is a continuum of reproductive casualty with a lethal component consisting of abortions, stillbirths and neonatal deaths and a substantial component consisting of cerebral palsy, epilepsy, mental deficiency, and behavior disorders in children. This investigation suggests that some of the reading disorders in childhood constitute a component of this continuum (p. 61).
In Prechtl’s (1962) investigation of mothers' whose
children manifested choreiform movements, 50% of the preg
nancies had been complicated by toxemia and severe bleeding.
Neonatal disturbances were noted in 46% of the children—26%
had experienced severe asphyxia; 14% had had difficulties in
sucking and had had a low body temperature; and in 8% the

64
delivery had been premature. Additionally, 60% of the
children in the total sample had experiences postnatal
difficulties.
There was a number of other reports in the literature indicating brain damage as an antecedent to reading disabil
ity, e.g., Benton and Bird (1963) and Shankweiler (1962). Most writers did, however, distinguish this form of read
ing disability from specific or developmental dyslexia
which does not result from brain damage, for as Critchley
(1964) wrote, "No brain pathology has indeed ever been
demonstrated in a case of developmental dyslexia (p. 75)." Although attention has been given to visual motor
problems associated with reading disability, few experi
mental studies have focused on problems of motor coordina
tion. The studies done in The Netherlands by Prechtl
(1962) are relevant to this association. Prechtl*s contribution was his discovery of the choreiform syndrome.
He studied a select group of children between the ages
of nine and 12 with choreiform movements. These movements were chorealike twitchings--slight jerky movements occur
ring quite irregularly and arhythmically in different
muscles--of the extremities and of the head. These move
ments occurred suddenly and were of short duration. In 96%

65
of the children, the choreiform movements were observed in
the eye muscles and caused disturbances of conjugate move
ment and difficulties in fixation and reading. In some
cases Prechtl was able to correlate errors in word recogni
tion with the occurrence of involuntary eye movements. In
addition, most of the children had difficulties in right
and left discrimination. Ambilaterality was also observed
in 58% of the cases.
Prechtl (1962) reported an unpublished study by a
colleague who found that children with the choreiform syn
drome, when compared with a control group, were poor readers
and showed a significantly lower performance in their schoolwork. Prechtl provided additional data about children who
had the choreiform syndrome. The majority of the patients
manifested, even at an early age, unrestrained and wild be
havior, clumsiness, inability to concentrate, and very labile
mood fluctuations from timidity to outbursts of agression.
At school, these behavior patterns became increasingly more
obvious. Prechtl considered that most of these children,
however, had adequate intelligence. In another uublication,
Prechtl and Stemmer (1962) reported:
The choreiform syndrome seems to be a form of minimal brain damage and

66falls, by definition into the category of cerebral palsy. No successful form of drug therapy has yet been discovered (p. 126).
In summary, Prechtl (1962) uncovered a neurological
syndrome involving motor incoordination which suggested the presence of minimal brain damage in a group of children with
learning difficulties. He did not assume that all children with reading problems would manifest the choreiform syn
drome. Rather, this type of neurological dysfunction was
only one of several antecedents to reading disability.
Other workers have reported correlations between motor
problems and reading disability. Rabinovitch et al. (1954)
observed problems in the following areas: (a) gait; (b)
performance of motor acts, such as opening and closing doors;
(c) handling of psychological test material; and (d) right
left discrimination. These activities suggested a non
specific awkwardness and clumsiness in motor function. Bakwin and Bakwin (1960) uncovered similar findings. They
observed that a number of children with reading disabilities were abnormally clumsy. Their movements were jerky and
uncoordinated. Cohn (1961) compared a group of children
with reading-writing difficulties with a control group who
were normal in schoolwork and who did not overtly manifest

67 motor problems. Differences between the two groups were
observed on the following variables: (a) right-left orienta
tion (b) evaluation of double simultaneous tactile stimuli;
(c) the knee-jerk reflexes; (d) the Babinski sign; (e) motor
coordination; (f) mechanics of speech; and (g) the EEG.
Bryant et al. (1964) reported the results of an experi
mental investigation of motor behavior in dyslexic children;
however, they did not relate their findings to the presence
of minimal brain damage. Using the Lincoln Oseretsky Motor
Development Scale, they compared the behavior of a sample of reading disability cases with a sample of normal readers.
Both groups were evaluated on the accuracy subtest of the
Gilmore Oral Reading Test. The experimental group was one
or more years below grade level in reading and the control
group was at grade level or above. All children were average
or above average in intelligence as measured by the WISC.
The control group was not significantly different from the norms of the Lincoln Scale, whereas the experimental group
was significantly (.01 level) below the norms of the Lincoln
Scale. The authors concluded from their study:
It is apparent from the analysis given above that reading disability cases usually show impairment in their motor development as reflected by a standardized scale . . . . The fact that the majority

68of items of the Lincoln Scale reflect the impairment suggests that this is a general impairment in motor development rather than extreme difficulty in some specific aspect of coordination of motor function (p. 4).
A few other studies have been reported on the association of nonspecific awkwardness and reading disability. Jensen (1943) characterized 22 cases of poor readers as mani
festing motor incoordination, clumsy gait, and speech de
fects. Although Orton (1937) rejected the association of
motor problems with strephosymbolia, his wife (Orton, 1957),
indicated that clumsiness in handwriting and disability in
other motor acts were characteristic of some children with strephosymbolia.
Auditory Variables
In view of the voluminous literature on reading disa
bility, it is surprising that little attention has been given to the relation of multiple auditory variables and poor reading. A few writers, however, did mention the associa
tion of one or two auditory variables and disorder reading
(Benton, 1963; Birch & Belmont, 1964; Boshes & Myklebust,
1964; Critchley, 1964: de Hirsch, 1961; Ingram, 1959; Kass,
1962; Monroe, 1932; Rabinovitch, 1962; Schilder, 1944. Silver
& Hagin, 1960; ’ifepman, 1962). For the most part, it has
been educators and educational psychologists who have in-
169
vestigated the relation between auditory variables and
general reading retardation, whereas neurologists and
clinical and experimental psychologists have studied the
relation between auditory variables and specific dyslexia.
Auditory Discrimination
From the early part of the twentieth century to the
present time, a few investigators have postulated a relation
ship between auditory discrimination and proficiency in
reading. One of the early reports was by Bronner (1917),
who explained a case of poor reading as resulting from
poor auditory discrimination and memory. Monroe (1932),
in a classic investigation, studied 32 nonreaders and 32
randomly selected children of elementary school age. She
noted that the nonreaders produced significantly more
auditory discrimination errors than did the control group.
Bond (1935) evaluated good and poor readers and found good readers significantly superior in auditory discrimination
Hester (1942) noted that 58% of a group of children (194
children of all ages) evidenced an inadequate knowledge of letter names, sounds, and blends. Schonell (1942) ob
served that 38% of a group of backward readers did poorly on auditory discrimination of speech sounds. Poling
70
(1953) and Reynolds (1953), however, did not find significant differences between good and poor readers. Wheeler and
Wheeler (1954) obtained a nonsignificant low correlation be
tween reading test scores and scores on the Seashore test
of pitch discrimination. It is possible that these last investigators did not uncover significant correlations be
cause their sample children were not severely deficient in reading.
Artley’s (1948) review of the literature indicated that auditory discrimination may be significantly related to
reading disability. Later studies by Goetzmger et al.
(1960), Rabinovitch (1962), Silver and Hagin (1960), and Wepman (1962) suggested a relation between auditory discrimina
tion and poor reading. Findings from Wepman’s study reveal
ed that 27% of 80 first-grade children had inadequate auditory discrimination, with reading scores significantly poorer
than those of the children with adequate auditory discrimina
tion. In the second grade, he found the same evidence m
19% of the children.Goetzinger et al. (1960), indicated the problems in
volved in auditory discrimination research by stating:
It is apparent, therefore, that the research relative to auditory discrimination and reading ability is m conflict.

71
That variables such as the influence of speech reading were not always adequately controlled was apparent from the review of the literature. Furthermore, test materials, varying in difficulty, could account for discrepancies in the results. It would appear, therefore, that further research is needed in the area of auditory discrimination and reading problems (p. 122),
Auditory Memory
Several publications suggested that poor readers were
deficient in auditory memory. Fields (1921) was one of the
first to present experimental evidence on this association.
In a stucty of good and poor readers, each group having rel
atively low intelligence, she found that backward readers
had more difficulty in remembering numbers and words pre
sented auditorily than those classified as good readers.
Hincks (1926), Lichtenstein (1938), Rizzo (1939), Wolfe
(1941), and Raymond (1955) reported similar results. John
son (1955) studied a wide age range (7^ to 18 years) of
poor readers and concluded that 70% of them had deficient
auditory memory spans. A stuc^r by Bond (1935) indicated
small differences in auditory memory between good and
poor readers. Artley’s (1948) review of the literature
supported the hypothesis of a relation between poor auditory
memory span and reading disability. More recently.

72
Schiffman (1962) suggested that in auditory memory span
tests, memory for digits forward was better than memory
for digits backward, and that the span for oral direction
was usually very low for dyslexic children.
Auditory Blending
Monroe (1932) produced evidence suggesting that poor
readers had more trouble blending sounds in response to visually presented words than did normal readers. Although
poor readers were inadequate in producing sounds of single
letters, their blending ability was even more inadequate.
Bond (1935) compared poor and normal readers and found that
the poor readers had more difficulty in blending sounds into words than did normal readers. Reynolds (1953), who
worked with a less severely deficient group of readers than
did Bond, did not find a significant correlation between reading ability and sound blending. Silver and Hagin (1960),
in a study of normal and below average readers, found the
below average readers were significantly poorer in auditory blending than the normal readers. Kass (1962), utilizing
the ITPA, noted that a sample of dyslexic children was de
ficient in auditory blending.

73
Auditory AttentionVery little can be said about the problem of auditory
attention and its relevance to language function as this
association has not been studied, for the most part. Only a few reports have been published. Burt (1937), in addition
to studying auditory perception and immediate memory defects,
noted that poor readers of both sexes experienced difficulty
in auditory attention. In a paper on developmental aphasia
and brain damage, Benton (1963) related auditory inattention to auditory imperception, a form of developmental aphasia;
and he referred to Myklebust’s (1956) statement that the
child is able to hear but cannot listen.
In reviewing the literature, this writer found no studies
on the relation between auditory attention and specific dyslexia. This may be an area needing exploration.
Auditory Intersensory Functions
Several investigators have studied the inter-relations
among the several sensory modalities. Schilder (1944) dis
cussed auditory-vocal-visual intersensory functions of
children with congenital reading disabilities. He reported:
But in all cases one difficulty was outstanding and that was the difficulty of

74 coordinating the sound which is more or less correctly connected with the single letter, with the sequence of letters in the re-write word. This inability was especially evident in short words such as, ME, UP, WAS, BAT, and HEN (p. 85).
Schilder (1944) further stated that congenital reading dis
ability:is due to an incomplete function of the hearing center. It is the inability of the patient to differentiate the spoken word into its sounds, and to put sounds together into a word (p. 85).
Vernon (1958), who presented a comprehensive review
of the literature in England and the United States, dis
cussed auditory discrimination, auditory memory, and auditory-
visual assocation. His review concerned children who were
slow or backward readers, not those with specific dyslexia,
since he did not recognize the existence of specific dys
lexia. He wrote that the backward reader was unable to hear some phonetic sounds clearly (letters, letter combina
tions , and words) and to recall them with sufficient ac
curacy to reproduce them in association with the corresponding printed letters and words. He wrote:
the normal reader acquires his skills in enunciating phonetic sounds correctly and systematically as he learns to read; but the backward reader re-

75mains in a state of confusion over the whole process (pp. 62-63).
Kass (1962), in a study of dyslexic readers, ages 7-0
to 9-11, found that the children were significantly de
ficient in auditory-vocal association as measured by the
ITPA. The auditory-vocal association subtest measures the
ability to draw relationships from what is heard. The sub
ject is tested by means of an analogies test (e.g., the examiner says, "Soup is hot; ice cream is .") Kass
also found that this group of readers was deficient on the
auditory-vocal automatic subtest. In the examiner’s manual,
McCarthy and Kirk (1961) described this subtest as follows:Auditory-vocal automatic ability permits one to predict future linguistic events from past experience It is called ’automatic’ because it is usually done without conscious effort. In listening to a speech, for example, we develop an expectation for what will be said which is based on what has already been said. In the present test, the subject must supply the last word to a test statement, invariably requiring inflection (e.g., the examiner says, ’Father is opening the can. Now the can has been . 1 ) (pp.6-7).
Birch (1962) and Birch and Belmont (1964) have focused
attention on auditory-visual integration. They found that
this form of intersensory organization was less well-
developed in poor readers than in normal readers; however.

76
they did not believe that this was the only factor under
lying poor reading ability.
Speech
Few investigators in dyslexic research have considered
the relation between specific dyslexia and speech problems.
Cole and Walker (1964), de Hirsch (1963), Hardy (1962),
Ingram (1959), Rabinovitch et al. (1954), Orton (1928) did,
however, indicate an association between these two variables.
The types of speech problems they referred to were stuttering, hesitation, repeating words, oral speech deficiencies, clut
tering, and motor speech delay. Quantitative and controlled experimental studies, however, do not appear in the litera
ture on the relation between dyslexia and speech disorders.The relation of speech disorders to the general field
of reading disability also has been relatively neglected,
particularly when compared to the amount of attention given
visual perceptual functions. One of the first to call at
tention to this possible association was Monroe (1932). She
noted that poor readers had many more speech defects than
good readers. In particular, she hypothesized dysarticula-
tion as a relevant factor in reading disability. Others
have more or less supported her general views and some have

77
produced corroborating data (Bennett, 1938; Betts, 1946;
Hildreth, 1946: Moss, 1938; Witty Kopel, 1939). Jones
(1951) produced experimental evidence suggesting that speech
training accelerated the reading achievement of an experimental grouo compared with a control group.
Bond (1935) did not find significant differences in
speech defects between good and poor readers. He considered
skill in oral and silent reading separately and observed
that 35% of those children who were poor in silent reading
had speech defects. Those poor in silent reading but good
in oral reading showed no speech defects. A study by
Everhart (1953) indicated some tendency for boys with normal
articulation to have higher reading achievement than boys
with articulatory difficulties. In regard to silent reading.
Hall (1938) and Moore (1947) both found subjects with dys-
articulation equal to normal speakers in silent reading.
Robinson (1946), after a careful review of the literature
on possible causes of reading disability, concluded that,
”On the basis of the evidence available, articulatory de
fects may be concluded to be important in oral reading but
of little significance in silent reading (p. 99).” Although
she concluded that speech defects may be causal factors in
poor reading, the mere presence of a speech defect did not

78
necessarily imply that it was causally related to reading
retardation. Artley (1948) arrived at a similar point of
view after his review of the literature on some of the fac
tors presumed to be associated with reading and speech
difficulties. He concluded that speech defects might: (a)
cause reading defects; (b) be the results of reading defects;
or (c) that speech and reading defects might result from
some common variable.These studies and reviews indicated that it is feasible
to hypothesize a significant correlation between reading dis
ability and speech defects. From an empirical point of view,
it seems advisable that a research design of comprehensive scope ought to be employed to measure the correlation between
these two factors.
Ophthalmological Problems
Considerable attention has been given to ophthalmologi
cal problems as they relate to reading skill. Most authori
ties have agreed that there was no causal connection between peripheral vision, types of eye movements--as measured
by the frequency and duration of fixations and the number
of regressive movements—and skill in reading. The following brief review, derived primarily from the medical literature.

79 illustrates this point of view. One of the earlier reports
in this area was by Orton (1937), who made the statement
that reading disability was not attributable to poor function
of the visual aperture. Schilder (1944) believed that the
optic functions were intact for poor readers and stated: Certainly the optic mistakes concerning the letters cannot be taken as the cause of the reading disability. They are merely an indication that we deal with the primary disturbance in the oerceptual optic sphere . . . (d. 83).
Cole (1951) stated that vision was adequate in the large
majority of reading disability cases and that it was not
considered by the ophthalmologist to be the cause of failure
in learning. In a review of the literature on peripheral
vision subsequent to Orton’s (1928) early work. Cole and
Walker (1964) reported that disturbance in the following
factors were not found to be related to poor reading: (a)
binocular vision; (b) stereoscopic vision; (c) fusion of
images; and (d) possible variation of size of the images in the
two eyes.Smith and Carrigan (1959) believed that visual prob
lems were an unlikely basis for reading disability, as many
children with very poor vision were successful readers. Critchley (1961) remarked that developmental dyslexia

80(specific dyslexia) was independent of muscular imbalance,
errors of refraction, imperfect binocular fusion; and that
there was no evidence that the reception of visual sense
data was disturbed. Gallagher (1962) said that children with
specific dyslexia did not have visual defects as the primary
cause.
Vernon’s (1958) review of the literature revealed no
significant correlation between poor reading and irregular eye movements. He stated that it was the failure to attend to and to comprehend what was read that caused irregular
eye movements and regressions. Those with irregular eye
movements needed training in understanding rather than training in eye movements. Gallagher (1962) stated that slow
eye movements, length of fixation on words, regressions,
or eye muscle incoordination, were not the cause of poor
reading. Ineffective eye movements were caused by faulty
understanding of what was read. He referred to a statement
by Hermann (1959) that it was the brain, not the eye, that
learned to read. And de Hirsch (1963b) said research had indicated no significant difference in the number of eye fixations between good and poor readers.
The above-mentioned statements and reviews of the re
search literature do not give credence to the notion that

81poor reading results from faulty eye movement patterns or other peripheral visual defects.
Summary
A condensation of the material contained in this chapter
suggests that some of our knowledge about specific dyslexia
is well-defined, that certain specific facts have been ob
served by many clinicians and, to some degree, verified by
research. There are some variables, on the other hand,
regarding which clinicians and researchers are not in com
plete agreement. A summary on the general state of our
understanding of specific dyslexia is presented in Table 2.
An inspection of this table reveals one glaring gap in our
knowledge: there is no experimentally identifiable pattern or syndrome associated with specific dyslexia. Some
clinicians have described symptom patterns, but consensus
is lacking.
All authorities agree that poor reading ability, i.e.,
when considered generically, is caused by a number of dif
ferent factors: low intelligence; brain damage; limited reading instruction* poor teaching methods; cultural de
privation; and heredity. Many authorities believe that specific dyslexia is a familial or hereditary condition and
not related to brain damage. There is some agreement, as

82
TABLE 2
Some Characteristics of Specific Dyslexia as Reported in the Literature by Various but not All Authorities
Measurement Area Description
Intelligence Level of intelligence is adequate and may range from average to very superior.
General Education 1. Emotional-attitudinal problems associated with early school experiences are absent.
2. Generally early success in learning arithmetic. When reading is involved, grades in arithmetic drop.
3. Reading and spelling ability are below grade level or the child's level of intelligence.
4. Writing may be poorly formed and organized.
Reading 1. Learning to read by the whole-word method produces poor results in comparison with a decoding system such as an alphabetic-phonic approach.
2. Rate in oral reading is slow.
3. A wide variety of accuracy errors are produced in oral reading, particularly substitution errors (e.g., "was" for "saw").

83
TABLE 2 continued
Measurement Area Description
Reading (cont.) 4. Reading level is considerably below the achievement level in arithmetic and science.
5. Letter reversal and/or word rotation is present in the early school grades.
6. Mirror reading may be present in the early grades.
7. Tendency to ignore details within words and to base word recognition on insufficient cues such a«5 initial letter and length of word.
Sense Organs Peripheral vision and hearing are intact.
Sensory 1. Visual and auditory sensory modalities may not be hierarchically dominant over other modalities.
2. Poor intersensory integration.
Visual Perceotion 1. Problems associated with object agnosia are not present.
2. Distortion in visual perception is present in the early school years, e.g., form perception and directional sense. These problems are attenuated

84
TABLE 2 continued
Measurement Area Description
Visual Perception (cont.) or eliminated in the latter grade school years♦
3. Poor visual memory.
4. Problems in form constancy, spatial relations, and figureground relationships are present in the early school years, but generally are absent in the latter grade school years.
5. Visual-motor sequencing difficulty in younger children.
6. Slow perceptual speed in younger children.
7. Poor perceptual-motor planning ability.
Auditory Perception 1. Poor auditory discrimination.
2. Poor auditory memory.3. Poor auditory comprehension.4. Poor ability in blending
sounds (inability in blending parts into wholes).
5. Difficulty in associating sounds with the equivalent printed visual symbols.

85
TABLE 2 continued
Measurement Area Description
Speech 1. Dysarticulation may be present .
2. Diadochokinetic ability may be poorly developed.
Neurological 1. Examination reveals no gross neurological signs.
2. Percent of children reported with abnormal EEG varies from 28 to 88 per cent. Interpretation of these findings is difficult since the nature of the samples studied is not always clearly defined.
3. Nonspecific awkwardness is present in some cases, indicating poor motor development and coordination.
4. Directional confusion (rightleft discrimination) may be present, particularly in younger children.
5. Lack of clearly developed peripheral dominance is present in some cases.
6. Confusion in double simultaneous tactile stimuli may be present.

86TABLE 2 continued
Measurement Area Description
Familial 1. Specific dyslexia occurs much more frequently in males.
2. A familial history of poor reading, writing, spelling, particularly in paternal relatives.
3. A familial history of il- lateralization, poor directional orientation, and poor motor coordination.
Etootional Minor emotional problems are present. They are secondary to specific dyslexia and are associated with poor academic success, parental pressure for need of achievement, and peer rejection. Occasionally, severe secondary emotional problems are reported.
General Comments The following variables are not assumed to be antecedent factors:
1. Below average intelligence.
2. Brain daumage.
3. Severe emotional problems.

87
TABLE 2 continued
Measurement Area Description
General Comments (cont.) 4. Educational problems of poor instructional methods and irregular school attendance.
5. Cultural and ethnic deprivation.
6. Poor motivation
Theoretical Specific dyslexia is assumed to result from some form of psychoneurological dysfunction or dysorganization. Some authorities claim this is familial in nature.

88
well as dispute, concerning the characteristics of this
disability. Most authorities agree that perceptual diffi
culties are present in younger children (ages 5, 6, 7, and
perhaps 8), but that cognitive, conceptual, or association-
al difficulties of a verbal nature are the sine qua non of
the older children. Fundamental to both the perceptual and conceptual consideration is an auditory-visual disturbance,
i.e., a problem of establishing the correct sounds with the
equivalent visual symbols. It is for this reason that most
programs have emphasized training in phonemic-visual symbol
association. There is agreement also concerning certain
psychoneurological variables: right-left discrimination,
finger agnosia, directional disorientation, and incomplete
cerebral dominance. Some of these variables in varying
degree may be present in younger children, but not necessar
ily present in older children. Carefully planned experi
mental research and comprehensive longitudinal studies are
needed before adequate understanding can be achieved concerning the complexities of dyslexia. Benton and Bird’s
(1963) comment on the value of this research is well justified.

CHAPTER HI
METHODS AND PROCEDURES
This dissertation posed two major questions- (a) what
are the quantitative characteristics that distinguish chil
dren with specific dyslexia from normal readers?; and (b)
what are the subpatterns or clinical syndromes within the
category of specific dyslexia? The beginning approach to
these questions was a review of the literature to ascertain
the relevant variables in specific dyslexia. A number of
research clinicians were contacted both in the United States
and in England concerning current published and unpublished
research findings. Also, note was made of the various
measurement instruments used in the assessment of the behavior studied.
Selection of a general experimental design was governed
by the nature of the two questions and the kinds of research designs reported by others. A clinical-observational ap
proach was excluded since another study of this type would
add little to the existing knowledge. As indicated in
Chapter I, an experimental approach was the preferred method,
since many hypotheses based on clinical observations have
been offered with little attention to testing these hypotheses.

90
To answer the question, "How do children with specific dys
lexia differ from normal readers?’’, it was necessary to use
a matched group design.
Selection of Subjects and Criterion VariablesThe experimental dyslexic group was selected from the
files in the Pediatric Neurology Study Center, Bradford
Memorial Hospital, Dallas, Texas.Records were available
on approximately 250 previously diagnosed dyslexic children,
collected through the years 1963 to 1965. These children,
in grades one through 12, were referred by pediatricians
and other medical specialists for evaluation of academic
problems particularly in reading, spelling, and writing.
The majority of the children came from the middle to above
middle socioeconomic geographic sections of Dallas. The
referring physicians had seen these children in private
practice. They indicated that the children were free of incapacitating medical problems, such as organic brain
damage or systemic disease.
n eThis unit was under the direction of Dr. Lucius Waites, Pediatric Neurologist, Department of Pediatrics, University of Texas Southwestern Medical School. The Pediatric Neurology Study Center was an autonomous unit housed in Bradford Memorial Hospital.

91
The following information and test scores, collected
by the staff of the Pediatric Neurology Study Center, were
available on all children referred by the physicians:
1. Sex and age of the child, and socioeconomic classification of the parents.
2. Grade level, grades repeated, and school attended.
3. Test results on the Peabody Picture Vocabulary Test, Gilmore Oral Reading Test (accuracy, comprehension, and rate), Durrell Analysis of Reading Difficulty (accuracy, comprehension, and composite score). Bender Gestalt, Raven’s Progressive Matrices (1956), Wepman Auditory Discrimination Test, an informal speech-sound discrimination test, Morrison-McCall Spelling Scale, Paragraph Copy Test, The American Handwriting Scale, and oral and written reproduction ofthe alphabet.
The experimental group, selected from the hospital files,
consisted of 32 children who met the following criteria:
1. Average to above average intelligence, as measured by the Peabody Picture Vocabulary Test (Dunn, 1959).
2. One or more years below grade level in reading, as measured by the accuracy subtest on the Gilmore Oral Reading Test (Gilmore, 1952).
3. One or more years below grade level in spelling, as measured by the Morrison-McCall Spelling Test (Morrison & McCall, 1923).
92
4. Currently enrolled in the third or fourth grade, regardless of age.
5. Pure tone auditory threshold within normal limits.
6. No known medical or physical problems that would contribute to problems of reading.
7. Parents of the children were in the middle to above middle socioeconomic classification.
8. No evidence of serious emotionpersonality disturbances or family conflicts, as determined by school officials and the pediatric neurologist and psychologist participating in this study.
9. Diagnosis of specific dyslexia by the pediatric neurologist and his staff.
Practical and theoretical reasons restricted the selection of subjects to the third and fourth grades. The major
ity of the 250 previously diagnosed children were in these
grades. Being younger, it was more convenient for these children to participate in a research project, since they
were less involved in extra-curricular activities than were
older children. Children in the first and second grades
were not considered, since several developmental variables
might have been present that could have confounded the
diagnostic picture of specific dyslexia; e.g., right-left

93
discrimination, incompletely developed lateralization, inter- sensory equivalence problems, and problems associated with
motor development and physical immaturity. The small sample
size necessitated the selection of children from a restricted
age range or grade range. Another governing factor for selecting children in these grades was that specific dyslexia
is clearly manifested at this period in the educational
history of the child. Knowledge about the early discernible
signs of specific dyslexia can result in accurate detection
of the problem and can lead to appropriate language re
training. Consequently, a study of children at these grade
levels may be beneficial to various professions working with dyslexic children.
The control group consisted of 23 subjects matched
with the experimental group on intelligence, grade, audition,
medical status, socioeconomic level, and family problems.
These children differed from the experimental group in that
they showed no deficiency in reading or spelling, and were
not diagnosed ’’specific dyslexic.” The specific criteria
for selection of the control group were:
1. Average to above average intelligence, as measured by school tests.
2. At or above grade level in reading, as measured by school tests.

94
3. At or above grade level in spelling, as measured by school tests.
4. Currently enrolled in the third or fourth grade, regardless of age.
5. Pure tone auditory threshold within normal limits.
6. No known medical or physical problems.
7. Parents of the children in the middle to above middle socioeconomic classification.
8. No evidence of serious emotionpersonality disturbances or family conflicts, as determined by school officials, the pediatric neurologist, and the author.
Fifty percent of the children in the experimental group
attended private schools; the remainder attended public
schools in either Northeast Dallas or the Highland Park
School District, an incorporated city within Northeast Dallas
which contains Southern Methodist University. Children in
the control group were selected from the same schools as
those in the experimental group, on a prorated basis.
To further limit the differences between the groups,
with the exception of reading and spelling ability, the con
trol group was administered the same criterion tests as
given the experimental children: (a) Gilmore Oral Reading Test; (b) the Morrison-McCall Spelling Test; and (c)

95
Peabody Picture Vocabulary Test. Information from these
tests is presented in Table 3. It is evident that the
two groups did not differ significantly in mean grade level
and mean IQ. Further evidence of nonsignificant difference
in IQ is presented in Table 4. Although the WTSC Full Scale
IQ was not a criterion measure, the results on this measure
did corroborate the results of IQ measures in Table 3.
Consideration was given to the socioeconomic classifica
tion of the parents of both groups. It is well known in
education that many variables contribute to poor performance
or underachievement in reading; namely, cultural deprivation
limited sensory-motor experiences, erratic educational ex
periences due to sporadic school attendance, poor teaching,
and family background evidencing low interest in academic
learning. To control for these variables, only children
from middle to above middle socioeconomic classifications
were selected. The Hollingshead Index of Social Position
(Hollingshead & Redlich, 1958) did not reveal a significant
difference between the experimental and control groups.
Personality-emotional disturbance and family conflicts were not considered relevant by the referring physicians
of the experimental group. The pediatric neurologist and
psychologist participating in this study did not detect

96
Table 3
Comparison of Experimental and Control Groups on Certain Criterion Variables
a Peabody Picture Vocabulary Test (Dunn, 1959).
Group»Mean
grade levelMean IQ»
Mean reading level (accuracy)
Mean spelling level
Control 4.28 113.9 5.6 6.8Experimental 4.31 112.5 3.7 4.0

97
TABLE 4Comparison of Experimental and Control Groups
on the WISC Full Scale IQ
Not significant.
GroupMean IQ F ratio
Probabi1- ity level
Control
Experimental
114.00
110.561.834 .1814*

98
serious personality-emotional disturbances in the chil
dren during the initial screening evaluation nor during any
phase of the project. The interview session with the mothers
also failed to elicit significant mtra-family disturbances
or emotional disturbances m the children. Because of these
facts, pernicious family environmental factors and personality-
emotional factors were ruled out as having significant in
fluence on reading ability in the experimental group.Data on the criterion variables were accepted as evi
dence that the groups were equated except on reading and
spelling. By definition, the experimental group was com
posed of children with specific dyslexia, manifested primarily by poor performance on the reading and spelling tests. The
control group was composed of normal children with no read
ing or spelling problems. It was reasonable to assume,
therefore, that significant differences found between the two groups on the prediction variables could be attributed
to some theoretical consideration of specific dyslexia.
Test Battery and Testing Procedures
Testing was of two types: individual and group. Bach
child was given four individual testing sessions and one

99group testing session. The types of tests administered
in the individual sessions were:
Language Evaluation
1. Gilmore Oral Reading Test, FormA (accuracy, comprehension, and rate)
2. Wide Range Achievement Test (reading)
3. Alphabet (verbal recitation)4. Auditory Blending5. Auditory Intrasensory Integration
Test6. Letter Recognition Test7. Benton’s Revised Visual Retention
Test (Administration C, A, and D)8. Minnesota Percepto-Diagnostic Test9. Benton Right-Left Discrimination
Test (verbal and behavioral forms)10. Harris Tests of Lateral Dominance
(hand dominance and foot dominance forms)
11. The A-B-C Vision Test for Ocular Dominance
12. Benton’s Finger Localization Test (single and double stimulation)
Intellectual Evaluation (WISC)
1. Information2. Comprehension3. Arithmetic4. Similarities
Testing was done at the Dean Memorial Pediatric Neurology Division, Texas Scottish Rite Hospital for Crippled Children, Dallas, Texas. The Pediatric Neurology Study Center, where the experimental groups had been selected, was moved to the latter facility.
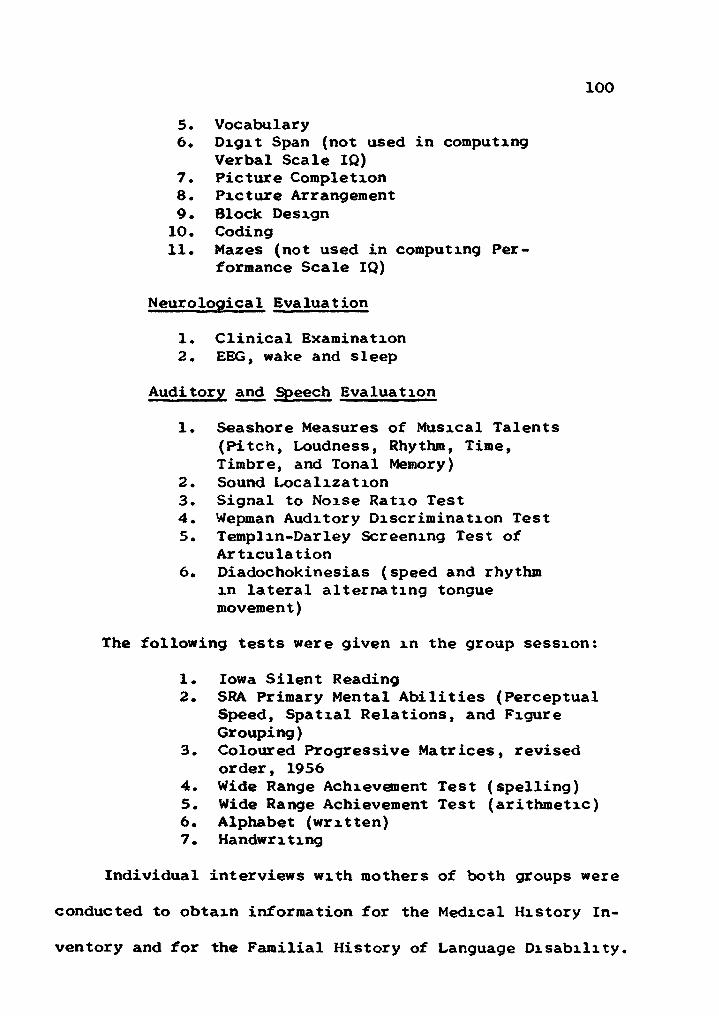
100
5. Vocabulary6. Digit Span (not used in computing
Verbal Scale IQ)7. Picture Completion8. Picture Arrangement9. Block Design10. Coding11. Mazes (not used in computing Per
formance Scale IQ)Neurological Evaluation
1. Clinical Examination2. EEG, wake and sleep
Auditory and Speech Evaluation
1. Seashore Measures of Musical Talents (Pitch, Loudness, Rhythm, Time, Timbre, and Tonal Memory)
2. Sound Localization3. Signal to Noise Ratio Test4. Wepman Auditory Discrimination Test5. Tempiin-Darley Screening Test of
Articulation6. Diadochokinesias (speed and rhythm
in lateral alternating tongue movement)
The following tests were given m the group session:
1. Iowa Silent Reading2. SRA Primary Mental Abilities (Perceptual
Speed, Spatial Relations, and Figure Grouping)
3. Coloured Progressive Matrices, revised order, 1956
4. Wide Range Achievement Test (spelling)5. Wide Range Achievement Test (arithmetic)6. Alphabet (written)7. Handwriting
Individual interviews with mothers of both groups were
conducted to obtain information for the Medical History In
ventory and for the Familial History of Language Disability.

101
Selection of standard tests was governed by: (a) the
literature reporting tests currently in use; (b) Buros*
Mental Measurements Yearbook (1953, 1959); (c) correspondence
with various clinicians engaged in research; and (d) need
for new tests not reported in the literature. Two new tests,
Auditory Intrasensory Integration Test and Letter Recognition
Test, were developed by this author to explore more specifically auditory and visual perception functions.
After the initial battery of tests was selected in
consultation with the pediatric neurologist, copies of the battery were sent to a number of clinicians and researchers for their opinions. Based upon their suggestions, a few
tests were dropped from the battery and several were added.
Description of Measurement Instruments
The following is a brief description of the instruments
employed in this study. More complete information may be
obtained from the original sources and from Buros’ Mental
Measurements Yearbook (1953 , 1959). Copies of some of these
instruments are presented in the appendices. Designation
of the types of evaluations within this study, such as
language, psychological, neurological, etc., were somewhat
arbitrary, in terms of the tests they subsume. These

102
classificatory titles were as much for the convenience of
organizing blocks of tests per testing situation as they
were for indicating the internal relatedness of the tests
within each category.
General Remarks about the Language Evaluation
This evaluation took place within one testing period of
approximately one hour and 15 minutes. Testing was done by
the staff psychometrist who was familiar with all the tests and who had several years of experience evaluating children
with language problems. Typical testing procedures were
maintained throughout the evaluation. The order of presenta
tion of tests was arranged in a predetermined sequence, the same sequence being used for all children of both groups.
Tests with dissimilar performance requirements were inter
mixed to present novelty and to maintain the interest of the
children. A short rest period was provided midway in the testing situation.
Gilmore Oral Reading Test (Form A). This test by Gil
more (1952) measures four aspects of oral reading: accuracy,
comprehension (immediate recall of factual information),
rate or speed in reading, and types of reading errors. In
addition, qualitative evaluation of voice is provided. As

103
an adjunct to this test, an additional category for miscel
laneous errors was included for purposes of this study. The
types of reading errors were:
1. Substitution. A sensible or real word is substituted for the word in the reading paragraph.
2. Mispronunciation. Instead of reading the correct word, the subject produces a nonsense word in one of the following manners: (a) false accentuation, (b) wrong pronunciation of letters, or (c) omission or addition of letters.
3. Words pronounced by examiner. If the child is unable to pronounce the word within five seconds, the examiner pronounces it for him.
4. Disregard of punctuation. The child fails to observe punctuation.
5. Insertions (including additions). The chi Id inserts one or more words not present in the reading material.
6. Hesitation. The child pauses at least two seconds before pronouncing a word.
7. Repetition. The child repeats a word, part of a word, or a group of words.
8. Omission. The child omits one or more words that appear in the reading material.
Evaluation of voice quality involved:
1. Word-by-word reading.

104
2. Reading in a monotone voice.
3. Poor enunciation.
4. Strained pitch.
5. Volume too loud or too soft.
Miscellaneous errors were-
1. Child loses place in reading.
2. Child is a ’’finger pointer.”
Wide Range Achievement Test (reading). The ’Vide Range
Achievement Test by Jastak and Bijou (1946) is a three part
test measuring ability in spelling, arithmetic computation,
and reading. In the reading section, the child is present
ed a list of 128 words. He is asked to pronounce the words one after the other. There is no syntactical relationship
among the words as they are not arranged in sentences or
paragraphs. Types of reading errors are disregarded in
scoring; the child either passes or fails each word. The
child may make one or more errors in pronouncing the v.ords,
but it is his last pronunciation that is scored as passed
or failed. Since this test is a measure of word attack
skill, initial mispronunciations are disregarded if the final
production is correct. The ceiling is reached when the child
makes eight successive errors. The total number of words
correctly pronounced constituted the score.

105Alphabet (verbal recitation). The child is asked to
recite the alphabet in sequence. If he omits one or more
letters or recites one or more letters in incorrect se
quence, the child fails the test.
Auditory Blending Test. This test, developed by Gates and McKillop (1962), contains 15 words. The examiner pro
nounces each word, syllable by syllable, with a half-second
pause between syllables. The child is asked to say the word.
There is only one trial for each word. The score consisted
of the total number of words correctly identified.
Auditory Intrasensory Integration Test. This test, clinically developed by the author, was based on the observa
tion that children and adults with specific dyslexia seem
to have much difficulty in recognizing simple words spelled
to them. It contains 25 words each spelled out with a half-
second pause between letters. The words were selected from
the Morrison-McCall Spelling Scale (Morrison & McCall, 1923).
The range or level of spelling difficulty was between grades 1.0 and 1.9. This test was included in the battery because
the psychological processes involved in integrating letter
names into a meaningful whole appear to be different from
the processes involved in a regular spelling test. Of
course, if there is a very high correlation between the two

106
procedures within a factoral matrix then this assumption
will prove to be unwarranted.
This test was scored in two ways; total number of words
correctly identified, and the cumulative reaction time in
producing responses. The reaction time was the interval be
tween the last letter of the word announced by the examiner
and the time the subject made a response. If the child did
not make a response within 10 seconds, timing was discontinued.
Letter Recognition Test. Many studies have reported that children with specific dyslexia exhibited visual-perceptual
confusion in letter recognition. Bryant (1964), for example,
noted that spatial confusion was frequently present in re
verse image letters, such as ”b,” ”d,” and ”p." The Letter
Recognition Test was developed for the present study in an
effort to quantify this behavior. The test consists of 12
rot/s with 22 letters in each row. The 12 letters are randor.l,
presented in each row. Many of these letters are commonly
confused by children with specific dyslexia. One row of
letters is revealed at a time. The examiner announces only
one letter within each row; the child is to circle this let
ter. He may, however, circle an incorrect letter. Scoring
consisted of the total number of letters correctly identified
and the total reaction time. Reaction time was the cuiula-

107
live time interval between the announced letter and the time
the child started to circle a letter, regardless of the letter
circled.Benton’s Revised Visual Retention Test. This test, de
veloped by Benton (1955), consists of three sets of 10 cards.
Each card contains one or more geometric designs. In Administration "C,” the child copies on a separate sheet of
paper the 10 designs. This procedure is similar to that of
the Bender Gestalt. In Administration "A,” the child is
shown each design for 10 seconds. He then reproduces it.
This administration is similar to the visual reproduction
subtest of the Wechsler Memory Scale (Wechsler & Stone, 1945).
In Administration ”D,” the child is shown each design for
10 seconds. Following a 15 second delay or waiting period,
the child reproduces the design. This is a delayed visual
memory test. In all three separate administrations, scoring
consisted of the total number of correct reproductions, and
the total number of errors. Scoring was governed by instruc
tions in the manual. No breakdown was made for the types
of errors.
Minnesota Percepto-Diagnostic Test. This test was de
veloped by Fuller and Laird (1963b). It consists of six
cards, three cards containing Figure ”A” and three cards

108
containing Figure ”3” derived from the Bender Gestalt. The directional orientation of each Gestalt figure, in relation
to the card, constitutes the difference among the six de
signs. (See illustration in Appendix C.) The cards are
presented in sequence and the child views the design while he draws it. He is given one sheet of paper and he is not
allowed to rotate the paper or the cards. Scoring is in
terms of degrees of rotation of the figure in relation to a
base line. Administration and scoring followed the in
structions in the manual.
Benton's Right-Left Discrimination Test. Benton (1959a) has developed a systematic series of tests to mea
sure right-left discrimination. In Part I, the child is
asked to touch one part of his body (either ear, knee, eye
or shoulder) with his right or left hand. There are seven of
these commands. In Part II, the child is shown eight pictures,
each depicting either the right or left hand on either the
right or left body part (eye or ear). The child is asked
which hand is on which body part. Correct responses are in
terms of the body schema of the pictures, not the body schema
of the child. Benton (1959b) indicated that some children
made consistent reversals on this part of the test, i.e., if
the picture showed the right hand on the left ear, the child

109
would indicate that the left hand was on the right ear. If
this occurred, Benton scored the responses as correct but
took note of the fact that consistent reversals were made.
The same procedure was adopted in this study and a dichoto
mous yes-no scoring system was used. A separate scoring system was employed to record whether or not the child made
consistent reversals on Part II.
Part I and Part II were scored separately and in terms
of the total number of correct responses for each part. For
the purposes of this study, an additional grand total (Part
I plus Part II) was obtained. Also, a recording of whether or not the child reversed all of his responses on Part II—
a dichotomous yes-no-system—was made.
Harris Tests of Lateral Dominance. Only two subtests,
Hand Dominance and Foot Dominance, were used from a series of dominance tests developed by Harris (1958). In the Hand
Dominance test, the examiner asks the child to demonstrate, in pantomime form, 10 separate activities involving the use
of a hand; for example, throwing a ball, winding a watch,
hammering a nail, etc. Note is made of which hand is used.
In the Foot Dominance test, Harris has two items; kicking a
football and stomping out a fire. A third item, hopping on one foot, was added to increase reliability. An extended

110
version of the Harris system of classifying dominance was
developed by the author for computer analysis, as follows:1. Eye (left = 0, right = JL). If the
majority of sightings were done by one eye, it was scored as the dominant eye.
2. Hand (left = O, right = 1J. If the majority of pantomime activities were done with one hand, it was scored as the dominant hand.
3. Foot (left = 0, right = .1). If the majority of activities were done by one foot, it was scored as the dominant foot.
4. Right lateralization (no = 0, yes = 1.) • If the child used his right eye, hand, and foot the majority of times, he was classified as right-lateralization.
5. Left lateralization (no = 0, yes = JL). If the child used his left eye, hand, and foot the majority of times, be was classified as left-lateralization.
6. Incomplete eye (yes = 0, no = jl). If one eye, whether right or left, was not used in all the sightings, the classification was incomplete eye dominance.
7. Incomplete hand (yes = 0, no = 1J. If one hand, whether right or left, was not used in all the pantomime activities, the classification was incomplete hand dominance.
8. Incomplete foot (yes - 0, no = 1J. If one foot, whether right or left,

Ill was not used in all the activities, the classification was incomplete foot dominance.
9. Cross dominance (yes = 0, no = 1J. If a child was right-eyed and lefthanded or left-eyed and right-handed, he was classified as cross-dominant.
10. Complete lateralization (no = 0, yes s I). To be classified as completely lateralized, a child could be either right-dominant (eye, hand, and foot) or left-dominant (eye, hand, and foot).
The A-B-C Vision Test for Ocular Dominance. This test, developed by Miles (1946), forms one part of the binocular
tests in the Harris Tests of Lateral Dominance (Harris 1958).
The child is asked to sight through a cone, open at both
ends. The examiner presents eight cards successively, each containing two circles of different size and different de
grees of shading. The examinei, who is 10 feet away, asks
the child to look through the cone and indicate which circle
is larger or which is darker. The examiner attends only to which eye is used in sighting and disregards the verbal
responses. The eye used in sighting was recorded.
Benton’s Finger Localization Test. Instructions for
administering and scoring this test were obtained in private
communication from Benton (1964). The test is briefly des
cribed in Benton (1959a). A 12-X-16-inch box with slanting

112
top, open at both ends, was constructed for use in adminis
tering this test. A curtain at the front of the box pre
vented the child from seeing what the examiner was doing.
The test consists of two parts; single stimulation of the fingers of both hands (10 trials for each hand) and double
simultaneous stimulation of the fingers of both hands (10
trials for each hand). A tracing of the hand to be stimulated
was placed on top of the box with the numerals 1 through 5
recorded on the finger tips. Scoring consisted of three parts:
total score for single stimulation, total score for double
simultaneous stimulation, and a grand total for both tests.
Only correct responses were scored.
Intellectual Evaluation (WI3C)
This evaluation was done by the author within one
testing period. Wechsler's (1949) manual was followed for
administration and scoring of the subtests selected for
this study. Subtests administered were: Information, Com
prehension, Arithmetic, Similarities, Vocabulary, Digit Span, Picture Completion, Picture Arrangement, Block Design, Coding,
and Mazes. The Object Assembly subtest was omitted. The
Digit Span subtest was not used in confuting the Verbal Scale IQ. The Performance Scale IQ was computed on a pro-

113rated basis of the subtests administered with Mazes excluded.
For computer analysis, the Digit Span subtest was addition
ally scored in terms of the magnitude of the difference be
tween digits recited forward and digits recited backwards.
As it turned out the direction of the difference was in favor
of more digits recited forward than backwards for all children in both groups.
Neurological Evaluation
Clinical Neurological Examination. The neurological
evaluation was developed by Dr. Lucius Waites, pediatric
neurologist, and for the most part was derived from pro
cedures previously used in examination of children with
specific dyslexia, learning disabilities in general, and neuropathological disorders. A few modifications of his es
tablished procedure resulted from a review of the literature regarding neurological tests of children with specific dys
lexia and from the work of Zedler (1965) in particular.
EEG. EEG tracings were obtained from a Grass Model
6-16CH6B electroencephalograph by a trained EEG technician
under standardized conditions. The EEG procedure included
wake, sleep, hyperventilation, and photic stimulation tra
cings. Each subject was assigned to one or more of nine

114
categories. He could, for example, be assigned to the ”14
and 6 cycles per second” and the ’’Fast” categories, if both
were observed on the tracing. The "Abnormal-Other” classi
fication was employed for subjects with an abnormal tracing
not specified by the other categories. As it turned out,
none of the children in either group was assigned to this
category. The following EEG categories were used:
1. Slow
2. Fast
3. Mixed (diffuse)
4. Paroxysmal bursts
5. Focal
6. Immature tracing
7. 14 and 6 cycles per second
8. Abnorma1-Other
9. Normal
Auditory Evaluation
Auditory testing was done by a fourth-year speech and
hearing major under the supervision of Mrs. Louise Helton, registered audiologist of the Callier Hearing and Speech
Center, Dallas, Texas. Subjects were evaluated in a sound room under standard conditions. The Seashore Measures of

115
Musical Talent, the Signal to Noise Ratio Test, and the
Wepman Auditory Discrimination Test were presented to the children on tape. A Beltone audiometer was used for the
Sound Localization Test.
Seashore Measures of Musical Talents. This test, de
veloped by Seashore, Lewis, and Saetveit (1960), measures
auditory discrimination in the following areas: pitch, loud
ness, rhythm, time, timbre, and tonal memory. Although the
test was designed for group administration, slight modifica
tions in the instructions to the examinees enabled it to be
used individually. Scoring consisted of the total number of correct responses for each subtest.
Sound Localization Test. This test measures the ability
of a person to localize sound in a three dimension field. In
this study the stimulus was a 1000 cycles per second signal,
40 dbs above the pure tone auditory threshold of each child.
The signal was presented to the child in a sound room for a
duration of one second. The child had five directional
choices to make concerning where he thought the sound origi
nated: right, right-oblique, center (front), left-oblique,
and left. A practice session to familiarize the child with
the problem preceded the testing and consisted of one signal
for each of the five directions. Whether or not he guessed

116
correctly, the examiner demonstrated the correct localiza
tion response. The five directional signals were randomized.
Testing consisted of 20 trials and correct responses were
scored.
Signal to Noise Ratio Test. Silver and Hagin (1964)
employed this type of test in research on children with spe
cific dyslexia. The test is similar to a visual figure
ground test in that the child attempts to differentiate an
auditory figure from an auditory background. The figure or auditory signal was 50 words presented on record W-22 from
the Central Institute for the Deaf. The background was white
noise. The signal and noise were reproduced on tape at 55
to 45 db level respectively. The signal consisted of an
announcer saying, ”Say the word .” (See Signal to
Noise Ratio Test, Appendix D, for the list of 50 stimulus
words.) This was repeated 50 times, once each for the 50
different words. Each time the announcer gave a stimulus
word, the child, who was in the sound room, repeated through
his microphone the word he heard. The score was the total number of words correctly reproduced.
Wepman Auditory Discrimination Test. This test by
Wepman (1958) consists of 40 pairs of words, 30 of which are
different, but similar in phonetic structure, and 10 of
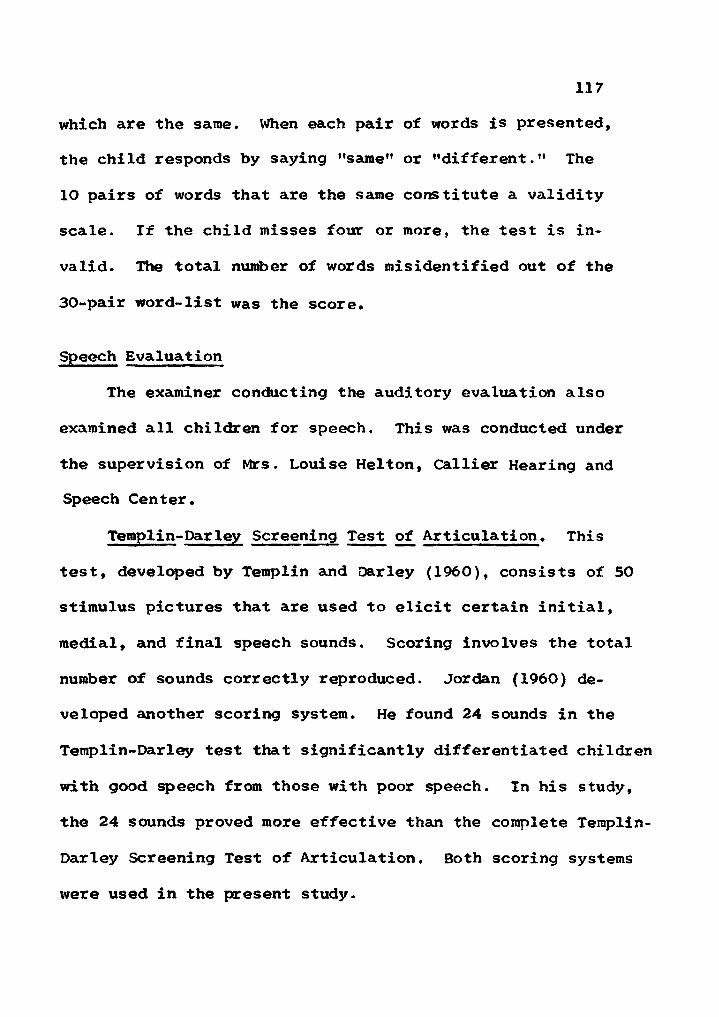
117
which are the same. When each pair of words is presented, the child responds by saying ’’same” or ’’different." The
10 pairs of words that are the same constitute a validity scale. If the child misses four or more, the test is in
valid. The total number of words misidentified out of the
30-pair word-list was the score.
Speech Evaluation
The examiner conducting the auditory evaluation also
examined all children for speech. This was conducted under
the supervision of Mrs. Louise Helton, Callier Hearing and Speech Center.
Templin-Parley Screening Test of Articulation. This
test, developed by Templin and Parley (1960), consists of 50 stimulus pictures that are used to elicit certain initial,
medial, and final speech sounds. Scoring involves the total
number of sounds correctly reproduced. Jordan (1960) developed another scoring system. He found 24 sounds in the
Templin-Darley test that significantly differentiated children
with good speech from those with poor speech. Tn his study,
the 24 sounds proved more effective than the complete Templin-
Darley Screening Test of Articulation. Both scoring systems
were used in the present study.

118
Diadochokinesis. This is a commonly used informal
tongue movement test employed by speech therapists. There
are several measures involved: the saying of ”tuh;” total number of jaw movements in clicking of teeth together over
a short time span; total number of left-right lateral tongue movements; and rhythm of left-right lateral tongue movements. In consultation with several speech therapists, it was arbi
trarily decided to use total number of left-right lateral
tongue movements, over a 10 second period of time, and to use the quality of tongue rhythm in left-right lateral move
ments .
The examiner demonstrated the test and allowed several
practice sessions for the child in order to assure adequate
understanding of the tasks. Following the practice sessions,
the examiner counted the total number of lateral tongue movements. A tongue movement consisted of a sweep of the tongue from one corner of the mouth to the other and back to the
starting point. If there was any doubt concerning the
quality of tongue rhythm, the test was repeated. The classification of rhythm was in two degrees: good and poor coordination.
Group Testing
Normally six to eight children were present for group

119
testing. At no time did this number exceed 10. Individual
desks were spaced to make copying impossible. The author
administered all group tests. Standardized testing pro
cedures were followed.
Iowa Silent Reading Test (Form 4). This test is one section of the Iowa Tests of Basic Skills developed under
the editorship of Lindquist and Hieronymus (1964). It is
55 minutes long and measures the following areas:
1. Recognition and understanding of stated or implied factual details and relationships.
2. Discernment of the main idea.
3. Organization of ideas.
4. Evaluation of what is read.
Reading sections are followed by questions with multiple
choice answers.
SRA Primary Mental Abilities. Three visual perception
sections were selected from the Primary Mental Abilities,
revised edition (Thurstone & Thurstone, 1962) as follows:
Spatial Relations, Figure Growing, and Perceptual Speed.
Coloured Progressive Matrices (1956). This test by Raven (1956) was administered to measure cognitive nonverbal
visual perception since uncertainty concerning its relevance
to dyslexia is present in the literature.

120
Wide Range Achievement Test (spelling). In this examination, the examiner states the word to be spelled, uses the
word in a sentence provided by the manual, and restates the
word. Scoring consisted of the total number of words correct
ly spelled.
Wide Range Achievement Test (arithmetic). This is a
computational test. The ceiling is reached when the child
makes 10 consecutive errors. The score was the total number
of problems correctly solved.
Alphabet (written reproduction). This test simply in
volves writing the alphabet in sequence. The manner of reproducing the alphabet is of no consequence, whether manu
script, cursive, upper or lower case. The test was scored
as passed or failed. The test was failed if one of the follow
ing errors were made: omission of letters; improper se
quence of letters; and reversals of letters such as ,,z.n
Handwriting. Each child was presented a printed para
graph on a sheet of paper. The children were asked to copy
the paragraph on the paper in cursive writing. Children in
the third grade copied a third-grade passage and those in
the fourth grade copied a fourth-grade passage. These para
graphs were from the American Handwriting Scale (West, 1957).

121
The written material was classified by three judges into four divisions: very poor, poor, good, and very good. The
three judges (the author, the staff psychometrist, and a
Ph.D. language disability specialist) collaborated in judging
the qualitative characteristics of the handwriting.
An informal scale for analysis of handwriting difficul
ties was developed by the author and the psychometrist as
a guide in judging the specimens, as follows:
1. Inconsistency in slanting of letters.
2. Malformation of lettersa. Unclosed letters such as ’’o”
and ”a”b. Misformed letters (bizarre
formation of letters)c. Spacing of letters (too little
or too much spacing)d. Height of letters in relation
one to another (disregard of the relative height of "f,” nh,” "k," ”1” in relation to ••a,' ’’c," ”e,” ”i,” etc.)*
e. Inconsistency in formation of identical letters
3. Irregular line formation (sentence not written in a straight line)
4. Letters retraced5. Erasing of letters
6. Incomplete letters (,,tM not crossed, ”i” not dotted, etc.).
Each child was assigned to one of four groups, ranging
from best to worst in quality of writing. Specimens within

122
each category were then assigned a group number: 0 = very
poor; = poor; £ = good; and 3^ = very good.
Interview Schedules
Two interview schedules were employed, the Medical History Inventory and the Familial History of Language Disability,
A staff registered nurse interviewed mothers of both groups.
She was conversant with medical and familial history in
formation contained in both schedules, and she was trained
in interviewing techniques.
Medical History Inventory. This inventory was adapted
from Zedler (1965) by the pediatric neurologist. Items were
presented as nontechnical questions. When necessary, exam
ples were given to explicate the items.
Familial History of Language Disability. This inventory, which was given to the mothers of both groups, was developed
by the author to explore familial factors in specific dys
lexia. The ideal approach would have been an evaluation of
the siblings and parents of both groups of children. Such
a task was too involved for this study.
The nine items in this inventory are reading, spelling,
handwriting, laterality, directional orientation, motor co
ordination, speech, overall judgment, and siblings. The

123
first eight items are divided into two categories: father
and mother. The ninth item is divided into two categories:
brothers and sisters. Subdividing the items allowed for
statistical analysis of a sex linked basis for specific dys
lexia.
Each item is briefly described in the schedule and was
used by the nurse in interviewing the mothers. The nurse*s
qualitative judgment was the basis for deciding the presence or absence of parental or sibling involvement on each item.
Statistical Analysis of Data
Information on each child was recorded on individual
test forms and transferred to a master data collection sheet Scores for each child were then punched on Fortran cards. The data were analyzed on a CDC 1604 computer at the University of Texas Computation Center. A total of 197 var
iables and/or measurement operations were studied.
Analysis of Variance
The statistical measurement of significant difference between the experimental and control groups was by simple analysis of variance. This method was chosen over the t^
test as the latter method was not in the program library of
the statistician consultant to this research project. Of

124
the 197 variables analyzed, 42 were significant at the .05
level or less. Two variables at the .06 level were arbitrar
ily considered significant for clinical reasons so they could
be included in additional analyses. Thus, the total number I
of significant variables was 44. This number was reduced to
43 as one variable, Neonatal Respiratory Difficulty (variable
42, Table 5), was excluded from additional statistical analy
sis. Since the control group has shown more respiratory difficulties than the experimental group, further analysis
would not add to our understanding of the experimental group.
Intercorrelation of Significant Variables
An intercorrelation matrix was computed on 43 significant
variables derived from the analysis of variance for the
experimental group.
Principal Axis Factor Analysis with Varimax RotationThis analysis was made only on the 43 significant vari
ables of the experimental group. It was a preliminary step
to the hierarchical grouping analysis since interest was m
identifying important variables that might differentiate the
experimental group into subsyndrome patterns.
Hierarchical Grouping Analysis
Following the factor analysis, the variables within each

125
factor with the highest loading were selected for the hierarchical grouping analysis. This method of analysis was develop
ed by Ward (Ward, 1963; Ward & Hook, 1961). The routine
developed by Ward is contained in Veldman's (1965) statistical
program library with Veldman's description of the routine as
follows:
This program clusters individual's profiles of test scores by a step-wise procedure which combines subjects (groups) so that total within-groups variation (considering all test variables equally and simultaneously) is minimally increased at each stage. The reduction proceeds from N one-person groups down to two groups. Beginning at an option-controlled stage, all subsequent stages of printout include complete group-membership information as well as the increase in within-group variance and the accumulated total of this error (p. 34).
In this routine, each child m the experimental group was
assigned to a group based upon the pattern of his scores
on the 14 variables selected from the factor analysis. The
routine was programmed to produce two or more mutually ex
clusive groups, and in the case of this study, syndrome pat
terns of specific dyslexia.
Analysis of Variance of the Variables Selected from the Factor Analysis for the Groups Identified by Hierarchical Grouping Analysis
A summary of the procedures leading up to the analysis of variance is as follows:

1261. Identification of the significant
variables distinguishing the experimental and control groups.
2. Factor analysis of the significant variables using only data from the experimental groups.
3. Selection of the variables within each factor with the highest loading.
4. Identifying and categorizing the children of the experimental group into subgroups (hierarchical grouping analysis) in terms of the variables with the highest factor loadings.
5. Analysis of variance of subgroups (hierarchical grouping analysis) X variables (variables with the highest loadings derived from the factor analysis).
The print out of this analysis of variance resulted in the
following information: groups F ratio; mean scores for the
subgroups for the variables with the highest loadings; and
probability levels for each F ratio for the variables.

CHAPTER TV
RESULTS
The results are presented in the following sequence:
(a) significant variables identifying the experimental group; (b) intercorrelations of significant variables; (c)
factor analysis of significant variables, (d) hierarchical
grouping analysis of the experimental group; and (e) analy
sis of variance of the important loadings from the factor
analysis used in the hierarchical grouping analysis.
Significant Variables Identifying the Experimental Group
The 42 significant variables at the .05 level or less
are presented in Table 5 and the two variables arbitrarily
considered significant—making a total of 44 significant
variables--are shown in Table 6 (variables 1 and 2). Only
43 significant variables, however, were used in later statistical analyses as variable Neonatal Respiratory Diffi
culty (variable 42, Table 5) was excluded from considera
tion. This was done because the control group had more in
volvement than the experimental group on this variable. The
following statistical information is contained in both
tables: F ratios; experimental and control group means;

128
and probability levels. The variables are arranged in de
creasing levels of significance. A scoring system such as
the following was used in all cases where a mean value of
less than one is found:
0 - the observed variable is not present (or is present)
1 = the observed variable is present (or is not present)
or
0 = the observed variable is not present1 = the observed variable is mildly pre
sent (mild involvement)
2 = the observed variable is moderatelypresent (moderate involvement)
3 = the observed variable is present to agreat degree (severe involvement)
These classifatory systems were used for the neurological,
alphabet, familial history of language disability, handwriting,
medical history variables, and lateral dominance measures.
On all 43 significant variables, the experimental group
was at a lower level of performance than the control group, i.e.,
the experimental group had more difficulty m functioning than
the control group, except on Picture Completion, (variable 32, Table 5, page 145). On Picture Completion, the experi
mental group performed better than the control group. On

129Foot-Dominance (variable 29, Table 5), the experimental group was sinnificantlv more left footed than the control group, (Tables 5 through 19 appear on pages 139-201).
Table 6 contains the variables that tend toward significance, i.e., between the .06 and the .10 levels. Since few experimental studies have been reported, the 16 variables in
this table are presented so that future research may take
cognizance of their relative importance in specific dyslexia.
This is to guard against Type II error.
The 41 significant variables listed in Table 5, with the
exception of Neonatal Respiratory Difficulty, and the two variables arbitrarily classified as significant (Table 6,
variables 1 and 2) are listed in Table 7 according to areas
of measurement, i.e., language, intellectual, visual memory retention, etc. The variables that tend toward significance
are listed in Table 8 according to areas of measurement. Table
9 presents for each area of measurement the number of variables studied, the number of significant variables, and the
percentage of significant variables. The area of language
contains the largest number of significant variables (13 out
of 29), followed by auditory (7 out of 12), familial history
(8 out of 18), and intellectual (5 out of 16).

130
The percentage column in Table 9 gives some idea of the
relative contribution of the various measurement areas, in
terms of the number of significant variables to the number
of variables studied. The importance of the percentages list
ed is relative only to the total number of variables within
any given area of measurement. Areas that contain a fairly
high number of variables but few significant variables are as
follows: (a) neurological examination (3 out of 41 were sig
nificant); (b) medical history (1 out of 27 was significant);
(c) EEG (none out of 18 were significant); (d) visual percep
tion (2 out of 13 were significant); and (e) dominance (2 out
of 10 were significant).
Referring again to Table 5, it is evident that there is
considerable similarity among several of the variables: for
example, variable 13, Alphabet-Total (verbal and written
scores combined), variable 14, Alphabet-Written, and variable
37, Alphabet-Verbal; and variable 8, Auditory Intrasensory
Integration Test (total number right), and variable 12, Auditory Intrasensory Integration Test (total reaction time in
seconds). The purpose of such a definitive classification
of some of the major variables was to determine the best
scoring system that would reflect differences between the experimental and control groups. Although there may be a

131
significant difference between the groups on a given vari
able, one type of scoring system may be more sensitive to
this difference than another type of scoring system.
Tntercorrelation of Significant Variables
Table 10 identifies variables by number that appear in
Table 11, the table showing the intercorrelations of the 43
significant variables. When noting the significant correla
tions in Table 11 one refers to Table 10 for the names of the
intercorrelated variables. Table 12 lists each variable and
the significant variables correlated with it. The level of
significance is .05 or less.
The positive and negative intercorrelations in Tables
11 and 12 are interpreted in relation to the particular scoring system used for any given variable. For example, under
variable 1 (Verbal Scale IQ) in Table 12, variable 33, Reading-
Father (Familial History of Language Disability) is negative
ly correlated with variable 1. The scoring of variable 33
is, 0 = presence of familial history and 1 - absence of
familial history. The interpretation of the correlation be
tween variables 1 and 33 is that a high score on the Verbal
Scale is correlated with a familial history of reading disa
bility for the father. The converse is that a low score on

132
the Verbal Scale is correlated with the absence of a familial history of reading disability in the father. A minus
sign precedes negatively correlated variables. The vari
ables without the minus sign are positively correlated.
Factor Analysis of Significant Variables
After identifying the 43 significant variables, these
variables were factor analyzed. The primary reason for in
cluding a factor analysis was to identify the highest load
ing within each factor in order that these highest loadings could be used in the hierarchical grouping analysis program.
Table 13 lists important loadings from the principal axis factor analysis with varimax rotation. The manner of deter
mining the important loading for the 14 factors was as
follows: The highest loading for each variable among the 14
factors was determined by inspection and recorded under that
factor. This was done for all 43 variables. This resulted
in each variable being assigned to only one of the 14 fac
tors. Any given factor may contain more than one important
loading; however, the variables assigned to a given factor were not assigned to any other factor.
Table 14 shows the highest loadings for each of the 14
factors. (These variables were used in the hierarchical
grouping analysis.) These variables are organized in Table

133
15 according to areas of measurement. Although the variables
are considered as separate factors. Table 15 does indicate
the relative contribution of the areas of measurement to the
14 factors. This classification is somewhat arbitrary; e.g.,
variable 2, Digit Span, is a subtest on the WISC but it is
included under the auditory area of measurement because of
its high correlation with several auditory measures on the
Seashore test. (See Table 12, variable 2).
Table 16 presents descriptive names for the 14 factors.
The names of the factors were derived primarily from the vari
able with the highest loading within each factor and were as follows: (a) familial history of language disability-father:
(b) soelling deficiency, (c) finger agnosia; (d) finger-hand
dyspraxia (e) auditory memory deficit; (f) incomplete peri
pheral dominance, (g) visual perception of pictorial details,
(h) reproduction of alphabet deficiency; (i) oral reading deficiency; (j) poor visuomotor coordination and planning; (k)
letter recognition deficit; (1) familial history of reading
disability-mother, (m) auditory discrimination deficit; and
(n) verbal mediation deficiency.
Hierarchical Grouping Analysis of the Experimental Group
The hierarchical grouping analysis procedure compared

134
the children in the experimental group on 14 variables as
listed in Table 14. These are the variables with the high
est loadings selected from the 14 factors as presented in
Table 13. The results of the hierarchical grouping analysis
is shown in Table 17. As indicated in Chapter III, this pro
cedure identifies subjects according to group patterns, in
this case, the variables with the highest loadings from the
factor analysis. As seen m Table 17, Group A contains eight
children. Group B contains 17 children, and Group C contains
seven children. One may say that the children within each group form a mutual pattern on the 14 variables and that the
patterns among the three groups are different one from another
Analysis of Variance of the Important Loadings from the Factor Analysis Used in the
Hierarchical Grouping Analysis
In order to reveal the different pattern structures of
the three groups resulting from the hierarchical grouping
analysis, it was necessary to compute an analysis of variance
for the three groups and the 14 variables. This analysis is
presented in Table 18 and contains the following informa
tion: F ratios; means for the three groups; mean scores trans
formed into standard scores; and probability level. The
means transformed into standard scores are presented in this

135
table since it was impractical to construct a profile of the
original means as their values range from .00 to 113.71. The significant £ ratios in Table 18 are Verbal Scale IQ (variable 1), Letter Recognition Test (variable 5), Alpha
bet-Total (variable 6), Foot Dominance (variable 10), Benton’s Finger Localization Test (variable 11), Approximation
and Abduction (variable 12), and Reading-Mother (variable
14).
Figure 1, page 202, is the profile of the scores for the
three groups derived from the analysis of variance in Table 18. A low standard score indicates a low score for any given
variable, poor performance, or the presence of a disability.
A high standard score indicates a good performance. (It is
to be noted that a low score on Foot Dominance, variable 10, indicates left footedness.) In order to maintain this schema it was necessary to present the converse of the standard
scores for variable 5, Letter Recognition, and variable 12, Approximation and Abduction of Fingers. The following com
putations were made to present these converse scores:
63 (the highest standard score) minus the original standard score plus 36 (the lowest standard score).
The converse standard scores for groups A, B, and C for
variable 5 are 56.0, 44.0, and 53.1 respectively. The
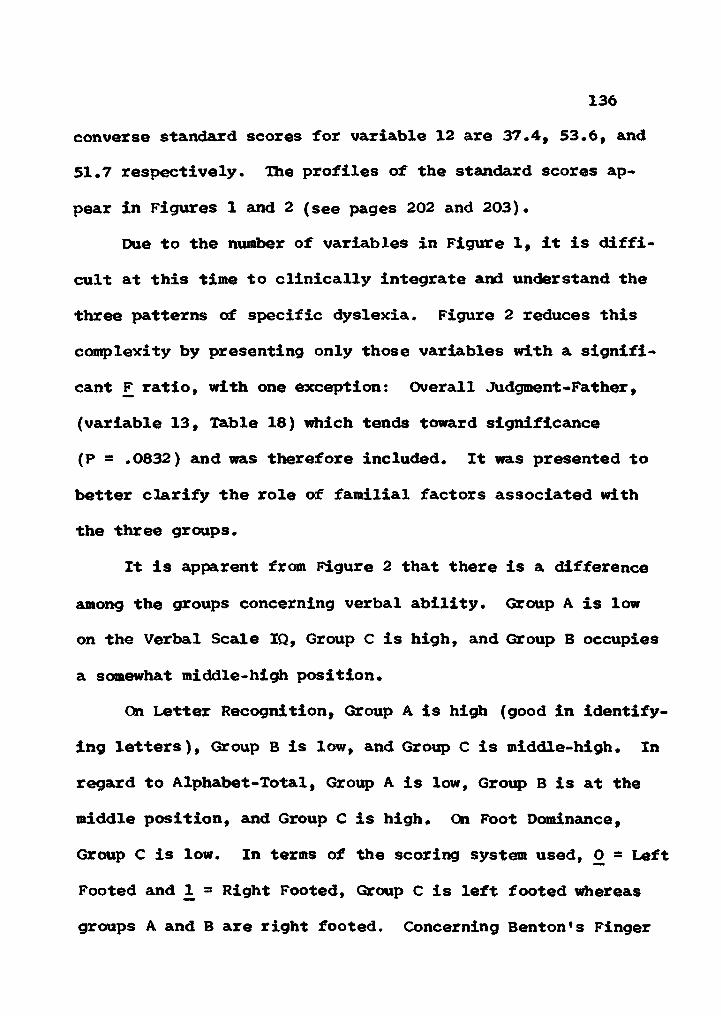
136converse standard scores for variable 12 are 37.4, 53.6, and 51.7 respectively. The profiles of the standard scores ap
pear in Figures 1 and 2 (see pages 202 and 203).
Due to the number of variables in Figure 1, it is diffi
cult at this time to clinically integrate and understand the
three patterns of specific dyslexia. Figure 2 reduces this
complexity by presenting only those variables with a signifi
cant F ratio, with one exception: Overall Judgment-Father,
(variable 13, Table 18) which tends toward significance (P = .0832) and was therefore included. It was presented to
better clarify the role of familial factors associated with
the three groups.
It is apparent from Figure 2 that there is a difference
among the groups concerning verbal ability. Group A is low
on the Verbal Scale IQ, Group C is high, and Group B occupies
a somewhat middle-high position.
On Letter Recognition, Group A is high (good in identify
ing letters). Group B is low, and Group C is middle-high. In
regard to Alphabet-Total, Group A is low. Group B is at the
middle position, and Group C is high. On Foot Dominance,
Group C is low. In terms of the scoring system used, 0 = Left
Footed and jL = Right Footed, Group C is left footed whereas
groups A and B are right footed. Concerning Benton*s Finger

137
Localization Test, Group C is low. Group A is middle-low,
and Group B is high.
There appears to be a difference among the groups on
the two familial history variables. Group C is low on Over
all Judgment-Father and high on Reading-Mother. The converse is true for Groups A and B; both tend to be high on Overall
Judgment-Father and low on Reading-Mother. This suggests
that Group C is associated with fathers who have a familial
history of generalized language disability (reading and
spelling) and groups A and B are associated with mothers who
have a history of reading disability.
Group A appears to be composed of children with the
following characteristics: poor verbal abilities; good abili
ty in letter recognition and discrimination; poor ability in
reproducing the alphabet; right footedness; average ability in finger localization; no familial history of generalized language disability for the father; and familial history of
reading disability for the mother. Group B has the follow
ing characteristics: average to high average verbal abili
ties; poor ability in letter recognition and discrimination;
average ability in reproducing the alphabet; right footed
ness; good ability in finger localization; no familial history
of generalized language disability for the father: and a

138
familial history of reading disability for the mother. Group
C has the following characteristics: bright normal verbal abilities; average ability in letter recognition and dis
crimination; good ability in reproducing the alphabet; left
footedness; poor ability in finger localization; familial
history of generalized language disability indicated for the
father; and no familial history of reading disability for
the mother. These qualitative characteristics are summarized
in Table 19.

TABLE 5
Variables Significant at the .05 Level or Less D Analysis of Variance of Experimental and Contr
»rived from d1 Groups
VariableExperimen
tal Group MeanControl
Group Mean RatioProba
bility Level
1. Wide Range Achievement Test-Reading (number of words correctly pronounced) 41.0000 70.1739 109.568 .0000*
2. Wide Range Achievement Test-Spelling (number of words correctly spelled) 33.7813 56.6087 75.409 .0000
3. Iowa Silent Reading Test (number of correct answers) 31.5000 51.3478 62.016 .0000
4. Gilmore Oral Reading Test (number of words read) 179.8750 376.4348 43.842 .OOOO
* P = .00005
139

TABLE 5, continued
Experimen-Variable tai Group Mean
ControlGroup Mean F Ratio
Probability Level
5. Gilmore Oral Reading Test (ratio of substitution errors to total words read) 20.9688 5.6957 34.729 .0000
6. Gilmore Oral Reading Test- Accuracy (number of errors) 67.4687 49.9130 31.810 .OOOO
7. Gilmore Oral Reading Test- Comprehension (number of correct answers) 41.0313 59.6522 24.124 .OOOO
8. Auditory Intrasensory Integration Test (number right) 20.0313 23.5217 21.039 .0000
9. Rapid Apposition of Thumb and Fingers (neurological rating scale of 0 = no involvement to 3 = severe involvement)a .5313 .0000 20.079 .0000
a All neurological measurements scale.
in Table 5 are based on 1 his four point rating
140

TABLE 5, continued
Experimen-Variable tai Group Mean
Control Group Mean F Ratio
Probability Level
10. Mazes (WISC Scaled Score) 9.9063 12.5217 19.218 .0001
11. Rhythm (number of correct auditory judgments) 39.9688 73.2174 18.601 .0001
12. Auditory Intrasensory Integration Test (total reaction time in seconds) 83.0625 50.6957 17.999 .0001
13. Alphabet-Total (verbal and written scores combined where 0 = failed & jL - passed) .3750 .8690 17.161 .0001
14. Alphabet-written^ .4375 .9130 16.533 .0002
15. Directional Orientation- Mother (Familial History of Language Disability rating scale where 0 =
b Same scale of measurement as variable 13.
141

TABLE 5, continued
Experimen-Variable tai Group Mean
Control Group Mean F Ratio
Probability Level
disability & 1_ = no disability)0 .2500 .7391 16.261 .0002
16. Gilmore Oral Reading Test- Rate (number of words read per minute) 99.4063 112.0870 16.064 .0002
17. Handwriting (clinical judgment based on 0 = very poor to 3 - very good) .9063 2.0000 15.506 .0002
18. Approximation and Abduction of Fingers (neurological) .5938 .0435 14.634 .0003
19. Rapid Supination and Pronation of Hands (neurological) .3750 .0000 13.298 .0006
c All Familial History of Language Disability items in Ta two point rating scale.
>le 5 are based on this
142

TABLE 5, continued
Experimen-Variable tai Group Mean
Control Group Mean F Ratio
Probability Level
20. Time (auditory)d 36.5625 59.7824 12.189 .0010
21. Digit Span (WISC Scaled Score) 9.1250 11.1304 10.882 .0017
22. Spelling-Father (Familial History of Language Disability) .4688 .8696 10.772 .0018
23. Crawling (Medical History Inventory rating scale of 0 = not late to 3 = very late in crawling) .6563 .0435 9.452 .0033
24. Tonal Memory (auditory)® 43.5938 66.1304 9.210 .003725. Reading-Mother (Familial
History of Language Disability) .5625 .9130 8.984 .0041
d Same scale of measurement as variable 11.e Same scale of measurement as variable 11.
143

TABLE 5, continued
VariableExperimen
tal Group MeanControl
Group Mean F RatioProba
bility Level
26. Vocabulary (WISC Scaled Score) 10.6250 12.3914 7.819 .0072
27. Auditory Blending (number of words blended correctly) 12.5625 14.0000 7.719 .0075
28. Overall Judgment-Mother (Familial History of Language Disability) .5938 .9130 7.575 .0081
29. Dominance-Foot (0 = left foot dominance & 1^ = right foot dominance) .7500 1.0000 7.388 .0089
30. Subjects* Brothers with Specific Dyslexia (familial History of Language Disability) .4375 .7826 7.166 .0099
31. Overall Judgment-Father

TABLE 5, continued
VariableExperimen
tal Group MeanControl
Group Mean F RatioProba
bility Level
(Familial History of Language Disability) .5000 .8261 6.671 .0126
32. Picture Completion (WISC Scaled Score) 12.8125 11.1304 6.700 .0124
33. Gilmore Oral Reading Test (ratio of total errors to total words read) 58.1875 47.2174 6.524 .0136
34. Verbal Scale IQ (WISC) 108.5313 115.1304 5.854 .019035. Reading-Father (Famil
ial History of Language Disability) .5313 .8261 5.469 .0232
36. Benton’s Visual Retention Test-Delayed Recall (number right) 3.9688 4.9130 5.235 .0261
37. Alphabet-Verbal^ .6563 .9130 5.171 .0270
Same rating scale as variable 13.
145

TABLE 5, continued
VariableExperimen
tal Group MeanControl Group Mean F Ratio
Probability Level
38. Benton’s Finger Localization Test (combined score of correct responses for single & double simultaneous stimulation ) 31.1250 33.6087 4.336 .0422
39. Loudness (auditory)9 33.0000 47.3913 4.269 .0437
40. Benton’s Finger Localization Test (correct responses to double simultaneous stimulation) 13.6875 14.5652 4.235 .0445
41. Motor Coordination- Father (Familial History of Language Disability) .8438 1.0000 4.104 .0478
9 Same rating scale as variable 11.
146

147TABLE 5, continued
Experimen- ControlVariable tai Group Mean Group Mean
Proba-F Ratio bility Level
42. Neonatal Respiratory Difficulty (Medical History Inventory rating scale where 0 = no difficulty to 3 = much difficulty .0000 .1739 4.044 .0494
Note.-Variable 42 was excluded from further statistical ai only to the control group, i.e., the control group had more experimental group.
lalysis as it applies difficulty than the
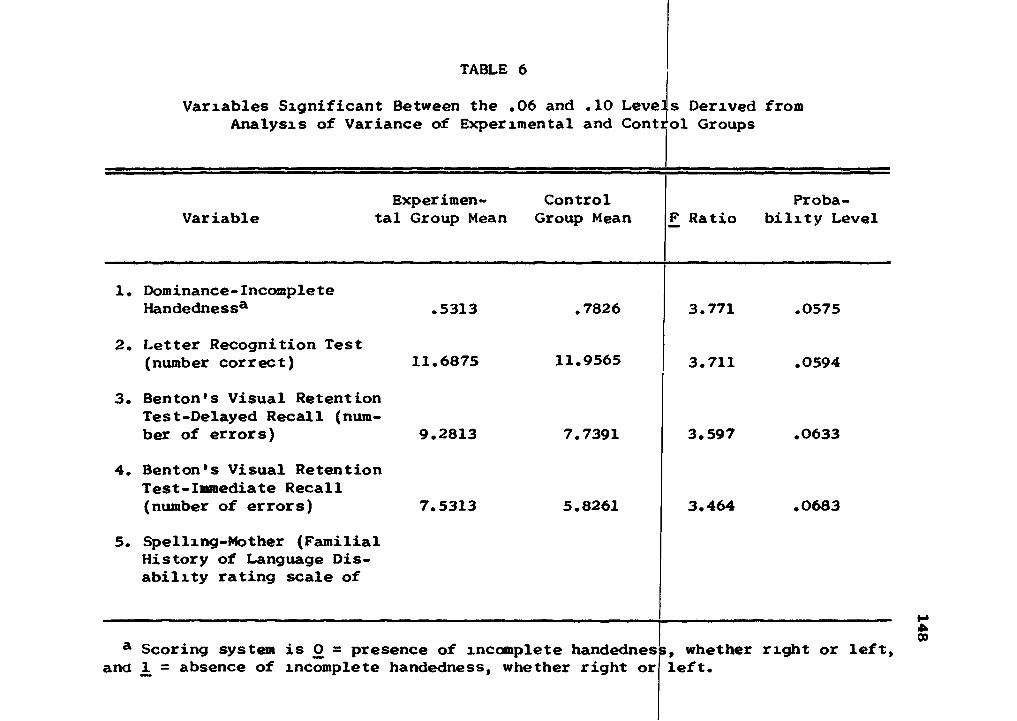
TABLE 6
Variables Significant Between the .06 and .10 Levels Derived from Analysis of Variance of Experimental and Control Groups
Experimen Control Proba-Variable tal Group Mean Group Mean F Ratio bility Level
1. Dominance-IncompleteHandedness* .5313 .7826 3.771 .0575
2. Letter Recognition Test(number correct)
3. Benton’s Visual Retention Test-Delayed Recall (num-
11.6875 11.9565 3.711 .0594
ber of errors)4. Benton’s Visual Retention
Test-Immediate Recall
9.2813 7.7391 3.597 .0633
(number of errors)
5. Spelling-Mother (Familial History of Language Disability rating scale of
7.5313 5.8261 3.464 .0683
a Scoring system is 0 = presence of incomplete handednes >, whether right or left.and JL = absence of incomplete handedness, whether right or left.
148

TABLE 6, continued
Experimen-Variable tai Group Mean
Control Group Mean F Ratio
Probability Level
0 = history of & 1^ = no history of disability) .6563 .8696 3.284 .0756
6. Benton’s Visual Retention Test-Immediate Recall (number right) 4.9063 5.8261 3.192 .0797
7. Handwriting-Father (Familial History of Language Disability J* 3 .7188 .9130 3.228 .0781
8. Extra Pyramidal System (neurological rating scale of 0 = no involvement to 3 = severe involvement)6 .1250 .0000 3.166 .0809
9. Caesarean Section (Medical History Inventory rating
b Same rating scale as variablec All neurological measurements
scale.
5.in Table 6 are based on this four point rating
6M

150TABLE 6, continued
ExperimentVariable tai Group Mean
Control Group Mean F Ratio
Probability Level
scale of 0 = Section not done to 3 = emergency Section done) .3750 .0000 3.166 .0809
10. Dominance-Left Sided (rating scale where 1 = yes left side of body is dominant & 0 = no) .1250 .0000 3.1666 .0809
11. Primary Mental Abilities- Perceptual Speed (correct responses) 12.8750 15.3913 3.070 .0856
12. Dominance-IncompleteFootednessd .5625 .7826 2.915 .0936
13. Alternating Flexion and Extension of Fingers (neurological) .1563 .0000 2.784 .1011
d Same scoring system as variable 1.
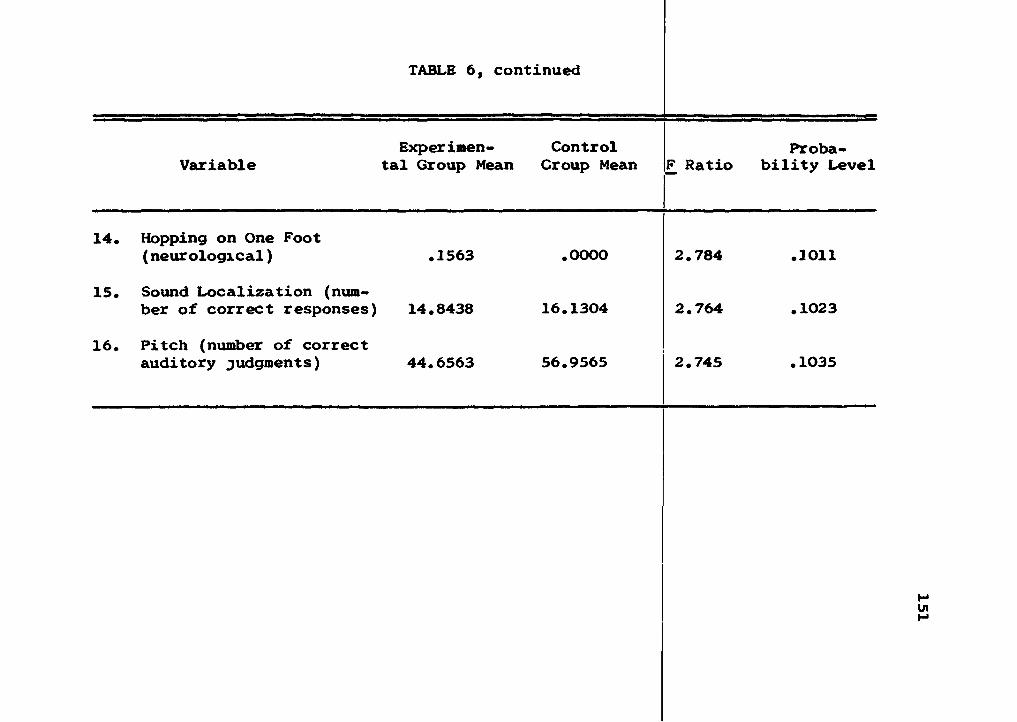
TABLE 6, continued
VariableExperimen
tal Group MeanControl
Group Mean F RatioProba
bility Level
14. Hopping on One Foot (neurological) .1563 .0000 2.784 .1011
15. Sound Localization (number of correct responses) 14.8438 16.1304 2.764 .1023
16. Pitch (number of correct auditory judgments) 44.6563 56.9565 2.745 .1035

152
TABLE 7
Significant Variables (.05 Level or Less)
Measurement Area Variable
Language Reading 1. Wide Range Achievement Test-Reading (1)
2e lowfli ksslqxrq Test ^313. Gilmore Oral Reading Test (number of
words read) (4)4. Gilmore Oral Reading Test (ratio of
substitution errors to total words read) (5)
5. Gilmore Oral Reading Test-Accuracy (6)6. Gilmore Ora? Reading Test-Comprehen
sion (7)7. Gilmore Oral Reading Test-Rate (16)8. Gilmore Oral Reading Test (ratio of
total errors to total words read) (33)
Handwriting 1. Handwriting (17)
Spelling 1. Wide Range Achievement Test-Spelling (2)
Alphabet 1. Alphabet-Total (verbal and written scores combined) (13)
2. Alphabet-Written (14)3. Alphabet-Verbal (37)
Intellectual (wise) 1. Mazes (10)
2. Digit Span (21)3. Vocabulary (26)4. Picture Completion (32) ,5. Verbal Scale IQ (34)
Note.-Numbers in brackets refer to the variable numbers listed in Table 5.

153
TABLE 7, continued
Measurement Area Variable
Visual Memory 1. Benton's Visual Retention Test-Delayed Recall (number right) (36)
Auditory 1. Auditory Intrasensory Integration Test—(number—right) (-8-)-------------------------------
2.3.
Rhythm (11)Auditory Intrasensory Integration Test (total reaction time in seconds) (12)
4.5.6.7.
Time (20)Tonal Memory (24)Auditory Blending (27)Loudness (39)
Dominance 1. Dominance-Foot (left foot is dominant) (29)
Neuropsychological 1. Benton's Finger Localization Test (com
bined score of correct responses for single and double simultaneous stimulation) (38)
2. Benton's Finger Localization Test (double simultaneous stimulation) (40)
Neurological 1.2.
Apposition of Thumb and Fingers (9) Approximation and Abduction of Fingers (18)
3. Supination and Pronation of Hands (19)
Medical History 1. Crawling (23)Familial History of Language Disability 1.
2.Directional Orientation-Mother (15) Spelling-Father (22)

154
TABI^E 7, continued
.6..__ Overall Judgment-Father (31)
Measurement Area Variable
3.4.5.
Reading-Mother (25)Overall Judgment-Mother (28)Subjects* Brothers with Specific Dyslexia (30)
7.8.
Reading-Father (35) ---------Motor Coordination-Father (41)

155
TABLE 8
Variables Tending Toward Significance (.06 to .10 Level)
Measurement Area Variable
Visual PerceptionM einor y It—Le 11 er—R ec ogn rt ion—Te s t- -(-number
2.
3.
4.
correct) (2)Benton’s Visual Retention Test- Delayed Recall (number of errors)(3)Benton’s Visual Retention Test-Immediate Recall (number of errors)(4)Benton’s Visual Retention Test-Immediate Recall (number right) (6)
Perceptual Speed 1. Primary Mental Abilities (perceptual speed) (11)
Auditory 1.2.
Sound Localization (15) Pitch (16)
Dominance 1.2.3.
Dominance-Incomplete Handedness (1) Dominance-Left Sided (10) Dominance-Incomplete Rootedness (12)
Neurological 1.2.
3.
Extra Pyramidal System (8) Alternating Flexion and Extension of Fingers (13)Hopping on One Foot (14)
Note.-Numbers m brackets refer to the variable numbers xn Table 6.

156
TABLE 8, continued
Measurement Area Variable
Medical History 1. Caesarean Section (9)
Familial History of Language Dis-SbiTity-------------- 1-—Spe-Hing^Mot-her—(-5-)----
2. Handwriting-Father (7)
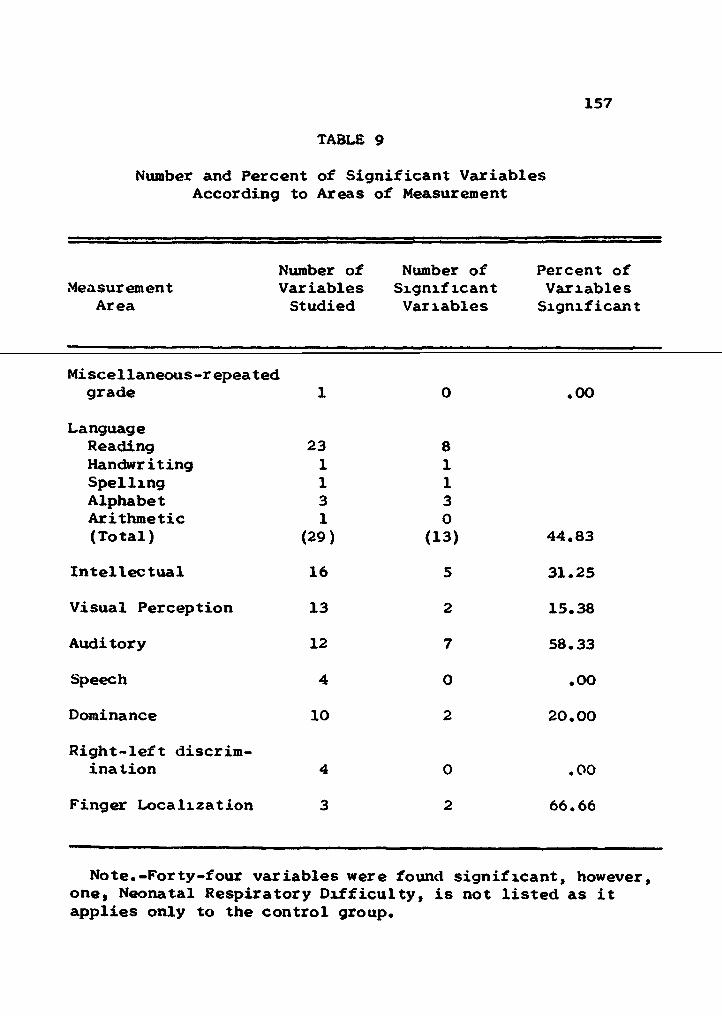
157
TABLE 9
Number and Percent of Significant Variables According to Areas of Measurement
Number of Number of Percent ofMeasurement Variables Significant Variables
Area Studied Variables Significant
Miscellaneous-repeatedgrade 1 0 .00
LanguageReading 23 8Handwriting 1 1Spelling 1 1Alphabet 3 3Arithmetic 1 0(Total) (29) (13) 44.83
Intellectual 16 5 31.25Visual Perception 13 2 15.38Auditory 12 7 58.33Speech 4 0 .00
Dominance 10 2 20.00Right-left discrim
ination 4 0 .00
Finger Localization 3 2 66.66
Note.-Forty-four variables were found significant, however, one, Neonatal Respiratory Difficulty, is not listed as it applies only to the control group.

158TABLE 9» continued
MeasurementArea
Number of Variables Studied
Number of Significant Variables
Percent of Variables Significant
Neurological Examination 41 3 7.32
EEG 18 0 .00
Medical history 27 1 3.70Familial history of language disability 18 8 44.44
Age 1 0 .00Grand Total 197 43 22.17
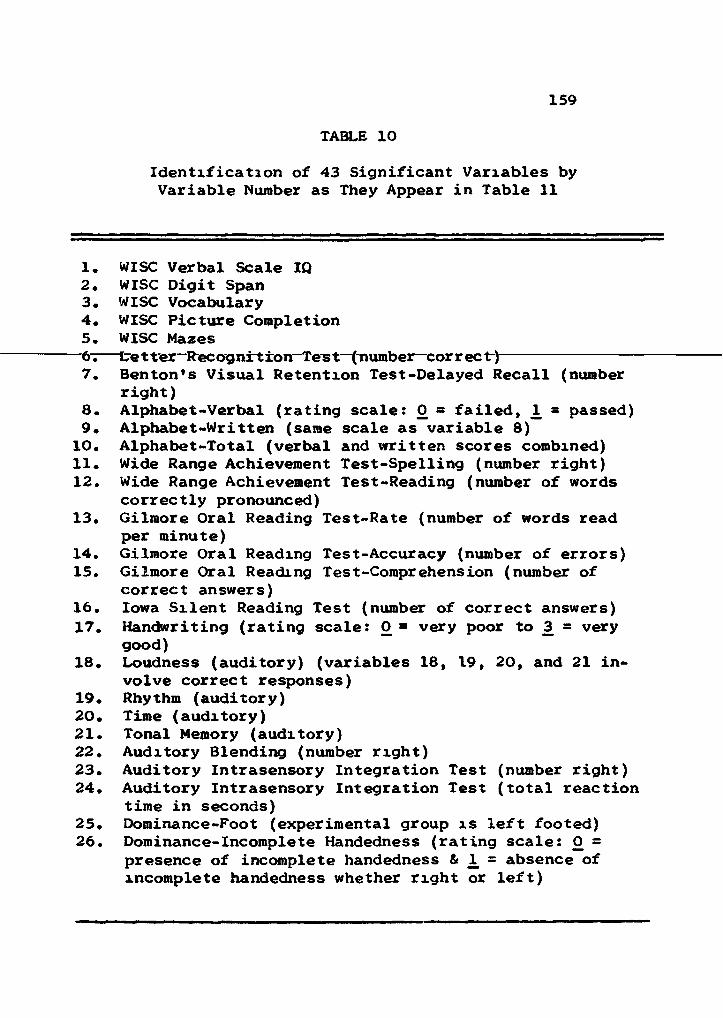
159
TABLE 10
Identification of 43 Significant Variables byVariable Number as They Appear in Table 11
1. WISC Verbal Scale IQ2. WISC Digit Span3. WISC Vocabulary4. WISC Picture Completion5. WISC Mazes—6^—te t ter-Rec og nrt ion-Tes t—(number—cor r ec t-)----------------7. Benton's Visual Retention Test-Delayed Recall (number
right)8. Alphabet-Verbal (rating scale: 0 = failed, 1^ = passed)9. Alphabet-Written (same scale as variable 8)
10. Alphabet-Total (verbal and written scores combined)11. Wide Range Achievement Test-Spelling (number right)12. Wide Range Achievement Test-Reading (number of words
correctly pronounced)13. Gilmore Oral Reading Test-Rate (number of words read
per minute)14. Gilmore Oral Reading Test-Accuracy (number of errors)15. Gilmore Oral Reading Test-Comprehension (number of
correct answers)16. Iowa Silent Reading Test (number of correct answers)17. Handwriting (rating scale: 0 = very poor to 3 = very
good)18. Loudness (auditory) (variables 18, 19, 20, and 21 in
volve correct responses)19. Rhythm (auditory)20. Time (auditory)21. Tonal Memory (auditory)22. Auditory Blending (number right)23. Auditory Intrasensory Integration Test (number right)24. Auditory Intrasensory Integration Test (total reaction
time in seconds)25. Dominance-Foot (experimental group is left footed)26. Dominance-Incomplete Handedness (rating scale: 0 =
presence of incomplete handedness & 1. = absence of incomplete handedness whether right or left)

160
TABLE 10, continued
27. Bentons Finger Localization Test (correct responses to double simultaneous stimulation)*
28. Benton's Finger Localization Test (combined score of correct responses for single & double simultaneous stimulation)
29. Approximation and Abduction (neurological) (rating scale: 0 » poor performance to 3 = good performance)
30. Apposition of Thumb (neurological) (rating scale: () =----- poor—per f ormance—to-3^=—good" per for mance~)-----------------31. Supination and Pronation of Hands (neurological) (rating
scale: 0 = poor performance 'co 3 = good performance)32. Crawling (Medical History Inventory) (rating scale: 0
= poor performance to _3 = good performance)33. Reading-Father (Familial History of Language Disability)
(rating scale: 0 = presence of familial history, 1, - absence of familial history)
34. Reading-Mother (Familial History of Language Disability) (rating scale: 0 = presence of familial history, 1 = absence of familial history)
35. Spelling-Father (Familial History of Language Disability) (rating scale: 0 = presence of familial history, 1, = absence of familial history)
36. Directional Orientation-Mother (Familial History of Language Disability) (rating scale: 0 = presence of familial history, JL = absence of familial history)
37. Motor Coordination-Father (Familial History of Language Disability) (rating scale: 0 = presence of familial history, 1^ = absence of familial history)
38. Overall Judgment-Father (Familial History of Language Disability) (rating scale: 0 = presence of familial history, 1^ = absence of familial history)
39. Overall Judgment-Mother (Familial History of Language Disability) (rating scale: 0 = presence of familial history, 1^ = absence of familial history)
40. Subjects' Brothers with Specific Dyslexia (Familial History of Language Disability) (rating scale: 0 = presence of familial history, 1, = absence of familial history)

161
TABLE 10, continued
41. Gilmore Oral Reading Test (ratio of errors to total words read)
substitution
42. Gilmore Oral Reading Test (number of words read)43. Gilmore Oral Reading
total words read)Test (ratio of total errors to

TABLE 11
Intercorrelation of Significant Variables Derived from Analysis of Variance (See Table 10 for identification of variables by numbers)
1 2 3 4 5 6 7 8 9
1.2. .02513. .8335** -.16304. .1509 -.0015 .14775. -.0802 -.0856 .0386 -.22706. .1242 -.0177 -.1420 -.1605 -.08607. .0533 .0314 -.1109 .0765 .0985 .05588. .2086 .2954 .1932 .0800 .0379 -.0454 .24999. .1227 .0377 .2219 -.0358 .1239 .0372 .0608 .3730*
10. .2225 .1700 .2894 -.0200 .0048 -.0254 .0163 .5606** .8783*11. -.0478 .2459 -.1499 .0030 .2104 -.0013 .2421 .2622 .325412. .3690* .1783 .2728 -.0858 .3467* .1534 .1222 .2405 .196113. .0943 .1858 .0811 -.0561 .3407 .2037 .0461 .1241 -.209014. -.2563 -.0905 -.2170 -.0189 .1421 .0139 .2280 -.1437 -.019515. -.0582 .0945 .0183 -.0083 -.0802 .1002 .1702 .0025 .178816. -.0426 .0858 -.0626 .2925 .2389 -.0411 .2526 .0240 -.1657
*- P <.05** P <.01
162

TABLE 11, continued
1 2 3 4 5 6 7 8 9
17. -.1894 .0341 -.2194 -.0691 .2088 -.1389 .3003 .1875 .260818. -.1666 -.0339 -.1129 -.0685 .1745 -.1453 .0224 -.0366 -.115819. -.1714 .3722* -.3264 -.1254 .0399 .0104 .1409 -.3904* -.306420. -.0671 .5854** -.1654 -.2083 .1010 -.2448 .1027 .0640 -.274721. .1876 .4118* -.0574 -.0674 -.0689 .0508 .3121 -.0034 .024022. .2605 -.0281 .3052 -.1236 -.2978 -.0299 .1814 .4706** .254023. .0305 .0040 -.0670 -.2570 .1574 ,1534 .0952 .0267 .296024. .0846 -.0505 -.0009 .3491* -.0323 .1504 .0617 -.1599 -.119425. .0449 .0000 .0308 -.2538 -.0321 .1707 .3271 -.1140 -.218226. -.1249 .1462 -.1504 .0826 .1337 .0309 .2326 -.1524 -.181527. .1046 .1729 -.2166 -.0347 -.2351 .3701* .2262 -.2074 -.164128. .0992 .2136 -.2054 -.1054 -.1236 .2353 .2128 -.0388 -.109729. -.2523 -.1914 -.1197 -.1666 .1072 -.0047 -.0771 -.1476 -.318730. -.2566 -.0838 -.0867 -.1578 -.0800 -.3255 -.3560* -.0184 -.275131. .0619 .0155 .1516 -.3139 -.1102 .0763 -.2438 .0170 -.4229*32. -.0579 -.3023 .1284 .2375 -.2421 -.0768 -.0533 -.0557 -.4226*33. -.3930 -.0037 -.3376 -.2802 .0593 .1296 -.1038 -.0206 -.181534. .4731** .0226 .3968* .1922 .1380 -.2359 .2776 .2901 .269835. -.4612** .1537 -.4379* -.2381 .0151 .0679 .1038 -.1112 -.071036. .1850 -.0346 .2157 .0149 .2036 -.0569 .1090 -.0380 .218237. .0485 -.0155 .2619 -.0690 .2316 -.2120 .0488 .4134* .2060 163

TABLE 11, continued
1 2 3 4 5 6 7 8 9
38. -.3329 .0000 -.3469* -.2328 .0557 . 1971 .0210 -.0548 -.126039. .3288 .0800 .3838* .1201 .2563 -.3072 .1963 .3391 .344740. .2670 .0679 .2757 .0945 -.1380 .0372 .0661 .3730* .238141. .1496 -.1372 .3175 .2971 .1547 -.3120 .1129 .2175 -.055842. .1437 .3249 .1048 -.0990 .0455 .1004 .2753 .2106 .032243. .5898** .1439 .4339* .1730 -.1713 .1137 .1183 .2921 -.1611

TABLE 11, continued
10 11 12 13 14 15 16 17 18
1.2.3.4.5.6.7.8.9.
10.11. .4284*12. .3059 .5766**13. -.1086 .3409 .5849*14. -.1301 .1758 .1665 .3813*15. .1980 .2371 .0169 .1120 .4832**16. -.0202 .4210* .3254 .3296 .1782 .244717. .1937 .4154* .0244 .0656 .4619** .3201 .295518. -.1186 .0659 -.2335 -.0685 .0931 .3785* .0832 -.091019. -.4449* -.1156 -.1017 -.1144 -.0982 -.0024 .0383 -.1122 .070120. -.2595 .0366 .1023 .2036 .2447 .0398 .1751 .1029 .230221. .0710 .2887 .1240 .0587 -.0946 .1514 .2708 -.1039 .237122. .4065* -.0694 .1346 -.0358 -.2036 -.1971 -.2231 -.0041 -.5831** 165

TABLE 11, continued
10 11 12 13 14 15 16 17 18
23. .2461 .6013** .4969 .2061 .2526 .1456 3319 .4538** -.157724. -.2229 -.3169 -.2368 -.2255 -.0017 -.0071 .0542 -.2222 -.014025. -.2981 -.3395 -.2247 .1034 .0349 .0501 0226 .0173 -.172726. -.3072 -.0810 -.1696 .2367 .1342 -.0385 .1273 .1559 -.222127. -.1803 .1194 .0153 .0654 -.0582 -.1286 ,1918 .0006 -.108928. -.1233 .1438 .0571 .1777 -.0576 -.1600 .1801 .1374 -.097629. -.3081 -.0256 -.0388 .3717 .2146 -.2257 .0672 -.0100 -.010230. -.1590 -.1348 -.1061 .1147 .0117 -.3142 13297 -.1831 .179531. -.3333 -.4082* -.1223 .2642 .0364 -.1389 .3027 -.1782 -.162832. -.3412 -.3608* -.3486* -.1017 -.1979 -.0928 .0371 -.2613 -.042033. -.1779 -.0199 -.0593 .3369 .1342 .1145 .1077 -.0244 .216834. .2928 .0258 .3411 -.0373 .0601 -.0949 .0263 .1021 -.242335. -.0808 .0723 -.0678 .1889 -.0534 .1428 .1664 -.1559 .254336. .0000 -.2640 -.1563 -.1130 .0737 -.0661 .3911* .1905 -.240637. .3333 .2628 .2913 .4093* .0307 .1926 ,1659 .1265 .147138. -.1291 .0131 -.0592 .2791 .0605 .1145 .0586 -.0900 .269839. .2464 .0014 .3532* .0884 .1766 -.0607 10365 .1699 -.250240. .2277 -.0346 -.0426 -.1223 -.0195 .0879 .0919 .1399 .032341. .0082 -.3845* -.1973 -. 1978 -.4900** -.2989 .0832 -.0698 -.052342. .2231 .2926 .3488* .4049* .4666** .4717* .2147 .2094 .016043. .0972 -.0103 .1271 -.0846 -.6625** -.2295 .0699 -.3087 -.1799
166

TABLE 11, continued
19 20 21 22 23 24 25 26 27
1.2.3.4.5.6.7.8.9.10.11.12.13.14.15.16.17.18.19.20.21.22.
.4646**
.3513*-.4109*
.4764**-.2569 -.1911

TABLE 11, continued
19 20 21 22 23 24 25 26 27
23. -.0376 -.0232 -.0476 .047724. .0007 -.0401 .0709 -.2314 -.3778*25. .0909 .1560 .1279 .3030 -.0817 -.074126. .1974 .2115 .0377 -.1263 -.2180 .2723 4700**27. .2020 .1385 .4392* -.2059 .0493 .1592 1853 .308528. .1371 .1444 .3323 -.1280 .0930 -.0553 2271 .3360 .9020**29. -.0701 .0167 -.1127 .0488 -.0374 -.3409 .0827 -.0090 -.202730. -.1037 .1068 -.1557 -.0387 -.2626 -.3243 .3556* -.3401 -.231431. .0785 .0955 -.2532 .2353 -.2022 -.2842 ,2981 .0808 -.180332. -.1442 -.1875 -.2890 .1226 -.3955** .1969 ,2543 .2610 .016033. -.0267 -.0646 -.2567 -.0709 .1601 -.2418 ,1808 -.0039 .138334. -.1505 .0578 .0658 .2749 -.0297 .3278 ,2182 .0552 -.159335. .2290 .0541 .0894 -.0951 .0857 -.0114 ,1085 .1294 .031936. .0189 -.1439 -.2769 .0797 -.1144 .2996 1667 .2531 -.032737. -.3711* -.0513 .0428 .1070 .1600 -.4368* -,,0497 -.2318 -.274538. .0049 -.1915 -.1970 -.0829 .1604 -.2106 ,1443 -.0626 .132139. -.0290 .2386 .0311 .1494 .0847 .2082 J 837 .1156 -.154940. -.2326 -.0050 .0128 .0870 .0487 .2067 .2182 -.1815 .140341. -.0740 -.1632 -.2701 .1377 -.4024* .0200 ,0217 .0147 -.343342. -.1383 .1247 .1619 .0773 .3037 -.0952 0878 -.1003 .026843. .0005 -.1543 .1898 .2812 -.2150 .1971 ,0215 -.0920 .1730

TABLE 11, continued
28 29 30 31 32 33 34 35 36
1.2.3.4.5.6.7.8.9.
10.11.12.13.14.15.16.17.18.19.20.21.22. 169

TABLE 11, continued
28 29 30 31 32 33 34 35 36
23.24.25.26.27.28.29. -.197130. -.1777 .6761**31. -.1088 .5792 .4192** *32. -.0048 .0792 -.0095 .218733. .3220 .0867 .1087 .2102 .125234. -.1310 -.2586 -.1763 -.2277 -.1921 -.5759**35. .0721 .0090 .0035 -.0808 -.0573 .6315 -*36. .0324 -.3031 -.2909 .0000 -.1761 -.036237. -.1040 .1273 .2554 -.0222 -.1604 .113238. .2950 .0477 .0560 .1291 -.0339 .9393 •**39. -.0769 -.2217 -.1247 -.1479 -.2393 -.3945*40. .1734 -.3187 -.1622 -.0325 .1238 -.055241. -.2819 -.0018 .1014 .1459 .1528 -.229142. .0263 .0820 -.0679 .2181 -.1793 .149343. .0629 -.2071 -.1341 .0844 .2132 -.3117
.3077
.2182 -.1085
.0325 ,0593## -.1491.5040** .6888 .0000
.8097 -.2431 .3306
.2698 -.3235 .0727
.1551 -.1715 .0753
.0624 .0111 -.0673
.1861 -.2106 -.0024
170

TABLE 11, continued
37 38 39 40 41 42 43
34.35.36.37.38. .086139. .1698 -.4454*40. .0325 -.1260 .344741. .1823 -.2057 .1333 .0201 .000042. .3261 .1667 .0451 .1301 .0000 -.334043. -.0174 -.2400 -.0487 .1225 .0000 .3763* .0413

172
TABLE 12Significant Intercorrelations of Variables* a
Note.-Minus sign before variable number indicates negative correlation.
a Level of significance is .05 or less.
Correlated Variable Variable
1. Verbal Scale IQ (WISC)
3. Vocabulary (WISC)12. Wide Range Achievement Test-Reading
-33. Reading-Father (Familial History of Language Disability)
34. Reading-Mother (Familial History of Language Disability)
-35. Spelling-Father (Familial History of Language Disability)
43. Gilmore Oral Reading Test (ratio of total errors to total words read)
2. Digit Span (WISC)
19. Rhythm (auditory)20. Time (auditory)21. Tonal Memory (auditory)

173
TABLE 12, continued
Correlated Variable Variable
3. Vocabulary (WISC)
1. Verbal Scale IQ (WISC)34"^ Reading-Mot Her (Fami"ri"a"l—History of~Language
Disability)-35. Spelling-Father (Familial History of Language
Disability)-38. Overall Judgment-Father (Familial History of
Language Disability)39. Overall Judgment-Mother (Familial History of
Language Disability)43. Gilmore Oral Reading Test (ratio of total errors
to total words read)
4, Picture Completion (WISC)
24. Auditory Intrasensory Integration Test (total reaction time)
5. Mazes (WISC)
12. Wide Range Achievement Test-Reading
6, Letter Recognition Test (number correct)
27. Benton's Finger Localization Test (correct responses to double simultaneous stimulation)

174
TABLE 12, continued
Correlated Variable Variable
7. Benton's Visual Retention Test-Delayed Recall (number right)
-30^----- Appos-i-t-i-on—of—Thumb—(-neur-o-l-og-i-ca-1-)----------
8. Alphabet-Verbal
9. Alphabet-Written10. Alphabet-Total (verbal and written scores
combined)-19. Rhythm (auditory)22. Auditory Blending37. Motor Coordination-Father (Familial History of
Language Disability)40. Subjects* Brothers with Specific Dyslexia
9. Alphabet-Written
8. Alphabet-Verbal10. Alphabet-Totai (verbal and written scores
combined)-31. Supination and Pronation of Hands (neurological)-32. Crawling (Medical History Inventory)
(Familial History of Language Disability)

175
TABLE 12, continued
Correlated Variable Variable
10« Alphabet-Total (verbal and written scores combined)
—Si-----ATphabet^VerbaT------------------------------9. Alphabet-Written11. Wide Range Achievement Test-Spelling
-19. Rhythm (auditory)22. Auditory Blending
11. Wide Range Achievement Test-Spelling
10. Alphabet-Total (verbal and written scores combined)12. Wide Range Achievement Test-Reading16. Iowa Silent Reading Test17. Handwriting23. Auditory Intrasensory Integration Test (number
right)-31. Supination and Pronation of Hands (neurological)-32. Crawling (Medical History Inventory)-41. Gilmore Oral Reading Test (ratio of substitution
errors to total words read)

176
TAm,E 12, continued
Correlated Variable Variable
12, Wide Range Achievement Test-Reading
1. Verbal Scale IQ (WISC)—5?-----Mazes-(WISG-)------------------------------ ---------11. Wide Range Achievement Test-Spelling13. Gilmore Oral Reading Test-Rate (number of words
read per minute)23. Auditory Intrasensory Integration Test (number
right)-32. Crawling (Medical History Inventory)39. Overall Judgment-Mother (Familial History of
Language Disability)42. Gilmore Oral Reading Test (number of words read)
13, Gilmore Oral Reading Test-Rate (number of words read per minute)
12. Wide Range Achievement Test-Reading14. Gilmore Oral Reading Test-Accuracy (number of
errors)29. Approximation and Abduction (neurological)37. Motor Coordination-Father (Familial History of
Language Disability)42. Gilmore Oral Reading Test (number of words
read)

m
TABLE 12, continued
Correlated Variable Variable
14. Gilmore Oral Reading Test-Accuracy (number of errors)
—13..---- Gilmor.e_Oral_Reading_TeS-t-.Ra.t.e_(.numb.er_0!f_wo.rd.s_read per minute)
15. Gilmore Oral Reading Test-Comprehension (numberof correct answers)
17. Handwriting-41. Gilmore Oral Reading Test (ratio of substitution
errors to total words read)42. Gilmore Oral Reading Test (number of words read)
-43. Gilmore Oral Reading Test (ratio of total errorsto total words read)
15, Gilmore Oral Reading Test-Comprehension
14. Gilmore Oral Reading Test-Accuracy (number oferrors)
18. Loudness (auditory)42. Gilmore Oral Reading Test (number of words read)
16, Iowa Silent Reading Test
11. Wide Range Achievement Test-Spelling-36. Directional Orientation-Mother (Familial History
of Language Disability)

178
TABLE 12, continued
Correlated Variable Variable
17. Handwriting
11. Wide Range Achievement Test-SpellingT4;-----Gilmore-Oral-ReadingsTest^Accuracy—(number-of—
errors)23. Auditory Intrasensory Integration Test (number
right)
18. Loudness (auditory)
15. Gilmore Oral Reading Test-Comprehension (numberof correct answers)
-22. Auditory Blending
19. Rhythm (auditory)
2. Digit Span (WISC)-8. Alphabet-Verbal
-10. Alphabet-Total (verbal and written scores combined)20. Time (auditory)21. Tonal Memory (auditory)
-22. Auditory Blending-37. Motor Coordination-Father (Familial History of
Language Disability)

179
TABLE 12, continued
Correlated Variable Variable
20. Time (auditory)
2. Digit Span (WISC)T9"; Rhythm-(auditory)-----------------21. Tonal Memory (auditory)
21. Tonal Memory (auditory)
2. Digit Span (WISC)19. Rhythm (auditory)20. Time (auditory)27. Bentons Finger Localization Test (correct*
22. Auditory Blending
8. Alphabet-Verbal10. Alphabet-Total (verbal and written scores combined)
-18. Loudness (auditory)-19. Rhythm (auditory)
responses to double simultaneous stimulation)

180TABLE 12, continued
Correlated Variable Variable
23. Auditory Intrasensory IntegrationTest (number right)
—1-lr12.17.
-24.
-32.-41.
Wide-Range^AchievementTest^SpeTlingWide Range Achievement Test-ReadingHandwritingAuditory Intrasensory Integration Test (total reaction time)Crawling (Medical History Inventory)Gilmore Oral Reading Test (ratio of substitution errors to total words read)
24. Auditory Intrasensory Integration Test (total reaction time)
4. Picture Completion (WISC)-23. Auditory Intrasensory Integration Test (number
right)-37. Motor Coordination-Father (Familial History of
Language Disability)
25o Dominance-Foot (Experimental group is left footed)
26. Dominance-Incomplete Handedness-30. Apposition of Thumb (neurological)

181
TABLE 12, continued
Correlated Variable Variable
26. Dominance-Incomplete Handedness
25, Dominance-Foot (Experimental group is left footed-)--------------------------------------
27, Benton^ Finger Localization Test (correct responses to double simultaneous stimulation)
6. Letter Recognition Test (number correct)21. Tonal Memory (auditory)28. Benton's Finger Localization Test (combined score
of correct responses for single & double simultaneous stimulation)
28, Benton's Finger Localization Test (combined score of correct responses for single &
double simultaneous stimulation)27, Benton's Finger Localization Test (correct
responses to double simultaneous stimulation)
29. Approximation and Abduction (neurological)13, Gilmore Oral Reading Test-Rate (number of words
read per minute)30. Apposition of Thumb (neurological)31. Supination and Pronation of Hands (neurological)

182
TABLE 12, continued
Correlated Variable Variable
30. Apposition of Thumb (neurological)
-7._____Ben.ton_Ls_V.isual—Ret ent ion—Test -Delayed—Recall------------(number right)
-25. Dominance-Foot (experimental group is left footed)29. Approximation and Abduction (neurological)31. Supination and Pronation of Hands (neurological)
31. Supination and Pronation of Hands (neurological)
-9. Alphabet-Written-11. Wide Range Achievement Test-Spelling29. Approximation and Abduction (neurological)30. Apposition of Thumb (neurological)
32. Crawling (Medical History Inventory)
-9. Alphabet-Written-11. Wide Range Achievement Test-Spelling-12. Wide Range Achievement Test-Reading-23. Auditory Intrasensory Integration Test (number
right)

183
TABLE 12, continued
Correlated Variable Variable
33. Reading-Father (Familial History of Language Disability)
_^1._____V_er.bal_Scale_IQ_(_WlSC-)-34. Reading-Mother (Familial History of Language
Disability)35. Spelling-Father (Familial History of Language
Disability)38. Overall Judgment-Father (Familial History of
Language Disability)-39. Overall Judgment-Mother (Familial History of
Language Disability)
34. Reading-Mother (Familial History of Language Disability)
1. Verbal Scale IQ (WISC)3. Vocabulary (WISC)
-33. Read!ng-Father (Familial History of Language Disability)
-38. Overall Judgment-Father (Familial History of Language Disability)
39. Overall Judgment-Mother (Familial History of Language Disability)

184TABLE 12, continued
Correlated Variable Variable
35* Spelling-Father (Familial History of Language Disability)
—.1.-----Verbal—Scale-IQ-(W-I-SC-)--------------------------3. Vocabulary (WISC)33. Reading-Father (Familial History of Language
Disability)38. Overall Judgment-Father (Familial History of
Language Disability)
36, Directional Orientation-Mother (Familial History of Language Disability)
-16. Iowa Silent Reading Test
37. Motor Coordination-Father (Familial History of Language Disability)
8.13.
Alphabet-VerbalGilmore Oral Reading Test-Rate (number of words read per minute)
-19.-24.
Rhythm (auditory)Auditory Intrasensory Integration Test (total reaction time)

185
TABLE 12, continued
Correlated Variable Variable
38. Overall Judgment-Father (Familial History of Language Disability)
—--3-i-- -- Vocabulary (WISC)---------------------33. Reading-Father (Familial History of Language
Disability)-34. Reading-Mother (Familial History of Language
Disability)35. Spelling-Father (Familial History of Language
Disability)-39. Overall Judgment-Mother (Familial History of
Language Disability)
39. Overall Judgment-Mother (Familial History of Language Disability)
3.12.
-33.34.
-38.
Vocabulary (WISC)Wide Range Achievement Test-ReadingReading-Father (Familial History of LanguageDisability)Reading-Mother (Familial History of LanguageDisability)Overall Judgment-Father (Familial History of Language Disability)
40. Subjects Brothers with Specific Dyslexia (Familial History of Language Disability)*
8. Alphabet-Verbal

186
TABLE 12, continued
Correlated Variable Variable
41, Gilmore Oral Reading Test (ratio of substitution errors to total words read)
-.11.. Wide Range Achievement Test-Spelling-14. Gilmore Oral Reading Test-Accuracy (number of
errors)-23. Auditory Intrasensory Integration Test (number
right)43. Gilmore Oral Reading Test (ratio of total number
of errors to total number of words read)
42. Gilmore Oral Reading Test (number of words read)
12. Wide Range Achievement Test-Reading13. Gilmore Oral Reading Test-Rate (number of words
read per minute)14. Gilmore Oral Reading Test-Accuracy (number of
errors)15. Gilmore Oral Reading Test-Comprehension (number
of correct answers)
43. Gilmore Oral Reading Test (ratio of total errors to total words read)
1. Verbal Scale IQ (WISC)3. Vocabulary (WISC)
-14. Gilmore Oral Reading Test-Accuracy (number oferrors)
41. Gilmore Oral Reading Test (ratio of substitution errors to total number of words read)

187
TABLE 13
Important Loadings in Rotated Factor Analysis of Significant Variables Listed in Table 5
Variable FactorNumber Loading Variables Within Each Factor
"Factor I
33. -.8815 Reading-Father (Familial History)35. -.7979 Spelling-Father (Familial History)38. -.8887 Overall Judgment-Father (Familial
History)
Factor II
11. .7434 Wide Range Achievement Test-Spelling12. .6643 Wide Range Achievement Test-Reading16. .7301 Iowa Silent Reading Test23. .6937 Auditory Intrasensory Integration Test
(number right)36. -.5419 Directional Orientation-Mother
(Familial History)
Factor III
27. .9071 Benton’s Finger Localization Test (correct responses to double simultaneous stimulation)
28. .9328 Benton’s Finger Localization Test (combined score of correct responses for single & double simultaneous stimulation)

188
TABLE 13, continued
Variable Number
Factor Loading Variables Within Each Factor
Factor IV
29. .8473 Approximation and Abduction of Fingers---------------------- (neuro-l-og-iea-l-)-------- -----------------30. .8098 Apposition of Thumb (neurological)31. .6041 Supination and Pronation of Out
stretched Hands (neurological)
Factor V
2. .9196 Digit Span (WISC)19. .5916 Rhythm (auditory)20. .7278 Time (auditory)
Factor VI
7. .7251 Benton's Visual Retention Test-Delayed Recall (number right)
25. .8022 Dominance-Foot (experimental group is left footed)
26. .4925 Dominance-Incomplete Handednessa
a This variable which is barely beyond the .05 level was included m the factor analysis for clinical reasons. (See variable 1, Table 6.)

189TABLE 13, continued
Variable Factor
Factor Loading Variables Within Each Factor
Factor VII
4. .8054 Picture Completion (WISC)24. .5007 Auditory Intrasensory Integration Test
(total reaction time)32. .4822 Crawling (Medical History Inventory)
History)
Factor VIII
8. .7640 Alphabet-Verbal9. .6982 Alphabet-Written
10. .8487 Alphabet-Total (verbal and writtenscores combined)
37. .5406 Motor Coordination-Father (Familial
Factor IX14.15.
.8107
.7445Gilmore Oral Reading Test-Accuracy Gilmore Oral Reading Test-Comprehension
41. -.5242 Gilmore Oral Reading Test (ratio of substitution errors to total words read)
42. .7057 Gilmore Oral Reading Test (number of words read)

190
TABLE 13, continued
VariableNumber
Factor Loading Variables Within Each Factor
Factor X
5. .8102 Mazes (WISC)
Factor XI
6. -.5498 Letter Recognition Test (number correct)15
40. .4827 Subjects’ Brothers with Specific Dyslexia
Factor XII
34. .8070 Reading-Mother (Familial History)39. .8065 Overall Judgment-Mother (Familial
History)
Factor XIII
18. .8553 Loudness (auditory)21. .5419 Tonal Memory (auditory)22. -.5245 Auditory Blending
t> This variable which is barely beyond the .05 level was included m the factor analysis for clinical reasons. (See variable 2, Table 6.)

191TABLE 13, continued
Variable FactorNumber Loading Variables Within Each Factor
Factor XIV
1. .8465------------ 3-;--------- 78T42
17. -.429243. .6652
Verbal Scale IQ (WISC)_________________________Vocabulary (Wl&c)HandwritingGilmore Oral Reading Test (ratio of total errors to total words read)

192
TABLE 14
Variables with Highest Loadings Selected from Rotated Factor Analysis for Use in
Hierarchical Grouping Analysis
Variable Factor Number* a Loading
Note.-Only the variable within each factor with the highest loading was selected for inclusion in the hierarchical grouping analysis.a The variable numbers are those listed in Table 13.
FactorNumber
38. -.8887 Overall Judgment-Father (Familial History of Language Disability) I
11. .7434 Wide Range Achievement Test- Spelling II
28. .9328 Benton*s Finger Localization Test (combined score of correct responses for single & double simultaneous stimulation) III
29. .8473 Approximation and Abduction of Fingers (neurological) IV
2. .9196 Digit Span (VJISC) V25. .8022 Dominance-Foot (experimental group
is left footed.) VI4. .8054 Picture Completion (WISC) VII10. .8487 Alphabet-Total (verbal & written
scores combined) VIII
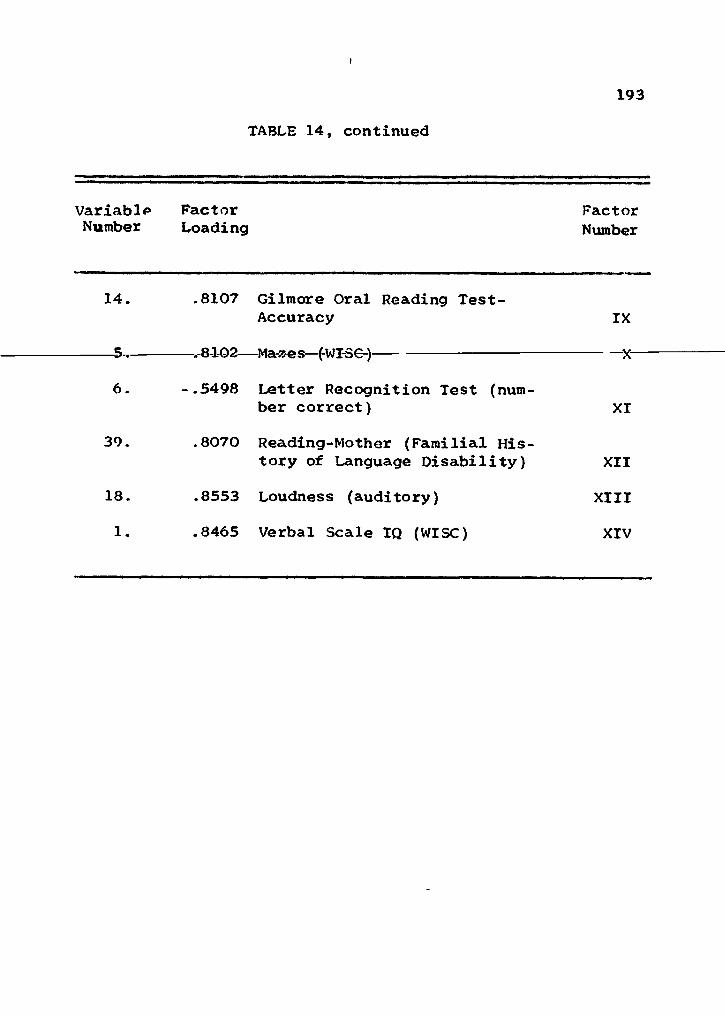
193
TABLE 14, continued
Variable Factor Number Loading
FactorNumber
14. .8107 Gilmore Oral Reading Test- Accuracy IX
5 ___ QIAO •»**.** /T<)TOr\l*lci»5C»S J X
6. -.5498 Letter Recognition Test (number correct) XI
39. .8070 Reading-Mother (Familial History of Language Disability) XII
18. .8553 Loudness (auditory) XIII1. .8465 Verbal Scale IQ (WISC) XIV

194TABLE 15
Organization by Areas of Measurement of 14 Factors and Their Highest Loadings
Derived from Factor Analysis
Measure- Factorment Area Variable Number
Familial History of Language Disability
38.39.
Overall Judgment-FatherReading-Mother
IXII
Language10. Alphabet-Total (verbal
and written scores combined) VIII
11. Wide Range Achievement Test-Spelling II
14. Gilmore Oral Reading- Accuracy IX
Neuropsychological28. Benton’s Finger Localiza
tion Test (combined score of correct responses for single & double simultaneous stimulation) III
Neurological29. Approximation and Abduc
tion of Fingers IVAuditory
2. Digit Span (WISC) V18. Loudness XIII
Note.-These variables are the ones with the highest loadings in Table 13 and as listed in Table 14.

195TABLE 15, continued
Measurement Area Variable
Factor Number
Dominance 25. Dominance-Foot (ex
perimental group is left----------------------------- footed-)-------------------------- V-I-Tntellectual
1.4.
Verbal Scale IQ (WISC) Picture Completion (WISC)
XIV VII
Visual Perceptual Recognition
Visual Perceptual Organization and Visual-Motor Coordination
6. Letter Recognition Test (number correct) XI
5. Mazes (WISC) X

196TABLE 16
Names of Factors in Rotated Factor Analysis
FactorNumber Factor Name
I Familial history of language disability-father
II Spelling deficiency
III Finger agnosia
IV Finger-hand dyspraxia
V Auditory memory deficit
VI Incomplete peripheral dominanceVII Visual perception of pictorial details
VIII Reproduction of alphabet deficiency
IX Oral reading deficiency
X Poor visuomotor coordination and planningXI Letter recognition deficit
KIT Familial history of reading disability-motherXIII Auditory discrimination deficit
XIV Verbal mediation deficiency

197
TABLE 17
Assignment of Children in Experimental Group to Mutually Exclusive Groups According to
Hierarchical Grouping Analysis
Classification of experimental children by number
Group A Group B Group C
01 02 0304 08 0506 09 1307 11 1910 12 2220 14 2821 15 2924 16
171823252627303132
= 8 17 7

TABLE 18
Analysis of Variance of 14 Important Loadings from Factor Analysis Used in Hierarchical Grouping Analysis Indicating Three Syndrome
Patterns of Specific Dyslexia
Note.-Numbers in brackets refer to means transformed to standard scores
Means and means transformed into si :andard scores
Variable F Ratio Group A Group B Group CProbability Level
1. Verbal Scale IQ (WISC) 5.95 99.37 (41.0) 110.71 (51.9) 113.71 (54.71) .0068
2. Digit Span (WISC) 1.49 8.25 (45.9) 9.71 (52.9) 8.71 (48.1) .2409
3. Picture Completion (WISC) 2.36 11.87 (46.1) 12.59 (48.9) 14.43 (56.7) .1122
4. Mazes (WISC) 2.15 10.87 (55.6) 9.41 (47.2) 10.00 (50.7) .1344
5. Letter Recognition 5.76 11.25 (43.0) 12.00 (55.0) 11.43 (45.9) .0078
6. Alphabet- Total 8.44 .OO (42.0) .35 (49.4) .86 (60.0) .0013 198

TABLE 18, continued
Means and means transformed into standard scores
Probability LevelVariable £ Ratio Group A Group B Group C
7. Spelling .52 33.37 (49.6) 32.94 (48.8) 36.29 (53.4) .59898. Gilmore Oral
Reading-Accuracy 2.63 35.50 (56.4) 32.00 (48.9) 30.43 (45.4) .0892
9. Loudness (auditory) .92 42.75 (54.1) 30.53 (48.9) 27.86 (47.6) .4083
10. Foot Dominance 18.04 .87 (53.1) .94 (54.6) .14 (36.3) .0000*
11. Benton's Finger Localization Test (combined score of correct res-
* P = .00005
199

TABLE 18, continued
Means and means transformed into st mdard scores
Variable F Ratio Group A Group B Group CProbability Level
ponses for single & double simultaneous stimulation) 9.41 28.87 (44.9) 33.71 (55.8) 27.43 (41.6) .0007
12. 1 Approximation and Abduction (neurological) 13.44 1.37 (61.6) .29 (45.4) .43 (47.3) .0003
13. Overall Judgment-Father 2.71 .50 (50.0) .64 (52.9) .14 (42.9) .0832
14. Reading- Mother 3.45 .50 (48.0) .47 (47.4) 1.00 (58.0) .0453
200

TABLE 19
Qualitative Description of the Performance of Three Subgroups of Children with Specific Dyslexia on a Select Number of Significant Variables
Group
Variable A B C
Verbal Scale IQ low3^ middle-hig i highLetter Recognition Test high low middle-high
Alphabet-Total low middle high
Foot Dominance right right left
Benton*s Finger Localization middle-low high low
Overall Judgment-Father middle-highb high lowReading-Mother low low high
a The qualitative terms refer to the level of performance: ance and high means good performance.b Low means presence of language disability, middle-high m
sence of language disability, and high means absence of langi
low means poor perform-
;ans tendency toward ab- tage disability.
201
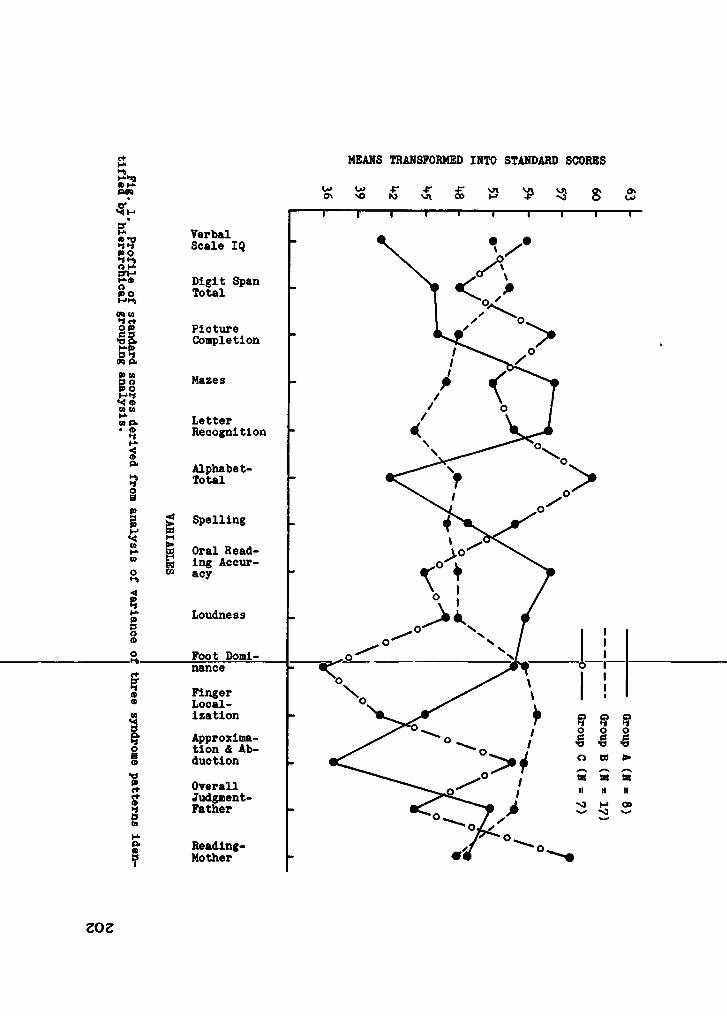
MEANS TRANSFORMED INTO STANDARD SCORES
T“ ■ I' I----1--- 1----1---- 1--- 1--- 1----rVerbal Scale IQ
Digit Span Total
Picture Completion
Mazes
Letter Recognition
Alphabet- Total
SpellingM6 Oral Read- M ing Accur- 60 acy
Loudness
Foot Domi- nanceFingerLocalizationApproximation & AbductionOverall Judgment- Father
Reading- Mother
Group A (N = 8) Group B (N = 17) Group C (N = 7)
ZO2

Fig. 2. Profile of variables with significant group J
ratios derived from the 1*+
variables presented in Fig. 1.
MEANS TRANSFORMED INTO STANDARD SCORES
i—i—i—i—i—i—i—r—i—r
Verbal Scale IQ
Letter Recognition
Alphabet- Total
Foot Dominance
Finger Localization
Overall Judgment- Father
Reading- Mother
EO2

CHAPTER V
DISCUSSION OF RESULTS
The sequence for this discussion is: (a) quantitative
differences between the experimental group and the control
group, (b) statistical characteristics of the experimental group; (c) syndrome patterns of specific dyslexia, and (d)
implications for research.
Quantitative Differences between the Experimental and Control Groups
The number of measurements that significantly differen
tiates the experimental group from the control group supports clinical hypotheses that specific dyslexia is a distinct en
tity. The variety of significant variables intimates that,
in reference to this study, specific dyslexia is a complex
phenomenon. Furthermore, specific dyslexia defies a simple theoretical explanation. Single-factor theories, such as
cerebral dominance, visual imperception, familial history,
neurological dysfunction, maturat'ional lag, etc., may be too
limited to account for the diversity of the results found in this study. Multi-factor theories, as presently developed,
appear too vague in explaining antecedent-subsequent relation
ships and therefore offer little interpretive help. Dis-

205cussion of the findings in this study, therefore, focuses on a descriptive explanation of the data rather than relating them to any particular theory.
Table 7 presents in a more meaningful way the inter
relations of the 43 significant variables that distinguish the
experimental group from the control group. It may be used as
a guide to the relative contribution of the several areas of
measurement and the processes or functions associated with
these measurements. (The reader is referred to Tables 5 and
b for a listing of the tests of these significant variables and those that tend toward significance.) The measurement
areas which contribute considerably to a difference between
the two groups in Table 7 are (a) intellectual, (b) familial history of language disability, (c) language, and (d) auditory.
The measurement areas containing few significant variables are. (a) visual perception, (b) dominance, (c) neuropsychological,
(d) neurological, and (e) medical history. Measurement areas
not listed in Table 7 because they contain no significant
variables are (a) "repeated grade," (b) speech, (c) right
left discrimination, (d) EEG, and (e) age.
Miscellaneous Variable
The variable, "Repeated GFade." was studied because
clinical experience had suggested that a number of children

206with specific dyslexia repeated one or more grades because of poor academic performance related to their reading problem.
This measure, however, was not significant (P = .9130). One
explanation is that the children were in the last two months of the third or fourth grades at the time of testing. Had
they been in a higher grade a significant difference might
have been found. (The opportunity or frequency for failing
a grade for children with dyslexia increases with advancement
in grade level, assuming that a reading disability results in
academic failure as a child progresses through school.)
Language
Measurement was made in five educational areas: (a)
reading (oral and silent); (b) handwriting; (c) spelling, (d) reproduction of the alphabet (oral and written): and (e)
arithmetic computation. The total number of language measures
was 29, of which 23 were in reading. Of these 29 measures,
13 (44.83%) were significant at the .05 level or less (see
Table 9).
Reading. Several measures of reading differentiated
the experimental and control groups: (a) word attack skills;
(b) silent reading comprehension; (c) total number of oral
words read; (d) ratio of oral substitution errors to total

207
number of words read; (e) oral reading accuracy; (f) com
prehension in oral reading; (g) rate in oral reading: and
(h) ratio of total number of errors to total number of words
read orally. The experimental group's performance was inferior on all of these measures.
Perhaps of equal interest to the researcher is knowledge
of reading errors that were not significantly related to chil-
dren with specific dyslexia, errors that were common to normal readers. The errors (and related behavior) in which no signifi
cant difference was found between the experimental and control
groups were the following: (a) hesitation errors: (b) mis
pronunciation errors; (c) repetition errors; (d) omission
errors; (e) number of words pronounced by the examiner; (f)
insertion errors; (g) disregard of punctuation, (h) reading
word-by-word; (i) reading in a monotone voice; (j) poor enunciation; (k) strained pitch; (1) finger pointing; (m) loss of
place, and (n) volume too loud or too soft.
It is not surprising that children with dyslexia have poorly developed word attack skills, that they have difficulty
in comprehending what is read orally and silently, that oral
reading is poor in accuracy, and that rate of reading is slow.
What is surprising is that only one type of reading error
significantly differentiated the two groups, namely, substitu
tion error. Whether this finding is peculiar to this sample

208 of children is not determinable, since comparable data from
other studies are not available for children with dyslexia
and normal readers.
The verification of the fact that children with specific
dyslexia make significantly more substitution errors confirms
what Orton (1937) and his co-workers have known for many years.
The traditionally reported reversal or rotational error of
’’was” for ’’saw" is a case in point. Orton (1928) referred to
this as strephosymbolia, or twisted symbols.The substitution error represents a visuoperceptive sym
bolic or associational difficulty that occurs at the integrative level of psycholinguistic functioning. This error is
not a ’’pure" visual perception function as found, for example,
in the three subtests of the Primary Mental Abilities test (Thurstone & Thurstone^ 1962). Benton (1962b) and Fuller (1964)
distinguished nonsymbolic visuoperceptive deficits from con
ceptual (symbolic) and associational difficulties. The Primary
Mental Abilities subtests are measurements of the former and
the substitution error is a measurement of the latter.
Parenthetically, researchers may find it more productive
to explore visual perception in dyslexia in reference to the
Arabic alphabet or some approximation thereof, whether in
single units or combinations of units, rather than studying

209visual perception in relation to geometric figures and the
like.Handwriting. Disturbance in handwriting has often been
associated with specific dyslexia (Benton, 1962b; Bryant et al., 1964; Saunders, 1962; Schiffman, 1962). This study found
a significant difference between the experimental and control groups in handwriting (P = .0002, variable 17 in Table
5). Many of the hand written specimens in the experimental
group were easily discernible in terms of qualitative
characteristics as follows: disorganization of letters;
slanting or irregular line formation, disregard of margin,
evidence of erasing: etc. Some of the writing appeared to
be at the first grade level even though presented in cursive form. A specimen, indicating these characteristics, is pre
sented in Figure 3, page 210.
Spelling. Spelling was one of the most significant
variables found in this study (P = .00005, variable 2, Table
5), the experimental group performing at a lower level than
the control group. It is significantly correlated with sev
eral other measures, as listed in Table 12; however, discussion of these correlations is presented in this chapter
under Statistical Characteristics of the Experimental Group,
subsection Principal Axis Factor Analysis with Varima Rotation.

210
III
A big car nearly ran over Bobby. He jumped quickly away from it. Now he does not play m the road.
Fig. 3. Handtvriting specimen of a student from the experimental group, age 9 years, 6 months, 3rd grade, 9th month, Full Scale IQ 120.

211
Clinical observation of the types of spelling errors produced by the experimental group is in keeping with the
report by Gillingham and Stillman (1956). These authors,
and others associated with Dr. Samuel T. Orton, stated that
bizarre or unusual spelling was one of several manifestations
of specific language disability (specific dyslexia). Bizarre
spelling may reflect a conflict between two perceptual modali
ties, auditory discrimination and/or other auditory variables
and visual memory of words. Assuming a dysfunction in auditory discrimination and visual memory, the child may alternate
ly respond to insufficient and inadequate cues from both per
ceptual areas. Integration and association of this type of
incomplete and "scrambled” information results, so to speak, in bizarre spelling. Examples of some of the bizarre spelling
produced by the experimental group are shown m Table 20.
It is reasonable to postulate that poor spelling ability
distinguishes children with dyslexia from normal readers, in
view of the findings in this and other studies. This may not,
however, be an exclusive characteristic of children with
dyslexia; for example, it is found m children with subnormal intelligence. In a clinical setting, one would
certainly consider spelling ability in diagnosing dyslexia.

212TABLE 20
Examples of Misspelled Words by Experimental Group
Grade Level Spelling Word Written Response
1.3 in an, on
1.6 man mad1.7 will whil, wale, wiele, went, welt2.1 cut keat, cait, ket, cout2.4 say snaj, sask, said
2.5 arm land, ram2.6 cook koc, cter, cocke, cog, kuc2.7 wall youl, wohe, woke2.8 light ligen, lat
3.0 must muse, mut, not, mose3.1 train truin, tura, rane3.2 order hored, rordr, rod, owdr, oret,
otr, ounr, otere, redr3.3 person peren, pust, prese, peusoun,
prason, prosin, prsun
3.4 reach reish, reark, rich, reas, reshe3.5 enter earner, nit, tanter, amtur3.6 watch whol, wint, warch, waclth

213Alphabet. The findings in this study demonstrated that
the experimental group was unable to write or recite the
alphabet in sequence as well as the control group. The three
measures of the alphabet are shown in Table 5 with the follow
ing levels of significance: variable 13, Alphabet-Total
(P = .0001); variable 14, Alphabet-Written (P = .0002); and
variable 37, Alphabet-Verbal (P = .0270), all of which indicate poor perfornance by the experimental group. Inability to reproduce the alphabet is an important theoretical and educational consideration; it has been ignored to a consider
able degree by present systems of teaching. If the child
manifests uncertainty and instability in this function, there
should be little wonder that he is unable to cope with the
molar aspects of these units.
Money (1962) discussed the principle of form constancy
in regard to visual perception of the alphabet; however, this
does not account for the finding on the verbal recitation of the alphabet. More research is needed on problems associated
with learning and reproducing the alphabet. Learning theory,
in addition to perceptual and cognitive theories, may offer some answers.
Arithmetic. Most authorities did not present evidence
for a deficiency in arithmetic computation in specific dyslexia.
214Rabinovitch et al* (1954) did, however, indicate a deficiency in their primary reading retardation group (specific dys
lexia). The present study did not find a significant difference between the experimental and the control groups on
arithmetic computation (P = .6113). The Arithmetic subtest
on the WISC also did not produce a significant difference.
The mean scaled scores on this subtest for the experimental
and control groups were 11.8125 and 12.6087 with P = .2356.
The difference between this and the Rabinovitch study may be
related to the criterion variables used in selecting and
classifying children into diagnostic groups.
Intellectual
The criterion measure for determining the intellectual
level for the two groups was the Peabody Picture Vocabulary
Test (Dunn, 1959). In Table 5, the comparability of the
groups on the measure of IQ is reflected in the WISC Full Scale IQ (experimental = 110.5625, control = 114.0000,
P = .1814). This suggests that differences between the two
groups may not be attributed to a generalized or global in
tellectual factor. There was, however, a significant differ
ence on the WISC Verbal Scale IQ (experimental = 108.5313,
control - 115.1304, P = .0190). A cautious attitude must be

215maintained -in generalizing from this finding to the population
of children with dyslexia, since evidence is presented in a
later section of this chapter that indicates that all of the
children in the esgserimental group did not have a low Verbal
Scale IQ.There was no significant difference between the two groups
on the WISC Performance Scale IQ (experimental = 110.7188,
control » 109.4783, P = .6687).
Four subtests on the WISC, two verbal and two performance,
were significant (see Table 5). The mean scaled scores are
as follows: Digit Span (experimental = 9.1250, control =
11.1304, P = .0017); Vocabulary (experimental = 10.6250, control = 12.3913, P = .0072); Picture Completion (experimen
tal = 12.8125, control = 11.1304, P = .0124); and Mazes
(experimental = 9.9063, control = 12.5217, P = .0001). The control group performed at a higher level on all of these sub
tests except Picture Completion. None of the other WISC sub
tests was significant. (Object Assembly was not administered.)
The Digit Span subtest which is interpreted as measuring im
mediate or short term auditory memory is significantly cor
related with several auditory variables as evidenced in Table
12 (see variable 2). Since the experimental group is de
ficient on a number of auditory measures it is not unwarranted

216to consider Digit Span as measuring an auditory function.
This is discussed more completely in the subsection below titled Auditory.
Depending on one’s theoretical frame of reference, several explanations may account for the experimental group’s poorer
performance on the Vocabulary subtest. The most obvious in
terpretation is a quantitative one wherein the disability in
reading itself discourages the child from reading and that the
lowered vocabulary is directly related to the amount of ma
terial read. This assumes that the more a child reads the
greater is the vocabulary level. A second explanation pertains
to a general verbal-cognitive deficiency in responding to,
integrating, and expressing verbal synbolic language. Benton
(1962b) discussed this type ctf difficulty in relation to
specific dyslexia. In a more general sense the work of Osgood
(1957a, 1957b) and McCarthy and Kirk (1961), concerning psycholinguistic functions, is applicable to this discussion.
The results of the Picture Completion subtest were not
anticipated since this phenomenon had not been mentioned in the literature in relation to dyslexia. One possible explana
tion for the superior performance by the experimental group
is that children with dyslexia compensate for the disability
by noting details in the pictures that accompany reading

217material. In this sense, they learn to carefully note pic
torial details, a requirement which is basic to Picture
Completion.
Of the measures involving the WISC, the Mazes subtest
was the most significant in indicating poor performance on
the part of the experimental group (see variable 10, Table 5). Further consideration of this is deferred to the section
on Visual Perception.Clinical researchers who evaluate children with dyslexia
and other reading disabilities frequently report that these
children achieve low scores on the WISC Coding subtest. This
study did not find a significant difference between the two groups on this subtest. The mean scaled scores are experimental - 9.9688 and control = 10.6087, with P = .3424. This
writer has no explanation for this finding except to say that
some clinical hypotheses are not validated under experimental conditions involving control groups.
In summary, five of 16 measures (31.25%) on the WISC were significant, as indicated in Table 9. The results obtained are additional proof of its value in diagnosis and research.
Visual Perception
Thirteen measurements were made in this area involving

218the following tests: Minnesota Percepto-Diagnostic Test (MPD)
(Fuller & Laird, 1963b), Raven’s Coloured Progressive Matrices
(Raven, 1956); Primary Mental Abilities-Perceptual Speed,
Spatial Relations, and Figure Grouping (Thurstone & Thurstone,
1962); Benton’s (1955) Visual Retention Test-Visual Motor
Reproduction, Immediate Recall, and Delayed Recall; and Letter Recognition Test. Only two of these 13 measures were sig
nificant; namely, Benton’s Visual Retention Test-Delayed Recall and the Letter Recognition Test. The experimental group
performed at a lower level than the control group on these
two tests at the following respective levels of significance:
P -• .0261 (variable 36, Table 5) and P = .0594 (variable 2,
Table 6). As previously stated, the Letter Recognition Test was arbitrarily classified as significant so that it could
be included in the additional statistical analyses in this
study.
Divided opinion on the role of visual perception was
mentioned in Chapter II. Considering the age and intellec
tual level of the children in this study, the results agree
with those writers who do not consider dyslexia as a per
vasive visuoperceptive disorder (Benton, 1962b; Fuller, 1964;
Rabinovitch, 1962). Benton presented a tenable hypothesis
that the role of form perception in dyslexia, for older

219children with adequate intelligence, had been rather exagger
ated: and Fuller presented experimental evidence that visual
perception in regard to directional orientation was not re
lated to dyslexia. This is not tantamount to saying that no
deficiency in visual perception is associated with dyslexia.
After a child with dyslexia has reached or passed the sensory
motor developmental asymptote, visual perception, as conventionally measured by geometric figures, probably is of minima] influence.
The conclusion that disordered visual perception is not related to dyslexia past a certain age level may not necessar
ily be true when visual perception is involved in or associated
with verbal-cognitive functions. For example, the results of
the Letter Recognition Test do suggest some difficulty in
visual perception. In this test the child selects a given
letter from among several, a perceptual configuration that
constitutes a symbol. The psychological process involved in
this test is probably a less ’’pure” visual perceptual process than that needed in responding to the MPD Test (Fuller &
Laird, 1963b) and the three subtests on the Primary Mental Abilities Test (Thurstone & Thurstone, 1962). By way of il
lustration, a dyslexic child could correctly perceive and
copy a letter as a pattern, in the manner of the Bender

220Gestalt test. The pattern’s identity as a letter, however,
involves more than perceptual processes. Identifying al
phabetic letters is not simply perception; it is cognition.
The results from Benton’s (1955) Visual Retention Test- Delayed Recall are considered in relation to Money’s (1962)
discussion of visual memory and cognition. Money considered the possibility that the child with specific dyslexia is a nonvisile cognitional person weak in visual imagery and visual
memory, as contrasted with one who has eidetic memory. On
the Benton test, the significantly poorer performance by the
children in the experimental group suggests that they are
weak in nonverbal visile memory. Since the Benton test consists of geometric stimuli, the process it purports to measure is nonverbal in nature. Whether this is related to poor
verbal visual memory, e.g., recognition and recall of words
previously learned, is not known. A more appropriate measure
of verbal visual memory could be achieved by an experiment involving sensible words on a memory drum.
The results from the Primary Mental Abilities (Thurston & Thurston, 1962) subtests were nonsignificant. The per
ceptual speed subtest, however, tended toward significance
(P • .0856, variable 11, Table 6). Kass (1962) found that
her group of children, ages 7-0 to 9-11 in grades two, three

221and four, was significantly below average on this subtest. She compared the results of her 21 children with a theoreti
cal population mean (£ test). The difference between these
two reports may be related to a mean age difference and an
intellectual difference. Since Kass did not use a control
group, there may be additional variables peculiar to her
sample of children that could account for the differences in
these findings. The relation of perceptual speed to specific
dyslexia should, however, remain an open question until addi
tional, more conclusive research is reported.
The Coloured Progressive Matrices (Raven, 1956) did not
distinguish the two groups (P = .3162). As Raven (1963)
described this instrument, it is "a test of observation and
clear thinking . . ." in which the stimulus material is
arranged ’’to assess the chief cognitive processes . . . (p.3)."
Principles of Gestalt perception are involved as the subject
apprehends "discrete figures as spatially related wholes
and (analyzes) them into their components . . .(p. 24)."
Thus, this is a cognitive nonverbal visual perception test. These statements by Raven suggest a similarity between the
Matrices test and the subtests on the Primary Mental Abilities
test, in contrast with the Letter Recognition Test. The re
sults of the experimental and control groups on the Matrices

222test supncrt the hypothesis that cognitive visual perception,
in relation to geometric figures (nonverbal stimuli), is not
a deficit characteristic of the experimental group. On the
other hand, a deficit in cognitive visual perception, in re- I lation to verbal or verbal symbolic stimuli, is postulated.
This statement, when considering the findings on Benton's
(1955) Visual Retention Test-Delayed Recall, implies that nonverbal visile cognition is not the deficit characteristic
involved in this test. Rather, it indicates that a deficit
in memory is the reason that the experimental group performed
less adequately than the control group on the Benton test.
The problem in discussing the role of visual cognition in specific dyslexia is the lack of an agreed-upon operational
definition of the term. It is suggested that future considera
tion of visual cognition be made in regard to the types of
stimulus material utilized in assessment, whether it be geo
metric figures, and the like, or verbal stimuli, as in the Letter Recognition Test.
The Mazes subtest of the WISC is discussed under the rubric of Visual Perception since it seems to bear more re
lation to it than to verbal cognitive intellectual factors,
even though it is classified in Table 7 with the intellectual
measures.

223Kass* (1963) description of the Mazes subtest indicates
that it measures a type of visual-motor predictive process.
Observations in the present study on how the children in
the experimental group performed on this subtest indicates
that at least two processes are involved, a visual-motor co
ordination factor and a Gestalt cognitive map factor, to use Tolman’s (1951) term. Wechsler (1949) described three types
of errors made in this subtest, two of which seem to reflect
these two factors; namely, crossing any line that forms the
boundary of the maze, and entering into a major blind alley.
The former is a visual-motor error and the latter pertains to a cognitive map of what-leads-to-what. Some of the children in the experimental group were able to find their way through
the mazes, but in so doing made a number of errors in cross
ing the boundary lines. Others were entirely unable to find
their way out of the mazes within the time limits of the sub
test. They characteristically would trace and retrace
erroneous solutions to the problem. The interpretive meaning
of this subtest, in regard to the experimental group, is obscured by the two types of processes involved in its per
formance. In studying children with dyslexia, it is suggested
that three scoring systems be used: the original system in
Wechsler’s manual (1944), one based on motor incoordination

224errors; and one based on entering blind alleys. This would
allow for a differential analysis of the problems associated
with the solving the Mazes subtest and the relation they have
with specific dyslexia.
In summary, two out of 13 (15.38%) visual perceptual tests significantly differentiated the experimental from the con
trol group and several tests tended toward significance (see
Table 9). All of these measures may be viewed from the con
text of cognitive mediating processes and/or visual perception.
The relation of visual perception to dyslexia, however, is
more meaningfully understood in relation to age. Younger
children with assumed dyslexia may manifest considerable
difficulty in visual perception, whereas older children may
be viewed as having more trouble with visual cognitive difficulties rather than visual perception.
AuditoryThis category produced a very high proportion of signifi
cant variables--58.33% (see Table 9). Two auditory variables
tended toward significance, Sound Localization and Pitch
(see Table 6). All of the significant variables, with the
exception of Auditory Intrasensory Integration--which later
statistical analysis revealed to be more of a spelling

225measure—and Auditory Blending, involve various forms of
auditory discrimination i.e., rhythm, time, tonal memory,
and loudness. All of these are from the Seashore Measures
of Musical Talent (Seashore et al., 1960). The only sub
test from the Seashore battery that was not significant or
did not tend toward significance was Timbre.
The findings from the Seashore test substantiate reports
in the literature that indicate a relation between dyslexia and auditory discrimination. There is little doubt, in view
of cumulative research, that auditory dysfunction is a
characteristic of children with dyslexia. The relation of auditory dysfunction to retraining is another question, a re
lation which has not been experimentally studied in dyslexic
children. As Waites (1965) stated, children with specific
dyslexia who are quite deficient in the auditory channel appear to be more resistive to retraining than those not mani
festing extensive deficiencies in auditory discrimination.
The Digit Span subtest on the WISC also differentiated
the experimental group from the control group, the latter per
forming at a higher level. This subtest is viewed as measur
ing an auditory function, namely, immediate auditory memory and/or an ability to cope with auditory sequencing stimuli.
This assumption is made as Digit Span is significantly cor
related with several auditory variables.

226The absolute difference between digits correctly re
cited forward and digits correctly recited backwards was
an additional computation performed with the Digit Span sub
test. Poorer performance on digits recited backwards has been
considered as an indication of cerebral dysfunction or brain damage. The absolute mean difference between digits recited
forward and backwards for the experimental and control groups
is 1.8438 and 1.6087 respectively with P = .3968. (No child
in either group recited more digits backwards than forwards.)
This nonsignificant difference indicates that this computation
al operation was of no value in differentiating the experimental group from the control group.
The experimental group was significantly below the per
formance level of the control group on the Auditory Blending
Test (P = .0075, variable 27, Table 5). The auditory variables on the Seashore test pertain to auditory discrimination
of likeness (sameness) and difference, whereas the Auditory
Blending Test is more a measure of auditory integration than
discrimination. The latter test involves the ability to blend
or integrate temporally spaced auditory sounds. This finding
agrees with a number of other reports that indicates that
poor readers are deficient in auditory blending ability.

227
The results of auditory measurements suggest that the
experimental group had more difficulty than the control group
in several aspects of auditory functioning; namely, auditory
discrimination, immediate auditory memory, and auditory blend
ing. In addition, Sound Localization tended toward significance (see Table 6). The number and variety of auditory measurements found significant in this study imply that audi
tory dysfunction is a significant characteristic of the experimental group. Generalization from this study to the popu
lation of children with dyslexia is warranted in view of other
studies that report similar results.
In concluding this discussion, one may state that considerably more attention should be given to auditory variables
associated with dyslexia. Perhaps the influence of visual
perceptual factors has been overemphasized, particularly in
the child with dyslexia who has passed the sensory-motor developmental asymptote, and has overshadowed attention on auditory dysfunction. Language is first learned through the
auditory channel. So is reading. If this primary channel
is defective in some functional manner then whatever is later
added to the learning process, for example visual perceptual
training in reading, will be restricted in its effectiveness
by defects associated with auditory reception and integration
of sensible sounds and sound patterns.

228Speech
None of the speech variables significantly differentiated
the two groups in this study; specifically, articulation-- total number of sounds correctly produced or total number of
a group of defective sounds found significant by Jordan (1960)--
and diadochokinesis (total number of left-right tongue
movements during a 10 second interval and rhythm of left-right
tongue movements). Notice is taken of the fact, however, that
others have found a relation between speech problems and
dyslexia (Cole & Walker, 1964; de Hirsch, 1963b; Hardy, 1962; Ingram, 1959; Orton, 1928: Rabinovitch, et al., 1954). These
studies may reflect a nonsignificant correlation because most
of them were clinical studies rather than experimental.However, the question should remain open and subjected to addi
tional experimental research.
Lateral DominanceTwo out of 10 measures in this area were significant as
follows: Dominance-Foot (the experimental group is left
footed) and Dominance-Incomplete Handedness. The first is significant with P = .0089 (variable 29, Table 5) and the
second tended toward significance with P = .0575 (variable
1, Table 6). The latter measure was arbitrarily classified

229as significant since it was very close to the conventional
.05 level. (For clinical reasons it was included with the
significant variables for additional statistical analysis
since it is frequently mentioned in the literature as related to dyslexia.) For additional information on the IO
measures or classifications of lateral dominance, see
Chapter III, Harris Tests of Lateral Dominance.
In Chapter II it was reported that some consider the
theory of lateral dominance basic to dyslexia and that a number of investigators have presented research supporting
this view. Four measures in this study focused upon this
issue: right lateralization (complete or incomplete), left lateralization (complete or incomplete); cross dominance; and
complete lateralization, regardless of the side lateralized.
None of these measures significantly differentiated the ex
perimental group from the control group. It is possible,
however, to infer some form of incomplete lateral dominance in the experimental group. Dominance-Foot (variable 29,
Table 5) and Dominance-Incomplete handedness (variable 1,
Table 6) were significant and Dominance-Incomplete Footedness (variable 12, Table 6) tended toward significance.
This study tends to de-emphasize the importance of con
cepts related to lateral dominance in children with dyslexia.

230Following the suggestion of Zangwill (1964), it may be more
appropriate to speak of peripheral lateral dominance or lack
of peripheral lateral dominance. Further discussion of this
issue is presented in the section on factor analysis.
Right-Left Discrimination
None of the four measures of right-left discrimination
was significant: subject's execution of examiner's commands;
subject's verbal description of pictorial stimuli. The re
spective levels of significance for these measures are P = .4562, .2332, .2533, and .9327.
These findings support Benton's (1962b) review of the literature on directional sense. He said that the importance
of this variable had been overemphasized in older children
with dyslexia who have adequate intelligence. Although it
is impossible to make a direct comparison with Harris' (1957) findings, since they are in percentages, nevertheless the
results of the present study may be considered comparable to
his. He found only 6 percent of a sample of children with
reading disabilities to be deficient in right-left discrimina
tion. As is the case with a number of neuropsychological
variables reviewed and studied in this research project, the
age of the child with dyslexia is crucial to whether or not

231problems of right-left discrimination are present.
Finger Localization
Finger localization or the problem of finger agnosia has often been discussed in relation to the Gerstmann syndrome (Gerstmann, 1940). The relation of finger agnosia to dys
lexia has received limited attention in the experimental
literature; however, it was included in this study at the
suggestion of Benton (1964). Two of the three measures on
the Benton Finger Localization Test were significant, as pre
sented in Table 5; namely, combined score of correct responses
for single and double simultaneous stimulation (P = .0422,
variable 38), and correct responses to double simultaneous
stimulation (P = .0445, variable 40). There was no signifi
cant difference between the two groups on single stimulation.
The statistical importance of finger localization to dyslexia
is not clear at this time since it appears to be primarily an isolated function unrelated to the other variables in this
study. Substantiation of this is seen in Table 12 where
finger localization does not correlate significantly with any
other variable. (The two measures of finger localization do,
however, correlate significantly with each other.)

232Neurological Examination
Three out of 41 variables (7.32%) in the neurological
examination significantly differentiated the two groups (see
Table 9). These variables and their levels of significance
are listed in Table 5. The variables are Apposition of Thumb
and Fingers (variable 9), Approximation and Abduction of
Fingers (variable 18), and Supination and Pronation of Hands (variable 19). These variables are measures of hand and
finger fine muscle coordination. They indicate that the ex
perimental group evidenced motor incoordination to a signifi
cant degree. Five measures of the lower extremities were not significant and thus did not reveal motor incoordination.
A number of authorities have agreed that no consistent
neurological pattern is associated with dyslexia (Benton,
—1"96"4";—Birch, T964a';" Drew^—1956; -Wadtesv-1965~)~ “Some- writers—
have interpreted ’’soft” neurological signs as indicative of
minimal brain damage in children with specific dyslexia or
other reading disabilities. This assumption appears to be
unwarranted in view of current criticism in the literature,
which questions the validity of such an assumption (Birch,
1964b; Cohn, 1964). The present study supports the view
that neurological variables associated with a central ner
vous system lesion are not present in children with specific

233dyslexia, whether these variables be “soft” or otherwise.
One may conclude from the neurological examination that
the experimental group evidenced significant motor incoordina
tion in the upper extremities. No other variables in tne neurological examination significantly differentiated the two groups. The results of this study would argue against the
assumption of a relation between specific dyslexia and brain
damage or minimal brain damage Acceptance of the null
hypothesis is, therefore, warranted.
EEG
None of the 18 measures--9 wake and 9 sleep tracings--
significantly differentiated the two groups. This is in keep
ing with the results of the neurological examination in this
study and is further substantiation of lack of a relation be
tween specific dyslexia and brain damage. Although Money (1962)
stated that positive EEG findings were not routinely produced from EEG tracings. Benton and Byrd (1963) did report that
some studies indicated positive EEG findings associated with
reading disability. The use of a control group in this pre
sent study may explain why no significant findings were pro
duced. Another possible explanation for the lack of agree
ment between this and other studies which report positive

234findings is that the neurologist who interpreted the tracings in this study was trained in pediatric neurology. Some of
the other investigators who have interpreted EEG tracings
may have been adult neurologists and this may account for
the difference. The relevance of this factor should at least
be considered since the norms for normal and pathological
EEG tracings for children and adults are, to some degree, different.
Medical History
One out of 27 medical history variables (3.7OS6) was
significant in this study (see Table 9). It is Crawling
(variable 23, Table 5). This finding is more indicative of
late motor development rather than generalized motor disability, since it is not significantly correlated with cur
rent neurological assessment of motor function. (See Table
12 for a listing of the significant correlations with vari
able 32, Crawling). It is not significantly correlated with
upper and lower motor extremities nor with handwriting, a
motor variable which significantly differentiated the two
groups. One may conclude that the children in the experimen
tal group were "late bloomers" in generalized motor develop
ment and that this is unrelated to present motor functioning.

235As discussed in Chapter II, a number of investigators
have presented evidence of a significant correlation between
medical history factors (prenatal, paranatal, and postnatal)
and reading difficulty. The negative results in this study
concerning the relation between natal factors and dyslexia are not necessarily in conflict with other studies if one can
assume that different samples of children with reading dis
abilities were studied. There is the possibility that studies demonstrating significant medical history variables were done
with children who incurred brain damage during one or another
phase of their natal development. The children in the pre
sent study were prescreened, i.e., no children were included
in the experimental group who had a history of brain damage or who manifested current medical signs of brain damage.
Children in these other studies were not prescreened or pre
diagnosed in terms of ruling out signs of brain damage. They
were selected from a more heterogeneous population represent
ing reading disability in general. This present study, there
fore, failed to confirm an antecedent-subsequent relation be
tween natal variables and dyslexia.
Familial History of Language Disability
More explanatory attention has been given to a genetic
basis for specific dyslexia than any other single hypothesis.

236The results of this study confirmed this view. Eight out of
18 measures (44.44%) in this area significantly differentiated
the experimental group from the control group, the difference
indicating a familial history of language disability for the
experimental group (see Table 9). Two variables tended to
ward significance and are presented in Table 6 (see variable
5 and 7). Five of the significant variables pertain to males
(four father and one brother) and three pertain to mother
(see Table 7).
Most incidence studies report more males are involved
with specific dyslexia than females. This study suggests
that the mothers manifest a history of reading disability
equally with the fathers. Suspicion is cast on the results of this study in view of the preponderance of evidence to the
contrary in other studies. The children in the experimental group were diagnosed six months to a year before their selec
tion for participation in this study. In addition, some of
the mothers had received non-technical literature on dyslexia.
Interest in their child and attention to his struggles with
educational difficulties may have contributed to a hypersensitivity to his learning problems and especially to dys
lexia following the diagnosis of the condition. This is to
suggest that the mothers may have been overly sensitive to

237their own nominal or nonsignificant difficulties in reading.
This may explain why the results of this study showed a
familial history of reading difficulty in the mothers. (The
family history information was obtained from them in the in
terview situation.) Clinically speaking, there was no doubt
in the interviewer’s opinion concerning information on the
familial problems associated with the fathers. This was not
necessarily true in the case of the familial history of the
mothers in the experimental group, even though their verbal
responses indicated reading problems. The mothers’ responses
to the other items in the familial history (handwriting,
laterality, directional orientation, motor coordination, speech, and siblings) were specific and concise and no question is raised concerning their validity.
The findings concerning siblings of the children in the
experimental and control groups indicate that brothers of
the children in the experimental group have significantly more language problems than do the brothers of the control group
children. No significant difference was found for the sisters
of both groups of children (P = .1182). If, as indicated in
this study, the mothers in the experimental group are involved
equally with the fathers in reading disability, one would

238expect this finding to be present in their daughters. Lack
of verification of involvement on the part of their daughters
may be interpreted as lending support to the reasoning de
veloped above.
Other areas of the familial history revealed a difference
between the parents of both groups. Mothers of the experimental group were inferior on Directional Orientation (P =
.0002, variable 15, Table 5). The manner in which these mothers described their directional disorientation illustrates
this. Many of them reported in the interview that it was
necessary for them to recite the four points of the compass in order to locate themselves spatially when driving only a few miles away from home. This behavior was not, however,
reported by the mothers in the control group. There was no
significant difference between the fathers of both groups on
Directional Orientation (P = .1182).
The fathers in the experimental group were significantly
deficient on Motor Coordination (P = .0478, variable 41, Table 5). This was reflected in the interview as a generalized awkwardness or clumsiness. There was no significant differ
ence between the mothers on this variable.
The results of the Familial History of Language Disabil- ty imply that the fathers and mothers in the experimental

239group are deficient on similar measures and also deficient
on dissimilar measures. Both are deficient in Reading. The
mothers, but not the fathers, are deficient on Directional
Orientation. The fathers, but not the mothers, are deficient on Spelling and Motor Coordination.
In concluding this discussion, it is suggested that a
more definitive approach to the question of a genetic basis
for specific dyslexia may be found in evaluating the parents
of an experimental and control group by utilizing standardized
measurement instruments rather than by means of an interview.
The interview permits interviewer and interviewee bias, par
ticularly where subjective interpretation of the data is the basis for judgment. The interview is at best only an approxi
mation to the problem, and in clinical practice it may be the
only practical approach. Possibly a more structured interview
schedule would produce more reliable and valid information.
Other than improving the interview, it is recommended
for research purposes that parents of children with dyslexia
be evaluated in terms of a familial history of language dis
ability.
Statistical Characteristics of the Experimental Group
This discussion pertains only to the statistical analysis

240of the experimental group. This involves intercorrelation
and principal axis factor analysis with verimax rotation.
Intercorrelation of Significant Variables
As shown in Table 12, the following measurements have
more variables correlated with them than do the other mea
surements: WISC Verbal Scale IQ (variable 1); WISC Vocabu
lary (variable 3; Alphabet-Verbal (variable 8); Wide Range
Achievement Test-Spelling (variable 11); Wide Range Achievement Test-Reading (variable 12). Gilmore Oral Reading Test-
Accuracy (variable 14); and Rhythm (variable 19). The great
er number of intercorrelations with these measurements may
reflect the preponderant number of variables in the intel
lectual, language, and auditory areas. It may also indicate that these specific measurements are more closely related to
the other variables than the measurements with fewer correlations .
The correlation between intelligence and reading ability
has been well established in educational research. This is
not always, however, a one-to-one relationship, particularly in certain subcategories of reading disability. The results
of the WISC Full Scale IQ demonstrated no significant differ
ence between the experimental group and the control group.

241One may assume from this finding that the problem of dys
lexia in the experimental group does not result from a gen
eralized condition of low intelligence. (See Table 4 in
Chapter III for the means of the two groups and the probabil
ity level.) The association between verbal ability, concept
formation, verbal mediation, verbal cognition, and dyslexia
is another question.
Clarification of the relation between verbal abilities
and dyslexia may be gleaned from the intercorrelations pre
sented in Table 12. The two measurements reflecting the high
est degree of verbal ability in this study were Verbal Scale
IQ (variable 1) and Vocabulary (variable 3). These measurements were significantly correlated (positively) with each other. They jointly correlate with several variables- Reading-
Mother (variable 34); Spelling-Father (variable 35); and Gilmore Oral Reading--total errors/total number of words
read (variable 43). Variables which correlate either with the
Full Scale IQ or the Vocabulary axe as follows: Wide Range Achievement Test-Reading (variable 12), Reading-Father
(variable 33), and Overall Judgment-Mother (variable 39).
The former two variables do not correlate significantly with
the majority of reading variables: Gilmore Oral Reading Test-
Accuracy (variable 14); Gilmore Oral Reading Test-Comprehension

242
(variable 15); Iowa Silent Reading Test (variable 16); Gilmore Oral Reading Test—substitution errors/total number
of words read (variable 41); and Gilmore Oral Reading Test--
number of words read (variable 42). This is surprising be
cause a deficiency in verbal ability, concept formation, verbal mediation, or verbal cognition has frequently been postu
lated as a basic factor in dyslexia. If this is a correct postulation for most older children with dyslexia whose in
telligence is adequate, then one would expect this to be de
monstrated in positive and significant correlations between
verbal ability (Verbal Scale IQ and Vocabulary) and reading
ability. Such, however, was not the case in this study.
In view of these findings it is reasonable to question the assumption that a verbal deficiency is a pervasive charac
teristic of dyslexia. A converse statement is offered for consideration: A verbal deficit is not necessarily character
istic of most children with dyslexia. Or, to state it differently, some but not all children with dyslexia are deficient in verbal mediating ability. The validity, or at
least heuristic value, of this consideration is tenable in so
far as this study is concerned, since three types of sub
groups of dyslexia were discovered by the hierarchical group
ing analysis procedure. One group was low in verbal ability
and one group was high in verbal ability.

243Returning to the intercorrelations in Table 12, the
WISC Digit Span subtest (variable 2) is significantly
(positively) correlated with three variables, all of which
are auditory measures: Rhythm (variable 19); Time (variable
20); and Tonal Memory (variable 21). It is not, however, significantly correlated with other auditory measures, e.g,,
Loudness and Auditory Blending. There is little doubt that
Digit Span is a measure of auditory functioning for the chil
dren with dyslexia in this study.Additional discussion of the 43 significant intercor
related variables in Table 12 is deferred to the following
section on factor analysis. The factor analytic structure
presented in Table 13 reduces the complexity associated with a discussion of these variables.
Principal Axis Factor Analysis with Varimax Rotation
As previously stated, the primary purpose of the factor
analysis was to derive important loadings from the 43 signifi
cant variables for use in the hierarchical grouping analysis procedure. A brief discussion of the 14 factors presented in
Table 13 will, however, add to our understanding of the ex
perimental group in particular and of dyslexia in general.Factor I in Table 13 is definitely a familial one involv
ing the father. The three important loadings pertain to

244reading (variable 33), spelling (variable 35), and Overall Judgment of language disability (variable 38). This is in
keeping with incidence studies which have demonstrated a high
er ratio of males to females and with studies which have shown
a correlation of reading disability between male children and
their fathers. As Money (1962) stated, there is a sex differ
ence in children with dyslexia and although the ratios vary
from one study to another, it is generally accepted that the male incidence is at least twice that of the female. Other
estimates have been considerably higher.
Factor II in Table 13 is composed of several different
test variables, two reading measures (variable 12 and 16) and
two spelling measures (variables 11 and 23). The fifth important loading in this factor is a familial history variable
involving directional orientation on the part of the mother. One can understand the relation between Wide Range Achieve
ment Test-Spelling (variable 11) and the Auditory Intrasensory Integration Test (variable 23). The latter in effect is a
spelling test wherein the examiner spells a word and the child
integrates the separate letters into a whole word. (The name
of the test was selected prior to this study as it appeared to describe the process involved in its performance.) In Table
12 it is not significantly correlated with any of the auditory

245measures nor are any auditory measures present in Factor II,
except the Auditory Intrasensory variable. Of the two read
ing variables, one measures word attack skills (variable 12)
and the other measures comprehension in silent reading
(variable 16). The former is essentially a measure of skill in syllabication, particularly in regard to the more difficult
words where sight vocabulary is of little help. There appears
to be a relation between this function of reading (syllabica
tion) and spelling, especially with regard to the more diffi
cult words which a child has to ’’sound out” to himself before
being able to spell. This assumption is substantiated by the
significant correlation between syllabication (variable 12)
and spelling (variable 11), as shown in Table 12. Silent reading and lack of directional orientation for the mother
(the negative loading indicating the presence of a familial
history disability) do not on the surface seem to be meaningfully related to these other variables. Notwithstanding this,
one may say that Factor II is primarily a spelling factor in
volving various aspects of the spelling process.The importance of Factor II needs to be emphasized in
vievz of the fact that some, but not all, investigators have
indicated that a spelling disability is central to specific
dyslexia. As in the case of auditory functioning, neglect

246
of the spelling variable may have hampered our efforts in
constructing more adequate theories about dyslexia. For ex
ample, in Table 12, Wide Range Achievement Test-Spelling
(variable 11) was significantly (positively) correlated with
Handwriting, variable 17. For the most part, poor handwriting has been considered a manifestation of poor motor coordination
and such may be the case, even though none of the neurologi
cal variables involving hand coordination were significantly correlated with handwriting. A consideration of the inter
relation between spelling and handwriting may facilitate the
development of improved methods of language retraining in these
two areas. For example, a child who evidences early difficulties in writing letters and words may need to overlearn
visual and auditory recognition of letters and overlearn the
spelling of words in verbal recitation before attempting to
write words. The poor writing may reflect uncertainty in spelling, a process that precedes the recording of the word
on paper. Regardless of the line of reasoning one may pursue, the emphasis should be on a reconsideration of how a
disability in either spelling or handwriting may influence
one another in learning.
Factor III in Table 13 is finger localization and its
important Loadings are two measures on Benton’s (1955) Finger

247Localization Test. The purity of this factor is indicated by the few measures significantly correlated with it (see
variable 27 in Table 12). Variable 28 in this table, which
is the combined scores for single and double stimulation, is
correlated only with the single stimulation subtest. Factor
III, in reference to the experimental group, is considered
to be a finger agnosis factor.
Factor IV in Table 13 contains important loadings from
the neurological examination. All of these involve fine motor
coordination of the hands and fingers. This factor indicates
that generalized motor disability is not characteristic of the experimental group. (This is the only factor with neurologi
cal variables.) Factor IV, therefore, pertains to fine muscle coordination of the upper extremities.
Factor V in Table 13 is an auditory factor composed of
two subtests from the Seashore Measures of Musical Talent
(Seashore, et al., 1960)--Rhythm (variable 19) and Time variable 20)--and the WISC Digit Span subtest (variable 2),
a measure that has been previously described as an auditory
function. The loadings in this factor, and the significant
correlations with the Digit Span subtest, clearly establish
the Digit Span subtest as a measure of auditory function in
the children in the experimental group. Tonal Memory, which

248is significantly correlated with Digit Span in Table 12, is not a component of Factor V, Tonal Memory is an important
loading in Factor XIII. Factor V may involve a memory com
ponent and/or an auditory sequencing component, both of which
appear to be characteristic of Rhythm and Digit Span. These
two components are not an aspect of Time, an auditory dis
crimination judgment that compares the relative length of two auditory signals.
Factor VI in Table 13 contains two lateral dominance mea
sures and one delayed visual retention measure. The dominance
measures are Dominance-Foot (variable 25) and Incomplete Handedness (variable 26). These measures indicate that the
children in the experimental group are left footed and that either their left or right hand is incompletely dominant. On
the 10 measures of the Harris Test of Lateral Dominance the children did not use the same hand for all 10 activities per
taining to the use of their hands. One may imply a lack of
peripheral lateral dominance when considering these variables together. Why Factor VI is heavily loaded with a delayed
visual retention measure is not clear. (This variable mea
sures visual retention of geometric figures. The child is
shown the geometric figures and, after a 15 second delay

249during which time he does not see the figures, he reproduces the figures on paper.) Nevertheless, Factor VI is described
as incomplete peripheral dominance. This is not necessarily
the same as central (cortical) illateralization (Zangwill,
1964).
Factor VIt in Table 13 contains three unrelated test
measures* Picture Completion (variable 4); Auditory Intra- sensory Integration Test (variable 24); and Crawling (variable
32). The highest loading is Picture Completion and for this
reason Factor VII is viewed as reflecting the inherent
characteristics of this subtest as described by Wechsler
(1944):
Ostensibly it measures the individual’s basic perceptual and conceptual abilities insofar as these are involved in the visual recognition and identification of familiar objects and forms (p. 90).
The superiority of the experimental group on Picture
Completion is contraindication that visual agnosia is charac
teristic of specific dyslexia. There is no reason to assume
that superior visual perception for meaningful objects is in
herent in children with dyslexia. Rather, this finding suggests that the experimental group developed a compensatory
mechanism for poor reading ability.
250Factor VIII in Table 13 contains the measures of the
alphabet (variables 8, 9, and 10) and the measure of Motor
Coordination-Father (variable 37). The highest loading is
variable 10, Alphabet-Total (verbal and written scores com
bined). The meaning of Factor VIII depends upon the assump
tions one postulates about the process or processes involved
in reciting and writing the alphabet. A sequential memory
process is one aspect of reproducing the alphabet, whether it
be verbal-auditory or subvocal-graphic. The types of errors
made by the experimental group reflect a sequencing memory
disability. All of the written errors, with few exceptions,
were errors of incorrect sequential placement of the letters
or errors of omission. The few exceptions were rotational errors, such as found in a ”z” rotated 180 degrees. The com
bination of these types of errors indicates a deficiency in memory and sequencing ability. Most of the errors in verbal
recitation of the alphabet were omission errors.
Occasionally, reference has been made in the literature
to the relation of reading disability and/or specific dyslexia
to sequencing ability. For example, Kass (1963) found that her sample of children with a severe reading disability had
difficulty on the Visual-Motor Sequential subtest of the
Illinois Test of Psycholinguistic Abilities. This subtest

251measures the ability to reproduce from memory a series of
pictures of objects or geometric symbols presented visually.
Although this subtest is different from the reproduction of
the alphabet, the sequencing factor is similar. It is not
certain whether the recitation of the alphabet and the writing of it are dependent upon memory or sequencing or both. Addi
tional research is needed to clarify this question.
Factor IX in Table 13 is clearly an oral reading factor,
the loadings of which come from the Gilmore Oral Reading Test,
as follows: Accuracy (variable 14); Comprehension (variable
15); substitution errors/total number of words read (vari
able 41), and number of words read (variable 42). Oral read
ing tests generally measure three separate processes in
reading; namely, accuracy, comprehension, and rate. These
measures are employed in diagnosing cases of reading disability. Factor IX indicates that there is little difference between accuracy and comprehension, the implication being that
one measure is as useful as the other in determining a disability in oral reading. Reading rate is not included as an important loading in this factor nor is it included in any of
the other factors. Since it is not factorially similar to
accuracy and comprehension, it may be clinically useful in a
differential diagnosis of reading disability. If one loading

252in Factor IX were selected as a single measure of oral read
ing deficiency in the experimental group, it would be ac
curacy since it has the highest loading.
The Mazes subtest on the WISC is the only important load
ing in Factor X in Table 13. The problem of deciding whether
this subtest reflects a motor coordination ability or a cog
nitive perceptual-motor predictive ability is undecided since
there are no other important loadings in Factor X from which to draw additional information. The cognitive predictive
hypothesis may be elaborated as reflecting a visual motor
directional orientation (or spatial orientation) factor. In order to present jointly the apparently dissimilar hypotheses
of coordination and orientation, Factor X is described as a
visual motor coordination and planning ability in Table 16, the table listing the designations of the 14 factors.
Factor XI in Table 13 encompasses two dissimilar measures;
namely. Letter Recognition Test (variable 6) and Subjects*
Brothers with Specific Dyslexia (variable 40). Variable 6
is the higher of the two loadings and it is viewed as a ver
bal perceptual-cognitive measurement. Since this measure is
the higher of the two loadings, Factor XI is assumed to re
flect a verbal perceptual-cognitive function.

253Factor XII in Table 13 pertains to the familial history
of the mother; Reading (variable 34) and Overall Judgment of
a language disability (variable 39). As mentioned previously, certain experimental design problems may be associated with
the findings that the mothers present a history of language disability. No discussion, therefore, is made for Factor XII.
Factor XIII in Table 13 is the second factor concerning auditory variables (see discussion of Factor V). Factor XIII
involves Loudness (variable 18), Tonal Memory (variable 21),
and Auditory Blending (variable 22). The last is negatively
related to the other two variables, i.e., those who score
high on Loudness and Tonal Memory score low on Auditory blend
ing. The two positive loadings suggest that this is an audi
tory discrimination factor.
Factor XIV in Table 13 is primarily a verbal-cognitive, concept formation, or verbal mediation factor, since the three highest loadings are Verbal Scale IQ (variable 1), Vocabulary (variable 3) and total number of errors/total number of words
read (variable 43). The fourth important loading, Handwriting (variable 17), is negatively related to these variables. This
negative relation is due to the nature of the scoring system
for Handwriting; it demonstrates that good handwriting is
correlated with a high performance on the Verbal Scale IQ.

254Handwriting ability, therefore, may involve more than ability
in eye-hand coordination.The 14 factors and their important loadings, as indicated
in Table 14, are summarized in Table 16. A descriptive title is given to these factors. For the most part, importance was
given to the highest loading within each factor in deriving
these titles. This procedure admittedly is somewhat arbitrary
but it represents an approximation to the structure of each
factor.
Syndrome Patterns of Specific Dyslexia
The results of the hierarchical grouping analysis and
the analysis of variance answered the second question posed
in this study: What arethe subgroupings or clinical syndrome
patterns within the category of dyslexia? The analysis of
variance of 14 selected variables on which the three subgroups
of children within the experimental group were compared (the three subgroups were identified by the hierarchical grouping
analysis procedure) gives credence to a diagnostic considera
tion of types of dyslexia. In terms of this study, the chil
dren with dyslexia are measurably different from normal
readers, and they cluster into three syndrome patterns on vari
ables that distinguish them from the control group.

255Two major considerations are present in discussing the
results of the analysis of variance of the three subgroups.
The first consideration pertains to the likeness or homogene
ity of the three subgroups and the second consideration pertains to the difference or heterogeneity of these groups.
An understanding of the ways in which children with dys
lexia are alike is as important to the construction of theoreti
cal models as is an understanding of the ways in which they
are different. Discussion of this first consideration is in
reference to the nonsignificant groups F ratios in the analysis of variance (see Table 18). 1
The variables in Table 18 on which the three syndrome
patterns are similar (nonsignificant groups F ratios) are as follows: Digit Span (variable 2), Picture Completion (variable 3), Mazes (variable 4), Spelling (variable 7), and Loudness (variable 9). The factorial designation of these vari
ables as set forth in Table 16, are as follows: auditory
memory, visual perception of pictorial details, visuorootor coordination and planning, spelling, and auditory discrimina
tion. These factorial designations indicate that the children
in the experimental group are similar in the following ways:
They are deficient in auditory memory, auditory discrimination,
and spelling. They perform poorly on tasks requiring visual

256
motor coordination and/or cognitive planning of what-leads- to-what. Lastly, they are superior in visual perception of
pictorial details. These factors or processes, therefore,
do not significantly differentiate the three syndrome pat
terns of specific dyslexia.
The second consideration pertains to the ways in which
the children in the experimental group differ. Some leniency
is taken at this point, as all variables whose F ratios ten
ded toward significance (.06 to the .10 level) are included
with the significant variables (.05 level and less). The
significant £ ratios in the analysis of variance in Table 18
are as follows: Verbal Scale IQ (variable 1), Letter Recog-
notion (variable 5), Alphabet-Totai (variable 6), Gilmore
Oral Reading-Accuracy (variable 8), Foot Dominance (variable 10), Benton’s Finger Localization Test (variable 11), Approx
imation and Abduction (variable 12), Overall Judgment-Father (variable 13, and Reading-Mother (variable 14). The factor
ial designation of these measures as set forth in Table 16,
are as follows: verbal mediation, letter recognition, repro
duction of alphabet, oral reading, incomplete peripheral dom
inance, finger agnosia, finger-hand dyspraxia, familial his
tory of language disability-father, and familial history of
reading disability-mother.

257
The statistical discovery of three types of dyslexia is
in keeping with a statement by Money (1962). He stated that
the diagnosis of specific dyslexia depended upon the clinical appraisal of the configuration of symptoms and test measure
ments, and not on a single telltale sign or signs. A statisti
cal consideration of types of dyslexia facilitates the clinical
configurational approach. It enables the clinician to be
more systematic in ordering his observations of the test data.A configural evaluation of dyslexia associated with the
experimental group is seen in Figure 1, page 202. In Figure 2,
page 203, only significant variables are used m the pro
files for the three dyslexic groups. One of the more interest
ing findings pertains to Verbal Scale IQ (variable 1) in Figure
1. Group A is significantly lower than Group C on this vari
able. There is a 14 point difference between the mean Verbal Scale IQ of these two groups (Group A = 99.37 and Group C = 113.71). Although low ability in verbal mediation is fre
quently assumed to be related to dyslexia, this finding sug
gests that this assumption is applicable to only a certain
proportion of children with dyslexia as the mean Verbal Scale
IQ of Group C indicates adequate verbal mediation ability.
The nonsignificant correlation between verbal ability
and oral reading proficiency previously discussed is further

258illustrated in Figure 1. Group At which is low in verbal
ability, is high in oral reading accuracy (variable 8). Group
C, which is high in verbal ability, is low in oral reading
accuracy.It is difficult to organize the various variables in Fig
ure 2 into meaningful patterns for the three dyslexic groups.
The diversity of these measures and the lack of a comprehensive
theory of specific dyslexia necessitates the postponement at
this time of an adequate conceptualization of the three groups.
An empirical description of these patterns, as presented in
Chapter IV, is preferable to speculation.
Generalizations to the population of children with dys
lexia from the data concerning the differences between the
experimental group and the control group is tenably warranted. Generalizations as to subtypes of dyslexia, however, should be
made with caution. Additional research is needed, particularly studies of replication, to substantiate the hypothesis of categories of dyslexia. One may state, however, that this
study does give some credence to the assumption that children
with dyslexia constitute a heterogeneous group on some vari
ables and a homogeneous group on other variables.
Problems associated with generalizations from this study
to the population of dyslexic readers do not preclude the

259possibility of utilizing the findings as diagnostic guidelines. The following considerations are offered. Dyslexia
is not primarily associated with low intelligence, brain damage,
cultural deprivation, disruptive or irregular school atten
dance, substandard educational instruction, poor motivation,
and emotional problems of a primary nature. If problems asso
ciated with school attendance and quality of educational in
struction are present, then careful consideration and weight
must be given to these factors and their influence on abilities that directly reflect educational training--reading, spelling, handwriting, and arithmetic computation. This is also true
of cultural deprivation; a child may have dyslexia but the
diagnostic picture becomes somewhat obscured by the influence of this variable.
The clinical evaluation of an individual suspected of
dyslexia should reflect the following characteristics- low
Digit Span on the WISC; Picture Completion on the WISC at or
above the mean of the Performance Scale IQ; low score on the
Mazes subtest of the WISC; poor quality in handwriting, and
reading and spelling level one or more years below peers of
comparable intellectual ability and educational experience.
Furthermore, substandard performance should be manifested in
auditory discrimination, particularly the Loudness subtest
on the Seashore Test and auditory blending.

260
A deficiency in oral reading accuracy in a dyslexic in
dividual should be present but reference only to grade level norms can be misleading when evaluating this function. For
example, a child with superior intelligence may perform slightly below grade level, at grade level or slightly above grade
level. Reference to Table 21 illustrates this. The mean grade
level for the experimental group is 4.31 whereas the mean grade
for reading is 3.7. This difference of approximately 5 months is not great enough to indicate a disability in reading, hhen
the experimental group is matched with a peer group of com
parable intelligence, the deficit in reading ability is more
nronounced. The experimental group is one year and nine
months below the control group, a difference that is signifi
cant.
The problem of determining the presence or absence of
dyslexia in reference to grade level norms for bright individuals applies equally well when consideration is given to the
children. In Table 21, it is seen that the experimental group
spelled at grade level, the conclusion being that there is no
deficiency or disability in spelling. However, when the ex
perimental group is compared with a matched group, a signifi
cant differonce is noted. The experimental group is two years
and eight months below the spelling level of the control group.

2 61TABLE 21
Comparison of Reading and Spelling Levels for the Experimental and Control Groups
GroupMean Grade
LevelMean Reading
Level (accuracy)Mean Spelling Level
Experimental 4.31 3.7 4.0*Control 4.28 5.6 6.8**
* P = .00005** P = .00005

262In summary, this study indicates that certain guide
lines may be established in diagnosing children with dyslexia
in reference to age and intellectual norms. This does not
apply necessarily to grade level norms of reading and spelling
since the level of performance in these skills is influenced by intelligence.
Implications for Research
Specific dyslexia is a complex phenomenon. Clinical-
observational studies have advanced our knowledge sufficnently
so that it is now possible to conduct meaningful experimental
research. Several areas of research are suggested below.
A. replication of this study involving the significant variables is needed to clarify problems of reliability and
validity. The replication should utilize similar selection
criterion variables. A sample of children with different in
tellectual abilities and at a different grade level may pro
duce different results. The finding that children with specific
dyslexia can be classified into subcategories needs additional
consideration, particularly in reference to homogeneous and
heterogeneous variables as previously discussed.
Apart from the specific findings in this study, there are other areas of research that should be considered. For

263example, lognitudinal studies of multiple variables could con
tribute immeasurably to our knowledge about developmental or
maturations 1 factors associated with specific dyslexia and
other forms of reading problems. Benton and Bird (1963) par
ticularly stressed the value of this type of research.Somewhat related to longitudinal research is the need for
more predictive knowledge about specific dyslexia. This en
tails identification of variables in kindergarten and first
grade children that would predict reading and related disabili
ties at a later time in the educational experience of the child.
This knowledge could assist the educator in planning a reading
program for those suspected of a potential reading problem.
Much frustration and anguish could be removed for the child,
his parents, and his teachers if early detection could be
realized, to say nothing of the expenditure of time, effort,
and money.Most research has focused on children with reading dis
abilities. Research on the adult poor reader is a neglected
area in the several professions interested in reading. An
adequate diagnostic battery of tests for the adult with specific dyslexia has not as yet been reported in the literature.
Moreover, matched group studies of good and poor adult readers
would add considerably to our theoretical knowledge about

264reading problems. This information could assist the diagnos
tician and educator in planning appropriate methods of re
education. Although many speed reading courses are currently
available* no research has been reported that demonstrates
the efficacy of this type of instruction for the adult with specific dyslexia.
Finally, a consideration of reconstructive language train
ing for children with specific dyslexia is offered. Diagnosing
specific dyslexia and identifying relevant variables are only
the first steps. Most of the dyslexic research is etiological
and diagnostic in nature, a fact that probably reflects the interests of the investigators. Those who study the underlying
problems of dyslexia are primarily interested in theory, re
search, and diagnosis. For example, of the 13 contributors
in Money’s (1962) book, only one had been trained in language therapy for children with specific dyslexia. It is suggested
that some institution or agency with adequate resources in money, equipment, diagnosticians, reading therapists, and a
clinic population from which to draw, might initiate a comprehensive, long term study of reading therapy for children
with specific dyslexia. For example, the Orton-Gillingham
(Gillingham & Stillman, 1956) alphabetic-phonetic system of
language retraining is a logical one to study since it has

265been especially developed for children with specific dyslexia.
It has been clinically tested and proven successful for some
30 years in various parts of the country. Recurrent in these
studies is the indication that a highly structured, multi-
sensory, and sequential training program in sound-symbol association is necessary and vital. In comparing various methods
of reading therapy related to the development of sound-symbol
association--the lack of which is probably the most basic deficit in the dyslexic reader--Bateman (1965) wrote that the Orton-GiHingham program:
is the most thoroughly multi-sensory in that every practical combination of mode of stimulus and response is employed to better insure an enduring association being built. The importance of this enduring storage cannot be overemphasized . . . (pp. 6-7).
A consideration of the Orton-Gillingham approach to
language retraining in the context of a theoretical model of
psycholinguistic functioning could advance our knowledge about
the processes involved in dyslexia, as well as producing insights on specific aspects of retraining. For example, Bateman (1965) stated that the Orton-Gillingham system covers
almost the entire psycholinguistic model developed by Osgood (1957a, 1957b) and its extension by McCarthy and Kirk (1961).

266Comprehensive research in investigating this relation between the Osgood model and the Orton-Gillingham approach
to language training may study the conditions under which
changes occur in basic organismic psychological (memory,
perception, cognition) and psychoneurological (perceptual-
motor integration, right-left discrimination, directional
orientation, body schema) processes. Knowledge on how to produce corrective changes in psychological and psychoneuro
logical processes should lead to more refined and definitive
educational methods of language retraining, as well as con
tributing general knowledge to psychology and neurology.

CHAPTER VISUMMARY AND CONCIJJSTONS
Summary
Specific dyslexia is considered to be an inborn neuropsychological learning disability revealed primarily by poor
performance in reading, spelling, and handwriting. Frequently
poor auditory discrimination is implicated. It is specific
in that it is not a manifestation of aphasia or visual agnosia. Etiological or antecedent factors assumed not to
be related to specific dyslexia are low intelligence, mini
mal brain damage, cultural deprivation, poor or insufficient
academic instruction, poor motivation, and primary emotional
disturbances.
This study investigated three major areas related to
specific dyslexia: (a) the quantitative ways in which chil
dren with specific dyslexia differ from normal readers: (b)
the statistical characteristics of children with specific
dyslexia; and (c) the subpatterns or clinical syndromes with
in the category of specific dyslexia. After reviewing the
literature, 197 variables or measurement operations were
selected for evaluation.

268Thirty-two children previously diagnosed with specific
dyslexia were matched with a control group of 23 normal
readers. Selection variables, 10 in all, were statistically
held constant with the exception of reading and spelling.
The experimental group was one or more years below grade level
in reading and spelling. The control group was at or above
grade level in reading and spelling. Only children with IQ
scores of 90 or above were included in the two groups. (The
mean IQ for the experimental group is 112.5 and that of the
control group is 113.9.)
Five methods of statistical analysis were used to answer
the three problems posed in this study. Simple analysis of
variance identified the variables that distinguished the ex
perimental group from the control group. Data from the ex
perimental group on significant variables differentiating
the two groups were subjected to intercorrelation and factor
analysis. Hierarchical grouping analysis categorized the
children in the experimental group into three subgroups.
These were compared on 14 variables by the analysis of variance method.
Conclusions
The results of this study indicated that the experimen
tal group differed from the control group on 43 significant

269variables in the following areas: intellectual; educational
(reading, spelling, handwriting, reproduction of the alpha
bet, etc.); visual perception of pictorial details, letter
recognition; auditory memory and discrimination; peripheral
lateral dominance; fine muscle coordination; finger localization; and familial history of language disability in both
parents and brothers of the children in the experimental group.
The experimental group was further characterized by three subgroups or syndrome patterns on 14 variables, seven of which
were significant.
Recommendations
Several areas for research were suggested as follows:
replication of the present study; longitudinal research with
multiple variables; investigation of predictive variables of reading disability; diagnostic consideration of adults with
reading disability; and research on present methods of reading retraining, particularly the Orton-Gillingham system of
language retraining.

REFERENCES

271
REFERENCES
Artley, A. S. A study of certain factors presumed to be associated with reading and speech difficulties. Journal of Speech and Hearing Disorders. 1948, 13, 351-360.
Bakwin, H., & Bakwm, R. Clinical management of behavior disorders m children. (2nd ed.) Philadelphia: W. B. Saunders, 1960.
Bateman, B. Learning disabilities--yesterday, today and tomorrow. Exceptional Children. 1964, 31, 167-177. (a)
Bateman, B. The ITPA in current research: Summaries of studies. Urbana: University of Illinois, 1964. (b)
Bateman, B. An overview of specific language disabilities. Bulletin of the Orton Society. 1965, rs, 1-11.
Becker, W. C. Summary of the conference. In S. A. Kirk & W. Becker (Eds.), Conference on children with minimal brain impairment. Urbana: University of Illinois, 1963. Pp. 116- 131.
Belmont, L. & Birch, H. G. Lateral dominance and right-left awareness in normal children. Child Development. 1963, 34, 257-270.
Bender, L. A visual-motor Gestalt test and its clinical use. New York: American Orthopsychiatric Association, 1938, No. 3.
Bender, L. Specific reading disability as a maturational lag. Bulletin of the Or ton Society. 1957, 9-18.
Bender, L. Specific reading disability as a maturational lag: Problems m conceptualization and communication m children with developmental alexia. Bulletin of the Orton Society. 1963, 13, 25-44.
Bender, L., & Schilder, P. Graphic art as a special ability in children with a reading disability. Journal of Clinical and Experimental Psychopathology. 1951, 12, 147-156.

272
Bennett, C. C. An inquiry into the genesis of poor reading. Teachers College Contribution to Education. 1938, No. 755.
Benton, A. L. The revised visual retention test—clinical and experimental applications. New York: The Psychological Corporation, 1955.
Benton, A. L. Finger localization and finger praxis. Quarterly Journal of Experimental Psychology. 1959, 11. 39-44. (a).
Benton, A. L. Right-left discrimination and finger localization. New York: Paul B. Koeber, Inc., 1959. (b)
Benton, A. L. Behavioral indices of brain injury in school children. Child Development. 1962, 33, 199-208. (a)
Benton, A. L. Dyslexia m relation to form perception and directional sense. In J. Money (Ed.), Reading disability: Progress and research needs in dyslexia. Baltimore: The Johns Hopkins Press, 1962. Pp. 81-102. (b)
Benton, A. L. Developmental aphasia and brain damage. In S. A. Kirk & W. Becker (Eds.), Conference on children with minimal brain impairment. Urbana: University of Illinois, 1963. Pp. 71-89.
Benton, A. L. Personal communication. 1964.
Benton, A. L., & Bird, J. W. The EEG and reading disability. American Journal of Orthopsychiatry, 1963, 33, 529-531.
Benton, A. L., & Kemble, J. D. Right-left orientation and reading disability. Psychiatry and Neurology. 1960, 139, 49-60.
Benton, A. L., & Menefee, F. L. Handedness and right-left discrimination. ChiId Development, 1957, 28, 237-242.
Betts, E. A. Foundation of reading instruction. New York: American Book, 1946.
Birch, H. G. Dyslexia and the maturation of visual functions. In J. Money (Ed.), Reading disability: Progress and research needs in dyslexia. Baltimore: The Johns Hopkins Press, 1962. Pp. 161-169.

273
Birch, H. G. Personal communication, 1964, (a)
Birch, H, G. The probl on of ’’brain damage” in children. In H. G. Birch (Ed.), Brain damage in children: The biological and social aspects. New York: The Williams & Wilkins Company, 1964. Pp. 3-12. (b)
Birch, H. G., & Belmont, L. Auditory-visual integration m normal and retarded readers. American Journal of Orthopsychiatry, 1964, 34, 852-861.
Birch, H. G., & Belmont, L. Auditory-visual integration, intelligence and reading ability in school children. Perceptual and Motor Skills, 1965, 20, 295-305.
Birch, H. G., & Lefford, A. Intersensory development in children. Monographs of the Society for Research in Child Development, 1963, 28(5), 3-48.
Blanchard, P. Psychoanalytic contributions to the problems of reading disability. Psychoanalytic Study of the Child, 1946, 2, 163-188.
Blau, A. The master hand. American Orthopsychiatric Association, 1946, No. 5.
Bond, G. L. The auditory and speech characteristics of poor readers. Teachers College Contribution to Education, 1935, No. 652.
Boshes, B. & Myklebust, H. R. A neurological and behavioral study of children with learning disorders. Neurology, 1964, 14, 7-12.
Bronner, A. F. The psychology of special abilities and disabilities. Boston: Little, Brown and Company, 1917.
Bryant, N. D. Characteristics of dyslexia and their remedial implication. Exceptional Children, 1964, 31, 195-199.
Bryant, N. D., & Patterson, P. R. Reading disability: Part of a syndrome of neurological dysfunction. Paper presented at the meeting of the International Reading Association, San Francisco, May, 1962.

274
Bryant, N. D., Mirling, B., & Patterson, P. R. Impaired motor development as a characteristic of reading disability. Albany: Authors, 1964.
Buros, 0. K. (Ed.) The fourth mental measurements yearbook. Highland Park, N. J.: The Gryphon Press, 1953.
Buros, 0. K. (Ed.) The fifth mental measurements yearbook. Highland Park, N. J.: The Gryphon Press, 1959.
Burt, C. L. The backward child. London: The toilversity of London Press, 1937.
Childs, B. Personal communication. 1965.
Clements, S. D., & Peters, J. E. Minimal brain dysfunction in the school-age child. Archives of General Psychiatry, 1962, 6, 185-197.
Clemmens, R. L. Minimal brain damage in children, an interdisciplinary problem: Medical, paramedical and educational. Children: An Interdisciplinary Journal for the Professions Serving Children, 1961, 8, 179-183.
Cohn, R. Delayed acquisition of reading and writing abilities in children: A neurological study. Archives of Neurology, 1961, 4, 153-164.
Cohn R. The neurological study of children with learning disabilities. Exceptional Children. 1964, 31, 179-185.
Cole, E. M. Specific reading disability. A problem in integration and adaption. American Journal of Ophthalmology, 1951, 34, 226-232.
Cole, E. M., & Walker, L. Reading and speech problems as expressions of a specific language disability. In D. Mck. Rioch & E. A. Weinstein (Eds.), Disorders of communication. Vol. 42. Baltimore: Williams & Williams Company, 1964. Pp. 171-189.
Conant, J. B. American high school today. New York: McGraw Hill, 1959.

275Cronin, E. M. Reading disorders and remediation. In R. M. Flower, H. F. Gorman, & L. I. Lawson (Eds.), Reading disorders. Philadelphia: F. A. Davis Company, 1965. Pp. 103-112.
Critchley, M. Inborn reading disorders of central origin. Transactions of the Ophthalmological Society, 1961, 91, 459-480.
Critchley, M. Developmental dyslexia. London: William Heinemann Medical Books Limited, 1964.
de Hirsch, K. Specific dyslexia or strephosymbolia. Folia Phoniatrica. 1952, 4, 231-248.
de Hirsch, K. Studies in tachyphenia: IV. Diagnosis of developmental language disorders. Logos. 1961, 4, 3-9.
de Hirsch, K. Concepts related to reading processes and their application to reading pathology. Journal of Genetic Psychology, 1963, 102, 277-285. (a)
de Hirsch, K. Psychological correlates of the reading process. Bulletin of the Orton Society, 1963, 13, 59-71. (b)
de Hirsch, K. Two categories of learning difficulty m adolescence. American Journal of Orthopsychiatry, 1963, 33. 87-91. (c)
de Hirsch, K. Prediction of reading competence at end of second grade from oral language tests administered at kindergarten level. Paper presented at the meeting of the American Speech and Hearing Association, San Francisco, November, 1964.
Dozier, P. Specific reading disability—a survey. Bulletin of the Orton Society, 1963, jL3, 19-24.
Drew, A. L. A neurological appraisal of familial congenital word-blindness. Brain. 1956, 79> 440-460.
Drew, A. L. Personal communication. 1964.
Dunn, L. M. Manual for the Peabody picture vocabulary test. Minneapolis: American Guidance Service, Inc., 1959.

276
Durrell, D. D. Improvement of basic reading abilities.Yonkers, N. Y.: World Book Company, 1940.
Eames, T. H. The relationship of birth weight, the speeds of object and word perception and visual acuity. Journal of Pediatrics, 1955, 47, 603-606.
Eisenberg, L. Introduction. In J. Money (Ed.), Reading disability: Progress and research needs in dyslexia. Baltimore: The Johns Hopkins Press, 1962. Pp. 3-7.
Ettlmger, G., & Jackson, C. V. Organic factors m developmental dyslexia. Proceedings of the Royal Society of Medicine, 1955, 48, 998-1000. Cited by 0. L. Zangwill, Dyslexia m relation to cerebral dominance. In J. Money (Ed.), Reading disability: Progress and research needs in dyslexia. Baltimore: The Johns Hopkins Press, 1962. P. 112.
Eustis, R. S. The primary etiology of the specific language disability. Journal of Pediatrics. 1947, 31, 448-455.
Everhart, R. W. The relationship between articulation and other developmental factors m children. Journal of Speech and Hearing Disorders, 1953, 18, 332-338.
Fabin, A. A. Clinical and experimental studies of school children who are retarded in reading. Quarterly Journal of Child Behavior. 1951, 3, 15-37.
Faigel, H. C. Language disability. American Journal of Diseases m Childhood, 1965, 110, 258-264.
Fields, L. G. A psychological inquiry into the nature of the condition known as congenital word-blindness. Brain, 1921, 44, 286-307.
Franklin, A. W. (Ed.) Word-blindness or specific developmental dyslexia. London: Pitman Medical Publishing Co., Ltd., 1962.
Fuller, G. B. Perceptual considerations in children with a reading disability. Psychology in the Schools, 1964, 1^, 314-317.
Fuller, G. B., & Laird, J. T, Comments and findings about rotations. Perceptual and Motor Skills. 1963, 16, 673-379. (a)
277
Fuller, G. B., & Laird, J. T. The Minnesota percepto- diagnostic test. Journal of Clinical Psychology, 1963, No. 16. (b)
Galifret-Granjon, N., & Ajuriaguerra, J. de. Trouble de 1’apprentissage de la lecture et dominance laterale. Encephale, 1951, 3^, 385-398. Cited by 0. L. Zangwill, Dyslexia in relation to cerebral dominance. In J. Money (Ed.), Reading disability: Progress and research needs in dyslexia. Baltimore: The Johns Hopkins Press, 1962. p. 110.
Gallagher, J. R. Specific language disability: A cause of scholastic failure. New England Journal of Medicine. 1950, 242, 436-440.
Gallagher, J. R. Specific language disability (dyslexia). Clinical Proceedings of the Children *s Hospital, 1960, 16, 3-15.
Gallagher, J. R. Poor readers and the ophthalomogist. International Ophthalmological Clinics, 1962, 2, 905-919.
Gallagher, J. R. & Locke, W. M. Forward. In K. Hermann (author^ Reading disability: A medical study of wordblindness and related handicaps. Springfield, Ill.: Charles C. Thomas Publisher, 1959.
Gann, E. Reading difficulty and personality organization. New York: Kings Crown Press, Columbia University, 1945.
Gates, A. I. The psychology of reading and spelling with special reference to disability. Teachers College Contribution to Education. 1922, No. 129.
Gates, A. I. The role of personality maladjustment in reading disability. Journal of Genetic Psychology. 1941, 59. 77-83.
Gates, A. J., & McKillop, A. S. Gates-McKillop reading diagnostic tests. New York: Bureau of Publications. Teachers College, Columbia University, 1962.
Gerstmann, J. Syndrome of finger agnosia, disorientation for right and left, agraphia and acalculia. Archives of Neurology and Psychiatry. 1940, 44, 398-408.

2.1%
Geschwind, N. The anatomy of acquired disorders of reading. In J. Money (Ed.), Reading disability: Progress and research needs. Baltimore: The Johns Hopkins Press, 1962. Pp. 115-124.
Gillingham, A., & Stillman, B. W. Remedial training for children with specific disability in reading, spelling and penmanship. Cambridge: Educators Publishing Service, Inc., 1956.
Gilmore, J. V. Gilmore oral reading test: Manual of directions. New York: Harcourt, Brace & World, 1952.
Goetzinger, C. P., Dirks, D. D., & Baer, C. J. Auditory discrimination and visual perception in good and poor readers. Annals of Otology. Rhmology and Laryngology, 1960, 69, 121-136.
Goody, W., & Reinhold, M. Congenital dyslexia and asymmetry of cerebral function. Brain. 1961, 84, 231-242.
Hall, M. E. Auditory factors in functional articulatory speech defects. Journal of Experimental Psychology, 1938, 7, 110-132.
Hallgren, B. Specific dyslexia ("congenital word-blindness"): A clinical and genetic study. Acta Psychiatrica et Neurologica Scandinavica, 1950, No. 65.
Hardy, G. H. Dyslexia in relation to diagnostic methodology in hearing and speech disorders. In J. Money (Ed.), Reading disability: Progress and research needs in dyslexia.Baltimore: The Johns Hopkins Press, 1962. Pp. 171-177.
Harris, A. J. Lateral dominance, directional confusion and reading disability. Journal of Psychology. 1957, 44, 283-294.
Harris, A. J. Harris tests of lateral dominance: Manual of directions for administration and interpretation. (3rd ed.) New York: The Psychological Corporation, 1958.
Herman, K. Reading disability: A medical study of word- blindness and related handicaps. Springfield, Ill.: Charles C. Thomas, Publisher, 1959.

279
Hermann, K., & Norrie, E. Is congenital word-blindness a hereditary type of Gerstmann’s syndrome? Monatscchrif t fur Psychiatric und Neurologie, 1958, 136, 59-73. Cited by H. F. Prechtl’, Dyslexia as a neurological problem in children. In J. Money (Ed.), Reading disability: Progress and research needs in dyslexia. Baltimore: The Johns Hopkins Press, 1962. P. 192.
Hester, K. B. A study of phonetic difficulties m reading. Elementary School Journal. 1942, 43, 171-173.
Hildreth, G. Speech defects and reading disability. Elementary School Journal, 1946, 46, 326-332.
Hincks, E. M. Disability in reading in relation to personal- lty» Harvard Monographs in Education, 1926, 2^(2), Cambridge: Cambridge University Press.Hinshelwood, J. Word-blindness and visual menory. Lancet. 1895, 2, 1564-1570.
Hollingshead, A. B., & Redlich, F. C. Social class and mental illness: A community study. New York: John Wiley and Sons, Inc., 1958.
Ingram, T. T. S. Specific developmental disorders of speech in children. Brain. 1959, 82^, 450-467.
Ingram, T. T. S. Paediatric aspects of specific developmental dysphasis, dyslexia and dysgraphia. Cerebral Palsy Bulletin, 1960, 2, 254-277.
Ingram, T. S., & Reid, J. F. Developmental aphasia observed in a department of child psychiatry. Archives of Disorders m Childhood. 1956, 31, 161-172.
Jackson, J. A survey of psychological, social, and enviro- mental differences between advanced and retarded readers. Journal of Genetic Psychology. 1944, 65, 113-131.
Jastak, J. Wide range achievement test: Manual, Wilmington, Del.: C. L. Story Co., 1946.
Jastak, J., & Bijau, S. Wide range achievement test. New York: The Psychological Corporation, 1946.

280
Jensen, M. B. Reading deficiency as related to cerebral injury and to neurotic behavior. Journal of Applied Psychology. 1943, 27, 535-545.
Johnson, M. S. A study of diagnostic and remedial procedures m a reading clinic laboratory school. Journal of Educational Research, 1955, 48. 565-578.
Jones, M. V. The effect of speech training on silent reading achievement. Journal of Speech and Hearing Disorders. 1951, 16. 258-263.
Jordan, E. P. Articulation test measures and listener ratings of articulation defectiveness. Journal of Speech and Hearing Research. 1960, 3, 303-319.
Kass, C. E. Some psychological correlates of severe reading disability (dyslexia). Unpublished doctoral dissertation. University of Illinois, 1962.
Kass, C. E. Some psychological correlates of severe reading disability (dyslexia). In D. J. Sievers, J. J. McCarthy, J. L. Olson, B. D. Bateman, & C. E. Kass (Eds.), Selected studies on the Illinois test of psycholinguistic abilities. Madison, Wis.: Photo Press, Inc., 1963. Pp.87-96.
Kawi, A. A., & Pasamanick, B. Association of factors of pregnancy with reading disorders in childhood. Journal of the American Medical Association. 1958, 166, 1420-1423.
Kawi, A. A., & Pasamanick, B. Prenatal and paranatal factors in the development of childhood reading disorders. Monographs of the Society of Research m Child Development, 1959, 24, No. 4.
Ketchum, E. G. Reading disorders. In We E. Nelson (Ed.), Textbook of Pediatrics. (6th ed.) Philadelphia! W. B. Saunders, 1954, Pp. 1144-1147.
Kirk, S. A. A behavioral approach to learning disabilities.In S. A. Kirk & W. Becker (Eds.), Confereix:e on chiIdren with minimal brain impairment. Urbana: The University of Illinois Press, 1963. Pp. 40-52.

281
Kirk, S. A., & Bateman, B. Diagnosis and remediation of learning disabilities. Exceptional Children, 1962, 29, 73-78.
Krise, E. M. An experimental investigation of theories of reversals m reading. Journal of Educational Psychology, 1952, 43, 408-422.
Lichtenstein, A. An investigation of reading retardation. Journal of Genetic Psychology, 1938, 52, 407-423.
Lindquist, E. A., 8e Hieronymus, A. N. Iowa tests of basic skills. Boston: Houghton Mifflin Company, 1964.
Macmeeken, A. M. Ocular dominance in relation to developmental aphasis. London: University of London Press, 1939.
Malmquist, R. Factors related to reading disabilities m the first grade of the elementary school. Stockholm Studies on Educational Psychology. Vol. 2. Stockholm: Almquist and Wilksell, 1960.
McCarthy, J. J., & Kirk, S. A. Illinois test of psycholinguistic abilities. (Experimental ed.) Urbana: University of Illinois Press, 1961.
McCarthy, J. J., & Kirk, S. A. The construction, standardization and statistical characteristics of the Illinois test of psycholinguistic abilities. Urbana: University of Illinois Press, 1963.
Meyer, G. Some relationships between Rorschach scores m kindergarten and reading in the primary grades. Journal of Projective Techniques, 1953, 17^, 414-425.
Miles, W. R. The A-B-C vision test for ocular dominance. New York: The Psychological Corporation, 1946.
Money, J. Dyslexia: A postconference review. In J. Money (Ed.), Reading disability: Progress and research needs in dyslexia. Baltimore: The Johns Hopkins Press, 1962.Pp. 9-33.
Monroe, M. Children who cannot read. Chicago: University of Chicago Press, 1932.

282
Moore, C. E. A. Reading and arithmetic abilities associated with speech defects. Journal of Speech Disorders. 1947, 12. 85-86.
Morrison, J. C., & McCall, W. A. Morrison-McCall spelling test. New York: Harcourt, Brace & World Inc., 1923.
Moss, M. A. The effect of speech defects on second-grade reading achievement. Quarterly Journal of Speech. 1938, 24. 642-654.
Myklebust, H. R. Some psychological consideration of the RH child. Journal of Speech and Hearing Disabilities, 1956, 21. 423-425. Cited by A. L. Benton, Developmental aphasia and brain damage. In S. A. Kirk & W. Becker (Eds.), Conference on children with minimal brain impairment. Urbana: University of Illinois Press, 1963. Pp. 71-89.
Myklebust, H. R. Psychoneurological learning disorders m children. In S. A. Kirk & W. Becker (Eds.), Conference on children with minimal brain impairment. Urbana: The University of Illinois Press, 1963. Pp. 26-36.
Myklebust, H. R., & Johnson, D. Dyslexia in children. Exceptional Children. 1962 , 2^, 14-25.
Naidoo, S. An investigation into some aspects of ambiguous handedness. Unpublished masters thesis, University of London, 1961. Cited by O. L. Zangwill, Dyslexia in relation to cerebral dominance. In J. Money (Ed.), Reading disability: Progress and research needs in dyslexia. Baltimore: The Johns Hopkins Press. P. 112.
Newbrough, J. R., & Kelly, J. G. A study of reading achievement in a population of school children. In J. Money (Ed.) Reading disability: Progress and research needs in dyslexia. Baltimore: The Johns Hopkins Press, 1962. Pp. 61-72.
Olson, W. C. Reading as a function of the total growth of the child. In W. S. Gray (Ed.), Reading and pupil development. Chicago: University of Chicago, 1940.
Orton, J. L. The Orton story. Bulletin of the Orton Society, 1957, 7, 5-8.

283
Orton, S, T. Word-blindness* in school-children. Archives of Neurology and Psychiatry, 1925, 14, 581-615.
Orton, S. T. Reading disability. Genetic Psychology Monographs , 1926, 14, 335-453.
Orton, S. T. Specific reading disability--strephosymbolia. Journal of the American Medical Association, 1928, 90, 1095-1099.
Orton, S. T. Reading, writing and speech problems in children. New York: W. W. Norton & Co., 1937.
Orton, S. T. "Word-blindness** in school children and other papers on strephosymbolia (specific language disability- dyslexia) , 1925-1946. Pomfret, Conn.: The Orton Society, Inc., 1966.
Osgood, C. A behavioristic analysis of perception and language as cognitive phenomena. In H. E. Grubber, K. R. Hamond, & R. Jessor (Eds.), Contemporary approaches to cognition. Cambridge: Harvard University Press, 1957. (a)
Osgood, C. E. Contemporary approaches to cognition.Cambridge: Harvard University Press, 1957. (b^
Osgood, C. E., & Miron, M. S. (Eds.) Approaches to the study of aphasia. Urbana: University of Illinois Press, 1963.
Pearson, G. J. A survey of learning difficulties in children. Psychoanalytic Study of the Child, 1952, 7^, 322-392.
Piaget, J. Judgment and reasoning in the child. London: Routledge and Kegan Paul, 1928.
Poling, D. L. Auditory deficiencies of poor readers. Supplementary Educational Monographs.Prechtl, H. F. Reading difficulties as a neurological problem in childhood. In J. Money (Ed.), Reading disability: Progress and research needs in dyslexia. Baltimore: The Johns Hopkins Press, 1962. Pp. 187-193.
Prechtl, H. F., & Stemmer, J. C. The choreiform syndrome in children. Developmental Medicine and Child Neurology, 1962, 4, 119-127.

284
Preston, M. T. Reading failure and the child’s security. American Journal of Orthopsychiatry, 1940, 10, 239-252.
Rabinovitch, R. D. Reading and learning disabilities. In b. Arieti (Ed.), American handbook of psychiatry. Vol. 1. New York: Basic Books, Inc«, 1959. Pp. 857-869.
Rabinovitch, R. D. Dyslexia: Psychiatric considerations.In J. Money (Ed.), Reading disability: Progress and research needs m dyslexia. Baltimore: The Johns Hopkins Press, 1962. Pp. 73-79.
Rabinovitch, R. 0., Drew, A. L., De Jong, R. N. Ingram, W., & Withey, L. A research approach to reading retardation. In B. McIntosh & C. C. Hare (Eds.), Neurology and psychiatry m childhood. Vol. 34. Baltimore: The Williams & Wilkins Company, 1954. Pp. 363-396.
Rabinovitch, R. D., & Ingram, W. Neuropsychiatric considerations m reading retardation. Reading Teacher, 1962, 15, 433-438.
Raven, J. C. Coloured progressive matrices. (Rev, order). London: H. K. Lewis & Co., 1956.
Raven, J. C. Guide to using the coloured progressive matrices (Revised order, 1956). Dunfnes: The Crichton Royal, 1963.
Raymond, D. M. The performance of reading achievers on memory span and associative learning tests. Journal of Educational Research, 1955, 48, 455-465.
Reed, H. B. C. Some relationships between neurological dysfunction and behavioral deficits in children. In S. A.Kirk & W. Becker (Eds.), Conference on children with minimal brain impairment. Urbana: University of Illinois Press, 1963. Pp. 54-69.
Reinhold, M. The diagnosis of congenital dyslexia. In A. W. Franklin (Ed.), Word-blindness or specific developmental dyslexia. London: Pitman Medical Publishing Company, Ltd., 1962. Pp. 70-73.

28 5
Rextan, R. M. Psychological deficit. In P. R. Farnsworth (Ed.), Annual review of psychology. Vol. 13. Palo Alto: Annual Reviews, Inc., 1962. Pp. 415-444.
Reynolds, M. C. A study of the relationship between auditory characteristics and specific silent reading abilities. Journal of Educational Research, 1953, 46, 439-449.
Rizzo, N. D. Studies in visual and auditory memory span with special reference to reading disability. Journal of Experimental Education, 1939, jB, 208-244.
Robinson, H. M. Why pupils fail in reading. Chicago: University of Chicago Press, 1946.
Robinson, H. M. A review of the Durrell-Sullivan reading capacity and achievement tests. In 0. K. Buros (Ed.), The fourth mental measurements yearbook. Highland Park, N J.: The Gryphon Press, 1953. Pp. 600-601.
Saunders, R. E. Dyslexia: Its phenomenology. In J. Money (Ed.), Reading disability: Progress and research needs m dyslexia. Baltimore: The Johns Hopkins Press, 1962. Pp. 35-44.
Saunders, R. E. Emotional growth and reading growth. Bulletin of the Orton Society, 1963, 13, 83-90.
Schiffman, G. Dyslexia as an educational phenomenon: Its recognition and treatment. In J. Money (Ed.), Reading disability: Progress and research needs. Baltimore: The Johns Hopkins Press, 1962. Pp. 45-60.
Schilder, P. Congenital alexia and its relation to optic- perception. Journal of Genetic Psychology, 1944, 65, 67-88.
Schonell, F. J. Backwardness in the basic subjects. Edinburgh: Oliver and Boyd, 1942.Seashore, C. E., Lewis, D., & Saetveit, J. G. Seashore measures of musical talents. New York: The Psychological Corporation, 1960.

286Shankweiler, D, P. Some critical issues concerning developmental dyslexia. In A. W. Franklin (Ed.), Word-blindness or specific developmental dyslexia. London: Pitman Medical Publishing Company, Ltd., 1962. Pp. 51-55.
Sievers, D. J., McCarthy, J. J., Olson, J. L., Bateman, B. D., Kass, C. E. (Eds.) Selected studies on the Illinois test of psycholinguistic abilities. Urbana: University of Illinois Press, 1963.
Silver, A. A. Diagnostic considerations in children with reading disability. Bulletin of the Orton Society, 1961, 11> 5-12.Silver, A. A., & Hagin, R. Specific reading disability: Delineation of the syndrome and relationship to cerebral dominance. Comprehensive Psychiatry. 1960, 1^, 126-134.
Silver, A. A., & Hagin, R. A. Specific reading disability: Follow-up study outline of tests used. American Journal of Orthopsychiatry. 1964, 34, 95-102.
Smith, D. E. P., & Carrigan, P. M. The nature of reading disability. New York: Harcourt, Brace and Company, 1959.
Statten, T. Behavior patterns, reading disability and EEG findings. American Journal of Psychiatry. 1953, 110. 205-206.
Stewart, R. E. Personality maladjustment and reading achievement. American Journal of Orthopsychiatry, 1950, 20. 410-417.
Templin, M., & Darley, F. L. The Templin-Parley tests of articulation. Iowa City: The University of Iowa, 1960.
Thurston^ L. L., & Thurston^ T. G. Primary mental abilities. (Rev. ed.) Chicago: Science Research Associates, Inc., 1962.
Tolman, E. C. Collected papers m psychology. Berkeley: University of California Press, 1951.
Tomkins, C. The last skill acquired. The New Yorker. September 14, 1963. Pp. 127-157.

287Veldman, D. J. Statistical program library for the CPC 1904. Austin, Texas: Author, 1965.
Vernon, M. D. Backwardness in reading. Cambridge: The University Press, 1958.
Vorhaus, P. G. Rorschach configurations associated with reading disability. Journal of Projective Techniques, 1952, 16, 3-19.
Walker, L., & Cole, E. M. Familial patterns of expression of specific reading disability in a population sample. Bulletin of the Orton Society, 1965, 15, Pp. 12-24.
Wallin, J. E. W. Congenital word-blindness. Lancet, 1921, 200. 890-892.
Ward, J. H. Hierarchical grouping to optimize an objective function. American Statistical Association Journal, 1963, 58, 236-244.
Ward, J. H., & Hook, M. E. A hierarchical grouping procedure applied to a problem of grouping profiles. Lackland Air Force Base, Texas: Personnel Laboratory, Aeronautical Systems Division, October, 1961. (Technical Note ASD-TN- 61-55).
Wechsler, D. The measurement of intelligence. Baltimore: The Williams & Wilkins Company, 1944.
Wechsler, D. Wechsler intelligence scale for children— manual. New York: The Psychological Corporation, 1949.
Wechsler, D., & Pignatelli, M. L. Reversal errors in reading: Phenomena of axial rotation. Journal of Educational Psychology. 1937, 28, 215-221.
Wechsler, D., & Stone, C. P. Wechsler memory scale. New York: The Psychological Corporation, 1945.Wepman, J. M. Auditory discrimination test—manual of directions. Chicago: Language Research Association, 1958.
Wepman, J. M. Auditory discrimination, speech and reading. Elementary School Journal. 1960, 60, 325-333.

288
Wepman, J. M. Dyslexia: Its relationship to language acquisition and concept formation. In J. Money (Ed.), Reading disability: Progress and research needs in dyslexia. Baltimore: The Johns Hopkins Press, 1962. Pp. 179-186.
West, P. V. American handwriting scale. Chicago: A. N. PaImer Company, 19 57.
Wheeler, L. R., & Wheeler, V. D. A study of the relationship of auditory discrimination to silent reading abilities. Journal of Educational Research, 1954, 48, 103-113.
Witty, P., & Kopel, D. Reading and the educative process. Boston: Ginn and Company, 1939.
Wolfe, L. S. Differential factors m specific reading disability: I. Laterality of function. Journal of Genetic Psychology. 1941, 58, 45-56.
Wright, M. S. The Parkwood project of Montgomery County, Maryland. Bulletin of the Orton Society, 1963, 13, 143-147.
Zangwill. 0. L. Cerebral dominance and its relation to psychological function. Edinburgh: Oliver & Boyd, 1960.
Zangwill, O. L. Dyslexia in relation to cerebral dominance. In J. Money (Ed.), Reading disability: Progress and research needs in dyslexia. Baltimore: The Johns Hopkins Press, 1962. Pp. 103-113.
Zangwill, 0. L. Personal communication. 1964.
Zedler, Empress Y. An investigation of relations between WISC results and neurological findings in underachievers. U. S. Dept, of Health, Education, and Welfare, Public Health Service, Division of Chronic Diseases, Neurological and Sensory Diseases. Service Project Grant #N4607A63, 1965.

APPENDIX A
Intellectual

290
WISC Subtests Used Plus Two Additional Computations
SubtestsInformation Comprehension Arithmetic Similarities Vocabulary Digit Span3-
Picture Completion Picture Arrangement Block DesignCoding Mazesb
Verbal Scale IQ Performance Scale IQp Full Scale IQ
Additional ComputationsVerbal Scale minus Performance Scale (magnitude of difference J Digits forward minus Digits backward (magnitude of difference)
a Not used in computing Verbal Scale IQ.13 Not used in computing Performance Scale IQ.c Performance Scale IQ based on prorating of four subtests.

APPENDIX B
Language
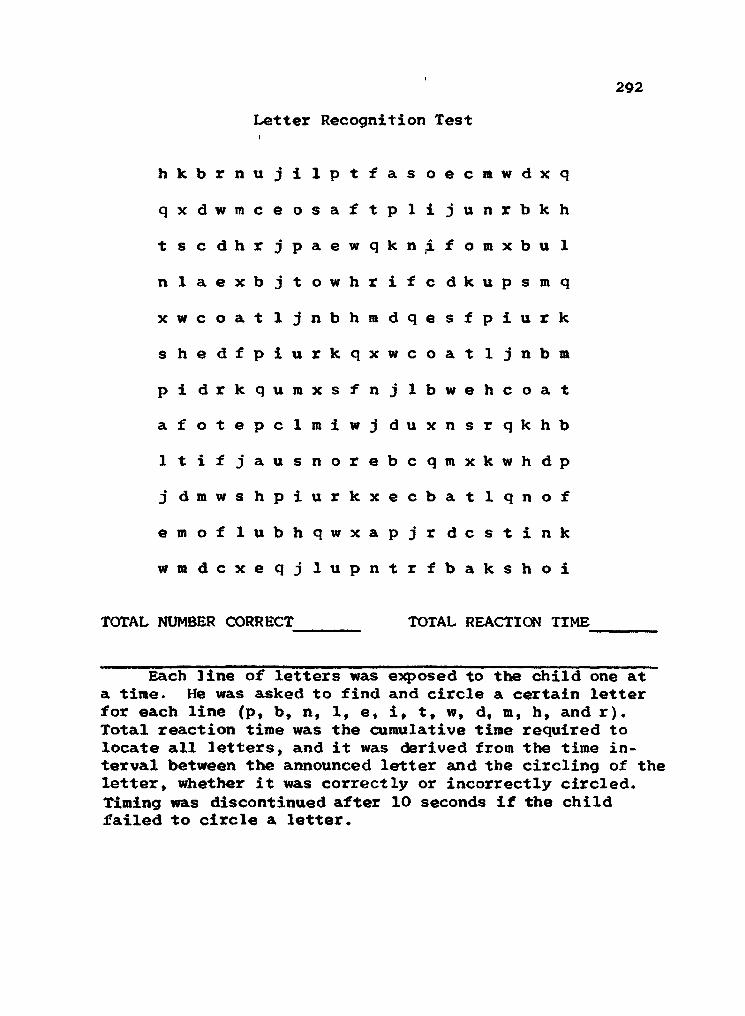
292Letter Recognition Test
hkbrnujilptfas oecmwdxq
qxdwmceosaftplijunrbkh
t s c d h r jpaewqkn^f o m x b u 1 nlaexbjtowhrifcdkupsmq
x w c o a t ijnbhmdqesfpiurk
shedfpiurkqxwcoat 1 j n b m
pi drkqumxsfnjlbwehcoat
afotepclmiwj duxnsrqkhb
Itifjausnorebcqmxkwhdp
j dmwshpiurkxecbatlqnof
e m o f lubhqwxapjr d c s t i n k wmdcxeqj lupntrfbakshoi
TOTAL NUMBER CORRECT TOTAL REACTION TIME
Each line of letters was exposed to the child one at a time. He was asked to find and circle a certain letter for each line (p, b, n, 1, e, i, t, wt d, m, h, and r). Total reaction time was the cumulative time required to locate all letters, and it was derived from the time interval between the announced letter and the circling of the letter, whether it was correctly or incorrectly circled. Timing was discontinued after 10 seconds if the child failed to circle a letter.

293
III
A big car nearly ran over Bobby, He jumped quickly away from it. Now he does not play in the road.
In group testing, third grade subjects copied in cursive form the above sentences. Quality of handwriting was judged O = very poor, = poor, 2, - good, and 3, = very good.

294
IV
A dozen boys had a jolly picnic. They rode to the woods in autos. Some took lunch in large boxes. All of them had a very fine time.
In group testing, fourth grade students copied in cursiveform the above sentences. Quality of handwriting was judgedO = very poor, = poor, 2^ = good, and 3 = very good.

APPENDIX C
Visual Perception

296
Test figures reproduced from the Minnesota Percepto- Diagnostic Test (Fuller & Laird, 1963b, p. 12).

297
An example of one stimulus card, reduced m size, contained in Revised Visual Retention Test (Benton, 1955), All three forms of the test were administered. In administration C, the subject reproduces 10 designs while viewing them. In administration A, the subject views each design for 10 seconds then reproduces it from memory. In administration D, a 15 second delay is introduced before the subject draws the designs from memory. Ten designs are in each administration and they are presented successively. Scoring consisted of the total number of correct reproductions and the total number of errors for each administration.

298
Examples of Practice Exercises of Three Subtests from Primary Mental Abilities (Thurston & Thurston, 1962)
This test is called "Spatial Relations." It is a test to see how well you can recognize shapes and forms. In sample problem S17 the first drawing is one part of a square. Look I at the other drawings in the first row and find the shape that is the other part of the square. Put your finger on the other part of the square.
This test is called "Figure Grouping." It is a test to see how well you can see differences in figures. In sample problen S21 three of the drawings are alike, but one is different. Put your finger on the one that is different.
S21
D
This test is called "Perceptual Speed." It is a test to see how well you can see similarities in drawings. In sample problem S 29 two of the drawings are exactly alike. Put your fingers on the two drawings that are alike.
S29.
D

APPENDIX D
Auditory and Speech

300
AUDITORY DISCRIMINATION TEST
FORM I
X YX
1. tub - tug w 21 cat - cap
2. lack - lack V ’j*. L»:)i 22. dm - bin
3. web - wed 23. lath - lash
4 leg - led 24. bum - bomb"SI
5. chap - chap____________________________________________________
25. clothe - clove ^156 gum - dumb 26. moon - noon
7. bale - gale"V?
27. shack - sack
8 sought - fought 28. sheaf - sheath
9. vow - thou 29. king - kingV? 'A
10. shake - shape 30. badge - badge < ' ' ' b v<;
11 zest - zest 31. pork - cork
12. wretch - wretch 32. fie - thigh-r -riumujl
13. thread - shred 33 shoal - shawl
14. jam - jam
d
34. tall - tall
15. bass - bath 35. par - par
16 tin - pin 36. pat - pet
17. pat - pack>.*♦ »
37. muff - muss v* y ♦J V#t CiA
18. dim - din 38. pose - poseo' •«
^1.4.. 7.
19. coast - toast 39. lease - leash • A A'
20. thimble - symbol 40. pen - pin
X Y
Error Score //30
Copyright 1958, by Joseph M Wepman, Ph.D , 950 E 59th Street, Chicago 37, Ill Printed in U 5 A This form is copyrighted The reproduction of any part of it by mimeograph, hectograph, or in any other way, whether die reproductions are sold or are furnished free for use, is a violation of the copyright law

301
Auditory Blending Test
Pronounce each word only once as shown in first column. Pause H second between syllables.
1. h-o-r-s (horse)
2. uh-s (us)
3. a-ten-shun (attention)
4. s~ap (sap)
5. fr-i (fry)
6. ch-amp (champ)
7. g-o (go)
8. d-an-s (dance)
9. b-ar-k (bark)
10. fl-i-t (flight)
11. c-ake (cake) 12. n-ice-lee (nicely)
13. s-ing-er (singer)
14. th-ir-s-tee (thirsty)
15. st-a-shun (station)
TOTAL NUMBER CORRECT
During individual testing, the examiner pronounced each word syllable by syllable. The child was requested to say the word. If he said he did not know the word, he was asked to guess. If he were unable to guess, the response was scored as failed. This administration is slightly modified from the original (Gates & McKillop, 1962).

302Auditory Intrasensory Integration Test
1. R-u-n 9. S-i-x 17. M-a-n
2. T-o-p 10. I-c-e 18. G-o-o-d
3. R-e-d 11. I-s 19. T-h-i-s
4. B-o-o-k 12. N-o-w 20. O-v-e-r
5. S-e-a 13. L-i-t-t-l-e 21. T-h-e
6. C-a-n 14. D-i-d 22. Y-o-u7. T-e-n 15. N-o-t 23. A-l-1
8. 0-1-d 16. S-h-e 24. M-U-S-t
25. A-n-dTOTAL CORRECT__ TOTAL REACTION TIME_______
Pause \ second between letters when spelling the word. Record the reaction time interval between the last letter of the word and the time the child says the word. Discontinue timing after 10 seconds if the child does not know the word.
This test measures the child's ability to integrate names of letters into a whole word. It is the converse of a spelling test wherein the child writes the letter names after hearing the whole word. It is similar but somewhat different from an auditory blending test wherein the child integrates phonemes into whole words. The test was derived from clinical recognition that children with dyslexia have difficulty integrating spelled words.
The words were selected from the first seven spelling lists in the Morrison-McCall Spelling Scale (Morrison & McCall, 1929). The level of difficulty ranges from grade levels 1.0 to 1.9. All words, therefore, are below the second grade level.
The Total Reaction Time was a cumulative reaction time to each of the spelling words.

303
TOTAL NUMBER CORRECT
Signal to Noise Ratio
Stimulus1. that
Response Stimulus26. well
Response
2. ill 27. die3. me 28. one (won)4. pew 29. then5. star 30. on6. and 31 . been7. tree 32. key8. odd 33. oak9. ham 34. young
10. smart 35. live11. dumb 36. hit12. with 37. bye (buy)13. off 38. chest14. thin 39. show15. gave 40. cap16. now 41. ale (ail)17. send 42. tear18. move 43. hurt19. ice 44. way20. eat 45. else21. rooms 46. does22. cars 47. your23. air 48. too24. new 49. flat25. jaw 50. ease
The 50 words above, constituting the signal, were taped from a record prepared by the Central Institute of Deaf, record W-22. They were taped at a 55 db level. Vhite noise constituted the background. It was presented at the 45 db level and originated from a Beltone audiometer. Both signal and noise were taped simultaneously.
The subject was told that he would hear a voice saying, "Say the word " while at the same time hearing static interference. When the subject heard the stimulus tvords, he was to repeat through the microphone on the table in front of him what he heard. The examiner, who was outside the sound room with earphones on, recorded his responses. If at any time she was uncertain as to the response, she stopped the tape and had the subject repeat the word. The total number of correct responses constituted the score.

304
TOTAL NUMBER CORRECT
Sound Localization Test
1. R 8. L 15. CL
2. L 9. C 16. CR
3. C 10. CL 17. R
4. CL 11. R 18. CL
5. C 12. L 19. L
6. R 13. CR 20. CR
7. CR 14. C
This test measures the subject's ability to localize the direction from which sound originates. In relation to the position of the subject in the sound room, there were 5 possible choices: right, right oblique, center, left oblique, and left.
A 1000 cps pure tone signal, 40 dps 3bove auditory threshold, was presented to the subject. The signal was fed from a Beltone audiometer to one of three speakers in the room (speaker right, speaker center, and speaker left of subject) or to two sneakers simultaneously (speakers right and center, and speakers left and center). Sending the signal through either pairs of speakers created the psychological experience of hearing the tone either right oblique or left oblique. The notational system for the 20 trials is as follows: R (signal comes from the right speaker), L (signal comes from the left speaker), C (signal comes from the center speaker), CR (signal comes from both the center and right speakers), and CL (signal comes from both the center and left speakers). Prior to the 20 test trials, the signal was presented in the following order as demonstration of the task confronting the subj'ect: R, RC, C, CL, and L. Once the subject understood what was expected of him, testing began.

305Templin-Darley Screening Test of Articulation
7. bird 45. bread33. music 46. tree28. rabbit 47. dress28. arrow 48. crayon29. leaf 49. grass31. valentine 50. frog32. thumb 51. three32. bathtub 52. shredded wheat32. teeth 76. planting33. there 78. clown33. feather 79. glass33. smooth 80. flower35. zipper 95. smoke36. sheep 96. snake36. dishes 97. spider36. fish 98. stair37. television 99. sky41. yellow 100. sled41. onion 101. sweeping42. chair 109. twins42. matches 110. queen42. watch 120. splash43. 2ar 121. sprinkling can43. engine 122. string44. present 123. scratch
Each child was shown pictures representing the words the examiner wished to elicit. The letters underlined in the response words above correspond to the sounds within the words the chi Id was to utter.
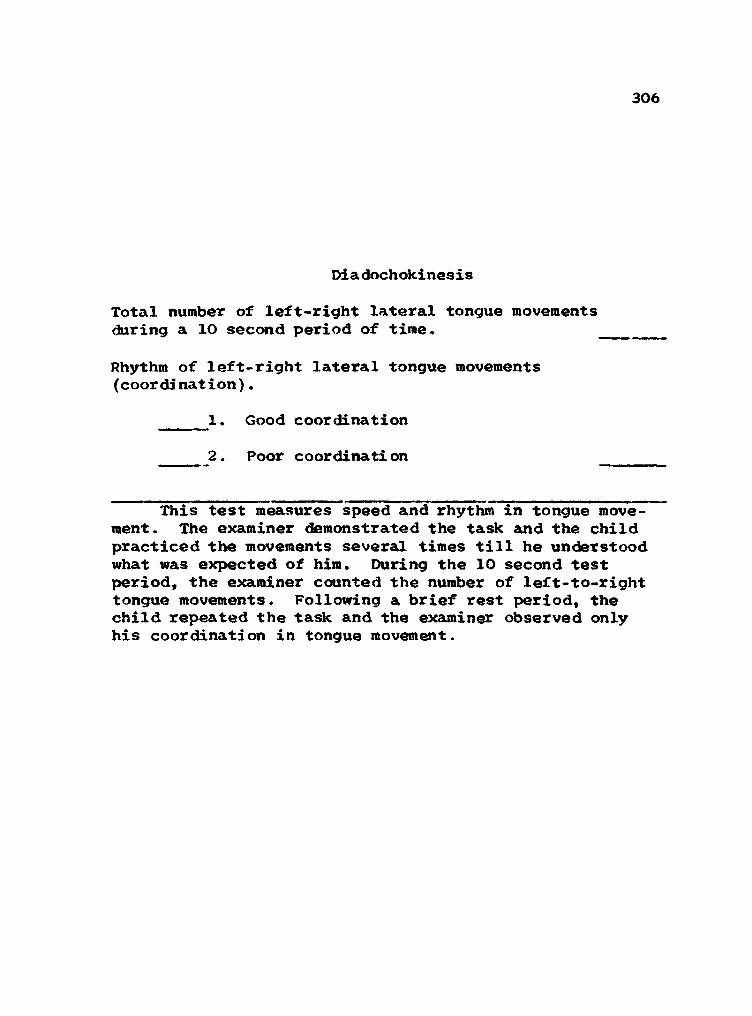
306
Diadochokinesis
Total number of left-right lateral tongue movements during a IO second period of time.
Rhythm of left-right lateral tongue movements (coordination).
1. Good coordination
2. Poor coordination
This test measures speed and rhythm in tongue movement. The examiner demonstrated the task and the child practiced the movements several times till he understood what was expected of him. During the 10 second test period, the examiner counted the number of left-to-right tongue movements. Following a brief rest period, the child repeated the task and the examiner observed only his coordination in tongue movement.

APPENDIX E
Neuropsychological

308Harris Tests of Lateral Dominance
A-B-C Vision Test1 5
2 6
3 7
8
NUMBER OF TIMES RIGHT FOOT USED
NUMBER OF TIMES RIGHT HAND USED
NUMBER OF TIMES RIGHT EYE USED
Directions for administration were followed according to the Harris (1958) manual. In the Foot Dominance test, item 3 was added to increase the reliability of this test.
Hand Preferences
1, How do you throw a ball7,
How do you wind a watch7.....3. How do you hammer a nail7....
4. How do you brush your teeth7..
5. How do you comb your hair7...._
6. How do you turn a door knob?.._
7. How do you hold an eraser7....-
8. How do you use scissors7...... _
9. How do you cut with a knife7..
10. How do you write7............. _
Foot
1 .
Dominance
How do you kick a football?....
2. How do you stamp out a fire7..3. How do you hop7......... ......

309
Benton*s Right-Left Discrimination Test
SUB TOTAL
Part I, Behavioral Responses (eyes closed).
1. Touch your right ear with your right hand. 12. Touch your left knee with your right hand 23. Touch your right eye with your left hand. 34. Touch your left ear with your left hand. 45. Touch your left eye with your right hand. 56. Touch your left knee with your left hand. 6___7. Touch your right shoulder with your left hand. 7___
SUB TOTAL
Part II. Verbal Responses (pictures).
1. Pict. A (L hand. L ear) Which hand on which ear? 1___2. Pict. B (R hand. L eye) Which hand on which eye? 2___3. Pict. C (R hand, R ear) Which hand on which ear7 3___4. Pict. D (L hand. R eye) Whi ch hand on which eye7 4___5. Pict. E (R hand, L ear) Which hand on which ear? 5___6. Pict. F (R hand. R eye) Which hand on which eye? 6___7. Pict. G (L hand. L eye) Which hand on which eye7 7___8. Pict. H (L hand. R ear) Which hand on which ear7 8___
GRAND TOTAL
Part III. Consistent reversal of responses to pictures.
(0 = yes; 1 = no)
In Part I, the child was asked to touch parts of his body with his left or right hand. In Part II, he was shown successively eight pictures, each containing a different hand-body part relationship.

310Benton’s Finger Localization Test (Parts 4 and 5)
The child extends his hand (first right then left) through the curtain attached to the box. The appropriate hand chart, with each finger marked by a number, is placed on the slanted top of the box. Examiner says,
”1 am going to touch one finger at a time under this box. You tell me which finger I touched by naming the number of the finger touched.”
Identification of fingers on chart (hand hidden). Subject points to corresponding finger on model as that touched by the examiner in the following order:
Right Hand 5 132435142
Left Hand 2415342315
Examiner says,"Now I am going to touch two fingers at the same time. You tell me which two fingers I touched by naming the two numbers of the fingers touched."
Identification of two simultaneously stimulated fingers on chart (hand hidden).
Right Hand 14 23 24 35 34 32 25 12 34 13
Left Hand 13 34 35 23 24 14 23 25 12 34
Recording and Scoring. Use check marks for correct responses. If the child changes his response before the next finger is stimulated, the second response is indicated.
The total score is the sum of the correct localizations for each of the separate tests. The grand total is the sum of the total scores for the single and double stimulation. Maximum total score is 20 and grand total is 40.
A mimeograph copy of this test with directions for administration was provided by Benton (1964). Adherence to the directions governed the administration of this test.

APPENDIX F
Neurological

312
Neurological Evaluation
SPECIAL SENSES
0123 Vision (visual acuity correctable to normal)
0123 Hearing0123 Taste
0123 Smell
CRANIAL NERVES
0 1 2 3 TIT, IV, & VI--eye movements
Lateral (R• 01 2 3, L: 0 1 2 3)Other (R: 01 2 3, L: 0 1 2 3)
0 1 2 3 V TrigeminalMotor movement of jaws deviation
Movement face (R: 0 1 2 3, L: 0123) Movement lip (R: 0 1 2 3, L: 0123)Ability to close one eye independently of the
Sensory: Pain, touch, temp. Corneal reflex
(R: 012 3,(R: 012 3,
L- L-
0 12 3 0 12 3
0 12 3 VII Facial--motor
Palpebral fissures equal unequal
other (R: 0123) (L: 012 3)
Position of lips at rest Much
Parted some___ More____
0 12 3 IX & X Glossopharyngeal and VagusPharyngeal Sensation R _________ LPharyngeal reflex R L
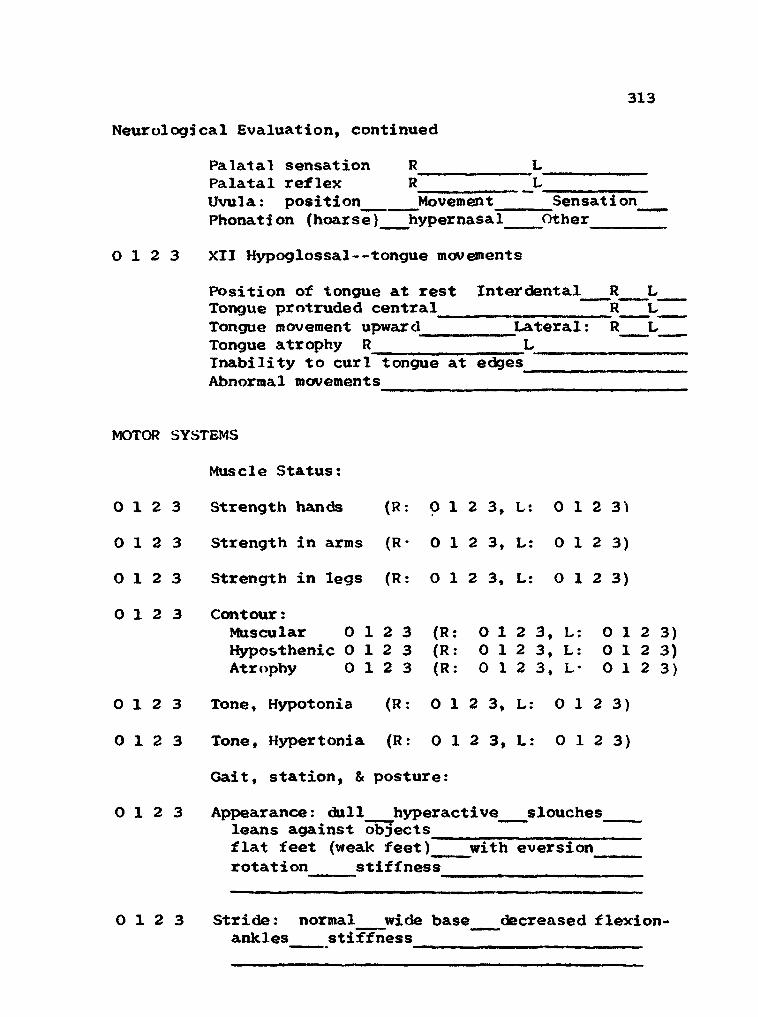
313Neurological Evaluation, continued
Palatal sensation R LPalatal reflex R L Uvula: position Movement Sensation Phonation (hoarse) hypernasal Other
0123 XII Hypoglossal--tongue movements
Position of tongue at rest Interdental R LTongue protruded central R LTongue movement upward Lateral: R LTongue atrophy R LInability to curl tongue at edges Abnorma1 movements
MOTOR SYSTEMS
Muscle Status:
0 12 3 Strength hands (R: 0 12 3, L: 0 1 2 3)0 12 3 Strength in arms (R- 0 12 3, L: 0 1 2 3)0 12 3 Strength in legs (R: 0 12 3, L: 0 1 2 3)0 12 3 Contour:
Muscular 0 12 3 (R: 0 12 3, L: 0 1 2 3)Hyposthenic 0 12 3 (R: 0 12 3, L: 0 1 2 3)Atrophy 0 12 3 (R: 0 12 3, L- 0 1 2 3)
0123 Tone, Hypotonia (R: 0 1 2 3, L: 0123)
0123 Tone, Hypertonia (R: 0 1 2 3, L: 0123)
Gait, station, & posture:
0 12 3 Appearance: dull hyperactive slouches leans against objects flat feet (weak feet) with eversionr ot a t i on stiff nes s
0 12 3 Stride: normal wide base decreased flexionankles stiffness

Neurological Evaluation, continued314
on toes on heels on a line position of trunk head on a line strength of legs
0 1 2 3 Lower motor neurone system
Decrease in muscle tone (R: 0 1 2 3, L: 0 1 2 3)Weakness, muscle (R: 0 1 2 3, L: 0 1 2 3)Paralysis, muscle (R: 0 1 2 3, L: 0 1 2 3)
0 1 2 3 Upper motor neurone system (pyramidal)
Increase in muscle tone (R- 0 1 2 3, L: 0 1 2 3)Spasticity (R: 0 1 2 3, L: 0 1 2 3)Clonus (R: 0 1 2 3, L: 0 1 2 3)
0 1 2 3 Extrapyramidal system
Rigidity (R: 0 1 2 3, L: 0 1 2 3)Tremor (rest) (R: 0 1 2 3, L: 0 1 2 3)Choreiform movements (R: 0 1 2 3, L: 0 1 2 3)Athetoid positioning (R: 0 1 2 3, L: 0 1 2 3)
0 1 2 3 Cerebellar system
Ataxia - Truncal (R: 0 1 2 3, L: 0 1 2 3)Dysmetria (R: 0 1 2 3, L: 0 1 2 3)Intention tremor (R: 0 1 2 3, L: 0 1 2 3)Nystagmus (R: 0 1 2 3, L: 0 1 2 3)
COORDINATION AND EQUILIBRIUM
Upper Extremities:0123 Alternating flexion and extension of fingers (open
ing and closing fist) (Bilateral- R & L)
0123 Apposition of thumb (Bilateral: R & L)
0123 Approximation and abduction of fingers (Bilateral: R & L)
0123 Supination and pronation of outstretched hands with wrists extended and fingers abducted (Bilateral: R & L)

315Neurological Evaluation, continued
0123 Patting chest symmetrically, then alternating supination and pronation touching thighs (Bilateral: R & L)
0123 Tandem Walking (straight line)
Lower Extremities:0123 Standing on one foot (R & L)
0123 Jumping on both feet
0123 Hopping on one foot (R & L)
0 12 3 Knee bends
REFLEXES
0123 Deep tendon reflexes
(absent, hypoactive, 0 = normal, 1 = hyperactive,2 = unsustained clonus, 3 = sustained clonus.)
0123 Superficial reflexes (R: 0 1 2 3, L: 0123)
0123 Plantar reflex (Babinski) (R: 0 1 2 3, L: 0123)
SENSORY SYSTEMS 0123 Pain appreciation equal (right = left)
0 12 3 Touch appreciation equal (right = left) _________
0123 Temperature appreciationequal (right - left) _________
0123 Vibratory appreciation equal (right = left)
0 12 3 Position Toes ankles fingers

316Neurological Evaluation, continued
Romberg’s sign Present Absent
0123 Stereognostic appreciation equal (right = left)
0123 Extinction Phenomena
Face (right = left) Hands (right - left) Legs (right left)
Instructions for scoring were: Circle 0 (no involvement, 1. (mild), 2 (moderate), or 3 (severe). Use scores following the items in right margin as bases for arriving at rating in left margin.

317
EEG Scoring System
Wake Tracing
0 1 Slow0 1 FastO 1 Mixed (diffuse)O 1 Paroxysmal bursts0 1 FocalO 1 Immature tracing0 1 14 and 6 cycles per
secondO 1 Abnormal—OtherO 1 Normal
Sleep Tracing
0 1 SlowO 1 FastO 1 Mised (diffuse)0 1 Paroxysmal burstsO 1 FocalO 1 Immature tracing0 1 14 and 6 cycles per
secondO 1 Abnormal--Other0 1 Normal
Instructions for scoring were: Circle 0 (not present) or 1^ (present) to indicate the absence or presence of each factor«

APPENDIX G
Interview Schedules

319Medical History Inventory
A. Intrauterine Development
0123 Maternal reproduction difficulties
Relative sterility 0 12 3Miscarriage (25% to 50% = £, over 50% = 3) 0 12 3Stillbirths (25% to 50% = 2, over 50% = 3) 0 12 3Death in 1st week of life (25% = 1, 26% to 50% = 2, over 50% - 3) 0 12 3Prematurity and children with low birth weights 0 12 3
0123 Maternal health during pregnancy for this childUterine bleeding or “spotting” 0 12 3Excessive vomiting 0 12 3Allergies (asthma and/or others) 0 12 3(Pre) eclampsia 0 12 3Heart disease 0 12 3Chronic anemia 0 12 3Surgery under general anesthesia 0 12 3Infections 0 12 3Thyroid disease (hyper or hypo) 0 12 3Diabetes and prediabetes 0 12 3Drugs and medications used duringpregnancy 0 12 3
B. Natal Factors
0123 Length of gestation (37 wks or more = 0; 36-33wks = 1; 32 to 29 wks = 2; 28 vdcs or less = 3)
0123 Birth weight (5 lbs, 8 oss or more = 0; 5 lbs,7 ozs to 4 lbs = 1; 3 lbs, 15 ozs to 3 lbs,1 oz = 2; 3 lbs or less = 3)
0123 Abnormal presentation (breech = 3, other 2 or 1J0123 Caesarean section (anticipated = 2, emergency = 3)

320Medical History Inventory, continued
0123 Significant injury at birth
C. Neonatal Factors (first week of life)
0123 Postdelivery color (cyanotic or jaundiced)
0123 Motor apathy0 12 3 “Floppy baby**
0123 Respiratory difficulty
0 12 3 Sucking (strong = 0, weak = 1^, absent = 3)
0123 Treatment for noncerebral congenital anomalies
0123 Convulsions or cyanotic episodes
0 23 Baby stayed in hospital after mother went home
D. Postnatal Factors
0123 Diseases
0123 Injuries
0123 Wake, Hyperactive
0123 Wake, Lethargic
0123 Sleep behavior: too sleepy or drowsy0123 Sleep behavior: disturbed sleep cycle
E. Age of acquisition of motor skills in infancy and early childhood
0123 Crawling (never or later than 1 year in crawling = 3, other =2, 1, or 0)

321Medical History Inventory, continued
0123 Sitting without support (by 6 mos = 0; 6-7 mos = I5 7-8 mos “ £, later than 8 mos = 3)
0123 Walking independently (by 14 mos - 0; 15-16 mos - I5 17-18 mos = 2; later than 18 mos = 3)
0123 Dressing self (based on Gesell scale of development)
Pulled on simple garment (24 mos = 0; 25-30 mos = lj 31-36 mos = 2; 3 years or later = 3)
Put on shoes and unbuttoned clothes (by 36 mos = 0; 37-47 mos = 48-59 mos = 2; 5years or older = 3) ""
0123 Communicated with single words other than "Mama", "Dada", and/or "bye-bye", (by 12 mos = 0; 13- 15 mos = 1^; 16-18 mos = 2^, older than 18 mos = 3)
0123 Communicated with sentences (by 2 yrs = 0; 25- 30 mos = 1^, 31-36 mos = 2; later than 3 years = 3)
Instructions for Scoring were: Circle 0 (no involvement), 1, (mild 2 (moderate), or 3 (severe). Use scores following the items in right margin as bases for arriving at rating in left margin.

322Familial History of Language Disability
1. Reading. (History of poor reading; slow, faltering, and word-by-word reading; poor phonic skills; dislike for reading.)
2. Spelling. (History of poor spelling; present ability reflects many misspelled words; frequent use of dictionary.)
3. Handwriting. (Difficult to read handwriting. Difficulty in learning to write.)
__ 4. Laterality. (Is parent right or left, or mixed, crossed or aunbidexterous?)
5. Directional Orientation.(Loses directions easily in driving, especially in a new situation. Does he express discomfort or confusion in spatial orientation?)
6. Motor'Coordination. (History of incoordination. Is parent awkward in dancing, walking, sports?)
7. Speech. (Note history of speech problems and present condition--hesitations, stuttering, dysar- ticulation.)
8. Brother(s). (is there any history of reading and spell-— 9* Sister(s) . ing problems in which arithmetic is better7)
10. Overal1 Judgment. (Make an overall judgment as to the presence or absence of a familial basis to child’s present language problem.)
Scoring: 0 is presence of and 1, is absence of familial history.
Each parent was scored separately. Variables 8 and 9 were scored according to sex of the siblings.
Copyright © 2022 FDOKUMEN