
Dynamic time warping in the analysis of event-related potentials
10
© PHOTODISC EMBS 2003 Student Paper Finalists 68 IEEE ENGINEERING IN MEDICINE AND BIOLOGY MAGAZINE JANUARY/FEBRUARY 2005 T he aim of this article is to compute reliable templates of event- related potentials (ERPs) for homogeneous groups of subjects and to automatically quantify the morphological characteristics of the ERPs. We developed a method based on dynamic time warping (DTW). The method was applied to ERPs recorded from normal and dyslexic children during two reading tasks. We found that characteris- tic latency and amplitude changes of ERP components are due to task and pathology. Our results support the idea that dyslexia involves different and complex cerebral functions aside from the language system. This mathe- matical approach provides reproducible analysis criteria that are crucial for the reliability of ERP analysis. Introduction ERPs recorded during the execution of specific cognitive tasks are useful for studying higher-order cerebral functions. This approach is worthwhile because it allows the evaluation of brain behavior in vivo with high tem- poral resolution; furthermore, it is noninvasive, easy to apply, and low in cost. These characteristics make it particularly suitable in children stud- ies. We recorded ERPs in normal children and in children with develop- mental dyslexia to study the neurophysiological bases of reading processes. Developmental dyslexia is a neuropsychological disorder that involves reading abilities and coexists with average intelligence, adequate Computing Reliable ERP Templates from Dyslexic Children BY SILVIA CASAROTTO, ANNA M. BIANCHI, SERGIO CERUTTI, AND GIUSEPPE A. CHIARENZA Dynamic Time Warping in the Analysis of Event-Related Potentials 0739-5175/05/$20.00©2005IEEE
-
Upload
independent -
Category
Documents
-
view
7 -
download
0
Transcript of Dynamic time warping in the analysis of event-related potentials

© PHOTODISC
EMBS 2003 Student Paper Finalists
68 IEEE ENGINEERING IN MEDICINE AND BIOLOGY MAGAZINE JANUARY/FEBRUARY 2005
The aim of this article is to compute reliable templates of event-related potentials (ERPs) for homogeneous groups of subjects andto automatically quantify the morphological characteristics of theERPs. We developed a method based on dynamic time warping(DTW). The method was applied to ERPs recorded from normal
and dyslexic children during two reading tasks. We found that characteris-tic latency and amplitude changes of ERP components are due to task andpathology. Our results support the idea that dyslexia involves different andcomplex cerebral functions aside from the language system. This mathe-matical approach provides reproducible analysis criteria that are crucial forthe reliability of ERP analysis.
IntroductionERPs recorded during the execution of specific cognitive tasks are usefulfor studying higher-order cerebral functions. This approach is worthwhilebecause it allows the evaluation of brain behavior in vivo with high tem-poral resolution; furthermore, it is noninvasive, easy to apply, and low incost. These characteristics make it particularly suitable in children stud-ies. We recorded ERPs in normal children and in children with develop-mental dyslexia to study the neurophysiological bases of readingprocesses. Developmental dyslexia is a neuropsychological disorder thatinvolves reading abilities and coexists with average intelligence, adequate
Computing Reliable
ERP Templates from
Dyslexic Children
BY SILVIA CASAROTTO, ANNA M. BIANCHI,
SERGIO CERUTTI, AND GIUSEPPE A. CHIARENZA
Dynamic Time Warping in the Analysis of
Event-Related Potentials
0739-5175/05/$20.00©2005IEEE

IEEE ENGINEERING IN MEDICINE AND BIOLOGY MAGAZINE JANUARY/FEBRUARY 2005 69
education, and normal sensory acuity. There is not fullagreement among researchers about the structural and func-tional origins of dyslexia, and several models have beenproposed [1]–[4]; the most recent theories hypothesize agenetic disruption of the cerebral structure that would affectphonological awareness and visual/auditory perception [5],[6]. This disorder is sometimes reversible when specificrehabilitative therapies are performed on young children [7].Therefore, it is important to deeply investigate the readingprocesses in order to diagnose dyslexia as early as possibleand to work out efficacious and tailored treatments.
The analysis of ERPs is based on the quantification of theirmorphological characteristics, primarily the latency and ampli-tude of the most relevant components. Group analysis usuallystems from the computation of grand averages of ERPs onhomogeneous subjects.
Cognitive potentials are characterized by a great intra-and interindividual variability, and their morphology isdeeply influenced by age and pathology. The componentswith long latency significantly vary with scalp site andstimulation paradigm [8].
The marked variability of cognitive potentials recorded inchildren has important consequences for the analysis andinterpretation of their morphological characteristics. First, thecomponents resulting from intersubject grand averagingappear smoothed because of latency variability; thereforepeaks detection loses precision. Furthermore, the identificationof the relevant components must be manually performed byskilled researchers after long and complex training. Due to thevariable characteristics of these potentials, the analysisapproach is often slightly modified as observations and experi-ence increase. For these reasons, the quantification of ERPs’morphology is time-consuming and greatly affected by thesubjective judgment of the experimenter.
This work describes a nonlinear alignment method basedon the DTW technique for computing reliable ERP templatesfor homogeneous groups of subjects and for automating thequantification of ERPs’ morphology. The results obtainedfrom comparing reading-related potentials recorded from bothnormal and dyslexic children are also reported.
MethodDTW is a nonlinear alignment algorithm that reduces thetemporal differences between morphologically similar signalsthrough local compressions and extensions of their temporalaxes [9]–[10]. The analytic procedure followed by the methodconsists in two different steps performed on paired signals.The first step is the identification of the best correspondencebetween the samples of the signals according to certain crite-ria of similarity. The second step consists of building up anew signal by condensing the morphological characteristicsof those signals from which it was computed.
Given the two signals:
x = {x(i) 1 ≤ i ≤ I}
y = {y( j) 1 ≤ j ≤ J}
with the same sampling rate, it is possible to graphically depicta temporal correspondence between their samples in aCartesian plot, as shown in Figure 1. The line linking the asso-ciated samples is called the warping function (WF):
WF = {{{WWWFFF(((kkk))) = (iii(((kkk))),,, j(k)
)1 ≤ k ≤ K}}}
with max (I, J) ≤ K < I + J − 1.
The WF has to respect the boundary limitations: WF(1) =(1, 1) and WF(K) = (I, J). This means that the first and thelast samples of the signals x(i) and y(j) have to be associatedtogether. In this way, all the signals samples are consideredin the alignment. Furthermore, the WF has to be continuousand monotonic, not decreasing. As a consequence, the asso-ciation between the samples of the signals is univocal with-out skips of samples. In order to prevent excessiveadjustment of the time axes during alignment, the WF has tobe confined in the region around the main diagonal definedby the following relation:
|i(k) − j(k)| ≤ r.
This constraint prevents that two samples of the signals far-ther than r samples are associated together. Due to thenoise usually superimposed on the signals, it is advisable toavoid the WF following the noise more than the signal.With this intent, the following slope constraint conditionwas imposed:
p = n/
m
where n represents the number of diagonal segments and m thenumber of horizontal or vertical segments that the WF canconsecutively contain. This constraint prevents, after m con-secutive horizontal or vertical segments, the WF stepping fur-ther in the same direction without making at least nconsecutive diagonal segments.
Fig. 1. An example of a warping function (WF(i (k), j (k)))com-puted on the sampled signals x(i )and y(j).
100
ms
2 µV
y
X
100 ms 2 µV
J
j
11 i
r
WF (i(k), j(k))
I

70 IEEE ENGINEERING IN MEDICINE AND BIOLOGY MAGAZINE JANUARY/FEBRUARY 2005
In case of no distortion, the WF is equal to the main diago-nal. The only allowed moves of the WF are: horizontal (com-pression axis j), vertical (compression axis i), and diagonal (nocompression axes i and j).
In order to compute the WF, a measure of the morphologi-cal distance between the samples of the signals was defined.This measure was called dissimilarity function and wasdescribed by the following equation:
d(k) =∣∣∣xn
(i(k)
) − yn
(j(k)
)∣∣∣ +∣∣∣x′
n
(i(k)
) − y′n
(j(k)
)∣∣∣
where the apex ′ indicates first derivative and n indicatesnormalization between 0 and 1. This function was comput-ed at every point of the warping plane, satisfying the pre-viously imposed constraints. Wishing to align the signalsaccording to their morphological similarity, the associationbetween their samples is obtained by minimizing the fol-lowing figure of merit:
D(x, y) =
K∑k=1
d (k) s (k)
K∑k=1
s (k)
where the weights s(k) determine if the compression orextension of the temporal axis of one signal has to be privi-leged in comparison with the other. In the present work, we
assumed that all the signals conveyed the same information;therefore a symmetric alignment was performed by comput-ing the weights s(k) as indicated below:
s(k) = (i(k) − i(k − 1)
) + (j(k) − j(k − 1)
)
with K∑
k=1s (k) = I + J.
Applying dynamic programming principles, a matrixG(I,J)
= [g(k)] = [g(i(k), j(k))] was computed as follows:
g(k) = mink−1
[g(k − 1) + d(k)s(k)
]
with the initial condition:
g(W(1)
) = g(1, 1) = d(1, 1)s(1),
The generic element g(k) measures the minimum cost to reachthe point (i(k), j(k)) from (1, 1). The WF representing thebest alignment between the whole signals corresponds to thepath in matrix G with the minimum cost reaching the point(I, J) from the point (1, 1).
At this stage, a new waveform (template) is computed byaveraging the original signals according to the WF. Thisnew waveform condenses the morphological characteristicsof the signals x(i) and y( j) without being distorted by thelatency differences between their components. We obtainedthe template by applying the double-mean technique con-sisting of three steps. The first step produces a vector r, thatappears as follows:
r =[. . . x
(i(k)
)y(
j(k))
x(i(k + 1)
)y(
j(k + 1))
. . .].
The pair [x(i(k)) y( j(k))] is repeated two times when thesegment between WF(k − 1) and WF(k) is diagonal.
The second step consists in the computation of a first aver-age m(a) according to the following:
m(a) = r(b) + r(b + 1)
2.
The last step allows the computation of the template as anaverage of the signal m(a):
IEEE ENGINEERING IN MEDICINE AND BIOLOGY MAGAZINE JANUARY/FEBRUARY 2005
Fig. 2. The alignment of the sampled signals x(i )and y(j) . Thesegments between the traces represent the temporal corre-spondence between morphologically similar samples of thetwo signals. The thick line represents the template computedwith the double-mean technique after aligning x(i )and y(j).
AW(l)
x(i)
y(j)
5 µV
100 ms
The latency variability of cognitive
ERPs produces a marked smoothing of
their components when averaging
across subjects is applied.

IEEE ENGINEERING IN MEDICINE AND BIOLOGY MAGAZINE JANUARY/FEBRUARY 2005 71
AW(l) = m(a) + m(a + 1)
2.
Figure 2 shows the temporal correspon-dence between two signals, x(i) and y( j),after alignment and the template resultingfrom the double-mean technique.
The computation of the template onmore than two signals is realized by iter-atively applying the method describedabove to paired signals following a bina-ry tree structure, as shown in Figure 3.
After the computation of a templateon a set of signals, the alignment of thetemplate with each of the original sig-nals produces a temporal correspon-dence between the samples of thetemplate and the signals. As a conse-quence, the temporal location of physiologically relevantcomponents detected on the template is automaticallyidentified on the original signals, thus quantifying aver-aged ERPs’ morphology.
Experimental Protocol
SubjectsThirty-two normal children (nine females and 23 males) rang-ing in age from 8.17 to 10.75 years (mean age 9.56 ± 0.67years) and 16 children with developmental dyslexia (threefemales and 13 males) ranging in age from 8 to 10.58 years(mean age 9.05 ± 0.84 years) participated in the experiment.The children with developmental dyslexia were diagnosedaccording to DSM IV-R criteria [11], and the discrepancybetween chronological age and reading age was obtained usingthe Direct Test of Reading and Spelling (TDLS), the Italianadaptation of the Boder test [12], [13]. All children wereinformed of the experimental procedure, and written consentwas obtained from parents and children. The entire experimen-tal protocol was approved by the hospital’s ethical committee.
Experimental SettingThe stimuli consisted of the central presentation of 21 Italianalphabetic capital and small letters produced by a vacuumfluorescent display (brilliance: 175 fLumen). Each stimuluswas 8 or 6 mm high for capital and small letters, respective-ly, and 3.5 mm wide, and its persistence on the screen was25 ms. A minimum of four sets of stimuli were presented inthe same random order for all subjects. When cooperationwas poor, in the case of some dyslexic children, it was neces-sary to increase the number of stimuli. The distance betweenthe examined subject and the display was 70 cm, and theangle of reading was 0.29.
Reading-related potentials were recorded during two con-ditions. The first condition, letter presentation (LPR), waspassive: subjects passively watched letters without makingany effort to read or articulate them silently. The second con-dition, letter recognition (LRE), was active: subjects readaloud the letters randomly appearing on the screen after thetechnician pressed a button. Single, isolated letters were usedinstead of words to avoid semantic inferences from contextthat might influence the reading processes of dyslexic
children. Subjects sat in a dimly illuminated, electrically andacoustically shielded room.
EEG RecordingEEG was recorded using Ag-AgCl electrodes fromFz, Cz, Pz, Oz, C4′, C3′, T4, T3, P4, P3 , referred to linkedmastoids. Resistance was less than 10 k�. The EOG wasbipolarly recorded using two electrodes diagonally placedabove and below the right eye. Electroencephalogram (EEG)and electrooculogram (EOG) recordings were bandpass fil-tered between 0.02–30 Hz. Lip movements were bipolarlyrecorded by two electrodes placed on the superior and inferiororbicularis oris muscles; this electromyograph (EMG) signalwas bandpass filtered between 160–3,000 Hz. Electro-cardiogram (ECG) and pneumogram were also recorded, andbandpass was filtered between 0.005–3,000 Hz. A microphonewas used to record the subjects’ voices. The EEG and EOGsignals were sampled at 250 Hz with 4 s analysis time, 2 s pre-and 2 s poststimulus.
Analysis ProtocolBefore averaging, the trials affected by artifacts generated bynonocular sources of noise (gross body movements, muscularactivity, etc.) were rejected by visual inspection. Artifactsfrom ocular movements and blinks were reduced by applyingprincipal component analysis as described in [14], thusimproving the signal-to-noise ratio (SNR) of averaged ERPs.
All ERPs were divided into four sets: two for the twotasks in the control group and two for the two tasks in thegroup with dyslexia. Alignment was separately performedon each set of potentials: four templates were obtained byiteratively applying DTW to pairs of signals according to abinary tree. Since each set contained a number of signalsequal to a power of two, the binary tree was well balancedand all the original signals equally contributed to the tem-plate. The method was not applied to the entire ERP record-ing window but to the signal recorded in the first 700 ms poststimulus time. This restriction allowed reductionof the computing time and was large enough to contain mostof the ERP components of interest. The parameters associat-ed to the boundaries of the WF were empirically set to thefollowing values: r = 8 samples (corresponding to 32 ms) and p = 1.
Fig. 3. The computation of a template on four signals (x1,x2,x3,x4). The thin seg-ments represent the temporal correspondence between the samples of the sig-nals. The method is applied to x1, x2, thus obtaining x1,2, and to x3,x4, thusobtaining x3,4. Then, the method is applied to x1,2,x3,4, thus obtaining the templatex1,2,3,4.
x1
x2
x4
x3
x3,4
x1,2
x1,2,3,4
72
A skilled technician analyzed the templates to detect themost relevant ERP components. The temporal location ofthese components on averaged ERPs was automaticallycomputed by aligning each original ERP with the corre-sponding template.
The templates were superimposed on traditionally comput-ed grand averages to point out the advantages of the method inreducing jitter effect due to the potentials’ latency variability.A two-sided t-test analysis was performed to evaluate the dis-similarities in latency and amplitude of the relevant ERP com-ponents between the two groups of children during the tworeading tasks (we considered significant the differences withp < 0.025). The automatically identified ERP componentswere compared to the manual measurements in order to quan-tify the efficacy of the method.
Results
Comparison Between Grand Averagesand TemplatesFigure 4 shows the superimposition of grand averages (thicklines) and templates (thin lines) computed on the ERPs record-ed from C3′ and P3 channels in 32 normal children during theletter presentation task. The latency variability of cognitiveERPs produces a marked smoothing of their components
when averaging across subjects is applied. As a consequence,certain waves can be hardly detected on the traces becausetheir amplitude is clearly reduced (see Figure 4). The deforma-tion of the temporal axes performed by DTW allows the corre-sponding peaks and troughs to align before interindividualaveraging. Therefore, the template’s morphology is sharperthan that of the grand averages, and the ERP components areeasier to identify.
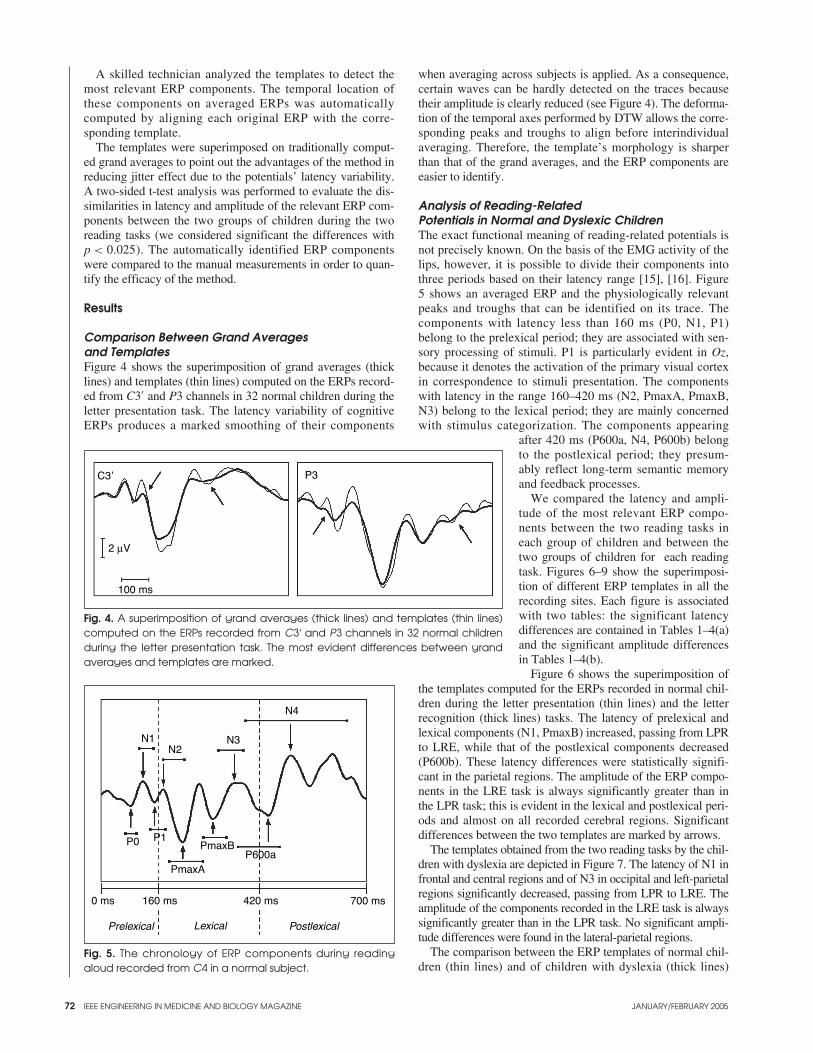
Analysis of Reading-RelatedPotentials in Normal and Dyslexic ChildrenThe exact functional meaning of reading-related potentials isnot precisely known. On the basis of the EMG activity of thelips, however, it is possible to divide their components intothree periods based on their latency range [15], [16]. Figure5 shows an averaged ERP and the physiologically relevantpeaks and troughs that can be identified on its trace. Thecomponents with latency less than 160 ms (P0, N1, P1)belong to the prelexical period; they are associated with sen-sory processing of stimuli. P1 is particularly evident in Oz,because it denotes the activation of the primary visual cortexin correspondence to stimuli presentation. The componentswith latency in the range 160–420 ms (N2, PmaxA, PmaxB,N3) belong to the lexical period; they are mainly concernedwith stimulus categorization. The components appearing
after 420 ms (P600a, N4, P600b) belongto the postlexical period; they presum-ably reflect long-term semantic memoryand feedback processes.
We compared the latency and ampli-tude of the most relevant ERP compo-nents between the two reading tasks ineach group of children and between thetwo groups of children for each readingtask. Figures 6–9 show the superimposi-tion of different ERP templates in all therecording sites. Each figure is associatedwith two tables: the significant latencydifferences are contained in Tables 1–4(a)and the significant amplitude differencesin Tables 1–4(b).
Figure 6 shows the superimposition ofthe templates computed for the ERPs recorded in normal chil-dren during the letter presentation (thin lines) and the letterrecognition (thick lines) tasks. The latency of prelexical andlexical components (N1, PmaxB) increased, passing from LPRto LRE, while that of the postlexical components decreased(P600b). These latency differences were statistically signifi-cant in the parietal regions. The amplitude of the ERP compo-nents in the LRE task is always significantly greater than inthe LPR task; this is evident in the lexical and postlexical peri-ods and almost on all recorded cerebral regions. Significantdifferences between the two templates are marked by arrows.
The templates obtained from the two reading tasks by the chil-dren with dyslexia are depicted in Figure 7. The latency of N1 infrontal and central regions and of N3 in occipital and left-parietalregions significantly decreased, passing from LPR to LRE. Theamplitude of the components recorded in the LRE task is alwayssignificantly greater than in the LPR task. No significant ampli-tude differences were found in the lateral-parietal regions.
The comparison between the ERP templates of normal chil-dren (thin lines) and of children with dyslexia (thick lines)
IEEE ENGINEERING IN MEDICINE AND BIOLOGY MAGAZINE JANUARY/FEBRUARY 2005
Fig. 4. A superimposition of grand averages (thick lines) and templates (thin lines)computed on the ERPs recorded from C3′ and P3 channels in 32 normal childrenduring the letter presentation task. The most evident differences between grandaverages and templates are marked.
C3ʼ P3
2 µV
100 ms
Fig. 5. The chronology of ERP components during readingaloud recorded from C4 in a normal subject.
0 ms
Prelexical Lexical Postlexical
160 ms 420 ms 700 ms
N1
P0
PmaxA
PmaxBP600a
P1
N2N3
N4

IEEE ENGINEERING IN MEDICINE AND BIOLOGY MAGAZINE JANUARY/FEBRUARY 2005 73
during the letter presentation task is plotted in Figure 8. Thelatency of most of the components is significantly greater indyslexic children in comparison with controls. No significantdifferences were noticed in the temporal regions. Consideringthe amplitude, only N2 in Cz is significantly higher in dyslexicscompared to controls.
For the letter recognition task, the templates computed fromthe two groups of children are shown in Figure 9. In the ERPcomponents recorded from dyslexic children in the temporaland occipital regions, there was a general increase of latencyin comparison with normal children. The significant amplitudedifferences were located in the left hemisphere (channels C3′
and P3) and consisted of an amplitude reduction of N3 and anamplitude increase of N2.
Quantification of the Method PerformancesConsidering the ERPs recorded from all the subjects in thetwo conditions, the whole number of peaks and troughs thatcan be automatically measured by means of DTW is 5,149.The component P600b is not considered because its latency inindividual ERPs is often outside the upper boundary of thetemporal window used for the alignment. Of these compo-nents, 68.56% were correctly identified by the method.
Figure 10 shows the percentage of correct automatic detec-tions for each component. P1 is the potential that was bestidentified automatically by the method, while the highest num-ber of mistakes was made with N4. In general, the efficacy ofthe method in the automatic detection of peaks and troughsdecreases as latency increases. In fact, the cognitive and
Fig. 8. A superimposition of the ERP templates obtained dur-ing the LPR task from the control group (thin lines) and thechildren with dyslexia (thick lines). Arrows mark significant dif-ferences of latency and amplitude between the two poten-tials (p < 0.025).
Fig. 9. A superimposition of the ERP templates obtained dur-ing the LRE task from the control group (thin lines) and thechildren with dyslexia (thick lines). Arrows mark significant dif-ferences of latency and amplitude between the two poten-tials (p < 0.025).
Fig. 6. A superimposition of the ERP templates obtained fromthe control group during the LPR (thin lines) and LRE (thicklines) tasks. Arrows mark significant differences of latency andamplitude between the two potentials (p < 0.025).
N3
PmaxA
N1P4
Fz
C3' C4'
T3
P3
Oz
Pz
T4
P4
Cz
100 ms5 µV
Fig. 7. A superimposition of the ERP templates obtained fromthe group with dyslexia during the LPR (thin lines) and LRE(thick lines) tasks. Arrows mark significant differences of laten-cy and amplitude between the two potentials (p < 0.025).
N1
N1
N3
Fz
C3' C4'
T3
P3
Oz
Pz
T4
P4
Cz
100 ms
5 µV
N1
N3
PmaxA
Fz
C3' C4'
T3
P3
Oz
Pz
T4
P4
Cz
100 ms2 µV
N1
P1
P600a
Fz
C3' C4'
T3
P3
Oz
Pz
T4
P4
Cz
100 ms5 µV

74
higher-order components are characterized by a greater laten-cy variability in comparison with those related to lower levelsof sensorial processing of stimuli.
DiscussionThe analysis of cognitive ERPs recorded in children is diffi-cult because of their marked morphological variability in bothamplitude and latency. The necessity of manually measuringthe morphological characteristics of these potentials and theinevitable smoothing produced by grand averaging affect thereliability of group analyses. DTW proved to be useful forimproving the comparison between the ERPs recorded in dif-ferent subjects. In fact, it reduces the morphological differ-ences between the signals by stretching and shrinking theirtemporal axes. The ERP templates of homogeneous groups ofsubjects had a well-defined and sharper morphology comparedto grand averages. Consequently, the quantification of groupcharacteristics (latency and amplitude of the main cerebralcomponents) was more precise and easier to perform.
After the computation of the templates, DTW was used toautomatically identify the relevant ERP components by align-ing the templates with individual averaged potentials. Themethod proved to successfully measure a significant percent-age of the peaks and troughs present on the traces. The manycomponents contribute differently to the total, because theycannot be clearly identified on all channels and subjects.Taking into account this feature, we computed the percentageof peaks and troughs correctly identified by the method. Ascould be inferred from the higher latency variability of cogni-tive components, the efficacy of the method is reduced for longlatencies compared to short and middle ones. In order to furtherimprove the method performances, it could be useful to varythe boundaries for computing the WF according to latency,increasing the alignment flexibility for cognitive components.
Combining the automatic identification of ERP componentswith a manual correction when necessary, we were able to char-acterize the morphology of reading-related potentials and toextract psychophysiologically relevant differences between nor-mal and dyslexic children. The comparison between the ERPsrecorded in normal children during LPR and LRE put into evi-dence that parietal regions are discriminating for reading aloudversus passive watching of letters. The importance of such areasin reading processes was also pointed out by other studies [17].Furthermore, the extensive and remarkable increase of amplitudeduring active reading revealed that the request of an explicit ver-bal-motor performance activates specific attention processesbesides motion-related functions. Considering the group with
IEEE ENGINEERING IN MEDICINE AND BIOLOGY MAGAZINE JANUARY/FEBRUARY 2005
Tab
le 1
(b).
The
am
plit
ude
[µµµV
] of s
igni
fica
ntly
diff
ere
nt c
om
po
nent
s (p
<<<0.
025)
be
twe
en
LPR
and
LRE
in th
e c
ont
rol g
roup
(m
ea
n ±±±
sta
nda
rd d
evi
atio
n). U
nde
rline
d c
hara
cte
rs in
dic
ate
p<<<
0.01
.
Cha
nnel
Com
pone
ntFz
Cz
PzO
zC
3′T4
T3P4
P3
N2
LPR
−9.0
9±
5.87
−6.0
9±
3.00
LRE
−11.
13±
7.11
−7.2
0±
3.23
Pma
xALP
R8.
07±
4.61
9.09
±5.
807.
02±
6.10
8.43
±4.
25LR
E10
.81
±5.
7811
.52
±6.
2311
.24
±9.
1310
.66
±4.
94
Pma
xBLP
R10
.21
±5.
215.
71±
3.69
12.2
7±
7.11
LRE
14.9
3±
4.83
7.66
±4.
5616
.20
±7.
10
N3
LPR
−10.
86±
5.61
−9.7
7±
5.59
−3.7
1±
2.31
−4.3
9±
2.27
LRE
−15.
08±
4.97
−12.
02±
5.80
−5.2
0±
2.26
−6.8
7±
2.70
P600
aLP
R3.
91±
1.93
5.70
±3.
727.
16±
3.85
4.84
±2.
584.
30±
2.69
4.22
±2.
935.
36±
3.22
LRE
5.97
±3.
469.
31±
4.63
11.2
0±
5.58
6.98
±3.
565.
77±
2.71
6.75
±3.
307.
82±
4.35
P600
bLP
R5.
57±
2.00
4.87
±1.
99LR
E10
.17
±5.
477.
84±
4.06
Table 1(a). The latency [ms] of significantly different components(p <<< 0.025) between LPR and LRE in the control group (mean±±± standard deviation). Underlined characters indicate p <<< 0.01.
Channel
Component Pz P4 P3
N1 LPR 101.38 ±17.75LRE 115.71 ±17.21
PmaxB LPR 308.02 ± 21.86LRE 317.87 ± 20.31
P600b LPR 713.30 ± 89.20 693.20 ± 73.77LRE 628.72 ± 66.13 624.77 ± 63.80

IEEE ENGINEERING IN MEDICINE AND BIOLOGY MAGAZINE JANUARY/FEBRUARY 2005 75
dyslexia, the comparison between the potentials recorded in thetwo tasks showed significant latency differences in the frontaland central regions. The amplitude of the potentials in LRE wassignificantly increased with respect to LPR in almost all therecorded scalp sites, except for the parietal regions. Comparingthese observations with those from the control group, it is possi-ble to argue that, when watching letters, the physiological mech-anisms that are activated are altered and that the strategies for theorganization of reading aloud are abnormal. The direct compari-son between the two groups of subjects in each separate taskallowed the detection of specific differences in the main ERPcomponents. In the LPR task, the main differences concernedlatency, while amplitude differences were negligible. The laten-cy of several ERP components was increased in dyslexic chil-dren compared to controls in almost all the EEG channels exceptfor the temporal ones. The latency differences affecting thepostlexical components were greater than those affecting the pre-and lexical ones. For the LRE task, the latency of the ERP com-ponents in the occipital and temporal regions was increased indyslexic children compared to controls. The finding of fewerlatency differences between the two groups in LRE compared toLPR suggests that the attention processes activated by verbal-motor production contribute to increasing the efficiency of thecerebral reading functions. Significant amplitude differenceswere found in the central and parietal regions of the left hemi-sphere, which is undoubtedly involved in language processing.
In conclusion, the method described in this article improvesthe comparison of ERPs recorded in different groups of sub-jects—and in different experimentalconditions—through the computa-tion of proper templates representingthe relevant group of cerebral poten-tials without morphological alter-ations. Furthermore, the partiallyautomatic identification of featuresallowed by the method makes theanalysis of ERPs easier, quicker,and more reliable because the sub-jective manual intervention of theexperimenter is reduced. The com-parison between the potentials
recorded in normal children during two reading conditions,which were characterized by increasing cognitive effort, high-lighted some physiological strategies activated during reading.
In particular, reading aloud likely activates attentionprocesses that are able to recruit larger neuronal resources forthe execution of the task. The visual presentation of single let-ters employed in this experimental setting led the cerebralactivity focusing on the strict association between graphemesand phonemes. In this condition, we evaluated the poor effi-ciency of dyslexic children in building and employing a cere-bral map of correspondence between written letters and theirsounds. The most evident difference between the two groupsof subjects in both reading tasks is an extensive delay of themain ERP components. This delay increases from shorter tolonger latencies. The involvement of several componentsrelated to perceptive functions, memory, attention, and cogni-tive processes shows that dyslexia is a pathology in which notonly the reading mechanisms, but also more general functions,at different time scales are compromised. The finding of groupdifferences in the right hemisphere supports the hypothesis ofdyslexia as a spread disorder which is not limited to the classi-cal brain areas normally involved in linguistic abilities.
The use of mathematical procedures for quantifying ERPs’morphology is critical for making the analysis of cognitivepotentials independent from the subjective judgment of theexperimenter. Furthermore, the comparison among studiesrealized by different research laboratories would benefit fromthe implementation of more reproducible analysis criteria.
Table 2(a). The latency [ms] of significantly different components (p <<< 0.025)between LPR and LRE in children with dyslexia (mean ±±± standard deviation).Underlined characters indicate p <<< 0.01.
Channel
Component Fz Cz Oz P3
N1 LPR 129.56 ± 17.95 129.93 ± 21.78LRE 113.46 ± 17.05 106.41 ± 16.90
N3 LPR 425.20 ± 29.10 406.61 ± 26.18LRE 394.96 ± 24.95 383.17 ± 24.61
Table 2(b). The amplitude [µµµV] of significantly different components (p <<< 0.025) between LPR and LREin children with dyslexia (mean ±±± standard deviation). Underlined characters indicate p <<< 0.01.
Channel
Component Fz Cz Pz Oz C4′ T4 T3
N1 LPR −1.64 ±1.30 −2.75 ±1.28LRE −3.24 ±1.38 −3.32 ±1.30
PmaxA LPR 9.73 ± 3.31LRE 13.01 ± 4.61
PmaxB LPR 9.67 ± 6.11LRE 14.30 ± 7.37
N3 LPR −9.20 ± 4.07LRE −13.26 ± 6.83
P600a LPR 5.62 ± 4.21 6.83 ± 5.08 3.72 ± 1.89LRE 10.39 ± 4.45 12.35 ± 6.35 6.87 ± 2.18
P600b LPR 5.29 ± 1.59LRE 9.30 ± 4.09

76 IEEE ENGINEERING IN MEDICINE AND BIOLOGY MAGAZINE JANUARY/FEBRUARY 2005
Tab
le 3
(a).
The
late
ncy
[ms]
of s
igni
fica
ntly
diff
ere
nt c
om
po
nent
s (p
<<<0.
025)
be
twe
en
norm
al c
hild
ren
(N)
and
chi
ldre
n w
ith d
ysle
xia
(D
) d
urin
g L
PR (
me
an
±±±st
and
ard
de
via
tion)
. Und
erli
ned
cha
rac
ters
ind
ica
te p
<<<0.
01.
Cha
nnel
Com
pone
ntFz
Cz
PzO
zC
4′C
3′P4
P3
P0N
80.7
2±1
8.63
D10
3.42
±20
.05
N1
N11
4.37
±17.
9411
0.54
±15.
7611
0.73
±13.
1411
3.01
±16.
33D
130.
59±1
9.07
131.
37±
22.0
712
4.42
±18.
6112
8.98
±17.
86
Pma
xAN
224.
97±
22.5
123
2.21
±21
.08
226.
56±1
9.42
D25
1.23
±29
.26
257.
34±1
7.66
265.
29±1
6.79
N3
N38
7.97
±19.
2439
2.33
±26
.52
D40
5.61
±26
.78
421.
11±
27.6
4
P600
aN
453.
08±
35.5
345
7.45
±39
.75
D48
9.49
±29
.24
495.
51±
31.9
1
Table 3(b). The amplitude [µµµV] of significantly differentcomponents (p <<< 0.025) between normal children (N) andchildren with dyslexia (D) during LPR (mean ±±± standarddeviation). Underlined characters indicate p <<< 0.01.
Channel
Component Cz
N2 N −2.39 ±1.20D −4.71 ± 2.71
Table 4(b). The amplitude [µµµV] of significantly differentcomponents (p <<< 0.025) between normal children (N) andchildren with dyslexia (D) during LRE (mean ±±± standarddeviation). Underlined characters indicate p <<< 0.01.
Channel
Component C3′ P3
N2 N −2.68 ± 2.05D −4.59 ± 1.73
N3 N −9.64 ± 5.34D −6.17 ± 3.26
Table 4(a). The latency [ms] of significantly differentcomponents (p <<< 0.025) between normal children (N) andchildren with dyslexia (D) during LRE (mean ±±± standarddeviation). Underlined characters indicate p <<< 0.01.
Channel
Component Oz T4 T3
N1 N 107.26 ±10.52 109.22 ±13.14D 120.79 ±19.02 121.90 ±19.75
P1 N 143.06 ±13.27D 152.88 ±13.26
N2 N 180.85 ±14.30D 199.40 ± 22.14
PmaxA N 211.19 ± 23.47D 240.00 ± 23.76
P600a N 457.41 ± 32.65D 496.19 ± 31.24
Fig. 10. The percentage of correct automatic detections foreach component.
90
80
70
60
50
40
30
20
10
0P0 N1 P1 N2 Pmax
BPmax
AN3 P4 N4 P600
a

IEEE ENGINEERING IN MEDICINE AND BIOLOGY MAGAZINE JANUARY/FEBRUARY 2005 77
Silvia Casarotto graduated with an M.A.in biomedical engineering, with an empha-sis in neural signals processing, from thePolytechnic University of Milan, Italy, in2002. She is currently a Ph.D. student ofbioengineering at the same university. Hercurrent research focuses on the integrationof electrophysiology and functional neu-
roimaging for investigating the reading processes in normalchildren and in children affected by developmental dyslexia.
Anna M. Bianchi received the Laurea degreein electronic engineering from the PolytechnicUniversity of Milan, Italy, in 1987.Afterwards, she was a research fellow in theLaboratory of Biomedical Engineering at SanRaffaele Hospital in Milan, Italy, and from1990 to 2000 she was a research assistant inthe same laboratory. Now, she is a researcher
at the Department of Biomedical Engineering of the PolytechnicUniversity of Milan, and she is also a professor of electronic bio-engineering foundations in the biomedical engineering course atthe university. Her research interests are mainly related to bio-medical signal processing and biomedical system modeling, withparticular applications to the cardiovascular and neurosensorialsystems. She is studying and developing methods and algorithmsfor time-frequency analysis of nonstationary signals, includingtime frequency distributions, wavelets, and recursive parametricidentification. She is the published author of various papers andbook chapters on these topics.
Sergio Cerutti received the Laurea degree inelectronic engineering from the PolytechnicUniversity of Milan, Italy, in 1971. From1982 to 1990 he was an associate professor ofbiomedical engineering at the Department ofElectrical Engineering and, later, at theDepartment of Biomedical Engineering of thesame university. He has been a professor of
biomedical signal and data processing for the Department ofBiomedical Engineering since 1994 and the department’s direc-tor since 2000. From 1990 to 1994, he was a professor of bio-medical engineering at the Department of Computer and SystemSciences of the University of Rome “La Sapienza,” Italy.
His research activity is mainly dedicated to various aspectsof biomedical signal and data processing and modeling relatedto the cardiovascular system and in the field of neurosciences.He is the author of more than 250 papers on these topics pub-lished in qualified international scientific literature. He hascoordinated various research projects at national and interna-tional levels in various topics of biomedical engineering andbioinfomatics. He spent over a year as a visiting professor atthe Massachusetts Institute of Technology and the HarvardSchool of Public Health, Boston, Massachusetts. He has beenchairman of the bachelor track in biomedical engineering ofthe same polytechnic from 1996–2000. He is chairman of theBiomedical Engineering Group of the Italian AEI (Associationof Electrical Engineering). He is a member of IEEE-AEI,IFMBE-AIIMB, ESEM, IEC-CEI and other international andnational scientific associations. He is on the editorial board ofvarious biomedical engineering journals; in particular, he is anassociate editor of IEEE Transactions on Biomedical
Engineering. He also has been the organizer of three IEEE-EMBS International Summer Schools on Biomedical SignalProcessing held in Siena, Italy. He was also elected member ofthe Consultive Committee 09-Industrial Engineering of CUN(University National Committee) from 1988–1996 and wassecretary of the same consultive committee.
Giuseppe A. Chiarenza received medicalpostgraduate training in child and adoles-cent neuropsychiatry and neurology. He hasbeen a senior researcher at MilanUniversity. He is currently head of theMental Health Department of AziendaOspedaliera “G. Salvini,” GarbagnateMilanese (Milan, Italy) and director of the
Child and Adolescent Neuropsychiatry Unit of Rho Hospital.He is also a professor of child neuropsychiatry at the CatholicUniversity of Piacenza. He is actively working in the develop-mental neuropsychology field, with particular interest ondyslexia and attention deficit hyperactivity disorder.
Address for Correspondence: Silvia Casarotto, via Buozzi11, 20085 Locate Triulzi, Milan, Italy. Phone: +39 0290730850, +39 338 4897257. Fax: +39 02 90730850. E-mail:[email protected].
References[1] W.E. Brown, S. Eliez, V. Menon, C.D. White, and A.L. Reiss, “Preliminaryevidence of widespread morphological variations of the brain in dyslexia,”Neurology, vol. 56, no. 6, pp. 781–783, 2001.[2] M. Habib, “The neurological basis of developmental dyslexia,” Brain, vol. 123,pp. 2373–2399, 2000.[3] F. Ramus, “Talk of two theories,” Nature, vol. 412, no. 6845, pp. 393–395, 2001.[4] S.E. Shaywitz, B.A. Shaywitz, K.R. Pugh, R.K. Fulbright, R.T. Constable,W.E. Mencl, D.P. Shankweiler, A.M. Liberman, P. Skudlarski, J.M. Fletcher, L. Katz,K.E. Marchine, C. Lacadie, C. Gatenby, and J.C. Gore, “Functional disruption inthe organization of the brain for reading in dyslexia,” Proc. Natl. Acad. Sci. USA,vol. 95, no. 5, pp. 2636–2641, 1998.[5] E.L. Grigorenko, “Developmental dyslexia: An update on genes, brains andenvironments,” J. Child Psychol. Psychiat., vol. 42, no. 1, pp. 91–125, 2001.[6] E. Paulesu, J-F. Demonet, F. Fazio, E. McCrory, V. Chanoine, N. Brunswick,S.F. Cappa, G. Cossu, M. Habib, C.D. Frith, and U. Frith, “Dyslexia: Culturaldiversity and biological unity,” Science, vol. 291, no. 5511, pp. 2165–2167, 2001.[7] G.A. Chiarenza, “Linee guida dei disturbi specifici di apprendimento,”Giornale Italiano di Neuropsichiatria Infantile, vol. 24, pp. 79–95, 2004.[8] J. Intriligator and J. Polich, “On the relationship between EEG and ERP vari-ability,” Int. J. Psychophysiology, vol. 20, no. 1,pp. 59–74, 1995.[9] E.G. Caiani, A. Porta, G. Baselli, M. Turiel, S. Muzzupappa, M. Pagani, A. Malliani,and S. Cerutti, “Analysis of cardiac left-ventricular volume based on time warpingaveraging,” Med. Biol. Eng. Comput., vol. 40, no. 2, pp. 225–233, 2002.[10] H. Sakoe and S. Chiba, “Dynamic programming algorithm optimisation forspoken word recognition,” IEEE Trans. Acoust., Speech, Signal Processing, vol.26, no. 1, pp. 43–49, Feb. 1978.[11] American Psychiatric Association, Diagnostic and statistical manual of men-tal disorders, 4th ed. Washington, DC: American Psychiatric Association, 1994.[12] E. Boder, “Developmental dyslexia: A diagnostic approach based on 3 atypicalreading-spelling patterns,” Dev. Med. Child Neurol., vol. 15, no. 5, pp. 663–687, 1973.[13] G.A. Chiarenza and D. Bindelli, “Il test diretto di lettura e scrittura (TDLS):Versione computerizzata e dati normativi,” Giornale di Neuropsichiatria dell’eta`Evolutiva, vol. 21, no. 2, pp. 163–179, 2001.[14] S. Casarotto, A.M. Bianchi, S. Cerutti, and G.A. Chiarenza, “Principal componentanalysis for reduction of ocular artefacts in event-related potentials of normal anddyslexic children,” Clinical Neurophysiology, vol. 115, no. 3, pp. 609–619, 2004.[15] E. Courchesne, “Neurophysiological correlates of cognitive development:Changes in long-latency event-related potentials from childhood to adoulthood,”Electr. Clin. Neurophysiol., vol. 45, no. 4, pp. 468–482, 1978.[16] R. Licht, D.J. Bakker, A. Kok, and A. Bouma, “The development of lateralevent-related potentials (ERPs) related to word naming: A four year longitudinalstudy,” Neuropsychologia, vol. 26, no. 2, pp. 327–340, 1988.[17] J.A. Fiez and S.E. Petersen, “Neuroimaging studies of word reading,” Proc.Natl. Acad. Sci. USA, vol. 95, no. 3, pp. 914–921, 1998.