
Automated dynamic sampling system for the on-line monitoring of biogenic emissions from living...
13
930 (2001) 39–51 Journal of Chromatography A, www.elsevier.com / locate / chroma Automated dynamic sampling system for the on-line monitoring of biogenic emissions from living organisms * Joeri Vercammen, Hai Pham-Tuan, Pat Sandra Department of Organic Chemistry, Ghent University, Krijgslaan 281 S4, B-9000 Ghent, Belgium Received 17 April 2001; received in revised form 12 July 2001; accepted 31 July 2001 Abstract An automated system for continuous on-line monitoring of biogenic emissions is presented. The system is designed in such a way that volatiles, emitted as reaction to biotic or abiotic stress, can be unequivocally elucidated. Two identical sampling units, named target and reference bulb, are therefore incorporated into the system and consecutively analyzed in monitoring experiments. A number of precautions were considered during these experiments to avoid the application of unwanted stress onto both organisms. Firstly, the system is constructed in such a way that both bulbs are continuously flushed, i.e. before, during and after analysis, with high purity air to avoid any accumulation of emitted volatiles. Moreover, the air is pre-humidified by bubbling it through water to sustain the biological samples for longer periods in the in vitro environment. Sorptive enrichment on polydimethylsiloxane (PDMS) was used to trap the headspace volatiles. The hydrophobic nature of this material permitted easy removal of trapped moisture by direct flushing of the sampling cartridge with dry air before desorption. The system was used to monitor the emissions from in vitro mechanically wounded ivy ( Hedera helix) and of in vitro grown tomato plants (Lycopersicon esculentum Mill.) upon cotton leafworm (Spodoptera littoralis) feeding. Differences in light and dark floral emissions of jasmine (Jasminum polyanthum) were also studied. 2001 Elsevier Science B.V. All rights reserved. Keywords: Biogenic emissions; Headspace analysis; Sorptive enrichment; Dynamic headspace analysis; Automation; Polydimethylsiloxane 1. Introduction ics), the entire field of interest is very wide and covers many different scientific disciplines. Insect An extremely exciting field of research comprises ecology, phytochemistry, plant physiology, entomol- the search for the overall biological significance of ogy, food and perfume chemistry are some of the components released by biological materials, i.e. areas where investigation of volatile emissions is biogenic emissions. Owing to the large diversity in carried out regularly. emission sources (animals, plants) as well as in The potential impact generated results may exhibit compound types (permanent gases, volatile organ- is far-reaching and not restricted solely to these areas. It is quite well known, for instance, that the communication within troops of social insects (bees, *Corresponding author. Tel.: 132-9-264-4462; fax: 132-9- ants, wasps) primarily passes via volatile secretions 264-4998. E-mail address: [email protected] (P. Sandra). (pheromones) [1], an effect that has been employed 0021-9673 / 01 / $ – see front matter 2001 Elsevier Science B.V. All rights reserved. PII: S0021-9673(01)01172-4
-
Upload
independent -
Category
Documents
-
view
0 -
download
0
Transcript of Automated dynamic sampling system for the on-line monitoring of biogenic emissions from living...
930 (2001) 39–51Journal of Chromatography A,www.elsevier.com/ locate /chroma
Automated dynamic sampling system for the on-line monitoring ofbiogenic emissions from living organisms
*Joeri Vercammen, Hai Pham-Tuan, Pat SandraDepartment of Organic Chemistry, Ghent University, Krijgslaan 281 S4, B-9000 Ghent, Belgium
Received 17 April 2001; received in revised form 12 July 2001; accepted 31 July 2001
Abstract
An automated system for continuous on-line monitoring of biogenic emissions is presented. The system is designed insuch a way that volatiles, emitted as reaction to biotic or abiotic stress, can be unequivocally elucidated. Two identicalsampling units, named target and reference bulb, are therefore incorporated into the system and consecutively analyzed inmonitoring experiments. A number of precautions were considered during these experiments to avoid the application ofunwanted stress onto both organisms. Firstly, the system is constructed in such a way that both bulbs are continuouslyflushed, i.e. before, during and after analysis, with high purity air to avoid any accumulation of emitted volatiles. Moreover,the air is pre-humidified by bubbling it through water to sustain the biological samples for longer periods in the in vitroenvironment. Sorptive enrichment on polydimethylsiloxane (PDMS) was used to trap the headspace volatiles. Thehydrophobic nature of this material permitted easy removal of trapped moisture by direct flushing of the sampling cartridgewith dry air before desorption. The system was used to monitor the emissions from in vitro mechanically wounded ivy(Hedera helix) and of in vitro grown tomato plants (Lycopersicon esculentum Mill.) upon cotton leafworm (Spodopteralittoralis) feeding. Differences in light and dark floral emissions of jasmine (Jasminum polyanthum) were also studied. 2001 Elsevier Science B.V. All rights reserved.
Keywords: Biogenic emissions; Headspace analysis; Sorptive enrichment; Dynamic headspace analysis; Automation;Polydimethylsiloxane
1. Introduction ics), the entire field of interest is very wide andcovers many different scientific disciplines. Insect
An extremely exciting field of research comprises ecology, phytochemistry, plant physiology, entomol-the search for the overall biological significance of ogy, food and perfume chemistry are some of thecomponents released by biological materials, i.e. areas where investigation of volatile emissions isbiogenic emissions. Owing to the large diversity in carried out regularly.emission sources (animals, plants) as well as in The potential impact generated results may exhibitcompound types (permanent gases, volatile organ- is far-reaching and not restricted solely to these
areas. It is quite well known, for instance, that thecommunication within troops of social insects (bees,*Corresponding author. Tel.: 132-9-264-4462; fax: 132-9-ants, wasps) primarily passes via volatile secretions264-4998.
E-mail address: [email protected] (P. Sandra). (pheromones) [1], an effect that has been employed
0021-9673/01/$ – see front matter 2001 Elsevier Science B.V. All rights reserved.PI I : S0021-9673( 01 )01172-4
930 (2001) 39–5140 J. Vercammen et al. / J. Chromatogr. A
already in specific insect lures [2]. Moreover, also sampling times and/or high sampling flow-rates arethe field of plant volatile research has experienced necessary to deliver sufficient sensitivity in a reason-great progress. It has been demonstrated, for exam- able amount of time.ple, that certain plant volatiles inhibit fungal prolifer- From a sensitivity standpoint, it is much moreation [3], perhaps indicating future directions for attractive to employ the alternative method, i.e.genetic improvement. Additionally, particular vola- thermal desorption. Here, the adsorbent is inserted intile organics serve as critical volatile markers in such a small oven placed on top of the gas chromatographinsect behaviors as host finding, feeding and oviposi- (GC), which is subsequently heated to elevatedtioning [4,5], and can be eventually exploited to craft temperatures. When properly designed, this set-upeffective methods for control of insect pests, as an allows complete transfer of the sample from trap toalternative to the toxic agrochemicals applied today analytical column. However, the strength of the[6]. A comprehensive overview of the various analyte–surface interactions calls for high desorptionclasses of plant volatiles, their occurrence in crops temperatures, which can lead to the formation ofand non-crops and their overall significance in artifacts and incomplete desorption, especially whenenvironmental interactions was provided by Charron polar and/or higher molecular mass compoundset al. [7]. (MW) are involved [10–12].
As can be expected from the literature dealing Recently, sampling tubes packed with 100% poly-with these topics, presented results primarily focus dimethylsiloxane (PDMS) particles were introducedon the final outcome of the above mentioned effects for the enrichment of volatile emissions [13,14].and although the analytical part is really critical with With this material, preconcentration occurs by sorp-respect to the reliability of the final results, it is often tion or dissolving of the target analytes in the bulk ofmerely of secondary importance. The prime portion the liquid phase instead of adsorption onto a porousof biogenic emissions are analyzed using dynamic surface. Since this process is less energetic comparedadsorptive enrichment, a technique which was de- to adsorption, trapped volatiles are easily desorbedveloped nearly 40 years ago for the analysis of from the trap using thermal desorption, even atapolar to medium polar volatiles in air. The success relatively mild temperatures. In addition, the absenceof this approach is primarily due to the significantly of active sites avoids displacement effects andhigher sensitivity that can be attained compared to catalytic modifications of trapped components fromthe alternative (static) methods such as solid-phase occurring [12]. The performance of the dynamicmicroextraction (SPME) [8] and headspace sorptive configuration with PDMS has been evaluated for theextraction (HSSE) [9]. Unfortunately, dynamic en- analysis of plant volatiles, where it performed su-richment is not free of hazards, especially when perior to Tenax, which was characterized by aapplied without full knowledge of its potential significant interference of degradation products aris-drawbacks. However, all of these problems are a ing from decomposition of the polymeric skeletondirect consequence of the use of adsorbents and and incomplete removal of higher MW analytes [15].originate from the strong interactions that occur Just recently, we described a completely auto-between trapped analytes and the adsorbent surface. mated and stand-alone system for the analysis ofTherefore, sufficient retention and high enrichment gaseous emissions, e.g., ethylene, released by plantsfactors hardly are an issue, though more harsh [16]. However, in order to be able to analyze regulardesorption conditions are required to remove the volatile emissions, an adapted version of this systemanalytes. had to be developed. These adaptations were carried
In general, liquid extraction of the adsorbent bed out successfully and the system was immediatelywith a suitable organic solvent is sufficiently inva- used for determining the response of Arabidopsissive to allow complete desorption. Unfortunately, a thaliana to oxidative damage [17]. The resultsgreat part of the enrichment effect acquired through presented in that particular paper mainly dealt withsampling has to be sacrificed since only a small the various problems and strategies encounteredportion of the final liquid extract is available for when identification of unknown volatiles has to besubsequent analysis. Consequently, relatively long performed, without paying too much attention to the
930 (2001) 39–51 41J. Vercammen et al. / J. Chromatogr. A
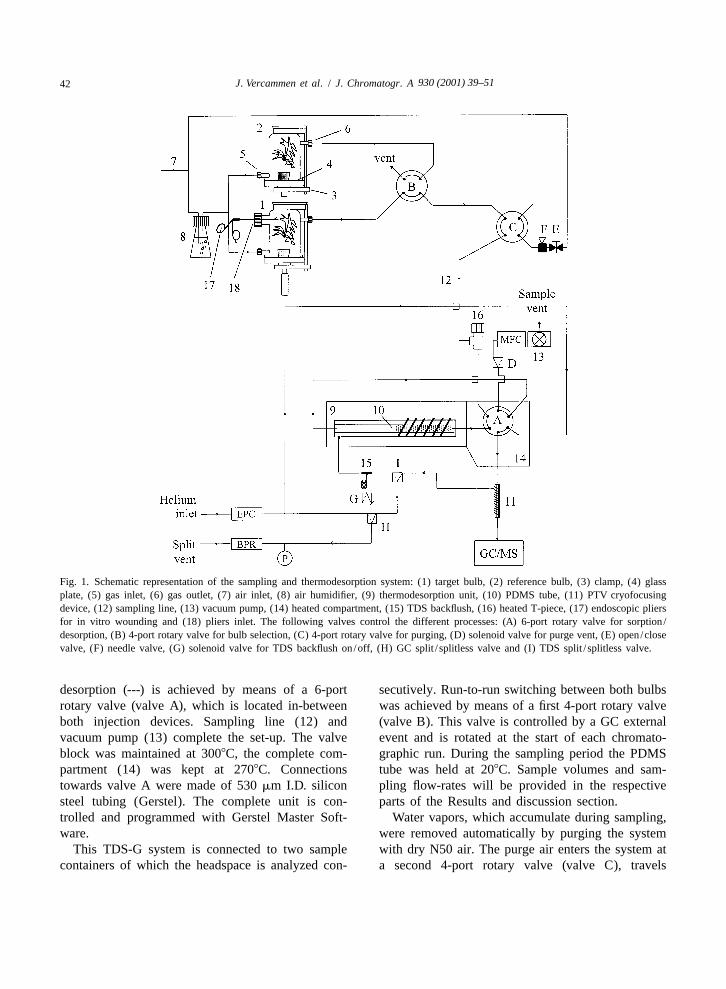
practical operation and additional possibilities of the identical pyrex glass bulbs (1 and 2), both tightlydevice. These particular matters will be discussed in pressed with clamps (3) onto separate glass platesthe present paper. (25325 cm, with 5 cm high glass side plates) (4).
After pressing the bulb onto the plate, the latter wasfilled with a small amount of purified water (Milli Q,
2. Experimental Millipore, Bedford, MA, USA), which was not ableto enter the interior, for perfect sealing. Larger plants
2.1. Biological materials were placed inside a 9.4 L bulb (30 cm height320cm I.D.), while smaller ones were placed inside a 3.5
Ivy (Hedera helix) and jasmine plants (Jasminum L one (20 cm height315 cm I.D.). Each bulb had apolyanthum) were purchased from a local florist and gas inlet (5) and outlet (6) made from Duran GL 14placed in an isolated room under four TL-lamps screw-thread tubes (Schott Glas, Mainz, Germany),(Osram, 32 W/lamp) equipped with a time controller equipped with GL 14 plastic nuts and Teflon-linedto obtain a 16 h photoperiod (day, 4.00 a.m. to 8.00 septa (Supelco, Bellefonte, PA, USA). High purityp.m.). The temperature inside the room fluctuated air (N50 grade) obtained from Air Liquide (Schelle,around 258C during the light period and 188C during Belgium) was fed to the bulbs (7). Flow-rates werethe dark period. Plants were kept in this chamber chosen as function of the volume of the samplinguntil analyzed. units and approximated a refresh rate of 1 bulb
Three-week-old tomato plants (Lycopersicon es- volume per hour to avoid excessive flow stress.culentum Mill.) of the cultivar Moneymaker were Before entering the system, air was humidified byobtained from the Department of Plant Production — bubbling through Milli Q water (8).Horticulture of Ghent University, Belgium where Analyses of tomato plants were performed directlyspecial facilities are present to achieve aseptic plant on dedicated sampling units. Plants were grown ingrowth. Plants were directly grown in especially vitro, i.e. under aseptic conditions, in order todesigned sampling units, which were placed inside a eliminate the influence of microbiological contami-growth chamber with full control of temperature nations onto plant volatile emissions. Details con-(25618C), photoperiod (16 h), light strength (60 cerning these sampling units are presented elsewhere
2mmol /m /s) and relative humidity (85%). Plants [18].were brought to the laboratory 1 day before experi-ments were started. During the total duration of these 2.3. Experimental set-upexperiments four TL lamps (16 h photoperiod) wereplaced in the vicinity of both units, in order to A schematic representation of the set-up forpreserve the day–night cycle. automated analysis of biogenic emissions is given in
Cotton leafworm caterpillars (Spodoptera lit- Fig. 1. The heart of the system is a TDS-G device¨toralis) were obtained from a colony, which was (Gerstel, Mulheim a/d Ruhr, Germany) for on-line
maintained at the Department of Crop Protection of sampling and thermodesorption. Basically, this de-Ghent University, Belgium. The colony was exclu- vice consists of two programmable temperaturesively fed with Moneymaker leafs. Animals were vaporization (PTV) injectors placed in series. Thedelivered together with the tomato plants and placed first injector (9) is the actual thermodesorptionin-between two petri dishes. In order to initiate system (TDS) in which the sampling tube (10) isimmediate feeding after introducing the animals into contained. A glass tube packed with 100% PDMSthe plant containers, they were famished during the particles (ca. 300 mg, Gerstel) was used as enrich-overnight period the plant was left to stabilize. ment cartridge. The second PTV (11) is a CIS-4
injector (Gerstel), which is used as a cryotrap to2.2. Sampling units refocus the analytes during desorption. After desorp-
tion, the cryotrap is flash heated to inject the sampleA schematic drawing of the sampling units is part as a small plug onto the analytical column. Auto-
of Fig. 1. Plant materials were placed underneath two matic switching between sampling (—) and thermo-
930 (2001) 39–5142 J. Vercammen et al. / J. Chromatogr. A
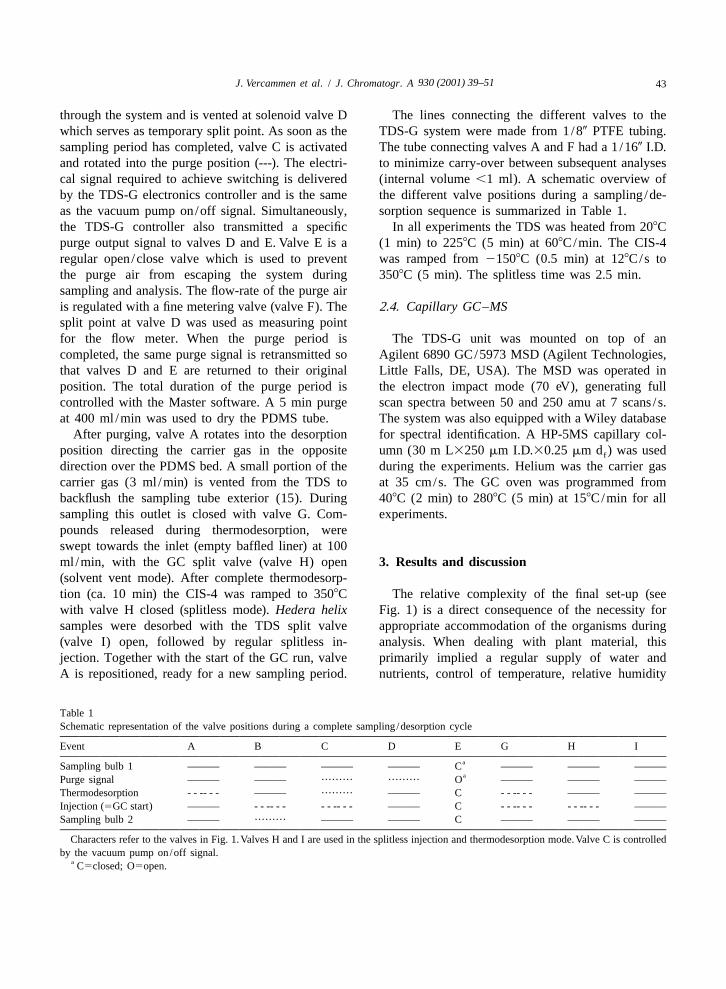
Fig. 1. Schematic representation of the sampling and thermodesorption system: (1) target bulb, (2) reference bulb, (3) clamp, (4) glassplate, (5) gas inlet, (6) gas outlet, (7) air inlet, (8) air humidifier, (9) thermodesorption unit, (10) PDMS tube, (11) PTV cryofocusingdevice, (12) sampling line, (13) vacuum pump, (14) heated compartment, (15) TDS backflush, (16) heated T-piece, (17) endoscopic pliersfor in vitro wounding and (18) pliers inlet. The following valves control the different processes: (A) 6-port rotary valve for sorption /desorption, (B) 4-port rotary valve for bulb selection, (C) 4-port rotary valve for purging, (D) solenoid valve for purge vent, (E) open/closevalve, (F) needle valve, (G) solenoid valve for TDS backflush on/off, (H) GC split / splitless valve and (I) TDS split / splitless valve.
desorption (---) is achieved by means of a 6-port secutively. Run-to-run switching between both bulbsrotary valve (valve A), which is located in-between was achieved by means of a first 4-port rotary valveboth injection devices. Sampling line (12) and (valve B). This valve is controlled by a GC externalvacuum pump (13) complete the set-up. The valve event and is rotated at the start of each chromato-block was maintained at 3008C, the complete com- graphic run. During the sampling period the PDMSpartment (14) was kept at 2708C. Connections tube was held at 208C. Sample volumes and sam-towards valve A were made of 530 mm I.D. silicon pling flow-rates will be provided in the respectivesteel tubing (Gerstel). The complete unit is con- parts of the Results and discussion section.trolled and programmed with Gerstel Master Soft- Water vapors, which accumulate during sampling,ware. were removed automatically by purging the system
This TDS-G system is connected to two sample with dry N50 air. The purge air enters the system atcontainers of which the headspace is analyzed con- a second 4-port rotary valve (valve C), travels
930 (2001) 39–51 43J. Vercammen et al. / J. Chromatogr. A
through the system and is vented at solenoid valve D The lines connecting the different valves to thewhich serves as temporary split point. As soon as the TDS-G system were made from 1/80 PTFE tubing.sampling period has completed, valve C is activated The tube connecting valves A and F had a 1/160 I.D.and rotated into the purge position (---). The electri- to minimize carry-over between subsequent analysescal signal required to achieve switching is delivered (internal volume ,1 ml). A schematic overview ofby the TDS-G electronics controller and is the same the different valve positions during a sampling /de-as the vacuum pump on/off signal. Simultaneously, sorption sequence is summarized in Table 1.the TDS-G controller also transmitted a specific In all experiments the TDS was heated from 208Cpurge output signal to valves D and E. Valve E is a (1 min) to 2258C (5 min) at 608C/min. The CIS-4regular open/close valve which is used to prevent was ramped from 21508C (0.5 min) at 128C/s tothe purge air from escaping the system during 3508C (5 min). The splitless time was 2.5 min.sampling and analysis. The flow-rate of the purge airis regulated with a fine metering valve (valve F). The 2.4. Capillary GC–MSsplit point at valve D was used as measuring pointfor the flow meter. When the purge period is The TDS-G unit was mounted on top of ancompleted, the same purge signal is retransmitted so Agilent 6890 GC/5973 MSD (Agilent Technologies,that valves D and E are returned to their original Little Falls, DE, USA). The MSD was operated inposition. The total duration of the purge period is the electron impact mode (70 eV), generating fullcontrolled with the Master software. A 5 min purge scan spectra between 50 and 250 amu at 7 scans / s.at 400 ml /min was used to dry the PDMS tube. The system was also equipped with a Wiley database
After purging, valve A rotates into the desorption for spectral identification. A HP-5MS capillary col-position directing the carrier gas in the opposite umn (30 m L3250 mm I.D.30.25 mm d ) was usedf
direction over the PDMS bed. A small portion of the during the experiments. Helium was the carrier gascarrier gas (3 ml /min) is vented from the TDS to at 35 cm/s. The GC oven was programmed frombackflush the sampling tube exterior (15). During 408C (2 min) to 2808C (5 min) at 158C/min for allsampling this outlet is closed with valve G. Com- experiments.pounds released during thermodesorption, wereswept towards the inlet (empty baffled liner) at 100ml /min, with the GC split valve (valve H) open 3. Results and discussion(solvent vent mode). After complete thermodesorp-tion (ca. 10 min) the CIS-4 was ramped to 3508C The relative complexity of the final set-up (seewith valve H closed (splitless mode). Hedera helix Fig. 1) is a direct consequence of the necessity forsamples were desorbed with the TDS split valve appropriate accommodation of the organisms during(valve I) open, followed by regular splitless in- analysis. When dealing with plant material, thisjection. Together with the start of the GC run, valve primarily implied a regular supply of water andA is repositioned, ready for a new sampling period. nutrients, control of temperature, relative humidity
Table 1Schematic representation of the valve positions during a complete sampling/desorption cycle
Event A B C D E G H IaSampling bulb 1 ——— ——— ——— ——— C ——— ——— ———aPurge signal ——— ——— ????????? ????????? O ——— ——— ———
Thermodesorption - - -- - - ——— ????????? ——— C - - -- - - ——— ———Injection (5GC start) ——— - - -- - - - - -- - - ——— C - - -- - - - - -- - - ———Sampling bulb 2 ——— ????????? ——— ——— C ——— ——— ———
Characters refer to the valves in Fig. 1.Valves H and I are used in the splitless injection and thermodesorption mode.Valve C is controlledby the vacuum pump on/off signal.
a C5closed; O5open.
930 (2001) 39–5144 J. Vercammen et al. / J. Chromatogr. A
(RH), light strength and photoperiod. The two latter easily co-trapped with the moisture and inevitablyfactors were easily implemented by means of a set of lost, which is of course highly undesirable [20].lamps, which were equipped with a time-controlled Purging the trap with air omits any additionalpower switch. Practical implementation of the other adsorbing devices and is, therefore, much morefactors was less straightforward to realize. attractive. Moreover, the hydrophobic and weakly
The main feature of the set-up is the use of two retentive nature of the PDMS material is even moreidentical sample containers, namely target and refer- advantageous for use in a post-sampling purgingence unit. The target unit contains the plant that has configuration. In addition, displacement caused bybeen subjected to the specific stress situation under co-sorption of water is unlikely to occur [21]. Theinvestigation (wounding, insect feeding, herbicide only factor to consider when applying post-samplingspraying, etc.). The use of two sample containers was purging is the size of the purge volume. In order topreferred over a singular set-up for two reasons. quantitatively trap and store the analytes of interestFirstly, accurate control of temperature and RH, on the PDMS bed, the sum of sample and purgewhich requires dedicated facilities, is less crucial, volume should not exceed the breakthrough volumesince both plants constantly experience identical of the most volatile compound.environmental fluctuations. In addition, specific In a first series of experiments, the minimal airstress-related volatile emissions are easily recognized volume required for drying the PDMS tube afterby continuously comparing the emissions emanating sampling was determined. Therefore, the PDMS tubefrom the target plant with these of the reference was saturated on-line with water by directly sam-plant. pling the air coming from the humidifier for 20 min
Water supply was taken care of by feeding both at 50 ml /min. At that stage, abundant water dropletscontainers with humidified air. Air is delivered were clearly visible at the inner wall of the samplingcontinuously to the systems, i.e. before, during and tube. Afterwards, the tube was purged for 1 minafter analysis a constant supply is guaranteed. Con- using different purge flow-rates, followed by thetinuous air supply was also necessary to preclude standard thermodesorption program. Flow-ratesaccumulation of volatile emissions inside one of the lower than 500 ml /min were far too short to achievecontainers. Although frequently applied to increase sufficient water removal. Regular system operationthe amount of analytes in the headspace (and mask was even not possible due to ice formation inside thethe insensitivity of the sampling technique), accumu- CIS-4 giving rise to blocking of the carrier gas flowlation has a profound effect on plant behavior which path and complete system shutdown. At 500 ml /minshould not be underestimated. It has been demon- injection could be carried out flawless, though thestrated, for example, that ethylene is able to influence acquired chromatogram was severely disturbed byits own emission via a positive feedback loop [19]. the injection of water (Fig. 2).Since the sensitivity of other compounds towards this Based on these results, the next series of experi-effect is hard to predict in advance, the incorporation ments were carried out with a purge time of 5 min atof continuous headspace refreshments was necessary variable flow-rates. The effectiveness of the purgeto provide a sure safety margin. step was now verified by looking at the influence of
Subsequent water removal was achieved by purg- water injection on chromatography and specificallying the sampling tube with dry air after the sampling on peak shape. Therefore, 1 ml of a plant volatileperiod. In the initial stage of instrumental develop- mixture (Table 2) was introduced in the system via ament two alternative approaches, i.e. Nafion mem- T-piece (Fig. 1(16)) which was kept at 2508C andbrane permeation and condensation in a cryostat, placed on top of the TDS. Injections were made 4were also briefly considered. The key advantage of min before the end of the sampling period (20 min inboth approaches is the limited load on the instrumen- total) to achieve complete transfer from the T-piecetal side of development. However, their operation towards the PDMS material. Repeatability of in-principle, which is based on in-line moisture remov- jection was determined in dry air and was excellental, is particularly dangerous when polar compounds with a precision of ca. 5% for each compound for sixare present in the sample. These compounds are replicate injections. Real recoveries, calculated by
930 (2001) 39–51 45J. Vercammen et al. / J. Chromatogr. A
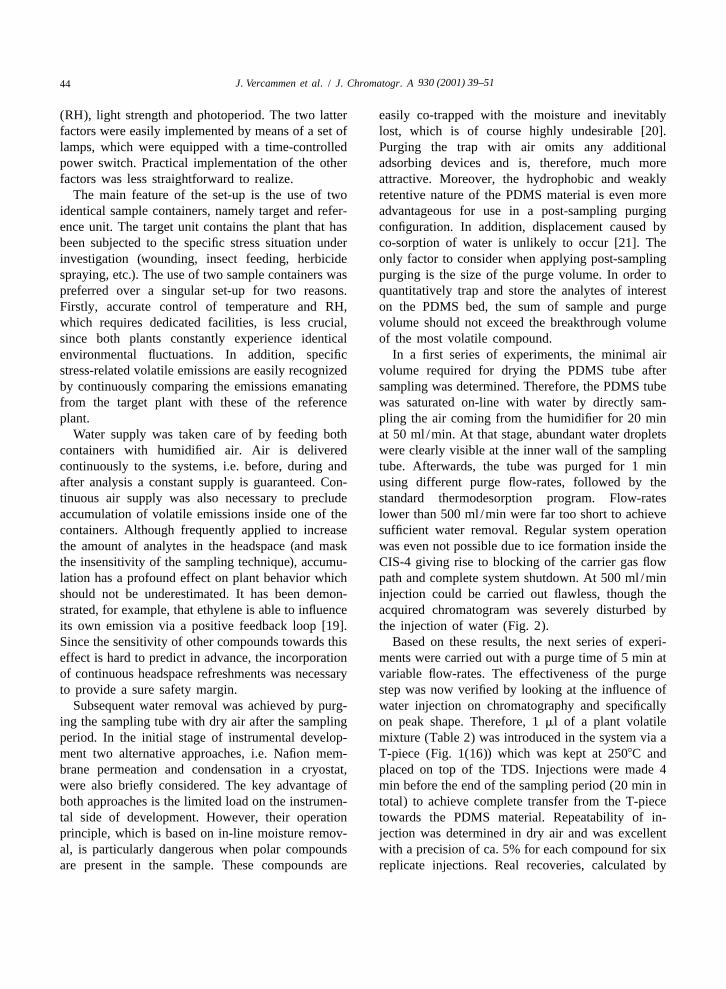
grams were, however, of an unacceptable quality.Particularly the peak shape of the polar compoundseluting in the first part of the chromatogram wasseriously disturbed, rendering an increased purgeflow necessary. A proportional improvement inoverall peak shape was observed at 400 ml /min.Higher flow-rates were also investigated, but did notinduce any additional improvements. A visual repre-sentation of the influence of water injection on theresponse of b-pinene is given in Fig. 3. The lowerresponse observed under incomplete purge condi-tions is due to inaccurate integration of the disturbedpeak.
The responses of b-pinene in dry and humidifiedair more or less converged at a purge volume of 2 l
Fig. 2. Illustration of the influence of insufficient water removal(5 min at 400 ml /min). This value was, therefore,on the chromatographic performance. Sampling humidified air fortaken as minimal purge volume to obtain a suffi-20 min at 50 ml /min. Purge time 1 min at 500 ml /min. For
desorption program see Experimental section. ciently dried system. It is also clear from Fig. 3 thatit is to be preferred to choose a purge volume as
using the area responses obtained after splitless small as possible. If taken excessively long, com-injection in the CIS-4 injector as reference, exhibited pound loss, due to breakthrough from the trap,a boiling point discrimination. The more volatile becomes increasingly significant. Insert in Fig. 3components (up to benzaldehyde) were partly lost represents the experimentally determined break-with recoveries between 70 and 80%. For the through curve of b-pinene at 400 ml /min of air. Assemivolatiles (up to acetophenone) values were can be seen, the compound started to elute from thesignificantly higher (.90%). The reason behind this trap around 5 min (52 l). This explains the overallrecovery decay is breakthrough from the PTV during decreasing trend of both curves observed in Fig. 3.thermodesorption. Prevention is possible by increas- The amount lost by breakthrough is, however, trivialing the available trapping surface of the cryotrap, for compared to the total amount retained by the trap.example by packing the liner with glass beads or a The dashed line at 10 min (54 l) indicates the 5%small amount of PDMS material. For the purge breakthrough level. The theoretical breakthroughevaluation experiments sensitivity was, however, volume, calculated according to the procedure pro-sufficiently high. posed by Baltussen et al., gave a similar result [13].
The first set of experiments was carried out using Values were also calculated for the other samplepurge flows of 200 and 300 ml /min. Both chromato- constituents. In general, retention is adequate enough
to combine purging with a sufficiently large samplevolume (viz. b-pinene). Potential problems are re-
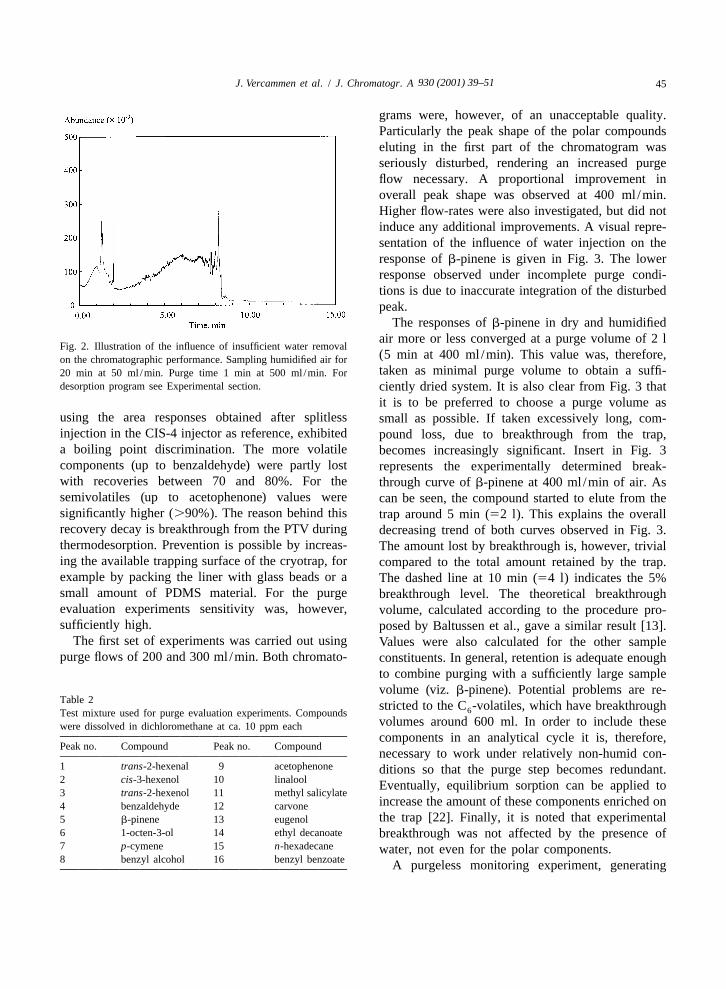
Table 2 stricted to the C -volatiles, which have breakthrough6Test mixture used for purge evaluation experiments. Compoundsvolumes around 600 ml. In order to include thesewere dissolved in dichloromethane at ca. 10 ppm eachcomponents in an analytical cycle it is, therefore,
Peak no. Compound Peak no. Compoundnecessary to work under relatively non-humid con-
1 trans-2-hexenal 9 acetophenone ditions so that the purge step becomes redundant.2 cis-3-hexenol 10 linalool Eventually, equilibrium sorption can be applied to3 trans-2-hexenol 11 methyl salicylate
increase the amount of these components enriched on4 benzaldehyde 12 carvonethe trap [22]. Finally, it is noted that experimental5 b-pinene 13 eugenol
6 1-octen-3-ol 14 ethyl decanoate breakthrough was not affected by the presence of7 p-cymene 15 n-hexadecane water, not even for the polar components.8 benzyl alcohol 16 benzyl benzoate A purgeless monitoring experiment, generating
930 (2001) 39–5146 J. Vercammen et al. / J. Chromatogr. A
Fig. 3. Response of b-pinene as a function of purge volume. Full and dashed lines represent signal variations when sampling was performedwith dry and humidified air, respectively. Insert shows the experimentally acquired breakthrough curve of b-pinene. The vertical dashed linerepresents 5% breakthrough of the compound.
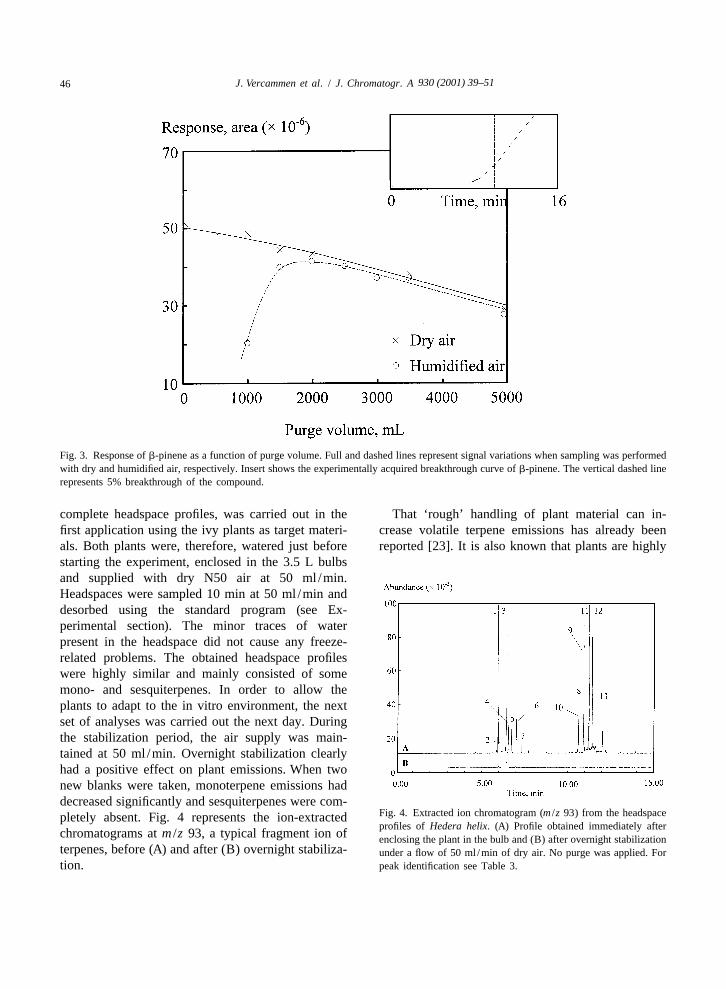
complete headspace profiles, was carried out in the That ‘rough’ handling of plant material can in-first application using the ivy plants as target materi- crease volatile terpene emissions has already beenals. Both plants were, therefore, watered just before reported [23]. It is also known that plants are highlystarting the experiment, enclosed in the 3.5 L bulbsand supplied with dry N50 air at 50 ml /min.Headspaces were sampled 10 min at 50 ml /min anddesorbed using the standard program (see Ex-perimental section). The minor traces of waterpresent in the headspace did not cause any freeze-related problems. The obtained headspace profileswere highly similar and mainly consisted of somemono- and sesquiterpenes. In order to allow theplants to adapt to the in vitro environment, the nextset of analyses was carried out the next day. Duringthe stabilization period, the air supply was main-tained at 50 ml /min. Overnight stabilization clearlyhad a positive effect on plant emissions. When twonew blanks were taken, monoterpene emissions haddecreased significantly and sesquiterpenes were com-
Fig. 4. Extracted ion chromatogram (m /z 93) from the headspacepletely absent. Fig. 4 represents the ion-extractedprofiles of Hedera helix. (A) Profile obtained immediately after
chromatograms at m /z 93, a typical fragment ion of enclosing the plant in the bulb and (B) after overnight stabilizationterpenes, before (A) and after (B) overnight stabiliza- under a flow of 50 ml /min of dry air. No purge was applied. Fortion. peak identification see Table 3.
930 (2001) 39–51 47J. Vercammen et al. / J. Chromatogr. A
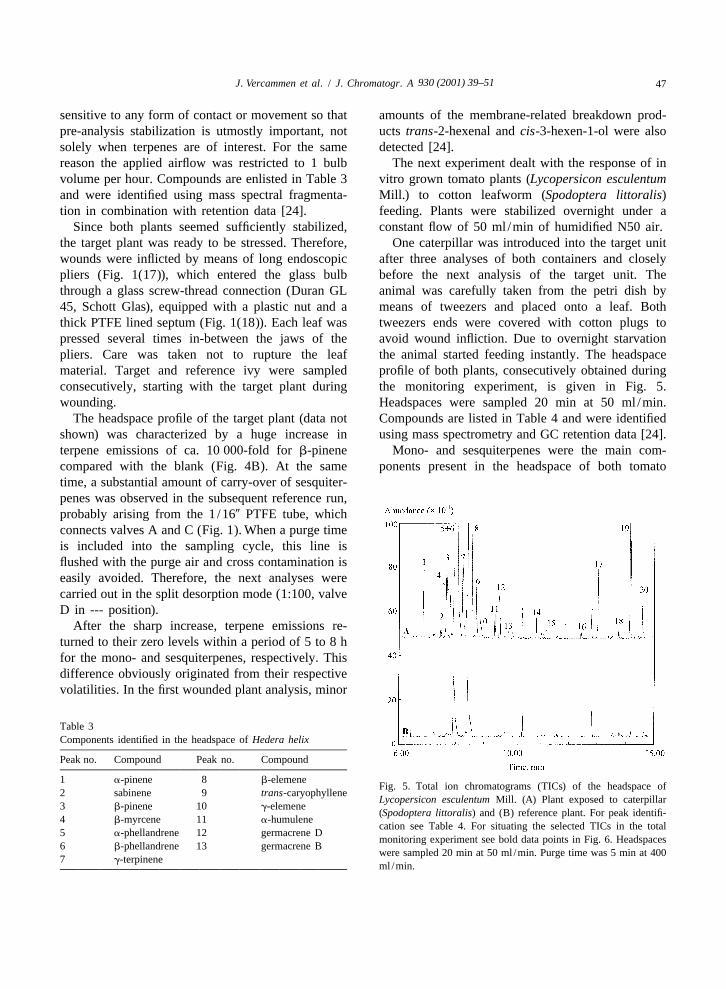
sensitive to any form of contact or movement so that amounts of the membrane-related breakdown prod-pre-analysis stabilization is utmostly important, not ucts trans-2-hexenal and cis-3-hexen-1-ol were alsosolely when terpenes are of interest. For the same detected [24].reason the applied airflow was restricted to 1 bulb The next experiment dealt with the response of involume per hour. Compounds are enlisted in Table 3 vitro grown tomato plants (Lycopersicon esculentumand were identified using mass spectral fragmenta- Mill.) to cotton leafworm (Spodoptera littoralis)tion in combination with retention data [24]. feeding. Plants were stabilized overnight under a
Since both plants seemed sufficiently stabilized, constant flow of 50 ml /min of humidified N50 air.the target plant was ready to be stressed. Therefore, One caterpillar was introduced into the target unitwounds were inflicted by means of long endoscopic after three analyses of both containers and closelypliers (Fig. 1(17)), which entered the glass bulb before the next analysis of the target unit. Thethrough a glass screw-thread connection (Duran GL animal was carefully taken from the petri dish by45, Schott Glas), equipped with a plastic nut and a means of tweezers and placed onto a leaf. Boththick PTFE lined septum (Fig. 1(18)). Each leaf was tweezers ends were covered with cotton plugs topressed several times in-between the jaws of the avoid wound infliction. Due to overnight starvationpliers. Care was taken not to rupture the leaf the animal started feeding instantly. The headspacematerial. Target and reference ivy were sampled profile of both plants, consecutively obtained duringconsecutively, starting with the target plant during the monitoring experiment, is given in Fig. 5.wounding. Headspaces were sampled 20 min at 50 ml /min.
The headspace profile of the target plant (data not Compounds are listed in Table 4 and were identifiedshown) was characterized by a huge increase in using mass spectrometry and GC retention data [24].terpene emissions of ca. 10 000-fold for b-pinene Mono- and sesquiterpenes were the main com-compared with the blank (Fig. 4B). At the same ponents present in the headspace of both tomatotime, a substantial amount of carry-over of sesquiter-penes was observed in the subsequent reference run,probably arising from the 1/160 PTFE tube, whichconnects valves A and C (Fig. 1). When a purge timeis included into the sampling cycle, this line isflushed with the purge air and cross contamination iseasily avoided. Therefore, the next analyses werecarried out in the split desorption mode (1:100, valveD in --- position).
After the sharp increase, terpene emissions re-turned to their zero levels within a period of 5 to 8 hfor the mono- and sesquiterpenes, respectively. Thisdifference obviously originated from their respectivevolatilities. In the first wounded plant analysis, minor
Table 3Components identified in the headspace of Hedera helix
Peak no. Compound Peak no. Compound
1 a-pinene 8 b-elemeneFig. 5. Total ion chromatograms (TICs) of the headspace of
2 sabinene 9 trans-caryophylleneLycopersicon esculentum Mill. (A) Plant exposed to caterpillar
3 b-pinene 10 g-elemene(Spodoptera littoralis) and (B) reference plant. For peak identifi-
4 b-myrcene 11 a-humulenecation see Table 4. For situating the selected TICs in the total
5 a-phellandrene 12 germacrene Dmonitoring experiment see bold data points in Fig. 6. Headspaces
6 b-phellandrene 13 germacrene Bwere sampled 20 min at 50 ml /min. Purge time was 5 min at 400
7 g-terpineneml /min.
930 (2001) 39–5148 J. Vercammen et al. / J. Chromatogr. A
Table 4Compounds identified in the headspace of Lycopersicon esculentum Mill
Peak no. Compound Peak no. Compounda1 a-pinene 12 linalool
2 m-cymene 13 terpinolene 23 trans-isolimonene 14 cis-3-hexenyl butyrate4 b-myrcene 15 methyl salicylate
a5 2-carene 16 indole6 a-phellandrene 17 d-elemene7 a-terpinene 18 a-copaene8 b-phellandrene 19 trans-caryophyllene9 trans-ocimene 20 a-humulene
10 g-terpinene * cyclic siloxane degradation11 terpinolene 1
a Not detected in wounding experiment.
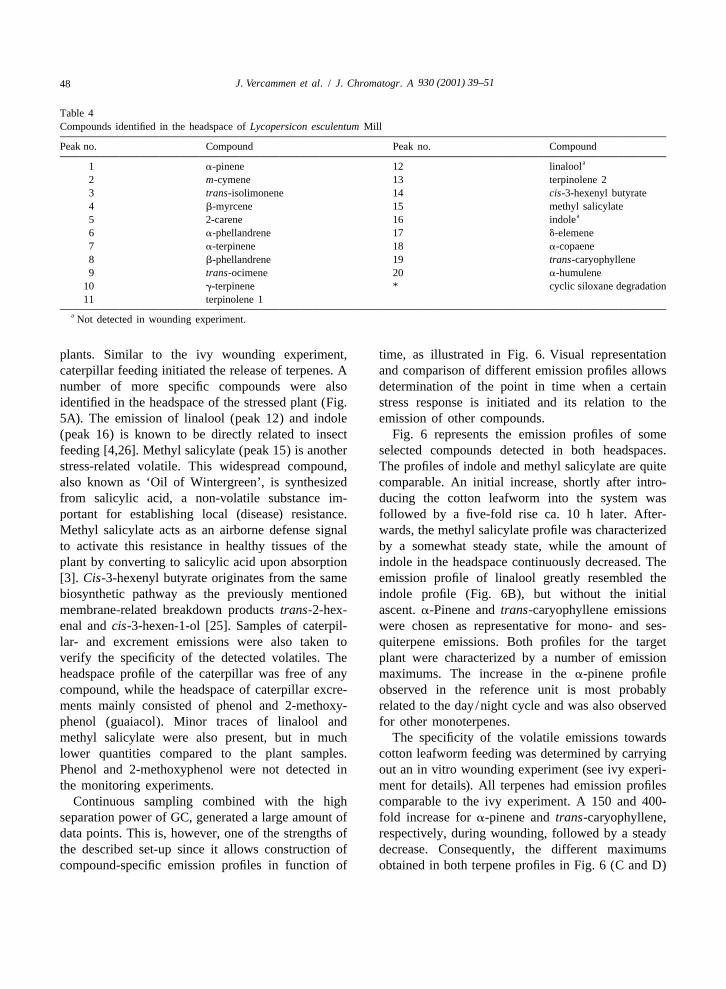
plants. Similar to the ivy wounding experiment, time, as illustrated in Fig. 6. Visual representationcaterpillar feeding initiated the release of terpenes. A and comparison of different emission profiles allowsnumber of more specific compounds were also determination of the point in time when a certainidentified in the headspace of the stressed plant (Fig. stress response is initiated and its relation to the5A). The emission of linalool (peak 12) and indole emission of other compounds.(peak 16) is known to be directly related to insect Fig. 6 represents the emission profiles of somefeeding [4,26]. Methyl salicylate (peak 15) is another selected compounds detected in both headspaces.stress-related volatile. This widespread compound, The profiles of indole and methyl salicylate are quitealso known as ‘Oil of Wintergreen’, is synthesized comparable. An initial increase, shortly after intro-from salicylic acid, a non-volatile substance im- ducing the cotton leafworm into the system wasportant for establishing local (disease) resistance. followed by a five-fold rise ca. 10 h later. After-Methyl salicylate acts as an airborne defense signal wards, the methyl salicylate profile was characterizedto activate this resistance in healthy tissues of the by a somewhat steady state, while the amount ofplant by converting to salicylic acid upon absorption indole in the headspace continuously decreased. The[3]. Cis-3-hexenyl butyrate originates from the same emission profile of linalool greatly resembled thebiosynthetic pathway as the previously mentioned indole profile (Fig. 6B), but without the initialmembrane-related breakdown products trans-2-hex- ascent. a-Pinene and trans-caryophyllene emissionsenal and cis-3-hexen-1-ol [25]. Samples of caterpil- were chosen as representative for mono- and ses-lar- and excrement emissions were also taken to quiterpene emissions. Both profiles for the targetverify the specificity of the detected volatiles. The plant were characterized by a number of emissionheadspace profile of the caterpillar was free of any maximums. The increase in the a-pinene profilecompound, while the headspace of caterpillar excre- observed in the reference unit is most probablyments mainly consisted of phenol and 2-methoxy- related to the day/night cycle and was also observedphenol (guaiacol). Minor traces of linalool and for other monoterpenes.methyl salicylate were also present, but in much The specificity of the volatile emissions towardslower quantities compared to the plant samples. cotton leafworm feeding was determined by carryingPhenol and 2-methoxyphenol were not detected in out an in vitro wounding experiment (see ivy experi-the monitoring experiments. ment for details). All terpenes had emission profiles
Continuous sampling combined with the high comparable to the ivy experiment. A 150 and 400-separation power of GC, generated a large amount of fold increase for a-pinene and trans-caryophyllene,data points. This is, however, one of the strengths of respectively, during wounding, followed by a steadythe described set-up since it allows construction of decrease. Consequently, the different maximumscompound-specific emission profiles in function of obtained in both terpene profiles in Fig. 6 (C and D)
930 (2001) 39–51 49J. Vercammen et al. / J. Chromatogr. A
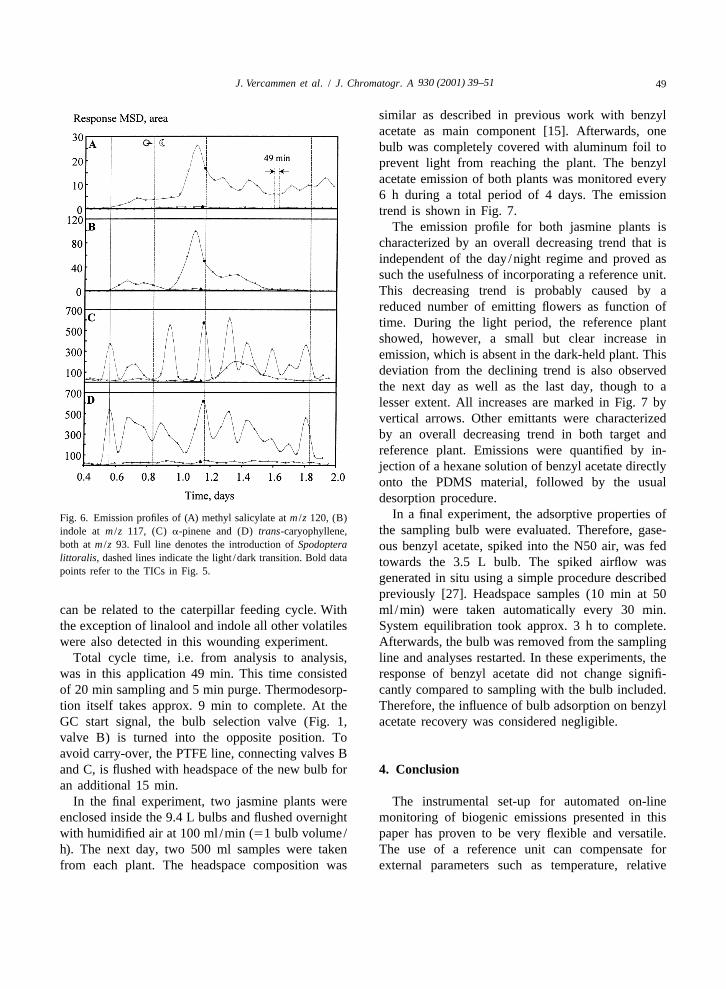
similar as described in previous work with benzylacetate as main component [15]. Afterwards, onebulb was completely covered with aluminum foil toprevent light from reaching the plant. The benzylacetate emission of both plants was monitored every6 h during a total period of 4 days. The emissiontrend is shown in Fig. 7.
The emission profile for both jasmine plants ischaracterized by an overall decreasing trend that isindependent of the day/night regime and proved assuch the usefulness of incorporating a reference unit.This decreasing trend is probably caused by areduced number of emitting flowers as function oftime. During the light period, the reference plantshowed, however, a small but clear increase inemission, which is absent in the dark-held plant. Thisdeviation from the declining trend is also observedthe next day as well as the last day, though to alesser extent. All increases are marked in Fig. 7 byvertical arrows. Other emittants were characterizedby an overall decreasing trend in both target andreference plant. Emissions were quantified by in-jection of a hexane solution of benzyl acetate directlyonto the PDMS material, followed by the usualdesorption procedure.
In a final experiment, the adsorptive properties ofFig. 6. Emission profiles of (A) methyl salicylate at m /z 120, (B)the sampling bulb were evaluated. Therefore, gase-indole at m /z 117, (C) a-pinene and (D) trans-caryophyllene,
both at m /z 93. Full line denotes the introduction of Spodoptera ous benzyl acetate, spiked into the N50 air, was fedlittoralis, dashed lines indicate the light /dark transition. Bold data towards the 3.5 L bulb. The spiked airflow waspoints refer to the TICs in Fig. 5.
generated in situ using a simple procedure describedpreviously [27]. Headspace samples (10 min at 50
can be related to the caterpillar feeding cycle. With ml /min) were taken automatically every 30 min.the exception of linalool and indole all other volatiles System equilibration took approx. 3 h to complete.were also detected in this wounding experiment. Afterwards, the bulb was removed from the sampling
Total cycle time, i.e. from analysis to analysis, line and analyses restarted. In these experiments, thewas in this application 49 min. This time consisted response of benzyl acetate did not change signifi-of 20 min sampling and 5 min purge. Thermodesorp- cantly compared to sampling with the bulb included.tion itself takes approx. 9 min to complete. At the Therefore, the influence of bulb adsorption on benzylGC start signal, the bulb selection valve (Fig. 1, acetate recovery was considered negligible.valve B) is turned into the opposite position. Toavoid carry-over, the PTFE line, connecting valves Band C, is flushed with headspace of the new bulb for 4. Conclusionan additional 15 min.
In the final experiment, two jasmine plants were The instrumental set-up for automated on-lineenclosed inside the 9.4 L bulbs and flushed overnight monitoring of biogenic emissions presented in thiswith humidified air at 100 ml /min (51 bulb volume/ paper has proven to be very flexible and versatile.h). The next day, two 500 ml samples were taken The use of a reference unit can compensate forfrom each plant. The headspace composition was external parameters such as temperature, relative
930 (2001) 39–5150 J. Vercammen et al. / J. Chromatogr. A
Fig. 7. Benzyl acetate emission from Jasminum polyanthum. The full curve represents plant kept in dark. The full line indicates the momentof covering of target plant with aluminum foil. The dashed lines indicate the light–dark transition. For quantitation details see text.
[2] P.E. Howse, O.T. Jones, I.D.R. Stevens, Insect Pheromoneshumidity and light strength. System operation andAnd Their Use In Pest Management, Chapman & Hall,chromatographic performance were strongly influ-London, 1997.
enced by the unavoidable presence of water, which [3] V. Shulaev, P. Silverman, I. Raskin, Nature 385 (1997) 718.demanded the use of post-sampling purging with dry ´[4] P.W. Pare, J.H. Tumlinson, Nature 385 (1997) 30.
[5] E.E. Farmer, C.A. Ryan, Proc. Natl. Acad. Sci. USA 87air. The use of sorption-based enrichment and the(1990) 7713.hydrophobic PDMS was especially useful in this
[6] S. Day, New Scientist 2046 (1996) 28.respect. Three applications have been shown that [7] C.S. Charron, D.J. Cantliffe, R.R. Heath, Horticult. Rev. 17fully demonstrate the possibilities of the presented (1995) 43.
[8] C.L. Arthur, J. Pawliszyn, Anal. Chem. 62 (1990) 2145.set-up.[9] B. Tienpont, F. David, C. Bicchi, P. Sandra, J. Microcol. Sep.
12 (2000) 577.[10] J.E. Bunch, E.D. Pellizzari, J. Chromatogr. 186 (1979) 811.
Acknowledgements [11] E.J. Brunke, F.J. Hammerschmidt, G. Schmaus, Flav. Fragr.J. 9 (1994) 59.
[12] E. Baltussen, F. David, P. Sandra, C.A. Cramers, J. Chroma-We thank Ghent University for supporting thistogr. A 864 (1999) 325.work through grant GOA 12051898. JV gratefully
[13] E. Baltussen, H.-G. Janssen, P. Sandra, C.A. Cramers, J.acknowledges the Flemish Institute for the Promo- High Resolut. Chromatogr. 20 (1997) 385.tion of Scientific and Technological Research in the [14] E. Baltussen, F. David, P. Sandra, H.-G. Janssen, C.A.
Cramers, J. High Resolut. Chromatogr. 21 (1998) 333.Industry (IWT), Flanders, Belgium for a study grant.[15] J. Vercammen, E. Baltussen, T. Sandra, F. David, P. Sandra,Ir. K. Maes and Prof. Dr. Ir. L. Tirry from the
J. High Resolut. Chromatogr. 29 (2000) 547.Faculty of Agriculture of Ghent University are[16] H. Pham-Tuan, J. Vercammen, C. Devos, P. Sandra, J.
thanked for supplying the tomato plants and the Chromatogr. A 868 (2000) 249.caterpillars. [17] J. Vercammen, H. Pham-Tuan, I. Arickx, D. Van der Straeten,
P. Sandra, J. Chromatogr. A 912 (2001) 127.[18] K. Maes, J. Vercammen, H. Pham-Tuan, P. Sandra, P.
Debergh, Phytochem. Anal. 12 (2001) 153.References [19] H. Kende, Annu. Rev. Plant Physiol. Plant Mol. Biol. 44
(1993) 283.[1] E.O. Wilson, The Insect Societies, Belknap Press, Cam- [20] Th. Noij, A. van Es, C.A. Cramers, J. Rijks, R. Dooper, J.
bridge, USA, 1971. High Resolut. Chromatogr. 10 (1987) 60.

930 (2001) 39–51 51J. Vercammen et al. / J. Chromatogr. A
¨[21] E. Baltussen, H.-G. Janssen, P. Sandra, C.A. Cramers, J. [25] K.P.C. Croft, F. Juttner, A.J. Slusarenko, Plant Physiol. 101High Resolut. Chromatogr. 20 (1997) 395. (1993) 13.
[22] E. Baltussen, F. David, P. Sandra, H.-G. Janssen, C.A. [26] T.C.J. Turlings, J.H. Tumlinson, Proc. Natl. Acad. Sci. USACramers, Anal. Chem. 71 (1999) 5193. 89 (1992) 8399.
[23] S. Juuti, J. Arey, R. Atkinson, J. Geophys. Res. 95 (1990) [27] H. Pham-Tuan, H.-G. Janssen, E.M. Kuiper-van Loo, H.7515. Vlap, J. High Resolut. Chromatogr. 18 (1995) 525.
[24] W. Jennings, T. Shibamoto, Qualitative Analysis of Flavorand Fragrance Volatiles by Glass Capillary Gas Chromatog-raphy, Academic Press, New York, 1980, Part B.