Automated detection of microaneurysms using scale-adapted blob analysis and semi-supervised learning
26
Automated Detection of Microaneurysms Using Scale-Adapted Blob Analysis and Semi-Supervised Learning Kedir M. Adal a,* , D´ esir´ e Sidib´ e a, , Sharib Ali a, , Edward Chaum,M.D. b, , Thomas P. Karnowski c, , Fabrice M´ eriaudeau a, a Universit´ e de Bourgogne, Laboratoire Le2i UMR CNRS 6306, Le Creusot, 71200, France b Hamilton Eye Institute, U. Tennessee Health Sciences Center, Memphis TN, USA c Oak Ridge National Laboratory, Oak Ridge TN, USA Abstract Despite several attempts, automated detection of microaneurysm (MA) from digital fundus images still remains to be an open issue. This is due to the subtle nature of MAs against the surrounding tissues. In this paper, the microaneurysm detection problem is modeled as finding interest regions or blobs from an image and an automatic local-scale selection technique is presented. Several scale-adapted region descriptors are then introduced to characterize these blob regions. A semi-supervised based learning approach, which requires few manually annotated learning examples, is also proposed to train a classifier to detect true MAs. The developed system is built using only few manually labeled and a large number of unlabeled retinal color fundus images. The performance of the overall system is evaluated on Retinopathy Online Challenge (ROC) competition database. A competition performance measure (CPM) of 0.364 shows the competitiveness of the proposed system against state-of-the art techniques as well as the applicability of the proposed features to analyze fundus images. Keywords: Microaneurysms, diabetic retinopathy, fundus image, semi-supervised learning, blobs, scale-space. * Corresponding author: Tel.:+33614386360 Email address: [email protected] (Kedir M. Adal) Preprint submitted to Elsevier December 16, 2013
-
Upload
independent -
Category
Documents
-
view
5 -
download
0
Transcript of Automated detection of microaneurysms using scale-adapted blob analysis and semi-supervised learning
Automated Detection of Microaneurysms Using
Scale-Adapted Blob Analysis and Semi-Supervised
Learning
Kedir M. Adala,∗, Desire Sidibea,, Sharib Alia,, Edward Chaum,M.D.b,,Thomas P. Karnowskic,, Fabrice Meriaudeaua,
aUniversite de Bourgogne, Laboratoire Le2i UMR CNRS 6306, Le Creusot, 71200, FrancebHamilton Eye Institute, U. Tennessee Health Sciences Center, Memphis TN, USA
cOak Ridge National Laboratory, Oak Ridge TN, USA
Abstract
Despite several attempts, automated detection of microaneurysm (MA)from digital fundus images still remains to be an open issue. This is dueto the subtle nature of MAs against the surrounding tissues. In this paper,the microaneurysm detection problem is modeled as finding interest regionsor blobs from an image and an automatic local-scale selection technique ispresented. Several scale-adapted region descriptors are then introduced tocharacterize these blob regions. A semi-supervised based learning approach,which requires few manually annotated learning examples, is also proposed totrain a classifier to detect true MAs. The developed system is built using onlyfew manually labeled and a large number of unlabeled retinal color fundusimages. The performance of the overall system is evaluated on RetinopathyOnline Challenge (ROC) competition database. A competition performancemeasure (CPM) of 0.364 shows the competitiveness of the proposed systemagainst state-of-the art techniques as well as the applicability of the proposedfeatures to analyze fundus images.
Keywords: Microaneurysms, diabetic retinopathy, fundus image,semi-supervised learning, blobs, scale-space.
∗Corresponding author: Tel.:+33614386360Email address: [email protected] (Kedir M. Adal)
Preprint submitted to Elsevier December 16, 2013
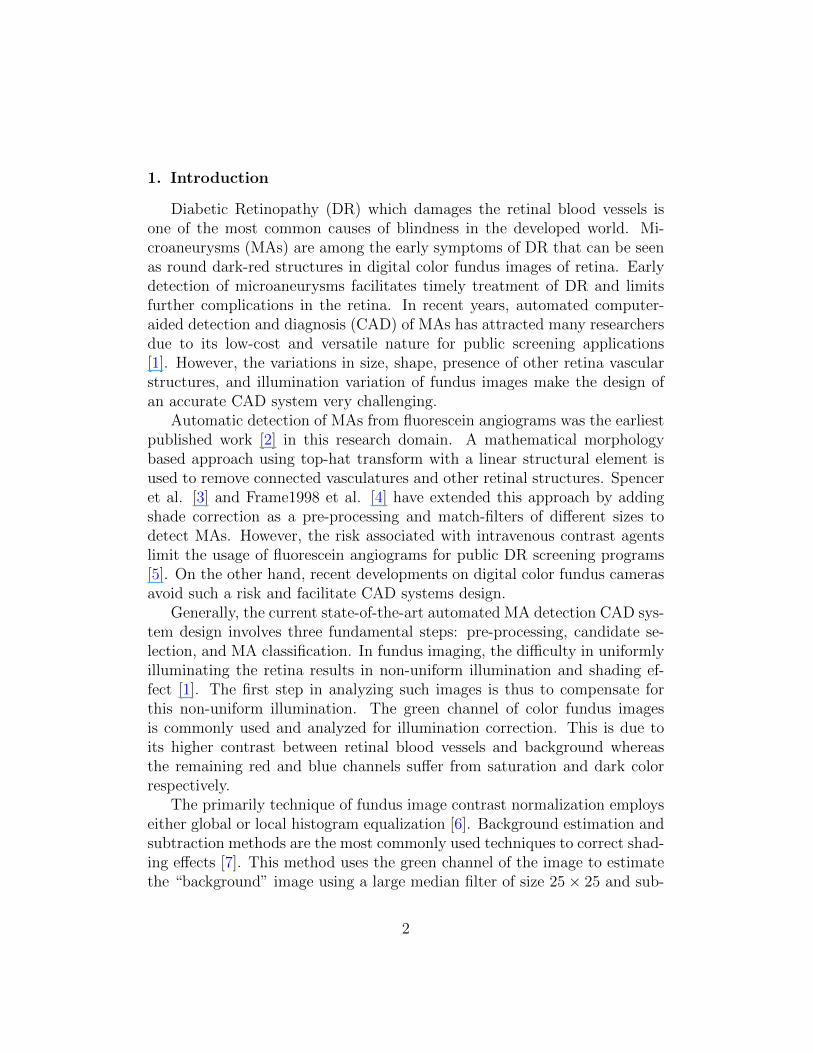
1. Introduction
Diabetic Retinopathy (DR) which damages the retinal blood vessels isone of the most common causes of blindness in the developed world. Mi-croaneurysms (MAs) are among the early symptoms of DR that can be seenas round dark-red structures in digital color fundus images of retina. Earlydetection of microaneurysms facilitates timely treatment of DR and limitsfurther complications in the retina. In recent years, automated computer-aided detection and diagnosis (CAD) of MAs has attracted many researchersdue to its low-cost and versatile nature for public screening applications[1]. However, the variations in size, shape, presence of other retina vascularstructures, and illumination variation of fundus images make the design ofan accurate CAD system very challenging.
Automatic detection of MAs from fluorescein angiograms was the earliestpublished work [2] in this research domain. A mathematical morphologybased approach using top-hat transform with a linear structural element isused to remove connected vasculatures and other retinal structures. Spenceret al. [3] and Frame1998 et al. [4] have extended this approach by addingshade correction as a pre-processing and match-filters of different sizes todetect MAs. However, the risk associated with intravenous contrast agentslimit the usage of fluorescein angiograms for public DR screening programs[5]. On the other hand, recent developments on digital color fundus camerasavoid such a risk and facilitate CAD systems design.
Generally, the current state-of-the-art automated MA detection CAD sys-tem design involves three fundamental steps: pre-processing, candidate se-lection, and MA classification. In fundus imaging, the difficulty in uniformlyilluminating the retina results in non-uniform illumination and shading ef-fect [1]. The first step in analyzing such images is thus to compensate forthis non-uniform illumination. The green channel of color fundus imagesis commonly used and analyzed for illumination correction. This is due toits higher contrast between retinal blood vessels and background whereasthe remaining red and blue channels suffer from saturation and dark colorrespectively.
The primarily technique of fundus image contrast normalization employseither global or local histogram equalization [6]. Background estimation andsubtraction methods are the most commonly used techniques to correct shad-ing effects [7]. This method uses the green channel of the image to estimatethe “background” image using a large median filter of size 25× 25 and sub-
2
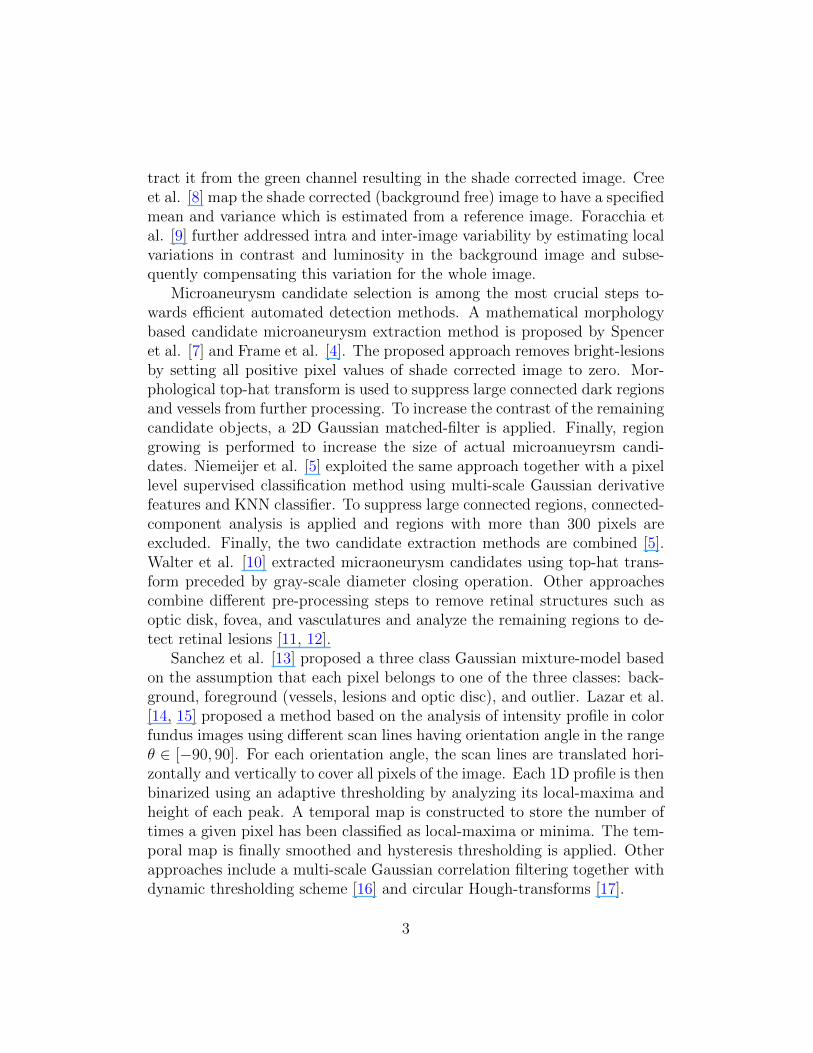
tract it from the green channel resulting in the shade corrected image. Creeet al. [8] map the shade corrected (background free) image to have a specifiedmean and variance which is estimated from a reference image. Foracchia etal. [9] further addressed intra and inter-image variability by estimating localvariations in contrast and luminosity in the background image and subse-quently compensating this variation for the whole image.
Microaneurysm candidate selection is among the most crucial steps to-wards efficient automated detection methods. A mathematical morphologybased candidate microaneurysm extraction method is proposed by Spenceret al. [7] and Frame et al. [4]. The proposed approach removes bright-lesionsby setting all positive pixel values of shade corrected image to zero. Mor-phological top-hat transform is used to suppress large connected dark regionsand vessels from further processing. To increase the contrast of the remainingcandidate objects, a 2D Gaussian matched-filter is applied. Finally, regiongrowing is performed to increase the size of actual microanueyrsm candi-dates. Niemeijer et al. [5] exploited the same approach together with a pixellevel supervised classification method using multi-scale Gaussian derivativefeatures and KNN classifier. To suppress large connected regions, connected-component analysis is applied and regions with more than 300 pixels areexcluded. Finally, the two candidate extraction methods are combined [5].Walter et al. [10] extracted micraoneurysm candidates using top-hat trans-form preceded by gray-scale diameter closing operation. Other approachescombine different pre-processing steps to remove retinal structures such asoptic disk, fovea, and vasculatures and analyze the remaining regions to de-tect retinal lesions [11, 12].
Sanchez et al. [13] proposed a three class Gaussian mixture-model basedon the assumption that each pixel belongs to one of the three classes: back-ground, foreground (vessels, lesions and optic disc), and outlier. Lazar et al.[14, 15] proposed a method based on the analysis of intensity profile in colorfundus images using different scan lines having orientation angle in the rangeθ ∈ [−90, 90]. For each orientation angle, the scan lines are translated hori-zontally and vertically to cover all pixels of the image. Each 1D profile is thenbinarized using an adaptive thresholding by analyzing its local-maxima andheight of each peak. A temporal map is constructed to store the number oftimes a given pixel has been classified as local-maxima or minima. The tem-poral map is finally smoothed and hysteresis thresholding is applied. Otherapproaches include a multi-scale Gaussian correlation filtering together withdynamic thresholding scheme [16] and circular Hough-transforms [17].
3
A Gaussian mixture-model based clustering combined with logistic-regressionclassification method has been proposed to classify microaneurysms at pixellevel [13]. The model is built using features extracted from color, shape, andtexture of color fundus images. Mizutani et al. [18] proposed a double-ringfilter based microaneurysm classification method based on rules and artificialneural network (ANN). The initial detection starts by applying a double-ringfilter on the green channel of the image followed by vessel removal. The re-maining pixel regions shape, color, and contrast against its surrounding isextracted to train an ANN. Walter et al. [10] also applied a KNN classifierusing intensity, shape, and number of pixel features extracted from each can-didate region. An accurate segmentation of retinal blood vessels is thus acrucial step and improves the detection of retinal lesions [19]. Several meth-ods have been proposed for the detection and removal of these structures[20, 21].
Quellec et al. [22] proposed a microaneurysm detector based on templatematching in wavelet space. The proposed method models MAs using 2Drotation-symmetric generalized Gaussian function template. Giancardo et al.[23] proposed a rule-based MA detector using Radon-transformation whichexploits the Gaussian ridge looking like structure of MAs in Radon-space.This approach has also been further improved by using SVM supervised clas-sification method on features extracted from Radon-space [24]. Grisan et al.[25] applied a hierarchical Bayesian classification approach to segment darkand bright lesions from fundus images. Ram et al. [26] modeled false MAs asclutters and a successive-clutter-rejection approach is applied to detect trueMAs.
Antal et al. [27] proposed a combination of different pre-processing andcandidate extractor methods using optimal voting scheme. The selection ofoptimal ensembles, pre-processing and candidate extractor pairs are opti-mized using simulated annealing [28]. The final microaneurysms are thenfound by fusing the candidates of the pairs which are considered as optimalensemble. This system is so far among the top performing methods in theRetinopathy Online Challenge database of images [29].
2. Methodology
Microaneurysms are round dark-red structures caused by thickening ofcapillary basement membranes within the retina. Apart from being ”rounddark-red” structures in digital color fundus images, little is known from CAD
4
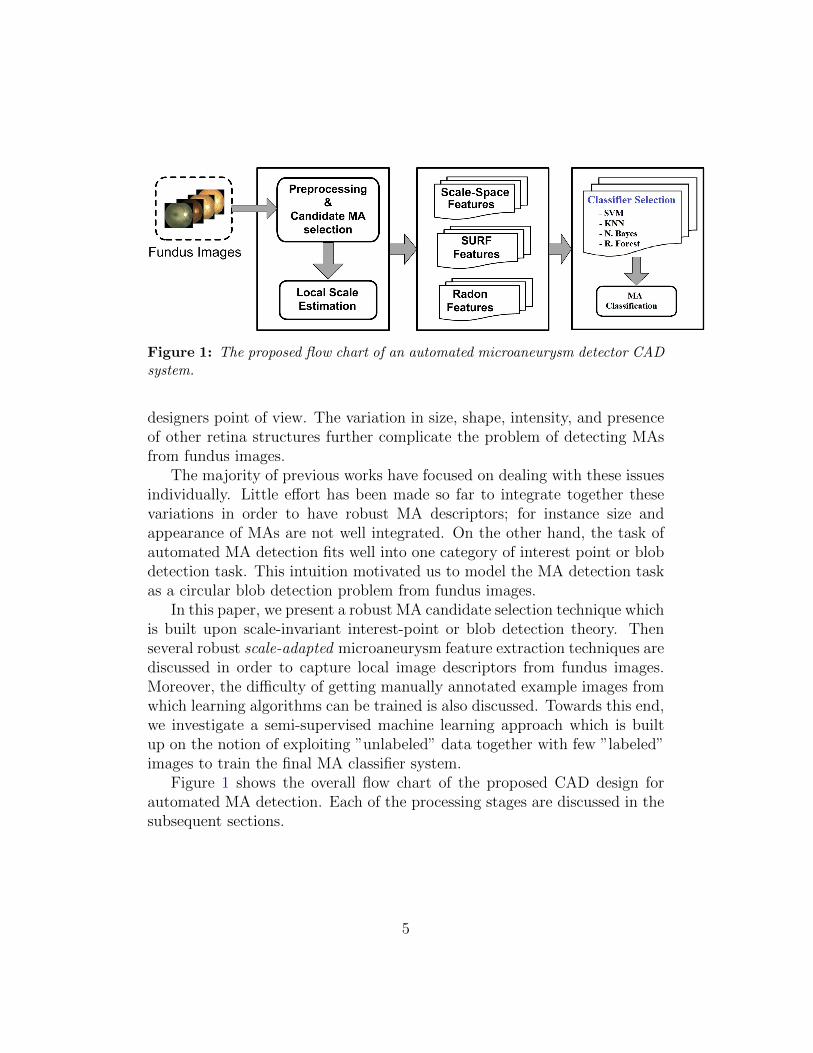
Figure 1: The proposed flow chart of an automated microaneurysm detector CADsystem.
designers point of view. The variation in size, shape, intensity, and presenceof other retina structures further complicate the problem of detecting MAsfrom fundus images.
The majority of previous works have focused on dealing with these issuesindividually. Little effort has been made so far to integrate together thesevariations in order to have robust MA descriptors; for instance size andappearance of MAs are not well integrated. On the other hand, the task ofautomated MA detection fits well into one category of interest point or blobdetection task. This intuition motivated us to model the MA detection taskas a circular blob detection problem from fundus images.
In this paper, we present a robust MA candidate selection technique whichis built upon scale-invariant interest-point or blob detection theory. Thenseveral robust scale-adapted microaneurysm feature extraction techniques arediscussed in order to capture local image descriptors from fundus images.Moreover, the difficulty of getting manually annotated example images fromwhich learning algorithms can be trained is also discussed. Towards this end,we investigate a semi-supervised machine learning approach which is builtup on the notion of exploiting ”unlabeled” data together with few ”labeled”images to train the final MA classifier system.
Figure 1 shows the overall flow chart of the proposed CAD design forautomated MA detection. Each of the processing stages are discussed in thesubsequent sections.
5

3. Pre-processing and Candidate Extraction
The pre-processing and MA candidate extraction stage is the most crucialpart in automated detection of diabetic retinopathy. A proper candidateselection algorithm reduces false detection rate as well as computation time;thus it increases accuracy and speeds up the automated detection process.
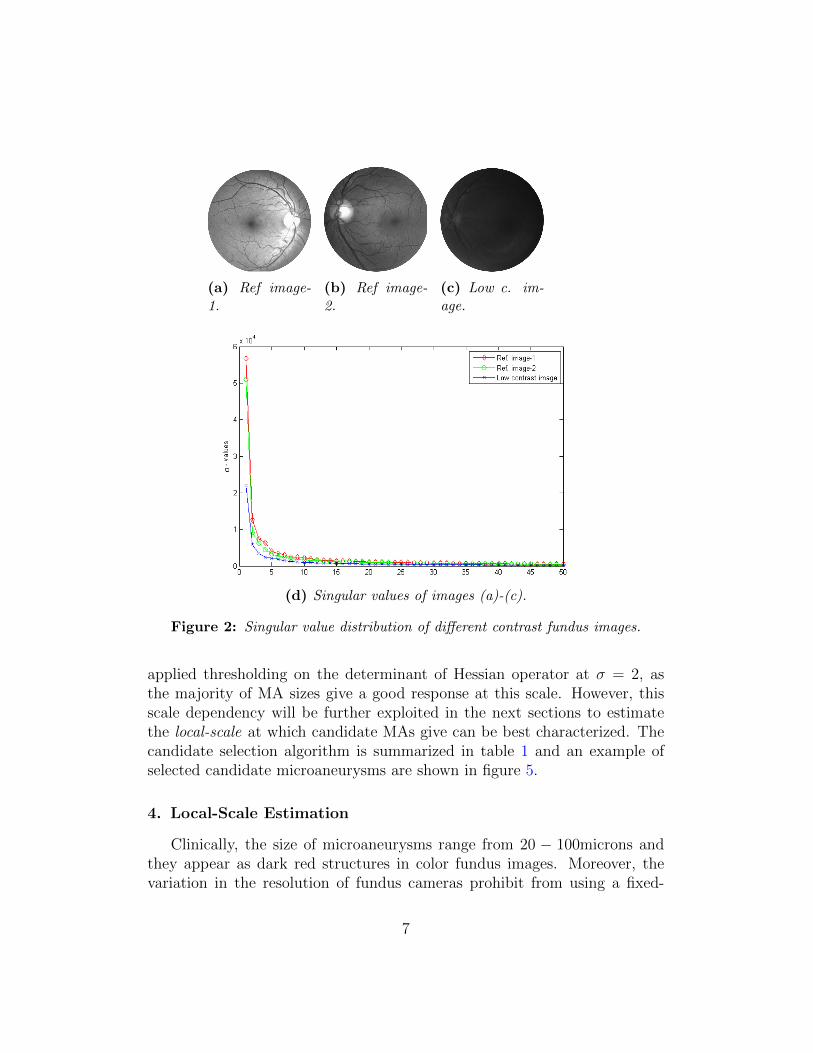
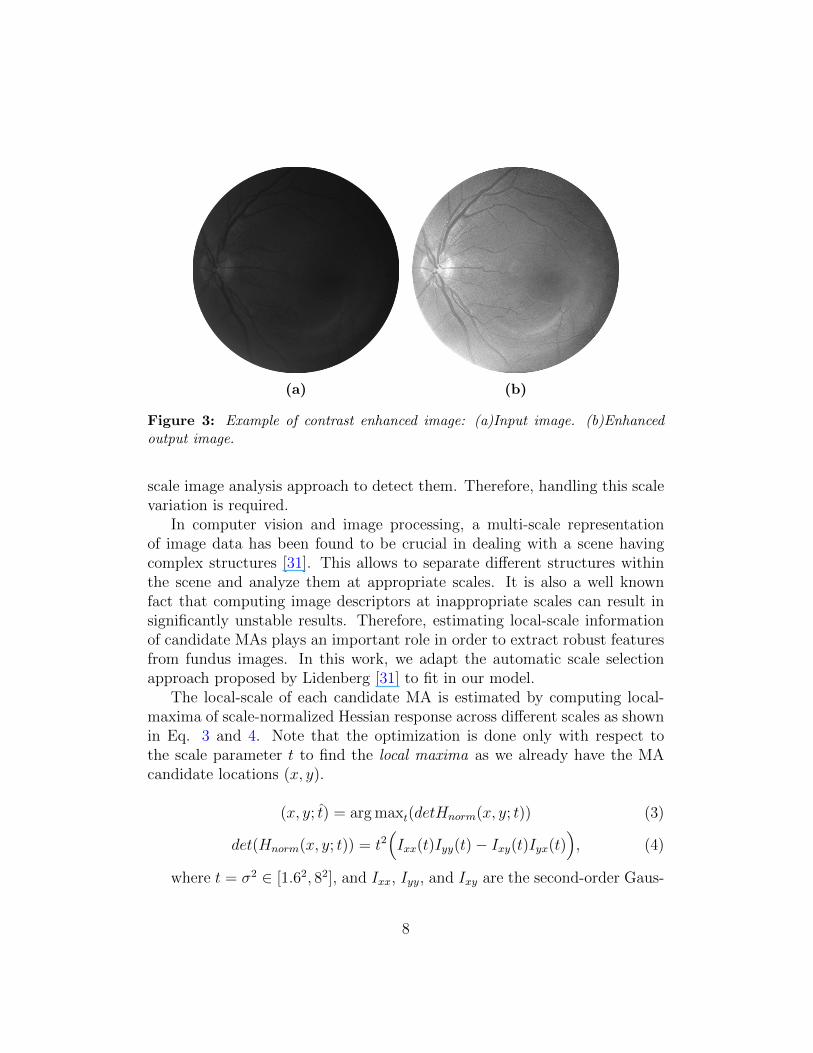
As a pre-processing step, we applied a singular value decomposition (SVD)based contrast enhancement technique which can reduce the shading effectwhile increasing the contrast of fundus images [30]. This contrast enhance-ment method is based on the observation that the singular value distributionof good quality retinal images is equivalent; whereas the corresponding dis-tribution of low quality fundus images is low compared to the good ones asshown in figure 2. The proposed contrast enhancement method is thus doneby equalizing all the singular values of any low quality image by the corre-sponding values of the reference image. An example contrast enhancementresult is also shown in figure 3.
In fundus images, the intensity values at locations corresponding to MAsare locally different from their surrounding regions i.e low in their pixel value.To detect these regions, a local-minima detection method is proposed inour previous work, Adal et al. [30]. The proposed approach exploits thedeterminant of the Hessian matrix of each pixel on the green channel of theimage to extract dark-circular regions. These regions have strong derivativesalong both orthogonal directions resulting in higher determinant value asshown in Figure 4.The Hessian matrix of each pixel x = (x, y) is:
H(x;σ) =
[Ixx(x;σ) Ixy(x;σ)
Ixy(x;σ) Iyy(x;σ)
], (1)
where each element, I··(x;σ), of the matrix is the convolution of the imagepixel at location x = (x, y) along the specified subscript directions with asecond-order Gaussian derivative kernel at a scale of σ. For instance Ixx(x;σ)is defined as:
Ixx(x;σ) = I(x) ∗Gxx(σ), (2)
where Gxx(σ) is a second-order Gaussian derivative along x-direction.In general, the response of the Hessian-operator depends on the scale,
σ, at which I··(x;σ) is computed. For candidate MA selection, we have
6
(a) Ref image-1.
(b) Ref image-2.
(c) Low c. im-age.
(d) Singular values of images (a)-(c).
Figure 2: Singular value distribution of different contrast fundus images.
applied thresholding on the determinant of Hessian operator at σ = 2, asthe majority of MA sizes give a good response at this scale. However, thisscale dependency will be further exploited in the next sections to estimatethe local-scale at which candidate MAs give can be best characterized. Thecandidate selection algorithm is summarized in table 1 and an example ofselected candidate microaneurysms are shown in figure 5.
4. Local-Scale Estimation
Clinically, the size of microaneurysms range from 20 − 100microns andthey appear as dark red structures in color fundus images. Moreover, thevariation in the resolution of fundus cameras prohibit from using a fixed-
7
(a) (b)
Figure 3: Example of contrast enhanced image: (a)Input image. (b)Enhancedoutput image.
scale image analysis approach to detect them. Therefore, handling this scalevariation is required.
In computer vision and image processing, a multi-scale representationof image data has been found to be crucial in dealing with a scene havingcomplex structures [31]. This allows to separate different structures withinthe scene and analyze them at appropriate scales. It is also a well knownfact that computing image descriptors at inappropriate scales can result insignificantly unstable results. Therefore, estimating local-scale informationof candidate MAs plays an important role in order to extract robust featuresfrom fundus images. In this work, we adapt the automatic scale selectionapproach proposed by Lidenberg [31] to fit in our model.
The local-scale of each candidate MA is estimated by computing local-maxima of scale-normalized Hessian response across different scales as shownin Eq. 3 and 4. Note that the optimization is done only with respect tothe scale parameter t to find the local maxima as we already have the MAcandidate locations (x, y).
(x, y; t) = arg maxt(detHnorm(x, y; t)) (3)
det(Hnorm(x, y; t)) = t2(Ixx(t)Iyy(t)− Ixy(t)Iyx(t)
), (4)
where t = σ2 ∈ [1.62, 82], and Ixx, Iyy, and Ixy are the second-order Gaus-
8
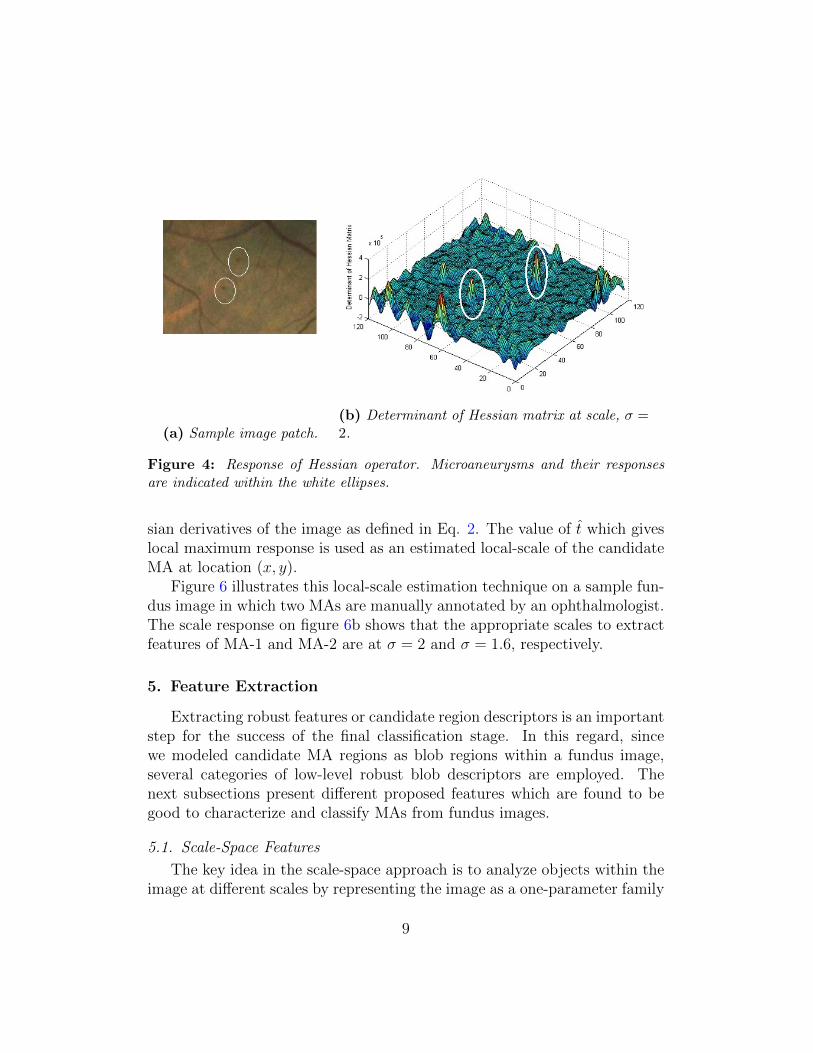
(a) Sample image patch.(b) Determinant of Hessian matrix at scale, σ =2.
Figure 4: Response of Hessian operator. Microaneurysms and their responsesare indicated within the white ellipses.
sian derivatives of the image as defined in Eq. 2. The value of t which giveslocal maximum response is used as an estimated local-scale of the candidateMA at location (x, y).
Figure 6 illustrates this local-scale estimation technique on a sample fun-dus image in which two MAs are manually annotated by an ophthalmologist.The scale response on figure 6b shows that the appropriate scales to extractfeatures of MA-1 and MA-2 are at σ = 2 and σ = 1.6, respectively.
5. Feature Extraction
Extracting robust features or candidate region descriptors is an importantstep for the success of the final classification stage. In this regard, sincewe modeled candidate MA regions as blob regions within a fundus image,several categories of low-level robust blob descriptors are employed. Thenext subsections present different proposed features which are found to begood to characterize and classify MAs from fundus images.
5.1. Scale-Space Features
The key idea in the scale-space approach is to analyze objects within theimage at different scales by representing the image as a one-parameter family
9

Algorithm-1: Hessian based microaneurysm Candidate Selection
Given an image I:
• Apply Pre-processing methods.
• Compute the Hessian Matrix, H at σ = 2
• Compute λ1 and λ2 of H, their absolute ratio,Ar, and |H|:Ar = |λ1|
|λ2||H| = λ1 · λ2
Create candidate mask image Icand:
Icand = |H| > Thsd1 ∩ Ar < Thsd2 ∩ λ1 > 0 ∩ λ2 > 0
Two empirically chosen threshold values Thsd1 = 3× 10⁴ and
Thsd2 = 2 have been used.
Table 1: Microaneurysm candidate selection.
of smoothed images [32]. Gaussian function is the most common smoothingfunction employed in practice. Depending on the differential expression used,the scale-space approach can be used to extract different attributes of objects.As we have pointed out in the previous section, the Hessian-operator, which iscrucial in blob detection task, is used as a differential expression to computefeature attributes.
For each candidate regions, the following features are extracted:
• mean of λ1, λ2, and |H|
• max of λ1, λ2, and |H|
|H| is the determinant of Hessian matrix H and {λ1,λ2} are the eigenval-ues of H. A total of 18 features (6 for each scale, σ = 1, 2, 4) are extracted.
5.2. Speeded Up Robust Features (SURF)
The majority of features come from SURF, which is a well-known tech-nique to extract low-level image descriptors [33]. The two main operationin SURF algorithm are interest point detection and descriptor extraction.Since SURF implicitly uses the Hessian operator to detect interest points,
10
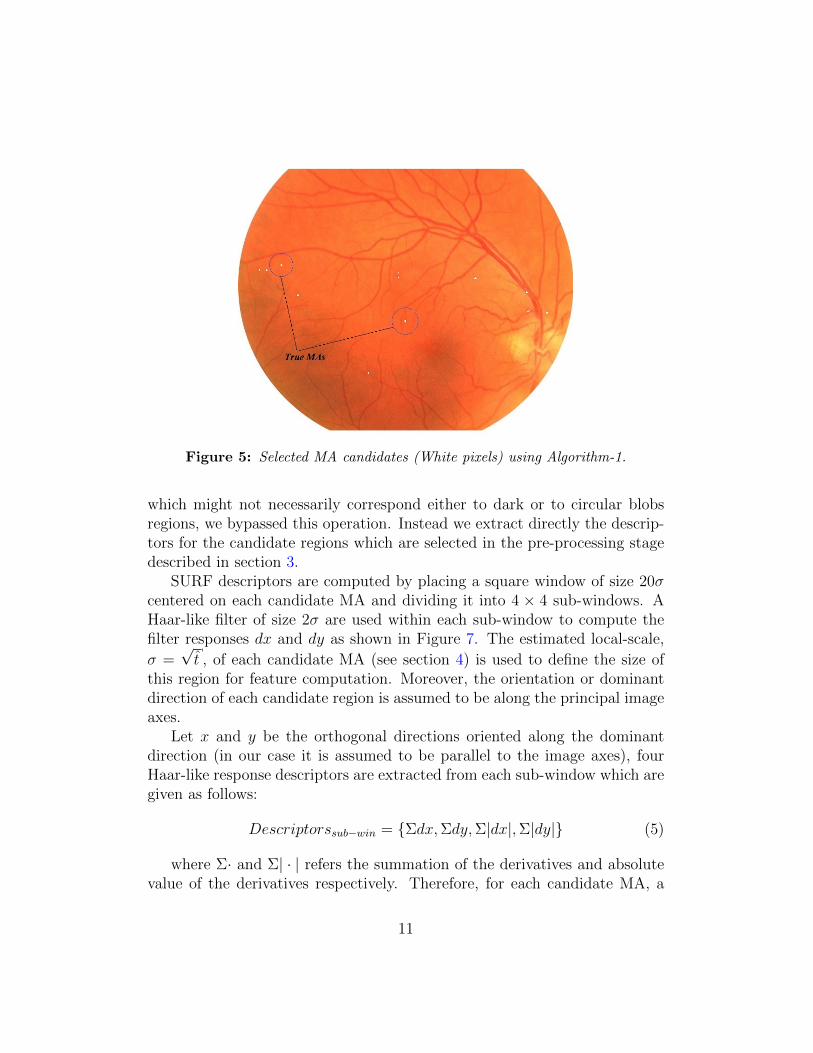
Figure 5: Selected MA candidates (White pixels) using Algorithm-1.
which might not necessarily correspond either to dark or to circular blobsregions, we bypassed this operation. Instead we extract directly the descrip-tors for the candidate regions which are selected in the pre-processing stagedescribed in section 3.
SURF descriptors are computed by placing a square window of size 20σcentered on each candidate MA and dividing it into 4 × 4 sub-windows. AHaar-like filter of size 2σ are used within each sub-window to compute thefilter responses dx and dy as shown in Figure 7. The estimated local-scale,
σ =√t , of each candidate MA (see section 4) is used to define the size of
this region for feature computation. Moreover, the orientation or dominantdirection of each candidate region is assumed to be along the principal imageaxes.
Let x and y be the orthogonal directions oriented along the dominantdirection (in our case it is assumed to be parallel to the image axes), fourHaar-like response descriptors are extracted from each sub-window which aregiven as follows:
Descriptorssub−win = {Σdx,Σdy,Σ|dx|,Σ|dy|} (5)
where Σ· and Σ| · | refers the summation of the derivatives and absolutevalue of the derivatives respectively. Therefore, for each candidate MA, a
11

(a) Two manually annotated MAs. (b) Scale-space response.
Figure 6: Local-scale estimation of two different size MAs (shown in black circlesin (a)) and their estimated scale using scale-space approach shown in (b).
Figure 7: SURF computation window.
total of 64−SURF descriptors (4× 16 sub-windows) which characterize theregion of interest are extracted.
5.3. Radon-Transform Features
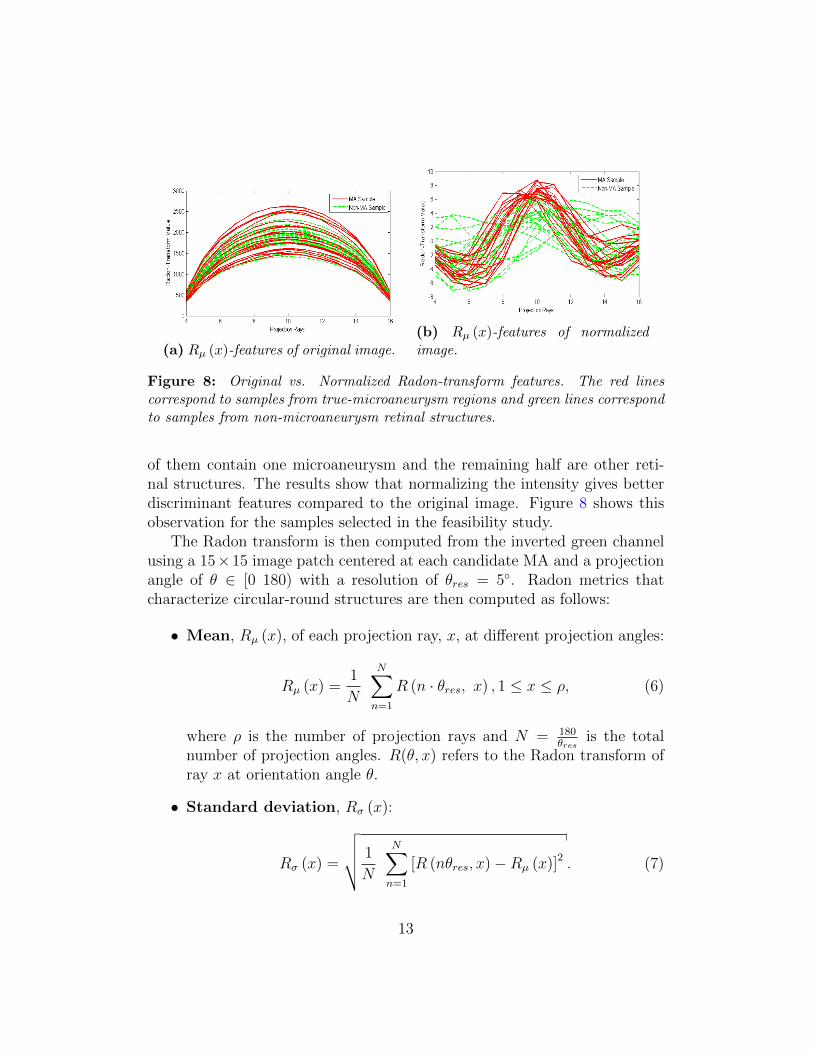
The Radon transform of an image at pixel location x = (x, y) can be de-fined as a series of line integrals from multiple sources along parallel paths ina specific orientation angle θ. Giancardo et al. [23] [24] proposed a methodthat automatically detects MAs from color fundus images by using Radontransformation. We extend the same approach by applying the transforma-tion on the Intensity Normalized image patch instead of the original imagepatch. The normalization is done by making the patch to have zero meanand unit variance.
The normalization is required to make the Radon transform illuminationinvariant. Feasibility study is done on 20 sample image patches where half
12
(a) Rµ (x)-features of original image.(b) Rµ (x)-features of normalizedimage.
Figure 8: Original vs. Normalized Radon-transform features. The red linescorrespond to samples from true-microaneurysm regions and green lines correspondto samples from non-microaneurysm retinal structures.
of them contain one microaneurysm and the remaining half are other reti-nal structures. The results show that normalizing the intensity gives betterdiscriminant features compared to the original image. Figure 8 shows thisobservation for the samples selected in the feasibility study.
The Radon transform is then computed from the inverted green channelusing a 15×15 image patch centered at each candidate MA and a projectionangle of θ ∈ [0 180) with a resolution of θres = 5◦. Radon metrics thatcharacterize circular-round structures are then computed as follows:
• Mean, Rµ (x), of each projection ray, x, at different projection angles:
Rµ (x) =1
N
N∑n=1
R (n · θres, x) , 1 ≤ x ≤ ρ, (6)
where ρ is the number of projection rays and N = 180θres
is the totalnumber of projection angles. R(θ, x) refers to the Radon transform ofray x at orientation angle θ.
• Standard deviation, Rσ (x):
Rσ (x) =
√√√√ 1
N
N∑n=1
[R (nθres, x)−Rµ (x)]2 . (7)
13
A total of 3 features have been extracted from Radon space. These fea-tures are: max {Rµ (x)}, σRµ(x), max {Rσ (x)}. In addition to the featuresdiscussed above, the following two additional features are computed directlyfrom each image patch centered at location of interest:
• σIpatch : the standard deviation of the image-patch (computed from thegreen channel).
• nP :the number of pixels which are similar to the center pixel at thelocation of interest. This is found by applying region growing by usingtheir intensity as a similarity criterion.
In summary, a total of 87 features (18 Scale-Space + 64 SURF + 3 Radon-space + 2 image) have been extracted for each candidate MA.
6. Microaneurysm (MA) Classification
Microaneurysm classification is the final stage where true lesions are de-tected from all candidate regions. This is done using a semi-supervised learn-ing approach which can be built from few supervised information (manuallylabeled training data) together with a large number of unsupervised informa-tion (unlabeled data) [34] [35]. This machine learning approach is especiallyimportant in the design of medical CAD systems where getting manuallyannotated labeled images is very difficult.
Towards this end, we have investigated a self-training and co-trainingsemi-supervised learning approach. In the former approach, a supervisedclassifier which is trained using few available labeled images re-train itselfby including all confidently predicted unlabeled data as a “labeled” data ina recursive manner [35]. Whereas in the later approach, multiple classifierstrain each other by looking at different views or features of the samples andforming different classification hypothesis [34].
7. Experimental Results
The performance of the overall system is evaluated on both the Retinopa-thy Online Challenge (ROC) and the University of Tennessee Health ScienceCenter (UTHSC) private database of fundus images. As a training dataset,few manually annotated images consisting of 80 MA samples and 300 un-labeled images from UTHSC database of fundus images have been used.
14
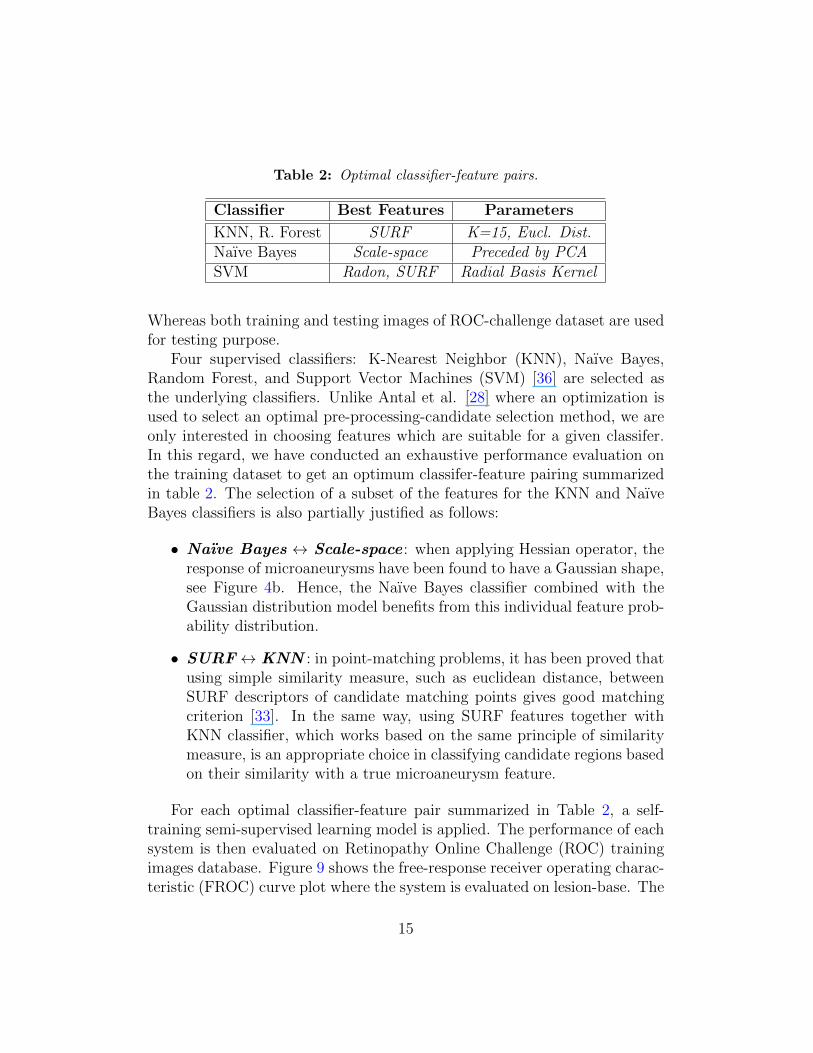
Table 2: Optimal classifier-feature pairs.
Classifier Best Features Parameters
KNN, R. Forest SURF K=15, Eucl. Dist.Naıve Bayes Scale-space Preceded by PCASVM Radon, SURF Radial Basis Kernel
Whereas both training and testing images of ROC-challenge dataset are usedfor testing purpose.
Four supervised classifiers: K-Nearest Neighbor (KNN), Naıve Bayes,Random Forest, and Support Vector Machines (SVM) [36] are selected asthe underlying classifiers. Unlike Antal et al. [28] where an optimization isused to select an optimal pre-processing-candidate selection method, we areonly interested in choosing features which are suitable for a given classifer.In this regard, we have conducted an exhaustive performance evaluation onthe training dataset to get an optimum classifer-feature pairing summarizedin table 2. The selection of a subset of the features for the KNN and NaıveBayes classifiers is also partially justified as follows:
• Naıve Bayes ↔ Scale-space : when applying Hessian operator, theresponse of microaneurysms have been found to have a Gaussian shape,see Figure 4b. Hence, the Naıve Bayes classifier combined with theGaussian distribution model benefits from this individual feature prob-ability distribution.
• SURF↔ KNN : in point-matching problems, it has been proved thatusing simple similarity measure, such as euclidean distance, betweenSURF descriptors of candidate matching points gives good matchingcriterion [33]. In the same way, using SURF features together withKNN classifier, which works based on the same principle of similaritymeasure, is an appropriate choice in classifying candidate regions basedon their similarity with a true microaneurysm feature.
For each optimal classifier-feature pair summarized in Table 2, a self-training semi-supervised learning model is applied. The performance of eachsystem is then evaluated on Retinopathy Online Challenge (ROC) trainingimages database. Figure 9 shows the free-response receiver operating charac-teristic (FROC) curve plot where the system is evaluated on lesion-base. The
15
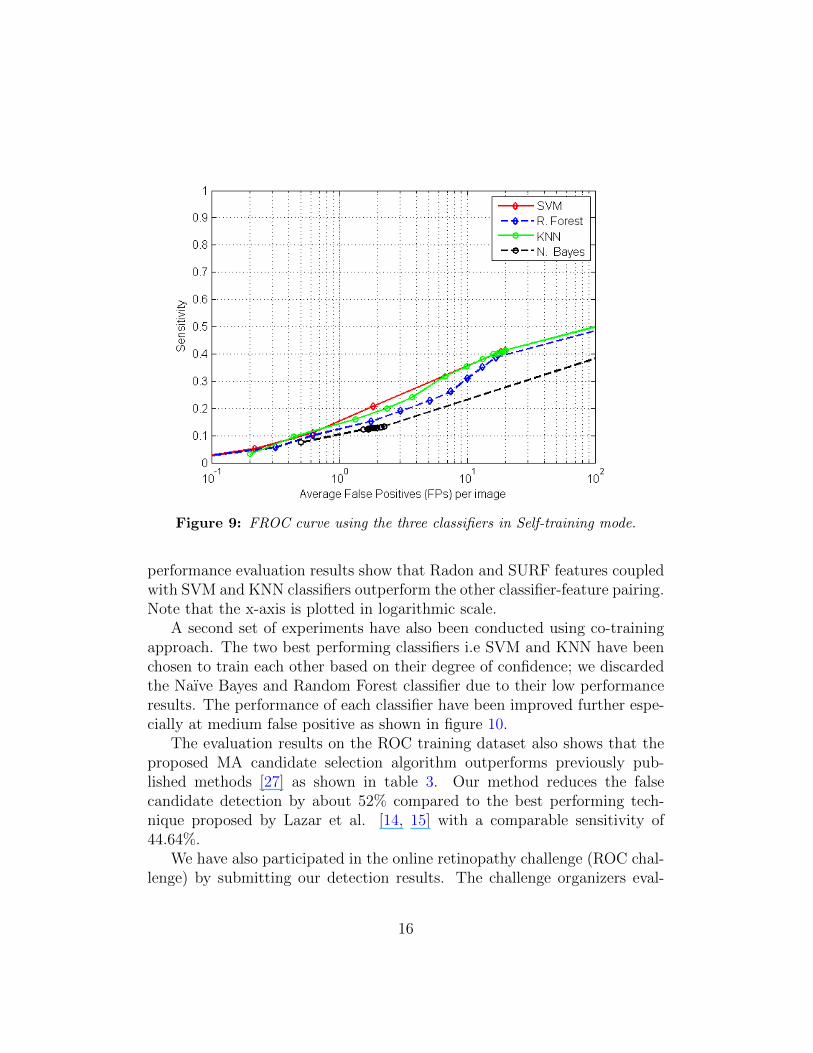
Figure 9: FROC curve using the three classifiers in Self-training mode.
performance evaluation results show that Radon and SURF features coupledwith SVM and KNN classifiers outperform the other classifier-feature pairing.Note that the x-axis is plotted in logarithmic scale.
A second set of experiments have also been conducted using co-trainingapproach. The two best performing classifiers i.e SVM and KNN have beenchosen to train each other based on their degree of confidence; we discardedthe Naıve Bayes and Random Forest classifier due to their low performanceresults. The performance of each classifier have been improved further espe-cially at medium false positive as shown in figure 10.
The evaluation results on the ROC training dataset also shows that theproposed MA candidate selection algorithm outperforms previously pub-lished methods [27] as shown in table 3. Our method reduces the falsecandidate detection by about 52% compared to the best performing tech-nique proposed by Lazar et al. [14, 15] with a comparable sensitivity of44.64%.
We have also participated in the online retinopathy challenge (ROC chal-lenge) by submitting our detection results. The challenge organizers eval-
16
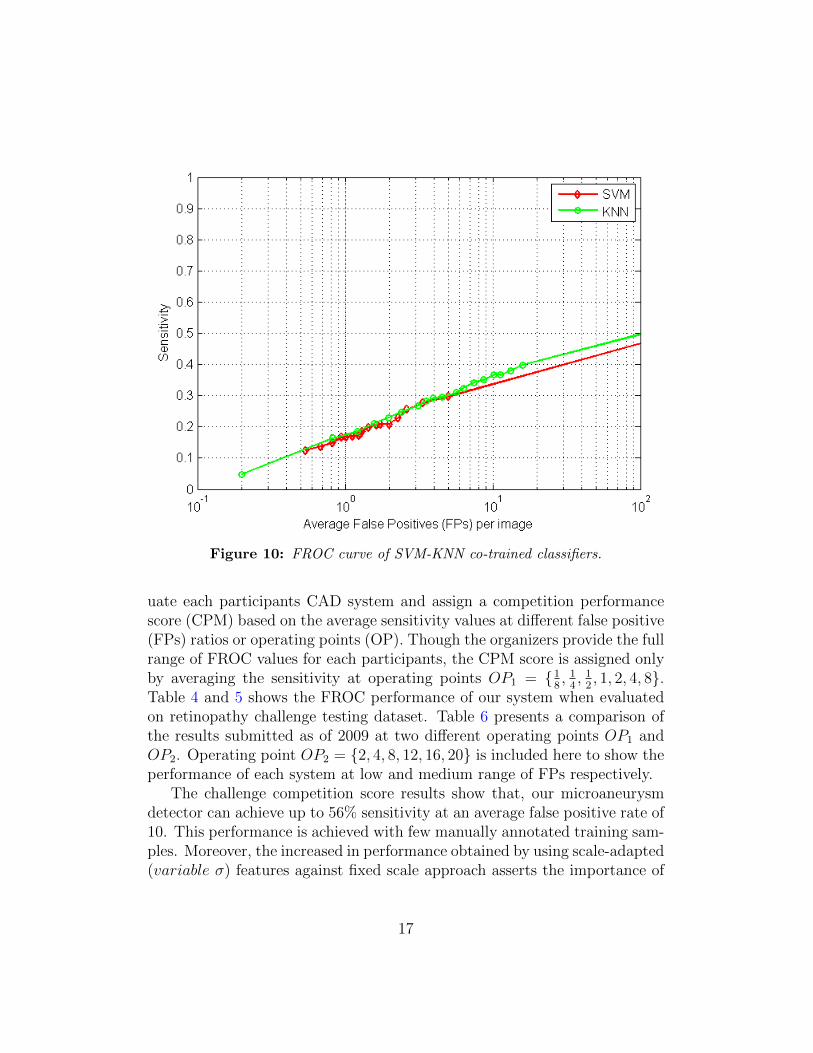
Figure 10: FROC curve of SVM-KNN co-trained classifiers.
uate each participants CAD system and assign a competition performancescore (CPM) based on the average sensitivity values at different false positive(FPs) ratios or operating points (OP). Though the organizers provide the fullrange of FROC values for each participants, the CPM score is assigned onlyby averaging the sensitivity at operating points OP1 = {1
8, 14, 12, 1, 2, 4, 8}.
Table 4 and 5 shows the FROC performance of our system when evaluatedon retinopathy challenge testing dataset. Table 6 presents a comparison ofthe results submitted as of 2009 at two different operating points OP1 andOP2. Operating point OP2 = {2, 4, 8, 12, 16, 20} is included here to show theperformance of each system at low and medium range of FPs respectively.
The challenge competition score results show that, our microaneurysmdetector can achieve up to 56% sensitivity at an average false positive rate of10. This performance is achieved with few manually annotated training sam-ples. Moreover, the increased in performance obtained by using scale-adapted(variable σ) features against fixed scale approach asserts the importance of
17
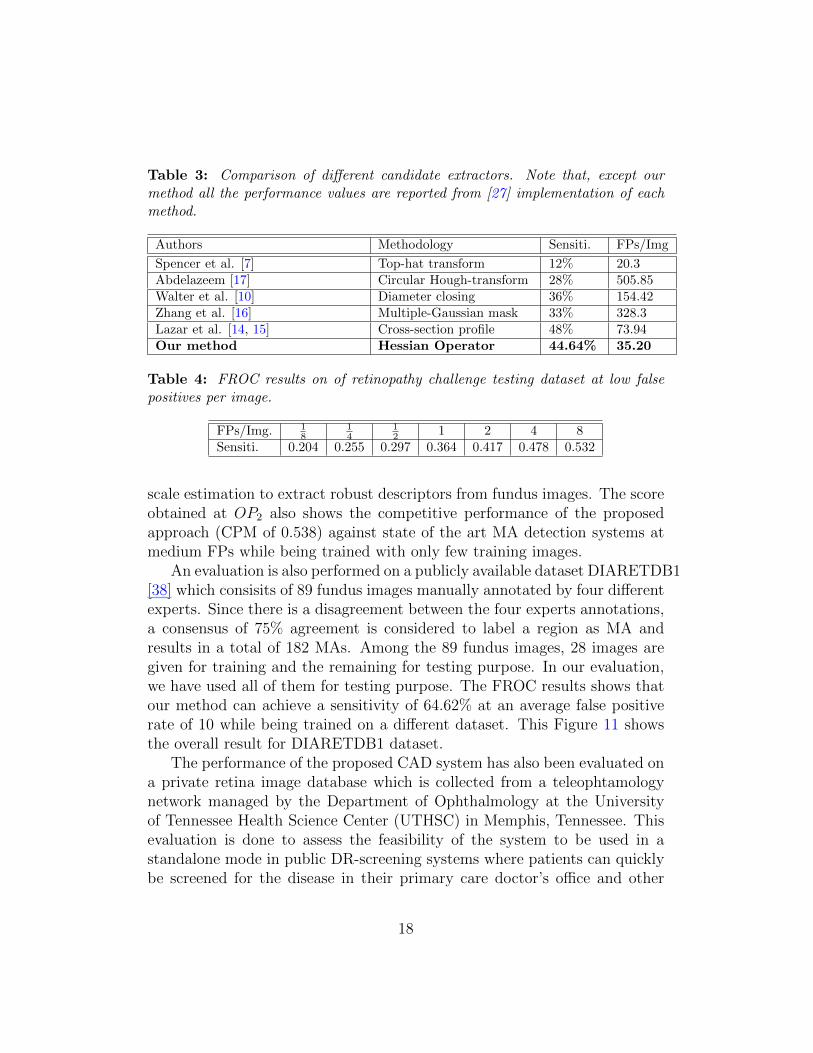
Table 3: Comparison of different candidate extractors. Note that, except ourmethod all the performance values are reported from [27] implementation of eachmethod.
Authors Methodology Sensiti. FPs/Img
Spencer et al. [7] Top-hat transform 12% 20.3Abdelazeem [17] Circular Hough-transform 28% 505.85Walter et al. [10] Diameter closing 36% 154.42Zhang et al. [16] Multiple-Gaussian mask 33% 328.3Lazar et al. [14, 15] Cross-section profile 48% 73.94Our method Hessian Operator 44.64% 35.20
Table 4: FROC results on of retinopathy challenge testing dataset at low falsepositives per image.
FPs/Img. 18
14
12 1 2 4 8
Sensiti. 0.204 0.255 0.297 0.364 0.417 0.478 0.532
scale estimation to extract robust descriptors from fundus images. The scoreobtained at OP2 also shows the competitive performance of the proposedapproach (CPM of 0.538) against state of the art MA detection systems atmedium FPs while being trained with only few training images.
An evaluation is also performed on a publicly available dataset DIARETDB1[38] which consisits of 89 fundus images manually annotated by four differentexperts. Since there is a disagreement between the four experts annotations,a consensus of 75% agreement is considered to label a region as MA andresults in a total of 182 MAs. Among the 89 fundus images, 28 images aregiven for training and the remaining for testing purpose. In our evaluation,we have used all of them for testing purpose. The FROC results shows thatour method can achieve a sensitivity of 64.62% at an average false positiverate of 10 while being trained on a different dataset. This Figure 11 showsthe overall result for DIARETDB1 dataset.
The performance of the proposed CAD system has also been evaluated ona private retina image database which is collected from a teleophtamologynetwork managed by the Department of Ophthalmology at the Universityof Tennessee Health Science Center (UTHSC) in Memphis, Tennessee. Thisevaluation is done to assess the feasibility of the system to be used in astandalone mode in public DR-screening systems where patients can quicklybe screened for the disease in their primary care doctor’s office and other
18
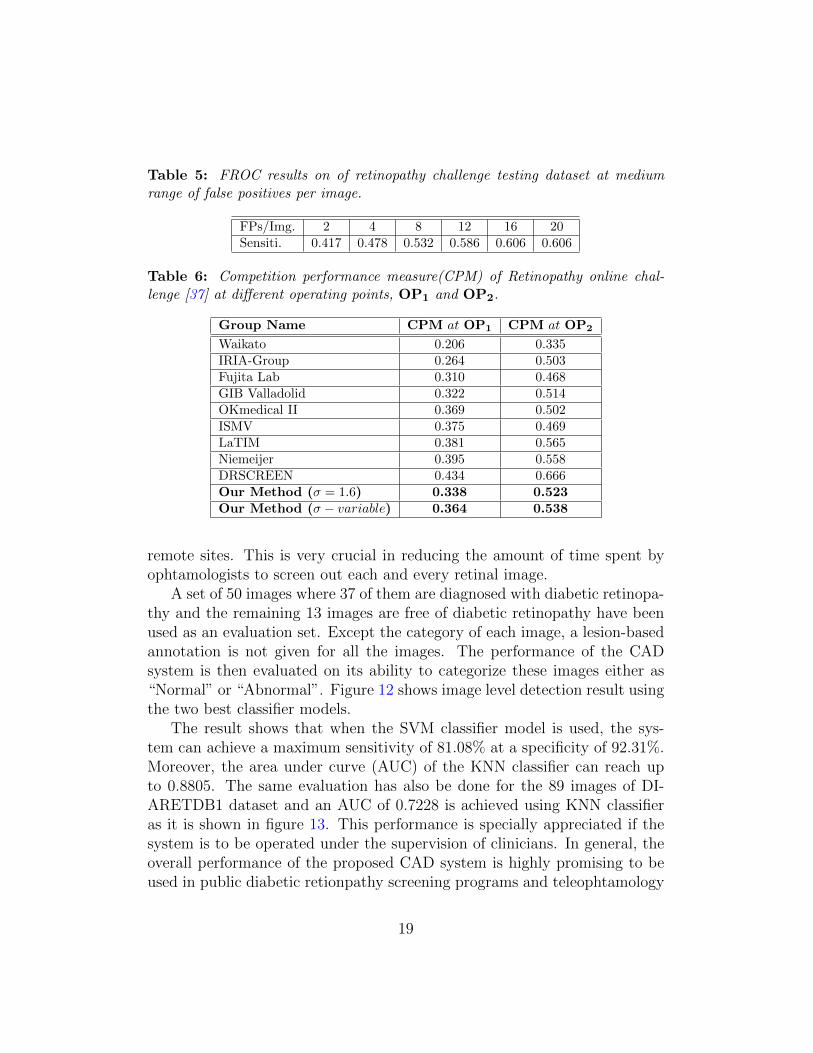
Table 5: FROC results on of retinopathy challenge testing dataset at mediumrange of false positives per image.
FPs/Img. 2 4 8 12 16 20Sensiti. 0.417 0.478 0.532 0.586 0.606 0.606
Table 6: Competition performance measure(CPM) of Retinopathy online chal-lenge [37] at different operating points, OP1 and OP2.
Group Name CPM at OP1 CPM at OP2
Waikato 0.206 0.335IRIA-Group 0.264 0.503Fujita Lab 0.310 0.468GIB Valladolid 0.322 0.514OKmedical II 0.369 0.502ISMV 0.375 0.469LaTIM 0.381 0.565Niemeijer 0.395 0.558DRSCREEN 0.434 0.666Our Method (σ = 1.6) 0.338 0.523Our Method (σ − variable) 0.364 0.538
remote sites. This is very crucial in reducing the amount of time spent byophtamologists to screen out each and every retinal image.
A set of 50 images where 37 of them are diagnosed with diabetic retinopa-thy and the remaining 13 images are free of diabetic retinopathy have beenused as an evaluation set. Except the category of each image, a lesion-basedannotation is not given for all the images. The performance of the CADsystem is then evaluated on its ability to categorize these images either as“Normal” or “Abnormal”. Figure 12 shows image level detection result usingthe two best classifier models.
The result shows that when the SVM classifier model is used, the sys-tem can achieve a maximum sensitivity of 81.08% at a specificity of 92.31%.Moreover, the area under curve (AUC) of the KNN classifier can reach upto 0.8805. The same evaluation has also be done for the 89 images of DI-ARETDB1 dataset and an AUC of 0.7228 is achieved using KNN classifieras it is shown in figure 13. This performance is specially appreciated if thesystem is to be operated under the supervision of clinicians. In general, theoverall performance of the proposed CAD system is highly promising to beused in public diabetic retionpathy screening programs and teleophtamology
19
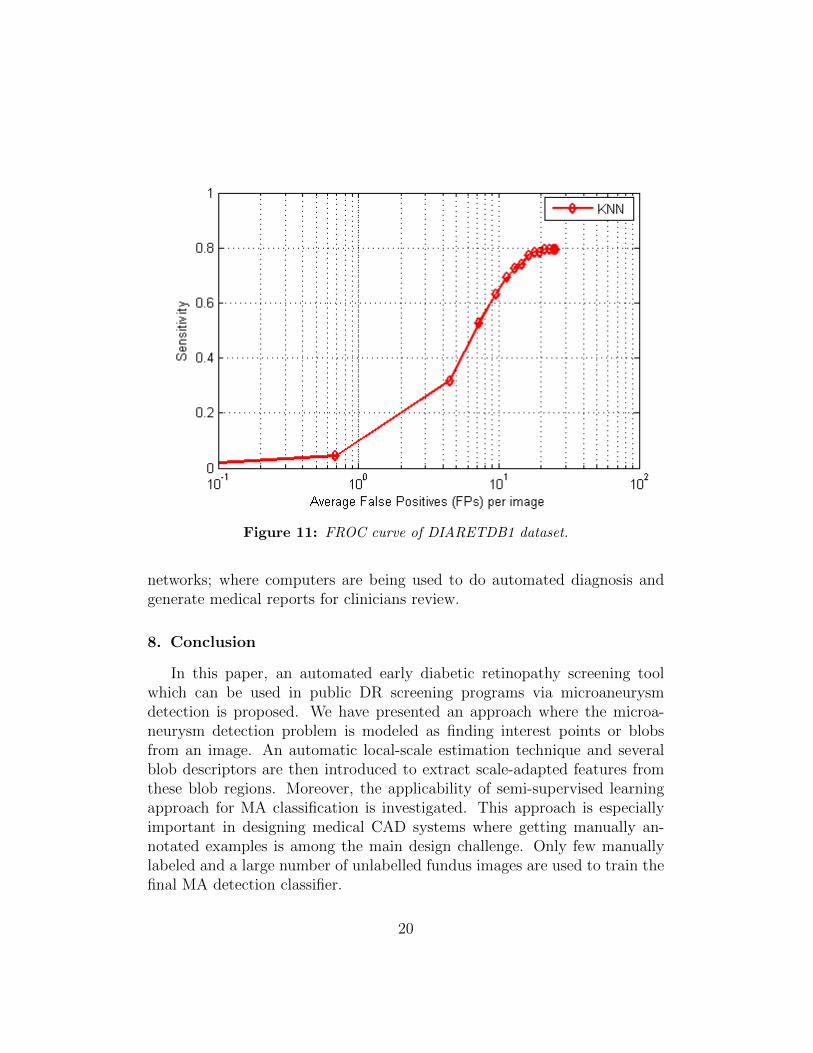
Figure 11: FROC curve of DIARETDB1 dataset.
networks; where computers are being used to do automated diagnosis andgenerate medical reports for clinicians review.
8. Conclusion
In this paper, an automated early diabetic retinopathy screening toolwhich can be used in public DR screening programs via microaneurysmdetection is proposed. We have presented an approach where the microa-neurysm detection problem is modeled as finding interest points or blobsfrom an image. An automatic local-scale estimation technique and severalblob descriptors are then introduced to extract scale-adapted features fromthese blob regions. Moreover, the applicability of semi-supervised learningapproach for MA classification is investigated. This approach is especiallyimportant in designing medical CAD systems where getting manually an-notated examples is among the main design challenge. Only few manuallylabeled and a large number of unlabelled fundus images are used to train thefinal MA detection classifier.
20
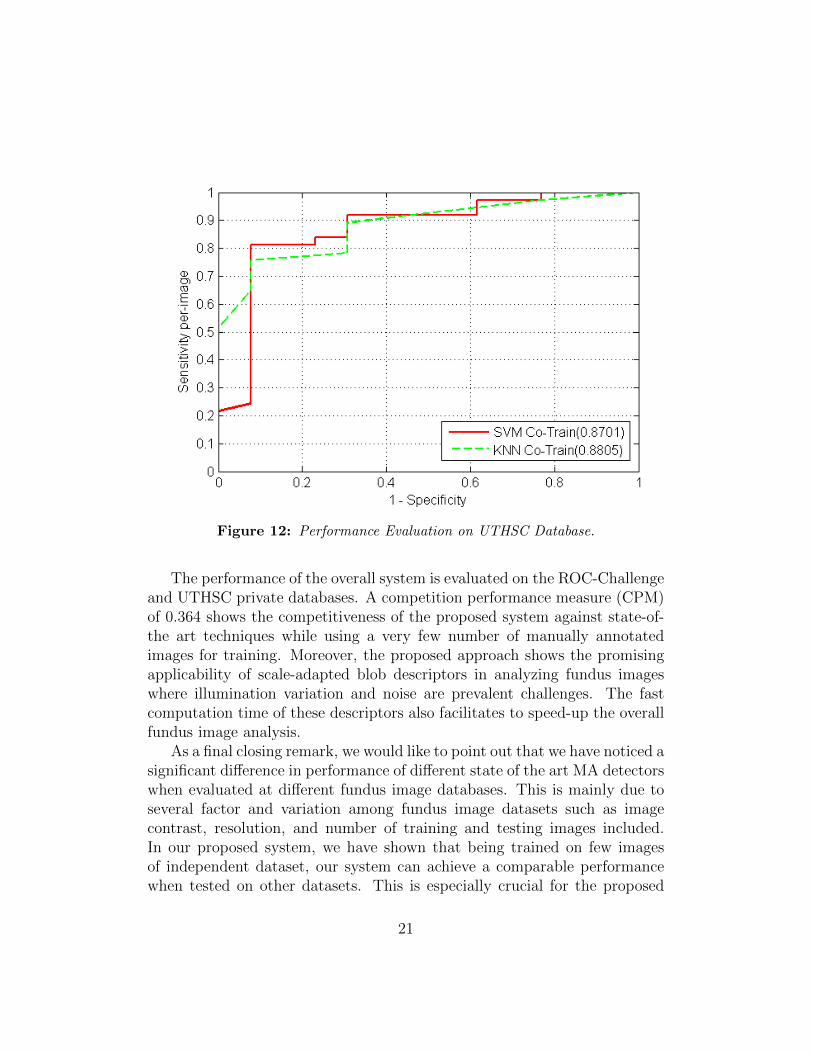
Figure 12: Performance Evaluation on UTHSC Database.
The performance of the overall system is evaluated on the ROC-Challengeand UTHSC private databases. A competition performance measure (CPM)of 0.364 shows the competitiveness of the proposed system against state-of-the art techniques while using a very few number of manually annotatedimages for training. Moreover, the proposed approach shows the promisingapplicability of scale-adapted blob descriptors in analyzing fundus imageswhere illumination variation and noise are prevalent challenges. The fastcomputation time of these descriptors also facilitates to speed-up the overallfundus image analysis.
As a final closing remark, we would like to point out that we have noticed asignificant difference in performance of different state of the art MA detectorswhen evaluated at different fundus image databases. This is mainly due toseveral factor and variation among fundus image datasets such as imagecontrast, resolution, and number of training and testing images included.In our proposed system, we have shown that being trained on few imagesof independent dataset, our system can achieve a comparable performancewhen tested on other datasets. This is especially crucial for the proposed
21
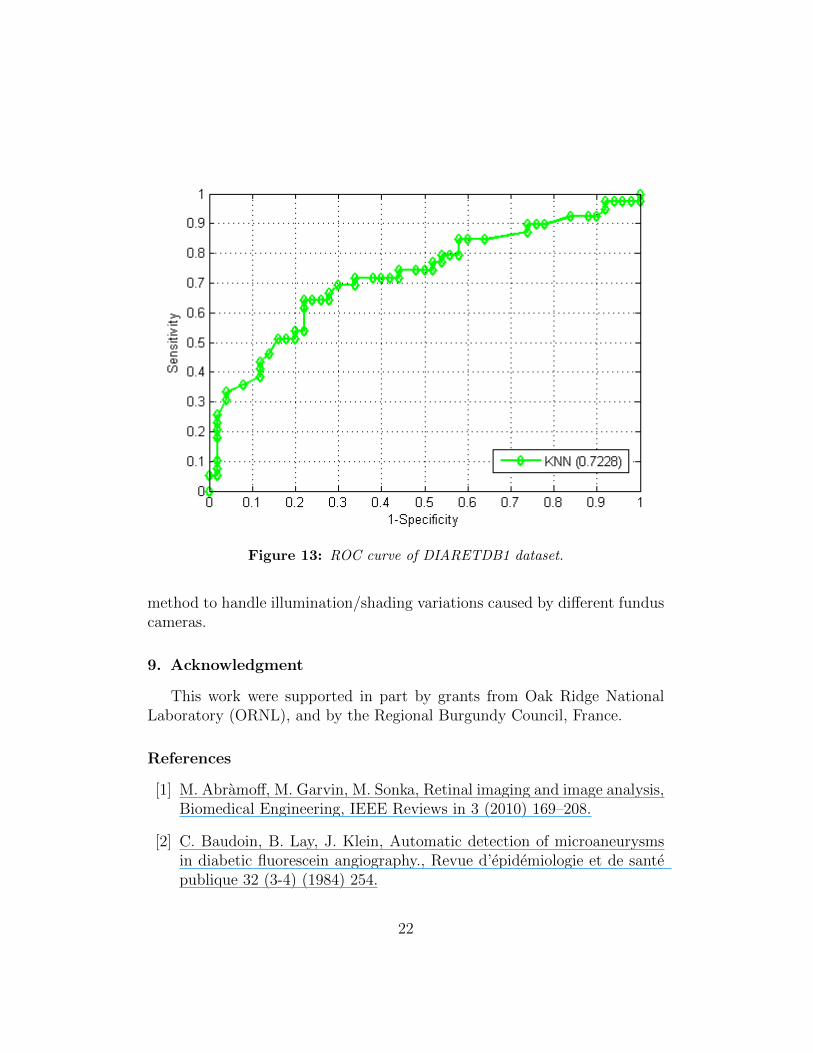
Figure 13: ROC curve of DIARETDB1 dataset.
method to handle illumination/shading variations caused by different funduscameras.
9. Acknowledgment
This work were supported in part by grants from Oak Ridge NationalLaboratory (ORNL), and by the Regional Burgundy Council, France.
References
[1] M. Abramoff, M. Garvin, M. Sonka, Retinal imaging and image analysis,Biomedical Engineering, IEEE Reviews in 3 (2010) 169–208.
[2] C. Baudoin, B. Lay, J. Klein, Automatic detection of microaneurysmsin diabetic fluorescein angiography., Revue d’epidemiologie et de santepublique 32 (3-4) (1984) 254.
22
[3] T. Spencer, J. A. Olson, K. C. McHardy, P. F. Sharp, J. V. Forrester,An image-processing strategy for the segmentation and quantification ofmicroaneurysms in fluorescein angiograms of the ocular fundus, Comput.Biomed. Res. 29 (4) (1996) 284–302.
[4] A. J. Frame, P. E. Undrill, M. J. Cree, J. A. Olson, K. C. McHardy, P. F.Sharp, J. V. Forrester, A comparison of computer based classificationmethods applied to the detection of microaneurysms in ophthalmic flu-orescein angiograms., Computers in biology and medicine 28 (3) (1998)225–238.
[5] M. Niemeijer, B. Van Ginneken, J. Staal, M. Suttorp-Schulten,M. Abramoff, Automatic detection of red lesions in digital color fun-dus photographs, Medical Imaging, IEEE Transactions on 24 (5) (2005)584–592.
[6] R. Gonzalez, E. Richard, Woods, digital image processing (2002).
[7] T. Spencer, R. Phillips, P. Sharp, J. Forrester, Automated detection andquantification of microaneurysms in fluorescein angiograms, Graefe’sarchive for clinical and experimental ophthalmology 230 (1) (1992) 36–41.
[8] M. Cree, E. Gamble, D. Cornforth, Colour normalisation to reduceinter-patient and intra-patient variability in microaneurysm detectionin colour retinal images.
[9] M. Foracchia, E. Grisan, A. Ruggeri, Luminosity and contrast normal-ization in retinal images, Medical Image Analysis 9 (3) (2005) 179–190.
[10] T. Walter, P. Massin, A. Erginay, R. Ordonez, C. Jeulin, J.-C. Klein,Automatic detection of microaneurysms in color fundus images, MedicalImage Analysis 11 (6) (2007) 555 – 566.
[11] C. Kose, U. Sevik, C. Ikibas, H. Erdol, Simple methods for segmenta-tion and measurement of diabetic retinopathy lesions in retinal fundusimages, Computer methods and programs in biomedicine 107 (2) (2012)274–293.
23
[12] M. D. Saleh, C. Eswaran, An automated decision-support system fornon-proliferative diabetic retinopathy disease based on mas and has de-tection, Computer methods and programs in biomedicine 108 (1) (2012)186–196.
[13] C. Sanchez, R. Hornero, A. Mayo, M. Garcıa, M. Lopez, Mixture model-based clustering and logistic regression for automatic detection of mi-croaneurysms in retinal images, SPIE Medical Imaging 2009: Computer-Aided Diagnosis 7260 (2009) 72601M.
[14] I. Lazar, A. Hajdu, R. Quareshi, Retinal microaneurysm detection basedon intensity profile analysis, in: 8th International Conference on AppliedInformatics, 2010.
[15] I. Lazar, A. Hajdu, Retinal microaneurysm detection through local ro-tating cross-section profile analysis, Medical Imaging, IEEE Transac-tions on 32 (2) (2013) 400–407.
[16] B. Zhang, X. Wu, J. You, Q. Li, F. Karray, Detection of microaneurysmsusing multi-scale correlation coefficients, Pattern Recognition 43 (6)(2010) 2237–2248.
[17] S. Abdelazeem, Micro-aneurysm detection using vessels removal andcircular hough transform, in: Radio Science Conference, 2002. (NRSC2002). Proceedings of the Nineteenth National, 2002, pp. 421 – 426.
[18] A. Mizutani, C. Muramatsu, Y. Hatanaka, S. Suemori, T. Hara, H. Fu-jita, Automated microaneurysm detection method based on double ringfilter in retinal fundus images, SPIE Medical Imaging 2009: Computer-Aided Diagnosis 7260 (1) (2009) 72601N.
[19] D. Youssef, N. H. Solouma, Accurate detection of blood vessels improvesthe detection of exudates in color fundus images, Computer methods andprograms in biomedicine.
[20] M. Fraz, S. Barman, P. Remagnino, A. Hoppe, A. Basit, B. Uyyanon-vara, A. Rudnicka, C. Owen, An approach to localize the retinal bloodvessels using bit planes and centerline detection, Computer Methodsand Programs in Biomedicine 108 (2) (2012) 600 – 616.
24
[21] M. M. Fraz, P. Remagnino, A. Hoppe, B. Uyyanonvara, A. R. Rud-nicka, C. G. Owen, S. A. Barman, Blood vessel segmentation method-ologies in retinal images–a survey, Computer methods and programs inbiomedicine 108 (1) (2012) 407–433.
[22] G. Quellec, M. Lamard, P. Josselin, G. Cazuguel, B. Cochener, C. Roux,Optimal wavelet transform for the detection of microaneurysms in retinaphotographs, Medical Imaging, IEEE Transactions on 27 (9) (2008)1230–1241.
[23] L. Giancardo, F. Meriaudeau, T. Karnowski, K. Tobin, Y. Lic,E. Chaum, Microaneurysms detection with the radon cliff operator inretinal fundus images., in: Proc. of SPIE Vol, Vol. 7623, 2010, pp.76230U–1.
[24] L. Giancardo, F. Meriaudeau, T. Karnowski, Y. Li, K. Tobin, E. Chaum,Microaneurysm detection with radon transform-based classification onretina images, in: Engineering in Medicine and Biology Society, EMBC,2011 Annual International Conference of the IEEE, IEEE, 2011, pp.5939–5942.
[25] E. Grisan, A. Ruggeri, A hierarchical bayesian classification for non-vascular lesions detection in fundus images, in: EMBEC05, 3rd Euro-pean Medical and Biological Engineering Conference, 2005.
[26] K. Ram, G. Joshi, J. Sivaswamy, A successive clutter-rejection-basedapproach for early detection of diabetic retinopathy, Biomedical Engi-neering, IEEE Transactions on 58 (3) (2011) 664–673.
[27] B. Antal, A. Hajdu, An ensemble-based system for microaneurysm de-tection and diabetic retinopathy grading, Biomedical Engineering, IEEETransactions on 59 (6) (2012) 1720–1726.
[28] B. Antal, I. Lazar, A. Hajdu, An optimal voting scheme for microa-neurysm candidate extractors using simulated annealing, in: Signal Pro-cessing and Multimedia Applications (SIGMAP), Proceedings of the2010 International Conference on, IEEE, 2010, pp. 80–87.
[29] M. Niemeijer, B. Van Ginneken, M. Cree, A. Mizutani, G. Quellec,C. Sanchez, B. Zhang, R. Hornero, M. Lamard, C. Muramatsu, et al.,
25

Retinopathy online challenge: Automatic detection of microaneurysmsin digital color fundus photographs, Medical Imaging, IEEE Transac-tions on 29 (1) (2010) 185–195.
[30] K. M. Adal, S. Ali, D. Sidibe, T. Karnowski, E. Chaum, F. Meriaudeau,Automated detection of microaneurysms using robust blob descriptors.,in: Proc. of SPIE Vol, Vol. 8670, 2013.
[31] T. Lindeberg, Feature detection with automatic scale selection, Interna-tional journal of computer vision 30 (2) (1998) 79–116.
[32] T. Lindeberg, Scale-space theory in computer vision, Springer, 1993.
[33] H. Bay, A. Ess, T. Tuytelaars, L. Van Gool, Speeded-up robust features(surf), Computer Vision and Image Understanding 110 (3) (2008) 346–359.
[34] A. Blum, T. Mitchell, Combining labeled and unlabeled data with co-training, in: Proceedings of the eleventh annual conference on Compu-tational learning theory, ACM, 1998, pp. 92–100.
[35] X. Zhu, Semi-supervised learning literature survey, Tech. Rep. 1530,Computer Sciences, University of Wisconsin-Madison (2005).
[36] C. Chang, C. Lin, LIBSVM: A library for support vector machines, ACMTransactions on Intelligent Systems and Technology 2 (2011) 27:1–27:27,software available at http://www.csie.ntu.edu.tw/~cjlin/libsvm.
[37] Niemeijer, M. Abramoff, Retinopathy online challenge. (Accessed onNovember 2, 2012).URL http://roc.healthcare.uiowa.edu/results.php
[38] T. Kauppi, V. Kalesnykiene, J.-K. Kamarainen, L. Lensu, I. Sorri,A. Raninen, R. Voutilainen, H. Uusitalo, H. Kalviainen, J. Pietila, Di-aretdb1 diabetic retinopathy database and evaluation protocol, Proc.Medical Image Understanding and Analysis (MIUA) (2007) 61–65.
26