Accounting for tutorial teaching assistants’ buy-in to reform instruction
Upload
independentCategory
view
1download
0
Automated Assistants for Analyzing Team Behaviors
Ranjit Nair ([email protected]) and Milind Tambe ([email protected])Computer Science Department
University of Southern California
941 W. 37th Place, Los Angeles, CA 90089
Stacy Marsella ([email protected]) and Taylor Raines([email protected])Information Sciences Institute
University of Southern California
4676 Admiralty Way, Marina del Rey, CA 90292
Abstract. Multi-agent teamwork is critical in a large number of agent applications,including training, education, virtual enterprises and collective robotics. The com-plex interactions of agents in a team as well as with other agents make it extremelydifficult for human developers to understand and analyze agent-team behavior. It hasthus become increasingly important to develop tools that can help humans analyze,evaluate, and understand team behaviors. However, the problem of automated teamanalysis is largely unaddressed in previous work. In this article, we identify severalkey constraints faced by team analysts. Most fundamentally, multiple types of mod-els of team behavior are necessary to analyze different granularities of team events,including agent actions, interactions, and global performance. In addition, effectiveways of presenting the analysis to humans is critical and the presentation techniquesdepend on the model being presented. Finally, analysis should be independent ofunderlying team architecture and implementation.
We also demonstrate an approach to addressing these constraints by buildingan automated team analyst called ISAAC for post-hoc, off-line agent-team analysis.ISAAC acquires multiple, heterogeneous team models via machine learning overteams’ external behavior traces, where the specific learning techniques are tailoredto the particular model learned. Additionally, ISAAC employs multiple presentationtechniques that can aid human understanding of the analyses. ISAAC also providesfeedback on team improvement in two novel ways: (i) It supports principled ”what-if” reasoning about possible agent improvements; (ii) It allows the user to comparedifferent teams based on their patterns of interactions. This paper presents ISAAC’sgeneral conceptual framework, motivating its design, as well as its concrete applica-tion in two domains: (i) RoboCup Soccer; (ii) software agent teams participating ina simulated evacuation scenario. In the RoboCup domain, ISAAC was used prior toand during the RoboCup’99 tournament, and was awarded the RoboCup ScientificChallenge Award. In the evacuation domain, ISAAC was used to analyze patternsof message exchanges among software agents, illustrating the generality of ISAAC’stechniques. We present detailed algorithms and experimental results from ISAAC’sapplication.1
1 This article significantly extends our previous conference paper [25] and ourextended abstract [26].
c© 2002 Kluwer Academic Publishers. Printed in the Netherlands.
ISAAC-final.tex; 13/10/2002; 4:03; p.1

2
1. Introduction
Teamwork has been a growing area of agent research and developmentin recent years, seen in a large number of multi-agent applications,including autonomous multi-robotic space missions [10], virtual en-vironments for training [35] and education [17], distributed resourceallocation [19] and software agents on the Internet [34]. With the grow-ing importance of teamwork, there is now a critical need for tools to helphumans analyze, evaluate, and understand team behaviors. Indeed, inmulti-agent domains with tens or even hundreds of agents in teams,agent interactions are often highly complex and dynamic, making itdifficult for human developers to analyze agent-team behaviors. Theproblem is further exacerbated in environments where agents are de-veloped by different developers, where even the intended interactionsare unpredictable.
Unfortunately, the problem of analyzing team behavior to aid humandevelopers in understanding and improving team performance has beenlargely unaddressed. Previous work in agent teamwork has largely fo-cused on guiding autonomous agents in their teamwork [13, 36], but noton its analysis for humans. Agent explanation systems, such as Debrief[15], allow individual agents to explain their actions based on internalstate, but do not have the means for a team analysis. Recent workon multi-agent visualization systems, such as [21], has been motivatedby multi-agent understandability concerns (similar to ours), but it stillleaves analysis of agent actions and interactions to humans.
This article focuses on tools that assist humans to analyze, under-stand and improve multi-agent team behaviors by:
1. Locating key aspects of team behaviors that are critical in teamsuccess or failures;
2. Diagnosing such team behaviors, particularly, problematic behav-iors;
3. Suggesting alternative courses of action; and
4. Presenting the relevant information to the user comprehensibly.
Based on our initial efforts at building a team analyst, we arrivedat several important design constraints that should be addressed inbuilding such team analysts. First, unlike systems that focus on ex-plaining individual agent behaviors [15, 29], team analysts need to havemultiple perspectives at multiple levels of granularity. It is sometimesbeneficial to analyze the critical actions of single individuals becausefailures in these critical actions may have been extremely costly and
ISAAC-final.tex; 13/10/2002; 4:03; p.2
Automated Assistants for Analyzing Team Behaviors 3
hence correcting these failures can significantly improve performance.In other circumstances it is the collaborative agent interaction withina small sub-team that is key in team success or failure. Here, analysismay determine which sequences of agent interactions within the sub-team contribute to the team’s success or failure. And in some othercircumstances, an analysis of the global behavior trends of the entireteam is important.
The second key constraint is that as assistants to human users anddevelopers, team analysts must not only be experts in analysis, theymust also be experts in conveying this information to humans. Theconstraint of multiple models has strong implications for the type ofpresentation as well. Analysis of an agent action can show the actionand highlight features of that action that played a prominent role in itssuccess or failure, but a similar presentation would be incongruous fora global analysis, since no single action would suffice. Global analysisrequires a more comprehensive explanation that ties together seeminglyunconnected aspects and trends of team behavior.
The third constraint is that team analysts should ideally be in-dependent of the underlying team architecture and implementation,to ensure generality of the analysis across teams and even across do-mains. In particular, by exploiting external behavior traces of the team,team analysts can understand team behaviors without necessarily re-quiring information on team internals. This bottom-up, data-intensiveapproach is especially desirable in complex domains where a causalmodel is weak or unknown. Furthermore, acquiring such causal informa-tion can be a significant bottleneck, if agents and teams are developedby different developers. Finally, such a bottom-up approach can revealunexpected patterns of interaction that are often of interest to devel-opers. This constraint does not imply ignoring “top-down” informationwhere easily available, but rather it stresses the criticality of bottom-upanalysis.
These constraints on team analysts have shaped the analyst we havedeveloped, called ISAAC. To address the first constraint, ISAAC relieson multiple models of team behavior, each covering a different level ofgranularity of team behavior. More specifically, ISAAC relies on threedifferent models that analyze events at three separate levels of granu-larity: an individual agent action, agent interactions, and overall teambehavior. To address the second constraint, multiple modes of presenta-tions are used, each suited to the model being presented. For instance,ISAAC uses a multimedia viewer to highlight individual agent actions,but uses a natural language summary to explain the overall team per-formance. The content for the summary is determined by ISAAC’sautomated analysis of key factors determining team performance. To
ISAAC-final.tex; 13/10/2002; 4:03; p.3

4
address the third constraint, ISAAC’s three models are automaticallyacquired via machine learning techniques like inductive decision treelearning and learning of probabilistic finite automata (PFA) basedon external data traces of team behaviors. With multiple models, themethod of acquisition can be tailored to the model being acquired.
An additional novelty in ISAAC is the two techniques it uses tosuggest improvements to a team. First, ISAAC presents alternativecourses of actions using a technique called ’perturbation analysis’. Akey feature of perturbation analysis is that it suggests improvementsusing actions within the agent’s skill set, since this analysis mines datafrom actions that the team has already performed. Second, ISAACalso aids in comparing patterns of behaviors of different teams. Such acomparison also provides suggestions for team improvement.
ISAAC was first extensively applied in the domain of RoboCupsoccer simulation [17, 22] (See Figure 1). RoboCup is a dynamic, multi-agent environment developed to explore multi-agent research issues,with agent teams participating in national and international annualcompetitions. There are 11 agents in each team that act without anycentralized control and act in a complex, dynamic, noisy environmentmanaged by a soccer server [22]. Agent-team analysis is posed as afundamental challenge in RoboCup since team developers wish to un-derstand the strengths and weaknesses of teams and understand howto improve such teams. There are at least 50 such development groupsaround the world.
Figure 1. 2-D snapshot of a RoboCup soccer game.
ISAAC has attacked the team analysis challenge in RoboCup: ithas been applied to all of the teams from several RoboCup tourna-
ISAAC-final.tex; 13/10/2002; 4:03; p.4

Automated Assistants for Analyzing Team Behaviors 5
ments in a fully automated fashion. This analysis has revealed manyinteresting results including surprising weaknesses of the leading teamsin both the RoboCup-97 and RoboCup-98 tournaments. ISAAC alsoprovided team analysis and natural language summaries at RoboCup-99. At RoboCup-99, ISAAC was also awarded the “Scientific ChallengeAward” for outstanding research at a RoboCup tournament. ISAAC isavailable on the web at http://coach.isi.edu and is used remotely byteams preparing for these competitions.
Although ISAAC was initially applied in RoboCup, ISAAC’s tech-niques are intended to apply in other team domains such as agent-teamsin foraging and exploration [4], distributed resource allocation [19] andbattlefield simulations [35]. For instance, in this article, we demonstratethe generality of ISAAC’s techniques by applying it to the analysis ofcommunication actions of a team of software agents [38]. The team isengaged in the task of the simulated evacuation of civilians trapped ina hostile territory. Here ISAAC can compare different scenarios basedon the sets of sequences of message exchanged between agents. ISAACcould potentially be applied to several other domains, which we discussin Section 7.
Finally, given the state of the art of team analysis tools, it is impor-tant at this juncture to actually build working team analysts, to beginto understand the key principles underlying such systems. This is whatwe have embarked upon with this investigation. ISAAC is a concreteimplemented team analyst that was not only used by its developers butby an entire user community (in this case, the RoboCup simulationcommunity), which provided valuable feedback, and thus guided itsdevelopment. This investigation has already revealed important princi-ples for building future team analysts, such as multiple granularities ofanalysis, multiple techniques of presentation, techniques to suggest im-provements to agent teams, as discussed in the rest of this paper. Theseprinciples appear to be applicable to other domains, as discussed insection 7. We expect that principles revealed via such investigations willeventually serve as a foundation to build general theories for analysisof agent teams and multi-agent systems in general.
The rest of this paper is organized as follows: Section 2 presentsan overview of ISAAC. Section 3-5 describes the three models usedin ISAAC for analysis. Section 6 presents the evaluation and results.Section 7 demonstrates the generality of ISAAC’s techniques. Section 8describes related work. Section 9 presents a summary of the work andidentifies some directions for future work.
ISAAC-final.tex; 13/10/2002; 4:03; p.5

6
2. Designing a team analyst : An Overview
In order to address the three constraints on the design of team analystsdescribed in the previous section, we use a two-staged approach to theteam analysis problem. The first stage is acquiring models that willcompactly describe team behavior, providing a basis for analyzing thebehavior of the team. As mentioned earlier, this involves using multiplemodels at different levels of granularity to capture various aspects ofteam performance. The second stage is to make efficient use of thesemodels in analyzing the team and presenting this analysis to the user.Later sections delve into more specifics of these models. An overviewof the entire process is shown in Figure 2.
Current Data Trace
PreviousData Traces
Individual KeyAgent Actions
Key Patternsof Interaction
Statistics ofEngagements
IndividualAgent Model
MultipleAgent Model
GlobalTeam Model
Multiple Models
Recommendations
Near Misses
Natural LanguageSummary
User
Data Mining
Data Mining
Data Mining
FSAlearning
C5.0
C5.0
Perturbationanalysis
Perturbationanaysis
Apply to currentdata trace
Display toUser
Model output
Model output
Request analysis
Presentation
Figure 2. Flow Chart for ISAAC Model Generation and Analysis.
For acquiring team models, ISAAC relies on a bottom-up approachusing large data traces. These data traces would be extremely difficultfor a human to read and understand much less analyze. There aresignificant advantages to relying on a bottom-up approach:
1. The analysis of team behavior will be independent of understandingthe source code of the team, thus increasing ISAAC’s generality byensuring that the techniques for obtaining the team models are notdependent on the specific team being analyzed.
2. Requiring users to enter a causal model that explains agents’ in-dividual and group behavior would have been extremely tediousand difficult; indeed, given complex agent interactions in dynamicenvironments, the users themselves may not have such a causalmodel available.
3. We are particularly interested in discovering novel and surprisingregularities in the data where the developers of the various teamsoperating in the domain might be unaware of.
While this bottom-up approach thus offers several advantages, itsone potential drawback is the absence of a causal model. This draw-back, in some ways, is also a strong point, particularly in domains
ISAAC-final.tex; 13/10/2002; 4:03; p.6

Automated Assistants for Analyzing Team Behaviors 7
where causal models may be impoverished or missing. ISAAC can usea data intensive approach even when it is unclear what factors causesuccess. Thus, by design, ISAAC’s analysis and advice relies on strongcorrelational patterns seen in the team’s data traces. Although corre-lational, these patterns may nonetheless enable a user to draw usefulconclusions about different team behaviors. Indeed, the patterns mayuncover interactions with other agents, teams and the world that comeas a surprise to the designers. This is especially relevant in complexdomains with numerous interacting agents.
Input to all models comes in the form of data traces of agent be-haviors. In the current implementation of ISAAC, these traces havebeen uploaded from users around the world through the Internet. Asshown in Figure 2, acquiring the models involves a mix of data miningand inductive learning but is specific to the granularity of analysis beingmodeled. It is important to note that this learning is mainly in service ofexplaining observed team behavior to the users rather than predictingunseen data. Thus, for analysis of an individual agent action (individualagent model) we use rules obtained from decision trees to explain agentbehavior and also to suggest improvements. For analysis of agent inter-actions (multiple agent model), critical patterns are learned and theirfrequency of occurrence is obtained. To develop rules of team successesor failures (global team model), game level statistics are mined fromall available previous games and again inductive learning is used todetermine factors that correlate with success and failure.
In order to maximize human comprehension, the presentation of themodels needs to be catered to the granularity of the analysis. ISAACuses different presentation techniques for the different levels of analysis.For the individual agent model, the features that compose a rule pro-vide implicit advice for improving the team (i.e., some specific featureswere seen to correlate with failure). To further elucidate, a multimediaviewer is used to show cases matching the rule, allowing the user tobetter understand the situation and to validate the rules. Figure 3shows ISAAC’s multimedia viewer which displays the soccer field andplays from the game. The viewer can highlight key features specific toISAAC’s analysis. In particular, the viewer highlights features empha-sized in a rule. A perturbation analysis is then performed to recommendchanges to the team by changing the rule condition by condition andmining cases of success and failure for this perturbed rule. These casesfrom actual games are also displayed in the multimedia viewer, enablingthe user to verify or refute the analysis.
For the multiple agent model, a finite automaton is learned in orderto characterize the patterns of agent interactions. A perturbation anal-ysis is also performed here to find patterns that are similar to successful
ISAAC-final.tex; 13/10/2002; 4:03; p.7

8
Figure 3. ISAAC’s multimedia viewer: On the right hand side of the field, ISAAChas highlighted the distance to goal and the angle from the center of field.
patterns but were unsuccessful. Both successful patterns and these“near misses” are displayed to the user as implicit advice. In addition,two teams can be compared based on the probability distributions oftheir critical patterns of agent interactions obtained from the learnedfinite automaton. The differences in these distributions may explain thedifferences in the team’s performance. For example, if the comparisonbetween a team that performs poorly and a team that performs wellshows that the distributions of their patterns are significantly different,then this may suggest to the user techniques to improve the poorlyperforming team.
Finally, the global team model also uses decision tree learning, but itrequires a different method of presentation. For the analysis of overallteam performance, the current engagement is matched against previ-ous rules, and if there are matches, ISAAC presents the conditionsof the matched rule as the likely determining factors in the result ofthe engagement. A natural language summary of the engagement isgenerated using this rule for content selection and sentence planning.ISAAC makes use of the multimedia display here as well, linking textin the summary to corresponding selected highlights.
ISAAC-final.tex; 13/10/2002; 4:03; p.8

Automated Assistants for Analyzing Team Behaviors 9
Of the three models that we have proposed, the multiple agent modelappears to be the most well suited for the comparison of different teamsof agents. In contrast, the individual agent model considers only acritical action by a single agent. Thus, it concentrates on events attoo fine a granularity to consider it to appropriately characterize ateam. The global team model finds the features that contribute to thesuccess of teams in general, and is not team specific. The multiple agentmodel, on the other hand, considers sequences of collaborative and non-collaborative actions of different agents in a particular team that resultin the team achieving a goal. These patterns of actions characterize ateam’s behavior better than a single action performed by individualagents and hence the multiple agent model was selected as a means ofcomparing different teams.
We have empirically settled on the three levels of analysis in ISAACdescribed above. They appear to cover the spectrum of activities thatare useful to analyze a team, starting with individual actions, to sub-team interactions, to global team behaviors; and indeed, these levelsappear useful in the RoboCup domain. However, it is not necessarythat all three levels be used in all applications of ISAAC. Indeed, asdiscussed in Section 7, we have so far applied one of the three ISAACmodels (the multiple agent model) in analyzing communications withina team of software agents. A second model (the global team model) isalso potentially applicable.
3. Individual Agent Model
This section examines the first of ISAAC’s three models, which focuseson key actions taken by individual agents and is specific to each team.In this and the following two sections, we first provide a conceptualoverview of the model being analyzed and then discuss its instantiationin RoboCup.
3.1. Conceptual Overview of the Individual Agent Model
The eventual success or failure of a team is often determined by inter-mediate successes or failures during critical events – events that maybe widely separated in time and/or loosely connected to each other.For instance, in a battlefield simulation, there may be many distinctattacks on enemy units, which are critical to the team’s eventual suc-cess or failure, that are embedded in a larger history of maneuvering.The individual agent model focuses on such intermediate successes orfailure, analyzing actions of individual agents that play a critical role
ISAAC-final.tex; 13/10/2002; 4:03; p.9

10
in such intermediate results. The goal is to learn a model of criticalindividual actions that is useful for developers and other analysts. Thus,this model should be both compact and easily understandable for thehuman users. Furthermore, since we want to support improvement toteams, it is desirable to be able to engage in “what-if” analysis todetermine how small changes in the team could affect performance.Thus, the model should lend itself easily to such modifications. Thiscould be very useful to a developer who is looking for hints on how toimprove the performance of his/her team.
To construct such a model, symbolic approaches for machine learn-ing seemed more promising than non-symbolic machine learning ap-proaches like neural networks since the latter could result in a modelthat is difficult for a human to comprehend. Amongst symbolic ap-proaches, decision trees have often been used for agents’ learning aboutown decisions [32] (or for modeling others [8]) in the presence of largeamounts of data. However, unlike these approaches that use decisiontrees as a model of prediction of agent behavior in unseen cases, we usedecision trees as a model to explain observed agent behavior. The keyinsight here is that we wish to extract key features that discriminatebetween success and failure of critical actions — these features are likelyto be of most interest to agent developers. Decision trees enable us toextract such discriminatory features. We also use rules extracted fromdecision trees in “what-if” analysis, as discussed later in this section.
The algorithm for the individual agent model is described in Fig-ure 4. The user submits logs of the team’s behavior along with whathe/she considers to be critical events and his/her choice of features.The MineLogs() function of the individual agent model then mines thelogs for positive and negative examples of the critical events. The indi-vidual agent model then uses C5.0 to come up with rules that explainthese examples. When a user selects a particular rule, all those casesof examples that satisfy this rule are obtained and user can choose todisplay any of these using the multimedia viewer.
This technique appears to result in compact and easily understand-able rules given a suitable choice of features. These rules and thecases they represent can be displayed to the user as implicit adviceon how individual agents operate in critical situations. Currently, C5.0is used to form the rules of success and failure. (Note that C5.0 is usedinstead of C4.5, since its ability to assign different costs of misclassifi-cations enables a user to tailor the analysis, as explained in the nextsubsection.)
At present, we assume that the identification of the intermediatesuccess and failure points is part of the domain specific knowledgeavailable to the individual agent analysis model. The other domain
ISAAC-final.tex; 13/10/2002; 4:03; p.10

Automated Assistants for Analyzing Team Behaviors 11
IndividualAgentModel(team, logs, choiceOfCriticalEvents, features){
team: team for which the Model is being constructed;
logs: Logs of team’s behavior;
examples <- MineLogs (logs, choiceOfCriticalEvents, features);
rules <- ApplyC5.0 (examples);
original_rule <- null; conditions <- {}; cases <- {};
do{
choice <- GetUserChoice ();
switch (choice) {
case selectRule:
original_rule <- SelectRule (choice, rules);
cases <- GetCasesFromExamples (original_rule, examples);
conditions <- GetConditions (original_rule);
break;
case selectCondition:
condition <- SelectCondition (choice, conditions);
perturbed_rule <- PerturbRule (condition_to_perturb, original_rule);
cases <-GetCasesFromExamples (perturbed_rule, logs);
break;
case selectCase:
selected_case <- SelectCase (choice, cases);
DisplayCase (multiMediaViewer, selected_case);
break;
}
} while (choice != exitModel);
}
MineLogs (logs, choiceOfCriticalEvents, features){
examples <- extract positive and negative examples from logs based on
choiceOfCriticalEvents and features;
return examples;
}
GetCasesFromExamples (rule, examples){
examples: positive and negative examples of team’s critical event behavior;
cases <- obtain snippets of logs corresponding to each example in examples;
return cases;
}
PerturbRule (condn_to_perturb, original_rule){
perturbed_rule <- rule obtained by modifying the original_rule by inverting
the test of condn_to_perturb;
return perturbed_rule;
}
Figure 4. General Algorithm for Individual Agent Model.
ISAAC-final.tex; 13/10/2002; 4:03; p.11

12
specific knowledge that is provided to the individual agent model iswhat features to use. The selection of features must be such that theyhave the breadth to cover all information necessary for the analysis, butshould also be as independent of each other if possible. In addition,it is important that the feature be an attribute that can be easilyunderstood by the team developer. In the future, a semi-automatedattribute selection may be used [7]. These features, along with thedecision on what constitutes intermediate success or failure, are the onlybackground information or bias given to the individual agent analysistechnique.
In addition to the implicit advice mentioned above, we developed anautomated approach to “what-if” analysis based on the perturbationof the learned rules, to provide explicit advice for team improvement.After ISAAC has produced rules determining which circumstances gov-ern success and failure classifications, it uses a perturbation analysisto determine which changes would produce the most benefit. Sinceeach learned rule consists of a number of conditions, several possibleapproaches to perturbations could be considered. One approach wouldbe to add or drop conditions in the rule. Another approach would beto incrementally modify the tests in each condition, for instance, byincreasing or decreasing the numeric value being tested in a condition.A third approach is to invert the attribute test in the conditions, i.e., anattribute test Ti in the original rule would be modified to ¬Ti to createa perturbed rule. We use this third approach, since it ensures that theset of cases satisfying the perturbed rule will have no overlap with theset of cases satisfying the original rule. Thus, if we invert a condition ina rule that classifies failure examples, the resulting rule will no longersatisfy any of these failure examples — it could thus form the basis ofgood advice in improving the team. For instance, it is possible that theresulting rule covers a significant number of success cases.
Our approach to rule perturbations could lead to a large numberof perturbations however. In particular, a rule R can be expressed asT1 ∧ T2 ∧ . . . ∧ TN , a conjunction of tests Ti where N is the numberof conditions in rule R. There are
∑Nk=1
(Nk
)
( = 2N − 1) differentnon-empty subsets of tests that can be inverted. To obtain a perturbedrule, all the tests in any one such subset should be inverted and hence2N −1 perturbed rules can be obtained. However, we restrict the set ofpossible perturbations to include only rules that result from reversingexactly one condition. While changing more than one condition at atime is not necessarily undesirable, the space of perturbation that canbe done is now exponential. In addition, we are more interested inshowing the effect of making a small change in the present behavior,for example, how a change to just a single condition of a failure rule
ISAAC-final.tex; 13/10/2002; 4:03; p.12

Automated Assistants for Analyzing Team Behaviors 13
results in transforming it into a success rule. This will tell us how animprovement in performance can be made with minimal effort. Thus,a rule with N conditions will result in exactly N perturbed rules. Thesuccesses and failures governed by the perturbations of a rule are minedfrom the data and examined to determine which condition has the mosteffect in changing the outcome of the original rule, turning a failure intoa success. This perturbed condition provides explicit advice for teamimprovement. Since these cases are mined from the original data usingthis perturbation technique, the recommended changes must already bewithin the agent’s skill set. Furthermore, perturbations are guaranteedto provide a non-empty set of examples. This is because, if there werea condition that when reversed led to an empty set of examples, thenC5.0 would not have included that condition in the rule. In particular,that condition would not discriminate between success and failure casesand thus would not be part of the rule.
As shown in Figure 4, in order to do “what-if” analysis the user canchoose any one of the conditions of a rule to invert and thus obtains aperturbed rule. ISAAC then mines through all the positive and negativeexamples of the team’s critical event behavior and returns those cases ofexamples that satisfy the conditions of this perturbed rule. The user canuse the multi-media viewer to display any of these cases. An exampleof applying perturbation analysis is presented in section 3.3.
3.2. Application of Individual Agent Model to RoboCup
The first step in applying the approach to RoboCup is identifying thedomain specific information that would be used by ISAAC as bias inits analysis (in this article we assume that the reader is somewhat fa-miliar with the game of soccer). In particular, in the RoboCup domain,success means outscoring the opponent. Shots on goal are therefore keypoints of intermediate success or failure as these are situations that candirectly affect the outcome of the game. Thus, the focus of ISAAC’sindividual agent analysis in RoboCup is shots on a team’s goal as wellas shots by the team on an opponent’s goal.
Having defined shots on goal as key events, we need to determinewhich domain dependent features might be useful in classifying thesuccess or failure of a shot on goal. After an initial set of experimentswith a relatively large feature set, ISAAC currently relies on a set ofonly 8 features such as velocity of the ball, distance to the goal, etc.to characterize successes and failures in order to improve understand-ability. Besides criteria like coverage and independence, an importantcriterion for selection of the features to use was the comprehensibility
ISAAC-final.tex; 13/10/2002; 4:03; p.13
14
of the feature to human users. A complete list of features is shown inAppendix A.
Having determined which features to use in the analysis and the keyevents (the cases) to examine, the task is transformed to mining theraw data and feeding it to the C5.0 decision tree learning algorithm.From the resulting decision tree, C5.0 forms rules representing distinctpaths in the tree from the root of the tree to a leaf classification ofsuccess (goal-score) or failure (goal not scored). Each rule describes aclass of similar successes or failures. The resulting rules were found tobe compact and few in number. An evaluation of the rules generatedand their compactness is presented in section 6.1.
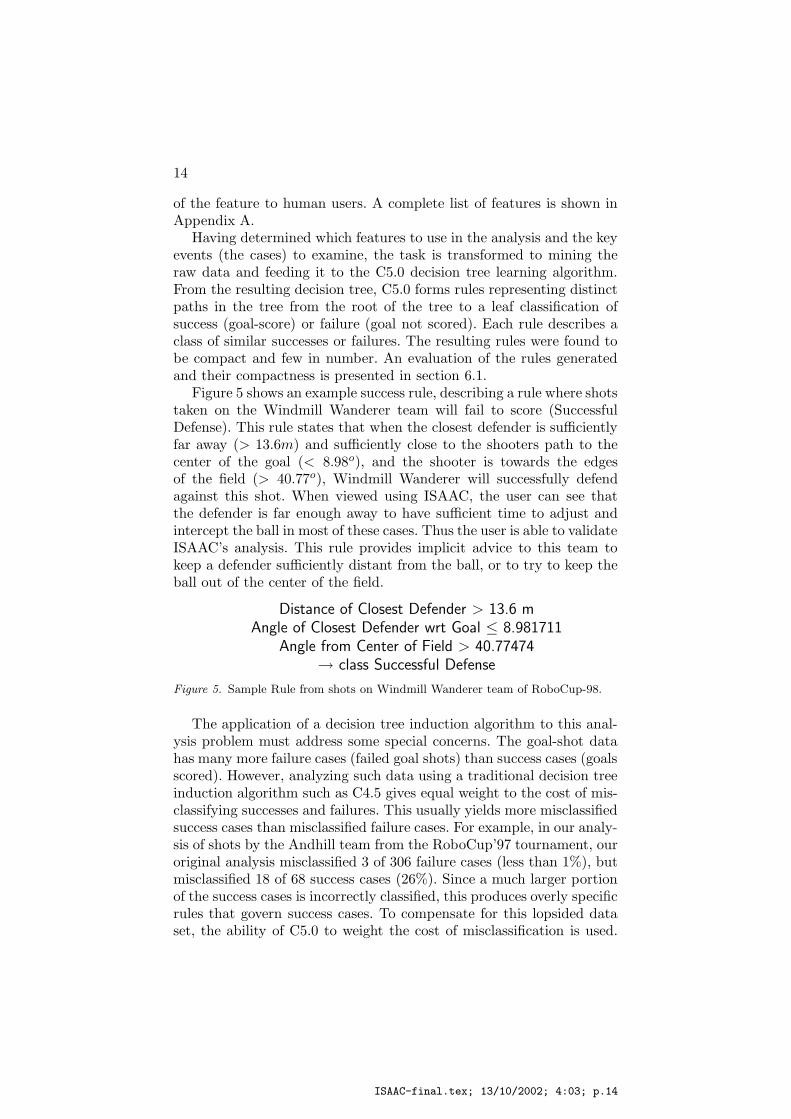
Figure 5 shows an example success rule, describing a rule where shotstaken on the Windmill Wanderer team will fail to score (SuccessfulDefense). This rule states that when the closest defender is sufficientlyfar away (> 13.6m) and sufficiently close to the shooters path to thecenter of the goal (< 8.98o), and the shooter is towards the edgesof the field (> 40.77o), Windmill Wanderer will successfully defendagainst this shot. When viewed using ISAAC, the user can see thatthe defender is far enough away to have sufficient time to adjust andintercept the ball in most of these cases. Thus the user is able to validateISAAC’s analysis. This rule provides implicit advice to this team tokeep a defender sufficiently distant from the ball, or to try to keep theball out of the center of the field.
Distance of Closest Defender > 13.6 mAngle of Closest Defender wrt Goal ≤ 8.981711
Angle from Center of Field > 40.77474→ class Successful Defense
Figure 5. Sample Rule from shots on Windmill Wanderer team of RoboCup-98.
The application of a decision tree induction algorithm to this anal-ysis problem must address some special concerns. The goal-shot datahas many more failure cases (failed goal shots) than success cases (goalsscored). However, analyzing such data using a traditional decision treeinduction algorithm such as C4.5 gives equal weight to the cost of mis-classifying successes and failures. This usually yields more misclassifiedsuccess cases than misclassified failure cases. For example, in our analy-sis of shots by the Andhill team from the RoboCup’97 tournament, ouroriginal analysis misclassified 3 of 306 failure cases (less than 1%), butmisclassified 18 of 68 success cases (26%). Since a much larger portionof the success cases is incorrectly classified, this produces overly specificrules that govern success cases. To compensate for this lopsided dataset, the ability of C5.0 to weight the cost of misclassification is used.
ISAAC-final.tex; 13/10/2002; 4:03; p.14
Automated Assistants for Analyzing Team Behaviors 15
Specifically, the cost of misclassifying a success case is set to be greaterthan the cost of misclassifying a failure case [40]. ISAAC uses a 3 to 1ratio by default, but this is adjustable.
More generally, differential weighting of misclassification cost pro-vides a mechanism for tailoring the level of aggressiveness or defensive-ness of ISAAC’s analysis. Consider shots on goal against a team. If avery high cost is assigned to misclassifying a successful shot on goal,the rules produced will likely cover all successful shots, and quite a fewmisclassified failure cases. In this case, the rule conditions are implicitlyadvising to make the team very defensive. On the other hand, if a lowcost is assigned, the rules may not cover all of the successful cases.Therefore, ISAAC would only give “advice” relevant to stopping themajority of shots on goal. This may not be appropriate if we considerany goal to be a serious failure. Therefore, we allow the user to adjustthe weight on success case misclassifications.
3.3. Perturbation Analysis in RoboCup Soccer
As explained in section 3.1, we consider perturbations that result frominverting a single condition in the rule. Analysis of the perturbed rulesand the cases that satisfy these rules, may be useful in identifying rea-sons for unsuccessful behavior and also to improve successful behaviorfurther.
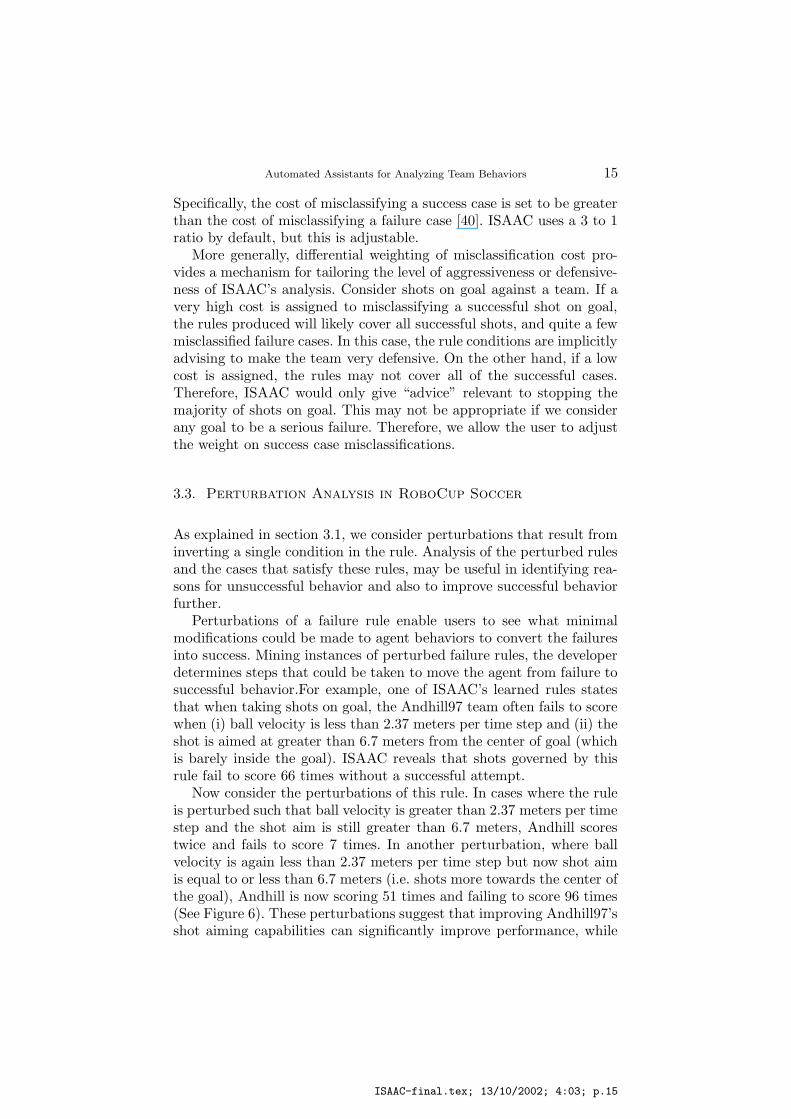
Perturbations of a failure rule enable users to see what minimalmodifications could be made to agent behaviors to convert the failuresinto success. Mining instances of perturbed failure rules, the developerdetermines steps that could be taken to move the agent from failure tosuccessful behavior.For example, one of ISAAC’s learned rules statesthat when taking shots on goal, the Andhill97 team often fails to scorewhen (i) ball velocity is less than 2.37 meters per time step and (ii) theshot is aimed at greater than 6.7 meters from the center of goal (whichis barely inside the goal). ISAAC reveals that shots governed by thisrule fail to score 66 times without a successful attempt.
Now consider the perturbations of this rule. In cases where the ruleis perturbed such that ball velocity is greater than 2.37 meters per timestep and the shot aim is still greater than 6.7 meters, Andhill scorestwice and fails to score 7 times. In another perturbation, where ballvelocity is again less than 2.37 meters per time step but now shot aimis equal to or less than 6.7 meters (i.e. shots more towards the center ofthe goal), Andhill is now scoring 51 times and failing to score 96 times(See Figure 6). These perturbations suggest that improving Andhill97’sshot aiming capabilities can significantly improve performance, while
ISAAC-final.tex; 13/10/2002; 4:03; p.15

16
trying to improve agents’ shot velocity may not result in a drasticperformance increase.
Figure 6. Perturbation analysis showing the Andhill ’97 team scoring using a per-turbed shooting behavior. The rule was perturbed to cover shots taken more towardsthe center of the goal.
Perturbations of success rules are also useful. There are two reasonsfor this. First, it allows ranking of conditions contributing to success.In particular, some changes to the rule will take a team further fromsuccess than another. For example, a team may succeed 95% of the timewhen all the conditions are met. The percentage of success may dropto 50% if the first condition is changed and down to 5% if the secondcondition is changed. In this case, the developer may decide that evenif the first condition is not met, this is still the correct course of actionwhile doing so if the second condition is not met is a bad decision.The second reason why perturbing success rules is useful is that byallowing the user to see how the team succeeds or fails when conditionsin the success rule are modified, more insight can be drawn as to whythese conditions are important. At this juncture if it important for thehuman user to determine if the factors that ISAAC comes up with aretruly the reasons the team is succeeding or failing.
ISAAC-final.tex; 13/10/2002; 4:03; p.16

Automated Assistants for Analyzing Team Behaviors 17
4. Multiple Agent Model
While the previous section focuses on critical actions of individualagents, it is also important to analyze the sequence of actions (pos-sibly including actions of multiple agents) that lead up to these criticalactions. Such analysis may for instance reveal that some sequences aremore prone to success than others. Therefore, we also need to modelthe patterns of collaborative or non-collaborative interactions of severalagents of the team that lead up to intermediate successes (or failures).Section 4.1 provides a conceptual overview of our approach to learningthese patterns, while Section 4.2 discusses its application in RoboCup.
4.1. Conceptual Overview of the Agent Interaction
Model
The multiple agent model is a characterization of key aspects of ateam’s interactions where we once again use intermediate goals tofocus our analysis of key interactions. The characterization is in theform of a set of patterns, each with a probability of occurrence, wherethe patterns consist of sequences of abstracted actions of differentagents that result in intermediate successes (or failures). The proba-bility distributions over patterns can be used in two ways. First, theprobability distributions of these patterns enable developers to checkfor surprising, unanticipated patterns. For instance, patterns they hadspecifically engineered may have very low likelihood of occurrence andconversely, unplanned for patterns may have an unexpected high rate ofoccurrence. Second, ISAAC can compare the probability distributionsof these patterns across two different teams to determine whether theyare similar. This comparison reveals if the two teams are significantlydissimilar in their approach to achieving their goals. If the comparisonof a less successful team with a highly successful team shows themto be dissimilar, then this suggests that the less successful team’sperformance could potentially improve by better emulating the moresuccessful team’s strategy for agent interaction.
There are some important concerns that must be addressed in ac-quiring this model. First, the patterns need to support human compre-hension as well as being able to differentiate teams. In particular, somedifferences in agent interactions may be insignificant with respect togoal achievement. Such differences should not be allowed to complicatethe representation of the patterns or obscure the comparison of teams.For example, actions that immediately precede (sub)goals are oftenfar more significant than actions far removed. Further, as we lookfarther away from the goal, we might expect increasing variance in
ISAAC-final.tex; 13/10/2002; 4:03; p.17

18
agent actions. Thus we may want at times to use a learning approachthat considers only a limited window of actions prior to (sub)goals. Werefer to the length of this window as window size.
Second, some form of generalization will typically be required thatprovides a compact representation which suppresses irrelevant details,again in support of comprehension and comparative analysis. For ex-ample, in soccer, if a teammate and scorer pass the ball back andforth to each other repeatedly, the fact that it may happen 2 times or3 times is not as significant as the fact that it happened repeatedly.More generally, it is often important that the pattern or ordering ofcausal interactions between actions not be violated whereas the numberof repetitions of the pattern is often less significant. Thus, we wouldlike the learned patterns to generalize over repetitions, but not overother (potentially causal) structure. We refer to such generalization asbounded structural generalization.
A final concern that must be addressed in learning sequences of inter-actions is to maintain some information about the frequency distribu-tion of different patterns of agent interactions, without over-generalization.In particular, it is important to ensure that generalization does notsurprise the developers by creating non-existent patterns of interac-tions (modulo bounded structural generalization). We refer to thisconstraint as frequency distribution accuracy constraint. Among otherimplications, one key implication of this discussion is that we need anapproach to learning that can be tailored. Tailoring allows us to erron the side of conservative learning and then tailor the learning whenthe patterns learned are too large or numerous for comprehension oreffective contrast.
Thus, to learn the sequences comprising the agent interaction model,ISAAC must be able to learn the probability distribution of the patternsof team interactions based on observation of the team’s actions whileallowing tailoring of window size and structural generalization. Oneproposed approach to learning such patterns is to use decision trees asin section 3.1. However, in our preliminary experiments this approachfailed for two reason. (i) It was difficult to capture temporal sequencinginformation in a flexible way; (ii) the goal is to find classes (patterns)and their frequencies as opposed to identifying features that discrimi-nate between classes. A natural way to learn these patterns and theirdistributions is by learning a probabilistic finite automaton (PFA). APFA is a good mechanism for representing a probability distributionsince it can be used to determine the probability of the occurrenceof a sequence of symbols. Several algorithms for learning deterministicprobabilistic finite automata (DPFA) and non-deterministic probabilis-tic finite automata (NPFA) have been proposed in the literature, e.g.,
ISAAC-final.tex; 13/10/2002; 4:03; p.18

Automated Assistants for Analyzing Team Behaviors 19
the APFA algorithm [28] and Crutchfield algorithm [9] for DPFA andBayesian state merging method [31] and Augmented Markov Model[12] for NPFAs. To arrive at a model of the underlying distributionthey are trying to learn, these algorithms have to perform some gen-eralization by either merging probabilistically similar states [28, 9, 31]or by merging all states and then splitting those states that do notaccurately represent the data [12].
Although our approach to learning the agent interaction model wasinspired by the above general work on learning finite automata, ourinitial efforts have led us away from general approaches to learningarbitrary automata. Instead, our initial focus has been on developinga learning approach that allows the learning to be modulated in waysconsistent with the constraints discussed earlier, specifically windowsize, bounded structural generalization and frequency distribution ac-curacy. To this end, we have found that a representation similar to theprefix tree automaton representation [1] to be appropriate. However, wereverse this representation. In particular, we reverse the direction of allthe edges, with the goal state as the root of the tree and add traversalsfrom a unique start state to all the leaf nodes (Note: This violates thetree structure of the automaton but only at this unique start state).In addition, we maintain information about frequency counts of eachedge. We discuss our approach more formally below, and discuss howthis approach could be extended to take into account the factors ofwindow size and bounded structural generalization.
The finite automaton ISAAC attempts to learn is defined as G = <
S, A, L, a0, g > where,
1. S, a set of symbols s1, s2, . . . , sM encountered;
2. A, a set of states (or nodes) a1, a2, . . . , aN where each state ai
consists of the following:
− asi , the symbol recognized by state ai. as
i ∈ S;
− i, the state number which uniquely identifies the state.
3. a0, the Start State where state number = 0 and as0 = ∅.
4. g, the Goal Symbol where g ∈ S. The state that recognizes g isreferred to as the Goal State;
5. L, a set of directed links l1, l2, . . . , lP where each link li consists ofthe following:
− lfi , state number of source of the link;
− lti , state number of destination of the link;
ISAAC-final.tex; 13/10/2002; 4:03; p.19

20
− lΣi , number of times the link was traversed while adding newsequences of symbols(frequency of link).
No two links li and lj are such that lfi = l
fj 6= 0.
The frequencies of the patterns learned by the finite automaton are thefrequencies of the links that begin at the start state, i.e., values of lΣi for
each link, li where lfI = an
0 = 0. It is possible to obtain the probabilitydistribution of the patterns of interactions from these frequencies.
Window size is defined as follows:
Def: Window size of k indicates that for a string of symbols σ =s1s2 . . . sig, where g is a goal symbol, the sequence added to thefinite state automata will be si−k+1si−k+2 . . . sig where s1 6= g,s2 6= g, . . . , and si 6= g.
Bounded structural generalization is defined as follows:
Def: Bounded structural generalization of k implies that, for a se-quence of symbols s1s2 . . . sn being added to the finite state au-tomaton, there does not exist any subsequence sisi+1 . . . si+m, suchthat sisi+1 . . . si+m is identical to si+m+1si+m+2 . . . si+2m and m ≤k and 1 ≤ i ≤ (n − 2m).
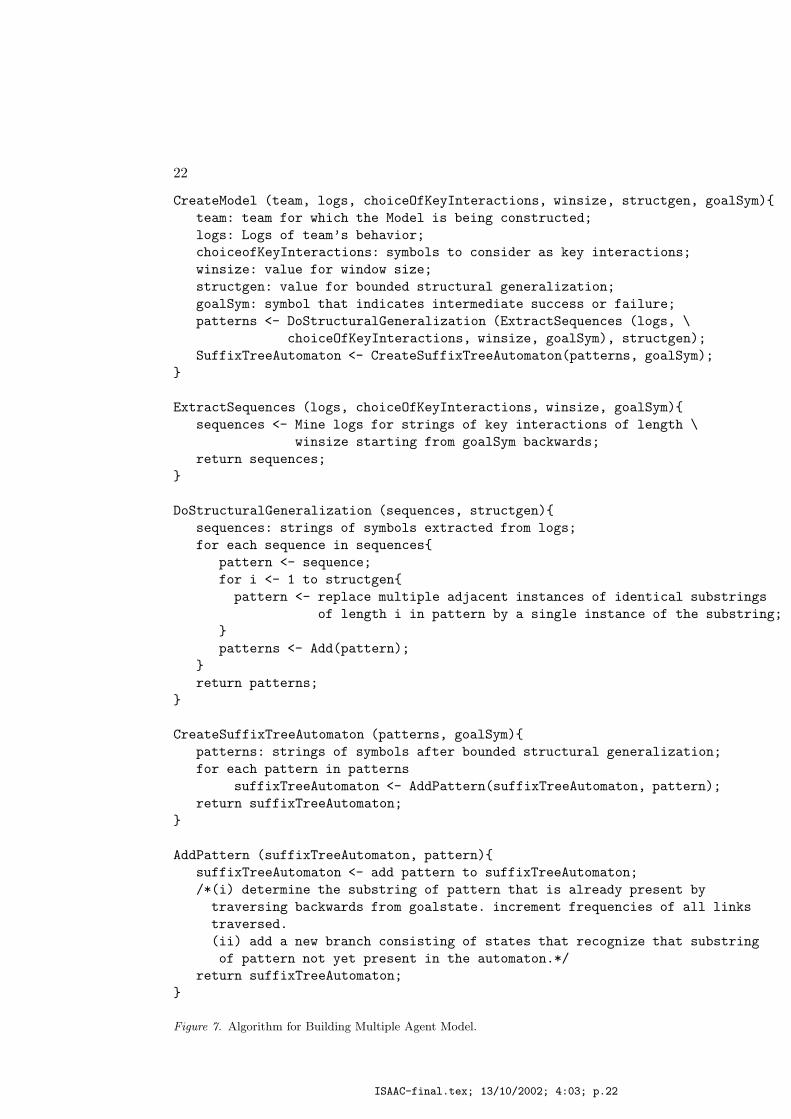
The algorithm for obtaining the multiple agent model is shown inFigure 7. Suppose the window size is set to k1 and the bounded struc-tural generalization to k2. First, the function ExtractSequences() ex-tracts a sequence of symbols of length equal to k1 that end with (inter-mediate) goals from the data traces. Next, to factor in bounded struc-tural generalization, the function DoStructuralGeneralization() elimi-nates repeating subsequences of symbols from this sequence, progres-sively increasing the length of the subsequence being searched for from 1to k2. The function AddPattern() then adds the resulting sequences tothe finite automaton as follows: ISAAC traverses the finite automatonbackwards from the goal state searching for symbols in the sequenceone at a time and increasing the frequency of each traversed link. Thus,ISAAC determines the state, ai up to which the sequence is alreadylearned. ISAAC then proceeds to add the portion of the pattern that isnot yet learned to the finite automata at ai. While adding each symbolof this portion of the sequence ISAAC creates a new state, aj thatrecognizes the current symbol and adds a link connecting aj to aI .The output of this algorithm is a finite state automaton that storesthe frequencies of all the patterns learned. For obtaining the frequencyof a specific pattern, we first find the path from the start state tothe goal state that matches this pattern. The frequency of the edge
ISAAC-final.tex; 13/10/2002; 4:03; p.20

Automated Assistants for Analyzing Team Behaviors 21
from the start state to the next state on the path is the frequencyof the pattern. Window size determines the size of the pattern or inother words the number of abstracted actions that are considered asbeing responsible for the team achieving its (intermediate) goal. Thechoice of window size is application dependent. There are tradeoffswhen choosing window size:
− In many domains, actions that occurred closer to an intermediategoal are likely to have been more responsible for the outcome thanactions that happened further away from the intermediate goal.Therefore a large window size may not be beneficial.
− Choosing a very small window size might cause sequences that areactually very different to appear to be the same while choosinga very large window size results in sequences that are essentiallysimilar appearing to be different. Therefore, at very small windowsizes, teams may appear superficially similar, while at very largewindow sizes, teams may appear superficially different.
− Increase in window size can make comprehensibility difficult forthe human user.
Bounded structural generalization is used to capture repetitive sub-sequences within larger sequences. This parameter appears related towindow size. For small window sizes, bounded structural generalizationgreater than zero may not be useful, as there are unlikely to be repet-itive subsequences at small window sizes. However, for larger windowsizes, bounded structural generalization could be used to capture suchrepetitive subsequences.
In addition to presenting the results of the learned finite automatonto the user, ISAAC uses the agent interaction model to suggest improve-ments in teams using two different techniques. The first technique isto compare two teams. To this end, ISAAC first obtains frequenciesof patterns of agent interactions that resulted in success, for differentteams. Now, if the distributions of the successful patterns for two teamscan be shown to be different we can conclude that the two teams aredifferent in the success strategies. In order to determine if the twodistributions being similar, ISAAC treats the distribution with greatervariance as the underlying distribution and the distribution with lesservariance as the observed distribution. ISAAC then determines whetherthe null hypothesis that the observed distribution is drawn from theunderlying distribution, holds. ISAAC uses the standard Chi-Squaregoodness of fit method (Figure 8) to determine if this null hypothesis istrue. The observed frequencies Oi are frequencies from the distribution
ISAAC-final.tex; 13/10/2002; 4:03; p.21
22
CreateModel (team, logs, choiceOfKeyInteractions, winsize, structgen, goalSym){
team: team for which the Model is being constructed;
logs: Logs of team’s behavior;
choiceofKeyInteractions: symbols to consider as key interactions;
winsize: value for window size;
structgen: value for bounded structural generalization;
goalSym: symbol that indicates intermediate success or failure;
patterns <- DoStructuralGeneralization (ExtractSequences (logs, \
choiceOfKeyInteractions, winsize, goalSym), structgen);
SuffixTreeAutomaton <- CreateSuffixTreeAutomaton(patterns, goalSym);
}
ExtractSequences (logs, choiceOfKeyInteractions, winsize, goalSym){
sequences <- Mine logs for strings of key interactions of length \
winsize starting from goalSym backwards;
return sequences;
}
DoStructuralGeneralization (sequences, structgen){
sequences: strings of symbols extracted from logs;
for each sequence in sequences{
pattern <- sequence;
for i <- 1 to structgen{
pattern <- replace multiple adjacent instances of identical substrings
of length i in pattern by a single instance of the substring;
}
patterns <- Add(pattern);
}
return patterns;
}
CreateSuffixTreeAutomaton (patterns, goalSym){
patterns: strings of symbols after bounded structural generalization;
for each pattern in patterns
suffixTreeAutomaton <- AddPattern(suffixTreeAutomaton, pattern);
return suffixTreeAutomaton;
}
AddPattern (suffixTreeAutomaton, pattern){
suffixTreeAutomaton <- add pattern to suffixTreeAutomaton;
/*(i) determine the substring of pattern that is already present by
traversing backwards from goalstate. increment frequencies of all links
traversed.
(ii) add a new branch consisting of states that recognize that substring
of pattern not yet present in the automaton.*/
return suffixTreeAutomaton;
}
Figure 7. Algorithm for Building Multiple Agent Model.
ISAAC-final.tex; 13/10/2002; 4:03; p.22

Automated Assistants for Analyzing Team Behaviors 23
with less variance and expected Ei is calculated by considering theunderlying distribution to be the one with greater variance. If the χ2
valued obtained is greater than the χ2 value for 95% certainty limit,ISAAC discards the null hypothesis.
χ2 =∑k
i=1(Oi − Ei)2/Ei
where Oi is the observed frequency for pattern i andEi is the expected frequency for pattern i.
Figure 8. Chi-Square Goodness of Fit Test
The Chi-Square Goodness of Fit Test is a valid choice for com-paring teams. Clearly, parametric tests like the t-test and analysis ofvariance would be difficult to apply because they assume the underly-ing distribution is normal. The Chi-Square Goodness of Fit Test is anon-parametric alternative.Furthermore, unlike other non-parametricmethods like the Kolmogorov-Smirnov and Anderson-Darling tests,which are restricted to continuous distributions, the chi-square testcan be applied to discrete distributions.
Using this method it is possible to determine if two teams are dis-similar under the assumption that the environment they operated inwas the same. (Alternatively, it is also possible to determine if theenvironments are dissimilar given that the same team is being com-pared under different settings.) If a team that performs poorly is foundto be dissimilar to a team that performs well, the probability distri-butions of the patterns of these two teams may suggest techniquesto improve the poorly performing team. The following subsection willprovide examples of applications of this technique.
The second technique that ISAAC uses to suggest improvement inteams is perturbation analysis. The goal of perturbation analysis in theagent interaction model is to find unsuccessful patterns of subteam in-teraction from the data traces that are similar to the successful patternslearnt by the finite automaton. These unsuccessful patterns, which werefer to as ”near misses”, help the user scrutinize the difference betweensuccessful and unsuccessful patterns of interaction. In order to do thisperturbation analysis, ISAAC begins with the patterns learned as partof the finite automata (which lead up to success). It then mines newpatterns from the behavior traces that are very similar, and yet end infailure. For instance given an n-step pattern learned as part of the finiteautomaton, ISAAC may mine new n-step patterns, where the first n-1 steps are ”similar” to the pattern from the finite state automatabut where the last step is dissimilar. By ”similar” we mean that thevalues of the attributes of the step from the new pattern lie in the
ISAAC-final.tex; 13/10/2002; 4:03; p.23

24
same range as the attributes of the step of the successful patterns inthe finite automata. The perturbations are restricted to the last stepwhere ISAAC explicitly makes sure that one of the attributes of thestate are not in the range of attribute values for that step in successfulpatterns. For instance, if ”angle” is one attribute of the state, then theperturbation ensures that the ”angle” range is kept the same for all thesteps, except for the last step where the angle range is not enforced,thus leading to a perturbation.
Since these ”near misses” are almost the same as the successfulpatterns but for the last step, team developers can determine whatattributes are useful in the last step to make an unsuccessful patterninto a successful pattern.
4.2. Application of Method to RoboCup Soccer
In RoboCup soccer a goal occurs as a result of a sequence of kicks byone or more players. It is not only the last kick that is responsible forthe goal but the actions of the different agents who interacted just priorto the goal. Thus, in order to analyze the performance of a team, themultiple agent model is important.
The first step necessary to apply the agent interaction model to theRoboCup domain is the determination of the patterns to examine and anotion of success or failure of these patterns. We again use a soccer goalas a notion of success. We consider the sequence of actions (kicks) beforethe ball enters the goal to be the pattern. The feature of the actionthat is considered important is the player who performed the action.The player can be one of shooter (the last player, from the team whichscored the goal, to kick the ball), teammate (any other player, from theteam which scored the goal, who kicked the ball), opponent (any playerfrom the team against whom the goal was scored who kicked the ball).This feature selection is one important aspect of generalization. We donot consider self goals (when the player kicks the ball into his/her owngoal) because such goals are presumably unintentional.
Before applying the learning algorithm we have to determine valuesfor both window size and bounded structural generalization. We canthen use the learning algorithm described in Section 4.1 to learn a finitestate automaton that recognizes all the successful patterns along withtheir frequencies of occurrence. Looking at the probability distributionsof scoring patterns of teams reveals more about the team’s scoring strat-egy. This can be beneficial to developers of this team and as well as foropposition teams. It is also possible to compare the scoring strategy ofdifferent teams based on the probability distribution of these patterns.
ISAAC-final.tex; 13/10/2002; 4:03; p.24

Automated Assistants for Analyzing Team Behaviors 25
Window size in the case of RoboCup is the number of kicks weconsider to be in the pattern. It would appear that in a sequence of kicksthat result in a goal, the kicks that happened earlier are less responsiblefor the eventual goal taking place. This suggests that increasing windowsize too much will not be useful.
The user can choose any value of window size that satisfies his/herneeds better. We have selected window size to be 3 based on the numberof patterns generated, the comprehensibility to a human user and thefact that the effect that a kick had on a goal lessens with the temporaldistance of that kick from the resulting goal. Figure 9 shows the numberof different patterns obtained (Y-axis) as the window size is increased(X-axis), for the top eight teams at RoboCup-98. A window size of twogives only a maximum of 3 different patterns — opponent → shooter →goal (opponent kicks the ball to the shooter, who scores the goal),teammate → shooter → goal (teammate passes the ball to the shooter,who scores the goal) and shooter → shooter → goal (shooter kicksthe ball to himself before scoring the goal). This is clearly too littleto analyze teams based on their interactions. Yet as can be seen inthe figure, for window size equal to 5, the teams have an average of16.75 different sequences while one of the teams has as many as 29different patterns. This may make the analysis difficult to comprehendfor a human. With an average of 6.63 different patterns per team, thewindow size of 3 appears to be a reasonable choice.
0
5
10
15
20
25
30
35
0 1 2 3 4 5
Window Size
Nu
mb
er o
f P
atte
rns
averagemaximum
Figure 9. Number of Patterns vs. Window Size for the top 8 teams of RoboCup-98.
ISAAC-final.tex; 13/10/2002; 4:03; p.25
26
In the case of RoboCup Soccer we choose bounded structural gen-eralization to be 0 because it seems unlikely that subsequences will beencountered within sequences when window size is equal to 3. Also, ifbounded structural generalization were greater than 0 we might havea situation where it becomes difficult to differentiate between two verydifferent patterns.
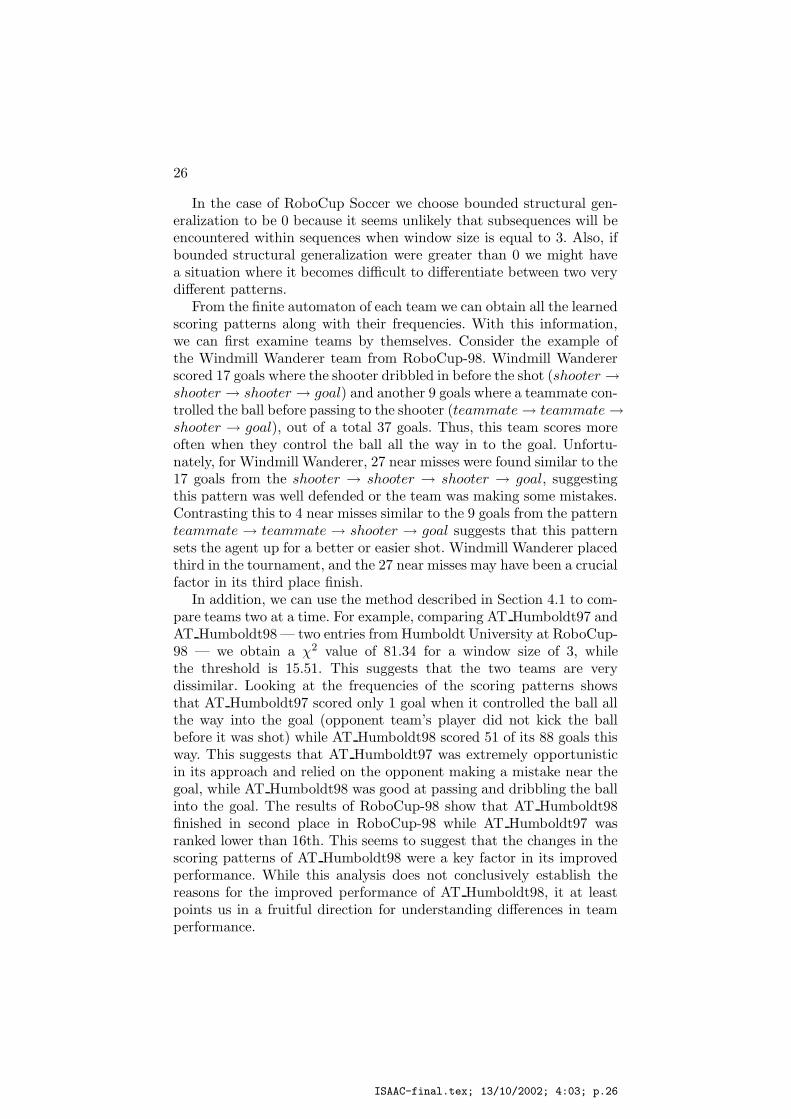
From the finite automaton of each team we can obtain all the learnedscoring patterns along with their frequencies. With this information,we can first examine teams by themselves. Consider the example ofthe Windmill Wanderer team from RoboCup-98. Windmill Wandererscored 17 goals where the shooter dribbled in before the shot (shooter →shooter → shooter → goal) and another 9 goals where a teammate con-trolled the ball before passing to the shooter (teammate → teammate →shooter → goal), out of a total 37 goals. Thus, this team scores moreoften when they control the ball all the way in to the goal. Unfortu-nately, for Windmill Wanderer, 27 near misses were found similar to the17 goals from the shooter → shooter → shooter → goal, suggestingthis pattern was well defended or the team was making some mistakes.Contrasting this to 4 near misses similar to the 9 goals from the patternteammate → teammate → shooter → goal suggests that this patternsets the agent up for a better or easier shot. Windmill Wanderer placedthird in the tournament, and the 27 near misses may have been a crucialfactor in its third place finish.
In addition, we can use the method described in Section 4.1 to com-pare teams two at a time. For example, comparing AT Humboldt97 andAT Humboldt98 — two entries from Humboldt University at RoboCup-98 — we obtain a χ2 value of 81.34 for a window size of 3, whilethe threshold is 15.51. This suggests that the two teams are verydissimilar. Looking at the frequencies of the scoring patterns showsthat AT Humboldt97 scored only 1 goal when it controlled the ball allthe way into the goal (opponent team’s player did not kick the ballbefore it was shot) while AT Humboldt98 scored 51 of its 88 goals thisway. This suggests that AT Humboldt97 was extremely opportunisticin its approach and relied on the opponent making a mistake near thegoal, while AT Humboldt98 was good at passing and dribbling the ballinto the goal. The results of RoboCup-98 show that AT Humboldt98finished in second place in RoboCup-98 while AT Humboldt97 wasranked lower than 16th. This seems to suggest that the changes in thescoring patterns of AT Humboldt98 were a key factor in its improvedperformance. While this analysis does not conclusively establish thereasons for the improved performance of AT Humboldt98, it at leastpoints us in a fruitful direction for understanding differences in teamperformance.
ISAAC-final.tex; 13/10/2002; 4:03; p.26

Automated Assistants for Analyzing Team Behaviors 27
5. Automated Engagement Summary – Team Model
The third ISAAC model attempts to address success or failure as ateam. In designing this model we had two options possible. One was totailor the analysis to specific teams. In particular, by analyzing datatraces of past behaviors of a specific team, it would be possible toexplain why this team tends to succeed or fail. This approach would besimilar to the one followed in Section 3, which explained why agents’critical actions tend to succeed or fail in a team specific manner. Asecond option was to analyze teams in terms of why teams succeed orfail in the domain in general, in a non-team-specific manner (whichdoes not require data traces from the particular team being analyzed,but from other teams in this domain). Despite the advantages of option1 (team specific explanations), this option was rejected due to the lackof large amounts of team specific engagement (team activity) data,and option 2 was used. In particular, unlike the individual agent modelin Section 3, which can obtain lots of individual action data pointseven from a single engagement, a single engagement is just one datapoint for the global team model. For instance, even a single RoboCupgame provides a large number of shots on the goal to begin learningthe individual agent model; yet this single game provides just a singleinstance and is not enough to begin learning a global team model. Thusunlike previous models, the team model is not specific to a particularteam. We use all available data of every engagement in the domain,such that the model provides general explanations in terms of whyengagements in a particular domain result in success or failure.
5.1. Conceptual Overview of Team Model
The global team model focuses on the analysis of why teams succeedor fail over the course of an engagement (overall team activity). Theassumption of this model is that there can be many different factorsthat impact a team’s overall success or failure. In a complex environ-ment, a team may have to perform many actions well in order to besuccessful. These actions may involve entirely different sub-teams, andvery different kinds of events, perhaps widely separated in time, maybe implicated in success or failure. Nevertheless, there may be patternsof these factors that, although not strongly related in the behavioraltrace, do in fact correlate with whether a team succeeds in a domain.The global team analysis attempts to find these patterns.
Acquiring the team model involves techniques similar to the previousmodels as discussed above, except that rather than searching for pointsof intermediate success or failure, overall features that lead to the final
ISAAC-final.tex; 13/10/2002; 4:03; p.27

28
outcome over an entire engagement are more useful. These outcomesmay be classified as success, failure, tie, etc. It is again up to thedomain expert to choose these features and to provide the classes of thefinal outcomes. The C5.0 induction algorithm is used on these features,classifying the engagement for each team, and learning the dominantfeatures that lead to that particular outcome. Just as in section 3.1,our use of decision trees is for explaining the outcome of an encounterrather than for prediction of the outcome.
A different approach from section 3.1 is taken for using these rules.When analyzing a specific engagement, we mine the features from theengagement and determine which learned rule the current engagementmost closely matches. This rule then provides key features that corre-late with team success or failure [37, 42]. ISAAC uses natural languagegeneration to create a summary to ease human understanding of theengagement as a whole. While the rule is a model of the engagement,further explanation of this rule to the human comes from generatingthe summary.
Thus, with the current method, ISAAC generates a natural languagesummary of each engagement employing the rule that matched theengagement as the basis for content selection and sentence planning inaccordance with Reiter’s architecture of natural language generation[27]. Reiter’s proposal of an emerging consensus architecture is widelyaccepted in the NL community. Reiter proposed that natural languagegeneration systems use modules in content determination, sentenceplanning, and surface generation. ISAAC’s NL generation can be easilyexplained in terms of these modules.
The algorithm for building the global team model is presented inFigure 10. Each engagement (team activity) is considered to be asingle data item.The function BuildTeamModel() mines the logs toobtain training data and using C5.0 with this data it obtains rules thatdescribe global team behavior. The CreateTemplate() function createstemplates for generating summaries using these rules. ISAAC uses therules for content determination since each rule contains the featurevalues that were pertinent to the result of the engagement it classifies.Furthermore, the conditions of each rule also have some ordering con-straints, since the rules come from a decision tree learning algorithm,and we use this to form our sentence planning. We consider branchescloser to the root of the tree to have more weight than lower branches,and as such should be stated first. Each condition is associated witha single sentence, and ordered accordingly. Surface generation of thetext is done by a template instantiation process. Every rule has one(or more) templates that obey the content determination and sentence
ISAAC-final.tex; 13/10/2002; 4:03; p.28
Automated Assistants for Analyzing Team Behaviors 29
planning specified. The creation of these templates, specifically the useof connectives, pronouns, etc. is currently done manually.
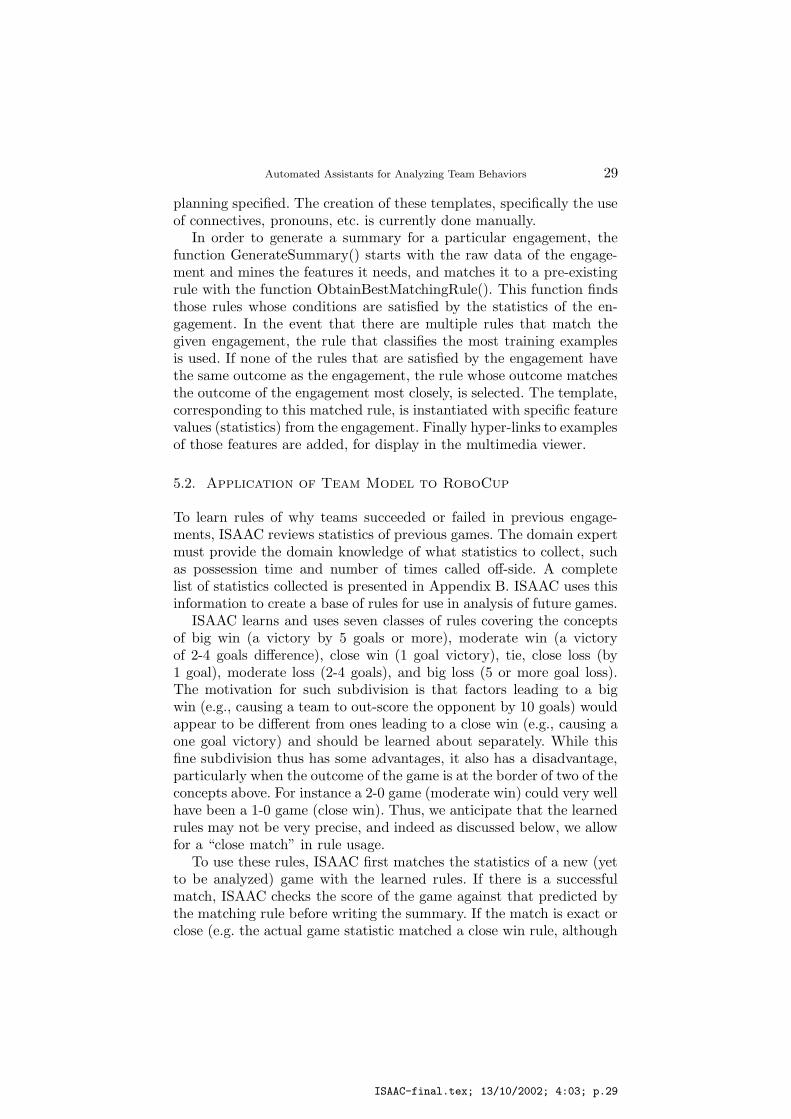
In order to generate a summary for a particular engagement, thefunction GenerateSummary() starts with the raw data of the engage-ment and mines the features it needs, and matches it to a pre-existingrule with the function ObtainBestMatchingRule(). This function findsthose rules whose conditions are satisfied by the statistics of the en-gagement. In the event that there are multiple rules that match thegiven engagement, the rule that classifies the most training examplesis used. If none of the rules that are satisfied by the engagement havethe same outcome as the engagement, the rule whose outcome matchesthe outcome of the engagement most closely, is selected. The template,corresponding to this matched rule, is instantiated with specific featurevalues (statistics) from the engagement. Finally hyper-links to examplesof those features are added, for display in the multimedia viewer.
5.2. Application of Team Model to RoboCup
To learn rules of why teams succeeded or failed in previous engage-ments, ISAAC reviews statistics of previous games. The domain expertmust provide the domain knowledge of what statistics to collect, suchas possession time and number of times called off-side. A completelist of statistics collected is presented in Appendix B. ISAAC uses thisinformation to create a base of rules for use in analysis of future games.
ISAAC learns and uses seven classes of rules covering the conceptsof big win (a victory by 5 goals or more), moderate win (a victoryof 2-4 goals difference), close win (1 goal victory), tie, close loss (by1 goal), moderate loss (2-4 goals), and big loss (5 or more goal loss).The motivation for such subdivision is that factors leading to a bigwin (e.g., causing a team to out-score the opponent by 10 goals) wouldappear to be different from ones leading to a close win (e.g., causing aone goal victory) and should be learned about separately. While thisfine subdivision thus has some advantages, it also has a disadvantage,particularly when the outcome of the game is at the border of two of theconcepts above. For instance a 2-0 game (moderate win) could very wellhave been a 1-0 game (close win). Thus, we anticipate that the learnedrules may not be very precise, and indeed as discussed below, we allowfor a “close match” in rule usage.
To use these rules, ISAAC first matches the statistics of a new (yetto be analyzed) game with the learned rules. If there is a successfulmatch, ISAAC checks the score of the game against that predicted bythe matching rule before writing the summary. If the match is exact orclose (e.g. the actual game statistic matched a close win rule, although
ISAAC-final.tex; 13/10/2002; 4:03; p.29

30
BuildTeamModel (logs, classes, features){
logs: Logs of team’s behavior;
classes: Classes for classification of engagements (team activity);
features: Features used in the classification;
for each engagement in Logs{
modelData <- Add (ExtractDataPoint (engagement, features, classes));
}
teamModelRules <- ApplyC5.0(modelData, features, classes);
summaryTemplates <- CreateTemplates (teamModelRules);
}
CreateTemplates (teamModelRules){/*currently with user assistance*/
teamModelRules: Rules of Global Team Activity obtained by applying C5.0;
for each rule in teamModelRules{
for each condition in rule in order of appearance{/*sentence planning*/
generate sentence corresponding to condition;
template <- Add(summaryTemplate, sentence)
}
summaryTemplates <- Add (summaryTemplates, template);
}
return summaryTemplates;
}
GenerateSummary(engagement, teamModelRules, summaryTemplates, classes, features){
engagement: Data trace of a single team activity;
teamModelRules: rules of global team model obtained by running BuildTeamModel();
summaryTemplates: templates for summary generation obtained by BuildTeamModel();
dataPoint <- ExtractDataPoint (engagement, features, classes);
matchingRule <- ObtainingBestMatchingRule (teamModelRules, dataPoint);
summary <- fillTemplate (summaryTemplates[matchingRule], dataPoint);
return summary;
}
ObtainBestMatchingRule(teamModelRules, dataPoint){
dataPoint: the feature values and outcome corresponding to an engagement;
satisfiedRules <- rules from teamModelRules that satisfy dataPoint;
matchedRules <- rules from satisfiedRules that have same outcome as dataPoint;
if (matchedRules is empty)
matchedRules <- rules from satisfiedRules whose outcomes are closest to
outcome of dataPoint;
bestMatchingRule <- rule from matchedRules covering most training examples;
return bestMatchingRule;
}
Figure 10. Algorithm for Global Team Model.
ISAAC-final.tex; 13/10/2002; 4:03; p.30

Automated Assistants for Analyzing Team Behaviors 31
the game had an outcome of 2-0), the template is used as is. If thereare multiple matches, the matching frequency is used to select the bestrule. However, if no match is close to the actual score, ISAAC still usesthe rule, but changes the template to reflect surprise that the score didnot more closely match the rule.
Once a rule is matched, ISAAC now has an associated templateto shape the game summary. The template orders components of therule according to their depth in the original decision tree, in accordancewith our sentence planning technique. ISAAC then fills in the template,mining the features of this particular game to create a summary basedon the rule. An example rule is shown in Figure 11.
Ball in Opposition Half > 69%Average Distance of Opponent Defender > 15 m
Bypass Opponent Last Defender > 0Possession time > 52%
Distance from Sideline to Opponents Kicks > 19 m→ class Big Win
Figure 11. Example team rule for big wins.
To see how this rule is used in creating a natural language summary,we examine one summary generated using this rule as a template,shown in Figure 12. In this case, ISAAC is presenting a summaryexplaining the reasons for which 11Monkeys was able to defeat theHAARLEM team. The underlined sentences above correspond directlyto the rule, with some augmentation by actual statistics from the game.By using the rule for content determination and sentence planning,ISAAC is able to present the user the reasons for the outcome of the en-gagement, and avoid presenting irrelevant data consisting of irrelevantfeatures. 1
6. Evaluation and Results
To evaluate ISAAC, we evaluate each of its models in isolation and thenthe effectiveness of the integrated ISAAC system. Section 6.1 presentsthe evaluation of the individual agent model, Section 6.2 describesthe evaluation of the multiple agent key interaction model, Section
1 The headline and the first sentence of the summaries were created based onheadlines and first sentences of the press reports for the World Cup’98 (Human)Soccer games in Paris. An appropriate headline was chosen at random from a selectedset to avoid repetitions.
ISAAC-final.tex; 13/10/2002; 4:03; p.31

32
HAARLEM Offense Collapses in Stunning Defeat at
the hands of 11Monkeys!
11Monkeys displayed the offensive and defensive prowess,shutting out their opponents 7-0. 11Monkeys pressedthe attack very hard against the HAARLEM defense,keeping the ball in their half of the field for 84% of the gameand allowing ample scoring opportunities. HAAR-LEM pulled their defenders back to stop the onslaught,but to no avail. To that effect, 11Monkeys waswas able to get past HAARLEM’s last defender, creating2 situations where only the goalie was left to de-fend the net. 11Monkeys also handled the ball better,keeping control of the ball for 86% of the game. HAARLEMhad a tendency to keep the ball towards the center of the fieldas well, which may have helped lead them to ruin given tehferocity of the 11Monkeys attack .
Figure 12. Game Summary for HAARLEM-vs-11Monkeys. The lines underlinedcorrespond to conditions in the rule used to generate the summary. These link tocases of that condition that can be viewed in the multimedia viewer.
6.3 presents the evaluation of the global team model, and Section 6.4describes the evaluation of the overall ISAAC system.
6.1. Evaluation of the Individual Agent Model
We evaluate along several dimensions: (i) bottom-up discovery of novelpatterns; (ii) ability to perform global analysis; (iii) compactness andunderstandability of model; and (iv) pattern accuracy.
A key measure of ISAAC’s individual agent model is the effectivenessof the analysis, specifically the capability to discover novel patterns.Section 3.3 highlighted a rule learned about the Andhill97 team con-cerning their aiming behavior. This rule was one instance of ISAAC’ssurprising revelation to the human observers; in this case, the surprisewas that Andhill97, the 2nd place winner of RoboCup-97, had so manygoal-shot failures, and that poor aim was at least a factor. Not onlywas this intriguing to other observers, this was also intriguing to thedeveloper of the team, Tomohito Andou. After hearing of this result,and witnessing it through ISAAC’s multimedia interface, he told[2] usthat he “was surprised that Andhill’s goal shooting behavior was so poor. . . ” and “ . . . this result would help improve Andhill team in the fu-ture.” Some other teams that used ISAAC in preparation for RoboCup
ISAAC-final.tex; 13/10/2002; 4:03; p.32

Automated Assistants for Analyzing Team Behaviors 33
included CMUnited99, Headless Chickens, Gongeroos and others, all ofwhich provided positive feedback about ISAAC’s capabilities. Indeed,Peter Stone of CMUnited99 pointed out[33]: ”I particularly like theway that you can change the rules and see how that affects the casesthat are covered. Being able to cycle through the covered cases is alsoa great feature.”
Another interesting result from the individual agent analysis modelcomes from the number of rules governing shooting behavior and defen-sive prowess. Figure 13 shows that in each year, the number of rules fordefense decreased for the top 4 teams, perhaps indicating more refineddefensive structures as the teams progress. Also, the number of rulesnecessary to capture the behavior of a team’s offense is consistentlymore than that necessary for defense, possibly due to the fact that nosingle offensive rule could be effective against all opponent defenses.The key here is that such global analysis of team behaviors is nowwithin reach with team analyst tools like ISAAC.
0
2
4
6
8
10
12
14
16
Offense Defense
Nu
mb
er o
f R
ule
s
RoboCup97RoboCup98RoboCup99
Figure 13. Number of Rules by Year for Top 4 Teams
In order to evaluate if the individual agent model meets it’s goalsof understandability and compactness we consider the number of rulesgenerated per team and the number of conditions per rule for RoboCup-98 teams. The Figure 14 shows the number of rules of offense for thetop 8 teams at RoboCup-98. As this figure clearly indicates, the num-ber of rules that characterize a team’s offense are few enough to becomprehensible to a human user. The average number of of rules ofoffense is 10.875. In addition, these rules are very compact as can beseen in Figure 15, which shows the number of conditions in a rule for
ISAAC-final.tex; 13/10/2002; 4:03; p.33

34
the top 8 teams at RoboCup-98. All of these teams had fewer than 3conditions in a rule on average. Although Figures 14 and 15 focus onthe top 8 teams at RoboCup-98, the observations from these figuresare true for all RoboCup teams. Owing to the manageable number ofrules per team, the comprehensibility of the features selected and thecompact nature of the rules generated, the goals of understandabilityand compactness of the individual model are met. The data used togenerate Figures 14 and 15 is presented in Appendix C.
0
2
4
6
8
10
12
14
16
18
A
ndhil
l
A
T_Hum
boldt
C
AT_Finl
and
C
MUnit
ed
IS
IS
G
emini
R
olling
Brains
W
indm
illWan
dere
rs
Teams
No
. of
Ru
les
No. of non-scoring Rules No. of scoring rules Total no. of rules
Figure 14. Number of Rules in Individual Model. Scoring rules refer to rules thatdescribe success in shots on goal; Non-scoring rules describe failed goal shots
Another point of evaluation is understanding how well the modelcaptures the shooting behaviors. To this end, ISAAC models were ap-plied to predict game scores at RoboCup-99, a rather difficult problemeven for humans. ISAAC used rules describing a team’s defense andmatched them with the raw averaged data of the shots taken by theother team to produce an estimate of how many goals would be scoredagainst that team in the upcoming game. Performing this analysis forboth teams produced a predictive score for the outcome of the game.This prediction obviously ignores many critical factors, including thefact that some early games were unrepresentative and that teams werechanged by hand during the competition. Yet in practice, ISAAC’s
ISAAC-final.tex; 13/10/2002; 4:03; p.34

Automated Assistants for Analyzing Team Behaviors 35
0
1
2
3
4
5
6
7
8
A
ndhil
l
A
T_Hum
boldt
C
AT_Finl
and
C
MUnit
ed
IS
IS
G
emini
R
olling
Brains
W
indm
illWan
dere
rs
A
vera
ge
Teams
No
. of
Co
nd
itio
ns
Avg. no. of conditions in arule Max. conditions in a rule
Min. conditions in a rule
Figure 15. Number of Conditions in a Rule in Individual Model.
predictive accuracy was 70% with respect to wins and losses, indicatingit had managed to capture the teams’ defenses quite well in its model.
Finally, in addition to the analysis, the multi-media viewer was alsoquite helpful to developers as seen from comments by another devel-oper, Helmut Myritz of AT Humboldt who said “I have to say thatwe know some weaknesses of the AT Humboldt98, like a not optimalkick, and a sometimes strange goal kick behavior or a static defense.All these things could be realized well by watching your analysis of ourgames.” [20]. Note that ISAAC’s users — for instance, Andou in Japanand Myritz in Germany — were able to view ISAAC’s analysis overseason the web.
6.2. Evaluation of the Multiple Agent Model
We have already evaluated the multiple agent model to some extent inSection 4.2. There, we showed how the probability distribution obtainedfor the Windmill Wanderer team of RoboCup-98 could be analyzedand also how the teams, AT Humboldt97 and AT Humboldt98 werecompared. It is possible to perform such analysis on any RoboCupteam and also to compare any two RoboCup teams. The comparison ofteams suggests methods for improving the performance of teams thatdid not perform well.
ISAAC-final.tex; 13/10/2002; 4:03; p.35

36
To illustrate how this comparison is useful, we use the method ofcomparison from in Section 4.1 to compare the top 8 teams of RoboCup-98 with each other. In Figure 16, the X-axis shows the top 8 teams atRoboCup-98 and the Y-axis shows the χ2 values obtained by comparingthe probability distributions of the scoring patterns of these teams toeach other. Values that lie above the threshold line indicate that wecan state with a confidence limit of 95% that the two distributions aredissimilar. Some of the observations that can be made from this figureare:
1. The teams AT Humboldt, CMUnited, Gemini and WindmillWan-derer are significantly dissimilar from ISIS while Andhill98, Rolling-Brains and CAT Finland are not as dissimilar.
2. All the remaining seven teams are significantly different from CMU-nited, the winner of RoboCup-99!
3. Andhill and CAT Finland are not significantly different from eachother.
Observation 1 can be explained by looking at the frequencies ofscoring patterns. This revealed that indeed, CMUnited, AT Humboldtand WindmillWanderer laid more emphasis on ball control and drib-bling while ISIS was more opportunistic in its strategy and tried tocapitalize on its opponents’ mistakes. The results of RoboCup-98 alsoshow that the teams CMUnited, AT Humboldt and WindmillWandererfinished in the top 3 positions. Observation 2 suggests that CMUnitedscoring patterns were very different from the other teams. Looking atthe shooting patterns and their frequencies reveal that unlike otherteams, CMUnited relied heavily on good dribbling skills and good ballcontrol. This probably accounted for why CMUnited finished in firstplace in RoboCup-98. Observation 3 is not that surprising given thatboth teams relied on opportunistic patterns for most of their goals. It isinteresting to note that Gemini finished in 5th place and CAT Finlandin 7th place. The data used to generate this graph is shown in AppendixC.
Thus, the multiple agent team interaction model is able to appro-priately discriminate between teams and suggest methods of improve-ments, e.g., ISIS’s performance might be improved by giving the teamthe necessary skills and strategies to use scoring patterns similar tothese top three teams.
ISAAC-final.tex; 13/10/2002; 4:03; p.36

Automated Assistants for Analyzing Team Behaviors 37
0
10
20
30
40
50
60
70
80
90
100
110
120
130
140
150
160
170
180
190
200
0 1 2 3 4 5 6 7 8 9
Teams
� ²
1 Andhill
2 AT_Humboldt
3 CAT_Finland
4 CMUnited
5 ISIS
6 Gemini
7 RollingBrains
8 WindmillWanderers
Threshold
Figure 16. χ2 values for the top 8 RoboCup-98 teams when compared to each other
for window size=3. Threshold = 15.51 represents the χ2 value for 95% certainty
limit.
6.3. Evaluation of the Global Team Model
For the global team model, three different evaluations were performed.In the first, we distributed a survey to twenty of the participants atthe RoboCup-99 tournament, who were witnessing game summariesjust after watching the games. Figure 17 shows the breakdown of thesurvey, showing that 75% of the participants thought the summarieswere very good.
In the second evaluation, we compared natural language summariesgenerated without a global team model with summaries generated di-rectly from the original feature set of 12 features, without using C5.0to pinpoint the justifications of a team’s success or failure. Comparisonbetween the two summaries revealed the following. On average, ISAACuses only about 4 features from its set of 12 statistics in the summaries,resulting in a 66% reduction from a natural language generator notbased on ISAAC’s machine learning based analysis. Thus, ISAAC’sapproach was highly selective in terms of content. Furthermore, sum-maries generated without ISAAC were much longer, lacked variety, andfailed to emphasize the key aspects of the game.
Finally, we measured ISAAC’s use of the team model for naturallanguage generation by viewing the error rates from the machine learn-
ISAAC-final.tex; 13/10/2002; 4:03; p.37

38
0%
10%
20%
30%
40%
50%
60%
70%
80%
Ratings by Participants
Per
cen
tag
e o
f P
arti
cip
ants
Very GoodGoodFairPoorVery Poor
Figure 17. Automated Game Summary Survey Results.
ing algorithm used. These error rates tell us how accurately ISAAC’slearned rules reflected the game. On the original set of games for whichISAAC’s rules were learned, 87% of the games were classified correctly(70% exact match, 17% close match), resulting in an error rate of 13%.Our test set of (unseen) RoboCup ’99 games produced 72% classifiedcorrectly (39% exact match, 33% close match), for an error rate of 28%.If an error does occur, ISAAC still produces a summary, but it reflectsits surprise at the outcome, thus explaining the error. The error rateon our test data could indicate that a better feature set is possible orthat the data may be noisy.
6.4. Evaluation of the overall ISAAC system
Evaluating ISAAC as an integrated system is more difficult. However,some observations can still be made. ISAAC was awarded the “Sci-entific Challenge Award” for outstanding research by the RoboCupFederation. ISAAC was used extensively at the RoboCup-99 tourna-ment in Stockholm, Sweden (held in conjunction with IJCAI’99), wherereceived a great deal of praise and other feedback. While visualizationtools like the 3-D visualization tools [14] by Bernard Jung (see figure19) were available, what was missing was the kind of analysis providedby ISAAC. ISAAC was continuously running throughout RoboCup-99with its analysis continually projected on the screen. Developers usedISAAC to analyze opponent teams after the early round matches to geta feel for the skill of upcoming opponents. Spectators and developers
ISAAC-final.tex; 13/10/2002; 4:03; p.38

Automated Assistants for Analyzing Team Behaviors 39
alike were able to view ISAAC’s game summaries just minutes aftera game, and there was also a great deal of speculation concerningISAAC’s predictions on future games. As mentioned earlier, ISAACwas also used in preparation for RoboCup-99; Figure 18 shows ISAACin use at RoboCup-99.
Figure 18. ISAAC in use – RoboCup-99, Stockholm. ISAAC was continuously run-ning throughout the RoboCup-99 tournament with its analysis continually projectedon the screen as shown in the figure. This tournament lasted several days and ISAACanalyzed dozens of games of teams. Here, ISAAC’s predictions are shown on the rightof the screen.
7. Generality of ISAAC
To illustrate the generality of ISAAC’s team analysis techniques, thissection discusses their applicability in very different domains. We beginby applying ISAAC’s analysis techniques to an agent team performingmission rehearsal simulations to evacuate civilians stranded in a hos-tile location [38]. The team comprises of 11 different heterogeneousagents, viz. a multi-modal user interface agent, a route-planner, a web-querying information-gathering agent and 8 synthetic helicopter pilots.
ISAAC-final.tex; 13/10/2002; 4:03; p.39

40
Figure 19. 3-D snapshot of a RoboCup soccer game.
The system must dynamically plan routes avoiding obstacles and enemythreats. The helicopters have to fly a coordinated mission to evacuatethe civilians.
Tacticians and agents developers of these mission rehearsal simula-tions are often interested in understanding the impact of changes inthe environment on agent-team performance. For instance, changes inevacuation tactics, threat profiles, and position of civilians may havedifferent impact on team performance; and mission rehearsal simu-lations could help tacticians select the tactics leading to improvedteam performance. Here, to analyze team performance, we focus onthe sequences of messages exchanged by the agents during a singleevacuation rehearsal. In particular, given that these agents are highlyheterogeneous, it is difficult to extract their actions as in RoboCup(e.g., user-interface agents’ actions are to communicate with a user,while helicopters’ actions are to fly, while a web-querying agent issuesqueries). However, the agents communicate in a common language —indicating commitment to plans or sub-plans and completion of plansand sub-plans — so that sequences of messages between agents canbe more easily used for team analysis. Here, changes in the environ-ment that impact team performance are often reflected as changes inthe sequences of messages exchanged. For instance, some evacuationtactics may result in increased frequency of message sequences dealingwith ground-based missile threats; while other tactics may result infew such sequences. Thus, these other tactics may be determined to bemore successful in preempting missile threats.
ISAAC’s multiple agent model seems well suited for this analysis.Interactions are considered to be the messages exchanged and are rep-resented by the content of the message. A message, which says thatthe task has been completed, indicates that the goal of evacuatingthe civilians has been achieved. APPENDIX D describes two examples
ISAAC-final.tex; 13/10/2002; 4:03; p.40

Automated Assistants for Analyzing Team Behaviors 41
of messages exchanged in this domain. Using the learning algorithmdescribed in Section 4.1, we obtain probability distributions of thedifferent patterns of message exchanges that result in the goal beingachieved. It is possible to compare different environments based on theprobability distributions of these patterns.
In this domain, all messages exchanged are important as they relateto the execution of critical team plans and sub plans, which has a directbearing on the outcome of the mission. It is, therefore, not desirable tospecify a window size of interactions that are responsible for the goal.For the purpose of the algorithm we specify window size to be infinityso as to include all messages in the sequence of symbols learned by thefinite automaton. Several messages can be repeated at multiple timesduring the message logs, which corresponds to the team repeating theexecution of a sub plan. If bounded structural generalization is set tozero the resulting finite automaton is extremely large. Figure 20 showsthe number of states in the finite automata on the Y-axis and the valueof bounded structural generalization on the X-axis. Each data point inthis graph corresponds to the size of the finite automata after learningall the logs that we have in this domain. As can be seen from thefigure, increasing structural generalization beyond 2 does not decreasethe number of states. This suggests that no repeating subsequence ofmessages of length greater than two was seen in the message logs.
To test ISAAC’s application in this domain, we compared two sets ofruns. The first set was reported by Gal Kaminka[16]. He had obtained aset of 10 logs of message exchanges among agents. We recently createda new set of runs. We wished to understand if ISAAC’s analysis wouldreveal any similarities or dissimilarities in the patterns seen in the tworuns, and possibly the causes for such dissimilarities. These dissimilari-ties could be due to changes in the composition of the evacuation agentteam, changes in our computational environment, etc. It is difficult toanswer the question purely by examining the message logs, becauseeach log contains approximately 1000 messages. ISAAC can abstractout the detail and is critical for understanding the activities of thesystem.
We applied the learning algorithm described in Section 4.1 (SeeFigure 7) to learn the probability distribution of the patterns of eachenvironment for bounded structural generalization equal to 2 and win-dow size equal to infinity. The pattern of symbols needs to be abstractedabstracted out of the message logs to get rid of irrelevant messages andunnecessary details in the message. One immediate surprise here wasthe number of different sequences/patterns of execution learned. WithISAAC’s abstraction, it is possible to see that the different patternsarise because: (i) some agents may fail during execution, requiring
ISAAC-final.tex; 13/10/2002; 4:03; p.41

42
0 2 4 6 8 10 12 14100
110
120
130
140
150
160
170
180
Structural Generalization
Nu
mb
er o
f S
tate
s
Figure 20. Structural Generalization vs. Number of States in finite automaton.
other agents to work around such failures; (ii) enemy reaction mayvary requiring agents to sometimes engage in failure recovery. Thecombinations of which agents fail and how enemy reactions vary, leadto different patterns.
Is the new set of runs very different from Kaminka’s set of runs?Comparing the probability distributions of the two sets of runs, weobtain a χ2 value of 150.0 while the threshold for 95% confidence limit is21.3. This indicates that the two teams are very dissimilar, a somewhatsurprising result, since we did not anticipate a significant change in thisteam.
However, observation of the patterns learned reveals the following:
− In Kaminka’s set of runs, helicopter pilot agents explicitly syn-chronize before landing to evacuate civilians. In the new runs, thehelicopters do not synchronize explicitly.
− One of the agents in our set of runs, which does route planningappeared to fail more frequently in the new set of runs, comparedwith Kaminka’s set of runs.
ISAAC-final.tex; 13/10/2002; 4:03; p.42
Automated Assistants for Analyzing Team Behaviors 43
Thus by applying ISAAC’s technique, differences between two teamscan be detected more easily and the reasons for these differences can befound more easily. Tacticians can potentially use tools such as ISAACto change evacuation simulation parameters and gauge their impact onteam performance.
There are several other similar domains where ISAAC could beuseful. For example, in team domains like agent teams in foragingand exploration [4], ISAAC could be used for exploring actions, in-teractions, and global trends such as target hit rate and friendly firedamage, ISAAC could produce a similar analysis of military tactics inthe battlefield simulation domain [35] (see Figure 23), and use simi-lar presentation techniques as well. Indeed, ISAAC’s techniques couldapply to analysis of many types of teams and their actions.
Team analysis would also be valuable in problems requiring dis-tributed, dynamic resource allocation [19], e.g., Figure 21 shows adomain where a set of sensor agents must collaborate to track multipletargets. Here, each sensor agent controls a hardware node (as shown inFigure 22), and must make decisions on which other agent to assist intracking targets, when to turn on/off to conserve power, which of itsmultiple radar heads to turn on, what messages to send other agentsand when to send (despite the limited bandwidth) etc. As we scaleup the number of sensor nodes, analysis of performance of individualnodes, teams and subteams is crucial. The analysis is complicated byproblems like noise and sensor failures. We may wish to understandfor instance when a sensor team succeeds or fails in tracking particulartypes of targets. Given the data traces of agent’s actions, ISAAC couldbe used to determine patterns that result in success. It could help incontrasting different strategies for tracking particular types of targets.Furthermore, the global team model could be used to explain to a userwhy tracking succeeded or failed over an entire set of targets using NL.
8. Related Work
The research presented in this article concerns areas of multi-agentteam analysis and comprehensible presentation techniques. We have al-ready discussed some related work in previous sections. In this section,we compare some specific highly related research. Section 8.2 discussesresearch outside the RoboCup domain, while Section 8.1 focuses onrelated research within the RoboCup domain itself.
ISAAC-final.tex; 13/10/2002; 4:03; p.43

44
Figure 21. Sensor Agents collaborating to track moving targets, shown in red.
Figure 22. Left: Moving target being sensed; Right: Hardware Sensor
8.1. RoboCup-specific Related Work
In this section, we discuss some of the related work conducted withinthe RoboCup community. A novelty of ISAAC here is that it is notconfined to RoboCup, but is intended to be more general-purpose, andindeed it has been applied to other domains, such as the evacuationrehearsal domain discussed in Section 7.
Andre et al have developed an automatic commentator system forRoboCup games, called ROCCO, to generate TV-style live reports formatches of the simulator league [3]. ROCCO attempts to recognizeevents occurring in the domain in real time, and generates correspond-
ISAAC-final.tex; 13/10/2002; 4:03; p.44

Automated Assistants for Analyzing Team Behaviors 45
Figure 23. Helicopter agents in a battlefield simulation.
ing speech output. While both ROCCO and ISAAC use multimediapresentations, ROCCO attempts to analyze events quickly to producelive reports. However, the ROCCO analysis does not use multiple mod-els of behavior for multi-perspective analysis as in ISAAC, and itsanalysis is not designed to help users and developers understand teams’abilities. ROCCO also has no capability to perform perturbation anal-ysis.
Similarly, Tanaka-Ishii et al developed a commentator system, MIKE[39] that presents real-time analysis of a RoboCup soccer game, high-lighting the statistics relevant to the game as they happen. ISAAC’sglobal team model provides a summary of the game to explain the keyaspects of the game responsible for the outcome, while MIKE looks atgames as they happen. Unlike ISAAC’s global model, MIKE’s focusis on determining what features to tell the human audience duringthe course of the game. ISAAC also analyzes individual actions andsubteam interactions.
Among other related work, Tomoichi Takahashi attempted to eval-uate teams based on the collaboration among agents and not just fromscores [41]. Some of the key differences between ISAAC and Taka-hashi’s work are: (i) ISAAC’s presentation of its analysis, for instance,using techniques such as natural language generation; (ii) ISAAC’sperturbation analysis; (iii) ISAAC’s capability to compare teams.
ISAAC-final.tex; 13/10/2002; 4:03; p.45

46
The designers of the KULRot RoboCup team used inductive logicprogramming to validate the programming of their multi-agent team[11]. Thus, they knew what they were looking for in their agents andcould incorporate all the background knowledge that the agents wereusing. In contrast, ISAAC is knowledge-lean, but has more differenttypes of analysis and presentation techniques and is capable of analyz-ing any RoboCup team.
Stone and Veloso have also used a decision tree to control someaspects of agents throughout an entire game, also using RoboCup astheir domain [32]. However, this work pertains to execution of agentsrather than analysis of agent teams, and since it is internal to the agent,their work has no means of presentation.
There is of course great general interest in analysis of (human) Soc-cer games, e.g., see [30]. Human soccer games are much more complexcompared to RoboCup and currently require complex analysis includingfactors such as personalities of star players, any injuries they may havesustained etc., that are beyond the scope of RoboCup. Nonetheless,we expect that techniques for analysis developed for RoboCup soccergames would eventually apply to analysis of human soccer games (andother games as well). One key hindrance at present is the unavailabil-ity of raw data in a machine-readable form for analysis tools such asISAAC.
8.2. General Related Work
Bhandari et al’s Advanced Scout uses data mining techniques on NBAbasketball games to help coaches find interesting patterns in their play-ers and opponents’ behaviors [5]. Advanced Scout also enables coachesto review the relevant footage of the games. Advanced Scout is ableto capture statistical anomalies of which coaches can take advantage.However, Advanced Scout does not have some of ISAAC’s extensionsincluding the use of multiple models to analyze different aspects ofteams, perturbations to make recommendations, and game summariesfor an analysis of overall team performance.
Ndumu et al’s system for visualization and debugging multi-agentsystems comprises a suite of tools, with each tool providing a differentperspective of the application being visualized [21]. However, the toolsdo not perform any in-depth analysis on the multi-agent system, andthe system has no capability for perturbing this analysis. ISAAC alsouses a visualization component, but only as an aid to understandingits analysis.
Johnson’s Debrief system enables agents to explain and justify theiractions [15]. This work focuses on agents’ understanding the rationales
ISAAC-final.tex; 13/10/2002; 4:03; p.46

Automated Assistants for Analyzing Team Behaviors 47
for the decisions they make and being able to recall the situation. De-brief also has a capability for agent experimentation to determine whatalternatives might have been chosen had the situation been slightlydifferent. ISAAC performs something similar in its perturbation anal-ysis however ISAAC focuses on an entire team, not just an individual,necessarily.
Marsella and Johnson’s PROBES [18] is a system for assessing bothagent and human teams in multi-agent simulated training environmentsfor battle-tank crews. In contrast to ISAAC, PROBES was designed toassist instructors controlling the exercise as opposed to the developersof the agents. Further, it approached the analysis problem top-down,in contrast ISAAC’s bottom-up approach. That is, it had pre-builtexpectations about a trainee team’s acceptable behaviors in particulartraining situations (encoded in what are called “situation-space mod-els”). It matched these expectations against observed behaviors of thetrainee crews to locate problematic trainee team behaviors and provideappropriate feedback.
SEEK (and its progeny, SEEK2) is an approach to knowledge baserefinement, an important aspect of knowledge acquisition [23]. Knowl-edge base refinement is characterized by the addition, deletion, andalteration of rule-components in an existing knowledge base, in an at-tempt to improve an expert system’s performance. While the alterationof a rule may seem comparable to ISAAC’s perturbation analysis, thegoals are varied. The refinement done by systems such as SEEK areused to increase performance of the system to correctly classify futurecases. ISAAC’s goal is not that of increased performance in terms ofcases classified but that of increased understandability of the causesof team failure or success. By looking at the changes to the automat-ically produced rules, the user gains insight as to the effects of eachcomponent of a rule.
9. Summary and Future Work
Multi-agent teamwork is a critical capability in a large number ofapplications including training, education, entertainment, design, androbotics. The complex interactions of agents in a team with their team-mates as well as with other agents make it extremely difficult for humandevelopers to understand and analyze agent-team behavior. It is thusincreasingly critical to build automated assistants to aid human de-velopers in analyzing agent team behaviors. However, the problem ofautomated team analysts is largely unaddressed in previous work. It
ISAAC-final.tex; 13/10/2002; 4:03; p.47

48
is thus important to understand the key principles that underlie thedevelopment of such team analysts.
In terms of these general principles, one key contribution of thisarticle is an understanding of the the key constraints faced by teamanalysts:
1. It is necessary to have multiple models of team behavior at differentlevels of granularity. In particular three different useful granularitiesappear to be: (i) individual agent’s critical actions, (ii) subteaminteractions and (iii) global team behavior trends.
2. Multiple presentation techniques are necessary each suited to themodel being presented.
3. A bottom-up data-intensive approach is particularly critical to teamanalyses in complex domains where causal models are difficult tounderstand, input, etc. Such bottom-up analysis should also beindependent of underlying team architecture and implementationto improve generality.
A second key contribution is presentation of general techniques tobuild team analysts that satisfy these constraints. First, ISAAC, ourteam analyst, uses multiple models of team behavior to analyze dif-ferent granularities of agent actions: (i) Individual agent model toanalyze critical actions of individual agents, (ii) Multiple agent modelto analyze interactions within subteams that result in success or fail-ure, (iii) Global team model to analyze an entire engagement. Second,ISAAC combines multiple presentation techniques to aid humans inunderstanding the analysis, where presentation techniques are tailoredto the model at hand. Third, ISAAC uses learning techniques to buildmodels bottom-up from data traces, enabling the analysis of differingaspects of team behavior. It is thus capable of discovering unexpectedteam behaviors.
A third key contribution are the techniques to provide feedbackabout team improvement: (i) ISAAC supports perturbations of mod-els, enabling users to engage in “what-if” reasoning about the agentsand providing suggestions for improvements in agents’ actions that arealready within the agents’ skill set; (ii) It allows the user to comparedifferent teams based on the patterns of their interactions.
ISAAC is available on the web for remote use at http://coach.isi.edu.It has found surprising results from top teams of previous tournamentsand was used extensively at the RoboCup-99 tournament. ISAAC wasawarded the “Scientific Challenge Award” at RoboCup-99 where itsanalysis and natural language game summaries drew a crowd through-out the tournament.
ISAAC-final.tex; 13/10/2002; 4:03; p.48

Automated Assistants for Analyzing Team Behaviors 49
Although ISAAC was initially applied in the context of the RoboCupsoccer simulation, it is intended for application in a variety of agentteam domains. We demonstrated the generality of ISAAC’s techniquesby applying them to a team of agents involved in the simulated evacua-tion of civilians trapped in hostile enemy territory. Given the promisingresults in applying ISAAC’s techniques to domains beyond RoboCup,we hope and expect to apply ISAAC to other domains, mentioned insection 7, more thoroughly.
Another direction of future work is to make the multimedia pre-sentation more intelligent by exploiting standard reference models forintelligent multimedia presentations such as [6]. It would be interestingto use this model to decide on the layout and media-allocation for thedata that should be conveyed to the human user.
Acknowledgements
This research was made possible by a generous gift from Intel Corpo-ration. We would like to thank Bill Swartout for interesting discussionsrelated to ISAAC, and support of this work at USC/ISI. We also thankseveral members of the RoboCup community for their valuable feedbackabout ISAAC, including Peter Stone, Itsuki Noda and Paul Scerri. Fi-nally, we would like to thank the reviewers for their excellent commentsfor improving this article.
APPENDIX A: Features used in Individual Agent Model for
RoboCup Soccer
The following are the eight features used in the Individual Agent Modelfor RoboCup Soccer:
1. Ball Velocity: Velocity with which the ball was kicked.
2. Distance to goal: Distance of kicker to goal.
3. Number of Defenders: Number of defenders between kicker andgoal.
4. Extrapolated Goal Line Position: Aim of kick, i.e. Distance of thecenter of goal to the point where the ball would have crossed theend-line if not intercepted.
5. Distance of Closest Defender: Distance of kicker to the closestdefender.
ISAAC-final.tex; 13/10/2002; 4:03; p.49

50
6. Angle of Closest Defender wrt to Center of Goal: Angle of closestdefender’s position with respect to the line connecting the centersof the two goals.
7. Angle from Center of Field: Angle of kicker’s position with respectto the line connecting the centers of the two goals.
8. Angle of Defender from shot: Angle of closest defender’s positionwith respect to the direction of kick.
APPENDIX B: Features used in Global Team Model for
RoboCup Soccer
The following are the twelve features used in the Global Team Modelfor RoboCup Soccer:
1. Possession time: Percentage of time that the ball was in the firstteam’s possession.
2. Ball in Opponent half: Percentage of time ball was in the oppositionteam’s side of the field.
3. Successful off-side traps: Number of successful off-side traps laid byfirst team.
4. Caught in off-side trap: Number of times the opposition’s off-sidetraps succeeded.
5. Defense was bypassed: Number of times the first team’s last de-fender was bypassed.
6. Bypassed opponent defense: Number of times the opposition team’slast defender was bypassed.
7. Distance from sideline: Average distance of ball from the sidelinewhen ball was in first team’s possession.
8. Distance from sideline for opponent: Average distance of ball fromthe sideline when ball was in opposition team’s possession.
9. Distance kept between own players: Average distance kept betweenplayers of the first team.
10. Distance kept between opponent players: Average distance kept be-tween players of the opposition team.
ISAAC-final.tex; 13/10/2002; 4:03; p.50

Automated Assistants for Analyzing Team Behaviors 51
11. Distance of last defender: Average distance of the first team’s lastdefender from the goal.
12. Distance of opponent last defender: Average distance of the oppo-sition team’s last defender from the goal.
APPENDIX C: Data for Figures 14 and 15
Tables I, II and III show the data used to generate Figures 14, 15and 16.
Table I. Data for figure 14
Team No. of non-scoring Rules No. of scoring rules Total no. of rules
Andhill 10 6 16
AT Humboldt 8 4 12
CAT Finland 4 4 8
CMUnited 6 2 8
ISIS 7 6 13
Gemini 6 6 12
RollingBrains 8 2 10
WindmillWanderers 6 2 8
Table II. Data for figure 15
Team Avg. no. of conditions in a rule Max. conditions in a rule Min. conditions in a rule
Andhill 2.625 6 1
AT Humboldt 2.75 5 2
CAT Finland 2.375 4 1
CMUnited 2.125 5 1
ISIS 2.692307692 5 1
Gemini 2.833333333 4 1
RollingBrains 1.9 7 1
WindmillWanderers 1.625 2 1
Average 2.436781609 4.75 1.125
ISAAC-final.tex; 13/10/2002; 4:03; p.51

52
Table III. Data for figure 16
Team Andhill AT Humb. CAT Fin. CMUnited ISIS Gemini R Brains W Wanderers
Andhill 0 21.4934 13.6993 67.2912 14.8278 12.1384 21.0962 105.8628
AT Humb. 21.4934 0 26.7541 72.1392 46.7939 10.1018 35.5333 15.3181
CAT Fin. 13.6993 26.7541 0 50.5455 12.5778 39.5714 70.6 115.2244
CMUnited 67.2912 72.1392 50.5455 0 106.5482 84.5932 62.8619 18.4048
ISIS 14.8278 46.7939 12.5778 106.5482 0 41.0625 15.6448 185.6138
Gemini 12.1384 10.1018 39.5714 84.5932 41.0625 0 70.2857 71.3586
R Brains 21.0962 35.5333 70.6 62.8619 15.6448 70.2857 0 54.0238
W Wanderers 105.8628 15.3181 115.2244 18.4048 185.6138 71.3586 54.0238 0
APPENDIX D: Example Messages Exchanged in Evacuation
Domain
Figure 24 shows two examples of messages exchanged between agents inthe evacuation domain described in section 7. In example 1, a helicopter
1)Log Message Received; Fri Sep 17 13:37:03 1999:
Logging Agent: TEAM trans2
Message==>
tell
:content TEAM trans2 establish-commitment evacuate 41 kqml string
:receiver TEAM-EVAC 9 kqml word
:reply-with nil 3 kqml word
:team TEAM-EVAC 9 kqml word
:sender TEAM trans2 11 kqml word
:kqml-msg-id 22151+sangat.isi.edu+7 22 kqml word
2)Log Message Received; Fri Sep 17 13:37:14 1999:
Logging Agent: teamquickset
Message==>
tell
:content teamquickset terminate-jpg constant determine-number-of-helos
number-of-helos-determined *yes* 4 4 98 kqml string
:receiver TEAM-EVAC 9 kqml word
:reply-with nil 3 kqml word
:team TEAM-EVAC 9 kqml word
:sender teamquickset 12 kqml word
:kqml-msg-id 19476+tsevet.isi.edu+7 22 kqml word
Figure 24. Examples of messages exchanged between agents in the evacuationdomain
ISAAC-final.tex; 13/10/2002; 4:03; p.52

Automated Assistants for Analyzing Team Behaviors 53
agent, TEAM trans2, sends a message to the team, TEAM-EVAC, ask-ing its members to initiate a joint goal to execute the evacuate plan.Example 2 is a message sent by another agent teamquickset to theentire team TEAM-EVAC to let the members know that the joint goalto execute sub-plan determine-number-of-helos ended successfully. Ascan be seen these messages are fairly complex and the relevant featuresof each message needs to be abstracted out so that analysis can beeasily done.
References
1. Aho, A., Hopcroft, J., Ullman, J.: Data Structures and Algorithms. Addison-Wesley, 1983.
2. Andou, T.: Personal Communication. 1998.3. Andre, E., Herzog, G., Rist, T.: Generating Multimedia Presentations for
RoboCup Soccer Games. RoboCup-97: Robot Soccer World Cup I, 1997.4. Balch, T.: The Impact of Diversity on Performance in Multi-robot Foraging.
Proceedings of the Third Annual Conference on Autonomous Agents, 1999.5. Bhandari, I., Colet, E., Parker, J., Pines, Z., Pratap, R., Ramanujam, K.:
Advanced Scout: Data Mining and Knowledge Discovery in NBA Data. DataMining and Knowledge Discovery, 1997.
6. Bordegoni, M., Faconti, G., Maybury, M. T., Rist, R., Ruggieri, S., Trahanias,P. and Wilson, M.: A Standard Refernece Model for Intelligent MultimdeiaPresentation Systems. Journal of Computer Standards and Interfaces, pp. 477-496, 1997.
7. Caruana, R., Freitag, D.: Greedy Attribute Selection. 11th Proceedings of the11th International Conference on Machine Learning (ICML), 1994.
8. Chiu, B. and Webb, G.: Using Decision Trees for Agent Modeling. ImprovingPrediction Performance, User Modeling and User-Adapted Interaction, KluwerAcademic Publisher Group, “Dordrecht, Netherlands”, 8, pp. 131-152, 1988.
9. Crutchfield, J. P. and Young, K.: Inferring Statistical Complexity. PhysicalReview Letters,63(2):105-108, 1989.
10. Dorais, G., Bonasso, R., Kortenkamp, D., Pell, B., Schreckenghost, D.: Ad-justable Autonomy for Human-Centered Autonomous Systems. Working notesof the Sixteenth International Joint Conference on Artificial IntelligenceWorkshop on Adjustable Autonomy Systems, 1999
11. Driessens, K., Jacobs, N., Cossement, N. Monsieur, P., DeRaedt, L.: InductiveVerification and Validation of the KULRot RoboCup Team. Proceedings of theSecond RoboCup Workshop, 1998.
12. Goldberg, D. and Mataric: Coordinating Mobile Robot Group Behavior Us-ing a Model of Interaction Dynamics. Proceedings of The Third InternationalConference on Autonomous Agents, 1999.
13. Jennings, N.: Controlling Cooperative Problem Solving in Industrial Multi-agent System Using Joint Intentions. Artificial Intelligence, Vol. 75, 1995.
14. 3D images from RoboCup soccer. http://www.techfak.uni-bielefeld.de/techfak/ags/wbski/3Drobocup/3DrobocupPics.html,1999.
ISAAC-final.tex; 13/10/2002; 4:03; p.53

54
15. Johnson, W. L.: Agents that Learn to Explain Themselves. Proceedings ofAAAI-94, 1994.
16. Kaminka, G.: Execution Monitoring in Multi-Agent Environments. Ph.D. Dis-sertation, University of Southern California, Computer Science Department,2000.
17. Kitano, H., Tambe, M., Stone, P., Veloso, M., Noda, I., Osawa, E. and Asada,M.: The RoboCup synthetic agent’s challenge. Proceedings of the InternationalJoint Conference on Artificial Intelligence (IJCAI), 1997.
18. Marsella, S.C. and Johnson, W.L.: An instructor’s assistant for team trainingin dynamic multi-agent virtual worlds. Goettl, Halff, Redfield and Shute (eds)Intelligent Tutoring Systems, Proceedings of the 4th International Conferenceon Intelligent Tutoring Systems, Springer, pp 464-473, 1998.
19. Modi, J., Jung, H., Tambe, M., Shen, W., Kulkarni, S.: Dynamic DistributedResource Allocation: A Distributed Constraint Satisfaction Approach. Intel-ligent Agents VIII Proceedings of the International workshop on Agents,theories, architectures and languages (ATAL’01)
20. Myritz, H.: Personal Communication. 1999.21. Ndumu, D., Nwana, H., Lee, L., Haynes, H.: Visualization and debugging of
distributed multi-agent systems. Applied Artificial Intelligence Journal, Vol 13(1), 1999.
22. Noda, I., Matsubara, H., Hiraki, K. and Frank, I.: Soccer Server: A Tool forResearch on Multi-agent Systems. Applied Artificial Intelligence, Volume 12,Number 2-3, 1998.
23. Politakis, P. and Weiss, S.: Using Empirical Analysis to Refine Expert SystemKnowledge Bases. Artificial Intelligence(22), pp 23-48, 1984.
24. Quinlan, J.: C4.5: Programs for Machine Learning. Morgan Kaufmann, 1994.25. Raines, T., Tambe, M., Marsella, M.: Automated Agents that Help Hu-
mans Understand Agent Team Behaviors. Proceedings of the InternationalConference on Autonomous Agents (Agents), 2000.
26. Raines, T., Tambe, M., Marsella, M.: Agent Assistants for Team Analysis. AIMagazine, Vol 21, Num 3, pp 27-31, Fall 2000.
27. Reiter, E.: Has a Consensus NL Generation Architecture Appeared, and isit Psycholinguistically Plausible? Proceedings of the Seventh InternationalWorkshop on Natural Language Generation, 1994
28. Ron, D., Singer, Y., Tishby, N.: On the Learnability and Usage of Acyclic Prob-abilistic Finite Automata. Journal of Computer and System Sciences 56(2),1998.
29. Sengers, P.: Designing Comprehensible Agents. Proceedings of the Interna-tional Joint Conference on Artificial Intelligence (IJCAI), 1999.
30. SoftSport Inc.: http://www.softsport.com.31. Stolcke, A. and Omohundro, S.M.: Hidden Markov Model Induction by
Bayesian Model Merging. Advances in Neural Information Processing Systems,Volume 5, S. J. Hanson, J. D. Cowan and C. L. Giles, editors, Morgan Kaufman,pp. 11-18, 1992.
32. Stone, P., Veloso, M.: Using Decision Tree Confidence Factors for Multi-agentControl. Proceedings of the International Conference on Autonomous Agents,1998.
33. Stone, P.: Personal Communication. 1999.34. Sycara, K., Decker, K., Pannu, A., Williamson, M., Zeng, D.: Distributed
Intelligent Agents. IEEE Expert, 1996.
ISAAC-final.tex; 13/10/2002; 4:03; p.54

Automated Assistants for Analyzing Team Behaviors 55
35. Tambe, M. Johnson, W. L., Jones, R., Koss, F., Laird, J. E., Rosenbloom, P.S.,Schwamb, K.: Intelligent Agents for Interactive Simulation Environments. AIMagazine, 16(1) (Spring), 1995.
36. Tambe, M.: Towards Flexible Teamwork. Journal of Artificial IntelligenceResearch, Vol. 7, 1997.
37. Tambe, M. and Jung, H.: The benefits of arguing in a team. AI MagazineVol20, Num 4, Winter, 1999.
38. Tambe, M., Pynadath, D. and Chauvat, N.: Building dynamic agent orga-nizations in cyberspace. IEEE Internet Computing Volume 4, Number 2,2000.
39. Tanaka-Ishii, K., Noda, I., Frank, I., Nakashima, H., Hasida, K., Matsub-ara, H.: MIKE: An Automatic Commentary System for Soccer. InternationalConference on Multi-Agent Systems, 1998.
40. Ting, K.: Inducing Cost-Sensitive Trees via Instance Weighting. Principles ofData Mining and Knowledge Discovery (PKDD 98), 1998.
41. Tomoichi, T.: LogMonitor: from player’s action analysis to collaboration anal-ysis and advice on formation. Proceedings of the Third RoboCup Workshop,1999.
42. Toulmin, S.: The uses of argument. Cambridge University Press, 1958.
ISAAC-final.tex; 13/10/2002; 4:03; p.55

ISAAC-final.tex; 13/10/2002; 4:03; p.56
Copyright © 2022 FDOKUMEN