Author's personal copy Seasonal absolute acoustic intensity, atmospheric forcing and currents in a...
12
This article appeared in a journal published by Elsevier. The attached copy is furnished to the author for internal non-commercial research and education use, including for instruction at the authors institution and sharing with colleagues. Other uses, including reproduction and distribution, or selling or licensing copies, or posting to personal, institutional or third party websites are prohibited. In most cases authors are permitted to post their version of the article (e.g. in Word or Tex form) to their personal website or institutional repository. Authors requiring further information regarding Elsevier’s archiving and manuscript policies are encouraged to visit: http://www.elsevier.com/copyright
-
Upload
independent -
Category
Documents
-
view
1 -
download
0
Transcript of Author's personal copy Seasonal absolute acoustic intensity, atmospheric forcing and currents in a...

This article appeared in a journal published by Elsevier. The attached
copy is furnished to the author for internal non-commercial research
and education use, including for instruction at the authors institution
and sharing with colleagues.
Other uses, including reproduction and distribution, or selling or
licensing copies, or posting to personal, institutional or third party
websites are prohibited.
In most cases authors are permitted to post their version of the
article (e.g. in Word or Tex form) to their personal website or
institutional repository. Authors requiring further information
regarding Elsevier’s archiving and manuscript policies are
encouraged to visit:
http://www.elsevier.com/copyright
Author's personal copy
Seasonal absolute acoustic intensity, atmospheric forcing and currents ina tropical coral reef system
José de Jesús Salas Pérez a,b,c, f,*, David Salas-Monreal c, María Adela Monreal-Gómez d,Mayra Lorena Riveron-Enzastiga e, Carme Llasat b
a Facultad de Ciencias Biológicas y Agropecuarias, Universidad Veracruzana, Campus Tuxpan, Km. 7.5 Carretera Tuxpan-Tampico, Tuxpan de Rodríguez Cano-Veracruz,
CP. 92780, Mexicob Facultad de Física, Universidad de Barcelona, Av. Diagonal 647, CP. 08028, Barcelona, Spainc Instituto de Ciencias Marinas y Pesquerías, Universidad Veracruzana, Campus Veracruz, Hidalgo 617, Col. Río Jamapa, Bocal del Río-Veracruz, CP. 94290, Mexicod Instituto de Ciencias del Mar y Limnología, Universidad Nacional Autónoma de México, Circuito Exterior S/N, Cd. Universitaria, 04510, México D.F, Mexicoe Posgrado en Ciencias del Mar y Limnología, Universidad Nacional Autónoma de México, Circuito Exterior S/N, Cd. Universitaria, 04510, México D.F, MexicofObservatori de L’Ebre (Universitat Ramon Llull - CSIC), Horta Alta, 38, 43520, Roquetes (Tarragona), Spain
a r t i c l e i n f o
Article history:
Received 12 July 2011
Accepted 10 January 2012
Available online 20 January 2012
Keywords:
Gulf of Mexico
Parque Nacional Sistema Arrecifal
Veracruzano
plankton variation
seasonal current
wind induced current
Gyre of Campeche Bay
a b s t r a c t
The seasonal patterns of marine circulation and biovolume were obtained from time-series measure-
ments carried out in the “Parque Nacional Sistema Arrecifal Veracruzano” (PNSAV), located in the
western continental shelf of the Gulf of Mexico, from June 2008 to September 2009. Two mechanisms
were depicted as the responsible for the current pattern observed in the PNSAV and not only one as
suggested in large-scale studies. The first mechanism is the wind generated currents. This mechanism by
itself is responsible for up to 78% of total variation of the seasonal circulation in the PNSAV as estimated
with the first mode of the EOF’s (Empirical Orthogonal Functions), which was correlated (Normalized
Lagged Correlation) with the north-south wind component. Therefore, the wind and the first mode were
highly correlated for most of the year (r > 0.7). The second mode was attributed to the low frequency
current, associated to the meso-scale circulation of the Gulf of Mexico, owing to the cyclonic eddy of the
Campeche Bay. Both mechanisms were mostly observed throughout the year. Nevertheless, the cyclonic
eddy of the Campeche Bay (meso-scale) was the first responsible for the current fluctuations observed
during the summer of 2008 and 2009. The absolute acoustic intensity (plankton biovolumes) was highly
correlated to currents, showing high spatial variability, attributed to advection produced by the meso-
scale circulation and to river discharges, but also by eddy diffusion produced by atmospheric and
coastal water fronts.
! 2012 Elsevier Ltd. All rights reserved.
1. Introduction
The understanding of the seasonal current pattern in shallow
areas is crucial to predict planktonic and organic matter concen-
tration (Lennert-Cody and Franks, 1999; Salas-Monreal et al., 2009;
Zavala-Sansón and Provenzale, 2009), hydraulic controls (Falter
and Sansone, 2000) and lee wave generation (Salas-Monreal and
Valle-Levinson, 2009). Studies using long-term data sets to
describe the variability of currents have been carried out in the
Central Great Barrier Reef, with corals of fringing and barrier reefs
and atolls (Wolanski and Pickard, 1985), in the Caribbean Reef
with fringing reefs (Coronado et al., 2007), among others. The
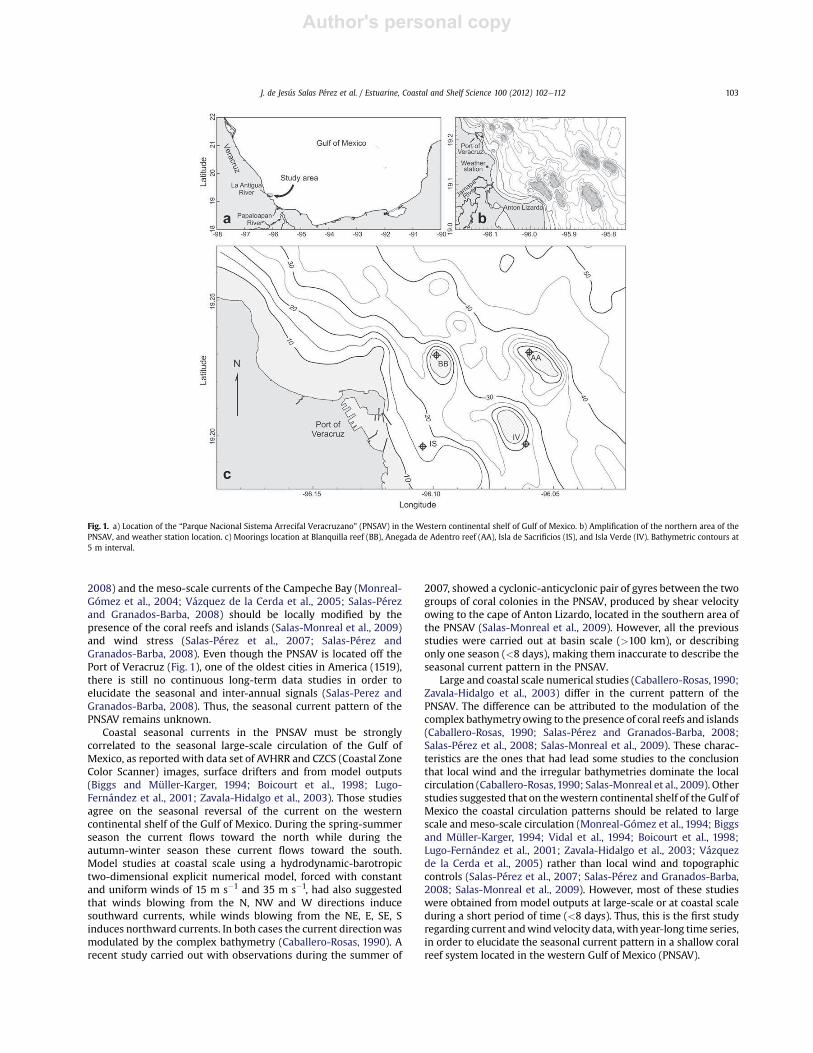
“Parque Nacional Sistema Arrecifal Veracruzano” (PNSAV) (Fig. 1a)
is formed by a 20e45 m depth platform coral reef types (Krutak
et al., 1980) protected by the cape of Anton Lizardo in the southern
end and by the port of Veracruz in the northern end (Fig. 1b);
those characteristics suggest frictional dynamics (Salas-Monreal
et al., 2009).
The study area located in the northern PNSAV (Fig. 1c) is char-
acterized by the influence of diurnal tides (Salas-Pérez et al., 2008)
with a coral reef area covering close to 19 km2. The depth of coral
reefs varies from 20 to 45 mwith shallow reef lagoons of about 2 m
depth and variable coral reef length extensions from 0.3 to 3.2 km
(Salas-Pérez and Granados-Barba, 2008). Those characteristics
suggest that the Gulf of Mexico (large-scale) current pattern
(Zavala-Hidalgo et al., 2003; Salas-Pérez and Granados-Barba,
* Corresponding author. Facultad de Ciencias Biológicas y Agropecuarias, Uni-
versidad Veracruzana, Campus Tuxpan, Km. 7.5 Carretera Tuxpan-Tampico, Tuxpan
de Rodríguez Cano-Veracruz, CP. 92780, Mexico.
E-mail address: [email protected] (J. de Jesús Salas Pérez).
Contents lists available at SciVerse ScienceDirect
Estuarine, Coastal and Shelf Science
journal homepage: www.elsevier .com/locate/ecss
0272-7714/$ e see front matter ! 2012 Elsevier Ltd. All rights reserved.
doi:10.1016/j.ecss.2012.01.002
Estuarine, Coastal and Shelf Science 100 (2012) 102e112
Author's personal copy
2008) and the meso-scale currents of the Campeche Bay (Monreal-
Gómez et al., 2004; Vázquez de la Cerda et al., 2005; Salas-Pérez
and Granados-Barba, 2008) should be locally modified by the
presence of the coral reefs and islands (Salas-Monreal et al., 2009)
and wind stress (Salas-Pérez et al., 2007; Salas-Pérez and
Granados-Barba, 2008). Even though the PNSAV is located off the
Port of Veracruz (Fig. 1), one of the oldest cities in America (1519),
there is still no continuous long-term data studies in order to
elucidate the seasonal and inter-annual signals (Salas-Perez and
Granados-Barba, 2008). Thus, the seasonal current pattern of the
PNSAV remains unknown.
Coastal seasonal currents in the PNSAV must be strongly
correlated to the seasonal large-scale circulation of the Gulf of
Mexico, as reported with data set of AVHRR and CZCS (Coastal Zone
Color Scanner) images, surface drifters and from model outputs
(Biggs and Müller-Karger, 1994; Boicourt et al., 1998; Lugo-
Fernández et al., 2001; Zavala-Hidalgo et al., 2003). Those studies
agree on the seasonal reversal of the current on the western
continental shelf of the Gulf of Mexico. During the spring-summer
season the current flows toward the north while during the
autumn-winter season these current flows toward the south.
Model studies at coastal scale using a hydrodynamic-barotropic
two-dimensional explicit numerical model, forced with constant
and uniform winds of 15 m s!1 and 35 m s!1, had also suggested
that winds blowing from the N, NW and W directions induce
southward currents, while winds blowing from the NE, E, SE, S
induces northward currents. In both cases the current directionwas
modulated by the complex bathymetry (Caballero-Rosas, 1990). A
recent study carried out with observations during the summer of
2007, showed a cyclonic-anticyclonic pair of gyres between the two
groups of coral colonies in the PNSAV, produced by shear velocity
owing to the cape of Anton Lizardo, located in the southern area of
the PNSAV (Salas-Monreal et al., 2009). However, all the previous
studies were carried out at basin scale (>100 km), or describing
only one season (<8 days), making them inaccurate to describe the
seasonal current pattern in the PNSAV.
Large and coastal scale numerical studies (Caballero-Rosas,1990;
Zavala-Hidalgo et al., 2003) differ in the current pattern of the
PNSAV. The difference can be attributed to the modulation of the
complex bathymetry owing to the presence of coral reefs and islands
(Caballero-Rosas, 1990; Salas-Pérez and Granados-Barba, 2008;
Salas-Pérez et al., 2008; Salas-Monreal et al., 2009). These charac-
teristics are the ones that had lead some studies to the conclusion
that local wind and the irregular bathymetries dominate the local
circulation (Caballero-Rosas,1990; Salas-Monreal et al., 2009). Other
studies suggested that on thewestern continental shelf of the Gulf of
Mexico the coastal circulation patterns should be related to large
scale and meso-scale circulation (Monreal-Gómez et al., 1994; Biggs
and Müller-Karger, 1994; Vidal et al., 1994; Boicourt et al., 1998;
Lugo-Fernández et al., 2001; Zavala-Hidalgo et al., 2003; Vázquez
de la Cerda et al., 2005) rather than local wind and topographic
controls (Salas-Pérez et al., 2007; Salas-Pérez and Granados-Barba,
2008; Salas-Monreal et al., 2009). However, most of these studies
were obtained from model outputs at large-scale or at coastal scale
during a short period of time (<8 days). Thus, this is the first study
regarding current andwind velocity data, withyear-long time series,
in order to elucidate the seasonal current pattern in a shallow coral
reef system located in the western Gulf of Mexico (PNSAV).
Fig. 1. a) Location of the “Parque Nacional Sistema Arrecifal Veracruzano” (PNSAV) in the Western continental shelf of Gulf of Mexico. b) Amplification of the northern area of the
PNSAV, and weather station location. c) Moorings location at Blanquilla reef (BB), Anegada de Adentro reef (AA), Isla de Sacrificios (IS), and Isla Verde (IV). Bathymetric contours at
5 m interval.
J. de Jesús Salas Pérez et al. / Estuarine, Coastal and Shelf Science 100 (2012) 102e112 103
Author's personal copy
2. Material and methods
Correlations and Empirical Orthogonal Function analysis were
performed in order to analyze the effect of thewind on the seasonal
current pattern. The correlations (Normalized Lagged Correlation)
between the current components and the wind and between the
modes of the EOF’s (Empirical Orthogonal Functions) with the NeS
wind component were carried out in order to obtain their depen-
dence and phase according to Emery and Thomson (2001).
However, the biovolumes were also calculated in order to depict
the possible relation between the seasonal biovolume with the
current variability within the northern coral reef area. Since the
PNSAV is a shallow water system it could be assumed that atmo-
spheric storms will have a major influence on current variability
and on biovolume variability owing to mixing process.
One year-long of absolute acoustic intensity data of the ADCP
(dB) converted to backscatter intensity and water velocity data
throughout the entire water columnwere recorded from June 2008
to September 2009. The ADCP data had a vertical blanking distance
of 0.75 m from the surface and 1 m at the bottom. Water velocities
and the backscatter intensity were registered using four Acoustic
Doppler Current Profilers (ADCP) moored at about 20 m depth
(Fig. 1c). The ADCPs recorded the water velocity at depth intervals
of 2 m every 15 min. The ADCPs were strategically deployed at the
reefs ends of the PNSAV (Fig. 1c) under the hypothesis that seasonal
circulation around the PNSAV is governed by wind patterns and
modulated by coastal topography, which in turn should influence
plankton biovolumes. However, the seasonal wind-driven current
should also be affected by the presence of coral reefs and islands.
The four year-long data series were recorded by two Nortek
Aquadop 400 kHz ADCPs deployed in the leeward side of Blanquilla
(BB) and Anegada de Adentro (AA) (Fig. 1c) and two Nortek Aqua-
dop 1 MHz ADCPs deployed in the southward side of Isla Verde (IV)
and in the northern side of Isla de Sacrificios (IS) (Fig. 1c).
One year-long time series of wind velocity were recorded every
hour from a weather station (19" 12.550 N; 96" 7.680 W) located
approximately 4 km southward from the moorings (Fig. 1b). The
weather station was located at a height of 10 m in a flat area where
the wind velocity is expected to represent the wind over the
studied area. A spectral analysis was carried out to determine the
spectral energy and main periods of the hourly wind velocity and
the water velocities (not showed here). On the other hand, the
backscatter intensity, the vertically averaged velocity profiles and
the Empirical Orthogonal Functions (EOF’s) time series were
filtered using a lowpass filter with 26 h (Salas-Pérez et al., 2008) in
order to obtain the subtidal biovolumes and seasonal currents
fluctuations. Progressive vectors diagrams of the currents were
computed at a sampling interval of 1 h. No previous filters were
applied to the original data. JASON-1/-2, TOPEX, ERS-2, ENVISAT
and GFO Sea Height Anomaly (SHA) data available from the NOAA
on a near-real time basis with a 2-day average delay were used to
show geostrophic currents maps of the Campeche Bay, where the
study area is located.
3. Results and discussions
3.1. Biovolumes
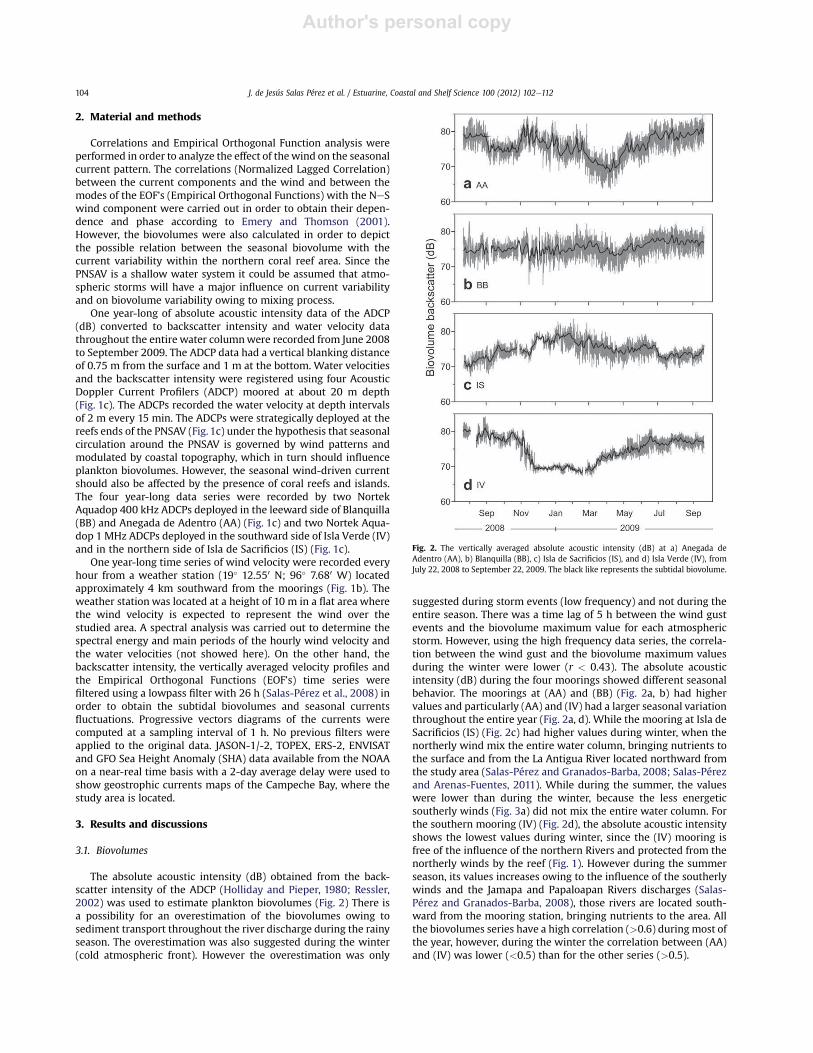
The absolute acoustic intensity (dB) obtained from the back-
scatter intensity of the ADCP (Holliday and Pieper, 1980; Ressler,
2002) was used to estimate plankton biovolumes (Fig. 2) There is
a possibility for an overestimation of the biovolumes owing to
sediment transport throughout the river discharge during the rainy
season. The overestimation was also suggested during the winter
(cold atmospheric front). However the overestimation was only
suggested during storm events (low frequency) and not during the
entire season. There was a time lag of 5 h between the wind gust
events and the biovolume maximum value for each atmospheric
storm. However, using the high frequency data series, the correla-
tion between the wind gust and the biovolume maximum values
during the winter were lower (r < 0.43). The absolute acoustic
intensity (dB) during the four moorings showed different seasonal
behavior. The moorings at (AA) and (BB) (Fig. 2a, b) had higher
values and particularly (AA) and (IV) had a larger seasonal variation
throughout the entire year (Fig. 2a, d). While the mooring at Isla de
Sacrificios (IS) (Fig. 2c) had higher values during winter, when the
northerly wind mix the entire water column, bringing nutrients to
the surface and from the La Antigua River located northward from
the study area (Salas-Pérez and Granados-Barba, 2008; Salas-Pérez
and Arenas-Fuentes, 2011). While during the summer, the values
were lower than during the winter, because the less energetic
southerly winds (Fig. 3a) did not mix the entire water column. For
the southern mooring (IV) (Fig. 2d), the absolute acoustic intensity
shows the lowest values during winter, since the (IV) mooring is
free of the influence of the northern Rivers and protected from the
northerly winds by the reef (Fig. 1). However during the summer
season, its values increases owing to the influence of the southerly
winds and the Jamapa and Papaloapan Rivers discharges (Salas-
Pérez and Granados-Barba, 2008), those rivers are located south-
ward from the mooring station, bringing nutrients to the area. All
the biovolumes series have a high correlation (>0.6) during most of
the year, however, during the winter the correlation between (AA)
and (IV) was lower (<0.5) than for the other series (>0.5).
Fig. 2. The vertically averaged absolute acoustic intensity (dB) at a) Anegada de
Adentro (AA), b) Blanquilla (BB), c) Isla de Sacrificios (IS), and d) Isla Verde (IV), from
July 22, 2008 to September 22, 2009. The black like represents the subtidal biovolume.
J. de Jesús Salas Pérez et al. / Estuarine, Coastal and Shelf Science 100 (2012) 102e112104
Author's personal copy
As a first approximation the seaward moorings seems to have
a similar pattern at high frequencies (from September to November
of 2008 and from May to September of 2009), both series had
similar correlation (0.78) and reported the highest values (close to
85 dB), while the other two series show a different pattern. At low
frequencies the correlation between the seaward moorings was of
0.56. Themain difference in the correlation values was attributed to
wind effect. Wind gust produce different responses at low
frequencies at each mooring. Therefore at high frequencies the
series seem to be influenced by different factors. All of them seem
to be influenced by the wind during the winter (r > 0.62) (Salas-
Perez and Arenas-Fuentes, 2011). The association between the
wind driving currents and the dispersion of plankton organisms
was also described in shallow water like in the Great Barrier Reef
(Wolankski and Pickard, 1985) where most of the variance of the
current, with periods <20 days, was associated to wind-driven
circulation, which disperse planktonic organisms over the Great
Barrier Reef (Wolanski and Pickard, 1985). However, owing to the
correlation between the wind and the biovolumes there should be
a second factor responsible for current variations. This factor should
not only be the influence of the river discharges since it affects the
four moorings and not only the once closer to the coast. During the
summer the Jamapa and Papaloapan Rivers affect the landward
moorings (Isla de Sacrificios and Isla Verde) (Fig. 2c, d). However, in
general the stations seem to have a similar behavior (high values
during the summer), implying that another factor should influence
themooring areas. This factorwas attributed to advection produced
by large-scale (wind induced currents) and meso-scale circulation
(Monreal-Gómez et al., 2004; Salas-Pérez and Granados-Barba,
2008; Salas-Pérez and Arenas-Fuentes, 2011). Thus, the patchi-
ness of plankton are advectedwind induced currents and themeso-
scale circulation but it is also influenced by random mixing
processes owing to eddy diffusion, produced in the frontal zone of
river and coastal waters, and mixing owing to tides and atmo-
spheric fronts.
3.2. Seasonal winds
Since the winds may play a significant forcing mechanism to
generate currents along to the Western Continental Shelf of the
Gulf of Mexico (Salas-Pérez and Granados-Barba, 2008), where the
PNSAV is located and they are related to the high absolute acoustic
intensity values observed in the PNSAV, a spectral analysis of the
hourly wind velocity was carried out in order to obtain the main
frequencies of the wind and any possible influence over the
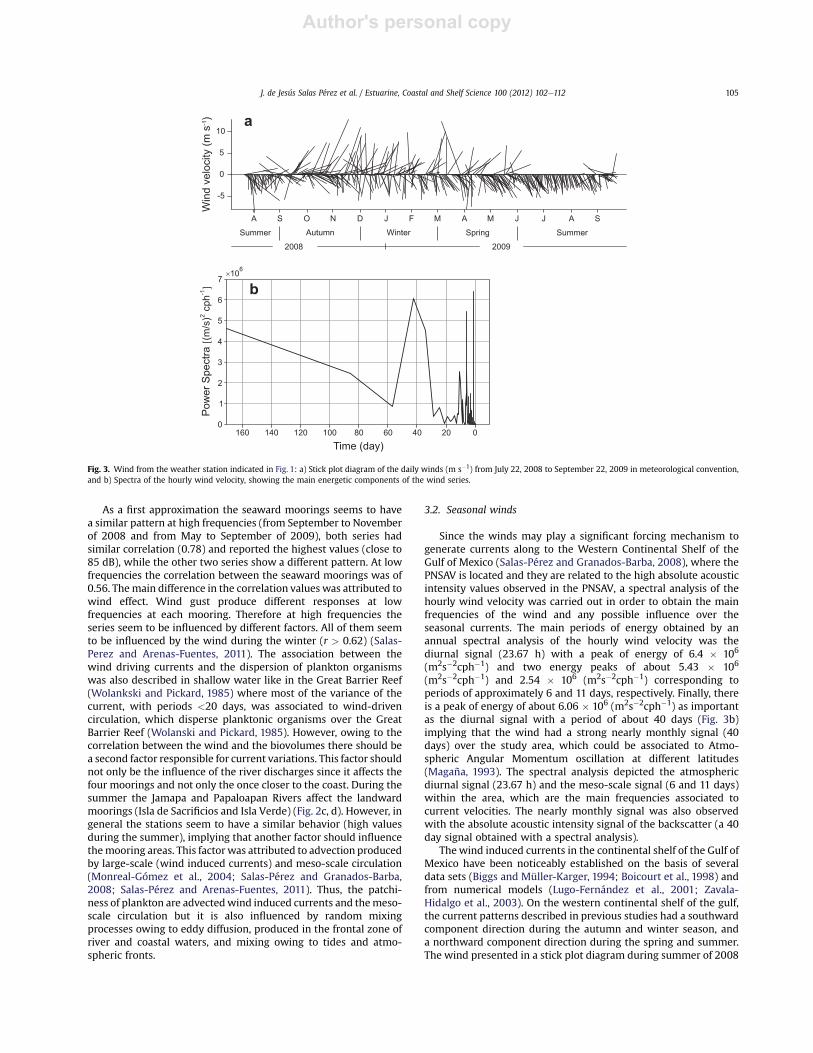
seasonal currents. The main periods of energy obtained by an
annual spectral analysis of the hourly wind velocity was the
diurnal signal (23.67 h) with a peak of energy of 6.4 $ 106
(m2s!2cph!1) and two energy peaks of about 5.43 $ 106
(m2s!2cph!1) and 2.54 $ 106 (m2s!2cph!1) corresponding to
periods of approximately 6 and 11 days, respectively. Finally, there
is a peak of energy of about 6.06 $ 106 (m2s!2cph!1) as important
as the diurnal signal with a period of about 40 days (Fig. 3b)
implying that the wind had a strong nearly monthly signal (40
days) over the study area, which could be associated to Atmo-
spheric Angular Momentum oscillation at different latitudes
(Magaña, 1993). The spectral analysis depicted the atmospheric
diurnal signal (23.67 h) and the meso-scale signal (6 and 11 days)
within the area, which are the main frequencies associated to
current velocities. The nearly monthly signal was also observed
with the absolute acoustic intensity signal of the backscatter (a 40
day signal obtained with a spectral analysis).
The wind induced currents in the continental shelf of the Gulf of
Mexico have been noticeably established on the basis of several
data sets (Biggs and Müller-Karger, 1994; Boicourt et al., 1998) and
from numerical models (Lugo-Fernández et al., 2001; Zavala-
Hidalgo et al., 2003). On the western continental shelf of the gulf,
the current patterns described in previous studies had a southward
component direction during the autumn and winter season, and
a northward component direction during the spring and summer.
The wind presented in a stick plot diagram during summer of 2008
PowerSpectra(m/s)cph
2-1
Time (day)
7
6
5
4
3
2
1
0
106
160 140 120 100 80 60 40 20 0
b
-5
0
5
10
S N J M M J S
Windvelocity(ms)-1
2008 2009
O D F A J AA
Summer Autumn Winter Spring Summer
a
Fig. 3. Wind from the weather station indicated in Fig. 1: a) Stick plot diagram of the daily winds (m s!1) from July 22, 2008 to September 22, 2009 in meteorological convention,
and b) Spectra of the hourly wind velocity, showing the main energetic components of the wind series.
J. de Jesús Salas Pérez et al. / Estuarine, Coastal and Shelf Science 100 (2012) 102e112 105
Author's personal copy
and spring-summer of 2009 shows the southeasterly winds (winds
blowing from the southeast in meteorological convention) domi-
nance (Fig. 3a), and not southward (steered by the mountain range
which border the gulf in this area) as Gutierrez de Velasco and
Winant (1996) reported. The reversals of the winds blowing from
the north to the south from autumn 2008 to spring 2009 occurred
at short periods of time, <6 days (Fig. 3a), mainly attributed to the
development of atmospheric fronts over the area (Gutierrez de
Velasco and Winant, 1996; Salas-Pérez and Arenas-Fuentes, 2011).
In all cases, the wind and currents were out of phase by approxi-
mately 5.5 h and the magnitude of the currents induced by the
wind was higher than 15 cm s!1 on average. The winds reversal is
not typically observed during summer, this feature has only been
reported during spring (Zavala-Hidalgo et al., 2003) (Fig. 3a). In
contrast, during some periods of time during the autumn and
winter seasons, the wind had a northerly direction, with magni-
tudes below 10 m s!1 (Fig. 3a). These winds were observed at
frequencies of about 40,11, 6 and 1 days. During the summer season
of 2009 the southeasterly (winds blowing from the southeast in
meteorological convention) winds were predominant, which is the
typical direction observed during this season (Fig. 3a). The wind
direction has two predominant directions, from northeast and from
southeast (Fig. 3a). Since the PNSAV is a shallow area it may be
assumed that the current and the winds should move in the same
direction (frictional dynamics), however owing to the abrupt
bathymetric changes of the area and the influence of the meso-
scale circulation of the western Gulf of Mexico (Monreal-Gómez
et al., 2004; Boicourt et al., 1998) the currents (Fig. 4) did not
necessary flow in the same direction as the wind (Fig. 3a), sug-
gesting that the wind induced current may be modified by local
bathymetry and by the meso-scale circulation.
3.3. Vertically averaged currents
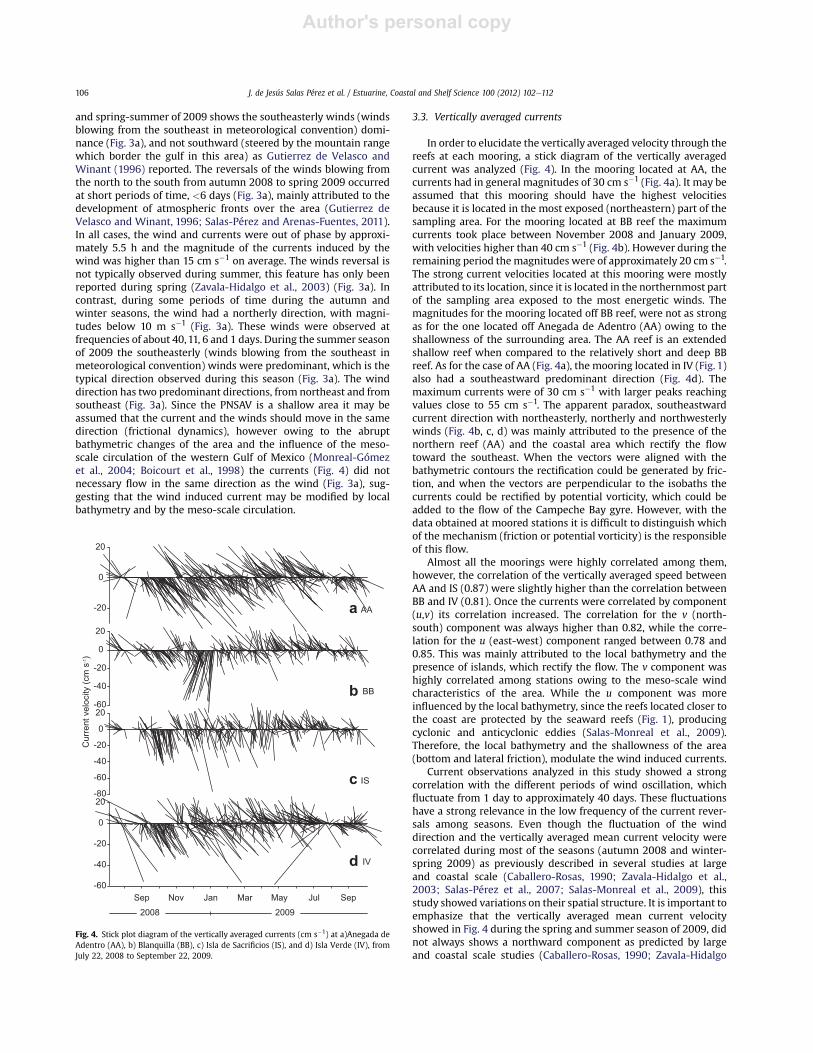
In order to elucidate the vertically averaged velocity through the
reefs at each mooring, a stick diagram of the vertically averaged
current was analyzed (Fig. 4). In the mooring located at AA, the
currents had in general magnitudes of 30 cm s!1 (Fig. 4a). It may be
assumed that this mooring should have the highest velocities
because it is located in the most exposed (northeastern) part of the
sampling area. For the mooring located at BB reef the maximum
currents took place between November 2008 and January 2009,
with velocities higher than 40 cm s!1 (Fig. 4b). However during the
remaining period themagnitudes were of approximately 20 cm s!1.
The strong current velocities located at this mooring were mostly
attributed to its location, since it is located in the northernmost part
of the sampling area exposed to the most energetic winds. The
magnitudes for the mooring located off BB reef, were not as strong
as for the one located off Anegada de Adentro (AA) owing to the
shallowness of the surrounding area. The AA reef is an extended
shallow reef when compared to the relatively short and deep BB
reef. As for the case of AA (Fig. 4a), the mooring located in IV (Fig. 1)
also had a southeastward predominant direction (Fig. 4d). The
maximum currents were of 30 cm s!1 with larger peaks reaching
values close to 55 cm s!1. The apparent paradox, southeastward
current direction with northeasterly, northerly and northwesterly
winds (Fig. 4b, c, d) was mainly attributed to the presence of the
northern reef (AA) and the coastal area which rectify the flow
toward the southeast. When the vectors were aligned with the
bathymetric contours the rectification could be generated by fric-
tion, and when the vectors are perpendicular to the isobaths the
currents could be rectified by potential vorticity, which could be
added to the flow of the Campeche Bay gyre. However, with the
data obtained at moored stations it is difficult to distinguish which
of the mechanism (friction or potential vorticity) is the responsible
of this flow.
Almost all the moorings were highly correlated among them,
however, the correlation of the vertically averaged speed between
AA and IS (0.87) were slightly higher than the correlation between
BB and IV (0.81). Once the currents were correlated by component
(u,v) its correlation increased. The correlation for the v (north-
south) component was always higher than 0.82, while the corre-
lation for the u (east-west) component ranged between 0.78 and
0.85. This was mainly attributed to the local bathymetry and the
presence of islands, which rectify the flow. The v component was
highly correlated among stations owing to the meso-scale wind
characteristics of the area. While the u component was more
influenced by the local bathymetry, since the reefs located closer to
the coast are protected by the seaward reefs (Fig. 1), producing
cyclonic and anticyclonic eddies (Salas-Monreal et al., 2009).
Therefore, the local bathymetry and the shallowness of the area
(bottom and lateral friction), modulate the wind induced currents.
Current observations analyzed in this study showed a strong
correlation with the different periods of wind oscillation, which
fluctuate from 1 day to approximately 40 days. These fluctuations
have a strong relevance in the low frequency of the current rever-
sals among seasons. Even though the fluctuation of the wind
direction and the vertically averaged mean current velocity were
correlated during most of the seasons (autumn 2008 and winter-
spring 2009) as previously described in several studies at large
and coastal scale (Caballero-Rosas, 1990; Zavala-Hidalgo et al.,
2003; Salas-Pérez et al., 2007; Salas-Monreal et al., 2009), this
study showed variations on their spatial structure. It is important to
emphasize that the vertically averaged mean current velocity
showed in Fig. 4 during the spring and summer season of 2009, did
not always shows a northward component as predicted by large
and coastal scale studies (Caballero-Rosas, 1990; Zavala-Hidalgo
Currentvelocity(cms)
-40
-20
0
20
IV
-20
0
20
AA
-60
-40
-20
0
20
BB
-60
-40
-20
0
20
-80
IS
Sep Nov Jan Mar May Jul Sep
2008 2009
-60
a
b
c
d
Fig. 4. Stick plot diagram of the vertically averaged currents (cm s!1) at a)Anegada de
Adentro (AA), b) Blanquilla (BB), c) Isla de Sacrificios (IS), and d) Isla Verde (IV), from
July 22, 2008 to September 22, 2009.
J. de Jesús Salas Pérez et al. / Estuarine, Coastal and Shelf Science 100 (2012) 102e112106
Author's personal copy
et al., 2003; Salas-Pérez et al., 2007; Salas-Pérez and Granados-
Barba, 2008; Salas-Monreal et al., 2009). During these seasons
the flow had a predominant southwestward and northwestward
direction. Those features imply that even though current velocities
had a strong large-scale component, coastal bathymetry is
responsible for the current rectification either by friction or
potential vorticity (Salas-Monreal et al., 2009).
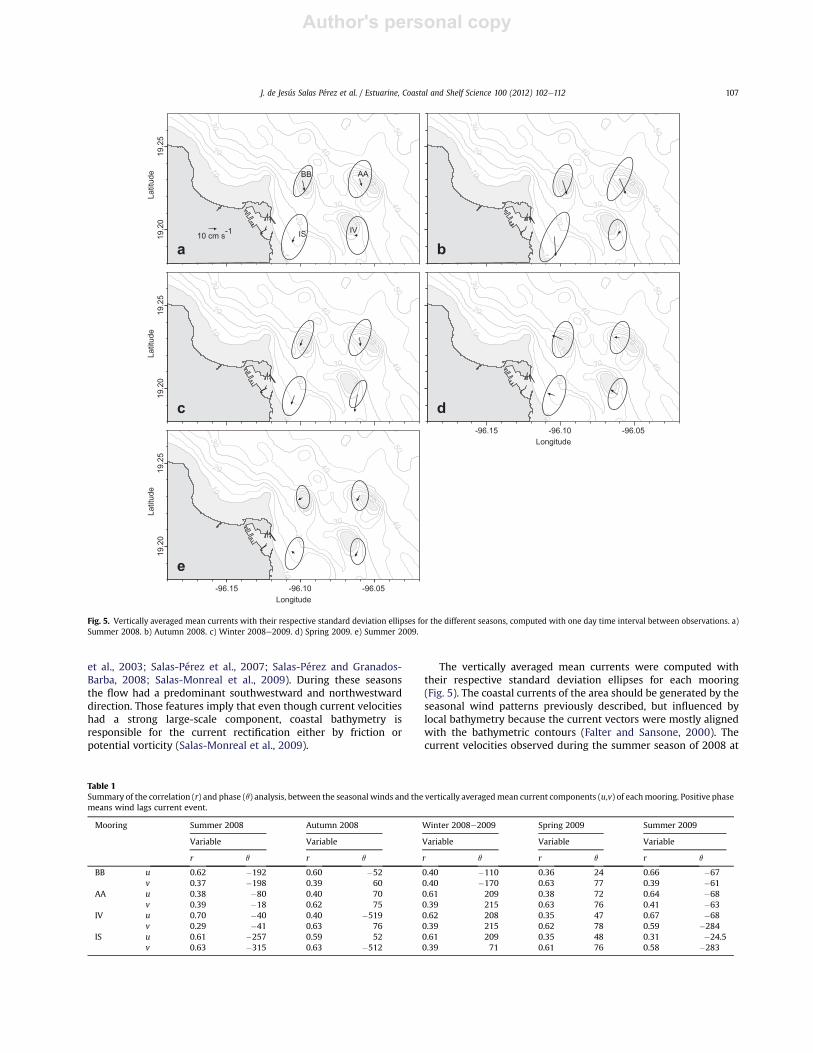
The vertically averaged mean currents were computed with
their respective standard deviation ellipses for each mooring
(Fig. 5). The coastal currents of the area should be generated by the
seasonal wind patterns previously described, but influenced by
local bathymetry because the current vectors were mostly aligned
with the bathymetric contours (Falter and Sansone, 2000). The
current velocities observed during the summer season of 2008 at
30
2040
50
10
20
30 40
19.20
19.25
Latitude
10
10
10
10
10 cm s-1
a
30
2040
50
10
20
30 40
10
10
10
10
b
30
2040
50
10
20
30 40
10
10
10
10
c
30
2040
50
10
20
30 40
10
10
10
10
d
30
2040
50
10
20
30 40
-96.10 -96.05-96.15
Longitude10
10
10
10
e
19.20
19.25
Latitude
19.20
19.25
Latitude
-96.10 -96.05-96.15
Longitude
BB AA
ISIV
Fig. 5. Vertically averaged mean currents with their respective standard deviation ellipses for the different seasons, computed with one day time interval between observations. a)
Summer 2008. b) Autumn 2008. c) Winter 2008e2009. d) Spring 2009. e) Summer 2009.
Table 1
Summary of the correlation (r) and phase (q) analysis, between the seasonal winds and the vertically averagedmean current components (u,v) of eachmooring. Positive phase
means wind lags current event.
Mooring Summer 2008 Autumn 2008 Winter 2008e2009 Spring 2009 Summer 2009
Variable Variable Variable Variable Variable
r q r q r q r q r q
BB u 0.62 !192 0.60 !52 0.40 !110 0.36 24 0.66 !67
v 0.37 !198 0.39 60 0.40 !170 0.63 77 0.39 !61
AA u 0.38 !80 0.40 70 0.61 209 0.38 72 0.64 !68
v 0.39 !18 0.62 75 0.39 215 0.63 76 0.41 !63
IV u 0.70 !40 0.40 !519 0.62 208 0.35 47 0.67 !68
v 0.29 !41 0.63 76 0.39 215 0.62 78 0.59 !284
IS u 0.61 !257 0.59 52 0.61 209 0.35 48 0.31 !24.5
v 0.63 !315 0.63 !512 0.39 71 0.61 76 0.58 !283
J. de Jesús Salas Pérez et al. / Estuarine, Coastal and Shelf Science 100 (2012) 102e112 107
Author's personal copy
the moorings (AA), (IS), (IV), during the winter at moorings (AA)
and (IS) and during the summer of 2009 at moorings (AA) and (IV)
showed magnitudes below 15 cm s!1, with a southwestward
component. It means that the flow is not in geostrophic balance
since the velocity vectors point in a transversal direction to the
bathymetry. Thus, the flow is ageostrophic (Fig. 5a, c, e).
During autumn 2008 and winter 2008 and 2009 (Fig. 5b and c),
the seasonal variability represented by the standard deviation
ellipses increased their major axis and the mean current magni-
tudes (>10 cm s!1). This feature is attributed to the generation of
atmospheric frontal system (northerly winds), with velocities
above 15 m s!1 (Salas-Pérez and Arenas-Fuentes, 2011). The verti-
cally averaged mean currents velocity during the spring season of
2009 was mainly oriented in a northwestward direction, with
magnitudes below 15 cm s!1 (Fig. 5d).
In general, the correlation of the seasonal wind patterns with
the seasonal vertically averaged mean currents, with predominant
southwestward and westward component for the current were
lower than 0.62 (Fig. 5e). It means that the Ekman transport is not
the major responsible of the southwestward and westward flow of
the current, the variability is then explained with the meso-scale
flow of the gyre of Campeche Bay (Monreal-Gómez et al., 2004;
Vázquez de la Cerda et al., 2005) and by flow rectification (poten-
tial vorticity) in the study area under the presence of reefs and
islands (Salas-Monreal et al., 2009).
The seasonal wind and the vertically averaged mean currents
were correlated to quantify their degree of dependence and phase
between both data sets. This analysis showed correlation values
higher than 0.5 for the u (east-west) component of the current,
while the phase indicate that seasonal currents are in general wind
generated, however during some periods of time the low correla-
tion between the current velocities and the wind (Table 1) sug-
gested the influence of other mechanisms (such as the gyre of
Campeche Bay and current rectification by potential vorticity) that
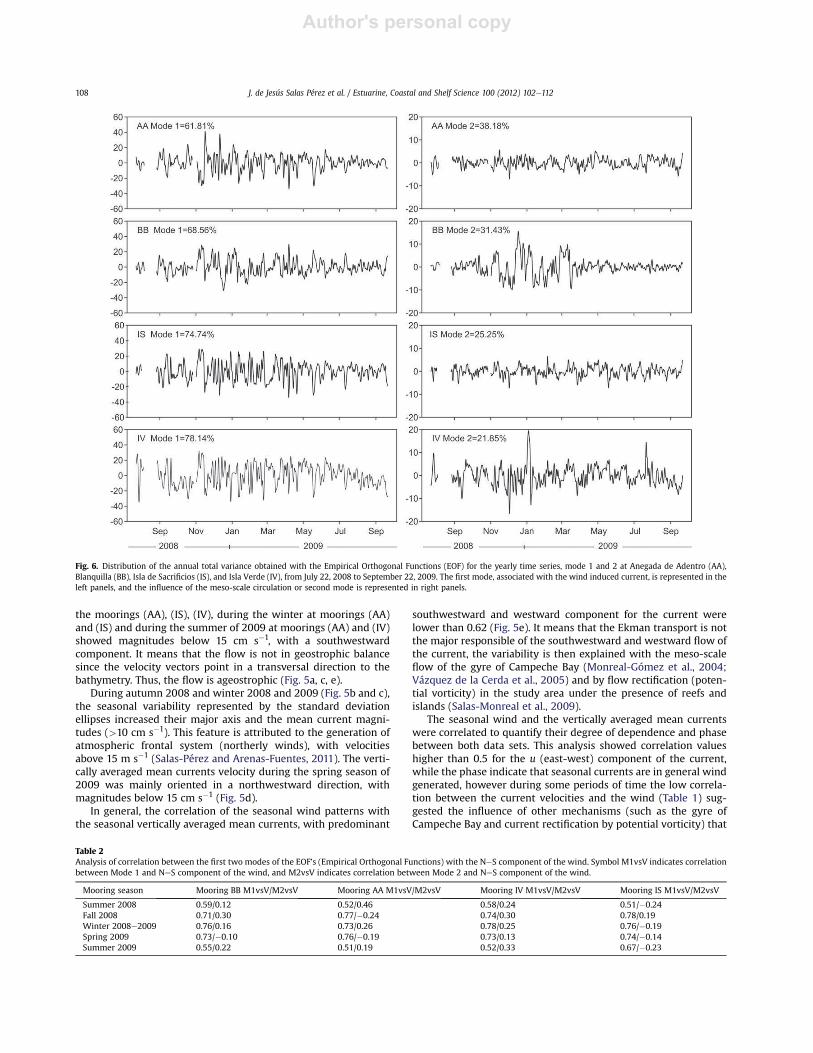
Fig. 6. Distribution of the annual total variance obtained with the Empirical Orthogonal Functions (EOF) for the yearly time series, mode 1 and 2 at Anegada de Adentro (AA),
Blanquilla (BB), Isla de Sacrificios (IS), and Isla Verde (IV), from July 22, 2008 to September 22, 2009. The first mode, associated with the wind induced current, is represented in the
left panels, and the influence of the meso-scale circulation or second mode is represented in right panels.
Table 2
Analysis of correlation between the first two modes of the EOF’s (Empirical Orthogonal Functions) with the NeS component of the wind. Symbol M1vsV indicates correlation
between Mode 1 and NeS component of the wind, and M2vsV indicates correlation between Mode 2 and NeS component of the wind.
Mooring season Mooring BB M1vsV/M2vsV Mooring AA M1vsV/M2vsV Mooring IV M1vsV/M2vsV Mooring IS M1vsV/M2vsV
Summer 2008 0.59/0.12 0.52/0.46 0.58/0.24 0.51/!0.24
Fall 2008 0.71/0.30 0.77/!0.24 0.74/0.30 0.78/0.19
Winter 2008e2009 0.76/0.16 0.73/0.26 0.78/0.25 0.76/!0.19
Spring 2009 0.73/!0.10 0.76/!0.19 0.73/0.13 0.74/!0.14
Summer 2009 0.55/0.22 0.51/0.19 0.52/0.33 0.67/!0.23
J. de Jesús Salas Pérez et al. / Estuarine, Coastal and Shelf Science 100 (2012) 102e112108
Author's personal copy
should modulate the current velocities. Furthermore in some
specific cases, the north-south wind component (v) had a lower
correlation with the measured currents than the east-west (u)
component (Table 1).
In order to elucidate the different forcing mechanism of the
area, an Empirical Orthogonal Function analysis of the filtered time
series were analyzed (Fig. 6), as observed in the distribution of the
total variance of the annual series there are two modes which
explains the variability of the currents in the PNSAV. Those modes
were attributed to the wind induced current in the PNSAV (because
of the previous correlation made between the first mode and the
NeS component of the wind, Table 2), and with the meso-scale
circulation associated to the large-scale circulation of the Gulf of
Mexico (this association was performed with maps of geostrophic
sea level anomalies and with the knowledge of the area), respec-
tively. The contributions of the diurnal tidal currents were not
analyzed since the aim of this study focuses on the seasonal
current.
During the summer season the distribution of the first mode
when compared to other seasons where lower (Fig. 6), this is
mainly attributed to the less energetic southerly winds, which had
a lower influence over the water column when compared to the
energetic northerly winds. In addition, the first mode (wind
induced currents) of the northerly moorings was reduced, since
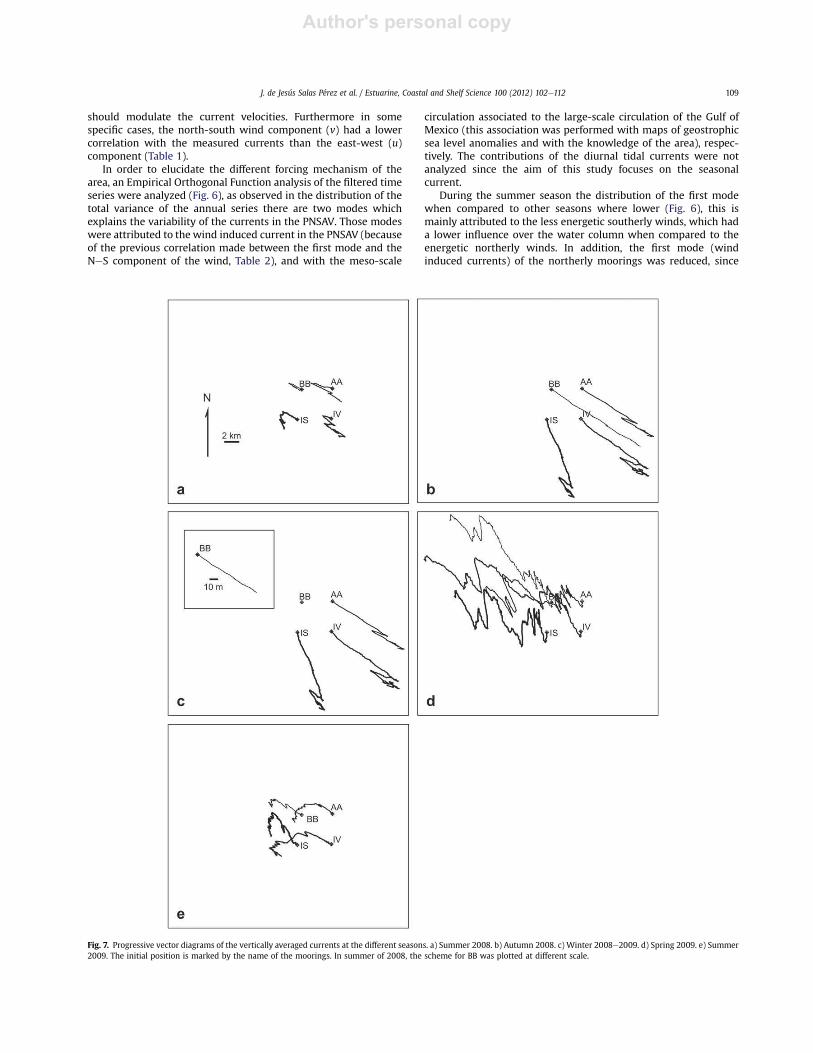
Fig. 7. Progressive vector diagrams of the vertically averaged currents at the different seasons. a) Summer 2008. b) Autumn 2008. c) Winter 2008e2009. d) Spring 2009. e) Summer
2009. The initial position is marked by the name of the moorings. In summer of 2008, the scheme for BB was plotted at different scale.
J. de Jesús Salas Pérez et al. / Estuarine, Coastal and Shelf Science 100 (2012) 102e112 109
Author's personal copy
they are protected from the southerly winds owing to the presence
of the southerly reefs (Fig. 1). While for the southerly moorings the
first mode increases due to their location.
3.4. Progresive vectors
The vertically averaged current velocity was influenced by wind
events associated with temporal fluctuations from diurnal to about
40 days period (Fig. 3b). Hence, an analysis employing the
progressive vector diagrams technique is presented to illustrate this
behavior. Fig. 7 shows the progressive vectors calculated from the
subtidal data set. In general two main features were observed:
Inertial oscillations with radius of hundred of meters along the
progressive vector diagrams and the random reversals of the flow
observed at periods of few days, in almost all seasons. The
progressive vector diagrams agree with the main direction of the
vertically averaged mean currents velocity described in Fig. 5 and
with the correlation analysis. However, during specific periods of
time the values of the correlation between the vertically averaged
current and the wind velocity (Table 1) were below what could be
expected according to frictional dynamics, where the wind and the
water velocity should have the same direction owing to the shal-
lowness of the system. The inertial oscillations inferred from the
progressive vectors also suggested that the system should not have
strong frictional dynamics as could be the case for shallow systems.
This is inferred since the progressive vectors did not follow strait
lines as would be the case of strong frictional dynamic systems. The
inertial oscillations have previously been described in a shallow
system in the southern Gulf of Mexico (Expósito-Díaz et al., 2009).
Therefore, two mechanisms were suggested from the Empirical
Orthogonal Function (EOF) analysis, the wind induced currents and
the meso-scale circulationwithin the Bay of Campeche (advection),
represented by a meso-scale cyclonic structure (Monreal-Gómez
and Salas de León, 1990; Vidal et al., 1994; Monreal-Gómez et al.,
2004; Vázquez de la Cerda et al., 2005). The Campeche Bay has
a cyclonic circulation, which has been described from observational
data (Vazquez de la Cerda et al., 2005) and from numerical model
studies (Monreal-Gómez and Salas de León,1990), the cyclonic gyre
start its development on the Campeche Bank, and shift westward
from August to December. This type of circulation affects the costal
circulation of the PNSAV inducing a southward flow pattern in the
study area.
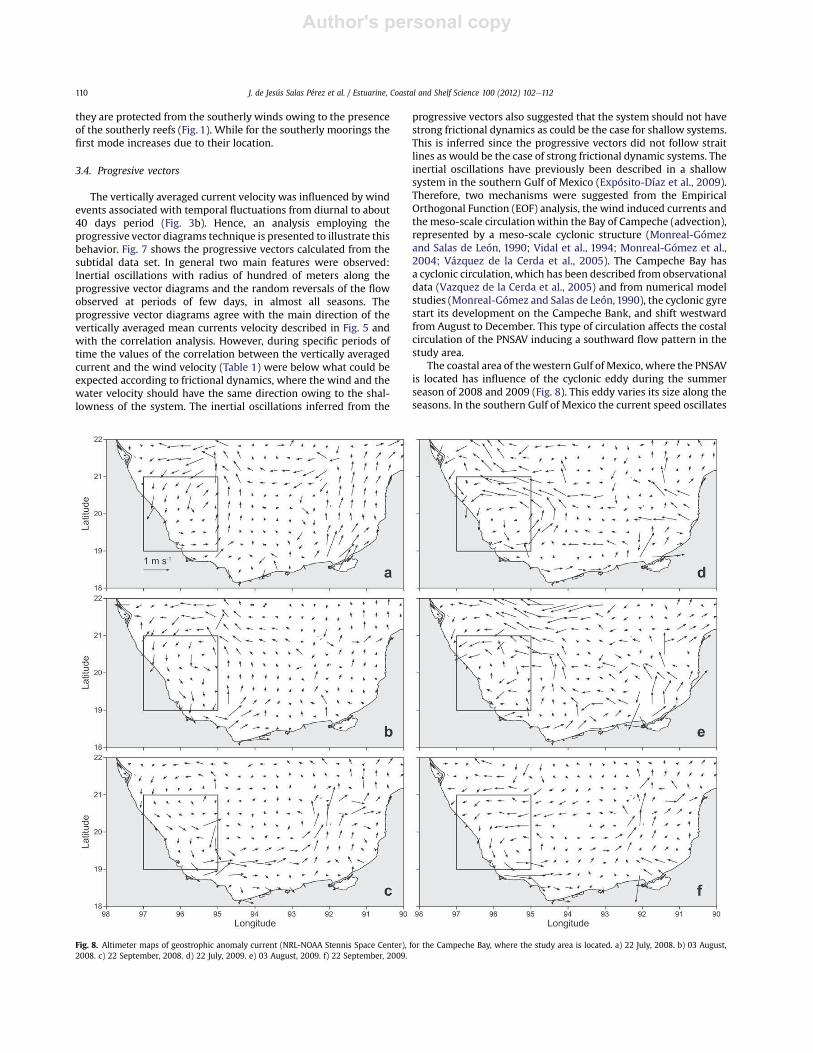
The coastal area of thewestern Gulf of Mexico, where the PNSAV
is located has influence of the cyclonic eddy during the summer
season of 2008 and 2009 (Fig. 8). This eddy varies its size along the
seasons. In the southern Gulf of Mexico the current speed oscillates
Fig. 8. Altimeter maps of geostrophic anomaly current (NRL-NOAA Stennis Space Center), for the Campeche Bay, where the study area is located. a) 22 July, 2008. b) 03 August,
2008. c) 22 September, 2008. d) 22 July, 2009. e) 03 August, 2009. f) 22 September, 2009.
J. de Jesús Salas Pérez et al. / Estuarine, Coastal and Shelf Science 100 (2012) 102e112110
Author's personal copy
from low values during July to higher values during September
(Fig. 8a, b, c). Current direction associated to the eddy had
a southward predominant component, in the area where the
PNSAV is located, with an intensification of its magnitude from July
to September (Fig. 8). Thus, the current velocity observed in the
PNSAV should be associated to the wind induced currents and by
the meso-scale circulation induced by the cyclonic eddy (advec-
tion), mostly during the summer season, when the flow is ageo-
strophic. It is confirmed that the effect of wind velocity in the
northern PNSAV circulation modulate the distribution of bio-
volumes, since it mix the entire water column and bring nutrients
from the different river discharges (Alongi, 1990; Grimes and
Finucane, 1991; Salas-Pérez and Arenas-Fuentes, 2011). This
phenomenon is similar to the one observed in the Catalan Sea
located in the northwestern Mediterranean sea, where a shallow
coastal haline front produced by the Rhone River increases the
biovolume of the area (Sabatés, 1990).
The influence of the meso-scale circulation generate a second
maximum in the biovolumes time series, mainly attributed to the
intrusion of the high nutrient water from the southwestern Gulf of
Mexico. The interaction of the cyclonic eddy in the western Gulf of
Mexico with eddies detached from the Loop current, constituted
a source of exchange of chlorophyll, nutrients, phytoplankton and
zooplankton, between the open-sea (Gulf of Mexico) and the
coastal waters, but mostly from the coastal area to the open sea
(Biggs and Müller-Karger, 1994; Toner et al., 2003), particularly in
the outer boundaries of the eddies, with a jet stream varying in
magnitude and size, located in the Campeche Bay (Salas-Pérez and
Granados-Barba, 2008). But also, the interaction of the river
discharges with the meso-scale circulation generates a local
circulation in the PNSAV, which might be an efficient mechanism
for the exchange of physical and biogeochemical properties
between the open-sea and the coastal area as reported for the
planktonic communities in the southern Gulf of Mexico (Salas de
León et al., 1998).
Finally, with the data analyzed of this study there was no
evidence of upwelling owing to the association between the coral
reefs bathymetry and the flow induced by the meso-scale cyclonic
gyre of the Campeche Bay (Zavala-Sansón and Provenzale, 2009). At
coastal scale, water mixed by wind effect bringing nutrients to the
entirewater columnwhich increase the plankton biovolumes of the
study area. The current profiles analyzed in this study, did not
showed signals associated to internal or lee waves, which produce
plankton patchiness peaks, mostly because of the location of the
moorings (Lennert-Cody and Franks, 1999; Salas-Monreal and
Valle-Levinson, 2009).
4. Conclusions
The seasonal patterns of marine circulation and biovolume
were obtained from the year-long in-situ time-series measure-
ments in the Parque Nacional Sistema Arrecifal Veracruzano
(PNSAV), located in the western continental shelf of the Gulf of
Mexico. Two mechanisms were depicted as the responsible for the
current pattern observed in the PNSAV and not only one as sug-
gested with large and coastal scale models. The first mechanism is
the wind generated currents (friction) responsible for up to 78% of
total variation of the seasonal circulation in the PNSAV throughout
the entire year. The second mechanism is the low frequency
current associated to the large-scale circulation of the Gulf of
Mexico, owing to the meso-scale circulation of the Bay of Cam-
peche. The cyclonic eddy of the Campeche Bay was responsible for
the current fluctuations analyzed during the summer of 2008 and
2009, which induce the ageostrophic mean current flow. The
absolute acoustic intensity (plankton biovolumes) was highly
correlated to wind induced currents and it was also associated
with the position of the meso-scale gyre of Campeche Bay. The
biovolume showed its maximum value during the summer
with high spatial variability between time series, mainly attrib-
uted to advection produced by meso-scale circulation and river
discharges, but also by eddy diffusion produced by atmospheric
and coastal water fronts.
Acknowledgments
The financial support of the SEP-CONACYT (Mexico) grants
59882 and 78773 is gratefully acknowledge. Jorge Castro-Sánchez
improved the quality of the figures. The authors want to thank two
anonymous reviewers for their helpful comments that have
improved the context and presentation of the paper.
References
Alongi, D.M., 1990. The ecology of tropical soft-bottom benthic ecosystems.Oceanogr. Marine Biology Annual Review 28, 381e496.
Biggs, D.C., Müller-Karger, F.E., 1994. Ship and satellite observations of chlorophyllstocks in interacting cyclone-anticyclone eddy pairs in the western gulf ofMexico. Journal of Geophysical Research C99, 7371e7384.
Boicourt, W.C., Wiseman Jr., W.J., Valle-Levinson, A., Atkinson, L.P., 1998. Continentalshelf of the southeastern United States and the Gulf of Mexico: the shadow ofthe western boundary current. In: Robinson, A.R., Brink, K.H. (Eds.), The Sea, vol.11. John Wiley, Hoboken, NJ-USA, pp. 135e182.
Caballero-Rosas, A., 1990. Modelación hidrodinámica numérica de la circulación porviento en la zona costera del Puerto de Veracruz y sus proximidades. Masterthesis, Univ. Veracruzana, México.
Coronado, C.J., Candela, J., Iglesias-Prieto, R., Sheinbaum, J., López, M., Ocampo-Torres, F.J., 2007. On the circulation in the Puerto Morelos fringing reef lagoon.Coral Reefs 26, 149e163.
Emery, W.J., Thomson, R.E., 2001. Data Analysis Methods in Physical Oceanography,second and revised ed. Elsevier, Amsterdam, p. 346.
Expósito-Díaz, G., Salas-de-León, D.A., Monreal-Gómez, M.A., Salas-Monreal, D.,Vázquez-Gutiérrez, F., 2009. Inertial currents in the southern Gulf of Mexico.Ciencias Marinas 35 (3), 287e296.
Falter, J.L., Sansone, F.J., 2000. Hydraulic control of pore water geochemistry withinthe oxic-suboxic zone of a permeable sediment. Limnology Oceanography 45(3), 550e557.
Grimes, C.B., Finucane, J.H., 1991. Spatial distribution and abundance of larval andjuvenile fish, chlorophyll and macrozooplankton around the Mississippi Riverdischarge plume, and the role of the plume in fish recruitment. Marine EcologyProgress Series 75, 109e119.
Gutiérrez de Velasco, G., Winant, C.D., 1996. Seasonal patterns of wind stress andwind stress curl over the Gulf of México. Journal of Geophysical Research 101,18127e18140.
Holliday, D.V., Pieper, R.E., 1980. Volume scattering strengths and zooplanktondistributions at acoustic frequencies between 0.5 and 3 MHz. Journal of theAcoustic Society of America 67, 135e145.
Krutak, P.R., Rickles, S.E., Gío-Argáez, R., 1980. Modern Ostracod Species Diversity,Dominance and Biofacies Patterns Veracruz-Anton Lizardo Reefs, México, vol. 7.Anales del Instituto de Ciencias del Mar y Limnología, pp. 181e198.
Lennert-Cody, C.E., Franks, P.J.S., 1999. Plankton patchiness in high- frequencyinternal waves. Marine Ecology Progress Series 186, 59e66.
Lugo-Fernández, A., Desalrzes, K.J., Price, J.M., Boland, G.S., Morin, M.V., 2001.Inferring probable dispersal of Flower Garden Banks coral larvae (Gulf ofMexico) using observed and simulated drifter trajectories. Continental ShelfResearch 21, 47e67.
Magaña, V., 1993. The 40- and 50- day oscillations in atmospheric angularmomentum at various latitudes. Journal of Geophysical Research 98 (D6),10441e10450.
Monreal-Gómez, M.A., Salas-de-León, D.A., Velasco-Mendoza, H., 2004. La hidro-dinámica del Golfo de México: diagnostico ambiental del Golfo de México. In:Caso, M., Pisanty, I., Ezcurra, E. (Eds.), Instituto Nacional de Ecología, vol 1.SEMARNAT, México, pp. 47e68 (In Spanish).
Monreal-Gómez, M.A., Salas-de-León, D.A., 1990. Simulación de la circulación de labahía de Campeche. Geofisica International 29, 101e111.
Ressler, P.H., 2002. Acoustic backscatter measurements with a 153 kHz ADCP in thenortheastern Gulf of Mexico: determination of dominant zooplankton andmicronekton scatterers. Deep-Sea Research 49, 2035e2051.
Sabatés, A., 1990. Changes in the heterogeneity of meso-scale distribution patternsof larval fish associate with a shallow coastal haline front. Estuarine. Coastal andShelf Science 30, 131e140.
Salas de León, D., Monreal-Gómez, M.A., San Vicente-Añorve, L., Flores-Coto, C.,1998. Influence de la circulation à long terme sur la répartition des organismeszooplanctoniques dans la Baie de Campeche, Mexique. Oceanologica Acta 21,87e93.
J. de Jesús Salas Pérez et al. / Estuarine, Coastal and Shelf Science 100 (2012) 102e112 111
Author's personal copy
Salas-Monreal, D., Salas-de-León, D.A., Monreal-Gómez, M.A.,RiveróneEnzástiga, M.L., 2009. Current rectification in a tropical coral reefsystem. Coral Reefs 28 (4), 871e879.
Salas-Monreal, D., Valle-Levinson, A., 2009. Continuously stratified flow dynamicsover a hollow. Journal of Geophysical Research 114, C03021. doi:10.1029/2007JC004648.
Salas-Pérez, J.J., Arenas-Fuentes, V., 2011. Winter water mass of the Veracruz reefsystem. Atmosfera 24 (2), 221e231.
Salas-Pérez, J.J., Granados-Barba, A., 2008. Oceanographic characterization of theVeracruz reef system. Atmosfera 21 (3), 281e301.
Salas-Pérez, J.J., Salas-Monreal, D., Arenas-Fuentes, V., Salas-de-León, D.A., Riveron-Enzástiga, M.L., 2008. Tidal characteristics at the Veracruz reef system (Westerngulf of Mexico). Ciencias Marinas 34 (4), 467e478.
Salas-Pérez, J.J., Vargas-Hernández, J.M., Arenas-Fuentes, V., Balderas-Cruz, P., 2007.In: Granados-Barba, A., Abarca-Arenas, L., Vargas-Hernández, J.M. (Eds.),Trayectoria de masas de agua en los sistemas arrecífales de Veracruz y modelosnuméricos: Circulación de verano: Investigaciones Científicas en el SistemaArrecifal Veracruzano. EPOMEX-UAC, México, pp. 17e26 (In Spanish).
Toner, M., Kirwan, A., Poje, A., Kantha, L., Müller-Karger, F., Jones, C., 2003.Chlorophyll dispersal by eddy-eddy interactions in the Gulf of México. Journalof Geophysical Research 108, 18127e18140.
Vázquez de la Cerda, A.M., Reid, R.O., DiMarco, S.F., Jochens, A.E., 2005. Bay ofCampeche circulation an update: circulation of the gulf of México: observationsand models. In: Sturges, W.E., Lugo-Fernández, A. (Eds.), GeophysicalMonograph Series, vol. 161. American Geophysical Union, USA, pp. 279e293.
Vidal, M.V.V., Hernández, A.F., Meza, E., Pérez-Molero, J.M., 1994. Baroclinicflows, transports, and kinematic properties in a cyclonic-anticyclonic-cyclonic ring triad in the Gulf of Mexico. Journal of Geophysical ResearchC99, 7571e7597.
Wolanski, E., Pickard, G.L., 1985. Long-term observations of currents on the centralGreat Barrier Reef continental shelf. Coral Reefs 4, 47e57.
Zavala-Hidalgo, J., Morey, S.L., O’Brien, J.J., 2003. Seasonal circulation on the westernshelf of the Gulf of México using a high resolution numerical model. Journal ofGeophysical Research C108, 1e19.
Zavala-Sansón, L., Provenzale, A., 2009. The effects of abrupt topography onplankton dynamics. Theoritical Population Biology 76 (4), 258e267.
J. de Jesús Salas Pérez et al. / Estuarine, Coastal and Shelf Science 100 (2012) 102e112112