August 31, 2021 - Annual Report - Xtrackers ETFs
104
August 31, 2021 Annual Report DBX ETF Trust Xtrackers Emerging Markets Carbon Reduction and Climate Improvers ETF (EMCR) (Formerly known as Xtrackers MSCI ACWI ex USA ESG Leaders Equity ETF (ACSG)) Xtrackers MSCI EAFE ESG Leaders Equity ETF (EASG) Xtrackers MSCI Emerging Markets ESG Leaders Equity ETF (EMSG) Xtrackers MSCI USA ESG Leaders Equity ETF (USSG) Xtrackers S&P 500 ESG ETF (SNPE) Xtrackers S&P MidCap 400 ESG ETF (MIDE) Xtrackers S&P SmallCap 600 ESG ETF (SMLE)
-
Upload
khangminh22 -
Category
Documents
-
view
3 -
download
0
Transcript of August 31, 2021 - Annual Report - Xtrackers ETFs

August 31, 2021
Annual ReportDBX ETF Trust
Xtrackers Emerging Markets Carbon Reduction and Climate Improvers ETF (EMCR)(Formerly known as Xtrackers MSCI ACWI ex USA ESG Leaders Equity ETF (ACSG))
Xtrackers MSCI EAFE ESG Leaders Equity ETF (EASG)Xtrackers MSCI Emerging Markets ESG Leaders Equity ETF (EMSG)Xtrackers MSCI USA ESG Leaders Equity ETF (USSG)Xtrackers S&P 500 ESG ETF (SNPE)Xtrackers S&P MidCap 400 ESG ETF (MIDE)Xtrackers S&P SmallCap 600 ESG ETF (SMLE)

DBX ETF Trust
Table of Contents
Page
Shareholder Letter . . . . . . . . . . . . . . . . . . . . . . . . . . . . . . . . . . . . . . . . . . . . . . . . . . . . . . . . . . . . . . . . . . . . . . . 1
Management’s Discussion of Fund Performance . . . . . . . . . . . . . . . . . . . . . . . . . . . . . . . . . . . . . . . . . . . . . 3
Performance Summary
Xtrackers Emerging Markets Carbon Reduction and Climate Improvers ETF . . . . . . . . . . . . . . . . . . 6Xtrackers MSCI EAFE ESG Leaders Equity ETF . . . . . . . . . . . . . . . . . . . . . . . . . . . . . . . . . . . . . . . . . . . 8Xtrackers MSCI Emerging Markets ESG Leaders Equity ETF . . . . . . . . . . . . . . . . . . . . . . . . . . . . . . . . 10Xtrackers MSCI USA ESG Leaders Equity ETF . . . . . . . . . . . . . . . . . . . . . . . . . . . . . . . . . . . . . . . . . . . . 12Xtrackers S&P 500 ESG ETF . . . . . . . . . . . . . . . . . . . . . . . . . . . . . . . . . . . . . . . . . . . . . . . . . . . . . . . . . . . . 14Xtrackers S&P MidCap 400 ESG ETF . . . . . . . . . . . . . . . . . . . . . . . . . . . . . . . . . . . . . . . . . . . . . . . . . . . . 16Xtrackers S&P SmallCap 600 ESG ETF . . . . . . . . . . . . . . . . . . . . . . . . . . . . . . . . . . . . . . . . . . . . . . . . . . . 18
Fees and Expenses . . . . . . . . . . . . . . . . . . . . . . . . . . . . . . . . . . . . . . . . . . . . . . . . . . . . . . . . . . . . . . . . . . . . . . . 20
Schedule of Investments
Xtrackers Emerging Markets Carbon Reduction and Climate Improvers ETF . . . . . . . . . . . . . . . . . . 21Xtrackers MSCI EAFE ESG Leaders Equity ETF . . . . . . . . . . . . . . . . . . . . . . . . . . . . . . . . . . . . . . . . . . . 34Xtrackers MSCI Emerging Markets ESG Leaders Equity ETF . . . . . . . . . . . . . . . . . . . . . . . . . . . . . . . . 40Xtrackers MSCI USA ESG Leaders Equity ETF . . . . . . . . . . . . . . . . . . . . . . . . . . . . . . . . . . . . . . . . . . . . 48Xtrackers S&P 500 ESG ETF . . . . . . . . . . . . . . . . . . . . . . . . . . . . . . . . . . . . . . . . . . . . . . . . . . . . . . . . . . . . 52Xtrackers S&P MidCap 400 ESG ETF . . . . . . . . . . . . . . . . . . . . . . . . . . . . . . . . . . . . . . . . . . . . . . . . . . . . 57Xtrackers S&P SmallCap 600 ESG ETF . . . . . . . . . . . . . . . . . . . . . . . . . . . . . . . . . . . . . . . . . . . . . . . . . . . 61
Statements of Assets and Liabilities . . . . . . . . . . . . . . . . . . . . . . . . . . . . . . . . . . . . . . . . . . . . . . . . . . . . . . . . 66
Statements of Operations . . . . . . . . . . . . . . . . . . . . . . . . . . . . . . . . . . . . . . . . . . . . . . . . . . . . . . . . . . . . . . . . . 68
Statements of Changes in Net Assets . . . . . . . . . . . . . . . . . . . . . . . . . . . . . . . . . . . . . . . . . . . . . . . . . . . . . . . 70
Financial Highlights . . . . . . . . . . . . . . . . . . . . . . . . . . . . . . . . . . . . . . . . . . . . . . . . . . . . . . . . . . . . . . . . . . . . . . 73
Notes to Financial Statements . . . . . . . . . . . . . . . . . . . . . . . . . . . . . . . . . . . . . . . . . . . . . . . . . . . . . . . . . . . . . 77
Report of Independent Registered Public Accounting Firm . . . . . . . . . . . . . . . . . . . . . . . . . . . . . . . . . . . . 89
Board Members and Officers . . . . . . . . . . . . . . . . . . . . . . . . . . . . . . . . . . . . . . . . . . . . . . . . . . . . . . . . . . . . . . 91
Additional Information . . . . . . . . . . . . . . . . . . . . . . . . . . . . . . . . . . . . . . . . . . . . . . . . . . . . . . . . . . . . . . . . . . . . 94
Privacy Policy Notice . . . . . . . . . . . . . . . . . . . . . . . . . . . . . . . . . . . . . . . . . . . . . . . . . . . . . . . . . . . . . . . . . . . . . 95
This Page is Intentionally Left Blank
To our Shareholders: (Unaudited)
Dear Shareholder,
We are pleased to provide this annual report for seven of our equity ETFs tracking theenvironmental, social, and governance (ESG) market for the period ended August 31, 2021.
The global economy staged a rebound from its post-pandemic recession, supported byaccommodative fiscal and monetary policies, rapid vaccination rollouts, favorable economic data,and corporate earnings results. Major economies, such as the U.S. and China, witnessed morepronounced recovery, while most developing nations continued to grapple with the emerging“Delta” variant of the virus. The Eurozone economy posted positive growth in Q2 2021 aftercontracting for two consecutive quarters driven by largely burgeoning household spending.
According to Citigroup, in 2020, half of new EMEA passive funds were launched as “sustainable”funds — passive funds linked to ESG goals. Demand for ESG investments has accelerated in recentyears, particularly in Europe, partly driven by growing evidence that companies that perform well onvarious ESG criteria tend to outperform over the longer term. With advancements in technology, suchas artificial intelligence, and the regulatory landscape becoming clearer, ESG-mandated assets are ontheir way to reaching almost USD35tn by 2025, according to Deloitte. Equities remained the mostpopular asset class for sustainable investment, due mainly to an increase in the number ofsustainable products, market appreciation, and positive inflows.
In the U.S., a favorable unemployment rate along with healthy corporate earnings results, drovea surge in markets in H1 2021. Biden’s administrative policies toward climate change proved tobe a growth catalyst in the alternative energy space. The USD2.3tn infrastructure plan is expectedto provide a huge impetus to ESG-oriented companies. The growing preference for electricvehicles (EVs) over combustion engines has been at the forefront of this “green revolution.” Theindustry has seen a massive inflow of funds, prompted partly by government policies to parecarbon emissions. The Eurozone economy began its recovery as lockdown restrictions wereeased, shoring up key pandemic-affected sectors, especially the hospitality sector. In its pursuit tobecome the global bellwether in green initiatives, the European Union (EU) is aiming to cut netCO2 emissions to zero by 2050 to retard climate change. Given the supply-demand imbalance inthe market, prices in the “green” sector have seen a significant escalation, with ESG fundsturning out to be one of the most crowded trades.
Developments with vaccine administration in emerging markets were mixed, but generallylagged behind those in developed markets. China still leads in sustainable investing among theemerging markets. Following President Xi Jinping’s announcement of China’s net carbonneutrality goals, net flow into ESG funds jumped dramatically in Q4 2020. However, net inflowdipped in H1 2021. Strong performance of many sustainable funds in China, coupled with thegovernment’s new crackdown on national security, technology, and monopolies, led manyinvestors toward profit booking.
While vaccination rollouts in developed nations have been swift, progress remains slow in otherparts of the world, and new coronavirus variants, such as “Delta,” remain a viable threat.Accelerating inflation in the U.S. and some emerging markets points to a possible bumpytransition from ultra-low interest rates and easy financing conditions to a post-pandemic“normalized” state. On the ESG front, sustainable investing has only gotten bigger, gatheringmore steam. The pandemic has shown investors that companies with robust ESG characteristicshave, on average, better tools to cope with the changing political and economic environment.
Our team appreciates your trust and looks forward to serving your investment needs throughinnovative index-driven strategies.
Sincerely,
/s/ Freddi KlassenFreddi KlassenPresident and Chief Executive Officer
Assumptions, estimates and opinions contained in this document constitute our judgment as of the date of the document andare subject to change without notice. Any projections are based on a number of assumptions as to market conditions and therecan be no guarantee that any projected results will be achieved. Past performance is not a guarantee of future results.
1

This Page is Intentionally Left Blank
2

DBX ETF Trust
Management’s Discussion of Fund Performance (Unaudited)
Xtrackers Emerging Markets Carbon Reduction and Climate Improvers ETF (EMCR)The Xtrackers Emerging Markets Carbon Reduction and Climate Improvers ETF (EMCR), seeks investment resultsthat correspond generally to the performance, before fees and expenses, of the Solactive ISS Emerging MarketsCarbon Reduction & Climate Improvers Index NTR (the “EMCR Index”). The EMCR index is comprised of largeand mid-capitalization companies in emerging markets countries that meet certain environmental, social andgovernance (“ESG”) criteria and/or have committed to greenhouse gas emissions reduction targets. The fund’sperformance reflects the result of the current strategy and the strategy in place prior to August 18, 2021, when theMSCI ACWI ex USA ESG Leaders Equity ETF’s name changed to Xtrackers Emerging Markets Carbon Reductionand Climate Improvers ETF and the Fund’s ticker symbol changed to EMCR. At that time the underlying indexreplaced the MSCI ACWI ex USA ESG Leaders Index which provides exposure to companies in the developed andemerging markets that exhibit high Environmental, Social and Governance (ESG) performance relative to theirsector peers. For the 12-month period ended August 31, 2021 EMCR shares returned 26.80%, compared to theEMCR Index return of 27.32%.
All sectors contributed positively to performance during the period with the greatest contributions coming fromFinancials, Information Technology and Industrials. From a geographical perspective, Japan, Canada and Taiwanwere the major positive contributors, while the United States, Hong Kong and Malaysia contributed negatively toperformance.
Xtrackers MSCI EAFE ESG Leaders Equity ETF (EASG)Xtrackers MSCI EAFE ESG Leaders Equity ETF (EASG), seeks investment results that correspond generally to theperformance, before fees and expenses, of the MSCI EAFE ESG Leaders Index. (the EASG Index). The EASG Indexprovides exposure to companies across developed market countries, (except the United States and Canada) thatexhibit high environmental, social and governance (ESG) performance relative to their sector peers. For the12-month period ended August 31, 2021 EASG shares returned 25.28%, compared to the EASG Index return of25.37%.
All sectors contributed positively to performance during the period with the greatest contributions coming fromFinancials, Industrials and Information Technology. From a geographical perspective, all the countries contributedpositively with the greatest contribution coming from Japan, Netherlands and France.
Xtrackers MSCI Emerging Markets ESG Leaders Equity ETF (EMSG)Xtrackers MSCI Emerging Markets ESG Leaders Equity ETF (EMSG), seeks investment results that correspondgenerally to the performance, before fees and expenses, of the MSCI Emerging Markets ESG Leaders Index (theEMSG Index). The EMSG Index is designed to provide exposure to large and mid-sized companies acrossemerging markets that exhibit high Environmental, Social and Governance (ESG) performance relative to itssector peers. For the 12-month period ended August 31, 2021, EMSG shares returned 18.43%, compared to theEMSG Index return of 18.74%.
The majority of sectors contributed positively to performance during the period with the greatest contributionscoming from Information Technology, Financials and Materials. The Consumer Discretionary and Real Estatesectors were the only negative contributors to performance. From a geographical perspective, Taiwan, India andKorea were the major positive contributors, while the United States, Hong Kong and Netherlands contributednegatively to performance.
Xtrackers MSCI USA ESG Leaders Equity ETF (USSG)Xtrackers MSCI USA ESG Leaders Equity ETF (USSG), seeks investment results that correspond generally to theperformance, before fees and expenses, of the MSCI USA ESG Leaders Index (the USSG Index). The USSG Indexis designed to provide exposure to large and medium sized companies in US markets that exhibit highEnvironmental, Social and Governance (ESG) performance relative to its sector peers. For the 12-month periodended August 31, 2021, USSG shares returned 33.48%, compared to the USSG Index return of 33.59%.
All sectors contributed positively to performance during the period with the greatest contributions coming fromInformation Technology, Communication Services and Financials.
Xtrackers S&P 500 ESG ETF (SNPE)Xtrackers S&P 500 ESG ETF (SNPE), seeks investment results that correspond generally to the performance,before fees and expenses, of the S&P 500 ESG Index (the SNPE Index). The SNPE Index measures the
3
DBX ETF Trust
Management’s Discussion of Fund Performance (Unaudited) (Continued)
performance of securities that fulfills sustainability criteria, while preserving similar overall industry groupweights as S&P 500 index. For the 12-month period ended August 31, 2021 SNPE shares returned 30.16%,compared to the SNPE Index return of 30.27%.
All sectors contributed positively to performance during the period with the greatest contributions coming fromInformation Technology, Financials and Communication Services.
Xtrackers S&P MidCap 400 ESG ETF (MIDE)Xtrackers S&P MidCap 400 ESG ETF (MIDE), seeks investment results that correspond generally to theperformance, before fees and expenses, of the S&P MidCap 400 ESG Index (the MIDE Index). The MIDE Indexmeasures the performance of securities that fulfills sustainability criteria, while preserving similar overall industrygroup weights as S&P MidCap 400 Index. For the period February 24, 2021 (commencement of operations) toAugust 31, 2021 MIDE shares returned 9.92%, compared to the MIDE Index return of 10.01%.
The majority of sectors contributed positively to performance during the period with the greatest contributionscoming from Industrials, Consumer Discretionary and Real Estate. The Communication Services sector was theonly negative contributor to performance.
Xtrackers S&P SmallCap 600 ESG ETFs (SMLE)Xtrackers S&P SmallCap 600 ESG ETF (SMLE), seeks investment results that correspond generally to theperformance, before fees and expenses, of the S&P SmallCap 600 ESG Index (the SMLE Index). The SMLE Indexmeasures the performance of securities that fulfills sustainability criteria, while preserving similar overall industrygroup weights as S&P SmallCap 600 Index. For the period February 24, 2021 (commencement of operations) toAugust 31, 2021 MIDE shares returned 7.01%, compared to the MIDE Index return of 7.10%.
The majority of sectors contributed positively to performance during the period with the greatest contributionscoming from Consumer Discretionary, Industrials and Information Technology. The Energy and Materials’ sectorswere the only negative contributors to performance.
*************************
Performance data quoted represents past performance and does not guarantee future results. Investment returnsand principal value of an investment will fluctuate so that an investor’s shares, when sold or redeemed, may beworth more or less than their original cost. Current performance may be lower or higher than the performancedata quoted. To obtain the most recent month-end performance data visit www.Xtrackers.com. Returns assumethat dividends and capital gains distributions have been reinvested. See pages 6-19 of this report for additionalperformance information, including performance data based on market value.
The views expressed in this report reflect those of the portfolio management team only through the end of theperiod of the report as stated on the cover. The management team’s views are subject to change at any timebased on market and other conditions and should not be construed as a recommendation. Current and futureportfolio holdings are subject to risk.
4
This Page is Intentionally Left Blank
5

DBX ETF Trust
Performance Summary (Unaudited)
Xtrackers Emerging Markets Carbon Reduction and Climate Improvers ETF (EMCR)The Xtrackers Emerging Markets Carbon Reduction and Climate Improvers ETF (the “Fund”), using a “passive” or indexing investmentapproach, seeks investment results that correspond generally to the performance, before fees and expenses, of the Solactive ISS EmergingMarkets Carbon Reduction & Climate Improvers Index NTR (the “Underlying Index”). The Underlying Index is comprised of large andmid-capitalization companies in emerging markets countries that meet certain environmental, social and governance (“ESG”) criteria and/orhave committed to greenhouse gas emissions reduction targets. The Underlying Index is then weighted in such a manner seeking to align itsconstituent companies’ greenhouse gas emissions with the long-term global warming target of the Paris Climate Agreement. On August 18,2021 the Xtrackers MSCI ACWI ex USA ESG Leaders Equity ETF name changed to Xtrackers Emerging Markets Carbon Reduction and ClimateImprovers ETF and the Fund’s ticker symbol cahnged to EMCR. At that time, the Underlying Index replaced the MSCI ACWI ex USA ESGLeaders Index which is a capitalization weighted index that provides exposure to companies with high environmental, social and governance(“ESG”) performance relative to their sector peers and is constructed using regional indexes that provide exposure to large- and medium-capitalization companies from developed and emerging markets countries (excluding the United States). It is not possible to invest directly intoan index.
Performance as of August 31, 2021
Average Annual Total Return
Net Asset Value Market Value
Solactive ISSEmerging
Markets CarbonReduction &
ClimateImprovers Index NTR2
MSCI ACWI exUSA ESG
Leaders Index
MSCIEmerging
Markets IndexMSCI ACWI ex
USA Index
One Year 26.80% 26.59% 27.32% 23.85% 21.12% 24.87%
Since Inception1 15.35% 15.29% 15.59% 14.43% 12.33% 12.85%
Cumulative Total Returns
Net Asset Value Market Value
Solactive ISSEmerging
Markets CarbonReduction &
ClimateImprovers Index NTR2
MSCI ACWI exUSA ESG
Leaders Index
MSCIEmerging
Markets IndexMSCI ACWI ex
USA Index
One Year 26.80% 26.59% 27.32% 23.85% 21.12% 24.87%
Since Inception1 47.88% 47.74% 48.78% 44.72% 37.55% 39.32%
1 Total returns are calculated based on the commencement of operations, December 6, 2018 (“Inception”).
2 On August 18, 2021, the Fund changed its Underlying Index from MSCI ACWI ex USA ESG Leaders Index to the Solactive ISS EmergingMarkets Carbon Reduction & Climate Improvers Index NTR. Returns reflect performance for the MSCI ACWI ex USA ESG Leaders Indexthrough August 17, 2021.
Prior to August 18, 2021, the Fund was known as Xtrackers MSCI ACWI ex USA ESG Leaders Equity ETF (ASCG) and had a differentinvestment strategy. Past performance may have been different if the Fund’s current investment strategy had been in effect.
Past performance is no guarantee of future results. Current performance may be lower or higher than the performance data quoted.
Performance data current to the most recent month-end is available at www.Xtrackers.com. Performance results assume reinvestment of all
dividends and capital gain distributions and do not reflect the deduction of taxes that a shareholder would pay on fund distributions or on
the sale of fund shares or redemption of fund creation units. The investment return and principal value of shares will vary with changes in
market conditions. Shares may be worth more or less than their original cost when they are sold in the market or redeemed. Performance for
certain funds may reflect a waiver of a portion of the unitary advisory fee. Without such waiver, performance would have been lower. The
gross expense ratio of the Fund, as stated in the fee table of the prospectus dated August 18, 2021, was 0.15%, and may differ from the
expense ratio disclosed in the Financial Highlights table in this report.
The Fund’s net asset value or “NAV” is calculated by dividing the value of the Fund’s total assets less total liabilities by the number of sharesoutstanding. The price used to calculate market return (“Market Price”) is determined by using the midpoint between the highest bid and thelowest offer on the primary stock exchange on which shares of a fund are listed for trading, as of the time that such fund’s NAV is calculated.Since shares of a fund may not have traded in the secondary market until after the fund’s inception, for the period from inception to the firstday of secondary trading, the NAV of the fund is used as a proxy for the Market Price to calculate market returns. Market and NAV returnsassume that dividends and capital gain distributions have been reinvested at Market Price and NAV, respectively.
An index is a statistical composite that tracks a specified financial market or sector. Unlike a fund, an index does not actually hold a portfolio ofsecurities and therefore does not incur the expenses incurred by a fund. These expenses negatively impact fund performance. Also, marketreturns do not include brokerage commissions that may be payable on secondary market transactions. If brokerage commissions wereincluded, market returns would be lower.
6

DBX ETF Trust
Performance Summary (Unaudited)
Xtrackers Emerging Markets Carbon Reduction and Climate Improvers ETF (EMCR) (Continued)
Growth of an Assumed $10,000 Investment
$8,000
$10,000
$16,000
$12,000
$14,000
MSCI ACWI ex USA Index MSCI Emerging Markets IndexMSCI ACWI ex USA ESG Leaders IndexSolactive ISS Emerging Markets Carbon Reduction & Climate Improvers Index NTREMCR1
$13,932$14,472
$13,755
$14,788$14,878
Periods Ended
12/6/
18
8/31/2
1
2/28/1
9
5/31/1
9
8/31/2
0
8/31/1
9
11/30
/19
2/29/2
0
5/31/2
0
11/30
/20
2/28/2
1
5/31/2
1
1 Based on Net Asset Value from commencement of operations,December 6, 2018.
Sector Diversification* as of August 31, 2021
Financials 25.4%Information Technology 25.4%Consumer Discretionary 14.8%Communication Services 13.1%Materials 6.2%Health Care 4.3%Industrials 4.2%Consumer Staples 4.1%Real Estate 1.8%Utilities 0.7%
Total 100.0%
Ten Largest Equity Holdings
as of August 31, 2021 (31.3% of Net Assets)
Description % of Net Assets
Taiwan Semiconductor Manufacturing Co. Ltd.(Taiwan) 10.2%
Tencent Holdings Ltd. (China) 7.1%Samsung Electronics Co. Ltd. (South Korea) 3.6%Alibaba Group Holding Ltd. (China) 3.6%Meituan (China) 1.5%China Construction Bank Corp. (China) 1.3%Housing Development Finance Corp. Ltd. (India) 1.2%NIO, Inc. (China) 1.0%Infosys Ltd. (India) 0.9%Tata Consultancy Services Ltd. (India) 0.9%
Country Diversification* as of August 31, 2021
China 34.1%Taiwan 19.5%India 12.0%South Korea 11.9%Brazil 4.5%South Africa 3.3%Saudi Arabia 2.1%Other 12.6%
Total 100.0%
* As a percent of total investments excluding exchange-traded funds, securities lending collateral and cash equivalents.
Portfolio holdings and characteristics are subject to change. For more complete details about the Fund’s investment portfolio see page 21.
7

DBX ETF Trust
Performance Summary (Unaudited)
Xtrackers MSCI EAFE ESG Leaders Equity ETF (EASG)The Xtrackers MSCI EAFE ESG Leaders Equity ETF (the “Fund”), using a “passive” or indexing investment approach, seeks investment resultsthat correspond generally to the performance, before fees and expenses, of the MSCI EAFE ESG Leaders Index (the “Underlying Index”). TheUnderlying Index is a capitalization weighted index that provides exposure to companies with high environmental, social and governance(“ESG”) performance relative to their sector peers and consists of large- and medium-capitalization companies across developed marketscountries, excluding Canada and the United States. It is not possible to invest directly into an index.
Performance as of August 31, 2021
Average Annual Total Return
Net Asset Value Market Value MSCI EAFE ESG Leaders Index MSCI EAFE Index
One Year 25.28% 26.07% 25.37% 26.12%
Since Inception1 11.04% 11.13% 11.02% 9.75%
Cumulative Total Returns
Net Asset Value Market Value MSCI EAFE ESG Leaders Index MSCI EAFE Index
One Year 25.28% 26.07% 25.37% 26.12%
Since Inception1 36.71% 37.09% 36.69% 32.07%
1 Total returns are calculated based on the commencement of operations, September 6, 2018 (“Inception”).
Past performance is no guarantee of future results. Current performance may be lower or higher than the performance data quoted.
Performance data current to the most recent month-end is available at www.Xtrackers.com. Performance results assume reinvestment of all
dividends and capital gain distributions and do not reflect the deduction of taxes that a shareholder would pay on fund distributions or on
the sale of fund shares or redemption of fund creation units. The investment return and principal value of shares will vary with changes in
market conditions. Shares may be worth more or less than their original cost when they are sold in the market or redeemed. Performance for
certain funds may reflect a waiver of a portion of the unitary advisory fee. Without such waiver, performance would have been lower. The
gross expense ratio of the Fund, as stated in the fee table of the prospectus dated December 18, 2020, was 0.14%, and may differ from the
expense ratio disclosed in the Financial Highlights table in this report.
The Fund’s net asset value or “NAV” is calculated by dividing the value of the Fund’s total assets less total liabilities by the number of sharesoutstanding. The price used to calculate market return (“Market Price”) is determined by using the midpoint between the highest bid and thelowest offer on the primary stock exchange on which shares of a fund are listed for trading, as of the time that such fund’s NAV is calculated.Since shares of a fund may not have traded in the secondary market until after the fund’s inception, for the period from inception to the firstday of secondary trading, the NAV of the fund is used as a proxy for the Market Price to calculate market returns. Market and NAV returnsassume that dividends and capital gain distributions have been reinvested at Market Price and NAV, respectively.
An index is a statistical composite that tracks a specified financial market or sector. Unlike a fund, an index does not actually hold a portfolio ofsecurities and therefore does not incur the expenses incurred by a fund. These expenses negatively impact fund performance. Also, marketreturns do not include brokerage commissions that may be payable on secondary market transactions. If brokerage commissions wereincluded, market returns would be lower.
8
DBX ETF Trust
Performance Summary (Unaudited)
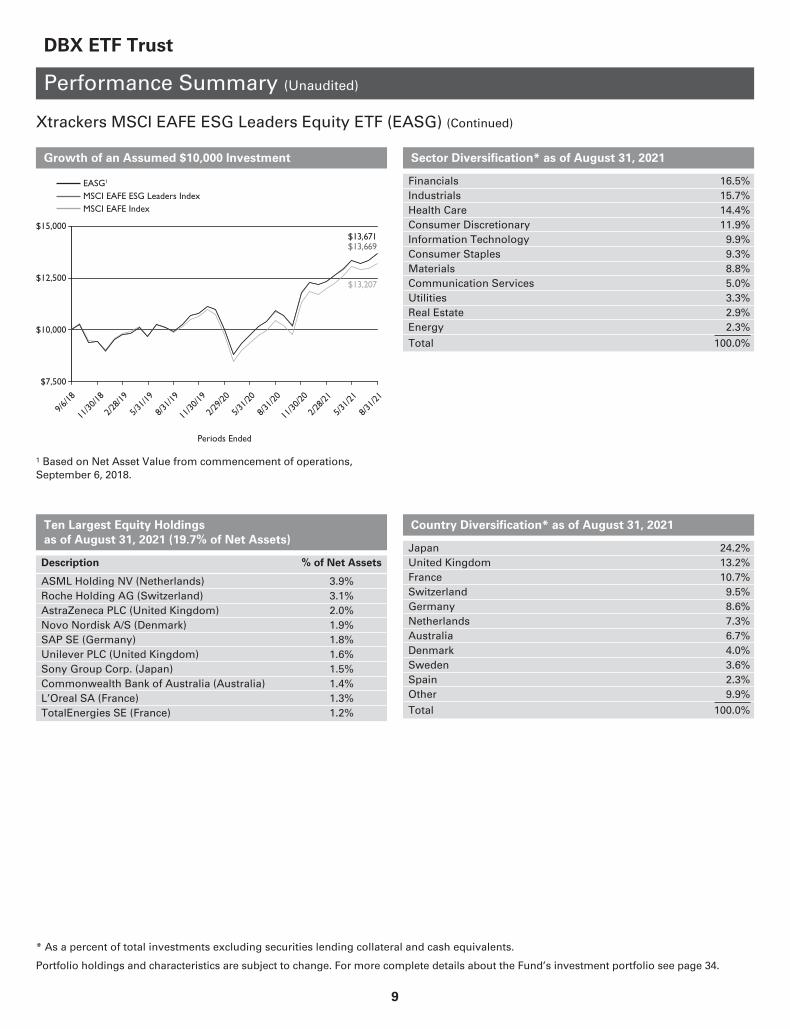
Xtrackers MSCI EAFE ESG Leaders Equity ETF (EASG) (Continued)
Growth of an Assumed $10,000 Investment
$7,500
$10,000
$15,000
$12,500
MSCI EAFE ESG Leaders IndexMSCI EAFE Index
EASG1
11/30
/18
2/28/1
9
5/31/1
9
$13,207
$13,669$13,671
Periods Ended
9/6/18
8/31/2
1
8/31/2
0
8/31/1
9
11/30
/19
2/29/2
0
5/31/2
0
11/30
/20
2/28/2
1
5/31/2
1
1 Based on Net Asset Value from commencement of operations,September 6, 2018.
Sector Diversification* as of August 31, 2021
Financials 16.5%Industrials 15.7%Health Care 14.4%Consumer Discretionary 11.9%Information Technology 9.9%Consumer Staples 9.3%Materials 8.8%Communication Services 5.0%Utilities 3.3%Real Estate 2.9%Energy 2.3%
Total 100.0%
Ten Largest Equity Holdings
as of August 31, 2021 (19.7% of Net Assets)
Description % of Net Assets
ASML Holding NV (Netherlands) 3.9%Roche Holding AG (Switzerland) 3.1%AstraZeneca PLC (United Kingdom) 2.0%Novo Nordisk A/S (Denmark) 1.9%SAP SE (Germany) 1.8%Unilever PLC (United Kingdom) 1.6%Sony Group Corp. (Japan) 1.5%Commonwealth Bank of Australia (Australia) 1.4%L’Oreal SA (France) 1.3%TotalEnergies SE (France) 1.2%
Country Diversification* as of August 31, 2021
Japan 24.2%United Kingdom 13.2%France 10.7%Switzerland 9.5%Germany 8.6%Netherlands 7.3%Australia 6.7%Denmark 4.0%Sweden 3.6%Spain 2.3%Other 9.9%
Total 100.0%
* As a percent of total investments excluding securities lending collateral and cash equivalents.
Portfolio holdings and characteristics are subject to change. For more complete details about the Fund’s investment portfolio see page 34.
9

DBX ETF Trust
Performance Summary (Unaudited)
Xtrackers MSCI Emerging Markets ESG Leaders Equity ETF (EMSG)The Xtrackers MSCI Emerging Markets ESG Leaders Equity ETF (the “Fund”), using a “passive” or indexing investment approach, seeksinvestment results that correspond generally to the performance, before fees and expenses, of the MSCI Emerging Markets ESG Leaders Index(the “Underlying Index”). The Underlying Index is a capitalization weighted index that provides exposure to companies with highenvironmental, social and governance (“ESG”) performance relative to their sector peers and consists of large- and medium-capitalizationcompanies across emerging markets countries. It is not possible to invest directly into an index.
Performance as of August 31, 2021
Average Annual Total Return
Net Asset Value Market Value
MSCI EmergingMarkets ESGLeaders Index
MSCI EmergingMarkets Index
One Year 18.43% 18.09% 18.74% 21.12%
Since Inception1 13.73% 13.71% 14.08% 12.33%
Cumulative Total Returns
Net Asset Value Market Value
MSCI EmergingMarkets ESGLeaders Index
MSCI EmergingMarkets Index
One Year 18.43% 18.09% 18.74% 21.12%
Since Inception1 42.26% 42.25% 43.52% 37.55%
1 Total returns are calculated based on the commencement of operations, December 6, 2018 (“Inception”).
Past performance is no guarantee of future results. Current performance may be lower or higher than the performance dataquoted. Performance data current to the most recent month-end is available at www.Xtrackers.com. Performance resultsassume reinvestment of all dividends and capital gain distributions and do not reflect the deduction of taxes that ashareholder would pay on fund distributions or on the sale of fund shares or redemption of fund creation units. Theinvestment return and principal value of shares will vary with changes in market conditions. Shares may be worth more orless than their original cost when they are sold in the market or redeemed. Performance for certain funds may reflect awaiver of a portion of the unitary advisory fee. Without such waiver, performance would have been lower. The gross expenseratio of the Fund, as stated in the fee table of the prospectus dated December 18, 2020, was 0.20%, and may differ from theexpense ratio disclosed in the Financial Highlights table in this report.
The Fund’s net asset value or “NAV” is calculated by dividing the value of the Fund’s total assets less total liabilities by the number of sharesoutstanding. The price used to calculate market return (“Market Price”) is determined by using the midpoint between the highest bid and thelowest offer on the primary stock exchange on which shares of a fund are listed for trading, as of the time that such fund’s NAV is calculated.Since shares of a fund may not have traded in the secondary market until after the fund’s inception, for the period from inception to the firstday of secondary trading, the NAV of the fund is used as a proxy for the Market Price to calculate market returns. Market and NAV returnsassume that dividends and capital gain distributions have been reinvested at Market Price and NAV, respectively.
An index is a statistical composite that tracks a specified financial market or sector. Unlike a fund, an index does not actually hold a portfolio ofsecurities and therefore does not incur the expenses incurred by a fund. These expenses negatively impact fund performance. Also, marketreturns do not include brokerage commissions that may be payable on secondary market transactions. If brokerage commissions wereincluded, market returns would be lower.
10

DBX ETF Trust
Performance Summary (Unaudited)
Xtrackers MSCI Emerging Markets ESG Leaders Equity ETF (EMSG) (Continued)
Growth of an Assumed $10,000 Investment
$7,500
$10,000
$17,500
$15,000
$12,500
MSCI Emerging Markets ESG Leaders IndexMSCI Emerging Markets Index
EMSG1
$13,755$14,226
$14,352
Periods Ended
12/6/
18
8/31/2
1
2/28/1
9
5/31/1
9
8/31/2
0
8/31/1
9
11/30
/19
2/29/2
0
5/31/2
0
11/30
/20
2/28/2
1
5/31/2
1
1 Based on Net Asset Value from commencement of operations,December 6, 2018.
Sector Diversification* as of August 31, 2021
Information Technology 20.9%Consumer Discretionary 19.1%Financials 17.6%Communication Services 12.4%Materials 6.9%Energy 5.4%Consumer Staples 5.3%Health Care 4.5%Industrials 4.4%Real Estate 2.0%Utilities 1.5%
Total 100.0%
Ten Largest Equity Holdings
as of August 31, 2021 (38.4% of Net Assets)
Description % of Net Assets
Taiwan Semiconductor Manufacturing Co. Ltd.(Taiwan) 11.9%
Tencent Holdings Ltd. (China) 7.8%Alibaba Group Holding Ltd. (China) 7.0%Meituan (China) 2.8%Reliance Industries Ltd. (India) 1.9%Infosys Ltd. (India) 1.7%China Construction Bank Corp. (China) 1.5%Housing Development Finance Corp. Ltd. (India) 1.4%Wuxi Biologics Cayman, Inc. (China) 1.2%NIO, Inc. (China) 1.2%
Country Diversification* as of August 31, 2021
China 33.3%Taiwan 21.2%India 11.8%South Korea 7.6%South Africa 4.7%Brazil 3.1%Russia 3.0%Thailand 2.2%Hong Kong 2.2%Other 10.9%
Total 100.0%
* As a percent of total investments excluding exchange-traded funds, securities lending collateral and cash equivalents.
Portfolio holdings and characteristics are subject to change. For more complete details about the Fund’s investment portfolio see page 40.
11

DBX ETF Trust
Performance Summary (Unaudited)
Xtrackers MSCI USA ESG Leaders Equity ETF (USSG)Xtrackers MSCI USA ESG Leaders Equity ETF (the “Fund”), using a “passive” or indexing investment approach, seeks investment results thatcorrespond generally to the performance, before fees and expenses, of the MSCI USA ESG Leaders Index (the “Underlying Index”). TheUnderlying Index is a capitalization weighted index that provides exposure to companies with high environmental, social and governance(“ESG”) performance relative to their sector peers and consists of large- and medium-capitalization companies in the U.S. market. The S&P500 Index or the Standard & Poor’s 500 Index is a market-capitalization-weighted index of the 500 largest U.S. publicly traded companies. It isnot possible to invest directly into an index.
Performance as of August 31, 2021
Average Annual Total Return
Net Asset Value Market ValueMSCI USA ESGLeaders Index S&P 500 Index
One Year 33.48% 33.60% 33.59% 31.17%
Since Inception1 24.88% 24.86% 24.95% 23.91%
Cumulative Total Returns
Net Asset Value Market ValueMSCI USA ESGLeaders Index S&P 500 Index
One Year 33.48% 33.60% 33.59% 31.17%
Since Inception1 73.79% 73.83% 74.16% 70.55%
1 Total returns are calculated based on the commencement of operations, March 7, 2019 (“Inception”).
Past performance is no guarantee of future results. Current performance may be lower or higher than the performance dataquoted. Performance data current to the most recent month-end is available at www.Xtrackers.com. Performance resultsassume reinvestment of all dividends and capital gain distributions and do not reflect the deduction of taxes that ashareholder would pay on fund distributions or on the sale of fund shares or redemption of fund creation units. Theinvestment return and principal value of shares will vary with changes in market conditions. Shares may be worth more orless than their original cost when they are sold in the market or redeemed. Performance for certain funds may reflect awaiver of a portion of the unitary advisory fee. Without such waiver, performance would have been lower. The gross expenseratio of the Fund, as stated in the fee table of the prospectus dated December 18, 2020, was 0.10%, and may differ from theexpense ratio disclosed in the Financial Highlights table in this report.
The Fund’s net asset value or “NAV” is calculated by dividing the value of the Fund’s total assets less total liabilities by the number of sharesoutstanding. The price used to calculate market return (“Market Price”) is determined by using the midpoint between the highest bid and thelowest offer on the primary stock exchange on which shares of a fund are listed for trading, as of the time that such fund’s NAV is calculated.Since shares of a fund may not have traded in the secondary market until after the fund’s inception, for the period from inception to the firstday of secondary trading, the NAV of the fund is used as a proxy for the Market Price to calculate market returns. Market and NAV returnsassume that dividends and capital gain distributions have been reinvested at Market Price and NAV, respectively.
An index is a statistical composite that tracks a specified financial market or sector. Unlike a fund, an index does not actually hold a portfolio ofsecurities and therefore does not incur the expenses incurred by a fund. These expenses negatively impact fund performance. Also, marketreturns do not include brokerage commissions that may be payable on secondary market transactions. If brokerage commissions wereincluded, market returns would be lower.
12

DBX ETF Trust
Performance Summary (Unaudited)
Xtrackers MSCI USA ESG Leaders Equity ETF (USSG) (Continued)
Growth of an Assumed $10,000 Investment
$5,000
$10,000
$15,000
$20,000
MSCI USA ESG Leaders IndexS&P 500 Index
USSG1
8/31/1
9
11/30
/19
$17,055
$17,379$17,416
3/7/19
8/31/2
1
8/31/2
0
11/30
/20
2/28/2
1
5/31/2
1
5/31/2
0
2/29/2
0
5/31/1
9
Periods Ended
1 Based on Net Asset Value from commencement of operations,March 7, 2019.
Sector Diversification* as of August 31, 2021
Information Technology 29.0%Health Care 13.5%Consumer Discretionary 12.3%Communication Services 12.0%Financials 11.1%Industrials 8.4%Consumer Staples 5.9%Materials 2.9%Real Estate 2.8%Energy 1.1%Utilities 1.0%
Total 100.0%
Ten Largest Equity Holdings
as of August 31, 2021 (35.2% of Net Assets)
Description % of Net Assets
Microsoft Corp. 10.6%Alphabet, Inc. 8.4%Tesla, Inc. 2.9%NVIDIA Corp. 2.7%Johnson & Johnson 2.2%Visa, Inc. 1.9%Procter & Gamble Co. 1.7%Home Depot, Inc. 1.7%Walt Disney Co. 1.6%Adobe, Inc. 1.5%
* As a percent of total investments excluding securities lending collateral and cash equivalents.
Portfolio holdings and characteristics are subject to change. For more complete details about the Fund’s investment portfolio see page 48.
13
DBX ETF Trust
Performance Summary (Unaudited)
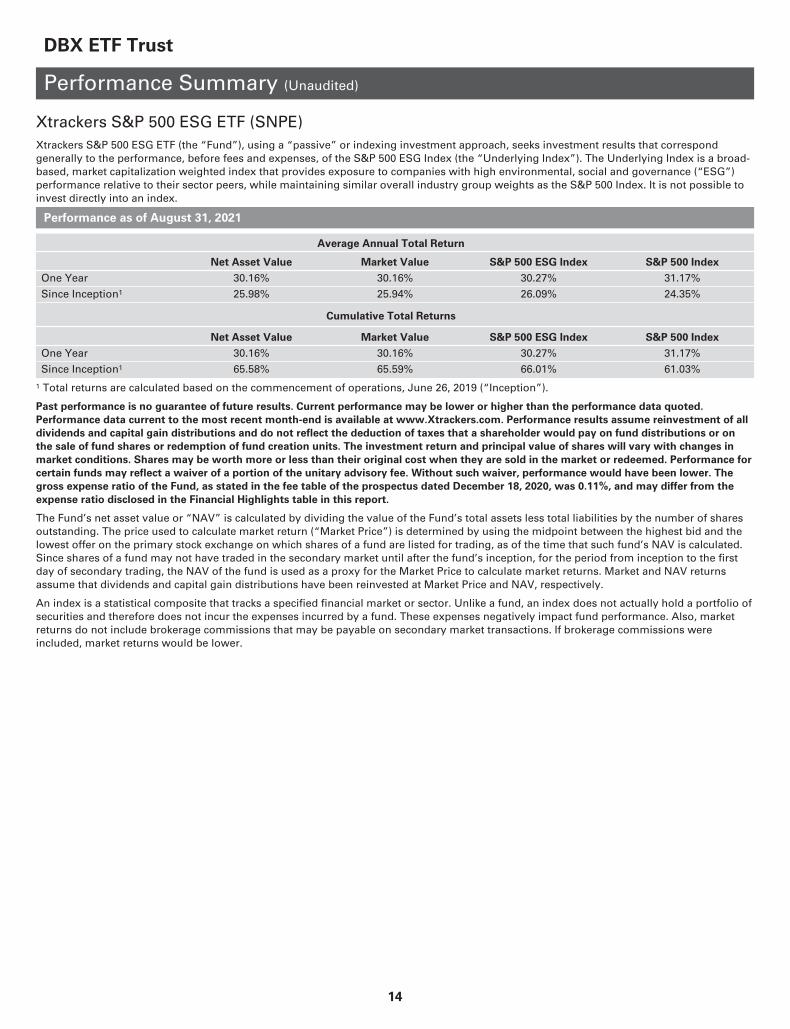
Xtrackers S&P 500 ESG ETF (SNPE)Xtrackers S&P 500 ESG ETF (the “Fund”), using a “passive” or indexing investment approach, seeks investment results that correspondgenerally to the performance, before fees and expenses, of the S&P 500 ESG Index (the “Underlying Index”). The Underlying Index is a broad-based, market capitalization weighted index that provides exposure to companies with high environmental, social and governance (“ESG”)performance relative to their sector peers, while maintaining similar overall industry group weights as the S&P 500 Index. It is not possible toinvest directly into an index.
Performance as of August 31, 2021
Average Annual Total Return
Net Asset Value Market Value S&P 500 ESG Index S&P 500 Index
One Year 30.16% 30.16% 30.27% 31.17%
Since Inception1 25.98% 25.94% 26.09% 24.35%
Cumulative Total Returns
Net Asset Value Market Value S&P 500 ESG Index S&P 500 Index
One Year 30.16% 30.16% 30.27% 31.17%
Since Inception1 65.58% 65.59% 66.01% 61.03%
1 Total returns are calculated based on the commencement of operations, June 26, 2019 (“Inception”).
Past performance is no guarantee of future results. Current performance may be lower or higher than the performance data quoted.
Performance data current to the most recent month-end is available at www.Xtrackers.com. Performance results assume reinvestment of all
dividends and capital gain distributions and do not reflect the deduction of taxes that a shareholder would pay on fund distributions or on
the sale of fund shares or redemption of fund creation units. The investment return and principal value of shares will vary with changes in
market conditions. Shares may be worth more or less than their original cost when they are sold in the market or redeemed. Performance for
certain funds may reflect a waiver of a portion of the unitary advisory fee. Without such waiver, performance would have been lower. The
gross expense ratio of the Fund, as stated in the fee table of the prospectus dated December 18, 2020, was 0.11%, and may differ from the
expense ratio disclosed in the Financial Highlights table in this report.
The Fund’s net asset value or “NAV” is calculated by dividing the value of the Fund’s total assets less total liabilities by the number of sharesoutstanding. The price used to calculate market return (“Market Price”) is determined by using the midpoint between the highest bid and thelowest offer on the primary stock exchange on which shares of a fund are listed for trading, as of the time that such fund’s NAV is calculated.Since shares of a fund may not have traded in the secondary market until after the fund’s inception, for the period from inception to the firstday of secondary trading, the NAV of the fund is used as a proxy for the Market Price to calculate market returns. Market and NAV returnsassume that dividends and capital gain distributions have been reinvested at Market Price and NAV, respectively.
An index is a statistical composite that tracks a specified financial market or sector. Unlike a fund, an index does not actually hold a portfolio ofsecurities and therefore does not incur the expenses incurred by a fund. These expenses negatively impact fund performance. Also, marketreturns do not include brokerage commissions that may be payable on secondary market transactions. If brokerage commissions wereincluded, market returns would be lower.
14

DBX ETF Trust
Performance Summary (Unaudited)
Xtrackers S&P 500 ESG ETF (SNPE) (Continued)
Growth of an Assumed $10,000 Investment
$6,000
$10,000
$14,000
$18,000
S&P 500 ESG IndexS&P 500 Index
SNPE1
$16,103
$16,558$16,601
Periods Ended
6/26/1
9
8/31/2
1
8/31/2
0
11/30
/20
2/28/2
1
5/31/2
1
2/29/2
0
5/31/2
0
11/30
/19
8/31/1
9
1 Based on Net Asset Value from commencement of operations,June 26, 2019.
Sector Diversification* as of August 31, 2021
Information Technology 30.8%Consumer Discretionary 13.7%Health Care 12.9%Financials 10.6%Communication Services 10.5%Industrials 6.9%Consumer Staples 5.3%Energy 2.7%Real Estate 2.6%Materials 2.5%Utilities 1.5%
Total 100.0%
Ten Largest Equity Holdings
as of August 31, 2021 (36.5% of Net Assets)
Description % of Net Assets
Apple, Inc. 8.2%Microsoft Corp. 7.8%Alphabet, Inc. 5.9%Amazon.com, Inc. 5.1%Tesla, Inc. 2.0%NVIDIA Corp. 1.9%JPMorgan Chase & Co. 1.7%UnitedHealth Group, Inc. 1.4%Visa, Inc. 1.3%Procter & Gamble Co. 1.2%
* As a percent of total investments excluding securities lending collateral and cash equivalents.
Portfolio holdings and characteristics are subject to change. For more complete details about the Fund’s investment portfolio see page 52.
15

DBX ETF Trust
Performance Summary (Unaudited)
Xtrackers S&P MidCap 400 ESG ETF (MIDE)Xtrackers S&P MidCap 400 ESG ETF (the “Fund”), using a “passive” or indexing investment approach, seeks investment results thatcorrespond generally to the performance, before fees and expenses, of the S&P MidCap 400 ESG Index (the “Underlying Index”). TheUnderlying Index is a broad-based, market capitalization weighted index that provides exposure to companies with high environmental, socialand governance (“ESG”) performance relative to their sector peers, while maintaining similar overall industry group weights as the S&PMidCap 400 Index. It is not possible to invest directly into an index.
Performance as of August 31, 2021
Cumulative Total Returns
Net Asset Value Market ValueS&P MidCap 400 ESG
IndexS&P MidCap 400
Index
Since Inception1 9.92% 9.92% 10.01% 9.49%
1 Total returns are calculated based on the commencement of operations, February 24, 2021 (“Inception”).
Past performance is no guarantee of future results. Current performance may be lower or higher than the performance data quoted.
Performance data current to the most recent month-end is available at www.Xtrackers.com. Performance results assume reinvestment of all
dividends and capital gain distributions and do not reflect the deduction of taxes that a shareholder would pay on fund distributions or on
the sale of fund shares or redemption of fund creation units. The investment return and principal value of shares will vary with changes in
market conditions. Shares may be worth more or less than their original cost when they are sold in the market or redeemed. Performance for
certain funds may reflect a waiver of a portion of the unitary advisory fee. Without such waiver, performance would have been lower. The
gross expense ratio of the Fund, as stated in the fee table of the prospectus dated January 26, 2021, was 0.15%, and may differ from the
expense ratio disclosed in the Financial Highlights table in this report.
The Fund’s net asset value or “NAV” is calculated by dividing the value of the Fund’s total assets less total liabilities by the number of sharesoutstanding. The price used to calculate market return (“Market Price”) is determined by using the midpoint between the highest bid and thelowest offer on the primary stock exchange on which shares of a fund are listed for trading, as of the time that such fund’s NAV is calculated.Since shares of a fund may not have traded in the secondary market until after the fund’s inception, for the period from inception to the firstday of secondary trading, the NAV of the fund is used as a proxy for the Market Price to calculate market returns. Market and NAV returnsassume that dividends and capital gain distributions have been reinvested at Market Price and NAV, respectively.
An index is a statistical composite that tracks a specified financial market or sector. Unlike a fund, an index does not actually hold a portfolio ofsecurities and therefore does not incur the expenses incurred by a fund. These expenses negatively impact fund performance. Also, marketreturns do not include brokerage commissions that may be payable on secondary market transactions. If brokerage commissions wereincluded, market returns would be lower.
16

DBX ETF Trust
Performance Summary (Unaudited)
Xtrackers S&P MidCap 400 ESG ETF (MIDE) (Continued)
Growth of an Assumed $10,000 Investment
$8,000
$10,000
$12,000
S&P MidCap 400 ESG IndexS&P MidCap 400 Index
MIDE1
$10,949
$10,992$11,001
Periods Ended
2/24/2
1
8/31/2
1
5/31/2
1
6/30/2
1
7/31/2
1
3/31/2
1
2/28/2
1
4/30/2
1
1 Based on Net Asset Value from commencement of operations,February 24, 2021.
Sector Diversification* as of August 31, 2021
Industrials 18.8%Financials 16.5%Consumer Discretionary 15.5%Information Technology 14.5%Real Estate 10.5%Health Care 9.3%Materials 7.1%Consumer Staples 3.2%Communication Services 2.1%Energy 1.3%Utilities 1.2%
Total 100.0%
Ten Largest Equity Holdings
as of August 31, 2021 (8.9% of Net Assets)
Description % of Net Assets
Molina Healthcare, Inc. 1.0%Cognex Corp. 0.9%SolarEdge Technologies, Inc. 0.9%Signature Bank 0.9%Ceridian HCM Holding, Inc. 0.9%Camden Property Trust 0.9%FactSet Research Systems, Inc. 0.9%Williams-Sonoma, Inc. 0.9%Masimo Corp. 0.8%Brown & Brown, Inc. 0.8%
* As a percent of total investments excluding securities lending collateral and cash equivalents.
Portfolio holdings and characteristics are subject to change. For more complete details about the Fund’s investment portfolio see page 57.
17

DBX ETF Trust
Performance Summary (Unaudited)
Xtrackers S&P SmallCap 600 ESG ETF (SMLE)Xtrackers S&P SmallCap 600 ESG ETF (the “Fund”), using a “passive” or indexing investment approach, seeks investment results thatcorrespond generally to the performance, before fees and expenses, of the S&P SmallCap 600 ESG Index (the “Underlying Index”). TheUnderlying Index is a broad-based, market capitalization weighted index that provides exposure to companies with high environmental, socialand governance (“ESG”) performance relative to their sector peers, while maintaining similar overall industry group weights as the S&PSmallCap 600 Index. It is not possible to invest directly into an index.
Performance as of August 31, 2021
Cumulative Total Returns
Net Asset Value Market ValueS&P SmallCap 600
ESG IndexS&P SmallCap 600
Index
Since Inception1 7.01% 7.01% 7.10% 6.73%
1 Total returns are calculated based on the commencement of operations, February 24, 2021 (“Inception”).
Past performance is no guarantee of future results. Current performance may be lower or higher than the performance data quoted.
Performance data current to the most recent month-end is available at www.Xtrackers.com. Performance results assume reinvestment of all
dividends and capital gain distributions and do not reflect the deduction of taxes that a shareholder would pay on fund distributions or on
the sale of fund shares or redemption of fund creation units. The investment return and principal value of shares will vary with changes in
market conditions. Shares may be worth more or less than their original cost when they are sold in the market or redeemed. Performance for
certain funds may reflect a waiver of a portion of the unitary advisory fee. Without such waiver, performance would have been lower. The
gross expense ratio of the Fund, as stated in the fee table of the prospectus dated January 26, 2021, was 0.15%, and may differ from the
expense ratio disclosed in the Financial Highlights table in this report.
The Fund’s net asset value or “NAV” is calculated by dividing the value of the Fund’s total assets less total liabilities by the number of sharesoutstanding. The price used to calculate market return (“Market Price”) is determined by using the midpoint between the highest bid and thelowest offer on the primary stock exchange on which shares of a fund are listed for trading, as of the time that such fund’s NAV is calculated.Since shares of a fund may not have traded in the secondary market until after the fund’s inception, for the period from inception to the firstday of secondary trading, the NAV of the fund is used as a proxy for the Market Price to calculate market returns. Market and NAV returnsassume that dividends and capital gain distributions have been reinvested at Market Price and NAV, respectively.
An index is a statistical composite that tracks a specified financial market or sector. Unlike a fund, an index does not actually hold a portfolio ofsecurities and therefore does not incur the expenses incurred by a fund. These expenses negatively impact fund performance. Also, marketreturns do not include brokerage commissions that may be payable on secondary market transactions. If brokerage commissions wereincluded, market returns would be lower.
18

DBX ETF Trust
Performance Summary (Unaudited)
Xtrackers S&P SmallCap 600 ESG ETF (SMLE) (Continued)
Growth of an Assumed $10,000 Investment
$8,000
$10,000
$12,000
S&P SmallCap 600 ESG IndexS&P SmallCap 600 Index
SMLE1
$10,673
$10,701$10,710
Periods Ended
2/24/2
1
8/31/2
1
5/31/2
1
6/30/2
1
7/31/2
1
3/31/2
1
2/28/2
1
4/30/2
1
1 Based on Net Asset Value from commencement of operations,February 24, 2021.
Sector Diversification* as of August 31, 2021
Industrials 18.1%Financials 17.6%Information Technology 15.4%Consumer Discretionary 14.3%Health Care 12.3%Real Estate 8.3%Materials 5.2%Consumer Staples 4.0%Energy 2.7%Communication Services 1.3%Utilities 0.8%
Total 100.0%
Ten Largest Equity Holdings
as of August 31, 2021 (7.9% of Net Assets)
Description % of Net Assets
Macy’s, Inc. 0.9%Chart Industries, Inc. 0.9%Omnicell, Inc. 0.9%Power Integrations, Inc. 0.9%Exponent, Inc. 0.8%MicroStrategy, Inc. 0.7%AMN Healthcare Services, Inc. 0.7%Agree Realty Corp. 0.7%Watts Water Technologies, Inc. 0.7%SPS Commerce, Inc. 0.7%
* As a percent of total investments excluding securities lending collateral and cash equivalents.
Portfolio holdings and characteristics are subject to change. For more complete details about the Fund’s investment portfolio see page 61.
19

DBX ETF Trust
Fees and Expenses (Unaudited)
As a shareholder of one or more of the Funds, you incur two types of costs: (1) transaction costs, includingbrokerage commissions paid on purchases and sales of fund shares, and (2) ongoing costs, includingmanagement fees and other Fund expenses. In the most recent six-month period the Funds limited theseexpenses; had they not done so, expenses would have been higher. The expense examples below are intended tohelp you understand your ongoing costs (in dollars) of investing in the Funds and to compare these costs with theongoing costs of investing in other funds.
The examples in the tables are based on an investment of $1,000 invested at the beginning of the period andheld for the entire period (March 1, 2021 to August 31, 2021).
Actual expenses
The first line in the following tables provides information about actual account values and actual expenses.You may use the information in this line, together with the amount you invested, to estimate the expenses thatyou paid over the period. Simply divide your account value by $1,000 (for example, an $8,600 account valuedivided by $1,000 = 8.6), then multiply the result by the number in the first line under the heading “Expenses PaidDuring the Period” to estimate the expenses you paid on your account during this period.
Hypothetical example for comparison purposes
The second line in the following tables provides information about hypothetical account values and hypotheticalexpenses based on the Funds’ actual expense ratios and an assumed rate of return of 5% per year before expenses(which is not the Funds’ actual return). The hypothetical account values and expenses may not be used to estimate theactual ending account balance or expenses you paid for the period. You may use this information to compare theongoing costs of investing in the Fund and other funds. To do so, compare this 5% hypothetical example with the 5%hypothetical examples that appear in the shareholder reports of the other funds.
Please note that the expenses shown in the tables are meant to highlight your ongoing costs only, and donot reflect any transactional costs. Therefore the second line in the table is useful in comparing ongoing costsonly, and will not help you determine the relative total costs of owning different funds. In addition, if thesetransactional costs were included, your costs would have been higher.
BeginningAccount ValueMarch 1, 2021
EndingAccount Value
August 31, 2021Annualized
Expense Ratio
Expenses PaidDuring the Period(1)
Per $1,000
Xtrackers Emerging Markets Carbon Reduction and Climate Improvers ETF
Actual . . . . . . . . . . . . . . . . . . . . . . . . . . . . . . . . . . . . . $1,000.00 $1,098.90 0.16% $0.82Hypothetical (5% return before expenses) . . . . . . $1,000.00 $1,024.43 0.16% $0.79
Xtrackers MSCI EAFE ESG Leaders Equity ETF
Actual . . . . . . . . . . . . . . . . . . . . . . . . . . . . . . . . . . . . . $1,000.00 $1,109.30 0.14% $0.74Hypothetical (5% return before expenses) . . . . . . $1,000.00 $1,024.50 0.14% $0.71
Xtrackers MSCI Emerging Markets ESG Leaders Equity ETF
Actual . . . . . . . . . . . . . . . . . . . . . . . . . . . . . . . . . . . . . $1,000.00 $ 989.20 0.20% $1.01Hypothetical (5% return before expenses) . . . . . . $1,000.00 $1,024.19 0.20% $1.03
Xtrackers MSCI USA ESG Leaders Equity ETF
Actual . . . . . . . . . . . . . . . . . . . . . . . . . . . . . . . . . . . . . $1,000.00 $1,207.60 0.09% $0.50Hypothetical (5% return before expenses) . . . . . . $1,000.00 $1,024.75 0.09% $0.46
Xtrackers S&P 500 ESG ETF
Actual . . . . . . . . . . . . . . . . . . . . . . . . . . . . . . . . . . . . . $1,000.00 $1,206.10 0.10% $0.56Hypothetical (5% return before expenses) . . . . . . $1,000.00 $1,024.70 0.10% $0.51
Xtrackers S&P MidCap 400 ESG ETF
Actual . . . . . . . . . . . . . . . . . . . . . . . . . . . . . . . . . . . . . $1,000.00 $1,114.30 0.15% $0.80Hypothetical (5% return before expenses) . . . . . . $1,000.00 $1,024.45 0.15% $0.77
Xtrackers S&P SmallCap 600 ESG ETF
Actual . . . . . . . . . . . . . . . . . . . . . . . . . . . . . . . . . . . . . $1,000.00 $1,078.30 0.15% $0.79Hypothetical (5% return before expenses) . . . . . . $1,000.00 $1,024.45 0.15% $0.77
(1) Expenses are equal to each Fund’s annualized expense ratio, multiplied by the average account value over the period, multiplied by 184
(the number of days in the most recent six-month period), then divided by 365.
20

DBX ETF Trust
Schedule of Investments
Xtrackers Emerging Markets Carbon Reduction and Climate Improvers ETFAugust 31, 2021
Numberof Shares Value
COMMON STOCKS — 97.7%
Argentina — 0.0%
Despegar.com Corp.* (a) . . . . . . . . . . . . . . . . . 4,860 $ 58,271Grupo Financiero Galicia SA, ADR . . . . . . . . 9,725 104,836Telecom Argentina SA, ADR . . . . . . . . . . . . . 12,010 67,376
(Cost $219,693) . . . . . . . . . . . . . . . . . . . . . . . . . 230,483
Brazil — 3.2%
Ambev SA . . . . . . . . . . . . . . . . . . . . . . . . . . . . . 251,903 841,391Americanas SA* . . . . . . . . . . . . . . . . . . . . . . . . 32,935 266,076Atacadao SA . . . . . . . . . . . . . . . . . . . . . . . . . . . 14,300 50,697B3 SA — Brasil Bolsa Balcao . . . . . . . . . . . . . 582,206 1,600,070Banco Bradesco SA . . . . . . . . . . . . . . . . . . . . . 128,782 501,590Banco BTG Pactual SA . . . . . . . . . . . . . . . . . . . 113,857 628,492Banco do Brasil SA . . . . . . . . . . . . . . . . . . . . . . 82,177 488,450Banco Inter SA . . . . . . . . . . . . . . . . . . . . . . . . . 34,137 452,022Banco Santander Brasil SA . . . . . . . . . . . . . . . 32,709 267,956BB Seguridade Participacoes SA . . . . . . . . . . 66,448 247,385BRF SA* . . . . . . . . . . . . . . . . . . . . . . . . . . . . . . . 32,937 150,674CCR SA . . . . . . . . . . . . . . . . . . . . . . . . . . . . . . . . 40,712 97,415Cia de Saneamento Basico do Estado deSao Paulo . . . . . . . . . . . . . . . . . . . . . . . . . . . . . 20,303 143,284
Cia Siderurgica Nacional SA . . . . . . . . . . . . . 25,737 175,248Cielo SA . . . . . . . . . . . . . . . . . . . . . . . . . . . . . . . 109,852 61,583Energisa SA . . . . . . . . . . . . . . . . . . . . . . . . . . . . 17,730 153,662Equatorial Energia SA . . . . . . . . . . . . . . . . . . . 31,220 155,199Hapvida Participacoes e Investimentos SA,144A . . . . . . . . . . . . . . . . . . . . . . . . . . . . . . . . . 79,313 228,045
Hypera SA . . . . . . . . . . . . . . . . . . . . . . . . . . . . . 28,307 196,674Itau Unibanco Holding SA . . . . . . . . . . . . . . . 42,145 235,687Klabin SA* . . . . . . . . . . . . . . . . . . . . . . . . . . . . . 37,854 194,536Localiza Rent a Car SA . . . . . . . . . . . . . . . . . . . 34,137 369,806Lojas Renner SA . . . . . . . . . . . . . . . . . . . . . . . . 55,868 415,337Magazine Luiza SA . . . . . . . . . . . . . . . . . . . . . . 158,000 562,924Multiplan Empreendimentos ImobiliariosSA . . . . . . . . . . . . . . . . . . . . . . . . . . . . . . . . . . . 21,157 87,198
Natura & Co. Holding SA* . . . . . . . . . . . . . . . 85,263 859,700Notre Dame Intermedica ParticipacoesSA . . . . . . . . . . . . . . . . . . . . . . . . . . . . . . . . . . . 42,714 666,964
Pagseguro Digital Ltd., Class A* (a) . . . . . . . 15,442 918,336Raia Drogasil SA . . . . . . . . . . . . . . . . . . . . . . . . 111,854 558,445Rede D’Or Sao Luiz SA, 144A . . . . . . . . . . . . . 59,586 800,990Rumo SA* . . . . . . . . . . . . . . . . . . . . . . . . . . . . . 124,493 455,218Sendas Distribuidora SA . . . . . . . . . . . . . . . . . 63,589 208,794StoneCo Ltd., Class A* . . . . . . . . . . . . . . . . . . 12,012 559,038Suzano SA* . . . . . . . . . . . . . . . . . . . . . . . . . . . . 44,718 532,820Telefonica Brasil SA . . . . . . . . . . . . . . . . . . . . . 24,589 210,033TIM SA . . . . . . . . . . . . . . . . . . . . . . . . . . . . . . . . 33,223 80,858Via S/A* . . . . . . . . . . . . . . . . . . . . . . . . . . . . . . . 118,434 240,359WEG SA . . . . . . . . . . . . . . . . . . . . . . . . . . . . . . . 83,318 578,720XP, Inc., Class A* . . . . . . . . . . . . . . . . . . . . . . . 11,438 556,459
(Cost $15,657,905) . . . . . . . . . . . . . . . . . . . . . . 15,798,135
Chile — 0.3%
Banco de Chile . . . . . . . . . . . . . . . . . . . . . . . . . 2,628,237 256,465Banco de Credito e Inversiones SA . . . . . . . . 6,003 259,664Banco Santander Chile . . . . . . . . . . . . . . . . . . 6,352,322 335,178Cencosud SA . . . . . . . . . . . . . . . . . . . . . . . . . . . 78,746 148,357
Numberof Shares Value
Chile (Continued)
Cencosud Shopping SA . . . . . . . . . . . . . . . . . 25,000 $ 35,486Empresas CMPC SA . . . . . . . . . . . . . . . . . . . . . 61,859 137,216Falabella SA . . . . . . . . . . . . . . . . . . . . . . . . . . . . 50,148 198,340
(Cost $1,338,086) . . . . . . . . . . . . . . . . . . . . . . . . 1,370,706
China — 34.0%
360 Security Technology, Inc., . . . . . . . . . . . .Class A* . . . . . . . . . . . . . . . . . . . . . . . . . . . . . . . 23,500 43,34351job, Inc., ADR* (a) . . . . . . . . . . . . . . . . . . . . . 3,431 263,501AAC Technologies Holdings, Inc. . . . . . . . . . 42,713 238,077Agile Group Holdings Ltd. . . . . . . . . . . . . . . . 56,152 64,402Agricultural Bank of China Ltd., Class A . . . . 476,600 218,651Agricultural Bank of China Ltd., Class H . . . . 2,648,998 888,977Aier Eye Hospital Group Co. Ltd., Class A . . 18,700 122,309Air China Ltd., Class A* . . . . . . . . . . . . . . . . . . 76,800 86,180Air China Ltd., Class H* . . . . . . . . . . . . . . . . . . 144,847 97,218Airtac International Group . . . . . . . . . . . . . . . 4,577 139,555Alibaba Group Holding Ltd., ADR* . . . . . . . . 106,247 17,742,187A-Living Smart City Services Co. Ltd.,144A . . . . . . . . . . . . . . . . . . . . . . . . . . . . . . . . . 49,294 195,215
Aluminum Corp. of China Ltd., Class A* . . . 105,400 127,421Aluminum Corp. of China Ltd., Class H* . . . 249,044 180,602Angang Steel Co. Ltd., Class A . . . . . . . . . . . . 134,500 118,824Angang Steel Co. Ltd., Class H . . . . . . . . . . . . 139,129 106,440Anhui Conch Cement Co. Ltd., Class A . . . . . 28,600 177,132Anhui Conch Cement Co. Ltd., Class H . . . . . 62,729 339,562ANTA Sports Products Ltd. . . . . . . . . . . . . . . . 63,587 1,308,147Autohome, Inc., ADR . . . . . . . . . . . . . . . . . . . . 3,430 151,812Baidu, Inc., ADR* . . . . . . . . . . . . . . . . . . . . . . . 16,300 2,559,426Bank of Beijing Co. Ltd., Class A . . . . . . . . . . 129,600 87,177Bank of China Ltd., Class A . . . . . . . . . . . . . . . 187,300 87,960Bank of China Ltd., Class H . . . . . . . . . . . . . . . 4,719,911 1,656,780Bank of Communications Co. Ltd.,Class A . . . . . . . . . . . . . . . . . . . . . . . . . . . . . . . 288,500 197,639
Bank of Communications Co. Ltd.,Class H . . . . . . . . . . . . . . . . . . . . . . . . . . . . . . . 658,299 378,355
Bank of Jiangsu Co. Ltd., Class A . . . . . . . . . 91,200 90,889Bank of Nanjing Co. Ltd., Class A . . . . . . . . . 52,600 76,471Bank of Ningbo Co. Ltd., Class A . . . . . . . . . . 28,600 143,177Bank of Shanghai Co. Ltd., Class A . . . . . . . . 91,200 101,914Baoshan Iron & Steel Co. Ltd., Class A . . . . . 86,200 136,140BBMG Corp., Class A . . . . . . . . . . . . . . . . . . . . 231,100 97,068BeiGene Ltd., ADR* . . . . . . . . . . . . . . . . . . . . . 4,287 1,321,682Beijing-Shanghai High Speed Railway Co.Ltd., Class A . . . . . . . . . . . . . . . . . . . . . . . . . . . 211,500 155,708
Bilibili, Inc., ADR* (a) . . . . . . . . . . . . . . . . . . . . 13,727 1,101,317BOE Technology Group Co. Ltd., Class A . . 153,700 138,644BYD Co. Ltd., Class A . . . . . . . . . . . . . . . . . . . . 5,700 244,715BYD Co. Ltd., Class H . . . . . . . . . . . . . . . . . . . . 47,292 1,601,665By-health Co. Ltd., Class A . . . . . . . . . . . . . . . 3,000 11,694CanSino Biologics, Inc., Class H, 144A* . . . . 3,717 146,915CGN Power Co. Ltd., Class A . . . . . . . . . . . . . 35,000 14,375CGN Power Co. Ltd., Class H, 144A . . . . . . . . 1,286,326 284,477Changchun High & New TechnologyIndustry Group, Inc., Class A . . . . . . . . . . . . 1,000 39,560
Changzhou Xingyu Automotive LightingSystems Co. Ltd., Class A . . . . . . . . . . . . . . . 2,700 80,983
See Notes to Financial Statements. 21

DBX ETF Trust
Schedule of Investments
Xtrackers Emerging Markets Carbon Reduction and Climate Improvers ETF (Continued)August 31, 2021
Numberof Shares Value
China (Continued)
China Bohai Bank Co. Ltd., Class H, 144A . . 192,887 $ 78,372China Cinda Asset Management Co. Ltd.,Class H . . . . . . . . . . . . . . . . . . . . . . . . . . . . . . . 415,336 73,697
China CITIC Bank Corp. Ltd., Class H . . . . . . 503,513 231,773China Conch Venture Holdings Ltd. . . . . . . . 67,875 277,527China Construction Bank Corp., Class A . . . . 86,200 78,157China Construction Bank Corp., Class H . . . . 8,816,388 6,370,820China Eastern Airlines Corp. Ltd.,Class A* . . . . . . . . . . . . . . . . . . . . . . . . . . . . . . 38,500 28,046
China Everbright Bank Co. Ltd., Class A . . . . 221,200 114,851China Everbright Bank Co. Ltd., Class H . . . . 366,487 131,471China Evergrande Group (a) . . . . . . . . . . . . . . 113,630 63,701China Feihe Ltd., 144A . . . . . . . . . . . . . . . . . . . 88,694 160,570China Galaxy Securities Co. Ltd., Class H . . 233,885 131,417China Hongqiao Group Ltd. . . . . . . . . . . . . . . 137,414 204,954China International Capital Corp. Ltd.,Class H, 144A . . . . . . . . . . . . . . . . . . . . . . . . . . 120,152 279,317
China International Marine ContainersGroup Co. Ltd., Class H . . . . . . . . . . . . . . . . . 36,139 79,180
China Lesso Group Holdings Ltd. . . . . . . . . . 81,890 175,207China Life Insurance Co. Ltd., Class A . . . . . 23,500 105,043China Life Insurance Co. Ltd., Class H . . . . . 691,728 1,158,016China Literature Ltd., 144A* . . . . . . . . . . . . . . 33,224 278,955China Merchants Bank Co. Ltd., Class A . . . . 124,800 947,025China Merchants Bank Co. Ltd., Class H . . . . 391,032 3,230,381China Merchants Securities Co. Ltd.,Class A . . . . . . . . . . . . . . . . . . . . . . . . . . . . . . . 43,000 121,029
China Merchants Securities Co. Ltd.,Class H, 144A . . . . . . . . . . . . . . . . . . . . . . . . . . 19,400 29,334
China Merchants Shekou Industrial ZoneHoldings Co. Ltd., Class A . . . . . . . . . . . . . . . 8,800 13,585
China Minsheng Banking Corp. Ltd.,Class A . . . . . . . . . . . . . . . . . . . . . . . . . . . . . . . 173,000 106,449
China Minsheng Banking Corp. Ltd.,Class H . . . . . . . . . . . . . . . . . . . . . . . . . . . . . . . 353,155 147,576
China Molybdenum Co. Ltd., Class H . . . . . . 202,036 157,943China National Building Material Co. Ltd.,Class H . . . . . . . . . . . . . . . . . . . . . . . . . . . . . . . 202,326 276,797
China National Nuclear Power Co. Ltd.,Class A . . . . . . . . . . . . . . . . . . . . . . . . . . . . . . . 124,800 105,999
China Northern Rare Earth Group High-Tech Co. Ltd., Class A . . . . . . . . . . . . . . . . . . 18,700 168,190
China Pacific Insurance Group Co. Ltd.,Class A . . . . . . . . . . . . . . . . . . . . . . . . . . . . . . . 33,400 136,147
China Pacific Insurance Group Co. Ltd.,Class H . . . . . . . . . . . . . . . . . . . . . . . . . . . . . . . 138,139 388,981
China Railway Group Ltd., Class A . . . . . . . . 139,500 121,727China Railway Group Ltd., Class H . . . . . . . . 240,751 115,464China Railway Signal & CommunicationCorp. Ltd., Class H, 144A . . . . . . . . . . . . . . . . 278,779 101,083
China Resources Mixc Lifestyle ServicesLtd., 144A . . . . . . . . . . . . . . . . . . . . . . . . . . . . . 36,136 189,802
China Resources Pharmaceutical GroupLtd., 144A . . . . . . . . . . . . . . . . . . . . . . . . . . . . . 44,163 22,998
China Southern Airlines Co. Ltd.,Class H* . . . . . . . . . . . . . . . . . . . . . . . . . . . . . . 166,008 96,693
Numberof Shares Value
China (Continued)
China State Construction Engineering Corp.Ltd., Class A . . . . . . . . . . . . . . . . . . . . . . . . . . . 206,700 $ 153,776
China Tower Corp. Ltd., Class H, 144A . . . . . 2,012,468 263,935China Vanke Co. Ltd., Class A . . . . . . . . . . . . . 52,600 161,420China Vanke Co. Ltd., Class H . . . . . . . . . . . . . 102,545 276,887China Yangtze Power Co. Ltd., Class A . . . . . 129,600 388,479Chongqing Changan Automobile Co. Ltd.,Class A . . . . . . . . . . . . . . . . . . . . . . . . . . . . . . . 23,500 75,104
Chongqing Rural Commercial Bank Co.Ltd., Class H . . . . . . . . . . . . . . . . . . . . . . . . . . . 196,892 75,442
Chongqing Zhifei Biological Products Co.Ltd., Class A . . . . . . . . . . . . . . . . . . . . . . . . . . . 5,800 159,113
CIFI Holdings Group Co. Ltd. . . . . . . . . . . . . . 216,158 145,637CITIC Securities Co. Ltd., Class A . . . . . . . . . . 52,600 209,356CITIC Securities Co. Ltd., Class H . . . . . . . . . . 116,267 294,504Contemporary Amperex Technology Co.Ltd., Class A . . . . . . . . . . . . . . . . . . . . . . . . . . . 14,200 1,089,144
COSCO SHIPPING Holdings Co. Ltd.,Class A* . . . . . . . . . . . . . . . . . . . . . . . . . . . . . . 47,700 153,332
COSCO SHIPPING Holdings Co. Ltd.,Class H* (a) . . . . . . . . . . . . . . . . . . . . . . . . . . . 189,169 357,549
Country Garden Holdings Co. Ltd. . . . . . . . . . 484,646 535,909Country Garden Services Holdings Co.Ltd. . . . . . . . . . . . . . . . . . . . . . . . . . . . . . . . . . . . 98,703 751,947
CSC Financial Co. Ltd., Class H, 144A . . . . . . 80,748 88,459Dada Nexus Ltd., ADR* . . . . . . . . . . . . . . . . . . 17,728 419,799Dali Foods Group Co. Ltd., 144A . . . . . . . . . . 110,428 61,906Dongfeng Motor Group Co. Ltd., Class H . . . 96,413 105,619East Money Information Co. Ltd., Class A . . 38,200 183,244Ecovacs Robotics Co. Ltd., Class A . . . . . . . . 1,300 29,556Eve Energy Co. Ltd., Class A . . . . . . . . . . . . . . 9,300 147,024Everbright Securities Co. Ltd., Class A . . . . . 33,400 82,309Evergrande Property Services Group Ltd.,144A * (a) . . . . . . . . . . . . . . . . . . . . . . . . . . . . . 222,737 167,253
Flat Glass Group Co. Ltd., Class H . . . . . . . . . 36,994 215,951Foshan Haitian Flavouring & Food Co. Ltd.,Class A . . . . . . . . . . . . . . . . . . . . . . . . . . . . . . . 4,300 63,300
Foxconn Industrial Internet Co. Ltd.,Class A . . . . . . . . . . . . . . . . . . . . . . . . . . . . . . . 43,000 76,510
Fuyao Glass Industry Group Co. Ltd.,Class A . . . . . . . . . . . . . . . . . . . . . . . . . . . . . . . 9,300 69,044
Fuyao Glass Industry Group Co. Ltd.,Class H, 144A . . . . . . . . . . . . . . . . . . . . . . . . . . 28,935 178,208
Ganfeng Lithium Co. Ltd., Class A . . . . . . . . . 4,300 146,621Ganfeng Lithium Co. Ltd., Class H, 144A . . . 12,870 296,541Gaotu Techedu, Inc., ADR* (a) . . . . . . . . . . . . 24,020 69,178GDS Holdings Ltd., ADR* . . . . . . . . . . . . . . . . 17,157 1,003,341GF Securities Co. Ltd., Class A . . . . . . . . . . . . 30,900 90,947GF Securities Co. Ltd., Class H . . . . . . . . . . . . 66,907 119,063GoerTek, Inc., Class A . . . . . . . . . . . . . . . . . . . 7,500 54,100Gotion High-tech Co. Ltd., Class A* . . . . . . . 3,500 29,158Great Wall Motor Co. Ltd., Class A . . . . . . . . 4,900 50,215Great Wall Motor Co. Ltd., Class H . . . . . . . . 119,866 551,756Guangdong Haid Group Co. Ltd., Class A . . 4,300 42,820Guangzhou Automobile Group Co. Ltd.,Class H . . . . . . . . . . . . . . . . . . . . . . . . . . . . . . . 96,413 97,066
See Notes to Financial Statements. 22

DBX ETF Trust
Schedule of Investments
Xtrackers Emerging Markets Carbon Reduction and Climate Improvers ETF (Continued)August 31, 2021
Numberof Shares Value
China (Continued)
Guangzhou Baiyunshan PharmaceuticalHoldings Co. Ltd., Class A . . . . . . . . . . . . . . . 21,700 $ 99,083
Guangzhou Kingmed Diagnostics GroupCo. Ltd., Class A . . . . . . . . . . . . . . . . . . . . . . . 2,000 32,703
Guangzhou R&F Properties Co. Ltd.,Class H . . . . . . . . . . . . . . . . . . . . . . . . . . . . . . . 31,229 26,662
Guangzhou Tinci Materials Technology Co.Ltd., Class A . . . . . . . . . . . . . . . . . . . . . . . . . . . 4,300 90,779
Guosen Securities Co. Ltd., Class A . . . . . . . 40,500 76,581Guotai Junan Securities Co. Ltd., Class A . . 47,700 131,301Guotai Junan Securities Co. Ltd., Class H,144A . . . . . . . . . . . . . . . . . . . . . . . . . . . . . . . . . 48,149 67,357
Haidilao International Holding Ltd.,144A (a) . . . . . . . . . . . . . . . . . . . . . . . . . . . . . . . 52,439 213,738
Haier Smart Home Co. Ltd., Class A . . . . . . . 28,600 119,950Haier Smart Home Co. Ltd., Class H . . . . . . . 123,293 464,488Haitong Securities Co. Ltd., Class A . . . . . . . 59,100 116,423Haitong Securities Co. Ltd., Class H . . . . . . . 155,249 143,525Hangzhou First Applied Material Co. Ltd.,Class A . . . . . . . . . . . . . . . . . . . . . . . . . . . . . . . 7,600 179,045
Hangzhou Tigermed Consulting Co. Ltd.,Class A . . . . . . . . . . . . . . . . . . . . . . . . . . . . . . . 4,300 89,359
Hangzhou Tigermed Consulting Co. Ltd.,Class H, 144A . . . . . . . . . . . . . . . . . . . . . . . . . . 6,002 106,498
Hansoh Pharmaceutical Group Co. Ltd.,144A . . . . . . . . . . . . . . . . . . . . . . . . . . . . . . . . . 72,453 197,963
Hello Group, Inc., ADR . . . . . . . . . . . . . . . . . . . 10,297 135,303Hengan International Group Co. Ltd. . . . . . . 35,853 207,908HengTen Networks Group Ltd.* (a) . . . . . . . . 394,177 193,608Hua Hong Semiconductor Ltd., 144A* . . . . . 58,441 344,153Huadong Medicine Co. Ltd., Class A . . . . . . . 14,200 67,677Huatai Securities Co. Ltd., Class A . . . . . . . . . 43,500 110,436Huatai Securities Co. Ltd., Class H, 144A . . . 77,501 111,209Huaxia Bank Co. Ltd., Class A . . . . . . . . . . . . . 67,100 58,239Huaxin Cement Co. Ltd., Class B . . . . . . . . . . 31,500 55,188Huazhu Group Ltd., ADR* . . . . . . . . . . . . . . . . 5,719 276,171Hunan Valin Steel Co. Ltd., Class A . . . . . . . . 76,800 92,846Hundsun Technologies, Inc., Class A . . . . . . 4,300 33,030HUYA, Inc., ADR* (a) . . . . . . . . . . . . . . . . . . . . 7,148 76,412Iflytek Co. Ltd., Class A . . . . . . . . . . . . . . . . . . 9,300 75,501Industrial & Commercial Bank of China Ltd.,Class A . . . . . . . . . . . . . . . . . . . . . . . . . . . . . . . 351,100 251,408
Industrial & Commercial Bank of China Ltd.,Class H . . . . . . . . . . . . . . . . . . . . . . . . . . . . . . . 7,417,003 4,138,915
Industrial Bank Co. Ltd., Class A . . . . . . . . . . 76,800 220,211Inner Mongolia BaoTou Steel Union Co.Ltd., Class A* . . . . . . . . . . . . . . . . . . . . . . . . . . 173,100 100,877
Inner Mongolia Yili Industrial Group Co.Ltd., Class A . . . . . . . . . . . . . . . . . . . . . . . . . . . 28,600 150,757
Innovent Biologics, Inc., 144A* . . . . . . . . . . . 47,287 381,222Intco Medical Technology Co. Ltd.,Class A . . . . . . . . . . . . . . . . . . . . . . . . . . . . . . . 2,000 31,671
iQIYI, Inc., ADR* . . . . . . . . . . . . . . . . . . . . . . . . 18,303 165,825JA Solar Technology Co. Ltd., Class A . . . . . 4,300 51,851Jafron Biomedical Co. Ltd., Class A . . . . . . . 9,300 70,600JD Health International, Inc., 144A* (a) . . . . 39,023 362,767JD.com, Inc., ADR* . . . . . . . . . . . . . . . . . . . . . . 52,136 4,095,804
Numberof Shares Value
China (Continued)
Jiangsu Hengrui Medicine Co. Ltd.,Class A . . . . . . . . . . . . . . . . . . . . . . . . . . . . . . . 23,500 $ 164,631
Jiangxi Copper Co. Ltd., Class A . . . . . . . . . . 23,500 96,630Jiangxi Copper Co. Ltd., Class H (a) . . . . . . . 47,001 95,605KE Holdings, Inc., ADR* . . . . . . . . . . . . . . . . . 36,765 665,079Kingdee International Software Group Co.Ltd.* . . . . . . . . . . . . . . . . . . . . . . . . . . . . . . . . . 263,055 957,197
Kingfa Sci & Tech Co. Ltd., Class A . . . . . . . . 2,700 6,783Kingsoft Cloud Holdings Ltd., ADR* (a) . . . . 16,869 543,013Kingsoft Corp. Ltd. . . . . . . . . . . . . . . . . . . . . . . 79,257 317,442Kuaishou Technology, 144A* (a) . . . . . . . . . . 104,136 1,131,425KWG Group Holdings Ltd. . . . . . . . . . . . . . . . 43,572 45,940Legend Holdings Corp., Class H, 144A . . . . . 87,265 140,704Lenovo Group Ltd. . . . . . . . . . . . . . . . . . . . . . . 584,491 647,819Lens Technology Co. Ltd., Class A . . . . . . . . 28,600 104,613Li Auto, Inc., ADR* (a) . . . . . . . . . . . . . . . . . . . 54,782 1,690,573Li Ning Co. Ltd. . . . . . . . . . . . . . . . . . . . . . . . . . 124,496 1,672,785Lingyi iTech Guangdong Co., Class A . . . . . . 27,000 27,996Logan Group Co. Ltd. . . . . . . . . . . . . . . . . . . . . 125,639 149,914Longfor Group Holdings Ltd., 144A . . . . . . . 94,127 407,861LONGi Green Energy Technology Co. Ltd.,Class A . . . . . . . . . . . . . . . . . . . . . . . . . . . . . . . 38,200 529,661
Lufax Holding Ltd., ADR* . . . . . . . . . . . . . . . . 188,585 1,635,032Luxshare Precision Industry Co. Ltd.,Class A . . . . . . . . . . . . . . . . . . . . . . . . . . . . . . . 28,600 150,092
Mango Excellent Media Co. Ltd., Class A . . . 5,600 39,752Maxscend Microelectronics Co. Ltd.,Class A . . . . . . . . . . . . . . . . . . . . . . . . . . . . . . . 2,500 146,854
Meituan, Class B, 144A* . . . . . . . . . . . . . . . . . 225,020 7,204,251Metallurgical Corp. of China Ltd., Class A . . 124,900 96,985Metallurgical Corp. of China Ltd., Class H . . 150,000 59,789Microport Scientific Corp. (a) . . . . . . . . . . . . . 55,009 340,564Midea Group Co. Ltd., Class A . . . . . . . . . . . . 14,200 145,257Ming Yuan Cloud Group Holdings Ltd.* . . . 26,880 93,317MINISO Group Holding Ltd., ADR . . . . . . . . . 17,445 235,856Muyuan Foods Co. Ltd., Class A . . . . . . . . . . 14,200 93,119NARI Technology Co. Ltd., Class A . . . . . . . . 17,060 92,571NAURA Technology Group Co. Ltd.,Class A . . . . . . . . . . . . . . . . . . . . . . . . . . . . . . . 3,000 165,460
NetEase, Inc., ADR . . . . . . . . . . . . . . . . . . . . . . 21,561 2,100,473New China Life Insurance Co. Ltd.,Class A . . . . . . . . . . . . . . . . . . . . . . . . . . . . . . . 18,700 117,730
New China Life Insurance Co. Ltd.,Class H . . . . . . . . . . . . . . . . . . . . . . . . . . . . . . . 82,822 243,865
New Oriental Education & TechnologyGroup, Inc., ADR* . . . . . . . . . . . . . . . . . . . . . . 88,919 200,957
NIO, Inc., ADR* . . . . . . . . . . . . . . . . . . . . . . . . . 127,461 5,010,492Nongfu Spring Co. Ltd., Class H,144A (a) . . . . . . . . . . . . . . . . . . . . . . . . . . . . . . . 99,276 525,270
OneConnect Financial Technology Co. Ltd.,ADR* . . . . . . . . . . . . . . . . . . . . . . . . . . . . . . . . . 30,133 141,625
Orient Securities Co. Ltd., Class A . . . . . . . . . 34,100 79,119Ovctek China, Inc., Class A . . . . . . . . . . . . . . . 2,500 25,883People’s Insurance Co. Group of China Ltd.,Class A . . . . . . . . . . . . . . . . . . . . . . . . . . . . . . . 115,300 91,854
People’s Insurance Co. Group of China Ltd.,Class H . . . . . . . . . . . . . . . . . . . . . . . . . . . . . . . 726,186 224,093
See Notes to Financial Statements. 23
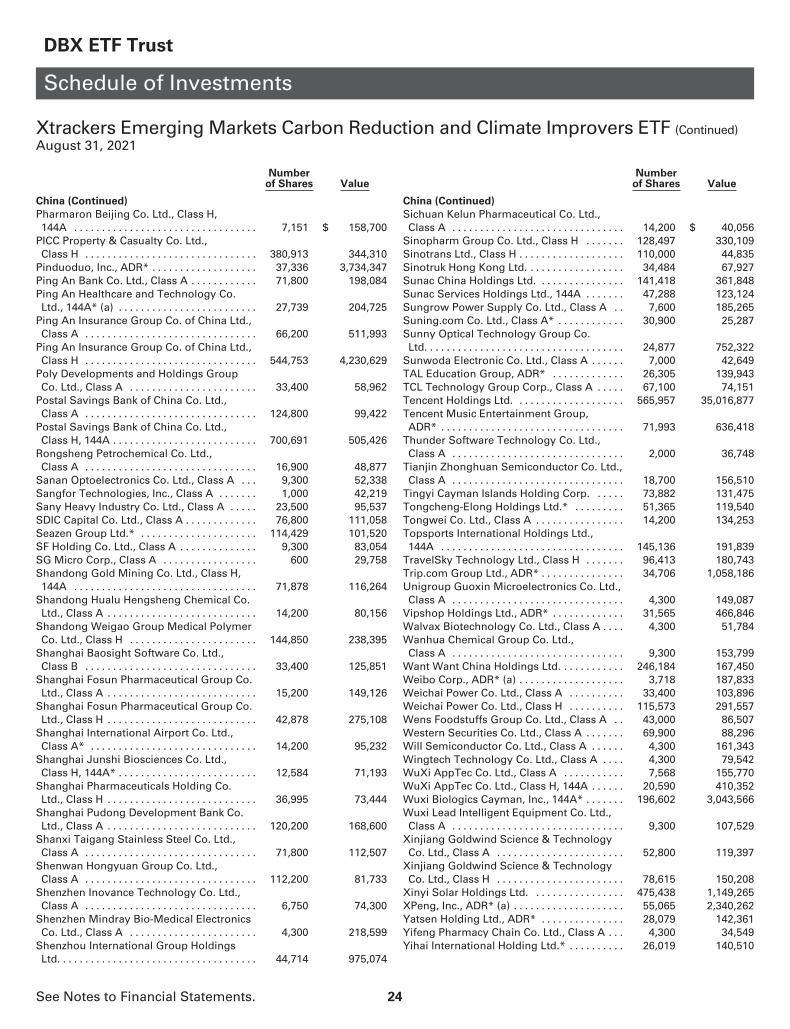
DBX ETF Trust
Schedule of Investments
Xtrackers Emerging Markets Carbon Reduction and Climate Improvers ETF (Continued)August 31, 2021
Numberof Shares Value
China (Continued)
Pharmaron Beijing Co. Ltd., Class H,144A . . . . . . . . . . . . . . . . . . . . . . . . . . . . . . . . . 7,151 $ 158,700
PICC Property & Casualty Co. Ltd.,Class H . . . . . . . . . . . . . . . . . . . . . . . . . . . . . . . 380,913 344,310
Pinduoduo, Inc., ADR* . . . . . . . . . . . . . . . . . . . 37,336 3,734,347Ping An Bank Co. Ltd., Class A . . . . . . . . . . . . 71,800 198,084Ping An Healthcare and Technology Co.Ltd., 144A* (a) . . . . . . . . . . . . . . . . . . . . . . . . . 27,739 204,725
Ping An Insurance Group Co. of China Ltd.,Class A . . . . . . . . . . . . . . . . . . . . . . . . . . . . . . . 66,200 511,993
Ping An Insurance Group Co. of China Ltd.,Class H . . . . . . . . . . . . . . . . . . . . . . . . . . . . . . . 544,753 4,230,629
Poly Developments and Holdings GroupCo. Ltd., Class A . . . . . . . . . . . . . . . . . . . . . . . 33,400 58,962
Postal Savings Bank of China Co. Ltd.,Class A . . . . . . . . . . . . . . . . . . . . . . . . . . . . . . . 124,800 99,422
Postal Savings Bank of China Co. Ltd.,Class H, 144A . . . . . . . . . . . . . . . . . . . . . . . . . . 700,691 505,426
Rongsheng Petrochemical Co. Ltd.,Class A . . . . . . . . . . . . . . . . . . . . . . . . . . . . . . . 16,900 48,877
Sanan Optoelectronics Co. Ltd., Class A . . . 9,300 52,338Sangfor Technologies, Inc., Class A . . . . . . . 1,000 42,219Sany Heavy Industry Co. Ltd., Class A . . . . . 23,500 95,537SDIC Capital Co. Ltd., Class A . . . . . . . . . . . . . 76,800 111,058Seazen Group Ltd.* . . . . . . . . . . . . . . . . . . . . . 114,429 101,520SF Holding Co. Ltd., Class A . . . . . . . . . . . . . . 9,300 83,054SG Micro Corp., Class A . . . . . . . . . . . . . . . . . 600 29,758Shandong Gold Mining Co. Ltd., Class H,144A . . . . . . . . . . . . . . . . . . . . . . . . . . . . . . . . . 71,878 116,264
Shandong Hualu Hengsheng Chemical Co.Ltd., Class A . . . . . . . . . . . . . . . . . . . . . . . . . . . 14,200 80,156
Shandong Weigao Group Medical PolymerCo. Ltd., Class H . . . . . . . . . . . . . . . . . . . . . . . 144,850 238,395
Shanghai Baosight Software Co. Ltd.,Class B . . . . . . . . . . . . . . . . . . . . . . . . . . . . . . . 33,400 125,851
Shanghai Fosun Pharmaceutical Group Co.Ltd., Class A . . . . . . . . . . . . . . . . . . . . . . . . . . . 15,200 149,126
Shanghai Fosun Pharmaceutical Group Co.Ltd., Class H . . . . . . . . . . . . . . . . . . . . . . . . . . . 42,878 275,108
Shanghai International Airport Co. Ltd.,Class A* . . . . . . . . . . . . . . . . . . . . . . . . . . . . . . 14,200 95,232
Shanghai Junshi Biosciences Co. Ltd.,Class H, 144A* . . . . . . . . . . . . . . . . . . . . . . . . . 12,584 71,193
Shanghai Pharmaceuticals Holding Co.Ltd., Class H . . . . . . . . . . . . . . . . . . . . . . . . . . . 36,995 73,444
Shanghai Pudong Development Bank Co.Ltd., Class A . . . . . . . . . . . . . . . . . . . . . . . . . . . 120,200 168,600
Shanxi Taigang Stainless Steel Co. Ltd.,Class A . . . . . . . . . . . . . . . . . . . . . . . . . . . . . . . 71,800 112,507
Shenwan Hongyuan Group Co. Ltd.,Class A . . . . . . . . . . . . . . . . . . . . . . . . . . . . . . . 112,200 81,733
Shenzhen Inovance Technology Co. Ltd.,Class A . . . . . . . . . . . . . . . . . . . . . . . . . . . . . . . 6,750 74,300
Shenzhen Mindray Bio-Medical ElectronicsCo. Ltd., Class A . . . . . . . . . . . . . . . . . . . . . . . 4,300 218,599
Shenzhou International Group HoldingsLtd. . . . . . . . . . . . . . . . . . . . . . . . . . . . . . . . . . . . 44,714 975,074
Numberof Shares Value
China (Continued)
Sichuan Kelun Pharmaceutical Co. Ltd.,Class A . . . . . . . . . . . . . . . . . . . . . . . . . . . . . . . 14,200 $ 40,056
Sinopharm Group Co. Ltd., Class H . . . . . . . 128,497 330,109Sinotrans Ltd., Class H . . . . . . . . . . . . . . . . . . . 110,000 44,835Sinotruk Hong Kong Ltd. . . . . . . . . . . . . . . . . . 34,484 67,927Sunac China Holdings Ltd. . . . . . . . . . . . . . . . 141,418 361,848Sunac Services Holdings Ltd., 144A . . . . . . . 47,288 123,124Sungrow Power Supply Co. Ltd., Class A . . 7,600 185,265Suning.com Co. Ltd., Class A* . . . . . . . . . . . . 30,900 25,287Sunny Optical Technology Group Co.Ltd. . . . . . . . . . . . . . . . . . . . . . . . . . . . . . . . . . . . 24,877 752,322
Sunwoda Electronic Co. Ltd., Class A . . . . . . 7,000 42,649TAL Education Group, ADR* . . . . . . . . . . . . . 26,305 139,943TCL Technology Group Corp., Class A . . . . . 67,100 74,151Tencent Holdings Ltd. . . . . . . . . . . . . . . . . . . . 565,957 35,016,877Tencent Music Entertainment Group,ADR* . . . . . . . . . . . . . . . . . . . . . . . . . . . . . . . . . 71,993 636,418
Thunder Software Technology Co. Ltd.,Class A . . . . . . . . . . . . . . . . . . . . . . . . . . . . . . . 2,000 36,748
Tianjin Zhonghuan Semiconductor Co. Ltd.,Class A . . . . . . . . . . . . . . . . . . . . . . . . . . . . . . . 18,700 156,510
Tingyi Cayman Islands Holding Corp. . . . . . 73,882 131,475Tongcheng-Elong Holdings Ltd.* . . . . . . . . . 51,365 119,540Tongwei Co. Ltd., Class A . . . . . . . . . . . . . . . . 14,200 134,253Topsports International Holdings Ltd.,144A . . . . . . . . . . . . . . . . . . . . . . . . . . . . . . . . . 145,136 191,839
TravelSky Technology Ltd., Class H . . . . . . . 96,413 180,743Trip.com Group Ltd., ADR* . . . . . . . . . . . . . . . 34,706 1,058,186Unigroup Guoxin Microelectronics Co. Ltd.,Class A . . . . . . . . . . . . . . . . . . . . . . . . . . . . . . . 4,300 149,087
Vipshop Holdings Ltd., ADR* . . . . . . . . . . . . . 31,565 466,846Walvax Biotechnology Co. Ltd., Class A . . . . 4,300 51,784Wanhua Chemical Group Co. Ltd.,Class A . . . . . . . . . . . . . . . . . . . . . . . . . . . . . . . 9,300 153,799
Want Want China Holdings Ltd. . . . . . . . . . . . 246,184 167,450Weibo Corp., ADR* (a) . . . . . . . . . . . . . . . . . . . 3,718 187,833Weichai Power Co. Ltd., Class A . . . . . . . . . . 33,400 103,896Weichai Power Co. Ltd., Class H . . . . . . . . . . 115,573 291,557Wens Foodstuffs Group Co. Ltd., Class A . . 43,000 86,507Western Securities Co. Ltd., Class A . . . . . . . 69,900 88,296Will Semiconductor Co. Ltd., Class A . . . . . . 4,300 161,343Wingtech Technology Co. Ltd., Class A . . . . 4,300 79,542WuXi AppTec Co. Ltd., Class A . . . . . . . . . . . 7,568 155,770WuXi AppTec Co. Ltd., Class H, 144A . . . . . . 20,590 410,352Wuxi Biologics Cayman, Inc., 144A* . . . . . . . 196,602 3,043,566Wuxi Lead Intelligent Equipment Co. Ltd.,Class A . . . . . . . . . . . . . . . . . . . . . . . . . . . . . . . 9,300 107,529
Xinjiang Goldwind Science & TechnologyCo. Ltd., Class A . . . . . . . . . . . . . . . . . . . . . . . 52,800 119,397
Xinjiang Goldwind Science & TechnologyCo. Ltd., Class H . . . . . . . . . . . . . . . . . . . . . . . 78,615 150,208
Xinyi Solar Holdings Ltd. . . . . . . . . . . . . . . . . 475,438 1,149,265XPeng, Inc., ADR* (a) . . . . . . . . . . . . . . . . . . . . 55,065 2,340,262Yatsen Holding Ltd., ADR* . . . . . . . . . . . . . . . 28,079 142,361Yifeng Pharmacy Chain Co. Ltd., Class A . . . 4,300 34,549Yihai International Holding Ltd.* . . . . . . . . . . 26,019 140,510
See Notes to Financial Statements. 24

DBX ETF Trust
Schedule of Investments
Xtrackers Emerging Markets Carbon Reduction and Climate Improvers ETF (Continued)August 31, 2021
Numberof Shares Value
China (Continued)
Yonyou Network Technology Co. Ltd.,Class A . . . . . . . . . . . . . . . . . . . . . . . . . . . . . . . 14,200 $ 73,729
Yunnan Baiyao Group Co. Ltd., Class A . . . . 4,300 59,108Yunnan Energy New Material Co. Ltd.,Class A . . . . . . . . . . . . . . . . . . . . . . . . . . . . . . . 4,300 188,208
Zai Lab Ltd., ADR* (a) . . . . . . . . . . . . . . . . . . . 5,431 784,779Zhangzhou Pientzehuang PharmaceuticalCo. Ltd., Class A . . . . . . . . . . . . . . . . . . . . . . . 2,800 150,611
Zhejiang Chint Electrics Co. Ltd., Class A . . . 5,200 50,735Zhejiang Expressway Co. Ltd., Class H . . . . . 55,010 48,239Zhejiang Huayou Cobalt Co. Ltd.,Class A . . . . . . . . . . . . . . . . . . . . . . . . . . . . . . . 1,800 39,116
Zhejiang Sanhua Intelligent Controls Co.Ltd., Class A . . . . . . . . . . . . . . . . . . . . . . . . . . . 18,700 73,183
ZhongAn Online P&C Insurance Co. Ltd.,Class H, 144A* . . . . . . . . . . . . . . . . . . . . . . . . 67,306 327,991
Zhongsheng Group Holdings Ltd. . . . . . . . . . 20,874 174,457Zhuzhou CRRC Times Electric Co. Ltd.,Class H* . . . . . . . . . . . . . . . . . . . . . . . . . . . . . . 31,223 188,084
Zijin Mining Group Co. Ltd., Class A . . . . . . . 67,100 115,543Zijin Mining Group Co. Ltd., Class H . . . . . . . 205,458 292,706Zoomlion Heavy Industry Science andTechnology Co. Ltd., Class H . . . . . . . . . . . . 121,005 115,290
ZTE Corp., Class A . . . . . . . . . . . . . . . . . . . . . . 23,500 120,924ZTE Corp., Class H . . . . . . . . . . . . . . . . . . . . . . 31,506 110,795ZTO Express Cayman, Inc., ADR . . . . . . . . . . 26,591 750,132
(Cost $164,163,124) . . . . . . . . . . . . . . . . . . . . . 168,826,045
Colombia — 0.1%
Bancolombia SA . . . . . . . . . . . . . . . . . . . . . . . . 23,731 195,935Interconexion Electrica SA ESP . . . . . . . . . . . 24,875 150,053
(Cost $339,707) . . . . . . . . . . . . . . . . . . . . . . . . . 345,988
Czech Republic — 0.1%
Komercni banka AS* . . . . . . . . . . . . . . . . . . . . 6,579 252,873Moneta Money Bank AS, 144A* . . . . . . . . . . 46,202 187,348
(Cost $436,422) . . . . . . . . . . . . . . . . . . . . . . . . . 440,221
Egypt — 0.1%
Commercial International Bank EgyptSAE* . . . . . . . . . . . . . . . . . . . . . . . . . . . . . . . . . 189,173 563,904
Fawry for Banking & Payment TechnologyServices SAE* . . . . . . . . . . . . . . . . . . . . . . . . . 90,123 93,510
(Cost $659,322) . . . . . . . . . . . . . . . . . . . . . . . . . 657,414
France — 0.0%
Alstom SA (a)(Cost $40) . . . . . . . . . . . . . . . . . . . . . . . . . . . . . 1 43
Greece — 0.2%
Alpha Services and Holdings SA* . . . . . . . . . 122,312 169,723Eurobank Ergasias Services and HoldingsSA* . . . . . . . . . . . . . . . . . . . . . . . . . . . . . . . . . . 250,176 238,324
Hellenic Telecommunications OrganizationSA . . . . . . . . . . . . . . . . . . . . . . . . . . . . . . . . . . . 20,589 405,031
JUMBO SA . . . . . . . . . . . . . . . . . . . . . . . . . . . . . 7,718 121,172LAMDA Development SA* . . . . . . . . . . . . . . . 8,576 83,975National Bank of Greece SA* . . . . . . . . . . . . . 54,495 164,810
(Cost $1,154,946) . . . . . . . . . . . . . . . . . . . . . . . 1,183,035
Numberof Shares Value
Hong Kong — 0.9%
Beijing Enterprises Water Group Ltd.* . . . . . 192,602 $ 79,494BOC Hong Kong Holdings Ltd. . . . . . . . . . . . . 204,324 620,011China Everbright Environment GroupLtd. . . . . . . . . . . . . . . . . . . . . . . . . . . . . . . . . . . . 126,206 87,303
China Jinmao Holdings Group Ltd. . . . . . . . . 391,315 127,296China Mengniu Dairy Co. Ltd.* . . . . . . . . . . . 170,015 1,021,968China Merchants Port Holdings Co. Ltd. . . . 63,302 106,625China Overseas Land & Investment Ltd. . . . 267,913 616,617China Resources Cement Holdings Ltd. . . . . 194,605 190,918China Resources Land Ltd. . . . . . . . . . . . . . . . 159,435 593,472China State Construction InternationalHoldings Ltd. . . . . . . . . . . . . . . . . . . . . . . . . . . 110,141 89,219
China Taiping Insurance Holdings Co.Ltd. . . . . . . . . . . . . . . . . . . . . . . . . . . . . . . . . . . . 137,985 201,548
Futu Holdings Ltd., ADR* (a) . . . . . . . . . . . . . 5,719 544,392Orient Overseas International Ltd. . . . . . . . . . 8,577 220,784Shenzhen International Holdings Ltd. . . . . . . 104,136 135,771
(Cost $4,549,395) . . . . . . . . . . . . . . . . . . . . . . . . 4,635,418
Hungary — 0.3%
OTP Bank Nyrt* . . . . . . . . . . . . . . . . . . . . . . . . . 20,873 1,259,639Richter Gedeon Nyrt . . . . . . . . . . . . . . . . . . . . 8,581 257,036
(Cost $1,481,690) . . . . . . . . . . . . . . . . . . . . . . . . 1,516,675
India — 12.0%
ACC Ltd. . . . . . . . . . . . . . . . . . . . . . . . . . . . . . . . 6,576 217,364Adani Green Energy Ltd.* . . . . . . . . . . . . . . . . 44,716 654,348Adani Ports & Special Economic ZoneLtd. . . . . . . . . . . . . . . . . . . . . . . . . . . . . . . . . . . . 40,139 411,410
Adani Transmission Ltd.* . . . . . . . . . . . . . . . . 21,731 470,472Alkem Laboratories Ltd. . . . . . . . . . . . . . . . . . 2,287 121,499Ambuja Cements Ltd. . . . . . . . . . . . . . . . . . . . 31,796 183,374Apollo Hospitals Enterprise Ltd. . . . . . . . . . . 7,149 486,626Ashok Leyland Ltd. . . . . . . . . . . . . . . . . . . . . . . 113,287 190,473Asian Paints Ltd. . . . . . . . . . . . . . . . . . . . . . . . . 34,709 1,521,976AU Small Finance Bank Ltd., 144A* . . . . . . . 12,010 186,013Aurobindo Pharma Ltd. . . . . . . . . . . . . . . . . . . 16,585 165,220Avenue Supermarts Ltd., 144A* . . . . . . . . . . 13,728 743,643Axis Bank Ltd.* . . . . . . . . . . . . . . . . . . . . . . . . . 153,998 1,659,000Axis Bank Ltd., GDR* . . . . . . . . . . . . . . . . . . . . 9,850 545,690Bajaj Auto Ltd. . . . . . . . . . . . . . . . . . . . . . . . . . . 3,072 156,860Bajaj Finance Ltd. . . . . . . . . . . . . . . . . . . . . . . . 14,867 1,532,264Bajaj Finserv Ltd. . . . . . . . . . . . . . . . . . . . . . . . 2,286 536,959Bajaj Holdings & Investment Ltd. . . . . . . . . . 2,000 119,351Bandhan Bank Ltd., 144A . . . . . . . . . . . . . . . . 58,440 228,133Bank of Baroda* . . . . . . . . . . . . . . . . . . . . . . . . 84,976 90,030Berger Paints India Ltd. . . . . . . . . . . . . . . . . . . 20,872 234,657Bharti Airtel Ltd.* . . . . . . . . . . . . . . . . . . . . . . . 134,269 1,221,263Biocon Ltd.* . . . . . . . . . . . . . . . . . . . . . . . . . . . . 35,568 174,826Britannia Industries Ltd. . . . . . . . . . . . . . . . . . 4,292 235,007Cadila Healthcare Ltd. . . . . . . . . . . . . . . . . . . . 13,152 99,828Cholamandalam Investment and FinanceCo. Ltd. . . . . . . . . . . . . . . . . . . . . . . . . . . . . . . . 34,709 263,405
Cipla Ltd. . . . . . . . . . . . . . . . . . . . . . . . . . . . . . . 27,453 356,401Colgate-Palmolive India Ltd. . . . . . . . . . . . . . . 10,864 251,974Container Corp. Of India Ltd. . . . . . . . . . . . . . 14,585 135,756Dabur India Ltd. . . . . . . . . . . . . . . . . . . . . . . . . 35,852 305,202Divi’s Laboratories Ltd. . . . . . . . . . . . . . . . . . . 7,433 526,732
See Notes to Financial Statements. 25

DBX ETF Trust
Schedule of Investments
Xtrackers Emerging Markets Carbon Reduction and Climate Improvers ETF (Continued)August 31, 2021
Numberof Shares Value
India (Continued)
DLF Ltd. . . . . . . . . . . . . . . . . . . . . . . . . . . . . . . . 38,138 $ 167,450Dr. Reddy’s Laboratories Ltd. . . . . . . . . . . . . . 11,153 718,615Eicher Motors Ltd. . . . . . . . . . . . . . . . . . . . . . . 5,347 196,226Embassy Office Parks REIT . . . . . . . . . . . . . . . 73,881 361,879Godrej Consumer Products Ltd.* . . . . . . . . . 35,795 538,978Godrej Properties Ltd.* . . . . . . . . . . . . . . . . . . 7,719 157,430Grasim Industries Ltd. . . . . . . . . . . . . . . . . . . . 21,159 434,845Havells India Ltd. . . . . . . . . . . . . . . . . . . . . . . . 21,448 372,643HCL Technologies Ltd. . . . . . . . . . . . . . . . . . . . 55,583 900,124HDFC Asset Management Co. Ltd., 144A . . . 4,287 180,523HDFC Life Insurance Co. Ltd., 144A . . . . . . . . 69,308 681,380Hero MotoCorp Ltd. . . . . . . . . . . . . . . . . . . . . . 7,722 290,005Hindalco Industries Ltd. . . . . . . . . . . . . . . . . . . 79,200 508,021Hindustan Unilever Ltd. . . . . . . . . . . . . . . . . . . 46,715 1,743,058Honeywell Automation India Ltd. . . . . . . . . . 3 1,627Housing Development Finance Corp.Ltd. . . . . . . . . . . . . . . . . . . . . . . . . . . . . . . . . . . . 148,333 5,685,853
ICICI Bank Ltd. . . . . . . . . . . . . . . . . . . . . . . . . . . 289,125 2,847,589ICICI Lombard General Insurance Co. Ltd.,144A . . . . . . . . . . . . . . . . . . . . . . . . . . . . . . . . . 12,011 262,339
ICICI Prudential Life Insurance Co. Ltd.,144A . . . . . . . . . . . . . . . . . . . . . . . . . . . . . . . . . 38,424 346,886
IDFC First Bank Ltd.* . . . . . . . . . . . . . . . . . . . . 363,758 213,997Indus Towers Ltd. . . . . . . . . . . . . . . . . . . . . . . . 40,425 119,242Info Edge India Ltd. . . . . . . . . . . . . . . . . . . . . . 5,434 460,157Infosys Ltd. . . . . . . . . . . . . . . . . . . . . . . . . . . . . . 197,461 4,615,380Infosys Ltd., ADR . . . . . . . . . . . . . . . . . . . . . . . 116,024 2,763,692InterGlobe Aviation Ltd., 144A* . . . . . . . . . . . 4,574 119,297JSW Steel Ltd. . . . . . . . . . . . . . . . . . . . . . . . . . . 55,867 526,167Jubilant Foodworks Ltd. . . . . . . . . . . . . . . . . . 5,436 297,460Kansai Nerolac Paints Ltd. . . . . . . . . . . . . . . . 8,577 72,785Kotak Mahindra Bank Ltd. . . . . . . . . . . . . . . . . 83,260 1,999,973Larsen & Toubro Infotech Ltd., 144A . . . . . . 3,429 249,514Lupin Ltd. . . . . . . . . . . . . . . . . . . . . . . . . . . . . . . 12,008 157,544Mahindra & Mahindra Ltd. . . . . . . . . . . . . . . . 61,587 669,205Marico Ltd. . . . . . . . . . . . . . . . . . . . . . . . . . . . . . 42,426 316,390Maruti Suzuki India Ltd. . . . . . . . . . . . . . . . . . . 7,718 723,737Mindtree Ltd. . . . . . . . . . . . . . . . . . . . . . . . . . . . 4,005 198,981Motherson Sumi Systems Ltd.* . . . . . . . . . . . 56,552 169,329Mphasis Ltd.* . . . . . . . . . . . . . . . . . . . . . . . . . . 4,291 170,335MRF Ltd. . . . . . . . . . . . . . . . . . . . . . . . . . . . . . . . 254 277,433Muthoot Finance Ltd. . . . . . . . . . . . . . . . . . . . . 8,867 183,880Nestle India Ltd. . . . . . . . . . . . . . . . . . . . . . . . . 2,001 533,575NHPC Ltd. . . . . . . . . . . . . . . . . . . . . . . . . . . . . . . 176,586 65,185NMDC Ltd. . . . . . . . . . . . . . . . . . . . . . . . . . . . . . 40,426 85,301Oracle Financial Services Software Ltd. . . . . 2,285 147,087Page Industries Ltd. . . . . . . . . . . . . . . . . . . . . . 287 123,826PI Industries Ltd. . . . . . . . . . . . . . . . . . . . . . . . . 6,007 279,256Pidilite Industries Ltd. . . . . . . . . . . . . . . . . . . . 6,293 196,558Piramal Enterprises Ltd. . . . . . . . . . . . . . . . . . 4,864 173,664Power Finance Corp. Ltd. . . . . . . . . . . . . . . . . 51,867 91,681Power Grid Corp. of India Ltd. . . . . . . . . . . . . 143,994 345,846Punjab National Bank* . . . . . . . . . . . . . . . . . . 174,589 87,644REC Ltd. . . . . . . . . . . . . . . . . . . . . . . . . . . . . . . . 52,151 108,363SBI Cards & Payment Services Ltd.* . . . . . . . 17,155 268,002SBI Life Insurance Co. Ltd., 144A . . . . . . . . . . 39,284 641,420Shree Cement Ltd. . . . . . . . . . . . . . . . . . . . . . . 289 111,978
Numberof Shares Value
India (Continued)
Shriram Transport Finance Co. Ltd. . . . . . . . 10,865 $ 201,309Siemens Ltd. . . . . . . . . . . . . . . . . . . . . . . . . . . . 3,433 106,854SRF Ltd. . . . . . . . . . . . . . . . . . . . . . . . . . . . . . . . 2,000 277,773State Bank of India . . . . . . . . . . . . . . . . . . . . . . 170,298 993,808Steel Authority of India Ltd. . . . . . . . . . . . . . . 96,703 161,067Sun Pharmaceutical Industries Ltd. . . . . . . . . 60,732 660,538Tata Consultancy Services Ltd. . . . . . . . . . . . 83,893 4,351,014Tata Consumer Products Ltd. . . . . . . . . . . . . . 50,148 594,124Tata Motors Ltd.* . . . . . . . . . . . . . . . . . . . . . . . 90,365 355,605Tech Mahindra Ltd. . . . . . . . . . . . . . . . . . . . . . 33,221 658,732Titan Co. Ltd. . . . . . . . . . . . . . . . . . . . . . . . . . . . 19,733 519,384Torrent Pharmaceuticals Ltd. . . . . . . . . . . . . . 4,001 170,211UltraTech Cement Ltd. . . . . . . . . . . . . . . . . . . . 6,006 644,341UPL Ltd. . . . . . . . . . . . . . . . . . . . . . . . . . . . . . . . 25,165 255,502Voltas Ltd. . . . . . . . . . . . . . . . . . . . . . . . . . . . . . 16,586 226,239Wipro Ltd. . . . . . . . . . . . . . . . . . . . . . . . . . . . . . 119,863 1,052,305Yes Bank Ltd.* . . . . . . . . . . . . . . . . . . . . . . . . . . 1,333,792 197,308
(Cost $56,660,148) . . . . . . . . . . . . . . . . . . . . . . 59,411,225
Indonesia — 1.2%
Aneka Tambang Tbk . . . . . . . . . . . . . . . . . . . . 637,247 106,785PT Bank Central Asia Tbk . . . . . . . . . . . . . . . . 616,888 1,416,518PT Bank Mandiri Persero Tbk . . . . . . . . . . . . . 1,104,260 472,286PT Bank Negara Indonesia Persero Tbk . . . . 687,679 260,366PT Bank Rakyat Indonesia Persero Tbk . . . . 4,953,063 1,364,805PT Bank Syariah Indonesia Tbk* . . . . . . . . . . 2,509,988 390,687PT Barito Pacific Tbk . . . . . . . . . . . . . . . . . . . . 2,151,784 160,677PT Charoen Pokphand Indonesia Tbk . . . . . . 269,390 120,883PT Elang Mahkota Teknologi Tbk* . . . . . . . . 1,342,084 204,194PT Indah Kiat Pulp & Paper Tbk . . . . . . . . . . . 151,537 83,936PT Indocement Tunggal Prakarsa Tbk . . . . . 144,671 114,114PT Indofood Sukses Makmur Tbk* . . . . . . . . 216,037 93,534PT Kalbe Farma Tbk . . . . . . . . . . . . . . . . . . . . . 1,127,871 106,362PT Merdeka Copper Gold Tbk* . . . . . . . . . . . 796,445 157,474PT Sarana Menara Nusantara Tbk . . . . . . . . . 1,771,528 166,440PT Semen Indonesia Persero Tbk . . . . . . . . . 194,593 126,204PT Telkom Indonesia Persero Tbk . . . . . . . . . 2,640,762 629,524PT Unilever Indonesia Tbk . . . . . . . . . . . . . . . 548,714 155,814
(Cost $6,005,972) . . . . . . . . . . . . . . . . . . . . . . . . 6,130,603
Kuwait — 0.7%
Agility Public Warehousing Co. KSC . . . . . . . 85,894 285,266Boubyan Bank KSCP* . . . . . . . . . . . . . . . . . . . 81,033 210,934Kuwait Finance House KSCP . . . . . . . . . . . . . 332,874 914,076Mobile Telecommunications Co. KSC . . . . . 255,905 519,807National Bank of Kuwait SAKP . . . . . . . . . . . . 496,369 1,544,552
(Cost $3,441,635) . . . . . . . . . . . . . . . . . . . . . . . . 3,474,635
Malaysia — 0.8%
AMMB Holdings Bhd* . . . . . . . . . . . . . . . . . . . 57,400 41,838Axiata Group Bhd . . . . . . . . . . . . . . . . . . . . . . . 171,352 170,651CIMB Group Holdings Bhd . . . . . . . . . . . . . . . 257,429 304,060DiGi.Com Bhd . . . . . . . . . . . . . . . . . . . . . . . . . . 171,700 181,737Hartalega Holdings Bhd . . . . . . . . . . . . . . . . . 57,000 101,193Hong Leong Bank Bhd . . . . . . . . . . . . . . . . . . . 28,500 131,496Hong Leong Financial Group Bhd . . . . . . . . . 300 1,316IHH Healthcare Bhd . . . . . . . . . . . . . . . . . . . . . 57,300 88,218Inari Amertron Bhd . . . . . . . . . . . . . . . . . . . . . . 171,500 141,920
See Notes to Financial Statements. 26

DBX ETF Trust
Schedule of Investments
Xtrackers Emerging Markets Carbon Reduction and Climate Improvers ETF (Continued)August 31, 2021
Numberof Shares Value
Malaysia (Continued)
Kossan Rubber Industries . . . . . . . . . . . . . . . . 57,100 $ 42,581Kuala Lumpur Kepong Bhd . . . . . . . . . . . . . . . 28,600 146,956Malayan Banking Bhd . . . . . . . . . . . . . . . . . . . 143,089 289,138Malaysia Airports Holdings Bhd* . . . . . . . . . 28,900 46,093Maxis Bhd . . . . . . . . . . . . . . . . . . . . . . . . . . . . . 109,800 123,878MR DIY Group M Bhd, 144A . . . . . . . . . . . . . . 142,800 124,697Nestle Malaysia Bhd . . . . . . . . . . . . . . . . . . . . 19 616Petronas Chemicals Group Bhd . . . . . . . . . . . 85,500 170,712PPB Group Bhd . . . . . . . . . . . . . . . . . . . . . . . . . 28,700 127,862Press Metal Aluminium Holdings Bhd . . . . . 171,400 222,651Public Bank Bhd . . . . . . . . . . . . . . . . . . . . . . . . 657,700 661,339RHB Bank Bhd . . . . . . . . . . . . . . . . . . . . . . . . . . 114,214 153,586Sime Darby Bhd . . . . . . . . . . . . . . . . . . . . . . . . 86,000 48,824Sime Darby Plantation Bhd . . . . . . . . . . . . . . . 57,500 55,743Supermax Corp. Bhd . . . . . . . . . . . . . . . . . . . . 57,328 45,509Telekom Malaysia Bhd . . . . . . . . . . . . . . . . . . 85,600 125,816TIME dotCom Bhd . . . . . . . . . . . . . . . . . . . . . . 57,300 63,406Top Glove Corp. Bhd . . . . . . . . . . . . . . . . . . . . 228,500 219,870Westports Holdings Bhd . . . . . . . . . . . . . . . . . 57,100 60,438
(Cost $3,779,188) . . . . . . . . . . . . . . . . . . . . . . . . 3,892,144
Mexico — 1.9%
Alfa SAB de CV, Class A . . . . . . . . . . . . . . . . . 293,230 206,320America Movil SAB de CV, Series L . . . . . . . 1,709,597 1,686,605Arca Continental SAB de CV . . . . . . . . . . . . . . 25,166 162,465Cemex SAB de CV, Series CPO* . . . . . . . . . . 801,310 659,778Coca-Cola Femsa SAB de CV . . . . . . . . . . . . . 46,489 269,731Fibra Uno Administracion SA de CV REIT . . 183,156 208,843Gruma SAB de CV, Class B . . . . . . . . . . . . . . . 11,722 134,169Grupo Aeroportuario del Pacifico SAB deCV, Class B* . . . . . . . . . . . . . . . . . . . . . . . . . . . 21,733 253,645
Grupo Aeroportuario del Sureste SAB deCV, Class B* . . . . . . . . . . . . . . . . . . . . . . . . . . . 7,432 133,672
Grupo Bimbo SAB de CV, Series A . . . . . . . . 89,662 227,382Grupo Elektra SAB DE CV (a) . . . . . . . . . . . . . 4,292 342,747Grupo Financiero Banorte SAB de CV,Class O . . . . . . . . . . . . . . . . . . . . . . . . . . . . . . . 276,820 1,831,423
Grupo Financiero Inbursa SAB de CV,Class O* . . . . . . . . . . . . . . . . . . . . . . . . . . . . . . 115,451 110,787
Grupo Mexico SAB de CV, Series B . . . . . . . 176,293 822,985Grupo Televisa SAB, Series CPO . . . . . . . . . . 244,740 646,550Industrias Penoles SAB de CV* . . . . . . . . . . . 7,434 105,574Kimberly-Clark de Mexico SAB de CV,Class A . . . . . . . . . . . . . . . . . . . . . . . . . . . . . . . 162,686 287,955
Orbia Advance Corp. SAB de CV . . . . . . . . . . 60,499 173,109Telesites SAB de CV* . . . . . . . . . . . . . . . . . . . . 110,593 101,931Wal-Mart de Mexico SAB de CV . . . . . . . . . . 291,457 1,039,323
(Cost $9,022,973) . . . . . . . . . . . . . . . . . . . . . . . . 9,404,994
Peru — 0.1%
Credicorp Ltd.* . . . . . . . . . . . . . . . . . . . . . . . . . 1,733 184,755Credicorp Ltd.* . . . . . . . . . . . . . . . . . . . . . . . . . 1,250 133,288Intercorp Financial Services, Inc. . . . . . . . . . . 2,500 56,525
(Cost $363,562) . . . . . . . . . . . . . . . . . . . . . . . . . 374,568
Philippines — 0.5%
Ayala Corp. . . . . . . . . . . . . . . . . . . . . . . . . . . . . 14,320 228,113Ayala Land, Inc. . . . . . . . . . . . . . . . . . . . . . . . . . 428,800 290,894
Numberof Shares Value
Philippines (Continued)
Bank of the Philippine Islands . . . . . . . . . . . . 160,130 $ 267,795BDO Unibank, Inc. . . . . . . . . . . . . . . . . . . . . . . 160,110 353,690International Container Terminal Services,Inc. . . . . . . . . . . . . . . . . . . . . . . . . . . . . . . . . . . . 45,730 171,062
Jollibee Foods Corp. . . . . . . . . . . . . . . . . . . . . 25,750 104,449Manila Electric Co. . . . . . . . . . . . . . . . . . . . . . . 11,440 64,846Metropolitan Bank & Trust Co. . . . . . . . . . . . . 85,600 77,771PLDT, Inc. . . . . . . . . . . . . . . . . . . . . . . . . . . . . . . 4,295 126,476SM Investments Corp. . . . . . . . . . . . . . . . . . . . 17,170 348,232SM Prime Holdings, Inc. . . . . . . . . . . . . . . . . . 600,200 410,187Universal Robina Corp. . . . . . . . . . . . . . . . . . . 45,760 138,706
(Cost $2,528,493) . . . . . . . . . . . . . . . . . . . . . . . . 2,582,221
Qatar — 0.8%
Commercial Bank PSQC . . . . . . . . . . . . . . . . . 99,849 165,583Industries Qatar QSC . . . . . . . . . . . . . . . . . . . . 168,009 592,946Masraf Al Rayan QSC . . . . . . . . . . . . . . . . . . . . 220,732 275,839Mesaieed Petrochemical Holding Co. . . . . . . 366,619 201,384Ooredoo QPSC . . . . . . . . . . . . . . . . . . . . . . . . . 32,364 61,448Qatar International Islamic Bank QSC . . . . . . 75,027 197,819Qatar Islamic Bank SAQ . . . . . . . . . . . . . . . . . 68,736 345,474Qatar National Bank QPSC . . . . . . . . . . . . . . . 413,623 2,177,740
(Cost $4,027,257) . . . . . . . . . . . . . . . . . . . . . . . . 4,018,233
Russia — 1.4%
Alrosa PJSC . . . . . . . . . . . . . . . . . . . . . . . . . . . . 116,597 232,096MMC Norilsk Nickel PJSC . . . . . . . . . . . . . . . . 3,433 1,127,413Mobile TeleSystems PJSC, ADR . . . . . . . . . . 24,880 233,374Mobile TeleSystems PJSC . . . . . . . . . . . . . . . 19,731 88,627Novolipetsk Steel PJSC . . . . . . . . . . . . . . . . . . 88,347 297,759Polymetal International PLC . . . . . . . . . . . . . . 17,729 354,120Polyus PJSC . . . . . . . . . . . . . . . . . . . . . . . . . . . . 1,713 308,829Sberbank of Russia PJSC . . . . . . . . . . . . . . . . 607,454 2,727,717United Co RUSAL International PJSC* . . . . . 156,680 113,138Yandex NV, Class A* . . . . . . . . . . . . . . . . . . . . 18,012 1,374,071
(Cost $6,641,191) . . . . . . . . . . . . . . . . . . . . . . . . 6,857,144
Saudi Arabia — 2.1%
Advanced Petrochemical Co. . . . . . . . . . . . . . 8,294 158,331Al Rajhi Bank . . . . . . . . . . . . . . . . . . . . . . . . . . . 70,451 2,272,795Alinma Bank . . . . . . . . . . . . . . . . . . . . . . . . . . . 75,310 459,807Almarai Co. JSC . . . . . . . . . . . . . . . . . . . . . . . . 18,012 278,534Arab National Bank . . . . . . . . . . . . . . . . . . . . . 42,145 257,093Arabian Centres Co. Ltd. . . . . . . . . . . . . . . . . . 14,869 99,108Bank AlBilad* . . . . . . . . . . . . . . . . . . . . . . . . . . 29,737 338,939Banque Saudi Fransi . . . . . . . . . . . . . . . . . . . . 45,001 485,920Bupa Arabia for Cooperative InsuranceCo. . . . . . . . . . . . . . . . . . . . . . . . . . . . . . . . . . . . 4,289 190,968
Dar Al Arkan Real Estate DevelopmentCo.* . . . . . . . . . . . . . . . . . . . . . . . . . . . . . . . . . . 43,858 119,271
Dr Sulaiman Al Habib Medical ServicesGroup Co. . . . . . . . . . . . . . . . . . . . . . . . . . . . . . 6,293 308,048
Etihad Etisalat Co. . . . . . . . . . . . . . . . . . . . . . . . 28,650 244,434Jarir Marketing Co. . . . . . . . . . . . . . . . . . . . . . . 4,860 280,661Mouwasat Medical Services Co. . . . . . . . . . . 3,717 194,239National Industrialization Co.* . . . . . . . . . . . . 26,304 146,433National Petrochemical Co. . . . . . . . . . . . . . . 10,008 126,744Riyad Bank . . . . . . . . . . . . . . . . . . . . . . . . . . . . . 111,572 800,194
See Notes to Financial Statements. 27

DBX ETF Trust
Schedule of Investments
Xtrackers Emerging Markets Carbon Reduction and Climate Improvers ETF (Continued)August 31, 2021
Numberof Shares Value
Saudi Arabia (Continued)
Sahara International Petrochemical Co. . . . . 29,508 $ 261,982Saudi British Bank . . . . . . . . . . . . . . . . . . . . . . 66,448 610,322Saudi Industrial Investment Group . . . . . . . . 18,587 177,906Saudi Kayan Petrochemical Co.* . . . . . . . . . . 57,013 283,036Saudi National Bank . . . . . . . . . . . . . . . . . . . . . 124,209 2,013,466Savola Group . . . . . . . . . . . . . . . . . . . . . . . . . . 20,305 217,358
(Cost $10,200,156) . . . . . . . . . . . . . . . . . . . . . . 10,325,589
Singapore — 0.0%
Ascendas Real Estate Investment TrustREIT . . . . . . . . . . . . . . . . . . . . . . . . . . . . . . . . . . 72 163
BOC Aviation Ltd., 144A . . . . . . . . . . . . . . . . . 8,579 64,309JOYY, Inc., ADR . . . . . . . . . . . . . . . . . . . . . . . . 2,859 180,975
(Cost $223,922) . . . . . . . . . . . . . . . . . . . . . . . . . 245,447
South Africa — 3.3%
Absa Group Ltd.* . . . . . . . . . . . . . . . . . . . . . . . 56,207 614,139Anglo American Platinum Ltd. . . . . . . . . . . . . 2,575 293,445AngloGold Ashanti Ltd. . . . . . . . . . . . . . . . . . . 21,159 356,785Aspen Pharmacare Holdings Ltd.* . . . . . . . . 20,876 283,027Bid Corp. Ltd.* . . . . . . . . . . . . . . . . . . . . . . . . . . 18,014 398,363Bidvest Group Ltd. . . . . . . . . . . . . . . . . . . . . . . 11,722 166,126Capitec Bank Holdings Ltd. . . . . . . . . . . . . . . . 3,434 450,515Clicks Group Ltd. . . . . . . . . . . . . . . . . . . . . . . . . 14,013 293,106Discovery Ltd.* . . . . . . . . . . . . . . . . . . . . . . . . . 32,765 291,680FirstRand Ltd. . . . . . . . . . . . . . . . . . . . . . . . . . . 351,506 1,503,955Gold Fields Ltd. (a) . . . . . . . . . . . . . . . . . . . . . . 42,769 403,533Harmony Gold Mining Co. Ltd. . . . . . . . . . . . 41,341 152,531Impala Platinum Holdings Ltd. . . . . . . . . . . . . 44,774 689,950Kumba Iron Ore Ltd. (a) . . . . . . . . . . . . . . . . . . 3,143 141,886MTN Group Ltd.* . . . . . . . . . . . . . . . . . . . . . . . 90,521 835,058MultiChoice Group . . . . . . . . . . . . . . . . . . . . . . 23,732 188,511Naspers Ltd., Class N (a) . . . . . . . . . . . . . . . . . 24,306 4,167,223Nedbank Group Ltd.* . . . . . . . . . . . . . . . . . . . . 38,197 488,520Northam Platinum Ltd.* . . . . . . . . . . . . . . . . . 19,159 264,888Old Mutual Ltd. . . . . . . . . . . . . . . . . . . . . . . . . . 442,368 469,739Pepkor Holdings Ltd., 144A* . . . . . . . . . . . . . 65,130 103,650Rand Merchant Investment Holdings Ltd. . . 56,779 124,352Sanlam Ltd. . . . . . . . . . . . . . . . . . . . . . . . . . . . . 157,539 701,819Shoprite Holdings Ltd. . . . . . . . . . . . . . . . . . . . 22,876 290,754Sibanye Stillwater Ltd. . . . . . . . . . . . . . . . . . . . 160,115 651,972Standard Bank Group Ltd. . . . . . . . . . . . . . . . 121,744 1,251,611Vodacom Group Ltd. . . . . . . . . . . . . . . . . . . . . 32,133 319,109Woolworths Holdings Ltd.* . . . . . . . . . . . . . . 89,661 394,533
(Cost $15,383,082) . . . . . . . . . . . . . . . . . . . . . . 16,290,780
South Korea — 11.2%
Alteogen, Inc.* . . . . . . . . . . . . . . . . . . . . . . . . . 1,716 125,801Amorepacific Corp. . . . . . . . . . . . . . . . . . . . . . . 1,432 280,978AMOREPACIFIC Group . . . . . . . . . . . . . . . . . . 1,145 57,080BGF retail Co. Ltd. . . . . . . . . . . . . . . . . . . . . . . . 574 88,369BNK Financial Group, Inc. . . . . . . . . . . . . . . . . 25,165 168,425Celltrion Healthcare Co. Ltd.* . . . . . . . . . . . . . 4,288 457,480Celltrion Pharm, Inc.* . . . . . . . . . . . . . . . . . . . . 1,141 170,149Celltrion, Inc.* . . . . . . . . . . . . . . . . . . . . . . . . . . 4,859 1,227,899Cheil Worldwide, Inc. . . . . . . . . . . . . . . . . . . . . 4,288 85,431CJ CheilJedang Corp. . . . . . . . . . . . . . . . . . . . 521 203,781CJ Corp. . . . . . . . . . . . . . . . . . . . . . . . . . . . . . . . 572 50,074
Numberof Shares Value
South Korea (Continued)
CJ ENM Co. Ltd. . . . . . . . . . . . . . . . . . . . . . . . . 859 $ 113,427Coway Co. Ltd. . . . . . . . . . . . . . . . . . . . . . . . . . 4,578 308,767CS Wind Corp. . . . . . . . . . . . . . . . . . . . . . . . . . . 1,431 98,613DB Insurance Co. Ltd. . . . . . . . . . . . . . . . . . . . . 3,718 188,233DL E&C Co. Ltd.* . . . . . . . . . . . . . . . . . . . . . . . . 1,427 173,537Doosan Bobcat, Inc.* . . . . . . . . . . . . . . . . . . . . 2,000 74,777Doosan Fuel Cell Co. Ltd.* . . . . . . . . . . . . . . . 2,575 121,926Doosan Heavy Industries & ConstructionCo. Ltd.* . . . . . . . . . . . . . . . . . . . . . . . . . . . . . . 13,440 242,267
Douzone Bizon Co. Ltd. . . . . . . . . . . . . . . . . . . 1,716 126,245Ecopro BM Co. Ltd. . . . . . . . . . . . . . . . . . . . . . . 289 79,862E-MART, Inc. . . . . . . . . . . . . . . . . . . . . . . . . . . . 859 132,615Fila Holdings Corp. . . . . . . . . . . . . . . . . . . . . . . 2,858 110,677Genexine, Inc.* . . . . . . . . . . . . . . . . . . . . . . . . . 1,428 91,879Green Cross Corp. . . . . . . . . . . . . . . . . . . . . . . 287 95,299GS Engineering & Construction Corp. . . . . . 2,286 88,230Hana Financial Group, Inc. . . . . . . . . . . . . . . . 24,877 966,587Hankook Tire & Technology Co. Ltd. . . . . . . 4,289 172,381Hanmi Pharm. Co. Ltd. . . . . . . . . . . . . . . . . . . . 289 77,020Hanmi Science Co. Ltd. . . . . . . . . . . . . . . . . . . 1,429 90,464Hanon Systems . . . . . . . . . . . . . . . . . . . . . . . . . 8,577 121,688Hansol Chemical Co. Ltd. . . . . . . . . . . . . . . . . 573 143,565Hanwha Life Insurance Co. Ltd. . . . . . . . . . . . 41,855 120,390Hanwha Solutions Corp.* . . . . . . . . . . . . . . . . 5,433 190,948Helixmith Co. Ltd.* . . . . . . . . . . . . . . . . . . . . . . 4,860 110,031HLB, Inc.* . . . . . . . . . . . . . . . . . . . . . . . . . . . . . . 3,719 178,019HMM Co. Ltd.* . . . . . . . . . . . . . . . . . . . . . . . . . 20,586 745,709Hugel, Inc.* . . . . . . . . . . . . . . . . . . . . . . . . . . . . 570 95,864HYBE Co. Ltd.* . . . . . . . . . . . . . . . . . . . . . . . . . 1,428 356,554Hyundai Elevator Co. Ltd. . . . . . . . . . . . . . . . . 2,002 86,679Hyundai Engineering & Construction Co.Ltd. . . . . . . . . . . . . . . . . . . . . . . . . . . . . . . . . . . . 4,001 191,518
Hyundai Glovis Co. Ltd. . . . . . . . . . . . . . . . . . . 860 143,896Hyundai Marine & Fire Insurance Co.Ltd. . . . . . . . . . . . . . . . . . . . . . . . . . . . . . . . . . . . 5,146 113,621
Hyundai Mipo Dockyard Co. Ltd.* . . . . . . . . . 1,432 94,236Hyundai Mobis Co. Ltd. . . . . . . . . . . . . . . . . . . 3,146 752,956Hyundai Motor Co. . . . . . . . . . . . . . . . . . . . . . . 6,861 1,257,460Hyundai Steel Co. . . . . . . . . . . . . . . . . . . . . . . . 4,575 201,238Industrial Bank of Korea . . . . . . . . . . . . . . . . . 12,867 114,304Kakao Corp. . . . . . . . . . . . . . . . . . . . . . . . . . . . . 13,437 1,796,313Kakao Games Corp.* . . . . . . . . . . . . . . . . . . . . 2,576 180,406KB Financial Group, Inc. . . . . . . . . . . . . . . . . . 30,081 1,372,448KCC Corp. . . . . . . . . . . . . . . . . . . . . . . . . . . . . . . 287 89,111Kia Corp. . . . . . . . . . . . . . . . . . . . . . . . . . . . . . . . 12,298 902,635KIWOOM Securities Co. Ltd. . . . . . . . . . . . . . . 1,141 116,122KMW Co. Ltd.* . . . . . . . . . . . . . . . . . . . . . . . . . 2,001 73,520Korea Investment Holdings Co. Ltd. . . . . . . . 1,718 141,210Korea Zinc Co. Ltd. . . . . . . . . . . . . . . . . . . . . . . 571 261,997Korean Air Lines Co. Ltd.* . . . . . . . . . . . . . . . 10,865 293,307Kumho Petrochemical Co. Ltd. . . . . . . . . . . . . 857 143,763LEENO Industrial, Inc. . . . . . . . . . . . . . . . . . . . 858 131,869LG Chem Ltd. . . . . . . . . . . . . . . . . . . . . . . . . . . . 2,428 1,587,325LG Corp. . . . . . . . . . . . . . . . . . . . . . . . . . . . . . . . 5,150 423,300LG Display Co. Ltd.* . . . . . . . . . . . . . . . . . . . . . 12,296 217,403LG Electronics, Inc. . . . . . . . . . . . . . . . . . . . . . . 8,581 1,050,931LG Household & Health Care Ltd. . . . . . . . . . 488 614,919
See Notes to Financial Statements. 28

DBX ETF Trust
Schedule of Investments
Xtrackers Emerging Markets Carbon Reduction and Climate Improvers ETF (Continued)August 31, 2021
Numberof Shares Value
South Korea (Continued)
LG Innotek Co. Ltd. . . . . . . . . . . . . . . . . . . . . . . 575 $ 106,624LG Uplus Corp. . . . . . . . . . . . . . . . . . . . . . . . . . 20,873 252,935Lotte Chemical Corp. . . . . . . . . . . . . . . . . . . . . 859 185,217LS Corp. . . . . . . . . . . . . . . . . . . . . . . . . . . . . . . . 1,713 98,396Mando Corp.* . . . . . . . . . . . . . . . . . . . . . . . . . . 2,289 119,835Meritz Fire & Marine Insurance Co. Ltd. . . . . 3,145 72,017Meritz Securities Co. Ltd. . . . . . . . . . . . . . . . . 22,875 105,748Mirae Asset Securities Co. Ltd. . . . . . . . . . . . 28,650 217,942NAVER Corp. . . . . . . . . . . . . . . . . . . . . . . . . . . . 6,864 2,598,901NCSoft Corp. . . . . . . . . . . . . . . . . . . . . . . . . . . . 857 487,835Netmarble Corp., 144A . . . . . . . . . . . . . . . . . . 1,141 126,947NH Investment & Securities Co. Ltd. . . . . . . . 7,146 81,663Orion Corp. . . . . . . . . . . . . . . . . . . . . . . . . . . . . 860 93,829Pan Ocean Co. Ltd. . . . . . . . . . . . . . . . . . . . . . . 11,438 81,978Pearl Abyss Corp.* . . . . . . . . . . . . . . . . . . . . . . 1,717 139,646S-1 Corp. . . . . . . . . . . . . . . . . . . . . . . . . . . . . . . . 1,428 101,116Samsung Biologics Co. Ltd., 144A* . . . . . . . 794 660,839Samsung C&T Corp. . . . . . . . . . . . . . . . . . . . . 4,004 459,297Samsung Electro-Mechanics Co. Ltd. . . . . . . 2,861 455,263Samsung Electronics Co. Ltd. . . . . . . . . . . . . . 268,601 17,768,508Samsung Engineering Co. Ltd.* . . . . . . . . . . 8,290 159,801Samsung Fire & Marine Insurance Co.Ltd. . . . . . . . . . . . . . . . . . . . . . . . . . . . . . . . . . . . 2,859 557,276
Samsung Life Insurance Co. Ltd. . . . . . . . . . . 6,290 404,161Samsung SDI Co. Ltd. . . . . . . . . . . . . . . . . . . . 4,291 2,934,808Samsung SDS Co. Ltd. . . . . . . . . . . . . . . . . . . 1,716 255,302Samsung Securities Co. Ltd. . . . . . . . . . . . . . 5,147 219,517Seegene, Inc. . . . . . . . . . . . . . . . . . . . . . . . . . . . 2,290 129,960Shin Poong Pharmaceutical Co. Ltd. . . . . . . . 2,287 139,258Shinhan Financial Group Co. Ltd. . . . . . . . . . 42,144 1,412,130Shinsegae, Inc. . . . . . . . . . . . . . . . . . . . . . . . . . 288 66,818SK Biopharmaceuticals Co. Ltd.* . . . . . . . . . . 1,718 185,958SK Bioscience Co. Ltd.* . . . . . . . . . . . . . . . . . . 33 8,923SK Chemicals Co. Ltd. . . . . . . . . . . . . . . . . . . . 572 133,201SK Hynix, Inc. . . . . . . . . . . . . . . . . . . . . . . . . . . 26,594 2,442,762SK IE Technology Co. Ltd., 144A* . . . . . . . . . 1,716 307,102SK Materials Co. Ltd. . . . . . . . . . . . . . . . . . . . . 285 99,429SK Telecom Co. Ltd. . . . . . . . . . . . . . . . . . . . . . 1,141 293,258Soulbrain Co. Ltd./New . . . . . . . . . . . . . . . . . . 289 70,614SSANGYONG C&E Co. Ltd. . . . . . . . . . . . . . . 11,152 81,083Studio Dragon Corp.* . . . . . . . . . . . . . . . . . . . 1,141 85,616WONIK IPS Co. Ltd. . . . . . . . . . . . . . . . . . . . . . 3,145 122,876Woori Financial Group, Inc. . . . . . . . . . . . . . . 24,303 235,809Yuhan Corp. . . . . . . . . . . . . . . . . . . . . . . . . . . . . 1,431 77,138
(Cost $53,673,193) . . . . . . . . . . . . . . . . . . . . . . 55,320,864
Taiwan — 19.5%
Accton Technology Corp. . . . . . . . . . . . . . . . . 36,366 368,076Acer, Inc. . . . . . . . . . . . . . . . . . . . . . . . . . . . . . . . 287,699 261,606Advantech Co. Ltd. . . . . . . . . . . . . . . . . . . . . . . 22,306 310,683ASE Technology Holding Co. Ltd.* . . . . . . . . 138,560 642,465Asia Cement Corp. . . . . . . . . . . . . . . . . . . . . . . 74,457 120,631ASMedia Technology, Inc. . . . . . . . . . . . . . . . 2,002 149,896Asustek Computer, Inc. . . . . . . . . . . . . . . . . . . 34,708 405,773AU Optronics Corp. . . . . . . . . . . . . . . . . . . . . . 784,870 498,447Catcher Technology Co. Ltd. . . . . . . . . . . . . . 39,281 236,705Cathay Financial Holding Co. Ltd. . . . . . . . . . 692,685 1,489,672
Numberof Shares Value
Taiwan (Continued)
Chailease Holding Co. Ltd. . . . . . . . . . . . . . . . 122,721 $ 1,180,116Chang Hwa Commercial Bank Ltd. . . . . . . . . 534,830 318,426Cheng Shin Rubber Industry Co. Ltd. . . . . . . 108,428 145,739Chicony Electronics Co. Ltd. . . . . . . . . . . . . . . 37,853 107,221China Airlines Ltd.* . . . . . . . . . . . . . . . . . . . . . 179,446 111,694China Development Financial HoldingCorp. . . . . . . . . . . . . . . . . . . . . . . . . . . . . . . . . . 1,355,295 694,434
China Life Insurance Co. Ltd. . . . . . . . . . . . . . 210,099 219,094China Steel Corp. . . . . . . . . . . . . . . . . . . . . . . . 657,230 904,733Chroma ATE, Inc. . . . . . . . . . . . . . . . . . . . . . . . 30,367 196,687Chunghwa Telecom Co. Ltd. . . . . . . . . . . . . . 208,329 841,931Compal Electronics, Inc. . . . . . . . . . . . . . . . . . 217,876 180,034CTBC Financial Holding Co. Ltd. . . . . . . . . . . 1,652,712 1,371,619Delta Electronics, Inc. . . . . . . . . . . . . . . . . . . . . 176,588 1,723,602E.Sun Financial Holding Co. Ltd. . . . . . . . . . . 1,067,484 1,024,594Eclat Textile Co. Ltd. . . . . . . . . . . . . . . . . . . . . . 17,440 350,518Eva Airways Corp. . . . . . . . . . . . . . . . . . . . . . . 156,001 108,078Evergreen Marine Corp. Taiwan Ltd. . . . . . . 146,276 717,828Far Eastern New Century Corp. . . . . . . . . . . . 147,709 160,162Far EasTone Telecommunications Co.Ltd. . . . . . . . . . . . . . . . . . . . . . . . . . . . . . . . . . . . 154,855 344,203
Feng TAY Enterprise Co. Ltd. . . . . . . . . . . . . . 39,856 310,639First Financial Holding Co. Ltd. . . . . . . . . . . . 916,941 757,679Formosa Chemicals & Fibre Corp. . . . . . . . . . 184,174 558,899Formosa Plastics Corp. . . . . . . . . . . . . . . . . . . 172,586 638,319Foxconn Technology Co. Ltd. . . . . . . . . . . . . . 69,305 165,801Fubon Financial Holding Co. Ltd. . . . . . . . . . . 556,472 1,706,754Giant Manufacturing Co. Ltd. . . . . . . . . . . . . . 17,727 214,283Globalwafers Co. Ltd. . . . . . . . . . . . . . . . . . . . . 12,009 376,994Highwealth Construction Corp. . . . . . . . . . . . 61,299 106,613Hiwin Technologies Corp. . . . . . . . . . . . . . . . . 12,297 144,652Hon Hai Precision Industry Co. Ltd. . . . . . . . . 674,102 2,699,959Hotai Motor Co. Ltd. . . . . . . . . . . . . . . . . . . . . . 14,586 306,841Hua Nan Financial Holdings Co. Ltd.* . . . . . 864,413 651,893Innolux Corp. . . . . . . . . . . . . . . . . . . . . . . . . . . . 512,667 319,105Inventec Corp. . . . . . . . . . . . . . . . . . . . . . . . . . . 93,843 82,284Largan Precision Co. Ltd. . . . . . . . . . . . . . . . . 5,146 497,638Lite-On Technology Corp. . . . . . . . . . . . . . . . . 114,147 252,072Macronix International Co. Ltd.* . . . . . . . . . . 116,720 169,730MediaTek, Inc. . . . . . . . . . . . . . . . . . . . . . . . . . . 83,034 2,699,538Mega Financial Holding Co. Ltd. . . . . . . . . . . 911,075 1,078,293Merida Industry Co. Ltd. . . . . . . . . . . . . . . . . . 20,014 230,374Micro-Star International Co. Ltd. . . . . . . . . . . 65,591 308,861momo.com, Inc. . . . . . . . . . . . . . . . . . . . . . . . . 4,577 283,239Nan Ya Plastics Corp. . . . . . . . . . . . . . . . . . . . . 266,199 860,643Nan Ya Printed Circuit Board Corp. . . . . . . . . 12,866 195,682Nanya Technology Corp. . . . . . . . . . . . . . . . . . 110,426 264,575Nien Made Enterprise Co. Ltd. . . . . . . . . . . . . 8,865 132,430Novatek Microelectronics Corp. . . . . . . . . . . . 20,591 333,605Oneness Biotech Co. Ltd.* . . . . . . . . . . . . . . . 17,444 121,482Pegatron Corp. . . . . . . . . . . . . . . . . . . . . . . . . . 96,415 225,439Phison Electronics Corp. . . . . . . . . . . . . . . . . . 10,006 154,169Pou Chen Corp. . . . . . . . . . . . . . . . . . . . . . . . . . 128,499 152,779Powertech Technology, Inc. . . . . . . . . . . . . . . 39,856 161,791Quanta Computer, Inc. . . . . . . . . . . . . . . . . . . . 145,423 411,394Realtek Semiconductor Corp. . . . . . . . . . . . . . 17,157 342,973Ruentex Development Co. Ltd. . . . . . . . . . . . 53,011 132,559
See Notes to Financial Statements. 29

DBX ETF Trust
Schedule of Investments
Xtrackers Emerging Markets Carbon Reduction and Climate Improvers ETF (Continued)August 31, 2021
Numberof Shares Value
Taiwan (Continued)
Ruentex Industries Ltd. . . . . . . . . . . . . . . . . . . 24,305 $ 97,348Shanghai Commercial & Savings BankLtd. . . . . . . . . . . . . . . . . . . . . . . . . . . . . . . . . . . . 308,912 501,598
Shin Kong Financial Holding Co. Ltd. . . . . . . 1,057,874 362,632Silicon Motion Technology Corp., ADR . . . . 2,857 213,304Sino-American Silicon Products, Inc. . . . . . . 31,221 217,427SinoPac Financial Holdings Co. Ltd. . . . . . . . 956,883 492,020Standard Foods Corp. . . . . . . . . . . . . . . . . . . . 61,873 116,541Synnex Technology International Corp. . . . . 52,720 102,345Taishin Financial Holding Co. Ltd.* . . . . . . . . 1,000,111 698,293Taiwan Business Bank* . . . . . . . . . . . . . . . . . . 168,011 58,745Taiwan Cement Corp. . . . . . . . . . . . . . . . . . . . 217,300 379,894Taiwan Cooperative Financial Holding Co.Ltd. . . . . . . . . . . . . . . . . . . . . . . . . . . . . . . . . . . . 466,235 376,003
Taiwan Fertilizer Co. Ltd. . . . . . . . . . . . . . . . . . 54,556 111,224Taiwan High Speed Rail Corp. . . . . . . . . . . . . 211,813 230,817Taiwan Mobile Co. Ltd. . . . . . . . . . . . . . . . . . . 151,423 551,851Taiwan Semiconductor Manufacturing Co.Ltd. . . . . . . . . . . . . . . . . . . . . . . . . . . . . . . . . . . . 2,292,788 50,797,331
Tatung Co. Ltd.* . . . . . . . . . . . . . . . . . . . . . . . . 123,637 136,291Teco Electric and Machinery Co. Ltd. . . . . . . 117,573 132,364Tripod Technology Corp. . . . . . . . . . . . . . . . . 38,138 157,569Unimicron Technology Corp. . . . . . . . . . . . . . 92,124 490,313Uni-President Enterprises Corp.* . . . . . . . . . 176,305 459,951United Microelectronics Corp. . . . . . . . . . . . . 1,064,452 2,423,617Vanguard International SemiconductorCorp. . . . . . . . . . . . . . . . . . . . . . . . . . . . . . . . . . 86,691 462,961
Voltronic Power Technology Corp. . . . . . . . . 4,864 217,633Walsin Lihwa Corp. . . . . . . . . . . . . . . . . . . . . . 212,441 205,822Walsin Technology Corp.* . . . . . . . . . . . . . . . 21,443 139,660Wan Hai Lines Ltd.* . . . . . . . . . . . . . . . . . . . . . 40,429 361,787Win Semiconductors Corp. . . . . . . . . . . . . . . . 18,300 218,238Winbond Electronics Corp. . . . . . . . . . . . . . . . 167,724 178,536Wistron Corp. . . . . . . . . . . . . . . . . . . . . . . . . . . 251,044 248,204Wiwynn Corp. . . . . . . . . . . . . . . . . . . . . . . . . . . 7,150 250,257WPG Holdings Ltd. . . . . . . . . . . . . . . . . . . . . . . 67,018 117,043Yageo Corp. . . . . . . . . . . . . . . . . . . . . . . . . . . . . 21,446 371,059Yang Ming Marine Transport Corp.* . . . . . . 130,214 627,260Yuanta Financial Holding Co. Ltd. . . . . . . . . . 1,048,152 945,525Zhen Ding Technology Holding Ltd. . . . . . . . 55,295 198,127
(Cost $92,141,083) . . . . . . . . . . . . . . . . . . . . . . 96,884,238
Thailand — 1.4%
Advanced Info Service PCL, NVDR . . . . . . . . 57,400 334,793Airports of Thailand PCL, NVDR . . . . . . . . . . 228,600 452,129Bangkok Bank PCL . . . . . . . . . . . . . . . . . . . . . . 57,100 201,952Bangkok Bank PCL, NVDR . . . . . . . . . . . . . . . . 57,100 201,952Bangkok Dusit Medical Services PCL,NVDR . . . . . . . . . . . . . . . . . . . . . . . . . . . . . . . . . 371,700 269,845
Bangkok Expressway & Metro PCL . . . . . . . . 371,800 99,777Bangkok Expressway & Metro PCL,NVDR . . . . . . . . . . . . . . . . . . . . . . . . . . . . . . . . . 371,800 99,777
Berli Jucker PCL, NVDR . . . . . . . . . . . . . . . . . . 85,500 96,157BTS Group Holdings PCL, NVDR . . . . . . . . . . 286,100 83,436Bumrungrad Hospital PCL, NVDR . . . . . . . . . 28,600 118,011Carabao Group PCL, NVDR . . . . . . . . . . . . . . . 28,500 123,788Central Pattana PCL, NVDR . . . . . . . . . . . . . . . 114,300 190,603
Numberof Shares Value
Thailand (Continued)
Central Retail Corp. PCL . . . . . . . . . . . . . . . . . 142,800 $ 148,415Central Retail Corp. PCL, NVDR . . . . . . . . . . . 142,800 151,738Charoen Pokphand Foods PCL, NVDR . . . . . 200,300 167,784Energy Absolute PCL, NVDR . . . . . . . . . . . . . 200,200 406,829Fabrinet* . . . . . . . . . . . . . . . . . . . . . . . . . . . . . . 1,713 176,473Home Product Center PCL, NVDR . . . . . . . . . 343,200 152,261Indorama Ventures PCL, NVDR . . . . . . . . . . . 114,300 155,142Intouch Holdings PCL, Class F . . . . . . . . . . . . 57,000 151,198Intouch Holdings PCL, NVDR . . . . . . . . . . . . . 114,400 303,458Kasikornbank PCL, NVDR . . . . . . . . . . . . . . . . 143,000 545,692Krung Thai Bank PCL, NVDR . . . . . . . . . . . . . 486,300 168,977Krungthai Card PCL . . . . . . . . . . . . . . . . . . . . . 28,900 59,401Krungthai Card PCL, NVDR . . . . . . . . . . . . . . . 28,900 59,401Land & Houses PCL, NVDR . . . . . . . . . . . . . . . 343,200 86,778Minor International PCL, NVDR* . . . . . . . . . . 114,631 116,471Muangthai Capital PCL . . . . . . . . . . . . . . . . . . 600 1,205Osotspa PCL . . . . . . . . . . . . . . . . . . . . . . . . . . . 85,700 80,761Osotspa PCL, NVDR . . . . . . . . . . . . . . . . . . . . . 85,700 97,047SCG Packaging PCL . . . . . . . . . . . . . . . . . . . . . 57,000 118,483SCG Packaging PCL, NVDR . . . . . . . . . . . . . . . 57,000 123,788Siam Cement PCL, NVDR . . . . . . . . . . . . . . . . 28,600 381,540Siam Commercial Bank PCL, NVDR . . . . . . . 114,200 377,330Sri Trang Gloves Thailand PCL . . . . . . . . . . . 57,500 66,674Thai Union Group PCL, NVDR . . . . . . . . . . . . 86,000 53,096TMBThanachart Bank PCL, NVDR . . . . . . . . . 4,105,700 136,294True Corp. PCL, NVDR . . . . . . . . . . . . . . . . . . . 2,258,900 232,670
(Cost $6,520,142) . . . . . . . . . . . . . . . . . . . . . . . . 6,791,126
Turkey — 0.6%
Akbank TAS . . . . . . . . . . . . . . . . . . . . . . . . . . . . 324,685 230,007Akcansa Cimento AS . . . . . . . . . . . . . . . . . . . . 113,449 208,764Arcelik AS . . . . . . . . . . . . . . . . . . . . . . . . . . . . . . 41,054 158,597BIM Birlesik Magazalar AS . . . . . . . . . . . . . . . 30,989 267,792Coca-Cola Icecek AS . . . . . . . . . . . . . . . . . . . . . 12,010 126,463Eregli Demir ve Celik Fabrikalari TAS . . . . . . 91,091 205,748Ford Otomotiv Sanayi AS . . . . . . . . . . . . . . . . 4,859 100,400Kardemir Karabuk Demir Celik Sanayi veTicaret AS, Class D* . . . . . . . . . . . . . . . . . . . . 173,379 162,233
Petkim Petrokimya Holding AS* . . . . . . . . . . 124,891 93,129Sasa Polyester Sanayi AS* . . . . . . . . . . . . . . . 24,020 79,388Tekfen Holding AS . . . . . . . . . . . . . . . . . . . . . . 50,207 89,068Turk Hava Yollari AO* . . . . . . . . . . . . . . . . . . . 84,228 128,452Turk Telekomunikasyon AS . . . . . . . . . . . . . . 111,449 99,325Turkcell Iletisim Hizmetleri AS . . . . . . . . . . . . 65,129 128,386Turkiye Garanti Bankasi AS . . . . . . . . . . . . . . 216,894 257,732Turkiye Is Bankasi AS, Class C . . . . . . . . . . . . 180,297 124,687Turkiye Sise ve Cam Fabrikalari AS . . . . . . . 193,450 207,072Yapi ve Kredi Bankasi AS . . . . . . . . . . . . . . . . 307,239 97,554
(Cost $2,700,769) . . . . . . . . . . . . . . . . . . . . . . . . 2,764,797
United Arab Emirates — 1.0%
Abu Dhabi Commercial Bank PJSC . . . . . . . . 147,706 301,995Aldar Properties PJSC . . . . . . . . . . . . . . . . . . . 226,454 255,852Dubai Islamic Bank PJSC . . . . . . . . . . . . . . . . 104,425 144,989Emaar Properties PJSC . . . . . . . . . . . . . . . . . . 202,321 231,340Emirates Integrated TelecommunicationsCo. PJSC . . . . . . . . . . . . . . . . . . . . . . . . . . . . . . 79,316 143,165
See Notes to Financial Statements. 30

DBX ETF Trust
Schedule of Investments
Xtrackers Emerging Markets Carbon Reduction and Climate Improvers ETF (Continued)August 31, 2021
Numberof Shares Value
United Arab Emirates (Continued)
Emirates NBD Bank PJSC . . . . . . . . . . . . . . . 184,884 $ 697,125Emirates Telecommunications Group Co.PJSC . . . . . . . . . . . . . . . . . . . . . . . . . . . . . . . . 91,838 590,059
First Abu Dhabi Bank PJSC . . . . . . . . . . . . . 252,474 1,168,495International Holding Co. PJSC* . . . . . . . . . 36,709 1,469,100
(Cost $4,987,803) . . . . . . . . . . . . . . . . . . . . . . 5,002,120
TOTAL COMMON STOCKS
(Cost $468,300,899) . . . . . . . . . . . . . . . . . . . 484,774,891
PREFERRED STOCKS — 2.2%
Brazil — 1.3%
Alpargatas SA* . . . . . . . . . . . . . . . . . . . . . . . . 14,872 174,209Banco Bradesco SA . . . . . . . . . . . . . . . . . . . . 457,369 2,068,169Bradespar SA . . . . . . . . . . . . . . . . . . . . . . . . . 17,442 215,148Gerdau SA . . . . . . . . . . . . . . . . . . . . . . . . . . . . 66,734 369,155Itau Unibanco Holding SA . . . . . . . . . . . . . . 457,653 2,765,826Itausa SA . . . . . . . . . . . . . . . . . . . . . . . . . . . . . 271,058 612,052Lojas Americanas SA . . . . . . . . . . . . . . . . . . . 81,319 94,669Usinas Siderurgicas de Minas Gerais SAUsiminas, Class A . . . . . . . . . . . . . . . . . . . . . 40,712 147,037
(Cost $6,227,322) . . . . . . . . . . . . . . . . . . . . . . 6,446,265
Chile — 0.1%
Embotelladora Andina SA, Class B . . . . . . . 32,082 76,132Sociedad Quimica y Minera de Chile SA,Class B . . . . . . . . . . . . . . . . . . . . . . . . . . . . . . 7,723 403,426
(Cost $469,584) . . . . . . . . . . . . . . . . . . . . . . . . 479,558
Colombia — 0.1%
Bancolombia SA . . . . . . . . . . . . . . . . . . . . . . . 44,855 374,279Grupo Aval Acciones y Valores SA . . . . . . . 75,000 22,322
(Cost $386,104) . . . . . . . . . . . . . . . . . . . . . . . . 396,601
Russia — 0.0%
Sberbank of Russia PJSC(Cost $180,922) . . . . . . . . . . . . . . . . . . . . . . 43,916 185,869
South Korea — 0.7%
Hyundai Motor Co. . . . . . . . . . . . . . . . . . . . . . 1,145 101,223Hyundai Motor Co. — 2nd Preferred . . . . . 1,718 147,136LG Chem Ltd. . . . . . . . . . . . . . . . . . . . . . . . . . 3 895LG Electronics, Inc. . . . . . . . . . . . . . . . . . . . . . 1,716 103,453Samsung Electronics Co. Ltd. . . . . . . . . . . . 47,004 2,870,226
(Cost $3,154,521) . . . . . . . . . . . . . . . . . . . . . . 3,222,933
TOTAL PREFERRED STOCKS
(Cost $10,418,453) . . . . . . . . . . . . . . . . . . . . 10,731,226
PrincipalAmount
CORPORATE BONDS — 0.0%
India — 0.0%
Britannia Industries Ltd.Series N3, 5.50%, 6/3/24(Cost $34) . . . . . . . . . . . . . . . . . . . . . . . . . . . . INR 2,494 35
Numberof Shares Value
WARRANTS — 0.0%
Switzerland — 0.0%
Cie Financiere Richemont SA*,expires 11/22/23(Cost $0) . . . . . . . . . . . . . . . . . . . . . . . . . . . . . . 746 $ 383
Thailand — 0.0%
BTS Group Holdings PCL*,expires 9/5/22 (b) . . . . . . . . . . . . . . . . . . . . . . 200 5
BTS Group Holdings PCL*,expires 11/7/24 (b) . . . . . . . . . . . . . . . . . . . . . 400 10
BTS Group Holdings PCL*,expires 11/20/26 (b) . . . . . . . . . . . . . . . . . . . . 800 16
Minor International PCL*,expires 9/30/21 . . . . . . . . . . . . . . . . . . . . . . . . 80 1
Minor International PCL*,expires 2/15/24 . . . . . . . . . . . . . . . . . . . . . . . . 52 7
(Cost $0) . . . . . . . . . . . . . . . . . . . . . . . . . . . . . . . 39
TOTAL WARRANTS
(Cost $0) . . . . . . . . . . . . . . . . . . . . . . . . . . . . . . 422
EXCHANGE-TRADED FUNDS — 0.0%
Xtrackers MSCI EAFE ESG Leaders EquityETF (c)(Cost $2,844) . . . . . . . . . . . . . . . . . . . . . . . . . . 97 3,087
SECURITIES LENDING COLLATERAL — 0.3%
DWS Government & Agency SecuritiesPortfolio “DWS Government CashInstitutional Shares”, 0.01% (d)(e)(Cost $1,768,050) . . . . . . . . . . . . . . . . . . . . . . 1,768,050 1,768,050
CASH EQUIVALENTS — 0.8%
DWS Government Money Market Series“Institutional Shares”, 0.04% (d)(Cost $3,753,775) . . . . . . . . . . . . . . . . . . . . . . 3,753,775 3,753,775
TOTAL INVESTMENTS — 101.0%(Cost $484,244,055) $501,031,486
Other assets and liabilities, net — (1.0%) . . . (4,929,382)
NET ASSETS — 100.0% . . . . . . . . . . . . . . . . . $496,102,104
See Notes to Financial Statements. 31

DBX ETF Trust
Schedule of Investments
Xtrackers Emerging Markets Carbon Reduction and Climate Improvers ETF (Continued)August 31, 2021
A summary of the Fund’s transactions with affiliated investments during the year ended August 31, 2021 is as follows:
Value ($) at8/31/2020
PurchasesCost ($)
SalesProceeds ($)
Net RealizedGain/(Loss) ($)
Net Changein UnrealizedAppreciation
(Depreciation)($) Income ($)
Capital GainDistributions
($)
Number ofShares at8/31/2021
Value ($) at8/31/2021
EXCHANGE-TRADED FUNDS — 0.0%Xtrackers MSCI EAFE ESG Leaders Equity ETF (c)
12,303 85,183 (98,530) 5,132 (1,001) 975 — 97 3,087
Xtrackers MSCI Emerging Markets ESG Leaders Equity ETF (c)5,738 38,547 (45,875) 2,495 (905) 143 — — —
SECURITIES LENDING COLLATERAL — 0.3%DWS Government & Agency Securities Portfolio “DWS Government Cash Institutional Shares”, 0.01% (d)(e)
18,551 1,749,499(f) — — — 11 — 1,768,050 1,768,050
CASH EQUIVALENTS — 0.8%DWS Government Money Market Series “Institutional Shares”, 0.04% (d)
6,027 4,137,709 (389,961) — — 7 — 3,753,775 3,753,775
42,619 6,010,938 (534,366) 7,627 (1,906) 1,136 — 5,521,922 5,524,912
* Non-income producing security.(a) All or a portion of these securities were on loan. In addition, “Other assets and liabilities, net” may include pending sales that are also on
loan. The value of securities loaned at August 31, 2021 amounted to $6,478,517, which is 1.3% of net assets.(b) Investment was valued using significant unobservable inputs.(c) Affiliated fund advised by DBX Advisors LLC.(d) Affiliated fund managed by DWS Investment Management Americas, Inc. The rate shown is the annualized seven-day yield at period end.(e) Represents cash collateral held in connection with securities lending. Income earned by the Fund is net of borrower rebates. In addition,
the Fund held non-cash U.S. Treasury securities collateral having a value of $4,796,817.(f) Represents the net increase (purchase cost) or decrease (sales proceeds) in the amount invested in cash collateral for the year ended
August 31, 2021.
ADR: American Depositary ReceiptCPO: Ordinary Participation CertificatesGDR: Global Depositary ReceiptJSC: Joint Stock CompanyKSC: Kuwait Shareholding CompanyKSCP: Kuwait Shareholding Company PublicNVDR: Non Voting Depositary ReceiptPJSC: Public Joint Stock CompanyPSQC: Public Shareholders Qatari CompanyQPSC: Qatari Public Shareholders CompanyQSC: Qatari Shareholders CompanyREIT: Real Estate Investment TrustSAE: Societe Anonyme EgyptienneSAQ: Societe Anonyme Qatar144A: Security exempt from registration under Rule 144A of the Securities Act of 1933. These securities may be resold in transactions
exempt from registration, normally to qualified institutional buyers.
Securities are listed in country of domicile.
At August 31, 2021, open futures contracts purchased were as follows:
Contract Description CurrencyNumber ofContracts
NotionalAmount
ContractValue
ExpirationDate
UnrealizedAppreciation
(Depreciation)
MINI TOPIX Index Futures . . . . . . . . . . . . . . . . . . . . . . . . . . . . . . . . . . JPY 1 $17,811 $17,882 9/09/2021 $ 71EURO STOXX 50 Futures . . . . . . . . . . . . . . . . . . . . . . . . . . . . . . . . . . . EUR 1 49,887 49,360 9/17/2021 (527)
Total net unrealized depreciation . . . . . . . . . . . . . . . . . . . . . . . . . . . . $(456)
See Notes to Financial Statements. 32

DBX ETF Trust
Schedule of Investments
Xtrackers Emerging Markets Carbon Reduction and Climate Improvers ETF (Continued)August 31, 2021
For information on the Fund’s policy and additional disclosures regarding open futures contracts, please refer to the Derivatives section ofNote 2 in the accompanying Notes to Financial Statements.
Currency Abbreviations
EUR EuroINR Indian RupeeJPY Japanese Yen
Fair Value Measurements
Various inputs are used in determining the value of the Fund’s investments. These inputs are summarized in three broad levels. Level 1includes quoted prices in active markets for identical securities. Level 2 includes other significant observable inputs (including quoted pricesfor similar securities, interest rates, prepayment speeds and credit risk). Level 3 includes significant unobservable inputs (including the Fund’sown assumptions in determining the fair value of investments). The level assigned to the securities valuations may not be an indication of therisk or liquidity associated with investing in those securities.
The following is a summary of the inputs used as of August 31, 2021 in valuing the Fund’s investments. For information on the Fund’s policyregarding the valuation of investments, please refer to the Security Valuation section of Note 2 in the accompanying Notes to FinancialStatements.
Assets Level 1 Level 2 Level 3 Total
Common Stocks (g) . . . . . . . . . . . . . . . . . . . . . . . . . . . . . . . . . . . . . . . . . . . . . . . . . . . . . . . $484,774,891 $ — $ — $484,774,891Preferred Stocks (g) . . . . . . . . . . . . . . . . . . . . . . . . . . . . . . . . . . . . . . . . . . . . . . . . . . . . . . . 10,731,226 — — 10,731,226Corporate Bonds . . . . . . . . . . . . . . . . . . . . . . . . . . . . . . . . . . . . . . . . . . . . . . . . . . . . . . . . . . — 35 — 35Warrants (g) . . . . . . . . . . . . . . . . . . . . . . . . . . . . . . . . . . . . . . . . . . . . . . . . . . . . . . . . . . . . . . 391 — 31 422Exchange-Traded Funds . . . . . . . . . . . . . . . . . . . . . . . . . . . . . . . . . . . . . . . . . . . . . . . . . . . 3,087 — — 3,087Short-Term Investments (g) . . . . . . . . . . . . . . . . . . . . . . . . . . . . . . . . . . . . . . . . . . . . . . . . 5,521,825 — — 5,521,825Derivatives (h)Futures Contracts . . . . . . . . . . . . . . . . . . . . . . . . . . . . . . . . . . . . . . . . . . . . . . . . . . . . . . . . 71 — — 71
TOTAL . . . . . . . . . . . . . . . . . . . . . . . . . . . . . . . . . . . . . . . . . . . . . . . . . . . . . . . . . . . . . . . . . . . $501,031,491 $ 35 $ 31 $501,031,557
Liabilities Level 1 Level 2 Level 3 Total
Derivatives (h)Futures Contracts . . . . . . . . . . . . . . . . . . . . . . . . . . . . . . . . . . . . . . . . . . . . . . . . . . . . . . . . $ (527) $ — $ — $ (527)
TOTAL . . . . . . . . . . . . . . . . . . . . . . . . . . . . . . . . . . . . . . . . . . . . . . . . . . . . . . . . . . . . . . . . . . . $ (527) $ — $ — $ (527)
(g) See Schedule of Investments for additional detailed categorizations.(h) Derivatives include unrealized appreciation (depreciation) on open futures contracts.
See Notes to Financial Statements. 33

DBX ETF Trust
Schedule of Investments
Xtrackers MSCI EAFE ESG Leaders Equity ETFAugust 31, 2021
Numberof Shares Value
COMMON STOCKS — 99.4%
Australia — 6.7%
Afterpay Ltd.* . . . . . . . . . . . . . . . . . . . . . . . . . . . 459 $ 45,150APA Group (a) . . . . . . . . . . . . . . . . . . . . . . . . . . . 2,539 17,035Aristocrat Leisure Ltd. . . . . . . . . . . . . . . . . . . . . 1,213 40,487ASX Ltd. . . . . . . . . . . . . . . . . . . . . . . . . . . . . . . . . 394 25,274Aurizon Holdings Ltd. . . . . . . . . . . . . . . . . . . . . 3,860 10,664AusNet Services Ltd. . . . . . . . . . . . . . . . . . . . . . 4,361 6,167Australia & New Zealand Banking GroupLtd. . . . . . . . . . . . . . . . . . . . . . . . . . . . . . . . . . . . . 6,018 122,491
BlueScope Steel Ltd. . . . . . . . . . . . . . . . . . . . . . 979 18,031Brambles Ltd. . . . . . . . . . . . . . . . . . . . . . . . . . . . 3,083 27,286Cochlear Ltd. . . . . . . . . . . . . . . . . . . . . . . . . . . . . 136 23,179Coles Group Ltd. . . . . . . . . . . . . . . . . . . . . . . . . . 2,797 36,959Commonwealth Bank of Australia . . . . . . . . . . 3,773 276,081Computershare Ltd. . . . . . . . . . . . . . . . . . . . . . . 1,024 12,348Dexus REIT . . . . . . . . . . . . . . . . . . . . . . . . . . . . . . 2,206 17,154Evolution Mining Ltd. . . . . . . . . . . . . . . . . . . . . . 3,348 9,567Fortescue Metals Group Ltd. . . . . . . . . . . . . . . 3,601 55,268Goodman Group REIT . . . . . . . . . . . . . . . . . . . . 3,492 59,031GPT Group REIT . . . . . . . . . . . . . . . . . . . . . . . . . 4,236 15,015Insurance Australia Group Ltd. . . . . . . . . . . . . 5,066 19,401Lendlease Corp. Ltd. (a) . . . . . . . . . . . . . . . . . . . 1,419 12,383Macquarie Group Ltd. . . . . . . . . . . . . . . . . . . . . 726 88,472Mirvac Group REIT . . . . . . . . . . . . . . . . . . . . . . . 8,290 18,903Newcrest Mining Ltd. . . . . . . . . . . . . . . . . . . . . . 1,709 30,901Northern Star Resources Ltd. . . . . . . . . . . . . . . 2,584 18,432Orica Ltd. . . . . . . . . . . . . . . . . . . . . . . . . . . . . . . . 790 7,604QBE Insurance Group Ltd. . . . . . . . . . . . . . . . . . 3,109 26,880Ramsay Health Care Ltd. . . . . . . . . . . . . . . . . . . 418 21,049REA Group Ltd. . . . . . . . . . . . . . . . . . . . . . . . . . . 103 11,555SEEK Ltd. . . . . . . . . . . . . . . . . . . . . . . . . . . . . . . . 687 16,338Sonic Healthcare Ltd. . . . . . . . . . . . . . . . . . . . . . 917 29,086Stockland REIT . . . . . . . . . . . . . . . . . . . . . . . . . . 4,988 16,842Sydney Airport* (a) . . . . . . . . . . . . . . . . . . . . . . 2,981 17,364Telstra Corp. Ltd. . . . . . . . . . . . . . . . . . . . . . . . . 8,841 24,812Transurban Group (a) . . . . . . . . . . . . . . . . . . . . 5,701 59,207Vicinity Centres REIT . . . . . . . . . . . . . . . . . . . . . 9,454 11,953Woodside Petroleum Ltd. . . . . . . . . . . . . . . . . . 2,025 28,845
(Cost $1,064,256) . . . . . . . . . . . . . . . . . . . . . . . . . 1,277,214
Austria — 0.3%
Erste Group Bank AG . . . . . . . . . . . . . . . . . . . . . 602 24,062OMV AG . . . . . . . . . . . . . . . . . . . . . . . . . . . . . . . . 311 17,229voestalpine AG . . . . . . . . . . . . . . . . . . . . . . . . . . 227 10,290
(Cost $35,579) . . . . . . . . . . . . . . . . . . . . . . . . . . . 51,581
Belgium — 0.7%
Etablissements Franz Colruyt NV . . . . . . . . . . . 128 7,161KBC Group NV . . . . . . . . . . . . . . . . . . . . . . . . . . . 530 44,633Solvay SA . . . . . . . . . . . . . . . . . . . . . . . . . . . . . . . 169 22,134UCB SA . . . . . . . . . . . . . . . . . . . . . . . . . . . . . . . . . 263 30,077Umicore SA . . . . . . . . . . . . . . . . . . . . . . . . . . . . . 409 26,912
(Cost $107,899) . . . . . . . . . . . . . . . . . . . . . . . . . . 130,917
Chile — 0.1%
Antofagasta PLC(Cost $18,896) . . . . . . . . . . . . . . . . . . . . . . . . . . 839 16,812
Numberof Shares Value
Denmark — 4.0%
Ambu A/S, Class B . . . . . . . . . . . . . . . . . . . . . . . 352 $ 11,125Chr Hansen Holding A/S . . . . . . . . . . . . . . . . . . 217 20,020Coloplast A/S, Class B . . . . . . . . . . . . . . . . . . . . 252 43,641Demant A/S* . . . . . . . . . . . . . . . . . . . . . . . . . . . . 255 14,450Genmab A/S* . . . . . . . . . . . . . . . . . . . . . . . . . . . 138 65,321GN Store Nord AS . . . . . . . . . . . . . . . . . . . . . . . 268 20,160Novo Nordisk A/S, Class B . . . . . . . . . . . . . . . . 3,569 355,605Novozymes A/S, Class B . . . . . . . . . . . . . . . . . . 446 36,021Orsted AS, 144A . . . . . . . . . . . . . . . . . . . . . . . . . 399 63,398Pandora A/S . . . . . . . . . . . . . . . . . . . . . . . . . . . . . 214 25,613Tryg A/S . . . . . . . . . . . . . . . . . . . . . . . . . . . . . . . . 693 17,155Vestas Wind Systems A/S . . . . . . . . . . . . . . . . . 2,142 86,464
(Cost $454,887) . . . . . . . . . . . . . . . . . . . . . . . . . . 758,973
Finland — 1.4%
Elisa OYJ . . . . . . . . . . . . . . . . . . . . . . . . . . . . . . . 295 18,888Kesko OYJ, Class B . . . . . . . . . . . . . . . . . . . . . . . 586 24,183Neste OYJ . . . . . . . . . . . . . . . . . . . . . . . . . . . . . . 899 54,696Nordea Bank Abp . . . . . . . . . . . . . . . . . . . . . . . . 6,899 80,996Orion OYJ, Class B . . . . . . . . . . . . . . . . . . . . . . . 261 10,639Stora Enso OYJ, Class R . . . . . . . . . . . . . . . . . . 1,203 23,538UPM-Kymmene OYJ . . . . . . . . . . . . . . . . . . . . . 1,129 45,886Wartsila OYJ Abp . . . . . . . . . . . . . . . . . . . . . . . . 941 13,335
(Cost $223,913) . . . . . . . . . . . . . . . . . . . . . . . . . . 272,161
France — 10.7%
Accor SA* . . . . . . . . . . . . . . . . . . . . . . . . . . . . . . 368 12,667Air Liquide SA . . . . . . . . . . . . . . . . . . . . . . . . . . . 1,007 180,471Alstom SA (b) . . . . . . . . . . . . . . . . . . . . . . . . . . . 674 28,961Amundi SA, 144A . . . . . . . . . . . . . . . . . . . . . . . . 136 12,867Atos SE . . . . . . . . . . . . . . . . . . . . . . . . . . . . . . . . . 192 9,963AXA SA . . . . . . . . . . . . . . . . . . . . . . . . . . . . . . . . . 4,094 114,923BNP Paribas SA . . . . . . . . . . . . . . . . . . . . . . . . . . 2,396 151,968Bouygues SA . . . . . . . . . . . . . . . . . . . . . . . . . . . . 470 19,657Bureau Veritas SA . . . . . . . . . . . . . . . . . . . . . . . . 609 20,208Carrefour SA . . . . . . . . . . . . . . . . . . . . . . . . . . . . 1,309 26,037Cie Generale des Etablissements MichelinSCA . . . . . . . . . . . . . . . . . . . . . . . . . . . . . . . . . . . 353 57,109
CNP Assurances . . . . . . . . . . . . . . . . . . . . . . . . . 379 6,485Covivio REIT . . . . . . . . . . . . . . . . . . . . . . . . . . . . 114 10,836Danone SA . . . . . . . . . . . . . . . . . . . . . . . . . . . . . . 1,395 101,883Eiffage SA . . . . . . . . . . . . . . . . . . . . . . . . . . . . . . . 192 19,949EssilorLuxottica SA . . . . . . . . . . . . . . . . . . . . . . 612 120,112Eurazeo SE . . . . . . . . . . . . . . . . . . . . . . . . . . . . . . 77 7,917Gecina SA REIT . . . . . . . . . . . . . . . . . . . . . . . . . . 89 13,821Kering SA . . . . . . . . . . . . . . . . . . . . . . . . . . . . . . . 160 127,300Klepierre SA REIT* . . . . . . . . . . . . . . . . . . . . . . . 425 10,385L’Oreal SA . . . . . . . . . . . . . . . . . . . . . . . . . . . . . . 535 250,280Orange SA . . . . . . . . . . . . . . . . . . . . . . . . . . . . . . 4,231 48,047Publicis Groupe SA . . . . . . . . . . . . . . . . . . . . . . 473 31,000Schneider Electric SE . . . . . . . . . . . . . . . . . . . . . 1,140 203,606SEB SA . . . . . . . . . . . . . . . . . . . . . . . . . . . . . . . . . 53 8,333Societe Generale SA . . . . . . . . . . . . . . . . . . . . . 1,717 54,015Teleperformance . . . . . . . . . . . . . . . . . . . . . . . . . 126 55,687TotalEnergies SE . . . . . . . . . . . . . . . . . . . . . . . . . 5,278 232,675Unibail-Rodamco-Westfield REIT* . . . . . . . . . 269 23,562Valeo . . . . . . . . . . . . . . . . . . . . . . . . . . . . . . . . . . . 517 14,696
See Notes to Financial Statements. 34

DBX ETF Trust
Schedule of Investments
Xtrackers MSCI EAFE ESG Leaders Equity ETF (Continued)August 31, 2021
Numberof Shares Value
France (Continued)
Vivendi SE (b) . . . . . . . . . . . . . . . . . . . . . . . . . . . 1,512 $ 57,686Wendel SE . . . . . . . . . . . . . . . . . . . . . . . . . . . . . . 58 8,414
(Cost $1,710,433) . . . . . . . . . . . . . . . . . . . . . . . . . 2,041,520
Germany — 8.4%
adidas AG . . . . . . . . . . . . . . . . . . . . . . . . . . . . . . . 406 143,995Allianz SE . . . . . . . . . . . . . . . . . . . . . . . . . . . . . . . 878 206,230BASF SE . . . . . . . . . . . . . . . . . . . . . . . . . . . . . . . . 1,950 150,819Bayerische Motoren Werke AG . . . . . . . . . . . . 716 67,929Beiersdorf AG . . . . . . . . . . . . . . . . . . . . . . . . . . . 232 28,140Brenntag SE . . . . . . . . . . . . . . . . . . . . . . . . . . . . . 321 32,375Commerzbank AG* . . . . . . . . . . . . . . . . . . . . . . 2,223 13,934Delivery Hero SE, 144A* (b) . . . . . . . . . . . . . . . 331 47,903Deutsche Boerse AG . . . . . . . . . . . . . . . . . . . . . 406 70,020Deutsche Post AG . . . . . . . . . . . . . . . . . . . . . . . . 2,098 147,555Deutsche Wohnen SE . . . . . . . . . . . . . . . . . . . . 739 45,851HeidelbergCement AG . . . . . . . . . . . . . . . . . . . . 313 27,194Henkel AG & Co. KGaA . . . . . . . . . . . . . . . . . . . 228 20,509LANXESS AG . . . . . . . . . . . . . . . . . . . . . . . . . . . . 173 12,608Merck KGaA . . . . . . . . . . . . . . . . . . . . . . . . . . . . . 274 65,077MTU Aero Engines AG . . . . . . . . . . . . . . . . . . . . 114 26,154Muenchener Rueckversicherungs-Gesellschaft AG in Muenchen . . . . . . . . . . . . 298 87,046
Puma SE . . . . . . . . . . . . . . . . . . . . . . . . . . . . . . . . 205 24,877SAP SE . . . . . . . . . . . . . . . . . . . . . . . . . . . . . . . . . 2,227 335,075Symrise AG . . . . . . . . . . . . . . . . . . . . . . . . . . . . . 272 38,723Telefonica Deutschland Holding AG . . . . . . . . 2,312 6,487
(Cost $1,372,089) . . . . . . . . . . . . . . . . . . . . . . . . . 1,598,501
Hong Kong — 1.6%
BOC Hong Kong Holdings Ltd. . . . . . . . . . . . . . 7,876 23,899ESR Cayman Ltd., 144A* . . . . . . . . . . . . . . . . . . 4,034 12,293Hang Seng Bank Ltd. . . . . . . . . . . . . . . . . . . . . . 1,598 28,601HKT Trust & HKT Ltd. (a) . . . . . . . . . . . . . . . . . . 7,739 10,548Hong Kong & China Gas Co. Ltd. . . . . . . . . . . . 23,461 37,768Hong Kong Exchanges & Clearing Ltd. . . . . . . 2,542 160,416MTR Corp. Ltd. . . . . . . . . . . . . . . . . . . . . . . . . . . 3,010 16,952Swire Pacific Ltd., Class A . . . . . . . . . . . . . . . . . 1,081 7,325Swire Properties Ltd. . . . . . . . . . . . . . . . . . . . . . 2,436 6,593
(Cost $247,593) . . . . . . . . . . . . . . . . . . . . . . . . . . 304,395
Ireland — 1.0%
CRH PLC . . . . . . . . . . . . . . . . . . . . . . . . . . . . . . . . 1,686 89,641DCC PLC . . . . . . . . . . . . . . . . . . . . . . . . . . . . . . . . 198 16,840Kerry Group PLC, Class A . . . . . . . . . . . . . . . . . 342 50,141Kingspan Group PLC . . . . . . . . . . . . . . . . . . . . . 329 37,586
(Cost $135,188) . . . . . . . . . . . . . . . . . . . . . . . . . . 194,208
Israel — 0.3%
Bank Hapoalim BM . . . . . . . . . . . . . . . . . . . . . . . 2,195 18,903Bank Leumi Le-Israel BM . . . . . . . . . . . . . . . . . . 3,370 27,875CyberArk Software Ltd.* . . . . . . . . . . . . . . . . . . 77 12,931
(Cost $46,679) . . . . . . . . . . . . . . . . . . . . . . . . . . . 59,709
Italy — 1.7%
Amplifon SpA . . . . . . . . . . . . . . . . . . . . . . . . . . . 255 13,329Assicurazioni Generali SpA . . . . . . . . . . . . . . . 2,345 47,806Enel SpA . . . . . . . . . . . . . . . . . . . . . . . . . . . . . . . . 17,242 157,067
Numberof Shares Value
Italy (Continued)
Intesa Sanpaolo SpA . . . . . . . . . . . . . . . . . . . . . 35,008 $ 99,077
(Cost $276,554) . . . . . . . . . . . . . . . . . . . . . . . . . . 317,279
Japan — 24.1%
Aeon Co. Ltd. (b) . . . . . . . . . . . . . . . . . . . . . . . . . 1,400 37,205Ajinomoto Co., Inc. . . . . . . . . . . . . . . . . . . . . . . . 1,000 29,529ANA Holdings, Inc.* . . . . . . . . . . . . . . . . . . . . . . 300 7,115Asahi Kasei Corp. . . . . . . . . . . . . . . . . . . . . . . . . 2,600 26,885Astellas Pharma, Inc. . . . . . . . . . . . . . . . . . . . . . 4,000 67,613Azbil Corp. . . . . . . . . . . . . . . . . . . . . . . . . . . . . . . 300 13,039Bridgestone Corp. . . . . . . . . . . . . . . . . . . . . . . . . 1,200 55,314Capcom Co. Ltd. . . . . . . . . . . . . . . . . . . . . . . . . . 400 11,178Casio Computer Co. Ltd. . . . . . . . . . . . . . . . . . . 400 6,186Central Japan Railway Co. . . . . . . . . . . . . . . . . 310 45,501Chugai Pharmaceutical Co. Ltd. . . . . . . . . . . . . 1,398 54,821CyberAgent, Inc. . . . . . . . . . . . . . . . . . . . . . . . . . 912 16,777Dai Nippon Printing Co. Ltd. . . . . . . . . . . . . . . . 465 11,073Daifuku Co. Ltd. . . . . . . . . . . . . . . . . . . . . . . . . . . 216 19,111Dai-ichi Life Holdings, Inc. . . . . . . . . . . . . . . . . . 2,200 43,445Daikin Industries Ltd. . . . . . . . . . . . . . . . . . . . . . 554 138,197Daiwa House Industry Co. Ltd. . . . . . . . . . . . . . 1,200 36,658Denso Corp. . . . . . . . . . . . . . . . . . . . . . . . . . . . . . 960 67,373East Japan Railway Co. . . . . . . . . . . . . . . . . . . . 629 42,546Eisai Co. Ltd. . . . . . . . . . . . . . . . . . . . . . . . . . . . . 458 37,879ENEOS Holdings, Inc. . . . . . . . . . . . . . . . . . . . . . 6,400 24,823Fast Retailing Co. Ltd. . . . . . . . . . . . . . . . . . . . . 128 84,494FUJIFILM Holdings Corp. . . . . . . . . . . . . . . . . . 800 66,033Fujitsu Ltd. . . . . . . . . . . . . . . . . . . . . . . . . . . . . . . 409 75,575Hankyu Hanshin Holdings, Inc. . . . . . . . . . . . . 500 14,996Hirose Electric Co. Ltd. . . . . . . . . . . . . . . . . . . . . 80 13,348Hitachi Construction Machinery Co. Ltd. . . . . 200 5,744Hitachi Metals Ltd.* . . . . . . . . . . . . . . . . . . . . . . 400 7,737Hoshizaki Corp. . . . . . . . . . . . . . . . . . . . . . . . . . . 100 9,403Hoya Corp. . . . . . . . . . . . . . . . . . . . . . . . . . . . . . . 800 129,474Hulic Co. Ltd. . . . . . . . . . . . . . . . . . . . . . . . . . . . . 500 5,871Ibiden Co. Ltd. . . . . . . . . . . . . . . . . . . . . . . . . . . . 200 10,814Inpex Corp. . . . . . . . . . . . . . . . . . . . . . . . . . . . . . . 2,300 15,869Isuzu Motors Ltd. . . . . . . . . . . . . . . . . . . . . . . . . 1,200 15,205ITOCHU Corp. . . . . . . . . . . . . . . . . . . . . . . . . . . . 2,500 75,346JFE Holdings, Inc. . . . . . . . . . . . . . . . . . . . . . . . . 1,100 17,873JSR Corp. . . . . . . . . . . . . . . . . . . . . . . . . . . . . . . . 400 13,890Kajima Corp. . . . . . . . . . . . . . . . . . . . . . . . . . . . . 1,100 14,248Kansai Paint Co. Ltd. . . . . . . . . . . . . . . . . . . . . . 300 7,785Kao Corp. . . . . . . . . . . . . . . . . . . . . . . . . . . . . . . . 984 59,527KDDI Corp. . . . . . . . . . . . . . . . . . . . . . . . . . . . . . . 3,400 104,296Keio Corp. . . . . . . . . . . . . . . . . . . . . . . . . . . . . . . . 239 12,879Kikkoman Corp. . . . . . . . . . . . . . . . . . . . . . . . . . . 300 22,556Kobayashi Pharmaceutical Co. Ltd. . . . . . . . . . 80 6,270Komatsu Ltd. . . . . . . . . . . . . . . . . . . . . . . . . . . . . 1,900 46,047Kubota Corp. . . . . . . . . . . . . . . . . . . . . . . . . . . . . 2,200 45,548Kurita Water Industries Ltd. . . . . . . . . . . . . . . . 200 9,394Kyowa Kirin Co. Ltd. . . . . . . . . . . . . . . . . . . . . . . 600 19,634Lawson, Inc. . . . . . . . . . . . . . . . . . . . . . . . . . . . . . 100 4,824Lixil Corp. . . . . . . . . . . . . . . . . . . . . . . . . . . . . . . . 600 17,504Marubeni Corp. . . . . . . . . . . . . . . . . . . . . . . . . . . 3,300 26,302Mazda Motor Corp.* . . . . . . . . . . . . . . . . . . . . . . 1,300 11,301Mercari, Inc.* . . . . . . . . . . . . . . . . . . . . . . . . . . . . 250 12,379
See Notes to Financial Statements. 35

DBX ETF Trust
Schedule of Investments
Xtrackers MSCI EAFE ESG Leaders Equity ETF (Continued)August 31, 2021
Numberof Shares Value
Japan (Continued)
Mitsubishi Chemical Holdings Corp. . . . . . . . . 2,700 $ 23,736Mitsubishi Estate Co. Ltd. . . . . . . . . . . . . . . . . . 2,500 39,164Mitsui Chemicals, Inc. . . . . . . . . . . . . . . . . . . . . 400 13,836Mitsui Fudosan Co. Ltd. . . . . . . . . . . . . . . . . . . . 1,900 43,652Miura Co. Ltd. . . . . . . . . . . . . . . . . . . . . . . . . . . . 200 8,993Mizuho Financial Group, Inc. . . . . . . . . . . . . . . 5,090 71,490MS&AD Insurance Group Holdings, Inc. . . . . 1,000 32,359Murata Manufacturing Co. Ltd. . . . . . . . . . . . . 1,200 99,607Nabtesco Corp. . . . . . . . . . . . . . . . . . . . . . . . . . . 250 9,922NEC Corp. . . . . . . . . . . . . . . . . . . . . . . . . . . . . . . . 500 26,306Nintendo Co. Ltd. . . . . . . . . . . . . . . . . . . . . . . . . 239 115,084Nippon Building Fund, Inc. REIT . . . . . . . . . . . 3 19,525Nippon Express Co. Ltd. . . . . . . . . . . . . . . . . . . 150 10,227Nippon Paint Holdings Co. Ltd. . . . . . . . . . . . . 1,550 19,315Nippon Yusen KK . . . . . . . . . . . . . . . . . . . . . . . . 300 24,222Nissin Foods Holdings Co. Ltd. . . . . . . . . . . . . 100 7,792Nitori Holdings Co. Ltd. . . . . . . . . . . . . . . . . . . . 144 26,975Nitto Denko Corp. . . . . . . . . . . . . . . . . . . . . . . . . 350 26,634Nomura Holdings, Inc. . . . . . . . . . . . . . . . . . . . . 6,500 31,571Nomura Real Estate Holdings, Inc. . . . . . . . . . 200 5,125Nomura Real Estate Master Fund, Inc.REIT . . . . . . . . . . . . . . . . . . . . . . . . . . . . . . . . . . . 9 13,902
Nomura Research Institute Ltd. . . . . . . . . . . . . 800 30,111NSK Ltd. . . . . . . . . . . . . . . . . . . . . . . . . . . . . . . . . 800 5,622NTT Data Corp. . . . . . . . . . . . . . . . . . . . . . . . . . . 1,300 23,442Obayashi Corp. . . . . . . . . . . . . . . . . . . . . . . . . . . 1,300 10,721Odakyu Electric Railway Co. Ltd. . . . . . . . . . . . 600 14,003Omron Corp. . . . . . . . . . . . . . . . . . . . . . . . . . . . . 413 39,022Oriental Land Co. Ltd. . . . . . . . . . . . . . . . . . . . . 415 62,934ORIX Corp. . . . . . . . . . . . . . . . . . . . . . . . . . . . . . . 2,600 48,552Orix JREIT, Inc. REIT . . . . . . . . . . . . . . . . . . . . . . 6 10,710Osaka Gas Co. Ltd. . . . . . . . . . . . . . . . . . . . . . . . 800 15,023Otsuka Corp. . . . . . . . . . . . . . . . . . . . . . . . . . . . . 250 12,971Pan Pacific International Holdings Corp. . . . . 900 17,179Panasonic Corp. . . . . . . . . . . . . . . . . . . . . . . . . . 4,700 56,130Recruit Holdings Co. Ltd. . . . . . . . . . . . . . . . . . . 2,900 171,582Resona Holdings, Inc. . . . . . . . . . . . . . . . . . . . . 5,000 19,375Rohm Co. Ltd. . . . . . . . . . . . . . . . . . . . . . . . . . . . 150 14,500SCSK Corp. . . . . . . . . . . . . . . . . . . . . . . . . . . . . . 100 6,326Secom Co. Ltd. . . . . . . . . . . . . . . . . . . . . . . . . . . 440 33,423Sekisui Chemical Co. Ltd. . . . . . . . . . . . . . . . . . 800 13,719Sekisui House Ltd. . . . . . . . . . . . . . . . . . . . . . . . 1,300 25,950Seven & i Holdings Co. Ltd. . . . . . . . . . . . . . . . 1,600 70,126SG Holdings Co. Ltd. . . . . . . . . . . . . . . . . . . . . . 700 19,064Sharp Corp. . . . . . . . . . . . . . . . . . . . . . . . . . . . . . 400 5,290Shimadzu Corp. . . . . . . . . . . . . . . . . . . . . . . . . . . 540 24,257Shimizu Corp. . . . . . . . . . . . . . . . . . . . . . . . . . . . 1,200 8,629Shin-Etsu Chemical Co. Ltd. . . . . . . . . . . . . . . . 743 123,123Shionogi & Co. Ltd. . . . . . . . . . . . . . . . . . . . . . . 600 37,968Shiseido Co. Ltd. . . . . . . . . . . . . . . . . . . . . . . . . . 850 56,427SoftBank Corp. . . . . . . . . . . . . . . . . . . . . . . . . . . 6,100 81,816Sohgo Security Services Co. Ltd. . . . . . . . . . . . 200 9,075Sompo Holdings, Inc. . . . . . . . . . . . . . . . . . . . . . 640 28,126Sony Group Corp. . . . . . . . . . . . . . . . . . . . . . . . . 2,705 279,709Stanley Electric Co. Ltd. . . . . . . . . . . . . . . . . . . . 200 5,003Sumitomo Chemical Co. Ltd. . . . . . . . . . . . . . . 3,600 18,285Sumitomo Metal Mining Co. Ltd. . . . . . . . . . . . 553 21,262
Numberof Shares Value
Japan (Continued)
Sumitomo Mitsui Trust Holdings, Inc. . . . . . . 700 $ 22,926Suntory Beverage & Food Ltd. . . . . . . . . . . . . . 300 12,029Sysmex Corp. . . . . . . . . . . . . . . . . . . . . . . . . . . . 350 39,887T&D Holdings, Inc. . . . . . . . . . . . . . . . . . . . . . . . 1,200 14,582Taisei Corp. . . . . . . . . . . . . . . . . . . . . . . . . . . . . . 374 11,728Takeda Pharmaceutical Co. Ltd. . . . . . . . . . . . . 3,350 112,185TDK Corp. . . . . . . . . . . . . . . . . . . . . . . . . . . . . . . . 275 28,962Terumo Corp. . . . . . . . . . . . . . . . . . . . . . . . . . . . 1,350 56,490Tobu Railway Co. Ltd. . . . . . . . . . . . . . . . . . . . . 400 10,453Toho Gas Co. Ltd. . . . . . . . . . . . . . . . . . . . . . . . . 150 7,004Tokyo Century Corp. . . . . . . . . . . . . . . . . . . . . . 100 5,726Tokyo Electron Ltd. . . . . . . . . . . . . . . . . . . . . . . . 323 138,891Tokyo Gas Co. Ltd. . . . . . . . . . . . . . . . . . . . . . . . 800 15,409Tokyu Corp. . . . . . . . . . . . . . . . . . . . . . . . . . . . . . 1,100 15,169Toray Industries, Inc. . . . . . . . . . . . . . . . . . . . . . 2,900 19,581TOTO Ltd. . . . . . . . . . . . . . . . . . . . . . . . . . . . . . . . 300 16,357Toyo Suisan Kaisha Ltd. . . . . . . . . . . . . . . . . . . 250 10,365Unicharm Corp. . . . . . . . . . . . . . . . . . . . . . . . . . . 800 35,711USS Co. Ltd. . . . . . . . . . . . . . . . . . . . . . . . . . . . . . 500 8,288West Japan Railway Co. . . . . . . . . . . . . . . . . . . 350 19,166Yakult Honsha Co. Ltd. . . . . . . . . . . . . . . . . . . . . 280 16,159Yamada Holdings Co. Ltd. . . . . . . . . . . . . . . . . . 2,000 8,611Yamaha Corp. . . . . . . . . . . . . . . . . . . . . . . . . . . . 319 18,845Yamaha Motor Co. Ltd. . . . . . . . . . . . . . . . . . . . 600 15,292Yaskawa Electric Corp. . . . . . . . . . . . . . . . . . . . . 501 24,535Yokogawa Electric Corp. . . . . . . . . . . . . . . . . . . 400 6,273Z Holdings Corp. . . . . . . . . . . . . . . . . . . . . . . . . . 5,600 36,548ZOZO, Inc. . . . . . . . . . . . . . . . . . . . . . . . . . . . . . . 200 7,637
(Cost $3,807,029) . . . . . . . . . . . . . . . . . . . . . . . . . 4,598,135
Luxembourg — 0.1%
Tenaris SA(Cost $12,409) . . . . . . . . . . . . . . . . . . . . . . . . . . 1,048 10,560
Netherlands — 7.3%
Aegon NV . . . . . . . . . . . . . . . . . . . . . . . . . . . . . . . 3,308 16,377Akzo Nobel NV . . . . . . . . . . . . . . . . . . . . . . . . . . 401 49,419ASML Holding NV . . . . . . . . . . . . . . . . . . . . . . . . 885 735,990ING Groep NV . . . . . . . . . . . . . . . . . . . . . . . . . . . 8,280 114,357JDE Peet’s NV . . . . . . . . . . . . . . . . . . . . . . . . . . . 157 5,393Koninklijke Ahold Delhaize NV . . . . . . . . . . . . . 2,226 75,073Koninklijke DSM NV (b) . . . . . . . . . . . . . . . . . . . 363 77,238Koninklijke KPN NV . . . . . . . . . . . . . . . . . . . . . . 7,170 22,971Koninklijke Vopak NV . . . . . . . . . . . . . . . . . . . . . 143 6,190NN Group NV . . . . . . . . . . . . . . . . . . . . . . . . . . . 612 31,766Prosus NV* . . . . . . . . . . . . . . . . . . . . . . . . . . . . . 1,973 174,444Randstad NV . . . . . . . . . . . . . . . . . . . . . . . . . . . . 247 18,165Wolters Kluwer NV . . . . . . . . . . . . . . . . . . . . . . . 572 65,780
(Cost $769,176) . . . . . . . . . . . . . . . . . . . . . . . . . . 1,393,163
New Zealand — 0.6%
Auckland International Airport Ltd.* . . . . . . . . 2,678 13,590Fisher & Paykel Healthcare Corp. Ltd. . . . . . . . 1,212 28,236Mercury NZ Ltd. . . . . . . . . . . . . . . . . . . . . . . . . . 1,617 7,569Meridian Energy Ltd. . . . . . . . . . . . . . . . . . . . . . 2,640 9,755Ryman Healthcare Ltd. . . . . . . . . . . . . . . . . . . . . 810 8,825Spark New Zealand Ltd. . . . . . . . . . . . . . . . . . . 3,846 13,197Xero Ltd.* . . . . . . . . . . . . . . . . . . . . . . . . . . . . . . . 271 30,070
(Cost $97,096) . . . . . . . . . . . . . . . . . . . . . . . . . . . 111,242
See Notes to Financial Statements. 36

DBX ETF Trust
Schedule of Investments
Xtrackers MSCI EAFE ESG Leaders Equity ETF (Continued)August 31, 2021
Numberof Shares Value
Norway — 0.7%
DNB Bank ASA . . . . . . . . . . . . . . . . . . . . . . . . . . 1,980 $ 41,759Mowi ASA . . . . . . . . . . . . . . . . . . . . . . . . . . . . . . 999 26,727Norsk Hydro ASA . . . . . . . . . . . . . . . . . . . . . . . . 2,800 19,305Orkla ASA . . . . . . . . . . . . . . . . . . . . . . . . . . . . . . . 1,726 15,402Telenor ASA . . . . . . . . . . . . . . . . . . . . . . . . . . . . 1,486 26,006
(Cost $119,797) . . . . . . . . . . . . . . . . . . . . . . . . . . 129,199
Portugal — 0.1%
Galp Energia SGPS SA . . . . . . . . . . . . . . . . . . . 1,052 10,772Jeronimo Martins SGPS SA . . . . . . . . . . . . . . . 540 11,442
(Cost $25,060) . . . . . . . . . . . . . . . . . . . . . . . . . . . 22,214
Singapore — 1.3%
Ascendas Real Estate Investment TrustREIT . . . . . . . . . . . . . . . . . . . . . . . . . . . . . . . . . . . 203 459
CapitaLand Integrated Commercial TrustREIT . . . . . . . . . . . . . . . . . . . . . . . . . . . . . . . . . . . 9,684 14,831
CapitaLand Ltd. . . . . . . . . . . . . . . . . . . . . . . . . . . 5,700 16,950City Developments Ltd. . . . . . . . . . . . . . . . . . . . 1,100 5,594DBS Group Holdings Ltd. . . . . . . . . . . . . . . . . . 3,847 85,715Keppel Corp. Ltd. . . . . . . . . . . . . . . . . . . . . . . . . 3,300 12,757Oversea-Chinese Banking Corp. Ltd. . . . . . . . . 7,000 59,483Singapore Airlines Ltd.* . . . . . . . . . . . . . . . . . . 3,150 11,850Singapore Exchange Ltd. . . . . . . . . . . . . . . . . . 1,700 12,512Singapore Telecommunications Ltd. . . . . . . . 16,800 28,976UOL Group Ltd. . . . . . . . . . . . . . . . . . . . . . . . . . . 1,100 5,724
(Cost $244,125) . . . . . . . . . . . . . . . . . . . . . . . . . . 254,851
Spain — 2.2%
Banco Bilbao Vizcaya Argentaria SA* . . . . . . 14,170 92,784CaixaBank SA . . . . . . . . . . . . . . . . . . . . . . . . . . . 9,160 28,460Iberdrola SA . . . . . . . . . . . . . . . . . . . . . . . . . . . . . 12,496 154,811Industria de Diseno Textil SA . . . . . . . . . . . . . . 2,341 79,891Naturgy Energy Group SA (b) . . . . . . . . . . . . . 631 16,238Red Electrica Corp. SA . . . . . . . . . . . . . . . . . . . . 886 17,665Repsol SA . . . . . . . . . . . . . . . . . . . . . . . . . . . . . . . 3,170 36,316
(Cost $367,702) . . . . . . . . . . . . . . . . . . . . . . . . . . 426,165
Sweden — 3.6%
Alfa Laval AB . . . . . . . . . . . . . . . . . . . . . . . . . . . . 675 27,348Assa Abloy AB, Class B . . . . . . . . . . . . . . . . . . . 2,123 67,780Atlas Copco AB, Class A . . . . . . . . . . . . . . . . . . 1,468 100,669Atlas Copco AB, Class B . . . . . . . . . . . . . . . . . . 773 44,669Boliden AB . . . . . . . . . . . . . . . . . . . . . . . . . . . . . . 577 20,098Electrolux AB, Series B . . . . . . . . . . . . . . . . . . . 523 13,234Essity AB, Class B . . . . . . . . . . . . . . . . . . . . . . . . 1,305 41,815Evolution AB, 144A . . . . . . . . . . . . . . . . . . . . . . . 361 58,103H & M Hennes & Mauritz AB, Class B* . . . . . . 1,571 31,454Husqvarna AB, Class B . . . . . . . . . . . . . . . . . . . 888 11,898ICA Gruppen AB . . . . . . . . . . . . . . . . . . . . . . . . . 223 11,082Nibe Industrier AB, Class B . . . . . . . . . . . . . . . . 3,010 41,917Sandvik AB . . . . . . . . . . . . . . . . . . . . . . . . . . . . . . 2,392 60,917SKF AB, Class B . . . . . . . . . . . . . . . . . . . . . . . . . . 879 22,385Svenska Cellulosa AB SCA, Class B . . . . . . . . 1,354 23,863Tele2 AB, Class B . . . . . . . . . . . . . . . . . . . . . . . . 1,067 15,977Telefonaktiebolaget LM Ericsson, Class B . . . 6,183 73,220Telia Co. AB . . . . . . . . . . . . . . . . . . . . . . . . . . . . . 5,532 23,720
(Cost $552,419) . . . . . . . . . . . . . . . . . . . . . . . . . . 690,149
Numberof Shares Value
Switzerland — 9.4%
ABB Ltd. . . . . . . . . . . . . . . . . . . . . . . . . . . . . . . . . 3,696 $ 136,858Adecco Group AG . . . . . . . . . . . . . . . . . . . . . . . . 325 18,087Chocoladefabriken Lindt & Spruengli AGParticipation Certificates . . . . . . . . . . . . . . . . . 4 47,028
Cie Financiere Richemont SA, Class A . . . . . . 1,109 122,274Clariant AG* . . . . . . . . . . . . . . . . . . . . . . . . . . . . . 415 8,734Coca-Cola HBC AG* . . . . . . . . . . . . . . . . . . . . . . 438 15,848Geberit AG . . . . . . . . . . . . . . . . . . . . . . . . . . . . . . 75 62,649Givaudan SA . . . . . . . . . . . . . . . . . . . . . . . . . . . . 20 100,322Kuehne + Nagel International AG . . . . . . . . . . 113 41,337Lonza Group AG . . . . . . . . . . . . . . . . . . . . . . . . . 158 133,672Roche Holding AG . . . . . . . . . . . . . . . . . . . . . . . 1,488 597,360SGS SA . . . . . . . . . . . . . . . . . . . . . . . . . . . . . . . . . 13 40,843Sika AG . . . . . . . . . . . . . . . . . . . . . . . . . . . . . . . . . 300 108,105Sonova Holding AG . . . . . . . . . . . . . . . . . . . . . . 118 45,471Straumann Holding AG . . . . . . . . . . . . . . . . . . . 22 42,509Swiss Life Holding AG . . . . . . . . . . . . . . . . . . . . 68 35,453Swiss Re AG . . . . . . . . . . . . . . . . . . . . . . . . . . . . 639 58,776Swisscom AG . . . . . . . . . . . . . . . . . . . . . . . . . . . 56 32,852Vifor Pharma AG . . . . . . . . . . . . . . . . . . . . . . . . . 102 14,520Zurich Insurance Group AG . . . . . . . . . . . . . . . 320 140,429
(Cost $1,251,751) . . . . . . . . . . . . . . . . . . . . . . . . . 1,803,127
United Kingdom — 13.1%
Abrdn PLC . . . . . . . . . . . . . . . . . . . . . . . . . . . . . . 4,565 16,680Ashtead Group PLC . . . . . . . . . . . . . . . . . . . . . . 960 75,176Associated British Foods PLC . . . . . . . . . . . . . . 814 22,181AstraZeneca PLC . . . . . . . . . . . . . . . . . . . . . . . . . 3,283 384,682Barratt Developments PLC . . . . . . . . . . . . . . . . 1,934 19,670Berkeley Group Holdings PLC* . . . . . . . . . . . . 262 17,405British Land Co. PLC REIT . . . . . . . . . . . . . . . . . 1,955 14,265BT Group PLC* . . . . . . . . . . . . . . . . . . . . . . . . . . 18,977 44,347Burberry Group PLC . . . . . . . . . . . . . . . . . . . . . . 929 23,774CNH Industrial NV . . . . . . . . . . . . . . . . . . . . . . . . 2,174 35,928Coca-Cola Europacific Partners PLC . . . . . . . . 438 25,290Compass Group PLC* . . . . . . . . . . . . . . . . . . . . 3,772 77,894Croda International PLC . . . . . . . . . . . . . . . . . . . 299 37,644Ferguson PLC . . . . . . . . . . . . . . . . . . . . . . . . . . . 477 68,962GlaxoSmithKline PLC . . . . . . . . . . . . . . . . . . . . . 10,723 215,755Informa PLC* . . . . . . . . . . . . . . . . . . . . . . . . . . . . 3,146 22,991InterContinental Hotels Group PLC* . . . . . . . . 367 23,401Intertek Group PLC . . . . . . . . . . . . . . . . . . . . . . . 339 24,587J Sainsbury PLC . . . . . . . . . . . . . . . . . . . . . . . . . 3,641 15,233JD Sports Fashion PLC . . . . . . . . . . . . . . . . . . . 1,118 15,533Johnson Matthey PLC . . . . . . . . . . . . . . . . . . . . 403 16,301Kingfisher PLC . . . . . . . . . . . . . . . . . . . . . . . . . . . 4,525 21,815Legal & General Group PLC . . . . . . . . . . . . . . . 12,691 47,193Lloyds Banking Group PLC . . . . . . . . . . . . . . . . 150,666 90,769Mondi PLC . . . . . . . . . . . . . . . . . . . . . . . . . . . . . . 1,008 27,815National Grid PLC . . . . . . . . . . . . . . . . . . . . . . . . 7,396 95,813Next PLC . . . . . . . . . . . . . . . . . . . . . . . . . . . . . . . . 288 31,352Reckitt Benckiser Group PLC . . . . . . . . . . . . . . 1,519 115,794RELX PLC . . . . . . . . . . . . . . . . . . . . . . . . . . . . . . . 4,122 123,783Rentokil Initial PLC . . . . . . . . . . . . . . . . . . . . . . . 3,914 31,264Schroders PLC . . . . . . . . . . . . . . . . . . . . . . . . . . . 261 13,578Segro PLC REIT . . . . . . . . . . . . . . . . . . . . . . . . . . 2,566 45,344Spirax-Sarco Engineering PLC . . . . . . . . . . . . . 156 34,587
See Notes to Financial Statements. 37

DBX ETF Trust
Schedule of Investments
Xtrackers MSCI EAFE ESG Leaders Equity ETF (Continued)August 31, 2021
Numberof Shares Value
United Kingdom (Continued)
St James’s Place PLC . . . . . . . . . . . . . . . . . . . . . 1,103 $ 24,440Standard Chartered PLC . . . . . . . . . . . . . . . . . . 5,699 35,671Taylor Wimpey PLC . . . . . . . . . . . . . . . . . . . . . . 7,747 19,500Tesco PLC . . . . . . . . . . . . . . . . . . . . . . . . . . . . . . . 16,436 57,715Unilever PLC . . . . . . . . . . . . . . . . . . . . . . . . . . . . 5,615 312,661Vodafone Group PLC . . . . . . . . . . . . . . . . . . . . . 59,234 99,423Whitbread PLC* . . . . . . . . . . . . . . . . . . . . . . . . . 465 20,530Wm Morrison Supermarkets PLC . . . . . . . . . . 4,870 19,437WPP PLC . . . . . . . . . . . . . . . . . . . . . . . . . . . . . . . . 2,550 34,519
(Cost $2,328,064) . . . . . . . . . . . . . . . . . . . . . . . . 2,500,702
TOTAL COMMON STOCKS
(Cost $15,268,594) . . . . . . . . . . . . . . . . . . . . . . 18,962,777
PREFERRED STOCKS — 0.3%
Germany — 0.3%
Bayerische Motoren Werke AG . . . . . . . . . . . . 97 8,118Henkel AG & Co. KGaA . . . . . . . . . . . . . . . . . . . 372 36,334
(Cost $47,931) . . . . . . . . . . . . . . . . . . . . . . . . . . . 44,452
Numberof Shares Value
WARRANTS — 0.0%
Switzerland — 0.0%
Cie Financiere Richemont SA*,expires 11/22/23(Cost $0) . . . . . . . . . . . . . . . . . . . . . . . . . . . . . . . 1,880 $ 965
SECURITIES LENDING COLLATERAL — 0.3%
DWS Government & Agency SecuritiesPortfolio “DWS Government CashInstitutional Shares”, 0.01% (c)(d)(Cost $61,137) . . . . . . . . . . . . . . . . . . . . . . . . . . 61,137 61,137
CASH EQUIVALENTS — 0.0%
DWS Government Money Market Series“Institutional Shares”, 0.04% (c)(Cost $2,532) . . . . . . . . . . . . . . . . . . . . . . . . . . . 2,532 2,532
TOTAL INVESTMENTS — 100.0%(Cost $15,380,194) . . . . . . . . . . . . . . . . . . . . . . $19,071,863
Other assets and liabilities, net — 0.0% . . . . . 4,223
NET ASSETS — 100.0% . . . . . . . . . . . . . . . . . . . $19,076,086
A summary of the Fund’s transactions with affiliated investments during the year ended August 31, 2021 is as follows:
Value ($) at8/31/2020
PurchasesCost ($)
SalesProceeds ($)
Net RealizedGain/(Loss) ($)
Net Changein UnrealizedAppreciation
(Depreciation)($) Income ($)
Capital GainDistributions
($)
Number ofShares at8/31/2021
Value ($) at8/31/2021
SECURITIES LENDING COLLATERAL — 0.3%DWS Government & Agency Securities Portfolio “DWS Government Cash Institutional Shares”, 0.01% (c)(d)
55,300 5,837(e) — — — 20 — 61,137 61,137
CASH EQUIVALENTS — 0.0%DWS Government Money Market Series “Institutional Shares”, 0.04% (c)
143 631,787 (629,398) — — 3 — 2,532 2,532
55,443 637,624 (629,398) — — 23 — 63,669 63,669
* Non-income producing security.(a) Stapled Security — A security contractually bound to one or more other securities to form a single saleable unit which cannot be sold
separately.(b) All or a portion of these securities were on loan. In addition, “Other assets and liabilities, net” may include pending sales that are also
on loan. The value of securities loaned at August 31, 2021 amounted to $170,080, which is 0.9% of net assets.(c) Affiliated fund managed by DWS Investment Management Americas, Inc. The rate shown is the annualized seven-day yield at period
end.(d) Represents cash collateral held in connection with securities lending. Income earned by the Fund is net of borrower rebates. In
addition, the Fund held non-cash U.S. Treasury securities collateral having a value of $119,195.(e) Represents the net increase (purchase cost) or decrease (sales proceeds) in the amount invested in cash collateral for the year ended
August 31, 2021.
REIT: Real Estate Investment Trust144A: Security exempt from registration under Rule 144A of the Securities Act of 1933. These securities may be resold in transactions
exempt from registration, normally to qualified institutional buyers.
Securities are listed in country of domicile.
See Notes to Financial Statements. 38

DBX ETF Trust
Schedule of Investments
Xtrackers MSCI EAFE ESG Leaders Equity ETF (Continued)August 31, 2021
At August 31, 2021, open futures contracts purchased were as follows:
Contract Description CurrencyNumber ofContracts
NotionalAmount
ContractValue
ExpirationDate
UnrealizedAppreciation
MINI TOPIX Index Futures . . . . . . . . . . . . . . . . . . . . . . . . . . . . . . . . . . . JPY 2 $35,681 $35,764 9/09/2021 $83
For information on the Fund’s policy and additional disclosures regarding open futures contracts, please refer to the Derivatives section ofNote 2 in the accompanying Notes to Financial Statements.
Currency Abbreviations
JPY Japanese Yen
Fair Value Measurements
Various inputs are used in determining the value of the Fund’s investments. These inputs are summarized in three broad levels. Level 1includes quoted prices in active markets for identical securities. Level 2 includes other significant observable inputs (including quoted pricesfor similar securities, interest rates, prepayment speeds and credit risk). Level 3 includes significant unobservable inputs (including the Fund’sown assumptions in determining the fair value of investments). The level assigned to the securities valuations may not be an indication of therisk or liquidity associated with investing in those securities.
The following is a summary of the inputs used as of August 31, 2021 in valuing the Fund’s investments. For information on the Fund’s policyregarding the valuation of investments, please refer to the Security Valuation section of Note 2 in the accompanying Notes to FinancialStatements.
Assets Level 1 Level 2 Level 3 Total
Common Stocks (f) . . . . . . . . . . . . . . . . . . . . . . . . . . . . . . . . . . . . . . . . . . . . . . . . . . . . . . . . . . $18,962,777 $ — $ — $18,962,777Preferred Stocks . . . . . . . . . . . . . . . . . . . . . . . . . . . . . . . . . . . . . . . . . . . . . . . . . . . . . . . . . . . . 44,452 — — 44,452Warrants . . . . . . . . . . . . . . . . . . . . . . . . . . . . . . . . . . . . . . . . . . . . . . . . . . . . . . . . . . . . . . . . . . . 965 — — 965Short-Term Investments (f) . . . . . . . . . . . . . . . . . . . . . . . . . . . . . . . . . . . . . . . . . . . . . . . . . . . 63,669 — — 63,669Derivatives (g)Futures Contracts . . . . . . . . . . . . . . . . . . . . . . . . . . . . . . . . . . . . . . . . . . . . . . . . . . . . . . . . . . 83 — — 83
TOTAL . . . . . . . . . . . . . . . . . . . . . . . . . . . . . . . . . . . . . . . . . . . . . . . . . . . . . . . . . . . . . . . . . . . . . $19,071,946 $ — $ — $19,071,946
(f) See Schedule of Investments for additional detailed categorizations.(g) Derivatives include unrealized appreciation (depreciation) on open futures contracts.
See Notes to Financial Statements. 39

DBX ETF Trust
Schedule of Investments
Xtrackers MSCI Emerging Markets ESG Leaders Equity ETFAugust 31, 2021
Numberof Shares Value
COMMON STOCKS — 98.3%
Argentina — 0.0%
Adecoagro SA*(Cost $5,993) . . . . . . . . . . . . . . . . . . . . . . . . . . . . 607 $ 5,675
Brazil — 2.6%
Americanas SA* . . . . . . . . . . . . . . . . . . . . . . . . . . 2,205 17,814Atacadao SA . . . . . . . . . . . . . . . . . . . . . . . . . . . . . 2,553 9,051B3 SA — Brasil Bolsa Balcao . . . . . . . . . . . . . . . 33,459 91,955Banco Bradesco SA . . . . . . . . . . . . . . . . . . . . . . . 8,066 31,416Banco do Brasil SA . . . . . . . . . . . . . . . . . . . . . . . 5,089 30,248Banco Santander Brasil SA . . . . . . . . . . . . . . . . 2,151 17,621CCR SA . . . . . . . . . . . . . . . . . . . . . . . . . . . . . . . . . 6,648 15,907Cosan SA . . . . . . . . . . . . . . . . . . . . . . . . . . . . . . . . 6,110 26,316CPFL Energia SA . . . . . . . . . . . . . . . . . . . . . . . . . 1,270 7,204Energisa SA . . . . . . . . . . . . . . . . . . . . . . . . . . . . . 911 7,895Equatorial Energia SA . . . . . . . . . . . . . . . . . . . . . 5,014 24,925Klabin SA* . . . . . . . . . . . . . . . . . . . . . . . . . . . . . . 4,203 21,600Localiza Rent a Car SA . . . . . . . . . . . . . . . . . . . . 3,305 35,803Lojas Renner SA . . . . . . . . . . . . . . . . . . . . . . . . . . 4,928 36,636Natura & Co. Holding SA* . . . . . . . . . . . . . . . . . 4,909 49,497Notre Dame Intermedica Participacoes SA . . . 2,831 44,205Rede D’Or Sao Luiz SA, 144A . . . . . . . . . . . . . . 2,195 29,507Rumo SA* . . . . . . . . . . . . . . . . . . . . . . . . . . . . . . . 7,024 25,684Telefonica Brasil SA . . . . . . . . . . . . . . . . . . . . . . 2,716 23,200TIM SA . . . . . . . . . . . . . . . . . . . . . . . . . . . . . . . . . . 3,968 9,657Ultrapar Participacoes SA . . . . . . . . . . . . . . . . . 4,393 12,391Via S/A* . . . . . . . . . . . . . . . . . . . . . . . . . . . . . . . . . 7,659 15,544WEG SA . . . . . . . . . . . . . . . . . . . . . . . . . . . . . . . . . 9,056 62,902
(Cost $656,228) . . . . . . . . . . . . . . . . . . . . . . . . . . . 646,978
Chile — 0.3%
Cencosud Shopping SA . . . . . . . . . . . . . . . . . . . 1,212 1,720Empresas CMPC SA . . . . . . . . . . . . . . . . . . . . . . 6,575 14,585Empresas COPEC SA . . . . . . . . . . . . . . . . . . . . . 2,062 19,155Enel Americas SA . . . . . . . . . . . . . . . . . . . . . . . . 125,793 17,651Falabella SA . . . . . . . . . . . . . . . . . . . . . . . . . . . . . 4,076 16,121
(Cost $80,776) . . . . . . . . . . . . . . . . . . . . . . . . . . . . 69,232
China — 33.0%
360 Security Technology, Inc., Class A* . . . . . 800 1,4763SBio, Inc., 144A* . . . . . . . . . . . . . . . . . . . . . . . . 7,378 8,22551job, Inc., ADR* (a) . . . . . . . . . . . . . . . . . . . . . . 177 13,594AAC Technologies Holdings, Inc. . . . . . . . . . . . 4,225 23,550Air China Ltd., Class A* . . . . . . . . . . . . . . . . . . . 4,600 5,162Air China Ltd., Class H* . . . . . . . . . . . . . . . . . . . 5,074 3,406Alibaba Group Holding Ltd.* . . . . . . . . . . . . . . . 83,278 1,772,134A-Living Smart City Services Co. Ltd.,144A . . . . . . . . . . . . . . . . . . . . . . . . . . . . . . . . . . . 3,103 12,289
Angel Yeast Co. Ltd., Class A . . . . . . . . . . . . . . . 200 1,242Baozun, Inc., ADR* . . . . . . . . . . . . . . . . . . . . . . . 339 8,163BBMG Corp., Class A . . . . . . . . . . . . . . . . . . . . . . 1,800 756Beijing Capital International Airport Co. Ltd.,Class H* . . . . . . . . . . . . . . . . . . . . . . . . . . . . . . . . 10,259 6,187
BYD Co. Ltd., Class A . . . . . . . . . . . . . . . . . . . . . 600 25,759BYD Co. Ltd., Class H . . . . . . . . . . . . . . . . . . . . . 4,311 146,003By-health Co. Ltd., Class A . . . . . . . . . . . . . . . . . 300 1,169CanSino Biologics, Inc., Class A* . . . . . . . . . . . 26 1,552CanSino Biologics, Inc., Class H, 144A* . . . . . 412 16,284
Numberof Shares Value
China (Continued)
Changzhou Xingyu Automotive LightingSystems Co. Ltd., Class A . . . . . . . . . . . . . . . . . 100 $ 2,999
China Aoyuan Group Ltd. . . . . . . . . . . . . . . . . . . 6,000 3,595China Communications Services Corp. Ltd.,Class H . . . . . . . . . . . . . . . . . . . . . . . . . . . . . . . . . 13,055 6,949
China Conch Venture Holdings Ltd. . . . . . . . . . 9,056 37,028China Construction Bank Corp., Class A . . . . . 1,800 1,632China Construction Bank Corp., Class H . . . . . 528,376 381,810China East Education Holdings Ltd.,144A* (a) . . . . . . . . . . . . . . . . . . . . . . . . . . . . . . . 2,000 2,145
China Eastern Airlines Corp. Ltd., Class A* . . 4,800 3,497China Feihe Ltd., 144A . . . . . . . . . . . . . . . . . . . . 19,567 35,424China Jushi Co. Ltd., Class A . . . . . . . . . . . . . . . 1,028 2,796China Lesso Group Holdings Ltd. . . . . . . . . . . . 5,105 10,922China Medical System Holdings Ltd. . . . . . . . . 7,095 13,903China Merchants Bank Co. Ltd., Class H . . . . . 21,739 179,590China Merchants Shekou Industrial ZoneHoldings Co. Ltd., Class A . . . . . . . . . . . . . . . . 2,100 3,242
China Molybdenum Co. Ltd., Class A . . . . . . . . 4,200 5,091China Molybdenum Co. Ltd., Class H . . . . . . . . 21,869 17,096China National Medicines Corp. Ltd.,Class A . . . . . . . . . . . . . . . . . . . . . . . . . . . . . . . . . 200 905
China Resources Pharmaceutical Group Ltd.,144A . . . . . . . . . . . . . . . . . . . . . . . . . . . . . . . . . . . 4,506 2,346
China Resources Sanjiu Medical &Pharmaceutical Co. Ltd., Class A . . . . . . . . . . . 400 1,733
China Southern Airlines Co. Ltd., Class H* . . . 9,335 5,437China Tourism Group Duty Free Corp. Ltd.,Class A . . . . . . . . . . . . . . . . . . . . . . . . . . . . . . . . . 600 21,230
China Vanke Co. Ltd., Class A . . . . . . . . . . . . . . 3,300 10,127China Vanke Co. Ltd., Class H . . . . . . . . . . . . . . 9,055 24,450Chongqing Changan Automobile Co. Ltd.,Class A . . . . . . . . . . . . . . . . . . . . . . . . . . . . . . . . . 2,000 6,392
CIFI Ever Sunshine Services Group Ltd. . . . . . 4,248 8,772CIFI Holdings Group Co. Ltd. . . . . . . . . . . . . . . . 20,133 13,565CITIC Ltd. . . . . . . . . . . . . . . . . . . . . . . . . . . . . . . . . 31,757 39,526Contemporary Amperex Technology Co. Ltd.,Class A . . . . . . . . . . . . . . . . . . . . . . . . . . . . . . . . . 804 61,667
Country Garden Services Holdings Co.Ltd. . . . . . . . . . . . . . . . . . . . . . . . . . . . . . . . . . . . . 8,241 62,782
CSPC Pharmaceutical Group Ltd. . . . . . . . . . . . 50,890 64,583Dali Foods Group Co. Ltd., 144A . . . . . . . . . . . . 5,848 3,278Dongfeng Motor Group Co. Ltd., Class H . . . . 15,043 16,479ENN Energy Holdings Ltd. . . . . . . . . . . . . . . . . . 4,386 86,791Eve Energy Co. Ltd., Class A . . . . . . . . . . . . . . . 480 7,588Fosun International Ltd. . . . . . . . . . . . . . . . . . . . 14,001 17,714Fu Jian Anjoy Foods Co. Ltd., Class A . . . . . . . 100 2,422Fuyao Glass Industry Group Co. Ltd.,Class A . . . . . . . . . . . . . . . . . . . . . . . . . . . . . . . . . 600 4,454
Fuyao Glass Industry Group Co. Ltd., Class H,144A . . . . . . . . . . . . . . . . . . . . . . . . . . . . . . . . . . . 3,010 18,538
Ganfeng Lithium Co. Ltd., Class A . . . . . . . . . . 400 13,639Ganfeng Lithium Co. Ltd., Class H, 144A . . . . . 1,423 32,788GEM Co. Ltd., Class A . . . . . . . . . . . . . . . . . . . . . 1,200 2,498Genscript Biotech Corp.* . . . . . . . . . . . . . . . . . . 6,941 32,977GoerTek, Inc., Class A . . . . . . . . . . . . . . . . . . . . . 700 5,049Gotion High-tech Co. Ltd., Class A* . . . . . . . . . 500 4,165
See Notes to Financial Statements. 40
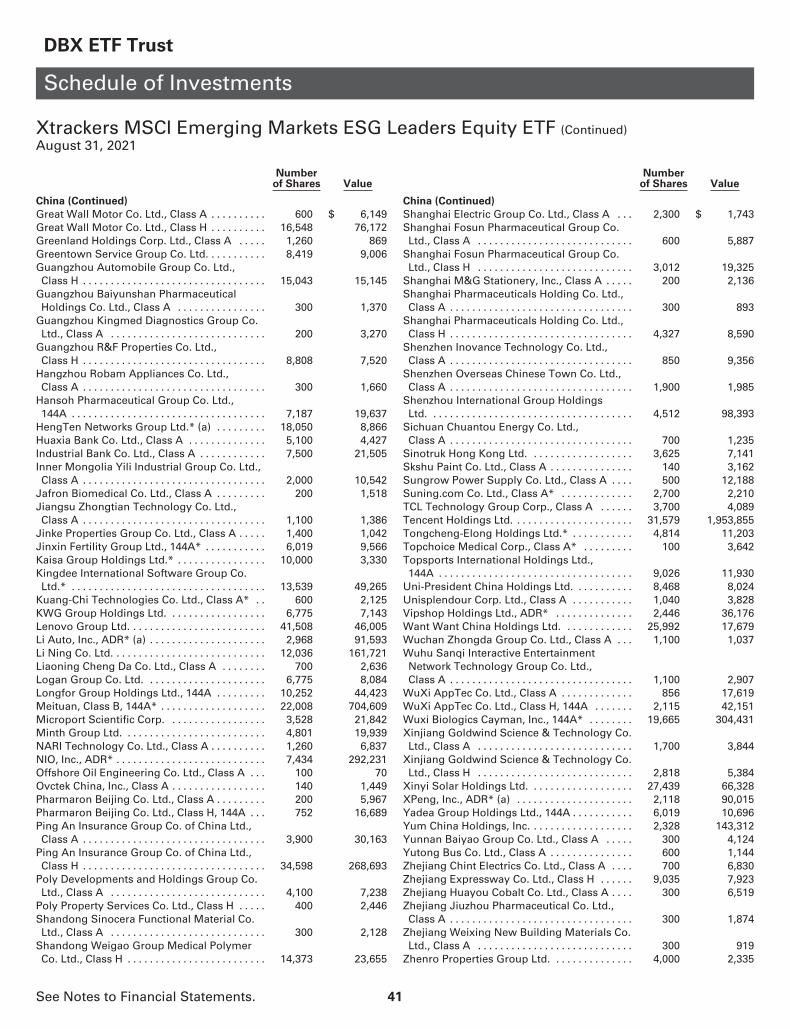
DBX ETF Trust
Schedule of Investments
Xtrackers MSCI Emerging Markets ESG Leaders Equity ETF (Continued)August 31, 2021
Numberof Shares Value
China (Continued)
Great Wall Motor Co. Ltd., Class A . . . . . . . . . . 600 $ 6,149Great Wall Motor Co. Ltd., Class H . . . . . . . . . . 16,548 76,172Greenland Holdings Corp. Ltd., Class A . . . . . 1,260 869Greentown Service Group Co. Ltd. . . . . . . . . . . 8,419 9,006Guangzhou Automobile Group Co. Ltd.,Class H . . . . . . . . . . . . . . . . . . . . . . . . . . . . . . . . . 15,043 15,145
Guangzhou Baiyunshan PharmaceuticalHoldings Co. Ltd., Class A . . . . . . . . . . . . . . . . 300 1,370
Guangzhou Kingmed Diagnostics Group Co.Ltd., Class A . . . . . . . . . . . . . . . . . . . . . . . . . . . . 200 3,270
Guangzhou R&F Properties Co. Ltd.,Class H . . . . . . . . . . . . . . . . . . . . . . . . . . . . . . . . . 8,808 7,520
Hangzhou Robam Appliances Co. Ltd.,Class A . . . . . . . . . . . . . . . . . . . . . . . . . . . . . . . . . 300 1,660
Hansoh Pharmaceutical Group Co. Ltd.,144A . . . . . . . . . . . . . . . . . . . . . . . . . . . . . . . . . . . 7,187 19,637
HengTen Networks Group Ltd.* (a) . . . . . . . . . 18,050 8,866Huaxia Bank Co. Ltd., Class A . . . . . . . . . . . . . . 5,100 4,427Industrial Bank Co. Ltd., Class A . . . . . . . . . . . . 7,500 21,505Inner Mongolia Yili Industrial Group Co. Ltd.,Class A . . . . . . . . . . . . . . . . . . . . . . . . . . . . . . . . . 2,000 10,542
Jafron Biomedical Co. Ltd., Class A . . . . . . . . . 200 1,518Jiangsu Zhongtian Technology Co. Ltd.,Class A . . . . . . . . . . . . . . . . . . . . . . . . . . . . . . . . . 1,100 1,386
Jinke Properties Group Co. Ltd., Class A . . . . . 1,400 1,042Jinxin Fertility Group Ltd., 144A* . . . . . . . . . . . 6,019 9,566Kaisa Group Holdings Ltd.* . . . . . . . . . . . . . . . . 10,000 3,330Kingdee International Software Group Co.Ltd.* . . . . . . . . . . . . . . . . . . . . . . . . . . . . . . . . . . . 13,539 49,265
Kuang-Chi Technologies Co. Ltd., Class A* . . 600 2,125KWG Group Holdings Ltd. . . . . . . . . . . . . . . . . . 6,775 7,143Lenovo Group Ltd. . . . . . . . . . . . . . . . . . . . . . . . . 41,508 46,005Li Auto, Inc., ADR* (a) . . . . . . . . . . . . . . . . . . . . . 2,968 91,593Li Ning Co. Ltd. . . . . . . . . . . . . . . . . . . . . . . . . . . . 12,036 161,721Liaoning Cheng Da Co. Ltd., Class A . . . . . . . . 700 2,636Logan Group Co. Ltd. . . . . . . . . . . . . . . . . . . . . . 6,775 8,084Longfor Group Holdings Ltd., 144A . . . . . . . . . 10,252 44,423Meituan, Class B, 144A* . . . . . . . . . . . . . . . . . . . 22,008 704,609Microport Scientific Corp. . . . . . . . . . . . . . . . . . 3,528 21,842Minth Group Ltd. . . . . . . . . . . . . . . . . . . . . . . . . . 4,801 19,939NARI Technology Co. Ltd., Class A . . . . . . . . . . 1,260 6,837NIO, Inc., ADR* . . . . . . . . . . . . . . . . . . . . . . . . . . . 7,434 292,231Offshore Oil Engineering Co. Ltd., Class A . . . 100 70Ovctek China, Inc., Class A . . . . . . . . . . . . . . . . . 140 1,449Pharmaron Beijing Co. Ltd., Class A . . . . . . . . . 200 5,967Pharmaron Beijing Co. Ltd., Class H, 144A . . . 752 16,689Ping An Insurance Group Co. of China Ltd.,Class A . . . . . . . . . . . . . . . . . . . . . . . . . . . . . . . . . 3,900 30,163
Ping An Insurance Group Co. of China Ltd.,Class H . . . . . . . . . . . . . . . . . . . . . . . . . . . . . . . . . 34,598 268,693
Poly Developments and Holdings Group Co.Ltd., Class A . . . . . . . . . . . . . . . . . . . . . . . . . . . . 4,100 7,238
Poly Property Services Co. Ltd., Class H . . . . . 400 2,446Shandong Sinocera Functional Material Co.Ltd., Class A . . . . . . . . . . . . . . . . . . . . . . . . . . . . 300 2,128
Shandong Weigao Group Medical PolymerCo. Ltd., Class H . . . . . . . . . . . . . . . . . . . . . . . . . 14,373 23,655
Numberof Shares Value
China (Continued)
Shanghai Electric Group Co. Ltd., Class A . . . 2,300 $ 1,743Shanghai Fosun Pharmaceutical Group Co.Ltd., Class A . . . . . . . . . . . . . . . . . . . . . . . . . . . . 600 5,887
Shanghai Fosun Pharmaceutical Group Co.Ltd., Class H . . . . . . . . . . . . . . . . . . . . . . . . . . . . 3,012 19,325
Shanghai M&G Stationery, Inc., Class A . . . . . 200 2,136Shanghai Pharmaceuticals Holding Co. Ltd.,Class A . . . . . . . . . . . . . . . . . . . . . . . . . . . . . . . . . 300 893
Shanghai Pharmaceuticals Holding Co. Ltd.,Class H . . . . . . . . . . . . . . . . . . . . . . . . . . . . . . . . . 4,327 8,590
Shenzhen Inovance Technology Co. Ltd.,Class A . . . . . . . . . . . . . . . . . . . . . . . . . . . . . . . . . 850 9,356
Shenzhen Overseas Chinese Town Co. Ltd.,Class A . . . . . . . . . . . . . . . . . . . . . . . . . . . . . . . . . 1,900 1,985
Shenzhou International Group HoldingsLtd. . . . . . . . . . . . . . . . . . . . . . . . . . . . . . . . . . . . . 4,512 98,393
Sichuan Chuantou Energy Co. Ltd.,Class A . . . . . . . . . . . . . . . . . . . . . . . . . . . . . . . . . 700 1,235
Sinotruk Hong Kong Ltd. . . . . . . . . . . . . . . . . . . 3,625 7,141Skshu Paint Co. Ltd., Class A . . . . . . . . . . . . . . . 140 3,162Sungrow Power Supply Co. Ltd., Class A . . . . 500 12,188Suning.com Co. Ltd., Class A* . . . . . . . . . . . . . 2,700 2,210TCL Technology Group Corp., Class A . . . . . . 3,700 4,089Tencent Holdings Ltd. . . . . . . . . . . . . . . . . . . . . . 31,579 1,953,855Tongcheng-Elong Holdings Ltd.* . . . . . . . . . . . 4,814 11,203Topchoice Medical Corp., Class A* . . . . . . . . . 100 3,642Topsports International Holdings Ltd.,144A . . . . . . . . . . . . . . . . . . . . . . . . . . . . . . . . . . . 9,026 11,930
Uni-President China Holdings Ltd. . . . . . . . . . . 8,468 8,024Unisplendour Corp. Ltd., Class A . . . . . . . . . . . 1,040 3,828Vipshop Holdings Ltd., ADR* . . . . . . . . . . . . . . 2,446 36,176Want Want China Holdings Ltd. . . . . . . . . . . . . 25,992 17,679Wuchan Zhongda Group Co. Ltd., Class A . . . 1,100 1,037Wuhu Sanqi Interactive EntertainmentNetwork Technology Group Co. Ltd.,Class A . . . . . . . . . . . . . . . . . . . . . . . . . . . . . . . . . 1,100 2,907
WuXi AppTec Co. Ltd., Class A . . . . . . . . . . . . . 856 17,619WuXi AppTec Co. Ltd., Class H, 144A . . . . . . . 2,115 42,151Wuxi Biologics Cayman, Inc., 144A* . . . . . . . . 19,665 304,431Xinjiang Goldwind Science & Technology Co.Ltd., Class A . . . . . . . . . . . . . . . . . . . . . . . . . . . . 1,700 3,844
Xinjiang Goldwind Science & Technology Co.Ltd., Class H . . . . . . . . . . . . . . . . . . . . . . . . . . . . 2,818 5,384
Xinyi Solar Holdings Ltd. . . . . . . . . . . . . . . . . . . 27,439 66,328XPeng, Inc., ADR* (a) . . . . . . . . . . . . . . . . . . . . . 2,118 90,015Yadea Group Holdings Ltd., 144A . . . . . . . . . . . 6,019 10,696Yum China Holdings, Inc. . . . . . . . . . . . . . . . . . . 2,328 143,312Yunnan Baiyao Group Co. Ltd., Class A . . . . . 300 4,124Yutong Bus Co. Ltd., Class A . . . . . . . . . . . . . . . 600 1,144Zhejiang Chint Electrics Co. Ltd., Class A . . . . 700 6,830Zhejiang Expressway Co. Ltd., Class H . . . . . . 9,035 7,923Zhejiang Huayou Cobalt Co. Ltd., Class A . . . . 300 6,519Zhejiang Jiuzhou Pharmaceutical Co. Ltd.,Class A . . . . . . . . . . . . . . . . . . . . . . . . . . . . . . . . . 300 1,874
Zhejiang Weixing New Building Materials Co.Ltd., Class A . . . . . . . . . . . . . . . . . . . . . . . . . . . . 300 919
Zhenro Properties Group Ltd. . . . . . . . . . . . . . . 4,000 2,335
See Notes to Financial Statements. 41

DBX ETF Trust
Schedule of Investments
Xtrackers MSCI Emerging Markets ESG Leaders Equity ETF (Continued)August 31, 2021
Numberof Shares Value
China (Continued)
Zhongsheng Group Holdings Ltd. . . . . . . . . . . 3,010 $ 25,156Zoomlion Heavy Industry Science andTechnology Co. Ltd., Class A . . . . . . . . . . . . . . 3,800 4,641
Zoomlion Heavy Industry Science andTechnology Co. Ltd., Class H . . . . . . . . . . . . . . 7,378 7,030
(Cost $7,845,791) . . . . . . . . . . . . . . . . . . . . . . . . . 8,327,385
Czech Republic — 0.1%
Komercni banka AS* . . . . . . . . . . . . . . . . . . . . . . 358 13,760Moneta Money Bank AS, 144A* . . . . . . . . . . . . 2,105 8,536
(Cost $19,287) . . . . . . . . . . . . . . . . . . . . . . . . . . . . 22,296
Egypt — 0.1%
Commercial International Bank Egypt SAE*(Cost $22,954) . . . . . . . . . . . . . . . . . . . . . . . . . . . 8,865 26,426
Greece — 0.1%
Eurobank Ergasias Services and HoldingsSA* . . . . . . . . . . . . . . . . . . . . . . . . . . . . . . . . . . . . 14,292 13,615
Hellenic Telecommunications OrganizationSA . . . . . . . . . . . . . . . . . . . . . . . . . . . . . . . . . . . . . 1,265 24,885
(Cost $32,432) . . . . . . . . . . . . . . . . . . . . . . . . . . . . 38,500
Hong Kong — 2.1%
Alibaba Health Information TechnologyLtd.* . . . . . . . . . . . . . . . . . . . . . . . . . . . . . . . . . . . 22,679 37,209
Beijing Enterprises Water Group Ltd.* . . . . . . 24,465 10,098China Education Group Holdings Ltd. . . . . . . . 4,512 8,517China Everbright Environment Group Ltd. . . . 17,100 11,829China Gas Holdings Ltd. . . . . . . . . . . . . . . . . . . . 17,935 52,001China Jinmao Holdings Group Ltd. . . . . . . . . . 30,086 9,787China Mengniu Dairy Co. Ltd.* . . . . . . . . . . . . . 16,890 101,527China Overseas Land & Investment Ltd. . . . . . 21,060 48,471China Resources Gas Group Ltd. . . . . . . . . . . . 5,014 30,429Geely Automobile Holdings Ltd. . . . . . . . . . . . . 32,143 116,134Hopson Development Holdings Ltd. . . . . . . . . 3,462 13,488Hutchmed China Ltd., ADR* (a) . . . . . . . . . . . . . 445 17,960Lee & Man Paper Manufacturing Ltd. . . . . . . . 4,038 3,546Shenzhen International Holdings Ltd. . . . . . . . 6,769 8,825Shenzhen Investment Ltd. . . . . . . . . . . . . . . . . . 9,074 2,695Shimao Group Holdings Ltd. . . . . . . . . . . . . . . . 6,769 13,995Sino Biopharmaceutical Ltd. . . . . . . . . . . . . . . . 59,046 49,424Vinda International Holdings Ltd. (a) . . . . . . . . 1,753 5,162
(Cost $519,180) . . . . . . . . . . . . . . . . . . . . . . . . . . . 541,097
Hungary — 0.4%
MOL Hungarian Oil & Gas PLC . . . . . . . . . . . . . 2,284 18,718OTP Bank Nyrt* . . . . . . . . . . . . . . . . . . . . . . . . . . 1,229 74,167
(Cost $79,006) . . . . . . . . . . . . . . . . . . . . . . . . . . . . 92,885
India — 11.7%
Adani Green Energy Ltd.* . . . . . . . . . . . . . . . . . 2,241 32,793Adani Total Gas Ltd. . . . . . . . . . . . . . . . . . . . . . . 958 19,060Asian Paints Ltd. . . . . . . . . . . . . . . . . . . . . . . . . . 2,105 92,303Axis Bank Ltd.* . . . . . . . . . . . . . . . . . . . . . . . . . . . 12,473 134,370Bajaj Auto Ltd. . . . . . . . . . . . . . . . . . . . . . . . . . . . 390 19,914Bandhan Bank Ltd., 144A . . . . . . . . . . . . . . . . . . 3,468 13,538Berger Paints India Ltd. . . . . . . . . . . . . . . . . . . . . 1,280 14,391Bharat Petroleum Corp. Ltd. . . . . . . . . . . . . . . . 4,919 31,778
Numberof Shares Value
India (Continued)
Biocon Ltd.* . . . . . . . . . . . . . . . . . . . . . . . . . . . . . 2,210 $ 10,863Britannia Industries Ltd. . . . . . . . . . . . . . . . . . . . 581 31,812Colgate-Palmolive India Ltd. . . . . . . . . . . . . . . . 655 15,192Dabur India Ltd. . . . . . . . . . . . . . . . . . . . . . . . . . . 3,311 28,186DLF Ltd. . . . . . . . . . . . . . . . . . . . . . . . . . . . . . . . . . 3,259 14,309Eicher Motors Ltd. . . . . . . . . . . . . . . . . . . . . . . . . 806 29,579Grasim Industries Ltd. . . . . . . . . . . . . . . . . . . . . . 1,454 29,882Havells India Ltd. . . . . . . . . . . . . . . . . . . . . . . . . . 1,250 21,718HCL Technologies Ltd. . . . . . . . . . . . . . . . . . . . . 5,939 96,177Hero MotoCorp Ltd. . . . . . . . . . . . . . . . . . . . . . . . 654 24,561Hindalco Industries Ltd. . . . . . . . . . . . . . . . . . . . 8,662 55,561Hindustan Unilever Ltd. . . . . . . . . . . . . . . . . . . . 4,508 168,205Housing Development Finance Corp. Ltd. . . . . 9,401 360,356Info Edge India Ltd. . . . . . . . . . . . . . . . . . . . . . . . 428 36,243Infosys Ltd. . . . . . . . . . . . . . . . . . . . . . . . . . . . . . . 5,955 139,190Infosys Ltd., ADR . . . . . . . . . . . . . . . . . . . . . . . . . 12,406 295,511Lupin Ltd. . . . . . . . . . . . . . . . . . . . . . . . . . . . . . . . 1,274 16,715Mahindra & Mahindra Ltd. . . . . . . . . . . . . . . . . . 4,794 52,092Marico Ltd. . . . . . . . . . . . . . . . . . . . . . . . . . . . . . . 3,076 22,939Motherson Sumi Systems Ltd.* . . . . . . . . . . . . 7,023 21,028Nestle India Ltd. . . . . . . . . . . . . . . . . . . . . . . . . . . 185 49,331PI Industries Ltd. . . . . . . . . . . . . . . . . . . . . . . . . . 465 21,617Pidilite Industries Ltd. . . . . . . . . . . . . . . . . . . . . . 757 23,644Piramal Enterprises Ltd. . . . . . . . . . . . . . . . . . . . 524 18,709Reliance Industries Ltd. . . . . . . . . . . . . . . . . . . . . 15,648 483,999Shree Cement Ltd. . . . . . . . . . . . . . . . . . . . . . . . . 62 24,023Siemens Ltd. . . . . . . . . . . . . . . . . . . . . . . . . . . . . . 372 11,579State Bank of India . . . . . . . . . . . . . . . . . . . . . . . . 9,829 57,359Tata Consultancy Services Ltd. . . . . . . . . . . . . . 5,069 262,898Titan Co. Ltd. . . . . . . . . . . . . . . . . . . . . . . . . . . . . . 1,958 51,536Trent Ltd. . . . . . . . . . . . . . . . . . . . . . . . . . . . . . . . . 1,018 14,040UPL Ltd. . . . . . . . . . . . . . . . . . . . . . . . . . . . . . . . . . 2,658 26,987Wipro Ltd. . . . . . . . . . . . . . . . . . . . . . . . . . . . . . . . 7,004 61,490Wipro Ltd., ADR . . . . . . . . . . . . . . . . . . . . . . . . . . 508 4,745
(Cost $2,350,120) . . . . . . . . . . . . . . . . . . . . . . . . . 2,940,223
Indonesia — 0.8%
Aneka Tambang Tbk . . . . . . . . . . . . . . . . . . . . . . 45,742 7,665PT Bank Central Asia Tbk . . . . . . . . . . . . . . . . . . 60,616 139,188PT Barito Pacific Tbk . . . . . . . . . . . . . . . . . . . . . . 165,986 12,394PT Indah Kiat Pulp & Paper Tbk . . . . . . . . . . . . 13,000 7,201PT Kalbe Farma Tbk . . . . . . . . . . . . . . . . . . . . . . 110,845 10,453PT Merdeka Copper Gold Tbk* . . . . . . . . . . . . . 58,830 11,632PT Tower Bersama Infrastructure Tbk . . . . . . . 43,033 9,444PT Unilever Indonesia Tbk . . . . . . . . . . . . . . . . . 43,223 12,274
(Cost $204,717) . . . . . . . . . . . . . . . . . . . . . . . . . . . 210,251
Kuwait — 0.3%
Kuwait Finance House KSCP . . . . . . . . . . . . . . .(Cost $65,089) . . . . . . . . . . . . . . . . . . . . . . . . . . . . 25,616 70,342
Malaysia — 1.9%
AMMB Holdings Bhd* . . . . . . . . . . . . . . . . . . . . 10,100 7,362Axiata Group Bhd . . . . . . . . . . . . . . . . . . . . . . . . 12,883 12,830CIMB Group Holdings Bhd . . . . . . . . . . . . . . . . . 38,401 45,357Dialog Group Bhd . . . . . . . . . . . . . . . . . . . . . . . . 22,400 14,333DiGi.Com Bhd . . . . . . . . . . . . . . . . . . . . . . . . . . . . 17,700 18,735Fraser & Neave Holdings Bhd . . . . . . . . . . . . . . 300 2,012
See Notes to Financial Statements. 42

DBX ETF Trust
Schedule of Investments
Xtrackers MSCI Emerging Markets ESG Leaders Equity ETF (Continued)August 31, 2021
Numberof Shares Value
Malaysia (Continued)
HAP Seng Consolidated Bhd . . . . . . . . . . . . . . . 2,200 $ 4,498Hartalega Holdings Bhd . . . . . . . . . . . . . . . . . . . 10,400 18,463IHH Healthcare Bhd . . . . . . . . . . . . . . . . . . . . . . . 9,300 14,318Kossan Rubber Industries . . . . . . . . . . . . . . . . . 6,200 4,624Kuala Lumpur Kepong Bhd . . . . . . . . . . . . . . . . 2,800 14,387Malayan Banking Bhd . . . . . . . . . . . . . . . . . . . . . 22,472 45,409Malaysia Airports Holdings Bhd* . . . . . . . . . . . 5,400 8,612Maxis Bhd . . . . . . . . . . . . . . . . . . . . . . . . . . . . . . . 12,200 13,764MISC Bhd . . . . . . . . . . . . . . . . . . . . . . . . . . . . . . . 7,200 12,471Nestle Malaysia Bhd . . . . . . . . . . . . . . . . . . . . . . 500 16,202Petronas Dagangan Bhd . . . . . . . . . . . . . . . . . . . 1,500 7,202Petronas Gas Bhd . . . . . . . . . . . . . . . . . . . . . . . . 4,600 18,590PPB Group Bhd . . . . . . . . . . . . . . . . . . . . . . . . . . 4,100 18,266Press Metal Aluminium Holdings Bhd . . . . . . . 18,200 23,642Public Bank Bhd . . . . . . . . . . . . . . . . . . . . . . . . . . 80,475 80,920QL Resources Bhd . . . . . . . . . . . . . . . . . . . . . . . . 5,400 7,223RHB Bank Bhd . . . . . . . . . . . . . . . . . . . . . . . . . . . 8,794 11,826Sime Darby Bhd . . . . . . . . . . . . . . . . . . . . . . . . . . 15,000 8,516Supermax Corp. Bhd . . . . . . . . . . . . . . . . . . . . . . 4,177 3,316Telekom Malaysia Bhd . . . . . . . . . . . . . . . . . . . . 6,100 8,966Top Glove Corp. Bhd . . . . . . . . . . . . . . . . . . . . . . 28,600 27,520Westports Holdings Bhd . . . . . . . . . . . . . . . . . . . 2,700 2,858
(Cost $473,917) . . . . . . . . . . . . . . . . . . . . . . . . . . . 472,222
Mexico — 1.4%
Arca Continental SAB de CV . . . . . . . . . . . . . . . 2,422 15,636Cemex SAB de CV, Series CPO* . . . . . . . . . . . . 83,556 68,798Coca-Cola Femsa SAB de CV . . . . . . . . . . . . . . . 2,972 17,244Fomento Economico Mexicano SAB de CV . . 10,755 93,851Gruma SAB de CV, Class B . . . . . . . . . . . . . . . . 1,282 14,674Grupo Bimbo SAB de CV, Series A . . . . . . . . . 8,444 21,414Grupo Financiero Banorte SAB de CV,Class O . . . . . . . . . . . . . . . . . . . . . . . . . . . . . . . . . 14,194 93,906
Industrias Penoles SAB de CV* . . . . . . . . . . . . . 756 10,736Kimberly-Clark de Mexico SAB de CV,Class A . . . . . . . . . . . . . . . . . . . . . . . . . . . . . . . . . 8,677 15,358
(Cost $323,308) . . . . . . . . . . . . . . . . . . . . . . . . . . . 351,617
Philippines — 0.6%
Ayala Land, Inc. . . . . . . . . . . . . . . . . . . . . . . . . . . 43,000 29,171Bank of the Philippine Islands . . . . . . . . . . . . . . 10,720 17,928Globe Telecom, Inc. . . . . . . . . . . . . . . . . . . . . . . . 130 7,108GT Capital Holdings, Inc. . . . . . . . . . . . . . . . . . . 460 4,993JG Summit Holdings, Inc. . . . . . . . . . . . . . . . . . 16,920 22,072SM Investments Corp. . . . . . . . . . . . . . . . . . . . . 1,382 28,029SM Prime Holdings, Inc. . . . . . . . . . . . . . . . . . . . 55,300 37,793Universal Robina Corp. . . . . . . . . . . . . . . . . . . . . 5,280 16,004
(Cost $160,130) . . . . . . . . . . . . . . . . . . . . . . . . . . . 163,098
Poland — 1.0%
Bank Polska Kasa Opieki SA* . . . . . . . . . . . . . . 1,010 28,278CD Projekt SA . . . . . . . . . . . . . . . . . . . . . . . . . . . . 418 18,485Cyfrowy Polsat SA . . . . . . . . . . . . . . . . . . . . . . . . 1,259 12,022KGHM Polska Miedz SA . . . . . . . . . . . . . . . . . . . 758 35,299Orange Polska SA* . . . . . . . . . . . . . . . . . . . . . . . 4,561 9,864Polski Koncern Naftowy ORLEN SA . . . . . . . . . 1,653 32,077Powszechna Kasa Oszczednosci Bank PolskiSA* . . . . . . . . . . . . . . . . . . . . . . . . . . . . . . . . . . . . 4,767 52,354
Numberof Shares Value
Poland (Continued)
Powszechny Zaklad Ubezpieczen SA* . . . . . . . 3,256 $ 34,526Santander Bank Polska SA* . . . . . . . . . . . . . . . . 223 17,589
(Cost $226,012) . . . . . . . . . . . . . . . . . . . . . . . . . . . 240,494
Qatar — 0.7%
Commercial Bank PSQC . . . . . . . . . . . . . . . . . . . 10,242 16,985Ooredoo QPSC . . . . . . . . . . . . . . . . . . . . . . . . . . . 3,312 6,288Qatar Fuel QSC . . . . . . . . . . . . . . . . . . . . . . . . . . . 2,569 12,912Qatar National Bank QPSC . . . . . . . . . . . . . . . . . 25,083 132,063
(Cost $160,286) . . . . . . . . . . . . . . . . . . . . . . . . . . . 168,248
Romania — 0.1%
NEPI Rockcastle PLC(Cost $18,617) . . . . . . . . . . . . . . . . . . . . . . . . . . . 2,573 18,658
Russia — 2.9%
Gazprom PJSC . . . . . . . . . . . . . . . . . . . . . . . . . . . 65,265 272,626LUKOIL PJSC . . . . . . . . . . . . . . . . . . . . . . . . . . . . 2,272 194,226LUKOIL PJSC, ADR . . . . . . . . . . . . . . . . . . . . . . . 1 85Mobile TeleSystems PJSC, ADR . . . . . . . . . . . . 2,678 25,120Moscow Exchange MICEX-RTS PJSC . . . . . . . 7,202 18,022Novatek PJSC, GDR . . . . . . . . . . . . . . . . . . . . . . . 505 119,685Novolipetsk Steel PJSC . . . . . . . . . . . . . . . . . . . 7,931 26,730PhosAgro PJSC, GDR . . . . . . . . . . . . . . . . . . . . . 759 14,952Polymetal International PLC . . . . . . . . . . . . . . . 1,940 38,750Polyus PJSC . . . . . . . . . . . . . . . . . . . . . . . . . . . . . 181 32,632
(Cost $638,096) . . . . . . . . . . . . . . . . . . . . . . . . . . . 742,828
Saudi Arabia — 1.1%
Almarai Co. JSC . . . . . . . . . . . . . . . . . . . . . . . . . . 1,417 21,912Bank AlBilad* . . . . . . . . . . . . . . . . . . . . . . . . . . . . 2,124 24,209Dr Sulaiman Al Habib Medical ServicesGroup Co. . . . . . . . . . . . . . . . . . . . . . . . . . . . . . . 309 15,126
Saudi Arabian Mining Co.* . . . . . . . . . . . . . . . . 2,339 45,399Saudi Basic Industries Corp. . . . . . . . . . . . . . . . 4,915 161,182Savola Group . . . . . . . . . . . . . . . . . . . . . . . . . . . . 1,599 17,117
(Cost $250,672) . . . . . . . . . . . . . . . . . . . . . . . . . . . 284,945
Singapore — 0.0%
BOC Aviation Ltd., 144A(Cost $8,753) . . . . . . . . . . . . . . . . . . . . . . . . . . . . 1,104 8,276
South Africa — 4.7%
Absa Group Ltd.* . . . . . . . . . . . . . . . . . . . . . . . . . 3,894 42,547Anglo American Platinum Ltd. (a) . . . . . . . . . . . 298 33,960Aspen Pharmacare Holdings Ltd.* . . . . . . . . . . 2,296 31,128Bid Corp. Ltd.* . . . . . . . . . . . . . . . . . . . . . . . . . . . 1,823 40,314Bidvest Group Ltd. . . . . . . . . . . . . . . . . . . . . . . . . 1,511 21,414Capitec Bank Holdings Ltd. . . . . . . . . . . . . . . . . 446 58,512Clicks Group Ltd. . . . . . . . . . . . . . . . . . . . . . . . . . 1,265 26,460Discovery Ltd.* . . . . . . . . . . . . . . . . . . . . . . . . . . . 2,378 21,169FirstRand Ltd. . . . . . . . . . . . . . . . . . . . . . . . . . . . . 27,938 119,536Gold Fields Ltd. (a) . . . . . . . . . . . . . . . . . . . . . . . . 5,036 47,516Growthpoint Properties Ltd. REIT . . . . . . . . . . . 19,917 21,315Impala Platinum Holdings Ltd. . . . . . . . . . . . . . 4,302 66,292Kumba Iron Ore Ltd. . . . . . . . . . . . . . . . . . . . . . . 404 18,238MTN Group Ltd.* . . . . . . . . . . . . . . . . . . . . . . . . . 9,332 86,088MultiChoice Group . . . . . . . . . . . . . . . . . . . . . . . 2,060 16,363Naspers Ltd., Class N (a) . . . . . . . . . . . . . . . . . . 1,200 205,738
See Notes to Financial Statements. 43
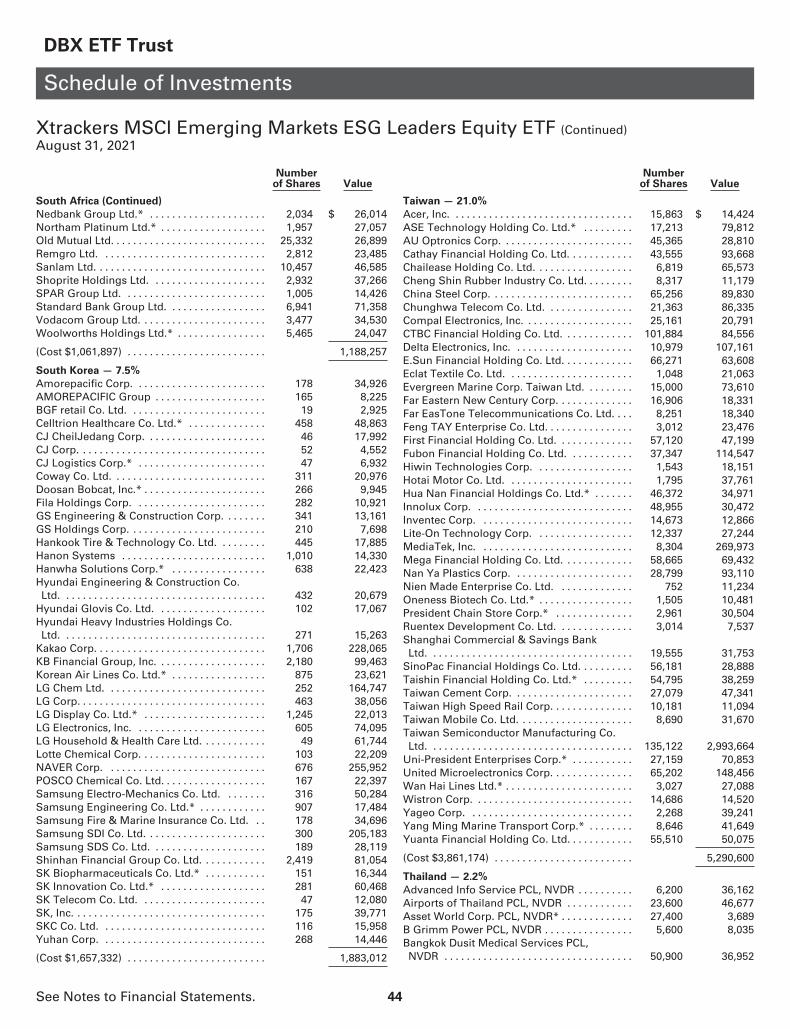
DBX ETF Trust
Schedule of Investments
Xtrackers MSCI Emerging Markets ESG Leaders Equity ETF (Continued)August 31, 2021
Numberof Shares Value
South Africa (Continued)
Nedbank Group Ltd.* . . . . . . . . . . . . . . . . . . . . . 2,034 $ 26,014Northam Platinum Ltd.* . . . . . . . . . . . . . . . . . . . 1,957 27,057Old Mutual Ltd. . . . . . . . . . . . . . . . . . . . . . . . . . . . 25,332 26,899Remgro Ltd. . . . . . . . . . . . . . . . . . . . . . . . . . . . . . 2,812 23,485Sanlam Ltd. . . . . . . . . . . . . . . . . . . . . . . . . . . . . . . 10,457 46,585Shoprite Holdings Ltd. . . . . . . . . . . . . . . . . . . . . 2,932 37,266SPAR Group Ltd. . . . . . . . . . . . . . . . . . . . . . . . . . 1,005 14,426Standard Bank Group Ltd. . . . . . . . . . . . . . . . . . 6,941 71,358Vodacom Group Ltd. . . . . . . . . . . . . . . . . . . . . . . 3,477 34,530Woolworths Holdings Ltd.* . . . . . . . . . . . . . . . . 5,465 24,047
(Cost $1,061,897) . . . . . . . . . . . . . . . . . . . . . . . . . 1,188,257
South Korea — 7.5%
Amorepacific Corp. . . . . . . . . . . . . . . . . . . . . . . . 178 34,926AMOREPACIFIC Group . . . . . . . . . . . . . . . . . . . . 165 8,225BGF retail Co. Ltd. . . . . . . . . . . . . . . . . . . . . . . . . 19 2,925Celltrion Healthcare Co. Ltd.* . . . . . . . . . . . . . . 458 48,863CJ CheilJedang Corp. . . . . . . . . . . . . . . . . . . . . . 46 17,992CJ Corp. . . . . . . . . . . . . . . . . . . . . . . . . . . . . . . . . . 52 4,552CJ Logistics Corp.* . . . . . . . . . . . . . . . . . . . . . . . 47 6,932Coway Co. Ltd. . . . . . . . . . . . . . . . . . . . . . . . . . . . 311 20,976Doosan Bobcat, Inc.* . . . . . . . . . . . . . . . . . . . . . . 266 9,945Fila Holdings Corp. . . . . . . . . . . . . . . . . . . . . . . . 282 10,921GS Engineering & Construction Corp. . . . . . . . 341 13,161GS Holdings Corp. . . . . . . . . . . . . . . . . . . . . . . . . 210 7,698Hankook Tire & Technology Co. Ltd. . . . . . . . . 445 17,885Hanon Systems . . . . . . . . . . . . . . . . . . . . . . . . . . 1,010 14,330Hanwha Solutions Corp.* . . . . . . . . . . . . . . . . . 638 22,423Hyundai Engineering & Construction Co.Ltd. . . . . . . . . . . . . . . . . . . . . . . . . . . . . . . . . . . . . 432 20,679
Hyundai Glovis Co. Ltd. . . . . . . . . . . . . . . . . . . . 102 17,067Hyundai Heavy Industries Holdings Co.Ltd. . . . . . . . . . . . . . . . . . . . . . . . . . . . . . . . . . . . . 271 15,263
Kakao Corp. . . . . . . . . . . . . . . . . . . . . . . . . . . . . . . 1,706 228,065KB Financial Group, Inc. . . . . . . . . . . . . . . . . . . . 2,180 99,463Korean Air Lines Co. Ltd.* . . . . . . . . . . . . . . . . . 875 23,621LG Chem Ltd. . . . . . . . . . . . . . . . . . . . . . . . . . . . . 252 164,747LG Corp. . . . . . . . . . . . . . . . . . . . . . . . . . . . . . . . . . 463 38,056LG Display Co. Ltd.* . . . . . . . . . . . . . . . . . . . . . . 1,245 22,013LG Electronics, Inc. . . . . . . . . . . . . . . . . . . . . . . . 605 74,095LG Household & Health Care Ltd. . . . . . . . . . . . 49 61,744Lotte Chemical Corp. . . . . . . . . . . . . . . . . . . . . . . 103 22,209NAVER Corp. . . . . . . . . . . . . . . . . . . . . . . . . . . . . 676 255,952POSCO Chemical Co. Ltd. . . . . . . . . . . . . . . . . . . 167 22,397Samsung Electro-Mechanics Co. Ltd. . . . . . . . 316 50,284Samsung Engineering Co. Ltd.* . . . . . . . . . . . . 907 17,484Samsung Fire & Marine Insurance Co. Ltd. . . 178 34,696Samsung SDI Co. Ltd. . . . . . . . . . . . . . . . . . . . . . 300 205,183Samsung SDS Co. Ltd. . . . . . . . . . . . . . . . . . . . . 189 28,119Shinhan Financial Group Co. Ltd. . . . . . . . . . . . 2,419 81,054SK Biopharmaceuticals Co. Ltd.* . . . . . . . . . . . 151 16,344SK Innovation Co. Ltd.* . . . . . . . . . . . . . . . . . . . 281 60,468SK Telecom Co. Ltd. . . . . . . . . . . . . . . . . . . . . . . 47 12,080SK, Inc. . . . . . . . . . . . . . . . . . . . . . . . . . . . . . . . . . . 175 39,771SKC Co. Ltd. . . . . . . . . . . . . . . . . . . . . . . . . . . . . . 116 15,958Yuhan Corp. . . . . . . . . . . . . . . . . . . . . . . . . . . . . . 268 14,446
(Cost $1,657,332) . . . . . . . . . . . . . . . . . . . . . . . . . 1,883,012
Numberof Shares Value
Taiwan — 21.0%
Acer, Inc. . . . . . . . . . . . . . . . . . . . . . . . . . . . . . . . . 15,863 $ 14,424ASE Technology Holding Co. Ltd.* . . . . . . . . . 17,213 79,812AU Optronics Corp. . . . . . . . . . . . . . . . . . . . . . . . 45,365 28,810Cathay Financial Holding Co. Ltd. . . . . . . . . . . . 43,555 93,668Chailease Holding Co. Ltd. . . . . . . . . . . . . . . . . . 6,819 65,573Cheng Shin Rubber Industry Co. Ltd. . . . . . . . . 8,317 11,179China Steel Corp. . . . . . . . . . . . . . . . . . . . . . . . . . 65,256 89,830Chunghwa Telecom Co. Ltd. . . . . . . . . . . . . . . . 21,363 86,335Compal Electronics, Inc. . . . . . . . . . . . . . . . . . . . 25,161 20,791CTBC Financial Holding Co. Ltd. . . . . . . . . . . . . 101,884 84,556Delta Electronics, Inc. . . . . . . . . . . . . . . . . . . . . . 10,979 107,161E.Sun Financial Holding Co. Ltd. . . . . . . . . . . . . 66,271 63,608Eclat Textile Co. Ltd. . . . . . . . . . . . . . . . . . . . . . . 1,048 21,063Evergreen Marine Corp. Taiwan Ltd. . . . . . . . . 15,000 73,610Far Eastern New Century Corp. . . . . . . . . . . . . . 16,906 18,331Far EasTone Telecommunications Co. Ltd. . . . 8,251 18,340Feng TAY Enterprise Co. Ltd. . . . . . . . . . . . . . . . 3,012 23,476First Financial Holding Co. Ltd. . . . . . . . . . . . . . 57,120 47,199Fubon Financial Holding Co. Ltd. . . . . . . . . . . . 37,347 114,547Hiwin Technologies Corp. . . . . . . . . . . . . . . . . . 1,543 18,151Hotai Motor Co. Ltd. . . . . . . . . . . . . . . . . . . . . . . 1,795 37,761Hua Nan Financial Holdings Co. Ltd.* . . . . . . . 46,372 34,971Innolux Corp. . . . . . . . . . . . . . . . . . . . . . . . . . . . . 48,955 30,472Inventec Corp. . . . . . . . . . . . . . . . . . . . . . . . . . . . 14,673 12,866Lite-On Technology Corp. . . . . . . . . . . . . . . . . . 12,337 27,244MediaTek, Inc. . . . . . . . . . . . . . . . . . . . . . . . . . . . 8,304 269,973Mega Financial Holding Co. Ltd. . . . . . . . . . . . . 58,665 69,432Nan Ya Plastics Corp. . . . . . . . . . . . . . . . . . . . . . 28,799 93,110Nien Made Enterprise Co. Ltd. . . . . . . . . . . . . . 752 11,234Oneness Biotech Co. Ltd.* . . . . . . . . . . . . . . . . . 1,505 10,481President Chain Store Corp.* . . . . . . . . . . . . . . 2,961 30,504Ruentex Development Co. Ltd. . . . . . . . . . . . . . 3,014 7,537Shanghai Commercial & Savings BankLtd. . . . . . . . . . . . . . . . . . . . . . . . . . . . . . . . . . . . . 19,555 31,753
SinoPac Financial Holdings Co. Ltd. . . . . . . . . . 56,181 28,888Taishin Financial Holding Co. Ltd.* . . . . . . . . . 54,795 38,259Taiwan Cement Corp. . . . . . . . . . . . . . . . . . . . . . 27,079 47,341Taiwan High Speed Rail Corp. . . . . . . . . . . . . . . 10,181 11,094Taiwan Mobile Co. Ltd. . . . . . . . . . . . . . . . . . . . . 8,690 31,670Taiwan Semiconductor Manufacturing Co.Ltd. . . . . . . . . . . . . . . . . . . . . . . . . . . . . . . . . . . . . 135,122 2,993,664
Uni-President Enterprises Corp.* . . . . . . . . . . . 27,159 70,853United Microelectronics Corp. . . . . . . . . . . . . . . 65,202 148,456Wan Hai Lines Ltd.* . . . . . . . . . . . . . . . . . . . . . . . 3,027 27,088Wistron Corp. . . . . . . . . . . . . . . . . . . . . . . . . . . . . 14,686 14,520Yageo Corp. . . . . . . . . . . . . . . . . . . . . . . . . . . . . . 2,268 39,241Yang Ming Marine Transport Corp.* . . . . . . . . 8,646 41,649Yuanta Financial Holding Co. Ltd. . . . . . . . . . . . 55,510 50,075
(Cost $3,861,174) . . . . . . . . . . . . . . . . . . . . . . . . . 5,290,600
Thailand — 2.2%
Advanced Info Service PCL, NVDR . . . . . . . . . . 6,200 36,162Airports of Thailand PCL, NVDR . . . . . . . . . . . . 23,600 46,677Asset World Corp. PCL, NVDR* . . . . . . . . . . . . . 27,400 3,689B Grimm Power PCL, NVDR . . . . . . . . . . . . . . . . 5,600 8,035Bangkok Dusit Medical Services PCL,NVDR . . . . . . . . . . . . . . . . . . . . . . . . . . . . . . . . . . 50,900 36,952
See Notes to Financial Statements. 44

DBX ETF Trust
Schedule of Investments
Xtrackers MSCI Emerging Markets ESG Leaders Equity ETF (Continued)August 31, 2021
Numberof Shares Value
Thailand (Continued)
Berli Jucker PCL, NVDR . . . . . . . . . . . . . . . . . . . 7,600 $ 8,547BTS Group Holdings PCL, NVDR . . . . . . . . . . . 46,000 13,415Bumrungrad Hospital PCL, NVDR . . . . . . . . . . . 2,900 11,966Central Pattana PCL, NVDR . . . . . . . . . . . . . . . . 11,700 19,511Charoen Pokphand Foods PCL, NVDR . . . . . . . 22,000 18,429CP ALL PCL, NVDR . . . . . . . . . . . . . . . . . . . . . . . 31,500 63,523Energy Absolute PCL, NVDR . . . . . . . . . . . . . . . 8,700 17,679Gulf Energy Development PCL, NVDR . . . . . . . 16,500 21,372Home Product Center PCL, NVDR . . . . . . . . . . . 31,400 13,931Indorama Ventures PCL, NVDR . . . . . . . . . . . . . 8,900 12,080Intouch Holdings PCL, NVDR . . . . . . . . . . . . . . . 6,100 16,181Land & Houses PCL, NVDR . . . . . . . . . . . . . . . . 52,300 13,224Minor International PCL, NVDR* . . . . . . . . . . . 17,374 17,653Muangthai Capital PCL, NVDR . . . . . . . . . . . . . 4,500 9,040Osotspa PCL, NVDR . . . . . . . . . . . . . . . . . . . . . . 4,400 4,983PTT Exploration & Production PCL, NVDR . . . 7,600 26,290PTT Global Chemical PCL, NVDR . . . . . . . . . . . 12,200 24,224Siam Cement PCL, NVDR . . . . . . . . . . . . . . . . . . 4,300 57,364Siam Commercial Bank PCL, NVDR . . . . . . . . . 4,600 15,199Sri Trang Gloves Thailand PCL, NVDR . . . . . . 3,500 4,018Thai Oil PCL, NVDR . . . . . . . . . . . . . . . . . . . . . . . 6,100 9,415Thai Union Group PCL, NVDR . . . . . . . . . . . . . . 14,700 9,076True Corp. PCL, NVDR . . . . . . . . . . . . . . . . . . . . 62,400 6,427
(Cost $533,729) . . . . . . . . . . . . . . . . . . . . . . . . . . . 545,062
Turkey — 0.2%
KOC Holding AS . . . . . . . . . . . . . . . . . . . . . . . . . . 4,872 13,501Turkcell Iletisim Hizmetleri AS . . . . . . . . . . . . . 6,597 13,004Turkiye Garanti Bankasi AS . . . . . . . . . . . . . . . . 14,875 17,676Turkiye Is Bankasi AS, Class C . . . . . . . . . . . . . 7,426 5,135
(Cost $46,343) . . . . . . . . . . . . . . . . . . . . . . . . . . . . 49,316
United Arab Emirates — 1.2%
Abu Dhabi Commercial Bank PJSC . . . . . . . . . 15,685 32,069Abu Dhabi Islamic Bank PJSC . . . . . . . . . . . . . . 7,652 11,749Aldar Properties PJSC . . . . . . . . . . . . . . . . . . . . 23,199 26,211Emirates NBD Bank PJSC . . . . . . . . . . . . . . . . . 13,873 52,310Emirates Telecommunications Group Co.PJSC . . . . . . . . . . . . . . . . . . . . . . . . . . . . . . . . . . . 9,915 63,704
First Abu Dhabi Bank PJSC . . . . . . . . . . . . . . . . 23,857 110,414
(Cost $259,136) . . . . . . . . . . . . . . . . . . . . . . . . . . . 296,457
Uruguay — 0.3%
Globant SA*(Cost $42,016) . . . . . . . . . . . . . . . . . . . . . . . . . . 226 72,835
TOTAL COMMON STOCKS
(Cost $21,602,991) . . . . . . . . . . . . . . . . . . . . . . . 24,767,215
PREFERRED STOCKS — 0.8%
Brazil — 0.5%
Banco Bradesco SA . . . . . . . . . . . . . . . . . . . . . . . 26,583 120,205Cia Energetica de Minas Gerais . . . . . . . . . . . . 6,023 15,894
(Cost $156,233) . . . . . . . . . . . . . . . . . . . . . . . . . . . 136,099
Chile — 0.1%
Sociedad Quimica y Minera de Chile SA,Class B(Cost $35,103) . . . . . . . . . . . . . . . . . . . . . . . . . . . 726 37,924
Numberof Shares Value
Colombia — 0.1%Bancolombia SA
(Cost $20,274) . . . . . . . . . . . . . . . . . . . . . 2,722 $ 22,713
South Korea — 0.1%LG Chem Ltd. . . . . . . . . . . . . . . . . . . . . . . . 44 13,130LG Household & Health Care Ltd. . . . . . . 13 7,703
(Cost $20,506) . . . . . . . . . . . . . . . . . . . . . . . 20,833
TOTAL PREFERRED STOCKS(Cost $232,116) . . . . . . . . . . . . . . . . . . . . . 217,569
PrincipalAmount
CORPORATE BONDS — 0.0%
India — 0.0%Britannia Industries Ltd.8.00%, 8/28/22 . . . . . . . . . . . . . . . . . . . . . . INR 4,500 64Series N3, 5.50%, 6/3/24 . . . . . . . . . . . . . INR 12,383 171
(Cost $234) . . . . . . . . . . . . . . . . . . . . . . . . . . 235
Numberof Shares
WARRANTS — 0.0%
Thailand — 0.0%BTS Group Holdings PCL*,expires 9/5/22 (b) . . . . . . . . . . . . . . . . . . . 1,525 43
BTS Group Holdings PCL*,expires 11/7/24 (b) . . . . . . . . . . . . . . . . . . 3,050 80
BTS Group Holdings PCL*,expires 11/20/26 (b) . . . . . . . . . . . . . . . . . 6,100 120
Minor International PCL*,expires 9/30/21 . . . . . . . . . . . . . . . . . . . . . 305 3
Minor International PCL*,expires 2/15/24 . . . . . . . . . . . . . . . . . . . . . 380 52
(Cost $0) 298
EXCHANGE-TRADED FUNDS — 0.3%iShares ESG Aware MSCI EM ETF (a) . .(Cost $74,925) . . . . . . . . . . . . . . . . . . . . . . . 1,717 74,106
SECURITIES LENDING COLLATERAL — 0.3%DWS Government & Agency SecuritiesPortfolio “DWS Government CashInstitutional Shares”, 0.01% (c)(d)(Cost $79,911) . . . . . . . . . . . . . . . . . . . . . . 79,911 79,911
CASH EQUIVALENTS — 0.6%DWS Government Money Market Series“Institutional Shares”, 0.04% (c)(Cost $149,313) . . . . . . . . . . . . . . . . . . . . . 149,313 149,313
TOTAL INVESTMENTS — 100.3%(Cost $22,139,490) . . . . . . . . . . . . . . . . . . . $25,288,647Other assets and liabilities,net — (0.3%) . . . . . . . . . . . . . . . . . . . . . . . (85,307)
NET ASSETS — 100.0% . . . . . . . . . . . . . . $25,203,340
See Notes to Financial Statements. 45

DBX ETF Trust
Schedule of Investments
Xtrackers MSCI Emerging Markets ESG Leaders Equity ETF (Continued)August 31, 2021
A summary of the Fund’s transactions with affiliated investments during the year ended August 31, 2021 is as follows:
Value ($) at8/31/2020
PurchasesCost ($)
SalesProceeds ($)
Net RealizedGain/(Loss) ($)
Net Changein UnrealizedAppreciation
(Depreciation)($) Income ($)
Capital GainDistributions
($)
Number ofShares at8/31/2021
Value ($) at8/31/2021
SECURITIES LENDING COLLATERAL — 0.3%DWS Government & Agency Securities Portfolio “DWS Government Cash Institutional Shares”, 0.01% (c)(d)
29,475 50,436(e) — — — 6 — 79,911 79,911
CASH EQUIVALENTS — 0.6%DWS Government Money Market Series “Institutional Shares”, 0.04% (c)
32,100 7,160,933 (7,043,720) — — 28 — 149,313 149,313
61,575 7,211,369 (7,043,720) — — 34 — 229,224 229,224
* Non-income producing security.(a) All or a portion of these securities were on loan. In addition, “Other assets and liabilities, net” may include pending sales that are also on
loan. The value of securities loaned at August 31, 2021 amounted to $288,300, which is 1.1% of net assets.(b) Investment was valued using significant unobservable inputs.(c) Affiliated fund managed by DWS Investment Management Americas, Inc. The rate shown is the annualized seven-day yield at period end.(d) Represents cash collateral held in connection with securities lending. Income earned by the Fund is net of borrower rebates. In addition,
the Fund held non-cash U.S. Treasury securities collateral having a value of $205,841.(e) Represents the net increase (purchase cost) or decrease (sales proceeds) in the amount invested in cash collateral for the year ended
August 31, 2021.
ADR: American Depositary ReceiptCPO: Ordinary Participation CertificatesGDR: Global Depositary ReceiptJSC: Joint Stock CompanyKSCP: Kuwait Shareholding Company PublicNVDR: Non Voting Depositary ReceiptPJSC: Public Joint Stock CompanyPSQC: Public Shareholders Qatari CompanyQPSC: Qatari Public Shareholders CompanyQSC: Qatari Shareholders CompanyREIT: Real Estate Investment TrustSAE: Societe Anonyme Egyptienne144A: Security exempt from registration under Rule 144A of the Securities Act of 1933. These securities may be resold in transactions
exempt from registration, normally to qualified institutional buyers.
Securities are listed in country of domicile.
At August 31, 2021, open futures contracts purchased were as follows:
Contract Description CurrencyNumber ofContracts
NotionalAmount
ContractValue
ExpirationDate
UnrealizedAppreciation
MSCI Emerging Markets Index Futures . . . . . . . . . . . . . . . . . . . . . . . . USD 3 $190,815 $194,880 9/17/2021 $4,065
For information on the Fund’s policy and additional disclosures regarding open futures contracts, please refer to the Derivatives section ofNote 2 in the accompanying Notes to Financial Statements.
Currency Abbreviations
INR Indian RupeeUSD U.S. Dollar
See Notes to Financial Statements. 46

DBX ETF Trust
Schedule of Investments
Xtrackers MSCI Emerging Markets ESG Leaders Equity ETF (Continued)August 31, 2021
Fair Value Measurements
Various inputs are used in determining the value of the Fund’s investments. These inputs are summarized in three broad levels. Level 1includes quoted prices in active markets for identical securities. Level 2 includes other significant observable inputs (including quoted pricesfor similar securities, interest rates, prepayment speeds and credit risk). Level 3 includes significant unobservable inputs (including the Fund’sown assumptions in determining the fair value of investments). The level assigned to the securities valuations may not be an indication of therisk or liquidity associated with investing in those securities.
The following is a summary of the inputs used as of August 31, 2021 in valuing the Fund’s investments. For information on the Fund’s policyregarding the valuation of investments, please refer to the Security Valuation section of Note 2 in the accompanying Notes to FinancialStatements.
Assets Level 1 Level 2 Level 3 Total
Common Stocks (f) . . . . . . . . . . . . . . . . . . . . . . . . . . . . . . . . . . . . . . . . . . . . . . . . . . . . . . . . . . $24,767,215 $ — $ — $24,767,215Preferred Stocks (f) . . . . . . . . . . . . . . . . . . . . . . . . . . . . . . . . . . . . . . . . . . . . . . . . . . . . . . . . . . 217,569 — — 217,569Corporate Bonds . . . . . . . . . . . . . . . . . . . . . . . . . . . . . . . . . . . . . . . . . . . . . . . . . . . . . . . . . . . . — 235 — 235Warrants . . . . . . . . . . . . . . . . . . . . . . . . . . . . . . . . . . . . . . . . . . . . . . . . . . . . . . . . . . . . . . . . . . . 55 — 243 298Exchange-Traded Funds . . . . . . . . . . . . . . . . . . . . . . . . . . . . . . . . . . . . . . . . . . . . . . . . . . . . . 74,106 — — 74,106Short-Term Investments (f) . . . . . . . . . . . . . . . . . . . . . . . . . . . . . . . . . . . . . . . . . . . . . . . . . . . 229,224 — — 229,224Derivatives (g)Futures Contracts . . . . . . . . . . . . . . . . . . . . . . . . . . . . . . . . . . . . . . . . . . . . . . . . . . . . . . . . . . 4,065 — — 4,065
TOTAL . . . . . . . . . . . . . . . . . . . . . . . . . . . . . . . . . . . . . . . . . . . . . . . . . . . . . . . . . . . . . . . . . . . . . $25,292,234 $235 $243 $25,292,712
(f) See Schedule of Investments for additional detailed categorizations.(g) Derivatives include unrealized appreciation (depreciation) on open futures contracts.
See Notes to Financial Statements. 47

DBX ETF Trust
Schedule of Investments
Xtrackers MSCI USA ESG Leaders Equity ETFAugust 31, 2021
Numberof Shares Value
COMMON STOCKS — 99.9%
Communication Services — 12.0%
Activision Blizzard, Inc. . . . . . . . . . . . . . . . . . 148,003 $ 12,191,007Alphabet, Inc., Class A* . . . . . . . . . . . . . . . . 57,189 165,502,107Alphabet, Inc., Class C* . . . . . . . . . . . . . . . . 55,510 161,491,912Cable One, Inc. . . . . . . . . . . . . . . . . . . . . . . . . 1,006 2,112,188Discovery, Inc., Class A* (a) . . . . . . . . . . . . . 39,528 1,139,988Discovery, Inc., Class C* . . . . . . . . . . . . . . . . 51,687 1,426,044Electronic Arts, Inc. . . . . . . . . . . . . . . . . . . . . 54,966 7,981,613Interpublic Group of Cos., Inc. . . . . . . . . . . 76,142 2,834,767Omnicom Group, Inc. . . . . . . . . . . . . . . . . . . 42,037 3,077,949Sirius XM Holdings, Inc. (a) . . . . . . . . . . . . . 171,627 1,076,101Take-Two Interactive Software, Inc.* . . . . . 21,486 3,463,973Verizon Communications, Inc. . . . . . . . . . . 789,265 43,409,575Walt Disney Co.* . . . . . . . . . . . . . . . . . . . . . . 346,631 62,844,200
(Cost $273,140,047) . . . . . . . . . . . . . . . . . . . . 468,551,424
Consumer Discretionary — 12.3%
Advance Auto Parts, Inc. . . . . . . . . . . . . . . . 11,598 2,352,654Aptiv PLC* . . . . . . . . . . . . . . . . . . . . . . . . . . . 51,326 7,811,304Best Buy Co., Inc. . . . . . . . . . . . . . . . . . . . . . . 41,976 4,890,624Booking Holdings, Inc.* . . . . . . . . . . . . . . . . 7,804 17,946,625BorgWarner, Inc. . . . . . . . . . . . . . . . . . . . . . . 43,109 1,839,892Burlington Stores, Inc.* . . . . . . . . . . . . . . . . 12,869 3,854,137CarMax, Inc.* . . . . . . . . . . . . . . . . . . . . . . . . . 31,293 3,918,196Darden Restaurants, Inc. . . . . . . . . . . . . . . . 23,906 3,601,439Domino’s Pizza, Inc. . . . . . . . . . . . . . . . . . . . 7,501 3,877,192eBay, Inc. . . . . . . . . . . . . . . . . . . . . . . . . . . . . . 130,029 9,978,425Garmin Ltd. . . . . . . . . . . . . . . . . . . . . . . . . . . . 30,180 5,264,297Genuine Parts Co. . . . . . . . . . . . . . . . . . . . . . 27,519 3,362,547Hasbro, Inc. . . . . . . . . . . . . . . . . . . . . . . . . . . . 25,803 2,536,693Hilton Worldwide Holdings, Inc.* . . . . . . . . 52,994 6,616,831Home Depot, Inc. . . . . . . . . . . . . . . . . . . . . . . 202,623 66,091,570LKQ Corp.* . . . . . . . . . . . . . . . . . . . . . . . . . . . 55,552 2,927,035Lowe’s Cos., Inc. . . . . . . . . . . . . . . . . . . . . . . 134,095 27,340,630Lululemon Athletica, Inc.* . . . . . . . . . . . . . . 23,623 9,453,216McDonald’s Corp. . . . . . . . . . . . . . . . . . . . . . 142,223 33,772,274MercadoLibre, Inc.* . . . . . . . . . . . . . . . . . . . . 8,581 16,024,588Mohawk Industries, Inc.* . . . . . . . . . . . . . . . 10,671 2,110,297Newell Brands, Inc. . . . . . . . . . . . . . . . . . . . . 75,500 1,918,455NIKE, Inc., Class B . . . . . . . . . . . . . . . . . . . . . 242,619 39,969,054NVR, Inc.* . . . . . . . . . . . . . . . . . . . . . . . . . . . . 640 3,315,162Pool Corp. . . . . . . . . . . . . . . . . . . . . . . . . . . . . 7,396 3,655,843Starbucks Corp. . . . . . . . . . . . . . . . . . . . . . . . 224,865 26,419,389Target Corp. . . . . . . . . . . . . . . . . . . . . . . . . . . 94,532 23,347,513Tesla, Inc.* . . . . . . . . . . . . . . . . . . . . . . . . . . . 155,891 114,692,126TJX Cos., Inc. . . . . . . . . . . . . . . . . . . . . . . . . . 231,663 16,846,533Tractor Supply Co. . . . . . . . . . . . . . . . . . . . . . 21,767 4,228,240Vail Resorts, Inc.* . . . . . . . . . . . . . . . . . . . . . 7,928 2,416,851VF Corp. . . . . . . . . . . . . . . . . . . . . . . . . . . . . . . 63,405 4,848,580
(Cost $276,099,588) . . . . . . . . . . . . . . . . . . . . 477,228,212
Consumer Staples — 5.9%
Bunge Ltd. . . . . . . . . . . . . . . . . . . . . . . . . . . . . 25,798 1,953,167Campbell Soup Co. . . . . . . . . . . . . . . . . . . . . 36,737 1,533,035Clorox Co. . . . . . . . . . . . . . . . . . . . . . . . . . . . . 23,289 3,913,716Coca-Cola Co. . . . . . . . . . . . . . . . . . . . . . . . . . 781,928 44,030,366Colgate-Palmolive Co. . . . . . . . . . . . . . . . . . 154,011 12,005,157
Numberof Shares Value
Consumer Staples (Continued)
Conagra Brands, Inc. . . . . . . . . . . . . . . . . . . . 89,503 $ 2,964,339Estee Lauder Cos., Inc., Class A . . . . . . . . . 43,947 14,963,514General Mills, Inc. . . . . . . . . . . . . . . . . . . . . . 116,837 6,754,347Hormel Foods Corp. . . . . . . . . . . . . . . . . . . . 53,819 2,450,917J M Smucker Co. . . . . . . . . . . . . . . . . . . . . . . 20,989 2,595,710Kellogg Co. . . . . . . . . . . . . . . . . . . . . . . . . . . . 46,635 2,944,534Keurig Dr Pepper, Inc. (a) . . . . . . . . . . . . . . . 137,399 4,901,022Kimberly-Clark Corp. . . . . . . . . . . . . . . . . . . . 64,686 8,914,378Kroger Co. . . . . . . . . . . . . . . . . . . . . . . . . . . . . 135,051 6,216,398Lamb Weston Holdings, Inc. . . . . . . . . . . . . 29,444 1,918,277McCormick & Co., Inc. . . . . . . . . . . . . . . . . . 48,674 4,200,079PepsiCo, Inc. . . . . . . . . . . . . . . . . . . . . . . . . . . 263,742 41,246,611Procter & Gamble Co. . . . . . . . . . . . . . . . . . . 467,116 66,512,647
(Cost $193,894,708) . . . . . . . . . . . . . . . . . . . . 230,018,214
Energy — 1.1%
Baker Hughes Co. . . . . . . . . . . . . . . . . . . . . . 140,162 3,192,890Cheniere Energy, Inc.* . . . . . . . . . . . . . . . . . 46,138 4,035,230Marathon Petroleum Corp. . . . . . . . . . . . . . 124,155 7,358,667ONEOK, Inc. . . . . . . . . . . . . . . . . . . . . . . . . . . 85,145 4,471,815Phillips 66 . . . . . . . . . . . . . . . . . . . . . . . . . . . . 83,355 5,925,707Schlumberger N.V. . . . . . . . . . . . . . . . . . . . . 266,662 7,477,203Valero Energy Corp. . . . . . . . . . . . . . . . . . . . 78,061 5,176,225Williams Cos., Inc. . . . . . . . . . . . . . . . . . . . . . 227,944 5,627,937
(Cost $43,124,917) . . . . . . . . . . . . . . . . . . . . . 43,265,674
Financials — 11.1%
Aflac, Inc. . . . . . . . . . . . . . . . . . . . . . . . . . . . . . 124,933 7,081,202Allstate Corp. . . . . . . . . . . . . . . . . . . . . . . . . . 56,974 7,707,443Ally Financial, Inc. . . . . . . . . . . . . . . . . . . . . . 72,478 3,834,086American Express Co. . . . . . . . . . . . . . . . . . . 130,611 21,676,202American Financial Group, Inc. . . . . . . . . . . 13,835 1,908,400American International Group, Inc. . . . . . . 160,460 8,754,698Ameriprise Financial, Inc. . . . . . . . . . . . . . . . 21,832 5,958,171Annaly Capital Management, Inc. REIT . . . 258,917 2,249,989Aon PLC, Class A (a) . . . . . . . . . . . . . . . . . . . 43,150 12,378,009Arch Capital Group Ltd.* . . . . . . . . . . . . . . . 78,886 3,242,215Arthur J Gallagher & Co. . . . . . . . . . . . . . . . 39,385 5,656,474Assurant, Inc. . . . . . . . . . . . . . . . . . . . . . . . . . 11,957 2,034,005Bank of New York Mellon Corp. . . . . . . . . . 159,776 8,822,831BlackRock, Inc. . . . . . . . . . . . . . . . . . . . . . . . . 28,888 27,249,761Carlyle Group, Inc. . . . . . . . . . . . . . . . . . . . . . 28,163 1,390,689Cboe Global Markets, Inc. . . . . . . . . . . . . . . 19,372 2,443,778Charles Schwab Corp. . . . . . . . . . . . . . . . . . 275,390 20,062,161Chubb Ltd. . . . . . . . . . . . . . . . . . . . . . . . . . . . 84,654 15,569,564Citizens Financial Group, Inc. . . . . . . . . . . . 77,377 3,388,339CME Group, Inc. . . . . . . . . . . . . . . . . . . . . . . . 68,516 13,821,047Discover Financial Services . . . . . . . . . . . . . 58,327 7,478,688Equitable Holdings, Inc. . . . . . . . . . . . . . . . . 78,103 2,421,974Erie Indemnity Co., Class A . . . . . . . . . . . . . 5,237 927,420FactSet Research Systems, Inc. . . . . . . . . . 6,934 2,636,445First Republic Bank . . . . . . . . . . . . . . . . . . . . 32,802 6,525,630Franklin Resources, Inc. . . . . . . . . . . . . . . . . 58,494 1,897,545Hartford Financial Services Group, Inc. . . . 69,061 4,642,280Huntington Bancshares, Inc. . . . . . . . . . . . . 281,547 4,372,425Intercontinental Exchange, Inc. . . . . . . . . . . 107,302 12,825,808Invesco Ltd. . . . . . . . . . . . . . . . . . . . . . . . . . . . 71,374 1,807,190KeyCorp . . . . . . . . . . . . . . . . . . . . . . . . . . . . . . 192,506 3,911,722
See Notes to Financial Statements. 48

DBX ETF Trust
Schedule of Investments
Xtrackers MSCI USA ESG Leaders Equity ETF (Continued)August 31, 2021
Numberof Shares Value
Financials (Continued)
Lincoln National Corp. . . . . . . . . . . . . . . . . . 32,882 $ 2,257,349Loews Corp. . . . . . . . . . . . . . . . . . . . . . . . . . . 41,038 2,292,793M&T Bank Corp. . . . . . . . . . . . . . . . . . . . . . . . 24,568 3,439,766MarketAxess Holdings, Inc. . . . . . . . . . . . . . 7,058 3,359,043Marsh & McLennan Cos., Inc. . . . . . . . . . . . 97,155 15,272,766Moody’s Corp. . . . . . . . . . . . . . . . . . . . . . . . . 32,071 12,211,675Morgan Stanley . . . . . . . . . . . . . . . . . . . . . . . 265,998 27,778,171Nasdaq, Inc. . . . . . . . . . . . . . . . . . . . . . . . . . . 21,999 4,306,964Northern Trust Corp. . . . . . . . . . . . . . . . . . . . 38,339 4,543,938PNC Financial Services Group, Inc. . . . . . . 80,548 15,392,723Principal Financial Group, Inc. . . . . . . . . . . 51,427 3,435,838Progressive Corp. . . . . . . . . . . . . . . . . . . . . . 112,268 10,815,899Prudential Financial, Inc. . . . . . . . . . . . . . . . 75,911 8,037,457Raymond James Financial, Inc. . . . . . . . . . 23,512 3,289,329Regions Financial Corp. . . . . . . . . . . . . . . . . 179,909 3,675,541S&P Global, Inc. . . . . . . . . . . . . . . . . . . . . . . . 45,896 20,369,563State Street Corp. . . . . . . . . . . . . . . . . . . . . . 67,077 6,232,124SVB Financial Group* . . . . . . . . . . . . . . . . . . 10,946 6,124,287T. Rowe Price Group, Inc. . . . . . . . . . . . . . . . 43,341 9,702,750Travelers Cos., Inc. . . . . . . . . . . . . . . . . . . . . 47,737 7,624,076Truist Financial Corp. . . . . . . . . . . . . . . . . . . 252,514 14,408,449US Bancorp . . . . . . . . . . . . . . . . . . . . . . . . . . . 267,308 15,340,806Voya Financial, Inc. (a) . . . . . . . . . . . . . . . . . 21,870 1,421,113Willis Towers Watson PLC . . . . . . . . . . . . . . 24,188 5,338,775
(Cost $311,507,591) . . . . . . . . . . . . . . . . . . . . 431,347,386
Health Care — 13.5%
ABIOMED, Inc.* . . . . . . . . . . . . . . . . . . . . . . . 8,633 3,142,067Agilent Technologies, Inc. . . . . . . . . . . . . . . 58,230 10,217,618Align Technology, Inc.* . . . . . . . . . . . . . . . . 14,317 10,150,753AmerisourceBergen Corp. . . . . . . . . . . . . . . 28,743 3,512,682Amgen, Inc. . . . . . . . . . . . . . . . . . . . . . . . . . . . 109,066 24,597,655Baxter International, Inc. . . . . . . . . . . . . . . . 96,652 7,366,815Biogen, Inc.* . . . . . . . . . . . . . . . . . . . . . . . . . . 28,275 9,582,680BioMarin Pharmaceutical, Inc.* . . . . . . . . . 34,530 2,907,771Bio-Techne Corp. . . . . . . . . . . . . . . . . . . . . . . 7,597 3,791,967Bristol-Myers Squibb Co. . . . . . . . . . . . . . . . 423,901 28,342,021Cardinal Health, Inc. . . . . . . . . . . . . . . . . . . . 52,721 2,767,325Catalent, Inc.* . . . . . . . . . . . . . . . . . . . . . . . . . 33,302 4,343,913Centene Corp.* . . . . . . . . . . . . . . . . . . . . . . . 110,961 6,988,324Cerner Corp. . . . . . . . . . . . . . . . . . . . . . . . . . . 58,632 4,476,553Cigna Corp. . . . . . . . . . . . . . . . . . . . . . . . . . . . 65,724 13,910,485DaVita, Inc.* . . . . . . . . . . . . . . . . . . . . . . . . . . 13,530 1,769,318DENTSPLY SIRONA, Inc. . . . . . . . . . . . . . . . 41,201 2,542,102Dexcom, Inc.* . . . . . . . . . . . . . . . . . . . . . . . . . 18,404 9,743,446Edwards Lifesciences Corp.* . . . . . . . . . . . . 119,278 13,976,996Eli Lilly & Co. . . . . . . . . . . . . . . . . . . . . . . . . . 154,995 40,033,659Gilead Sciences, Inc. . . . . . . . . . . . . . . . . . . . 239,759 17,449,660HCA Healthcare, Inc. . . . . . . . . . . . . . . . . . . . 50,971 12,894,644Hologic, Inc.* . . . . . . . . . . . . . . . . . . . . . . . . . 48,023 3,801,021Horizon Therapeutics PLC* . . . . . . . . . . . . . 41,676 4,504,759Humana, Inc. . . . . . . . . . . . . . . . . . . . . . . . . . 24,664 9,999,279IDEXX Laboratories, Inc.* . . . . . . . . . . . . . . 16,369 11,028,777Illumina, Inc.* . . . . . . . . . . . . . . . . . . . . . . . . . 28,126 12,858,082Insulet Corp.* . . . . . . . . . . . . . . . . . . . . . . . . . 12,990 3,868,552Jazz Pharmaceuticals PLC* . . . . . . . . . . . . . 10,509 1,384,140Johnson & Johnson . . . . . . . . . . . . . . . . . . . 500,252 86,608,629
Numberof Shares Value
Health Care (Continued)
Laboratory Corp. of America Holdings* . . 17,987 $ 5,456,896Merck & Co., Inc. . . . . . . . . . . . . . . . . . . . . . . 483,386 36,877,518Mettler-Toledo International, Inc.* . . . . . . . 4,321 6,709,778Novocure Ltd.* (a) . . . . . . . . . . . . . . . . . . . . . 17,406 2,336,059Quest Diagnostics, Inc. . . . . . . . . . . . . . . . . . 24,942 3,811,886ResMed, Inc. . . . . . . . . . . . . . . . . . . . . . . . . . . 27,800 8,076,734STERIS PLC . . . . . . . . . . . . . . . . . . . . . . . . . . . 19,013 4,087,985Teladoc Health, Inc.* . . . . . . . . . . . . . . . . . . . 25,724 3,715,060Teleflex, Inc. . . . . . . . . . . . . . . . . . . . . . . . . . . 9,105 3,600,663Thermo Fisher Scientific, Inc. . . . . . . . . . . . 74,761 41,488,617Vertex Pharmaceuticals, Inc.* . . . . . . . . . . . 49,544 9,923,168Waters Corp.* . . . . . . . . . . . . . . . . . . . . . . . . . 11,668 4,830,785West Pharmaceutical Services, Inc. . . . . . . 13,727 6,199,388Zoetis, Inc. . . . . . . . . . . . . . . . . . . . . . . . . . . . . 90,840 18,582,230
(Cost $415,258,730) . . . . . . . . . . . . . . . . . . . . 524,258,460
Industrials — 8.4%
3M Co. . . . . . . . . . . . . . . . . . . . . . . . . . . . . . . . 110,531 21,524,807Allegion PLC . . . . . . . . . . . . . . . . . . . . . . . . . . 18,473 2,659,927AMERCO . . . . . . . . . . . . . . . . . . . . . . . . . . . . . 1,982 1,310,399C.H. Robinson Worldwide, Inc. . . . . . . . . . . 25,324 2,280,679Caterpillar, Inc. . . . . . . . . . . . . . . . . . . . . . . . . 104,102 21,951,989Copart, Inc.* . . . . . . . . . . . . . . . . . . . . . . . . . . 41,202 5,946,273CSX Corp. . . . . . . . . . . . . . . . . . . . . . . . . . . . . 436,089 14,185,975Cummins, Inc. . . . . . . . . . . . . . . . . . . . . . . . . 28,132 6,638,589Deere & Co. . . . . . . . . . . . . . . . . . . . . . . . . . . . 57,028 21,558,295Delta Air Lines, Inc.* . . . . . . . . . . . . . . . . . . . 32,362 1,308,719Dover Corp. . . . . . . . . . . . . . . . . . . . . . . . . . . . 26,635 4,644,079Eaton Corp. PLC . . . . . . . . . . . . . . . . . . . . . . . 75,896 12,777,851Expeditors International of Washington,Inc. . . . . . . . . . . . . . . . . . . . . . . . . . . . . . . . . . 33,109 4,126,706
Fastenal Co. . . . . . . . . . . . . . . . . . . . . . . . . . . 109,168 6,097,033Fortive Corp. . . . . . . . . . . . . . . . . . . . . . . . . . . 60,893 4,498,166Fortune Brands Home & Security, Inc. . . . 26,713 2,601,045Generac Holdings, Inc.* . . . . . . . . . . . . . . . . 11,794 5,153,742Howmet Aerospace, Inc. . . . . . . . . . . . . . . . 70,767 2,246,852IDEX Corp. . . . . . . . . . . . . . . . . . . . . . . . . . . . 14,021 3,140,704IHS Markit Ltd. . . . . . . . . . . . . . . . . . . . . . . . . 71,675 8,644,005Illinois Tool Works, Inc. . . . . . . . . . . . . . . . . 60,199 14,017,939Johnson Controls International PLC . . . . . 136,743 10,228,376Kansas City Southern . . . . . . . . . . . . . . . . . . 16,762 4,704,591Lennox International, Inc. . . . . . . . . . . . . . . 5,885 1,972,534Masco Corp. . . . . . . . . . . . . . . . . . . . . . . . . . . 51,106 3,103,156Norfolk Southern Corp. . . . . . . . . . . . . . . . . 47,996 12,168,906Owens Corning . . . . . . . . . . . . . . . . . . . . . . . 19,810 1,892,845PACCAR, Inc. . . . . . . . . . . . . . . . . . . . . . . . . . 66,191 5,419,057Pentair PLC (a) . . . . . . . . . . . . . . . . . . . . . . . . 32,773 2,528,765Robert Half International, Inc. . . . . . . . . . . . 20,487 2,118,356Rockwell Automation, Inc. . . . . . . . . . . . . . . 22,126 7,200,907Roper Technologies, Inc. . . . . . . . . . . . . . . . 20,042 9,685,898Snap-on, Inc. . . . . . . . . . . . . . . . . . . . . . . . . . 10,326 2,322,834Stanley Black & Decker, Inc. . . . . . . . . . . . . 29,899 5,778,580Trane Technologies PLC . . . . . . . . . . . . . . . . 45,331 8,998,203Union Pacific Corp. . . . . . . . . . . . . . . . . . . . . 126,456 27,420,719United Parcel Service, Inc., Class B . . . . . . 137,282 26,856,478United Rentals, Inc.* . . . . . . . . . . . . . . . . . . . 13,818 4,872,918
See Notes to Financial Statements. 49

DBX ETF Trust
Schedule of Investments
Xtrackers MSCI USA ESG Leaders Equity ETF (Continued)August 31, 2021
Numberof Shares Value
Industrials (Continued)
W. W. Grainger, Inc. . . . . . . . . . . . . . . . . . . . 8,345 $ 3,619,226Waste Management, Inc. . . . . . . . . . . . . . . . 80,573 12,497,678Xylem, Inc. . . . . . . . . . . . . . . . . . . . . . . . . . . . 33,972 4,630,723
(Cost $219,645,750) . . . . . . . . . . . . . . . . . . . . 325,334,524
Information Technology — 28.9%
Accenture PLC, Class A . . . . . . . . . . . . . . . . 121,241 40,804,871Adobe, Inc.* . . . . . . . . . . . . . . . . . . . . . . . . . . 90,954 60,366,170ANSYS, Inc.* . . . . . . . . . . . . . . . . . . . . . . . . . 16,831 6,149,374Applied Materials, Inc. . . . . . . . . . . . . . . . . . 175,246 23,680,992Autodesk, Inc.* . . . . . . . . . . . . . . . . . . . . . . . 42,141 13,067,503Automatic Data Processing, Inc. . . . . . . . . . 80,882 16,907,573Cadence Design Systems, Inc.* . . . . . . . . . 51,884 8,481,996Cisco Systems, Inc. . . . . . . . . . . . . . . . . . . . . 800,801 47,263,275Citrix Systems, Inc. . . . . . . . . . . . . . . . . . . . . 23,386 2,405,718Cognex Corp. . . . . . . . . . . . . . . . . . . . . . . . . . 31,746 2,813,330Hewlett Packard Enterprise Co. . . . . . . . . . 243,025 3,757,166HP, Inc. . . . . . . . . . . . . . . . . . . . . . . . . . . . . . . 237,823 7,072,856Intel Corp. . . . . . . . . . . . . . . . . . . . . . . . . . . . . 769,865 41,618,902International Business Machines Corp. . . . 170,567 23,937,373Intuit, Inc. . . . . . . . . . . . . . . . . . . . . . . . . . . . . 51,885 29,372,617Keysight Technologies, Inc.* . . . . . . . . . . . 35,391 6,348,438Lam Research Corp. . . . . . . . . . . . . . . . . . . . 26,861 16,246,070Mastercard, Inc., Class A . . . . . . . . . . . . . . . 168,422 58,312,749Microsoft Corp. . . . . . . . . . . . . . . . . . . . . . . . 1,362,513 411,315,424Motorola Solutions, Inc. . . . . . . . . . . . . . . . . 32,357 7,902,227NVIDIA Corp. . . . . . . . . . . . . . . . . . . . . . . . . . 474,458 106,207,423Okta, Inc.* . . . . . . . . . . . . . . . . . . . . . . . . . . . . 23,818 6,278,425salesforce.com, Inc.* . . . . . . . . . . . . . . . . . . 185,057 49,090,070Teledyne Technologies, Inc.* . . . . . . . . . . . 9,091 4,212,588Texas Instruments, Inc. . . . . . . . . . . . . . . . . 175,624 33,528,378Trimble, Inc.* . . . . . . . . . . . . . . . . . . . . . . . . . 49,435 4,657,766Visa, Inc., Class A . . . . . . . . . . . . . . . . . . . . . 323,614 74,139,967VMware, Inc., Class A* (a) . . . . . . . . . . . . . . 15,310 2,279,200Western Union Co. . . . . . . . . . . . . . . . . . . . . 68,484 1,481,994Workday, Inc., Class A* . . . . . . . . . . . . . . . . 36,021 9,839,496Zebra Technologies Corp., Class A* . . . . . 10,015 5,880,508
(Cost $669,331,459) . . . . . . . . . . . . . . . . . . . . 1,125,420,439
Materials — 2.9%
Amcor PLC . . . . . . . . . . . . . . . . . . . . . . . . . . . 297,852 3,827,398Ball Corp. . . . . . . . . . . . . . . . . . . . . . . . . . . . . 62,584 6,005,561DuPont de Nemours, Inc. . . . . . . . . . . . . . . . 101,907 7,543,156Ecolab, Inc. . . . . . . . . . . . . . . . . . . . . . . . . . . . 49,027 11,048,725International Flavors & Fragrances,Inc. . . . . . . . . . . . . . . . . . . . . . . . . . . . . . . . . . 47,009 7,121,864
International Paper Co. . . . . . . . . . . . . . . . . . 70,559 4,239,890Linde PLC . . . . . . . . . . . . . . . . . . . . . . . . . . . . 98,972 31,135,601LyondellBasell Industries NV, Class A . . . . 51,472 5,165,215Mosaic Co. . . . . . . . . . . . . . . . . . . . . . . . . . . . 70,439 2,266,727Newmont Corp. . . . . . . . . . . . . . . . . . . . . . . . 152,236 8,828,166PPG Industries, Inc. . . . . . . . . . . . . . . . . . . . . 44,853 7,156,296Sherwin-Williams Co. . . . . . . . . . . . . . . . . . . 48,696 14,787,514Steel Dynamics, Inc. . . . . . . . . . . . . . . . . . . . 41,491 2,800,228
(Cost $80,821,738) . . . . . . . . . . . . . . . . . . . . . 111,926,341
Numberof Shares Value
Real Estate — 2.8%
American Tower Corp. REIT . . . . . . . . . . . . 86,901 $ 25,389,865Boston Properties, Inc. REIT . . . . . . . . . . . . 27,126 3,064,967CBRE Group, Inc., Class A* . . . . . . . . . . . . . 64,010 6,164,163Crown Castle International Corp. REIT . . . 81,664 15,899,164Equinix, Inc. REIT . . . . . . . . . . . . . . . . . . . . . . 17,064 14,392,631Equity Residential REIT . . . . . . . . . . . . . . . . 65,251 5,485,652Healthpeak Properties, Inc. REIT . . . . . . . . . 100,699 3,625,164Host Hotels & Resorts, Inc. REIT* . . . . . . . . 140,954 2,334,198Prologis, Inc. REIT . . . . . . . . . . . . . . . . . . . . . 141,149 19,007,124Welltower, Inc. REIT . . . . . . . . . . . . . . . . . . . 79,910 6,994,522Weyerhaeuser Co. REIT . . . . . . . . . . . . . . . . 143,779 5,176,044
(Cost $80,814,827) . . . . . . . . . . . . . . . . . . . . . 107,533,494
Utilities — 1.0%
American Water Works Co., Inc. . . . . . . . . . 34,768 6,336,468Atmos Energy Corp. . . . . . . . . . . . . . . . . . . . 25,496 2,486,115CenterPoint Energy, Inc. . . . . . . . . . . . . . . . . 112,494 2,822,475Consolidated Edison, Inc. . . . . . . . . . . . . . . 64,094 4,835,892Edison International . . . . . . . . . . . . . . . . . . . 73,768 4,266,741Essential Utilities, Inc. . . . . . . . . . . . . . . . . . . 43,157 2,141,882Eversource Energy . . . . . . . . . . . . . . . . . . . . 65,877 5,977,020Sempra Energy . . . . . . . . . . . . . . . . . . . . . . . 60,545 8,013,736UGI Corp. . . . . . . . . . . . . . . . . . . . . . . . . . . . . 37,851 1,752,880
(Cost $35,117,423) . . . . . . . . . . . . . . . . . . . . . 38,633,209
TOTAL COMMON STOCKS
(Cost $2,598,756,778) . . . . . . . . . . . . . . . . . 3,883,517,377
SECURITIES LENDING COLLATERAL —0.0%
DWS Government & Agency SecuritiesPortfolio “DWS Government CashInstitutional Shares”, 0.01% (b)(c)(Cost $852,902) . . . . . . . . . . . . . . . . . . . . . . 852,902 852,902
CASH EQUIVALENTS — 0.1%
DWS Government Money Market Series“Institutional Shares”, 0.04% (b)(Cost $3,332,190) . . . . . . . . . . . . . . . . . . . . . 3,332,190 3,332,190
TOTAL INVESTMENTS — 100.0%(Cost $2,602,941,870) $3,887,702,469
Other assets and liabilities, net — 0.0% . . 1,699,997
NET ASSETS — 100.0% . . . . . . . . . . . . . . . . $3,889,402,466
See Notes to Financial Statements. 50
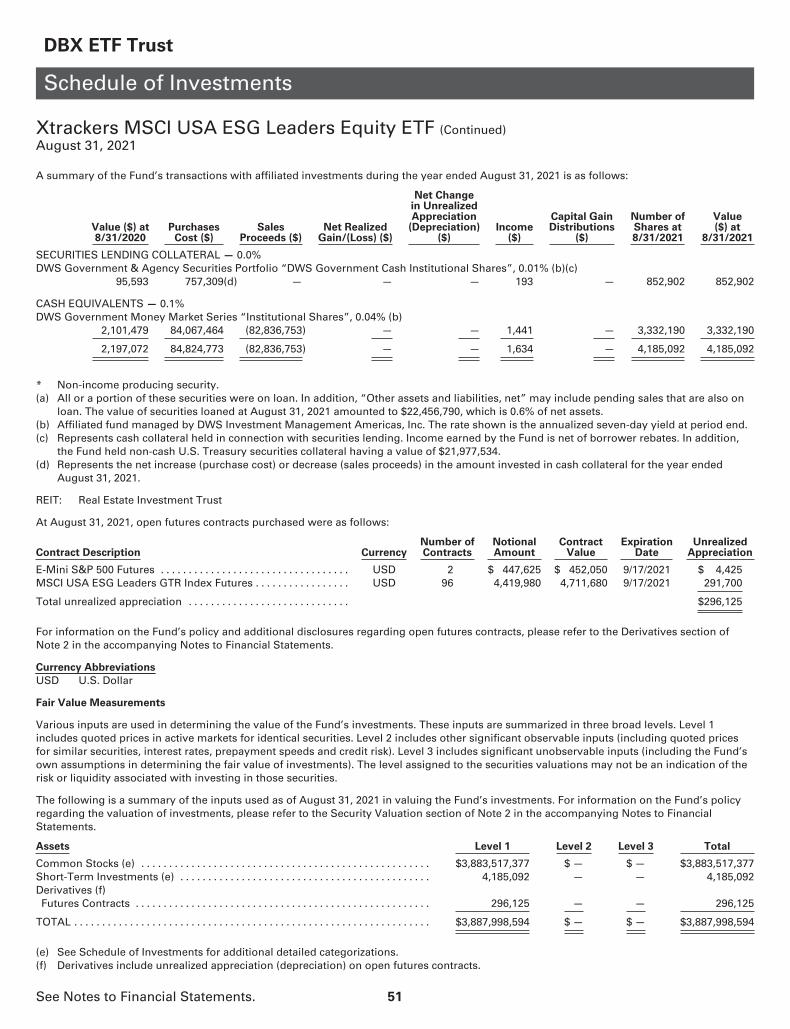
DBX ETF Trust
Schedule of Investments
Xtrackers MSCI USA ESG Leaders Equity ETF (Continued)August 31, 2021
A summary of the Fund’s transactions with affiliated investments during the year ended August 31, 2021 is as follows:
Value ($) at8/31/2020
PurchasesCost ($)
SalesProceeds ($)
Net RealizedGain/(Loss) ($)
Net Changein UnrealizedAppreciation
(Depreciation)($)
Income($)
Capital GainDistributions
($)
Number ofShares at8/31/2021
Value($) at
8/31/2021
SECURITIES LENDING COLLATERAL — 0.0%DWS Government & Agency Securities Portfolio “DWS Government Cash Institutional Shares”, 0.01% (b)(c)
95,593 757,309(d) — — — 193 — 852,902 852,902
CASH EQUIVALENTS — 0.1%DWS Government Money Market Series “Institutional Shares”, 0.04% (b)
2,101,479 84,067,464 (82,836,753) — — 1,441 — 3,332,190 3,332,190
2,197,072 84,824,773 (82,836,753) — — 1,634 — 4,185,092 4,185,092
* Non-income producing security.(a) All or a portion of these securities were on loan. In addition, “Other assets and liabilities, net” may include pending sales that are also on
loan. The value of securities loaned at August 31, 2021 amounted to $22,456,790, which is 0.6% of net assets.(b) Affiliated fund managed by DWS Investment Management Americas, Inc. The rate shown is the annualized seven-day yield at period end.(c) Represents cash collateral held in connection with securities lending. Income earned by the Fund is net of borrower rebates. In addition,
the Fund held non-cash U.S. Treasury securities collateral having a value of $21,977,534.(d) Represents the net increase (purchase cost) or decrease (sales proceeds) in the amount invested in cash collateral for the year ended
August 31, 2021.
REIT: Real Estate Investment Trust
At August 31, 2021, open futures contracts purchased were as follows:
Contract Description CurrencyNumber ofContracts
NotionalAmount
ContractValue
ExpirationDate
UnrealizedAppreciation
E-Mini S&P 500 Futures . . . . . . . . . . . . . . . . . . . . . . . . . . . . . . . . . . USD 2 $ 447,625 $ 452,050 9/17/2021 $ 4,425MSCI USA ESG Leaders GTR Index Futures . . . . . . . . . . . . . . . . . USD 96 4,419,980 4,711,680 9/17/2021 291,700
Total unrealized appreciation . . . . . . . . . . . . . . . . . . . . . . . . . . . . . $296,125
For information on the Fund’s policy and additional disclosures regarding open futures contracts, please refer to the Derivatives section ofNote 2 in the accompanying Notes to Financial Statements.
Currency Abbreviations
USD U.S. Dollar
Fair Value Measurements
Various inputs are used in determining the value of the Fund’s investments. These inputs are summarized in three broad levels. Level 1includes quoted prices in active markets for identical securities. Level 2 includes other significant observable inputs (including quoted pricesfor similar securities, interest rates, prepayment speeds and credit risk). Level 3 includes significant unobservable inputs (including the Fund’sown assumptions in determining the fair value of investments). The level assigned to the securities valuations may not be an indication of therisk or liquidity associated with investing in those securities.
The following is a summary of the inputs used as of August 31, 2021 in valuing the Fund’s investments. For information on the Fund’s policyregarding the valuation of investments, please refer to the Security Valuation section of Note 2 in the accompanying Notes to FinancialStatements.
Assets Level 1 Level 2 Level 3 Total
Common Stocks (e) . . . . . . . . . . . . . . . . . . . . . . . . . . . . . . . . . . . . . . . . . . . . . . . . . . . . $3,883,517,377 $ — $ — $3,883,517,377Short-Term Investments (e) . . . . . . . . . . . . . . . . . . . . . . . . . . . . . . . . . . . . . . . . . . . . . 4,185,092 — — 4,185,092Derivatives (f)Futures Contracts . . . . . . . . . . . . . . . . . . . . . . . . . . . . . . . . . . . . . . . . . . . . . . . . . . . . . 296,125 — — 296,125
TOTAL . . . . . . . . . . . . . . . . . . . . . . . . . . . . . . . . . . . . . . . . . . . . . . . . . . . . . . . . . . . . . . . . $3,887,998,594 $ — $ — $3,887,998,594
(e) See Schedule of Investments for additional detailed categorizations.(f) Derivatives include unrealized appreciation (depreciation) on open futures contracts.
See Notes to Financial Statements. 51
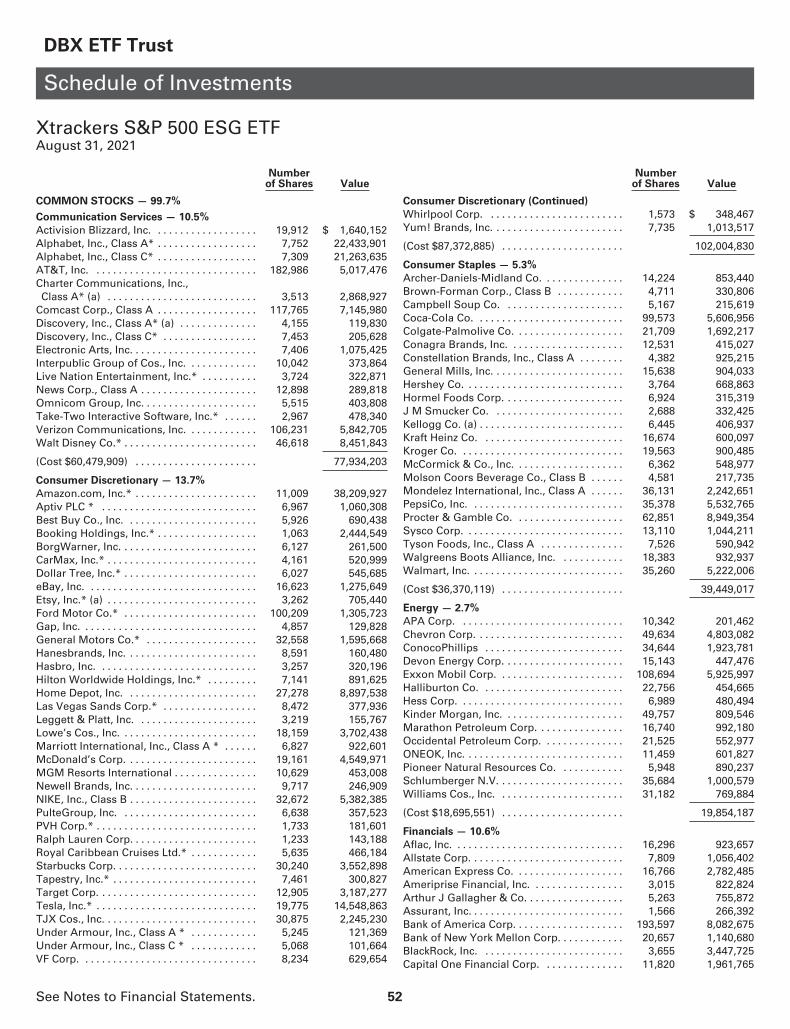
DBX ETF Trust
Schedule of Investments
Xtrackers S&P 500 ESG ETFAugust 31, 2021
Numberof Shares Value
COMMON STOCKS — 99.7%
Communication Services — 10.5%
Activision Blizzard, Inc. . . . . . . . . . . . . . . . . . . 19,912 $ 1,640,152Alphabet, Inc., Class A* . . . . . . . . . . . . . . . . . . 7,752 22,433,901Alphabet, Inc., Class C* . . . . . . . . . . . . . . . . . . 7,309 21,263,635AT&T, Inc. . . . . . . . . . . . . . . . . . . . . . . . . . . . . . 182,986 5,017,476Charter Communications, Inc.,Class A* (a) . . . . . . . . . . . . . . . . . . . . . . . . . . . 3,513 2,868,927
Comcast Corp., Class A . . . . . . . . . . . . . . . . . . 117,765 7,145,980Discovery, Inc., Class A* (a) . . . . . . . . . . . . . . 4,155 119,830Discovery, Inc., Class C* . . . . . . . . . . . . . . . . . 7,453 205,628Electronic Arts, Inc. . . . . . . . . . . . . . . . . . . . . . . 7,406 1,075,425Interpublic Group of Cos., Inc. . . . . . . . . . . . . 10,042 373,864Live Nation Entertainment, Inc.* . . . . . . . . . . 3,724 322,871News Corp., Class A . . . . . . . . . . . . . . . . . . . . . 12,898 289,818Omnicom Group, Inc. . . . . . . . . . . . . . . . . . . . . 5,515 403,808Take-Two Interactive Software, Inc.* . . . . . . 2,967 478,340Verizon Communications, Inc. . . . . . . . . . . . . 106,231 5,842,705Walt Disney Co.* . . . . . . . . . . . . . . . . . . . . . . . . 46,618 8,451,843
(Cost $60,479,909) . . . . . . . . . . . . . . . . . . . . . . 77,934,203
Consumer Discretionary — 13.7%
Amazon.com, Inc.* . . . . . . . . . . . . . . . . . . . . . . 11,009 38,209,927Aptiv PLC * . . . . . . . . . . . . . . . . . . . . . . . . . . . . 6,967 1,060,308Best Buy Co., Inc. . . . . . . . . . . . . . . . . . . . . . . . 5,926 690,438Booking Holdings, Inc.* . . . . . . . . . . . . . . . . . . 1,063 2,444,549BorgWarner, Inc. . . . . . . . . . . . . . . . . . . . . . . . . 6,127 261,500CarMax, Inc.* . . . . . . . . . . . . . . . . . . . . . . . . . . . 4,161 520,999Dollar Tree, Inc.* . . . . . . . . . . . . . . . . . . . . . . . . 6,027 545,685eBay, Inc. . . . . . . . . . . . . . . . . . . . . . . . . . . . . . . 16,623 1,275,649Etsy, Inc.* (a) . . . . . . . . . . . . . . . . . . . . . . . . . . . 3,262 705,440Ford Motor Co.* . . . . . . . . . . . . . . . . . . . . . . . . 100,209 1,305,723Gap, Inc. . . . . . . . . . . . . . . . . . . . . . . . . . . . . . . . 4,857 129,828General Motors Co.* . . . . . . . . . . . . . . . . . . . . 32,558 1,595,668Hanesbrands, Inc. . . . . . . . . . . . . . . . . . . . . . . . 8,591 160,480Hasbro, Inc. . . . . . . . . . . . . . . . . . . . . . . . . . . . . 3,257 320,196Hilton Worldwide Holdings, Inc.* . . . . . . . . . 7,141 891,625Home Depot, Inc. . . . . . . . . . . . . . . . . . . . . . . . 27,278 8,897,538Las Vegas Sands Corp.* . . . . . . . . . . . . . . . . . 8,472 377,936Leggett & Platt, Inc. . . . . . . . . . . . . . . . . . . . . . 3,219 155,767Lowe’s Cos., Inc. . . . . . . . . . . . . . . . . . . . . . . . . 18,159 3,702,438Marriott International, Inc., Class A * . . . . . . 6,827 922,601McDonald’s Corp. . . . . . . . . . . . . . . . . . . . . . . . 19,161 4,549,971MGM Resorts International . . . . . . . . . . . . . . . 10,629 453,008Newell Brands, Inc. . . . . . . . . . . . . . . . . . . . . . . 9,717 246,909NIKE, Inc., Class B . . . . . . . . . . . . . . . . . . . . . . . 32,672 5,382,385PulteGroup, Inc. . . . . . . . . . . . . . . . . . . . . . . . . 6,638 357,523PVH Corp.* . . . . . . . . . . . . . . . . . . . . . . . . . . . . . 1,733 181,601Ralph Lauren Corp. . . . . . . . . . . . . . . . . . . . . . . 1,233 143,188Royal Caribbean Cruises Ltd.* . . . . . . . . . . . . 5,635 466,184Starbucks Corp. . . . . . . . . . . . . . . . . . . . . . . . . . 30,240 3,552,898Tapestry, Inc.* . . . . . . . . . . . . . . . . . . . . . . . . . . 7,461 300,827Target Corp. . . . . . . . . . . . . . . . . . . . . . . . . . . . . 12,905 3,187,277Tesla, Inc.* . . . . . . . . . . . . . . . . . . . . . . . . . . . . . 19,775 14,548,863TJX Cos., Inc. . . . . . . . . . . . . . . . . . . . . . . . . . . . 30,875 2,245,230Under Armour, Inc., Class A * . . . . . . . . . . . . 5,245 121,369Under Armour, Inc., Class C * . . . . . . . . . . . . 5,068 101,664VF Corp. . . . . . . . . . . . . . . . . . . . . . . . . . . . . . . . 8,234 629,654
Numberof Shares Value
Consumer Discretionary (Continued)
Whirlpool Corp. . . . . . . . . . . . . . . . . . . . . . . . . 1,573 $ 348,467Yum! Brands, Inc. . . . . . . . . . . . . . . . . . . . . . . . 7,735 1,013,517
(Cost $87,372,885) . . . . . . . . . . . . . . . . . . . . . . 102,004,830
Consumer Staples — 5.3%
Archer-Daniels-Midland Co. . . . . . . . . . . . . . . 14,224 853,440Brown-Forman Corp., Class B . . . . . . . . . . . . 4,711 330,806Campbell Soup Co. . . . . . . . . . . . . . . . . . . . . . 5,167 215,619Coca-Cola Co. . . . . . . . . . . . . . . . . . . . . . . . . . . 99,573 5,606,956Colgate-Palmolive Co. . . . . . . . . . . . . . . . . . . . 21,709 1,692,217Conagra Brands, Inc. . . . . . . . . . . . . . . . . . . . . 12,531 415,027Constellation Brands, Inc., Class A . . . . . . . . 4,382 925,215General Mills, Inc. . . . . . . . . . . . . . . . . . . . . . . . 15,638 904,033Hershey Co. . . . . . . . . . . . . . . . . . . . . . . . . . . . . 3,764 668,863Hormel Foods Corp. . . . . . . . . . . . . . . . . . . . . . 6,924 315,319J M Smucker Co. . . . . . . . . . . . . . . . . . . . . . . . 2,688 332,425Kellogg Co. (a) . . . . . . . . . . . . . . . . . . . . . . . . . . 6,445 406,937Kraft Heinz Co. . . . . . . . . . . . . . . . . . . . . . . . . . 16,674 600,097Kroger Co. . . . . . . . . . . . . . . . . . . . . . . . . . . . . . 19,563 900,485McCormick & Co., Inc. . . . . . . . . . . . . . . . . . . . 6,362 548,977Molson Coors Beverage Co., Class B . . . . . . 4,581 217,735Mondelez International, Inc., Class A . . . . . . 36,131 2,242,651PepsiCo, Inc. . . . . . . . . . . . . . . . . . . . . . . . . . . . 35,378 5,532,765Procter & Gamble Co. . . . . . . . . . . . . . . . . . . . 62,851 8,949,354Sysco Corp. . . . . . . . . . . . . . . . . . . . . . . . . . . . . 13,110 1,044,211Tyson Foods, Inc., Class A . . . . . . . . . . . . . . . 7,526 590,942Walgreens Boots Alliance, Inc. . . . . . . . . . . . 18,383 932,937Walmart, Inc. . . . . . . . . . . . . . . . . . . . . . . . . . . . 35,260 5,222,006
(Cost $36,370,119) . . . . . . . . . . . . . . . . . . . . . . 39,449,017
Energy — 2.7%
APA Corp. . . . . . . . . . . . . . . . . . . . . . . . . . . . . . 10,342 201,462Chevron Corp. . . . . . . . . . . . . . . . . . . . . . . . . . . 49,634 4,803,082ConocoPhillips . . . . . . . . . . . . . . . . . . . . . . . . . 34,644 1,923,781Devon Energy Corp. . . . . . . . . . . . . . . . . . . . . . 15,143 447,476Exxon Mobil Corp. . . . . . . . . . . . . . . . . . . . . . . 108,694 5,925,997Halliburton Co. . . . . . . . . . . . . . . . . . . . . . . . . . 22,756 454,665Hess Corp. . . . . . . . . . . . . . . . . . . . . . . . . . . . . . 6,989 480,494Kinder Morgan, Inc. . . . . . . . . . . . . . . . . . . . . . 49,757 809,546Marathon Petroleum Corp. . . . . . . . . . . . . . . . 16,740 992,180Occidental Petroleum Corp. . . . . . . . . . . . . . . 21,525 552,977ONEOK, Inc. . . . . . . . . . . . . . . . . . . . . . . . . . . . . 11,459 601,827Pioneer Natural Resources Co. . . . . . . . . . . . 5,948 890,237Schlumberger N.V. . . . . . . . . . . . . . . . . . . . . . . 35,684 1,000,579Williams Cos., Inc. . . . . . . . . . . . . . . . . . . . . . . 31,182 769,884
(Cost $18,695,551) . . . . . . . . . . . . . . . . . . . . . . 19,854,187
Financials — 10.6%
Aflac, Inc. . . . . . . . . . . . . . . . . . . . . . . . . . . . . . . 16,296 923,657Allstate Corp. . . . . . . . . . . . . . . . . . . . . . . . . . . . 7,809 1,056,402American Express Co. . . . . . . . . . . . . . . . . . . . 16,766 2,782,485Ameriprise Financial, Inc. . . . . . . . . . . . . . . . . 3,015 822,824Arthur J Gallagher & Co. . . . . . . . . . . . . . . . . . 5,263 755,872Assurant, Inc. . . . . . . . . . . . . . . . . . . . . . . . . . . . 1,566 266,392Bank of America Corp. . . . . . . . . . . . . . . . . . . . 193,597 8,082,675Bank of New York Mellon Corp. . . . . . . . . . . . 20,657 1,140,680BlackRock, Inc. . . . . . . . . . . . . . . . . . . . . . . . . . 3,655 3,447,725Capital One Financial Corp. . . . . . . . . . . . . . . 11,820 1,961,765
See Notes to Financial Statements. 52
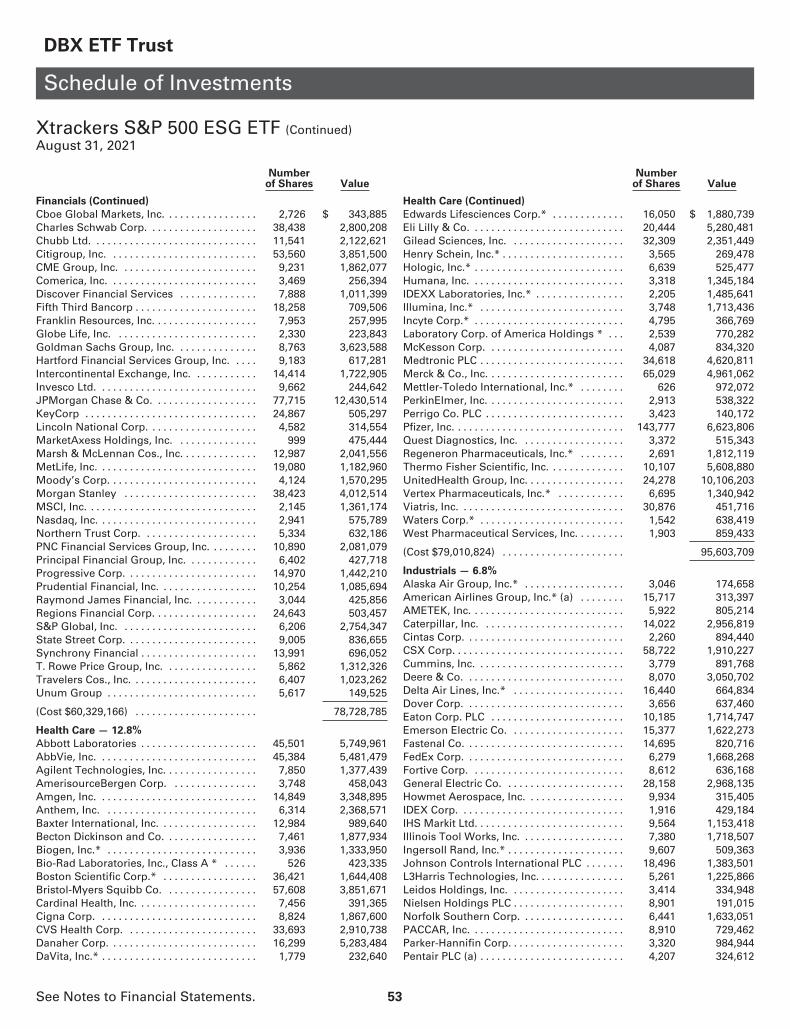
DBX ETF Trust
Schedule of Investments
Xtrackers S&P 500 ESG ETF (Continued)August 31, 2021
Numberof Shares Value
Financials (Continued)
Cboe Global Markets, Inc. . . . . . . . . . . . . . . . . 2,726 $ 343,885Charles Schwab Corp. . . . . . . . . . . . . . . . . . . . 38,438 2,800,208Chubb Ltd. . . . . . . . . . . . . . . . . . . . . . . . . . . . . . 11,541 2,122,621Citigroup, Inc. . . . . . . . . . . . . . . . . . . . . . . . . . . 53,560 3,851,500CME Group, Inc. . . . . . . . . . . . . . . . . . . . . . . . . 9,231 1,862,077Comerica, Inc. . . . . . . . . . . . . . . . . . . . . . . . . . . 3,469 256,394Discover Financial Services . . . . . . . . . . . . . . 7,888 1,011,399Fifth Third Bancorp . . . . . . . . . . . . . . . . . . . . . . 18,258 709,506Franklin Resources, Inc. . . . . . . . . . . . . . . . . . . 7,953 257,995Globe Life, Inc. . . . . . . . . . . . . . . . . . . . . . . . . . 2,330 223,843Goldman Sachs Group, Inc. . . . . . . . . . . . . . . 8,763 3,623,588Hartford Financial Services Group, Inc. . . . . 9,183 617,281Intercontinental Exchange, Inc. . . . . . . . . . . . 14,414 1,722,905Invesco Ltd. . . . . . . . . . . . . . . . . . . . . . . . . . . . . 9,662 244,642JPMorgan Chase & Co. . . . . . . . . . . . . . . . . . . 77,715 12,430,514KeyCorp . . . . . . . . . . . . . . . . . . . . . . . . . . . . . . . 24,867 505,297Lincoln National Corp. . . . . . . . . . . . . . . . . . . . 4,582 314,554MarketAxess Holdings, Inc. . . . . . . . . . . . . . . 999 475,444Marsh & McLennan Cos., Inc. . . . . . . . . . . . . . 12,987 2,041,556MetLife, Inc. . . . . . . . . . . . . . . . . . . . . . . . . . . . . 19,080 1,182,960Moody’s Corp. . . . . . . . . . . . . . . . . . . . . . . . . . . 4,124 1,570,295Morgan Stanley . . . . . . . . . . . . . . . . . . . . . . . . 38,423 4,012,514MSCI, Inc. . . . . . . . . . . . . . . . . . . . . . . . . . . . . . . 2,145 1,361,174Nasdaq, Inc. . . . . . . . . . . . . . . . . . . . . . . . . . . . . 2,941 575,789Northern Trust Corp. . . . . . . . . . . . . . . . . . . . . 5,334 632,186PNC Financial Services Group, Inc. . . . . . . . . 10,890 2,081,079Principal Financial Group, Inc. . . . . . . . . . . . . 6,402 427,718Progressive Corp. . . . . . . . . . . . . . . . . . . . . . . . 14,970 1,442,210Prudential Financial, Inc. . . . . . . . . . . . . . . . . . 10,254 1,085,694Raymond James Financial, Inc. . . . . . . . . . . . 3,044 425,856Regions Financial Corp. . . . . . . . . . . . . . . . . . . 24,643 503,457S&P Global, Inc. . . . . . . . . . . . . . . . . . . . . . . . . 6,206 2,754,347State Street Corp. . . . . . . . . . . . . . . . . . . . . . . . 9,005 836,655Synchrony Financial . . . . . . . . . . . . . . . . . . . . . 13,991 696,052T. Rowe Price Group, Inc. . . . . . . . . . . . . . . . . 5,862 1,312,326Travelers Cos., Inc. . . . . . . . . . . . . . . . . . . . . . . 6,407 1,023,262Unum Group . . . . . . . . . . . . . . . . . . . . . . . . . . . 5,617 149,525
(Cost $60,329,166) . . . . . . . . . . . . . . . . . . . . . . 78,728,785
Health Care — 12.8%
Abbott Laboratories . . . . . . . . . . . . . . . . . . . . . 45,501 5,749,961AbbVie, Inc. . . . . . . . . . . . . . . . . . . . . . . . . . . . . 45,384 5,481,479Agilent Technologies, Inc. . . . . . . . . . . . . . . . . 7,850 1,377,439AmerisourceBergen Corp. . . . . . . . . . . . . . . . 3,748 458,043Amgen, Inc. . . . . . . . . . . . . . . . . . . . . . . . . . . . . 14,849 3,348,895Anthem, Inc. . . . . . . . . . . . . . . . . . . . . . . . . . . . 6,314 2,368,571Baxter International, Inc. . . . . . . . . . . . . . . . . . 12,984 989,640Becton Dickinson and Co. . . . . . . . . . . . . . . . . 7,461 1,877,934Biogen, Inc.* . . . . . . . . . . . . . . . . . . . . . . . . . . . 3,936 1,333,950Bio-Rad Laboratories, Inc., Class A * . . . . . . 526 423,335Boston Scientific Corp.* . . . . . . . . . . . . . . . . . 36,421 1,644,408Bristol-Myers Squibb Co. . . . . . . . . . . . . . . . . 57,608 3,851,671Cardinal Health, Inc. . . . . . . . . . . . . . . . . . . . . . 7,456 391,365Cigna Corp. . . . . . . . . . . . . . . . . . . . . . . . . . . . . 8,824 1,867,600CVS Health Corp. . . . . . . . . . . . . . . . . . . . . . . . 33,693 2,910,738Danaher Corp. . . . . . . . . . . . . . . . . . . . . . . . . . . 16,299 5,283,484DaVita, Inc.* . . . . . . . . . . . . . . . . . . . . . . . . . . . . 1,779 232,640
Numberof Shares Value
Health Care (Continued)
Edwards Lifesciences Corp.* . . . . . . . . . . . . . 16,050 $ 1,880,739Eli Lilly & Co. . . . . . . . . . . . . . . . . . . . . . . . . . . . 20,444 5,280,481Gilead Sciences, Inc. . . . . . . . . . . . . . . . . . . . . 32,309 2,351,449Henry Schein, Inc.* . . . . . . . . . . . . . . . . . . . . . . 3,565 269,478Hologic, Inc.* . . . . . . . . . . . . . . . . . . . . . . . . . . . 6,639 525,477Humana, Inc. . . . . . . . . . . . . . . . . . . . . . . . . . . . 3,318 1,345,184IDEXX Laboratories, Inc.* . . . . . . . . . . . . . . . . 2,205 1,485,641Illumina, Inc.* . . . . . . . . . . . . . . . . . . . . . . . . . . 3,748 1,713,436Incyte Corp.* . . . . . . . . . . . . . . . . . . . . . . . . . . . 4,795 366,769Laboratory Corp. of America Holdings * . . . 2,539 770,282McKesson Corp. . . . . . . . . . . . . . . . . . . . . . . . . 4,087 834,320Medtronic PLC . . . . . . . . . . . . . . . . . . . . . . . . . . 34,618 4,620,811Merck & Co., Inc. . . . . . . . . . . . . . . . . . . . . . . . . 65,029 4,961,062Mettler-Toledo International, Inc.* . . . . . . . . 626 972,072PerkinElmer, Inc. . . . . . . . . . . . . . . . . . . . . . . . . 2,913 538,322Perrigo Co. PLC . . . . . . . . . . . . . . . . . . . . . . . . . 3,423 140,172Pfizer, Inc. . . . . . . . . . . . . . . . . . . . . . . . . . . . . . . 143,777 6,623,806Quest Diagnostics, Inc. . . . . . . . . . . . . . . . . . . 3,372 515,343Regeneron Pharmaceuticals, Inc.* . . . . . . . . 2,691 1,812,119Thermo Fisher Scientific, Inc. . . . . . . . . . . . . . 10,107 5,608,880UnitedHealth Group, Inc. . . . . . . . . . . . . . . . . . 24,278 10,106,203Vertex Pharmaceuticals, Inc.* . . . . . . . . . . . . 6,695 1,340,942Viatris, Inc. . . . . . . . . . . . . . . . . . . . . . . . . . . . . . 30,876 451,716Waters Corp.* . . . . . . . . . . . . . . . . . . . . . . . . . . 1,542 638,419West Pharmaceutical Services, Inc. . . . . . . . . 1,903 859,433
(Cost $79,010,824) . . . . . . . . . . . . . . . . . . . . . . 95,603,709
Industrials — 6.8%
Alaska Air Group, Inc.* . . . . . . . . . . . . . . . . . . 3,046 174,658American Airlines Group, Inc.* (a) . . . . . . . . 15,717 313,397AMETEK, Inc. . . . . . . . . . . . . . . . . . . . . . . . . . . . 5,922 805,214Caterpillar, Inc. . . . . . . . . . . . . . . . . . . . . . . . . . 14,022 2,956,819Cintas Corp. . . . . . . . . . . . . . . . . . . . . . . . . . . . . 2,260 894,440CSX Corp. . . . . . . . . . . . . . . . . . . . . . . . . . . . . . . 58,722 1,910,227Cummins, Inc. . . . . . . . . . . . . . . . . . . . . . . . . . . 3,779 891,768Deere & Co. . . . . . . . . . . . . . . . . . . . . . . . . . . . . 8,070 3,050,702Delta Air Lines, Inc.* . . . . . . . . . . . . . . . . . . . . 16,440 664,834Dover Corp. . . . . . . . . . . . . . . . . . . . . . . . . . . . . 3,656 637,460Eaton Corp. PLC . . . . . . . . . . . . . . . . . . . . . . . . 10,185 1,714,747Emerson Electric Co. . . . . . . . . . . . . . . . . . . . . 15,377 1,622,273Fastenal Co. . . . . . . . . . . . . . . . . . . . . . . . . . . . . 14,695 820,716FedEx Corp. . . . . . . . . . . . . . . . . . . . . . . . . . . . . 6,279 1,668,268Fortive Corp. . . . . . . . . . . . . . . . . . . . . . . . . . . . 8,612 636,168General Electric Co. . . . . . . . . . . . . . . . . . . . . . 28,158 2,968,135Howmet Aerospace, Inc. . . . . . . . . . . . . . . . . . 9,934 315,405IDEX Corp. . . . . . . . . . . . . . . . . . . . . . . . . . . . . . 1,916 429,184IHS Markit Ltd. . . . . . . . . . . . . . . . . . . . . . . . . . . 9,564 1,153,418Illinois Tool Works, Inc. . . . . . . . . . . . . . . . . . . 7,380 1,718,507Ingersoll Rand, Inc.* . . . . . . . . . . . . . . . . . . . . . 9,607 509,363Johnson Controls International PLC . . . . . . . 18,496 1,383,501L3Harris Technologies, Inc. . . . . . . . . . . . . . . . 5,261 1,225,866Leidos Holdings, Inc. . . . . . . . . . . . . . . . . . . . . 3,414 334,948Nielsen Holdings PLC . . . . . . . . . . . . . . . . . . . . 8,901 191,015Norfolk Southern Corp. . . . . . . . . . . . . . . . . . . 6,441 1,633,051PACCAR, Inc. . . . . . . . . . . . . . . . . . . . . . . . . . . . 8,910 729,462Parker-Hannifin Corp. . . . . . . . . . . . . . . . . . . . . 3,320 984,944Pentair PLC (a) . . . . . . . . . . . . . . . . . . . . . . . . . . 4,207 324,612
See Notes to Financial Statements. 53

DBX ETF Trust
Schedule of Investments
Xtrackers S&P 500 ESG ETF (Continued)August 31, 2021
Numberof Shares Value
Industrials (Continued)
Republic Services, Inc. . . . . . . . . . . . . . . . . . . . 5,288 $ 656,399Robert Half International, Inc. . . . . . . . . . . . . . 2,911 300,997Rockwell Automation, Inc. . . . . . . . . . . . . . . . 2,982 970,492Roper Technologies, Inc. . . . . . . . . . . . . . . . . . 2,698 1,303,889Snap-on, Inc. . . . . . . . . . . . . . . . . . . . . . . . . . . . 1,362 306,382Stanley Black & Decker, Inc. . . . . . . . . . . . . . . 4,122 796,659Trane Technologies PLC . . . . . . . . . . . . . . . . . 6,109 1,212,637TransDigm Group, Inc.* . . . . . . . . . . . . . . . . . 1,421 863,215Union Pacific Corp. . . . . . . . . . . . . . . . . . . . . . . 17,185 3,726,395United Parcel Service, Inc., Class B . . . . . . . . 18,509 3,620,916United Rentals, Inc.* . . . . . . . . . . . . . . . . . . . . 1,857 654,871Verisk Analytics, Inc. . . . . . . . . . . . . . . . . . . . . 4,162 839,725W.W. Grainger, Inc. . . . . . . . . . . . . . . . . . . . . . 1,120 485,744Waste Management, Inc. . . . . . . . . . . . . . . . . . 9,946 1,542,724Westinghouse Air Brake TechnologiesCorp. . . . . . . . . . . . . . . . . . . . . . . . . . . . . . . . . . 4,541 407,736
Xylem, Inc. . . . . . . . . . . . . . . . . . . . . . . . . . . . . . 4,551 620,347
(Cost $40,810,543) . . . . . . . . . . . . . . . . . . . . . . 50,972,230
Information Technology — 30.7%
Accenture PLC, Class A . . . . . . . . . . . . . . . . . . 16,313 5,490,303Adobe, Inc.* . . . . . . . . . . . . . . . . . . . . . . . . . . . . 12,309 8,169,483Advanced Micro Devices, Inc.* . . . . . . . . . . . 31,159 3,449,925Akamai Technologies, Inc.* . . . . . . . . . . . . . . 4,175 472,819Amphenol Corp., Class A . . . . . . . . . . . . . . . . 15,354 1,176,577Analog Devices, Inc. . . . . . . . . . . . . . . . . . . . . . 13,807 2,249,851ANSYS, Inc.* . . . . . . . . . . . . . . . . . . . . . . . . . . . 2,233 815,849Apple, Inc. . . . . . . . . . . . . . . . . . . . . . . . . . . . . . 403,033 61,192,500Applied Materials, Inc. . . . . . . . . . . . . . . . . . . . 23,557 3,183,257Arista Networks, Inc.* . . . . . . . . . . . . . . . . . . . 1,427 527,319Autodesk, Inc.* . . . . . . . . . . . . . . . . . . . . . . . . . 5,645 1,750,458Cisco Systems, Inc. . . . . . . . . . . . . . . . . . . . . . . 108,398 6,397,650Corning, Inc. . . . . . . . . . . . . . . . . . . . . . . . . . . . 19,732 789,083DXC Technology Co.* . . . . . . . . . . . . . . . . . . . 6,343 232,915Hewlett Packard Enterprise Co. . . . . . . . . . . . 33,458 517,261HP, Inc. . . . . . . . . . . . . . . . . . . . . . . . . . . . . . . . . 32,077 953,970Intel Corp. . . . . . . . . . . . . . . . . . . . . . . . . . . . . . . 104,374 5,642,458Intuit, Inc. . . . . . . . . . . . . . . . . . . . . . . . . . . . . . . 7,046 3,988,811Juniper Networks, Inc. . . . . . . . . . . . . . . . . . . . 8,300 240,534Keysight Technologies, Inc.* . . . . . . . . . . . . . 4,786 858,513KLA Corp. . . . . . . . . . . . . . . . . . . . . . . . . . . . . . . 3,982 1,353,721Lam Research Corp. . . . . . . . . . . . . . . . . . . . . . 3,680 2,225,738Mastercard, Inc., Class A . . . . . . . . . . . . . . . . . 22,457 7,775,287Micron Technology, Inc.* . . . . . . . . . . . . . . . . 28,725 2,117,033Microsoft Corp. . . . . . . . . . . . . . . . . . . . . . . . . . 193,516 58,418,610Motorola Solutions, Inc. . . . . . . . . . . . . . . . . . 4,369 1,066,997NortonLifeLock, Inc. . . . . . . . . . . . . . . . . . . . . . 14,658 389,317NVIDIA Corp. . . . . . . . . . . . . . . . . . . . . . . . . . . . 63,972 14,320,132Oracle Corp. . . . . . . . . . . . . . . . . . . . . . . . . . . . . 46,620 4,155,241QUALCOMM, Inc. . . . . . . . . . . . . . . . . . . . . . . . 29,161 4,277,627salesforce.com, Inc.* . . . . . . . . . . . . . . . . . . . . 24,812 6,581,879Seagate Technology Holdings PLC . . . . . . . . 5,133 449,599TE Connectivity Ltd. . . . . . . . . . . . . . . . . . . . . . 8,509 1,278,222Texas Instruments, Inc. . . . . . . . . . . . . . . . . . . 23,731 4,530,485Trimble, Inc.* . . . . . . . . . . . . . . . . . . . . . . . . . . . 6,442 606,965Visa, Inc., Class A (a) . . . . . . . . . . . . . . . . . . . . 43,553 9,977,992
Numberof Shares Value
Information Technology (Continued)
Zebra Technologies Corp., Class A * . . . . . . 1,392 $ 817,341
(Cost $171,217,400) . . . . . . . . . . . . . . . . . . . . . 228,441,722
Materials — 2.5%
Air Products and Chemicals, Inc. . . . . . . . . . . 5,662 1,525,966Albemarle Corp. . . . . . . . . . . . . . . . . . . . . . . . . 2,994 708,800Ball Corp. . . . . . . . . . . . . . . . . . . . . . . . . . . . . . . 8,433 809,231CF Industries Holdings, Inc. . . . . . . . . . . . . . . 5,309 241,135Corteva, Inc. . . . . . . . . . . . . . . . . . . . . . . . . . . . . 19,104 840,003Dow, Inc. . . . . . . . . . . . . . . . . . . . . . . . . . . . . . . 19,114 1,202,271Eastman Chemical Co. . . . . . . . . . . . . . . . . . . . 3,632 410,997Ecolab, Inc. . . . . . . . . . . . . . . . . . . . . . . . . . . . . . 6,364 1,434,191FMC Corp. . . . . . . . . . . . . . . . . . . . . . . . . . . . . . 3,323 311,132Freeport-McMoRan, Inc. . . . . . . . . . . . . . . . . . 37,516 1,365,207International Flavors & Fragrances, Inc. . . . . 6,378 966,267International Paper Co. . . . . . . . . . . . . . . . . . . 10,052 604,025Linde PLC . . . . . . . . . . . . . . . . . . . . . . . . . . . . . . 13,422 4,222,427LyondellBasell Industries NV, Class A . . . . . 6,621 664,417Martin Marietta Materials, Inc. . . . . . . . . . . . . 1,594 607,712Mosaic Co. . . . . . . . . . . . . . . . . . . . . . . . . . . . . . 8,875 285,598Newmont Corp. . . . . . . . . . . . . . . . . . . . . . . . . 20,578 1,193,318PPG Industries, Inc. . . . . . . . . . . . . . . . . . . . . . 6,059 966,713Westrock Co. . . . . . . . . . . . . . . . . . . . . . . . . . . . 6,762 351,894
(Cost $15,685,887) . . . . . . . . . . . . . . . . . . . . . . 18,711,304
Real Estate — 2.6%
American Tower Corp. REIT . . . . . . . . . . . . . . 11,635 3,399,398AvalonBay Communities, Inc. REIT . . . . . . . . 3,607 828,095Boston Properties, Inc. REIT . . . . . . . . . . . . . . 3,663 413,882CBRE Group, Inc., Class A * . . . . . . . . . . . . . . 8,619 830,010Digital Realty Trust, Inc. REIT . . . . . . . . . . . . . 7,200 1,180,152Duke Realty Corp. REIT . . . . . . . . . . . . . . . . . . 9,629 505,619Equinix, Inc. REIT . . . . . . . . . . . . . . . . . . . . . . . 2,285 1,927,283Equity Residential REIT . . . . . . . . . . . . . . . . . . 8,837 742,927Essex Property Trust, Inc. REIT . . . . . . . . . . . 1,652 546,382Extra Space Storage, Inc. REIT . . . . . . . . . . . . 3,388 633,251Healthpeak Properties, Inc. REIT . . . . . . . . . . 13,945 502,020Host Hotels & Resorts, Inc. REIT * . . . . . . . . . 18,247 302,170Iron Mountain, Inc. REIT . . . . . . . . . . . . . . . . . 7,422 354,401Kimco Realty Corp. REIT . . . . . . . . . . . . . . . . . 15,426 336,133Prologis, Inc. REIT . . . . . . . . . . . . . . . . . . . . . . 19,017 2,560,829Realty Income Corp. REIT (a) . . . . . . . . . . . . . 9,636 695,912Regency Centers Corp. REIT . . . . . . . . . . . . . . 3,851 264,256Simon Property Group, Inc. REIT . . . . . . . . . 8,477 1,139,733Ventas, Inc. REIT . . . . . . . . . . . . . . . . . . . . . . . . 9,664 540,604Vornado Realty Trust REIT . . . . . . . . . . . . . . . 3,672 153,783Welltower, Inc. REIT . . . . . . . . . . . . . . . . . . . . . 10,759 941,735Weyerhaeuser Co. REIT . . . . . . . . . . . . . . . . . . 19,258 693,288
(Cost $15,908,716) . . . . . . . . . . . . . . . . . . . . . . 19,491,863
Utilities — 1.5%
American Water Works Co., Inc. . . . . . . . . . . 4,679 852,748Consolidated Edison, Inc. . . . . . . . . . . . . . . . . 8,782 662,602Edison International . . . . . . . . . . . . . . . . . . . . . 9,729 562,725Entergy Corp. . . . . . . . . . . . . . . . . . . . . . . . . . . 5,137 568,203Eversource Energy . . . . . . . . . . . . . . . . . . . . . . 8,814 799,694Exelon Corp. . . . . . . . . . . . . . . . . . . . . . . . . . . . 24,946 1,222,853FirstEnergy Corp. . . . . . . . . . . . . . . . . . . . . . . . 13,949 542,198
See Notes to Financial Statements. 54

DBX ETF Trust
Schedule of Investments
Xtrackers S&P 500 ESG ETF (Continued)August 31, 2021
Numberof Shares Value
Utilities (Continued)
NextEra Energy, Inc. . . . . . . . . . . . . . . . . . . . . 50,338 $ 4,227,889Public Service Enterprise Group, Inc. . . . . . . 12,966 829,046Sempra Energy . . . . . . . . . . . . . . . . . . . . . . . . . 8,099 1,071,984
(Cost $10,077,173) . . . . . . . . . . . . . . . . . . . . . . 11,339,942
TOTAL COMMON STOCKS
(Cost $595,958,173) . . . . . . . . . . . . . . . . . . . . 742,531,792
SECURITIES LENDING COLLATERAL — 0.0%
DWS Government & Agency SecuritiesPortfolio “DWS Government CashInstitutional Shares”, 0.01% (b)(c)(Cost $107,727) . . . . . . . . . . . . . . . . . . . . . . . . 107,727 107,727
CASH EQUIVALENTS — 0.2%
DWS Government Money Market Series“Institutional Shares”, 0.04% (b)(Cost $1,353,973) . . . . . . . . . . . . . . . . . . . . . . 1,353,973 1,353,973
TOTAL INVESTMENTS — 99.9%(Cost $597,419,873) $743,993,492
Other assets and liabilities, net — 0.1% . . . . 758,642
NET ASSETS — 100.0% . . . . . . . . . . . . . . . . . $744,752,134
A summary of the Fund’s transactions with affiliated investments during the year ended August 31, 2021 is as follows:
Value ($) at8/31/2020
PurchasesCost ($)
SalesProceeds ($)
Net RealizedGain/(Loss) ($)
Net Changein UnrealizedAppreciation
(Depreciation)($) Income ($)
Capital GainDistributions
($)
Number ofShares at8/31/2021
Value ($) at8/31/2021
SECURITIES LENDING COLLATERAL — 0.0%DWS Government & Agency Securities Portfolio “DWS Government Cash Institutional Shares”, 0.01% (b)(c)
84,196 23,531(d) — — — 15 — 107,727 107,727
CASH EQUIVALENTS — 0.2%DWS Government Money Market Series “Institutional Shares”, 0.04% (b)
344,797 11,397,855 (10,388,679) — — 281 — 1,353,973 1,353,973
428,993 11,421,386 (10,388,679) — — 296 — 1,461,700 1,461,700
* Non-income producing security.(a) All or a portion of these securities were on loan. In addition, “Other assets and liabilities, net” may include pending sales that are also on
loan. The value of securities loaned at August 31, 2021 amounted to $14,021,303, which is 1.9% of net assets.(b) Affiliated fund managed by DWS Investment Management Americas, Inc. The rate shown is the annualized seven-day yield at period end.(c) Represents cash collateral held in connection with securities lending. Income earned by the Fund is net of borrower rebates. In addition,
the Fund held non-cash U.S. Treasury securities collateral having a value of $14,267,599.(d) Represents the net increase (purchase cost) or decrease (sales proceeds) in the amount invested in cash collateral for the year ended
August 31, 2021.
REIT: Real Estate Investment Trust
At August 31, 2021, open futures contracts purchased were as follows:
Contract Description CurrencyNumber ofContracts
NotionalAmount
ContractValue
ExpirationDate
UnrealizedAppreciation
E-Mini S&P 500 ESG Futures . . . . . . . . . . . . . . . . . . . . . . . . . . . . . . USD 10 $1,861,940 $1,934,500 9/17/2021 $72,560
For information on the Fund’s policy and additional disclosures regarding open futures contracts, please refer to the Derivatives section ofNote 2 in the accompanying Notes to Financial Statements.
See Notes to Financial Statements. 55

DBX ETF Trust
Schedule of Investments
Xtrackers S&P 500 ESG ETF (Continued)August 31, 2021
Currency Abbreviations
USD U.S. Dollar
Fair Value Measurements
Various inputs are used in determining the value of the Fund’s investments. These inputs are summarized in three broad levels. Level 1includes quoted prices in active markets for identical securities. Level 2 includes other significant observable inputs (including quoted pricesfor similar securities, interest rates, prepayment speeds and credit risk). Level 3 includes significant unobservable inputs (including the Fund’sown assumptions in determining the fair value of investments). The level assigned to the securities valuations may not be an indication of therisk or liquidity associated with investing in those securities.
The following is a summary of the inputs used as of August 31, 2021 in valuing the Fund’s investments. For information on the Fund’s policyregarding the valuation of investments, please refer to the Security Valuation section of Note 2 in the accompanying Notes to FinancialStatements.
Assets Level 1 Level 2 Level 3 Total
Common Stocks (e) . . . . . . . . . . . . . . . . . . . . . . . . . . . . . . . . . . . . . . . . . . . . . . . . . . . . . . . $742,531,792 $ — $ — $742,531,792Short-Term Investments (e) . . . . . . . . . . . . . . . . . . . . . . . . . . . . . . . . . . . . . . . . . . . . . . . . 1,461,700 — — 1,461,700Derivatives (f)Futures Contracts . . . . . . . . . . . . . . . . . . . . . . . . . . . . . . . . . . . . . . . . . . . . . . . . . . . . . . . . 72,560 — — 72,560
TOTAL . . . . . . . . . . . . . . . . . . . . . . . . . . . . . . . . . . . . . . . . . . . . . . . . . . . . . . . . . . . . . . . . . . . $744,066,052 $ — $ — $744,066,052
(e) See Schedule of Investments for additional detailed categorizations.(f) Derivatives include unrealized appreciation (depreciation) on open futures contracts.
See Notes to Financial Statements. 56

DBX ETF Trust
Schedule of Investments
Xtrackers S&P MidCap 400 ESG ETFAugust 31, 2021
Numberof Shares Value
COMMON STOCKS — 99.9%
Communication Services — 2.1%
Cable One, Inc. . . . . . . . . . . . . . . . . . . . . . . . . . . . 36 $ 75,585Iridium Communications, Inc.* . . . . . . . . . . . . . 790 35,163New York Times Co., Class A . . . . . . . . . . . . . . 953 48,394TEGNA, Inc. . . . . . . . . . . . . . . . . . . . . . . . . . . . . . . 1,481 26,243TripAdvisor, Inc.* . . . . . . . . . . . . . . . . . . . . . . . . . 636 22,260Yelp, Inc.* . . . . . . . . . . . . . . . . . . . . . . . . . . . . . . . 449 17,291
(Cost $223,383) . . . . . . . . . . . . . . . . . . . . . . . . . . . 224,936
Consumer Discretionary — 15.5%
American Eagle Outfitters, Inc. (a) . . . . . . . . . . 981 29,940AutoNation, Inc.* . . . . . . . . . . . . . . . . . . . . . . . . . 351 38,291Brunswick Corp. . . . . . . . . . . . . . . . . . . . . . . . . . . 518 50,179Capri Holdings Ltd.* . . . . . . . . . . . . . . . . . . . . . . 1,007 56,906Carter’s, Inc. . . . . . . . . . . . . . . . . . . . . . . . . . . . . . 293 29,997Columbia Sportswear Co. . . . . . . . . . . . . . . . . . 206 21,014Cracker Barrel Old Country Store, Inc. . . . . . . . 158 22,686Dana, Inc. . . . . . . . . . . . . . . . . . . . . . . . . . . . . . . . . 968 22,516Deckers Outdoor Corp.* . . . . . . . . . . . . . . . . . . . 184 76,995Dick’s Sporting Goods, Inc. (a) . . . . . . . . . . . . . 436 61,393Foot Locker, Inc. . . . . . . . . . . . . . . . . . . . . . . . . . . 684 38,776Gentex Corp. . . . . . . . . . . . . . . . . . . . . . . . . . . . . . 1,591 49,003Goodyear Tire & Rubber Co.* . . . . . . . . . . . . . . 1,803 28,560Graham Holdings Co., Class B . . . . . . . . . . . . . 26 16,037Grand Canyon Education, Inc.* . . . . . . . . . . . . . 311 27,723H&R Block, Inc. . . . . . . . . . . . . . . . . . . . . . . . . . . . 1,214 31,139Harley-Davidson, Inc. . . . . . . . . . . . . . . . . . . . . . 1,008 39,846Helen of Troy Ltd.* . . . . . . . . . . . . . . . . . . . . . . . 159 38,031Jack in the Box, Inc. . . . . . . . . . . . . . . . . . . . . . . . 145 15,364KB Home . . . . . . . . . . . . . . . . . . . . . . . . . . . . . . . . 587 25,259Kohl’s Corp. . . . . . . . . . . . . . . . . . . . . . . . . . . . . . 1,038 59,581Lear Corp. . . . . . . . . . . . . . . . . . . . . . . . . . . . . . . . 364 58,218Lithia Motors, Inc. . . . . . . . . . . . . . . . . . . . . . . . . 198 65,597Mattel, Inc.* . . . . . . . . . . . . . . . . . . . . . . . . . . . . . 2,318 49,489Murphy USA, Inc. . . . . . . . . . . . . . . . . . . . . . . . . 162 25,155Nordstrom, Inc.* . . . . . . . . . . . . . . . . . . . . . . . . . 720 20,599Papa John’s International, Inc. . . . . . . . . . . . . . 214 27,291Polaris, Inc. (a) . . . . . . . . . . . . . . . . . . . . . . . . . . . 378 45,269RH* . . . . . . . . . . . . . . . . . . . . . . . . . . . . . . . . . . . . . 112 78,475Service Corp. International . . . . . . . . . . . . . . . . 1,102 69,162Six Flags Entertainment Corp.* . . . . . . . . . . . . . 511 21,585Tempur Sealy International, Inc. . . . . . . . . . . . . 1,219 54,489Texas Roadhouse, Inc. . . . . . . . . . . . . . . . . . . . . 430 40,850Thor Industries, Inc. (a) . . . . . . . . . . . . . . . . . . . . 360 40,835Toll Brothers, Inc. . . . . . . . . . . . . . . . . . . . . . . . . . 735 47,084Travel + Leisure Co. . . . . . . . . . . . . . . . . . . . . . . . 573 31,377Urban Outfitters, Inc.* . . . . . . . . . . . . . . . . . . . . . 465 15,354Visteon Corp.* . . . . . . . . . . . . . . . . . . . . . . . . . . . 188 19,868Wendy’s Co. . . . . . . . . . . . . . . . . . . . . . . . . . . . . . 1,140 26,243Williams-Sonoma, Inc. . . . . . . . . . . . . . . . . . . . . 505 94,283Wingstop, Inc. . . . . . . . . . . . . . . . . . . . . . . . . . . . . 194 33,354WW International, Inc.* . . . . . . . . . . . . . . . . . . . 350 7,578Wyndham Hotels & Resorts, Inc. . . . . . . . . . . . 611 44,420
(Cost $1,563,483) . . . . . . . . . . . . . . . . . . . . . . . . . 1,695,811
Numberof Shares Value
Consumer Staples — 3.3%
BJ’s Wholesale Club Holdings, Inc.* . . . . . . . . 893 $ 50,597Boston Beer Co., Inc., Class A * . . . . . . . . . . . . 62 35,353Coty, Inc., Class A* . . . . . . . . . . . . . . . . . . . . . . . 1,807 17,654Darling Ingredients, Inc.* . . . . . . . . . . . . . . . . . . 1,082 80,609Flowers Foods, Inc. . . . . . . . . . . . . . . . . . . . . . . . 1,300 31,369Hain Celestial Group, Inc.* . . . . . . . . . . . . . . . . . 548 20,501Ingredion, Inc. . . . . . . . . . . . . . . . . . . . . . . . . . . . . 440 38,658Nu Skin Enterprises, Inc., Class A . . . . . . . . . . . 324 16,401Pilgrim’s Pride Corp.* . . . . . . . . . . . . . . . . . . . . . 307 8,547Sanderson Farms, Inc. . . . . . . . . . . . . . . . . . . . . 131 25,742Sprouts Farmers Market, Inc.* (a) . . . . . . . . . . . 801 19,945TreeHouse Foods, Inc.* . . . . . . . . . . . . . . . . . . . 355 13,302
(Cost $360,101) . . . . . . . . . . . . . . . . . . . . . . . . . . . 358,678
Energy — 1.3%
Cimarex Energy Co. . . . . . . . . . . . . . . . . . . . . . . . 674 43,284CNX Resources Corp.* . . . . . . . . . . . . . . . . . . . . 1,401 15,915EQT Corp.* . . . . . . . . . . . . . . . . . . . . . . . . . . . . . . 1,843 33,782Equitrans Midstream Corp. . . . . . . . . . . . . . . . . 2,731 23,842Murphy Oil Corp. . . . . . . . . . . . . . . . . . . . . . . . . . 969 20,601
(Cost $126,050) . . . . . . . . . . . . . . . . . . . . . . . . . . . 137,424
Financials — 16.5%
Affiliated Managers Group, Inc. . . . . . . . . . . . . 272 46,270Alleghany Corp.* . . . . . . . . . . . . . . . . . . . . . . . . . 93 62,932Associated Banc-Corp. . . . . . . . . . . . . . . . . . . . . 1,033 21,300BancorpSouth Bank . . . . . . . . . . . . . . . . . . . . . . . 657 19,270Bank of Hawaii Corp. . . . . . . . . . . . . . . . . . . . . . . 272 22,796Bank OZK . . . . . . . . . . . . . . . . . . . . . . . . . . . . . . . . 791 33,562Brown & Brown, Inc. . . . . . . . . . . . . . . . . . . . . . . 1,551 90,036CIT Group, Inc. . . . . . . . . . . . . . . . . . . . . . . . . . . . 646 35,801CNO Financial Group, Inc. . . . . . . . . . . . . . . . . . 858 20,987Commerce Bancshares, Inc. . . . . . . . . . . . . . . . 686 48,514East West Bancorp, Inc. . . . . . . . . . . . . . . . . . . . 941 69,013Essent Group Ltd. . . . . . . . . . . . . . . . . . . . . . . . . 769 36,205Evercore, Inc., Class A . . . . . . . . . . . . . . . . . . . . . 266 37,144FactSet Research Systems, Inc. . . . . . . . . . . . . . 251 95,435First American Financial Corp. . . . . . . . . . . . . . 716 50,500First Horizon Corp. . . . . . . . . . . . . . . . . . . . . . . . . 3,617 59,283FNB Corp. . . . . . . . . . . . . . . . . . . . . . . . . . . . . . . . 2,057 24,026Fulton Financial Corp. . . . . . . . . . . . . . . . . . . . . . 1,036 16,421Hancock Whitney Corp. . . . . . . . . . . . . . . . . . . . 582 26,749Hanover Insurance Group, Inc. . . . . . . . . . . . . . 240 33,914Interactive Brokers Group, Inc., Class A . . . . . 530 34,259Janus Henderson Group PLC . . . . . . . . . . . . . . 1,115 48,346Kemper Corp. . . . . . . . . . . . . . . . . . . . . . . . . . . . . 412 28,263MGIC Investment Corp. (a) . . . . . . . . . . . . . . . . . 2,239 34,190Navient Corp. . . . . . . . . . . . . . . . . . . . . . . . . . . . . 1,172 27,202New York Community Bancorp, Inc. . . . . . . . . 3,043 38,098PacWest Bancorp . . . . . . . . . . . . . . . . . . . . . . . . . 767 32,636Pinnacle Financial Partners, Inc. . . . . . . . . . . . . 495 47,975Primerica, Inc. . . . . . . . . . . . . . . . . . . . . . . . . . . . . 259 39,611PROG Holdings, Inc. . . . . . . . . . . . . . . . . . . . . . . 444 21,010Prosperity Bancshares, Inc. . . . . . . . . . . . . . . . . 609 42,557Reinsurance Group of America, Inc. . . . . . . . . . 443 51,308RenaissanceRe Holdings Ltd. . . . . . . . . . . . . . . 329 51,564RLI Corp. . . . . . . . . . . . . . . . . . . . . . . . . . . . . . . . . 261 28,509
See Notes to Financial Statements. 57

DBX ETF Trust
Schedule of Investments
Xtrackers S&P MidCap 400 ESG ETF (Continued)August 31, 2021
Numberof Shares Value
Financials (Continued)
SEI Investments Co. . . . . . . . . . . . . . . . . . . . . . . 787 $ 49,432Selective Insurance Group, Inc. . . . . . . . . . . . . . 393 32,843Signature Bank . . . . . . . . . . . . . . . . . . . . . . . . . . . 382 99,064SLM Corp. . . . . . . . . . . . . . . . . . . . . . . . . . . . . . . . 2,155 40,406Sterling Bancorp . . . . . . . . . . . . . . . . . . . . . . . . . 1,290 29,528Synovus Financial Corp. . . . . . . . . . . . . . . . . . . . 974 41,979Texas Capital Bancshares, Inc.* . . . . . . . . . . . . 336 22,845UMB Financial Corp. . . . . . . . . . . . . . . . . . . . . . . 292 26,741Umpqua Holdings Corp. . . . . . . . . . . . . . . . . . . . 1,478 28,777Webster Financial Corp. . . . . . . . . . . . . . . . . . . . 594 30,009Wintrust Financial Corp. . . . . . . . . . . . . . . . . . . . 378 28,290
(Cost $1,697,376) . . . . . . . . . . . . . . . . . . . . . . . . . 1,805,600
Health Care — 9.3%
Acadia Healthcare Co., Inc.* . . . . . . . . . . . . . . . 582 38,482Amedisys, Inc.* . . . . . . . . . . . . . . . . . . . . . . . . . . 215 39,442Emergent BioSolutions, Inc.* . . . . . . . . . . . . . . 302 19,050Encompass Health Corp. . . . . . . . . . . . . . . . . . . 662 51,934Exelixis, Inc.* . . . . . . . . . . . . . . . . . . . . . . . . . . . . 2,053 39,356Haemonetics Corp.* . . . . . . . . . . . . . . . . . . . . . . 338 21,209Hill-Rom Holdings, Inc. . . . . . . . . . . . . . . . . . . . . 435 63,327ICU Medical, Inc.* . . . . . . . . . . . . . . . . . . . . . . . . 132 26,314Integra LifeSciences Holdings Corp.* . . . . . . . 464 34,907Jazz Pharmaceuticals PLC * . . . . . . . . . . . . . . . . 400 52,684LHC Group, Inc.* . . . . . . . . . . . . . . . . . . . . . . . . . 206 38,473Ligand Pharmaceuticals, Inc.* . . . . . . . . . . . . . . 106 14,024LivaNova PLC * . . . . . . . . . . . . . . . . . . . . . . . . . . 342 28,280Masimo Corp.* . . . . . . . . . . . . . . . . . . . . . . . . . . . 336 91,237Molina Healthcare, Inc.* . . . . . . . . . . . . . . . . . . . 387 104,014Neurocrine Biosciences, Inc.* . . . . . . . . . . . . . . 629 59,881NuVasive, Inc.* . . . . . . . . . . . . . . . . . . . . . . . . . . . 340 21,128Penumbra, Inc.* . . . . . . . . . . . . . . . . . . . . . . . . . . 226 62,139Quidel Corp.* . . . . . . . . . . . . . . . . . . . . . . . . . . . . 252 32,495Syneos Health, Inc.* . . . . . . . . . . . . . . . . . . . . . . 672 62,348Tenet Healthcare Corp.* . . . . . . . . . . . . . . . . . . . 710 53,499United Therapeutics Corp.* . . . . . . . . . . . . . . . . 298 64,034
(Cost $1,010,396) . . . . . . . . . . . . . . . . . . . . . . . . . 1,018,257
Industrials — 18.7%
Acuity Brands, Inc. (a) . . . . . . . . . . . . . . . . . . . . . 238 43,918AECOM* . . . . . . . . . . . . . . . . . . . . . . . . . . . . . . . . 961 63,003AGCO Corp. . . . . . . . . . . . . . . . . . . . . . . . . . . . . . 410 56,424Avis Budget Group, Inc.* (a) . . . . . . . . . . . . . . . 340 30,855Axon Enterprise, Inc.* . . . . . . . . . . . . . . . . . . . . . 429 78,022Brink’s Co. . . . . . . . . . . . . . . . . . . . . . . . . . . . . . . . 326 25,480Carlisle Cos., Inc. . . . . . . . . . . . . . . . . . . . . . . . . . 347 73,127Clean Harbors, Inc.* . . . . . . . . . . . . . . . . . . . . . . 335 34,378Colfax Corp.* . . . . . . . . . . . . . . . . . . . . . . . . . . . . 766 36,898Crane Co. . . . . . . . . . . . . . . . . . . . . . . . . . . . . . . . . 324 32,973Curtiss-Wright Corp. . . . . . . . . . . . . . . . . . . . . . . 274 33,368Donaldson Co., Inc. . . . . . . . . . . . . . . . . . . . . . . . 822 55,690Dycom Industries, Inc.* . . . . . . . . . . . . . . . . . . . 208 15,669EMCOR Group, Inc. . . . . . . . . . . . . . . . . . . . . . . . 359 43,618EnerSys . . . . . . . . . . . . . . . . . . . . . . . . . . . . . . . . . 288 24,362Flowserve Corp. . . . . . . . . . . . . . . . . . . . . . . . . . . 845 32,845FTI Consulting, Inc.* . . . . . . . . . . . . . . . . . . . . . . 224 31,295Graco, Inc. . . . . . . . . . . . . . . . . . . . . . . . . . . . . . . . 1,124 88,144
Numberof Shares Value
Industrials (Continued)
Herman Miller, Inc. . . . . . . . . . . . . . . . . . . . . . . . 477 $ 20,048Hexcel Corp.* . . . . . . . . . . . . . . . . . . . . . . . . . . . . 549 31,134Hubbell, Inc. . . . . . . . . . . . . . . . . . . . . . . . . . . . . . 361 74,406Insperity, Inc. . . . . . . . . . . . . . . . . . . . . . . . . . . . . 247 27,254ITT, Inc. . . . . . . . . . . . . . . . . . . . . . . . . . . . . . . . . . 565 54,054KAR Auction Services, Inc.* . . . . . . . . . . . . . . . . 826 13,968KBR, Inc. . . . . . . . . . . . . . . . . . . . . . . . . . . . . . . . . 920 35,825Kennametal, Inc. . . . . . . . . . . . . . . . . . . . . . . . . . 547 20,337Kirby Corp.* . . . . . . . . . . . . . . . . . . . . . . . . . . . . . 404 21,650Lincoln Electric Holdings, Inc. . . . . . . . . . . . . . . 391 54,588ManpowerGroup, Inc. . . . . . . . . . . . . . . . . . . . . . 364 44,197MasTec, Inc.* . . . . . . . . . . . . . . . . . . . . . . . . . . . . 369 33,741Mercury Systems, Inc.* . . . . . . . . . . . . . . . . . . . 368 18,540Middleby Corp.* . . . . . . . . . . . . . . . . . . . . . . . . . . 370 67,688MSA Safety, Inc. . . . . . . . . . . . . . . . . . . . . . . . . . . 237 38,593Nordson Corp. . . . . . . . . . . . . . . . . . . . . . . . . . . . 358 85,419Oshkosh Corp. . . . . . . . . . . . . . . . . . . . . . . . . . . . 456 52,248Owens Corning . . . . . . . . . . . . . . . . . . . . . . . . . . 682 65,165Regal Beloit Corp. . . . . . . . . . . . . . . . . . . . . . . . . 273 40,792Ryder System, Inc. . . . . . . . . . . . . . . . . . . . . . . . . 353 28,060Science Applications International Corp. . . . . 388 32,681Stericycle, Inc.* . . . . . . . . . . . . . . . . . . . . . . . . . . 596 41,482Terex Corp. . . . . . . . . . . . . . . . . . . . . . . . . . . . . . . 461 23,534Tetra Tech, Inc. . . . . . . . . . . . . . . . . . . . . . . . . . . . 357 51,351Timken Co. . . . . . . . . . . . . . . . . . . . . . . . . . . . . . . 446 32,799Toro Co. . . . . . . . . . . . . . . . . . . . . . . . . . . . . . . . . . 710 78,057Trinity Industries, Inc. . . . . . . . . . . . . . . . . . . . . . 525 15,241Univar Solutions, Inc.* . . . . . . . . . . . . . . . . . . . . 1,114 26,302Werner Enterprises, Inc. . . . . . . . . . . . . . . . . . . . 394 18,581Woodward, Inc. . . . . . . . . . . . . . . . . . . . . . . . . . . 386 46,683XPO Logistics, Inc.* . . . . . . . . . . . . . . . . . . . . . . . 676 58,751
(Cost $1,845,568) . . . . . . . . . . . . . . . . . . . . . . . . . 2,053,238
Information Technology — 14.4%
ACI Worldwide, Inc.* . . . . . . . . . . . . . . . . . . . . . . 777 25,043Alliance Data Systems Corp. . . . . . . . . . . . . . . . 329 32,278Amkor Technology, Inc. . . . . . . . . . . . . . . . . . . . 717 19,696Arrow Electronics, Inc.* . . . . . . . . . . . . . . . . . . . 486 58,913Avnet, Inc. . . . . . . . . . . . . . . . . . . . . . . . . . . . . . . . 667 26,987Belden, Inc. . . . . . . . . . . . . . . . . . . . . . . . . . . . . . . 303 17,347Blackbaud, Inc.* . . . . . . . . . . . . . . . . . . . . . . . . . . 320 22,301Ceridian HCM Holding, Inc.* . . . . . . . . . . . . . . . 871 97,857Ciena Corp.* . . . . . . . . . . . . . . . . . . . . . . . . . . . . . 1,031 58,901CMC Materials, Inc. . . . . . . . . . . . . . . . . . . . . . . . 192 25,463Cognex Corp. . . . . . . . . . . . . . . . . . . . . . . . . . . . . 1,171 103,774Coherent, Inc.* . . . . . . . . . . . . . . . . . . . . . . . . . . . 160 40,427CommVault Systems, Inc.* . . . . . . . . . . . . . . . . 300 24,291Cree, Inc.* . . . . . . . . . . . . . . . . . . . . . . . . . . . . . . . 766 65,095Fair Isaac Corp.* . . . . . . . . . . . . . . . . . . . . . . . . . . 189 86,891First Solar, Inc.* . . . . . . . . . . . . . . . . . . . . . . . . . . 565 53,110Jabil, Inc. . . . . . . . . . . . . . . . . . . . . . . . . . . . . . . . . 889 54,922Littelfuse, Inc. . . . . . . . . . . . . . . . . . . . . . . . . . . . . 161 45,949LiveRamp Holdings, Inc.* . . . . . . . . . . . . . . . . . . 449 22,001Manhattan Associates, Inc.* . . . . . . . . . . . . . . . 423 68,945Maximus, Inc. . . . . . . . . . . . . . . . . . . . . . . . . . . . . 406 35,358National Instruments Corp. . . . . . . . . . . . . . . . . 872 36,467NetScout Systems, Inc.* . . . . . . . . . . . . . . . . . . . 467 12,805
See Notes to Financial Statements. 58

DBX ETF Trust
Schedule of Investments
Xtrackers S&P MidCap 400 ESG ETF (Continued)August 31, 2021
Numberof Shares Value
Information Technology (Continued)
Paylocity Holding Corp.* . . . . . . . . . . . . . . . . . . 250 $ 67,300Qualys, Inc.* . . . . . . . . . . . . . . . . . . . . . . . . . . . . . 226 26,528Semtech Corp.* . . . . . . . . . . . . . . . . . . . . . . . . . . 435 30,415Silicon Laboratories, Inc.* . . . . . . . . . . . . . . . . . 298 46,971SolarEdge Technologies, Inc.* . . . . . . . . . . . . . 345 99,974Synaptics, Inc.* . . . . . . . . . . . . . . . . . . . . . . . . . . 229 43,460SYNNEX Corp. . . . . . . . . . . . . . . . . . . . . . . . . . . . 270 34,309Teradata Corp.* . . . . . . . . . . . . . . . . . . . . . . . . . . 713 38,994Universal Display Corp. . . . . . . . . . . . . . . . . . . . 280 58,405Viasat, Inc.* . . . . . . . . . . . . . . . . . . . . . . . . . . . . . . 457 23,599WEX, Inc.* . . . . . . . . . . . . . . . . . . . . . . . . . . . . . . . 298 54,704Xerox Holdings Corp. . . . . . . . . . . . . . . . . . . . . . 1,063 23,928
(Cost $1,478,076) . . . . . . . . . . . . . . . . . . . . . . . . . 1,583,408
Materials — 7.1%
AptarGroup, Inc. . . . . . . . . . . . . . . . . . . . . . . . . . . 436 58,773Ashland Global Holdings, Inc. . . . . . . . . . . . . . . 363 33,073Avient Corp. . . . . . . . . . . . . . . . . . . . . . . . . . . . . . 612 31,879Cabot Corp. . . . . . . . . . . . . . . . . . . . . . . . . . . . . . . 381 20,345Chemours Co. . . . . . . . . . . . . . . . . . . . . . . . . . . . . 1,079 36,157Cleveland-Cliffs, Inc. * (a) . . . . . . . . . . . . . . . . . . 3,053 71,654Commercial Metals Co. . . . . . . . . . . . . . . . . . . . . 791 25,802Compass Minerals International, Inc. . . . . . . . . 216 14,457Eagle Materials, Inc. . . . . . . . . . . . . . . . . . . . . . . 283 44,386Greif, Inc., Class A . . . . . . . . . . . . . . . . . . . . . . . . 169 10,701Ingevity Corp.* . . . . . . . . . . . . . . . . . . . . . . . . . . . 258 20,741Minerals Technologies, Inc. . . . . . . . . . . . . . . . . 216 16,986Olin Corp. . . . . . . . . . . . . . . . . . . . . . . . . . . . . . . . 940 46,850RPM International, Inc. . . . . . . . . . . . . . . . . . . . . 861 70,852Scotts Miracle-Gro Co. . . . . . . . . . . . . . . . . . . . . 276 43,285Sonoco Products Co. . . . . . . . . . . . . . . . . . . . . . . 660 43,098Steel Dynamics, Inc. . . . . . . . . . . . . . . . . . . . . . . 1,332 89,897United States Steel Corp. (a) . . . . . . . . . . . . . . . 1,765 47,214Valvoline, Inc. . . . . . . . . . . . . . . . . . . . . . . . . . . . . 1,191 35,920Worthington Industries, Inc. . . . . . . . . . . . . . . . 238 13,792
(Cost $695,122) . . . . . . . . . . . . . . . . . . . . . . . . . . . 775,862
Real Estate — 10.5%
American Campus Communities, Inc. REIT . . 906 46,070Brixmor Property Group, Inc. REIT . . . . . . . . . . 1,951 45,751Camden Property Trust REIT . . . . . . . . . . . . . . . 648 97,226CoreSite Realty Corp. REIT . . . . . . . . . . . . . . . . . 279 41,395Corporate Office Properties Trust REIT . . . . . . 756 21,304Cousins Properties, Inc. REIT . . . . . . . . . . . . . . . 969 37,365CyrusOne, Inc. REIT . . . . . . . . . . . . . . . . . . . . . . . 814 62,662Douglas Emmett, Inc. REIT . . . . . . . . . . . . . . . . . 1,091 36,014Healthcare Realty Trust, Inc. REIT . . . . . . . . . . . 920 27,628Highwoods Properties, Inc. REIT . . . . . . . . . . . . 696 31,800Hudson Pacific Properties, Inc. REIT . . . . . . . . . 1,013 26,723JBG SMITH Properties REIT . . . . . . . . . . . . . . . . 743 22,387Jones Lang LaSalle, Inc.* . . . . . . . . . . . . . . . . . . 336 81,456Kilroy Realty Corp. REIT . . . . . . . . . . . . . . . . . . . 694 45,561Life Storage, Inc. REIT . . . . . . . . . . . . . . . . . . . . . 511 63,589Macerich Co. REIT (a) . . . . . . . . . . . . . . . . . . . . . 1,088 18,583Medical Properties Trust, Inc. REIT . . . . . . . . . . 3,908 80,036National Retail Properties, Inc. REIT . . . . . . . . . 1,145 54,513Park Hotels & Resorts, Inc. REIT * . . . . . . . . . . . 1,566 29,973
Numberof Shares Value
Real Estate (Continued)
Pebblebrook Hotel Trust REIT . . . . . . . . . . . . . . 873 $ 19,232PotlatchDeltic Corp. REIT . . . . . . . . . . . . . . . . . . 451 23,429PS Business Parks, Inc. REIT . . . . . . . . . . . . . . . 136 21,383Rayonier, Inc. REIT . . . . . . . . . . . . . . . . . . . . . . . 902 33,176Rexford Industrial Realty, Inc. REIT . . . . . . . . . 893 55,304SL Green Realty Corp. REIT (a) . . . . . . . . . . . . . 457 32,027Spirit Realty Capital, Inc. REIT . . . . . . . . . . . . . . 760 39,345STORE Capital Corp. REIT . . . . . . . . . . . . . . . . . 1,588 57,279
(Cost $1,030,289) . . . . . . . . . . . . . . . . . . . . . . . . . 1,151,211
Utilities — 1.2%
Hawaiian Electric Industries, Inc. . . . . . . . . . . . 717 31,261National Fuel Gas Co. . . . . . . . . . . . . . . . . . . . . . 605 31,345New Jersey Resources Corp. (a) . . . . . . . . . . . . 647 24,159Southwest Gas Holdings, Inc. . . . . . . . . . . . . . . 377 26,507Spire, Inc. . . . . . . . . . . . . . . . . . . . . . . . . . . . . . . . 347 23,145
(Cost $127,635) . . . . . . . . . . . . . . . . . . . . . . . . . . . 136,417
TOTAL COMMON STOCKS
(Cost $10,157,479) . . . . . . . . . . . . . . . . . . . . . . . 10,940,842
SECURITIES LENDING COLLATERAL — 0.0%
DWS Government & Agency SecuritiesPortfolio “DWS Government CashInstitutional Shares”, 0.01% (b)(c)(Cost $1,305) . . . . . . . . . . . . . . . . . . . . . . . . . . . . 1,305 1,305
CASH EQUIVALENTS — 0.1%
DWS Government Money Market Series“Institutional Shares”, 0.04% (b)(Cost $10,177) . . . . . . . . . . . . . . . . . . . . . . . . . . . 10,177 10,177
TOTAL INVESTMENTS — 100.0%(Cost $10,168,961) . . . . . . . . . . . . . . . . . . . . . . . $10,952,324
Other assets and liabilities, net — 0.0% . . . . . . 4,431
NET ASSETS — 100.0% . . . . . . . . . . . . . . . . . . . $10,956,755
See Notes to Financial Statements. 59

DBX ETF Trust
Schedule of Investments
Xtrackers S&P MidCap 400 ESG ETF (Continued)August 31, 2021
A summary of the Fund’s transactions with affiliated investments during the period ended August 31, 2021 is as follows:
Value ($) at2/24/2021
(Commencementof Operations)
PurchasesCost ($)
SalesProceeds ($)
Net RealizedGain/(Loss) ($)
Net Changein UnrealizedAppreciation
(Depreciation)($) Income ($)
Capital GainDistributions ($)
Number ofShares at8/31/2021
Value($) at
8/31/2021
SECURITIES LENDING COLLATERAL — 0.0%DWS Government & Agency Securities Portfolio “DWS Government Cash Institutional Shares”, 0.01% (b)(c)
— 1,305(d) — — — — — 1,305 1,305CASH EQUIVALENTS — 0.1%DWS Government Money Market Series “Institutional Shares”, 0.04% (b)
— 10,147,201 (10,137,024) — — 12 — 10,177 10,177
— 10,148,506 (10,137,024) — — 12 — 11,482 11,482
* Non-income producing security.(a) All or a portion of these securities were on loan. In addition, “Other assets and liabilities, net” may include pending sales that are also on
loan. The value of securities loaned at August 31, 2021 amounted to $457,260, which is 4.2% of net assets.(b) Affiliated fund managed by DWS Investment Management Americas, Inc. The rate shown is the annualized seven-day yield at period end.(c) Represents cash collateral held in connection with securities lending. Income earned by the Fund is net of borrower rebates. In addition,
the Fund held non-cash U.S. Treasury securities collateral having a value of $471,616.(d) Represents the net increase (purchase cost) or decrease (sales proceeds) in the amount invested in cash collateral for the period ended
August 31, 2021.
REIT: Real Estate Investment Trust
Fair Value Measurements
Various inputs are used in determining the value of the Fund’s investments. These inputs are summarized in three broad levels. Level 1includes quoted prices in active markets for identical securities. Level 2 includes other significant observable inputs (including quoted pricesfor similar securities, interest rates, prepayment speeds and credit risk). Level 3 includes significant unobservable inputs (including the Fund’sown assumptions in determining the fair value of investments). The level assigned to the securities valuations may not be an indication of therisk or liquidity associated with investing in those securities.
The following is a summary of the inputs used as of August 31, 2021 in valuing the Fund’s investments. For information on the Fund’s policyregarding the valuation of investments, please refer to the Security Valuation section of Note 2 in the accompanying Notes to FinancialStatements.
Assets Level 1 Level 2 Level 3 Total
Common Stocks (e) . . . . . . . . . . . . . . . . . . . . . . . . . . . . . . . . . . . . . . . . . . . . . . . . . . . . . . . . . . $10,940,842 $ — $ — $10,940,842Short-Term Investments (e) . . . . . . . . . . . . . . . . . . . . . . . . . . . . . . . . . . . . . . . . . . . . . . . . . . 11,482 — — 11,482
TOTAL . . . . . . . . . . . . . . . . . . . . . . . . . . . . . . . . . . . . . . . . . . . . . . . . . . . . . . . . . . . . . . . . . . . . . $10,952,324 $ — $ — $10,952,324
(e) See Schedule of Investments for additional detailed categorizations.
See Notes to Financial Statements. 60

DBX ETF Trust
Schedule of Investments
Xtrackers S&P SmallCap 600 ESG ETFAugust 31, 2021
Numberof Shares Value
COMMON STOCKS — 99.9%
Communication Services — 1.3%
ATN International, Inc. . . . . . . . . . . . . . . . . . . . . 154 $ 7,021Consolidated Communications Holdings,Inc.* . . . . . . . . . . . . . . . . . . . . . . . . . . . . . . . . . . . 1,019 9,446
EW Scripps Co., Class A . . . . . . . . . . . . . . . . . . . 855 15,852Marcus Corp.* . . . . . . . . . . . . . . . . . . . . . . . . . . . 367 5,725Meredith Corp.* . . . . . . . . . . . . . . . . . . . . . . . . . . 585 25,161QuinStreet, Inc.* . . . . . . . . . . . . . . . . . . . . . . . . . 850 15,223Scholastic Corp. . . . . . . . . . . . . . . . . . . . . . . . . . . 500 16,620Shenandoah Telecommunications Co. . . . . . . 630 18,793TechTarget, Inc.* (a) . . . . . . . . . . . . . . . . . . . . . . 352 29,772
(Cost $145,902) . . . . . . . . . . . . . . . . . . . . . . . . . . . 143,613
Consumer Discretionary — 14.3%
Abercrombie & Fitch Co., Class A* . . . . . . . . . . 900 32,184American Axle & Manufacturing Holdings,Inc.* . . . . . . . . . . . . . . . . . . . . . . . . . . . . . . . . . . . 1,689 14,981
American Public Education, Inc.* . . . . . . . . . . . 260 6,838Asbury Automotive Group, Inc.* . . . . . . . . . . . 278 51,775Bed Bath & Beyond, Inc.* (a) . . . . . . . . . . . . . . . 1,541 42,439Big Lots, Inc. (a) . . . . . . . . . . . . . . . . . . . . . . . . . . 461 22,432Bloomin’ Brands, Inc.* . . . . . . . . . . . . . . . . . . . . 1,199 32,121Boot Barn Holdings, Inc.* . . . . . . . . . . . . . . . . . . 417 37,230Brinker International, Inc.* . . . . . . . . . . . . . . . . . 600 31,962Buckle, Inc. . . . . . . . . . . . . . . . . . . . . . . . . . . . . . . 436 16,886Caleres, Inc. . . . . . . . . . . . . . . . . . . . . . . . . . . . . . . 572 14,066Cato Corp., Class A . . . . . . . . . . . . . . . . . . . . . . . 267 4,608Cheesecake Factory, Inc.* . . . . . . . . . . . . . . . . . 674 31,442Chico’s FAS, Inc.* . . . . . . . . . . . . . . . . . . . . . . . . 1,788 9,244Children’s Place, Inc.* . . . . . . . . . . . . . . . . . . . . . 212 18,410Cooper-Standard Holdings, Inc.* . . . . . . . . . . . 236 5,494Designer Brands, Inc., Class A* . . . . . . . . . . . . . 908 13,166Dine Brands Global, Inc.* . . . . . . . . . . . . . . . . . . 274 22,665Ethan Allen Interiors, Inc. . . . . . . . . . . . . . . . . . . 306 7,350Fiesta Restaurant Group, Inc.* . . . . . . . . . . . . . 283 3,399Fossil Group, Inc.* . . . . . . . . . . . . . . . . . . . . . . . . 654 8,764Genesco, Inc.* . . . . . . . . . . . . . . . . . . . . . . . . . . . 199 12,344Gentherm, Inc.* . . . . . . . . . . . . . . . . . . . . . . . . . . 482 41,365G-III Apparel Group Ltd.* . . . . . . . . . . . . . . . . . . 643 19,888Group 1 Automotive, Inc. . . . . . . . . . . . . . . . . . . 250 41,360Guess?, Inc. (a) . . . . . . . . . . . . . . . . . . . . . . . . . . . 562 13,595Hibbett, Inc. . . . . . . . . . . . . . . . . . . . . . . . . . . . . . . 232 22,200Installed Building Products, Inc. . . . . . . . . . . . . 331 41,104iRobot Corp.* (a) . . . . . . . . . . . . . . . . . . . . . . . . . 406 32,935Kontoor Brands, Inc. . . . . . . . . . . . . . . . . . . . . . . 695 37,502La-Z-Boy, Inc. . . . . . . . . . . . . . . . . . . . . . . . . . . . . 666 23,317LCI Industries . . . . . . . . . . . . . . . . . . . . . . . . . . . . 368 52,131Macy’s, Inc.* . . . . . . . . . . . . . . . . . . . . . . . . . . . . . 4,512 101,024MarineMax, Inc.* . . . . . . . . . . . . . . . . . . . . . . . . . 321 15,607MDC Holdings, Inc. . . . . . . . . . . . . . . . . . . . . . . . 804 42,009Meritage Homes Corp.* . . . . . . . . . . . . . . . . . . . 552 61,570ODP Corp.* . . . . . . . . . . . . . . . . . . . . . . . . . . . . . . 764 36,038Oxford Industries, Inc. . . . . . . . . . . . . . . . . . . . . . 248 22,394Perdoceo Education Corp.* . . . . . . . . . . . . . . . . 1,150 12,627Red Robin Gourmet Burgers, Inc.* . . . . . . . . . . 218 5,337Regis Corp.* . . . . . . . . . . . . . . . . . . . . . . . . . . . . . 317 1,718Rent-A-Center, Inc. . . . . . . . . . . . . . . . . . . . . . . . . 858 54,123
Numberof Shares Value
Consumer Discretionary (Continued)
Ruth’s Hospitality Group, Inc.* . . . . . . . . . . . . . 481 $ 9,856Sally Beauty Holdings, Inc.* . . . . . . . . . . . . . . . 1,614 30,004Shake Shack, Inc., Class A* . . . . . . . . . . . . . . . . 491 42,594Shoe Carnival, Inc. . . . . . . . . . . . . . . . . . . . . . . . . 240 9,187Signet Jewelers Ltd. . . . . . . . . . . . . . . . . . . . . . . 779 61,697Sleep Number Corp.* . . . . . . . . . . . . . . . . . . . . . 351 32,471Standard Motor Products, Inc. . . . . . . . . . . . . . 281 12,052Steven Madden Ltd. . . . . . . . . . . . . . . . . . . . . . . 1,110 44,922Sturm Ruger & Co., Inc. . . . . . . . . . . . . . . . . . . . 254 19,860Tupperware Brands Corp.* . . . . . . . . . . . . . . . . 718 17,139Unifi, Inc.* . . . . . . . . . . . . . . . . . . . . . . . . . . . . . . . 198 4,602Universal Electronics, Inc.* . . . . . . . . . . . . . . . . 193 9,750Vera Bradley, Inc.* . . . . . . . . . . . . . . . . . . . . . . . . 296 3,392Vista Outdoor, Inc.* . . . . . . . . . . . . . . . . . . . . . . . 838 34,232Winnebago Industries, Inc. . . . . . . . . . . . . . . . . 488 33,975Wolverine World Wide, Inc. . . . . . . . . . . . . . . . . 1,204 43,175
(Cost $1,465,487) . . . . . . . . . . . . . . . . . . . . . . . . . 1,526,552
Consumer Staples — 4.0%
Andersons, Inc. . . . . . . . . . . . . . . . . . . . . . . . . . . 470 14,279B&G Foods, Inc. (a) . . . . . . . . . . . . . . . . . . . . . . . 928 28,174Calavo Growers, Inc. . . . . . . . . . . . . . . . . . . . . . . 251 11,777Cal-Maine Foods, Inc. . . . . . . . . . . . . . . . . . . . . . 552 19,960Celsius Holdings, Inc.* (a) . . . . . . . . . . . . . . . . . 485 39,654Chefs’ Warehouse, Inc.* . . . . . . . . . . . . . . . . . . . 472 14,269Coca-Cola Consolidated, Inc. . . . . . . . . . . . . . . . 68 27,619Edgewell Personal Care Co. . . . . . . . . . . . . . . . . 775 32,782elf Beauty, Inc.* . . . . . . . . . . . . . . . . . . . . . . . . . . 574 17,765Fresh Del Monte Produce, Inc. . . . . . . . . . . . . . 424 13,941J & J Snack Foods Corp. . . . . . . . . . . . . . . . . . . 222 36,355John B Sanfilippo & Son, Inc. . . . . . . . . . . . . . . 135 11,474Medifast, Inc. . . . . . . . . . . . . . . . . . . . . . . . . . . . . 173 39,427MGP Ingredients, Inc. . . . . . . . . . . . . . . . . . . . . . 184 12,015Seneca Foods Corp., Class A* . . . . . . . . . . . . . . 102 4,995Simply Good Foods Co.* . . . . . . . . . . . . . . . . . . 1,236 44,026SpartanNash Co. (a) . . . . . . . . . . . . . . . . . . . . . . 505 10,857United Natural Foods, Inc.* . . . . . . . . . . . . . . . . 811 29,845USANA Health Sciences, Inc.* . . . . . . . . . . . . . 166 16,107
(Cost $400,271) . . . . . . . . . . . . . . . . . . . . . . . . . . . 425,321
Energy — 2.7%
Callon Petroleum Co.* . . . . . . . . . . . . . . . . . . . . 677 23,133Core Laboratories NV . . . . . . . . . . . . . . . . . . . . . 671 18,493Helix Energy Solutions Group, Inc.* . . . . . . . . 2,139 8,043Helmerich & Payne, Inc. . . . . . . . . . . . . . . . . . . . 1,570 42,264Laredo Petroleum, Inc.* . . . . . . . . . . . . . . . . . . . 138 7,456Par Pacific Holdings, Inc.* . . . . . . . . . . . . . . . . . 750 12,368PBF Energy, Inc., Class A* . . . . . . . . . . . . . . . . . 1,411 14,674Range Resources Corp.* . . . . . . . . . . . . . . . . . . 3,744 54,737Renewable Energy Group, Inc.* (a) . . . . . . . . . 630 30,505SM Energy Co. . . . . . . . . . . . . . . . . . . . . . . . . . . . 1,630 31,133Southwestern Energy Co.* . . . . . . . . . . . . . . . . 9,427 42,893
(Cost $283,552) . . . . . . . . . . . . . . . . . . . . . . . . . . . 285,699
Financials — 17.6%
Ambac Financial Group, Inc.* . . . . . . . . . . . . . . 642 9,046Ameris Bancorp . . . . . . . . . . . . . . . . . . . . . . . . . . 1,006 49,535AMERISAFE, Inc. . . . . . . . . . . . . . . . . . . . . . . . . . 288 16,574
See Notes to Financial Statements. 61

DBX ETF Trust
Schedule of Investments
Xtrackers S&P SmallCap 600 ESG ETF (Continued)August 31, 2021
Numberof Shares Value
Financials (Continued)
Assured Guaranty Ltd. . . . . . . . . . . . . . . . . . . . . 1,086 $ 54,148Banc of California, Inc. . . . . . . . . . . . . . . . . . . . . 624 11,213BankUnited, Inc. . . . . . . . . . . . . . . . . . . . . . . . . . . 1,340 56,320Banner Corp. . . . . . . . . . . . . . . . . . . . . . . . . . . . . . 512 29,286Berkshire Hills Bancorp, Inc. . . . . . . . . . . . . . . . 752 19,274Blucora, Inc.* . . . . . . . . . . . . . . . . . . . . . . . . . . . . 674 11,060Brightsphere Investment Group, Inc. . . . . . . . . 872 23,710Cadence BanCorp . . . . . . . . . . . . . . . . . . . . . . . . 1,852 39,837Capstead Mortgage Corp. REIT . . . . . . . . . . . . . 1,355 9,336Central Pacific Financial Corp. . . . . . . . . . . . . . . 394 9,972City Holding Co. . . . . . . . . . . . . . . . . . . . . . . . . . . 235 18,306Columbia Banking System, Inc. . . . . . . . . . . . . 1,054 38,323Community Bank System, Inc. . . . . . . . . . . . . . 808 59,792Customers Bancorp, Inc.* . . . . . . . . . . . . . . . . . 438 18,138Donnelley Financial Solutions, Inc.* . . . . . . . . 450 15,007Eagle Bancorp, Inc. . . . . . . . . . . . . . . . . . . . . . . . 463 26,715eHealth, Inc.* . . . . . . . . . . . . . . . . . . . . . . . . . . . . 300 11,595Employers Holdings, Inc. . . . . . . . . . . . . . . . . . . 421 17,333Encore Capital Group, Inc.* . . . . . . . . . . . . . . . . 461 22,686Enova International, Inc.* . . . . . . . . . . . . . . . . . . 540 17,809First BanCorp . . . . . . . . . . . . . . . . . . . . . . . . . . . . 3,126 39,794First Financial Bancorp . . . . . . . . . . . . . . . . . . . . 1,386 32,585First Hawaiian, Inc. . . . . . . . . . . . . . . . . . . . . . . . 1,877 52,387First Midwest Bancorp, Inc. . . . . . . . . . . . . . . . . 1,632 30,567Granite Point Mortgage Trust, Inc. REIT . . . . . 770 10,595Great Western Bancorp, Inc. . . . . . . . . . . . . . . . 803 24,861Green Dot Corp., Class A* . . . . . . . . . . . . . . . . . 798 41,688Greenhill & Co., Inc. . . . . . . . . . . . . . . . . . . . . . . . 188 2,771Hanmi Financial Corp. . . . . . . . . . . . . . . . . . . . . . 430 8,290Heritage Financial Corp. . . . . . . . . . . . . . . . . . . . 502 12,776Hilltop Holdings, Inc. . . . . . . . . . . . . . . . . . . . . . . 931 31,161HomeStreet, Inc. . . . . . . . . . . . . . . . . . . . . . . . . . 350 14,297Hope Bancorp, Inc. . . . . . . . . . . . . . . . . . . . . . . . 1,801 24,836Horace Mann Educators Corp. . . . . . . . . . . . . . 598 24,518Independent Bank Corp. (a) . . . . . . . . . . . . . . . . 486 37,276Independent Bank Group, Inc. . . . . . . . . . . . . . . 524 36,905Invesco Mortgage Capital, Inc. REIT (a) . . . . . . 4,158 12,973Investors Bancorp, Inc. . . . . . . . . . . . . . . . . . . . . 3,301 47,237KKR Real Estate Finance Trust, Inc. REIT . . . . . 381 8,127Meta Financial Group, Inc. . . . . . . . . . . . . . . . . . 477 23,464National Bank Holdings Corp., Class A . . . . . . 442 16,575NBT Bancorp, Inc. . . . . . . . . . . . . . . . . . . . . . . . . 646 23,166New York Mortgage Trust, Inc. REIT . . . . . . . . 5,460 24,133NMI Holdings, Inc., Class A* . . . . . . . . . . . . . . . 1,223 27,603Northfield Bancorp, Inc. . . . . . . . . . . . . . . . . . . . 656 11,086Northwest Bancshares, Inc. . . . . . . . . . . . . . . . . 1,827 23,788OFG Bancorp . . . . . . . . . . . . . . . . . . . . . . . . . . . . 764 18,191Old National Bancorp. . . . . . . . . . . . . . . . . . . . . . 2,362 39,351Pacific Premier Bancorp, Inc. . . . . . . . . . . . . . . . 1,362 54,426Palomar Holdings, Inc.* . . . . . . . . . . . . . . . . . . . 313 28,107Park National Corp. (a) . . . . . . . . . . . . . . . . . . . . 204 23,917PennyMac Mortgage Investment TrustREIT . . . . . . . . . . . . . . . . . . . . . . . . . . . . . . . . . . . 1,406 27,290
Piper Sandler Cos. . . . . . . . . . . . . . . . . . . . . . . . . 206 29,442PRA Group, Inc.* . . . . . . . . . . . . . . . . . . . . . . . . . 656 27,552Preferred Bank . . . . . . . . . . . . . . . . . . . . . . . . . . . 190 12,139ProAssurance Corp. . . . . . . . . . . . . . . . . . . . . . . . 783 19,967Provident Financial Services, Inc. . . . . . . . . . . . 1,043 23,019
Numberof Shares Value
Financials (Continued)
Redwood Trust, Inc. REIT . . . . . . . . . . . . . . . . . . 1,627 $ 20,289S&T Bancorp, Inc. . . . . . . . . . . . . . . . . . . . . . . . . 584 17,403Safety Insurance Group, Inc. . . . . . . . . . . . . . . . 204 16,587Seacoast Banking Corp. of Florida . . . . . . . . . . 806 25,744Simmons First National Corp., Class A . . . . . . 1,575 45,754Southside Bancshares, Inc. . . . . . . . . . . . . . . . . 435 16,395Stewart Information Services Corp. . . . . . . . . . 407 25,621Tompkins Financial Corp. . . . . . . . . . . . . . . . . . . 169 13,451Trupanion, Inc.* (a) . . . . . . . . . . . . . . . . . . . . . . . 497 45,515United Community Banks, Inc. . . . . . . . . . . . . . 1,286 38,799United Fire Group, Inc. . . . . . . . . . . . . . . . . . . . . 301 7,814Universal Insurance Holdings, Inc. . . . . . . . . . . 398 5,668Veritex Holdings, Inc. . . . . . . . . . . . . . . . . . . . . . 711 25,546WisdomTree Investments, Inc. (a) . . . . . . . . . . 1,571 9,913WSFS Financial Corp. . . . . . . . . . . . . . . . . . . . . . 676 30,697
(Cost $1,856,547) . . . . . . . . . . . . . . . . . . . . . . . . . 1,877,071
Health Care — 12.3%
Addus HomeCare Corp.* . . . . . . . . . . . . . . . . . . 221 19,872Allscripts Healthcare Solutions, Inc.* (a) . . . . . 2,141 32,886AMN Healthcare Services, Inc.* . . . . . . . . . . . . 677 76,853Amphastar Pharmaceuticals, Inc.* . . . . . . . . . . 558 10,970AngioDynamics, Inc.* . . . . . . . . . . . . . . . . . . . . . 581 16,442Anika Therapeutics, Inc.* . . . . . . . . . . . . . . . . . . 237 10,222Cardiovascular Systems, Inc.* . . . . . . . . . . . . . 566 20,257Coherus Biosciences, Inc.* (a) . . . . . . . . . . . . . . 1,028 16,428Collegium Pharmaceutical, Inc.* . . . . . . . . . . . . 527 10,819Community Health Systems, Inc.* . . . . . . . . . . 1,797 22,121Computer Programs and Systems, Inc.* . . . . . 193 6,865CONMED Corp. . . . . . . . . . . . . . . . . . . . . . . . . . . 418 54,900Corcept Therapeutics, Inc.* . . . . . . . . . . . . . . . . 1,529 32,537CorVel Corp.* . . . . . . . . . . . . . . . . . . . . . . . . . . . . 136 22,414Covetrus, Inc.* . . . . . . . . . . . . . . . . . . . . . . . . . . . 1,459 32,959Cross Country Healthcare, Inc.* . . . . . . . . . . . . 488 10,614CryoLife, Inc.* (a) . . . . . . . . . . . . . . . . . . . . . . . . . 591 15,508Cutera, Inc.* . . . . . . . . . . . . . . . . . . . . . . . . . . . . . 266 13,231Cytokinetics, Inc.* (a) . . . . . . . . . . . . . . . . . . . . . 1,176 38,773Eagle Pharmaceuticals, Inc.* . . . . . . . . . . . . . . . 162 8,646Enanta Pharmaceuticals, Inc.* . . . . . . . . . . . . . . 251 14,357Endo International PLC* . . . . . . . . . . . . . . . . . . . 2,094 4,795Ensign Group, Inc. . . . . . . . . . . . . . . . . . . . . . . . . 741 60,518Glaukos Corp.* . . . . . . . . . . . . . . . . . . . . . . . . . . . 600 35,778Heska Corp.* . . . . . . . . . . . . . . . . . . . . . . . . . . . . . 143 37,938Inogen, Inc.* . . . . . . . . . . . . . . . . . . . . . . . . . . . . . 270 15,981Invacare Corp.* (a) . . . . . . . . . . . . . . . . . . . . . . . . 541 4,577Magellan Health, Inc.* . . . . . . . . . . . . . . . . . . . . 331 31,319Merit Medical Systems, Inc.* . . . . . . . . . . . . . . . 713 51,172Myriad Genetics, Inc.* . . . . . . . . . . . . . . . . . . . . 1,100 39,358Natus Medical, Inc.* . . . . . . . . . . . . . . . . . . . . . . 550 14,586NextGen Healthcare, Inc.* . . . . . . . . . . . . . . . . . 777 11,857Omnicell, Inc.* . . . . . . . . . . . . . . . . . . . . . . . . . . . 627 97,354OraSure Technologies, Inc.* . . . . . . . . . . . . . . . 1,056 11,563Orthofix Medical, Inc.* . . . . . . . . . . . . . . . . . . . . 300 12,720Owens & Minor, Inc. . . . . . . . . . . . . . . . . . . . . . . 1,080 40,262Pacira BioSciences, Inc.* (a) . . . . . . . . . . . . . . . 648 38,420Phibro Animal Health Corp., Class A . . . . . . . . 283 6,874Prestige Consumer Healthcare, Inc.* . . . . . . . . 747 42,870
See Notes to Financial Statements. 62

DBX ETF Trust
Schedule of Investments
Xtrackers S&P SmallCap 600 ESG ETF (Continued)August 31, 2021
Numberof Shares Value
Health Care (Continued)
RadNet, Inc.* . . . . . . . . . . . . . . . . . . . . . . . . . . . . . 621 $ 19,506REGENXBIO, Inc.* . . . . . . . . . . . . . . . . . . . . . . . . 520 16,796Select Medical Holdings Corp. . . . . . . . . . . . . . 1,554 53,722Spectrum Pharmaceuticals, Inc.* . . . . . . . . . . . 2,733 6,423Supernus Pharmaceuticals, Inc.* . . . . . . . . . . . 779 21,446Surmodics, Inc.* . . . . . . . . . . . . . . . . . . . . . . . . . 192 11,533Tabula Rasa HealthCare, Inc.* (a) . . . . . . . . . . . 331 10,364Tactile Systems Technology, Inc.* . . . . . . . . . . 340 15,123Tivity Health, Inc.* . . . . . . . . . . . . . . . . . . . . . . . . 558 12,974US Physical Therapy, Inc. . . . . . . . . . . . . . . . . . . 186 21,836Vanda Pharmaceuticals, Inc.* (a) . . . . . . . . . . . 806 13,492Vericel Corp.* (a) . . . . . . . . . . . . . . . . . . . . . . . . . 681 36,890Xencor, Inc.* . . . . . . . . . . . . . . . . . . . . . . . . . . . . . 780 26,419
(Cost $1,250,000) . . . . . . . . . . . . . . . . . . . . . . . . . 1,312,140
Industrials — 18.1%
AAR Corp.* . . . . . . . . . . . . . . . . . . . . . . . . . . . . . . 497 16,823ABM Industries, Inc. . . . . . . . . . . . . . . . . . . . . . . 983 48,678AeroVironment, Inc.* . . . . . . . . . . . . . . . . . . . . . 321 32,858Alamo Group, Inc. . . . . . . . . . . . . . . . . . . . . . . . . 145 22,476Albany International Corp., Class A . . . . . . . . . 438 34,309Applied Industrial Technologies, Inc. . . . . . . . . 560 49,734ArcBest Corp. . . . . . . . . . . . . . . . . . . . . . . . . . . . . 371 24,757Arcosa, Inc. . . . . . . . . . . . . . . . . . . . . . . . . . . . . . . 702 35,676Astec Industries, Inc. . . . . . . . . . . . . . . . . . . . . . . 333 20,360Atlas Air Worldwide Holdings, Inc.* . . . . . . . . . 392 28,683AZZ, Inc. . . . . . . . . . . . . . . . . . . . . . . . . . . . . . . . . . 352 18,850Barnes Group, Inc. . . . . . . . . . . . . . . . . . . . . . . . . 680 32,416Boise Cascade Co. . . . . . . . . . . . . . . . . . . . . . . . . 560 32,396Brady Corp., Class A . . . . . . . . . . . . . . . . . . . . . . 713 38,024Chart Industries, Inc.* (a) . . . . . . . . . . . . . . . . . . 523 98,523CIRCOR International, Inc.* . . . . . . . . . . . . . . . . 280 10,010Comfort Systems USA, Inc. . . . . . . . . . . . . . . . . 532 40,421CoreCivic, Inc.* . . . . . . . . . . . . . . . . . . . . . . . . . . . 1,735 16,864Deluxe Corp. . . . . . . . . . . . . . . . . . . . . . . . . . . . . . 603 23,125Echo Global Logistics, Inc.* . . . . . . . . . . . . . . . . 372 12,231Encore Wire Corp. . . . . . . . . . . . . . . . . . . . . . . . . 298 25,333Enerpac Tool Group Corp. . . . . . . . . . . . . . . . . . 894 22,493EnPro Industries, Inc. . . . . . . . . . . . . . . . . . . . . . 299 25,567ESCO Technologies, Inc. . . . . . . . . . . . . . . . . . . 372 33,525Exponent, Inc. . . . . . . . . . . . . . . . . . . . . . . . . . . . . 749 87,558Federal Signal Corp. . . . . . . . . . . . . . . . . . . . . . . 891 36,201Forward Air Corp. . . . . . . . . . . . . . . . . . . . . . . . . 390 34,386Franklin Electric Co., Inc. . . . . . . . . . . . . . . . . . . 563 47,844GMS, Inc.* . . . . . . . . . . . . . . . . . . . . . . . . . . . . . . . 622 30,733Granite Construction, Inc. . . . . . . . . . . . . . . . . . . 657 26,635Greenbrier Cos., Inc. (a) . . . . . . . . . . . . . . . . . . . 482 21,256Harsco Corp.* . . . . . . . . . . . . . . . . . . . . . . . . . . . . 1,137 20,739Heartland Express, Inc. . . . . . . . . . . . . . . . . . . . . 682 11,444Heidrick & Struggles International, Inc. . . . . . . 271 11,713Hillenbrand, Inc. . . . . . . . . . . . . . . . . . . . . . . . . . . 1,090 50,598HNI Corp. . . . . . . . . . . . . . . . . . . . . . . . . . . . . . . . . 620 23,492Hub Group, Inc., Class A* . . . . . . . . . . . . . . . . . . 484 33,977Interface, Inc. . . . . . . . . . . . . . . . . . . . . . . . . . . . . 820 11,792John Bean Technologies Corp. . . . . . . . . . . . . . 456 66,526Kaman Corp. . . . . . . . . . . . . . . . . . . . . . . . . . . . . . 418 16,335Kelly Services, Inc., Class A . . . . . . . . . . . . . . . . 468 9,098
Numberof Shares Value
Industrials (Continued)
Lindsay Corp. . . . . . . . . . . . . . . . . . . . . . . . . . . . . 158 $ 26,030Lydall, Inc.* . . . . . . . . . . . . . . . . . . . . . . . . . . . . . . 251 15,557Marten Transport Ltd. . . . . . . . . . . . . . . . . . . . . . 887 13,828Matson, Inc. . . . . . . . . . . . . . . . . . . . . . . . . . . . . . 635 50,273Meritor, Inc.* . . . . . . . . . . . . . . . . . . . . . . . . . . . . . 1,042 24,716Mueller Industries, Inc. . . . . . . . . . . . . . . . . . . . . 815 36,357MYR Group, Inc.* . . . . . . . . . . . . . . . . . . . . . . . . . 242 25,170National Presto Industries, Inc. . . . . . . . . . . . . . 73 6,098Pitney Bowes, Inc. . . . . . . . . . . . . . . . . . . . . . . . . 2,510 18,750Powell Industries, Inc. . . . . . . . . . . . . . . . . . . . . . 139 3,517Proto Labs, Inc.* . . . . . . . . . . . . . . . . . . . . . . . . . . 350 25,956Raven Industries, Inc.* . . . . . . . . . . . . . . . . . . . . 523 30,517SPX Corp.* . . . . . . . . . . . . . . . . . . . . . . . . . . . . . . 656 40,987SPX FLOW, Inc. . . . . . . . . . . . . . . . . . . . . . . . . . . 617 49,687Standex International Corp. . . . . . . . . . . . . . . . . 173 17,168Team, Inc.* . . . . . . . . . . . . . . . . . . . . . . . . . . . . . . 505 2,262Tennant Co. . . . . . . . . . . . . . . . . . . . . . . . . . . . . . . 268 19,827Titan International, Inc.* . . . . . . . . . . . . . . . . . . . 704 5,850Triumph Group, Inc.* . . . . . . . . . . . . . . . . . . . . . 905 16,706UniFirst Corp. . . . . . . . . . . . . . . . . . . . . . . . . . . . . 228 52,228US Ecology, Inc.* . . . . . . . . . . . . . . . . . . . . . . . . . 474 16,993Veritiv Corp.* . . . . . . . . . . . . . . . . . . . . . . . . . . . . 174 15,603Viad Corp.* . . . . . . . . . . . . . . . . . . . . . . . . . . . . . . 286 12,352Vicor Corp.* . . . . . . . . . . . . . . . . . . . . . . . . . . . . . 304 37,504Wabash National Corp. . . . . . . . . . . . . . . . . . . . . 727 11,298Watts Water Technologies, Inc., Class A . . . . . 412 70,687
(Cost $1,813,921) . . . . . . . . . . . . . . . . . . . . . . . . . 1,930,380
Information Technology — 15.4%
8x8, Inc.* . . . . . . . . . . . . . . . . . . . . . . . . . . . . . . . . 1,485 35,863ADTRAN, Inc. . . . . . . . . . . . . . . . . . . . . . . . . . . . . 734 15,164Advanced Energy Industries, Inc. . . . . . . . . . . . 560 50,501Agilysys, Inc.* . . . . . . . . . . . . . . . . . . . . . . . . . . . . 297 16,879Badger Meter, Inc. . . . . . . . . . . . . . . . . . . . . . . . . 424 45,406Benchmark Electronics, Inc. . . . . . . . . . . . . . . . . 508 13,731Bottomline Technologies DE, Inc.* . . . . . . . . . . 563 23,798Cohu, Inc.* . . . . . . . . . . . . . . . . . . . . . . . . . . . . . . 725 25,868CSG Systems International, Inc. . . . . . . . . . . . . 479 23,093CTS Corp. . . . . . . . . . . . . . . . . . . . . . . . . . . . . . . . 487 17,084Diodes, Inc.* . . . . . . . . . . . . . . . . . . . . . . . . . . . . . 616 59,647Ebix, Inc. . . . . . . . . . . . . . . . . . . . . . . . . . . . . . . . . 400 11,512EVERTEC, Inc. . . . . . . . . . . . . . . . . . . . . . . . . . . . . 878 40,608ExlService Holdings, Inc.* . . . . . . . . . . . . . . . . . 482 59,354Extreme Networks, Inc.* . . . . . . . . . . . . . . . . . . . 1,794 19,429Fabrinet* . . . . . . . . . . . . . . . . . . . . . . . . . . . . . . . . 536 55,219FARO Technologies, Inc.* . . . . . . . . . . . . . . . . . 264 18,200FormFactor, Inc.* . . . . . . . . . . . . . . . . . . . . . . . . . 1,131 43,973Ichor Holdings Ltd.* . . . . . . . . . . . . . . . . . . . . . . 414 18,344Insight Enterprises, Inc.* . . . . . . . . . . . . . . . . . . 528 54,326Itron, Inc.* . . . . . . . . . . . . . . . . . . . . . . . . . . . . . . . 658 55,279Knowles Corp.* . . . . . . . . . . . . . . . . . . . . . . . . . . 1,318 26,360Kulicke & Soffa Industries, Inc. . . . . . . . . . . . . . 901 63,241LivePerson, Inc.* (a) . . . . . . . . . . . . . . . . . . . . . . 920 58,972MaxLinear, Inc.* . . . . . . . . . . . . . . . . . . . . . . . . . . 989 51,655Methode Electronics, Inc. . . . . . . . . . . . . . . . . . . 553 25,753MicroStrategy, Inc., Class A* (a) . . . . . . . . . . . . 112 77,762NETGEAR, Inc.* . . . . . . . . . . . . . . . . . . . . . . . . . . 427 15,257
See Notes to Financial Statements. 63

DBX ETF Trust
Schedule of Investments
Xtrackers S&P SmallCap 600 ESG ETF (Continued)August 31, 2021
Numberof Shares Value
Information Technology (Continued)
OneSpan, Inc.* . . . . . . . . . . . . . . . . . . . . . . . . . . . 560 $ 10,791Onto Innovation, Inc.* . . . . . . . . . . . . . . . . . . . . . 708 52,484PDF Solutions, Inc.* . . . . . . . . . . . . . . . . . . . . . . 410 9,233Plantronics, Inc.* . . . . . . . . . . . . . . . . . . . . . . . . . 544 16,200Plexus Corp.* . . . . . . . . . . . . . . . . . . . . . . . . . . . . 409 37,558Power Integrations, Inc. . . . . . . . . . . . . . . . . . . . 871 94,625Progress Software Corp. . . . . . . . . . . . . . . . . . . 644 29,985Rogers Corp.* . . . . . . . . . . . . . . . . . . . . . . . . . . . . 271 57,563Sanmina Corp.* . . . . . . . . . . . . . . . . . . . . . . . . . . 956 37,743ScanSource, Inc.* . . . . . . . . . . . . . . . . . . . . . . . . 356 12,666SPS Commerce, Inc.* . . . . . . . . . . . . . . . . . . . . . 516 69,933TTEC Holdings, Inc. . . . . . . . . . . . . . . . . . . . . . . . 260 27,420TTM Technologies, Inc.* . . . . . . . . . . . . . . . . . . 1,427 19,978Unisys Corp.* . . . . . . . . . . . . . . . . . . . . . . . . . . . . 985 23,847Veeco Instruments, Inc.* (a) . . . . . . . . . . . . . . . . 740 16,865Viavi Solutions, Inc.* . . . . . . . . . . . . . . . . . . . . . . 3,305 53,838Vonage Holdings Corp.* . . . . . . . . . . . . . . . . . . . 3,406 48,025
(Cost $1,530,156) . . . . . . . . . . . . . . . . . . . . . . . . . 1,641,032
Materials — 5.1%
AdvanSix, Inc.* . . . . . . . . . . . . . . . . . . . . . . . . . . 392 14,308Allegheny Technologies, Inc.* . . . . . . . . . . . . . 1,860 33,220American Vanguard Corp. . . . . . . . . . . . . . . . . . 372 5,703Balchem Corp. . . . . . . . . . . . . . . . . . . . . . . . . . . . 466 65,436Carpenter Technology Corp. . . . . . . . . . . . . . . . 705 23,512Century Aluminum Co.* . . . . . . . . . . . . . . . . . . . 751 9,628Clearwater Paper Corp.* . . . . . . . . . . . . . . . . . . . 232 7,538Ferro Corp.* . . . . . . . . . . . . . . . . . . . . . . . . . . . . . 1,186 24,669GCP Applied Technologies, Inc.* . . . . . . . . . . . 718 17,117Glatfelter Corp. . . . . . . . . . . . . . . . . . . . . . . . . . . . 686 10,839Hawkins, Inc. . . . . . . . . . . . . . . . . . . . . . . . . . . . . . 264 10,000Haynes International, Inc. . . . . . . . . . . . . . . . . . . 173 6,790HB Fuller Co. . . . . . . . . . . . . . . . . . . . . . . . . . . . . . 758 51,218Innospec, Inc. . . . . . . . . . . . . . . . . . . . . . . . . . . . . 350 32,760Kaiser Aluminum Corp. . . . . . . . . . . . . . . . . . . . 227 28,661Koppers Holdings, Inc.* . . . . . . . . . . . . . . . . . . . 295 9,706Kraton Corp.* . . . . . . . . . . . . . . . . . . . . . . . . . . . . 467 19,670Livent Corp.* (a) . . . . . . . . . . . . . . . . . . . . . . . . . . 2,305 57,325Mercer International, Inc. . . . . . . . . . . . . . . . . . . 553 6,293Neenah, Inc. . . . . . . . . . . . . . . . . . . . . . . . . . . . . . 236 11,892Stepan Co. . . . . . . . . . . . . . . . . . . . . . . . . . . . . . . . 315 37,031SunCoke Energy, Inc. . . . . . . . . . . . . . . . . . . . . . 1,156 8,034TimkenSteel Corp.* . . . . . . . . . . . . . . . . . . . . . . . 530 7,250Tredegar Corp. . . . . . . . . . . . . . . . . . . . . . . . . . . . 361 4,794Trinseo SA . . . . . . . . . . . . . . . . . . . . . . . . . . . . . . 567 29,444Warrior Met Coal, Inc. . . . . . . . . . . . . . . . . . . . . . 751 16,815
(Cost $540,506) . . . . . . . . . . . . . . . . . . . . . . . . . . . 549,653
Real Estate — 8.3%
Acadia Realty Trust REIT . . . . . . . . . . . . . . . . . . 1,240 26,313Agree Realty Corp. REIT . . . . . . . . . . . . . . . . . . . 996 74,252Alexander & Baldwin, Inc. REIT . . . . . . . . . . . . . 1,067 22,279American Assets Trust, Inc. REIT . . . . . . . . . . . 722 28,750Armada Hoffler Properties, Inc. REIT . . . . . . . . 910 12,221Brandywine Realty Trust REIT . . . . . . . . . . . . . . 2,438 33,839CareTrust REIT, Inc. REIT . . . . . . . . . . . . . . . . . . 1,429 31,424Centerspace REIT . . . . . . . . . . . . . . . . . . . . . . . . . 189 19,123
Numberof Shares Value
Real Estate (Continued)
Chatham Lodging Trust REIT* . . . . . . . . . . . . . 748 $ 8,976Community Healthcare Trust, Inc. REIT . . . . . . 336 16,299DiamondRock Hospitality Co. REIT* . . . . . . . . 3,009 27,201Diversified Healthcare Trust REIT . . . . . . . . . . . 3,538 13,268Easterly Government Properties, Inc. REIT . . . 1,220 26,071Four Corners Property Trust, Inc. REIT . . . . . . 1,086 31,070GEO Group, Inc. REIT . . . . . . . . . . . . . . . . . . . . . 1,777 13,772Getty Realty Corp. REIT . . . . . . . . . . . . . . . . . . . 547 17,302Hersha Hospitality Trust REIT* . . . . . . . . . . . . . 511 4,793Independence Realty Trust, Inc. REIT . . . . . . . 1,457 29,839iStar, Inc. REIT (a) . . . . . . . . . . . . . . . . . . . . . . . . 1,088 28,778Kite Realty Group Trust REIT . . . . . . . . . . . . . . . 1,211 24,535Lexington Realty Trust REIT . . . . . . . . . . . . . . . 4,028 54,499LTC Properties, Inc. REIT . . . . . . . . . . . . . . . . . . 576 19,878Office Properties Income Trust REIT . . . . . . . . 712 18,889Realogy Holdings Corp.* . . . . . . . . . . . . . . . . . . 1,704 29,905Retail Opportunity Investments Corp. REIT . . 1,736 31,387Retail Properties of America, Inc., Class AREIT . . . . . . . . . . . . . . . . . . . . . . . . . . . . . . . . . . . 3,072 40,612
RPT Realty REIT . . . . . . . . . . . . . . . . . . . . . . . . . . 1,135 14,687SITE Centers Corp. REIT . . . . . . . . . . . . . . . . . . . 2,444 39,373Summit Hotel Properties, Inc. REIT* . . . . . . . . 1,607 14,977Tanger Factory Outlet Centers, Inc.REIT (a) . . . . . . . . . . . . . . . . . . . . . . . . . . . . . . . . 1,475 24,662
Uniti Group, Inc. REIT . . . . . . . . . . . . . . . . . . . . . 3,330 43,523Washington Real Estate Investment TrustREIT (a) . . . . . . . . . . . . . . . . . . . . . . . . . . . . . . . . 1,205 30,294
Whitestone REIT . . . . . . . . . . . . . . . . . . . . . . . . . 558 5,474Xenia Hotels & Resorts, Inc. REIT* . . . . . . . . . . 1,626 28,325
(Cost $808,442) . . . . . . . . . . . . . . . . . . . . . . . . . . . 886,590
Utilities — 0.8%
California Water Service Group . . . . . . . . . . . . 733 46,582South Jersey Industries, Inc. (a) . . . . . . . . . . . . 1,626 40,341
(Cost $84,473) . . . . . . . . . . . . . . . . . . . . . . . . . . . . 86,923
TOTAL COMMON STOCKS
(Cost $10,179,257) . . . . . . . . . . . . . . . . . . . . . . . 10,664,974
SECURITIES LENDING COLLATERAL — 0.5%
DWS Government & Agency SecuritiesPortfolio “DWS Government CashInstitutional Shares”, 0.01% (b)(c)(Cost $50,397) . . . . . . . . . . . . . . . . . . . . . . . . . . . 50,397 50,397
CASH EQUIVALENTS — 0.1%
DWS Government Money Market Series“Institutional Shares”, 0.04% (b)(Cost $12,273) . . . . . . . . . . . . . . . . . . . . . . . . . . . 12,273 12,273
TOTAL INVESTMENTS — 100.5%(Cost $10,241,927) . . . . . . . . . . . . . . . . . . . . . . . . $10,727,644Other assets and liabilities, net — (0.5%) . . . . (56,937)
NET ASSETS — 100.0% . . . . . . . . . . . . . . . . . . . $10,670,707
See Notes to Financial Statements. 64

DBX ETF Trust
Schedule of Investments
Xtrackers S&P SmallCap 600 ESG ETF (Continued)August 31, 2021
A summary of the Fund’s transactions with affiliated investments during the period ended August 31, 2021 is as follows:
Value ($) at2/24/2021
(Commencementof Operations)
PurchasesCost ($)
SalesProceeds ($)
Net RealizedGain/(Loss) ($)
Net Changein UnrealizedAppreciation
(Depreciation)($) Income ($)
Capital GainDistributions
($)
Number ofShares at8/31/2021
Value ($) at8/31/2021
SECURITIES LENDING COLLATERAL — 0.5%DWS Government & Agency Securities Portfolio “DWS Government Cash Institutional Shares”, 0.01% (b)(c)
— 50,397(d) — — — 5 — 50,397 50,397
CASH EQUIVALENTS — 0.1%DWS Government Money Market Series “Institutional Shares”, 0.04% (b)
— 10,336,414 (10,324,141) — — 12 — 12,273 12,273
— 10,386,811 (10,324,141) — — 17 — 62,670 62,670
*Non-income producing security.(a) All or a portion of these securities were on loan. In addition, “Other assets and liabilities, net” may include pending sales that are also on
loan. The value of securities loaned at August 31, 2021 amounted to $871,859, which is 8.2% of net assets.(b) Affiliated fund managed by DWS Investment Management Americas, Inc. The rate shown is the annualized seven-day yield at period end.(c) Represents cash collateral held in connection with securities lending. Income earned by the Fund is net of borrower rebates. In addition,
the Fund held non-cash U.S. Treasury securities collateral having a value of $842,400.(d) Represents the net increase (purchase cost) or decrease (sales proceeds) in the amount invested in cash collateral for the period ended
August 31, 2021.
REIT: Real Estate Investment Trust
Fair Value Measurements
Various inputs are used in determining the value of the Fund’s investments. These inputs are summarized in three broad levels. Level 1includes quoted prices in active markets for identical securities. Level 2 includes other significant observable inputs (including quoted pricesfor similar securities, interest rates, prepayment speeds and credit risk). Level 3 includes significant unobservable inputs (including the Fund’sown assumptions in determining the fair value of investments). The level assigned to the securities valuations may not be an indication of therisk or liquidity associated with investing in those securities.
The following is a summary of the inputs used as of August 31, 2021 in valuing the Fund’s investments. For information on the Fund’s policyregarding the valuation of investments, please refer to the Security Valuation section of Note 2 in the accompanying Notes to FinancialStatements.
Assets Level 1 Level 2 Level 3 Total
Common Stocks (e) . . . . . . . . . . . . . . . . . . . . . . . . . . . . . . . . . . . . . . . . . . . . . . . . . . . . . . . . . . $10,664,974 $ — $ — $10,664,974Short-Term Investments (e) . . . . . . . . . . . . . . . . . . . . . . . . . . . . . . . . . . . . . . . . . . . . . . . . . . 62,670 — — 62,670
TOTAL . . . . . . . . . . . . . . . . . . . . . . . . . . . . . . . . . . . . . . . . . . . . . . . . . . . . . . . . . . . . . . . . . . . . . $10,727,644 $ — $ — $10,727,644
(e) See Schedule of Investments for additional detailed categorizations.
See Notes to Financial Statements. 65
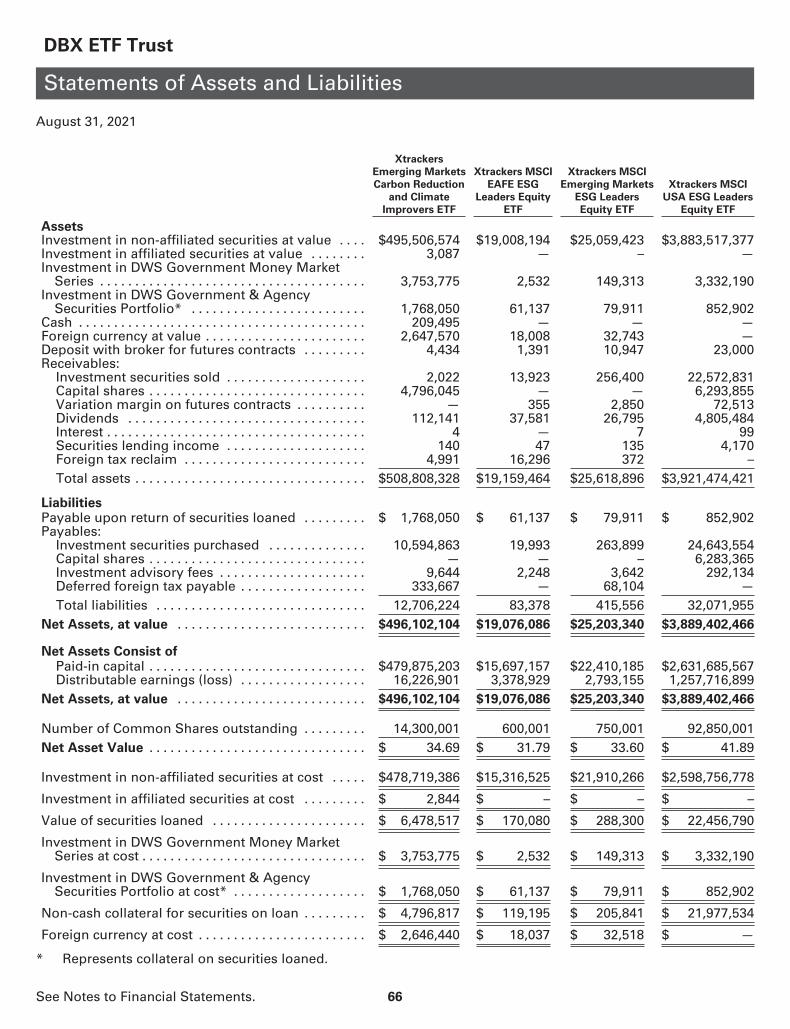
DBX ETF Trust
Statements of Assets and Liabilities
August 31, 2021
Xtrackers
Emerging Markets
Carbon Reduction
and Climate
Improvers ETF
Xtrackers MSCI
EAFE ESG
Leaders Equity
ETF
Xtrackers MSCI
Emerging Markets
ESG Leaders
Equity ETF
Xtrackers MSCI
USA ESG Leaders
Equity ETF
AssetsInvestment in non-affiliated securities at value . . . . $495,506,574 $19,008,194 $25,059,423 $3,883,517,377Investment in affiliated securities at value . . . . . . . . 3,087 — – —Investment in DWS Government Money Market
Series . . . . . . . . . . . . . . . . . . . . . . . . . . . . . . . . . . . . . . 3,753,775 2,532 149,313 3,332,190Investment in DWS Government & Agency
Securities Portfolio* . . . . . . . . . . . . . . . . . . . . . . . . . 1,768,050 61,137 79,911 852,902Cash . . . . . . . . . . . . . . . . . . . . . . . . . . . . . . . . . . . . . . . . . 209,495 — — —Foreign currency at value . . . . . . . . . . . . . . . . . . . . . . . 2,647,570 18,008 32,743 —Deposit with broker for futures contracts . . . . . . . . . 4,434 1,391 10,947 23,000Receivables:
Investment securities sold . . . . . . . . . . . . . . . . . . . . 2,022 13,923 256,400 22,572,831Capital shares . . . . . . . . . . . . . . . . . . . . . . . . . . . . . . . 4,796,045 — — 6,293,855Variation margin on futures contracts . . . . . . . . . . — 355 2,850 72,513Dividends . . . . . . . . . . . . . . . . . . . . . . . . . . . . . . . . . . 112,141 37,581 26,795 4,805,484Interest . . . . . . . . . . . . . . . . . . . . . . . . . . . . . . . . . . . . . 4 — 7 99Securities lending income . . . . . . . . . . . . . . . . . . . . 140 47 135 4,170Foreign tax reclaim . . . . . . . . . . . . . . . . . . . . . . . . . . 4,991 16,296 372 –Total assets . . . . . . . . . . . . . . . . . . . . . . . . . . . . . . . . . $508,808,328 $19,159,464 $25,618,896 $3,921,474,421
LiabilitiesPayable upon return of securities loaned . . . . . . . . . $ 1,768,050 $ 61,137 $ 79,911 $ 852,902Payables:
Investment securities purchased . . . . . . . . . . . . . . 10,594,863 19,993 263,899 24,643,554Capital shares . . . . . . . . . . . . . . . . . . . . . . . . . . . . . . . — — – 6,283,365Investment advisory fees . . . . . . . . . . . . . . . . . . . . . 9,644 2,248 3,642 292,134Deferred foreign tax payable . . . . . . . . . . . . . . . . . . 333,667 — 68,104 —Total liabilities . . . . . . . . . . . . . . . . . . . . . . . . . . . . . . 12,706,224 83,378 415,556 32,071,955
Net Assets, at value . . . . . . . . . . . . . . . . . . . . . . . . . . . $496,102,104 $19,076,086 $25,203,340 $3,889,402,466
Net Assets Consist ofPaid-in capital . . . . . . . . . . . . . . . . . . . . . . . . . . . . . . . $479,875,203 $15,697,157 $22,410,185 $2,631,685,567Distributable earnings (loss) . . . . . . . . . . . . . . . . . . 16,226,901 3,378,929 2,793,155 1,257,716,899
Net Assets, at value . . . . . . . . . . . . . . . . . . . . . . . . . . . $496,102,104 $19,076,086 $25,203,340 $3,889,402,466
Number of Common Shares outstanding . . . . . . . . . 14,300,001 600,001 750,001 92,850,001Net Asset Value . . . . . . . . . . . . . . . . . . . . . . . . . . . . . . . $ 34.69 $ 31.79 $ 33.60 $ 41.89
Investment in non-affiliated securities at cost . . . . . $478,719,386 $15,316,525 $21,910,266 $2,598,756,778
Investment in affiliated securities at cost . . . . . . . . . $ 2,844 $ – $ – $ –
Value of securities loaned . . . . . . . . . . . . . . . . . . . . . . $ 6,478,517 $ 170,080 $ 288,300 $ 22,456,790
Investment in DWS Government Money MarketSeries at cost . . . . . . . . . . . . . . . . . . . . . . . . . . . . . . . . $ 3,753,775 $ 2,532 $ 149,313 $ 3,332,190
Investment in DWS Government & AgencySecurities Portfolio at cost* . . . . . . . . . . . . . . . . . . . $ 1,768,050 $ 61,137 $ 79,911 $ 852,902
Non-cash collateral for securities on loan . . . . . . . . . $ 4,796,817 $ 119,195 $ 205,841 $ 21,977,534
Foreign currency at cost . . . . . . . . . . . . . . . . . . . . . . . . $ 2,646,440 $ 18,037 $ 32,518 $ —
* Represents collateral on securities loaned.
See Notes to Financial Statements. 66

DBX ETF Trust
Statements of Assets and Liabilities (Continued)
August 31, 2021
Xtrackers S&P 500
ESG ETF
Xtrackers S&P
MidCap 400
ESG ETF
Xtrackers S&P
SmallCap 600
ESG ETF
Assets
Investment in non-affiliated securities at value . . . . . . . . . . . . . . . . . . . . $742,531,792 $10,940,842 $10,664,974Investment in DWS Government Money Market Series . . . . . . . . . . . . . 1,353,973 10,177 12,273Investment in DWS Government & Agency Securities Portfolio* . . . . . 107,727 1,305 50,397Deposit with broker for futures contracts . . . . . . . . . . . . . . . . . . . . . . . . . 95,000 — —Receivables:
Capital shares . . . . . . . . . . . . . . . . . . . . . . . . . . . . . . . . . . . . . . . . . . . . . . . 13,983,455 — —Dividends . . . . . . . . . . . . . . . . . . . . . . . . . . . . . . . . . . . . . . . . . . . . . . . . . . 828,826 7,064 6,124Interest . . . . . . . . . . . . . . . . . . . . . . . . . . . . . . . . . . . . . . . . . . . . . . . . . . . . . 53 — —Securities lending income . . . . . . . . . . . . . . . . . . . . . . . . . . . . . . . . . . . . 1,595 47 153
Total assets . . . . . . . . . . . . . . . . . . . . . . . . . . . . . . . . . . . . . . . . . . . . . . . . . $758,902,421 $10,959,435 $10,733,921
Liabilities
Payable upon return of securities loaned . . . . . . . . . . . . . . . . . . . . . . . . . $ 107,727 $ 1,305 $ 50,397Payables:
Investment securities purchased . . . . . . . . . . . . . . . . . . . . . . . . . . . . . . . 13,981,735 — 11,484Investment advisory fees . . . . . . . . . . . . . . . . . . . . . . . . . . . . . . . . . . . . . 59,325 1,375 1,333Variation margin on futures contracts . . . . . . . . . . . . . . . . . . . . . . . . . . 1,500 — —
Total liabilities . . . . . . . . . . . . . . . . . . . . . . . . . . . . . . . . . . . . . . . . . . . . . . 14,150,287 2,680 63,214
Net Assets, at value . . . . . . . . . . . . . . . . . . . . . . . . . . . . . . . . . . . . . . . . . . . $744,752,134 $10,956,755 $10,670,707
Net Assets Consist ofPaid-in capital . . . . . . . . . . . . . . . . . . . . . . . . . . . . . . . . . . . . . . . . . . . . . . . $599,124,936 $10,172,141 $10,142,260Distributable earnings (loss) . . . . . . . . . . . . . . . . . . . . . . . . . . . . . . . . . . 145,627,198 784,614 528,447
Net Assets, at value . . . . . . . . . . . . . . . . . . . . . . . . . . . . . . . . . . . . . . . . . . . $744,752,134 $10,956,755 $10,670,707
Number of Common Shares outstanding . . . . . . . . . . . . . . . . . . . . . . . . . 18,650,001 400,001 400,001
Net Asset Value . . . . . . . . . . . . . . . . . . . . . . . . . . . . . . . . . . . . . . . . . . . . . . . $ 39.93 $ 27.39 $ 26.68
Investment in non-affiliated securities at cost . . . . . . . . . . . . . . . . . . . . . $595,958,173 $10,157,479 $10,179,257
Value of securities loaned . . . . . . . . . . . . . . . . . . . . . . . . . . . . . . . . . . . . . . $ 14,021,303 $ 457,260 $ 871,859
Investment in DWS Government Money Market Series at cost . . . . . . . $ 1,353,973 $ 10,177 $ 12,273
Investment in DWS Government & Agency Securities Portfolio atcost* . . . . . . . . . . . . . . . . . . . . . . . . . . . . . . . . . . . . . . . . . . . . . . . . . . . . . . . $ 107,727 $ 1,305 $ 50,397
Non-cash collateral for securities on loan . . . . . . . . . . . . . . . . . . . . . . . . . $ 14,267,599 $ 471,616 $ 842,400
* Represents collateral on securities loaned.
See Notes to Financial Statements. 67

DBX ETF Trust
Statements of Operations
For the Year Ended August 31, 2021
Xtrackers
Emerging Markets
Carbon Reduction
and Climate
Improvers ETF
Xtrackers MSCI
EAFE ESG
Leaders Equity
ETF
Xtrackers MSCI
Emerging Markets
ESG Leaders
Equity ETF
Xtrackers MSCI
USA ESG Leaders
Equity ETF
Investment Income
Unaffiliated dividend income* . . . . . . . . . . . . . . $ 316,964 $ 391,918 $ 226,951 $ 47,547,335Affiliated dividend income . . . . . . . . . . . . . . . . . . 1,118 — — —Income distributions from affiliated funds . . . . 7 3 28 1,441Affiliated securities lending income . . . . . . . . . . 11 20 6 193Unaffiliated non-cash dividend income . . . . . . . — 37,012 — —Unaffiliated securities lending income, net of
borrower rebates . . . . . . . . . . . . . . . . . . . . . . . . 2,470 2,514 719 102,077
Total investment income . . . . . . . . . . . . . . . . . 320,570 431,467 227,704 47,651,046
Expenses
Investment advisory fees . . . . . . . . . . . . . . . . . . . 23,492 23,314 27,127 3,213,850Other expenses . . . . . . . . . . . . . . . . . . . . . . . . . . . 57 57 177 401
Total expenses . . . . . . . . . . . . . . . . . . . . . . . . . . 23,549 23,371 27,304 3,214,251
Less fees waived (see note 3):Waiver . . . . . . . . . . . . . . . . . . . . . . . . . . . . . . . . . (43) (5) (40) (323,385)
Net expenses . . . . . . . . . . . . . . . . . . . . . . . . . . . 23,506 23,366 27,264 2,890,866
Net investment income (loss) . . . . . . . . . . . . . . . . . 297,064 408,101 200,440 44,760,180
Realized and Unrealized Gain (Loss)
Net realized gain (loss) from:Investments** . . . . . . . . . . . . . . . . . . . . . . . . . . . . (42,017) (138,569) (263,333) (13,859,466)Investments in affiliates . . . . . . . . . . . . . . . . . . . . 7,627 — — —In-kind redemptions . . . . . . . . . . . . . . . . . . . . . . . 1,823,712 393,092 — 92,199,804Futures contracts . . . . . . . . . . . . . . . . . . . . . . . . . . 14,862 14,707 17,095 1,332,245Foreign currency transactions . . . . . . . . . . . . . . . (292,427) (5,054) (17,162) 22
Net realized gain (loss) . . . . . . . . . . . . . . . . . . . . . . . 1,511,757 264,176 (263,400) 79,672,605
Net change in unrealized appreciation(depreciation) on:Investments*** . . . . . . . . . . . . . . . . . . . . . . . . . . . 15,576,200 2,956,968 1,854,655 828,718,505Investments in affiliates . . . . . . . . . . . . . . . . . . . . (1,906) — — —Futures contracts . . . . . . . . . . . . . . . . . . . . . . . . . . (6,111) 171 (1,590) (13,955)Foreign currency translations . . . . . . . . . . . . . . . (5,490) (1,634) 585 —
Net change in unrealized appreciation(depreciation) . . . . . . . . . . . . . . . . . . . . . . . . . . . . . 15,562,693 2,955,505 1,853,650 828,704,550
Net realized and unrealized gain (loss) oninvestments, futures and foreign currencytransactions . . . . . . . . . . . . . . . . . . . . . . . . . . . . . . . 17,074,450 3,219,681 1,590,250 908,377,155
Net Increase (Decrease) in Net Assets Resulting
from Operations . . . . . . . . . . . . . . . . . . . . . . . . . . . $17,371,514 $3,627,782 $1,790,690 $953,137,335
* Unaffiliated foreign tax withheld . . . . . . . . . . . $ 51,583 $ 52,269 $ 29,414 $ 8,710** Net of foreign taxes . . . . . . . . . . . . . . . . . . . . . . $ 2,848 $ — $ 2,637 $ —*** Net of change in deferred foreign taxes . . . . . $ 330,980 $ — $ 63,666 $ —
See Notes to Financial Statements. 68

DBX ETF Trust
Statements of Operations (Continued)
For the Year Ended August 31, 2021
Xtrackers S&P
500 ESG ETF
Xtrackers S&P
MidCap 400
ESG ETF(1)
Xtrackers S&P
SmallCap 600
ESG ETF(1)
Investment Income
Unaffiliated dividend income* . . . . . . . . . . . . . . . . . . . . . . . . . . . . . . . . . . $ 7,263,865 $ 62,861 $ 72,414Income distributions from affiliated funds . . . . . . . . . . . . . . . . . . . . . . . . 281 12 12Affiliated securities lending income . . . . . . . . . . . . . . . . . . . . . . . . . . . . . . 15 — 5Unaffiliated securities lending income, net of borrower rebates . . . . . 12,080 276 792
Total investment income . . . . . . . . . . . . . . . . . . . . . . . . . . . . . . . . . . . . . 7,276,241 63,149 73,223
Expenses
Investment advisory fees . . . . . . . . . . . . . . . . . . . . . . . . . . . . . . . . . . . . . . . 531,466 8,268 8,176Other expenses . . . . . . . . . . . . . . . . . . . . . . . . . . . . . . . . . . . . . . . . . . . . . . . 57 — —
Total expenses . . . . . . . . . . . . . . . . . . . . . . . . . . . . . . . . . . . . . . . . . . . . . . 531,523 8,268 8,176
Less fees waived (see note 3):Waiver . . . . . . . . . . . . . . . . . . . . . . . . . . . . . . . . . . . . . . . . . . . . . . . . . . . . . (48,644) (22) (22)
Net expenses . . . . . . . . . . . . . . . . . . . . . . . . . . . . . . . . . . . . . . . . . . . . . . . 482,879 8,246 8,154
Net investment income (loss) . . . . . . . . . . . . . . . . . . . . . . . . . . . . . . . . . . . . . 6,793,362 54,903 65,069
Realized and Unrealized Gain (Loss)
Net realized gain (loss) from:Investments . . . . . . . . . . . . . . . . . . . . . . . . . . . . . . . . . . . . . . . . . . . . . . . . . . (2,171,431) (16,639) 9,666In-kind redemptions . . . . . . . . . . . . . . . . . . . . . . . . . . . . . . . . . . . . . . . . . . . 24,895,450 148,732 118,830Futures contracts . . . . . . . . . . . . . . . . . . . . . . . . . . . . . . . . . . . . . . . . . . . . . . 248,170 — —
Net realized gain (loss) . . . . . . . . . . . . . . . . . . . . . . . . . . . . . . . . . . . . . . . . . . . 22,972,189 132,093 128,496
Net change in unrealized appreciation (depreciation) on:Investments . . . . . . . . . . . . . . . . . . . . . . . . . . . . . . . . . . . . . . . . . . . . . . . . . . 109,432,495 783,363 485,717Futures contracts . . . . . . . . . . . . . . . . . . . . . . . . . . . . . . . . . . . . . . . . . . . . . . 22,300 — —
Net change in unrealized appreciation (depreciation) . . . . . . . . . . . . . . . . . 109,454,795 783,363 485,717
Net realized and unrealized gain (loss) on investments and futures . . . . 132,426,984 915,456 614,213
Net Increase (Decrease) in Net Assets Resulting from Operations . . . . . $139,220,346 $970,359 $679,282
* Unaffiliated foreign tax withheld . . . . . . . . . . . . . . . . . . . . . . . . . . . . . . . $ 466 $ 39 $ 124
(1) For the period February 24, 2021 (commencement of operations) through August 31, 2021.
See Notes to Financial Statements. 69

DBX ETF Trust
Statements of Changes in Net Assets
Xtrackers Emerging Markets
Carbon Reduction and Climate
Improvers ETF
Xtrackers MSCI EAFE ESG
Leaders Equity ETF
Year EndedAugust 31, 2021
Year EndedAugust 31, 2020
Year EndedAugust 31, 2021
Year EndedAugust 31, 2020
Increase (Decrease) in Net Assets from Operations
Net investment income (loss) . . . . . . . . . . . . . . . . . . . . . . . . . . $ 297,064 $ 203,185 $ 408,101 $ 229,188Net realized gain (loss) . . . . . . . . . . . . . . . . . . . . . . . . . . . . . . . . 1,511,757 (48,254) 264,176 (175,028)Net change in net unrealized appreciation (depreciation) . . 15,562,693 808,500 2,955,505 989,572
Net increase (decrease) in net assets resulting fromoperations . . . . . . . . . . . . . . . . . . . . . . . . . . . . . . . . . . . . . . . . . 17,371,514 963,431 3,627,782 1,043,732
Distributions to Shareholders . . . . . . . . . . . . . . . . . . . . . . . . . . (192,472) (218,581) (404,392) (223,206)
Fund Shares Transactions
Proceeds from shares sold . . . . . . . . . . . . . . . . . . . . . . . . . . . . . 475,859,618 — 5,739,352 3,628,617Value of shares redeemed . . . . . . . . . . . . . . . . . . . . . . . . . . . . . (5,307,482) — (1,567,175) —
Net increase (decrease) in net assets resulting from fundshare transactions . . . . . . . . . . . . . . . . . . . . . . . . . . . . . . . . . . 470,552,136 — 4,172,177 3,628,617
Total net increase (decrease) in Net Assets . . . . . . . . . . . . . . 487,731,178 744,850 7,395,567 4,449,143
Net Assets
Beginning of year . . . . . . . . . . . . . . . . . . . . . . . . . . . . . . . . . . . . . 8,370,926 7,626,076 11,680,519 7,231,376
End of year . . . . . . . . . . . . . . . . . . . . . . . . . . . . . . . . . . . . . . . . . . $496,102,104 $8,370,926 $19,076,086 $11,680,519
Changes in Shares Outstanding
Shares outstanding, beginning of year . . . . . . . . . . . . . . . . . . 300,001 300,001 450,001 300,001Shares sold . . . . . . . . . . . . . . . . . . . . . . . . . . . . . . . . . . . . . . . . . . 14,150,000 — 200,000 150,000Shares redeemed . . . . . . . . . . . . . . . . . . . . . . . . . . . . . . . . . . . . . (150,000) — (50,000) —
Shares outstanding, end of year . . . . . . . . . . . . . . . . . . . . . . . . 14,300,001 300,001 600,001 450,001
See Notes to Financial Statements. 70

DBX ETF Trust
Statements of Changes in Net Assets (Continued)
Xtrackers MSCI Emerging Markets
ESG Leaders Equity ETF
Xtrackers MSCI USA ESG Leaders
Equity ETF
Year EndedAugust 31, 2021
Year EndedAugust 31, 2020
Year EndedAugust 31, 2021
Year EndedAugust 31, 2020
Increase (Decrease) in Net Assets from
Operations
Net investment income (loss) . . . . . . . . . . . . . . . . $ 200,440 $ 258,084 $ 44,760,180 $ 33,012,859Net realized gain (loss) . . . . . . . . . . . . . . . . . . . . . (263,400) (164,600) 79,672,605 4,492,657Net change in net unrealized appreciation
(depreciation) . . . . . . . . . . . . . . . . . . . . . . . . . . . 1,853,650 1,385,759 828,704,550 386,265,567
Net increase (decrease) in net assets resultingfrom operations . . . . . . . . . . . . . . . . . . . . . . . . . 1,790,690 1,479,243 953,137,335 423,771,083
Distributions to Shareholders . . . . . . . . . . . . . . . (82,138) (318,526) (44,278,620) (29,554,714)
Fund Shares Transactions
Proceeds from shares sold . . . . . . . . . . . . . . . . . . 14,924,326 — 610,533,251 1,074,035,689Value of shares redeemed . . . . . . . . . . . . . . . . . . — — (296,434,378) (142,918,766)
Net increase (decrease) in net assets resultingfrom fund share transactions . . . . . . . . . . . . . . 14,924,326 — 314,098,873 931,116,923
Total net increase (decrease) in Net Assets . . . . 16,632,878 1,160,717 1,222,957,588 1,325,333,292
Net Assets
Beginning of year . . . . . . . . . . . . . . . . . . . . . . . . . . 8,570,462 7,409,745 2,666,444,878 1,341,111,586
End of year . . . . . . . . . . . . . . . . . . . . . . . . . . . . . . . $25,203,340 $8,570,462 $3,889,402,466 $2,666,444,878
Changes in Shares Outstanding
Shares outstanding, beginning of year . . . . . . . 300,001 300,001 83,750,001 50,250,001Shares sold . . . . . . . . . . . . . . . . . . . . . . . . . . . . . . . 450,000 — 17,200,000 38,450,000Shares redeemed . . . . . . . . . . . . . . . . . . . . . . . . . . — — (8,100,000) (4,950,000)
Shares outstanding, end of year . . . . . . . . . . . . . 750,001 300,001 92,850,001 83,750,001
See Notes to Financial Statements. 71

DBX ETF Trust
Statements of Changes in Net Assets (Continued)
Xtrackers S&P 500 ESG ETF
Xtrackers S&P
MidCap 400 ESG ETF
Xtrackers S&P
SmallCap 600 ESG
ETF
Year EndedAugust 31, 2021
Year EndedAugust 31, 2020
For the PeriodFebruary 24, 2021(1) to
August 31, 2021
For the PeriodFebruary 24, 2021(1) to
August 31, 2021
Increase (Decrease) in Net Assets from
Operations
Net investment income (loss) . . . . . . . . . . . . . . . . $ 6,793,362 $ 2,350,149 $ 54,903 $ 65,069Net realized gain (loss) . . . . . . . . . . . . . . . . . . . . . . 22,972,189 745,744 132,093 128,496Net change in net unrealized appreciation
(depreciation) . . . . . . . . . . . . . . . . . . . . . . . . . . . . 109,454,795 37,102,920 783,363 485,717
Net increase (decrease) in net assets resultingfrom operations . . . . . . . . . . . . . . . . . . . . . . . . . . 139,220,346 40,198,813 970,359 679,282
Distributions to Shareholders . . . . . . . . . . . . . . . . (5,646,092) (1,693,157) (33,536) (27,800)
Fund Shares Transactions
Proceeds from shares sold . . . . . . . . . . . . . . . . . . . 428,551,169 280,622,402 11,371,328 11,335,683Value of shares redeemed . . . . . . . . . . . . . . . . . . . (87,808,140) (60,077,355) (1,351,421) (1,316,483)
Net increase (decrease) in net assets resultingfrom fund share transactions . . . . . . . . . . . . . . . 340,743,029 220,545,047 10,019,907 10,019,200
Total net increase (decrease) in Net Assets . . . . . 474,317,283 259,050,703 10,956,730 10,670,682
Net Assets
Beginning of period . . . . . . . . . . . . . . . . . . . . . . . . . 270,434,851 11,384,148 25 25
End of period . . . . . . . . . . . . . . . . . . . . . . . . . . . . . . $744,752,134 $270,434,851 $10,956,755 $10,670,707
Changes in Shares Outstanding
Shares outstanding, beginning of period . . . . . . 8,700,001 450,001 1 1Shares sold . . . . . . . . . . . . . . . . . . . . . . . . . . . . . . . . 12,450,000 10,700,000 450,000 450,000Shares redeemed . . . . . . . . . . . . . . . . . . . . . . . . . . . (2,500,000) (2,450,000) (50,000) (50,000)
Shares outstanding, end of period . . . . . . . . . . . . 18,650,001 8,700,001 400,001 400,001
(1) Commencement of Operations.
See Notes to Financial Statements. 72

DBX ETF Trust
Financial Highlights
Xtrackers Emerging Markets Carbon Reduction and Climate Improvers ETF
Selected Per Share Data
Years EndedAugust 31, Period Ended
8/31/2019(a)2021 2020
Net Asset Value, beginning of period . . . . . . . . . . . . . . . . . . . . . . . . . . . . . . . . . . . . . . . . . . $27.90 $25.42 $25.00
Income (loss) from investment operations:Net investment income (loss) (b) . . . . . . . . . . . . . . . . . . . . . . . . . . . . . . . . . . . . . . . . . . . 0.57 0.68 0.60Net realized and unrealized gain (loss) . . . . . . . . . . . . . . . . . . . . . . . . . . . . . . . . . . . . . . . 6.86 2.53 0.27
Total from investment operations . . . . . . . . . . . . . . . . . . . . . . . . . . . . . . . . . . . . . . . . . 7.43 3.21 0.87
Less distributions from:Net investment income . . . . . . . . . . . . . . . . . . . . . . . . . . . . . . . . . . . . . . . . . . . . . . . . . . . . (0.64) (0.73) (0.45)
Total distributions . . . . . . . . . . . . . . . . . . . . . . . . . . . . . . . . . . . . . . . . . . . . . . . . . . . . . . (0.64) (0.73) (0.45)
Net Asset Value, end of period . . . . . . . . . . . . . . . . . . . . . . . . . . . . . . . . . . . . . . . . . . . . . . . $34.69 $27.90 $25.42
Total Return (%) (c) . . . . . . . . . . . . . . . . . . . . . . . . . . . . . . . . . . . . . . . . . . . . . . . . . . . . . . . . . 26.80 12.74 3.44**
Ratios to Average Net Assets and Supplemental Data
Net Assets, end of period ($ millions) . . . . . . . . . . . . . . . . . . . . . . . . . . . . . . . . . . . . . . . . . . 496 8 8Ratio of expenses before fee waiver (%) . . . . . . . . . . . . . . . . . . . . . . . . . . . . . . . . . . . . . 0.16 0.16 0.16*Ratio of expenses after fee waiver (%) . . . . . . . . . . . . . . . . . . . . . . . . . . . . . . . . . . . . . . . 0.16 0.16 0.16*Ratio of net investment income (loss) (%) . . . . . . . . . . . . . . . . . . . . . . . . . . . . . . . . . . . . 1.97 2.61 3.17*
Portfolio turnover rate (%) (d) . . . . . . . . . . . . . . . . . . . . . . . . . . . . . . . . . . . . . . . . . . . . . . . . 17 13 10**
Xtrackers MSCI EAFE ESG Leaders Equity ETF
Selected Per Share Data
Years EndedAugust 31, Period Ended
8/31/2019(e)2021 2020
Net Asset Value, beginning of period . . . . . . . . . . . . . . . . . . . . . . . . . . . . . . . . . . . . . . . . . . $25.96 $24.10 $25.00
Income (loss) from investment operations:Net investment income (loss) (b) . . . . . . . . . . . . . . . . . . . . . . . . . . . . . . . . . . . . . . . . . . . 0.72 0.59 0.78Net realized and unrealized gain (loss) . . . . . . . . . . . . . . . . . . . . . . . . . . . . . . . . . . . . . . . 5.80 1.83 (1.01)
Total from investment operations . . . . . . . . . . . . . . . . . . . . . . . . . . . . . . . . . . . . . . . . . 6.52 2.42 (0.23)
Less distributions from:Net investment income . . . . . . . . . . . . . . . . . . . . . . . . . . . . . . . . . . . . . . . . . . . . . . . . . . . . (0.69) (0.56) (0.66)Net realized gains . . . . . . . . . . . . . . . . . . . . . . . . . . . . . . . . . . . . . . . . . . . . . . . . . . . . . . . . . — — (0.01)
Total distributions . . . . . . . . . . . . . . . . . . . . . . . . . . . . . . . . . . . . . . . . . . . . . . . . . . . . . . (0.69) (0.56) (0.67)
Net Asset Value, end of period . . . . . . . . . . . . . . . . . . . . . . . . . . . . . . . . . . . . . . . . . . . . . . . $31.79 $25.96 $24.10
Total Return (%) (c) . . . . . . . . . . . . . . . . . . . . . . . . . . . . . . . . . . . . . . . . . . . . . . . . . . . . . . . . . 25.28 10.12 (0.91)**
Ratios to Average Net Assets and Supplemental Data
Net Assets, end of period ($ millions) . . . . . . . . . . . . . . . . . . . . . . . . . . . . . . . . . . . . . . . . . . 19 12 7Ratio of expenses before fee waiver (%) . . . . . . . . . . . . . . . . . . . . . . . . . . . . . . . . . . . . . 0.14 0.14 0.14*Ratio of expenses after fee waiver (%) . . . . . . . . . . . . . . . . . . . . . . . . . . . . . . . . . . . . . . . 0.14 0.14 0.14*Ratio of net investment income (loss) (%) . . . . . . . . . . . . . . . . . . . . . . . . . . . . . . . . . . . . 2.45 2.39 3.25*
Portfolio turnover rate (%) (d) . . . . . . . . . . . . . . . . . . . . . . . . . . . . . . . . . . . . . . . . . . . . . . . . 22 16 10**(a) For the period December 6, 2018 (commencement of operations) through August 31, 2019.(b) Based on average shares outstanding during the period.(c) Total Return would have been lower if certain expenses had not been reimbursed by the Advisor.(d) Portfolio turnover rate does not include securities received or delivered from processing creations or
redemptions.(e) For the period September 6, 2018 (commencement of operations) through August 31, 2019.* Annualized.** Not Annualized.
See Notes to Financial Statements. 73

DBX ETF Trust
Financial Highlights (Continued)
Xtrackers MSCI Emerging Markets ESG Leaders Equity ETF
Selected Per Share Data
Years EndedAugust 31, Period Ended
8/31/2019(a)2021 2020
Net Asset Value, beginning of period . . . . . . . . . . . . . . . . . . . . . . . . . . . . . . . . . . . . . . . . . . $28.57 $24.70 $25.00
Income (loss) from investment operations:Net investment income (loss) (b) . . . . . . . . . . . . . . . . . . . . . . . . . . . . . . . . . . . . . . . . . . . 0.49 0.86 0.50Net realized and unrealized gain (loss) . . . . . . . . . . . . . . . . . . . . . . . . . . . . . . . . . . . . . . . 4.77 4.07 (0.53)
Total from investment operations . . . . . . . . . . . . . . . . . . . . . . . . . . . . . . . . . . . . . . . . . 5.26 4.93 (0.03)
Less distributions from:Net investment income . . . . . . . . . . . . . . . . . . . . . . . . . . . . . . . . . . . . . . . . . . . . . . . . . . . . (0.23) (1.06) (0.27)Net realized gains . . . . . . . . . . . . . . . . . . . . . . . . . . . . . . . . . . . . . . . . . . . . . . . . . . . . . . . . . — (0.00)(c) —
Total distributions . . . . . . . . . . . . . . . . . . . . . . . . . . . . . . . . . . . . . . . . . . . . . . . . . . . . . . (0.23) (1.06) (0.27)
Net Asset Value, end of period . . . . . . . . . . . . . . . . . . . . . . . . . . . . . . . . . . . . . . . . . . . . . . . $33.60 $28.57 $24.70
Total Return (%) (d) 18.43 20.32 (0.17)**
Ratios to Average Net Assets and Supplemental Data
Net Assets, end of period ($ millions) . . . . . . . . . . . . . . . . . . . . . . . . . . . . . . . . . . . . . . . 25 9 7Ratio of expenses before fee waiver (%) . . . . . . . . . . . . . . . . . . . . . . . . . . . . . . . . . . . . . 0.20 0.20 0.20*Ratio of expenses after fee waiver (%) . . . . . . . . . . . . . . . . . . . . . . . . . . . . . . . . . . . . . . . 0.20 0.20 0.20*
Ratio of net investment income (loss) (%) . . . . . . . . . . . . . . . . . . . . . . . . . . . . . . . . . . . . . . 1.48 3.38 2.68*Portfolio turnover rate (%) (e) . . . . . . . . . . . . . . . . . . . . . . . . . . . . . . . . . . . . . . . . . . . . . 26 17 16**
Xtrackers MSCI USA ESG Leaders Equity ETF
Selected Per Share Data
Years EndedAugust 31, Period Ended
8/31/2019(f)2021 2020
Net Asset Value, beginning of period . . . . . . . . . . . . . . . . . . . . . . . . . . . . . . . . . . . . . . . . . . $31.84 $26.69 $25.00
Income (loss) from investment operations:Net investment income (loss) (b) . . . . . . . . . . . . . . . . . . . . . . . . . . . . . . . . . . . . . . . . . . . 0.50 0.51 0.24Net realized and unrealized gain (loss) . . . . . . . . . . . . . . . . . . . . . . . . . . . . . . . . . . . . . . . 10.05 5.10 1.57
Total from investment operations . . . . . . . . . . . . . . . . . . . . . . . . . . . . . . . . . . . . . . . . . 10.55 5.61 1.81
Less distributions from:Net investment income . . . . . . . . . . . . . . . . . . . . . . . . . . . . . . . . . . . . . . . . . . . . . . . . . . . . (0.50) (0.46) (0.12)
Total distributions . . . . . . . . . . . . . . . . . . . . . . . . . . . . . . . . . . . . . . . . . . . . . . . . . . . . . . (0.50) (0.46) (0.12)
Net Asset Value, end of period . . . . . . . . . . . . . . . . . . . . . . . . . . . . . . . . . . . . . . . . . . . . . . . $41.89 $31.84 $26.69
Total Return (%) (d) . . . . . . . . . . . . . . . . . . . . . . . . . . . . . . . . . . . . . . . . . . . . . . . . . . . . . . . . . 33.48 21.42 7.23**
Ratios to Average Net Assets and Supplemental Data
Net Assets, end of period ($ millions) . . . . . . . . . . . . . . . . . . . . . . . . . . . . . . . . . . . . . . . . . . 3,889 2,666 1,341Ratio of expenses before fee waiver (%) . . . . . . . . . . . . . . . . . . . . . . . . . . . . . . . . . . . . . 0.10 0.10 0.10*Ratio of expenses after fee waiver (%) . . . . . . . . . . . . . . . . . . . . . . . . . . . . . . . . . . . . . . . 0.09 0.09 0.10*Ratio of net investment income (loss) (%) . . . . . . . . . . . . . . . . . . . . . . . . . . . . . . . . . . . . 1.39 1.83 1.89*
Portfolio turnover rate (%) (e) . . . . . . . . . . . . . . . . . . . . . . . . . . . . . . . . . . . . . . . . . . . . . . . . 12 9 5**(a) For the period December 6, 2018 (commencement of operations) through August 31, 2019.(b) Based on average shares outstanding during the period.(c) Amount represents less than $0.005.(d) Total Return would have been lower if certain expenses had not been reimbursed by the Advisor.(e) Portfolio turnover rate does not include securities received or delivered from processing creations or
redemptions.(f) For the period March 7, 2019 (commencement of operations) through August 31, 2019.* Annualized.** Not Annualized.
See Notes to Financial Statements. 74
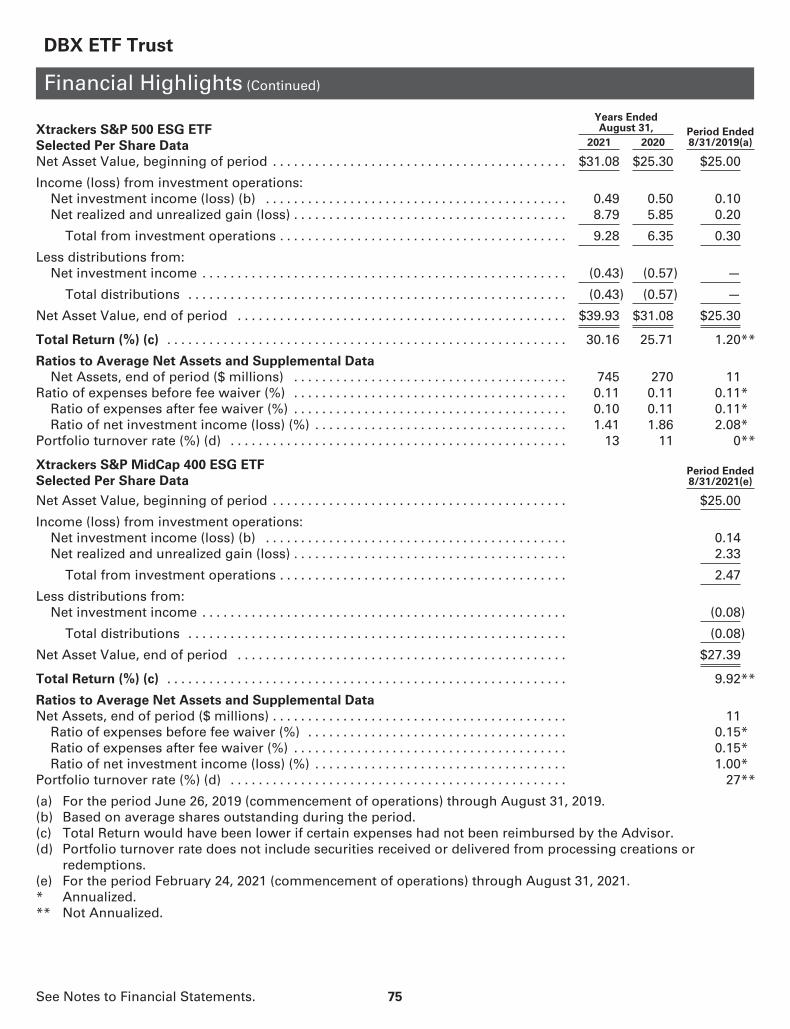
DBX ETF Trust
Financial Highlights (Continued)
Xtrackers S&P 500 ESG ETF
Selected Per Share Data
Years EndedAugust 31, Period Ended
8/31/2019(a)2021 2020
Net Asset Value, beginning of period . . . . . . . . . . . . . . . . . . . . . . . . . . . . . . . . . . . . . . . . . . $31.08 $25.30 $25.00
Income (loss) from investment operations:Net investment income (loss) (b) . . . . . . . . . . . . . . . . . . . . . . . . . . . . . . . . . . . . . . . . . . . 0.49 0.50 0.10Net realized and unrealized gain (loss) . . . . . . . . . . . . . . . . . . . . . . . . . . . . . . . . . . . . . . . 8.79 5.85 0.20
Total from investment operations . . . . . . . . . . . . . . . . . . . . . . . . . . . . . . . . . . . . . . . . . 9.28 6.35 0.30
Less distributions from:Net investment income . . . . . . . . . . . . . . . . . . . . . . . . . . . . . . . . . . . . . . . . . . . . . . . . . . . . (0.43) (0.57) —
Total distributions . . . . . . . . . . . . . . . . . . . . . . . . . . . . . . . . . . . . . . . . . . . . . . . . . . . . . . (0.43) (0.57) —
Net Asset Value, end of period . . . . . . . . . . . . . . . . . . . . . . . . . . . . . . . . . . . . . . . . . . . . . . . $39.93 $31.08 $25.30
Total Return (%) (c) . . . . . . . . . . . . . . . . . . . . . . . . . . . . . . . . . . . . . . . . . . . . . . . . . . . . . . . . . 30.16 25.71 1.20**
Ratios to Average Net Assets and Supplemental Data
Net Assets, end of period ($ millions) . . . . . . . . . . . . . . . . . . . . . . . . . . . . . . . . . . . . . . . 745 270 11Ratio of expenses before fee waiver (%) . . . . . . . . . . . . . . . . . . . . . . . . . . . . . . . . . . . . . . . 0.11 0.11 0.11*
Ratio of expenses after fee waiver (%) . . . . . . . . . . . . . . . . . . . . . . . . . . . . . . . . . . . . . . . 0.10 0.11 0.11*Ratio of net investment income (loss) (%) . . . . . . . . . . . . . . . . . . . . . . . . . . . . . . . . . . . . 1.41 1.86 2.08*
Portfolio turnover rate (%) (d) . . . . . . . . . . . . . . . . . . . . . . . . . . . . . . . . . . . . . . . . . . . . . . . . 13 11 0**
Xtrackers S&P MidCap 400 ESG ETF
Selected Per Share DataPeriod Ended8/31/2021(e)
Net Asset Value, beginning of period . . . . . . . . . . . . . . . . . . . . . . . . . . . . . . . . . . . . . . . . . . $25.00
Income (loss) from investment operations:Net investment income (loss) (b) . . . . . . . . . . . . . . . . . . . . . . . . . . . . . . . . . . . . . . . . . . . 0.14Net realized and unrealized gain (loss) . . . . . . . . . . . . . . . . . . . . . . . . . . . . . . . . . . . . . . . 2.33
Total from investment operations . . . . . . . . . . . . . . . . . . . . . . . . . . . . . . . . . . . . . . . . . 2.47
Less distributions from:Net investment income . . . . . . . . . . . . . . . . . . . . . . . . . . . . . . . . . . . . . . . . . . . . . . . . . . . . (0.08)
Total distributions . . . . . . . . . . . . . . . . . . . . . . . . . . . . . . . . . . . . . . . . . . . . . . . . . . . . . . (0.08)
Net Asset Value, end of period . . . . . . . . . . . . . . . . . . . . . . . . . . . . . . . . . . . . . . . . . . . . . . . $27.39
Total Return (%) (c) . . . . . . . . . . . . . . . . . . . . . . . . . . . . . . . . . . . . . . . . . . . . . . . . . . . . . . . . . 9.92**
Ratios to Average Net Assets and Supplemental Data
Net Assets, end of period ($ millions) . . . . . . . . . . . . . . . . . . . . . . . . . . . . . . . . . . . . . . . . . . 11Ratio of expenses before fee waiver (%) . . . . . . . . . . . . . . . . . . . . . . . . . . . . . . . . . . . . . 0.15*Ratio of expenses after fee waiver (%) . . . . . . . . . . . . . . . . . . . . . . . . . . . . . . . . . . . . . . . 0.15*Ratio of net investment income (loss) (%) . . . . . . . . . . . . . . . . . . . . . . . . . . . . . . . . . . . . 1.00*
Portfolio turnover rate (%) (d) . . . . . . . . . . . . . . . . . . . . . . . . . . . . . . . . . . . . . . . . . . . . . . . . 27**
(a) For the period June 26, 2019 (commencement of operations) through August 31, 2019.(b) Based on average shares outstanding during the period.(c) Total Return would have been lower if certain expenses had not been reimbursed by the Advisor.(d) Portfolio turnover rate does not include securities received or delivered from processing creations or
redemptions.(e) For the period February 24, 2021 (commencement of operations) through August 31, 2021.* Annualized.** Not Annualized.
See Notes to Financial Statements. 75

DBX ETF Trust
Financial Highlights (Continued)
Xtrackers S&P SmallCap 600 ESG ETF
Selected Per Share DataPeriod Ended8/31/2021(a)
Net Asset Value, beginning of period . . . . . . . . . . . . . . . . . . . . . . . . . . . . . . . . . . . . . . . . . . . . . . . . . . . . . . . . . $25.00
Income (loss) from investment operations:Net investment income (loss) (b) . . . . . . . . . . . . . . . . . . . . . . . . . . . . . . . . . . . . . . . . . . . . . . . . . . . . . . . . . . . 0.16Net realized and unrealized gain (loss) . . . . . . . . . . . . . . . . . . . . . . . . . . . . . . . . . . . . . . . . . . . . . . . . . . . . . . 1.59
Total from investment operations . . . . . . . . . . . . . . . . . . . . . . . . . . . . . . . . . . . . . . . . . . . . . . . . . . . . . . . . 1.75
Less distributions from:Net investment income . . . . . . . . . . . . . . . . . . . . . . . . . . . . . . . . . . . . . . . . . . . . . . . . . . . . . . . . . . . . . . . . . . . (0.07)
Total distributions . . . . . . . . . . . . . . . . . . . . . . . . . . . . . . . . . . . . . . . . . . . . . . . . . . . . . . . . . . . . . . . . . . . . . . (0.07)
Net Asset Value, end of period . . . . . . . . . . . . . . . . . . . . . . . . . . . . . . . . . . . . . . . . . . . . . . . . . . . . . . . . . . . . . . . $26.68
Total Return (%) (c) . . . . . . . . . . . . . . . . . . . . . . . . . . . . . . . . . . . . . . . . . . . . . . . . . . . . . . . . . . . . . . . . . . . . . . . . . 7.01**
Ratios to Average Net Assets and Supplemental Data
Net Assets, end of period ($ millions) . . . . . . . . . . . . . . . . . . . . . . . . . . . . . . . . . . . . . . . . . . . . . . . . . . . . . . . . . 11Ratio of expenses before fee waiver (%) . . . . . . . . . . . . . . . . . . . . . . . . . . . . . . . . . . . . . . . . . . . . . . . . . . . . . 0.15*Ratio of expenses after fee waiver (%) . . . . . . . . . . . . . . . . . . . . . . . . . . . . . . . . . . . . . . . . . . . . . . . . . . . . . . 0.15*Ratio of net investment income (loss) (%) . . . . . . . . . . . . . . . . . . . . . . . . . . . . . . . . . . . . . . . . . . . . . . . . . . . 1.19*
Portfolio turnover rate (%) (d) . . . . . . . . . . . . . . . . . . . . . . . . . . . . . . . . . . . . . . . . . . . . . . . . . . . . . . . . . . . . . . . . 25**
(a) For the period February 24, 2021 (commencement of operations) through August 31, 2021.(b) Based on average shares outstanding during the period.(c) Total Return would have been lower if certain expenses had not been reimbursed by the Advisor.(d) Portfolio turnover rate does not include securities received or delivered from processing creations or
redemptions.* Annualized.** Not Annualized.
See Notes to Financial Statements. 76

DBX ETF Trust
Notes to Financial Statements
1. Organization
DBX ETF Trust (the “Trust”) is registered under the Investment Company Act of 1940, as amended (the “Act”), asan open-end registered management investment company organized as a Delaware statutory trust.
As of August 31, 2021, the Trust consists of thirty-five investment series of exchange-traded funds (“ETFs”) (eacha “Fund” and collectively, the “Funds”) in operation and trading. These financial statements report on the Fundslisted below:
Xtrackers Emerging Markets Carbon Reduction and Climate Improvers ETF*Xtrackers MSCI EAFE ESG Leaders Equity ETFXtrackers MSCI Emerging Markets ESG Leaders Equity ETFXtrackers MSCI USA ESG Leaders Equity ETFXtrackers S&P 500 ESG ETFXtrackers S&P MidCap 400 ESG ETFXtrackers S&P SmallCap 600 ESG ETF
DBX Advisors LLC (“DBX” or the “Advisor”), an indirect, wholly-owned subsidiary of DWS Group GmbH & Co.KGaA (“DWS Group”), serves as investment advisor to the Funds and has overall responsibility for the generalmanagement and administration of the Funds, subject to the supervision of the Funds’ Board of Trustees(“Board”).
Each Fund offers shares that are listed and traded on the NYSE Arca, Inc. (“NYSE Arca”). Unlike conventionalmutual funds, each Fund issues and redeems shares on a continuous basis, at net asset value (“NAV”), only inlarge specified lots consisting of 50,000 shares, each called a “Creation Unit”, to authorized participants who haveentered into agreements with the Funds’ distributor. Shares are not individually redeemable securities of theFunds, and owners of the shares may acquire those shares from the Funds, or tender such shares for redemptionto the Funds, in Creation Units only.
The investment objective of each Fund is to track the performance, before fees and expenses, of a particular index(the “Underlying Index”). The underlying indices for the Funds are:Fund Underlying Index
Xtrackers Emerging Markets Carbon Reduction and ClimateImprovers ETF*
Solactive ISS Emerging Markets Carbon Reduction& Climate Improvers Index NTR*
Xtrackers MSCI EAFE ESG Leaders Equity ETFXtrackers MSCI Emerging Markets ESG Leaders Equity ETFXtrackers MSCI USA ESG Leaders Equity ETFXtrackers S&P 500 ESG ETF
MSCI EAFE ESG Leaders IndexMSCI Emerging Markets ESG Leaders IndexMSCI USA ESG Leaders IndexS&P 500 ESG Index
Xtrackers S&P MidCap 400 ESG ETF S&P MidCap 400 ESG IndexXtrackers S&P SmallCap 600 ESG ETF S&P SmallCap 600 ESG Index
* On August 18, 2021, the Fund changed its name from Xtrackers MSCI ACWI ex USA ESG Leaders Equity ETFto Xtrackers Emerging Markets Carbon Reduction and Climate Improvers ETF and its Underlying Index fromMSCI ACWI ex USA ESG Leaders Index to the Solactive ISS Emerging Markets Carbon Reduction & ClimateImprovers Index NTR.
The Solactive ISS Emerging Markets Carbon Reduction & Climate Improvers Index NTR is comprised of large andmid-capitalization companies in emerging markets countries that meet certain environmental, social andgovernance (“ESG”) criteria and/or have committed to greenhouse gas emissions reduction targets. TheUnderlying Index is then weighted in such a manner seeking to align its constituent companies’ greenhouse gasemissions with the long-term global warming target of the Paris Climate Agreement. Under normalcircumstances, the Underlying Index is rebalanced semi-annually in February and August, and thus the Fundupdates and rebalances its portfolio in a corresponding fashion.
The MSCI EAFE ESG Leaders Index is a capitalization weighted index that provides exposure to companies withhigh ESG performance relative to their sector peers. The Underlying Index consists of large- and medium-capitalization companies across developed markets countries, excluding Canada and the United States. Theannual review of the Underlying Index takes place in May and it is rebalanced in August, November and February,and thus the Fund updates and rebalances its portfolio in a corresponding fashion.
77

DBX ETF Trust
Notes to Financial Statements (Continued)
The MSCI Emerging Markets ESG Leaders Index is a capitalization weighted index that provides exposure tocompanies with high ESG performance relative to their sector peers. The Underlying Index consists of large- andmedium-capitalization companies across emerging markets countries. The annual review of the Underlying Indextakes place in May and it is rebalanced in August, November and February, and thus the Fund updates andrebalances its portfolio in a corresponding fashion.
MSCI USA ESG Leaders Index is a capitalization weighted index that provides exposure to companies with highESG performance relative to their sector peers. The Underlying Index consists of large- and medium-capitalizationcompanies in the U.S market. The annual review of the Underlying Index takes place in May and it is rebalancedin August, November and February, and thus the Fund updates and rebalances its portfolio in a correspondingfashion.
S&P 500 ESG Index is a broad-based, market capitalization weighted index that provides exposure to companieswith high ESG performance relative to their sector peers, while maintaining similar overall industry groupweights as the S&P 500 Index. Under normal circumstances, the Underlying Index is rebalanced annually,effective after the close of the last business day of April. The Fund rebalances its portfolio in accordance with theUnderlying Index, and therefore, any changes to the Underlying Index’s rebalance schedule will result incorresponding changes to the Fund’s rebalance schedule.
S&P MidCap 400 ESG Index is a broad-based, market capitalization weighted index that provides exposure tocompanies with high ESG performance relative to their sector peers, while maintaining similar overall industrygroup weights as the S&P MidCap 400 Index. Under normal circumstances, the Underlying Index is rebalancedannually, effective after the close of the last business day of April. The Fund rebalances its portfolio in accordancewith the Underlying Index, and, therefore, any changes to the Underlying Index’s rebalance schedule will result incorresponding changes to the Fund’s rebalance schedule.
S&P SmallCap 600 ESG is a broad-based, market capitalization weighted index that provides exposure tocompanies with high ESG performance relative to their sector peers, while maintaining similar overall industrygroup weights as the S&P SmallCap 600 Index. Under normal circumstances, the Underlying Index is rebalancedannually, effective after the close of the last business day of April. The Fund rebalances its portfolio in accordancewith the Underlying Index, and, therefore, any changes to the Underlying Index’s rebalance schedule will result incorresponding changes to the Fund’s rebalance schedule.
Each Fund is entitled to use its respective Underlying Index pursuant to a licensing agreement between the IndexProvider and DBX. There is no charge to the Funds in connection with these licensing agreements.
Each Fund, except Xtrackers MSCI EAFE ESG Leaders Equity ETF (effective September 13, 2021), is non-diversifiedand is not limited by the Act with regard to the percentage of its assets that may be invested in the securities of asingle issuer. This means the securities of a particular issuer (or securities of issuers in particular industries) maydominate the Underlying Index of the Fund and, consequently, the Fund’s investment portfolio. This mayadversely affect the Fund’s performance or subject the Fund’s shares to greater price volatility than thatexperienced by more diversified investment companies. Each Fund may change its diversification status overtime and then change it back again, without shareholder approval, solely as a result of a change in relative marketcapitalization or index weighting of one or more constituents of the index each Fund tracks.
Pursuant to the Trust’s organizational documents, the Trust’s officers and trustees are indemnified against certainliabilities that may arise out of the performance of their duties to the Funds. Additionally, in the normal course ofbusiness the Trust enters into contracts that contain a variety of representations that provide indemnification forcertain liabilities. The Trust’s maximum exposure under these arrangements is unknown, as this would involvefuture claims that may be made against the Funds that have not yet occurred. However, the Trust expects the riskof loss to be remote.
2. Significant Accounting Policies
The financial statements have been prepared in conformity with U.S. generally accepted accounting principles(“U.S. GAAP”), which require management to make certain estimates and assumptions that affect the reportedamounts and disclosures in the financial statements. Actual results could differ from those estimates. Each Fund
78

DBX ETF Trust
Notes to Financial Statements (Continued)
qualifies as an investment company under Topic 946 of Accounting Standards Codification of U.S. GAAP. Thefollowing is a summary of significant accounting policies followed by the Funds.
Security Valuation The NAV of each Fund’s shares is calculated each business day as of the close of regulartrading on the New York Stock Exchange, generally 4:00 p.m. Eastern Time. NAV per share is calculated bydividing a Fund’s net assets by the number of Fund shares outstanding.
Various inputs are used in determining the value of the Funds’ investments. These inputs are summarized in threebroad levels. Level 1 includes quoted prices in active markets for identical securities. Level 2 includes othersignificant observable inputs (including quoted prices for similar securities, interest rates, prepayment speeds,and credit risk). Level 3 includes significant unobservable inputs (including the Funds’ own assumptions indetermining the fair value of investments). The level assigned to the securities valuations may not be anindication of the risk or liquidity associated with investing in those securities.
Equity securities and ETFs are valued at the most recent sale price or official closing price reported on theexchange (U.S. or foreign) or over-the-counter market on which they trade. Securities or ETFs for which no salesare reported are valued at the calculated mean between the most recent bid and asked quotations on the relevantmarket or, if a mean cannot be determined, at the most recent bid quotation. Equity securities and ETFs aregenerally categorized as Level 1.
Corporate and sovereign debt securities are valued at prices supplied by independent pricing services approvedby the Funds’ Board. Such services may use various pricing techniques which take into account appropriatefactors such as yield, quality, coupon rate, maturity, type of issue, trading characteristics and other data, as wellas broker quotes. If the pricing services are unable to provide valuations, securities are valued at the meanbetween the bid and ask quotations or evaluated prices, as applicable, obtained from broker dealers. Thesesecurities are generally categorized as Level 2
Investments in open-end investment companies are valued at their NAV each business day and are categorized asLevel 1.
Futures contracts are generally valued at the settlement prices established each day on the exchange on whichthey are traded and are categorized as Level 1.
Securities and other assets for which market quotations are not readily available or for which the above valuationprocedures are deemed not to reflect fair value are valued in a manner that is intended to reflect their fair value asdetermined in accordance with procedures approved by the Board and are generally categorized as Level 3. Inaccordance with the Funds’ valuation procedures, factors considered in determining value may include, but arenot limited to, the type of the security; the size of the holding; the initial cost of the security; the existence of anycontractual restrictions on the security’s disposition; the price and extent of public trading in similar securities ofthe issuer or of comparable companies; quotations or evaluated prices from broker-dealers and/or pricingservices; information obtained from the issuer, analysts, and/or the appropriate stock exchange (for exchange-traded securities); an analysis of the company’s or issuer’s financial statements; an evaluation of the forces thatinfluence the issuer and the market(s) in which the security is purchased and sold; and with respect to debtsecurities, the maturity, coupon, creditworthiness, currency denomination and the movement of the market inwhich the security is normally traded. The value determined under these procedures may differ from publishedvalues for the same securities.
Fair value pricing could result in a difference between the prices used to calculate a Fund’s NAV and the pricesused by the Fund’s Underlying Index, which in turn could result in a difference between the Fund’s performanceand the performance of the Fund’s Underlying Index.
Disclosure about the classification of the fair value measurements is included in a table following the Fund’sSchedule of Investments.
Cash Cash consists of cash held at banks and is on deposit with major financial institutions.
Investment Transactions and Investment Income Investment transactions are recorded as of the date that thesecurities are purchased or sold (trade date). Realized gains and losses from the sale or disposition of securitiesare calculated on the identified cost-method. Dividend income is net of any foreign taxes withheld at source.
79

DBX ETF Trust
Notes to Financial Statements (Continued)
Certain dividends from foreign securities may be recorded subsequent to the ex-dividend date as soon as thefund is informed of such dividends. Interest income is recorded on the accrual basis. Distributions received fromforeign domiciled corporations, generally determined to be passive foreign investment companies for taxreporting purposes, are included in dividend income.
Tax Information and Dividends and Distributions to Shareholders It is each Fund’s policy to comply with allrequirements of the Internal Revenue Code of 1986, as amended (“the Code”). Each Fund intends to qualify forand to elect treatment as a separate Regulated Investment Company (“RIC”) under Subchapter M of the Code. It isthe policy of Xtrackers Emerging Markets Carbon Reduction and Climate Improvers ETF, Xtrackers MSCI EAFEESG Leaders Equity ETF and Xtrackers MSCI Emerging Markets ESG Leaders Equity ETF to pay out dividendsfrom its net investment income, if any, to investors semi-annually. It is the policy of Xtrackers MSCI USA ESGLeaders Equity ETF, Xtrackers S&P 500 ESG ETF, Xtrackers S&P MidCap 400 ESG ETF and Xtrackers S&PSmallCap 600 ESG ETF to pay out dividends from its net investment income, if any, to investors quarterly.Taxable net realized gains from investment transactions, reduced by capital loss carryforwards, if any, aredeclared and distributed to shareholders at least annually. The capital loss carryforward amount, if any, isavailable to offset future net capital gains. The Funds may occasionally be required to make supplementaldistributions at some other time during the year. The Funds reserve the right to declare special distributions if, intheir reasonable discretion, such action is necessary or advisable to preserve the status of each Fund as a RIC orto avoid imposition of income or excise taxes on undistributed income. Dividends and distributions toshareholders, if any, are recorded on the ex-dividend date. The amount of dividends and distributions from netinvestment income and net realized capital gains are determined in accordance with Federal income taxregulations which may differ from U.S. GAAP. These “book/tax” differences are either considered temporary orpermanent in nature. To the extent these differences are permanent in nature, such amounts are reclassified atthe end of the year within the components of net assets based on their federal tax treatment; temporarydifferences do not require reclassification. Dividends and distributions, which exceed earnings and profits for thefull year for tax purposes, are reported as a tax return of capital.
In accordance with U.S. GAAP requirements regarding accounting for uncertainties in income taxes, managementhas analyzed the Funds’ tax positions taken or expected to be taken on foreign, federal and state income taxreturns for all open tax years and has concluded that no provision for income tax is required in the Funds’financial statements.
The Funds recognize interest and penalties, if any, related to uncertain tax positions as income tax expense on theStatements of Operations. For the period ended August 31, 2021, the Funds did not incur any interest or penalties.
As of August 31, 2021, the components of accumulated earnings (losses) on a tax basis were as follows:Undistributed
OrdinaryIncome*
Capital andOther Gains
(Losses)
UnrealizedAppreciation
(Depreciation)
TotalAccumulated
Earnings (Losses)
Xtrackers Emerging Markets Carbon Reduction andClimate Improvers ETF . . . . . . . . . . . . . . . . . . . . . . . . $ 266,563 $ (61,591) $ 16,021,929 $ 16,226,901
Xtrackers MSCI EAFE ESG Leaders Equity ETF . . . . . . 69,340 (247,525) 3,557,114 3,378,929Xtrackers MSCI Emerging Markets ESG Leaders
Equity ETF . . . . . . . . . . . . . . . . . . . . . . . . . . . . . . . . . . . 142,046 (242,908) 2,894,017 2,793,155Xtrackers MSCI USA ESG Leaders Equity ETF . . . . . . 8,318,142 (25,243,752) 1,274,642,509 1,257,716,899Xtrackers S&P 500 ESG ETF . . . . . . . . . . . . . . . . . . . . . . 1,891,596 (304,487) 144,040,089 145,627,198Xtrackers S&P MidCap 400 ESG ETF . . . . . . . . . . . . . . 21,723 — 762,891 784,614Xtrackers S&P SmallCap 600 ESG ETF . . . . . . . . . . . . . 85,555 — 442,892 528,447
80

DBX ETF Trust
Notes to Financial Statements (Continued)
The tax character of dividends and distributions declared for the period ended August 31, 2021 and year endedAugust 31, 2020 were as follows:
Period EndedAugust 31, 2021
Ordinary Income*
Xtrackers Emerging Markets Carbon Reduction and Climate Improvers ETF . . . . . . . . . . . . . . . . . . . . $ 192,472Xtrackers MSCI EAFE ESG Leaders Equity ETF . . . . . . . . . . . . . . . . . . . . . . . . . . . . . . . . . . . . . . . . . . . . . . 404,392Xtrackers MSCI Emerging Markets ESG Leaders Equity ETF . . . . . . . . . . . . . . . . . . . . . . . . . . . . . . . . . . 82,138Xtrackers MSCI USA ESG Leaders Equity ETF . . . . . . . . . . . . . . . . . . . . . . . . . . . . . . . . . . . . . . . . . . . . . . 44,278,620Xtrackers S&P 500 ESG ETF . . . . . . . . . . . . . . . . . . . . . . . . . . . . . . . . . . . . . . . . . . . . . . . . . . . . . . . . . . . . . . 5,646,092Xtrackers S&P MidCap 400 ESG ETF . . . . . . . . . . . . . . . . . . . . . . . . . . . . . . . . . . . . . . . . . . . . . . . . . . . . . . 33,536Xtrackers S&P SmallCap 600 ESG ETF . . . . . . . . . . . . . . . . . . . . . . . . . . . . . . . . . . . . . . . . . . . . . . . . . . . . . 27,800
Year Ended August 31, 2020
Ordinary Income*Long Term
Capital Gain
Xtrackers Emerging Markets Carbon Reduction and Climate Improvers ETF . . . . . . . . $ 218,581 $ —Xtrackers MSCI EAFE ESG Leaders Equity ETF . . . . . . . . . . . . . . . . . . . . . . . . . . . . . . . . . 223,206 —Xtrackers MSCI Emerging Markets ESG Leaders Equity ETF . . . . . . . . . . . . . . . . . . . . . 317,935 591Xtrackers MSCI USA ESG Leaders Equity ETF . . . . . . . . . . . . . . . . . . . . . . . . . . . . . . . . . . 29,554,714 —Xtrackers S&P 500 ESG ETF . . . . . . . . . . . . . . . . . . . . . . . . . . . . . . . . . . . . . . . . . . . . . . . . . 1,693,157 —
* For tax purposes short-term capital gain distributions are considered ordinary income distributions.
At August 31, 2021, for Federal income tax purposes, the Funds have capital loss carryforwards available asshown in the table below, to the extent provided by regulations, to offset future capital gains for an unlimitedperiod. To the extent that these loss carryforwards are used to offset future capital gains, it is probable that thecapital gains so offset will not be distributed to shareholders.
Short-Term Long-Term Total Amount
Xtrackers Emerging Markets Carbon Reduction and ClimateImprovers ETF . . . . . . . . . . . . . . . . . . . . . . . . . . . . . . . . . . . . . . . . . . . . . . . . . . . . $ 56,337 $ 5,254 $ 61,591
Xtrackers MSCI EAFE ESG Leaders Equity ETF . . . . . . . . . . . . . . . . . . . . . . . . . 75,738 171,787 247,525Xtrackers MSCI Emerging Markets ESG Leaders Equity ETF . . . . . . . . . . . . . . 49,283 193,625 242,908Xtrackers MSCI USA ESG Leaders Equity ETF . . . . . . . . . . . . . . . . . . . . . . . . . . 4,036,785 21,206,967 25,243,752Xtrackers S&P 500 ESG ETF . . . . . . . . . . . . . . . . . . . . . . . . . . . . . . . . . . . . . . . . . . 304,487 — 304,487
For the period ended August 31, 2021, the effect of permanent “book/tax” reclassifications to the components ofnet assets are included below. These differences are primarily due to redemptions-in-kind, excise tax andequalization.
Distributableearnings (loss) Paid-In Capital
Xtrackers Emerging Markets Carbon Reduction and Climate Improvers ETF . . . . . . . . $ (1,821,504) $ 1,821,504Xtrackers MSCI EAFE ESG Leaders Equity ETF . . . . . . . . . . . . . . . . . . . . . . . . . . . . . . . . . (388,724) 388,724Xtrackers MSCI Emerging Markets ESG Leaders Equity ETF . . . . . . . . . . . . . . . . . . . . . 120 (120)Xtrackers MSCI USA ESG Leaders Equity ETF . . . . . . . . . . . . . . . . . . . . . . . . . . . . . . . . . . (89,649,159) 89,649,159Xtrackers S&P 500 ESG ETF . . . . . . . . . . . . . . . . . . . . . . . . . . . . . . . . . . . . . . . . . . . . . . . . . (24,548,017) 24,548,017Xtrackers S&P MidCap 400 ESG ETF . . . . . . . . . . . . . . . . . . . . . . . . . . . . . . . . . . . . . . . . . . (152,209) 152,209Xtrackers S&P SmallCap 600 ESG ETF . . . . . . . . . . . . . . . . . . . . . . . . . . . . . . . . . . . . . . . . (123,035) 123,035
81

DBX ETF Trust
Notes to Financial Statements (Continued)
As of August 31, 2021, the aggregate cost of investments for federal income tax purposes, the net unrealizedappreciation or (depreciation) and the aggregated gross unrealized appreciation (depreciation) on investmentswere as follows:
AggregateTax Cost
NetUnrealized
Appreciation(Depreciation)
AggregateGross Unrealized
Appreciation
AggregateGross Unrealized
(Depreciation)
Xtrackers Emerging Markets Carbon Reductionand Climate Improvers ETF . . . . . . . . . . . . . . . . $ 484,672,330 $ 16,359,227 $ 18,027,181 $ (1,667,954)
Xtrackers MSCI EAFE ESG LeadersEquity ETF . . . . . . . . . . . . . . . . . . . . . . . . . . . . . . . 15,515,051 3,556,895 3,970,952 (414,057)
Xtrackers MSCI Emerging Markets ESG LeadersEquity ETF . . . . . . . . . . . . . . . . . . . . . . . . . . . . . . . 22,326,991 2,961,656 3,733,486 (771,830)
Xtrackers MSCI USA ESG LeadersEquity ETF . . . . . . . . . . . . . . . . . . . . . . . . . . . . . . . 2,613,059,960 1,274,642,509 1,289,542,739 (14,900,230)
Xtrackers S&P 500 ESG ETF . . . . . . . . . . . . . . . . . 599,953,403 144,040,089 147,236,303 (3,196,214)Xtrackers S&P MidCap 400 ESG ETF . . . . . . . . . . 10,189,433 762,891 1,142,858 (379,967)Xtrackers S&P SmallCap 600 ESG ETF . . . . . . . . 10,284,752 442,892 1,044,269 (601,377)
Foreign Taxes The Funds may be subject to foreign taxes (a portion of which may be reclaimable) on income,capital gains on investments, certain foreign currency transactions or other corporate events. All foreign taxes arerecorded in accordance with the applicable foreign tax regulations and rates that exist in the foreign jurisdictionsin which the Funds invest. These foreign taxes, if any, are paid by the Funds and are reflected in their Statementsof Operations as follows: foreign taxes withheld at source are presented as a reduction of income, foreign taxeson capital gains from sales of investments and foreign currency transactions are included in their respective netrealized gain (loss) categories, and deferred foreign taxes on unrealized gains are included in net change inunrealized appreciation (depreciation). Receivables and payables related to foreign taxes as of August 31, 2021, ifany, are disclosed in the Funds’ Statements of Assets and Liabilities.
Foreign Currency Translations The books and records of the Funds are maintained in U.S. dollars. Investmentsecurities and other assets and liabilities denominated in a foreign currency are translated into U.S. dollars at theprevailing exchange rates at period end. Purchases and sales of investment securities, income and expenses aretranslated into U.S. dollars at the prevailing exchange rates on the respective dates of the transactions.
Net realized and unrealized gains and losses on foreign currency transactions represent net gains and lossesbetween trade and settlement dates on securities transactions, the acquisition and disposition of foreigncurrencies, and the difference between the amount of net investment income accrued and the U.S. dollar amountactually received. The portion of both realized and unrealized gains and losses on investments that results fromfluctuations in foreign currency exchange rates is not separately disclosed, but is included with net realized andunrealized gain/appreciation and loss/depreciation on investments.
Securities Lending The Funds may lend securities to certain financial institutions under the terms of theirsecurities lending agreement. During the term of the loans, the Funds continue to receive interest and dividendsgenerated by the securities and to participate in any changes in their market value. The Funds require theborrowers of the securities to maintain collateral with the Funds consisting of cash and/or securities issued orguaranteed by the U.S. Government, its agencies or instrumentalities having a value at least equal to the value ofthe securities loaned. When the collateral falls below specified amounts, the lending agent will use its best effortto obtain additional collateral on the next business day to meet required amounts under the securities lendingagreement. During the period ended August 31, 2021, the Funds invested the cash collateral into a joint tradingaccount in DWS Government & Agency Securities Portfolio, an affiliated money market fund managed by DWSInvestment Management Americas, Inc. DWS Investment Management Americas, Inc. receives a management/administration fee (0.02% annualized effective rate as of August 31, 2021) on the cash collateral invested in DWSGovernment & Agency Securities Portfolio. The Funds receive compensation for lending their securities either inthe form of fees or by earning interest on invested cash collateral, net of borrower rebates and fees paid to alending agent. Either the Fund or the borrower may terminate the loan at any time and the borrower, after notice,is required to return borrowed securities within a standard time period. There may be risks of delay and costs in
82

DBX ETF Trust
Notes to Financial Statements (Continued)
recovery of securities or even loss of rights in the collateral should the borrower of the securities fail financially. Ifthe Funds are not able to recover securities lent, the Funds may sell the collateral and purchase a replacementinvestment in the market, incurring the risk that the value of the replacement security is greater than the value ofthe collateral. The Funds are also subject to all investment risks associated with the reinvestment of any cashcollateral received, including, but not limited to, interest rate, credit and liquidity risk associated with suchinvestments.
As of August 31, 2021, the Funds listed below had securities on loan. The value of the related collateral exceededthe value of the securities loaned at period end.Remaining Contractual Maturity of the Agreements, as of August 31, 2021
Securities Lending TransactionsOvernight and
Continuous <30 DaysBetween
30 & 90 days >90 days Total
Xtrackers Emerging Markets Carbon Reduction and Climate Improvers ETF
Common Stocks . . . . . . . . . . . . . . . . . . . . . $1,768,050 $ 69,030 $287,483 $ 4,440,304 $ 6,564,867
Gross amount of recognized liabilities and non-cash collateral for securities lending transactions . . $ 6,564,867
Xtrackers MSCI EAFE ESG Leaders Equity ETF
Common Stocks . . . . . . . . . . . . . . . . . . . . . $ 61,137 $ 590 $ — $ 118,605 $ 180,332
Gross amount of recognized liabilities and non-cash collateral for securities lending transactions . . $ 180,332
Xtrackers MSCI Emerging Markets ESG Leaders Equity ETF
Common Stocks . . . . . . . . . . . . . . . . . . . . . $ 75,561 $ 950 $ 16,976 $ 187,915 $ 281,402Exchange- Trade Funds . . . . . . . . . . . . . . 4,350 — — — 4,350
Total Borrowings $ 79,911 $ 950 $ 16,976 $ 187,915 $ 285,752
Gross amount of recognized liabilities and non-cash collateral for securities lending transactions . . $ 285,752
Xtrackers MSCI USA ESG Leaders Equity ETF
Common Stocks . . . . . . . . . . . . . . . . . . . . . $ 852,902 $168,704 $421,610 $21,387,220 $22,830,436
Gross amount of recognized liabilities and non-cash collateral for securities lending transactions . . $22,830,436
Xtrackers S&P 500 ESG ETF
Common Stocks . . . . . . . . . . . . . . . . . . . . . $ 107,727 $ 3,757 $444,756 $13,819,086 $14,375,326
Gross amount of recognized liabilities and non-cash collateral for securities lending transactions . . $14,375,326
Xtrackers S&P MidCap 400 ESG ETF
Common Stocks . . . . . . . . . . . . . . . . . . . . . $ 1,305 $ 2,789 $ 33,880 $ 434,947 $ 472,921
Gross amount of recognized liabilities and non-cash collateral for securities lending transactions . . $ 472,921
Xtrackers S&P SmallCap 600 ESG ETF
Common Stocks . . . . . . . . . . . . . . . . . . . . . $ 50,397 $ 4,838 $ 67,318 $ 770,244 $ 892,797
Gross amount of recognized liabilities and non-cash collateral for securities lending transactions . . $ 892,797
Derivatives
Futures Contracts Each Fund may enter into futures contracts. These futures contracts will be used to simulateinvestment in the respective Underlying Index, to facilitate trading or to reduce transaction costs. Each Fund willenter into futures contracts that are traded on a U.S. or non-U.S. exchange. No Fund will use futures forspeculative purposes. Futures contracts provide for the future sale by one party and purchase by another party ofa specified amount of a specific instrument or index at a specified future time and at a specified price. For theperiod ended August 31, 2021, Xtrackers Emerging Markets Carbon Reduction and Climate Improvers ETF,Xtrackers MSCI EAFE ESG Leaders Equity ETF, Xtrackers MSCI Emerging Markets ESG Leaders Equity ETF,Xtrackers MSCI USA ESG Leaders Equity ETF and Xtrackers S&P 500 ESG ETF utilized futures in order to simulateinvestment in the Funds’ Underlying Index. To the extent required by law, liquid assets committed to futurescontracts will be maintained.
83
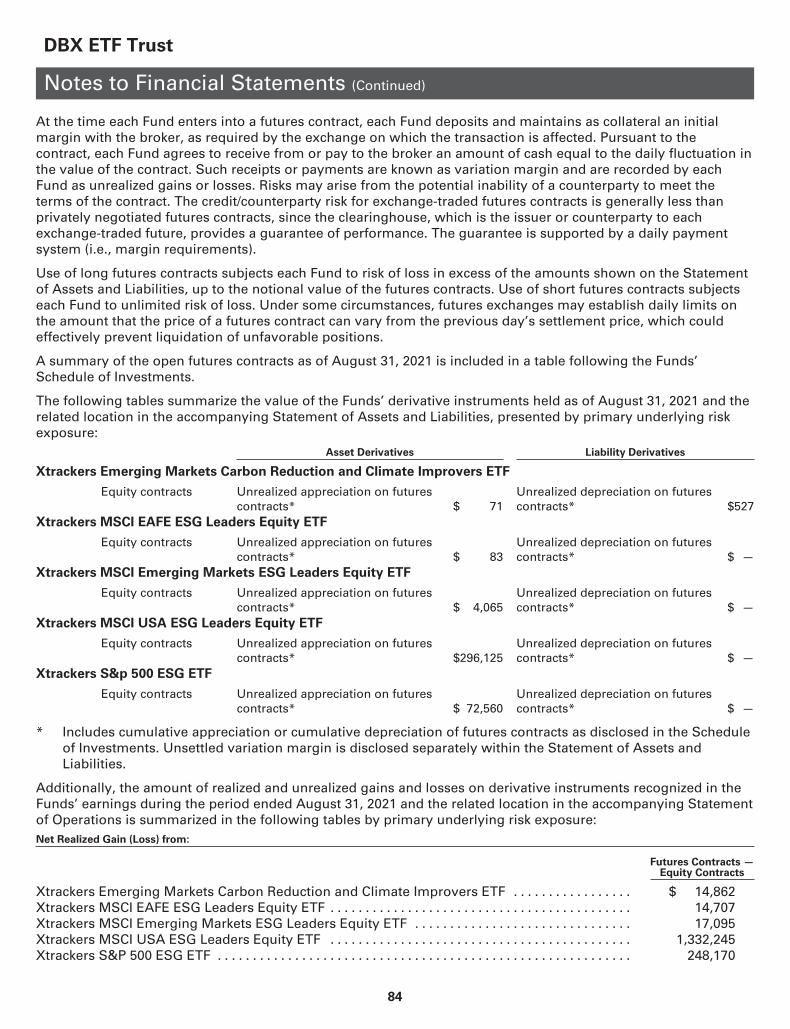
DBX ETF Trust
Notes to Financial Statements (Continued)
At the time each Fund enters into a futures contract, each Fund deposits and maintains as collateral an initialmargin with the broker, as required by the exchange on which the transaction is affected. Pursuant to thecontract, each Fund agrees to receive from or pay to the broker an amount of cash equal to the daily fluctuation inthe value of the contract. Such receipts or payments are known as variation margin and are recorded by eachFund as unrealized gains or losses. Risks may arise from the potential inability of a counterparty to meet theterms of the contract. The credit/counterparty risk for exchange-traded futures contracts is generally less thanprivately negotiated futures contracts, since the clearinghouse, which is the issuer or counterparty to eachexchange-traded future, provides a guarantee of performance. The guarantee is supported by a daily paymentsystem (i.e., margin requirements).
Use of long futures contracts subjects each Fund to risk of loss in excess of the amounts shown on the Statementof Assets and Liabilities, up to the notional value of the futures contracts. Use of short futures contracts subjectseach Fund to unlimited risk of loss. Under some circumstances, futures exchanges may establish daily limits onthe amount that the price of a futures contract can vary from the previous day’s settlement price, which couldeffectively prevent liquidation of unfavorable positions.
A summary of the open futures contracts as of August 31, 2021 is included in a table following the Funds’Schedule of Investments.
The following tables summarize the value of the Funds’ derivative instruments held as of August 31, 2021 and therelated location in the accompanying Statement of Assets and Liabilities, presented by primary underlying riskexposure:
Asset Derivatives Liability Derivatives
Xtrackers Emerging Markets Carbon Reduction and Climate Improvers ETF
Equity contracts Unrealized appreciation on futurescontracts* $ 71
Unrealized depreciation on futurescontracts* $527
Xtrackers MSCI EAFE ESG Leaders Equity ETF
Equity contracts Unrealized appreciation on futurescontracts* $ 83
Unrealized depreciation on futurescontracts* $ —
Xtrackers MSCI Emerging Markets ESG Leaders Equity ETF
Equity contracts Unrealized appreciation on futurescontracts* $ 4,065
Unrealized depreciation on futurescontracts* $ —
Xtrackers MSCI USA ESG Leaders Equity ETF
Equity contracts Unrealized appreciation on futurescontracts* $296,125
Unrealized depreciation on futurescontracts* $ —
Xtrackers S&p 500 ESG ETF
Equity contracts Unrealized appreciation on futurescontracts* $ 72,560
Unrealized depreciation on futurescontracts* $ —
* Includes cumulative appreciation or cumulative depreciation of futures contracts as disclosed in the Scheduleof Investments. Unsettled variation margin is disclosed separately within the Statement of Assets andLiabilities.
Additionally, the amount of realized and unrealized gains and losses on derivative instruments recognized in theFunds’ earnings during the period ended August 31, 2021 and the related location in the accompanying Statementof Operations is summarized in the following tables by primary underlying risk exposure:Net Realized Gain (Loss) from:
Futures Contracts —Equity Contracts
Xtrackers Emerging Markets Carbon Reduction and Climate Improvers ETF . . . . . . . . . . . . . . . . . $ 14,862Xtrackers MSCI EAFE ESG Leaders Equity ETF . . . . . . . . . . . . . . . . . . . . . . . . . . . . . . . . . . . . . . . . . . . 14,707Xtrackers MSCI Emerging Markets ESG Leaders Equity ETF . . . . . . . . . . . . . . . . . . . . . . . . . . . . . . . 17,095Xtrackers MSCI USA ESG Leaders Equity ETF . . . . . . . . . . . . . . . . . . . . . . . . . . . . . . . . . . . . . . . . . . . 1,332,245Xtrackers S&P 500 ESG ETF . . . . . . . . . . . . . . . . . . . . . . . . . . . . . . . . . . . . . . . . . . . . . . . . . . . . . . . . . . . 248,170
84

DBX ETF Trust
Notes to Financial Statements (Continued)
Net Change in Unrealized Appreciation (Depreciation) on:
Futures Contracts —Equity Contracts
Xtrackers Emerging Markets Carbon Reduction and Climate Improvers ETF . . . . . . . . . . . . . . . . . $ (6,111)Xtrackers MSCI EAFE ESG Leaders Equity ETF . . . . . . . . . . . . . . . . . . . . . . . . . . . . . . . . . . . . . . . . . . . 171Xtrackers MSCI Emerging Markets ESG Leaders Equity ETF . . . . . . . . . . . . . . . . . . . . . . . . . . . . . . . (1,590)Xtrackers MSCI USA ESG Leaders Equity ETF . . . . . . . . . . . . . . . . . . . . . . . . . . . . . . . . . . . . . . . . . . . (13,955)Xtrackers S&P 500 ESG ETF . . . . . . . . . . . . . . . . . . . . . . . . . . . . . . . . . . . . . . . . . . . . . . . . . . . . . . . . . . . 22,300
For the period ended August 31, 2021 the average monthly volume of derivatives was as follows:Futures Contracts(Contract Value)
Xtrackers Emerging Markets Carbon Reduction and Climate Improvers ETF . . . . . . . . . . . . . . . . . . . $ 63,280Xtrackers MSCI EAFE ESG Leaders Equity ETF . . . . . . . . . . . . . . . . . . . . . . . . . . . . . . . . . . . . . . . . . . . . . 61,704Xtrackers MSCI Emerging Markets ESG Leaders Equity ETF . . . . . . . . . . . . . . . . . . . . . . . . . . . . . . . . . 98,547Xtrackers MSCI USA ESG Leaders Equity ETF . . . . . . . . . . . . . . . . . . . . . . . . . . . . . . . . . . . . . . . . . . . . . 4,882,312Xtrackers S&P 500 ESG ETF . . . . . . . . . . . . . . . . . . . . . . . . . . . . . . . . . . . . . . . . . . . . . . . . . . . . . . . . . . . . . 1,030,735
Affiliated Cash Management Vehicles The Funds may invest uninvested cash balances in DWS GovernmentMoney Market Series and DWS ESG Liquidity Fund, affiliated money market funds which are managed by DWSInvestment Management Americas, Inc. (“DIMA”), also an indirect, wholly owned subsidiary of DWS GroupGmbH & Co. KGaA. Each affiliated money market fund is managed in accordance with Rule 2a-7 under the 1940Act, which governs the quality, maturity, diversity and liquidity of instruments in which a money market fund mayinvest. DWS Government Money Market Series seeks to maintain a stable NAV, and DWS ESG Liquidity Fundmaintains a floating NAV. The Funds indirectly bear their proportionate share of the expenses of each affiliatedmoney market fund in which they invest. The Advisor will waive an amount of the unitary advisory fee payable tothe Advisor by the Funds equal to such acquired fund’s fees and expenses on the Funds’ assets invested in theaffiliated money market funds.
3. Investment Advisory and Other Agreements
The Advisor has overall responsibility for the general management and administration of the Funds, subject to thesupervision of the Funds’ Board of Trustees. Under an investment advisory agreement between the Trust, onbehalf of the Funds, and the Advisor (the “Investment Advisory Agreement”), the Advisor is responsible forarranging sub-advisory, transfer agency, custody, fund administration, and all other non-distribution relatedservices for the Funds to operate.
For its investment advisory services to the Funds below, the Advisor was entitled to receive a unitary advisory feebased on each Fund’s average daily net assets, computed and accrued daily and payable monthly, at an annualrate equal to:
UnitaryAdvisory Fee
Xtrackers MSCI EAFE ESG Leaders Equity ETF . . . . . . . . . . . . . . . . . . . . . . . . . . . . . . . . . . . . . . . . . . . . . . . . 0.14%Xtrackers MSCI Emerging Markets ESG Leaders Equity ETF . . . . . . . . . . . . . . . . . . . . . . . . . . . . . . . . . . . . . 0.20%Xtrackers MSCI USA ESG Leaders Equity ETF . . . . . . . . . . . . . . . . . . . . . . . . . . . . . . . . . . . . . . . . . . . . . . . . . 0.10%Xtrackers S&P 500 ESG ETF . . . . . . . . . . . . . . . . . . . . . . . . . . . . . . . . . . . . . . . . . . . . . . . . . . . . . . . . . . . . . . . . . 0.11%Xtrackers S&P MidCap 400 ESG ETF . . . . . . . . . . . . . . . . . . . . . . . . . . . . . . . . . . . . . . . . . . . . . . . . . . . . . . . . . 0.15%Xtrackers S&P SmallCap 600 ESG ETF . . . . . . . . . . . . . . . . . . . . . . . . . . . . . . . . . . . . . . . . . . . . . . . . . . . . . . . 0.15%
For its investment advisory services to Xtrackers Emerging Markets Carbon Reduction and Climate ImproversETF, for the period from September 1, 2020 through August 17, 2021, the Advisor was entitled to receive a unitaryadvisory fee from the Fund based on the Fund’s average daily net assets, computed and accrued daily andpayable monthly, at an annual rate equal to 0.16%.
Effective August 18, 2021, for its investment advisory services to Xtrackers Emerging Markets Carbon Reduction andClimate Improvers ETF, the Advisor is entitled to receive a unitary advisory fee from the Fund based on the Fund’saverage daily net assets, computed and accrued daily and payable monthly, at an annual rate equal to 0.15%.
85

DBX ETF Trust
Notes to Financial Statements (Continued)
The Advisor for the Xtrackers MSCI USA ESG Leaders Equity ETF has voluntarily elected to waive its fees and/orreimburse Fund expenses to the extent necessary to maintain the Fund’s total annual operating expenses(excluding certain expenses such as extraordinary expenses, taxes, brokerage, interest expense and acquiredfund fees and expenses) at 0.09% of the Fund’s average daily net assets. Any voluntary waiver or reimbursementimplemented by the Advisor may be eliminated by the Advisor at any time. For the year ended August 31, 2021,the Advisor waived $321,385 of expenses to the Fund.
The Advisor for the Xtrackers S&P 500 ESG ETF has contractually agreed through December 17, 2021 to waive itsfees and/or reimburse fund expenses to the extent necessary to prevent the operating expenses of the fund(excluding interest expense, taxes, brokerage expenses, distribution fees or expenses, litigation expenses andother extraordinary expenses) from exceeding 0.10% of the fund’s average daily net assets. This agreement mayonly be terminated by the Fund’s Board (and may not be terminated by the Advisor) prior to that time. For theyear ended August 31, 2021, the Advisor waived $48,315 of expenses to the Fund.
The Advisor for the Funds below has contractually agreed to waive a portion of its unitary advisory fee in anamount equal to the acquired fund’s fees and expenses attributable to the Funds’ investments in affiliated Funds.For the period ended August 31, 2021, the Advisor waived expenses of the Funds as follows:
ExpensesWaived
Xtrackers Emerging Markets Carbon Reduction and Climate Improvers ETF . . . . . . . . . . . . . . . . . . . . . . . . . $ 43Xtrackers MSCI EAFE ESG Leaders Equity ETF . . . . . . . . . . . . . . . . . . . . . . . . . . . . . . . . . . . . . . . . . . . . . . . . . . . 5Xtrackers MSCI Emerging Markets ESG Leaders Equity ETF . . . . . . . . . . . . . . . . . . . . . . . . . . . . . . . . . . . . . . . 40Xtrackers MSCI USA ESG Leaders Equity ETF . . . . . . . . . . . . . . . . . . . . . . . . . . . . . . . . . . . . . . . . . . . . . . . . . . . 2,000Xtrackers S&P 500 ESG ETF . . . . . . . . . . . . . . . . . . . . . . . . . . . . . . . . . . . . . . . . . . . . . . . . . . . . . . . . . . . . . . . . . . . 329Xtrackers S&P MidCap 400 ESG ETF . . . . . . . . . . . . . . . . . . . . . . . . . . . . . . . . . . . . . . . . . . . . . . . . . . . . . . . . . . . . 22Xtrackers S&P SmallCap 600 ESG ETF . . . . . . . . . . . . . . . . . . . . . . . . . . . . . . . . . . . . . . . . . . . . . . . . . . . . . . . . . . 22
Out of the unitary advisory fee, the Advisor pays substantially all expenses of each Fund, including the cost oftransfer agency, custody, fund administration, legal, audit and other services, and expenses of the IndependentTrustees. Each Fund is responsible for the payment of interest expense, acquired fund fees and expenses, taxes,brokerage expenses, distribution fees or expenses, if any, litigation expenses and extraordinary expenses.
The Bank of New York Mellon, a wholly-owned subsidiary of The Bank of New York Mellon Corporation, serves asAdministrator, Custodian, Accounting Agent, Lending Agent and Transfer Agent for each Fund.
ALPS Distributors, Inc. (the “Distributor”) serves as the distributor of Creation Units for each Fund on an agencybasis. The Distributor does not maintain a secondary market in shares of the Funds.
The Board of Trustees is currently comprised of three Independent Trustees. The Advisor paid retainer fees andattendance fees to each Independent Trustee; retainer fees to the Chairman of the Board of Trustees andChairman of the Audit Committee; and attendance fees to each member of the Audit Committee (which iscomprised of all of the Funds’ Independent Trustees).
4. Investment Portfolio Transactions
For the period ended August 31, 2021, the cost of investments purchased and proceeds from sale of investments(excluding in-kind transactions and short-term investments) were as follows:
Purchases Sales
Xtrackers Emerging Markets Carbon Reduction and Climate Improvers ETF . . . . . . $372,117,776 $ 7,753,802Xtrackers MSCI EAFE ESG Leaders Equity ETF . . . . . . . . . . . . . . . . . . . . . . . . . . . . . . . . 5,210,096 3,618,765Xtrackers MSCI Emerging Markets ESG Leaders Equity ETF . . . . . . . . . . . . . . . . . . . . 14,909,377 3,523,215Xtrackers MSCI USA ESG Leaders Equity ETF . . . . . . . . . . . . . . . . . . . . . . . . . . . . . . . . 372,919,575 372,557,804Xtrackers S&P 500 ESG ETF . . . . . . . . . . . . . . . . . . . . . . . . . . . . . . . . . . . . . . . . . . . . . . . . 62,168,390 61,814,889Xtrackers S&P MidCap 400 ESG ETF . . . . . . . . . . . . . . . . . . . . . . . . . . . . . . . . . . . . . . . . 12,906,568 2,889,425Xtrackers S&P SmallCap 600 ESG ETF . . . . . . . . . . . . . . . . . . . . . . . . . . . . . . . . . . . . . . . 12,688,052 2,646,971
86
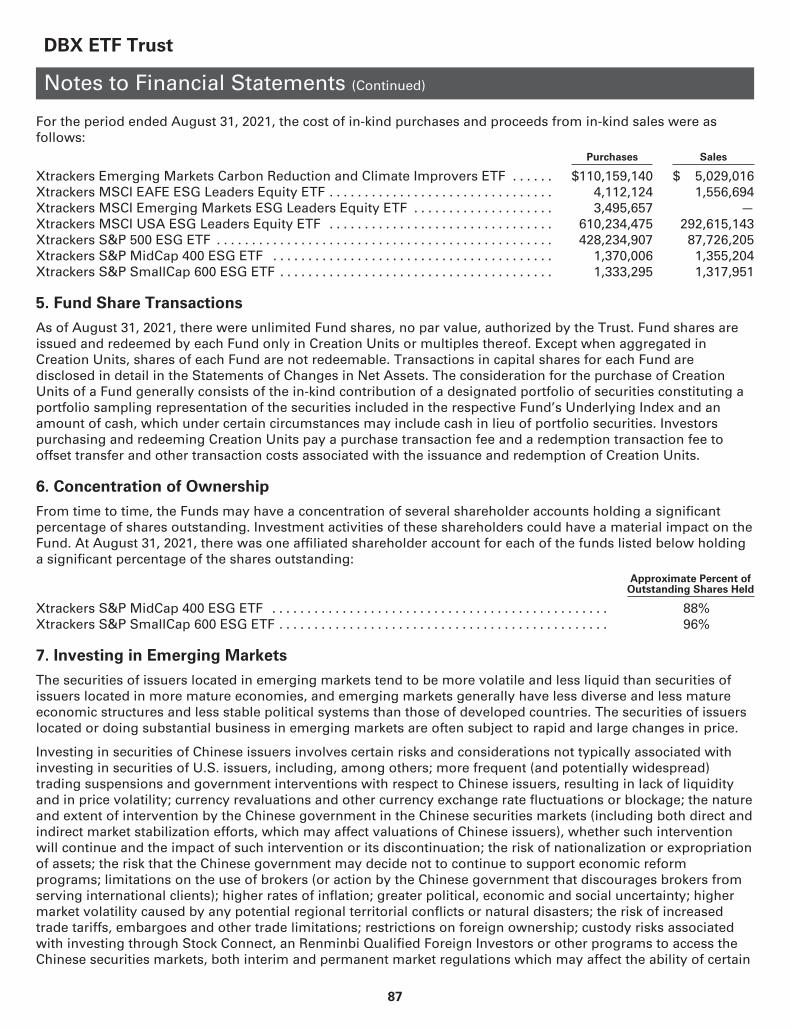
DBX ETF Trust
Notes to Financial Statements (Continued)
For the period ended August 31, 2021, the cost of in-kind purchases and proceeds from in-kind sales were asfollows:
Purchases Sales
Xtrackers Emerging Markets Carbon Reduction and Climate Improvers ETF . . . . . . $110,159,140 $ 5,029,016Xtrackers MSCI EAFE ESG Leaders Equity ETF . . . . . . . . . . . . . . . . . . . . . . . . . . . . . . . . 4,112,124 1,556,694Xtrackers MSCI Emerging Markets ESG Leaders Equity ETF . . . . . . . . . . . . . . . . . . . . 3,495,657 —Xtrackers MSCI USA ESG Leaders Equity ETF . . . . . . . . . . . . . . . . . . . . . . . . . . . . . . . . 610,234,475 292,615,143Xtrackers S&P 500 ESG ETF . . . . . . . . . . . . . . . . . . . . . . . . . . . . . . . . . . . . . . . . . . . . . . . . 428,234,907 87,726,205Xtrackers S&P MidCap 400 ESG ETF . . . . . . . . . . . . . . . . . . . . . . . . . . . . . . . . . . . . . . . . 1,370,006 1,355,204Xtrackers S&P SmallCap 600 ESG ETF . . . . . . . . . . . . . . . . . . . . . . . . . . . . . . . . . . . . . . . 1,333,295 1,317,951
5. Fund Share Transactions
As of August 31, 2021, there were unlimited Fund shares, no par value, authorized by the Trust. Fund shares areissued and redeemed by each Fund only in Creation Units or multiples thereof. Except when aggregated inCreation Units, shares of each Fund are not redeemable. Transactions in capital shares for each Fund aredisclosed in detail in the Statements of Changes in Net Assets. The consideration for the purchase of CreationUnits of a Fund generally consists of the in-kind contribution of a designated portfolio of securities constituting aportfolio sampling representation of the securities included in the respective Fund’s Underlying Index and anamount of cash, which under certain circumstances may include cash in lieu of portfolio securities. Investorspurchasing and redeeming Creation Units pay a purchase transaction fee and a redemption transaction fee tooffset transfer and other transaction costs associated with the issuance and redemption of Creation Units.
6. Concentration of Ownership
From time to time, the Funds may have a concentration of several shareholder accounts holding a significantpercentage of shares outstanding. Investment activities of these shareholders could have a material impact on theFund. At August 31, 2021, there was one affiliated shareholder account for each of the funds listed below holdinga significant percentage of the shares outstanding:
Approximate Percent ofOutstanding Shares Held
Xtrackers S&P MidCap 400 ESG ETF . . . . . . . . . . . . . . . . . . . . . . . . . . . . . . . . . . . . . . . . . . . . . . . . 88%Xtrackers S&P SmallCap 600 ESG ETF . . . . . . . . . . . . . . . . . . . . . . . . . . . . . . . . . . . . . . . . . . . . . . . 96%
7. Investing in Emerging Markets
The securities of issuers located in emerging markets tend to be more volatile and less liquid than securities ofissuers located in more mature economies, and emerging markets generally have less diverse and less matureeconomic structures and less stable political systems than those of developed countries. The securities of issuerslocated or doing substantial business in emerging markets are often subject to rapid and large changes in price.
Investing in securities of Chinese issuers involves certain risks and considerations not typically associated withinvesting in securities of U.S. issuers, including, among others; more frequent (and potentially widespread)trading suspensions and government interventions with respect to Chinese issuers, resulting in lack of liquidityand in price volatility; currency revaluations and other currency exchange rate fluctuations or blockage; the natureand extent of intervention by the Chinese government in the Chinese securities markets (including both direct andindirect market stabilization efforts, which may affect valuations of Chinese issuers), whether such interventionwill continue and the impact of such intervention or its discontinuation; the risk of nationalization or expropriationof assets; the risk that the Chinese government may decide not to continue to support economic reformprograms; limitations on the use of brokers (or action by the Chinese government that discourages brokers fromserving international clients); higher rates of inflation; greater political, economic and social uncertainty; highermarket volatility caused by any potential regional territorial conflicts or natural disasters; the risk of increasedtrade tariffs, embargoes and other trade limitations; restrictions on foreign ownership; custody risks associatedwith investing through Stock Connect, an Renminbi Qualified Foreign Investors or other programs to access theChinese securities markets, both interim and permanent market regulations which may affect the ability of certain
87
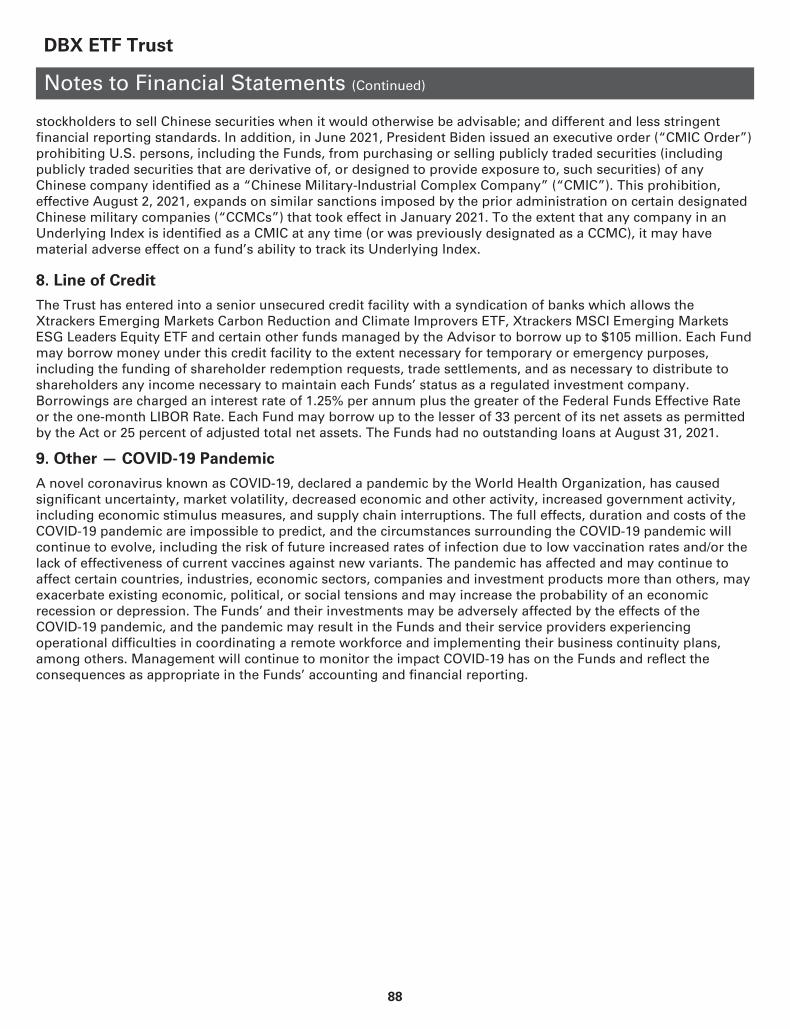
DBX ETF Trust
Notes to Financial Statements (Continued)
stockholders to sell Chinese securities when it would otherwise be advisable; and different and less stringentfinancial reporting standards. In addition, in June 2021, President Biden issued an executive order (“CMIC Order”)prohibiting U.S. persons, including the Funds, from purchasing or selling publicly traded securities (includingpublicly traded securities that are derivative of, or designed to provide exposure to, such securities) of anyChinese company identified as a “Chinese Military-Industrial Complex Company” (“CMIC”). This prohibition,effective August 2, 2021, expands on similar sanctions imposed by the prior administration on certain designatedChinese military companies (“CCMCs”) that took effect in January 2021. To the extent that any company in anUnderlying Index is identified as a CMIC at any time (or was previously designated as a CCMC), it may havematerial adverse effect on a fund’s ability to track its Underlying Index.
8. Line of Credit
The Trust has entered into a senior unsecured credit facility with a syndication of banks which allows theXtrackers Emerging Markets Carbon Reduction and Climate Improvers ETF, Xtrackers MSCI Emerging MarketsESG Leaders Equity ETF and certain other funds managed by the Advisor to borrow up to $105 million. Each Fundmay borrow money under this credit facility to the extent necessary for temporary or emergency purposes,including the funding of shareholder redemption requests, trade settlements, and as necessary to distribute toshareholders any income necessary to maintain each Funds’ status as a regulated investment company.Borrowings are charged an interest rate of 1.25% per annum plus the greater of the Federal Funds Effective Rateor the one-month LIBOR Rate. Each Fund may borrow up to the lesser of 33 percent of its net assets as permittedby the Act or 25 percent of adjusted total net assets. The Funds had no outstanding loans at August 31, 2021.
9. Other — COVID-19 Pandemic
A novel coronavirus known as COVID-19, declared a pandemic by the World Health Organization, has causedsignificant uncertainty, market volatility, decreased economic and other activity, increased government activity,including economic stimulus measures, and supply chain interruptions. The full effects, duration and costs of theCOVID-19 pandemic are impossible to predict, and the circumstances surrounding the COVID-19 pandemic willcontinue to evolve, including the risk of future increased rates of infection due to low vaccination rates and/or thelack of effectiveness of current vaccines against new variants. The pandemic has affected and may continue toaffect certain countries, industries, economic sectors, companies and investment products more than others, mayexacerbate existing economic, political, or social tensions and may increase the probability of an economicrecession or depression. The Funds’ and their investments may be adversely affected by the effects of theCOVID-19 pandemic, and the pandemic may result in the Funds and their service providers experiencingoperational difficulties in coordinating a remote workforce and implementing their business continuity plans,among others. Management will continue to monitor the impact COVID-19 has on the Funds and reflect theconsequences as appropriate in the Funds’ accounting and financial reporting.
88

DBX ETF Trust
Report of Independent Registered Public Accounting Firm
To the Shareholders ofXtrackers Emerging Markets Carbon Reduction and Climate Improvers ETF (formerly Xtrackers MSCI ACWI exUSA ESG Leaders Equity ETF), Xtrackers MSCI EAFE ESG Leaders Equity ETF, Xtrackers MSCI Emerging MarketsESG Leaders Equity ETF, Xtrackers MSCI USA ESG Leaders Equity ETF, Xtrackers S&P 500 ESG ETF, XtrackersS&P MidCap 400 ESG ETF and Xtrackers S&P SmallCap 600 ESG ETF and the Board of Trustees of DBX ETF Trust
Opinion on the Financial Statements
We have audited the accompanying statements of assets and liabilities of Xtrackers Emerging Markets CarbonReduction and Climate Improvers ETF (formerly Xtrackers MSCI ACWI ex USA ESG Leaders Equity ETF), XtrackersMSCI EAFE ESG Leaders Equity ETF, Xtrackers MSCI Emerging Markets ESG Leaders Equity ETF, Xtrackers MSCIUSA ESG Leaders Equity ETF, Xtrackers S&P 500 ESG ETF, Xtrackers S&P MidCap 400 ESG ETF and Xtrackers S&PSmallCap 600 ESG ETF (collectively referred to as the “Funds”), (seven of the funds constituting DBX ETF Trust (the“Trust”)), including the schedules of investments, as of August 31, 2021, and the related statements of operationsand changes in net assets, and the financial highlights for each of the periods indicated in the table below and therelated notes (collectively referred to as the “financial statements”). In our opinion, the financial statements presentfairly, in all material respects, the financial position of each of the Funds (seven of the funds constituting DBX ETFTrust) at August 31, 2021, and the results of their operations, changes in net assets and financial highlights for eachof the periods indicated in the table below, in conformity with U.S. generally accepted accounting principles.
Individual fundconstituting
the DBX ETF Trust
Statement of operations Statements of changes innet assets
Financial highlights
Xtrackers EmergingMarkets CarbonReduction and ClimateImprovers ETF
Xtrackers MSCI EmergingMarkets ESG LeadersEquity ETF
For the year endedAugust 31, 2021
For each of the two yearsin the period endedAugust 31, 2021
For each of the two yearsin the period endedAugust 31, 2021 and theperiod from December 6,2018 (commencement ofoperations) throughAugust 31, 2019
Xtrackers MSCI EAFE ESGLeaders Equity ETF
For the year endedAugust 31, 2021
For each of the two yearsin the period endedAugust 31, 2021
For each of the two yearsin the period endedAugust 31, 2021 and theperiod from September 6,2018 (commencement ofoperations) throughAugust 31, 2019
Xtrackers MSCI USA ESGLeaders Equity ETF
For the year endedAugust 31, 2021
For each of the two yearsin the period endedAugust 31, 2021
For each of the two yearsin the period endedAugust 31, 2021 and theperiod from March 7,2019 (commencement ofoperations) throughAugust 31, 2019
Xtrackers S&P 500 ESGETF
For the year endedAugust 31, 2021
For each of the two yearsin the period endedAugust 31, 2021
For each of the two yearsin the period endedAugust 31, 2021 and theperiod from June 26, 2019(commencement ofoperations) throughAugust 31, 2019
Xtrackers S&P MidCap400 ESG ETF
Xtrackers S&P SmallCap600 ESG ETF
For the period from February 24, 2021 (commencement of operations) throughAugust 31, 2021
89

DBX ETF Trust
Report of Independent Registered Public Accounting Firm (Continued)
Basis for Opinion
These financial statements are the responsibility of the Trust’s management. Our responsibility is to express anopinion on each of the Funds’ financial statements based on our audits. We are a public accounting firmregistered with the Public Company Accounting Oversight Board (United States) (“PCAOB”) and are required tobe independent with respect to the Trust in accordance with the U.S. federal securities laws and the applicablerules and regulations of the Securities and Exchange Commission and the PCAOB.
We conducted our audits in accordance with the standards of the PCAOB. Those standards require that we planand perform the audit to obtain reasonable assurance about whether the financial statements are free of materialmisstatement, whether due to error or fraud. The Trust is not required to have, nor were we engaged to perform,an audit of the Trust’s internal control over financial reporting. As part of our audits we are required to obtain anunderstanding of internal control over financial reporting but not for the purpose of expressing an opinion on theeffectiveness of the Trust’s internal control over financial reporting. Accordingly, we express no such opinion.
Our audits included performing procedures to assess the risks of material misstatement of the financialstatements, whether due to error or fraud, and performing procedures that respond to those risks. Suchprocedures included examining, on a test basis, evidence regarding the amounts and disclosures in the financialstatements. Our procedures included confirmation of securities owned as of August 31, 2021, by correspondencewith the custodians and brokers or by other appropriate auditing procedures where replies from brokers were notreceived. Our audits also included evaluating the accounting principles used and significant estimates made bymanagement, as well as evaluating the overall presentation of the financial statements. We believe that our auditsprovide a reasonable basis for our opinion.
We have served as the auditor of one or more investment companies in the DWS family of funds since at least1979, but we are unable to determine the specific year.
New York, New YorkOctober 25, 2021
90

DBX ETF Trust
Board Members and Officers (Unaudited)
Identification and Background
The Board has responsibility for the overall management and operations of the funds, including generalsupervision of the duties performed by the Advisor and other service providers. Each Board Member serves untilhis or her successor is duly elected or appointed and qualified. Each officer serves until he or she resigns, isremoved, dies, retires or becomes disqualified.
The Trust currently has three Board Members. The three Independent Board Members have no affiliation orbusiness connection with the Advisor or any of its affiliated persons and do not own any stock or other securitiesissued by the Advisor.
The Independent Board Members of the Trust, their term of office and length of time served, their principalbusiness occupations during the past five years, the number of portfolios in the fund complex (defined below)overseen by each Independent Board Member, and other directorships, if any, held by the Board Members areshown below. The fund complex includes all registered open- and closed-end funds (including all of theirportfolios) advised by the Advisor and any registered funds that have an investment advisor that is an affiliatedperson of the Advisor. As of the date of this shareholder report, the fund complex consists of the funds in theTrust, as well as the registered funds advised by affiliates of the Advisor.
Shareholder Communications to the Board. Shareholders may send communications to the Trust’s Board byaddressing the communications directly to the Board (or individual Board Members) and/or otherwise clearlyindicating in the salutation that the communication is for the Board (or individual Board Members). The shareholdermay send the communication to either the Trust’s office or directly to such Board members c/o 875 Third Avenue,New York, NY 10022. Other shareholder communications received by the Trust not directly addressed and sent tothe Board will be reviewed and generally responded to by management. Such communications will be forwarded tothe Board at management’s discretion based on the matters contained therein.
Independent Board Members
Name, Year of Birth, Position with
the Trust and Length of Time Served(1)
Business Experience and
Directorships During the Past 5 Years
Number of
Portfolios in
Fund Complex
Overseen
Other Directorships
Held by Board Member
Stephen R. Byers (1953)Chairman since 2016, and BoardMember since 2011 (formerly, LeadIndependent Board Member,2015-2016)
Independent Director (2011-present); Independent Consultant(2014-present); Director ofInvestment Management, theDreyfus Corporation (2000-2006)and Vice Chairman and ChiefInvestment Officer, the DreyfusCorporation (2002-2006).
35 The ArbitrageFunds, SierraIncomeCorporation, MutualFund DirectorsForum
George O. Elston (1964)Board Member since 2011, Chairmanof the Audit Committee since 2015
Chief Financial Officer, EyePointPharmaceuticals, Inc. (2019-present);Chief Financial Officer, Enzyvant(2018-2019); Chief Executive Officer,2X Oncology, Inc. (2017- 2018);Senior Vice President and ChiefFinancial Officer, JuniperPharmaceuticals, Inc. (2014-2016);Senior Vice President and ChiefFinancial Officer, KBI BioPharma Inc.(2013-2014); Managing Partner,Chatham Street Partners (2010-2013).
35 —
J. David Officer (1948)Board Member since 2011, Chairmanof the Nominating Committeesince 2015
Independent Director (2010-present); Vice Chairman, theDreyfus Corporation (2006-2009);President, The Dreyfus Family ofFunds, Inc. (2006-2009).
35 (Chairman of) IlexManagement Ltd;Old WestburyFunds
91

DBX ETF Trust
Board Members and Officers (Unaudited) (Continued)
Officers(2)
Name, Year of Birth, Position
with the Trust and Length of Time Served(3)
Business Experience and
Directorships During the Past 5 Years
Freddi Klassen(4) (1975)President and Chief Executive Officer,2016-present
Programmes (Head since 2021), of DWS Investment ManagementAmericas, Inc. and Manager and Chief Operating Officer of theAdvisor (2016-present). Formerly: Chief Operating Officer in theAmericas for the Traditional Asset Classes Department (2014-2020); Manager and Chief Operating Officer of DWS InvestmentManagement Americas, Inc. (2018-2020); Global Chief OperatingOfficer for Equities Technology in the Investment Bank Division atDeutsche Bank AG (2013-2014); Chief Operating Officer forExchange Traded Funds and Systematic Funds in Europe (2008-2013).
Diane Kenneally(5) (1966)Treasurer, Chief Financial Officer andController, 2019-present
Fund Administration Treasurer’s Office (Co-Head since 2018), ofDWS Investment Management Americas, Inc.; Chief FinancialOfficer and Treasurer for DWS US registered investmentcompanies advised by DWS Investment Management Americas,Inc. (2018-present); Treasurer and Chief Financial Officer, TheEuropean Equity Fund, Inc., The New Germany Fund, Inc. and TheCentral and Eastern Europe Fund, Inc. (2018-present); formerly:Assistant Treasurer for the DWS funds (2007-2018).
Frank Gecsedi(4) (1967)Chief Compliance Officer, 2010-present
AFC Compliance US (Senior Team Lead), of DWS InvestmentManagement Americas, Inc.; Compliance Department (2016-present), Vice President in the Deutsche Asset ManagementCompliance Department at Deutsche Bank AG (2013-2016) andChief Compliance Officer of the Advisor (2010-present); ChiefCompliance Officer of DWS Distributors, Inc. (2019-present); VicePresident in Deutsche Bank’s Global Markets Legal, Risk andCapital Division (2010-2012).
Bryan Richards(4) (1978)Vice President, 2016-present
Portfolio Engineering, Systematic Investments Solutions (Head), ofDWS Investment Management Americas, Inc. (2018-present);Portfolio Manager in the Passive Asset Management Departmentat DWS (2011-present); Primary Portfolio Manager for thePowerShares DB Commodity ETFs (2011-2015).
John Millette(5) (1962)Secretary, 2020-present
Legal (Associate General Counsel), DWS US Retail Legal(2003-present), of DWS Investment Management Americas, Inc.;Vice President and Secretary of DWS US registered investmentcompanies advised by DWS Investment Management Americas,Inc. (1999-present); Chief Legal Officer, DWS InvestmentManagement Americas, Inc. (2015-present); Director and VicePresident of DWS Trust Company (2016-present); Vice President,DBX Advisors LLC (2021-present); Secretary, The European EquityFund, Inc., The New Germany Fund, Inc. and The Central andEastern Europe Fund, Inc. (2011-present); formerly: Secretary ofDeutsche Investment Management Americas Inc. (2015-2017); andAssistant Secretary of DBX ETF Trust (2019-2020).
92

DBX ETF Trust
Board Members and Officers (Unaudited) (Continued)
Name, Year of Birth, Position
with the Trust and Length of Time Served(3)
Business Experience and
Directorships During the Past 5 Years
Caroline Pearson(5) (1962)Assistant Secretary, 2020-present
Legal (Senior Team Lead), DWS US Retail Legal, of DWSInvestment Management Americas, Inc.; Chief Legal Officer ofDWS US registered investment companies advised by DWSInvestment Management Americas, Inc. (2010-present); Chief LegalOfficer, DBX Advisors LLC (2020-present); Chief Legal Officer, TheEuropean Equity Fund, Inc., The New Germany Fund, Inc. and TheCentral and Eastern Europe Fund, Inc. (2012-present); formerly:Secretary, Deutsche AM Distributors, Inc. (2002-2017); andSecretary, Deutsche AM Service Company (2010-2017); and ChiefLegal Officer, DBX Strategic Advisors LLC (2020–2021).
Paul Antosca(5) (1957)Assistant Treasurer, 2019-present
Fund Administration Tax (Head), of DWS Investment ManagementAmericas, Inc.; Assistant Treasurer for DWS US registeredinvestment companies advised by DWS Investment ManagementAmericas, Inc. (2007-present).
Jeffrey Berry(5) (1959)Assistant Treasurer, 2019-present
Fund Administration (Senior Specialist), of DWS InvestmentManagement Americas, Inc.
Sheila Cadogan(5) (1966)Assistant Treasurer, 2019-present
Fund Administration Treasurer’s Office (Co-Head since 2018), ofDWS Investment Management Americas, Inc.; Assistant Treasurerfor DWS US registered investment companies advised by DWSInvestment Management Americas, Inc. (2017-present); Directorand Vice President, DWS Trust Company (2018-present); AssistantTreasurer, The European Equity Fund, Inc., The New GermanyFund, Inc. and The Central and Eastern Europe Fund, Inc.(2018-present).
Christina A. Morse(6) (1964)Assistant Secretary, 2017-present
Vice President at BNY Mellon Asset Servicing (2014-present); VicePresident and Counsel at Lord Abbett & Co. LLC (2013-2014).
Christian Rijs(4) (1980)Anti-Money Laundering Compliance Officer,since October 6, 2021
Americas Head of Anti-Financial Crime and AML Officer, of DWSInvestment Management Americas, Inc.; AML Officer, DWS TrustCompany (since October 6, 2021); AML Officer, of DWS USregistered investment companies advised by DWS InvestmentManagement Americas, Inc. (since October 6, 2021); AML Officer,The European Equity Fund, Inc., The New Germany Fund, Inc. andThe Central and Eastern Europe Fund, Inc. (since October 6, 2021.);formerly: DWS UK & Ireland Head of Anti-Financial Crime andMLRO
(1) The length of time served is represented by the year in which the Board Member joined the Board.(2) As a result of their respective positions held with the Advisor and its affiliates, these individuals are considered “interested persons” of the
Advisor within the meaning of the 1940 Act. Interested persons receive no compensation from the Funds.(3) The length of time served is represented by the year in which the officer was first elected to the Trust in such capacity.(4) Address: 875 Third Avenue, New York, New York 10022.(5) Address: 100 Summer Street, Boston, MA 02110.(6) Address: BNY Mellon Asset Servicing, 240 Greenwich Street, New York, NY 10286.
The Funds’ Statement of Additional Information (“SAI”) includes additional information about the Funds’ Board Members. The SAI is availableby calling 855-329-3837, or on the Company’s website at www.Xtrackers.com.
93

DBX ETF Trust
Additional Information (Unaudited)
Proxy Voting Policies and Procedures
The Funds’ policies and procedures for voting proxies for portfolio securities and information about how eachFund voted proxies related to its portfolio securities during the most recent 12-month period ended June 30 areavailable on our Web site — www.Xtrackers.com (click on “Resources” and “Proxy Voting” at the top of thepage) — or on the SEC’s Web site — www.sec.gov. To obtain a written copy of the Funds’ policies and procedureswithout charge, upon request, call us toll free at (855) 329-3837.
Portfolio Holdings Information
The Funds are required to file their complete schedule of portfolio holdings with the SEC for their first and thirdfiscal quarters on Form N-PORT. Copies of the filings are available without charge, upon request on the SEC’swebsite at www.sec.gov and are available by calling the Trust at 855-329-3837.
Information about each Fund’s portfolio holdings is available daily at www.Xtrackers.com.
Discount & Premium Information
Information regarding how often shares of each Fund traded on NYSE Arca at a price above (i.e.,at a premium) orbelow (i.e., at a discount) the NAV of the Fund can be found at www.Xtrackers.com.
Tax Information
Form 1099-DIV and other year-end tax information provide shareholders with actual calendar year amounts thatshould be included in their tax returns. Shareholders should consult their tax advisors.
Each Fund designates the following amounts or, if subsequently determined to be different, the maximumallowable for its period ended August 31, 2021.
Qualified DividendIncome*
DividendsReceived Deduction*
Xtrackers Emerging Markets Carbon Reduction and Climate Improvers ETF . . . 65% 0%Xtrackers MSCI EAFE ESG Leaders Equity ETF . . . . . . . . . . . . . . . . . . . . . . . . . . . . 94% 0%Xtrackers MSCI Emerging Markets ESG Leaders Equity ETF . . . . . . . . . . . . . . . . . 71% 0%Xtrackers MSCI USA ESG Leaders Equity ETF . . . . . . . . . . . . . . . . . . . . . . . . . . . . . 100% 96%Xtrackers S&P 500 ESG ETF . . . . . . . . . . . . . . . . . . . . . . . . . . . . . . . . . . . . . . . . . . . . . 100% 98%Xtrackers S&P MidCap 400 ESG ETF . . . . . . . . . . . . . . . . . . . . . . . . . . . . . . . . . . . . . 100% 95%Xtrackers S&P SmallCap 600 ESG ETF . . . . . . . . . . . . . . . . . . . . . . . . . . . . . . . . . . . 56% 55%
* The above percentage is based on ordinary income dividends paid to shareholders during each Fund’s fiscal year.
Each Fund intends to elect to pass through to shareholders the credit for taxes paid to foreign countries. Thegross foreign source income and foreign taxes paid are as follows:
Gross Foreign Income Foreign Taxes Income
Xtrackers Emerging Markets Carbon Reduction and Climate ImproversETF . . . . . . . . . . . . . . . . . . . . . . . . . . . . . . . . . . . . . . . . . . . . . . . . . . . . . . . . . . . $369,103 $22,873
Xtrackers MSCI EAFE ESG Leaders Equity ETF . . . . . . . . . . . . . . . . . . . . . . . 479,571 42,774Xtrackers MSCI Emerging Markets ESG Leaders Equity ETF . . . . . . . . . . . . 257,877 27,612
94

DBX ETF Trust
Privacy Policy Notice (Unaudited)
DBX Advisors LLC (“Advisors”) collects non-public information about you from the following sources:(i) information received from you on applications or other forms; and (ii) information about your transactions withthe Advisors, Advisors’ affiliates and third-party service providers and vendors. Advisors does not disclose anynon-public personal information about you to anyone, other than as set forth below, as permitted by applicablelaw and regulation. Advisors may disclose non-public personal information about you to the funds in which youinvest, to Advisors’ affiliates, and to non-affiliated companies that work with Advisors to service your account(s),or to provide services or process transactions that you have requested. Advisors may disclose non-publicpersonal information in situations that may include, but are not limited to, in response to legal and/or regulatoryinquiries and the proposed or actual sale, assignment merger or other transfer of all or a portion of Advisors’business to another business entity. Advisors may also disclose non-public personal information about you toparties representing you, such as your investment representative, your accountant, your tax advisor, or to otherthird parties at your direction/consent. Advisors will not sell, rent, license or trade your personal and financialinformation to or with third parties for their own direct marketing use unless you give us general or specificconsent to do so. If you decide to close your account(s) or become an inactive customer, Advisors will adhere tothe privacy policies and practices as described in this notice. Advisors restricts access to your personal andaccount information to those employees who need to know that information to provide products and services toyou. Advisors maintains reasonable and customary physical, electronic and procedural safeguards to guard yournon-public personal information.
California residents may go to https://fundsus.dws.com/us/en-us/legal-resources/privacy-policy.html to obtainadditional information relating to their rights under California state law.
Advisors reserves the right, at their discretion, to change, modify, add, or remove portions of this Privacy Policy
Notice, and any of the policies described herein, at any time. Advisors will indicate any such changes to the
Privacy Policy Notice at the privacy link which can be found at www.Xtrackers.com. At all times, you are bound
by the then-current version of the Privacy Policy and all applicable laws. Advisors highly recommends that you
review this Privacy Policy Notice from time to time to ensure that you are familiar with the most recent version.
The examples contained in this Privacy Policy Notice are illustrations; they are not intended to be exclusive.
95

This Page is Intentionally Left Blank

This Page is Intentionally Left Blank

This Page is Intentionally Left Blank

DBX ETF Trust
This report is intended for the shareholders of the DBX ETF Trust.This report must be preceded or accompanied by a prospectus.
Investing involves risk, including the possible loss of principal. ESG criteria in a Fund’s investment strategydoes not guarantee a return or protect against loss, limits the types and number of investment opportunitiesavailable to the Fund and, as a result, the Fund may underperform other funds that do not have an ESG focus.Stocks may decline in value. Foreign investing involves greater and different risks than investing in UScompanies, including currency fluctuations, less liquidity, less developed or less efficient trading markets, lackof comprehensive company information, political instability and differing auditing and legal standards.Emerging markets tend to be more volatile and less liquid than the markets of more mature economies, andgenerally have less diverse and less mature economic structures and less stable political systems than those ofdeveloped countries. Stocks of medium-sized companies involve greater risk than securities of larger, moreestablished companies. Small company stocks tend to be more volatile than medium-sized or large companystocks. Each Fund, except EASG, is currently non-diversified and can take larger positions in fewer issues,increasing its potential risk. Funds investing in a single industry, country or in a limited geographic regiongenerally are more volatile than more diversified funds. Performance of a Fund may diverge from that of itsUnderlying Index due to operating expenses, transaction costs, cash flows, use of sampling strategies oroperational inefficiencies. In certain situations, it may be difficult or impossible to sell an investment at anacceptable price. Any fund that focuses in a particular segment of the market or region of the world willgenerally be more volatile than a fund that invests more broadly. An investment in any Fund should beconsidered only as a supplement to a complete investment program for those investors willing to accept therisks associated with the Fund. Please read the prospectus for more information.War, terrorism, economic uncertainty, trade disputes, public health crises (including the ongoing pandemicspread of the novel coronavirus) and related geopolitical events could lead to increased market volatility,disruption to U.S. and world economies and markets and may have significant adverse effects on the Fundsand their investments.Shares of the Funds are bought and sold at market price (not NAV) throughout the day on the NYSE Arca, Inc.Transactions in Fund shares may result in brokerage commissions and may generate tax consequences. Therecan be no assurance that an active trading market for shares of a Fund will develop or be maintained.DBX ETF Trust Funds are distributed by ALPS Distributors, Inc. (“ALPS”). The Funds are managed by DBXAdvisors LLC which is not affiliated with ALPS.The brand DWS represents DWS Group GmbH & Co. KGaA and any of its subsidiaries such as DWSDistributors, Inc. which offers investment products or Deutsche Investment Management Americas Inc. andRREEF America L.L.C. which offer advisory services.The Funds or securities referred to herein are not sponsored, endorsed, issued, sold or promoted by MSCI, andMSCI bears no liability with respect to any such Funds or securities or any index on which such Funds orsecurities are based. The prospectus contains a more detailed description of the limited relationship MSCI haswith DBX Advisors LLC and any related funds.The S&P 400 ESG Index, S&P 500 ESG Index and S&P 600 ESG Index are products of S&P Dow Jones IndicesLLC or its affiliates (“SPDJI”), and have been licensed for use by DBX Advisors. S&P®, S&P 400®, S&P 500®
and S&P 600®, are registered trademarks of Standard & Poor’s Financial Services LLC (“S&P”); Dow Jones® isa registered trademark of Dow Jones Trademark Holdings LLC (“Dow Jones”); and these trademarks havebeen licensed for use by SPDJI and sublicensed for certain purposes by DBX Advisors. The ESG Scores used inthe Indexes are calculated by SAM. DBX Advisors LLC. Xtrackers ETFs are not sponsored, endorsed, sold orpromoted by SPDJI, Dow Jones, S&P, their respective affiliates or SAM, and none of such parties make anyrepresentation regarding the advisability of investing in such ETFs, nor do they have any liability for any errors,omissions, or interruptions of the S&P 400 ESG Index, S&P 500 ESG Index and S&P 600 ESG Index.EMCR (the “Fund”) is not sponsored, endorsed, sold or promoted by Solactive. Neither Solactive nor any otherparty makes any representation or warranty, express or implied, to the owners of the Fund or any member ofthe public regarding advisability of investing in funds generally or in this Fund particularly or the ability of theUnderlying Indexes to track general stock market performance. Neither Solactive nor any other party makes anyexpress or implied warranties, and Solactive hereby expressly disclaims all warranties of merchantability orfitness for a particular purpose with respect to the Underlying Indexes or any data included therein. Theprospectus contains a more detailed description of the limited relationship Solactive has with DBX Advisors LLCand any related funds.
Copyright © 2021 DWS Group. All rights reserved. XtrackersTM is a trademark of DWS Investment GmbH. Allother trademarks, servicemarks or registered trademarks are the property of their respective owners.
Not FDIC Insured | No Bank Guarantee | May Lose Value

DBX ETF Trust
Investment advisorDBX Advisors LLC875 Third AvenueNew York, NY 10022
Administrator, custodian, fundaccounting agent, lendingagent & transfer agentThe Bank of New York Mellon240 Greenwich StreetNew York, NY 10286
DistributorALPS Distributors, Inc.1290 BroadwaySuite 1000Denver, CO 80203
Independent registered publicaccounting firmErnst & Young LLPOne Manhattan WestNew York, NY 10001
Legal counselVedder Price P.C.1633 BroadwayNew York, NY 10019
R-070013-3 (10/21) DBX004977 (10/22)