Audited Annual Report as at December 31, 2009 - HSBC HK
204
Société d'Investissement à Capital Variable Luxembourg R.C.S. Luxembourg B 81.110 Aerogolf Center, 1A Hoehenhof L-1736 Senningerberg Grand Duchy of Luxembourg Audited Annual Report as at December 31, 2009 No subscription can be received on the basis of this report. Subscriptions are only valid if made on the basis of the current Prospectus of the Fund.
-
Upload
khangminh22 -
Category
Documents
-
view
1 -
download
0
Transcript of Audited Annual Report as at December 31, 2009 - HSBC HK

Société d'Investissement à Capital Variable
Luxembourg
R.C.S. Luxembourg B 81.110
Aerogolf Center, 1A HoehenhofL-1736 Senningerberg
Grand Duchy of Luxembourg
Audited Annual Report
as at December 31, 2009
No subscription can be received on the basis of this report. Subscriptions are only valid if madeon the basis of the current Prospectus of the Fund.


1
INTERNATIONAL OPPORTUNITIES FUNDS
TABLE OF CONTENTS
Directory, Administration and Management 2
General Information 3
Report of the Board of Directors 4
Report of the Réviseur d’Entreprises 55
Combined Statement of Net Assets 56
Combined Statement of Operations and Changes in Net Assets 62
Statement of Changes in Shares Outstanding 68
Statistics 80
Statement of InvestmentsAsia Pacific Equity(*) 92
Asian Bond 94
Asian Dynamic(*) 99
Asian Equity 101
Asian Equity Income 103
Asian Infrastructure Equity 105
Asian Local Bond 107
Asian Property Securities 112
China Equity 114
Dragon Peacock 115
Emerging Europe, Middle East and Africa Dynamic(*) 117
European Investment Grade Bond 118
Global Market Navigator 126
Global Technology 127
Greater China Equity 129
Hong Kong Equity 131
India Equity 132
Indonesia Equity 133
Japan Dynamic(*) 135
Japan Equity 136
Japan Smaller Companies(*) 138
Korea Equity(**) 139
Latin American Equity(*) 140
Malaysia Equity 141
North America 142
North American Value(*) 144
Pan European 145
Philippines Equity 147
Taiwan Equity 148
Thailand Equity 149
US Bond(*) 150
US Corporate Bond(*) 157
US High Investment Grade Bond 167
US High Yield Bond 172
US Investment Grade Bond 177
Vietnam Equity(**) 185
World Value Equity 186
Notes to the Financial Statements 191
(*) Not authorized in Hong Kong and not available to Hong Kong residents.(**) The Sub-Funds were de-registered in 2009 and are not authorised for sale in Hong Kong as of December 31, 2009.

2
INTERNATIONAL OPPORTUNITIES FUNDS
DIRECTORY, ADMINISTRATION AND MANAGEMENT
Board of Directors and Officers
ChairmanMr Stephen Paul BICKELLRegional Risk DirectorPrudential Corporation Asia, Hong Kong
DirectorsMr Suraj MISHRA (resigned effective June 30, 2009)Regional Head of Business Development – PCA FundsPrudential Asset Management (Singapore) Limited
Mr Peter Martin LLOYDChief Actuary, AsiaPrudential Corporation Asia, Hong Kong
Mr Guy STRAPPRegional Head of Investment Management (Asia) andDirectorPrudential Asset Management (Hong Kong) Limited
Mr Kevin GIBSONChief Investment Officer, Japanese EquitiesPrudential Asset Management (Singapore) Limited
Mr Manuel HAUSERIndependent DirectorGrand Duchy of Luxembourg
Day-to-day ManagersMr Manuel HAUSERIndependent day-to-day managerGrand Duchy of Luxembourg
Mr SWAMINATHAN B.Regional Chief Operations Officer – FundsRegional OperationsPrudential Asset Management (Singapore) Limited
Administration and Management
Registered officeAerogolf Center, 1A, HoehenhofL-1736 Senningerberg,Grand Duchy of Luxembourg
Investment ManagerPrudential Asset Management (Singapore) Limited30 Cecil Street, # 20-01 Prudential TowerSingapore 049712
Administration and Management (continued)
Investment Sub-ManagersFor the European Investment Grade Bond, the PanEuropean and the World Value Equity Sub-Funds,M&G Investment Management LimitedLaurence Pountney Hill, London EC4R OHHUnited Kingdom
For the Global Technology Sub-Fund,Henderson Global Investors Limited4 Broadgate, London EC2M 2DAUnited Kingdom
For the China Equity, the Greater China Equityand the Hong Kong Equity Sub-Funds,Prudential Asset Management (Hong Kong) Limited13/F, One International Finance Centre,1 Harbour View Street,Central, Hong Kong(change of address with effect from May 4, 2009)
For the North America, the North American Value, the US Bond, the US Corporate Bond, the US HighInvestment Grade Bond, the US High Yield Bond and the US Investment Grade Bond Sub-Funds,PPM America, Inc.225 West Wacker Drive, Suite 1200Chicago, Illinois 60606United States of America
Custodian, Central Administration, Registrar andTransfer Agent and Domiciliary and Corporate AgentThe Bank of New York Mellon (Luxembourg) S.A.[formerly known as The Bank of New York (Luxembourg) S.A.]Aerogolf Center, 1A HoehenhofL-1736 SenningerbergGrand Duchy of Luxembourg
AuditorKPMG Audit S.à r.l.9, Allée SchefferL-2520 LuxembourgGrand Duchy of Luxembourg
Legal AdvisorKremer Associés & Clifford Chance2-4, Place de ParisL-1011 LuxembourgGrand Duchy of Luxembourg

3
INTERNATIONAL OPPORTUNITIES FUNDS
GENERAL INFORMATION
Current ProspectusThe SICAV’s Prospectus dated September 2009 may be obtained from the Registered Office of the SICAV. Copies ofthe Company’s Articles of Association may also be obtained, free of charge, from the Registered Office of the SICAV.
During the year, the Prospectus and the Simplified Prospectus have been amended in line with CSSF approval.Please refer to the Prospectus and the Simplified Prospectus dated September 2009 to have the current applicableterms and conditions.
The Company is governed by the Luxembourg Law dated December 20, 2002 (the “2002 Law”). The Company fulfilsthe provisions of article 27 applicable to the investment companies which have not designated a managementcompany i.e. self managed investment companies. Thus, the Company complies with the provisions of directives2001/107/EC and 2001/108/EC of the European Parliament and of the Council of January 21, 2002 amendingthe Council Directive 85/611/EEC on the coordination of laws, regulations and administrative provisions relating toundertakings for collective investment in transferable securities (UCITS) with a view to regulating managementcompanies and simplified prospectuses respectively with regards to investments of UCITS.
Annual General MeetingThe annual general meeting of Shareholders of the SICAV will be held at the Registered Office of the SICAV or atsuch other place in Luxembourg on the second Friday of April in each year at 11 a.m., or if any such day is not aBusiness Day in Luxembourg, on the next following Business Day in Luxembourg.
Notices of all general meetings will be sent to the holders of registered Shares by post at least 8 days prior to themeeting at their addresses in the register of Shareholders.
The notices of all general meetings of Shareholders may be published in any newspapers as the Board of Directorsmay decide.
Report and AccountsThe financial year-end of the SICAV will be the last day of December of each year.
Audited annual reports will be published within 4 months after the financial year-end and unaudited semi-annualreports will be published within 2 months after the end of the relevant period. Such reports will be mailed to eachregistered Shareholder at their registered address and will be made available at the Registered Office of the SICAVduring normal business hours.
Publication of PricesPrices will be made available at the registered office of the SICAV on a daily basis and on Bloomberg and Reuters’Lipper Hindsight. The SICAV will further arrange for regular publication of the prices in the Financial Times, or insuch other newspapers as the Board of Directors may decide on.
Purchases and SalesA detailed list of investments purchased and sold for any Sub-Fund during the year is available upon request, free of charge, from the Registered Office of the SICAV.

4
INTERNATIONAL OPPORTUNITIES FUNDS
REPORT OF THE BOARD OF DIRECTORSAS AT DECEMBER 31, 2009
Dear Shareholders,
2009 was a year of extremes. Markets moved from an early state of total risk aversion to one of almost unrestrainedappetite by the end of the year, largely due to quick action by the world’s central banks. Their numerous liquiditymeasures restored stability to the credit markets while the fiscal stimuli packages propped up their economies.As the year progressed, better-than-expected economic numbers from the US (the epicenter of the credit crisis) andencouraging corporate earnings rekindled investor optimism. For investors starved of opportunities, any news thatwas modestly better, not necessarily good, was sufficient to pile into the market in anticipation of a recovery. This setthe stage for the sharp market rallies.
Global equities have made a tremendous recovery in 2009, gaining 27% (as measured by the MSCI World equities)after a dismal drop of 42% in 2008. The strength of the rebound has caught many by surprise, given the numerousdoomsday scenarios that were painted at the start of the year. Many markets not only seem to have weathered thestorm, but also posted spectacular gains.
Emerging markets have been among the biggest beneficiaries of the market turnaround, generating exceptional gainsin 2009. To a large extent, the weak US dollar fuelled investment in these countries with higher yielding currencies.Besides this, investors were drawn to the higher growth rates and favorable demographics in these markets relativeto the developed countries. Market activity was also underpinned by the low interest rates around the globe.
2009 was also a good year for credit markets. Investors’ preference for safe haven assets along with the prospect offurther interest rate easing by global central banks continued to underpin the government bond markets at the startof the year. By late March, however, improved investor sentiment also led to a move out of government bonds intocorporate bonds and equities. Falling global inflation and attractive valuations were also supportive of the corporatebond market.
While there is no denying that the global economy is on mend, the near default of Dubai World, the governmentbacked company behind some of the emirate's most ambitious projects, was an unpleasant but timely reminder thatthe world has yet to put the financial crisis behind it. Greece’s debt crisis also signals that all is still not well withinthe Eurozone.
Against such a background, the IOF range of equity Sub-Funds posted attractive returns, ranging from over 29%to 137%. The bond Sub-Funds too posted healthy gains. Performance details of the respective Sub-Funds are statedlater in the report. In 2009, one new Sub-Fund was launched – the IOF – Emerging Europe, Middle East and AfricaDynamic.
Going forward, the Investment Manager expects equities to come under pressure when central banks start to tightenmonetary policy. Market returns will also likely be driven by improving economic data and corporate earnings.Emerging markets should continue to outpace the developed ones, but after such strong gains in 2009, markets willlikely be susceptible to profit taking.
On the other hand, robust demand and liquidity should continue to underpin credit markets in 2010. Excess cashin the system will likely continue to be deployed across risk asset classes as investors seek yield in the current lowinterest rate environment.

5
INTERNATIONAL OPPORTUNITIES FUNDS
REPORT OF THE BOARD OF DIRECTORSAS AT DECEMBER 31, 2009 (continued)
International Opportunities Funds – Asia Pacific Equity (“Sub-Fund”)
Performance
*August 21, 2007, Class E†Annualised
Source: Prudential Asset Management, (Singapore) Limited (Sub-Fund data) & Bloomberg (Benchmark), in USD, bid-to-bid, net income reinvested.
Manager commentary
Sub-Fund performanceThe stock markets of Asia ex-Japan climbed sharply in full-year 2009 after having been punished in 2008, when afinancial crisis shook the world. Gains in 2009 occurred as the economies of the region and the world appeared tostabilize and begin recovering. For the 12 months ended December 31, 2009 the Sub-Fund climbed 71.3% tooutperform its benchmark, which rose 73.7%.
Factors affecting performanceStock selection among the financial and industrial sectors contributed strongly to the Sub-Fund’s performance.In contrast, stock selection in consumer staples and telecommunication services and asset allocation totelecommunication services detracted from performance. Hong Kong and Australia were big contributors while Korearestrained performance.
Positions in Tata Consultancy Services Ltd. and Rio Tinto Ltd. were key contributors to the Sub-Fund. Eachoutperformed the region. Australia-based Rio is the world’s second largest mining company and benefited from a rallyin cyclical stocks. Tata Consultancy is among India’s largest and oldest information technology services businesses.
Commonwealth Bank of Australia and China Zhongwang Holdings Ltd. were big detractors from Sub-Fundperformance. The Sub-Fund held no position in Commonwealth Bank because of concern about valuation and baddebts. But the stock outperformed the region, lifted by investment returns from an affiliated life insurance company.
China Zhongwang makes aluminium goods but was hit by a news report that questioned information about companycustomers. Zhongwang rejected the report as groundless. We expect the company to gain from Beijing’s economicstimulus spending.
Key changes to the portfolioNew positions were established in POSCO, China Pacific Insurance (Group) Co. Ltd. and the GPT Group.
POSCO is the world’s fourth-largest steelmaker and, the fund manager believes, offers the best value among Asiansteel stocks. The Korean company is benefiting in two ways from a recovery of spot steel prices – earnings haveturned around and investor sentiment has risen. China Pacific is involved in life and property insurance and the fundmanager sees it as attractively valued. GPT is a leading property trust in Australia, where such companies havelagged behind ex-Japan Asia’s real estate sector.
Outlook and strategyWe believe ex-Japan Asian economic growth will exceed that of the world’s developed markets in the coming fewyears, led by China, India and Indonesia. We believe the medium-term outlook for the region’s economies andmarkets is positive. We believe that China and India are becoming key participants in global economic growth,and expect the thrust of investment in Indonesia to pick up.
0
20
40
60
80
Since Launch*†1-Year
Tota
l ret
urn
US
$ (
%)
78.273.7
1.4 1.0
MSCI AC Asia Pacific ex Japan IndexInternational Opportunities Funds – Asia Pacific Equity

6
INTERNATIONAL OPPORTUNITIES FUNDS
REPORT OF THE BOARD OF DIRECTORSAS AT DECEMBER 31, 2009 (continued)
International Opportunities Funds – Asian Bond (“Sub-Fund”)
Performance
*March 1, 2005, Class A†Annualised
Source: Prudential Asset Management (Singapore) Limited (Sub-Fund data) & Bloomberg (Benchmark), in USD, bid-to-bid, net income reinvested.
Manager commentary
Sub-Fund performanceAsian credit markets delivered strong performance on the back of improved fundamentals and market risk appetiteover the course of 2009. Global macro data were weak at the beginning of the year but gradually showed signs ofstabilization, thanks largely to bold policy actions from authorities around the world. The recovery of Asia ex Japaneconomies was particularly robust, and the region’s credit fundamentals continued to improve, as evidenced by theupgrades of several Asian countries’ sovereign credit ratings in the year. Sentiment toward equity and credit marketsturned positive since March on more upbeat economic and corporate outlook. The Sub-Fund returned 28.5% in theyear ended December 31, 2009 in USD terms, compared with 28.3% for the benchmark.
Factors affecting performanceThe Sub-Fund benefited in the review period from its overweight in high-yield corporates and high-yield quasi-sovereigns, as they were among the best performing sectors. The Sub-Fund’s overweight in financials was a dragto performance initially as the sector lagged behind in the market rally, but the sector exhibited a strong catch-upsubsequently and contributed to the Sub-Fund’s outperformance. Nevertheless, the portfolio’s underweight in high-yield sovereigns, especially the distressed ones, had a negative impact on performance as their prices reboundedstrongly following improvement in their credit outlook and market sentiment.
Key changes to the portfolioWe took advantage of the compelling valuation early in the year to increase credit exposure, including activelyparticipating in new issuance. After the strong market rally along the year, we turned more selective and used anyredemption outflow to trim our positions in areas where valuation had become relatively expensive.
Outlook and strategyWhile recent data tend to indicate a brighter outlook for the global economy, we are still mindful that the recoverycontinues to depend on government stimulus. In addition, the sovereign credit risk of some developed and emergingeconomies is on the rise pursuant to years of debt-funded fiscal stimulus programs, as evidenced by some negativerating actions of late. Nevertheless, we believe individual sovereign credit problems are likely to have limitedcontagion. We also remain constructive on the Asian credit markets in view of the robust credit fundamentals and stillreasonable valuations.
0
10
20
30
Since Launch*†3-Year†1-Year
Tota
l ret
urn
US
$ (
%)
28.5 28.3
4.56.8
5.46.7
JP Morgan Asia Credit IndexInternational Opportunities Funds – Asian Bond

7
INTERNATIONAL OPPORTUNITIES FUNDS
REPORT OF THE BOARD OF DIRECTORSAS AT DECEMBER 31, 2009 (continued)
International Opportunities Funds – Asian Dynamic (“Sub-Fund”)
Performance
*July 5, 2006, Class D†Annualised
Source: Prudential Asset Management (Singapore) Limited (Sub-Fund data) & Bloomberg (Benchmark), in USD, bid-to-bid, net income reinvested.
Manager commentary
Sub-Fund performanceThe Sub-Fund returned 90.8% over the year versus 72.5% by the MSCI Asia Ex Japan Index. This is anoutperformance of 18.3% over the reporting period.
Factors affecting performanceThe most significant impact to the relative performance of the Sub-Fund over 2009 came from stock selection. Mostnotable was stock specific strength within cyclical sectors such as financials, materials and consumer discretionary.At a country level, Hong Kong and India saw much of this outperformance.
On a stock level, the largest contribution for the year came from China Shanshui Cement Group Ltd, whichoutperformed on efficiency gains and support from Chinese infrastructure demand. In India IVRCL Infrastructure andProjects Ltd, Sun TV Network Ltd and Unitech Ltd outperformed as these stocks’ individual strength was supportedby the outlook for India following the national elections. Indonesia’s PT Astra International Tbk and Hong Kong’sTechtronic Industries Co Ltd also contributed strongly to performance.
Detraction to performance came from several Korean companies S1 Corporation, discount store operator ShinsegaeCo Ltd and Hankook Tire Co Ltd. In China, aluminium extrusion company China Zhongwang Holdings Ltd and ChinaCommunication Construction Co Ltd detracted from performance.
Key changes to the portfolioDuring the year, we continued to manage the portfolio with high conviction positions taking profit in outperformingstocks and looking for attractively valued stocks. During the first half of 2009, we added several new positionsincluding Rural Electrification Corp Ltd, China Zhongwang Holdings Ltd, Unitech Ltd, China Telecom Corp Ltd,PT Bank Mandiri Tbk and Li & Fung Ltd.
We sold out of stocks including Hon Hai Precision Industry Co Ltd, China Unicom Ltd, Hanwa Chemical and AUOptronics Corp. We also reduced the Sub-Fund’s position in top performing stock China Shanshui cement Group Ltd.
Later in the year, we added new positions in companies such as Max India Ltd, Powertech Technology Inc, POSCO,Hindalco Industries Ltd, Sun TV Network Ltd and LIC Housing Finance Ltd. We also sold out of companies such asPT Bank Mandiri Tbk, Rural Electrification Corp Ltd, Shui On Land Ltd, Swire Pacific Ltd, Unitech Ltd, China TelecomCorp Ltd, Bharti Airtel Ltd and ICICI Bank Ltd.
Outlook and strategyThe fund manager believes that Asia ex Japan economic growth will exceed that of the world’s developed markets inthe coming few years. The region will probably be led by China, India and Indonesia. He believes the medium-termoutlook for the region’s economies and markets is positive. The manager believes that China and India are becomingkey participants in global economic growth. He expects the thrust of investment in Indonesia to pick up. The fundmanager will watch each market for any sign of a slowdown of government economic stimulus spending. In China,he will watch policies that address asset bubbles and inflation.
0
20
40
60
80
100
Since Launch*†3-Year†1-Year
Tota
l ret
urn
US
$ (
%)
90.8
72.5
10.95.4
17.011.0
MSCI AC Asia ex Japan IndexInternational Opportunities Funds – Asian Dynamic

8
INTERNATIONAL OPPORTUNITIES FUNDS
REPORT OF THE BOARD OF DIRECTORSAS AT DECEMBER 31, 2009 (continued)
International Opportunities Funds – Asian Equity (“Sub-Fund”)
Performance
*August 26, 2005, Class A†Annualised
Source: Prudential Asset Management (Singapore) Limited (Sub-Fund data) & Bloomberg (Benchmark), in USD, bid-to-bid, net income reinvested.
Manager commentary
Sub-Fund performanceThe stock markets of Asia ex-Japan climbed sharply in full-year 2009 after having been punished in 2008, when afinancial crisis shook the world. Gains in 2009 occurred as the economies of the region and the world appeared tostabilize and begin recovering. For the 12 months ended December 31, 2009 the Sub-Fund climbed 76.5% tooutperform its benchmark, which rose 72.5%.
Factors affecting performanceStock selection among the financial, information technology and utility sectors contributed strongly to the Sub-Fund’sperformance. In contrast, stock selection in consumer discretionaries and materials and asset allocation to consumerdiscretionaries detracted from performance. Taiwan and Hong Kong were big contributors to the Sub-Fund. Korearestrained performance.
Positions in AAC Acoustic Technologies Holdings Inc. and Sterlite Industries (India) Ltd. were key contributors to theSub-Fund’s performance. Each outperformed the region. AAC’s market share is being driven increasingly by newproducts and customers, and valuation is not expensive, the fund manager believes. Sterlite is one of the world’slowest-cost producers of zinc, copper and aluminium and seems relatively cheap.
Positions in China Zhongwang Holdings Ltd. and Shinsegae Co. Ltd. were big detractors from Sub-Fund performance.Each underperformed the region. Zhongwang makes aluminium goods but was hit by a news report that questionedinformation about company customers. Zhongwang rejected the report as groundless. We expect the company to gainfrom Beijing’s economic stimulus spending.
Shinsegae, an operator of department and discount stores in Korea, suffered because company sales appearedweak. We believe valuations are attractive.
Key changes to the portfolioNew positions were established in Taiwan Semiconductor Manufacturing Co. Ltd., China Pacific Insurance (Group) Co.Ltd. and Shanda Games Ltd.
Taiwan Semiconductor is one of the world’s largest semiconductor foundries; its dividend yield and valuation seemattractive. The Sub-Fund participated in the Hong Kong initial public offer of China Pacific, which is involved in lifeand property insurance and which the fund manager sees as attractively valued. Shanda is a leading distributor ofonline games in China. A substantial portion of revenue is generated by games that thousands of fee-payingsubscribers can play simultaneously.
Outlook and strategyWe believe ex-Japan Asian economic growth will exceed that of the world’s developed markets in the coming fewyears, probably led by China, India and Indonesia. We believe the medium-term outlook for the region’s economiesand markets is positive. We believe that China and India are becoming key participants in global economic growth,and expect the thrust of investment in Indonesia to pick up.
0
20
40
60
80
Since Launch*†3-Year†1-Year
Tota
l ret
urn
US
$ (
%)
76.572.5
2.6 5.010.4 12.7
MSCI AC Asia ex Japan IndexInternational Opportunities Funds – Asian Equity

9
INTERNATIONAL OPPORTUNITIES FUNDS
REPORT OF THE BOARD OF DIRECTORSAS AT DECEMBER 31, 2009 (continued)
International Opportunities Funds – Asian Equity Income (“Sub-Fund”)
Performance
*September 5, 2007, Class A†Annualised
Source: Prudential Asset Management, (Singapore) Limited (Sub-Fund data) & Bloomberg (Benchmark), in USD, bid-to-bid, net income reinvested.
Manager commentary
Sub-Fund performance2009 has been a challenging year in which to manage high yield equity exposure. The MSCI Asia Pacific ex-Japanregion has rallied 72.5% in US$ terms bringing the regional yield down to 2.4 % at the end of December from 5.3%at the beginning of the year. The Sub-Fund gained 55.1%, underperforming its benchmark’s return of 73.7%.
Factors affecting performanceIn the early part of the year, our lower volatility yield seeking investment mandate protected our returns andcontributed to strong outperformance as the markets stumbled on macro economic concerns. Since March however,the extensive monetary and fiscal stimulus has buoyed equity markets and we have seen defensive high yieldingTelecommunication Services and Utilities companies languish as higher beta Materials, Energy and Real Estatenames soared. The fund manager’s focus has remained on protecting the portfolio yield whilst at the same timeprotecting the portfolio from being exposed to high country or sector risk.
Key changes to the portfolioThroughout the year, the portfolio was actively managed to reflect the yield dynamics of the region and theconvictions of the fund manager. In the first half of 2009, notable purchases included GAIL (India) Limited, The Wharf(Holdings) Limited and Macquarie Group Limited.
A position was started in GAIL (India) Limited as it had an above average yield with a payout of only 35% and thecompany is seen as the key beneficiary of growth in India’s gas production and utilization. A position was initiated inThe Wharf (Holdings) Limited with the stock trading at a discount to Net Asset Value, making it a major laggardrelative to other regional real estate names. The position gave us access to two of the most successful andrecession resilient malls in Hong Kong, moving the portfolio toward a neutral position in the Hong Kong retail space.Shares of Macquarie Group Limited were acquired through a placement at a discount to pre-deal pricing. We believewe were acquiring the future profit streams from non-capital intensive businesses at a bargain.
Other notable purchases included Samsung Fire & Marine Insurance Co., Ltd, Cheung Kong (Holdings) Limited andWoolworths Holdings Limited. Samsung Fire & Marine Insurance Co., Ltd was added to the portfolio as its shareprice experienced some weakness in the second half of the year and is expected to benefit from a rising interest ratecycle in 2010. Cheung Kong (Holdings) Limited had been a major laggard. It is our opinion that with the largest land-bank in HK, it is well placed to benefit from the tight supply environment over the mid-long term. Australia-basedWoolworths Holdings had been a standout laggard in the equity rally in the second half of 2009. That, coupled withits defensive business led the fund manager to start a position on price weakness.
Over the 12 months, notable exits include Texwinca Holdings Limited and Singapore Press Holdings Limited andPhilippine Long Distance Telephone Co. Texwinca Holdings Limited is an off benchmark stock. After we bought thestock, it gained 119% and was trading at its historical peak valuations and share price. We gradually sold it down
-20
0
20
40
60
80
Since Launch*†1-Year
Tota
l ret
urn
US
$ (
%)
55.1
73.7
-3.8 -2.7
MSCI AC Asia Pacific ex Japan IndexInternational Opportunities Funds – Asian Equity Income

10
INTERNATIONAL OPPORTUNITIES FUNDS
REPORT OF THE BOARD OF DIRECTORSAS AT DECEMBER 31, 2009 (continued)
and used its proceeds for other convictions. The fund manager also exited Singapore Press Holdings Limited onnews of an expensive property acquisition and lack of clarity on future strategy in real estate. Philippine LongDistance Telephone Co. was also eliminated from the portfolio as the stock was looking fully valued.
Outlook and strategyConsensus economic growth estimates as well as earnings forecasts for Asia have risen in recent months. At currentlevels, we believe the valuation of Asian equities is modestly above fair.
Asia’s strong stock market performance in the year to date and the region’s modestly-elevated valuation are likely tobe challenged in the near term by a weak economic recovery among the world’s developed markets and thetightening of monetary policy at home.
We believe ex-Japan Asian economic growth will exceed that of the world’s developed markets in the coming fewyears, led by China, India and Indonesia. We believe the medium-term outlook for the region’s economies andmarkets is positive as Asia’s fundamentals generally remain better than those of several developed markets.

11
INTERNATIONAL OPPORTUNITIES FUNDS
REPORT OF THE BOARD OF DIRECTORSAS AT DECEMBER 31, 2009 (continued)
International Opportunities Funds – Asian Infrastructure Equity (“Sub-Fund”)
Performance
*October 1, 2007, Class A†Annualised
Source: Prudential Asset Management (Singapore) Limited (Sub-Fund data) & Bloomberg (Benchmark), in USD, bid-to-bid, net income reinvested.
Manager commentary
Sub-Fund performanceThe Sub-Fund returned 39.7% over the year versus 72.5% by the MSCI Asia Ex Japan Index. This is anunderperformance of 32.8% over the reporting period.
Factors affecting performanceThe most significant impact to relative performance of the fund over 2009 was the divergence in sector performance.Very large structural underweight positions in Financials, IT and Consumer Discretionary stocks detracted fromperformance as these sectors rallied very strongly over the year. Significant overweight positions in infrastructuresectors such as Utilities, Telecoms and Industrials hurt performance as these sectors heavily underperformed themarket rally. Within Telecom and Utility sectors we saw positive contribution from stock picking while in Industrialstocks we were hurt by some stock specific events.
At a stock level, positive performance came from companies such as China Shipping Container Lines Co Limited,Banpu Public Company Limited, Energy Development Corporation, POSCO and Siam Cement Public Co. These wereoutweighed by a drag on performance from names in China such as China Railway Group Limited, China MobileLimited, China Resources Power Holdings Co Limited and China Zhongwang Holdings Limited. Elsewhere we sawdetractors in India from Bharti Airtel Limited and in Korea from Korea Electric Power Corporation.
Key changes to the portfolioDuring the year we continued to look for opportunities to sell stocks to lock in strong performance while addingnames that had lagged the rally and looked attractive. In this light, we sold out of Guangdong Investments Limited,Singapore Telecommunications Limited and China Shipping Container Lines Co Limited. We sold out of a favouritestock Angang Steel Co Limited as it reached what we felt was an attractive level. We added to some names that webelieve were undervalued by the market such as Chinese companies, China Zhongwang Holdings Limited andGuangshen Railway Co Limited, Thai company Banpu Public Co Limited, and in Indian company Sterlite IndustriesIndia Limited. In Korea, we added Hyundai Engineering and Construction Co holdings to our Sub-Fund.
Outlook and strategyThe bull market in 2009 was characterised by a sharp rebound in highly cyclical sectors such as energy, materialsand financials and under-performance of large and good quality names. However, the fund manager believes that thistrend will not continue into 2010 taking into consideration a few important factors such as 1) global macro-economicsituation is still fluid especially considering a potential withdrawal in government stimuli and easy monetary policyand 2) end-demand in developed economies will remain sluggish amid continued financial deleveraging. In thisenvironment, the manager believes infrastructure companies with solid long-term projects and steady cash-flow willfare well and they remain the main focus of the Sub-Fund.
-20
0
20
40
60
80
Since Launch*†1-Year
Tota
l ret
urn
US
$ (
%)
39.7
72.5
-6.2 -8.2
MSCI AC Asia ex Japan IndexInternational Opportunities Funds – Asian Infrastructure Equity

12
INTERNATIONAL OPPORTUNITIES FUNDS
REPORT OF THE BOARD OF DIRECTORSAS AT DECEMBER 31, 2009 (continued)
International Opportunities Funds – Asian Local Bond (“Sub-Fund”)
Performance
*September 5, 2007, Class A†Annualised
Source: Prudential Asset Management (Singapore) Limited (Sub-Fund data) & Bloomberg (Benchmark), in USD, bid-to-bid, net income reinvested.
Manager commentary
Sub-Fund performanceAsian local bond markets delivered strong performance on the back of improved fundamentals and market riskappetite over the course of 2009. Global macro data were weak at the beginning of the year but gradually showedsigns of stabilization, thanks largely to bold policy actions from authorities around the world. The recovery of Asia exJapan economies was particularly robust, and the region fundamentals continued to improve, as evidenced by theupgrades of several Asian countries’ sovereign credit ratings in the year. Asian currencies generally strengthenedagainst the US Dollar from the second quarter of 2009 onwards. Capital inflow returned to the region in a strongfashion, in line with the improving global risk appetite for emerging market assets. Asian central banks tried tomoderate the impact on their currencies by intervening to support the US Dollar. The Sub-Fund rose 10.4% in theyear ended December 31, 2009 in USD terms, outperforming the benchmark which returned 7.5%.
Factors affecting performanceOutperformance for the year resulted largely from an improvement in market sentiment and liquidity which benefitedthe Sub-Fund’s overweight allocation to corporate bonds and Asian currencies, in particular, the Indonesia Rupiah,Korea Won and Philippine Peso. During the second half of the year the overweight allocation to Indonesiangovernment bonds was also a notable contributor to the Sub-Fund’s overall outperformance.
Outlook and strategyBond markets in Hong Kong and Singapore have become more attractive with the recent increase in yields. While weexpect the Asian central banks to raise interest rates in 2010, we still expect rates to remain lower than they werepre-crisis. Economic recovery is still tentative, and there appears to be little inflation pressure. As such, the bias forAsian central banks will still be to maintain easy monetary policy, albeit less easy than in 2008-09. Our key durationoverweights are in Indonesia, Korea and Malaysia.
We favour Korea Won and Indonesia Rupiah as our core currency overweights. Korea has displayed the strongestrecovery in Asia so far, and expects a GDP growth rate of 5% in 2010. We expect the currency to recover in line.Finally, we are positive on Indonesia Rupiah, due to the high yield on its bond market, and its close link tocommodity exports.
0
5
10
15
Since Launch*†1-Year
Tota
l ret
urn
US
$ (
%)
10.4
7.5
2.6
4.8
International Opportunities Funds – Asian Local Bond
HSBC Asian Local Bond with Government and Corporate Bonds Custom Index

13
INTERNATIONAL OPPORTUNITIES FUNDS
REPORT OF THE BOARD OF DIRECTORSAS AT DECEMBER 31, 2009 (continued)
International Opportunities Funds – Asian Property Securities (“Sub-Fund”)
Performance
*February 28, 2007, Class A†Annualised
Source: Prudential Asset Management (Singapore) Limited (Sub-Fund data) & Bloomberg (Benchmark), in USD, bid-to-bid, net income reinvested.
Manager commentary
Sub-Fund performance2009 started as a challenging year for most Asian REITs markets as the sector initially struggled with refinancing,asset write downs and limited forward visibility. By the end of the first quarter, REITs began to rally on the back ofsuccessful refinancing and positive economic indicators. REITs managed to roll over nearly all interest bearing debtand some REITs shifted their borrowings to longer terms. As risk aversion declined, the appetite for REITs at adiscount to net asset value was enough to fuel capital raising in the form of secondary offerings which was a positivesign that investors still had an appetite for REITs. Asian markets benefited from resilient domestic economiesand increasing employment numbers that helped office, retail and hospitality REITs. For the 12 months endedDecember 31, 2009 the Sub-Fund advanced 35.9% outperforming the benchmark by 8.8%.
Factors affecting performanceSingapore REITs were the primary contributors to relative performance at the country level. Optimism regarding officerecovery, tourism and consumer spending helped Singapore outperform its neighbors. Overweights ARA AssetManagement, Ascott Residence Trust, CDL Hospitality Trust and Cambridge REIT all moved higher. UnderweightAustralian REITs were the leading detractors from relative performance. Stockland advanced on the back of positivedrivers including a resilient labor market and undersupply of housing in Australia. The company was 8% of theportfolio versus the benchmark’s 11.6% at year end. Westfield Group constitutes over 32% of the benchmark whilethe Sub-Fund is limited to a maximum 10% exposure of any one stock. The company has benefited from a superiorbalance sheet and an improving economy.
Key changes to the portfolioThe fund manager initiated a new position in Ascendas REIT, Singapore’s largest industrial REIT with a diversifiedrange of industrial asset classes housing over 900 tenants. The Sub-Fund continued to reduce its exposure toMalaysian REITs and fully exited UOA REIT and KLCC Property as other investments provide more attractivepotential. The Sub-Fund exited Suntec REIT in Singapore after shares rallied 87% since the position was initiatedin April. Commonwealth Property Office REIT was also sold when valuation became stretched on the back ofexpectations regarding an improving occupancy and rental scenario. CapitaLand was purchased as the companystands to benefit from the Singapore residential sector as well as the upswing in China.
Outlook and strategyThe medium-term outlook for the region’s economies is positive and should help the REIT sector to continue itsrecovery. Strengthening business sentiment and strong employment data bodes well for both the office and retailsubsectors, however, high household debt in Australia warrants caution. Singapore REITs are benefiting fromrecovery with a positive trend in office occupancy and an increase in tourism. In Hong Kong, the unemployment ratecontinues to fall which bodes well for office, retail and hospitality REITs. The resilient Asian consumer and theresidual impact of the strong recovery in China are likely to be positive influences on the market going forward,however, Japan may continue to be a laggard with office occupancy declining incrementally and more time may berequired for recovery to gain traction.
-20
0
20
40
Since Launch*†1-Year
Tota
l ret
urn
US
$ (
%)
35.9
27.1
-13.6 -15.6
MSCI AC Asia Pacific REITS IndexInternational Opportunities Funds – Asian Property Securities

14
INTERNATIONAL OPPORTUNITIES FUNDS
REPORT OF THE BOARD OF DIRECTORSAS AT DECEMBER 31, 2009 (continued)
International Opportunities Funds – China Equity (“Sub-Fund”)
Performance
*July 2, 2007, Class A†Annualised
Source: Prudential Asset Management (Singapore) Limited (Sub-Fund data) & Bloomberg (Benchmark), in USD, bid-to-bid, net income reinvested.
Manager commentary
Sub-Fund performance2009 was an eventful and robust year for the China stock market. The Rmb4trillion stimulus package announced bythe China government at the end of 2008 kicked off aggressively in 2009. Banks in China, supported by Chinagovernment, were proactive to lend. The information technology and consumer sectors were the strongest performersthroughout the year followed by the materials, energy and banking. The industrial, telecommunication and utilitieswere the laggers subsequently. The Sub-Fund posted a return of 85.1% in 2009 against the MSCI China Index’s62.6%, outperforming the benchmark by 22.5%.
Factors affecting performanceThe leading contributor to performance on a sector level came from good stock picks in the information technologysector, with the non benchmark holding position in AAC Acoustic Technology, Travelsky Technology and overweightposition in BYD Co both helping. In the materials sector, our non-benchmark holdings China Shanshui Cement andFosun International posted strong returns and contributed positively. In the consumer discretionary sector, our nonbenchmark stocks Focus Media and Xingda International also made significant contributions to performance as didthe overweight position in Gome Electric Appliances.
On a negative side, not owning Tencent Holding restrained performance in relative terms. However, this hasbeen offset by the Sub-Fund’s positions in AAC and BYD Co within the information technology sector. Thetelecommunication was the weakest sector in 2009; our overweight position in China Unicom was one of the majordrags. Our overweight position in China Zhongwang also hurt our performance towards the end of the year, as themarket got worried about the delay in auditor’s report on the company’s business with key customers. After the NewYear, the company announced that the auditor found no problems with the company’s reported revenue number frommajor customers. Our fund manager conducted a company visit with China Zhongwang management at the endof December and reconfirmed his confidence on company’s business model and management quality. Not owningSino-Ocean Land Holdings also hindered performance in relative terms.
Key changes to the portfolioMost of the China stocks fell into the attractive radar screen at the beginning of the year. The Sub-Fund took theopportunity to top up Bank of China, Industrial & Commercial Banking Corporation China Citic Bank and reducedunderweight position in China Construction Bank. In the consumer sector, the Sub-Fund initiated position in Li Ning,Ajisen China and increased more stakes in BYD Co. The Sub-Fund also reduced small caps exposure and exitedpositions in BYD Electric, Ctrip.com and Anhui Expressway. In the second half of 2009, the Sub-Fund began to takeprofits from BYD Co and AAC Acoustic after the tremendous rally. Proceeds were used to build position in ChinaZhongwang and China Shenshui Cement. The Sub-Fund also participated in the initial public offering of Evergrandebut redeemed profits immediately as the stock advanced by as much as 34% on its launch.
0
25
50
75
100
Since Launch*†1-Year
Tota
l ret
urn
US
$ (
%)
85.1
62.6
6.2 3.6
MSCI China IndexInternational Opportunities Funds – China Equity

15
INTERNATIONAL OPPORTUNITIES FUNDS
REPORT OF THE BOARD OF DIRECTORSAS AT DECEMBER 31, 2009 (continued)
Outlook and strategyThe Public Bank of China (PBOC) raised its reserve requirement ratio (RRR) by 50bp on January 12, 2010. This wasthe first increase since June 2008. The move was to control abundant liquidity in the system but it came earlier thanexpected. Our fund manager maintains his positive view on the long-term outlook for China stocks. However, heturned cautious on the market’s near-term outlook. The risk of inflation is rising. More tightening policies are likely.The initial tightening will not derail the growth in economy, which is why the long-term outlook is still positive. Historyalso shows that the stock market can be volatile when the government’s policy turns from accommodative to neutral.

16
INTERNATIONAL OPPORTUNITIES FUNDS
REPORT OF THE BOARD OF DIRECTORSAS AT DECEMBER 31, 2009 (continued)
International Opportunities Funds – Dragon Peacock (“Sub-Fund”)
Performance
*June 30, 2006, Class A†Annualised
Source: Prudential Asset Management (Singapore) Limited (Sub-Fund data) & Bloomberg (Benchmark), in USD, bid-to-bid, net income reinvested.
Manager commentary
Sub-Fund performanceIndia and China began the year on a positive note with the help of a rally in March which was helped by positivecues from the US financial markets, but domestic economic indicators also contributed. The India market rallied in thesecond quarter on the election victory of the ruling party, as it raised hopes of a revival in foreign direct investmentand economic growth while putting to rest fears of an unwieldy coalition. Meanwhile, China advanced based onstrong economic indicators pointing to a swift recovery. The India market continued its rally in the second half of2009 as positive economic data, corporate earnings upgrades and robust advance tax payments by Indian companiesconfirmed the economic recovery and bolstered investor sentiment. In China, economic data showed that stimulusefforts were more than compensating for a slump in exports. For the 12 months ended December 31, 2009 the Sub-Fund advanced 87.3% to outperform its benchmark, which gained 84.4%.
Factors affecting performanceOverweight positions in consumer discretionary stocks were leading contributors to outperformance in 2009. BYDCompany Limited, Gome Electric Appliances, and Maruti Suzuki all moved higher as the economic outlook improvedand investors became less risk averse. Underweight positioning in telecommunications companies such as ChinaMobile and Reliance Communications also helped. China faced a maturing market while India telecommunicationscompanies grappled with hyper-competition which squeezed margins. Consumer staples were laggards in 2009 assome investors lost interest in defensive stocks and the potential increase in commodities costs deterred others.Positions in Colgate Palmolive and ITC had a negative impact on Sub-Fund performance.
Key changes to the portfolioTata Power was sold to consolidate the Sub-Fund’s position in GVK Power & Infrastructure, a leading infrastructureasset owner which has improving prospects across all its businesses. A new position was initiated in Mphasis, acompany that is well positioned to benefit from an increase in IT outsourcing from its US based parent HewlettPackard. The fund manager exited DLF, a real estate developer, in favor of LIC Housing Finance. LIC HousingFinance is more attractive in terms of delivering strong business growth and margin expansion. China Life Insurancewas sold in favor of China Pacific Insurance. China Life may see notable growth deceleration going forward whileChina Pacific enjoys better operating trends, more growth drivers and more appealing valuation.
Outlook and strategyInflation continues to be a key risk for India. While the market is anticipating tightening in monetary policy, surpriseson the degree and timing of policy actions could be a source of volatility going forward. Strong economic growth andaccelerating inflation indicate that policy could return to normal soon. The recovery in consumption is on track andwill likely be supported by improving hiring trends. In China, the government is likely to focus more on adjustingChina’s economic structure in the future to achieve sustainable growth. We are positive on the long-term outlook forChina stocks, but we believe that investment opportunities exist more in individual stocks than in the overall market.
0
30
60
90
Since Launch*†3-Year†1-Year
Tota
l ret
urn
US
$ (
%)
87.3 84.4
11.4 10.719.3 20.8
50% MSCI China Index & 50% MSCI India IndexInternational Opportunities Funds – Dragon Peacock

17
INTERNATIONAL OPPORTUNITIES FUNDS
REPORT OF THE BOARD OF DIRECTORSAS AT DECEMBER 31, 2009 (continued)
International Opportunities Funds – Emerging Europe, Middle East and Africa Dynamic (“Sub-Fund”)
Performance
*November 2, 2009, Class E
Source: Prudential Asset Management (Singapore) Limited (Sub-Fund data) & Bloomberg (Benchmark), in USD, bid-to-bid, net income reinvested.
Manager commentary
Sub-Fund performanceThe Sub-Fund was recently incepted and returned 8% since its launch versus its benchmark’s return of 3.5%.
Factors affecting performanceTurkey was the strongest performer in the fourth quarter and rose almost 12%. Russia and Poland each roseabout 5%; selected bank, materials and energy-related stocks did well. Egypt was the weakest market and declinedby 10%, led lower by Orascom Telecom Holding. Morocco followed, losing 7%.
Outlook and strategyWe believe that valuations in Russia may reflect more risk than necessary. The economy has begun to turn and withoil prices relatively strong at about US$80/barrel, we believe the government’s finances and domestic consumptionshould do well. We are positive about consumer-sector stocks. Separately, we believe that Turkey’s economic growthcan surprise on the upside and we like certain Hungarian companies.
0
5
10
Since Launch*
Tota
l ret
urn
US
$ (
%)
3.5
8.0
International Opportunities Funds – Emerging Europe, Middle east and Africa Dynamic
MSCI EMEA Index Ex South Africa and Ex Israel with Russia capped at 40% (net)

18
INTERNATIONAL OPPORTUNITIES FUNDS
REPORT OF THE BOARD OF DIRECTORSAS AT DECEMBER 31, 2009 (continued)
International Opportunities Funds – European Investment Grade Bond (“Sub-Fund”)
Performance
*October 17, 2005, Class A†Annualised
Source: Prudential Asset Management (Singapore) Limited (Sub-Fund data) & Bloomberg (Benchmark), in Euros, bid-to-bid, net income reinvested.
Manager commentary
Sub-Fund performanceThe global economic recovery and associated recovery in risk (non-cash) assets continued up to the year-end.Broadly speaking, positive economic activity looks to be picking up across the world and we expect this to continueinto 2010 with stimulus from governments remaining in place for some time. The key theme for the coming year andbeyond is likely to be how the world can move from the extreme policy-based responses (both fiscal and monetarysuch as interest rate cuts) that we have seen, to more normal interest rate levels and balanced government budgets,without slowing the recovery or causing excessive inflation.
The Sub-Fund returned 15.1% over the year versus the benchmark which posted 14.9%.
Factors affecting performanceSector selection was a significant positive in 2009. After a further bout of weakness in the first quarter, credit marketsembarked on a strong and continuing recovery for the remainder of the year. This recovery was most dramatic insubordinated financials and securitised bonds, vindicating our decision not to panic out of these holdings in 2008.A small number of our corporate bond holdings were downgraded to sub-investment grade requiring us to sell themand realise losses.
Key changes to the portfolioWe have invested most of the cash inflows into attractively priced corporate bonds to keep the portfolio close to fullyinvested to benefit from the market rally. We have maintained an underweight position in banks, and have liquidateda number of subordinated bonds that were downgraded and therefore ceased to be eligible for inclusion in theportfolio. We have continued to build on our overweight allocation to Utilities as a defensive sector with attractivespreads. We increased our government bond exposure at the end of year as we felt that the market had becomemodestly overbought.
Outlook and strategy2009 saw record new issuance in the primary market for investment grade debt and issuance will likely remain strongin 2010 but at lower levels than in 2009, particularly as companies by-pass their traditional source of funding (banksand financial institutions) in favour of borrowing directly from capital markets.
The main risk to corporate bonds in 2010 is a renewed bout of investor risk aversion. In this scenario it is likely thatspreads would widen but it is unlikely that they would reach the depression-type levels of early 2009. Flows into theasset class, as investors search for extra yield, will likely support corporate bond prices going forward. The yieldavailable on many corporate bonds should continue to attract investment in an environment of very low returns forcash. Selective opportunities remain in this asset class.
0
4
8
12
16
Since Launch*†3-Year†1-Year
Tota
l ret
urn
US
$ (
%)
15.1 14.9
2.33.7
1.42.7
International Opportunities Funds – European Investment Grade Bond
The BofA Merrill Lynch Euro Corporate Index

19
INTERNATIONAL OPPORTUNITIES FUNDS
REPORT OF THE BOARD OF DIRECTORSAS AT DECEMBER 31, 2009 (continued)
International Opportunities Funds – Global Market Navigator (“Sub-Fund”)
Performance
*March 26, 2008, Class A†Annualised
Source: Prudential Asset Management (Singapore) Limited (Sub-Fund data) in USD, bid-to-bid, net income reinvested.
Manager commentary
Sub-Fund performanceAfter one of the worst years in financial market history in 2008, equity and credit markets generally started 2009on a weak note. A slew of weak economic news, coupled with investors’ disappointment over the new Obamaadministrations’ actions to “fix” the financial institutions drove markets lower. Sentiment, however, turned positive inMarch, with risky assets rallying strongly from their lows, buoyed by government policy initiatives, signs of financialsystem stabilisation, and the strong rebound in global trade and production that followed. The ‘green shoots’ storythat began to emerge towards the end of the first quarter gained momentum in the second quarter as manyeconomic indicators came out “less worse” than expected, suggesting a depression-type scenario had been averted.This transitioned to a story of recovery by the second half of the year amid better than expected corporate earningsand encouraging macroeconomic data.
Against this backdrop, over 2009, global equities gained as did credit markets. The riskier high yield creditsoutperformed the higher quality investment grade corporate bonds. In contrast, government bond markets postedmodest gains as improving risk appetite prompted investors to switch out of safe G7 government bonds intocorporate bonds and equities.
The Sub-Fund has gained 13.9% for the 12 months period ended December 31, 2009.
Factors affecting performanceAs outlined above, massive policy stimulus and the subsequent loose monetary conditions led to a sharp rebound ineconomic activity, earnings momentum and sentiment, pushing the valuation of some equity markets (particularlyemerging markets) to modestly expensive levels. However, we remained concerned that the high household debt andweak income growth would constrain a strong economic recovery, which in turn would disappoint the market’s highexpectations. Given this view, the fund manager has positioned the Sub-Fund defensively over the year with amodest equity weighting. This relatively defensive strategy helped the Sub-Fund to avoid the drawdown in equities asmarkets sold off sharply in January through mid March. Equally, as risk appetite recovered, this meant the Sub-Funddid not fully participate in the market rally from March to December.
Nonetheless, despite the low equity weighting, the Sub-Fund's core equity holdings (Russia and Turkey) didoutperform the broader global equity markets by a wide margin. This together with the Sub-Fund’s exposure to selectemerging market bonds (namely Turkey, Poland and Russia Eurobonds) and US high yield credits, allowed the Sub-Fund to enjoy some good gains over the year.
Key changes to the portfolioThe fund manager reduced the Sub-Fund’s equity weighting over the first and second quarter of the year given hisrelatively cautious stance. He sold the entire equity holdings in Asia, Singapore, the UK and Russia into the rally asvaluation no longer looked extremely cheap. The Sub-Fund added a small position in UK equities in early July followingsome price correction as the market remained one of the most attractive equity markets from a valuation perspective.
-10
0
10
20
Since Launch*†1-Year
Tota
l ret
urn
US
$ (
%) 13.9
-3.5
International Opportunities Funds – Global Market Navigator

20
INTERNATIONAL OPPORTUNITIES FUNDS
REPORT OF THE BOARD OF DIRECTORSAS AT DECEMBER 31, 2009 (continued)
In line with the relatively cautious view, the fund manager also gradually took profits on the US high yield bondholdings and switched into safer US investment grade bonds as the latter offered better expected risk-adjustedreturns in his opinion.
Towards the end of the second quarter, the Sub-Fund established positions in US 30-year bond and Australia 10-Year bond futures as yields spiked up amid expectations of a strong economic recovery and rising inflation,and were looking attractive. The Sub-Fund took profits on these positions in the late third/early fourth quarter asyields subsequently fell.
The fund manager also gradually invested the Sub-Fund’s cash holdings in select emerging markets governmentbonds in the second through the fourth quarter of the year as value emerged. These included Turkish governmentinflation-linked bonds, Polish, Brazilian, Indonesian, Philippine, Korean and Mexican local government bonds. Thefund manager also established a position in Russian US dollar Eurobonds. Towards the end of the year, the Sub-Fund completely sold out its Polish local government bonds and Turkish inflation linked bonds as valuations wereno longer attractive following strong performance of these assets.
Outlook and strategyThe key question for 2010 from a global perspective is whether the US economic recovery is sustainable. Thanksto the rapid and massive policy response, the world has returned to a relatively normal state of affairs (for now).Consequently, most markets are currently priced for a sustainable recovery based on consensus earnings. As such,even if the economic recovery turns out to be sustainable, equity markets may not perform that well as this isalready been discounted. The fund manager feels that equities are more likely to remain range-bound in 2010 asrealised earnings catch up with the consensus earnings already priced into valuations. However, the fund managerremains concerned that growth will eventually disappoint as ongoing balance sheet repair in the US will probablylead to weaker-than-expected private demand once policy support ends. Equally, if the recovery in the US turns outto be weaker-than-expected, this could delay policy tightening meaning interest rates will remain low for some time.This could provide support for markets.
With low valuation dispersion between markets and asset classes following the recovery since March 2009, the fundmanager is maintaining a neutral position between bonds and equities. Within equities, the fund manager is modestlyoverweight developed markets equities relative to emerging markets. Although emerging markets’ fundamentals arestronger, this is already largely reflected in the price, in our opinion. Within bonds, the fund manager is underweightdeveloped market government bonds and overweight select emerging market local government bonds, such as Brazil,Indonesia and Mexico. Despite short-term inflation risk, the credibility of these central banks in anchoring long-terminflation expectations remains intact. Furthermore, the structural soundness of these economies can underpindownward grind of long-end real yields from very high levels. The fund manager is neutral on credit, with a modestpreference for investment grade bonds over high yield bonds. He favours select Asian currencies and the Britishpound given their attractive valuations and fundamentals.

21
INTERNATIONAL OPPORTUNITIES FUNDS
REPORT OF THE BOARD OF DIRECTORSAS AT DECEMBER 31, 2009 (continued)
International Opportunities Funds – Global Technology (“Sub-Fund”)
Performance
*August 26, 2005, Class A†Annualised
Source: Prudential Asset Management (Singapore) Limited (Sub-Fund data) & Bloomberg (Benchmark), in USD, bid-to-bid, net income reinvested.
Benchmark changed from FTSE World IT Index to MSCI AC World Information Technology Index effective December 1, 2008.
Manager commentary
Sub-Fund performanceAt the start of the year, whilst the general economy continued in a downward spiral, the technology sectoruncharacteristically outperformed in a falling market. From March, we saw stronger than expected demand trendswith the consequence that inventories across the technology sector for the majority of 2009 were too low toaccommodate this high demand. As the macro economy recovered with help from worldwide government stimulusprograms, notably the Chinese, technology also participated in this rally enabling the sector to comfortably outperformthe overall market. The Sub-Fund posted a 60.6% gain while the benchmark returned 52.9%.
Factors affecting performance The positive performance within our portfolio was derived mainly from the Internet sector, with Asian internet stocksCTrip, Baidu Inc. and Tencent Inc. leading the performance. Another strong area of performance was companiesrelated to consumer demand, given that this demand was stronger than expected. As such, LG Display and MediatekInc., two companies both heavily exposed to the increased demand for mobile handsets, performed well.
Unfortunately, our defensive stance at the beginning of 2009 hindered the performance of the Sub-Fund as we didnot capitalise upon the cyclical rally. Our holdings, especially within the Semiconductor sector, were skewed towardssecular rather than cyclical growth opportunities.
Key changes to the portfolioThe Sub-Fund changed stance from a defensive position at the beginning of the year towards more growthopportunities throughout the year. Exposure towards the Internet grew as we had strong conviction in a numberof stocks with secular growth potential. In addition, as the economy recovers we have begun to anticipate greatercorporate spending on computing, networking and storage as these areas have faced chronic underinvestment fora number of years and require a replacement cycle.
We cut exposure to mobile telecom equipment companies as devaluations of emerging market currencies during thesummer meant that it became more expensive for operators in these regions to purchase equipment in the short term.
Outlook and strategyWe believe that heading into 2010, the technology sector looks attractively valued when compared to most othersectors. The sector has shrugged off the irrational valuations seen in the early part of the prior decade and whatremains are much akin to traditionally defensive holdings – namely well-managed businesses with strong marketshare with little or no balance sheet debt.
We temper our enthusiasm on an absolute basis as we are concerned in the longer term about the macroeconomy,given that the monetary and fiscal measures introduced by governments worldwide may prove to be only atemporary fix. However, we remain confident that on a relative basis, technology can outperform both rising andfalling markets as one of the few genuine growth areas available to investors.
-10
0
10
20
30
40
50
60
70
Since Launch*†3-Year†1-Year
Tota
l ret
urn
US
$ (
%)
60.652.9
-2.0 -1.2
1.7 3.3
BenchmarkInternational Opportunities Funds – Global Technnology

22
INTERNATIONAL OPPORTUNITIES FUNDS
REPORT OF THE BOARD OF DIRECTORSAS AT DECEMBER 31, 2009 (continued)
International Opportunities Funds – Greater China Equity (“Sub-Fund”)
Performance
*February 23, 2005, Class A†Annualised
Source: Prudential Asset Management (Singapore) Limited (Sub-Fund data) & Bloomberg (Benchmark), in USD, bid-to-bid, net income reinvested.
Manager commentary
Sub-Fund performanceThe Greater China equity market had an eventful and robust year, advancing 67.1% with China taking the lead as adominant player followed by Taiwan and Hong Kong. In China, the Rmb 4trillion stimulus package announced by theChina government at the end of 2008 kicked off aggressively in 2009. Banks in China, supported by the Chinesegovernment, were proactive to lend. The stimulus measures were vastly effective as the macroeconomic andproduction data from China stabilised. In China, the information technology, banking and consumer sectors wereamong the outperformers while the Hong Kong property sector also shared the joy under the low interest rate andlimited supply environment. Taiwan started off poorly in January to become the second-worst performer among Asianmarkets ex-Japan before the stimulus policy gained traction at the end of first quarter. Anticipation of closer economicties with the mainland also buoyed the markets. For the 12 months ended December 31, 2009 the Sub-Fundreturned 77.8% to outperform its MSCI Golden Dragon Index benchmark by 10.7%.
Factors affecting performanceKey contributors to performance came from good stock picks in China. In the technology sector, non benchmarkholding position in AAC Acoustic and overweight position in BYD posted exceptionally strong returns. Our overweightpositions in Gome Electric Appliances and Industrial & Communication Bank of China boosted performance. Theunderweight position in China Mobile helped as the stock underperformed in 2009. Among Taiwan holdings, ouroverweight position in Hon Hai Precision Industry also contributed.
On a negative note, lack of exposure in Tencent Holding hurt performance in relative terms but this has been offsetby our positions in AAC and BYD in the information technology sector. The overweight positions in Cheung KongHolding and China Unicom curbed performance as they underperformed in 2009. Our overweight position in ChinaZhongwang suffered from consensus uncertainty over client validity which also hurt performance. Our fund managerconducted a company visit at the end of December and reconfirmed his confidence on company’s business modeland management quality.
Key changes to the portfolioAmong large trades in first half of 2009, the Sub-Fund favoured selected China and Hong Kong financials andtopped up positions in Bank of China, Bank of East Asia, Industrial & Communication Bank of China, Hang LungProperties and Link REIT. In Taiwan, the Sub-Fund captured the early market weakness to increase stakes in Acer,HTC, Mediatek as well as new position in Chunghwa Telecommunication. Subsequently, the Sub-Fund sold downpositions in Kowloon Development, Ctrip.com and China Life Insurance and reduced positions in China Unicom.Receipts were used to add positions in BYD, establish positions in Beijing Capital International Airport and participatein China Zhongwang initial public offering. In the second half of 2009, following the strong recovery, the Sub-Fundtook partial profits from Bank of East Asia, BYD and Focus Media. Proceeds were used to fund new positions inChina Construction Bank, Ping An Insurance, Powertech, Lite-on Technology and Siliconware Precision IndustriesCompany.
0
10
20
30
40
50
60
70
80
Since Launch*†3-Year†1-Year
Tota
l ret
urn
US
$ (
%)
77.8
67.1
3.1 5.312.5 12.9
MSCI Golden Dragon IndexInternational Opportunities Funds – Greater China Equity

23
INTERNATIONAL OPPORTUNITIES FUNDS
REPORT OF THE BOARD OF DIRECTORSAS AT DECEMBER 31, 2009 (continued)
Outlook and strategyWe continue to believe that the long-term outlook for Greater China is strong. We are adhering to our investmentfocus on cash flow and long-term valuations. Going forward, the fund manager will be focussing more on China.

24
INTERNATIONAL OPPORTUNITIES FUNDS
REPORT OF THE BOARD OF DIRECTORSAS AT DECEMBER 31, 2009 (continued)
International Opportunities Funds – Hong Kong Equity (“Sub-Fund”)
Performance
*July 2, 2007, Class A†Annualised
Source: Prudential Asset Management (Singapore) Limited (Sub-Fund data) & Bloomberg (Benchmark), in USD, bid-to-bid, net income reinvested.
Manager commentary
Sub-Fund performanceThe Hong Kong equity market recovered most of its lost ground from 2008. Improved macroeconomic data on theback of the government’s fiscal stimulus program and the loose monetary policy from China helped ease HongKong’s recession. Hong Kong Property had a successful year benefiting from low interest rates and limited supply.Selected property developers such as Henderson Land Development, Kerry Properties and Sino Land Cooutperformed the mass market in 2009. For the 12 months ended December 31, 2009 the Sub-Fund returned 61.4%versus its benchmark’s return of 60.2%.
Factors affecting performanceThe leading contributors to Sub-Fund performance in 2009 came from non-benchmark holdings such as AACAcoustic Technology, Gome Electric Appliances, Industrial & Communication Bank of China and Shun Tak Holdings.Our defensive positions in utilities holdings Hong Kong Electric and CLP Holdings also helped in relative terms. Inthe financials sector, our overweight positions in Henderson Land Development, Wharf Holding and Bank of ChinaHong Kong posted good returns and helped Sub-Fund performance.
On a negative note, overweight positions in Hang Seng Bank and NWS Holdings restrained Sub-Fund performanceas they lagged the broader market in 2009. Not owning Foxconn International and ASM Pacific Technology curbedperformance in relative terms, however our holding position in AAC served to offset this somewhat.
Key changes to the portfolioAmong large trades in 2009, the Sub-Fund took the early market weakness to increase stakes in various holdingsin the financials sector. Among banks, the Sub-Fund topped up positions in Bank of China Hong Kong and Bankof East Asia. In properties, the Sub-Fund increased overweights in Cheung Kong Properties, Henderson LandDevelopment and Link REIT. The fund manager also narrowed the underweight positions in Hang Lung Propertiesand Hong Kong Electric. Following positive market guidance, the Sub-Fund further increased the position in AACAcoustic Technology. On the other side, the Sub-Fund sold down and closed positions in Kowloon Development,Champion REIT, China Unicom, Yuen Yuen Holding and Shun Tak Holdings. The Sub-Fund also established newposition in Orient Overseas.
Outlook and strategyWith the strong recovery in China’s economy and the stabilisation in developed economies, Hong Kong is likely togain positive traction. The upcoming data and upward earnings revision could support the equity market in 2010.An earnings rebound needs to be seen to sustain current valuations.
-20
0
20
40
60
80
Since Launch*†1-Year
Tota
l ret
urn
US
$ (
%) 61.4 60.2
-2.3
1.5
MSCI Hong Kong IndexInternational Opportunities Funds – Hong Kong Equity

25
INTERNATIONAL OPPORTUNITIES FUNDS
REPORT OF THE BOARD OF DIRECTORSAS AT DECEMBER 31, 2009 (continued)
International Opportunities Funds – India Equity (“Sub-Fund”)
Performance
*July 2, 2007, Class A†Annualised
Source: Prudential Asset Management (Singapore) Limited (Sub-Fund data) & Bloomberg (Benchmark), in USD, bid-to-bid, net income reinvested
Manager commentary
Sub-Fund performanceIndia emerged the second-best performing market in Asia ex-Japan in 2009 following Indonesia. The MSCI IndiaIndex recovered in 2009 after a 65% fall the year before. The materials, consumer discretionary, informationtechnology and industrials outperformed the benchmark for the year while the rest of the sectors lagged led bytelecoms, consumer staples and utilities.
2009 started on a weak note as an accounting scandal at Satyam Computer Services Ltd raised concerns aboutthe oversight of the country’s publicly traded companies and pressured the market lower. The market was alsodisappointed by the interim budget in February and later in the year, concerns over a weaker monsoon emerged. TheIndian market, however, surged the most in May on the election victory by the ruling party, the Congress-led UnitedProgressive Alliance, as it raised hopes of a revival in foreign direct investment and economic growth while putting torest fears of an unwieldy coalition. India’s economy showed resilience in 2009 with GDP numbers beating estimates,thanks to government spending and construction. For the 12 months ended December 31, 2009, the Sub-Fundreturned 101.5% versus its benchmark’s return of 102.8%.
Factors affecting performanceThe Sub-Fund’s stock picks in the financials, healthcare and IT sector contributed to its performance in 2009.Telecoms, where the Sub-Fund was an underweight, also aided its performance. Cash, however, weakened the Sub-Fund the most in 2009. Stock selection in the energy and industrials sectors, both Sub-Fund underweights,dragged its performance.
MphasiS Ltd, where the Sub-Fund has an off-benchmark position, contributed the most to the Sub-Fund’sperformance on the back of the strength in the IT sector. Positive economic data releases in the U.S. that suggestedthe biggest overseas market for the sector is recovering, shored up India IT stocks. The lack of exposure to RelianceCommunications Ltd proved advantageous to the Sub-Fund as the telecoms sector underperformed on worries overheightened competition.
The Sub-Fund’s underweight position in Tata Consultancy Services Ltd weakened the Sub-Fund’s performance in2009 due to the rally in IT stocks. Not owning Tata Motors Ltd ordinary shares dragged performance but the losseswere capped by the Sub-Fund’s holdings in Tata Motors `A’ which are differential voting right shares.
Key changes to the portfolioAmong the larger trades, the Sub-Fund established new positions in GVK Power & Infrastructure Ltd, Marico Ltd,Hindalco Industries Ltd and Unitech Ltd. GVK is an infrastructure developer with assets in power, airport, roadand mining. The company is well poised to exploit the large investments planned to develop India’s infrastructure.Hindalco is India’s biggest aluminium producer and the profitability of its unit Novelis Inc and the visibility on Asiangrowth prompted the Sub-Fund’s share purchase. The Sub-Fund established a new position in Marico Ltd as the
0
20
40
60
80
100
120
Since Launch*†1-Year
Tota
l ret
urn
US
$ (
%) 101.5 102.8
0.2 2.4
MSCI India IndexInternational Opportunities Funds – India Equity

26
INTERNATIONAL OPPORTUNITIES FUNDS
REPORT OF THE BOARD OF DIRECTORSAS AT DECEMBER 31, 2009 (continued)
personal care products maker is likely to benefit from consumption growth and rural demand. The Sub-Fund alsobought into Unitech, India’s 2nd-largest developer. The Sub-Fund exited Hindustan Unilever Ltd, Zee EntertainmentEnterprises Ltd, Bharat Petroleum Ltd, and Tata Chemicals Ltd, among others.
Outlook and strategyThe sharp rise in inflation continues to be a key risk for the market. The strong economic growth and acceleratinginflation suggest that policy could return to normal soon. The degree and timing could be a source of volatility in thefuture. The government’s stimulus package seems to have achieved its purpose and may be withdrawn from early2010. This suggests the confidence of the government in the resilience demonstrated by the economy. Meanwhile,the recovery in consumption is on track and will be supported by improving hiring trends.

27
INTERNATIONAL OPPORTUNITIES FUNDS
REPORT OF THE BOARD OF DIRECTORSAS AT DECEMBER 31, 2009 (continued)
International Opportunities Funds – Indonesia Equity (“Sub-Fund”)
Performance
*July 2, 2007, Class A†Annualised
Source: Prudential Asset Management (Singapore) Limited (Sub-Fund data) & Bloomberg (Benchmark), in USD, bid-to-bid, net income reinvested.
Manager commentary
Sub-Fund performanceThe Jakarta Composite Index surged 117% in US dollar terms to end 2009 as the best performing market in Asia.The Jakarta Miscellaneous Industries, Mining and Consumer Goods Indices were the best performing sector indices,while the construction, property, infrastructure and utilities sectors lagged the broader market. In 2009, marketsentiment was bolstered by President Susilo Bambang Yudhoyono’s re-election in July and his party winning thelargest share of seats in the new parliament earlier in the year. Both Moody’s Investor Service and Standard & Poor’supgraded Indonesia’s sovereign credit rating in 2009, helping to fuel the market rally. The rating upgrade contributedto the strength of the Indonesian Rupiah which ended the year 16% stronger against the US dollar, the largestappreciation among regional currencies. Economic indicators were generally positive in 2009, thanks to policy ratecuts and the government’s stimulus policies. The Sub-Fund posted a return of 138.0% in 2009, outperforming its totalreturn benchmark by 14.9%.
Factors affecting performanceThe Sub-Fund’s underweight in select banks, namely Bank Danamon Indonesia and Bank Internasional Indonesia,bolstered its performance in 2009 as the sector underperformed the benchmark. The underweight in PT Indosatalso aided performance as the stock underperformed on concerns over its loss of subscriber market share.The underweight position in PT Lippo Karawaci was beneficial as the stock underperformed in tandem with theproperty sector. The overweight in United Tractors also aided performance as the stock rose on the back of better-than expected heavy equipment sales.
Cash was the biggest drag on the Sub-Fund’s performance in 2009. The Sub-Fund’s underweight position in smallercapitalized stocks such as coal miner Bayan Resources, property developer Bumi Serpong and investment holdingfirm Sinar Mas Multiartha negatively weakened its performance for the year. The underweight in coal miningcompanies, Adaro Energy and Bumi Resources, also hurt performance.
Key changes to the portfolioThe Sub-Fund established new positions in Delta Dunia Makmur, Panin Life and Sampoerna Agro. The Sub-Fundbought Delta Dunia as its acquisition of Bukit Makmur Mandiri Utama is earnings accretive and will transform it intothe country’s second-largest coal mining contractor. It added Panin Life, a financial holding company, as the stockwas trading at a steep discount to its sum-of-parts. The Sub-Fund purchased crude palm oil producer SampoernaAgro as the stock’s valuation was deemed attractive relative to its listed Indonesian peers. The Sub-Fund trimmedits stakes in Central Proteinaprima, Hexindo Adiperkasa and Indofood Sukses Makmur.
Outlook and strategyWe remain positive on Indonesia in view of the structural improvements in macro fundamentals and declining costof capital. The stock market, however, may face consolidation in the near term given the JCI’s strong gains in 2009.Valuation remains undemanding compared to other Asian equity markets but is no longer cheap relative to history.
0
20
40
60
80
100
120
140
Since Launch*†1-Year
Tota
l ret
urn
US
$ (
%)
138.0123.1
7.7 7.5
Jakarta Composite IndexInternational Opportunities Funds – Indonesia Equity

28
INTERNATIONAL OPPORTUNITIES FUNDS
REPORT OF THE BOARD OF DIRECTORSAS AT DECEMBER 31, 2009 (continued)
International Opportunities Funds – Japan Dynamic (“Sub-Fund”)
Performance
*July 5, 2006, Class D†Annualised
Source: Prudential Asset Management (Singapore) Limited (Sub-Fund data) & Bloomberg (Benchmark), in USD, bid-to-bid, net income reinvested.
Manager commentary
Sub-Fund performanceJapan equity market performance has fluctuated from factors affecting market sentiment such as increasing concernsabout Japan's fiscal deficit and the direction of the yen. Despite the strong end to the year, Japan equity indiceshave lagged all other major developed regions in both local and US$ terms overall in 2009. The Sub-Fund rose13.9% for the year ended December 31, 2009 versus the benchmark’s return of 6.4%.
Factors affecting performanceValuation-oriented factors, such as owning companies with low price to book ratios have generally outperformed.During the year, the Sub-Fund benefited from holding contrarian positions it had accumulated since 2007, based ontheir cheap valuations. Cheap, out of favour companies were recognized by the market, such as the selected cyclicalnames held in the portfolio, which ultimately delivered good performance. These included selected Auto-relatednames, such as Nissan Motor Co Ltd; NOK Corp; and Fuji Heavy Industries Ltd. Selected technology-related stockswere also strong contributors, which included Thine Electronics Inc; Funai electronics Co Ltd; and Rohm Co Ltd.
Key changes to the portfolioThe Sub-Fund continues to be active in responding to pricing opportunities that are presented. More recently, positionsizes in domestically focused names, including banks and selected defensive names were raised. These were fundedfrom the cyclical names which had performed relatively well as markets rallied from March onwards.
Outlook and strategyThe cornerstone of our investment approach is the discipline around a company’s valuation, and understanding thefactors that are priced in by the market. There are now strong valuation signals for Japanese equities. We continue tofind many examples of healthy companies with high levels of cash on their balance sheets and strong ongoingcashflows, which may be supportive in this current environment.
With our focus on valuation discipline and a medium term time frame the Sub-Fund has accumulated positions incompanies valued at a significant discount to the trend return the business can generate. These are reflected inselected technology; domestically focused stocks such as banks; and selected global consumer discretionary names.The fund manager has also taken the opportunity to build some positions in Defensive names where valuations haveimproved.
-15
-10
-5
0
5
10
15
Since Launch*†3-Year†1-Year
Tota
l ret
urn
US
$ (
%)
13.9
6.4
-8.5-10.3
-6.7 -7.5
MSCI Japan IndexInternational Opportunities Funds – Japan Dynamic

29
INTERNATIONAL OPPORTUNITIES FUNDS
REPORT OF THE BOARD OF DIRECTORSAS AT DECEMBER 31, 2009 (continued)
International Opportunities Funds – Japan Equity (“Sub-Fund”)
Performance
*January 16, 2006, Class D†Annualised
Source: Prudential Asset Management (Singapore) Limited (Sub-Fund data) & Bloomberg (Benchmark), in USD, bid-to-bid, net income reinvested.
Manager commentary
Sub-Fund performanceJapan equity market performance has fluctuated from factors affecting market sentiment such as increasing concernsabout Japan's fiscal deficit and the direction of the yen. Despite the strong end to the year, Japan equity indiceshave lagged all other major developed regions in both local and US$ terms overall in 2009. The Sub-Fund rose 7.0%for the year ended December 31, 2009, compared with the benchmark’s return of 6.3%.
Factors affecting performanceValuation-oriented factors, such as owning companies with low price to book ratios have generally outperformed.During the year, the Sub-Fund benefited significantly from holding contrarian positions it had accumulated based ontheir cheap valuations. These included selected names exposed to the global cycle where share prices had beencrushed as a result of extremely negative market sentiment in 2008 and early 2009. Other contrarian positions, suchas avoiding expensive stocks, which tended to be in the defensive sector, also rewarded Sub-Fund performance asthese names underperformed the market as global fears receded and markets began to rally strongly from Marchonwards.
Key changes to the portfolioThe Sub-Fund continues to be active in responding to pricing opportunities that are presented. More recently positionsizes in domestically focused names, including banks and selected defensive names were raised. These were fundedfrom the cyclical names which had performed relatively well as markets rallied from March onwards.
Outlook and strategyThe cornerstone of our investment approach is the discipline around a company’s valuation, and understanding thefactors that are priced in by the market. There are now strong valuation signals for Japanese equities. We continue tofind many examples of healthy companies with high levels of cash on their balance sheets and strong ongoingcashflows, which may be supportive in this current environment.
With our focus on valuation discipline and a medium term time frame the Sub-Fund has accumulated positions incompanies valued at a significant discount to the trend return the business can generate. These are reflected inselected technology; domestically focused stocks such as banks; and selected global consumer discretionary names.The fund manager has also taken the opportunity to build some positions in Defensive names where valuations haveimproved.
-20
-10
0
10
Since Launch*†3-Year†1-Year
Tota
l ret
urn
US
$ (
%)
7.0 6.3
-10.6 -11.2
-7.8 -7.6
Topix 100 IndexInternational Opportunities Funds – Japan Equity

30
INTERNATIONAL OPPORTUNITIES FUNDS
REPORT OF THE BOARD OF DIRECTORSAS AT DECEMBER 31, 2009 (continued)
International Opportunities Funds – Japan Smaller Companies (“Sub-Fund”)
Performance
*March 26, 2008, Class A†Annualised
Source: Prudential Asset Management (Singapore) Limited (Sub-Fund data) & Bloomberg (Benchmark), in USD, bid-to-bid, net income reinvested.
Manager commentary
Sub-Fund performanceJapan equity market performance has fluctuated due to factors affecting market sentiment such as increasingconcerns about Japan's fiscal deficit and the direction of the yen. Despite the strong end to the year, Japan equityindices have lagged all other major developed regions in both local and US$ terms overall in 2009. The Sub-Fundrose 26.9% for the year ended December 31, 2009 versus the benchmark’s return of 7.1%.
Factors affecting performanceValuation-oriented factors, such as owning companies with low price to book ratios, were an important contributor topositive market performance in 2009. Valuation-oriented factors have also been a critical driver of the Sub-Fund’sperformance.
The Sub-Fund remains broadly diversified which is also reflected in the drivers of the Sub-Fund’s performance fromsectors across the board.
A large contribution to Sub-Fund performance came from electronic component makers, including Thine Electronicsand Iriso Electronics.
Amongst the domestic names, clothing retailer Pal contributed significantly to performance. Card and loan companyCredit Saison, was another notable driver of Sub-Fund performance. Credit Saison, a credit card issuer andtransaction processing company, has extremely attractive absolute and relative valuations.
Key changes to the portfolioDuring the year the Sub-Fund has trimmed exposure to names where share price performance has been relativelystrong and recycled proceeds into new positions based on their cheap valuation. The new positions have beenbroadly diversified across the market, and have ranged from domestic companies to those exposed to the globalcycle.
Outlook and strategyThe cornerstone of our investment approach is the discipline around a company’s valuation, and understanding thefactors that are priced in by the market. There are now strong valuation signals for Japanese equities. We continueto find many examples of healthy companies with high levels of cash on their balance sheets and strong ongoingcashflows, which may be supportive in this current environment.
With our focus on valuation discipline and a medium term time frame the Sub-Fund has accumulated positions incompanies valued at a significant discount given the expected sustainable earnings the business can generate. Thesehave typically been positions in selected electronic and auto component names on the global cyclical side, and retailand other specialist consumer names on the domestic side.
-10
0
10
20
30
Since Launch*†1-Year
Tota
l ret
urn
US
$ (
%)
26.9
7.1
0.0
-8.2
Russell Nomura Mid-Small IndexInternational Opportunities Funds – Japan Smaller Companies

31
INTERNATIONAL OPPORTUNITIES FUNDS
REPORT OF THE BOARD OF DIRECTORSAS AT DECEMBER 31, 2009 (continued)
International Opportunities Funds – Korea Equity (“Sub-Fund”)
Performance
*February 10, 2006, Class D †Annualised
Source: Prudential Asset Management (Singapore) Limited (Sub-Fund data) & Bloomberg (Benchmark), in USD, bid-to-bid, net income reinvested.
Manager commentary
Sub-Fund performanceIn 2009, Korea avoided a technical recession, thanks to record interest-rate cuts and a massive stimulus package.The FTSE Group’s upgrade of the Korean stock market to developed market status from emerging in Septembertriggered buying in large cap names such as Samsung Electronics Co Ltd, Hyundai Motor Co and KB FinancialGroup Inc. In the fourth quarter, investors were concerned over the possibility of a W-shaped recovery on the exit ofthe stimulus measures and the potential that a stronger Korean Won may hurt exporters’ margin. The Sub-Fundposted a gross return of 63.1% in 2009 while the benchmark rose 64%, resulting in an underperformance of 0.9%.
Factors affecting performanceThe Sub-Fund’s holdings in KB Financial Group, the largest commercial bank in Korea, bolstered its performance asthe bank outperformed the broader market in 2009. Optimism over the economic recovery augured well for thesector. The fund manager likes KB for its strong capital base. It has the highest tier 1 ratio among its peers. LGChemical Ltd also gave the Sub-Fund’s performance a boost as shares of the diversified chemical/building materialmaker more than doubled in 2009 to outperform the benchmark. Improving earnings prospects on the back of soliddemand from China for chemicals and positive sentiment due to the potential of its rechargeable battery businessprompted the stock’s gains. The Sub-Fund’s holdings in SK Energy Co also aided performance as the stockoutperformed on positive sentiment over the potential of its car battery business. In absolute terms, Posco contributedto performance as the steelmaker outperformed. The fund manager believes Posco has the best balance sheet andcost structure among steelmakers in the region.
The natural underweight on Samsung Electronics Co Ltd weakened the Sub-Fund’s performance in 2009 as thestock outperformed the market, bolstered by strong earnings and expectations of more upgrades. Theunderperformance of SK Telecom in 2009 in line with the industry, hurt the Sub-Fund. Hyundai Motor Co’soutperformance in 2009 on the back of strong U.S. sales and the won’s movement marred the Sub-Fund’sperformance. The fund manager views the stock as overvalued.
Key changes to the portfolioThe fund manager exited all his positions in December except for Hanjin Shipping Co due to the shipping line’sdecision at month end to split into a holding and operating company. The Sub-Fund’s last acquisition was inSeptember when it added a few shares to its KB Financial Group holdings.
Outlook and strategyKorea’s fundamentals remain fragile despite the improved economic numbers due to the weakness in global tradeand its high dependence on external demand. The structural domestic issues such as high debt levels of consumersand small-to-medium sized companies will weigh on domestic consumption on a mid-term basis. The Korean marketis trading at 12x 2010 P/E and 11x 2011 P/E, a discount to the rest of the region. However, earnings risk stillremains relatively high given its large exposure to the export sector.
-20
0
20
40
60
80
Since Launch*†3-Year†1-Year
Tota
l ret
urn
US
$ (
%) 63.1 64.0
2.9
-1.2
5.9 1.8
KOSPI 200 IndexInternational Opportunities Funds – Korea Equity

32
INTERNATIONAL OPPORTUNITIES FUNDS
REPORT OF THE BOARD OF DIRECTORSAS AT DECEMBER 31, 2009 (continued)
International Opportunities Funds – Latin American Equity (“Sub-Fund”)
Performance
*April 30, 2008, Class A†Annualised
Source: Prudential Asset Management (Singapore) Limited (Sub-Fund data) & Bloomberg (Benchmark), in USD, bid-to-bid, net income reinvested.
Manager commentary
Sub-Fund performanceThe region outperformed every other major regional index in the world in 2009. The year’s best performing marketin Latam was Brazil, rising over 121%. For the 12 months ended December 31, 2009 the Sub-Fund added 120.5%,versus its benchmark’s return of 103.8%.
Factors affecting performanceThe Sub-Fund’s overweight position in Brazil as well as strong stock selection within the market were strongcontributors to outperformance. We maintained an aggressive overweight in Brazil favoring consumer and industrialsectors. The Sub-Fund’s overweight positions in consumer, industrial and financial stocks in Brazil were amongst topcontributors to performance. We kept a slight underweight in Mexico favoring the homebuilders, infrastructure playsand the pan regional mobile operations of America Movil. The underweight in Mexico positively contributed to Sub-Fund performance. On a stock level, not owning Mexico’s Cemex helped us. We have exposure to the retail sector inChile having eliminated our exposure to the financial sector due to rich valuations.
Key changes to the portfolioOver the year, the fund manager established new positions in Bradespar, Cemig, Cyrela, CIA Brasileira, Fosfertil, ItauUnibanco, JBS, Gerdau, and Credicorp. In return, the fund manager trimmed the Sub-Fund’s position in Anhanguera,Lopes,Gafisa, Santos, SLC Agricola, Banco Santander, Cencosud, Banorte, Grupo Famsa and Walmart.
Outlook and strategyWe maintain our positive outlook in Brazil and remain optimistic about 2010 albeit staying committed to reducingpositions where growth is fully priced, recognizing that the market will be impacted by increasing rates and electionsin the second half of the year.
In Mexico, 2009 GDP is expected to come in at about -7% and inflation about 5.5%. S&P downgraded Mexican debtone notch still keeping it investment grade. In foreign currency it is rated BBB with a stable outlook. We expect ratesin Mexico to mirror those in the US and so likely not to be raised this year. GDP growth is expected to remain about3% for the next 2 years. Inflation is forecasted to be between 4.75% and 5.25% mainly impacted by tax increasesand higher public prices. President Calderon has proposed a major political reform in order to make the system moreopen, give the president some extraordinary powers and to reduce the powers of the Congress. This would be verypositive for the future implementation of important reforms.
-50
0
50
100
150
Since Launch*†1- Year
Tota
l ret
urn
US
$ (
%)
120.5103.8
-7.9 -5.2
MSCI EM Latin America Standard IndexInternational Opportunities Funds – Latin American Equity

33
INTERNATIONAL OPPORTUNITIES FUNDS
REPORT OF THE BOARD OF DIRECTORSAS AT DECEMBER 31, 2009 (continued)
International Opportunities Funds – Malaysia Equity (“Sub-Fund”)
Performance
*July 2, 2007, Class A†Annualised
Source: Prudential Asset Management (Singapore) Limited (Sub-Fund data) & Bloomberg (Benchmark), in USD, bid-to-bid, net income reinvested.
Manager commentary
Sub-Fund performanceAsian equity markets started 2009 poorly and Malaysia’s new Prime Minister Najib Razak looked to step up reformsin the near term as the Malaysian economy headed for a recession despite a second stimulus package. Thegovernment also cut its 2009 GDP forecast to between -1% and 1%. Globally coordinated efforts to avoid a financialmeltdown soon paid off as March kicked started an extended period of equity appreciation. Bank Negara Malaysiaannounced that they will hold the overnight policy rate at 2% on an improving macroeconomic outlook. Stock marketgains tapered in Q409 on fears of a building asset bubble, but still finished the year in positive territory. The Sub-Fund returned 49.1% while the benchmark posted a gain of 52.1%.
Factors affecting performanceDuring the year, off-benchmark holding SapuraCrest Petroleum Berhad was the top contributor to the Sub-Fund. InQ109, it announced that it was awarded a US$1 billion contract from Sabah Shell Petroleum Company Limited foroffshore installation works at the GumusutKakap offshore fields. The fund manager’s recommendation of operationallyresilient Financials also paid dividends as AMMB Holdings Berhad and Public Bank Berhad both turned in goodperformances.
Shares of Tanjong Public Limited Company were affected by the uncertainty of the windfall tax which was imposedrecently on independent power producers. In addition, the company tracked the general underperforming trend ofutilities and lagged the broader market. Another area of muted performance came from DiGi Telecommunications SdnBhd. The company’s shares offered limited upside due to its uninspiring growth outlook and because investors weremost likely waiting for the re-listing of top telecom firm Maxis Communications Berhad.
Key changes to the portfolioOver the year, the fund manager exited Kencana Petroleum Berhad, KLCC Property Holdings Berhad, Petra PerdanaBerhad, SapuraCrest Petroleum Berhad, Telekom Malaysia Berhad and Tower Real Estate Investment Trust. The fundmanager started positions in AMMB Holdings Berhad, Plus Expressways Berhad, Berjaya Sports Toto Berhad,Lafarge Malayan Cement Bhd, Kuala Lumpur Kepong Berhad, IJM Corporation Berhad, DiGi Telecommunications SdnBhd, Media Prima Berhad and Public Bank Berhad.
Over the 12 months, on a percentage basis, the fund manager added to its positions notably in Public Bank Berhad,Sime Darby Berhad and IJM Plantations Berhad while making reductions in IGB Corporation Berhad, Sunway CityBerhad and Media Prima Berhad.
Outlook and strategyMalaysia has the highest fiscal deficit among the ASEAN countries and the government’s latest budgetannouncement in October suggests more prudence in spending going forward, which is a positive development.
-10
0
10
20
30
40
50
60
Since Launch*†1-Year
Tota
l ret
urn
US
$ (
%) 49.1 52.1
-3.7-0.2
MSCI Malaysia IndexInternational Opportunities Funds – Malaysia Equity

34
INTERNATIONAL OPPORTUNITIES FUNDS
REPORT OF THE BOARD OF DIRECTORSAS AT DECEMBER 31, 2009 (continued)
International Opportunities Funds – North America (“Sub-Fund”)
Performance
*October 17, 2005, Class A†Annualised
Source: Prudential Asset Management (Singapore) Limited (Sub-Fund data) & Bloomberg (Benchmark), in USD, bid-to-bid, net income reinvested.
Manager commentary
Sub-Fund performanceThe consensus view was that the U.S. exited one of the longest recessions (started in December 2007) in its history.The Fed Funds rate remained unchanged for all of 2009 at a rate of 0 to 0.25 percent. The Federal Open MarketCommittee (FOMC) believed economic conditions were likely to warrant exceptionally low short-term interest rates foran extended period. Additionally, inflation is forecast to remain in check. Sector performance followed the typicaltextbook cycle in 2009. Early cyclical stocks outperformed in 2009 with the Information Technology and ConsumerDiscretionary sectors leading the way. The Material sector took its place among the best performers as commodityprices increased globally. Traditional defensive sectors such as Utilities and Telecommunication Servicesunderperformed the broad market. Health Care stocks were weak for much of 2009 as Congress attempted to reformhealth care. For the year ended December 31, 2009 the Sub-Fund increased 34.1% versus its benchmark, theS&P 500 Index, which gained 29.6%.
Factors affecting performanceThe relative overweight positions in the Materials and Consumer Discretionary sectors helped Sub-Fund performance.The relative underweight position in the Information Technology sector detracted from Sub-Fund performance.
A diverse group of stocks including energy company, Newfield Exploration, managed health care name, Cigna Corp,and global financial services company, Morgan Stanley, led the Sub-Fund outperformance. Companies that detractedfrom Sub-Fund performance included Citigroup, sold early in 2009 after its fundamentals weakened significantly,property/casualty company, Allstate Insurance, negatively impacted by the financial crisis, and steel company, Nucor,who reported little improvement in real demand.
Key changes to the portfolioSignificant changes to the Sub-Fund included the purchase of Edison International and Lockheed Martin. Additionally,the positions of Microsoft, Johnson & Johnson, Procter & Gamble were increased to a relative overweight positionfrom a market weight position. Some other purchases included Apple, CVS Caremark Corporation, EMC Corporationand Gilead Sciences.
The Sub-Fund exited positions in Sherwin-Williams, Masco and Burlington Northern Santa Fe (the company was soldafter the announcement that Berkshire Hathaway would purchase all remaining shares of the railroad operator, that itdid not already own). Contract drilling company, Ensco International, purchased during 2009, was sold when thecompany announced that it would reincorporate in the UK in late 2009. Healthcare services provider, IMS Health Inc.,also purchased during 2009, was sold after the company announced that it would be acquired. Positions in DowChemical, E.I. DuPont de Nemours & Co. and Citigroup were reduced from a relative overweight position to a marketweight position.
-10
0
10
20
30
40
Since Launch*†3-Year†1-Year
Tota
l ret
urn
US
$ (
%)
34.129.6
-9.4-5.7
-2.2
0.7
S&P 500 Index (1 day lag return)International Opportunities Funds – North America

35
INTERNATIONAL OPPORTUNITIES FUNDS
REPORT OF THE BOARD OF DIRECTORSAS AT DECEMBER 31, 2009 (continued)
Through stock selection the Sub-Fund reduced its significant underweight positions in the Health Care and Utilitiessectors. The Consumer Staples sector went from a significant underweight position to a modest overweight position.The relative weight in the Consumer Discretionary and Materials sectors position were reduced.
Outlook and strategyWe believe the market’s current valuation is attractive and that the Sub-Fund is inexpensive relative to the overallmarket. We continue to favor stocks within the Financials and Industrials sectors, the Sub-Fund’s larger sectoroverweight positions (relative to the S&P 500 Index) at the end of the period. We believe these sectors are still veryattractive on a long-term basis and offer significant upside potential using our normal 2-3 year investment timehorizon.

36
INTERNATIONAL OPPORTUNITIES FUNDS
REPORT OF THE BOARD OF DIRECTORSAS AT DECEMBER 31, 2009 (continued)
International Opportunities Funds – North American Value (“Sub-Fund”)
Performance
*August 31, 2007, Class A†Annualised
Source: Prudential Asset Management (Singapore) Limited (Sub-Fund data) & Bloomberg (Benchmark), in USD, bid-to-bid, net income reinvested.
Manager commentary
Sub-Fund performanceThe consensus view was that the U.S. exited one of the longest recessions (started in December 2007) in its history.The Fed Funds rate remained unchanged for all of 2009 at a rate of 0 to 0.25 percent. The Federal Open MarketCommittee (FOMC) believed economic conditions were likely to warrant exceptionally low short-term interest rates foran extended period. Additionally, inflation is forecast to remain in check. Sector performance followed the typicaltextbook cycle in 2009. Early cyclical stocks outperformed in 2009 with the Information Technology and ConsumerDiscretionary sectors leading the way. The Material sector took its place among the best performers as commodityprices increased globally. Traditional defensive sectors such as Utilities and Telecommunication Servicesunderperformed the broad market. Health Care stocks were weak for much of 2009 as Congress attempted to reformhealth care. For the year ended December 31, 2009 the Sub-Fund increased 43.1% versus its benchmark whichgained 24.4%.
Factors affecting performanceThe relative overweight positions in the Materials and Consumer Discretionary sectors helped Sub-Fund performance.The relative underweight position in the Information Technology sector detracted from Sub-Fund performance.
A diverse group of stocks including energy company, Newfield Exploration, managed health care name, Cigna Corp,and global financial services company, Morgan Stanley, led Sub-Fund outperformance. Companies that detractedfrom Sub-Fund performance included Citigroup, sold early in 2009 after its fundamentals weakened significantly,property/casualty company, Allstate Insurance, negatively impacted by the financial crisis, and steel company, Nucor,who reported little improvement in real demand.
Key changes to the portfolioSignificant changes to the Sub-Fund included the purchase of several high quality names such as Microsoft, Johnson& Johnson, Procter & Gamble, Edison International and Lockheed Martin. Sales in 2009 included Citigroup, Sherwin-Williams, Masco, Dow Chemical and E.I. DuPont de Nemours & Co. Contract drilling company, Ensco International,purchased during 2009, was sold when the company announced that it would reincorporate in the UK in late 2009.Healthcare services provider, IMS Health Inc., also purchased during 2009, was sold after the company announcedthat it would be acquired.
Through stock selection, the Sub-Fund reduced its significant underweight position in the Health Care and ConsumerStaples sectors. The relative weight in the Financials and Consumer Discretionary sector positions were reduced.
Outlook and strategyWe believe the market’s current valuation is attractive and that the Sub-Fund is inexpensive relative to the overallmarket. We continue to favor stocks within the Financials and Consumer Discretionary sectors, the Sub-Fund’s largersector overweight positions at the end of the period. We believe these sectors are still very attractive on a long-termbasis and offer significant upside potential using our normal 2-3 year investment time horizon.
-20
0
20
40
60
Since Launch*†1-Year
Tota
l ret
urn
US
$ (
%) 43.1
24.4
-16.0 -13.0
S&P Citi Value Index (1 day lag return)International Opportunities Funds – North American Value

37
INTERNATIONAL OPPORTUNITIES FUNDS
REPORT OF THE BOARD OF DIRECTORSAS AT DECEMBER 31, 2009 (continued)
International Opportunities Funds – Pan European (“Sub-Fund”)
Performance
*August 26, 2005, Class A†Annualised
Source: Prudential Asset Management (Singapore) Limited (Sub-Fund data) & Bloomberg (Benchmark), in USD, bid-to-bid, net income reinvested.
Manager commentary
Sub-Fund performanceDespite a treacherous start to the year, European equities enjoyed strong returns during 2009. As soon as signsemerged that the unprecedented monetary and fiscal stimulus measures employed by governments worldwide hadsaved the economy from a 1930s-style depression, and economic data stopped deteriorating, investors demandedhigher yielding assets. Having been heavily sold at the height of the downturn, cyclical-led sectors with the greatestexposure to the rebound in economic activity were the biggest beneficiaries of investors’ renewed risk appetite.Commodity- and industrial-related stocks therefore achieved some of the biggest gains, spurred on by attractivedemand fundamentals from emerging countries, such as China and India. For the year ended December 31, 2009,the Sub-Fund gained 35.8%, underperforming a gain of 37.4% from its benchmark, the FTSE World Europe Index.
Factors affecting performance Anglo-Irish oil & gas exploration group Tullow Oil Plc, the fund’s largest holding, maintained its winning streak. Sharesin the business advanced against a backdrop of rising oil prices, as well as optimism over the potential of its assetbase.
There were also strong contributions from online gaming companies Sportingbet Plc and PartyGaming Plc. A massiveboost for the sector came in March when PartyGaming reached an agreement with the US authorities, ending nearlythree years of uncertainty for the industry after the passing of a US law that made online gambling illegal there.Possible consolidation, expansion into new markets and various product launches also underpinned confidence inPartyGaming and Sportingbet.
A comparatively large position in Storebrand ASA, the Norwegian insurance provider, benefited performance too.The company swung to profit in the third quarter of 2009, helped by recovering equity markets, a build-up of buffercapital, strength from its pension unit and improved investment returns.
As ever, there were a number of setbacks, including Public Power Corp (“PPC”), the Greek power provider, whichsuccumbed to concerns over the country’s massive budget deficit. The fund manager believes that PPC offerscompelling value since there is not enough capacity in the Greek electricity market. In his opinion, restructuringefforts will enhance the transparency and clarity of PPC’s different activities, and enable the business to chargehigher electricity prices.
Another detractor, Irish airline Aer Lingus Group Plc, was unable to escape the effects of the tough economic climateas companies and consumers scaled back their travel plans. The fund manager disposed of the holding in AerLingus, freeing up assets for more attractive investment opportunities.
Key changes to the portfolioThere was a relatively high level of portfolio activity during the year as the fund manager rebalanced the Sub-Fundby reducing its underweight position in banks, as well as increasing its exposure to more cyclical stocks.
-10
0
10
20
30
40
Since Launch*†3-Year†1-Year
Tota
l ret
urn
US
$ (
%)
35.8 37.4
-6.5 -5.2
3.5 4.5
FTSE World Europe (incl. UK) IndexInternational Opportunities Funds – Pan European

38
INTERNATIONAL OPPORTUNITIES FUNDS
REPORT OF THE BOARD OF DIRECTORSAS AT DECEMBER 31, 2009 (continued)
This is reflected by the significant reduction in the weighting of the Sub-Fund’s ‘defensive’ holdings, including Germanglasses retailer Fielmann AG, dialysis clinic operator Fresenius Medical Care AG & Co, French drug maker IpsenLimited, Dutch animal feed manufacturer Nutreco Holding NV, Spanish producer of blood and plasma products GrifolsSA, and Icon, the Irish clinical trial outsourcing firm.
The fund manager also disposed of the longstanding holding in Belgian supermarket chain Colruyt NV. Although heregarded Colruyt as an extremely well run company, he believed that after nearly four years in the Sub-Fund, thestock had fulfilled its role and that its share price offered limited potential for further upside.
Wanting to increase the Sub-Fund’s exposure to the financial sector, the fund manager established a holding inBelgian-Dutch financial services group Fortis NV. The business is now a pure life insurance provider, having recentlysold its banking operations to BNP Paribas and disposed of its toxic assets via the bail-out programme. Positions inBank of Cyprus and Spanish banking giant Santander SA were also initiated.
Given the subdued economic environment, the fund manager is building up the Sub-Fund’s investment in companiesthat are taking specific actions to generate earnings and enhance their cashflows. To this end, he established aposition in ThyssenKrupp AG, a German industrial conglomerate that he believes looks undervalued. A restructuringinitiative is under way at ThyssenKrupp, and in the fund manager’s view, the company is a good example of abusiness that is taking steps to enhance value.
Outlook and strategySince businesses will not be able to rely on buoyant economic activity as a way to generate solid growth in earnings,the fund manager will continue to seek more companies in the transition stage, that is, businesses whosemanagement teams are taking specific actions to grow their profits and boost their cashflows. Additionally, the fundmanager will continue to favour companies that are able to tap into further sources of growth, for instance throughexports to or operations in emerging markets, or through outsourcing production to lower cost locations in easternEurope. A thorough fundamental analysis of the business prospects of individual firms and the valuations paid forindividual stocks will continue to form a solid base from which to generate long-term performance for the Sub-Fund’sinvestors.

39
INTERNATIONAL OPPORTUNITIES FUNDS
REPORT OF THE BOARD OF DIRECTORSAS AT DECEMBER 31, 2009 (continued)
International Opportunities Funds – Philippines Equity (“Sub-Fund”)
Performance
*July 2, 2007, Class A†Annualised
Source: Prudential Asset Management (Singapore) Limited (Sub-Fund data) & Bloomberg (Benchmark), in USD, bid-to-bid, net income reinvested.Benchmark changed from MSCI Philippines Index to PSEi effective October 1, 2009.
Manager commentary
Sub-Fund performanceThe PSEi advanced 63% in 2009 in local currency terms, its biggest percentage gain since 1993. Remittances fromoverseas Filipino workers remained resilient in the year, boosting private consumption growth. he upgrade by Moody’sInvestors Service of the country’s debt rating to Ba3 from B1 cheered the market in July. Sentiment remained positivedespite the damage to infrastructure and agriculture brought about by a string of typhoons that brought about theworst flooding in 40 years in Metro Manila. The Sub-Fund posted a net return of 82.9% in 2009, outperforming itstotal return benchmark by 11.4%. The benchmark was changed from the MSCI Philippines Free Total Return Indexto the 32-member Philippine Stock Exchange Index (PSEi) effective 1 October 2009.
Factors affecting performanceThe Sub-Fund’s natural underweight in Philippine Long Distance Telephone Co boosted its performance as thetelecom sector underperformed in the year. The overweight in Universal Robina Corp, the country’s largest snackfood producer, also aided the Sub-Fund as the stock advanced on expectations that the company will benefit fromhigher consumer spending during the 2010 elections. Lopez-linked companies such as the First Philippine Holdings(FPH) and Energy Development Corp also contributed to the Sub-Fund’s performance. FPH rallied on the back of thesale of its stake in Manila Electric Co. Exposure to Security Bank Corp bolstered the Sub-Fund. The bank has thehighest return on equity and lowest non-performing loan ratio among private universal banks and trades at anattractive valuation of 0.9x forward price-to-book.
Cash was a major drag on performance in 2009. The Sub-Fund’s underweight position in mining stocks such asPhilex Mining Corp and Lepanto Consolidated Mining Co hurt performance as the stock prices surged on the backof record gold prices. The overweight in Manila Water Co also detracted from performance as it was the worstperforming stock in the PSEi last year. The underweight position in Manila Electric also weakened performance asthe battle for control by two of its shareholders, San Miguel Corp and First Pacific Group, lifted the stock.
Key changes to the portfolioThe Sub-Fund established new positions in property developers Filinvest Land Inc and Megaworld Corp which aredeemed beneficiaries of low interest rates and rising demand for homes on the back of strong remittances fromFilipinos working overseas. It also bought Lepanto Consolidated Mining and acquired Alliance Global Group Inc, whichis a holding company engaged in the gaming, property, and food and beverage businesses. The Sub-Fund exitedPilipino Telephone Corp and cement makers Republic Cement Corp and Holcim (Philippines) Inc, locking in gains.
Outlook and strategyWe are concerned with the deterioration in the Philippines’ fiscal position but feel that it is unlikely to derail thecountry’s economic recovery. In the near term, the central bank is unlikely to tighten monetary policy as inflationremains subdued. Valuation of Philippines equities remains in-line with historical average and attractive relative toother Asian peers.
-20
0
20
40
60
80
100
Since Launch*†1-Year
Tota
l ret
urn
US
$ (
%)
82.971.5
-8.7 -5.3
BenchmarkInternational Opportunities Funds – Philippines Equity

40
INTERNATIONAL OPPORTUNITIES FUNDS
REPORT OF THE BOARD OF DIRECTORSAS AT DECEMBER 31, 2009 (continued)
International Opportunities Funds – Taiwan Equity (“Sub-Fund”)
Performance
*July 2, 2007, Class A†Annualised
Source: Prudential Asset Management (Singapore) Limited (Sub-Fund data) & Bloomberg (Benchmark), in USD, bid-to-bid, net income reinvested.
Manager commentary
Sub-Fund performanceAsian equity markets started 2009 poorly. The Taiwan MSCI Index lost 10.0% in January, becoming the second-worstperformer among Asian markets ex-Japan amid the likelihood that the economy may have slipped into recession inthe 4Q08. Globally coordinated efforts to avoid a financial meltdown soon paid dividends as March kicked off anextended period of equity appreciation. For the 12 months ended December 31, 2009, the Sub-Fund returned 89.8%versus its benchmark’s return of 88.1%.
Factors affecting performanceThe Sub-Fund added 9.9% in Q109, in line with the benchmark and 29.0% in Q209, thus outperforming thebenchmark by 1.3%. The market continued to rally into the third quarter as positive macroeconomic data, earningsupgrades encouraged investors. The Sub-Fund added 25.9% in the quarter, outperforming the benchmark by 3.4% onthe back of strong performance of tech-related holdings. The fourth quarter saw the Sub-Fund add 6.4% to returnsas positive sentiment over the cross-strait talks buoyed the markets.
Key changes to the portfolioOver the year, the fund manager completely exited the positions in ACHEM Technology, Ardentec Corp, China LifeInsurance, Green Energy Technology, KGI Securities, Motech Industries, Paragon Technology, President Securities,Shin Kong Financial, Tatung and Sinopac Holdings.
Proceeds were used to established new positions in Asustek Computer, Chi Mei Optoelec, China Steel, FirstFinancial Holdings, Formosa Chemical and Fibre, Fubon Financial Holdings, HTC Corp, Lite-on Technology, MegaFinancial Holdings, Nan Ya Plastic, Quanta Computer, Siliconware Precision, United Microelectric and Wistron Corp.
The fund manager trimmed exposure to Advanced Semiconductor, Asia Cement, Taiwan Cement, Far Eastern Textile,Chinatrust Financial and Delta Electronics. Proceeds were used to add to Chunghwa Telecom and Fubon.
Outlook and strategyAsia’s strong performance and modestly-elevated valuations are likely to be challenged in the near term by a weakeconomic recovery among the world’s developed markets and the tightening of monetary policy at home.Nonetheless, we believe ex-Japan Asian economic growth will exceed that of the world’s developed markets and thatthe medium-term outlook for the region’s economies and markets is positive.
Specifically, Taiwan’s relative valuation is in line with the region although earnings risks are higher. Cross-Straitdevelopment will remain a key driver in the Taiwanese market. In the medium term, economic growth and assetreflation are likely to occur as cross strait policies continue to open. Corporate restructuring will improve shareholdervalue.
-20
0
20
40
60
80
100
Since Launch*†1-Year
Tota
l ret
urn
US
$ (
%)
89.8 88.1
-1.2
1.8
TWSE IndexInternational Opportunities Funds – Taiwan Equity

41
INTERNATIONAL OPPORTUNITIES FUNDS
REPORT OF THE BOARD OF DIRECTORSAS AT DECEMBER 31, 2009 (continued)
International Opportunities Funds – Thailand Equity (“Sub-Fund”)
Performance
*July 2, 2007, Class A†Annualised
Source: Prudential Asset Management (Singapore) Limited (Sub-Fund data) & Bloomberg (Benchmark), in USD, bid-to-bid, net income reinvested.
Manager commentary
Sub-Fund performanceThe Thai SET50 Index advanced 64.5% in local currency terms to post its biggest annual gain since 2003 whenit surged 123%. Improved macroeconomic data on the back of the government’s fiscal stimulus program and loosemonetary policy helped eased Thailand’s recession, the first in about a decade, and boosted market sentiment.Politics hogged the limelight early in the year as Prime Minister Abhisit Vejjajiva had to impose an emergency ruleafter anti-government riots led to casualties. The emergency decree was later lifted. Worries over the health of theailing Thai monarch, King Bhumibol Adulyadej dampened market sentiment. A court decision to suspend over70 government approved projects in the Map Ta Phut industrial zone also hurt shares. The Sub-Fund posted a returnof 61.2% in 2009 against the benchmark’s 79.6%, underperforming the benchmark by 18.4%.
Factors affecting performanceThe Sub-Fund’s holdings in Kasikornbank Plc, Siam Commercial Bank and Bangkok Bank boosted its performance asthe sector outperformed in 2009. The fund manager likes Thai banks due to their resilient operations and attractivevaluation. The natural underweight in PTT Plc and its unit PTT Exploration & Production benefited the Sub-Fund asshares underperformed. Coal miner Banpu Public Pcl helped the Sub-Fund on the back of its impressive 9-monthresults. The fund manager believes the stock’s valuation is attractive versus its growth prospects. We are positive aboutthe company’s earnings potential from its new coal mines amid the stronger demand and tighter supply outlook.
The Sub-Fund’s exposure to defensive names such as utilities Thai Tap Water and Electricity Generating Pclweakened its performance in 2009. The fund manager likes the consistent growth of Thai Tap Water which runs thecountry’s largest private tap water operation with a concession lasting until 2034. Total Access Communication Plc(DTAC) underperformed for the year on worries over the possible delay in the auction of licenses for third-generationmobile services. Bangkok Expressway Pcl, deemed a defensive play, underperformed the broader market in 2009,hurting the Sub-Fund.
Key changes to the portfolioAmong the larger trades in 2009, the fund manager established new positions in Krung Thai Bank, oil refiner Esso(Thailand) Pcl and holding company TISCO Financial Group Pcl. Krung Thai Bank, the largest state-owned bank,is deemed a beneficiary of the government’s infrastructure spending. Broadcaster BEC World Pcl, oil refiner TheBangchak Petroleum Pcl and hotel and fast-food chain operator Minor International Pcl were also added to theportfolio. The Sub-Fund exited positions in property names such as Hemaraj Land & Development Pcl, Quality HousePcl, and Preuksa Real Estate Pcl, locking in gains brought about by lower interest rates. The Sub-Fund also sold outof Major Cineplex Group, Thailand’s biggest cinema operator.
-20
0
20
40
60
80
Since Launch*†1 Year
Tota
l ret
urn
US
$ (
%) 61.2
79.6
-1.3
2.4
SET 50 IndexInternational Opportunities Funds – Thailand Equity

42
INTERNATIONAL OPPORTUNITIES FUNDS
REPORT OF THE BOARD OF DIRECTORSAS AT DECEMBER 31, 2009 (continued)
Outlook and strategyThe Thai market’s valuation is attractive relative to other emerging markets with the SET50 currently trading at11x FY2010 PE and 10x FY2011 PE. A higher risk premium, however, may be required if tension resumes in thepolitical arena. Earnings expectations for the Thai market are not overly excessive having come from a very lowbase. Hence, earnings risks could be moderate relative to other markets.

43
INTERNATIONAL OPPORTUNITIES FUNDS
REPORT OF THE BOARD OF DIRECTORSAS AT DECEMBER 31, 2009 (continued)
International Opportunities Funds – US Bond (“Sub-Fund”)
Performance
*November 30, 2007, Class A†Annualised
Source: Prudential Asset Management (Singapore) Limited (Sub-Fund data) & Bloomberg (Benchmark), in USD, bid-to-bid, net income reinvested.
Manager commentary
Sub-Fund performanceAfter January and February of 2009 left fixed income markets with record wide risk premiums, US fixed income,along with many global risk asset classes, staged a furious rally, with investment grade credit posting double-digittotal and excess returns. Such performance was driven by the severe dislocation in spreads at the beginning of theyear, which implied “depression type” scenarios that did not materialize; the strong investor demand that followed,improving health in the banking system, and aggressive monetary and fiscal policy. A “green shoot” economic storygained ground in the second quarter as “less worse” economic data emerged, and the stabilization story of thesecond quarter transitioned to a story of recovery by the third quarter due to better than expected second quarterearnings and encouraging macroeconomic signs. In addition to benefiting from signs of fundamental improvement asthe year progressed, investment grade credit benefited from strong investor demand. While US fixed income riskasset classes benefited from an improving fundamental backdrop and strong technicals, US Treasuries posted losses,as the US sold record amounts of securities.
For the year ending December 31, 2009, the Sub-Fund gained 12.9%, versus the benchmark’s return of 5.8%.
Factors affecting performanceThe Sub-Fund’s positioning across all broad asset classes within its benchmark, except for cash, contributedpositively to relative return in 2009. The fund’s significant over-weights to corporate credit and CMBS were the toptwo broad sector contributors. Under-weights to Treasuries, MBS and Agencies, which under-performed the stellarperformance in traditionally higher risk asset classes, too boosted performance.
Within the corporate space, the Sub-Fund’s over-weight to banks, which benefited from improving liquidity, capitalraises, and government sponsored programs, was the largest positive contributor to relative return. Within Banking,over-weights to Barclays Bank (BACR), Citigroup (C), and Bank of America (BAC) were the largest sources of out-performance.
The fund manager’s long term relative value discipline paid off in 2009 as the Sub-Fund’s significant over-weight toCMBS, which had contributed to underperformance in late 2008 and early 2009 amid risk aversion and marketdislocation, was a large source of out-performance in 2009. CMBS rallied in 2009 despite an overall weakening incommercial real estate fundamentals, which highlights both the excessiveness of the depression type scenarios thatwere priced into CMBS valuations at the beginning of the year as well as the positive support provided by thegovernment’s TALF program.
Cash was the largest source of negative relative return in 2009.
Key changes to the portfolioThe Sub-Fund’s allocation to CMBS was trimmed throughout the year as valuations improved and the asset classbecame less attractive from a relative value perspective. CMBS positions were reduced by roughly 50% year-over-year.
0
4
8
12
16
Since Launch*†1-Year
Tota
l ret
urn
US
$ (
%) 12.9
5.8 5.4 5.7
Barclays Capital U.S. Aggregate Bond Index (1 day lag return)International Opportunities Funds – US Bond

44
INTERNATIONAL OPPORTUNITIES FUNDS
REPORT OF THE BOARD OF DIRECTORSAS AT DECEMBER 31, 2009 (continued)
We increased our under-weights to Treasuries and MBS towards the end of the year due to our relatively negativeoutlook for these asset classes in 2010. Proceeds from CMBS, Treasury, and MBS trims were generally deployed incorporate credit, although a large portion of this was allocated to the “Other Corporates” sector which comprised ofLocal Authorities (including taxable municipals), Sovereigns, Government Guarantees, and Supranationals.
A large portion of purchases were comprised of new issues, which despite small or non-existent new issueconcessions, continued to be a good way to add credits that we like, due to the large, diverse array of companiesissuing within the quarter and better purchasing liquidity in the primary market than in the secondary market.
Outlook and strategyCollectively, economic data has continued to move in the right direction, with manufacturing data transitioning fromcontraction to expansion, housing activity showing signs of improvement, and job losses slowly diminishing. On theother hand, the strength of the recovery is still very uncertain and the government remains sensitive to the fragility ofthe recovery. Therefore, our base case assumption is that recovery will continue in the near-term supported by fiscaland monetary policy, which should continue to provide support for investment grade fixed income. Longer-term,however, the economy faces many challenges, and growth could soften as the year progresses due to strongheadwinds from persistently high unemployment, lasting consumer spending cutbacks, and a high federal budgetdeficit.
Although corporate credit spreads have already dramatically tightened, in some instances near pre-crises level, weanticipate that corporate spreads will continue to tighten in the near term due to very strong technical support, themarket’s positive perception of economic data, and favorable fiscal and monetary policy. Because companies wereable to take advantage of the drastically improved conditions in 2009 to refinance and extend maturities, whichgenerally left companies with sufficient cash levels and low near-term maturities, corporate supply should decreasein 2010. On the demand side, significant cash remains on the sidelines, and a shift in many investors’ preferencestowards more conservative investing should keep flows into corporate credit strong, providing strong technical supportto the market.
We remain over-weight to financial credit due to our constructive view about near-term spread tightening. The roomfor further spread compression is greatest in financials, which should continue to benefit from improving balancesheet strength and equity capitalization as well as increased regulation that should lead to lower leverage. The Sub-Fund is maintaining an out-of-index over-weight to CMBS, which has been significantly reduced within 2009 asvaluations have improved. The over-weight that remains is due to the asset class’s still attractive relative valuation,and we will continue to use periods of market strength to trim this over-weight. We expect to maintain an under-weight to Treasuries and MBS for the foreseeable future, reflecting our concerns over the withdrawal of quantitativeeasing and record treasury issuance, which also strengthens the relative attractiveness of corporate credit.

45
INTERNATIONAL OPPORTUNITIES FUNDS
REPORT OF THE BOARD OF DIRECTORSAS AT DECEMBER 31, 2009 (continued)
International Opportunities Funds – US Corporate Bond (“Sub-Fund”)
Performance
*November 30, 2007, Class D†Annualised
Source: Prudential Asset Management (Singapore) Limited (Sub-Fund data) & Bloomberg (Benchmark), in USD, bid-to-bid, net income reinvested.
Manager commentary
Sub-Fund performanceAfter January and February of 2009 left fixed income markets with record wide risk premiums, US fixed income,along with many global risk asset classes, staged a furious rally, with investment grade credit posting double-digittotal and excess returns. Such performance was driven by the severe dislocation in spreads at the beginning of theyear, which implied “depression type” scenarios that did not materialize; the strong investor demand that followed,improving health in the banking system, and aggressive monetary and fiscal policy. A “green shoot” economic storygained ground in the second quarter as “less worse” economic data emerged, and the stabilization story of thesecond quarter transitioned to a story of recovery by the third quarter due to better than expected second quarterearnings and encouraging macroeconomic signs. In addition to benefiting from signs of fundamental improvement asthe year progressed, investment grade credit benefited from strong investor demand.
For the year ending December 31, 2009, the Sub-Fund gained 25.1% versus the benchmark’s 15.6% return.
Factors affecting performanceThe fund manager’s long term relative value discipline paid off in 2009 as out-of-index positioning in CMBS, whichhad contributed to underperformance in late 2008 and early 2009 amid risk aversion and market dislocation, was byfar the largest source of out-performance in 2009. CMBS rallied in 2009 despite an overall weakening in commercialreal estate fundamentals, which highlights both the excessiveness of the depression type scenarios that were pricedinto CMBS valuations at the beginning of the year as well as the positive support provided by the government’s TALFprogram.
The Sub-Fund’s under-weights to “other corporate” sectors such as Supranational and Government Guarantee, whichmaterially under-performed in 2009, were also large contributors to out-performance in 2009.
Over-weight positioning in Banking also contributed to out-performance in 2009, with over-weights to JP MorganChase (JPM), Bank of America (BAC) and Barclays Bank (BACR) as the top three contributors to relative returnwithin the banking sector.
Cash was the largest source of negative relative return in 2009.
Key changes to the portfolioWe opportunistically reduced our over-weight positions in CMBS and ABS as the year progressed, taking advantageof strength and spread compression to monetize gains and diversify across the Sub-Fund’s investment universe.Exposure to the foreign and local government components of the Sub-Fund’s index, such as sovereigns,supranationals, and local authorities, was modestly increased within the year. We also participated in new issues of“Build America Bonds”, the US government sponsored program.that provides a 35% subsidy to municipal issuers oninterest payments made to investors.
0
5
10
15
20
25
30
Since Launch*†1-Year
Tota
l ret
urn
US
$ (
%) 25.1
15.6
8.25.7
International Opportunities Funds – US Corporate Bond
Barclays Capital Credit Most Conservative 2% Issuer Cap Bond Index (1 day lag return)

46
INTERNATIONAL OPPORTUNITIES FUNDS
REPORT OF THE BOARD OF DIRECTORSAS AT DECEMBER 31, 2009 (continued)
Outlook and strategyCollectively, economic data has continued to move in the right direction, with manufacturing data transitioning fromcontraction to expansion, housing activity showing signs of improvement, and job losses slowly diminishing. On theother hand, the strength of the recovery is still very uncertain and the government remains sensitive to the fragility ofthe recovery. Therefore, our base case assumption is that recovery will continue in the near-term supported by fiscaland monetary policy, which should continue to provide support for investment grade fixed income. Longer-term,however, the economy faces many challenges, and growth could soften as the year progresses due to strongheadwinds from persistently high unemployment, lasting consumer spending cutbacks, and a high federal budgetdeficit.
Although corporate credit spreads have already dramatically tightened, in some instances near pre-crises level, weanticipate that corporate spreads will continue to tighten in the near term due to very strong technical support, themarket’s positive perception of economic data, and favorable fiscal and monetary policy. Because companies wereable to take advantage of the drastically improved conditions in 2009 to refinance and extend maturities, whichgenerally left companies with sufficient cash levels and low near-term maturities, corporate supply should decrease in2010. On the demand side, significant cash remains on the sidelines, and a shift in many investors’ preferencestowards more conservative investing should keep flows into corporate credit strong, providing strong technical supportto the market.
We remain over-weight to financial credit due to our constructive view about near-term spread tightening. The roomfor further spread compression is greatest in financials, which should continue to benefit from improving balancesheet strength and equity capitalization as well as increased regulation that should lead to lower leverage. The Sub-Fund is maintaining an out-of-index over-weight to CMBS, which has been significantly reduced within 2009 asvaluations have improved. The over-weight that remains is due to the asset class’s still attractive relative valuation,and we will continue to use periods of market strength to trim this over-weight.

47
INTERNATIONAL OPPORTUNITIES FUNDS
REPORT OF THE BOARD OF DIRECTORSAS AT DECEMBER 31, 2009 (continued)
International Opportunities Funds – US High Investment Grade Bond (“Sub-Fund”)
Performance
*December 16, 2004, Class A†Annualised
Source: Prudential Asset Management (Singapore) Limited (Sub-Fund data) & Bloomberg (Benchmark), in USD, bid-to-bid, net income reinvested.
Manager commentary
Sub-Fund performanceAfter January and February of 2009 left fixed income markets with record wide risk premiums, US fixed income,along with many global risk asset classes, staged a furious rally, with investment grade credit posting double-digittotal and excess returns. Such performance was driven by the severe dislocation in spreads at the beginning of theyear, which implied “depression type” scenarios that did not materialize; the strong investor demand that followed,improving health in the banking system, and aggressive monetary and fiscal policy. A “green shoot” economic storygained ground in the second quarter as “less worse” economic data emerged, and the stabilization story of thesecond quarter transitioned to a story of recovery by the third quarter due to better than expected second quarterearnings and encouraging macroeconomic signs. In addition to benefiting from signs of fundamental improvement asthe year progressed, investment grade credit benefited from strong investor demand.
For the year ending December 31, 2009, the Sub-Fund gained 14.5%, versus the benchmark’s return of 10.6%.
Factors affecting performanceThe fund manager’s long term relative value discipline paid off in 2009 as out-of-index positioning in CMBS, whichhad contributed to underperformance in late 2008 and early 2009 amid risk aversion and market dislocation, was byfar the largest source of out-performance in 2009. CMBS rallied in 2009 despite an overall weakening in commercialreal estate fundamentals, which highlights both the excessiveness of the depression type scenarios that were pricedinto CMBS valuations at the beginning of the year as well as the positive support provided by the government’s TALFprogram.
Over-weight positioning in Banking was the second largest contributor to out-performance in 2009, with over-weightsto Barclays Bank (BACR) and Wells Fargo & Co. (WFC) as the top two contributors to relative return within thebanking sector.
Detractors from relative performance were mild in 2009, with cash as the largest source of negative relative return.
Key changes to the portfolioWe opportunistically reduced our out-of-index over-weight position in CMBS as the year progressed, taking advantageof strength and spread compression to monetize gains and diversify across the Sub-Fund’s investment universe.The Sub-Fund’s allocation to ABS was modestly increased, mostly in the last quarter of the year, due to the fundmanager’s relative value outlook. The Sub-Fund’s allocation to corporate credit was also increased as CMBSpositions were trimmed; however, the Sub-Fund’s overall allocation within corporates was not significantly changed,with our largest over-weight position in financial sectors, which currently offer the most room for further spreadcompression.
0
5
10
15
Since Launch*†3-Year†1-Year
Tota
l ret
urn
US
$ (
%)
14.5
10.6
2.84.2
2.43.8
International Opportunities Funds – US High Investment Grade Bond
The BofA Merrill Lynch U.S. Corporates, A2 Rated and above Index (1 day lag return)

48
INTERNATIONAL OPPORTUNITIES FUNDS
REPORT OF THE BOARD OF DIRECTORSAS AT DECEMBER 31, 2009 (continued)
Exposure to “other corporates,” such as sovereigns, government guarantees, and local authorities, was modestlyincreased within the year, including with participation in new issues of “Build America Bonds,” the US governmentsponsored program that provides a 35% subsidy to municipal issuers on interest payments made to investors.
Outlook and strategyCollectively, economic data has continued to move in the right direction, with manufacturing data transitioning fromcontraction to expansion, housing activity showing signs of improvement, and job losses slowly diminishing. On theother hand, the strength of the recovery is still very uncertain and the government remains sensitive to the fragility ofthe recovery. Therefore, our base case assumption is that recovery will continue in the near-term supported by fiscaland monetary policy, which should continue to provide support for investment grade fixed income. Longer-term,however, the economy faces many challenges, and growth could soften as the year progresses due to strongheadwinds from persistently high unemployment, lasting consumer spending cutbacks, and a high federal budgetdeficit.
Although corporate credit spreads have already dramatically tightened, in some instances near pre-crises level, weanticipate that corporate spreads will continue to tighten in the near term due to very strong technical support, themarket’s positive perception of economic data, and favorable fiscal and monetary policy. Because companies wereable to take advantage of the drastically improved conditions in 2009 to refinance and extend maturities, whichgenerally left companies with sufficient cash levels and low near-term maturities, corporate supply should decrease in2010. On the demand side, significant cash remains on the sidelines, and a shift in many investors’ preferencestowards more conservative investing should keep flows into corporate credit strong, providing strong technical supportto the market.
We remain over-weight to financial credit due to our constructive view about near-term spread tightening. The roomfor further spread compression is greatest in financials, which should continue to benefit from improving balancesheet strength and equity capitalization as well as increased regulation that should lead to lower leverage. The Sub-Fund is maintaining an out-of-index over-weight to CMBS, which has been significantly reduced within 2009 asvaluations have improved. The over-weight that remains is due to the asset class’s still attractive relative valuation,and we will continue to use periods of market strength to trim this over-weight.

49
INTERNATIONAL OPPORTUNITIES FUNDS
REPORT OF THE BOARD OF DIRECTORSAS AT DECEMBER 31, 2009 (continued)
International Opportunities Funds – US High Yield Bond (“Sub-Fund”)
Performance
*August 26, 2005, Class A†Annualised
Source: Prudential Asset Management (Singapore) Limited (Sub-Fund data) & Bloomberg (Benchmark), in USD, bid-to-bid, net income reinvested.
Manager commentary
Sub-Fund performance2009 was an incredible year for the U.S. high yield market, as it achieved all-time records in terms of performance,mutual fund inflows and new issuance. High yield substantially outperformed all other domestic asset classes,including equities.
Improving economic indicators and sentiment, a welcome thaw in the credit markets, as well as improving health ofthe banking system supported the unprecedented rally in high yield bonds. Additionally, as indicated above, the highyield asset class enjoyed record demand in the form of high yield mutual fund inflows. Recognizing the opportunitycreated by record wide credit spreads, investors literally poured cash into high yield throughout the year. Thisdemand, along with robust demand from other sources, was met with new issuance. The majority of this newissuance was for refinancing purposes, which contributed to the corporate default rate peaking in 2009 at a lowerrate than originally forecasted, as even low-rated companies got much-needed financing, enabling them to survivethe current operating environment.
While absolute returns in high yield were impressive in 2009, relative returns suffered as active high yield managersstruggled to keep pace with indices due to index composition changes and poor purchasing liquidity.
During the period under review, the Sub-Fund gained 36.8%, underperforming its benchmark which returned 41.4%.
Factors affecting performanceOver-weight positioning in certain investment-grade-rated financials, a core strategy employed by the fund managerin 2009, was among the top contributors to relative performance. Specifically, over-weights to debt issued by LibertyMutual Inc. (LIBMUT), most of which was investment grade-rated, and investment grade rated securities issued byPNC Bank (PNC) were the top two contributors to positive relative performance.
The fund manager’s fundamental, longer term outlook paid off in 2009 as over-weight positioning in Markwest Energy(MWE), a gas distribution company, and TRW Automotive, an auto parts supplier, rebounded in 2009 as their liquiditysituations improved. These positions were among the top five positive contributors to relative performance in 2009.
The timing of the Sub-Fund’s positiong in MGM Mirage, a gaming company, was by far the largest detractor fromrelative performance in 2009. The company was on the verge of bankruptcy earlier in the year and was downgradedbelow the Sub-Fund’s rating threshold, and the fund manager sold it in order to avoid incurring further losses. Withina matter of weeks MGM received emergency financing and rebounded significantly, which had a material negativeimpact on the Sub-Fund’s performance versus its benchmark.
The Sub-Fund’s allocation to cash, although modest, was the second largest detractor from relative return in 2009.
0
5
10
15
20
25
30
35
40
45
Since Launch*†3-Year†1-Year
Tota
l ret
urn
US
$ (
%) 36.8
41.4
0.75.3
1.95.6
International Opportunities Funds – US High Yield Bond
The BofA Merrill Lynch U.S. High Yield, 70% BB Rated and 30% B Rated Custom Index (1 day lag return)

50
INTERNATIONAL OPPORTUNITIES FUNDS
REPORT OF THE BOARD OF DIRECTORSAS AT DECEMBER 31, 2009 (continued)
Key changes to the portfolioThe Sub-Fund’s positions in lower quality / higher risk companies were decreased throughout the first several monthsof the year as the fund manager sold various bonds that had been downgraded below the Sub-Fund’s B- threshold.Examples include sales of remaining shares in auto loan company, Ford Motor Credit; auto supplier company,Lear Corp.; gaming companies, Harrah’s and MGM; and chemical company, LyondellBassell.
Activity in the second and third quarters largely focused on purchases of new issues, fallen angels, and higher-qualityhigh yield and investment grade credits, as we sought to keep pace with index changes and began to find lowerquality less attractive as relative spread levels compressed.
Throughout most of the year, purchases were concentrated in the primary market, which reflected the record level ofdemand as new issues were oversubscribed and it was difficult to gain significant allocations. Nonetheless, the newissue market was a better place than the secondary market to add new positions as poor purchasing liquidity madesecondary bonds even more difficult and expensive to obtain than primary bonds. In general, purchases werediversified across many different sectors, reflecting more of a bottom-up approach than in 2008 and early 2009, asmany of the broader sector themes that we liked at the beginning of the year have diminished with the rally.
Outlook and strategyWe expect the positive dynamics that have continued to fuel the rally since March of 2009 – strong capital marketliquidity, economic improvement, risk appetite, and strong demand for high yield product – to continue to pushspreads tighter in 2010. That being said, the room for further tightening is nowhere near its level prior to the recordrally of 2009, and while we expect a very positive year by historical standards, high yield total returns will inevitablybe much less dramatic than in 2009. We estimate that spreads will tighten to an extent largely offsetting the modestrise in treasury rates that we anticipate, leading to a total return roughly-equal-to or slightly-higher-than coupon,which would be a historically attractive year for high yield. We believe, however, that risks of higher volatility,particularly in the latter part of the year, exist due to economic and capital market concerns that could heighten withpolicy tightening and potentially lackluster job market and consumer consumption data. Regardless of business cycleuncertainty, high yield bonds offer an attractive value proposition, with a risk/reward profile in between equities andinvestment grade bonds and an attractive coupon less dependent on earnings growth than equity markets.
Our portfolio positioning on a sector level currently reflects our general preference for companies that we believe arestill attractively priced from a relative valuation perspective, yet also have relatively stable businesses, cashflows,and liquidity positions and that are capable of withstanding “slower growth” scenarios. Our largest over-weights arecurrently in Banking (which is largely investment grade rated securities), Telecommunications, and Building andConstruction, which reflect these themes.

51
INTERNATIONAL OPPORTUNITIES FUNDS
REPORT OF THE BOARD OF DIRECTORSAS AT DECEMBER 31, 2009 (continued)
International Opportunities Funds – US Investment Grade Bond (“Sub-Fund”)
Performance
*March 1, 2005, Class A†Annualised
Source: Prudential Asset Management (Singapore) Limited (Sub-Fund data) & Bloomberg (Benchmark), in USD, bid-to-bid, net income reinvested.
Manager commentary
Sub-Fund performanceAfter January and February of 2009 left fixed income markets with record wide risk premiums, US fixed income,along with many global risk asset classes, staged a furious rally, with investment grade credit posting double-digittotal and excess returns. Such performance was driven by the severe dislocation in spreads at the beginning of theyear, which implied “depression type” scenarios that did not materialize; the strong investor demand that followed,improving health in the banking system, and aggressive monetary and fiscal policy. A “green shoot” economic storygained ground in the second quarter as “less worse” economic data emerged, and the stabilization story of thesecond quarter transitioned to a story of recovery by the third quarter due to better than expected second quarterearnings and encouraging macroeconomic signs. In addition to benefiting from signs of fundamental improvementas the year progressed, investment grade credit benefited from strong investor demand.
For the year ending December 31, 2009, the Sub-Fund gained 29.1%, versus the benchmark’s return of 25.3%.
Factors affecting performanceThe fund manager’s long term relative value discipline paid off in 2009 as out-of-index positioning in CMBS, whichhad contributed to underperformance in late 2008 and early 2009 amid risk aversion and market dislocation, was thelargest source of out-performance in 2009. CMBS rallied in 2009 despite an overall weakening in commercial realestate fundamentals, which highlights both the excessiveness of the depression type scenarios that were priced intoCMBS valuations at the beginning of the year as well as the positive support provided by the government’s TALFprogram.
The Sub-Fund’s positioning within the Electric Integrated sector was the second largest contributor to out-performance,driven largely by under-weights to PG&E (PCG), Berkshire Hathaway Inc. (BRK), and Progress Energy Inc. (PGN),which under-performed better returns in other securities and sectors that had offered better relative valueopportunities at the beginning of the year.
The Sub-Fund’s positioning within the Consumer/Commercial/Lease Financing sector was also a material contributorto out-performance in 2009, driven largely by the Sub-Fund’s over-weight to bonds issued by American GeneralFinance (AIG). The Sub-Fund’s under-weight to and positioning within securities issued by HSBC Finance was also alarge underlying driver of this sector’s positive contributor to relative return.
The Sub-Fund’s under-weight to REITs was the largest negative detractor from relative return within 2009 as REITsrebounded in sympathy with improving sentiment surrounding real estate related securities.
Key changes to the portfolioWe opportunistically reduced our out-of-index over-weight position in CMBS as the year progressed, taking advantageof strength and spread compression to monetize gains and diversify across the Sub-Fund’s investment universe.The Sub-Fund’s allocation to ABS was increased, mostly in the last quarter of the year, due to the fund manager’s
0
10
20
30
Since Launch*†3-Year†1-Year
Tota
l ret
urn
US
$ (
%)
29.1
25.3
4.86.4
3.85.2
International Opportunities Funds – US Investment Grade Bond
The BofA Merrill Lynch U.S. Corporates, BBB3 – A3 Rated Index (1 day lag return)

52
INTERNATIONAL OPPORTUNITIES FUNDS
REPORT OF THE BOARD OF DIRECTORSAS AT DECEMBER 31, 2009 (continued)
relative value outlook. The Sub-Fund’s allocation to corporate credit was also increased as CMBS positions weretrimmed; however, the Sub-Fund’s overall allocation within corporates was not significantly changed, with our largestover-weight position in financial sectors, which currently offer the most room for further spread compression.
Outlook and strategyCollectively, economic data has continued to move in the right direction, with manufacturing data transitioning fromcontraction to expansion, housing activity showing signs of improvement, and job losses slowly diminishing. On theother hand, the strength of the recovery is still very uncertain and the government remains sensitive to the fragility ofthe recovery. Therefore, our base case assumption is that recovery will continue in the near-term supported by fiscaland monetary policy, which should continue to provide support for investment grade fixed income. Longer-term,however, the economy faces many challenges, and growth could soften as the year progresses due to strongheadwinds from persistently high unemployment, lasting consumer spending cutbacks, and a high federal budgetdeficit.
Although corporate credit spreads have already dramatically tightened, in some instances near pre-crises level, weanticipate that corporate spreads will continue to tighten in the near term due to very strong technical support, themarket’s positive perception of economic data, and favorable fiscal and monetary policy. Because companies wereable to take advantage of the drastically improved conditions in 2009 to refinance and extend maturities, whichgenerally left companies with sufficient cash levels and low near-term maturities, corporate supply should decreasein 2010. On the demand side, significant cash remains on the sidelines, and a shift in many investors’ preferencestowards more conservative investing should keep flows into corporate credit strong, providing strong technical supportto the market.
We remain over-weight to financial credit due to our constructive view about near-term spread tightening. The roomfor further spread compression is greatest in financials, which should continue to benefit from improving balancesheet strength and equity capitalization as well as increased regulation that should lead to lower leverage. The Sub-Fund is maintaining an out-of-index over-weight to CMBS, which has been significantly reduced within 2009 asvaluations have improved. The over-weight that remains is due to the asset class’s still attractive relative valuation,and we will continue to use periods of market strength to trim this over-weight.

53
INTERNATIONAL OPPORTUNITIES FUNDS
REPORT OF THE BOARD OF DIRECTORSAS AT DECEMBER 31, 2009 (continued)
International Opportunities Funds – Vietnam Equity (“Sub-Fund”)
Performance
*January 11, 2008, Class C†Annualised
Source: Prudential Asset Management (Singapore) Limited (Sub-Fund data) & Bloomberg (Benchmark), in USD, bid-to-bid, net income reinvested.
Manager commentary
Sub-Fund performanceEquity markets started 2009 poorly with the Vietnamese government struggling to boost an economy that expanded6.23% last year, the slowest since 1999 when it grew 4.77%. Inflation, which slowed to 17.5% in January, the lowestin almost a year, and a 24% fall in exports, gave the central bank reason to cut interest rates. The Sub-Fund posteda return of 72.8% in 2009 while the benchmark rose 52.8%.
Key changes to the portfolioOver the year, the fund manager exited Hoa Binh Construction and Real Estate Corporation, Domesco Medical JSC,Nam Viet JSC, An Giang Fisheries JSC, Tan Tien Plastic Packaging JSC and Minh Phu Seafood JSC.
The fund manager built positions in DIC Corporation, Danang Rubber JSC, Song Da Urban & Industrial ZoneInvestment and Development JSC, Ho Chi Minh City Infrastructure Investment JSC, Petrovietnam Drilling and WellServices JSC, Thu Duc Housing Development Corporation, Hoa Phat Group JSC, Saigon Thuong Tin CommercialJoint Stock Bank, Vincom JSC, Vietnam Bank for Industry and Trade, Electrical Engineering Corporation, PVF CapitalCorporation, HAGL JSC, Baoviet Holdings, Joint Stock Commercial Bank for Foreign Trade of Vietnam (Vietcombank)and Vietnam Export Import Commercial Joint Stock Bank (Eximbank).
Over the 12 months, on a percentage basis, the fund manager added to its positions notably in FPT Corporation,Phu My Fertilizer Plant while making sizable reductions Dong Phu Rubber JSC, North Kinh Do Food JSC andGemadept Corporation.
Outlook and strategyThe relative valuation of Vietnam compared to the rest of the region does not look compelling although it is lessdemanding compared to its own history. The medium/long-term growth potential of Vietnam should remain intact if the government can successfully implement policies to maintain macroeconomic stability.
-40
-20
0
20
40
60
80
Since Launch*†1-Year
Tota
l ret
urn
US
$ (
%)
72.8
52.8
-22.4 -25.9
FTSE Vietnam All Share IndexInternational Opportunities Funds – Vietnam Equity

54
INTERNATIONAL OPPORTUNITIES FUNDS
REPORT OF THE BOARD OF DIRECTORSAS AT DECEMBER 31, 2009 (continued)
International Opportunities Funds – World Value Equity (“Sub-Fund”)
Performance
*December 9, 2003, Class A†Annualised
Source: Prudential Asset Management (Singapore) Limited (Sub-Fund data) & Bloomberg (Benchmark), in USD, bid-to-bid, net income reinvested.
Manager commentary
Sub-Fund performanceFollowing one of the deepest recessions since World War II, there are growing signs of a steady revival in globaleconomic activity and business confidence. Growth in emerging countries, particularly China and India, returnedalmost to pre-2008-crisis levels. Much of this rebound could be attributed to the unprecedented efforts of centralbanks around the world to stimulate recovery. We started off the year overweight pan-European and Asian equitiesand short US equities. As Asian equities rallied in 2009, we reduced our exposure to neutral in the second half.Afterwards we went underweight Asian equities in favour of European equities. For year ended December 31, 2009,the Sub-Fund increased 29.9%, versus the benchmark’s 30.8% gain.
Factors affecting performanceThe US portion of the Sub-Fund gained 35.8% while its benchmark returned 26.5% in 2009. Overweight in financials& consumer discretionary helped performance while underweight in information technology hurt overall performance.The Japan portion of the Sub-Fund delivered 16.2% in 2009 compared to its benchmark return of 9.3%. Overweightin technology, industrials and automotives helped performance. The Asian portion of the Sub-Fund rose 71.5% versus73.3% return of its benchmark. Cash drag from sub-fund outflows, as part of asset allocations switch, and stockselection in Taiwan hurt performance.
Key changes to the portfolioFund managers initiated and liquidated a lot of major positions depending on underlying valuations. Major namesacquired included but are not limited to Rio Tinto Limited, Edison International, Lockheed Martin, China Petroleum& Chemical Corporation and Commonwealth Bank of Australia.
Outlook and strategyThe Sub-Fund’s benchmark is approximately 52% North American Equities, 34% Pan European Equities,10% Japanese Equities and 4% Pac Rim Equities. The Sub-Fund is long Europe, neutral US and Japan and shortPacific Rim Equities relative to benchmark.
Global growth outlook is generally positive with most of the growth expected to come from Asia. As governmentsmove to withdraw stimuli, we might experience increased volatility in equity markets as doubts about sustainablegrowth take the centre stage again. While fund managers believe stocks will perform positively albeit lessspectacularly, there is a risk of economic slowdown in the West.
-10
0
10
20
30
40
Since Launch*†3-Year†1-Year
Tota
l ret
urn
US
$ (
%) 29.9 30.8
-8.1-5.1
2.85.4
International Opportunities Funds – World Value Equity MSCI World Index

55
INTERNATIONAL OPPORTUNITIES FUNDS
Report of the Réviseur d’Entreprises
To the Shareholders ofInternational Opportunities FundsAerogolf Center1A, HoehenhofL-1736 SenningerbergGrand Duchy of Luxembourg
Following our appointment by the General Meeting of the Shareholders of International Opportunities Funds(the “SICAV”) on April 14, 2009, we have audited the accompanying financial statements of InternationalOpportunities Funds and each of its sub-funds, which comprise the combined statement of net assets and thestatements of investment as at December 31, 2009 and the combined statement of operations and changes in netassets for the year then ended and a summary of significant accounting policies and other explanatory notes to thefinancial statements.
Responsibility of the Board of Directors of the SICAV for the financial statementsThe Board of Directors of the SICAV is responsible for the preparation and fair presentation of these financialstatements in accordance with Luxembourg legal and regulatory requirements relating to the preparation of thefinancial statements. This responsibility includes: designing, implementing and maintaining internal control relevantto the preparation and fair presentation of financial statements that are free from material misstatement, whether dueto fraud or error; selecting and applying appropriate accounting policies; and making accounting estimates that arereasonable in the circumstances.
Responsibility of the Réviseur d’EntreprisesOur responsibility is to express an opinion on these financial statements based on our audit. We conducted our auditin accordance with International Standards on Auditing as adopted by the Institut des Réviseurs d’Entreprises. Thosestandards require that we comply with ethical requirements and plan and perform the audit to obtain reasonableassurance whether the financial statements are free from material misstatement.
An audit involves performing procedures to obtain audit evidence about the amounts and disclosures in the financialstatements. The procedures selected depend on the judgement of the Réviseur d’Entreprises, including theassessment of the risks of material misstatement of the financial statements, whether due to fraud or error. In makingthose risk assessments, the Réviseur d’Entreprises considers internal control relevant to the entity’s preparation andfair presentation of the financial statements in order to design audit procedures that are appropriate in thecircumstances, but not for the purpose of expressing an opinion on the effectiveness of the entity’s internal control.
An audit also includes evaluating the appropriateness of accounting policies used and the reasonableness ofaccounting estimates made by the Board of Directors of the SICAV, as well as evaluating the overall presentation ofthe financial statements. We believe that the audit evidence we have obtained is sufficient and appropriate to providea basis for our audit opinion.
OpinionIn our opinion, the financial statements give a true and fair view of the financial position of International OpportunitiesFunds and each of its sub-funds as of December 31, 2009 and of the results of their operations and changes in theirnet assets for the year then ended in accordance with Luxembourg legal and regulatory requirements relating to thepreparation of the financial statements.
Other matterSupplementary information included in the annual report has been reviewed in the context of our mandate but hasnot been subject to specific audit procedures carried out in accordance with the standards described above.Consequently, we express no opinion on such information. However, we have no observation to make concerningsuch information in the context of the financial statements taken as a whole.
Luxembourg, March 10, 2010 KPMG Audit S.à r.l.Réviseurs d’Entreprises
Nathalie DOGNIEZ

56 The accompanying notes form an integral part of these financial statements.
INTERNATIONAL OPPORTUNITIES FUNDS
Combined Statement of Net AssetsAs at December 31, 2009
Note
Assets
Investments in securities at cost
Unrealised appreciation / (depreciation)
Investments in securities at market value 2(a)
Cash at bank
Cash equivalents*
Amounts receivable on sale of investments
Amounts receivable on subscriptions
Interest and dividends receivable, net
Unrealised appreciation on futures contracts 2(c), 9
Unrealised appreciation on forward foreign exchange contracts 2(c), 8
Other assets
Total assets
Liabilities
Cash owed to bank
Amounts payable on purchase of investments
Amounts payable on redemptions
Unrealised depreciation on futures contracts 2(c), 9
Management fees payable 3
Tax and expenses payable
Other liabilities
Total liabilities
Total net asset value
Number of Class A shares outstanding
Number of Class ADQ shares outstanding**
Number of Class ADM shares outstanding
Number of Class AJ shares outstanding
Number of Class B shares outstanding
Number of Class C shares outstanding
Number of Class D shares outstanding
Number of Class DD shares outstanding
Number of Class DDJ shares outstanding
Number of Class DJ shares outstanding
Number of Class E shares outstanding
Number of Class F shares outstanding
Number of Class FD shares outstanding
Number of Class J shares outstanding
Net asset value per Class A share
Net asset value per Class ADQ share**
Net asset value per Class ADM share
Net asset value per Class AJ share
Net asset value per Class B share
Net asset value per Class C share
Net asset value per Class D share
Net asset value per Class DD share
Net asset value per Class DDJ share
Net asset value per Class DJ share
Net asset value per Class E share
Net asset value per Class F share
Net asset value per Class FD share
Net asset value per Class J share
* Cash equivalents consist of time deposits.** Class AD changed its name into Class ADQ, effective June 2, 2009.† New Sub-Fund launched on November 2, 2009.
AsiaPacific Asian Asian AsianEquity Bond Dynamic Equity
USD USD USD USD
863,416,592 791,197,851 7,195,912 672,134,990
191,469,364 29,411,678 1,375,183 132,963,175
1,054,885,956 820,609,529 8,571,095 805,098,165
10,941,768 7,137,790 62,905 20,105,414
— 24,350,000 — —
373,210 — 9,852 —
— 1,357,068 — 737,448
244,037 12,394,593 1,679 —
— — — —
— 29,832 — —
— — — —
1,066,444,971 865,878,812 8,645,531 825,941,027
— — — —
380,333 — — —
— 811,366 — 248,457
— — — —
— 103,487 — 535,810
120,317 105,683 3,130 127,565
— — — —
500,650 1,020,536 3,130 911,832
1,065,944,321 864,858,276 8,642,401 825,029,195
— 5,825,122 — 2,271,261
— 10,692 — —
— 1,360,656 — —
— — — —
— — — 4,756,695
— — — 17,944,679
13,475,177 39,925,154 500,000 5,045,153
— — — —
— — — —
— — — —
93,313,823 19,622,403 — —
— 10,100 — 305,098
— — — —
— — — 580,569
— USD 13.263 — USD 15.393
— USD 12.146 — —
— USD 10.891 — —
— — — —
— — — USD 8.040
— — — USD 31.929
USD 10.311 USD 14.133 USD 17.285 USD 33.607
— — — —
— — — —
— — — —
USD 9.934 USD 10.616 — —
— SGD 10.177 — SGD 12.903
— — — —
— — — USD 11.209

The accompanying notes form an integral part of these financial statements. 57
INTERNATIONAL OPPORTUNITIES FUNDS
Combined Statement of Net AssetsAs at December 31, 2009 (continued)
Emerging Europe,Asian Asian Asian Asian Middle East European
Equity Infrastructure Local Property China Dragon and Africa Investment Global MarketIncome Equity Bond Securities Equity Peacock Dynamic† Grade Bond Navigator
USD USD USD USD USD USD USD EUR USD
5,040,075 105,192,348 474,904,400 12,466,032 374,597,224 209,077,683 77,505,243 262,423,528 15,632,549
819,003 (7,839,223) 15,507,029 (1,613,925) 57,646,631 35,535,647 6,056,934 1,194,878 342,915
5,859,078 97,353,125 490,411,429 10,852,107 432,243,855 244,613,330 83,562,177 263,618,406 15,975,464
131,512 1,438,512 15,653,988 201,461 9,390,610 2,901,865 2,592,530 707,761 7,435,847
— — — — — — — — —
718 — — — 7,159,011 2,530,424 193,844 — —
85,154 198,834 40,659 98,694 13,492,897 2,264,059 — 98,856 37,457
8,748 124,895 5,855,920 95,159 — 67,197 83,236 6,753,274 83,961
— — — — — — — — —
— — 148,376 — — — — — —
— — 49 — 1,914 49 — — —
6,085,210 99,115,366 512,110,421 11,247,421 462,288,287 252,376,924 86,431,787 271,178,297 23,532,729
— — — — — — — — —
— — 843,149 — 15,200,290 3,002,723 — — 730,054
— — 8,509 — 425,478 100,345 — 1,078 7,140
— — — — — — — — 28,596
1 114,173 7,840 156 208,906 328,984 — 13,854 2,612
2,913 23,758 75,698 3,544 57,742 65,708 8,053 31,519 3,940
— — — — — — — — —
2,914 137,931 935,196 3,700 15,892,416 3,497,760 8,053 46,451 772,342
6,082,296 98,977,435 511,175,225 11,243,721 446,395,871 248,879,164 86,423,734 271,131,846 22,760,387
100 9,697,021 687,248 251 15,591,911 12,214,366 — 965,365 52,954
— — — — — — — — —
— — 8,695 — — — — 322,037 —
— — — — — — — — —
— — — — — — — — —
— 935,619 — — — — — — 237,596
250,000 — 69,569 1,614,669 8,264,215 890,221 — 22,507,761 2,040,284
212,592 — — — — — — — —
— — — — — — — — 32,554
— — — — — — — — —
— — 50,560,213 — — — 8,000,000 — —
— — 5,055 2,809 — — — — —
— — — 26,163 — — — — —
— 575,036 — — 3,968,657 — — — —
USD 9.138 USD 8.666 USD 10.618 USD 6.606 USD 11.630 USD 18.565 — EUR 10.583 USD 9.382
— — — — — — — — —
— — USD 10.481 — — — — EUR 10.927 —
— — — — — — — — —
— — — — — — — — —
— USD 9.532 — — — — — — USD 9.731
USD 12.764 — USD 11.823 USD 6.886 USD 26.302 USD 24.852 — EUR 11.436 USD 9.639
USD 13.596 — — — — — — — —
— — — — — — — — JPY 815
— — — — — — — — —
— — USD 9.947 — — — USD 10.803 — —
— — SGD 9.768 SGD 6.393 — — — — —
— — — SGD 5.970 — — — — —
— USD 10.483 — — USD 12.018 — — — —

58 The accompanying notes form an integral part of these financial statements.
INTERNATIONAL OPPORTUNITIES FUNDS
Combined Statement of Net AssetsAs at December 31, 2009 (continued)
Note
Assets
Investments in securities at cost
Unrealised appreciation / (depreciation)
Investments in securities at market value 2(a)
Cash at bank
Cash equivalents*
Amounts receivable on sale of investments
Amounts receivable on subscriptions
Interest and dividends receivable, net
Unrealised appreciation on futures contracts 2(c), 9
Unrealised appreciation on forward foreign exchange contracts 2(c), 8
Other assets
Total assets
Liabilities
Cash owed to bank
Amounts payable on purchase of investments
Amounts payable on redemptions
Unrealised depreciation on futures contracts 2(c), 9
Management fees payable 3
Tax and expenses payable
Other liabilities
Total liabilities
Total net asset value
Number of Class A shares outstanding
Number of Class ADQ shares outstanding**
Number of Class ADM shares outstanding
Number of Class AJ shares outstanding
Number of Class B shares outstanding
Number of Class C shares outstanding
Number of Class D shares outstanding
Number of Class DD shares outstanding
Number of Class DDJ shares outstanding
Number of Class DJ shares outstanding
Number of Class E shares outstanding
Number of Class F shares outstanding
Number of Class FD shares outstanding
Number of Class J shares outstanding
Net asset value per Class A share
Net asset value per Class ADQ share**
Net asset value per Class ADM share
Net asset value per Class AJ share
Net asset value per Class B share
Net asset value per Class C share
Net asset value per Class D share
Net asset value per Class DD share
Net asset value per Class DDJ share
Net asset value per Class DJ share
Net asset value per Class E share
Net asset value per Class F share
Net asset value per Class FD share
Net asset value per Class J share
* Cash equivalents consist of time deposits.** Class AD changed its name into Class ADQ, effective June 2, 2009.
GreaterGlobal China Hong Kong India
Technology Equity Equity EquityUSD USD USD USD
44,321,161 60,082,833 867,119,283 97,331,071
18,095,369 13,200,780 (31,923,817) 43,011,449
62,416,530 73,283,613 835,195,466 140,342,520
477,333 1,656,653 12,610,512 4,983,962
— — — —
— — — —
592,261 1,112,888 104,214 207,691
2,852 44,858 2,806,342 68,780
— — — —
— — — —
236 — — 18,452
63,489,212 76,098,012 850,716,534 145,621,405
— — — —
95,312 — — 105,475
154,970 81,904 — 177,532
— — — —
53,244 67,684 278 32,792
14,251 14,244 86,591 32,352
— — — —
317,777 163,832 86,869 348,151
63,171,435 75,934,180 850,629,665 145,273,254
285,012 898,279 44,930 1,996,848
— — — —
— — — —
— — — —
— — — —
14,916,348 2,336,715 — —
— — 60,268,481 4,325,724
— — — —
— — — —
— — — —
— — — —
— 580 — —
— — — —
— — — 3,802,964
USD 10.776 USD 17.750 USD 9.444 USD 10.041
— — — —
— — — —
— — — —
— — — —
SGD 5.650 USD 25.670 — —
— — USD 14.107 USD 19.830
— — — —
— — — —
— — — —
— — — —
— SGD 13.657 — —
— — — —
— — — USD 10.372

The accompanying notes form an integral part of these financial statements. 59
INTERNATIONAL OPPORTUNITIES FUNDS
Combined Statement of Net AssetsAs at December 31, 2009 (continued)
NorthIndonesia Japan Japan Japan Smaller Korea Latin American Malaysia North American
Equity Dynamic Equity Companies Equity Equity Equity America ValueUSD USD USD USD USD USD USD USD USD
63,778,685 4,934,764 564,472,365 11,479,001 14,994 165,935,666 26,631,997 644,854,136 174,724,106
13,596,008 (1,014,293) (131,859,597) (175,510) 5,006 5,867,766 887,587 89,418,102 5,590,444
77,374,693 3,920,471 432,612,768 11,303,491 20,000 171,803,432 27,519,584 734,272,238 180,314,550
7,019,889 10,772 949,764 22,935 7,808 6,813,645 1,048,660 — 813,940
— — — — — — — — —
— — — — — — — — —
5,308,907 — — — — — — 1,676,230 —
734 385 240,463 27,745 — 287,726 13,252 828,303 214,074
— — — — — — — — —
— — — — — — — — —
— — — — — — — — —
89,704,223 3,931,628 433,802,995 11,354,171 27,808 178,904,803 28,581,496 736,776,771 181,342,564
— — — — — — — 175,063 —
1,910,989 — — — — — — — —
595,051 — — — — — — 115,000 —
— — — — — — — — —
38,908 — 39,955 10 — 48 6,037 7,358 34
11,851 2,277 50,000 2,672 2,789 22,004 5,317 82,981 16,129
— — — — — — — 6 —
2,556,799 2,277 89,955 2,682 2,789 22,052 11,354 380,408 16,163
87,147,424 3,929,351 433,713,040 11,351,489 25,019 178,882,751 28,570,142 736,396,363 181,326,401
1,841,855 — — 750 — 4,368 114 641,886 1,612
— — — — — — — — —
— — — — — — — — —
— — 4,174,095 — — — — — —
— — — — — — — — —
— — — — — — — — —
13,771 500,000 35,913,231 — 2,000 — — 76,343,884 26,289,863
— — — — — — — — —
— — — — — — — — —
— — 8,094,174 — — — — — —
— — 10,998,658 1,117,319 — 20,472,804 — — —
— — — — — — — — 3,172
— — — — — — — — —
5,199,526 — — — — — 3,046,000 — —
USD 12.040 — — USD 10.002 — USD 8.716 USD 9.100 USD 9.109 USD 6.652
— — — — — — — — —
— — — — — — — — —
— — JPY 674 — — — — — —
— — — — — — — — —
— — — — — — — — —
USD 21.619 USD 7.859 USD 7.259 — USD 12.510 — — USD 9.569 USD 6.896
— — — — — — — — —
— — — — — — — — —
— — JPY 673 — — — — — —
— — USD 7.634 USD 10.153 — USD 8.736 — — —
— — — — — — — — SGD 7.270
— — — — — — — — —
USD 12.438 — — — — — USD 9.379 — —

60 The accompanying notes form an integral part of these financial statements.
INTERNATIONAL OPPORTUNITIES FUNDS
Combined Statement of Net AssetsAs at December 31, 2009 (continued)
Note
Assets
Investments in securities at cost
Unrealised appreciation / (depreciation)
Investments in securities at market value 2(a)
Cash at bank
Cash equivalents*
Amounts receivable on sale of investments
Amounts receivable on subscriptions
Interest and dividends receivable, net
Unrealised appreciation on futures contracts 2(c), 9
Unrealised appreciation on forward foreign exchange contracts 2(c), 8
Other assets
Total assets
Liabilities
Cash owed to bank
Amounts payable on purchase of investments
Amounts payable on redemptions
Unrealised depreciation on futures contracts 2(c), 9
Management fees payable 3
Tax and expenses payable
Other liabilities
Total liabilities
Total net asset value
Number of Class A shares outstanding
Number of Class ADQ shares outstanding**
Number of Class ADM shares outstanding
Number of Class AJ shares outstanding
Number of Class B shares outstanding
Number of Class C shares outstanding
Number of Class D shares outstanding
Number of Class DD shares outstanding
Number of Class DDJ shares outstanding
Number of Class DJ shares outstanding
Number of Class E shares outstanding
Number of Class F shares outstanding
Number of Class FD shares outstanding
Number of Class J shares outstanding
Net asset value per Class A share
Net asset value per Class ADQ share**
Net asset value per Class ADM share
Net asset value per Class AJ share
Net asset value per Class B share
Net asset value per Class C share
Net asset value per Class D share
Net asset value per Class DD share
Net asset value per Class DDJ share
Net asset value per Class DJ share
Net asset value per Class E share
Net asset value per Class F share
Net asset value per Class FD share
Net asset value per Class J share
* Cash equivalents consist of time deposits.** Class AD changed its name into Class ADQ, effective June 2, 2009.
Pan Philippines TaiwanEuropean Equity Equity
USD USD USD
92,008,726 8,838,634 3,453,204
10,067,126 677,985 834,061
102,075,852 9,516,619 4,287,265
515,437 314,396 130,386
— — —
— — —
2,032,392 — 6,674
65,203 957 —
— — —
— — —
197 — —
104,689,081 9,831,972 4,424,325
— — —
242,556 — —
871,867 — —
— — —
49,544 2,249 1,131
18,765 2,893 3,035
— — —
1,182,732 5,142 4,166
103,506,349 9,826,830 4,420,159
1,158,594 20,375 98,099
— — —
— — —
— — —
— — —
4,721,346 — —
3,834,497 — 250,000
— — —
— — —
— — —
— — —
— — —
— — —
— 1,178,151 —
USD 11.629 USD 7.957 USD 9.710
— — —
— — —
— — —
— — —
SGD 11.358 — —
USD 13.507 — USD 13.871
— — —
— — —
— — —
— — —
— — —
— — —
— USD 8.203 —

The accompanying notes form an integral part of these financial statements. 61
INTERNATIONAL OPPORTUNITIES FUNDS
Combined Statement of Net AssetsAs at December 31, 2009 (continued)
US HighThailand US US Corporate Investment US High US Investment Vietnam World Value
Equity Bond Bond Grade Bond Yield Bond Grade Bond Equity Equity CombinedUSD USD USD USD USD USD USD USD USD
30,009,429 593,114,820 973,746,488 210,650,406 248,461,277 390,507,373 11,875,229 289,580,870 9,563,337,542
2,905,963 16,140,886 54,346,593 8,155,088 28,926,712 16,926,712 (2,781,336) 17,302,727 641,593,023
32,915,392 609,255,706 1,028,093,081 218,805,494 277,387,989 407,434,085 9,093,893 306,883,597 10,204,930,565
926,993 — — 46,944 22,731 — 503,993 6,482,328 124,370,194
— — — — — — — — 24,350,000
— — — 3,098,310 — — — — 13,365,369
28,214 770,100 — 44,173 2,313,673 4,794,234 — 193,038 37,638,995
— 4,868,510 12,468,141 2,804,737 4,658,241 4,982,362 15,709 355,990 63,417,893
— 593,992 668,563 19,875 — 206,313 — — 1,488,743
— — — — — — — — 178,208
— 2 — — — — — — 20,899
33,870,599 615,488,310 1,041,229,785 224,819,533 284,382,634 417,416,994 9,613,595 313,914,953 10,469,760,866
— 20,110 149,446 — — 20,660 — — 365,279
— 2,676,288 — — — — — — 25,187,169
328,538 300,000 — 6,640,751 185,228 2,461,569 — 83,133 13,598,387
— — — — — — — — 28,596
10,609 3,639 — 99,483 46,630 264,004 7,816 73,565 2,126,892
6,949 53,078 70,145 45,116 31,067 60,386 5,825 48,079 1,332,133
— — 1 — — — — — 7
346,096 3,053,115 219,592 6,785,350 262,925 2,806,619 13,641 204,777 42,638,463
33,524,503 612,435,195 1,041,010,193 218,034,183 284,119,709 414,610,375 9,599,954 313,710,176 10,427,122,403
347,231 184,277 — 826,400 688,615 10,218,995 — 804,061
— — — 18,199 212 7,786 — —
— — — 877,468 381,902 6,500,338 — —
— — — — — — — —
— — — 12,190,331 — 7,417,430 — —
— 66,514 — 716,402 11,892,643 — 8,597 16,506,340
17,451 51,985,037 88,288,583 1,893,157 7,566,433 7,735,250 — 7,260,836
— 939,763 — — — — — —
— — — — — — — —
— — — — — — — —
— 262,980 — — — — — —
— — — 7,960 — 5,576 — 849
— — — — — — — —
2,993,141 — — — — — 1,660,803 —
USD 9.679 USD 11.153 — USD 11.260 USD 10.872 USD 12.147 — USD 11.831
— — — USD 11.537 USD 12.258 USD 12.411 — —
— — — USD 10.987 USD 11.388 USD 11.422 — —
— — — — — — — —
— — — USD 13.596 — USD 15.647 — —
— USD 11.284 — USD 13.955 USD 15.462 — USD 6.071 USD 12.708
USD 13.595 USD 11.466 USD 11.791 USD 12.189 USD 11.682 USD 12.931 — USD 13.005
— USD 11.312 — — — — — —
— — — — — — — —
— — — — — — — —
— USD 11.147 — — — — — —
— — — SGD 10.841 — SGD 11.838 — SGD 8.137
— — — — — — — —
USD 9.998 — — — — — USD 5.749 —

Note
Net assets at the beginning of the year*
Income
Dividends, net
Interest on bonds, net
Bank interest, net
Securities lending income 10
Total income
Expenses
Management fees 3
Depositary bank commission 4
Transaction fees 4
Domiciliation, administration and transfer agent fees 4
Audit fees, printing and publication expenses 6
Subscription tax 5
Bank interest, net
Compliance fee 6
Other charges 6
Total expenses
Net surplus / (deficit) from investments
Net realised profit / (loss) on:
Sale of investments
Futures contracts
Forward foreign exchange contracts
Foreign exchange
Net realised profit / (loss)
Change in net unrealised appreciation / (depreciation) on:
Investments
Futures contracts
Forward foreign exchange contracts
Foreign exchange
Net increase in net assets
as a result of operations
Movements in capital
Issue of shares
Redemption of shares
Dividends and distributions
Dividends and distributions declared during the year
Change in total net assets for the year
Net assets at the end of the year
62 The accompanying notes form an integral part of these financial statements.
INTERNATIONAL OPPORTUNITIES FUNDS
Combined Statement of Operations and Changes in Net AssetsFor the Year Ended December 31, 2009
* The opening balance was combined using the foreign exchange rate as at December 31, 2009. The same net assets when combined using the foreignexchange rate ruling as at December 31, 2008 reflected a figure of USD 6,951,645,169.
† New Sub-Fund launched on November 2, 2009.
AsiaPacific Asian Asian AsianEquity Bond Dynamic Equity
USD USD USD USD
797,022,764 722,664,424 4,529,603 497,849,562
25,184,833 — 130,953 11,299,023
— 50,869,218 — —
15,492 7,654 — 3,136
— — — 88,349
25,200,325 50,876,872 130,953 11,390,508
— 716,915 — 4,970,127
346,627 86,839 4,570 281,064
27,837 3,946 8,527 25,711
184,499 185,104 7,490 150,282
36,875 24,198 198 19,620
95,975 102,228 687 78,466
— — 77 —
2,999 2,999 2,999 2,999
98,826 25,452 6,445 68,310
793,638 1,147,681 30,993 5,596,579
24,406,687 49,729,191 99,960 5,793,929
(133,206,422) (6,430,949) (113,217) (119,074,597)
— — — —
— — — —
(683,401) (230,556) 4,369 303,894
(109,483,136) 43,067,686 (8,888) (112,976,774)
663,900,602 154,134,027 4,120,412 474,675,429
— — — —
— 144,691 — —
4,090 13,751 1,274 116,333
554,421,556 197,360,155 4,112,798 361,814,988
102,012,225 221,871,251 — 114,484,414
(362,500,000) (258,001,282) — (149,119,769)
(25,012,224) (19,036,272) — —
(285,499,999) (55,166,303) — (34,635,355)
1,065,944,321 864,858,276 8,642,401 825,029,195

The accompanying notes form an integral part of these financial statements. 63
INTERNATIONAL OPPORTUNITIES FUNDS
Combined Statement of Operations and Changes in Net AssetsFor the Year Ended December 31, 2009 (continued)
Emerging Europe,Asian Asian Asian Asian Middle East European
Equity Infrastructure Local Property China Dragon and Africa Investment Global MarketIncome Equity Bond Securities Equity Peacock Dynamic† Grade Bond Navigator
USD USD USD USD USD USD USD EUR USD
2,026,987 72,576,509 341,155,515 6,787,291 167,966,695 131,088,670 — 203,396,257 19,294,820
147,744 2,044,942 — 542,459 5,409,748 2,962,503 230,827 — 167,821
— — 19,413,235 — — — — 11,154,146 193,489
86 137 — — 1,828 10,594 — 1,511 4,161
— — — — — 44,103 — — —
147,830 2,045,079 19,413,235 542,459 5,411,576 3,017,200 230,827 11,155,657 365,471
11 1,173,397 31,519 1,350 716,891 2,938,303 — 63,487 30,289
4,806 32,946 133,424 3,617 67,473 73,895 2,707 21,897 1,081
13,311 3,589 15,893 4,342 9,528 45,331 — 1,964 2,143
9,022 36,594 109,649 9,741 62,174 60,516 3,102 67,923 18,212
98 2,654 12,781 251 8,129 5,676 406 7,026 769
370 37,614 49,168 1,046 49,429 88,529 1,353 25,797 1,805
— — 2,204 75 — — — — —
2,999 2,999 2,999 2,999 2,999 2,999 485 2,150 2,999
7,554 19,775 26,633 4,400 24,601 46,581 200 7,428 31,025
38,171 1,309,568 384,270 27,821 941,224 3,261,830 8,253 197,672 88,323
109,659 735,511 19,028,965 514,638 4,470,352 (244,630) 222,574 10,957,985 277,148
(488,015) (2,168,726) (12,704,113) (1,574,138) 4,566,158 8,592,731 52,081 (6,348,355) 327,511
— — — — — — — — 614,127
— — — — — — — — —
2,013 (129,904) 2,516,428 (10,775) (65,771) (10,927) 92,145 (5,254) 99,365
(376,343) (1,563,119) 8,841,280 (1,070,275) 8,970,739 8,337,174 366,800 4,604,376 1,318,151
1,849,115 30,189,413 41,003,189 3,956,553 156,349,803 109,670,732 6,056,934 30,282,250 706,470
— — — — — — — — (135,698)
— — (10,510) — — — — — —
(317) 54,823 (65,780) 115 (1,103) (6,196) — 14,156 5,585
1,472,455 28,681,117 49,768,179 2,886,393 165,319,439 118,001,710 6,423,734 34,900,782 1,894,508
2,759,527 11,591,209 155,473,515 1,596,838 276,345,830 50,436,183 80,000,010 42,590,532 14,442,524
(146,565) (13,871,400) (15,920,373) (23,303) (163,236,093) (50,647,399) (10) (9,731,467) (12,751,643)
(30,108) — (19,301,611) (3,498) — — — (24,258) (119,822)
2,582,854 (2,280,191) 120,251,531 1,570,037 113,109,737 (211,216) 80,000,000 32,834,807 1,571,059
6,082,296 98,977,435 511,175,225 11,243,721 446,395,871 248,879,164 86,423,734 271,131,846 22,760,387

64 The accompanying notes form an integral part of these financial statements.
INTERNATIONAL OPPORTUNITIES FUNDS
Note
Net assets at the beginning of the year*
Income
Dividends, net
Interest on bonds, net
Bank interest, net
Securities lending income 10
Total income
Expenses
Management fees 3
Depositary bank commission 4
Transaction fees 4
Domiciliation, administration and transfer agent fees 4
Audit fees, printing and publication expenses 6
Subscription tax 5
Bank interest, net
Compliance fee 6
Other charges 6
Total expenses
Net surplus / (deficit) from investments
Net realised profit / (loss) on:
Sale of investments
Futures contracts
Forward foreign exchange contracts
Foreign exchange
Net realised profit / (loss)
Change in net unrealised appreciation / (depreciation) on:
Investments
Futures contracts
Forward foreign exchange contracts
Foreign exchange
Net increase in net assets
as a result of operations
Movements in capital
Issue of shares
Redemption of shares
Dividends and distributions
Dividends and distributions declared during the year
Change in total net assets for the year
Net assets at the end of the year
Combined Statement of Operations and Changes in Net AssetsFor the Year Ended December 31, 2009 (continued)
* The opening balance was combined using the foreign exchange rate as at December 31, 2009. The same net assets when combined using the foreignexchange rate ruling as at December 31, 2008 reflected a figure of USD 6,951,645,169.
GreaterGlobal China Hong Kong India
Technology Equity Equity EquityUSD USD USD USD
39,550,535 31,383,625 455,231,182 51,807,624
436,236 1,148,922 22,370,009 1,088,118
— — — —
10,788 — 78 —
— 9,571 — —
447,024 1,158,493 22,370,087 1,088,118
504,132 514,150 774 285,175
10,993 22,179 75,997 71,079
12,135 7,884 6,133 38,484
35,964 26,653 138,099 30,179
1,505 1,454 20,596 3,030
5,798 7,309 70,087 17,848
— 104 — 830
2,999 2,999 3,000 2,630
9,201 6,431 60,316 36,488
582,727 589,163 375,002 485,743
(135,703) 569,330 21,995,085 602,375
5,211,789 (2,215,006) (62,811,109) 4,672,839
— — — —
— — — —
30,019 (10,581) (7,473) 39,522
5,106,105 (1,656,257) (40,823,497) 5,314,736
19,338,348 28,267,207 373,891,978 67,994,960
— — — —
— — — —
(120,535) (73) (3,978) 1,323
24,323,918 26,610,877 333,064,503 73,311,019
5,284,850 31,491,666 96,501,850 35,063,730
(5,987,868) (13,551,988) (34,167,870) (14,909,119)
— — — —
(703,018) 17,939,678 62,333,980 20,154,611
63,171,435 75,934,180 850,629,665 145,273,254

The accompanying notes form an integral part of these financial statements. 65
INTERNATIONAL OPPORTUNITIES FUNDS
Combined Statement of Operations and Changes in Net AssetsFor the Year Ended December 31, 2009 (continued)
NorthIndonesia Japan Japan Japan Smaller Korea Latin American Malaysia North American
Equity Dynamic Equity Companies Equity Equity Equity America ValueUSD USD USD USD USD USD USD USD USD
18,080,892 3,450,135 433,488,485 9,427,778 1,918,255 79,881,366 15,804,579 430,777,764 275,167,303
745,738 59,479 7,570,827 236,841 24,787 2,690,245 659,299 10,115,765 3,211,775
3,692 — — — — 16,178 — — —
— — — — — 100 — 529 —
— — 2,842 — — — — 2,441 —
749,430 59,479 7,573,669 236,841 24,787 2,706,523 659,299 10,118,735 3,211,775
177,966 — 436,605 102 16 347 54,744 65,795 321
13,739 1,984 47,344 2,756 3,216 59,590 6,766 34,060 10,564
66,485 3,228 20,892 11,576 1,599 2,398 8,945 13,068 9,963
19,581 7,221 96,828 10,883 7,525 32,963 13,029 126,570 44,681
947 115 13,289 334 488 3,759 670 17,879 5,698
7,308 371 52,376 1,082 174 13,261 2,285 62,934 16,037
— — 513 — — — — — 14
2,999 2,999 2,999 2,999 2,860 2,999 2,999 2,999 2,999
7,343 755 40,875 1,315 4,497 3,613 6,017 16,455 5,894
296,368 16,673 711,721 31,047 20,375 118,930 95,455 339,760 96,171
453,062 42,806 6,861,948 205,794 4,412 2,587,593 563,844 9,778,975 3,115,604
(712,168) (45,630) (46,436,976) 85,824 94,929 (23,826,600) (1,905,653) (27,547,532) (102,827,125)
— — — — — — — — —
— — — — — — — — —
201,625 1,284 (229,093) 8,170 (793) 121,205 28,846 — —
(57,481) (1,540) (39,804,121) 299,788 98,548 (21,117,802) (1,312,963) (17,768,557) (99,711,521)
26,858,284 481,171 69,724,769 2,281,662 877,834 120,123,867 10,035,772 241,299,802 152,642,775
— — — — — — — — —
— — — — — — — — —
(16,669) (415) (8,921) (4,596) (6,602) (14,681) (5,949) — 442
26,784,134 479,216 29,911,727 2,576,854 969,780 98,991,384 8,716,860 223,531,245 52,931,696
90,957,211 — 82,827,581 112,280 12,707 1,863,390 6,038,793 188,759,299 —
(48,674,813) — (109,971,559) (653,143) (2,875,723) — (1,990,090) (106,671,945) (146,772,598)
— — (2,543,194) (112,280) — (1,853,389) — — —
42,282,398 — (29,687,172) (653,143) (2,863,016) 10,001 4,048,703 82,087,354 (146,772,598)
87,147,424 3,929,351 433,713,040 11,351,489 25,019 178,882,751 28,570,142 736,396,363 181,326,401

66 The accompanying notes form an integral part of these financial statements.
INTERNATIONAL OPPORTUNITIES FUNDS
Note
Net assets at the beginning of the year*
Income
Dividends, net
Interest on bonds, net
Bank interest, net
Securities lending income 10
Total income
Expenses
Management fees 3
Depositary bank commission 4
Transaction fees 4
Domiciliation, administration and transfer agent fees 4
Audit fees, printing and publication expenses 6
Subscription tax 5
Bank interest, net
Compliance fee 6
Other charges 6
Total expenses
Net surplus / (deficit) from investments
Net realised profit / (loss) on:
Sale of investments
Futures contracts
Forward foreign exchange contracts
Foreign exchange
Net realised profit / (loss)
Change in net unrealised appreciation / (depreciation) on:
Investments
Futures contracts
Forward foreign exchange contracts
Foreign exchange
Net increase in net assets
as a result of operations
Movements in capital
Issue of shares
Redemption of shares
Dividends and distributions
Dividends and distributions declared during the year
Change in total net assets for the year
Net assets at the end of the year
Combined Statement of Operations and Changes in Net AssetsFor the Year Ended December 31, 2009 (continued)
* The opening balance was combined using the foreign exchange rate as at December 31, 2009. The same net assets when combined using the foreignexchange rate ruling as at December 31, 2008 reflected a figure of USD 6,951,645,169.
Pan Philippines TaiwanEuropean Equity Equity
USD USD USD
77,227,295 5,851,925 4,648,858
1,727,605 203,325 105,678
— — —
— 2,122 37
— — —
1,727,605 205,447 105,715
513,011 21,947 28,839
9,978 4,840 4,658
19,215 35,460 6,018
44,935 10,228 8,001
2,709 244 144
13,806 879 1,184
251 — —
2,999 2,999 2,999
4,119 4,948 8,153
611,023 81,545 59,996
1,116,582 123,902 45,719
(15,014,884) (1,576,355) (1,112,213)
— — —
— — —
66,179 10,954 4,695
(13,832,123) (1,441,499) (1,061,799)
41,941,279 6,144,654 4,157,102
— — —
— — —
(7,588) 767 3,505
28,101,568 4,703,922 3,098,808
19,541,240 696,743 114,344
(21,363,754) (1,425,760) (3,441,851)
— — —
(1,822,514) (729,017) (3,327,507)
103,506,349 9,826,830 4,420,159

The accompanying notes form an integral part of these financial statements. 67
INTERNATIONAL OPPORTUNITIES FUNDS
Combined Statement of Operations and Changes in Net AssetsFor the Year Ended December 31, 2009 (continued)
US HighThailand US US Corporate Investment US High US Investment Vietnam World Value
Equity Bond Bond Grade Bond Yield Bond Grade Bond Equity Equity CombinedUSD USD USD USD USD USD USD USD USD
22,484,169 574,061,193 783,067,081 149,369,554 142,046,868 77,752,032 5,662,507 213,813,620 6,957,157,207
1,087,026 — — 2,120 7,876 1,553 188,242 5,956,406 107,758,725
— 31,579,271 56,068,140 10,425,866 30,763,173 12,019,190 — — 227,377,729
124 — — — 13,697 — 59 12,164 84,957
— — — — — — — — 147,306
1,087,150 31,579,271 56,068,140 10,427,986 30,784,746 12,020,743 188,301 5,968,570 335,368,717
86,034 424,545 — 896,938 584,779 1,225,249 77,588 678,135 17,247,212
7,452 25,504 40,932 12,092 17,878 11,053 17,887 30,479 1,613,530
15,575 8,414 11,006 3,564 5,841 6,057 20,560 28,883 526,363
14,395 155,553 207,147 69,898 90,273 73,716 10,084 96,916 2,305,299
817 19,554 27,271 5,731 9,228 5,320 237 7,894 270,663
3,592 79,262 87,443 26,420 31,588 47,973 792 29,232 1,122,776
— 5,354 4,157 15 — 945 — — 14,539
2,999 2,999 2,999 2,999 2,999 2,999 2,999 2,999 108,032
6,411 42,054 60,043 22,272 10,957 9,953 2,871 23,931 765,387
137,275 763,239 440,998 1,039,929 753,543 1,383,265 133,018 898,469 23,973,801
949,875 30,816,032 55,627,142 9,388,057 30,031,203 10,637,478 55,283 5,070,101 311,394,916
(3,110,006) 8,168,252 14,167,561 (2,325,842) (15,051,714) 1,310,559 (2,193,715) (13,558,986) (559,902,772)
— 1,173,411 1,576,767 21,602 — 33,718 — — 3,419,625
— — — — — — — — —
42,353 (43) — 2,479 39 1,879 (40,652) 104,887 2,254,832
(2,117,778) 40,157,652 71,371,470 7,086,296 14,979,528 11,983,634 (2,179,084) (8,383,998) (242,833,399)
14,751,591 43,353,981 117,042,132 22,640,615 74,482,324 31,233,400 6,566,954 87,063,736 3,253,318,413
— 593,992 668,563 19,875 — — — — 1,146,732
— — — — — — — — 134,181
2,349 (235) — 1,986 (101) 1,536 (341) 73,667 37,805
12,636,162 84,105,390 189,082,165 29,748,772 89,461,751 43,218,570 4,387,529 78,753,405 3,011,803,732
7,930,719 179,219,912 218,013,592 94,735,164 230,048,900 393,769,305 1,494,254 65,684,461 2,842,369,593
(9,526,547) (224,496,180) (149,152,645) (55,742,369) (177,415,263) (99,339,763) (1,944,336) (44,541,310) (2,314,816,503)
— (455,120) — (76,938) (22,547) (789,769) — — (69,391,626)
(1,595,828) (45,731,388) 68,860,947 38,915,857 52,611,090 293,639,773 (450,082) 21,143,151 458,161,464
33,524,503 612,435,195 1,041,010,193 218,034,183 284,119,709 414,610,375 9,599,954 313,710,176 10,427,122,403

68 The accompanying notes form an integral part of these financial statements.
INTERNATIONAL OPPORTUNITIES FUNDS
Statement of Changes in Shares OutstandingFor the Year Ended December 31, 2009
Class A shares
Shares outstanding at the beginning of the year
Shares issued
Shares redeemed
Shares outstanding at the end of the year
Class AD shares
Shares outstanding at the beginning of the year
Shares issued
Shares redeemed
Shares outstanding at the end of the year
Class ADQ shares**
Shares outstanding at the beginning of the year
Shares issued
Shares redeemed
Shares outstanding at the end of the year
Class ADM shares
Shares outstanding at the beginning of the year
Shares issued
Shares redeemed
Shares outstanding at the end of the year
Class AJ shares
Shares outstanding at the beginning of the year
Shares issued
Shares redeemed
Shares outstanding at the end of the year
Class B shares
Shares outstanding at the beginning of the year
Shares issued
Shares redeemed
Shares outstanding at the end of the year
Class C shares
Shares outstanding at the beginning of the year
Shares issued
Shares redeemed
Shares outstanding at the end of the year
Class D shares
Shares outstanding at the beginning of the year
Shares issued
Shares redeemed
Shares outstanding at the end of the year
Class DD shares
Shares outstanding at the beginning of the year
Shares issued
Shares redeemed
Shares outstanding at the end of the year
Class DDJ shares
Shares outstanding at the beginning of the year
Shares issued
Shares redeemed
Shares outstanding at the end of the year
** Class AD changed its name into Class ADQ, effective June 2, 2009.† New Sub-Fund launched on November 2, 2009.
Asia AsianPacific Asian Asian Asian EquityEquity Bond Dynamic Equity Income
USD USD USD USD USD
— 1,188,335 — 2,049,913 100
— 9,021,242 — 832,862 —
— (4,384,455) — (611,514) —
— 5,825,122 — 2,271,261 100
— — — — —
— — — — —
— — — — —
— — — — —
— 4,748 — — —
— 615,431 — — —
— (609,487) — — —
— 10,692 — — —
— — — — —
— 2,704,468 — — —
— (1,343,812) — — —
— 1,360,656 — — —
— — — — —
— — — — —
— — — — —
— — — — —
— — — 5,705,627 —
— — — 636,814 —
— — — (1,585,746) —
— — — 4,756,695 —
— — — 18,837,539 —
— — — 2,942,132 —
— — — (3,834,992) —
— — — 17,944,679 —
26,224,024 39,401,200 500,000 5,798,923 250,000
3,044,791 4,206,481 — 1,264,395 —
(15,793,638) (3,682,527) — (2,018,165) —
13,475,177 39,925,154 500,000 5,045,153 250,000
— — — — —
— — — — 225,322
— — — — (12,730)
— — — — 212,592
— — — — —
— — — — —
— — — — —
— — — — —

The accompanying notes form an integral part of these financial statements. 69
INTERNATIONAL OPPORTUNITIES FUNDS
Statement of Changes in Shares OutstandingFor the Year Ended December 31, 2009 (continued)
Emerging Europe,Asian Asian Asian Middle East European
Infrastructure Local Property China Dragon and Africa Investment Global MarketEquity Bond Securities Equity Peacock Dynamic† Grade Bond Navigator
USD USD USD USD USD USD EUR USD
9,785,928 118,702 251 63,346 11,649,553 — 185,539 55,084
833,116 931,626 — 23,467,697 3,401,016 — 1,156,473 9,693
(922,023) (363,080) — (7,939,132) (2,836,203) — (376,647) (11,823)
9,697,021 687,248 251 15,591,911 12,214,366 — 965,365 52,954
— — — — — — — —
— — — — — — — —
— — — — — — — —
— — — — — — — —
— — — — — — — —
— — — — — — — —
— — — — — — — —
— — — — — — — —
— — — — — — — —
— 27,610 — — — — 364,338 —
— (18,915) — — — — (42,301) —
— 8,695 — — — — 322,037 —
— — — — — — — —
— — — — — — — —
— — — — — — — —
— — — — — — — —
— — — — — — — —
— — — — — — — —
— — — — — — — —
— — — — — — — —
515,464 — — — — — — 225,645
627,755 — — — — — — 94,954
(207,600) — — — — — — (83,003)
935,619 — — — — — — 237,596
— 21,040 1,340,490 9,857,435 1,195,969 — 20,560,782 658,409
— 48,529 274,179 1,449,245 45,752 — 2,484,986 1,443,935
— — — (3,042,465) (351,500) — (538,007) (62,060)
— 69,569 1,614,669 8,264,215 890,221 — 22,507,761 2,040,284
— — — — — — — —
— — — — — — — —
— — — — — — — —
— — — — — — — —
— — — — — — — 1,426,505
— — — — — — — 46,970
— — — — — — — (1,440,921)
— — — — — — — 32,554

70 The accompanying notes form an integral part of these financial statements.
INTERNATIONAL OPPORTUNITIES FUNDS
Statement of Changes in Shares OutstandingFor the Year Ended December 31, 2009 (continued)
Class DJ shares
Shares outstanding at the beginning of the year
Shares issued
Shares redeemed
Shares outstanding at the end of the year
Class E shares
Shares outstanding at the beginning of the year
Shares issued
Shares redeemed
Shares outstanding at the end of the year
Class F shares
Shares outstanding at the beginning of the year
Shares issued
Shares redeemed
Shares outstanding at the end of the year
Class FD shares
Shares outstanding at the beginning of the year
Shares issued
Shares redeemed
Shares outstanding at the end of the year
Class J shares
Shares outstanding at the beginning of the year
Shares issued
Shares redeemed
Shares outstanding at the end of the year
† New Sub-Fund launched on November 2, 2009.
Asia AsianPacific Asian Asian Asian EquityEquity Bond Dynamic Equity Income
USD USD USD USD USD
— — — — —
— — — — —
— — — — —
— — — — —
111,290,138 32,367,908 — — —
17,626,584 2,284,120 — — —
(35,602,899) (15,029,625) — — —
93,313,823 19,622,403 — — —
— 250 — 245,988 —
— 10,100 — 87,619 —
— (250) — (28,509) —
— 10,100 — 305,098 —
— — — — —
— — — — —
— — — — —
— — — — —
— — — 849,459 —
— — — 92,184 —
— — — (361,074) —
— — — 580,569 —

The accompanying notes form an integral part of these financial statements. 71
INTERNATIONAL OPPORTUNITIES FUNDS
Statement of Changes in Shares OutstandingFor the Year Ended December 31, 2009 (continued)
Emerging Europe,Asian Asian Asian Middle East European
Infrastructure Local Property China Dragon and Africa Investment Global MarketEquity Bond Securities Equity Peacock Dynamic† Grade Bond Navigator
USD USD USD USD USD USD EUR USD
— — — — — — — —
— — — — — — — —
— — — — — — — —
— — — — — — — —
— 35,991,032 — — — — — —
— 15,939,394 — — — 8,000,000 — —
— (1,370,213) — — — — — —
— 50,560,213 — — — 8,000,000 — —
400 14,983 2,809 — — — — —
— — — — — — — —
(400) (9,928) — — — — — —
— 5,055 2,809 — — — — —
— — 25,313 — — — — —
— — 6,387 — — — — —
— — (5,537) — — — — —
— — 26,163 — — — — —
1,128,833 — — 4,625,779 — — — —
14,497 — — 158,063 — — — —
(568,294) — — (815,185) — — — —
575,036 — — 3,968,657 — — — —

72 The accompanying notes form an integral part of these financial statements.
INTERNATIONAL OPPORTUNITIES FUNDS
Statement of Changes in Shares OutstandingFor the Year Ended December 31, 2009 (continued)
Class A shares
Shares outstanding at the beginning of the year
Shares issued
Shares redeemed
Shares outstanding at the end of the year
Class AD shares
Shares outstanding at the beginning of the year
Shares issued
Shares redeemed
Shares outstanding at the end of the year
Class ADQ shares**
Shares outstanding at the beginning of the year
Shares issued
Shares redeemed
Shares outstanding at the end of the year
Class ADM shares
Shares outstanding at the beginning of the year
Shares issued
Shares redeemed
Shares outstanding at the end of the year
Class AJ shares
Shares outstanding at the beginning of the year
Shares issued
Shares redeemed
Shares outstanding at the end of the year
Class B shares
Shares outstanding at the beginning of the year
Shares issued
Shares redeemed
Shares outstanding at the end of the year
Class C shares
Shares outstanding at the beginning of the year
Shares issued
Shares redeemed
Shares outstanding at the end of the year
Class D shares
Shares outstanding at the beginning of the year
Shares issued
Shares redeemed
Shares outstanding at the end of the year
Class DD shares
Shares outstanding at the beginning of the year
Shares issued
Shares redeemed
Shares outstanding at the end of the year
Class DDJ shares
Shares outstanding at the beginning of the year
Shares issued
Shares redeemed
Shares outstanding at the end of the year
** Class AD changed its name into Class ADQ, effective June 2, 2009.
GreaterGlobal China Hong Kong India
Technology Equity Equity EquityUSD USD USD USD
179,891 400,894 100 254
286,455 1,055,285 89,588 2,344,748
(181,334) (557,900) (44,758) (348,154)
285,012 898,279 44,930 1,996,848
— — — —
— — — —
— — — —
— — — —
— — — —
— — — —
— — — —
— — — —
— — — —
— — — —
— — — —
— — — —
— — — —
— — — —
— — — —
— — — —
— — — —
— — — —
— — — —
— — — —
15,407,047 1,906,689 — —
851,747 706,720 — —
(1,342,446) (276,694) — —
14,916,348 2,336,715 — —
— — 52,885,709 3,211,678
— — 10,489,659 1,510,265
— — (3,106,887) (396,219)
— — 60,268,481 4,325,724
— — — —
— — — —
— — — —
— — — —
— — — —
— — — —
— — — —
— — — —

The accompanying notes form an integral part of these financial statements. 73
INTERNATIONAL OPPORTUNITIES FUNDS
Statement of Changes in Shares OutstandingFor the Year Ended December 31, 2009 (continued)
Indonesia Japan Japan Japan Smaller Korea Latin American Malaysia NorthEquity Dynamic Equity Companies Equity Equity Equity America
USD USD USD USD USD USD USD USD
65,795 — — 750 100 2,700 100 622,918
5,264,656 — — — 1,754 1,668 14 107,814
(3,488,596) — — — (1,854) — — (88,846)
1,841,855 — — 750 — 4,368 114 641,886
— — — — — — — —
— — — — — — — —
— — — — — — — —
— — — — — — — —
— — — — — — — —
— — — — — — — —
— — — — — — — —
— — — — — — — —
— — — — — — — —
— — — — — — — —
— — — — — — — —
— — — — — — — —
— — 3,586,083 — — — — —
— — 1,520,212 — — — — —
— — (932,200) — — — — —
— — 4,174,095 — — — — —
— — — — — — — —
— — — — — — — —
— — — — — — — —
— — — — — — — —
— — — — — — — —
— — — — — — — —
— — — — — — — —
— — — — — — — —
13,771 500,000 35,825,530 — 250,000 — — 60,705,642
— — 9,448,036 — — — — 30,754,791
— — (9,360,335) — (248,000) — — (15,116,549)
13,771 500,000 35,913,231 — 2,000 — — 76,343,884
— — — — — — — —
— — — — — — — —
— — — — — — — —
— — — — — — — —
— — — — — — — —
— — — — — — — —
— — — — — — — —
— — — — — — — —

74 The accompanying notes form an integral part of these financial statements.
INTERNATIONAL OPPORTUNITIES FUNDS
Statement of Changes in Shares OutstandingFor the Year Ended December 31, 2009 (continued)
Class DJ shares
Shares outstanding at the beginning of the year
Shares issued
Shares redeemed
Shares outstanding at the end of the year
Class E shares
Shares outstanding at the beginning of the year
Shares issued
Shares redeemed
Shares outstanding at the end of the year
Class F shares
Shares outstanding at the beginning of the year
Shares issued
Shares redeemed
Shares outstanding at the end of the year
Class FD shares
Shares outstanding at the beginning of the year
Shares issued
Shares redeemed
Shares outstanding at the end of the year
Class J shares
Shares outstanding at the beginning of the year
Shares issued
Shares redeemed
Shares outstanding at the end of the year
GreaterGlobal China Hong Kong India
Technology Equity Equity EquityUSD USD USD USD
— — — —
— — — —
— — — —
— — — —
— — — —
— — — —
— — — —
— — — —
250 830 — —
— — — —
(250) (250) — —
— 580 — —
— — — —
— — — —
— — — —
— — — —
— — — 4,073,810
— — — 379,136
— — — (649,982)
— — — 3,802,964

The accompanying notes form an integral part of these financial statements. 75
INTERNATIONAL OPPORTUNITIES FUNDS
Statement of Changes in Shares OutstandingFor the Year Ended December 31, 2009 (continued)
Indonesia Japan Japan Japan Smaller Korea Latin American Malaysia NorthEquity Dynamic Equity Companies Equity Equity Equity America
USD USD USD USD USD USD USD USD
— — 7,971,474 — — — — —
— — 1,057,132 — — — — —
— — (934,432) — — — — —
— — 8,094,174 — — — — —
— — 15,322,929 1,181,719 — 20,000,000 — —
— — 360,788 14,419 — 472,804 — —
— — (4,685,059) (78,819) — — — —
— — 10,998,658 1,117,319 — 20,472,804 — —
— — — — — — — —
— — — — — — — —
— — — — — — — —
— — — — — — — —
— — — — — — — —
— — — — — — — —
— — — — — — — —
— — — — — — — —
3,416,632 — — — — — 2,544,221 —
2,887,557 — — — — — 739,066 —
(1,104,663) — — — — — (237,287) —
5,199,526 — — — — — 3,046,000 —

76 The accompanying notes form an integral part of these financial statements.
INTERNATIONAL OPPORTUNITIES FUNDS
Statement of Changes in Shares OutstandingFor the Year Ended December 31, 2009 (continued)
Class A shares
Shares outstanding at the beginning of the year
Shares issued
Shares redeemed
Shares outstanding at the end of the year
Class AD shares
Shares outstanding at the beginning of the year
Shares issued
Shares redeemed
Shares outstanding at the end of the year
Class ADQ shares**
Shares outstanding at the beginning of the year
Shares issued
Shares redeemed
Shares outstanding at the end of the year
Class ADM shares
Shares outstanding at the beginning of the year
Shares issued
Shares redeemed
Shares outstanding at the end of the year
Class AJ shares
Shares outstanding at the beginning of the year
Shares issued
Shares redeemed
Shares outstanding at the end of the year
Class B shares
Shares outstanding at the beginning of the year
Shares issued
Shares redeemed
Shares outstanding at the end of the year
Class C shares
Shares outstanding at the beginning of the year
Shares issued
Shares redeemed
Shares outstanding at the end of the year
Class D shares
Shares outstanding at the beginning of the year
Shares issued
Shares redeemed
Shares outstanding at the end of the year
Class DD shares
Shares outstanding at the beginning of the year
Shares issued
Shares redeemed
Shares outstanding at the end of the year
Class DDJ shares
Shares outstanding at the beginning of the year
Shares issued
Shares redeemed
Shares outstanding at the end of the year
** Class AD changed its name into Class ADQ, effective June 2, 2009.
NorthAmerican Pan Philippines Taiwan
Value European Equity EquityUSD USD USD USD
1,612 1,236,413 35,675 556,859
— 305,265 7,174 14,046
— (383,084) (22,474) (472,806)
1,612 1,158,594 20,375 98,099
— — — —
— — — —
— — — —
— — — —
— — — —
— — — —
— — — —
— — — —
— — — —
— — — —
— — — —
— — — —
— — — —
— — — —
— — — —
— — — —
— — — —
— — — —
— — — —
— — — —
— 5,060,907 — —
— 198,355 — —
— (537,916) — —
— 4,721,346 — —
57,991,881 3,739,568 — 250,000
— 1,331,223 — —
(31,702,018) (1,236,294) — —
26,289,863 3,834,497 — 250,000
— — — —
— — — —
— — — —
— — — —
— — — —
— — — —
— — — —
— — — —

The accompanying notes form an integral part of these financial statements. 77
INTERNATIONAL OPPORTUNITIES FUNDS
Statement of Changes in Shares OutstandingFor the Year Ended December 31, 2009 (continued)
US HighThailand US US Corporate Investment US High US Investment Vietnam World Value
Equity Bond Bond Grade Bond Yield Bond Grade Bond Equity EquityUSD USD USD USD USD USD USD USD
199,770 2,145,099 — 259,653 314,933 547,921 — 649,062
586,256 4,440,685 — 2,758,991 982,332 12,801,627 — 614,719
(438,795) (6,401,507) — (2,192,244) (608,650) (3,130,553) — (459,720)
347,231 184,277 — 826,400 688,615 10,218,995 — 804,061
— — — — — — — —
— — — — — — — —
— — — — — — — —
— — — — — — — —
— — — — — — — —
— — — 18,236 212 31,997 — —
— — — (37) — (24,211) — —
— — — 18,199 212 7,786 — —
— — — — — — — —
— — — 1,098,501 459,078 7,856,536 — —
— — — (221,033) (77,176) (1,356,198) — —
— — — 877,468 381,902 6,500,338 — —
— — — — — — — —
— — — — — — — —
— — — — — — — —
— — — — — — — —
— — — 9,801,059 — 4,431,925 — —
— — — 4,070,688 5,836,660 — —
— — — (1,681,416) (2,851,155) — —
— — — 12,190,331 — 7,417,430 — —
— 40,942 — 651,132 8,397,932 — 8,597 12,738,083
— 59,269 — 482,118 15,401,254 — — 5,171,233
— (33,697) — (416,848) (11,906,543) — — (1,402,976)
— 66,514 — 716,402 11,892,643 — 8,597 16,506,340
17,451 53,975,349 83,062,301 2,232,088 5,402,128 1,950,792 — 8,592,361
— 11,873,835 19,922,201 — 3,597,679 6,403,828 — 976,392
— (13,864,147) (14,695,919) (338,931) (1,433,374) (619,370) — (2,307,917)
17,451 51,985,037 88,288,583 1,893,157 7,566,433 7,735,250 — 7,260,836
— 903,001 — — — — — —
— 36,762 — — — — — —
— — — — — — — —
— 939,763 — — — — — —
— — — — — — — —
— — — — — — — —
— — — — — — — —
— — — — — — — —

78 The accompanying notes form an integral part of these financial statements.
INTERNATIONAL OPPORTUNITIES FUNDS
Statement of Changes in Shares OutstandingFor the Year Ended December 31, 2009 (continued)
Class DJ shares
Shares outstanding at the beginning of the year
Shares issued
Shares redeemed
Shares outstanding at the end of the year
Class E shares
Shares outstanding at the beginning of the year
Shares issued
Shares redeemed
Shares outstanding at the end of the year
Class F shares
Shares outstanding at the beginning of the year
Shares issued
Shares redeemed
Shares outstanding at the end of the year
Class FD shares
Shares outstanding at the beginning of the year
Shares issued
Shares redeemed
Shares outstanding at the end of the year
Class J shares
Shares outstanding at the beginning of the year
Shares issued
Shares redeemed
Shares outstanding at the end of the year
NorthAmerican Pan Philippines Taiwan
Value European Equity EquityUSD USD USD USD
— — — —
— — — —
— — — —
— — — —
— — — —
— — — —
— — — —
— — — —
3,172 250 — —
— — — —
— (250) — —
3,172 — — —
— — — —
— — — —
— — — —
— — — —
— — 1,286,478 —
— — 108,662 —
— — (216,989) —
— — 1,178,151 —

The accompanying notes form an integral part of these financial statements. 79
INTERNATIONAL OPPORTUNITIES FUNDS
Statement of Changes in Shares OutstandingFor the Year Ended December 31, 2009 (continued)
US HighThailand US US Corporate Investment US High US Investment Vietnam World Value
Equity Bond Bond Grade Bond Yield Bond Grade Bond Equity EquityUSD USD USD USD USD USD USD USD
— — — — — — — —
— — — — — — — —
— — — — — — — —
— — — — — — — —
— 243,746 — — — — — —
— 45,241 — — — — — —
— (26,007) — — — — — —
— 262,980 — — — — — —
— 457 — — 250 — — 1,099
— — — 20,169 — 11,955 — —
— (457) — (12,209) (250) (6,379) — (250)
— — — 7,960 — 5,576 — 849
— — — — — — — —
— — — — — — — —
— — — — — — — —
— — — — — — — —
3,453,375 — — — — — 1,704,935 —
289,421 — — — — — 256,392 —
(749,655) — — — — — (300,524) —
2,993,141 — — — — — 1,660,803 —

80 The accompanying notes form an integral part of these financial statements.
INTERNATIONAL OPPORTUNITIES FUNDS
Statistics
Total net assets value
– December 31, 2009
– December 31, 2008
– December 31, 2007
Net asset value per Class A share as at
– December 31, 2009
– December 31, 2008
– December 31, 2007
Net asset value per Class ADQ share as at**
– December 31, 2009
– December 31, 2008
– December 31, 2007
Net asset value per Class ADM share as at
– December 31, 2009
– December 31, 2008
– December 31, 2007
Net asset value per Class AJ share as at
– December 31, 2009
– December 31, 2008
– December 31, 2007
Net asset value per Class B share as at
– December 31, 2009
– December 31, 2008
– December 31, 2007
Net asset value per Class C share as at
– December 31, 2009
– December 31, 2008
– December 31, 2007
Net asset value per Class D share as at
– December 31, 2009
– December 31, 2008
– December 31, 2007
Net asset value per Class DD share as at
– December 31, 2009
– December 31, 2008
– December 31, 2007
Net asset value per Class DDJ share as at
– December 31, 2009
– December 31, 2008
– December 31, 2007
Net asset value per Class DJ share as at
– December 31, 2009
– December 31, 2008
– December 31, 2007
Net asset value per Class E share as at
– December 31, 2009
– December 31, 2008
– December 31, 2007
** Class AD changed its name into Class ADQ, effective June 2, 2009.† New Sub-Fund launched on November 2, 2009.
Asia AsianPacific Asian Asian Asian EquityEquity Bond Dynamic Equity Income
USD USD USD USD USD
1,065,944,321 864,858,276 8,642,401 825,029,195 6,082,296
797,022,764 722,664,424 4,529,603 497,849,562 2,026,987
927,063,174 761,451,423 9,538,253 848,593,929 3,535,964
— USD 13.263 — USD 15.393 USD 9.138
— USD 10.321 — USD 8.722 USD 5.892
— USD 11.990 — USD 19.076 USD 10.427
— USD 12.146 — — —
— USD 9.884 — — —
— USD 11.997 — — —
— USD 10.891 — — —
— — — — —
— — — — —
— — — — —
— — — — —
— — — — —
— — — USD 8.040 —
— — — USD 4.501 —
— — — USD 9.727 —
— — — USD 31.929 —
— — — USD 17.993 —
— — — USD 39.153 —
USD 10.311 USD 14.133 USD 17.285 USD 33.607 USD 12.764
USD 5.787 USD 10.857 USD 9.059 USD 18.751 USD 8.106
— USD 12.435 USD 19.077 USD 40.395 USD 14.140
— — — — USD 13.596
— — — — —
— — — — —
— — — — —
— — — — —
— — — — —
— — — — —
— — — — —
— — — — —
USD 9.934 USD 10.616 — — —
USD 5.798 USD 8.730 — — —
USD 12.120 USD 10.064 — — —

The accompanying notes form an integral part of these financial statements. 81
INTERNATIONAL OPPORTUNITIES FUNDS
Statistics (continued)
Emerging Europe,Asian Asian Asian Middle East European
Infrastructure Local Property China Dragon and Africa Investment Global MarketEquity Bond Securities Equity Peacock Dynamic† Grade Bond Navigator
USD USD USD USD USD USD EUR USD
98,977,435 511,175,225 11,243,721 446,395,871 248,879,164 86,423,734 271,131,846 22,760,387
72,576,509 341,155,515 6,787,291 167,966,695 131,088,670 — 203,396,257 19,294,820
131,813,959 414,243,620 10,293,827 275,088,219 255,482,836 — 192,723,152 —
USD 8.666 USD 10.618 USD 6.606 USD 11.630 USD 18.565 — EUR 10.583 USD 9.382
USD 6.203 USD 9.619 USD 4.860 USD 6.284 USD 9.914 — EUR 9.195 USD 8.235
USD 10.523 USD 10.443 USD 10.228 USD 12.850 USD 23.130 — EUR 9.777 —
— — — — — — — —
— — — — — — — —
— — — — — — — —
— USD 10.481 — — — — EUR 10.927 —
— — — — — — — —
— — — — — — — —
— — — — — — — —
— — — — — — — —
— — — — — — — —
— — — — — — — —
— — — — — — — —
— — — — — — — —
USD 9.532 — — — — — — USD 9.731
USD 6.786 — — — — — — USD 8.498
— — — — — — EUR 9.943 —
— USD 11.823 USD 6.886 USD 26.302 USD 24.852 — EUR 11.436 USD 9.639
— USD 10.573 USD 4.994 USD 13.992 USD 13.037 — EUR 9.809 USD 8.333
— — USD 10.348 USD 28.172 USD 29.875 — EUR 10.298 —
— — — — — — — —
— — — — — — — —
— — — — — — — —
— — — — — — — JPY 815
— — — — — — — JPY 723
— — — — — — — —
— — — — — — — —
— — — — — — — —
— — — — — — — —
— USD 9.947 — — — USD 10.803 — —
— USD 9.438 — — — — — —
— USD 10.168 — — — — — —

82 The accompanying notes form an integral part of these financial statements.
INTERNATIONAL OPPORTUNITIES FUNDS
Statistics (continued)
Net asset value per Class F share as at
– December 31, 2009
– December 31, 2008
– December 31, 2007
Net asset value per Class FD share as at
– December 31, 2009
– December 31, 2008
– December 31, 2007
Net asset value per Class J share as at
– December 31, 2009
– December 31, 2008
– December 31, 2007
† New Sub-Fund launched on November 2, 2009.
Asia AsianPacific Asian Asian Asian EquityEquity Bond Dynamic Equity Income
USD USD USD USD USD
— SGD 10.177 — SGD 12.903 —
— SGD 8.489 — SGD 7.490 —
— SGD 9.844 — SGD 16.394 —
— — — — —
— — — — —
— — — — —
— — — USD 11.209 —
— — — USD 6.274 —
— — — USD 13.560 —
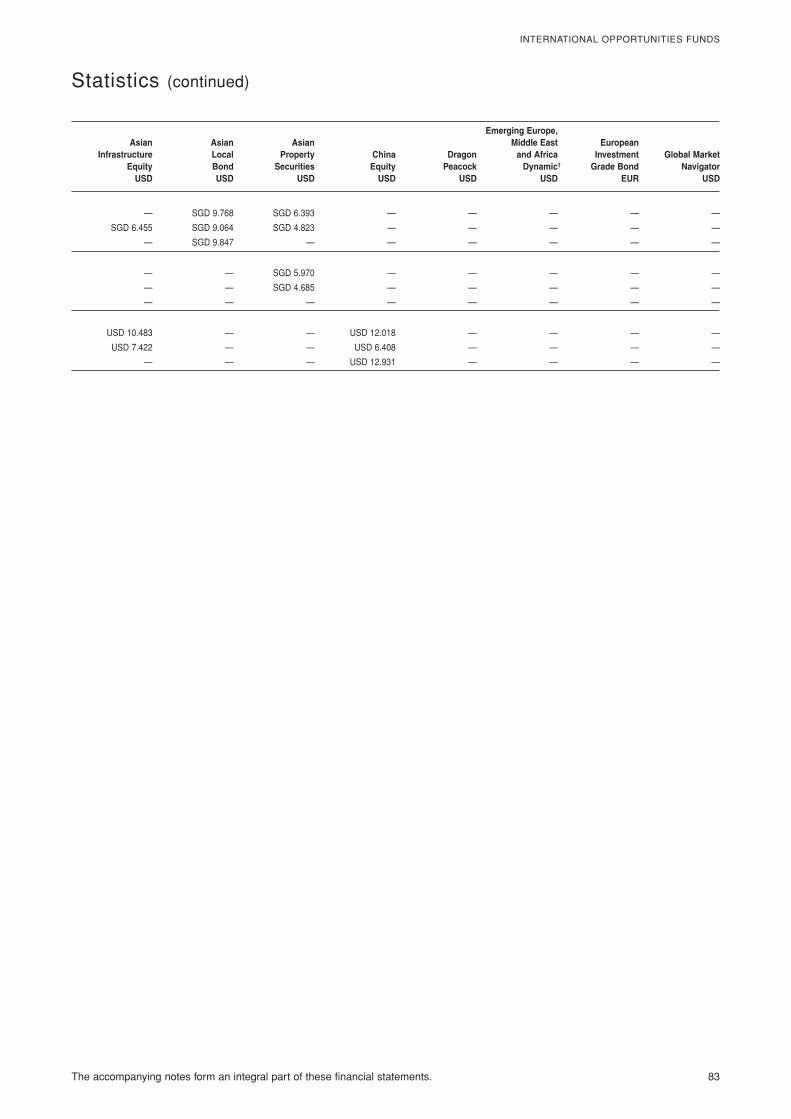
The accompanying notes form an integral part of these financial statements. 83
INTERNATIONAL OPPORTUNITIES FUNDS
Statistics (continued)
Emerging Europe,Asian Asian Asian Middle East European
Infrastructure Local Property China Dragon and Africa Investment Global MarketEquity Bond Securities Equity Peacock Dynamic† Grade Bond Navigator
USD USD USD USD USD USD EUR USD
— SGD 9.768 SGD 6.393 — — — — —
SGD 6.455 SGD 9.064 SGD 4.823 — — — — —
— SGD 9.847 — — — — — —
— — SGD 5.970 — — — — —
— — SGD 4.685 — — — — —
— — — — — — — —
USD 10.483 — — USD 12.018 — — — —
USD 7.422 — — USD 6.408 — — — —
— — — USD 12.931 — — — —

84 The accompanying notes form an integral part of these financial statements.
INTERNATIONAL OPPORTUNITIES FUNDS
Statistics (continued)
Total net assets value
– December 31, 2009
– December 31, 2008
– December 31, 2007
Net asset value per Class A share as at
– December 31, 2009
– December 31, 2008
– December 31, 2007
Net asset value per Class ADQ share as at**
– December 31, 2009
– December 31, 2008
– December 31, 2007
Net asset value per Class ADM share as at
– December 31, 2009
– December 31, 2008
– December 31, 2007
Net asset value per Class AJ share as at
– December 31, 2009
– December 31, 2008
– December 31, 2007
Net asset value per Class B share as at
– December 31, 2009
– December 31, 2008
– December 31, 2007
Net asset value per Class C share as at
– December 31, 2009
– December 31, 2008
– December 31, 2007
Net asset value per Class D share as at
– December 31, 2009
– December 31, 2008
– December 31, 2007
Net asset value per Class DD share as at
– December 31, 2009
– December 31, 2008
– December 31, 2007
Net asset value per Class DDJ share as at
– December 31, 2009
– December 31, 2008
– December 31, 2007
Net asset value per Class DJ share as at
– December 31, 2009
– December 31, 2008
– December 31, 2007
Net asset value per Class E share as at
– December 31, 2009
– December 31, 2008
– December 31, 2007
** Class AD changed its name into Class ADQ, effective June 2, 2009.
GreaterGlobal China Hong Kong India
Technology Equity Equity EquityUSD USD USD USD
63,171,435 75,934,180 850,629,665 145,273,254
39,550,535 31,383,625 455,231,182 51,807,624
84,208,569 68,995,916 1,019,562,132 96,615,908
USD 10.776 USD 17.750 USD 9.444 USD 10.041
USD 6.709 USD 9.982 USD 5.853 USD 4.982
USD 12.584 USD 20.479 USD 12.178 USD 14.311
— — — —
— — — —
— — — —
— — — —
— — — —
— — — —
— — — —
— — — —
— — — —
— — — —
— — — —
— — — —
SGD 5.650 USD 25.670 — —
SGD 3.575 USD 14.359 — —
SGD 6.657 USD 29.303 — —
— — USD 14.107 USD 19.830
— — USD 8.608 USD 9.688
— — USD 17.640 USD 27.411
— — — —
— — — —
— — — —
— — — —
— — — —
— — — —
— — — —
— — — —
— — — —
— — — —
— — — —
— — — —

The accompanying notes form an integral part of these financial statements. 85
INTERNATIONAL OPPORTUNITIES FUNDS
Statistics (continued)
Indonesia Japan Japan Japan Smaller Korea Latin American Malaysia NorthEquity Dynamic Equity Companies Equity Equity Equity America
USD USD USD USD USD USD USD USD
87,147,424 3,929,351 433,713,040 11,351,489 25,019 178,882,751 28,570,142 736,396,363
18,080,892 3,450,135 433,488,485 9,427,778 1,918,255 79,881,366 15,804,579 430,777,764
39,832,126 4,485,442 628,666,628 — 3,660,420 — 45,233,074 841,463,690
USD 12.040 — — USD 10.002 — USD 8.716 USD 9.100 USD 9.109
USD 5.059 — — USD 7.880 USD 5.610 USD 3.953 USD 6.102 USD 6.792
USD 12.352 — — — USD 10.864 — USD 10.726 USD 11.884
— — — — — — — —
— — — — — — — —
— — — — — — — —
— — — — — — — —
— — — — — — — —
— — — — — — — —
— — JPY 674 — — — — —
— — JPY 622 — — — — —
— — JPY 1,080 — — — — —
— — — — — — — —
— — — — — — — —
— — — — — — — —
— — — — — — — —
— — — — — — — —
— — — — — — — —
USD 21.619 USD 7.859 USD 7.259 — USD 12.510 — — USD 9.569
USD 8.946 USD 6.900 USD 6.781 — USD 7.671 — — USD 7.026
USD 21.497 USD 8.971 USD 9.352 — USD 14.633 — — USD 12.105
— — — — — — — —
— — — — — — — —
— — — — — — — —
— — — — — — — —
— — — — — — — —
— — — — — — — —
— — JPY 673 — — — — —
— — JPY 611 — — — — —
— — JPY 1,047 — — — — —
— — USD 7.634 USD 10.153 — USD 8.736 — —
— — USD 7.299 USD 7.973 — USD 3.994 — —
— — USD 10.073 — — — — —

86 The accompanying notes form an integral part of these financial statements.
INTERNATIONAL OPPORTUNITIES FUNDS
Statistics (continued)
Net asset value per Class F share as at
– December 31, 2009
– December 31, 2008
– December 31, 2007
Net asset value per Class FD share as at
– December 31, 2009
– December 31, 2008
– December 31, 2007
Net asset value per Class J share as at
– December 31, 2009
– December 31, 2008
– December 31, 2007
GreaterGlobal China Hong Kong India
Technology Equity Equity EquityUSD USD USD USD
— SGD 13.657 — —
SGD 5.769 SGD 7.867 — —
SGD 10.823 SGD 16.150 — —
— — — —
— — — —
— — — —
— — — USD 10.372
— — — USD 5.079
— — — USD 14.402

The accompanying notes form an integral part of these financial statements. 87
INTERNATIONAL OPPORTUNITIES FUNDS
Statistics (continued)
Indonesia Japan Japan Japan Smaller Korea Latin American Malaysia NorthEquity Dynamic Equity Companies Equity Equity Equity America
USD USD USD USD USD USD USD USD
— — — — — — — —
— — — — — — — —
— — — — — — — —
— — — — — — — —
— — — — — — — —
— — — — — — — —
USD 12.438 — — — — — USD 9.379 —
USD 5.159 — — — — — USD 6.212 —
USD 12.428 — — — — — USD 10.787 —

88 The accompanying notes form an integral part of these financial statements.
INTERNATIONAL OPPORTUNITIES FUNDS
Statistics (continued)
Total net assets value
– December 31, 2009
– December 31, 2008
– December 31, 2007
Net asset value per Class A share as at
– December 31, 2009
– December 31, 2008
– December 31, 2007
Net asset value per Class ADQ share as at**
– December 31, 2009
– December 31, 2008
– December 31, 2007
Net asset value per Class ADM share as at
– December 31, 2009
– December 31, 2008
– December 31, 2007
Net asset value per Class AJ share as at
– December 31, 2009
– December 31, 2008
– December 31, 2007
Net asset value per Class B share as at
– December 31, 2009
– December 31, 2008
– December 31, 2007
Net asset value per Class C share as at
– December 31, 2009
– December 31, 2008
– December 31, 2007
Net asset value per Class D share as at
– December 31, 2009
– December 31, 2008
– December 31, 2007
Net asset value per Class DD share as at
– December 31, 2009
– December 31, 2008
– December 31, 2007
Net asset value per Class DDJ share as at
– December 31, 2009
– December 31, 2008
– December 31, 2007
Net asset value per Class DJ share as at
– December 31, 2009
– December 31, 2008
– December 31, 2007
Net asset value per Class E share as at
– December 31, 2009
– December 31, 2008
– December 31, 2007
** Class AD changed its name into Class ADQ, effective June 2, 2009.
NorthAmerican Pan Philippines Taiwan
Value European Equity EquityUSD USD USD USD
181,326,401 103,506,349 9,826,830 4,420,159
275,167,303 77,227,295 5,851,925 4,648,858
525,964,438 164,439,666 15,866,037 5,214,373
USD 6.652 USD 11.629 USD 7.957 USD 9.710
USD 4.648 USD 8.563 USD 4.351 USD 5.117
USD 9.242 USD 15.823 USD 10.144 USD 9.837
— — — —
— — — —
— — — —
— — — —
— — — —
— — — —
— — — —
— — — —
— — — —
— — — —
— — — —
— — — —
— SGD 11.358 — —
— SGD 8.521 — —
— SGD 15.669 — —
USD 6.896 USD 13.507 — USD 13.871
USD 4.745 USD 9.793 — USD 7.198
USD 9.290 USD 17.819 — USD 13.626
— — — —
— — — —
— — — —
— — — —
— — — —
— — — —
— — — —
— — — —
— — — —
— — — —
— — — —
— — — —

The accompanying notes form an integral part of these financial statements. 89
INTERNATIONAL OPPORTUNITIES FUNDS
Statistics (continued)
US HighThailand US US Corporate Investment US High US Investment Vietnam World Value
Equity Bond Bond Grade Bond Yield Bond Grade Bond Equity EquityUSD USD USD USD USD USD USD USD
33,524,503 612,435,195 1,041,010,193 218,034,183 284,119,709 414,610,375 9,599,954 313,710,176
22,484,169 574,061,193 783,067,081 149,369,554 142,046,868 77,752,032 5,662,507 213,813,620
47,045,985 554,515,766 495,365,737 208,505,445 129,013,937 106,802,821 12,636,192 322,671,213
USD 9.679 USD 11.153 — USD 11.260 USD 10.872 USD 12.147 — USD 11.831
USD 6.004 USD 9.879 — USD 9.838 USD 7.950 USD 9.412 — USD 9.110
USD 11.048 USD 9.984 — USD 10.783 USD 10.590 USD 10.894 — USD 15.692
— — — USD 11.537 USD 12.258 USD 12.411 — —
— — — — — — — —
— — — — — — — —
— — — USD 10.987 USD 11.388 USD 11.422 — —
— — — — — — — —
— — — — — — — —
— — — — — — — —
— — — — — — — —
— — — — — — — —
— — — USD 13.596 — USD 15.647 — —
— — — USD 11.785 — USD 12.027 — —
— — — USD 12.733 — USD 13.812 — —
— USD 11.284 — USD 13.955 USD 15.462 — USD 6.071 USD 12.708
— USD 9.909 — USD 12.047 USD 11.191 — USD 3.514 USD 9.670
— USD 9.991 — USD 12.962 USD 14.825 — — USD 16.460
USD 13.595 USD 11.466 USD 11.791 USD 12.189 USD 11.682 USD 12.931 — USD 13.005
USD 8.305 USD 10.018 USD 9.427 USD 10.513 USD 8.434 USD 9.890 — USD 9.860
USD 15.045 USD 9.995 USD 9.992 USD 11.302 USD 11.145 USD 11.301 — USD 16.727
— USD 11.312 — — — — — —
— USD 10.288 — — — — — —
— — — — — — — —
— — — — — — — —
— — — — — — — —
— — — — — — — —
— — — — — — — —
— — — — — — — —
— — — — — — — —
— USD 11.147 — — — — — —
— USD 10.002 — — — — — —
— USD 9.995 — — — — — —

90 The accompanying notes form an integral part of these financial statements.
INTERNATIONAL OPPORTUNITIES FUNDS
Statistics (continued)
Net asset value per Class F share as at
– December 31, 2009
– December 31, 2008
– December 31, 2007
Net asset value per Class FD share as at
– December 31, 2009
– December 31, 2008
– December 31, 2007
Net asset value per Class J share as at
– December 31, 2009
– December 31, 2008
– December 31, 2007
NorthAmerican Pan Philippines Taiwan
Value European Equity EquityUSD USD USD USD
SGD 7.270 — — —
SGD 5.203 SGD 7.363 — —
SGD 10.336 SGD 13.619 — —
— — — —
— — — —
— — — —
— — USD 8.203 —
— — USD 4.428 —
— — USD 10.192 —

The accompanying notes form an integral part of these financial statements. 91
INTERNATIONAL OPPORTUNITIES FUNDS
Statistics (continued)
US HighThailand US US Corporate Investment US High US Investment Vietnam World Value
Equity Bond Bond Grade Bond Yield Bond Grade Bond Equity EquityUSD USD USD USD USD USD USD USD
— — — SGD 10.841 — SGD 11.838 — SGD 8.137
— SGD 9.826 — — SGD 6.797 — — SGD 6.417
— SGD 9.923 — — SGD 9.104 — — SGD 11.062
— — — — — — — —
— — — — — — — —
— — — — — — — —
USD 9.998 — — — — — USD 5.749 —
USD 6.121 — — — — — USD 3.304 —
USD 11.078 — — — — — USD 9.972 —

92 The accompanying notes form an integral part of these financial statements.
INTERNATIONAL OPPORTUNITIES FUNDS
ASIA PACIFIC EQUITY
Statement of Investment as at December 31, 2009
(expressed in USD)
Quantity/ Aquisition % net
Description Nominal Currency cost Evaluation assets
Transferable Securities Admitted to an Official Stock Exchange Listing or Dealt in on Another Regulated Market
SHARES
Australia Aristocrat Leisure Ltd 3,332,595 AUD 21,962,764 12,022,587 1.13 Australia & New Zealand Banking Group Ltd 2,038,054 AUD 35,599,008 41,846,683 3.93 AXA Asia Pacific Holdings Ltd 3,779,953 AUD 9,941,161 22,252,539 2.09 BHP Billiton Ltd 1,031,486 AUD 35,969,400 39,914,567 3.74 Foster's Group Ltd 3,753,320 AUD 19,415,351 18,525,401 1.74 GPT Group – REIT 20,102,395 AUD 9,570,453 10,914,215 1.02 Macquarie Group Ltd 708,566 AUD 30,306,886 30,776,200 2.89 Metcash Ltd 3,309,483 AUD 12,465,537 13,275,687 1.25 Origin Energy Ltd 1,729,044 AUD 15,917,455 26,098,850 2.45 QBE Insurance Group Ltd 625,011 AUD 6,984,359 14,358,761 1.35 Rio Tinto Ltd 533,577 AUD 28,207,450 35,859,998 3.36 Suncorp-Metway Ltd 1,887,494 AUD 14,217,129 14,719,555 1.38 Telstra Corp., Ltd 4,697,751 AUD 11,666,916 14,460,171 1.36
252,223,869 295,025,214 27.69
China Bank of China Ltd "H" 65,289,000 HKD 29,529,320 35,363,669 3.32 Beijing Capital International Airport Co., Ltd "H" 4,862,000 HKD 3,108,003 3,222,894 0.30 China Coal Energy Co. "H" 4,839,000 HKD 9,848,710 8,886,559 0.83 China Pacific Insurance Group Co., Ltd "H" 2,893,000 HKD 10,548,624 11,528,556 1.08 China Petroleum & Chemical Corp. "H" 27,462,000 HKD 23,733,005 24,472,494 2.30 China Zhongwang Holdings Ltd 10,156,400 HKD 10,408,136 8,173,205 0.77 Focus Media Holding Ltd – ADR 902,000 USD 14,249,440 14,044,140 1.32 Ping An Insurance Group Company of China Ltd "H" 696,500 HKD 3,152,184 6,107,986 0.57 Tencent Holdings Ltd 551,100 HKD 10,580,035 11,975,629 1.12
115,157,457 123,775,132 11.61
Hong Kong China Merchants Holdings International Co., Ltd 5,082,000 HKD 11,907,117 16,548,707 1.55 China Resources Land Ltd 3,764,000 HKD 5,249,634 8,562,808 0.80 China Unicom Hong Kong Ltd 12,024,000 HKD 15,852,601 15,940,799 1.49 CNOOC Ltd 12,442,000 HKD 15,401,176 19,575,733 1.84 Dah Sing Financial Holdings Ltd 868,800 HKD 2,396,888 4,817,883 0.45 Hang Seng Bank Ltd 611,300 HKD 7,887,109 9,042,444 0.85 Henderson Land Development Co., Ltd 3,455,000 HKD 13,742,810 26,021,295 2.44 Li & Fung Ltd 2,890,000 HKD 7,745,267 12,019,754 1.13 Swire Pacific Ltd 2,032,500 HKD 13,830,230 24,639,190 2.31 Techtronic Industries Co. 2,246,500 HKD 1,405,434 1,880,265 0.18 Wharf Holdings Ltd 3,416,125 HKD 15,891,431 19,714,910 1.85
111,309,697 158,763,788 14.89
India Bharti Airtel Ltd 2,306,067 INR 16,730,615 16,340,944 1.53 Hindalco Industries Ltd 3,696,482 INR 10,472,231 12,777,035 1.20 ICICI Bank Ltd 792,240 INR 11,294,315 14,930,583 1.40 IVRCL Infrastructures & Projects Ltd 999,739 INR 10,313,267 7,535,373 0.71 LIC Housing Finance Ltd 306,651 INR 5,422,425 5,290,201 0.49 Oil India Ltd 238,771 INR 6,049,519 6,372,189 0.60 Sterlite Industries India Ltd 868,828 INR 11,817,633 16,122,846 1.51 Sterlite Industries India Ltd – ADR 202,100 USD 2,455,515 3,730,766 0.35 Tata Consultancy Services Ltd 1,459,777 INR 11,242,816 23,534,931 2.21 Tata Power Co., Ltd 459,570 INR 10,864,100 13,642,918 1.28 Unitech Ltd 4,926,565 INR 3,804,108 8,712,935 0.82
100,466,544 128,990,721 12.10

The accompanying notes form an integral part of these financial statements. 93
INTERNATIONAL OPPORTUNITIES FUNDS
ASIA PACIFIC EQUITY (continued)
Statement of Investment as at December 31, 2009
(expressed in USD)
Malaysia Genting Malaysia BHD 5,604,800 MYR 4,444,339 4,599,731 0.43
Philippines Metropolitan Bank & Trust 19,195,900 PHP 15,928,419 18,685,170 1.75
Singapore CapitaCommercial Trust – REIT 10,246,000 SGD 6,483,641 8,548,650 0.80 DBS Group Holdings Ltd 1,719,500 SGD 15,435,398 18,883,402 1.77 SembCorp Industries Ltd 3,822,000 SGD 5,576,566 10,084,392 0.95
27,495,605 37,516,444 3.52
South Korea Hankook Tire Co., Ltd 743,020 KRW 6,755,853 16,270,859 1.53 KB Financial Group, Inc. 330,300 KRW 7,994,856 16,933,733 1.59 Korea Electric Power Corp. 484,770 KRW 11,437,510 14,195,801 1.33 KT Corp. 289,570 KRW 9,302,171 9,722,996 0.91 LG Electronics, Inc. 58,419 KRW 5,874,112 6,095,372 0.57 POSCO 49,229 KRW 22,422,299 26,126,383 2.45 Samsung Electronics Co., Ltd 60,348 KRW 29,460,302 41,407,543 3.88 Samsung Fire & Marine Insurance Co., Ltd 64,032 KRW 13,249,823 10,970,079 1.03 Shinsegae Co., Ltd 26,435 KRW 15,980,746 12,190,553 1.14 SK Energy Co., Ltd 66,053 KRW 7,599,513 6,665,001 0.63
130,077,185 160,578,320 15.06
Taiwan Acer, Inc. 6,238,450 TWD 10,621,870 18,763,129 1.76 Delta Electronics, Inc. 5,648,180 TWD 12,534,203 17,658,834 1.66 Far Eastern Textile Co., Ltd 19,439,079 TWD 19,090,125 24,310,236 2.28 Powertech Technology, Inc. 3,709,300 TWD 8,074,160 12,582,739 1.18 Taiwan Cement Corp. 18,616,020 TWD 26,337,319 19,788,791 1.85 Taiwan Semiconductor Manufacturing Co., Ltd 11,676,618 TWD 20,485,950 23,546,713 2.21
97,143,627 116,650,442 10.94
Thailand Bangkok Bank PCL 2,947,941 THB 9,169,850 10,300,994 0.97
Total Investments 863,416,592 1,054,885,956 98.96
Other Net Assets 11,058,365 1.04
Total Net Assets 1,065,944,321 100.00
Quantity/ Aquisition % net
Description Nominal Currency cost Evaluation assets

94 The accompanying notes form an integral part of these financial statements.
INTERNATIONAL OPPORTUNITIES FUNDS
ASIAN BOND
Statement of Investment as at December 31, 2009
(expressed in USD)
Quantity/ Aquisition % net
Description Nominal Currency cost Evaluation assets
Transferable Securities Admitted to an Official Stock Exchange Listingor Dealt in on Another Regulated Market
BONDS
BermudaBW Group Ltd 6.625% 28/6/2017 2,000,000 USD 1,781,913 1,790,000 0.21 Noble Group Ltd 8.5% 30/5/2013 2,700,000 USD 2,953,094 3,010,500 0.35 Qtel International Finance Ltd 6.5% 10/6/2014 800,000 USD 794,802 867,048 0.10 Qtel International Finance Ltd 7.875% 10/6/2019 700,000 USD 692,703 790,769 0.09
6,222,512 6,458,317 0.75
British Virgin IslandsCITIC Resources Finance 2007 Ltd 6.75% 15/5/2014 5,000,000 USD 4,975,304 4,912,500 0.57 CMHI Finance BVI Co., Ltd 6.125% 18/6/2013 2,100,000 USD 2,093,061 2,251,236 0.26 Gain Silver Finance Ltd 6.375% 25/8/2016 8,900,000 USD 8,865,243 8,939,659 1.03 Henson Finance Ltd 5.5% 17/9/2019 2,400,000 USD 2,395,226 2,322,768 0.27 PCCW-HKT Capital Ltd 8% 15/11/2011 12,000,000 USD 12,720,319 12,901,235 1.49 PCCW-HKT Capital No 2 Ltd 6% 15/7/2013 1,000,000 USD 1,014,618 1,037,688 0.12 PCCW-HKT Capital No 3 Ltd 5.25% 20/7/2015 4,000,000 USD 3,807,442 3,966,981 0.46
35,871,213 36,332,067 4.20
CanadaSino-Forest Corp. 10.25% 28/7/2014 5,000,000 USD 5,034,034 5,400,000 0.62
Cayman IslandsAgile Property Holdings Ltd 9% 22/9/2013 2,000,000 USD 1,906,910 2,040,000 0.24 Agile Property Holdings Ltd 10% 14/11/2016 4,600,000 USD 4,490,257 4,657,500 0.54 Bank CIMB Niaga Tbk PT (Cayman Islands) FRN 14/7/2015 4,500,000 USD 4,535,095 4,528,620 0.52 Country Garden Holdings Co. 11.75% 10/9/2014 2,000,000 USD 2,023,454 2,000,000 0.23 Hutchison Whampoa Finance CI Ltd 7.45% 1/8/2017 6,000,000 USD 6,530,322 6,700,398 0.77 Hutchison Whampoa International 03/13 Ltd 6.5% 13/2/2013 20,400,000 USD 20,648,038 22,231,404 2.57 Hutchison Whampoa International 03/33 Ltd 6.25% 24/1/2014 4,000,000 USD 4,100,879 4,368,646 0.51 Hutchison Whampoa International 03/33 Ltd 7.45% 24/11/2033 8,400,000 USD 8,869,967 9,267,701 1.07 Hutchison Whampoa International 09 Ltd 7.625% 9/4/2019 3,400,000 USD 3,389,790 3,894,366 0.45 Hutchison Whampoa International 09/16 Ltd 4.625% 11/9/2015 8,900,000 USD 8,884,879 8,957,355 1.04 Hutchison Whampoa International 09/19 Ltd 5.75% 11/9/2019 3,000,000 USD 3,019,068 3,035,239 0.35 Lai Fung Holdings Ltd 9.125% 4/4/2014 3,000,000 USD 2,996,743 2,790,000 0.32 Parkson Retail Group Ltd 7.125% 30/5/2012 1,000,000 USD 1,000,000 1,023,060 0.12 Parkson Retail Group Ltd 7.875% 14/11/2011 5,000,000 USD 5,039,460 5,137,500 0.59 Sun Hung Kai Properties Capital Market Ltd 5.375% 8/3/2017 "EMTN" 7,000,000 USD 6,736,735 7,224,163 0.84 Swire Pacific MTN Financing Ltd 5.5% 19/8/2019 "EMTN" 2,000,000 USD 1,990,938 2,046,358 0.24 Swire Pacific MTN Financing Ltd 6.25% 18/4/2018 "EMTN" 4,000,000 USD 3,970,180 4,296,076 0.50 Towngas China Co., Ltd 8.25% 23/9/2011 4,000,000 USD 4,136,389 4,339,600 0.50 UOB Cayman Ltd FRN Perpetual 7,800,000 USD 7,481,130 6,864,000 0.79
101,750,234 105,401,986 12.19
Hong KongBank of East Asia Ltd FRN 13/12/2015 4,000,000 USD 3,798,265 3,960,000 0.46 Bank of East Asia Ltd FRN 22/6/2017 4,000,000 USD 3,652,615 3,500,000 0.40 Chinatrust Commercial Bank Hong Kong FRN Perpetual 1,800,000 USD 1,492,951 1,521,000 0.18 Chong Hing Bank Ltd FRN 16/12/2016 6,000,000 USD 6,000,000 5,073,060 0.59 Dah Sing Bank FRN 6/5/2015 "EMTN" 900,000 USD 898,620 880,480 0.10 Dah Sing Bank FRN 18/8/2017 7,000,000 USD 6,882,392 6,665,190 0.77 HKCG Finance Ltd 6.25% 7/8/2018 8,000,000 USD 8,038,037 8,581,087 0.99 Kowloon Canton Railway Corp. 5.125% 20/5/2019 2,300,000 USD 2,347,550 2,383,877 0.28 Wharf Finance Ltd 6.125% 6/11/2017 "EMTN" 5,300,000 USD 5,295,618 5,443,594 0.63 Wing Hang Bank Ltd FRN Perpetual "EMTN" 6,800,000 USD 6,756,614 5,984,000 0.69
45,162,662 43,992,288 5.09
IndiaICICI Bank Ltd (Bahrain) 6.625% 3/10/2012 5,900,000 USD 5,981,561 6,195,000 0.72 ICICI Bank Ltd (Singapore) 5.875% 20/10/2011 "EMTN" 4,000,000 USD 3,969,972 4,060,000 0.47 ICICI Bank Ltd FRN 12/1/2010 1,500,000 USD 1,498,658 1,492,500 0.17

The accompanying notes form an integral part of these financial statements. 95
INTERNATIONAL OPPORTUNITIES FUNDS
ASIAN BOND (continued)
Statement of Investment as at December 31, 2009
(expressed in USD)
ICICI Bank Ltd FRN 30/4/2022 3,000,000 USD 2,557,757 2,610,000 0.30 ICICI Bank Ltd FRN Perpetual 1,000,000 USD 980,717 800,000 0.09 State Bank of India Ltd FRN Perpetual "EMTN" 2,000,000 USD 2,000,000 1,720,000 0.20
16,988,665 16,877,500 1.95
IndonesiaAdaro Indonesia PT 7.625% 22/10/2019 2,700,000 USD 2,684,462 2,676,375 0.31 Indonesia Government International Bond 6.625% 17/2/2037 6,000,000 USD 5,621,789 5,910,000 0.68 Indonesia Government International Bond 6.75% 10/3/2014 5,650,000 USD 5,982,136 6,186,750 0.72 Indonesia Government International Bond 6.875% 9/3/2017 6,600,000 USD 6,893,116 7,260,000 0.84 Indonesia Government International Bond 6.875% 17/1/2018 10,000,000 USD 9,894,453 10,975,000 1.27 Indonesia Government International Bond 7.25% 20/4/2015 410,000 USD 315,955 460,225 0.05 Indonesia Government International Bond 7.5% 15/1/2016 3,400,000 USD 2,545,501 3,850,500 0.45 Indonesia Government International Bond 7.75% 17/1/2038 8,625,000 USD 8,655,213 9,552,188 1.10 Indonesia Government International Bond 8.5% 12/10/2035 7,000,000 USD 7,435,070 8,365,000 0.97 Indonesia Government International Bond 10.375% 4/5/2014 3,630,000 USD 3,645,440 4,501,200 0.52 Indonesia Government International Bond 11.625% 4/3/2019 6,370,000 USD 6,401,772 9,188,725 1.06 PT Bank Lippo Tbk (Cayman Islands) FRN 22/11/2016 "EMTN" 9,400,000 USD 9,479,350 9,524,738 1.10
69,554,257 78,450,701 9.07
MalaysiaPenerbangan Malaysia Berhad 5.625% 15/3/2016 10,000,000 USD 10,444,691 10,442,061 1.21 Petronas Capital Ltd 5.25% 12/8/2019 13,000,000 USD 12,907,529 13,047,935 1.51 Petronas Capital Ltd 7% 22/5/2012 12,450,000 USD 13,003,049 13,712,877 1.58 Petronas Capital Ltd 7.875% 22/5/2022 2,000,000 USD 2,367,945 2,444,512 0.28 Petronas Global Sukuk Ltd 4.25% 12/8/2014 4,200,000 USD 4,195,014 4,218,228 0.49 Public Bank BHD FRN 20/6/2017 7,000,000 USD 6,806,804 6,895,000 0.80 Public Bank BHD FRN 22/8/2036 1,450,000 USD 1,356,832 1,290,500 0.15 Sarawak International, Inc. 5.5% 3/8/2015 4,000,000 USD 3,954,889 4,101,177 0.47 SBB Capital Corp. FRN Perpetual 10,000,000 USD 10,054,628 8,300,000 0.96 Telekom Malaysia BHD 7.875% 1/8/2025 6,150,000 USD 6,504,840 7,247,223 0.84 TM Global, Inc. 5.25% 22/9/2014 1,800,000 USD 1,797,381 1,905,615 0.22
73,393,602 73,605,128 8.51
NetherlandsIndo Integrated Energy BV 8.5% 1/6/2012 7,100,000 USD 7,101,758 7,171,000 0.83 Lippo Karawaci Finance BV 8.875% 9/3/2011 6,000,000 USD 5,906,569 5,923,140 0.69 Majapahit Holding BV 7.25% 17/10/2011 5,000,000 USD 5,005,654 5,225,000 0.60 Majapahit Holding BV 7.25% 28/6/2017 3,000,000 USD 2,980,417 3,082,500 0.36 Majapahit Holding BV 7.75% 17/10/2016 2,500,000 USD 2,520,740 2,656,250 0.31 Majapahit Holding BV 7.75% 20/1/2020 2,000,000 USD 2,049,635 2,090,000 0.24 Majapahit Holding BV 7.875% 29/6/2037 3,000,000 USD 2,961,152 2,925,000 0.34 Majapahit Holding BV 8% 7/8/2019 3,700,000 USD 3,697,368 3,931,250 0.45 Matahari International Finance Company BV 10.75% 7/8/2012 2,000,000 USD 1,978,647 2,080,000 0.24 Media Nusantara Citra BV 10.75% 12/9/2011 2,553,571 USD 2,588,702 2,339,863 0.27
36,790,642 37,424,003 4.33
PeruCFG Investment SAC 9.25% 19/12/2013 2,000,000 USD 1,332,332 1,985,000 0.22
PhilippinesDevelopment Bank of Philippines FRN Perpetual 2,500,000 USD 2,521,730 2,535,000 0.29 Land Bank of Philippines FRN 19/10/2016 5,400,000 USD 5,452,830 5,653,152 0.65 Philippine Government International Bond 6.375% 15/1/2032 7,000,000 USD 6,878,858 6,895,000 0.80 Philippine Government International Bond 7.75% 14/1/2031 10,000,000 USD 10,076,133 11,325,000 1.31 Philippine Government International Bond 8% 15/1/2016 5,050,000 USD 5,686,334 5,883,250 0.68 Philippine Government International Bond 8.375% 17/6/2019 6,710,000 USD 7,101,744 8,161,038 0.94 Philippine Government International Bond 8.75% 7/10/2016 3,000,000 USD 3,550,822 3,645,000 0.42 Philippine Government International Bond 8.875% 17/3/2015 1,250,000 USD 1,265,206 1,515,625 0.18 Philippine Government International Bond 9.375% 18/1/2017 5,000,000 USD 5,314,497 6,250,000 0.72 Philippine Government International Bond 9.5% 21/10/2024 2,000,000 USD 2,468,563 2,600,000 0.30 Philippine Government International Bond 9.5% 2/2/2030 8,350,000 USD 9,592,329 11,147,250 1.29 Philippine Government International Bond 9.875% 15/1/2019 4,000,000 USD 5,144,561 5,240,000 0.61
Quantity/ Aquisition % net
Description Nominal Currency cost Evaluation assets

96 The accompanying notes form an integral part of these financial statements.
INTERNATIONAL OPPORTUNITIES FUNDS
ASIAN BOND (continued)
Statement of Investment as at December 31, 2009
(expressed in USD)
Philippine Government International Bond 10.625% 16/3/2025 8,550,000 USD 9,803,481 12,098,250 1.40 Philippine Long Distance Telephone Co. 8.35% 6/3/2017 "EMTN" 10,450,000 USD 11,415,593 11,704,000 1.35 Philippine Long Distance Telephone Co. 11.375% 15/5/2012 750,000 USD 820,698 879,060 0.10 Power Sector Assets & Liabilities Management Corp. 7.25% 27/5/2019 2,900,000 USD 2,876,233 3,110,250 0.36 Power Sector Assets & Liabilities Management Corp. 7.39% 2/12/2024 3,400,000 USD 3,400,000 3,514,750 0.41 Republic of the Philippines 6.5% 20/1/2020 3,900,000 USD 3,881,706 4,207,125 0.49 SM Investments Corp. 6% 22/9/2014 5,100,000 USD 5,087,898 5,100,000 0.59
102,339,216 111,463,750 12.89
SingaporeCiliandra Perkasa Finance Company Pte Ltd 10.75% 8/12/2011 800,000 USD 551,075 823,456 0.10 DBS Bank Ltd (Singapore) FRN 16/5/2017 3,000,000 USD 2,825,346 2,790,000 0.32DBS Bank Ltd (Singapore) FRN 16/5/2017 5,000,000 USD 4,975,053 5,100,000 0.59 DBS Bank Ltd (Singapore) FRN 15/11/2019 4,000,000 USD 3,924,527 4,000,000 0.46 DBS Bank Ltd (Singapore) FRN 15/7/2021 3,800,000 USD 3,318,198 3,201,500 0.37 Oversea-Chinese Banking Corp., Ltd 4.25% 18/11/2019 "EMTN" 5,000,000 USD 4,994,524 4,950,000 0.57 Oversea-Chinese Banking Corp., Ltd 7.75% 6/9/2011 3,200,000 USD 3,476,445 3,456,000 0.40 PSA International Pte Ltd 4.625% 11/9/2019 3,000,000 USD 2,973,850 2,961,823 0.34 PSA International Pte Ltd 5.9% 29/6/2016 7,000,000 USD 7,189,571 7,652,372 0.89 ST Engineering Financial 1 Ltd 4.8% 16/7/2019 "EMTN" 1,600,000 USD 1,590,910 1,601,189 0.19 STATS ChipPAC Ltd 6.75% 15/11/2011 1,500,000 USD 1,292,827 1,515,000 0.18 Temasek Financial I Ltd 4.3% 25/10/2019 4,500,000 USD 4,496,415 4,415,059 0.51 Temasek Financial I Ltd 4.5% 21/9/2015 3,000,000 USD 3,154,851 3,142,159 0.36 United Overseas Bank Ltd FRN 3/9/2019 6,000,000 USD 6,003,576 6,240,000 0.72
50,767,188 51,848,558 6.00
South KoreaExport-Import Bank of Korea 5.5% 17/10/2012 6,000,000 USD 6,324,993 6,300,000 0.73 Export-Import Bank of Korea 5.875% 14/1/2015 7,900,000 USD 8,001,881 8,374,000 0.97 Export-Import Bank of Korea 8.125% 21/1/2014 6,000,000 USD 6,003,976 6,990,000 0.81 Export-Import Bank of Korea FRN 16/11/2010 7,000,000 USD 7,002,261 6,929,608 0.80 GS Caltex Corp. 7.25% 2/7/2013 6,000,000 USD 5,963,948 6,462,251 0.75 Hana Bank 6.5% 9/4/2012 3,000,000 USD 3,204,909 3,232,500 0.37 Hana Bank FRN 12/4/2017 "GMTN" 1,500,000 USD 1,337,056 1,470,000 0.17 Hana Funding Ltd FRN Perpetual 4,400,000 USD 4,935,034 4,282,652 0.49 Hyundai Capital Services, Inc. 5.5% 23/11/2010 8,400,000 USD 8,383,885 8,558,592 0.99 Hyundai Capital Services, Inc. 5.625% 24/1/2012 "EMTN" 2,000,000 USD 2,000,000 2,040,000 0.24 Hyundai Capital Services, Inc. 6% 5/5/2015 5,000,000 USD 4,977,821 5,250,000 0.61 Kookmin Bank 5.875% 11/6/2012 "GMTN" 2,400,000 USD 2,395,103 2,496,000 0.29 Kookmin Bank 7.25% 14/5/2014 2,200,000 USD 2,200,610 2,468,818 0.28 Korea Development Bank (Republic of Korea) 5.75% 10/9/2013 1,500,000 USD 1,508,465 1,567,500 0.18 Korea Development Bank (Republic of Korea) 8% 23/1/2014 8,400,000 USD 8,354,955 9,618,000 1.11 Korea East-West Power Co., Ltd 5.25% 15/11/2012 4,000,000 USD 4,007,712 4,208,358 0.49 Korea Expressway Corp. 4.5% 23/3/2015 1,800,000 USD 1,788,471 1,831,590 0.21 Korea Expressway Corp. 4.9% 1/7/2013 4,000,000 USD 3,899,927 4,159,074 0.48 Korea Expressway Corp. 5.125% 20/5/2015 4,600,000 USD 4,543,271 4,808,361 0.56 Korea Gas Corp. 4.75% 26/11/2010 8,000,000 USD 7,972,476 8,203,200 0.95 Korea Gas Corp. 6% 15/7/2014 1,600,000 USD 1,591,491 1,729,586 0.20 Korea Hydro & Nuclear Power Co., Ltd 6.25% 17/6/2014 3,000,000 USD 2,971,575 3,273,199 0.38 Korea Midland Power Co., Ltd 5.375% 11/2/2013 2,700,000 USD 2,690,573 2,805,117 0.32 Korea National Housing Corp. 4.875% 10/9/2014 3,000,000 USD 3,026,172 3,094,792 0.36 Korea National Oil Corp. 5.375% 30/7/2014 4,000,000 USD 4,053,974 4,223,271 0.49 Korea South-East Power Co., Ltd 6% 25/5/2016 7,000,000 USD 7,187,454 7,227,653 0.84 KT Corp. 4.875% 15/7/2015 7,000,000 USD 6,759,627 7,000,238 0.81 KT Corp. 5.875% 24/6/2014 2,000,000 USD 1,993,572 2,108,136 0.24 National Agricultural Cooperative Federation 5% 30/9/2014 3,400,000 USD 3,406,598 3,502,000 0.40 National Agricultural Cooperative Federation 5.55% 23/10/2012 "EMTN" 3,000,000 USD 2,787,159 3,150,000 0.36 National Agricultural Cooperative Federation FRN 26/5/2015 "EMTN" 6,300,000 USD 6,198,128 6,291,653 0.73 National Agricultural Cooperative Federation FRN 26/4/2017 "EMTN" 1,500,000 USD 1,209,811 1,485,000 0.17 National Federation of Fisheries Cooperatives 6.375% 21/7/2014 "EMTN" 2,900,000 USD 2,876,965 3,161,000 0.37 Republic of Korea 4.25% 1/6/2013 4,000,000 USD 4,111,678 4,124,641 0.48 Republic of Korea 4.875% 22/9/2014 2,800,000 USD 2,961,628 2,975,242 0.34 Republic of Korea 5.75% 16/4/2014 6,200,000 USD 6,617,840 6,789,644 0.79 Republic of Korea 7.125% 16/4/2019 6,200,000 USD 6,999,245 7,172,863 0.83
Quantity/ Aquisition % net
Description Nominal Currency cost Evaluation assets

The accompanying notes form an integral part of these financial statements. 97
INTERNATIONAL OPPORTUNITIES FUNDS
ASIAN BOND (continued)
Statement of Investment as at December 31, 2009
(expressed in USD)
Shinhan Bank 6% 29/6/2012 3,500,000 USD 3,495,222 3,648,750 0.42 Shinhan Bank FRN 15/7/2015 "EMTN" 5,000,000 USD 4,996,680 4,950,000 0.57 Shinhan Bank FRN 28/2/2016 4,500,000 USD 4,443,160 4,455,000 0.51 Shinhan Bank FRN 2/3/2035 650,000 USD 627,985 546,000 0.06 Shinsegae Co., Ltd 6.125% 27/6/2011 3,000,000 USD 2,995,919 3,119,993 0.36 SK Broadband Co., Ltd 7% 1/2/2012 6,750,000 USD 6,770,543 7,053,750 0.82 SK Telecom Co., Ltd 4.25% 1/4/2011 6,450,000 USD 6,398,428 6,568,695 0.76 Standard Chartered First Bank Korea Ltd FRN 3/3/2034 3,800,000 USD 3,914,792 3,372,690 0.39 Woori Bank 7% 2/2/2015 1,100,000 USD 1,095,715 1,210,000 0.14 Woori Bank FRN 2/5/2037 3,400,000 USD 3,096,867 2,618,000 0.30
200,085,555 206,907,417 23.92
ThailandBangkok Bank PCL (Hong Kong) 9.025% 15/3/2029 1,150,000 USD 1,293,052 1,276,500 0.15 IRPC PCL 6.375% 25/5/2017 3,000,000 USD 3,027,799 2,997,119 0.35 PTT Chemical PCL 5.5% 24/6/2015 "0311" 2,000,000 USD 1,983,946 2,040,191 0.23 Thai Oil PCL 5.1% 9/6/2015 2,000,000 USD 1,930,233 2,040,338 0.24
8,235,030 8,354,148 0.97
Total Bonds 753,527,142 784,500,863 90.71
SECURITISED ASSETS
Cayman IslandsStart CLO Ltd FRN 7/6/2011 "2006-3X D" 4,250,000 USD 4,250,000 4,103,800 0.48 Start CLO Ltd FRN 26/12/2011 "2007-4X D" 2,700,000 USD 2,700,000 2,438,910 0.28
6,950,000 6,542,710 0.76
LuxembourgMerrill Lynch SA FRN 3/8/2011 "EMTN" 4,000,000 USD 4,000,000 4,000,000 0.46
Total Securitised Assets 10,950,000 10,542,710 1.22
Total Transferable Securities Admitted to an Official Stock Exchange Listing
or Dealt in on Another Regulated Market 764,477,142 795,043,573 91.93
Unlisted Securities
BONDS
IndonesiaBumi Capital Pte Ltd 12% 10/11/2016 2,500,000 USD 2,500,000 2,506,250 0.29
MalaysiaTenaga Nasional BHD 7.5% 1/11/2025 6,000,000 USD 6,911,791 6,788,193 0.79 YTL Power International BHD 3% 18/4/2013 12,000,000 MYR 3,604,746 3,378,853 0.39
10,516,537 10,167,046 1.18
ThailandCIMB Thai Bank PCL FRN 17/7/2016 "EMTN" 6,000,000 USD 6,000,000 5,402,160 0.62 Kasikornbank PCL 8.25% 21/8/2016 2,550,000 USD 2,704,172 2,703,000 0.31
8,704,172 8,105,160 0.93
Total Bonds 21,720,709 20,778,456 2.40
Quantity/ Aquisition % net
Description Nominal Currency cost Evaluation assets

98 The accompanying notes form an integral part of these financial statements.
INTERNATIONAL OPPORTUNITIES FUNDS
ASIAN BOND (continued)
Statement of Investment as at December 31, 2009
(expressed in USD)
Quantity/ Aquisition % net
Description Nominal Currency cost Evaluation assets
SECURITISED ASSETS
LuxembourgMerrill Lynch SA FRN 20/12/2013 "EMTN" 5,000,000 USD 5,000,000 4,787,500 0.55
Total Securitised Assets 5,000,000 4,787,500 0.55
Total Unlisted Securities 26,720,709 25,565,956 2.95
Total Investments 791,197,851 820,609,529 94.88
Other Net Assets 44,248,747 5.12
Total Net Assets 864,858,276 100.00

The accompanying notes form an integral part of these financial statements. 99
INTERNATIONAL OPPORTUNITIES FUNDS
ASIAN DYNAMIC
Statement of Investment as at December 31, 2009
(expressed in USD)
Quantity/ Aquisition % net
Description Nominal Currency cost Evaluation assets
Transferable Securities Admitted to an Official Stock Exchange Listingor Dealt in on Another Regulated Market
SHARES
AustraliaMacquarie Group Ltd 5,367 AUD 250,812 233,113 2.69
ChinaBank of China Ltd "H" 606,000 HKD 311,050 328,239 3.80 China Communications Services Corp., Ltd "H" 362,000 HKD 226,758 178,336 2.06 China Pacific Insurance Group Co., Ltd "H" 38,800 HKD 141,475 154,617 1.79 China Petroleum & Chemical Corp. "H" 192,000 HKD 169,979 171,099 1.98 China Shanshui Cement Group Ltd 347,000 HKD 178,554 253,288 2.93 China Zhongwang Holdings Ltd 164,000 HKD 149,623 131,976 1.53 Focus Media Holding Ltd – ADR 23,100 USD 341,462 359,667 4.16 Ping An Insurance Group Company of China Ltd "H" 25,000 HKD 101,652 219,239 2.54
1,620,553 1,796,461 20.79
Hong KongChina Merchants Holdings International Co., Ltd 48,330 HKD 179,507 157,379 1.82 China Resources Land Ltd 40,000 HKD 74,264 90,997 1.05 China Unicom Hong Kong Ltd 176,000 HKD 232,826 233,332 2.70 CNOOC Ltd 154,000 HKD 124,830 242,297 2.81 Dah Sing Financial Holdings Ltd 28,800 HKD 112,569 159,709 1.85 Henderson Land Development Co., Ltd 35,000 HKD 111,942 263,602 3.05 Li & Fung Ltd 74,000 HKD 198,289 307,772 3.56 Techtronic Industries Co. 61,000 HKD 74,097 51,056 0.59
1,108,324 1,506,144 17.43
IndiaHindalco Industries Ltd 85,843 INR 266,221 296,720 3.43 IVRCL Infrastructures & Projects Ltd 13,185 INR 63,199 99,380 1.15 LIC Housing Finance Ltd 14,008 INR 191,488 241,660 2.80 MAX India Ltd 68,501 INR 289,126 326,865 3.78 OnMobile Global Ltd 27,247 INR 230,901 265,034 3.07 Sun TV Network Ltd 35,231 INR 159,081 260,286 3.01
1,200,016 1,489,945 17.24
MalaysiaTanjong PLC 36,500 MYR 133,906 179,515 2.07
PhilippinesMetropolitan Bank & Trust 252,200 PHP 214,427 245,490 2.84
SingaporeDBS Group Holdings Ltd 21,000 SGD 212,671 230,620 2.67
South KoreaKorea Electric Power Corp. 6,590 KRW 162,113 192,979 2.23 KT Corp. 7,240 KRW 232,580 243,100 2.81 POSCO 583 KRW 269,728 309,405 3.58 S1 Corp. (Korea) 4,200 KRW 179,685 174,929 2.02 Samsung Electronics Co., Ltd 371 KRW 222,694 254,560 2.95 Shinsegae Co., Ltd 459 KRW 242,669 211,669 2.45 SK Energy Co., Ltd 2,172 KRW 169,488 219,163 2.54
1,478,957 1,605,805 18.58

100 The accompanying notes form an integral part of these financial statements.
INTERNATIONAL OPPORTUNITIES FUNDS
ASIAN DYNAMIC (continued)
Statement of Investment as at December 31, 2009
(expressed in USD)
TaiwanAcer, Inc. 97,970 TWD 130,920 294,660 3.41 Delta Electronics, Inc. 89,760 TWD 225,504 280,631 3.25 Powertech Technology, Inc. 94,500 TWD 207,463 320,564 3.71 Taiwan Cement Corp. 153,520 TWD 221,623 163,191 1.89 Taiwan Semiconductor Manufacturing Co., Ltd 111,554 TWD 190,736 224,956 2.60
976,246 1,284,002 14.86
Total Investments 7,195,912 8,571,095 99.17
Other Net Assets 71,306 0.83
Total Net Assets 8,642,401 100.00
Quantity/ Aquisition % net
Description Nominal Currency cost Evaluation assets

The accompanying notes form an integral part of these financial statements. 101
INTERNATIONAL OPPORTUNITIES FUNDS
ASIAN EQUITY
Statement of Investment as at December 31, 2009
(expressed in USD)
Transferable Securities Admitted to an Official Stock Exchange Listingor Dealt in on Another Regulated Market
SHARES
Cayman IslandsHengan International Group Co., Ltd 2,510,000 HKD 7,946,900 18,645,079 2.26 Shanda Games Ltd – ADR 1,207,558 USD 13,729,925 12,341,243 1.50
21,676,825 30,986,322 3.76
ChinaAAC Acoustic Technologies Holdings, Inc. 12,714,000 HKD 13,690,296 21,020,268 2.55 Bank of China Ltd "H" 44,539,000 HKD 24,619,571 24,124,469 2.92 China Construction Bank Corp. "H" 9,241,000 HKD 7,375,298 7,949,006 0.96 China Pacific Insurance Group Co., Ltd "H" 2,971,800 HKD 10,835,949 11,842,573 1.44 China Petroleum & Chemical Corp. "H" 9,156,000 HKD 10,151,582 8,159,280 0.99 China Shanshui Cement Group Ltd 15,593,000 HKD 10,877,730 11,381,883 1.38 China Zhongwang Holdings Ltd 13,845,600 HKD 14,075,661 11,142,032 1.35 Longfor Properties Co., Ltd 441,000 HKD 406,362 497,639 0.06 Ping An Insurance Group Company of China Ltd "H" 2,255,000 HKD 10,049,229 19,775,318 2.40 RREEF China Commercial Trust – REIT 8,195,000 HKD 5,452,495 3,424,223 0.42 Shui On Land Ltd 8,222,300 HKD 5,815,201 4,877,746 0.59 Sohu.com, Inc. 241,800 USD 11,606,975 13,896,246 1.68
124,956,349 138,090,683 16.74
Hong KongChina Mobile Ltd 2,511,500 HKD 24,384,653 23,595,585 2.86 China Unicom Hong Kong Ltd 10,074,408 HKD 17,087,158 13,356,131 1.62 CNOOC Ltd 13,699,000 HKD 11,359,592 21,553,446 2.61 Franshion Properties China Ltd 3,928,000 HKD 1,244,246 1,388,002 0.17 Hang Seng Bank Ltd 1,087,000 HKD 12,704,648 16,079,072 1.95 Henderson Land Development Co., Ltd 2,877,000 HKD 12,421,649 21,668,095 2.62 Huabao International Holdings Ltd 10,213,000 HKD 8,718,059 11,024,193 1.34 Hutchison Whampoa Ltd 2,923,000 HKD 15,692,474 20,129,736 2.44 Wharf Holdings Ltd 3,749,500 HKD 16,160,952 21,638,862 2.62
119,773,431 150,433,122 18.23
IndiaAditya Birla Nuvo Ltd 213,554 INR 7,661,685 4,016,615 0.49 GVK Power & Infrastructure Ltd 12,731,536 INR 11,501,310 12,708,285 1.54 Hindalco Industries Ltd 2,860,829 INR 8,110,344 9,888,567 1.20 ICICI Bank Ltd 1,091,030 INR 11,286,391 20,561,590 2.49 Infrastructure Development Finance Co., Ltd 2,442,927 INR 7,416,375 8,100,220 0.98 IVRCL Infrastructures & Projects Ltd 871,681 INR 6,689,907 6,570,156 0.80 Sterlite Industries India Ltd 939,866 INR 10,576,996 17,441,099 2.11 Suzlon Energy Ltd 4,439,529 INR 12,270,816 8,619,567 1.04 Tata Power Co., Ltd 326,576 INR 9,042,599 9,694,822 1.18 Unitech Ltd 5,133,258 INR 5,156,576 9,078,484 1.10
89,712,999 106,679,405 12.93
IndonesiaAstra International Tbk PT 2,479,500 IDR 3,522,249 9,157,918 1.11 Bakrie and Brothers Tbk PT 296,826,000 IDR 16,714,862 2,685,493 0.33 Bank Rakyat Indonesia 13,814,500 IDR 7,907,097 11,248,634 1.36 Telekomunikasi Indonesia Tbk PT 12,482,000 IDR 8,566,631 12,555,071 1.52
36,710,839 35,647,116 4.32
MalaysiaAMMB Holdings BHD 6,323,900 MYR 7,521,323 9,234,662 1.12 Axiata Group BHD 10,173,425 MYR 5,483,891 9,062,188 1.10
13,005,214 18,296,850 2.22
Quantity/ Aquisition % net
Description Nominal Currency cost Evaluation assets

102 The accompanying notes form an integral part of these financial statements.
INTERNATIONAL OPPORTUNITIES FUNDS
ASIAN EQUITY (continued)
Statement of Investment as at December 31, 2009
(expressed in USD)
PhilippinesMetropolitan Bank & Trust 10,098,800 PHP 10,129,020 9,830,109 1.19
SingaporeARA Asset Management Ltd 10,599,000 SGD 9,028,429 6,575,692 0.80 DBS Group Holdings Ltd 1,117,000 SGD 8,223,260 12,266,798 1.49 SembCorp Industries Ltd 4,213,000 SGD 8,118,763 11,116,051 1.35 Yanlord Land Group Ltd 6,222,000 SGD 12,019,891 9,628,244 1.16
37,390,343 39,586,785 4.80
South KoreaKangwon Land, Inc. 604,220 KRW 6,131,087 8,561,480 1.04 KB Financial Group, Inc. 395,473 KRW 9,805,326 20,275,005 2.46 Korea Electric Power Corp. 577,580 KRW 13,915,183 16,913,610 2.05 LG Dacom Corp. 3,600 KRW 83,221 55,029 0.01 POSCO 19,483 KRW 6,348,862 10,339,847 1.25 S1 Corp. (Korea) 236,504 KRW 14,733,852 9,850,313 1.19 Samsung Electronics Co., Ltd 34,411 KRW 15,945,384 23,610,972 2.86 Samsung Fire & Marine Insurance Co., Ltd 95,088 KRW 15,254,224 16,290,650 1.97 Shinsegae Co., Ltd 45,526 KRW 19,370,772 20,994,405 2.55
101,587,911 126,891,311 15.38
TaiwanDelta Electronics, Inc. 834,680 TWD 1,509,758 2,609,597 0.31 Far Eastern Textile Co., Ltd 8,970,160 TWD 9,495,160 11,217,955 1.36 HON HAI Precision Industry Co., Ltd 5,694,733 TWD 19,577,143 26,973,637 3.27 Lite-On Technology Corp. 5,035,000 TWD 5,746,422 7,563,910 0.92 MediaTek, Inc. 1,001,171 TWD 10,528,705 17,466,101 2.12 Powertech Technology, Inc. 3,083,150 TWD 6,372,190 10,458,705 1.27 Taiwan Cement Corp. 12,631,160 TWD 16,869,758 13,426,897 1.63 Taiwan Semiconductor Manufacturing Co., Ltd 8,370,808 TWD 14,934,658 16,880,317 2.04 Wistron Corp. 2,699,114 TWD 2,639,408 5,240,423 0.63 Yuanta Financial Holding Co., Ltd 16,488,660 TWD 10,412,023 12,114,534 1.47
98,085,225 123,952,076 15.02
ThailandBangkok Bank PCL 5,020,400 THB 12,555,036 17,542,790 2.12 PTT PCL (Foreign Market) 970,600 THB 6,551,798 7,161,596 0.87
19,106,834 24,704,386 2.99
Total Investments 672,134,990 805,098,165 97.58
Other Net Assets 19,931,030 2.42
Total Net Assets 825,029,195 100.00
Quantity/ Aquisition % net
Description Nominal Currency cost Evaluation assets

The accompanying notes form an integral part of these financial statements. 103
INTERNATIONAL OPPORTUNITIES FUNDS
ASIAN EQUITY INCOME
Statement of Investment as at December 31, 2009
(expressed in USD)
Quantity/ Aquisition % net
Description Nominal Currency cost Evaluation assets
Transferable Securities Admitted to an Official Stock Exchange Listingor Dealt in on Another Regulated Market
SHARES
AustraliaAmcor Ltd (Australia) 14,024 AUD 74,125 78,406 1.29 AMP Ltd 12,199 AUD 74,434 74,114 1.22 Australia & New Zealand Banking Group Ltd 11,141 AUD 173,969 228,754 3.76 CFS Retail Property Trust – REIT 47,047 AUD 79,851 80,219 1.32 Commonwealth Bank of Australia 3,413 AUD 104,566 167,997 2.76 Crown Ltd 8,779 AUD 52,789 63,342 1.04 Dexus Property Group – REIT 93,098 AUD 68,640 71,015 1.17 Foster's Group Ltd 21,655 AUD 88,517 106,883 1.76 Macquarie Group Ltd 3,215 AUD 102,487 139,642 2.30 Metcash Ltd 19,869 AUD 72,693 79,703 1.31 National Australia Bank Ltd 5,278 AUD 105,315 129,780 2.13 Orica Ltd 5,339 AUD 75,562 124,812 2.05 Origin Energy Ltd 8,789 AUD 115,053 132,665 2.18 QBE Insurance Group Ltd 7,551 AUD 132,930 173,474 2.85 SP AusNet 72,978 AUD 61,735 59,924 0.99 Suncorp-Metway Ltd 15,916 AUD 132,245 124,120 2.04 Telstra Corp., Ltd 21,391 AUD 60,469 65,844 1.08 Westpac Banking Corp. 6,733 AUD 102,872 152,869 2.51 Woolworths Ltd 4,346 AUD 111,833 109,204 1.80
1,790,085 2,162,767 35.56
ChinaAnhui Expressway Co. "H" 88,000 HKD 58,950 61,284 1.01 Bank of China Ltd "H" 382,000 HKD 143,908 206,910 3.40 China Petroleum & Chemical Corp. "H" 162,000 HKD 135,428 144,365 2.37 Industrial & Commercial Bank of China "H" 232,000 HKD 152,985 192,682 3.17 PetroChina Co., Ltd "H" 98,000 HKD 98,386 117,790 1.94 Shenzhen Chiwan Wharf Holdings Ltd "B" 9,362 HKD 16,192 15,587 0.25
605,849 738,618 12.14
Hong KongBOC Hong Kong Holdings Ltd 20,000 HKD 50,473 45,395 0.75 Cheung Kong Holdings Ltd 8,000 HKD 104,310 103,481 1.70 Cheung Kong Infrastructure Holdings Ltd 14,000 HKD 53,420 53,352 0.88 China Merchants Holdings International Co., Ltd 16,000 HKD 46,296 52,101 0.86 China Mobile Ltd 18,000 HKD 178,061 169,110 2.78 CNOOC Ltd 62,000 HKD 72,536 97,548 1.60 Hang Seng Bank Ltd 8,700 HKD 131,306 128,692 2.11 Hutchison Whampoa Ltd 12,000 HKD 69,256 82,640 1.36 Li & Fung Ltd 24,000 HKD 83,676 99,818 1.64 Link REIT (The) – REIT 39,698 HKD 86,139 101,471 1.67 Wharf Holdings Ltd 10,000 HKD 31,450 57,711 0.95 Yue Yuen Industrial Holdings Ltd 8,000 HKD 21,280 23,214 0.38
928,203 1,014,533 16.68
IndiaGAIL India Ltd 6,047 INR 41,870 53,706 0.88 Oil India Ltd 2,081 INR 51,784 55,537 0.92
93,654 109,243 1.80
IndonesiaBank Rakyat Indonesia 69,500 IDR 43,451 56,591 0.93 Telekomunikasi Indonesia Tbk PT 48,500 IDR 39,204 48,784 0.80
82,655 105,375 1.73

104 The accompanying notes form an integral part of these financial statements.
INTERNATIONAL OPPORTUNITIES FUNDS
ASIAN EQUITY INCOME (continued)
Statement of Investment as at December 31, 2009
(expressed in USD)
MalaysiaBerjaya Sports Toto BHD 27,657 MYR 32,683 35,137 0.58 Tanjong PLC 5,800 MYR 22,801 28,526 0.47
55,484 63,663 1.05
SingaporeCapitaCommercial Trust – REIT 93,000 SGD 53,814 77,594 1.28 DBS Group Holdings Ltd 10,000 SGD 88,667 109,819 1.81 Fortune Real Estate Investment Trust – REIT 156,000 HKD 49,870 62,970 1.03 Macquarie International Infrastructure Fund Ltd 47,420 SGD 29,616 15,386 0.25 SembCorp Industries Ltd 22,000 SGD 38,045 58,047 0.95 StarHub Ltd 41,000 SGD 78,034 62,861 1.03 United Overseas Bank Ltd 6,000 SGD 71,132 84,290 1.39
409,178 470,967 7.74
South KoreaHyundai Mipo Dockyard 272 KRW 24,290 24,059 0.40 KT&G Corp. 1,169 KRW 62,276 64,650 1.06 Macquarie Korea Infrastructure Fund 8,489 KRW 42,449 35,721 0.59 Samsung Fire & Marine Insurance Co., Ltd 490 KRW 90,794 83,948 1.38 SK Telecom Co., Ltd 323 KRW 45,049 47,016 0.77
264,858 255,394 4.20
TaiwanAcer, Inc. 44,130 TWD 85,829 132,728 2.18 China Steel Corp. 111,000 TWD 103,493 114,522 1.88 Chunghwa Telecom Co., Ltd 19,419 TWD 40,115 36,124 0.59 Delta Electronics, Inc. 25,906 TWD 70,191 80,994 1.33 Lite-On Technology Corp. 50,000 TWD 61,562 75,113 1.24 Quanta Computer, Inc. 25,300 TWD 31,254 55,053 0.91 Taiwan Cement Corp. 45,000 TWD 45,194 47,835 0.79 Taiwan Mobile Co., Ltd 20,000 TWD 38,469 39,018 0.64 Taiwan Semiconductor Manufacturing Co., Ltd 114,996 TWD 208,885 231,897 3.81
684,992 813,284 13.37
ThailandAdvanced Info Service PCL (Foreign Market) 18,300 THB 48,404 47,479 0.78 Bangkok Bank PCL 8,300 THB 28,594 29,003 0.48 Bangkok Expressway PCL (Foreign Market) 46,900 THB 30,805 29,260 0.48 Electricity Generating PCL (Foreign Market) 8,200 THB 17,314 19,492 0.32
125,117 125,234 2.06
Total Investments 5,040,075 5,859,078 96.33
Other Net Assets 223,218 3.67
Total Net Assets 6,082,296 100.00
Quantity/ Aquisition % net
Description Nominal Currency cost Evaluation assets

The accompanying notes form an integral part of these financial statements. 105
INTERNATIONAL OPPORTUNITIES FUNDS
ASIAN INFRASTRUCTURE EQUITY
Statement of Investment as at December 31, 2009
(expressed in USD)
Quantity/ Aquisition % net
Description Nominal Currency cost Evaluation assets
Transferable Securities Admitted to an Official Stock Exchange Listingor Dealt in on Another Regulated Market
SHARES
ChinaChina Petroleum & Chemical Corp. "H" 4,082,000 HKD 4,540,929 3,637,634 3.68 China Railway Group Ltd "H" 4,170,000 HKD 3,546,861 3,248,187 3.28 China Shenhua Energy Co., Ltd "H" 593,500 HKD 3,409,887 2,908,522 2.94 China Zhongwang Holdings Ltd 2,074,000 HKD 2,214,240 1,669,019 1.69 Guangshen Railway Co., Ltd "H" 4,026,000 HKD 1,920,296 1,645,891 1.66 Jiangsu Expressway Co., Ltd "H" 3,166,000 HKD 3,451,918 2,825,433 2.85 Sinotruk Hong Kong Ltd 2,291,500 HKD 2,472,800 2,680,373 2.71
21,556,931 18,615,059 18.81
Hong KongCheung Kong Infrastructure Holdings Ltd 460,000 HKD 1,794,740 1,753,006 1.77 China Merchants Holdings International Co., Ltd 444,000 HKD 774,020 1,445,814 1.46 China Mobile Ltd 470,500 HKD 5,376,443 4,420,355 4.47 China Resources Power Holdings Co., Ltd 1,095,600 HKD 3,406,359 2,181,561 2.20 CNOOC Ltd 1,832,000 HKD 3,129,773 2,882,394 2.91 Hong Kong & China Gas Co., Ltd 1,044,900 HKD 2,477,970 2,627,710 2.65 MTR Corp. 711,665 HKD 2,218,276 2,459,679 2.49 NWS Holdings Ltd 792,546 HKD 2,067,483 1,461,600 1.48
21,245,064 19,232,119 19.43
IndiaBharat Heavy Electricals Ltd 48,032 INR 2,280,694 2,480,613 2.50 Bharti Airtel Ltd 287,641 INR 2,797,346 2,038,243 2.06 GAIL India Ltd – GDR 46,632 USD 1,874,156 2,471,496 2.50 NTPC Ltd 437,771 INR 2,208,480 2,216,843 2.24 Reliance Industries Ltd 153,378 INR 3,916,441 3,594,422 3.63 Sterlite Industries India Ltd 105,000 INR 1,477,189 1,948,486 1.97
14,554,306 14,750,103 14.90
IndonesiaIndosat Tbk PT 1,762,000 IDR 1,011,646 886,157 0.89 Telekomunikasi Indonesia Tbk PT 2,438,000 IDR 1,849,323 2,452,272 2.48
2,860,969 3,338,429 3.37
MalaysiaPLUS Expressways BHD 2,106,600 MYR 1,955,222 2,005,699 2.03 Tenaga Nasional BHD 699,200 MYR 1,886,350 1,715,326 1.73
3,841,572 3,721,025 3.76
PhilippinesEnergy Development Corp. (Philippines) 18,417,500 PHP 2,228,731 1,872,426 1.89 Manila Water Co., Inc. 5,422,800 PHP 1,866,735 1,847,482 1.87
4,095,466 3,719,908 3.76
SingaporeSembCorp Industries Ltd 992,000 SGD 3,751,357 2,617,404 2.65

106 The accompanying notes form an integral part of these financial statements.
INTERNATIONAL OPPORTUNITIES FUNDS
ASIAN INFRASTRUCTURE EQUITY (continued)
Statement of Investment as at December 31, 2009
(expressed in USD)
South KoreaHanjin Shipping Co., Ltd 62,729 KRW 1,111,524 1,054,138 1.06 Hyundai Engineering & Construction Co., Ltd 27,129 KRW 1,185,070 1,651,771 1.67 Korea Electric Power Corp. 111,790 KRW 4,599,062 3,273,611 3.31 KT Corp. 51,520 KRW 1,458,907 1,729,906 1.75 Macquarie Korea Infrastructure Fund 599,332 KRW 3,961,221 2,521,932 2.55 POSCO 6,332 KRW 2,308,821 3,360,463 3.40 S1 Corp. (Korea) 31,475 KRW 1,874,493 1,310,923 1.32
16,499,098 14,902,744 15.06
TaiwanChina Steel Corp. 2,141,060 TWD 2,966,068 2,209,003 2.23 Chunghwa Telecom Co., Ltd 1,299,030 TWD 2,395,733 2,416,516 2.44 Far EasTone Telecommunications Co., Ltd 1,272,188 TWD 1,886,455 1,517,397 1.53 Formosa Plastics Corp. 678,000 TWD 1,378,863 1,426,587 1.44 Taiwan Secom Co., Ltd 769,000 TWD 1,473,611 1,293,487 1.31
10,100,730 8,862,990 8.95
ThailandAdvanced Info Service PCL (Foreign Market) 453,400 THB 1,186,218 1,176,338 1.19 Banpu PCL (Foreign Market) 140,000 THB 1,342,907 2,427,115 2.45 Siam Cement PCL (Foreign Market) 339,400 THB 2,534,577 2,433,011 2.46 Thai Tap Water Supply PCL (Foreign Market) 11,638,200 THB 1,623,153 1,556,880 1.57
6,686,855 7,593,344 7.67
Total Investments 105,192,348 97,353,125 98.36
Other Net Assets 1,624,310 1.64
Total Net Assets 98,977,435 100.00
Quantity/ Aquisition % net
Description Nominal Currency cost Evaluation assets

The accompanying notes form an integral part of these financial statements. 107
INTERNATIONAL OPPORTUNITIES FUNDS
ASIAN LOCAL BOND
Statement of Investment as at December 31, 2009
(expressed in USD)
Quantity/ Aquisition % net
Description Nominal Currency cost Evaluation assets
Transferable Securities Admitted to an Official Stock Exchange Listingor Dealt in on Another Regulated Market
BONDS
AustraliaWestpac Banking Corp. 4.08% 10/12/2019 "EMTN" 10,000,000 HKD 1,288,238 1,257,862 0.25
BermudaBW Group Ltd 6.625% 28/6/2017 3,000,000 USD 2,663,322 2,655,570 0.52 Noble Group Ltd 6.75% 29/1/2020 1,200,000 USD 1,189,449 1,233,237 0.24
3,852,771 3,888,807 0.76
British Virgin IslandsCLP Power Hong Kong Financing Ltd 3.88% 5/8/2019 "EMTN" 10,000,000 HKD 1,290,007 1,262,352 0.25 CLP Power Hong Kong Financing Ltd 4.38% 11/1/2017 "MTN" 10,000,000 HKD 1,290,743 1,335,296 0.26 CLP Power Hong Kong Financing Ltd 4.75% 18/1/2016 "EMTN" 5,000,000 HKD 663,354 685,988 0.13 CLP Power Hong Kong Financing Ltd 4.75% 18/8/2023 "EMTN" 10,000,000 HKD 1,360,889 1,351,306 0.27 Hysan MTN Ltd 5.25% 11/8/2015 "EMTN" 20,000,000 HKD 2,641,649 2,778,568 0.54
7,246,642 7,413,510 1.45
Cayman IslandsAgile Property Holdings Ltd 10% 14/11/2016 3,400,000 USD 3,318,886 3,455,077 0.68 Cheung Kong Bond Finance Ltd 3.48% 22/4/2013 "EMTn" 10,000,000 HKD 1,283,262 1,329,836 0.26 DBS Capital Funding Corp. FRN Perpetual 1,000,000 USD 897,398 1,021,667 0.20 Sun Hung Kai Properties Capital Market Ltd 3.1% 24/7/2014 "MTN" 10,000,000 HKD 1,274,413 1,294,797 0.25 Sun Hung Kai Properties Capital Market Ltd 5.15% 13/8/2018 3,000,000 HKD 401,252 415,460 0.08 Swire Pacific MTN Financing Ltd 4.93% 28/3/2013 "EMTN" 20,000,000 HKD 2,597,040 2,755,717 0.54 UOB Cayman Ltd FRN Perpetual 2,000,000 USD 1,565,003 1,803,500 0.35
11,337,254 12,076,054 2.36
Hong KongAirport Authority Hong Kong 2.2% 9/4/2014 20,000,000 HKD 2,538,236 2,539,844 0.50 Bank of East Asia Ltd FRN 22/6/2017 2,000,000 USD 1,740,132 1,804,300 0.35 Cathay Pacific Airways Ltd FRN 9/11/2011 "MTN" 1,000,000 SGD 643,931 689,186 0.13 HKCG Finance Ltd 3.9% 3/6/2019 "EMTN" 10,000,000 HKD 1,266,183 1,259,947 0.25 HKCG Finance Ltd 4.25% 3/6/2024 "EMTN" 10,000,000 HKD 1,290,091 1,250,542 0.24 HKCG Finance Ltd 4.72% 23/9/2039 "MTN" 2,000,000 HKD 258,061 243,355 0.05 Hong Kong Government Bond 1.61% 10/12/2018 30,000,000 HKD 3,723,630 3,596,931 0.70 Hong Kong Government Bond 1.67% 19/12/2013 6,000,000 HKD 775,938 777,575 0.15 Hong Kong Government Bond 1.67% 24/3/2014 20,000,000 HKD 2,585,239 2,582,372 0.51 Hong Kong Government Bond 1.73% 20/2/2024 5,000,000 HKD 641,515 581,434 0.11 Hong Kong Government Bond 2.03% 18/3/2013 18,500,000 HKD 2,349,803 2,446,670 0.48 Hong Kong Government Bond 2.46% 23/6/2014 5,000,000 HKD 658,361 664,873 0.13 Hong Kong Government Bond 2.6% 20/8/2024 "15Y2408" 3,000,000 HKD 397,129 388,633 0.08 Hong Kong Government Bond 2.64% 10/6/2019 "10Y1906" 5,000,000 HKD 624,951 650,945 0.13 Hong Kong Government Bond 2.88% 17/6/2013 10,000,000 HKD 1,290,223 1,357,216 0.27 Hong Kong Government Bond 3.27% 28/8/2023 5,000,000 HKD 649,299 697,050 0.14 Hong Kong Government Bond 3.51% 8/12/2014 "1412" 5,000,000 HKD 692,924 693,245 0.14 Hong Kong Government Bond 3.52% 5/12/2017 40,000,000 HKD 5,207,531 5,565,048 1.09 Hong Kong Government Bond 3.56% 25/6/2018 10,000,000 HKD 1,278,705 1,397,710 0.27 Hong Kong Government Bond 3.73% 5/6/2013 "1306" 14,000,000 HKD 1,815,078 1,951,197 0.38 Hong Kong Government Bond 4.85% 27/6/2017 15,000,000 HKD 2,111,536 2,258,673 0.44 Hong Kong Government Bond Programme 2.07% 3/11/2014 "05GB1411" 10,000,000 HKD 1,298,419 1,295,829 0.25 Urban Renewal Authority 2.08% 27/7/2012 "MTN" 10,000,000 HKD 1,289,212 1,299,591 0.25
35,126,127 35,992,166 7.04
IndiaICICI Bank Ltd 3.92% 15/2/2012 "EMTN" 5,000,000 SGD 3,263,698 3,524,874 0.69

108 The accompanying notes form an integral part of these financial statements.
INTERNATIONAL OPPORTUNITIES FUNDS
ASIAN LOCAL BOND (continued)
Statement of Investment as at December 31, 2009
(expressed in USD)
IndonesiaAdaro Indonesia PT 7.625% 22/10/2019 1,000,000 USD 983,490 990,808 0.19 Excelcomindo Pratama PT 10.35% 26/4/2012 "II" 2,000,000,000 IDR 180,438 210,429 0.04 Indonesia Recapitalization Bond 13.15% 15/1/2012 "FR17" 15,000,000,000 IDR 1,697,560 1,748,917 0.34 Indonesia Treasury Bond 9% 15/9/2013 "FR49" 17,868,000,000 IDR 1,841,174 1,912,669 0.38 Indonesia Treasury Bond 9% 15/9/2018 "FR48" 30,000,000,000 IDR 2,994,405 3,028,681 0.59 Indonesia Treasury Bond 9.5% 15/6/2015 "FR27" 71,500,000,000 IDR 7,437,412 7,733,065 1.51 Indonesia Treasury Bond 9.5% 15/7/2023 "FR46" 6,000,000,000 IDR 493,254 588,360 0.12 Indonesia Treasury Bond 10% 15/7/2017 "FR28" 22,000,000,000 IDR 1,859,294 2,397,461 0.47 Indonesia Treasury Bond 10% 15/9/2024 "FR44" 28,900,000,000 IDR 2,447,517 2,926,821 0.57 Indonesia Treasury Bond 10% 15/2/2028 "FR47" 24,500,000,000 IDR 2,101,740 2,455,807 0.48 Indonesia Treasury Bond 10.25% 15/7/2022 "FR43" 21,000,000,000 IDR 1,640,582 2,188,551 0.43 Indonesia Treasury Bond 10.25% 15/7/2027 "FR42" 22,000,000,000 IDR 2,365,160 2,260,799 0.44 Indonesia Treasury Bond 10.75% 15/5/2016 "FR30" 18,000,000,000 IDR 1,838,582 2,046,930 0.40 Indonesia Treasury Bond 11% 15/12/2012 "FR23" 15,000,000,000 IDR 1,252,994 1,707,097 0.33 Indonesia Treasury Bond 11% 15/10/2014 "FR26" 34,500,000,000 IDR 3,840,804 3,950,259 0.77 Indonesia Treasury Bond 11% 15/11/2020 "FR31" 19,000,000,000 IDR 1,811,158 2,121,795 0.42 Indonesia Treasury Bond 11% 15/9/2025 "FR40" 25,800,000,000 IDR 2,398,726 2,814,951 0.55 Indonesia Treasury Bond 11.25% 15/5/2014 "FR51" 5,000,000,000 IDR 524,844 577,569 0.11 Indonesia Treasury Bond 11.5% 15/9/2019 "FR36" 13,000,000,000 IDR 1,049,941 1,503,107 0.30 Indonesia Treasury Bond 11.6% 15/8/2018 "FR38" 20,000,000,000 IDR 1,557,721 2,340,543 0.46 Indonesia Treasury Bond 11.75% 15/8/2023 "FR39" 25,000,000,000 IDR 2,731,774 2,870,830 0.56 Indonesia Treasury Bond 12% 15/9/2011 "FR22" 12,000,000,000 IDR 1,312,132 1,368,561 0.27 Indonesia Treasury Bond 12.5% 15/3/2013 "FR33" 73,000,000,000 IDR 8,249,066 8,624,295 1.69 Indonesia Treasury Bond 12.8% 15/6/2021 "FR34" 40,000,000,000 IDR 4,627,151 4,941,977 0.97
57,236,919 63,310,282 12.39
MalaysiaMalaysia Government Bond 3.461% 31/7/2013 "0108" 4,000,000 MYR 1,173,206 1,169,392 0.23 Malaysia Government Bond 3.741% 27/2/2015 "0409" 4,000,000 MYR 1,185,501 1,164,719 0.23 Malaysia Government Bond 3.814% 15/2/2017 "0207" 5,000,000 MYR 1,491,099 1,425,671 0.28 Malaysia Government Bond 4.24% 7/2/2018 "2/03" 8,500,000 MYR 2,459,127 2,481,234 0.48 Malaysia Government Bond 4.378% 29/11/2019 "0902" 5,000,000 MYR 1,422,153 1,469,041 0.29 Malaysia Government Bond 4.72% 30/9/2015 "2/05" 930,000 MYR 253,562 283,156 0.05 Malaysia Government Bond 5.094% 30/4/2014 "2/04" 22,700,000 MYR 6,683,284 6,977,727 1.37 Malaysia Government Bond 5.248% 15/9/2028 "0308" 8,000,000 MYR 2,351,178 2,453,270 0.48 Malaysia Government Bond 5.734% 30/7/2019 "3/04" 6,000,000 MYR 1,920,823 1,975,758 0.39 Malaysia Government Investment Issue 3.902% 30/12/2014 "0309" 13,000,000 MYR 3,671,707 3,806,219 0.74 Penerbangan Malaysia Berhad 3.85% 14/3/2014 "IMTN" 5,000,000 MYR 1,352,998 1,458,191 0.28 Pengurusan Air SPV BHD 5.05% 5/11/2019 "IMTN" 10,000,000 MYR 2,925,254 2,919,736 0.57 Putrajaya Holdings Sdn BHD 5.6% 13/7/2018 "IMTN" 5,000,000 MYR 1,622,770 1,514,485 0.30 SBB Capital Corp. FRN Perpetual 2,000,000 USD 1,480,981 1,692,280 0.33
29,993,643 30,790,879 6.02
NetherlandsIndo Integrated Energy BV 9% 1/6/2012 3,600,000 USD 3,251,435 3,651,000 0.72 Lippo Karawaci Finance BV 8.875% 9/3/2011 1,000,000 USD 942,554 987,190 0.19 Majapahit Holding BV 8% 7/8/2019 2,000,000 USD 1,999,940 2,109,600 0.41 Matahari International Finance Company BV 10.75% 7/8/2012 1,050,000 USD 1,054,003 1,095,234 0.22 Media Nusantara Citra BV 10.75% 12/9/2011 851,190 USD 783,188 783,095 0.15
8,031,120 8,626,119 1.69
PeruCFG Investment SAC 9.25% 19/12/2013 2,500,000 USD 2,485,293 2,481,250 0.49
PhilippinesNational Power Corp. 5.875% 19/12/2016 150,000,000 PHP 3,036,437 3,017,359 0.59 Philippine Government Bond 5.5% 21/2/2010 "3-16" 6,534 PHP 137 142 0.00 Philippine Government Bond 5.75% 21/2/2012 "5-65" 104,000,000 PHP 2,391,918 2,275,177 0.45 Philippine Government Bond 6.25% 27/1/2014 "5-67" 226,019,812 PHP 4,659,707 4,916,696 0.96
Quantity/ Aquisition % net
Description Nominal Currency cost Evaluation assets

The accompanying notes form an integral part of these financial statements. 109
INTERNATIONAL OPPORTUNITIES FUNDS
ASIAN LOCAL BOND (continued)
Statement of Investment as at December 31, 2009
(expressed in USD)
Philippine Government Bond 6.25% 24/9/2014 "R5-8" 49,000,000 PHP 1,054,363 1,060,442 0.21 Philippine Government Bond 6.625% 13/3/2013 "5-66" 50,500,000 PHP 1,079,474 1,126,373 0.22 Philippine Government Bond 7% 27/1/2016 "7-48" 228,974,998 PHP 4,774,990 4,938,804 0.97 Philippine Government Bond 7% 24/9/2016 "R7-1" 50,000,000 PHP 1,058,754 1,074,447 0.21 Philippine Government Bond 8.75% 3/3/2013 "7-43" 140,000,000 PHP 3,139,062 3,274,943 0.64 Philippine Government Bond 9.125% 4/9/2016 "1042" 112,001,107 PHP 2,572,617 2,633,118 0.52 Philippine Government Bond 9.25% 5/11/2034 "25-6" 10,000,000 PHP 214,429 215,790 0.04 Philippine Government Bond 9.5% 4/12/2028 "2015" 30,000,000 PHP 667,332 678,346 0.13 Philippine Government Bond 10.25% 19/1/2026 "2012" 64,000,000 PHP 1,535,258 1,556,405 0.30
26,184,478 26,768,042 5.24
SingaporeAscendas Pte Ltd 5.15% 29/4/2014 "MTN" 2,000,000 SGD 1,336,650 1,464,445 0.29 Ascendas Real Estate Investment Trust 5% 22/7/2013 "MtN" 5,000,000 SGD 3,445,105 3,613,781 0.71 Ascott Capital Pte Ltd 5.15% 28/5/2014 "MTN" 3,500,000 SGD 2,399,069 2,532,355 0.49 Ascott Reit Mtn Pte Ltd 4.11% 1/10/2012 "1" 2,000,000 SGD 1,416,405 1,432,013 0.28 Banyan Tree Holdings Ltd 5.5% 1/8/2011 "MTN" 3,000,000 SGD 2,220,655 2,139,976 0.42 Ezra Holdings Ltd 5.285% 1/8/2011 "MTN" 1,000,000 SGD 734,978 678,369 0.13 F&N Treasury Pte Ltd 4.55% 5/8/2013 "MTN" 750,000 SGD 497,178 557,114 0.11 F&N Treasury Pte Ltd 5.5% 18/3/2016 "MTN" 1,000,000 SGD 652,017 731,809 0.14 F&N Treasury Pte Ltd 6% 30/4/2019 "MTN" 2,000,000 SGD 1,336,845 1,464,631 0.29 FCT MTN Pte Ltd 4.8% 18/6/2012 "EMTN" 1,750,000 SGD 1,198,865 1,268,374 0.25 Mapletree Treasury Services Ltd 4.6% 20/8/2013 "MTN" 3,000,000 SGD 2,190,524 2,211,002 0.43 Queensley Holdings Ltd 4.62% 7/12/2012 8,000,000 SGD 5,770,452 5,719,153 1.12 Sembcorp Financial Services PTE Ltd 5% 21/4/2014 "MTN" 3,000,000 SGD 1,979,412 2,235,347 0.44 Singapore Government Bond 2.5% 1/6/2019 4,000,000 SGD 2,750,909 2,816,790 0.55 Singapore Government Bond 2.875% 1/7/2015 4,100,000 SGD 2,903,547 3,115,262 0.61 Singapore Government Bond 3% 1/9/2024 2,600,000 SGD 1,776,399 1,792,904 0.35 Singapore Government Bond 3.125% 1/9/2022 5,500,000 SGD 3,727,891 3,929,957 0.77 Singapore Government Bond 3.25% 1/9/2020 5,500,000 SGD 3,797,100 4,049,581 0.79 Singapore Government Bond 3.5% 1/3/2027 8,000,000 SGD 5,525,844 5,818,988 1.14 Singapore Government Bond 3.625% 1/7/2014 10,200,000 SGD 7,811,151 8,041,115 1.57 Singapore Government Bond 3.75% 1/9/2016 9,000,000 SGD 6,659,217 7,063,011 1.38 Singapore Government Bond 4% 1/9/2018 8,000,000 SGD 6,199,309 6,315,314 1.23 United Overseas Bank Ltd FRN 3/9/2019 50,000 SGD 35,488 35,901 0.01
66,365,010 69,027,192 13.50
South KoreaExport-Import Bank of Korea 6% 21/1/2010 "EMTN" 2,000,000 SGD 1,349,378 1,427,692 0.28 Hana Bank 4.8% 30/12/2011 "MTN" 5,000,000 MYR 1,412,623 1,488,521 0.29 Korea Monetary Stabilization Bond 3.4% 24/3/2011 "9711" 5,000,000,000 KRW 3,592,075 4,268,735 0.84 Korea Monetary Stabilization Bond 4.18% 2/12/2011 "0418" 4,700,000,000 KRW 3,981,030 4,011,016 0.78 Korea Monetary Stabilization Bond 5.1% 11/3/2010 "8711" 1,000,000,000 KRW 999,776 859,707 0.17 Korea Monetary Stabilization Bond 5.41% 25/3/2010 "8713" 2,000,000,000 KRW 1,982,628 1,709,017 0.33 Korea Treasury Bond 4.25% 10/9/2014 "1409" 7,500,000,000 KRW 5,593,522 6,292,611 1.23 Korea Treasury Bond 4.75% 10/9/2011 "1109" 6,700,000,000 KRW 4,864,541 5,816,370 1.14 Korea Treasury Bond 4.75% 10/12/2011 "1112" 7,000,000,000 KRW 5,417,803 6,056,274 1.18 Korea Treasury Bond 4.75% 10/3/2012 "1203" 6,300,000,000 KRW 6,599,577 5,445,020 1.07 Korea Treasury Bond 4.75% 17/9/2013 "1309" 7,650,000,000 KRW 6,985,350 6,500,709 1.27 Korea Treasury Bond 4.75% 10/3/2014 "1403" 6,350,000,000 KRW 5,145,653 5,452,498 1.07 Korea Treasury Bond 5% 10/3/2011 "1103" 5,900,000,000 KRW 5,327,376 5,140,110 1.01 Korea Treasury Bond 5% 10/9/2014 "1409" 1,800,000,000 KRW 1,539,955 1,551,299 0.30 Korea Treasury Bond 5% 10/9/2016 "1609" 10,000,000,000 KRW 10,622,569 8,484,423 1.66 Korea Treasury Bond 5.25% 10/9/2012 "1209" 5,000,000,000 KRW 5,428,885 4,376,635 0.86 Korea Treasury Bond 5.25% 10/3/2013 "1303" 3,750,000,000 KRW 3,570,241 3,279,719 0.64 Korea Treasury Bond 5.25% 17/3/2014 "1403" 4,000,000,000 KRW 3,025,186 3,499,409 0.68 Korea Treasury Bond 5.5% 10/6/2011 "1106" 3,300,000,000 KRW 2,401,999 2,897,557 0.57 Korea Treasury Bond 5.5% 10/9/2017 "1709" 3,730,000,000 KRW 3,533,687 3,237,037 0.63 Korea Treasury Bond 5.5% 10/3/2028 "2803" 4,100,000,000 KRW 3,347,927 3,478,096 0.68 Korea Treasury Bond 5.75% 10/9/2013 "1309" 8,000,000,000 KRW 5,815,035 7,085,396 1.39 Korea Treasury Bond 5.75% 10/9/2018 "1809" 10,000,000,000 KRW 8,352,133 8,802,240 1.72 Korea Treasury Bond 5.75% 10/3/2026 "2603" 5,100,000,000 KRW 5,831,496 4,440,926 0.87
Quantity/ Aquisition % net
Description Nominal Currency cost Evaluation assets

110 The accompanying notes form an integral part of these financial statements.
INTERNATIONAL OPPORTUNITIES FUNDS
ASIAN LOCAL BOND (continued)
Statement of Investment as at December 31, 2009
(expressed in USD)
Korea Water Resources Corp. 4.45% 11/8/2014 "EMTN" 20,000,000 HKD 2,580,630 2,558,616 0.50 National Agricultural Cooperative Federation FRN 15/6/2016 2,000,000 USD 1,678,089 1,977,780 0.39 Shinhan Bank FRN 15/7/2015 "EMTN" 1,400,000 USD 1,098,208 1,400,000 0.27
112,077,372 111,537,413 21.82
SrilankaDemocratic Socialist Republic of Sri Lanka 7.4% 22/1/2015 400,000 USD 400,000 416,500 0.08
SupranationalCentral American Bank for Economic Integration 4.8% 3/11/2011 EMTN" 30,000,000 HKD 3,880,300 4,078,224 0.80
TaiwanTaiwan Government Bond 0.25% 21/10/2011 "98-7" 26,000,000 TWD 807,553 807,112 0.16 Taiwan Government Bond 0.875% 21/1/2014 "98-1" 230,000,000 TWD 6,891,315 7,174,392 1.40 Taiwan Government Bond 1.375% 5/3/2019 "98-3" 123,000,000 TWD 3,623,304 3,811,861 0.75 Taiwan Government Bond 1.375% 9/9/2019 "98-6" 115,000,000 TWD 3,538,867 3,545,098 0.69 Taiwan Government Bond 1.75% 31/3/2016 240,000,000 TWD 7,159,846 7,763,352 1.52 Taiwan Government Bond 1.875% 8/9/2016 38,000,000 TWD 1,215,041 1,237,906 0.24 Taiwan Government Bond 2% 20/7/2014 "98-4" 130,000,000 TWD 4,166,945 4,245,250 0.83 Taiwan Government Bond 2% 16/11/2020 "A94108" 50,000,000 TWD 1,545,316 1,613,075 0.32 Taiwan Government Bond 2.125% 24/9/2018 "97-6" 40,000,000 TWD 1,271,767 1,321,431 0.26 Taiwan Government Bond 2.125% 10/11/2026 245,000,000 TWD 7,446,336 7,625,205 1.49 Taiwan Government Bond 2.125% 16/2/2029 "98-2" 100,000,000 TWD 2,976,192 3,118,202 0.61 Taiwan Government Bond 2.375% 4/3/2014 50,000,000 TWD 1,544,154 1,654,075 0.32 Taiwan Government Bond 2.375% 14/3/2018 50,000,000 TWD 1,601,752 1,683,784 0.33 Taiwan Government Bond 2.625% 19/10/2012 "A96201" 14,000,000 TWD 461,861 459,669 0.09 Taiwan Government Bond 2.625% 14/8/2028 "975A" 50,000,000 TWD 1,730,249 1,677,753 0.33 Taiwan Government Bond 3% 10/2/2024 40,000,000 TWD 1,335,448 1,391,247 0.27
47,315,946 49,129,412 9.61
ThailandBank of Thailand 1.65% 21/5/2012 "3YR" 30,000,000 THB 867,614 883,416 0.17 Thailand Government Bond 3.625% 22/5/2015 5,000,000 THB 150,097 150,741 0.03 Thailand Government Bond 3.875% 13/6/2019 20,000,000 THB 576,098 584,306 0.11 Thailand Government Bond 4.25% 13/3/2013 97,000,000 THB 3,053,161 3,021,703 0.59 Thailand Government Bond 4.5% 9/4/2024 15,000,000 THB 449,344 441,781 0.09 Thailand Government Bond 5% 3/12/2014 "05-2" 90,000,000 THB 2,868,437 2,870,491 0.56 Thailand Government Bond 5.125% 13/3/2018 100,000,000 THB 3,216,949 3,204,954 0.63 Thailand Government Bond 5.25% 13/7/2013 105,000,000 THB 3,291,697 3,371,503 0.66 Thailand Government Bond 5.25% 12/5/2014 135,000,000 THB 4,335,589 4,343,326 0.85 Thailand Government Bond 5.375% 30/11/2011 "R033" 72,000,000 THB 2,240,404 2,290,940 0.45 Thailand Government Bond 5.375% 3/12/2019 "05-3" 20,000,000 THB 551,249 649,636 0.13 Thailand Government Bond 5.5% 13/8/2019 "04-5" 30,000,000 THB 995,928 985,675 0.19 Thailand Government Bond 5.5% 13/3/2023 30,000,000 THB 884,088 976,100 0.19 Thailand Government Bond 5.625% 12/1/2019 31,000,000 THB 1,067,143 1,029,800 0.20 Thailand Government Bond 5.85% 31/3/2021 "06-5" 70,000,000 THB 1,973,380 2,354,922 0.46 Thailand Government Bond 6.15% 7/7/2026 "06-6" 50,000,000 THB 1,452,033 1,744,006 0.34
27,973,211 28,903,300 5.65
United States of AmericaGeneral Electric Capital Corp. 3.03% 11/2/2013 "EMTN" 250,000 SGD 145,916 174,563 0.03 General Electric Capital Corp. 4.69% 6/2/2012 "EMTN" 3,000,000 HKD 352,983 405,534 0.08 General Electric Capital Corp. 4.72% 26/9/2011 "EMTN" 3,000,000 HKD 384,796 404,230 0.08 Morgan Stanley 3.585% 23/10/2012 "EMTN" 3,000,000 SGD 2,059,525 2,145,324 0.42
2,943,220 3,129,651 0.61
Total Bonds 447,001,242 462,351,537 90.45
Quantity/ Aquisition % net
Description Nominal Currency cost Evaluation assets

The accompanying notes form an integral part of these financial statements. 111
INTERNATIONAL OPPORTUNITIES FUNDS
ASIAN LOCAL BOND (continued)
Statement of Investment as at December 31, 2009
(expressed in USD)
SECURITISED ASSETS
Cayman IslandsLink Finance Cayman 2009 Ltd (The) 4.75% 20/5/2019 10,000,000 HKD 1,294,093 1,305,002 0.25
LuxembourgMerrill Lynch SA FRN 3/8/2011 "EMTN" 2,000,000 USD 2,000,000 2,000,000 0.39
MalaysiaCagamas MBS BHD 4.17% 27/5/2022 "6" 2,500,000 MYR 734,648 643,764 0.13
PhilippinesPhilippine Government Bond 7.875% 19/2/2019 "1048" 39,000,000 PHP 806,406 843,531 0.17
South KoreaKorea Development Bank (Republic of Korea) 5.65% 19/5/2014 "EMTN" 2,000,000 SGD 1,369,292 1,554,954 0.30
Total Securitised Assets 6,204,439 6,347,251 1.24
Total Transferable Securities Admitted to an Official Stock Exchange Listing
or Dealt in on Another Regulated Market 453,205,681 468,698,788 91.69
Unlisted Securities
BONDS
IndonesiaBumi Capital Pte Ltd 12% 10/11/2016 1,900,000 USD 1,900,000 1,904,044 0.37
MalaysiaBinariang GSM Sdn BHD 5.35% 28/12/2012 "IMTN" 5,000,000 MYR 1,497,783 1,486,389 0.29 Binariang GSM Sdn BHD 5.55% 27/12/2013 "IMTN" 10,000,000 MYR 3,111,810 2,966,558 0.58 Cagamas BHD 4.35% 3/9/2014 "MTN" 5,000,000 MYR 1,415,023 1,459,915 0.29 CIMB Bank BHD FRN 7/10/2038 5,000,000 MYR 1,450,751 1,492,245 0.29 EON Bank BHD 8.25% 9/9/2039 (Step-up coupon) 5,000,000 MYR 1,408,398 1,534,068 0.30 Malayan Banking BHD FRN 25/9/2068 5,000,000 MYR 1,467,569 1,453,738 0.28 PLUS SPV BHD 2% 11/3/2015 "MTN9" 5,000,000 MYR 1,135,731 1,251,284 0.25 Public Bank BHD FRN 22/12/2036 10,000,000 MYR 2,813,338 2,873,538 0.56 YTL Power International BHD 3% 18/4/2013 3,000,000 MYR 901,214 842,435 0.16
15,201,617 15,360,170 3.00
SingaporePSA International Pte Ltd 3.8% 26/5/2020 "GMTN" 10,000,000 HKD 1,290,319 1,237,443 0.24
South KoreaNational Agricultural Cooperative Federation 4.8% 25/7/2012 "EMTN" 10,000,000 HKD 1,306,783 1,295,984 0.26
Total Bonds 19,698,719 19,797,641 3.87
SECURITISED ASSETS
LuxembourgMerrill Lynch SA FRN 20/12/2013 "EMTN" 2,000,000 USD 2,000,000 1,915,000 0.38
Total Securitised Assets 2,000,000 1,915,000 0.38
Total Unlisted Securities 21,698,719 21,712,641 4.25
Total Investments 474,904,400 490,411,429 95.94
Other Net Assets 20,763,796 4.06
Total Net Assets 511,175,225 100.00
Quantity/ Aquisition % net
Description Nominal Currency cost Evaluation assets

112 The accompanying notes form an integral part of these financial statements.
INTERNATIONAL OPPORTUNITIES FUNDS
ASIAN PROPERTY SECURITIES
Statement of Investment as at December 31, 2009
(expressed in USD)
Quantity/ Aquisition % net
Description Nominal Currency cost Evaluation assets
Transferable Securities Admitted to an Official Stock Exchange Listingor Dealt in on Another Regulated Market
MUTUAL FUNDS
ThailandCPN Retail Growth Leasehold Property Fund 480,192 THB 154,363 133,227 1.18
Total Mutual Funds 154,363 133,227 1.18
SHARES
AustraliaAustraland Property Group – REIT 112,114 AUD 55,282 51,815 0.46 CFS Retail Property Trust – REIT 275,933 AUD 399,821 470,486 4.18 Dexus Property Group – REIT 706,058 AUD 644,072 538,578 4.79 Goodman Group – REIT 927,144 AUD 839,928 528,336 4.70 GPT Group – REIT 1,314,199 AUD 571,815 713,519 6.35 Mirvac Group – REIT 336,182 AUD 657,632 473,656 4.21 Stockland – REIT 254,167 AUD 1,247,462 900,960 8.01 Westfield Group – REIT 85,091 AUD 1,223,281 957,570 8.52
5,639,293 4,634,920 41.22
Hong KongHenderson Land Development Co., Ltd 17,000 HKD 88,256 128,035 1.14 Link REIT (The) – REIT 354,414 HKD 826,924 905,905 8.06 Regal Real Estate Investment Trust – REIT 871,000 HKD 227,092 185,340 1.65 Wharf Holdings Ltd 28,000 HKD 103,115 161,592 1.44
1,245,387 1,380,872 12.29
JapanJapan Prime Realty Investment Corp. – REIT 84 JPY 253,552 174,421 1.55 Japan Real Estate Investment Corp. – REIT 66 JPY 717,026 486,702 4.33 Japan Retail Fund Investment Corp. – REIT 53 JPY 290,321 238,273 2.12 Nippon Building Fund, Inc. – REIT 78 JPY 915,227 593,693 5.28 Nomura Real Estate Office Fund, Inc. – REIT 42 JPY 329,393 228,214 2.03
2,505,519 1,721,303 15.31
MalaysiaAmFirst Real Estate Investment Trust – REIT 682,700 MYR 195,345 207,362 1.84 Hektar Real Estate Investment Trust – REIT 293,000 MYR 130,557 95,841 0.85 IGB Corp BHD 120,100 MYR 58,503 70,152 0.62 Starhill Real Estate Investment Trust – REIT 425,600 MYR 130,142 106,276 0.95 Tower Real Estate Investment Trust – REIT 471,800 MYR 166,210 157,083 1.40
680,757 636,714 5.66
SingaporeARA Asset Management Ltd 177,000 SGD 117,891 109,812 0.98 Ascendas Real Estate Investment Trust – REIT 225,000 SGD 278,349 356,199 3.17 Ascott Residence Trust – REIT 230,000 SGD 212,558 196,819 1.75 Cambridge Industrial Trust – REIT 519,000 SGD 276,708 166,547 1.48 CapitaCommercial Trust – REIT 298,000 SGD 184,619 248,633 2.21 CapitaLand Ltd 36,000 SGD 113,224 107,822 0.96 CapitaMall Trust – REIT 359,100 SGD 386,375 460,941 4.10 CDL Hospitality Trusts – REIT 110,000 SGD 126,765 137,274 1.22 Fortune Real Estate Investment Trust – REIT 616,000 HKD 192,718 248,653 2.21

The accompanying notes form an integral part of these financial statements. 113
INTERNATIONAL OPPORTUNITIES FUNDS
ASIAN PROPERTY SECURITIES (continued)
Statement of Investment as at December 31, 2009
(expressed in USD)
Frasers Centrepoint Trust – REIT 74,000 SGD 30,951 73,878 0.66 Lippo-Mapletree Indonesia Retail Trust – REIT 288,000 SGD 140,383 103,715 0.92 Starhill Global REIT – REIT 360,000 SGD 180,172 134,778 1.20
2,240,713 2,345,071 20.86
Total Shares 12,311,669 10,718,880 95.34
Total Investments 12,466,032 10,852,107 96.52
Other Net Assets 391,614 3.48
Total Net Assets 11,243,721 100.00
Quantity/ Aquisition % net
Description Nominal Currency cost Evaluation assets

114 The accompanying notes form an integral part of these financial statements.
INTERNATIONAL OPPORTUNITIES FUNDS
CHINA EQUITY
Statement of Investment as at December 31, 2009
(expressed in USD)
Quantity/ Aquisition % net
Description Nominal Currency cost Evaluation assets
Transferable Securities Admitted to an Official Stock Exchange Listingor Dealt in on Another Regulated Market
SHARES
Cayman IslandsAjisen China Holdings Ltd 4,704,000 HKD 4,045,520 4,028,129 0.90 China Resources Cement Holdings Ltd 8,368,000 HKD 4,197,566 4,154,803 0.93
8,243,086 8,182,932 1.83
ChinaAAC Acoustic Technologies Holdings, Inc. 6,698,000 HKD 6,612,426 11,073,915 2.48 Anta Sports Products Ltd 2,628,000 HKD 2,715,203 3,904,324 0.88 Bank of China Ltd "H" 69,612,000 HKD 29,294,462 37,705,214 8.45 Byd Co., Ltd "H" 1,363,400 HKD 2,396,930 12,035,517 2.70 China Citic Bank "H" 17,694,000 HKD 11,606,249 15,128,907 3.39 China Coal Energy Co. "H" 2,614,000 HKD 5,449,798 4,800,468 1.08 China Construction Bank Corp. "H" 26,436,000 HKD 17,636,566 22,739,954 5.09 China Life Insurance Co., Ltd "H" 4,046,000 HKD 16,548,720 20,010,561 4.48 China Pacific Insurance Group Co., Ltd "H" 2,467,600 HKD 9,585,205 9,833,345 2.20 China Petroleum & Chemical Corp. "H" 16,854,000 HKD 15,085,717 15,019,278 3.36 China Shanshui Cement Group Ltd 16,383,000 HKD 7,475,309 11,958,532 2.68 China Shenhua Energy Co., Ltd "H" 3,083,000 HKD 13,649,210 15,108,632 3.39 China Zhongwang Holdings Ltd 13,809,600 HKD 13,031,089 11,113,061 2.49 Focus Media Holding Ltd – ADR 1,104,100 USD 13,124,393 17,190,837 3.85 Fosun International 13,427,000 HKD 8,121,206 9,385,260 2.10 Industrial & Commercial Bank of China "H" 45,645,000 HKD 31,443,072 37,909,416 8.49 Li Ning Co., Ltd 1,684,500 HKD 2,981,459 6,408,569 1.44 PetroChina Co., Ltd "H" 9,522,000 HKD 12,388,569 11,444,903 2.56 Ping An Insurance Group Company of China Ltd "H" 1,064,500 HKD 9,196,479 9,335,178 2.09 Shandong Chenming Paper Holdings Ltd "H" 6,064,000 HKD 4,410,027 4,535,814 1.02 Sino-Ocean Land Holdings Ltd 5,660,000 HKD 4,757,185 5,240,936 1.17 Sohu.com, Inc. 162,100 USD 8,684,165 9,315,887 2.09 Travelsky Technology LTD 11,777,000 HKD 9,581,734 11,892,262 2.66 Xingda International Holdings Ltd 11,181,000 HKD 1,929,570 5,234,260 1.17
257,704,743 318,325,030 71.31
Hong KongChina Mobile Ltd 2,704,500 HKD 32,409,621 25,408,823 5.69 China Resources Land Ltd 3,164,000 HKD 6,820,344 7,197,855 1.61 China Unicom Hong Kong Ltd 10,012,030 HKD 14,429,324 13,273,433 2.97 CNOOC Ltd 16,575,000 HKD 24,123,305 26,078,426 5.84 Franshion Properties China Ltd 27,628,000 HKD 8,874,271 9,762,657 2.19 GOME Electrical Appliances Holdings Ltd 24,253,860 HKD 8,282,099 8,820,597 1.98 Huabao International Holdings Ltd 8,455,000 HKD 7,372,065 9,126,559 2.05 Sinotrans Shipping Ltd 13,069,000 HKD 6,338,366 6,067,543 1.36
108,649,395 105,735,893 23.69
Total Investments 374,597,224 432,243,855 96.83
Other Net Assets 14,152,016 3.17
Total Net Assets 446,395,871 100.00

The accompanying notes form an integral part of these financial statements. 115
INTERNATIONAL OPPORTUNITIES FUNDS
DRAGON PEACOCK
Statement of Investment as at December 31, 2009
(expressed in USD)
Quantity/ Aquisition % net
Description Nominal Currency cost Evaluation assets
Transferable Securities Admitted to an Official Stock Exchange Listingor Dealt in on Another Regulated Market
SHARES
Cayman IslandsChina Resources Cement Holdings Ltd 4,402,000 HKD 2,217,691 2,185,641 0.88
ChinaAAC Acoustic Technologies Holdings, Inc. 3,232,000 HKD 3,416,710 5,343,519 2.15 Bank of China Ltd "H" 25,199,000 HKD 11,551,291 13,648,993 5.48 Byd Co., Ltd "H" 764,900 HKD 1,297,133 6,752,213 2.71 China Pacific Insurance Group Co., Ltd "H" 1,216,600 HKD 4,774,599 4,848,131 1.95 China Petroleum & Chemical Corp. "H" 6,504,000 HKD 7,532,425 5,795,976 2.33 China Shenhua Energy Co., Ltd "H" 957,500 HKD 4,120,074 4,692,350 1.89 China Zhongwang Holdings Ltd 5,214,400 HKD 4,922,778 4,196,207 1.69 Focus Media Holding Ltd – ADR 403,800 USD 4,357,413 6,287,166 2.53 Fosun International 3,369,000 HKD 2,819,291 2,354,878 0.95 Industrial & Commercial Bank of China "H" 17,515,000 HKD 12,286,551 14,546,685 5.84 Li Ning Co., Ltd 872,500 HKD 1,894,106 3,319,369 1.33 Ping An Insurance Group Company of China Ltd "H" 649,000 HKD 4,677,900 5,691,433 2.29 Sino-Ocean Land Holdings Ltd 3,147,500 HKD 2,664,228 2,914,461 1.17 Sohu.com, Inc. 69,800 USD 3,774,262 4,011,406 1.61 Travelsky Technology LTD 3,438,000 HKD 2,920,542 3,471,648 1.39
73,009,303 87,874,435 35.31
Hong KongChina Mobile Ltd 878,000 HKD 10,660,317 8,248,825 3.32 China Resources Land Ltd 976,000 HKD 1,967,170 2,220,324 0.89 China Unicom Hong Kong Ltd 1,697,046 HKD 3,161,654 2,249,856 0.90 CNOOC Ltd 4,081,000 HKD 5,269,285 6,420,878 2.58 Franshion Properties China Ltd 5,754,000 HKD 2,194,380 2,033,239 0.82 GOME Electrical Appliances Holdings Ltd 11,796,460 HKD 5,176,080 4,290,114 1.72 Huabao International Holdings Ltd 2,454,000 HKD 2,112,956 2,648,915 1.07 Sinotrans Shipping Ltd 3,928,500 HKD 1,907,160 1,823,884 0.73
32,449,002 29,936,035 12.03
IndiaAxis Bank Ltd 416,036 INR 6,976,088 8,843,729 3.55 Bharat Petroleum Corp., Ltd 230,157 INR 1,768,494 3,143,362 1.26 Bharti Airtel Ltd 338,424 INR 2,170,951 2,398,095 0.96 Colgate-Palmolive India Ltd 249,231 INR 3,307,136 3,529,457 1.42 Dr Reddys Laboratories Ltd 143,313 INR 2,265,284 3,531,164 1.42 GAIL India Ltd 691,207 INR 3,978,388 6,138,948 2.47 GVK Power & Infrastructure Ltd 4,505,455 INR 4,173,600 4,497,227 1.81 Hindalco Industries Ltd 1,392,804 INR 4,001,000 4,814,282 1.93 ICICI Bank Ltd 570,302 INR 9,535,445 10,747,932 4.32 Infosys Technologies Ltd 195,793 INR 6,953,025 10,943,963 4.40 Infrastructure Development Finance Co., Ltd 1,201,175 INR 3,267,788 3,982,838 1.60 ITC Ltd 975,018 INR 4,966,133 5,254,853 2.11 IVRCL Infrastructures & Projects Ltd 651,166 INR 4,847,782 4,908,059 1.97 LIC Housing Finance Ltd 202,210 INR 3,729,554 3,488,433 1.40 Maruti Suzuki India Ltd 146,237 INR 3,017,232 4,902,641 1.97 Mphasis Ltd 335,169 INR 4,079,443 5,216,062 2.10 Oil India Ltd 128,804 INR 3,122,449 3,437,450 1.38 OnMobile Global Ltd 259,199 INR 2,181,623 2,521,252 1.01 Reliance Industries Ltd 544,156 INR 11,372,009 12,752,326 5.12 Rural Electrification Corp., Ltd 590,071 INR 3,234,675 3,078,743 1.24

116 The accompanying notes form an integral part of these financial statements.
INTERNATIONAL OPPORTUNITIES FUNDS
DRAGON PEACOCK (continued)
Statement of Investment as at December 31, 2009
(expressed in USD)
Quantity/ Aquisition % net
Description Nominal Currency cost Evaluation assets
Sterlite Industries India Ltd 393,613 INR 4,815,201 7,304,279 2.94 Sun TV Network Ltd 499,911 INR 2,883,279 3,693,337 1.48 Tata Motors Ltd "A" – DVR 263,349 INR 2,457,798 2,805,246 1.13 Tata Steel Ltd 202,167 INR 2,297,310 2,683,541 1.08
101,401,687 124,617,219 50.07
Total Investments 209,077,683 244,613,330 98.29
Other Net Assets 4,265,834 1.71
Total Net Assets 248,879,164 100.00

The accompanying notes form an integral part of these financial statements. 117
INTERNATIONAL OPPORTUNITIES FUNDS
EMERGING EUROPE, MIDDLE EAST AND AFRICA DYNAMIC*
Statement of Investment as at December 31, 2009
(expressed in USD)
Quantity/ Aquisition % net
Description Nominal Currency cost Evaluation assets
Transferable Securities Admitted to an Official Stock Exchange Listingor Dealt in on Another Regulated Market
SHARES
Cayman IslandsEurasia Drilling Co., Ltd – GDR 145,455 USD 2,510,904 2,472,735 2.86
Czech RepublicCEZ AS 64,208 CZK 3,190,453 3,005,149 3.48
EgyptEgyptian Financial Group-Hermes Holding 353,155 EGP 2,011,011 1,618,089 1.87 Talaat Moustafa Group 1,552,181 EGP 2,030,229 1,966,852 2.28 Telecom Egypt 633,434 EGP 1,993,709 2,112,320 2.44
6,034,949 5,697,261 6.59
HungaryMOL Hungarian Oil and Gas NyRt 28,385 HUF 2,309,137 2,563,291 2.97 OTP Bank PLC 112,048 HUF 3,102,841 3,247,421 3.76
5,411,978 5,810,712 6.73
PolandAsseco Poland SA 78,996 PLN 1,544,512 1,740,361 2.01 Globe Trade Centre SA 227,964 PLN 1,949,243 2,046,408 2.37 Polski Koncern Naftowy Orlen 151,517 PLN 1,568,562 1,800,278 2.08 Powszechna Kasa Oszczednosci Bank Polski SA 266,356 PLN 3,240,598 3,542,294 4.10
8,302,915 9,129,341 10.56
Russian FederationFederal Grid Company Unified Energy System JSC 148,475,900 USD 1,635,685 1,567,312 1.81 Gazprom Neft JSC 548,009 USD 2,847,941 2,959,919 3.42 Gazprom OAO 596,352 USD 3,665,183 3,601,896 4.17 Lukoil OAO – ADR 47,444 USD 2,752,763 2,718,541 3.15 Magnit OAO – GDR 120,301 USD 1,642,921 1,906,771 2.21 Mechel – ADR 139,900 USD 2,482,791 2,667,893 3.09 MMC Norilsk Nickel 18,112 USD 2,371,973 2,536,355 2.93 Mobile Telesystems OJSC – ADR 61,800 USD 2,911,278 3,024,492 3.50 Rosneft Oil Co. – GDR 470,588 USD 3,632,356 4,047,057 4.68 RusHydro "CLS" 45,395,800 USD 1,609,422 1,704,204 1.97 Sberbank of Russian Federation 1,550,677 USD 3,457,502 4,279,089 4.95 TMK OAO – GDR 132,597 USD 2,406,846 2,377,464 2.75 Vimpel-Communications – ADR 156,200 USD 2,892,032 2,931,874 3.39 Wimm-Bill-Dann Foods OJSC – ADR 94,800 USD 1,683,790 2,156,700 2.50
35,992,483 38,479,567 44.52
TurkeyAkbank TAS 587,473 TRY 3,222,562 3,788,777 4.39 Enka Insaat ve Sanayi AS 394,859 TRY 1,556,829 1,834,048 2.12 Ford Otomotiv Sanayi AS 253,541 TRY 1,575,523 1,533,489 1.78 Tekfen Holding AS 554,986 TRY 1,566,379 1,832,284 2.12 Turk Hava Yollari 570,768 TRY 1,566,470 2,155,222 2.49 Turkiye Garanti Bankasi AS 985,353 TRY 3,673,213 4,181,667 4.84 Turkiye Halk Bankasi AS 465,759 TRY 2,900,585 3,641,925 4.21
16,061,561 18,967,412 21.95
Total Investments 77,505,243 83,562,177 96.69
Other Net Assets 2,861,557 3.31
Total Net Assets 86,423,734 100.00
* New Sub-Fund launched on November 2, 2009.

118 The accompanying notes form an integral part of these financial statements.
INTERNATIONAL OPPORTUNITIES FUNDS
EUROPEAN INVESTMENT GRADE BOND
Statement of Investment as at December 31, 2009
(expressed in EUR)
Quantity/ Aquisition % net
Description Nominal Currency cost Evaluation assets
Transferable Securities Admitted to an Official Stock Exchange Listingor Dealt in on Another Regulated Market
BONDS
AustraliaAustralia & New Zealand Banking Group Ltd 3.375% 1/3/2011 "EMTN" 1,000,000 EUR 999,136 1,020,550 0.38 Australia & New Zealand Banking Group Ltd 4.375% 24/5/2012 "EMTN" 500,000 EUR 498,984 523,985 0.19 Commonwealth Bank of Australia 3.625% 5/4/2011 "EMTN" 1,000,000 EUR 998,986 1,022,900 0.38 National Australia Bank Ltd 4.625% 7/6/2012 "EMTN" 500,000 EUR 499,014 525,870 0.19 National Australia Bank Ltd FRN 4/6/2015 "EMTN" 1,000,000 EUR 1,012,490 999,950 0.37 Telstra Corp., Ltd 6.375% 29/6/2011 "EMTN" 200,000 EUR 207,605 212,558 0.08 Westpac Banking Corp. 4.875% 28/9/2012 "EMTN" 800,000 EUR 798,044 846,728 0.31 WT Finance Aust Pty Ltd / Westfield Europe Finance PLC / WEA Finance LLC 3.625% 27/6/2012 1,150,000 EUR 1,135,491 1,138,477 0.42
6,149,750 6,291,018 2.32
AustriaErste Group Bank AG FRN 19/7/2017 "EMTN" 500,000 EUR 500,896 404,975 0.15
BelgiumAnheuser-Busch InBev NV 7.375% 30/1/2013 "EMTN" 622,000 EUR 620,380 698,400 0.26 Anheuser-Busch InBev NV 8.625% 30/1/2017 "EMTN" 750,000 EUR 747,437 941,265 0.34 Elia System Operator SA/NV 4.75% 13/5/2014 1,000,000 EUR 999,498 1,054,360 0.39
2,367,315 2,694,025 0.99
BermudaBacardi Ltd 7.75% 9/4/2014 "EMTN" 1,191,000 EUR 1,311,743 1,360,896 0.50
CanadaRoyal Bank of Canada 5.75% 25/7/2011 "EMTN" 1,852,000 EUR 1,849,382 1,964,472 0.73 Xstrata Canada Financial Corp. 6.25% 27/5/2015 "EMTN" 772,000 EUR 767,931 844,028 0.31
2,617,313 2,808,500 1.04
Cayman IslandsBES Finance Ltd 6.25% 17/5/2011 "EMTN" 900,000 EUR 929,598 935,793 0.34 MUFG Capital Finance 4 Ltd FRN Perpetual 350,000 EUR 350,000 273,091 0.10 Principal Financial Global Funding II LLC 4.5% 26/1/2017 "EMTN" 1,000,000 EUR 897,594 874,770 0.32 Thames Water Utilities Cayman Finance Ltd 6.125% 4/2/2013 "EMTN" 1,400,000 EUR 1,396,523 1,512,896 0.56 CEZ AS 5.125% 12/10/2012 500,000 EUR 499,629 531,725 0.20
4,073,344 4,128,275 1.52
DenmarkAP Moller - Maersk A/S 4.875% 30/10/2014 305,000 EUR 304,961 308,617 0.11 Carlsberg Breweries A/S 6% 28/5/2014 "EMTN" 400,000 EUR 398,593 433,512 0.16 Danica Pension Livsforsikringsaktieselskab FRN Perpetual 100,000 EUR 99,887 91,617 0.03 Dong Energy A/S 4.875% 7/5/2014 "EMTN" 200,000 EUR 199,803 212,022 0.08 Dong Energy A/S 6.5% 7/5/2019 "EMTN" 300,000 EUR 307,553 345,732 0.13 Dong Energy A/S FRN 29/6/3005 500,000 EUR 497,984 478,750 0.18
1,808,781 1,870,250 0.69
EstoniaEesti Energia AS 4.5% 18/11/2020 500,000 EUR 479,560 423,930 0.15
FinlandFortum Oyj 4.5% 20/6/2016 "EMTN" 300,000 EUR 298,823 313,410 0.12 Fortum Oyj 4.625% 20/3/2014 "EMTN" 333,000 EUR 331,911 353,396 0.13 Fortum Oyj 6% 20/3/2019 "EMTN" 625,000 EUR 620,990 706,837 0.26 Teollisuuden Voima OYJ 6% 27/6/2016 "EMTN" 995,000 EUR 987,815 1,082,729 0.40
2,239,539 2,456,372 0.91

The accompanying notes form an integral part of these financial statements. 119
INTERNATIONAL OPPORTUNITIES FUNDS
EUROPEAN INVESTMENT GRADE BOND (continued)
Statement of Investment as at December 31, 2009
(expressed in EUR)
FranceAreva SA 3.875% 23/9/2016 "EMTN" 400,000 EUR 399,004 399,128 0.15 Areva SA 4.875% 23/9/2024 "EMTN" 250,000 EUR 247,346 253,260 0.09 Autoroutes du Sud de la France 5.625% 4/7/2022 750,000 EUR 748,637 797,715 0.29 AXA SA FRN Perpetual "EMTN" 200,000 EUR 200,000 168,418 0.06 BNP Paribas FRN 22/1/2019 "EMTN" 750,000 EUR 742,400 770,198 0.28 Bouygues SA 4.25% 22/7/2020 500,000 EUR 499,313 487,660 0.18 Cie de Saint-Gobain 4.875% 31/5/2016 1,500,000 EUR 1,472,645 1,535,025 0.57 Credit Agricole SA 5.971% 1/2/2018 "EMTN" 2,000,000 EUR 2,005,452 2,200,440 0.81 Credit Logement SA FRN 15/6/2017 700,000 EUR 672,419 656,537 0.24 EDF SA 5% 5/2/2018 1,000,000 EUR 994,539 1,069,610 0.39 EDF SA 5.125% 23/1/2015 "EMTN" 500,000 EUR 499,274 542,270 0.20 EDF SA 6.25% 25/1/2021 "EMTN" 450,000 EUR 449,481 521,892 0.19 France Telecom SA 4.375% 21/2/2012 "EMTN" 1,500,000 EUR 1,484,087 1,564,875 0.58 France Telecom SA 8.125% 28/1/2033 "EMTN" 500,000 EUR 702,776 672,870 0.25 GDF Suez 5.625% 18/1/2016 "EMTN" 1,000,000 EUR 1,114,439 1,104,350 0.41 GDF Suez 6.375% 18/1/2021 "EMTN" 500,000 EUR 498,371 585,235 0.22 Imerys SA 5.125% 25/4/2014 "EMTN" 1,000,000 EUR 1,036,575 1,011,790 0.37 Klepierre 4.625% 15/7/2011 700,000 EUR 709,287 724,507 0.27 Lafarge SA 5.375% 26/6/2017 "EMTN" 1,000,000 EUR 996,879 1,004,530 0.37 Lafarge SA 6.125% 28/5/2015 "EMTN" 200,000 EUR 199,273 214,528 0.08 Regie Autonome des Transports Parisiens 4% 23/9/2021 "EMTN" 1,000,000 EUR 992,327 995,160 0.37 RTE EDF Transport SA 4.125% 27/9/2016 "EMTN" 150,000 EUR 149,163 153,063 0.06 Sanofi-Aventis SA 3.125% 10/10/2014 1,000,000 EUR 998,825 1,011,080 0.37 Sanofi-Aventis SA 4.125% 11/10/2019 "EMTN" 350,000 EUR 349,394 352,397 0.13 Schneider Electric SA 5.375% 8/1/2015 "EMTN" 1,000,000 EUR 1,003,169 1,079,470 0.40 Societe Francaise du Radiotelephone 3.375% 18/7/2012 300,000 EUR 299,840 304,017 0.11 Societe Generale 5.25% 28/3/2013 "EMTN" 750,000 EUR 748,208 808,230 0.30 Societe Generale FRN Perpetual 750,000 EUR 726,361 531,083 0.20 Suez Environnement Co. 5.5% 22/7/2024 "EMTN" 550,000 EUR 546,637 582,323 0.21 TPSA Eurofinance France SA 6% 22/5/2014 "EMTN" 1,400,000 EUR 1,430,941 1,519,616 0.56 Veolia Environnement 4.375% 11/12/2020 "EMTN" 400,000 EUR 396,928 389,636 0.14 Veolia Environnement 6.125% 25/11/2033 "EMTN" 750,000 EUR 898,983 811,733 0.30 Vivendi SA 4.25% 1/12/2016 "EMTN" 700,000 EUR 696,022 701,554 0.26 WPP Finance SAS 5.25% 30/1/2015 500,000 EUR 499,957 514,740 0.19
25,408,952 26,038,940 9.60
GermanyBertelsmann AG 7.875% 16/1/2014 "EMTN" 193,000 EUR 192,850 219,070 0.08 Bundesrepublik Deutschland 3.5% 4/7/2019 "09" 9,100,000 EUR 9,222,838 9,211,566 3.40 Bundesrepublik Deutschland 6.25% 4/1/2030 "00" 2,200,000 EUR 2,690,512 2,807,640 1.04 Deutsche Boerse AG FRN 13/6/2038 1,550,000 EUR 1,544,899 1,609,810 0.59 EWE AG 5.25% 16/7/2021 275,000 EUR 272,292 287,045 0.11 Muenchener Rueckversicherungs AG FRN 21/6/2023 100,000 EUR 113,152 105,683 0.04 Muenchener Rueckversicherungs AG FRN Perpetual 400,000 EUR 394,834 358,096 0.13 Volkswagen Bank GmbH FRN 27/6/2011 "EMTN" 550,000 EUR 549,885 544,137 0.20 Volkswagen Leasing GmbH 4.875% 18/10/2012 "EMTN" 500,000 EUR 498,708 525,775 0.19
15,479,970 15,668,822 5.78
IcelandDanaher European Finance Co. EHF 4.5% 22/7/2013 1,000,000 EUR 1,027,244 1,025,010 0.38
IrelandAegon Global Institutional Markets PLC 4.25% 23/1/2012 "EMTN" 2,000,000 EUR 1,998,406 2,048,520 0.76 Bank of Ireland Mortgage Bank 4.625% 16/9/2014 "EMTN" 730,000 EUR 729,161 731,867 0.27 Bord Gais Eireann 5.75% 16/6/2014 "EMTN" 1,020,000 EUR 1,018,690 1,090,788 0.40 GE Capital European Funding 5.25% 18/5/2015 "EMTN" 4,000,000 EUR 3,992,417 4,229,880 1.56 Governor & Co. of the Bank of Ireland (The) FRN 27/2/2019 "EMTN" 1,000,000 EUR 938,885 871,290 0.32 Ireland Government Bond 5.4% 13/3/2025 1,280,000 EUR 1,271,128 1,260,531 0.47 Irish Life Assurance PLC FRN Perpetual 200,000 EUR 198,461 113,616 0.04 TransCapitalInvest Ltd for OJSC AK Transneft 5.381% 27/6/2012 1,000,000 EUR 1,000,000 1,032,300 0.38
11,147,148 11,378,792 4.20
Quantity/ Aquisition % net
Description Nominal Currency cost Evaluation assets

120 The accompanying notes form an integral part of these financial statements.
INTERNATIONAL OPPORTUNITIES FUNDS
EUROPEAN INVESTMENT GRADE BOND (continued)
Statement of Investment as at December 31, 2009
(expressed in EUR)
ItalyA2A SpA 4.5% 2/11/2016 495,000 EUR 491,402 501,262 0.19 A2A SpA 4.875% 28/5/2014 1,000,000 EUR 1,035,717 1,047,410 0.39 Assicurazioni Generali SpA 5.125% 16/9/2024 "EMTN" 355,000 EUR 349,959 353,754 0.13 Atlantia SpA 5% 9/6/2014 "EMTN" 500,000 EUR 512,089 532,060 0.20 Banca Lombarda e Piemontese SpA 6.875% 23/2/2010 "EMTN" 1,000,000 EUR 1,004,476 1,002,520 0.37 Banco Popolare SC FRN 15/6/2016 "EMTN" 300,000 EUR 299,729 270,183 0.10 Enel SpA 5.25% 20/6/2017 "EMTN" 500,000 EUR 498,431 540,415 0.20 Enel SpA 5.625% 21/6/2027 "EMTN" 550,000 EUR 481,563 580,839 0.21 ENI SpA 4.125% 16/9/2019 750,000 EUR 745,844 754,725 0.28 ENI SpA 5.875% 20/1/2014 "EMTN" 900,000 EUR 897,947 1,001,205 0.37 Exor SpA 5.375% 12/6/2017 1,000,000 EUR 976,767 986,950 0.36 Hera SpA 4.125% 16/2/2016 200,000 EUR 199,855 198,850 0.07 Hera SpA 4.5% 3/12/2019 900,000 EUR 893,598 886,131 0.33 Intesa Sanpaolo SpA 2.625% 4/12/2012 "EMTN" 1,500,000 EUR 1,499,035 1,499,445 0.55 Terna Rete Elettrica Nazionale SpA 4.875% 3/10/2019 "EMTN" 750,000 EUR 746,931 781,005 0.29 UniCredit SpA 4.875% 12/2/2013 "EMTN" 1,000,000 EUR 999,080 1,060,130 0.39 UniCredit SpA 6% 16/3/2011 "MTN1" 900,000 EUR 924,488 929,808 0.34
12,556,911 12,926,692 4.77
JapanBank of Tokyo-Mitsubishi UFJ Ltd FRN 16/12/2015 "EMTN" 550,000 EUR 548,027 548,081 0.20
JerseyBAA Funding Ltd FRN 15/2/2014 1,350,000 EUR 1,122,093 1,335,825 0.49 WPP PLC 4.375% 5/12/2013 200,000 EUR 199,537 201,872 0.08 WPP PLC 6.625% 12/5/2016 "EMTN" 270,000 EUR 269,547 295,677 0.11
1,591,177 1,833,374 0.68
LuxembourgCiba Specialty Chemicals Finance Luxembourg SA 4.875% 20/6/2018 200,000 EUR 209,046 211,418 0.08 Enel Finance International SA 4% 14/9/2016 "EMTN" 200,000 EUR 199,118 203,266 0.07 Enel Finance International SA 5% 14/9/2022 "EMTN" 280,000 EUR 277,829 276,755 0.10 Finmeccanica Finance SA 5.25% 21/1/2022 400,000 EUR 396,815 405,524 0.15 Finmeccanica Finance SA 8.125% 3/12/2013 "EMTN" 500,000 EUR 578,280 582,285 0.21 Gaz Capital SA 6.605% 13/2/2018 "EMTN" 1,000,000 EUR 867,480 1,020,120 0.38 Glencore Finance Europe SA 5.25% 11/10/2013 "EMTN" 500,000 EUR 497,650 514,605 0.19 Glencore Finance Europe SA 7.125% 23/4/2015 "EMTN" 350,000 EUR 348,272 376,733 0.14 Holcim Finance Luxembourg SA 4.375% 9/12/2014 700,000 EUR 707,123 712,411 0.26 ITW Finance Europe SA 5.25% 1/10/2014 1,500,000 EUR 1,570,380 1,598,115 0.59 Novartis Finance SA 4.25% 15/6/2016 "EMTN" 400,000 EUR 399,104 420,904 0.16 SES SA 4.375% 21/10/2013 "EMTN" 600,000 EUR 597,632 616,272 0.23 Telecom Italia Finance SA 7.5% 20/4/2011 "EMTN" 1,500,000 EUR 1,536,506 1,602,030 0.59
8,185,235 8,540,438 3.15
MexicoPetroleos Mexicanos 5.5% 9/1/2017 "EMTN" 912,000 EUR 905,918 896,396 0.33
NetherlandsABN Amro Bank NV FRN 8/6/2015 "EMTN" 850,000 EUR 848,900 680,561 0.25 Akzo Nobel NV 7.25% 27/3/2015 588,000 EUR 587,200 676,188 0.25 Allianz Finance II BV 5% 6/3/2013 "EMTN" 500,000 EUR 498,628 536,570 0.20 Allianz Finance II BV FRN Perpetual "XW" 850,000 EUR 846,597 688,679 0.25 BASF Finance Europe NV 5.125% 9/6/2015 "EMTN" 650,000 EUR 674,306 701,245 0.26 BMW Finance NV 4% 17/9/2014 "NOV" 465,000 EUR 474,315 473,137 0.17 BMW Finance NV 4.875% 18/10/2012 "EMTN" 1,250,000 EUR 1,248,964 1,316,837 0.49 CEZ Finance BV 4.625% 8/6/2011 500,000 EUR 498,001 517,160 0.19 CRH Finance BV 7.375% 28/5/2014 "EMTN" 500,000 EUR 507,807 568,475 0.21 Deutsche Bahn Finance BV 3.625% 16/10/2017 "EMTn" 665,000 EUR 661,554 664,129 0.25 Deutsche Telekom International Finance BV 4.375% 2/6/2014 "EMTN" 235,000 EUR 234,088 244,323 0.09 Deutsche Telekom International Finance BV 7.125% 11/7/2011 500,000 EUR 510,658 536,370 0.20
Quantity/ Aquisition % net
Description Nominal Currency cost Evaluation assets

The accompanying notes form an integral part of these financial statements. 121
INTERNATIONAL OPPORTUNITIES FUNDS
EUROPEAN INVESTMENT GRADE BOND (continued)
Statement of Investment as at December 31, 2009
(expressed in EUR)
Deutsche Telekom International Finance BV 7.5% 24/1/2033 "EMTN" 300,000 EUR 408,363 375,309 0.14 Deutsche Telekom International Finance BV 8.125% 29/5/2012 1,000,000 EUR 1,068,253 1,124,770 0.41 Diageo Capital BV 5.5% 1/7/2013 "EMTN" 600,000 EUR 598,478 650,646 0.24 E.ON International Finance BV 5.5% 2/10/2017 "EMTN" 1,350,000 EUR 1,363,219 1,487,389 0.55 E.ON International Finance BV 5.75% 7/5/2020 "EMTN" 132,000 EUR 131,184 147,686 0.05 EDP Finance BV 4.25% 12/6/2012 "EMTN" 500,000 EUR 498,703 521,455 0.19 EDP Finance BV 4.625% 13/6/2016 "EMTN" 400,000 EUR 398,845 418,656 0.15 ELM BV for Elsevier Finance SA 6.5% 2/4/2013 900,000 EUR 898,251 991,170 0.37 ELM BV for Swiss Reinsurance Co. FRN Perpetual 100,000 EUR 100,000 83,072 0.03 Enbw International Finance BV 6.125% 7/7/2039 "EmTN" 512,000 EUR 504,495 562,765 0.21 Eureko BV FRN Perpetual 300,000 EUR 300,144 215,562 0.08 Generali Finance BV FRN Perpetual 150,000 EUR 150,000 132,756 0.05 Generali Finance BV FRN Perpetual 250,000 EUR 250,000 222,173 0.08 Koninklijke DSM NV 5.75% 17/3/2014 "EMTN" 500,000 EUR 496,801 547,940 0.20 Koninklijke KPN NV 4.5% 21/7/2011 "EMTN" 800,000 EUR 812,630 830,800 0.31 Koninklijke KPN NV 4.75% 29/5/2014 "GMTN" 50,000 EUR 49,551 52,700 0.02 Koninklijke KPN NV 4.75% 17/1/2017 "GMTN" 150,000 EUR 149,781 154,677 0.06 Koninklijke KPN NV 5% 13/11/2012 "EMTN" 263,000 EUR 261,724 278,691 0.10 Koninklijke KPN NV 6.25% 4/2/2014 "GMTN" 400,000 EUR 397,993 443,132 0.16 Lanxess Finance BV 7.75% 9/4/2014 600,000 EUR 596,699 687,864 0.25 Linde Finance BV 4.75% 24/4/2017 "EMTN" 750,000 EUR 720,617 780,638 0.29 Linde Finance BV 6.75% 8/12/2015 "EMTN" 200,000 EUR 199,210 232,440 0.09 Nederlandse Gasunie NV 5.125% 31/3/2017 "EMTN" 706,000 EUR 701,453 765,544 0.28 PACCAR Financial Europe BV 5.125% 19/5/2011 "EMTN" 600,000 EUR 599,060 611,532 0.23 Rabobank Nederland NV FRN 28/7/2015 "EMTN" 1,000,000 EUR 999,318 979,600 0.36 Repsol International Finance BV 5% 22/7/2013 "EMTN" 500,000 EUR 495,697 527,750 0.20 Rodamco Europe Finance BV 3.75% 12/12/2012 "EMTN" 1,500,000 EUR 1,497,485 1,530,525 0.56 Siemens Financieringsmaatschappij NV 5.125% 20/2/2017 "EMTN" 1,000,000 EUR 1,061,859 1,077,270 0.40 Syngenta Finance NV 4.125% 22/4/2015 "EMTN" 350,000 EUR 349,880 362,604 0.13 TNT NV 5.375% 14/11/2017 1,500,000 EUR 1,494,642 1,567,710 0.58 Urenco Finance NV 5.375% 22/5/2015 "EMTN" 650,000 EUR 648,859 696,371 0.26 Verbund International Finance BV 4.75% 16/7/2019 "EMTN" 540,000 EUR 535,383 550,795 0.20 Verbund International Finance BV 5% 25/6/2014 515,000 EUR 513,311 547,651 0.20
26,842,906 27,763,317 10.24
NorwayDnB NOR Bank ASA 5.875% 20/6/2013 "EMTN" 1,450,000 EUR 1,445,975 1,590,592 0.59 DnB NOR Bank ASA FRN Perpetual 800,000 EUR 942,543 779,552 0.29 Statkraft AS 4.625% 22/9/2017 "EMTN" 250,000 EUR 249,493 256,813 0.09 Statkraft AS 5.5% 2/4/2015 "EMTN" 200,000 EUR 199,860 217,346 0.08 Statkraft AS 6.625% 2/4/2019 960,000 EUR 955,826 1,107,101 0.41 StatoilHydro ASA 4.375% 11/3/2015 "EMTN" 650,000 EUR 648,341 685,054 0.25 StatoilHydro ASA 5.625% 11/3/2021 "EMTN" 1,000,000 EUR 990,878 1,117,860 0.41 Telenor ASA 4.875% 29/5/2017 "EMTN" 1,500,000 EUR 1,458,632 1,568,385 0.58
6,891,548 7,322,703 2.70
PortugalREN - Redes Energeticas Nacionais SA 6.375% 10/12/2013 "EMTN" 1,000,000 EUR 1,032,495 1,103,970 0.41
SloveniaTelekom Slovenije DD 4.875% 21/12/2016 650,000 EUR 644,988 641,615 0.24
SpainBancaja Emisiones SA Unipersonal FRN Perpetual "EMTN" 1,000,000 EUR 1,040,031 514,980 0.19 Banco Bilbao Vizcaya Argentaria SA FRN 12/11/2015 500,000 EUR 515,878 501,895 0.18 Banesto Banco de Emisiones SA FRN 23/3/2016 500,000 EUR 508,039 488,525 0.18 BBVA International Preferred SA Unipersonal FRN Perpetual "E" 200,000 EUR 268,907 209,333 0.08 BBVA Subordinated Capital SAU FRN 24/10/2016 "EMTN" 500,000 EUR 494,627 479,790 0.18 Enagas 3.25% 6/7/2012 300,000 EUR 299,907 306,570 0.11 Enagas 4.375% 6/7/2015 "EMTN" 100,000 EUR 99,825 104,415 0.04 Gas Natural Capital Markets SA 3.125% 2/11/2012 "EMTN" 300,000 EUR 299,196 303,534 0.11 Gas Natural Capital Markets SA 6.375% 9/7/2019 "EMTN" 1,000,000 EUR 1,043,039 1,126,020 0.42
Quantity/ Aquisition % net
Description Nominal Currency cost Evaluation assets

122 The accompanying notes form an integral part of these financial statements.
INTERNATIONAL OPPORTUNITIES FUNDS
EUROPEAN INVESTMENT GRADE BOND (continued)
Statement of Investment as at December 31, 2009
(expressed in EUR)
Iberdrola Finanzas SAU 4.875% 4/3/2014 "EMTN" 600,000 EUR 597,831 642,972 0.24 Santander Issuances S.A Unipersonal FRN 24/10/2017 "EMTN" 750,000 EUR 751,203 782,242 0.29 Telefonica Emisiones SAU 4.375% 2/2/2016 "EMTN" 750,000 EUR 721,078 769,147 0.28 Telefonica Emisiones SAU 4.693% 11/11/2019 "EMTN" 550,000 EUR 550,000 550,478 0.20 Telefonica Emisiones SAU 5.58% 12/6/2013 "EMTN" 1,000,000 EUR 1,035,672 1,083,020 0.40
8,225,233 7,862,921 2.90
SupranationalEuropean Investment Bank 4.75% 15/10/2017 "EMTN" 3,000,000 EUR 3,113,784 3,257,220 1.20
SwedenSecuritas AB 6.5% 2/4/2013 "EMTN" 450,000 EUR 448,924 493,551 0.18 Svenska Handelsbanken AB 3% 20/8/2012 1,500,000 EUR 1,497,760 1,515,255 0.56 Swedbank AB FRN 27/9/2017 "GMTN" 1,500,000 EUR 1,482,176 1,478,970 0.54 Telefonaktiebolaget LM Ericsson 5% 24/6/2013 "EMTN" 85,000 EUR 84,753 89,552 0.03 Telefonaktiebolaget LM Ericsson 5.375% 27/6/2017 "EMTN" 1,000,000 EUR 997,278 1,038,580 0.38 Vattenfall AB 4.125% 18/3/2013 "EMTN" 225,000 EUR 224,666 234,603 0.09 Vattenfall AB 5.25% 17/3/2016 "EMTN" 240,000 EUR 239,063 260,369 0.10 Vattenfall AB 6.25% 17/3/2021 "EMTN" 750,000 EUR 748,725 865,732 0.32 Vattenfall Treasury AB FRN Perpetual 400,000 EUR 401,836 378,188 0.14 Volvo Treasury AB 5% 31/5/2017 "EMTN" 350,000 EUR 345,572 342,083 0.13
6,470,753 6,696,883 2.47
SwitzerlandCredit Suisse (London) 6.125% 5/8/2013 "EMTN" 1,200,000 EUR 1,197,180 1,322,220 0.49 UBS AG (Jersey) FRN 25/9/2018 "EMTN" 2,000,000 EUR 1,960,488 1,948,600 0.72 UBS AG (London) 6% 18/4/2018 "EMTN" 1,000,000 EUR 995,132 1,085,150 0.40
4,152,800 4,355,970 1.61
United KingdomAlliance & Leicester PLC 3.5% 9/3/2011 "EMTN" 1,000,000 EUR 999,244 1,012,890 0.37 Anglian Water Services Financing PLC 4.625% 7/10/2013 "EMTN" 1,000,000 EUR 994,548 1,043,700 0.38 Anglian Water Services Financing PLC 6.25% 27/6/2016 "EMTN" 1,440,000 EUR 1,439,288 1,607,371 0.59 Anglo American Capital PLC 4.25% 30/9/2013 "EMTN" 220,000 EUR 219,509 227,108 0.08 Anglo American Capital PLC 5.875% 17/4/2015 "EMTN" 750,000 EUR 750,803 821,325 0.30 Aviva PLC FRN 22/5/2038 "EMTN" 445,000 EUR 444,755 428,709 0.16 Aviva PLC FRN Perpetual 1,000,000 EUR 1,022,656 774,500 0.29 Barclays Bank PLC 6% 23/1/2018 "EMTN" 500,000 EUR 499,972 527,710 0.19 Barclays Bank PLC FRN 30/5/2017 "EMTN" 1,000,000 EUR 999,629 888,890 0.33 Barclays Bank PLC FRN Perpetual 250,000 EUR 296,387 238,660 0.09 Barclays Bank PLC FRN Perpetual "EMTN" 250,000 EUR 261,612 158,010 0.06 BAT International Finance PLC 4.875% 24/2/2021 "EMTN" 248,000 EUR 244,903 245,798 0.09 BAT International Finance PLC 5.375% 29/6/2017 "EMTN" 750,000 EUR 746,815 797,495 0.29 BAT International Finance PLC 5.875% 12/3/2015 "EMTN" 750,000 EUR 779,818 822,128 0.30 BG Energy Capital PLC 3.375% 15/7/2013 "EMTN" 1,120,000 EUR 1,116,573 1,137,136 0.42 British Telecommunications PLC 5.25% 22/1/2013 "EMTN" 500,000 EUR 499,521 524,785 0.19 British Telecommunications PLC 5.25% 23/6/2014 "EMTN" 1,000,000 EUR 997,948 1,045,030 0.39 British Telecommunications PLC 6.125% 11/7/2014 "EMTN" 224,000 EUR 223,741 243,204 0.09 Centrica PLC 7.125% 9/12/2013 "EMTN" 1,550,000 EUR 1,544,027 1,772,580 0.65 Hammerson PLC 4.875% 19/6/2015 225,000 EUR 224,833 218,468 0.08 HBOS PLC FRN 30/10/2019 "EMTN" 1,000,000 EUR 972,140 826,580 0.31 HSBC Bank PLC FRN 18/3/2016 "EMTN" 1,500,000 EUR 1,481,201 1,517,625 0.56 HSBC Bank PLC FRN 30/9/2020 "EMTN" 500,000 EUR 488,912 453,975 0.17 Imperial Tobacco Finance PLC 4.375% 22/11/2013 "EMTN" 150,000 EUR 149,519 154,241 0.06 Imperial Tobacco Finance PLC 5% 25/6/2012 "EMTN" 200,000 EUR 199,715 209,922 0.08 Imperial Tobacco Finance PLC 8.375% 17/2/2016 "EMTN" 500,000 EUR 526,559 605,890 0.22 Lloyds TSB Bank PLC 6.25% 15/4/2014 "EMTN" 250,000 EUR 458,666 270,800 0.10 Lloyds TSB Bank PLC FRN 5/3/2018 "EMTN" 1,250,000 EUR 1,252,705 1,180,287 0.44 National Grid Electricity Transmission PLC 6.625% 28/1/2014 "EMTN" 800,000 EUR 799,054 900,480 0.33 National Grid Gas PLC 5.125% 14/5/2013 "EMTN" 1,000,000 EUR 999,912 1,068,700 0.39
Quantity/ Aquisition % net
Description Nominal Currency cost Evaluation assets

The accompanying notes form an integral part of these financial statements. 123
INTERNATIONAL OPPORTUNITIES FUNDS
EUROPEAN INVESTMENT GRADE BOND (continued)
Statement of Investment as at December 31, 2009
(expressed in EUR)
National Grid PLC 4.375% 10/3/2020 "EMTN" 850,000 EUR 840,639 838,406 0.31 Nationwide Building Society 3.125% 26/1/2010 "EMTN" 1,500,000 EUR 1,499,862 1,500,465 0.55 Old Mutual PLC FRN 18/1/2017 "EMTN" 800,000 EUR 786,959 614,728 0.23 OTE PLC 5.375% 14/2/2011 "GMTN" 1,250,000 EUR 1,250,190 1,288,875 0.48 Permanent Financing PLC 3.9615% 10/3/2011 "5A1" 1,000,000 EUR 1,004,168 962,500 0.36 Rexam PLC 4.375% 15/3/2013 "EMTN" 200,000 EUR 201,332 202,730 0.07 Royal Bank of Scotland PLC (The) FRN 28/1/2016 "EMTN" 1,000,000 EUR 995,862 816,430 0.30 Severn Trent Utilities Finance PLC 5.25% 11/3/2016 "EMTN" 1,800,000 EUR 1,793,958 1,915,128 0.71 Standard Chartered Bank 5.875% 26/9/2017 "EMTN" 750,000 EUR 714,878 786,000 0.29 Standard Chartered PLC 4.875% 11/3/2011 1,000,000 EUR 999,536 1,031,830 0.38 Standard Life PLC FRN Perpetual 500,000 EUR 505,333 398,750 0.15 Tesco PLC 5.125% 24/2/2015 "EMTN" 500,000 EUR 497,815 540,290 0.20 Tesco PLC 5.125% 10/4/2047 "EMTN" 750,000 EUR 592,807 656,550 0.24 Tesco PLC 5.625% 12/9/2012 "EMTN" 650,000 EUR 649,712 702,065 0.26 United Utilities Water PLC 4.25% 24/1/2020 "EMTN" 1,000,000 EUR 970,344 974,470 0.36 Vodafone Group PLC FRN 6/6/2014 "EMTN" 750,000 EUR 750,000 737,685 0.27
35,688,360 35,690,899 13.16
United States of America3M Co. 5% 14/7/2014 1,250,000 EUR 1,246,255 1,334,262 0.49 Air Products & Chemicals, Inc. 4.25% 10/4/2012 200,000 EUR 202,581 202,624 0.07 American Honda Finance Corp. 3.875% 16/9/2014 "EMTN" 550,000 EUR 547,207 561,478 0.21 AT&T, Inc. 4.375% 15/3/2013 1,200,000 EUR 1,186,171 1,255,740 0.46 AT&T, Inc. 6.125% 2/4/2015 "GLOB" 550,000 EUR 549,591 617,980 0.23 BA Credit Card Trust 4.15% 19/4/2010 "03A5" 2,000,000 EUR 2,004,755 2,009,256 0.74 Bank of America Corp. FRN 23/5/2017 "EMTN" 2,000,000 EUR 1,986,636 1,820,980 0.67 BMW US Capital LLC 5% 28/5/2015 "EMTN" 650,000 EUR 647,220 689,916 0.25 Bristol-Myers Squibb Co. 4.375% 15/11/2016 200,000 EUR 200,004 208,130 0.08 Cargill, Inc. 6.25% 24/7/2015 "EMTN" 500,000 EUR 498,435 555,925 0.20 Citigroup, Inc. 3.95% 10/10/2013 "EMTN" 2,000,000 EUR 1,862,879 1,975,600 0.73 Citigroup, Inc. FRN 30/11/2017 "EMTN" 750,000 EUR 749,581 648,270 0.24 Credit Suisse Group Finance US, Inc. FRN 14/9/2020 560,000 EUR 559,934 530,258 0.20 Daimler Finance North America LLC 4.375% 21/3/2013 "EMTN" 1,000,000 EUR 993,816 1,035,370 0.38 Daimler Finance North America LLC 5% 23/5/2012 "EMTN" 400,000 EUR 399,203 419,476 0.15 General Electric Capital Corp. FRN 15/9/2067 250,000 EUR 248,148 196,085 0.07 Goldman Sachs Group, Inc. (The) 5.125% 16/10/2014 1,750,000 EUR 1,713,707 1,832,600 0.68 Goldman Sachs Group, Inc. (The) 6.375% 2/5/2018 "EMTN" 593,000 EUR 589,621 652,087 0.24 IntesaBci Capital Trust FRN Perpetual 750,000 EUR 871,244 708,180 0.26 John Deere Capital Corp. 7.5% 24/1/2014 "EMTN" 850,000 EUR 846,499 974,295 0.36 JPMorgan Chase & Co. FRN 31/3/2018 "EMTN" 750,000 EUR 730,052 745,943 0.28 JPMorgan Chase & Co. FRN 12/11/2019 "EMTN" 750,000 EUR 756,720 745,553 0.27 JPMorgan Chase Bank NA FRN 30/11/2021 1,000,000 EUR 755,838 972,420 0.36 Kraft Foods, Inc. 5.75% 20/3/2012 1,000,000 EUR 998,517 1,054,190 0.39 Manpower, Inc. 4.75% 14/6/2013 "EMTN" 50,000 EUR 49,842 48,356 0.02 Merrill Lynch & Co., Inc. 4.45% 31/1/2014 "EMTN" 1,500,000 EUR 1,460,029 1,514,130 0.56 Merrill Lynch & Co., Inc. 6.75% 21/5/2013 "EMTN" 450,000 EUR 448,547 487,534 0.18 Metropolitan Life Global Funding I 4.625% 16/5/2017 "EMTN" 1,000,000 EUR 996,073 944,660 0.35 Morgan Stanley 3.75% 1/3/2013 "EMTN" 1,500,000 EUR 1,488,911 1,498,770 0.55 Morgan Stanley 6.5% 15/4/2011 "GMTN" 800,000 EUR 801,869 837,568 0.31 Morgan Stanley 6.5% 28/12/2018 "GMTN" 400,000 EUR 397,483 433,196 0.16 New York Life Global Funding 4.375% 19/1/2017 "EMTN" 1,500,000 EUR 1,497,231 1,458,450 0.54 Parker Hannifin Corp. 4.125% 11/11/2015 1,500,000 EUR 1,438,617 1,490,490 0.55 Pfizer, Inc. 3.625% 3/6/2013 350,000 EUR 348,731 362,855 0.13 Pfizer, Inc. 4.75% 3/6/2016 1,000,000 EUR 1,031,648 1,073,700 0.40 Pfizer, Inc. 5.75% 3/6/2021 250,000 EUR 248,869 281,972 0.10 PLD International Finance LLC 4.375% 13/4/2011 800,000 EUR 805,586 804,392 0.30 PPG Industries, Inc. 3.875% 24/6/2015 1,000,000 EUR 997,669 979,840 0.36 Procter & Gamble Co. (The) 4.875% 11/5/2027 250,000 EUR 247,858 249,625 0.09
Quantity/ Aquisition % net
Description Nominal Currency cost Evaluation assets

124 The accompanying notes form an integral part of these financial statements.
INTERNATIONAL OPPORTUNITIES FUNDS
EUROPEAN INVESTMENT GRADE BOND (continued)
Statement of Investment as at December 31, 2009
(expressed in EUR)
Roche Holdings, Inc. 4.625% 4/3/2013 "EMTN" 500,000 EUR 498,302 531,240 0.20 Roche Holdings, Inc. 5.625% 4/3/2016 "EMTn" 1,000,000 EUR 1,104,417 1,123,890 0.41 Roche Holdings, Inc. 6.5% 4/3/2021 "EMTN" 562,000 EUR 557,290 664,616 0.24 SanPaolo IMI Capital FRN Perpetual 900,000 EUR 1,079,605 864,837 0.32 Schering-Plough Corp. 5.375% 1/10/2014 970,000 EUR 1,009,512 1,061,907 0.39 SG Capital Trust I LLC FRN Perpetual 850,000 EUR 1,002,966 829,166 0.31 Swiss Re Treasury US Corp. 7% 19/5/2014 "EMTN" 500,000 EUR 499,317 561,295 0.21 Toyota Motor Credit Corp. 5.25% 3/2/2012 "EMTN" 1,000,000 EUR 998,163 1,057,010 0.39 Verizon Wireless Capital LLC 8.75% 18/12/2015 500,000 EUR 590,199 633,580 0.23 Wachovia Bank NA 6% 23/5/2013 "EMTN" 700,000 EUR 699,882 754,082 0.28 Wal-Mart Stores, Inc. 4.875% 21/9/2029 800,000 EUR 790,600 781,800 0.29 Washington Mutual Bank 4.5% 17/1/2017 "GMTN" 500,000 EUR 498,846 50 0.00 Wells Fargo & Co. 4% 17/5/2011 "EMTN" 1,000,000 EUR 999,462 1,024,750 0.38 Zurich Finance USA, Inc. FRN 15/6/2025 "EMTN" 400,000 EUR 400,340 372,248 0.14
44,132,478 44,472,627 16.40
Total Bonds 235,594,168 240,462,911 88.69
SECURITISED ASSETS
IrelandDECO Series FRN 27/7/2017 "9-E3X A1" 1,732,678 EUR 1,719,476 1,472,776 0.54 DECO Series FRN 27/1/2018 "7-E2X A2" 517,915 EUR 504,579 367,720 0.14 DECO Series FRN 27/4/2018 "2007-E6X A1" 1,882,279 EUR 1,882,279 1,524,646 0.56 Epic FRN 25/1/2022 "A" 2,298,585 EUR 2,189,543 1,494,080 0.55 European Loan Conduit FRN 15/5/2017 "28X A" 1,349,637 EUR 1,348,695 917,753 0.34 Fleet Street Finance PLC FRN 25/10/2016 "3 A1" 930,402 EUR 930,402 797,913 0.29 German Residential Asset Note Distributor PLC FRN 20/7/2016 "1 A" 1,742,640 EUR 1,693,429 1,450,676 0.54 Hipototta PLC FRN 30/9/2048 "4 A" 530,731 EUR 530,393 473,511 0.17 Titan Europe PLC (Ireland) FRN 23/1/2016 "2006-1X A" 138,055 EUR 138,031 111,134 0.04 Titan Europe PLC (Ireland) FRN 23/1/2016 "2006-2X C" 881,470 EUR 882,074 220,367 0.08 Titan Europe PLC (Ireland) FRN 23/4/2017 "2007-2X A1" 498,666 EUR 498,666 299,200 0.11
12,317,567 9,129,776 3.36
LuxembourgVolkswagen Car Lease FRN 21/1/2013 "10 A" 214,011 EUR 214,011 213,213 0.08 Volkswagen Car Lease FRN 21/8/2015 "11 A" 701,417 EUR 701,417 702,625 0.26
915,428 915,838 0.34
NetherlandsArena BV FRN 17/11/2041 "2009-1 A1" 600,000 EUR 600,000 601,320 0.22 E-MAC NL BV FRN 25/2/2048 "DE06-II A1" 569,866 EUR 569,866 420,832 0.16
1,169,866 1,022,152 0.38
SpainFondo de Titulizacion de Activos Santander Auto FRN 25/11/2021 "1 A" 231,843 EUR 231,547 229,338 0.08
United KingdomArkle Master Issuer PLC FRN 17/2/2052 "2006-2X 3A2" 650,000 EUR 650,000 639,015 0.23 Business Mortgage Finance PLC FRN 15/8/2040 "6 A2" 956,665 EUR 920,263 502,249 0.18 Gracechurch Card Funding PLC FRN 15/10/2012 "10 A1" 2,000,000 EUR 1,976,060 1,950,308 0.72 Holmes Master Issuer PLC FRN 15/7/2040 "2007-1 3A2" 600,000 EUR 600,000 588,798 0.22 Permanent Financing PLC FRN 10/9/2032 "8 4A" 2,000,000 EUR 1,971,616 1,974,688 0.73 Pillar Funding PLC FRN 15/11/2012 "2005-1 A" 2,000,000 EUR 1,998,511 1,970,600 0.73
8,116,450 7,625,658 2.81
Quantity/ Aquisition % net
Description Nominal Currency cost Evaluation assets

The accompanying notes form an integral part of these financial statements. 125
INTERNATIONAL OPPORTUNITIES FUNDS
EUROPEAN INVESTMENT GRADE BOND (continued)
Statement of Investment as at December 31, 2009
(expressed in EUR)
United States of AmericaCitibank Credit Card Issuance Trust 5.375% 10/4/2013 "2001-A4 A4" 2,000,000 EUR 1,929,954 1,996,391 0.74 MBNA Credit Card Master Note Trust 5.6% 17/7/2014 "2002-A2 A" 1,000,000 EUR 995,335 1,028,792 0.38
2,925,289 3,025,183 1.12
Total Securitised Assets 25,676,147 21,947,945 8.09
Total Transferable Securities Admitted to an Official Stock Exchange Listing
or Dealt in on Another Regulated Market 261,270,315 262,410,856 96.78
Unlisted Securities
BONDS
United States of AmericaUS Bank NA (Cincinnati OH) FRN 28/2/2017 "EMTN" 1,250,000 EUR 1,153,213 1,207,550 0.45
Total Unlisted Securities 1,153,213 1,207,550 0.45
Total Investments 262,423,528 263,618,406 97.23
Other Net Assets 7,513,440 2.77
Total Net Assets 271,131,846 100.00
Quantity/ Aquisition % net
Description Nominal Currency cost Evaluation assets

126 The accompanying notes form an integral part of these financial statements.
INTERNATIONAL OPPORTUNITIES FUNDS
GLOBAL MARKET NAVIGATOR
Statement of Investment as at December 31, 2009
(expressed in USD)
Quantity/ Aquisition % net
Description Nominal Currency cost Evaluation assets
Transferable Securities Admitted to an Official Stock Exchange Listingor Dealt in on Another Regulated Market
MUTUAL FUNDS
IrelandIShares PLC – iShares FTSE 100 135,000 GBP 1,160,395 1,180,031 5.18
United States of AmericaiShares Barclays 1-3 Year Credit Bond Fund 21,500 USD 2,246,552 2,232,130 9.81 iShares iBoxx Investment Grade Corporate Bond Fund – ETP 41,000 USD 4,079,860 4,266,870 18.75
6,326,412 6,499,000 28.56
Total Mutual Funds 7,486,807 7,679,031 33.74
BONDS
BrazilBrazil Notas do Tesouro Nacional Serie F 10% 1/1/2017 "NTNF" 2,000,000 BRL 1,061,391 1,040,683 4.57
GreeceHellenic Republic Government Bond 6% 19/7/2019 "10YR" 500,000 EUR 726,470 726,354 3.19
IndonesiaIndonesia Treasury Bond 10% 15/9/2024 "FR44" 11,000,000,000 IDR 1,118,274 1,114,015 4.90
MexicoMexican Bonos 8.5% 31/5/2029 "M 20" 17,000,000 MXN 1,309,957 1,290,627 5.67
PhilippinesPhilippine Government Bond 8.5% 3/3/2011 "5-62" 60,000,000 PHP 1,339,783 1,350,069 5.93
Russian FederationRussian Foreign Bond – Eurobond 12.75% 24/6/2028 600,000 USD 875,290 1,017,000 4.47
South KoreaKorea Treasury Bond 5.5% 10/6/2011 "1106" 2,000,000,000 KRW 1,714,577 1,757,685 7.72
Total Bonds 8,145,742 8,296,433 36.45
Total Investments 15,632,549 15,975,464 70.19
Other Net Assets 6,784,923 29.81
Total Net Assets 22,760,387 100.00

The accompanying notes form an integral part of these financial statements. 127
INTERNATIONAL OPPORTUNITIES FUNDS
GLOBAL TECHNOLOGY
Statement of Investment as at December 31, 2009
(expressed in USD)
Quantity/ Aquisition % net
Description Nominal Currency cost Evaluation assets
Transferable Securities Admitted to an Official Stock Exchange Listingor Dealt in on Another Regulated Market
SHARES
ArgentinaMercadoLibre, Inc. 14,091 USD 269,710 736,958 1.17
BermudaMarvell Technology Group Ltd 51,271 USD 810,896 1,074,384 1.70 Xyratex Ltd 11,756 USD 125,476 159,882 0.25
936,372 1,234,266 1.95
CanadaCelestica, Inc. 34,206 USD 309,620 329,062 0.52
Cayman IslandsASM Pacific Technology Ltd 18,000 HKD 154,832 171,432 0.27 Seagate Technology 32,866 USD 503,134 606,378 0.96
657,966 777,810 1.23
ChinaBaidu, Inc. (China) – ADR 1,665 USD 369,679 691,874 1.09 Ctrip.com International Ltd – ADR 16,487 USD 665,032 1,186,240 1.88 Tencent Holdings Ltd 31,603 HKD 196,561 686,746 1.09
1,231,272 2,564,860 4.06
GermanySAP AG 6,589 EUR 289,900 312,420 0.50
NetherlandsASM International NV 16,946 EUR 355,773 432,308 0.68 ASML Holding NV 12,224 EUR 360,826 421,532 0.67 VistaPrint NV 20,788 USD 410,475 1,187,203 1.88
1,127,074 2,041,043 3.23
South KoreaLG Display Co., Ltd 11,160 KRW 323,735 376,161 0.59 NHN Corp. 4,365 KRW 550,509 719,706 1.14 Samsung Electronics Co., Ltd 1,268 KRW 553,825 870,033 1.38
1,428,069 1,965,900 3.11
SwitzerlandTemenos Group AG 19,212 CHF 375,791 499,210 0.79
TaiwanCompal Electronics, Inc. 309,000 TWD 415,912 428,455 0.68 HON HAI Precision Industry Co., Ltd 261,050 TWD 902,570 1,236,488 1.96 MediaTek, Inc. 54,489 TWD 468,230 950,597 1.50 Radiant Opto-Electronics Corp. 321,702 TWD 362,432 468,195 0.74 Siliconware Precision Industries Co. 493,000 TWD 690,284 668,174 1.06 Taiwan Semiconductor Manufacturing Co., Ltd 311,169 TWD 512,000 627,494 0.99 Wistron Corp. 322,894 TWD 373,663 626,910 0.99
3,725,091 5,006,313 7.92
United KingdomAutonomy Corp. PLC 44,162 GBP 604,132 1,079,538 1.71 Rightmove PLC 31,705 GBP 287,191 258,770 0.41
891,323 1,338,308 2.12

128 The accompanying notes form an integral part of these financial statements.
INTERNATIONAL OPPORTUNITIES FUNDS
GLOBAL TECHNOLOGY (continued)
Statement of Investment as at December 31, 2009
(expressed in USD)
United States of AmericaActivision Blizzard, Inc. 27,287 USD 283,454 308,616 0.49 Adobe Systems, Inc. 19,344 USD 626,870 718,630 1.14 Amazon.com, Inc. 3,834 USD 265,223 523,839 0.83 Apple, Inc. 22,810 USD 2,387,170 4,833,895 7.65 Atheros Communications, Inc. 7,394 USD 251,417 254,354 0.40 Cisco Systems, Inc. 175,387 USD 3,648,050 4,226,827 6.69 Cognizant Technology Solutions Corp. "A" 20,706 USD 527,960 949,546 1.50 comScore, Inc. 10,220 USD 183,191 179,055 0.28 Concur Technologies, Inc. 11,061 USD 369,869 476,065 0.75 Corning, Inc. 59,422 USD 910,050 1,149,816 1.82 Dell, Inc. 48,496 USD 789,264 705,617 1.12 F5 Networks, Inc. 12,388 USD 589,108 655,449 1.04 First Solar, Inc. 2,214 USD 325,005 302,215 0.48 Google, Inc. "A" 6,403 USD 2,240,623 3,991,374 6.32 GSI Commerce, Inc. 20,063 USD 409,161 514,014 0.81 Hewlett-Packard Co. 50,946 USD 1,735,413 2,674,156 4.23 Intel Corp. 116,791 USD 1,682,507 2,414,070 3.82 International Business Machines Corp. 25,741 USD 2,066,229 3,411,712 5.40 Intuit, Inc. 16,035 USD 377,261 495,177 0.78 Juniper Networks, Inc. 19,239 USD 469,264 520,800 0.82 McAfee, Inc. 10,641 USD 310,997 436,281 0.69 Micron Technology, Inc. 48,936 USD 352,417 527,530 0.84 MICROS Systems, Inc. 10,207 USD 298,990 326,318 0.52 Microsoft Corp. 139,583 USD 3,312,997 4,314,510 6.83 NetApp, Inc. 38,542 USD 1,094,655 1,342,803 2.13 NetFlix, Inc. 9,617 USD 364,224 536,725 0.85 Nuance Communications, Inc. 52,991 USD 672,529 841,497 1.33 ON Semiconductor Corp. 98,213 USD 654,336 870,167 1.38 Oracle Corp. 94,577 USD 1,542,322 2,355,440 3.73 priceline.com, Inc. 5,490 USD 603,970 1,215,870 1.92 QUALCOMM, Inc. 34,293 USD 1,114,065 1,601,209 2.53 Red Hat, Inc. 15,729 USD 430,138 489,958 0.78 Skyworks Solutions, Inc. 59,723 USD 599,784 856,010 1.36 Tekelec 10,617 USD 141,555 164,033 0.26 Texas Instruments, Inc. 11,971 USD 296,236 312,802 0.50
31,926,304 45,496,380 72.02
Total Transferable Securities Admitted to an Official Stock Exchange Listing
or Dealt in on Another Regulated Market 43,168,492 62,302,530 98.62
Unlisted Securities
CanadaExcapsa Software, Inc. 1,140,000 USD 1,152,669 114,000 0.18
Total Unlisted Securities 1,152,669 114,000 0.18
Total Investments 44,321,161 62,416,530 98.80
Other Net Assets 754,905 1.20
Total Net Assets 63,171,435 100.00
Quantity/ Aquisition % net
Description Nominal Currency cost Evaluation assets

The accompanying notes form an integral part of these financial statements. 129
INTERNATIONAL OPPORTUNITIES FUNDS
GREATER CHINA EQUITY
Statement of Investment as at December 31, 2009
(expressed in USD)
Quantity/ Aquisition % net
Description Nominal Currency cost Evaluation assets
Transferable Securities Admitted to an Official Stock Exchange Listingor Dealt in on Another Regulated Market
SHARES
Cayman IslandsChina Resources Cement Holdings Ltd 1,404,000 HKD 712,066 697,101 0.92
ChinaAAC Acoustic Technologies Holdings, Inc. 1,188,000 HKD 578,648 1,964,140 2.59 Bank of China Ltd "H" 6,259,000 HKD 2,950,773 3,390,176 4.46 Byd Co., Ltd "H" 139,500 HKD 244,029 1,231,447 1.62 China Coal Energy Co. "H" 909,000 HKD 2,088,289 1,669,329 2.20 China Construction Bank Corp. "H" 2,918,000 HKD 2,343,184 2,510,031 3.31 China Life Insurance Co., Ltd "H" 368,000 HKD 835,991 1,820,041 2.40 China Pacific Insurance Group Co., Ltd "H" 261,000 HKD 951,673 1,040,081 1.37 China Petroleum & Chemical Corp. "H" 1,406,000 HKD 1,766,599 1,252,943 1.65 China Shanshui Cement Group Ltd 969,000 HKD 735,157 707,307 0.93 China Shipping Container Lines Co., Ltd "H" 2,002,000 HKD 409,927 722,920 0.95 China Zhongwang Holdings Ltd 1,291,200 HKD 1,233,946 1,039,073 1.37 CHT Holdings Ltd (China) 1,393,000 SGD 664,207 59,602 0.08 Focus Media Holding Ltd – ADR 88,700 USD 1,248,305 1,381,059 1.82 Industrial & Commercial Bank of China "H" 4,552,000 HKD 2,270,320 3,780,560 4.98 Li Ning Co., Ltd 289,500 HKD 600,162 1,101,384 1.45 Longfor Properties Co., Ltd 43,000 HKD 39,623 48,523 0.06 Ping An Insurance Group Company of China Ltd "H" 65,000 HKD 497,426 570,020 0.75 Sohu.com, Inc. 11,900 USD 579,802 683,893 0.90 Travelsky Technology LTD 1,455,000 HKD 596,083 1,469,240 1.93
20,634,144 26,441,769 34.82
Hong KongBOC Hong Kong Holdings Ltd 506,500 HKD 1,200,331 1,149,635 1.51 Cheung Kong Holdings Ltd 92,000 HKD 1,036,698 1,190,027 1.57 China Mobile Ltd 249,500 HKD 1,848,136 2,344,057 3.09 China Power International Development Ltd 1,649,000 HKD 503,522 414,690 0.55 China Resources Land Ltd 454,000 HKD 723,296 1,032,815 1.36 China Unicom Hong Kong Ltd 810,572 HKD 1,140,661 1,074,615 1.41 CNOOC Ltd 1,558,000 HKD 2,366,856 2,451,293 3.23 Dah Sing Financial Holdings Ltd 93,600 HKD 371,854 519,054 0.68 Esprit Holdings Ltd 84,800 HKD 712,400 565,945 0.75 Franshion Properties China Ltd 3,116,000 HKD 739,810 1,101,073 1.45 GOME Electrical Appliances Holdings Ltd 2,568,680 HKD 1,055,949 934,173 1.23 Hang Lung Properties Ltd 100,000 HKD 186,201 394,629 0.52 Hang Seng Bank Ltd 115,000 HKD 1,399,180 1,701,098 2.24 Hong Kong Exchanges and Clearing Ltd 30,600 HKD 682,185 550,113 0.72 Huabao International Holdings Ltd 672,000 HKD 497,968 725,375 0.95 Industrial & Commercial Bank of China Asia Ltd 161,814 HKD 417,120 352,672 0.46 Kerry Properties Ltd 247,276 HKD 995,229 1,259,642 1.66 NWS Holdings Ltd 414,279 HKD 965,519 764,006 1.01 SJM Holdings Ltd 1,934,000 HKD 623,540 1,067,501 1.41 Sun Hung Kai Properties Ltd 67,000 HKD 663,281 1,004,899 1.32 Swire Pacific Ltd 42,500 HKD 484,009 515,211 0.68 Techtronic Industries Co. 387,500 HKD 518,939 324,328 0.43 Varitronix International Ltd 716,000 HKD 482,270 224,382 0.30 VTech Holdings Ltd 43,000 HKD 113,062 412,027 0.54 Wharf Holdings Ltd 269,000 HKD 1,187,655 1,552,435 2.04
20,915,671 23,625,695 31.11
TaiwanAcer, Inc. 623,782 TWD 1,261,411 1,876,123 2.47 AU Optronics Corp. 653,687 TWD 911,780 792,967 1.05 Chinatrust Financial Holding Co., Ltd 1,865,999 TWD 707,746 1,163,879 1.53

130 The accompanying notes form an integral part of these financial statements.
INTERNATIONAL OPPORTUNITIES FUNDS
GREATER CHINA EQUITY (continued)
Statement of Investment as at December 31, 2009
(expressed in USD)
Chunghwa Telecom Co., Ltd 413,443 TWD 708,314 769,106 1.01 Delta Electronics, Inc. 393,840 TWD 923,118 1,231,327 1.62 Far Eastern Textile Co., Ltd 1,136,202 TWD 1,147,287 1,420,918 1.87 HON HAI Precision Industry Co., Ltd 571,407 TWD 1,431,078 2,706,523 3.57 Lite-On Technology Corp. 1,130,000 TWD 1,282,329 1,697,561 2.24 MediaTek, Inc. 47,094 TWD 379,039 821,586 1.08 Powertech Technology, Inc. 642,000 TWD 1,593,653 2,177,801 2.87 Siliconware Precision Industries Co. 1,016,000 TWD 1,331,264 1,377,007 1.81 Taiwan Cement Corp. 1,134,520 TWD 1,668,928 1,205,992 1.59 Taiwan Fertilizer Co., Ltd 431,000 TWD 863,231 1,536,157 2.02 Taiwan Semiconductor Manufacturing Co., Ltd 1,043,165 TWD 1,903,706 2,103,615 2.77 U-Ming Marine Transport Corp. 209,000 TWD 494,886 424,730 0.56 Yuanta Financial Holding Co., Ltd 1,652,000 TWD 1,097,842 1,213,756 1.60
17,705,612 22,519,048 29.66
Total Transferable Securities Admitted to an Official Stock Exchange Listing
or Dealt in on Another Regulated Market 59,967,493 73,283,613 96.51
Unlisted Securities
SHARES
BermudaEuro-Asia Agricultural Holdings Co., Ltd 562,000 HKD 115,340 – 0.00
Total Unlisted Securities 115,340 – 0.00
Total Investments 60,082,833 73,283,613 96.51
Other Net Assets 2,650,567 3.49
Total Net Assets 75,934,180 100.00
Quantity/ Aquisition % net
Description Nominal Currency cost Evaluation assets

The accompanying notes form an integral part of these financial statements. 131
INTERNATIONAL OPPORTUNITIES FUNDS
HONG KONG EQUITY
Statement of Investment as at December 31, 2009
(expressed in USD)
Quantity/ Aquisition % net
Description Nominal Currency cost Evaluation assets
Transferable Securities Admitted to an Official Stock Exchange Listingor Dealt in on Another Regulated Market
SHARES
ChinaAAC Acoustic Technologies Holdings, Inc. 15,497,000 HKD 13,552,751 25,621,448 3.02
Hong KongBank of East Asia Ltd 3,666,562 HKD 16,065,203 14,587,545 1.72 BOC Hong Kong Holdings Ltd 16,905,500 HKD 35,033,206 38,371,493 4.51 Cheung Kong Holdings Ltd 5,003,000 HKD 70,483,386 64,714,179 7.61 Cheung Kong Infrastructure Holdings Ltd 3,242,000 HKD 12,220,301 12,354,879 1.45 CLP Holdings Ltd 6,118,500 HKD 43,540,174 41,386,478 4.87 Esprit Holdings Ltd 4,422,100 HKD 50,533,264 29,512,563 3.47 GOME Electrical Appliances Holdings Ltd 27,523,500 HKD 11,295,386 10,009,694 1.18 Hang Lung Properties Ltd 7,115,000 HKD 14,948,882 28,077,882 3.30 Hang Seng Bank Ltd 4,319,800 HKD 70,783,632 63,899,149 7.51 Henderson Land Development Co., Ltd 5,765,000 HKD 36,725,270 43,419,036 5.10 Hong Kong & China Gas Co., Ltd 10,367,483 HKD 25,120,030 26,072,097 3.07 Hong Kong Exchanges and Clearing Ltd 2,178,300 HKD 48,019,940 39,160,523 4.60 Hongkong Electric Holdings Ltd 2,569,000 HKD 14,939,534 13,981,204 1.64 Hutchison Whampoa Ltd 8,472,137 HKD 85,407,100 58,344,811 6.86 Industrial & Commercial Bank of China Asia Ltd 2,710,613 HKD 6,191,137 5,907,752 0.69 Kerry Properties Ltd 4,889,778 HKD 27,842,820 24,908,883 2.93 Kingboard Chemical Holdings Ltd 2,294,500 HKD 11,739,481 9,113,953 1.07 Li & Fung Ltd 6,041,400 HKD 21,171,676 25,126,692 2.95 Link REIT (The) – REIT 12,761,081 HKD 27,570,224 32,618,135 3.84 MTR Corp. 7,963,793 HKD 22,920,791 27,524,711 3.24 New World Development Ltd 7,807,900 HKD 17,035,349 16,070,713 1.89 NWS Holdings Ltd 11,632,710 HKD 28,423,202 21,452,848 2.52 Orient Overseas International Ltd 2,506,500 HKD 11,534,972 11,733,899 1.38 Sun Hung Kai Properties Ltd 4,898,340 HKD 76,423,018 73,467,736 8.64 Swire Pacific Ltd 2,732,500 HKD 35,641,830 33,125,011 3.89 Television Broadcasts Ltd 977,000 HKD 3,047,378 4,706,014 0.55 Wharf Holdings Ltd 6,918,250 HKD 28,909,346 39,926,138 4.69
853,566,532 809,574,018 95.17
Total Investments 867,119,283 835,195,466 98.19
Other Net Assets 15,434,199 1.81
Total Net Assets 850,629,665 100.00

132 The accompanying notes form an integral part of these financial statements.
INTERNATIONAL OPPORTUNITIES FUNDS
INDIA EQUITY
Statement of Investment as at December 31, 2009
(expressed in USD)
Quantity/ Aquisition % net
Description Nominal Currency cost Evaluation assets
Transferable Securities Admitted to an Official Stock Exchange Listingor Dealt in on Another Regulated Market
SHARES
IndiaAban Offshore Ltd 73,465 INR 2,348,989 2,026,504 1.40 Axis Bank Ltd 131,414 INR 2,382,745 2,793,484 1.92 Bharat Electronics Ltd 105,959 INR 2,135,495 4,419,722 3.04 Bharat Heavy Electricals Ltd 44,154 INR 1,519,091 2,280,334 1.57 Cairn India Ltd 593,443 INR 2,326,805 3,598,152 2.48 Dr Reddys Laboratories Ltd 167,701 INR 2,251,607 4,132,073 2.84 GAIL India Ltd 534,792 INR 2,953,190 4,749,750 3.27 GVK Power & Infrastructure Ltd 1,726,564 INR 1,587,690 1,723,411 1.19 HDFC Bank Ltd 145,857 INR 3,472,608 5,335,450 3.67 Hero Honda Motors Ltd 99,131 INR 2,111,126 3,659,125 2.52 Hindalco Industries Ltd 1,409,228 INR 3,431,610 4,871,052 3.35 Hindustan Zinc Ltd 107,821 INR 1,802,623 2,803,324 1.93 Housing Development Finance Corp. 118,402 INR 5,779,861 6,808,212 4.69 ICICI Bank Ltd 258,229 INR 3,840,338 4,866,593 3.35 Infosys Technologies Ltd 248,235 INR 8,702,036 13,875,239 9.55 Infrastructure Development Finance Co., Ltd 932,157 INR 2,082,382 3,090,832 2.13 ITC Ltd 649,190 INR 2,898,753 3,498,805 2.41 IVRCL Infrastructures & Projects Ltd 185,354 INR 542,100 1,397,076 0.96 Kotak Mahindra Bank Ltd 172,602 INR 2,741,398 2,993,042 2.06 Larsen & Toubro Ltd 38,380 INR 874,586 1,383,610 0.95 LIC Housing Finance Ltd 118,872 INR 1,991,710 2,050,725 1.41 Marico Ltd 1,539,567 INR 1,949,895 3,412,622 2.35 Maruti Suzuki India Ltd 103,364 INR 1,934,577 3,465,310 2.39 MAX India Ltd 339,300 INR 1,432,103 1,619,031 1.12 Mphasis Ltd 407,179 INR 1,974,014 6,336,717 4.36 NTPC Ltd 270,804 INR 1,046,116 1,371,333 0.94 Oil & Natural Gas Corp., Ltd 118,395 INR 2,308,887 2,997,085 2.06 OnMobile Global Ltd 149,618 INR 1,259,304 1,455,348 1.00 Ranbaxy Laboratories Ltd 381,796 INR 3,880,989 4,249,518 2.93 Reliance Industries Ltd 512,476 INR 10,140,292 12,009,904 8.27 Rural Electrification Corp., Ltd 593,787 INR 1,292,073 3,098,131 2.13 Sterlite Industries India Ltd 347,963 INR 2,705,242 6,457,151 4.45 Sterlite Industries India Ltd – ADR 10,300 USD 125,145 190,138 0.13 Sun TV Network Ltd 334,934 INR 1,512,351 2,474,489 1.70 Suzlon Energy Ltd 428,474 INR 791,308 831,904 0.57 Tata Motors Ltd "A" – DVR 352,647 INR 3,433,661 3,756,467 2.59 Unitech Ltd 1,338,416 INR 2,013,974 2,367,071 1.63 Wipro Ltd 129,599 INR 1,754,397 1,893,786 1.30
Total Investments 97,331,071 140,342,520 96.61
Other Net Assets 4,930,734 3.39
Total Net Assets 145,273,254 100.00

The accompanying notes form an integral part of these financial statements. 133
INTERNATIONAL OPPORTUNITIES FUNDS
INDONESIA EQUITY
Statement of Investment as at December 31, 2009
(expressed in USD)
Quantity/ Aquisition % net
Description Nominal Currency cost Evaluation assets
Transferable Securities Admitted to an Official Stock Exchange Listingor Dealt in on Another Regulated Market
SHARES
IndonesiaAdaro Energy PT 12,610,500 IDR 1,889,187 2,322,104 2.66 AKR Corporindo Tbk PT 7,877,000 IDR 853,284 980,957 1.13 Aneka Tambang Tbk PT 1,779,500 IDR 333,630 416,700 0.48 Astra Agro Lestari Tbk PT 400,000 IDR 731,826 968,600 1.11 Astra International Tbk PT 1,631,000 IDR 4,468,106 6,024,023 6.91 Bakrie and Brothers Tbk PT 29,126,750 IDR 681,183 263,520 0.30 Bakrie Sumatera Plantations Tbk PT 1,310,500 IDR 97,692 80,904 0.09 Bakrieland Development Tbk PT 6,298,500 IDR 134,142 129,389 0.15 Bank Central Asia Tbk PT 9,132,700 IDR 3,765,525 4,714,592 5.41 Bank CIMB Niaga Tbk PT 6,643,929 IDR 402,982 502,096 0.58 Bank Danamon Indonesia Tbk PT 2,352,068 IDR 955,630 1,139,107 1.31 Bank Mandiri Tbk PT 11,072,500 IDR 4,497,462 5,539,196 6.36 Bank Negara Indonesia Persero Tbk PT 12,227,000 IDR 2,102,817 2,576,845 2.96 Bank Pan Indonesia Tbk PT 4,444,700 IDR 309,967 359,550 0.41 Bank Permata Tbk PT 1,075,500 IDR 93,846 91,581 0.10 Bank Rakyat Indonesia 6,557,000 IDR 4,653,818 5,339,121 6.13 Berlian Laju Tanker Tbk PT 1,184,666 IDR 218,051 81,962 0.09 Bumi Resources Tbk PT 7,632,000 IDR 1,866,217 1,969,941 2.26 Bumi Serpong Damai PT 3,398,280 IDR 187,658 318,306 0.36 Central Proteinaprima Tbk PT 8,155,050 IDR 181,042 52,081 0.06 Ciputra Development Tbk PT 17,836,375 IDR 960,780 920,771 1.06 Delta Dunia Makmur Tbk PT 10,700,900 IDR 1,733,483 1,924,909 2.21 Global Mediacom Tbk PT 2,548,500 IDR 75,183 56,965 0.07 Gudang Garam Tbk PT 1,361,500 IDR 1,628,361 3,122,972 3.58 Hexindo Adiperkasa Tbk PT 1,829,000 IDR 586,974 613,236 0.70 Holcim Indonesia Tbk PT (Foreign Market) 1,985,200 IDR 268,926 327,521 0.38 Indah Kiat Pulp and Paper Corp Tbk PT 950,000 IDR 202,288 175,945 0.20 Indika Energy Tbk PT 2,488,500 IDR 610,789 589,347 0.68 Indo Tambangraya Megah PT 834,500 IDR 2,073,287 2,824,598 3.24 Indocement Tunggal Prakarsa Tbk PT 1,401,000 IDR 1,263,691 2,042,970 2.34 Indofood Sukses Makmur Tbk PT 2,254,500 IDR 496,225 851,887 0.98 Indosat Tbk PT 1,882,500 IDR 941,559 946,760 1.09 International Nickel Indonesia Tbk PT 2,772,000 IDR 1,147,657 1,076,934 1.24 Jasa Marga PT 2,523,000 IDR 327,240 486,070 0.56 Kalbe Farma Tbk PT 3,794,000 IDR 483,816 524,981 0.60 Mayora Indah Tbk PT 1,428,454 IDR 584,107 684,198 0.78 Medco Energi Internasional Tbk PT 1,117,500 IDR 343,898 291,418 0.33 Media Nusantara Citra MNC PT 24,916,000 IDR 788,420 556,930 0.64 Mitra Adiperkasa Tbk PT 13,602,500 IDR 879,829 897,664 1.03 Panin Life Tbk PT 9,236,500 IDR 141,255 137,638 0.16 Perusahaan Gas Negara PT 9,571,500 IDR 2,863,423 3,973,267 4.56 Perusahaan Perkebunan London Sumatra Indonesia Tbk PT 1,208,000 IDR 940,176 1,073,635 1.23 Ramayana Lestari Sentosa Tbk PT 2,195,500 IDR 153,536 144,887 0.17 Sampoerna Agro PT 2,458,500 IDR 548,973 706,541 0.81 Semen Gresik Persero Tbk PT 3,896,500 IDR 2,412,488 3,131,301 3.59 Summarecon Agung Tbk PT 2,001,000 IDR 76,487 127,791 0.15 Tambang Batubara Bukit Asam Tbk PT 1,005,500 IDR 1,119,834 1,846,181 2.12 Telekomunikasi Indonesia Tbk PT 7,819,500 IDR 7,059,338 7,865,276 9.02 Timah Tbk PT 1,873,000 IDR 358,499 398,723 0.46 Truba Alam Manunggal Engineering PT 3,182,000 IDR 367,060 42,675 0.05 Unilever Indonesia Tbk PT 2,107,000 IDR 2,010,988 2,478,164 2.84 United Tractors Tbk PT 1,573,250 IDR 1,836,199 2,595,569 2.98
Total Transferable Securities Admitted to an Official Stock Exchange Listing
or Dealt in on Another Regulated Market 63,708,834 77,308,299 88.71

134 The accompanying notes form an integral part of these financial statements.
INTERNATIONAL OPPORTUNITIES FUNDS
INDONESIA EQUITY (continued)
Statement of Investment as at December 31, 2009
(expressed in USD)
Unlisted Securities
BONDS
IndonesiaBhakti Investama Tbk PT 6% 23/7/2010 69,851 USD 69,851 66,394 0.08
Total Unlisted Securities 69,851 66,394 0.08
Total Investments 63,778,685 77,374,693 88.79
Other Net Assets 9,772,731 11.21
Total Net Assets 87,147,424 100.00
Quantity/ Aquisition % net
Description Nominal Currency cost Evaluation assets

The accompanying notes form an integral part of these financial statements. 135
INTERNATIONAL OPPORTUNITIES FUNDS
JAPAN DYNAMIC
Statement of Investment as at December 31, 2009
(expressed in USD)
Quantity/ Aquisition % net
Description Nominal Currency cost Evaluation assets
Transferable Securities Admitted to an Official Stock Exchange Listingor Dealt in on Another Regulated Market
SHARES
JapanAdvantest Corp. 1,600 JPY 33,328 41,486 1.06 Ajinomoto Co., Inc. 20,000 JPY 196,385 188,669 4.80 Asahi Kasei Corp. 25,000 JPY 130,037 125,061 3.18 Bridgestone Corp. 4,800 JPY 80,031 84,144 2.14 Chiyoda Corp. 5,000 JPY 29,875 38,542 0.98 Credit Saison Co., Ltd 11,500 JPY 169,853 129,438 3.29 Daiichi Sankyo Co., Ltd 4,200 JPY 77,411 88,252 2.25 East Japan Railway Co. 1,400 JPY 82,956 88,599 2.25 Ebara Corp. 9,000 JPY 37,452 38,618 0.98 Fuji Heavy Industries Ltd 23,000 JPY 111,962 111,584 2.84 Fuji Media Holdings, Inc. 91 JPY 180,531 126,461 3.22 Funai Electric Co., Ltd 1,300 JPY 20,370 65,312 1.66 JS Group Corp. 5,100 JPY 101,442 87,919 2.24 Kaneka Corp. 23,000 JPY 176,113 146,547 3.73 KDDI Corp. 17 JPY 89,728 90,356 2.30 Komeri Co., Ltd 2,100 JPY 60,733 56,261 1.43 Kose Corp. 2,500 JPY 55,389 50,590 1.29 Meitec Corp. 4,800 JPY 100,484 64,945 1.65 Mitsubishi Chemical Holdings Corp. 21,000 JPY 88,860 89,203 2.27 Mitsubishi UFJ Financial Group, Inc. 43,600 JPY 433,415 212,465 5.41 NEC Corp. 41,000 JPY 188,509 105,644 2.69 New Japan Radio Co., Ltd 7,000 JPY 49,025 13,509 0.34 Nippon Thompson Co., Ltd 12,000 JPY 39,970 59,641 1.52 Nissan Motor Co., Ltd 17,000 JPY 135,314 148,456 3.78 NOK Corp. 6,600 JPY 131,558 91,007 2.32 Obic Co., Ltd 480 JPY 99,524 78,711 2.00 Onward Holdings Co., Ltd 17,000 JPY 158,922 105,385 2.68 ORIX Corp. 1,330 JPY 127,633 89,905 2.29 Rohm Co., Ltd 2,700 JPY 209,642 176,400 4.49 Seven & I Holdings Co., Ltd 3,400 JPY 99,586 69,536 1.77 Sompo Japan Insurance, Inc. 12,000 JPY 138,095 76,718 1.95 Sony Corp. 6,900 JPY 209,435 198,620 5.05 Sumisho Computer Systems Corp. 8,400 JPY 142,587 115,284 2.93 Sumitomo Electric Industries Ltd 4,600 JPY 38,417 57,032 1.45 Sumitomo Forestry Co., Ltd 12,700 JPY 120,545 95,844 2.44 Sumitomo Mitsui Financial Group, Inc. 4,600 JPY 364,712 131,173 3.34 Sumitomo Trust & Banking Co., Ltd (The) 13,000 JPY 86,666 63,490 1.62 TECMO KOEI HOLDINGS Co., Ltd 5,000 JPY 66,371 36,656 0.93 Toppan Forms Co., Ltd 2,900 JPY 37,938 30,171 0.77 Toshiba Machine Co., Ltd 15,000 JPY 51,641 57,409 1.46 United Arrows Ltd 5,500 JPY 37,314 45,836 1.17 Yamaha Motor Co., Ltd 11,900 JPY 145,005 149,592 3.81
Total Investments 4,934,764 3,920,471 99.77
Other Net Assets 8,880 0.23
Total Net Assets 3,929,351 100.00

136 The accompanying notes form an integral part of these financial statements.
INTERNATIONAL OPPORTUNITIES FUNDS
JAPAN EQUITY
Statement of Investment as at December 31, 2009
(expressed in USD)
Quantity/ Aquisition % net
Description Nominal Currency cost Evaluation assets
Transferable Securities Admitted to an Official Stock Exchange Listingor Dealt in on Another Regulated Market
SHARES
JapanAeon Co., Ltd 181,400 JPY 3,212,517 1,470,679 0.34 Ajinomoto Co., Inc. 555,000 JPY 5,208,747 5,235,566 1.21 Asahi Glass Co., Ltd 139,000 JPY 1,343,698 1,315,746 0.30 Asahi Kasei Corp. 1,327,000 JPY 7,330,282 6,638,219 1.53 Astellas Pharma, Inc. 69,200 JPY 2,895,398 2,581,338 0.60 Bridgestone Corp. 320,900 JPY 6,154,190 5,625,393 1.30 Canon, Inc. 304,300 JPY 14,489,733 12,827,480 2.96 Dai Nippon Printing Co., Ltd 170,000 JPY 2,523,340 2,164,519 0.50 Daiichi Sankyo Co., Ltd 418,300 JPY 11,270,983 8,789,463 2.03 Daiwa House Industry Co., Ltd 127,000 JPY 1,631,021 1,360,983 0.31 Denso Corp. 58,400 JPY 1,869,342 1,750,331 0.40 East Japan Railway Co. 133,500 JPY 8,361,840 8,448,547 1.95 Ebara Corp. 290,000 JPY 1,184,412 1,244,353 0.29 Fuji Heavy Industries Ltd 455,000 JPY 1,728,721 2,207,428 0.51 Fuji Media Holdings, Inc. 1,937 JPY 3,813,186 2,691,815 0.62 FUJIFILM Holdings Corp. 146,800 JPY 5,372,317 4,415,632 1.02 Fujitsu Ltd 605,000 JPY 4,413,682 3,887,445 0.90 Hitachi Ltd 582,000 JPY 3,539,123 1,781,985 0.41 Honda Motor Co., Ltd 445,900 JPY 14,576,995 14,950,665 3.45 HOYA Corp. 115,200 JPY 3,573,827 3,055,274 0.70 ITOCHU Corp. 408,000 JPY 2,023,993 2,999,903 0.69 JFE Holdings, Inc. 93,400 JPY 2,765,594 3,675,381 0.85 JS Group Corp. 273,200 JPY 4,577,919 4,709,684 1.09 Kaneka Corp. 736,000 JPY 5,229,735 4,689,515 1.08 Kansai Electric Power Co., Inc. (The) 77,600 JPY 1,838,568 1,756,886 0.41 Kao Corp. 112,100 JPY 2,757,614 2,628,618 0.61 KDDI Corp. 970 JPY 5,227,574 5,155,625 1.19 Keyence Corp. 16,720 JPY 3,308,153 3,460,988 0.80 Kobe Steel Ltd 773,000 JPY 2,563,828 1,400,075 0.32 Kose Corp. 42,300 JPY 939,185 855,987 0.20 Kyocera Corp. 50,900 JPY 4,330,056 4,483,348 1.03 Kyushu Electric Power Co., Inc. 120,500 JPY 2,668,167 2,486,518 0.57 Meitec Corp. 49,300 JPY 878,112 667,042 0.15 Mitsubishi Chemical Holdings Corp. 804,500 JPY 3,395,282 3,417,314 0.79 Mitsubishi Corp. 340,700 JPY 7,599,843 8,466,535 1.95 Mitsubishi Estate Co., Ltd 378,000 JPY 7,211,655 6,023,222 1.39 Mitsubishi Heavy Industries Ltd 833,000 JPY 3,965,363 2,927,691 0.68 Mitsubishi UFJ Financial Group, Inc. 5,403,400 JPY 48,713,721 26,331,051 6.07 Mitsui & Co., Ltd 485,500 JPY 5,558,562 6,862,061 1.58 Mitsui OSK Lines Ltd 294,000 JPY 1,389,985 1,549,954 0.36 Mitsui Sumitomo Insurance Group Holdings, Inc. 115,200 JPY 4,335,611 2,937,286 0.68 Mizuho Financial Group, Inc. 3,825,600 JPY 20,819,568 6,846,526 1.58 Murata Manufacturing Co., Ltd 103,800 JPY 6,503,104 5,147,755 1.19 NEC Corp. 3,165,000 JPY 13,383,037 8,155,193 1.88 Nikon Corp. 95,000 JPY 970,620 1,872,244 0.43 Nintendo Co., Ltd 14,500 JPY 4,245,809 3,445,421 0.80 Nippon Oil Corp. 378,000 JPY 2,768,705 1,752,358 0.40 Nippon Steel Corp. 1,545,000 JPY 7,643,260 6,246,294 1.44 Nippon Telegraph & Telephone Corp. 338,600 JPY 15,834,104 13,324,240 3.07 Nissan Motor Co., Ltd 1,029,200 JPY 8,991,766 8,987,677 2.07 Nitto Denko Corp. 48,800 JPY 987,088 1,746,709 0.40 Nomura Holdings, Inc. 797,100 JPY 13,250,603 5,852,246 1.35 NTT DoCoMo, Inc. 7,512 JPY 11,406,672 10,495,985 2.42 Obic Co., Ltd 16,780 JPY 3,270,064 2,751,591 0.63 Onward Holdings Co., Ltd 731,000 JPY 6,059,622 4,531,561 1.05 ORIX Corp. 110,820 JPY 9,514,522 7,491,147 1.73

The accompanying notes form an integral part of these financial statements. 137
INTERNATIONAL OPPORTUNITIES FUNDS
JAPAN EQUITY (continued)
Statement of Investment as at December 31, 2009
(expressed in USD)
Panasonic Corp. 292,800 JPY 5,688,150 4,182,631 0.96 Resona Holdings, Inc. 194,700 JPY 3,447,783 1,968,935 0.45 Rohm Co., Ltd 131,900 JPY 10,278,363 8,617,476 1.99 Secom Co., Ltd 141,400 JPY 6,588,494 6,738,051 1.55 Sekisui House Ltd 122,000 JPY 1,591,651 1,103,531 0.25 Seven & I Holdings Co., Ltd 467,300 JPY 13,449,942 9,557,092 2.20 Sharp Corp. 260,000 JPY 3,624,333 3,271,198 0.75 Shin-Etsu Chemical Co., Ltd 55,600 JPY 2,689,844 3,135,011 0.72 SMC Corp. (Japan) 60,700 JPY 7,733,367 6,890,960 1.59 Sompo Japan Insurance, Inc. 854,000 JPY 9,215,843 5,459,781 1.26 Sony Corp. 420,800 JPY 17,237,179 12,112,942 2.79 Sumisho Computer Systems Corp. 160,600 JPY 3,135,573 2,204,127 0.51 Sumitomo Chemical Co., Ltd 379,000 JPY 2,722,533 1,654,843 0.38 Sumitomo Corp. 333,400 JPY 3,521,156 3,389,533 0.78 Sumitomo Electric Industries Ltd 497,400 JPY 6,889,163 6,166,891 1.42 Sumitomo Forestry Co., Ltd 314,000 JPY 2,723,637 2,369,683 0.55 Sumitomo Mitsui Financial Group, Inc. 326,400 JPY 28,035,849 9,307,616 2.15 Sumitomo Trust & Banking Co., Ltd (The) 1,070,000 JPY 8,008,866 5,225,702 1.20 T&D Holdings, Inc. 73,300 JPY 4,540,854 1,500,692 0.35 Takeda Pharmaceutical Co., Ltd 213,600 JPY 12,140,018 8,819,880 2.03 Tokio Marine Holdings, Inc. 76,900 JPY 2,806,428 2,097,536 0.48 Tokyo Electric Power Co., Inc. (The) 302,100 JPY 8,144,864 7,605,018 1.75 Tokyo Electron Ltd 40,600 JPY 2,616,644 2,591,256 0.60 Tokyo Gas Co., Ltd 733,000 JPY 2,938,922 2,931,842 0.68 Toyota Motor Corp. 575,900 JPY 30,736,228 24,090,258 5.55 West Japan Railway Co. 1,840 JPY 8,040,398 6,189,208 1.43 Yahoo! Japan Corp. 4,044 JPY 1,569,712 1,213,789 0.28 Yamada Denki Co., Ltd 26,800 JPY 1,056,833 1,808,722 0.42 Yamaha Motor Co., Ltd 145,900 JPY 1,879,320 1,834,072 0.42
Total Investments 564,472,365 432,612,768 99.75
Other Net Assets 1,100,272 0.25
Total Net Assets 433,713,040 100.00
Quantity/ Aquisition % net
Description Nominal Currency cost Evaluation assets

138 The accompanying notes form an integral part of these financial statements.
INTERNATIONAL OPPORTUNITIES FUNDS
JAPAN SMALLER COMPANIES
Statement of Investment as at December 31, 2009
(expressed in USD)
Quantity/ Aquisition % net
Description Nominal Currency cost Evaluation assets
Transferable Securities Admitted to an Official Stock Exchange Listingor Dealt in on Another Regulated Market
SHARES
JapanAhresty Corp. 41,900 JPY 230,847 247,095 2.18 Ai Holdings Corp. 40,700 JPY 182,902 129,004 1.14 Ando Corp. 188,000 JPY 285,175 206,738 1.82 Axell Corp. 9,000 JPY 316,447 318,258 2.80 Bunka Shutter Co., Ltd 53,000 JPY 174,059 178,847 1.58 Credit Saison Co., Ltd 45,000 JPY 473,445 506,496 4.46 Daiichikosho Co., Ltd 29,800 JPY 304,005 337,662 2.97 DTS Corp. 39,900 JPY 333,700 377,685 3.33 Fuji Heavy Industries Ltd 59,000 JPY 230,764 286,238 2.52 Fuji Machine Manufacturing Co., Ltd 1,600 JPY 19,403 19,837 0.17 Future Architect, Inc. 766 JPY 398,038 306,383 2.70 Geo Corp. 256 JPY 201,527 258,332 2.28 Hikari Tsushin, Inc. 12,500 JPY 304,184 226,403 1.99 Iriso Electronics Co., Ltd 20,600 JPY 183,227 357,566 3.15 Jaccs Co., Ltd 159,000 JPY 417,940 375,408 3.31 Kaneka Corp. 62,000 JPY 315,380 395,041 3.48 Koa Corp. 32,000 JPY 212,629 254,951 2.25 Komeri Co., Ltd 8,900 JPY 205,803 238,440 2.10 Kose Corp. 12,000 JPY 263,680 242,833 2.14 Maeda Corp. 29,000 JPY 83,680 79,101 0.70 Max Co., Ltd 16,000 JPY 155,810 160,423 1.41 MEC Co., Ltd (Japan) 32,900 JPY 192,926 213,528 1.88 Meitec Corp. 22,000 JPY 408,148 297,666 2.62 Miraial Co., Ltd 7,900 JPY 203,556 211,223 1.86 Miyachi Corp. 15,000 JPY 113,698 101,881 0.90 Nippon Thompson Co., Ltd 60,000 JPY 243,139 298,205 2.63 Onward Holdings Co., Ltd 47,000 JPY 284,114 291,359 2.57 Otsuka Kagu Ltd 30,400 JPY 245,103 231,060 2.04 Pal Co., Ltd 18,150 JPY 264,574 316,018 2.78 Pocket Card Co., Ltd 142,600 JPY 396,520 379,734 3.35 Riken Corp. 51,000 JPY 131,053 165,501 1.46 Roland DG Corp. 26,600 JPY 310,547 332,088 2.93 Sato Corp. 26,100 JPY 269,617 270,412 2.38 Sumisho Computer Systems Corp. 22,500 JPY 401,591 308,797 2.72 Sumitomo Forestry Co., Ltd 46,100 JPY 317,458 347,906 3.06 Tecmo Koei Holdings Co., Ltd 47,800 JPY 527,054 350,429 3.09 Tokyo Tomin Bank Ltd (The) 9,500 JPY 193,428 129,562 1.14 Toppan Forms Co., Ltd 30,000 JPY 341,796 312,113 2.75 Toshiba Machine Co., Ltd 60,000 JPY 203,140 229,637 2.02 Toyo Tire & Rubber Co., Ltd 201,000 JPY 480,894 372,724 3.28 United Arrows Ltd 33,400 JPY 224,183 278,348 2.45 Zeon Corp. 33,000 JPY 141,136 148,714 1.31 Zuken, Inc. 32,200 JPY 292,681 213,845 1.88
Total Investments 11,479,001 11,303,491 99.58
Other Net Assets 47,998 0.42
Total Net Assets 11,351,489 100.00

The accompanying notes form an integral part of these financial statements. 139
INTERNATIONAL OPPORTUNITIES FUNDS
KOREA EQUITY
Statement of Investment as at December 31, 2009
(expressed in USD)
Quantity/ Aquisition % net
Description Nominal Currency cost Evaluation assets
Transferable Securities Admitted to an Official Stock Exchange Listingor Dealt in on Another Regulated Market
SHARES
South KoreaHanjin Shipping Co., Ltd 1,190 KRW 14,994 20,000 79.94
Total Investments 14,994 20,000 79.94
Other Net Assets 5,019 20.06
Total Net Assets 25,019 100.00

140 The accompanying notes form an integral part of these financial statements.
INTERNATIONAL OPPORTUNITIES FUNDS
LATIN AMERICAN EQUITY
Statement of Investment as at December 31, 2009
(expressed in USD)
Quantity/ Aquisition % net
Description Nominal Currency cost Evaluation assets
Transferable Securities Admitted to an Official Stock Exchange Listingor Dealt in on Another Regulated Market
SHARES & RIGHTS
BermudaDufry South America Ltd – BDR 176,200 BRL 3,347,761 3,638,824 2.03
BrazilAll America Latina Logistica SA – Units 539,600 BRL 5,270,647 5,045,592 2.82 Banco Bradesco SA (Pref) 40,200 BRL 888,427 838,960 0.47 Banco do Brasil SA 435,400 BRL 6,338,750 7,418,182 4.15 BM&FBOVESPA SA 456,666 BRL 4,143,798 3,209,131 1.79 Bradespar SA (Pref) 160,000 BRL 1,614,643 3,536,483 1.98 BRF – Brasil Foods SA 200,100 BRL 5,052,697 5,207,970 2.91 Cia de Concessoes Rodoviarias 184,400 BRL 3,152,297 4,219,661 2.36 Cia Energetica de Minas Gerais (Pref) 130,100 BRL 1,646,797 2,358,397 1.32 Cia Energetica de Sao Paulo "B" (Pref) 130,800 BRL 2,055,890 1,803,076 1.01 Cielo SA 220,700 BRL 1,764,763 1,942,139 1.08 Cyrela Brazil Realty SA 258,200 BRL 2,630,154 3,628,900 2.03 Diagnosticos da America SA 96,500 BRL 2,119,867 3,154,849 1.76 Fertilizantes Fosfatados SA (Pref) 143,800 BRL 1,475,853 1,361,117 0.76 Gerdau SA (Pref) 392,400 BRL 8,019,552 6,559,507 3.67 Investimentos Itau SA (Pref) 849,750 BRL 4,675,041 5,776,465 3.23 Itau Unibanco Holding SA (Pref) 724,130 BRL 8,346,546 16,071,925 8.98 JBS (Rights) 1,077 BRL – 4,683 0.00 JBS SA 751,300 BRL 3,711,179 4,016,816 2.24 Localiza Rent A CAR 157,500 BRL 1,781,727 1,745,582 0.98 Lojas Americanas SA (Pref) 493,100 BRL 3,353,987 4,392,979 2.46 Lojas Renner SA 162,800 BRL 3,544,793 3,670,283 2.05 Lupatech SA 88,000 BRL 3,239,273 1,370,582 0.77 Metalurgica Gerdau SA (Pref) 90,800 BRL 1,636,104 1,818,916 1.02 Petroleo Brasileiro SA (Pref) 561,700 BRL 13,096,785 11,822,376 6.61 Sul America SA – Units 188,400 BRL 3,222,612 5,618,926 3.14 Usinas Siderurgicas de Minas Gerais SA "A" (Pref) 181,600 BRL 7,376,002 5,145,262 2.88 Vale SA "A" (Pref) 623,700 BRL 18,443,838 15,098,744 8.44 Vivo Participacoes SA (Pref) 116,770 BRL 3,123,156 3,649,396 2.04
121,725,178 130,486,899 72.95
ChileSACI Falabella 548,218 CLP 2,749,734 3,236,891 1.81
MexicoAmerica Movil SAB de CV "L" 5,757,800 MXN 15,719,770 13,623,613 7.62 Corp GEO SAB de CV "B" 1,325,100 MXN 3,886,061 3,512,552 1.96 Desarrolladora Homex SAB de CV 335,500 MXN 2,863,476 1,891,126 1.06 Empresas ICA SAB de CV 1,526,400 MXN 5,515,908 3,585,940 2.00 Fomento Economico Mexicano SAB de CV – Units 1,171,500 MXN 5,120,090 5,664,830 3.17 Grupo Televisa SA 712,200 MXN 2,272,924 2,976,802 1.66
35,378,229 31,254,863 17.47
PeruCredicorp Ltd 41,500 USD 2,734,764 3,185,955 1.78
Total Investments 165,935,666 171,803,432 96.04
Other Net Assets 7,079,319 3.96
Total Net Assets 178,882,751 100.00

The accompanying notes form an integral part of these financial statements. 141
INTERNATIONAL OPPORTUNITIES FUNDS
MALAYSIA EQUITY
Statement of Investment as at December 31, 2009
(expressed in USD)
Quantity/ Aquisition % net
Description Nominal Currency cost Evaluation assets
Transferable Securities Admitted to an Official Stock Exchange Listingor Dealt in on Another Regulated Market
SHARES
MalaysiaAlliance Financial Group BHD 1,369,100 MYR 1,084,392 1,083,604 3.79 AMMB Holdings BHD 1,170,000 MYR 1,215,257 1,708,527 5.98 Axiata Group BHD 859,325 MYR 728,810 765,461 2.68 Berjaya Sports Toto BHD 693,285 MYR 882,480 880,779 3.08 British American Tobacco Malaysia BHD 48,000 MYR 586,411 600,000 2.10 CIMB Group Holdings Berhad 651,900 MYR 2,038,223 2,444,624 8.56 DiGi.Com BHD 54,000 MYR 331,464 346,332 1.21 Genting BHD 510,000 MYR 1,063,525 1,093,282 3.83 Genting Malaysia BHD 2,097,700 MYR 1,977,953 1,721,534 6.02 Genting Plantation BHD 627,000 MYR 1,081,444 1,142,663 4.00 Hap Seng Plantations Holdings BHD 1,225,000 MYR 1,055,759 822,868 2.88 Hektar Real Estate Investment Trust – REIT 668,800 MYR 299,551 218,766 0.77 IGB Corp. BHD 456,200 MYR 333,734 266,472 0.93 IJM Corp. BHD 174,600 MYR 118,281 228,448 0.80 IJM Plantations BHD 1,331,250 MYR 1,092,236 964,223 3.37 IOI Corp. BHD 480,384 MYR 748,869 767,436 2.69 Kuala Lumpur Kepong BHD 180,000 MYR 625,911 867,406 3.04 Lafarge Malayan Cement BHD 323,000 MYR 482,065 589,588 2.06 Lingkaran Trans Kota Holdings BHD 574,000 MYR 302,635 467,716 1.64 Malayan Banking BHD 689,000 MYR 1,418,750 1,380,414 4.83 Media Prima BHD 867,700 MYR 446,836 423,206 1.48 MISC BHD (Foreign Market) 329,000 MYR 926,625 813,852 2.85 PLUS Expressways BHD 933,000 MYR 872,849 888,311 3.11 Public Bank BHD 4,174 MYR – 13,775 0.05 Public Bank BHD (Foreign Market) 615,100 MYR 1,749,137 2,022,787 7.08 Sime Darby BHD 496,100 MYR 1,244,584 1,299,654 4.55 Sunway City BHD 318,800 MYR 411,519 302,599 1.06 Tanjong PLC 288,100 MYR 1,299,922 1,416,940 4.96 Tenaga Nasional BHD 806,400 MYR 2,212,775 1,978,317 6.92
Total Transferable Securities Admitted to an Official Stock Exchange Listing
or Dealt in on Another Regulated Market 26,631,997 27,519,584 96.32
Unlisted Securities
WARRANTS
MalaysiaMedia Prima BHD (Wts) 24,791 MYR – – 0.00
Total Unlisted Securities – – 0.00
Total Investments 26,631,997 27,519,584 96.32
Other Net Assets 1,050,558 3.68
Total Net Assets 28,570,142 100.00

142 The accompanying notes form an integral part of these financial statements.
INTERNATIONAL OPPORTUNITIES FUNDS
NORTH AMERICA
Statement of Investment as at December 31, 2009
(expressed in USD)
Quantity/ Aquisition % net
Description Nominal Currency cost Evaluation assets
Transferable Securities Admitted to an Official Stock Exchange Listingor Dealt in on Another Regulated Market
SHARES
United States of America3M Co. 51,000 USD 3,359,053 4,266,660 0.58 Abbott Laboratories 114,900 USD 5,494,530 6,251,709 0.85 Abercrombie & Fitch Co. "A" 108,800 USD 5,293,839 3,843,904 0.52 Alcoa, Inc. 72,000 USD 1,167,399 1,170,720 0.16 Allegheny Technologies, Inc. 185,900 USD 6,273,681 8,441,719 1.15 Allstate Corp. (The) 272,000 USD 9,082,957 8,334,080 1.13 Altria Group, Inc. 570,000 USD 10,096,257 11,263,200 1.53 American Express Co. 88,900 USD 1,767,779 3,646,678 0.50 Amgen, Inc. 75,400 USD 3,713,803 4,306,094 0.58 Anadarko Petroleum Corp. 38,300 USD 1,716,359 2,430,135 0.33 Apache Corp. 108,900 USD 7,899,199 11,388,762 1.55 Apple, Inc. 18,400 USD 3,718,004 3,899,328 0.53 Applied Materials, Inc. 97,000 USD 1,404,256 1,368,670 0.19 Archer-Daniels-Midland Co. 344,300 USD 9,782,533 10,941,854 1.49 AT&T, Inc. 572,837 USD 15,544,499 16,182,645 2.20 Automatic Data Processing, Inc. 40,400 USD 1,595,895 1,741,644 0.24 Avnet, Inc. 155,600 USD 4,189,059 4,786,256 0.65 Bank of America Corp. 1,088,900 USD 17,159,973 16,464,168 2.24 Baxter International, Inc. 46,400 USD 2,285,671 2,731,568 0.37 Boeing Co. (The) 54,300 USD 3,266,853 2,976,183 0.40 Bristol-Myers Squibb Co. 146,800 USD 3,299,497 3,766,888 0.51 Cardinal Health, Inc. 26,400 USD 934,860 859,848 0.12 Caterpillar, Inc. 185,000 USD 8,370,002 10,648,600 1.45 CBS Corp. "B" 52,950 USD 758,461 759,303 0.10 Chevron Corp. 218,600 USD 14,884,620 16,969,918 2.30 CIGNA Corp. 300,600 USD 6,554,454 10,767,492 1.46 Cisco Systems, Inc. 428,700 USD 8,357,909 10,331,670 1.40 Citigroup, Inc. 1,167,200 USD 9,397,488 3,898,448 0.53 Coca-Cola Co. (The) 172,000 USD 8,231,789 9,883,120 1.34 Colgate-Palmolive Co. 37,800 USD 2,399,265 3,134,376 0.43 Comcast Corp. "A" 613,100 USD 10,486,738 10,471,748 1.42 Computer Sciences Corp. 138,100 USD 5,793,802 8,022,229 1.09 ConocoPhillips 180,900 USD 9,638,361 9,238,563 1.25 Corning, Inc. 117,900 USD 2,332,236 2,281,365 0.31 CVS Caremark Corp. 107,100 USD 3,395,121 3,490,389 0.47 Dell, Inc. 131,100 USD 2,702,723 1,907,505 0.26 Dominion Resources, Inc./VA 46,200 USD 1,637,399 1,823,052 0.25 Dow Chemical Co. (The) 84,700 USD 2,155,022 2,386,846 0.32 Edison International 269,700 USD 9,127,277 9,544,683 1.30 EI Du Pont de Nemours & Co. 66,200 USD 2,191,458 2,244,842 0.30 Eli Lilly & Co. 74,900 USD 3,408,935 2,697,898 0.37 EMC Corp. (Massachusetts) 146,900 USD 2,481,883 2,594,254 0.35 Emerson Electric Co. 56,100 USD 2,042,304 2,422,959 0.33 Exxon Mobil Corp. 357,000 USD 24,377,573 24,525,900 3.33 FedEx Corp. 24,400 USD 1,638,031 2,059,604 0.28 Fortune Brands, Inc. 129,200 USD 5,537,682 5,630,536 0.76 General Electric Co. 782,300 USD 19,645,426 11,969,190 1.63 Gilead Sciences, Inc. 36,100 USD 1,687,115 1,572,155 0.21 Goldman Sachs Group, Inc. (The) 59,800 USD 6,788,475 10,013,510 1.36 Goodrich Corp. 175,000 USD 7,649,658 11,415,250 1.55 Hartford Financial Services Group, Inc. 409,200 USD 5,934,781 9,775,788 1.33 Hewlett-Packard Co. 282,300 USD 9,336,666 14,817,927 2.01 Home Depot, Inc. 270,800 USD 7,446,606 7,899,236 1.07 Honeywell International, Inc. 55,900 USD 2,093,689 2,215,317 0.30 Ingram Micro, Inc. "A" 239,300 USD 3,788,551 4,276,291 0.58 Intel Corp. 594,900 USD 11,039,261 12,296,583 1.67

The accompanying notes form an integral part of these financial statements. 143
INTERNATIONAL OPPORTUNITIES FUNDS
NORTH AMERICA (continued)
Statement of Investment as at December 31, 2009
(expressed in USD)
International Business Machines Corp. 139,700 USD 12,964,086 18,515,838 2.51 Johnson & Johnson 289,000 USD 16,895,176 18,767,660 2.55 JPMorgan Chase & Co. 423,700 USD 14,402,787 17,592,024 2.39 Kimberly-Clark Corp. 32,300 USD 1,854,182 2,079,151 0.28 Kraft Foods, Inc. "A" 108,734 USD 2,846,148 2,985,836 0.41 Lincoln National Corp. 429,300 USD 7,777,739 10,741,086 1.46 Lockheed Martin Corp. 112,000 USD 8,721,101 8,457,120 1.15 Macy's, Inc. 376,000 USD 5,500,232 6,459,680 0.88 Medtronic, Inc. 82,800 USD 3,490,670 3,687,084 0.50 Merck & Co., Inc. 369,792 USD 11,037,120 13,671,210 1.86 Microsoft Corp. 690,000 USD 15,680,550 21,327,900 2.90 Morgan Stanley 352,100 USD 6,680,469 10,422,160 1.42 Newell Rubbermaid, Inc. 422,800 USD 5,799,305 6,392,736 0.87 Newfield Exploration Co. 159,400 USD 5,880,085 7,895,082 1.07 Nucor Corp. 255,700 USD 11,154,228 12,017,900 1.63 Occidental Petroleum Corp. 100,400 USD 5,823,239 8,257,900 1.12 Oracle Corp. 290,100 USD 4,785,067 7,224,941 0.98 PepsiCo, Inc. (NC) 116,400 USD 6,706,356 7,146,960 0.97 Pfizer, Inc. 889,722 USD 17,548,338 16,370,885 2.22 Philip Morris International, Inc. 144,700 USD 5,801,732 7,051,231 0.96 PPG Industries, Inc. 108,000 USD 5,807,191 6,407,640 0.87 Procter & Gamble Co. (The) 302,800 USD 17,110,980 18,552,556 2.52 QUALCOMM, Inc. 122,100 USD 4,833,762 5,701,093 0.77 Royal Caribbean Cruises Ltd 164,000 USD 2,643,180 4,183,640 0.57 Spirit Aerosystems Holdings, Inc. "A" 305,400 USD 5,291,727 6,089,676 0.83 Terex Corp. 197,200 USD 3,259,972 3,983,440 0.54 Texas Instruments, Inc. 91,900 USD 2,247,430 2,401,347 0.33 Textron, Inc. 478,100 USD 4,146,250 9,045,652 1.23 Time Warner, Inc. 90,066 USD 2,875,892 2,648,841 0.36 Time Warner Cable, Inc. 26,978 USD 924,419 1,130,378 0.15 Travelers Cos., Inc. (The) 218,000 USD 9,684,194 11,000,280 1.49 United Parcel Service, Inc. "B" 73,600 USD 4,573,858 4,268,064 0.58 United Technologies Corp. 69,900 USD 3,743,282 4,934,940 0.67 UnitedHealth Group, Inc. 86,600 USD 3,211,646 2,674,208 0.36 US Bancorp 143,800 USD 2,991,915 3,236,938 0.44 Valero Energy Corp. 42,600 USD 1,687,726 717,810 0.10 Verizon Communications, Inc. 339,200 USD 10,915,440 11,298,752 1.53 VF Corp. 105,400 USD 6,222,359 7,837,544 1.06 Viacom, Inc. "B" 361,500 USD 8,601,806 10,924,530 1.48 Walgreen Co. 74,500 USD 2,316,769 2,760,225 0.38 Wal-Mart Stores, Inc. 160,600 USD 7,986,392 8,680,430 1.18 Walt Disney Co. (The) 137,800 USD 3,337,443 4,506,060 0.61 WellPoint, Inc. 37,300 USD 2,189,465 2,191,002 0.30 Wells Fargo & Co. 593,800 USD 13,609,058 16,008,848 2.17 Western Union Co. (The) 51,300 USD 936,653 974,700 0.13
Total Investments 644,854,136 734,272,238 99.71
Other Net Assets 2,124,125 0.29
Total Net Assets 736,396,363 100.00
Quantity/ Aquisition % net
Description Nominal Currency cost Evaluation assets

144 The accompanying notes form an integral part of these financial statements.
INTERNATIONAL OPPORTUNITIES FUNDS
NORTH AMERICAN VALUE
Statement of Investment as at December 31, 2009
(expressed in USD)
Quantity/ Aquisition % net
Description Nominal Currency cost Evaluation assets
Transferable Securities Admitted to an Official Stock Exchange Listingor Dealt in on Another Regulated Market
SHARES
United States of AmericaAbercrombie & Fitch Co. "A" 43,500 USD 2,667,819 1,536,855 0.85 Allegheny Technologies, Inc. 82,200 USD 3,709,894 3,732,702 2.06 Allstate Corp. (The) 111,000 USD 4,487,039 3,401,040 1.88 Altria Group, Inc. 236,100 USD 4,788,918 4,665,336 2.57 Apache Corp. 45,400 USD 4,525,740 4,747,932 2.62 Archer-Daniels-Midland Co. 139,000 USD 3,822,250 4,417,420 2.44 AT&T, Inc. 163,500 USD 5,597,593 4,618,875 2.55 Avnet, Inc. 61,700 USD 1,939,125 1,897,892 1.05 Bank of America Corp. 248,500 USD 5,178,207 3,757,320 2.07 Caterpillar, Inc. 74,900 USD 4,620,294 4,311,244 2.38 Chevron Corp. 55,000 USD 4,520,039 4,269,650 2.36 CIGNA Corp. 121,500 USD 3,564,998 4,352,130 2.40 Comcast Corp. "A" 247,800 USD 4,589,670 4,232,424 2.33 Computer Sciences Corp. 55,000 USD 2,670,960 3,194,950 1.76 ConocoPhillips 66,800 USD 4,608,427 3,411,476 1.88 Edison International 109,000 USD 3,689,371 3,857,510 2.13 Fortune Brands, Inc. 51,400 USD 2,855,014 2,240,012 1.24 Goldman Sachs Group, Inc. (The) 21,700 USD 2,708,849 3,633,665 2.00 Goodrich Corp. 73,000 USD 4,000,969 4,761,790 2.63 Hartford Financial Services Group, Inc. 169,000 USD 2,928,254 4,037,410 2.23 Hewlett-Packard Co. 91,900 USD 4,049,306 4,823,831 2.66 Home Depot, Inc. 110,400 USD 2,850,090 3,220,368 1.78 Ingram Micro, Inc. "A" 99,600 USD 1,699,986 1,779,852 0.98 Intel Corp. 129,000 USD 2,976,377 2,666,430 1.47 International Business Machines Corp. 35,000 USD 3,939,599 4,638,900 2.56 Johnson & Johnson 70,200 USD 3,751,578 4,558,788 2.51 JPMorgan Chase & Co. 103,600 USD 3,902,758 4,301,472 2.37 Lincoln National Corp. 171,000 USD 4,267,117 4,278,420 2.36 Lockheed Martin Corp. 45,000 USD 3,503,819 3,397,950 1.87 Macy's, Inc. 158,600 USD 2,746,651 2,724,748 1.50 Merck & Co., Inc. 120,200 USD 4,479,147 4,443,794 2.45 Microsoft Corp. 154,800 USD 2,686,251 4,784,868 2.64 Morgan Stanley 147,300 USD 2,866,499 4,360,080 2.40 Newell Rubbermaid, Inc. 168,200 USD 2,980,743 2,543,184 1.40 Newfield Exploration Co. 70,200 USD 3,074,567 3,477,006 1.92 Nucor Corp. 105,700 USD 5,331,473 4,967,900 2.74 Occidental Petroleum Corp. 40,000 USD 2,779,735 3,290,000 1.81 Pfizer, Inc. 239,700 USD 4,977,608 4,410,480 2.43 PPG Industries, Inc. 42,000 USD 2,782,463 2,491,860 1.37 Procter & Gamble Co. (The) 55,200 USD 3,184,024 3,382,104 1.87 Royal Caribbean Cruises Ltd 72,000 USD 1,323,311 1,836,720 1.01 Spirit Aerosystems Holdings, Inc. "A" 120,000 USD 2,320,388 2,392,800 1.32 Terex Corp. 81,100 USD 1,940,204 1,638,220 0.90 Textron, Inc. 201,600 USD 2,027,194 3,814,272 2.10 Travelers Cos., Inc. (The) 87,000 USD 4,271,854 4,390,020 2.42 Verizon Communications, Inc. 137,800 USD 5,103,578 4,590,118 2.53 VF Corp. 41,300 USD 3,147,039 3,071,068 1.69 Viacom, Inc. "B" 145,600 USD 4,146,648 4,400,032 2.43 Wells Fargo & Co. 169,200 USD 4,140,669 4,561,632 2.52
Total Investments 174,724,106 180,314,550 99.44
Other Net Assets 1,011,851 0.56
Total Net Assets 181,326,401 100.00

The accompanying notes form an integral part of these financial statements. 145
INTERNATIONAL OPPORTUNITIES FUNDS
PAN EUROPEAN
Statement of Investment as at December 31, 2009
(expressed in USD)
Quantity/ Aquisition % net
Description Nominal Currency cost Evaluation assets
Transferable Securities Admitted to an Official Stock Exchange Listingor Dealt in on Another Regulated Market
SHARES & WARRANTS
AustriaAndritz AG 39,588 EUR 2,208,891 2,304,829 2.23 Vienna Insurance Group 37,131 EUR 2,409,446 1,920,635 1.85
4,618,337 4,225,464 4.08
BelgiumFortis 641,239 EUR 2,267,361 2,416,707 2.34
CyprusBank of Cyprus Public Co., Ltd 214,443 EUR 1,746,493 1,515,942 1.47
FinlandFortum OYJ 105,933 EUR 2,228,784 2,887,383 2.79 Nokia OYJ 80,829 EUR 1,018,133 1,035,948 1.00
3,246,917 3,923,331 3.79
FranceApril Group 36,857 EUR 1,855,728 1,281,566 1.24 AXA SA 161,246 EUR 3,562,719 3,832,041 3.70 Groupe Eurotunnel SA 453,223 EUR 4,003,784 4,258,880 4.11 Groupe Eurotunnel SA (Call Warrants 31/12/2011) 6 EUR 2 2 0.00 Ipsen SA 26,482 EUR 1,289,118 1,474,824 1.43 Sanofi-Aventis SA 31,397 EUR 2,329,197 2,483,877 2.40 Vallourec SA 22,388 EUR 4,400,339 4,086,916 3.95
17,440,887 17,418,106 16.83
GermanyBayer AG 13,221 EUR 1,056,698 1,063,035 1.03 Fielmann AG 14,743 EUR 923,713 1,087,969 1.05 Freenet AG 169,275 EUR 2,132,988 2,283,832 2.21 Fresenius Medical Care AG & Co. KGaA 52,966 EUR 2,478,046 2,811,252 2.71 SAP AG 53,622 EUR 2,078,593 2,542,510 2.46 Siemens AG (Reg) 11,466 EUR 682,896 1,057,841 1.02 ThyssenKrupp AG 68,802 EUR 2,181,523 2,609,821 2.52
11,534,457 13,456,260 13.00
GibraltarPartyGaming PLC 1,053,883 GBP 4,493,337 4,432,927 4.28
GreecePublic Power Corporation SA 135,147 EUR 2,929,060 2,524,384 2.44
IrelandDCC PLC 76,446 EUR 2,145,802 2,136,388 2.06 FBD Holdings PLC 240,362 EUR 2,473,361 2,382,981 2.30 ICON PLC – ADR 46,124 USD 1,249,736 1,011,499 0.98
5,868,899 5,530,868 5.34
JerseyInforma PLC 505,098 GBP 2,490,396 2,614,872 2.53
LuxembourgReinet Investments SCA 112,760 EUR 1,070,258 1,782,188 1.72

146 The accompanying notes form an integral part of these financial statements.
INTERNATIONAL OPPORTUNITIES FUNDS
PAN EUROPEAN (continued)
Statement of Investment as at December 31, 2009
(expressed in USD)
NetherlandsNutreco Holding NV 25,391 EUR 1,487,824 1,433,218 1.39
NorwayFred. Olsen Energy ASA 45,100 NOK 1,809,790 1,734,930 1.68 Storebrand ASA 582,200 NOK 2,227,073 3,990,992 3.85
4,036,863 5,725,922 5.53
PolandGlobe Trade Centre SA 13,183 PLN 121,909 118,342 0.11
SpainBanco Santander SA 84,025 EUR 1,442,097 1,394,428 1.35 Grifols SA 164,482 EUR 3,352,938 2,884,443 2.79 Telefonica SA 79,449 EUR 1,699,184 2,228,302 2.15
6,494,219 6,507,173 6.29
SwedenElekta AB "B" 113,578 SEK 2,131,778 2,724,023 2.63
SwitzerlandCredit Suisse Group AG (Reg) 61,430 CHF 3,149,412 3,043,806 2.94 GAM Holding Ltd 172,005 CHF 2,316,436 2,095,720 2.02 Roche Holding AG (Genusscheine) 6,825 CHF 899,548 1,161,149 1.12 Temenos Group AG 69,204 CHF 1,734,043 1,798,217 1.74
8,099,439 8,098,892 7.82
United KingdomBP PLC 251,457 GBP 2,032,623 2,440,843 2.36 Compass Group PLC 344,012 GBP 2,348,147 2,477,728 2.39 SABMiller PLC 34,273 GBP 992,117 1,012,460 0.98 Sportingbet PLC 4,091,215 GBP 2,503,571 4,500,762 4.35 Tullow Oil PLC 266,747 GBP 2,590,776 5,631,640 5.44 Victrex PLC 119,336 GBP 1,463,058 1,563,800 1.51
11,930,292 17,627,233 17.03
Total Investments 92,008,726 102,075,852 98.62
Other Net Assets 1,430,497 1.38
Total Net Assets 103,506,349 100.00
Quantity/ Aquisition % net
Description Nominal Currency cost Evaluation assets

The accompanying notes form an integral part of these financial statements. 147
INTERNATIONAL OPPORTUNITIES FUNDS
PHILIPPINES EQUITY
Statement of Investment as at December 31, 2009
(expressed in USD)
Quantity/ Aquisition % net
Description Nominal Currency cost Evaluation assets
Transferable Securities Admitted to an Official Stock Exchange Listingor Dealt in on Another Regulated Market
SHARES & RIGHTS
PhilippinesAboitiz Equity Ventures, Inc. 1,160,000 PHP 192,517 225,827 2.30 Aboitiz Power Corp. 1,594,000 PHP 169,897 296,526 3.02 Alliance Global Group, Inc. 1,797,000 PHP 186,548 161,314 1.64 Ayala Corp. 83,304 PHP 727,843 545,089 5.55 Ayala Land, Inc. 2,270,800 PHP 556,809 552,596 5.62 Banco de Oro Unibank, Inc. 294,600 PHP 296,818 248,527 2.53 Bank of the Philippine Islands 606,760 PHP 657,063 629,991 6.41 DMCI Holdings, Inc. 173,000 PHP 34,284 36,299 0.37 Energy Development Corp. (Philippines) 7,032,750 PHP 545,953 714,989 7.28 Filinvest Land, Inc. 12,040,000 PHP 177,695 234,393 2.38 First Gen Corp. 668,700 PHP 196,897 140,307 1.43 First Gen Corp. (Rights) 1,174,237 PHP 107,678 68,580 0.70 First Philippine Holdings Corp. 255,500 PHP 205,099 265,282 2.70 Globe Telecom, Inc. 20,680 PHP 550,093 409,306 4.16 GMA Holdings, Inc. – PDR 1,256,000 PHP 157,915 220,065 2.24 International Container Terminal Services, Inc. 316,000 PHP 143,801 153,796 1.56 Jollibee Foods Corp. 117,000 PHP 119,167 139,195 1.42 Lepanto Consolidated Mining "B" 5,140,000 PHP 29,245 27,796 0.28 Manila Electric Co. 107,021 PHP 316,247 474,568 4.83 Manila Water Co., Inc. 1,109,300 PHP 347,032 377,925 3.85 Megaworld Corp. 2,980,000 PHP 100,776 95,401 0.97 Metropolitan Bank & Trust 535,600 PHP 458,371 521,350 5.31 Philex Mining Corp. 886,100 PHP 164,614 306,675 3.12 Philippine Long Distance Telephone Co. 16,650 PHP 900,741 943,608 9.60 Robinsons Land Corp. 692,800 PHP 142,073 194,817 1.98 San Miguel Corp. "B" 35,400 PHP 50,377 52,836 0.54 Security Bank Corp. 269,567 PHP 321,425 314,874 3.20 SM Investments Corp. 61,230 PHP 408,957 430,451 4.38 SM Prime Holdings, Inc. 1,203,400 PHP 265,588 255,101 2.60 Universal Robina Corp. 920,000 PHP 121,900 323,383 3.29 Vista Land & Lifescapes, Inc. 3,830,000 PHP 185,211 155,752 1.58
Total Investments 8,838,634 9,516,619 96.84
Other Net Assets 310,211 3.16
Total Net Assets 9,826,830 100.00

148 The accompanying notes form an integral part of these financial statements.
INTERNATIONAL OPPORTUNITIES FUNDS
TAIWAN EQUITY
Statement of Investment as at December 31, 2009
(expressed in USD)
Quantity/ Aquisition % net
Description Nominal Currency cost Evaluation assets
Transferable Securities Admitted to an Official Stock Exchange Listingor Dealt in on Another Regulated Market
SHARES
TaiwanAcer, Inc. 35,279 TWD 56,924 106,107 2.40 Advanced Semiconductor Engineering, Inc. 52,601 TWD 40,997 47,445 1.07 Asia Cement Corp. 35,246 TWD 42,447 38,128 0.86 Asustek Computer, Inc. 39,078 TWD 59,340 75,505 1.71 AU Optronics Corp. 69,887 TWD 91,775 84,778 1.92 Cathay Financial Holding Co., Ltd 108,137 TWD 209,400 201,838 4.57 Chi Mei Optoelectronics Corp. 69,000 TWD 37,167 48,538 1.10 China Steel Corp. 96,730 TWD 81,869 99,799 2.26 Chinatrust Financial Holding Co., Ltd 81,280 TWD 44,884 50,697 1.15 Chunghwa Telecom Co., Ltd 92,189 TWD 177,626 171,494 3.88 Compal Electronics, Inc. 52,320 TWD 57,277 72,546 1.64 Delta Electronics, Inc. 23,552 TWD 62,416 73,634 1.67 Far Eastern New Century Corp. 66,693 TWD 73,807 83,405 1.89 First Financial Holding Co., Ltd 74,000 TWD 43,735 45,925 1.04 Formosa Chemicals & Fibre Corp. 39,000 TWD 63,492 84,621 1.91 Formosa Petrochemical Corp. 55,780 TWD 125,256 143,701 3.25 Formosa Plastics Corp. 55,476 TWD 79,129 116,728 2.64 Fubon Financial Holding Co., Ltd 108,000 TWD 68,736 132,700 3.00 HON HAI Precision Industry Co., Ltd 71,235 TWD 242,710 337,411 7.63 HTC Corp. 5,350 TWD 73,249 61,303 1.39 InnoLux Display Corp. 46,453 TWD 113,272 68,913 1.56 KYE Systems Corp. 46,607 TWD 58,373 48,815 1.10 Largan Precision Co., Ltd 4,080 TWD 43,190 53,703 1.22 Lite-On Technology Corp. 50,250 TWD 52,017 75,489 1.71 MediaTek, Inc. 11,629 TWD 119,516 202,876 4.59 Mega Financial Holding Co., Ltd 99,000 TWD 52,321 57,261 1.30 Nan Ya Plastics Corp. 83,000 TWD 105,475 151,286 3.42 Powertech Technology, Inc. 29,897 TWD 85,344 101,417 2.29 Quanta Computer, Inc. 29,000 TWD 51,083 63,104 1.43 Richtek Technology Corp. 6,285 TWD 49,380 64,255 1.45 Shin Zu Shing Co., Ltd 10,493 TWD 49,518 52,326 1.18 Siliconware Precision Industries Co. 43,000 TWD 54,526 58,279 1.32 Synnex Technology International Corp. 42,082 TWD 43,220 91,440 2.07 Taiwan Cement Corp. 55,880 TWD 63,732 59,400 1.34 Taiwan Fertilizer Co., Ltd 25,000 TWD 69,627 89,104 2.02 Taiwan Mobile Co., Ltd 36,000 TWD 58,542 70,233 1.59 Taiwan Semiconductor Manufacturing Co., Ltd 190,332 TWD 326,656 383,818 8.68 Unimicron Technology Corp. 67,217 TWD 42,146 97,510 2.21 Uni-President Enterprises Corp. 80,365 TWD 59,632 99,121 2.24 United Microelectronics Corp. 108,000 TWD 44,804 58,077 1.31 Wistron Corp. 49,272 TWD 47,626 95,663 2.16 WPG Holdings Co., Ltd 40,414 TWD 46,549 70,379 1.59 Yuanta Financial Holding Co., Ltd 134,055 TWD 84,419 98,493 2.23
Total Investments 3,453,204 4,287,265 96.99
Other Net Assets 132,894 3.01
Total Net Assets 4,420,159 100.00

The accompanying notes form an integral part of these financial statements. 149
INTERNATIONAL OPPORTUNITIES FUNDS
THAILAND EQUITY
Statement of Investment as at December 31, 2009
(expressed in USD)
Quantity/ Aquisition % net
Description Nominal Currency cost Evaluation assets
Transferable Securities Admitted to an Official Stock Exchange Listingor Dealt in on Another Regulated Market
MUTUAL FUNDS
ThailandCPN Retail Growth Leasehold Property Fund 1,448,591 THB 348,825 401,904 1.20
Total Mutual Funds 348,825 401,904 1.20
SHARES
ThailandAdvanced Info Service PCL 39,700 THB 97,010 103,001 0.31 Advanced Info Service PCL (Foreign Market) 503,000 THB 1,365,787 1,305,024 3.89 Amata Corp. PCL (Foreign Market) 706,500 THB 171,550 178,002 0.53 Asian Property Development PCL (Foreign Market) 3,833,200 THB 582,093 661,095 1.97 Bangchak Petroleum PCL (Foreign Market) 857,500 THB 369,726 383,226 1.14 Bangkok Bank PCL (Foreign Market) 705,000 THB 2,494,644 2,463,482 7.35 Bangkok Expressway PCL (Foreign Market) 2,196,000 THB 1,203,055 1,370,030 4.09 Banpu PCL (Foreign Market) 92,100 THB 1,018,836 1,596,695 4.76 BEC World PCL (Foreign Market) 999,500 THB 589,171 737,483 2.20 Big C Supercenter PCL (Foreign Market) 186,500 THB 214,254 237,740 0.71 Bumrungrad Hospital PCL (Foreign Market) 245,400 THB 127,653 217,136 0.65 Central Pattana PCL (Foreign Market) 582,300 THB 252,251 354,550 1.06 Electricity Generating PCL (Foreign Market) 534,200 THB 1,287,749 1,269,807 3.79 Esso Thailand PCL (Foreign Market) 2,011,200 THB 374,857 383,057 1.14 Glow Energy PCL (Foreign Market) 661,000 THB 561,772 654,259 1.95 Kasikornbank PCL (Foreign Market) 878,800 THB 1,794,140 2,293,209 6.84 Kiatnakin Bank PCL (Foreign Market) 377,000 THB 271,753 288,347 0.86 Krung Thai Bank PCL (Foreign Market) 3,320,200 THB 852,279 980,923 2.93 MCOT PCL (Foreign Market) 155,400 THB 93,539 111,866 0.33 Minor International PCL (Foreign Market) 764,600 THB 186,153 259,148 0.77 PTT Chemical PCL (Foreign Market) 382,000 THB 752,416 847,870 2.53 PTT Exploration & Production PCL (Foreign Market) 675,200 THB 2,552,956 2,977,037 8.88 PTT PCL (Foreign Market) 455,000 THB 3,793,787 3,357,229 10.01 Robinson Department Store PCL (Foreign Market) 2,031,600 THB 639,450 633,732 1.89 Siam Cement PCL (Foreign Market) 262,300 THB 1,584,978 1,880,315 5.61 Siam City Cement PCL (Foreign Market) 57,300 THB 296,650 403,884 1.20 Siam Commercial Bank PCL (Foreign Market) 569,700 THB 1,200,971 1,482,348 4.42 Siam Makro PCL (Foreign Market) 119,400 THB 297,830 313,362 0.93 Thai Oil PCL (Foreign Market) 417,900 THB 613,774 535,850 1.60 Thai Tap Water Supply PCL (Foreign Market) 9,406,300 THB 1,280,085 1,258,311 3.75 Thoresen Thai Agencies PCL (Foreign Market) 613,200 THB 482,021 501,191 1.50 Tisco Financial Group PCL (Foreign Market) 1,429,400 THB 751,506 1,037,537 3.10 Total Access Communication PCL 621,800 USD 747,423 683,980 2.04 Total Access Communication PCL (Foreign Market) 678,300 THB 758,485 752,762 2.25
Total Shares 29,660,604 32,513,488 96.98
Total Investments 30,009,429 32,915,392 98.18
Other Net Assets 609,111 1.82
Total Net Assets 33,524,503 100.00

150 The accompanying notes form an integral part of these financial statements.
INTERNATIONAL OPPORTUNITIES FUNDS
US BOND
Statement of Investment as at December 31, 2009
(expressed in USD)
Quantity/ Aquisition % net
Description Nominal Currency cost Evaluation assets
Transferable Securities Admitted to an Official Stock Exchange Listingor Dealt in on Another Regulated Market
MUTUAL FUNDS
United States of AmericaBank of New York Mellon Liquidity "B" 6,375,069 USD 6,375,069 6,375,069 1.04
Total Mutual Funds 6,375,069 6,375,069 1.04
BONDS
AustraliaNational Australia Bank Ltd 3.375% 8/7/2014 "144A" 9,000,000 USD 8,971,548 9,104,886 1.49 National Australia Bank Ltd 5.35% 12/6/2013 "144A" 3,000,000 USD 2,999,918 3,237,039 0.53 Rio Tinto Finance USA Ltd 9% 1/5/2019 2,424,000 USD 2,369,635 3,080,041 0.50 Westpac Banking Corp. 4.875% 19/11/2019 1,250,000 USD 1,249,123 1,239,406 0.20
15,590,224 16,661,372 2.72
BrazilBrazilian Government International Bond 5.625% 7/1/2041 250,000 USD 243,167 233,125 0.04
CanadaCanada Government International Bond 2.375% 10/9/2014 3,000,000 USD 2,983,870 2,957,865 0.48 Canadian Natural Resources Ltd 5.7% 15/5/2017 594,000 USD 594,956 636,902 0.10 Cenovus Energy, Inc. 4.5% 15/9/2014 "144A" 519,000 USD 518,526 537,487 0.09 Cenovus Energy, Inc. 6.75% 15/11/2039 "144A" 883,000 USD 879,677 958,142 0.16 Husky Energy, Inc. 5.9% 15/6/2014 952,000 USD 950,986 1,040,922 0.17 Nexen, Inc. 7.5% 30/7/2039 612,000 USD 608,652 704,883 0.11 Province of Ontario Canada 4.1% 16/6/2014 2,400,000 USD 2,398,571 2,512,579 0.41 Rogers Communications, Inc. 6.8% 15/8/2018 1,500,000 USD 1,498,120 1,686,501 0.28
10,433,358 11,035,281 1.80
Cayman IslandsPetrobras International Finance Co. 5.75% 20/1/2020 1,247,000 USD 1,235,485 1,267,224 0.21 Petrobras International Finance Co. 6.875% 20/1/2040 930,000 USD 915,690 961,711 0.16 Petrobras International Finance Co. 7.875% 15/3/2019 722,000 USD 769,683 835,661 0.13 Vale Overseas Ltd 5.625% 15/9/2019 596,000 USD 591,564 592,475 0.10 Vale Overseas Ltd 6.875% 10/11/2039 941,000 USD 927,557 943,621 0.15 Voto-Votorantim Overseas Trading Operations NV 6.625% 25/9/2019 "144A" 369,000 USD 365,778 369,923 0.06
4,805,757 4,970,615 0.81
FranceAXA SA 8.6% 15/12/2030 145,000 USD 173,205 169,134 0.03 Societe Financement de l'Economie Francaise 2.875% 22/9/2014 "144A" 3,500,000 USD 3,482,358 3,484,467 0.57
3,655,563 3,653,601 0.60
GermanyFederal Republic of Germany 1.5% 21/9/2012 "144A" 4,000,000 USD 3,990,213 4,052,256 0.66 Kreditanstalt fuer Wiederaufbau 2.75% 21/10/2014 4,700,000 USD 4,696,668 4,663,133 0.76
8,686,881 8,715,389 1.42
ItalyItalian Republic 2.125% 5/10/2012 6,000,000 USD 5,991,924 5,992,428 0.98
LuxembourgTelecom Italia Capital SA 6.175% 18/6/2014 1,500,000 USD 1,500,000 1,630,810 0.26

The accompanying notes form an integral part of these financial statements. 151
INTERNATIONAL OPPORTUNITIES FUNDS
US BOND (continued)
Statement of Investment as at December 31, 2009
(expressed in USD)
MexicoPetroleos Mexicanos 4.875% 15/3/2015 "144A" 2,400,000 USD 2,383,016 2,391,120 0.39 United Mexican States 5.95% 19/3/2019 "EMTN" 1,260,000 USD 1,335,230 1,315,764 0.22
3,718,246 3,706,884 0.61
NetherlandsDeutsche Telekom International Finance BV 5.875% 20/8/2013 1,800,000 USD 1,797,874 1,952,829 0.32
New ZealandWestpac Securities NZ Ltd 3.45% 28/7/2014 "144A" 1,500,000 USD 1,497,019 1,514,766 0.25
South KoreaHyundai Capital Services, Inc. 6% 5/5/2015 "144A" 693,000 USD 689,930 726,159 0.12
SpainSpain Government International Bond 2% 17/9/2012 "144A" 3,500,000 USD 3,488,748 3,493,297 0.57 Telefonica Emisiones SAU 4.949% 15/1/2015 1,400,000 USD 1,400,000 1,501,710 0.25 Telefonica Emisiones SAU 5.855% 4/2/2013 1,310,000 USD 1,327,315 1,418,589 0.23
6,216,063 6,413,596 1.05
SupranationalInter-American Development Bank 1.75% 22/10/2012 "GMTN" 6,800,000 USD 6,792,473 6,782,891 1.10
SwedenSvensk Exportkredit AB 3.25% 16/9/2014 3,000,000 USD 2,997,409 3,009,525 0.49
SwitzerlandCredit Suisse (Guernsey) FRN Perpetual 730,000 USD 650,081 613,200 0.10 Credit Suisse (New York NY) 5.3% 13/8/2019 3,218,000 USD 3,215,402 3,319,679 0.54
3,865,483 3,932,879 0.64
United Arab EmiratesAbu Dhabi National Energy Co. 4.75% 15/9/2014 "144A" 2,087,000 USD 2,076,243 2,011,490 0.33
United KingdomBarclays Bank PLC 2.5% 23/1/2013 1,000,000 USD 998,718 1,000,909 0.16 Barclays Bank PLC 6.75% 22/5/2019 1,700,000 USD 1,696,570 1,904,314 0.31 Barclays Bank PLC FRN Perpetual "144A" 1,560,000 USD 1,427,727 1,170,000 0.19 BP Capital Markets PLC 3.875% 10/3/2015 5,000,000 USD 5,100,841 5,154,215 0.84 HSBC Holdings PLC 6.5% 2/5/2036 1,365,000 USD 1,294,739 1,437,177 0.24 HSBC Holdings PLC 6.8% 1/6/2038 1,000,000 USD 997,947 1,089,553 0.18 Nationwide Building Society 2.5% 17/8/2012 "144A" 4,000,000 USD 3,997,491 4,036,204 0.66
15,514,033 15,792,372 2.58
United States of AmericaAmerican Airlines Pass Through Trust 2009-1A 10.375% 2/7/2019 777,000 USD 777,000 858,585 0.14 Anadarko Petroleum Corp. 7.95% 15/6/2039 600,000 USD 597,992 745,100 0.12 Anheuser-Busch InBev Worldwide, Inc. 3% 15/10/2012 "144A" 1,500,000 USD 1,497,938 1,509,606 0.25 Anheuser-Busch InBev Worldwide, Inc. 4.125% 15/1/2015 "144A" 1,500,000 USD 1,498,020 1,527,834 0.25 Anheuser-Busch InBev Worldwide, Inc. 5.375% 15/1/2020 "144A" 1,206,000 USD 1,198,249 1,236,151 0.20 Assurant, Inc. 5.625% 15/2/2014 280,000 USD 281,316 287,825 0.05 AT&T, Inc. 6.55% 15/2/2039 1,589,000 USD 1,580,328 1,682,325 0.27 BAC Capital Trust XIV FRN Perpetual 5,221,000 USD 4,641,583 3,602,490 0.59 Bank of America Corp. 5.65% 1/5/2018 2,680,000 USD 2,668,056 2,741,624 0.45 Bank of America Corp. 6.5% 1/8/2016 2,500,000 USD 2,494,117 2,698,922 0.44 Bank of America Corp. 7.375% 15/5/2014 1,500,000 USD 1,492,740 1,709,229 0.28 BB&T Corp. 3.375% 25/9/2013 "MTN" 2,750,000 USD 2,747,718 2,778,660 0.45 BB&T Corp. 3.85% 27/7/2012 "MTN" 2,400,000 USD 2,399,201 2,487,782 0.41 Berkshire Hathaway Finance Corp. 4% 15/4/2012 "144A" 2,000,000 USD 2,046,185 2,098,908 0.34 BlackRock, Inc. 2.25% 10/12/2012 1,000,000 USD 997,631 997,481 0.16
Quantity/ Aquisition % net
Description Nominal Currency cost Evaluation assets

152 The accompanying notes form an integral part of these financial statements.
INTERNATIONAL OPPORTUNITIES FUNDS
US BOND (continued)
Statement of Investment as at December 31, 2009
(expressed in USD)
BlackRock, Inc. 3.5% 10/12/2014 1,000,000 USD 998,568 987,860 0.16 Bunge Ltd Finance Corp. 8.5% 15/6/2019 997,000 USD 996,972 1,141,066 0.19 Bunge NA Finance LP 5.9% 1/4/2017 950,000 USD 950,967 944,039 0.15 Burlington Northern and Santa Fe Railway Co. 2004-1 Pass Through Trust 4.575% 15/1/2021 1,149,542 USD 1,111,285 1,192,183 0.19 CareFusion Corp. 4.125% 1/8/2012 "144A" 1,546,000 USD 1,536,965 1,596,189 0.26 Cellco Partnership / Verizon Wireless Capital LLC 3.75% 20/5/2011 5,500,000 USD 5,532,667 5,676,792 0.93 Cellco Partnership / Verizon Wireless Capital LLC 5.55% 1/2/2014 2,400,000 USD 2,387,376 2,612,146 0.43 Cellco Partnership / Verizon Wireless Capital LLC 8.5% 15/11/2018 958,000 USD 948,936 1,192,925 0.19 CenterPoint Energy Houston Electric LLC 6.95% 15/3/2033 "K2" 380,000 USD 421,024 422,041 0.07 Chicago Metropolitan Water Reclamation 5.72% 1/12/2038 964,000 USD 964,000 965,697 0.16 CIGNA Corp. 8.5% 1/5/2019 1,524,000 USD 1,519,886 1,738,585 0.28 Cisco Systems, Inc. 5.5% 15/1/2040 700,000 USD 682,156 672,223 0.11 Citigroup Capital XXI FRN 21/12/2057 2,112,000 USD 2,107,118 2,030,160 0.33 Citigroup Funding, Inc. 1.875% 22/10/2012 5,000,000 USD 4,983,776 4,999,290 0.82 Citigroup, Inc. 5.125% 5/5/2014 2,400,000 USD 2,366,216 2,395,106 0.39 Citigroup, Inc. 6.01% 15/1/2015 2,000,000 USD 2,036,960 2,048,992 0.33 Citigroup, Inc. 8.5% 22/5/2019 1,355,000 USD 1,358,622 1,565,751 0.26 Commonwealth Edison Co. 6.15% 15/9/2017 790,000 USD 813,493 858,720 0.14 ConocoPhillips 5.2% 15/5/2018 450,000 USD 449,966 473,967 0.08 Consumers Energy Co. 5.65% 15/4/2020 265,000 USD 267,114 277,951 0.05 CRH America, Inc. 5.3% 15/10/2013 320,000 USD 316,690 334,303 0.05 Dominion Resources, Inc./VA 7% 15/6/2038 482,000 USD 478,490 557,979 0.09 Dow Chemical Co. (The) 8.55% 15/5/2019 1,893,000 USD 1,889,100 2,267,799 0.37 Duke Realty LP 5.625% 15/8/2011 828,000 USD 837,244 848,389 0.14 Duke Realty LP 6.25% 15/5/2013 2,500,000 USD 2,498,894 2,520,097 0.41 Enbridge Energy Partners LP 9.875% 1/3/2019 1,200,000 USD 1,199,352 1,525,308 0.25 Enterprise Products Operating LLC 5.25% 31/1/2020 938,000 USD 932,105 930,042 0.15 Exelon Generation Co. LLC 5.2% 1/10/2019 343,000 USD 342,350 344,690 0.06 Exelon Generation Co. LLC 6.25% 1/10/2039 655,000 USD 654,111 670,609 0.11 Express Scripts, Inc. 6.25% 15/6/2014 665,000 USD 662,489 727,619 0.12 Express Scripts, Inc. 7.25% 15/6/2019 214,000 USD 212,652 244,172 0.04 Federal Farm Credit Bank 3% 22/9/2014 2,000,000 USD 1,997,161 2,013,314 0.33 Federal Home Loan Banks 1.625% 26/9/2012 5,000,000 USD 4,984,788 4,988,150 0.81 Federal Home Loan Mortgage Corp. 2.125% 21/9/2012 5,000,000 USD 4,998,214 5,061,685 0.83 Federal National Mortgage Association 5% 15/3/2016 9,000,000 USD 9,242,978 9,824,148 1.60 FirstEnergy Solutions Corp. 6.8% 15/8/2039 523,000 USD 521,220 530,662 0.09 Fiserv, Inc. 6.125% 20/11/2012 200,000 USD 201,806 218,174 0.04 Fiserv, Inc. 6.8% 20/11/2017 110,000 USD 111,508 121,831 0.02 General Electric Capital Corp. 2% 28/9/2012 "GMTN" 3,000,000 USD 3,016,342 3,015,288 0.49 General Electric Capital Corp. 5.25% 19/10/2012 "MTN" 5,500,000 USD 5,422,041 5,863,264 0.96 General Electric Capital Corp. 6% 7/8/2019 "GMTN" 773,000 USD 772,170 802,973 0.13 General Electric Capital Corp. 6.875% 10/1/2039 "MTN" 2,963,000 USD 2,919,376 3,071,567 0.50 Goldman Sachs Group, Inc. (The) 3.625% 1/8/2012 4,000,000 USD 3,997,352 4,127,324 0.67 Goldman Sachs Group, Inc. (The) 5.15% 15/1/2014 3,000,000 USD 2,657,276 3,181,755 0.52 Goldman Sachs Group, Inc. (The) 7.5% 15/2/2019 954,000 USD 989,720 1,116,732 0.18 Harris Corp. 6.375% 15/6/2019 260,000 USD 259,243 281,955 0.05 Hewlett-Packard Co. 2.95% 15/8/2012 750,000 USD 749,903 766,532 0.13 International Business Machines Corp. 2.1% 6/5/2013 3,000,000 USD 2,997,678 3,001,281 0.49 International Paper Co. 7.5% 15/8/2021 543,000 USD 542,580 611,332 0.10 Interstate Power & Light Co. 6.25% 15/7/2039 398,000 USD 395,525 419,956 0.07 JP Morgan Chase Capital XXV 6.8% 1/10/2037 "Y" 2,433,000 USD 2,230,999 2,428,134 0.40 JPMorgan Chase & Co. 6.3% 23/4/2019 1,000,000 USD 998,708 1,104,809 0.18 Kansas City Power & Light Co. 5.85% 15/6/2017 1,020,000 USD 1,050,000 1,055,117 0.17 Keycorp 6.5% 14/5/2013 "MTN" 1,125,000 USD 1,121,888 1,163,770 0.19 Kinder Morgan Energy Partners LP 6.5% 1/9/2039 938,000 USD 929,809 946,570 0.15 L-3 Communications Corp. 5.2% 15/10/2019 "144A" 172,000 USD 171,400 170,893 0.03 Mead Johnson Nutrition Co. 3.5% 1/11/2014 "144A" 1,750,000 USD 1,742,426 1,735,379 0.28 Morgan Stanley 5.625% 23/9/2019 "MTN" 3,000,000 USD 2,987,907 3,035,373 0.50 Morgan Stanley 6.625% 1/4/2018 "MTN" 1,474,000 USD 1,488,767 1,599,773 0.26 Morgan Stanley 7.3% 13/5/2019 901,000 USD 900,890 1,013,166 0.17 New York City Transitional Finance 5.767% 1/8/2036 1,000,000 USD 1,000,000 973,940 0.16
Quantity/ Aquisition % net
Description Nominal Currency cost Evaluation assets

The accompanying notes form an integral part of these financial statements. 153
INTERNATIONAL OPPORTUNITIES FUNDS
US BOND (continued)
Statement of Investment as at December 31, 2009
(expressed in USD)
New York N Y City Municipal WTR Finance Authority 5.75% 15/6/2041 1,700,000 USD 1,700,000 1,631,473 0.27 Newmont Mining Corp. 6.25% 1/10/2039 500,000 USD 494,097 502,616 0.08 News America, Inc. 6.9% 15/8/2039 "144A" 376,000 USD 375,265 411,800 0.07 Nisource Finance Corp. 10.75% 15/3/2016 847,000 USD 837,991 1,047,477 0.17 Norfolk Southern Corp. 5.9% 15/6/2019 389,000 USD 388,085 417,179 0.07 Northern States Power Co. (MN) 5.25% 15/7/2035 225,000 USD 207,828 215,692 0.04 Northern States Power Co. (MN) 6.2% 1/7/2037 370,000 USD 386,522 403,431 0.07 Ohio Power Co. 5.5% 15/2/2013 "F" 455,000 USD 456,925 481,365 0.08 Ohio Power Co. 6.6% 15/2/2033 "G" 305,000 USD 317,096 319,660 0.05 Pacific Gas & Electric Co. 6.25% 1/12/2013 900,000 USD 894,814 1,004,690 0.16 Plains All American Pipeline LP / PAA Finance Corp. 4.25% 1/9/2012 1,900,000 USD 1,896,777 1,963,874 0.32 Praxair, Inc. 1.75% 15/11/2012 5,500,000 USD 5,484,775 5,456,775 0.89 Principal Life Income Funding Trusts 5.125% 1/3/2011 1,960,000 USD 1,976,981 2,016,893 0.33 Prudential Financial, Inc. 3.625% 17/9/2012 "MTN" 2,732,000 USD 2,731,582 2,776,696 0.45 Rowan Cos., Inc. 7.875% 1/8/2019 372,000 USD 369,661 415,595 0.07 SCANA Corp. 6.875% 15/5/2011 "MTN" 600,000 USD 614,691 635,878 0.10 St Jude Medical, Inc. 3.75% 15/7/2014 647,000 USD 646,109 655,881 0.11 St Jude Medical, Inc. 4.875% 15/7/2019 236,000 USD 233,134 238,959 0.04 State of Georgia 4.503% 1/11/2025 2,625,000 USD 2,625,000 2,573,576 0.42 State of Texas 5.517% 1/4/2039 3,400,000 USD 3,400,000 3,328,668 0.54 State of Washington 5.481% 1/8/2039 "D" 1,050,000 USD 1,050,000 1,023,729 0.17 Tennessee Valley Authority 5.25% 15/9/2039 870,000 USD 860,367 854,263 0.14 Thermo Fisher Scientific, Inc. 2.15% 28/12/2012 "144A" 1,131,000 USD 1,129,425 1,117,387 0.18 Time Warner Cable, Inc. 7.5% 1/4/2014 1,300,000 USD 1,294,873 1,502,214 0.25 Time Warner, Inc. 7.7% 1/5/2032 600,000 USD 615,980 707,527 0.12 TJX Cos., Inc. 4.2% 15/8/2015 2,000,000 USD 1,999,852 2,100,374 0.34 Travelers Property Casualty Corp. 5% 15/3/2013 280,000 USD 281,641 294,234 0.05 Union Electric Co. 6.4% 15/6/2017 266,000 USD 279,087 287,462 0.05 United States Treasury Note / Bond 0.75% 30/11/2011 10,000,000 USD 9,993,101 9,946,880 1.62 United States Treasury Note / Bond 1.875% 30/4/2014 4,016,000 USD 3,983,501 3,944,467 0.64 United States Treasury Note / Bond 2.625% 30/6/2014 10,885,000 USD 10,935,172 10,999,804 1.80 United States Treasury Note / Bond 2.75% 28/2/2013 6,000,000 USD 6,163,655 6,199,686 1.01 United States Treasury Note / Bond 3.125% 15/5/2019 1,770,000 USD 1,721,072 1,683,851 0.27 United States Treasury Note / Bond 3.25% 31/7/2016 7,000,000 USD 7,022,153 7,039,375 1.15 United States Treasury Note / Bond 3.5% 15/2/2039 3,505,000 USD 3,032,972 2,889,434 0.47 United States Treasury Note / Bond 4% 15/8/2018 3,496,000 USD 3,533,005 3,586,679 0.59 United States Treasury Note / Bond 4.25% 15/11/2017 7,525,000 USD 7,848,067 7,921,236 1.29 United States Treasury Note / Bond 4.5% 15/2/2016 3,500,000 USD 3,700,129 3,790,664 0.62 United States Treasury Note / Bond 4.5% 15/5/2038 3,475,000 USD 3,775,245 3,423,417 0.56 United States Treasury Note / Bond 5% 15/5/2037 1,807,000 USD 1,907,721 1,930,384 0.31 University of California Revenues 5.77% 15/5/2043 2,100,000 USD 2,098,255 2,043,174 0.33 Waste Management, Inc. 6.375% 11/3/2015 1,500,000 USD 1,495,488 1,667,542 0.27 Wells Fargo Capital XIII FRN Perpetual "GMTN" 2,472,000 USD 2,380,212 2,397,840 0.39 Westar Energy, Inc. 5.1% 15/7/2020 350,000 USD 337,114 343,461 0.06 Willis North America, Inc. 7% 29/9/2019 323,000 USD 321,438 330,285 0.05 Wisconsin Power & Light Co. 6.375% 15/8/2037 120,000 USD 124,867 128,482 0.02 WR Berkley Corp. 5.125% 30/9/2010 220,000 USD 221,753 222,195 0.04 WR Berkley Corp. 6.15% 15/8/2019 130,000 USD 133,439 123,921 0.02 Xerox Corp. 5.5% 15/5/2012 952,000 USD 954,893 1,000,885 0.16
236,007,103 241,969,089 39.51
Total Bonds 332,078,750 340,705,101 55.63
SECURITISED ASSETS
United States of AmericaBanc of America Commercial Mortgage, Inc. 5.118% 11/7/2043 "2002-2 A3" 2,585,000 USD 2,588,824 2,674,016 0.44 Banc of America Commercial Mortgage, Inc. 6.186% 11/6/2035 "2002-PB2 A4" 3,238,000 USD 3,353,398 3,394,389 0.55
Quantity/ Aquisition % net
Description Nominal Currency cost Evaluation assets

154 The accompanying notes form an integral part of these financial statements.
INTERNATIONAL OPPORTUNITIES FUNDS
US BOND (continued)
Statement of Investment as at December 31, 2009
(expressed in USD)
Banc of America Commercial Mortgage, Inc. FRN 10/5/2045 "2006-2 A4" 2,463,000 USD 1,727,137 2,420,979 0.40 Banc of America Mortgage Securities, Inc. FRN 25/5/2035 "2005-D 2A4 1,130,431 USD 1,125,322 1,118,615 0.18 Bear Stearns Commercial Mortgage Securities FRN 11/9/2038 "2006-PW12 AM" 251,000 USD 220,508 210,683 0.03 Bear Stearns Commercial Mortgage Securities FRN 11/5/2039 "2003-PWR2 A4" 5,450,000 USD 5,495,882 5,570,116 0.91 Bear Stearns Commercial Mortgage Securities FRN 13/8/2039 "2003-T12 A4" 7,611,000 USD 7,453,220 7,636,681 1.25 CarMax Auto Owner Trust 4.12% 15/3/2013 "2009-1 A3" 7,000,000 USD 7,233,030 7,258,016 1.18 Carmax Auto Owner Trust 5.23% 15/12/2011 "2007-2 A3" 532,877 USD 535,181 541,586 0.09 Carmax Auto Owner Trust 5.24% 15/7/2011 "2007-1 A3" 600,092 USD 600,520 604,483 0.10 Chase Issuance Trust 4.96% 17/9/2012 "2007-A15 A" 3,900,000 USD 4,031,813 4,018,529 0.66 Citigroup Commercial Mortgage Trust FRN 15/3/2049 "2006-C4 A3" 1,090,000 USD 1,008,251 1,046,740 0.17 Citigroup Commercial Mortgage Trust FRN 10/12/2049 "2007-C6 AM" 100,000 USD 92,973 72,221 0.01 CNH Equipment Trust 4.78% 16/7/2012 1,700,967 USD 1,700,818 1,729,313 0.28 CNH Equipment Trust 5.21% 15/12/2011 "2007-C A3A" 828,256 USD 828,216 834,510 0.14 Credit Suisse First Boston Mortgage Securities Corp. 4.7% 15/8/2036 "2003-C4 A3" 736,124 USD 733,699 751,897 0.12 Credit Suisse Mortgage Capital Certificates 5.343% 15/12/2039 "2006-C5 AM" 146,000 USD 93,217 110,628 0.02 Credit Suisse Mortgage Capital Certificates FRN 15/6/2039 "2007-C3 A4" 3,040,000 USD 2,873,536 2,436,190 0.40 Credit Suisse Mortgage Capital Certificates FRN 15/9/2040 "2007-C5 AM" 930,000 USD 761,090 585,883 0.10 CS First Boston Mortgage Securities Corp. 6.704% 15/8/2036 "2001-CK6 C" 1,000,000 USD 911,851 997,664 0.16 CS First Boston Mortgage Securities Corp. FRN 15/5/2036 "2004-C2 A2" 2,500,000 USD 2,495,790 2,482,182 0.41 Daimler Chrysler Auto Trust 5.14% 8/9/2012 "2006-A B" 1,125,000 USD 1,111,368 1,134,096 0.19 Fannie Mae Pool 4.5% 1/8/2022 "888701" 2,805,211 USD 2,770,161 2,892,835 0.47 Fannie Mae Pool 4.5% 1/12/2024 "AC6882" 2,250,000 USD 2,341,155 2,320,280 0.38 Fannie Mae Pool 4.5% 1/8/2035 "835751" 802,618 USD 771,271 803,915 0.13 Fannie Mae Pool 4.5% 1/5/2037 941,508 USD 897,661 943,122 0.15 Fannie Mae Pool 5% 1/6/2023 2,748,772 USD 2,814,745 2,881,110 0.47 Fannie Mae Pool 5% 1/2/2035 9,334,165 USD 9,260,210 9,629,164 1.57 Fannie Mae Pool 5.5% 1/8/2022 "256846" 1,183,275 USD 1,208,866 1,255,101 0.20 Fannie Mae Pool 5.5% 1/9/2035 1,607,646 USD 1,619,920 1,691,880 0.28 Fannie Mae Pool 5.5% 1/2/2037 "905142" 1,758,341 USD 1,842,664 1,846,075 0.30 Fannie Mae Pool 5.5% 1/12/2037 1 USD 1 1 0.00 Fannie Mae Pool 5.5% 1/6/2038 5,401,349 USD 5,560,718 5,670,854 0.93 Fannie Mae Pool 6% 1/9/2035 10,211,946 USD 10,477,458 10,889,126 1.78 Fannie Mae Pool 6% 1/4/2037 "923301" 1 USD 1 1 0.00 Fannie Mae Pool 6.5% 1/12/2034 "745637" 1,761,613 USD 1,825,085 1,892,468 0.31 Fannie Mae Pool 6.5% 1/11/2037 2,389,587 USD 2,431,738 2,567,462 0.42 Fannie Mae Pool FRN 1/1/2038 "967669" 2,932,492 USD 2,986,763 3,100,396 0.51 Fannie Mae Whole Loan 5% 25/6/2043 "2003-W12 2A6" 3,034,762 USD 3,038,383 3,088,819 0.50 First Horizon Asset Securities, Inc. FRN 25/11/2034 "2004-6 B1" 1,325,612 USD 1,178,345 1,107,428 0.18 Freddie Mac Gold Pool 4% 1/8/2024 "J10404" 2,225,262 USD 2,168,308 2,246,514 0.37 Freddie Mac Gold Pool 4.5% 1/4/2023 "J07688" 1 USD 1 1 0.00 Freddie Mac Gold Pool 4.5% 1/6/2039 7,941,805 USD 7,966,389 7,949,664 1.30 Freddie Mac Gold Pool 5% 1/9/2022 "G12798" 1,156,000 USD 1,221,535 1,212,262 0.20 Freddie Mac Gold Pool 5% 1/6/2023 "G18258" 1 USD 1 1 0.00 Freddie Mac Gold Pool 5% 1/5/2038 "G04545" 3,354,781 USD 3,158,095 3,451,182 0.56 Freddie Mac Gold Pool 5.5% 1/8/2035 1,017,679 USD 1,018,901 1,072,114 0.17 Freddie Mac Gold Pool 5.5% 1/8/2037 "G03422" 7,695,132 USD 7,662,449 8,086,301 1.32 Freddie Mac Gold Pool 5.5% 1/8/2038 1 USD 1 1 0.00 Freddie Mac Gold Pool 5.5% 1/3/2039 1,311,809 USD 1,353,038 1,378,288 0.22 Freddie Mac Gold Pool 6% 1/1/2038 "A71422" 3,408,928 USD 3,447,134 3,624,331 0.59 Freddie Mac Gold Pool 6.5% 1/9/2037 "A66140" 2,784,386 USD 2,968,791 2,988,447 0.49 Freddie Mac Gold Pool 7% 1/10/2037 "A66579" 2,910,338 USD 3,018,764 3,177,309 0.52 Freddie Mac Non Gold Pool FRN 1/10/2035 "1G0329" 4,622,338 USD 4,619,939 4,851,098 0.79 Ginnie Mae 6% TBA 2,510,000 USD 2,675,939 2,657,071 0.43 Ginnie Mae I Pool 4.5% 15/4/2039 "698096" 2,963,196 USD 2,938,123 2,978,102 0.49
Quantity/ Aquisition % net
Description Nominal Currency cost Evaluation assets

The accompanying notes form an integral part of these financial statements. 155
INTERNATIONAL OPPORTUNITIES FUNDS
US BOND (continued)
Statement of Investment as at December 31, 2009
(expressed in USD)
Ginnie Mae I Pool 5% 15/6/2038 "632260" 2,608,880 USD 2,571,744 2,693,919 0.44 Ginnie Mae I Pool 5% 15/5/2039 2,343,854 USD 2,355,713 2,420,254 0.40 Ginnie Mae I Pool 5.5% 15/12/2037 "661189" 1 USD 1 1 0.00 Ginnie Mae I Pool 5.5% 15/11/2038 996,795 USD 1,039,791 1,047,625 0.17 Ginnie Mae I Pool 5.5% 15/10/2039 "782789" 4,239,999 USD 4,458,564 4,457,296 0.73 Household Automotive Trust 5.3% 17/11/2011 "2007-1 A3" 950,863 USD 951,024 962,998 0.16 JP Morgan Chase Commercial Mortgage Securities Corp. 6.465% 15/11/2035 "2001-CIB3 A3" 2,700,000 USD 2,804,241 2,839,116 0.46 JP Morgan Chase Commercial Mortgage Securities Corp. FRN 12/2/2049 "2007-CB19 AM" 1,500,000 USD 1,397,651 1,088,834 0.18 Merrill Lynch Mortgage Trust FRN 12/11/2035 "2003-KEY1 A4" 400,000 USD 398,988 406,813 0.07 Morgan Stanley Capital I 5.01% 15/4/2038 "2003-IQ5 A4" 5,055,056 USD 5,026,434 5,177,435 0.85 Morgan Stanley Capital I FRN 12/12/2049 "2007-IQ16 AM" 200,000 USD 186,768 134,781 0.02 Morgan Stanley Dean Witter Capital I 4.74% 13/11/2036 "2003-TOP9 A2" 5,590,000 USD 5,505,154 5,692,543 0.93 Nissan Auto Receivables Owner Trust 5.05% 17/11/2014 "2008-B A4" 2,700,000 USD 2,699,403 2,850,664 0.47 Residential Funding Mortgage Securities I 5.75% 25/9/2034 "2004-S8 A11" 931,377 USD 907,992 808,697 0.13 USAA Auto Owner Trust 2.53% 15/7/2015 "2009-2 A4" 2,108,000 USD 2,107,959 2,099,694 0.34 USAA Auto Owner Trust 5.16% 15/11/2013 "2008-2 A4" 3,700,000 USD 3,699,304 3,939,520 0.64 Volkswagen Auto Loan Enhanced Trust 4.5% 20/7/2012 "2008-1 A3" 8,000,000 USD 7,999,759 8,200,156 1.34 Wachovia Auto Loan Owner Trust 2006-1 4.27% 20/4/2012 "2008-1 A3" 6,666,599 USD 6,666,571 6,768,664 1.10 Wachovia Auto Owner Trust 5.49% 22/4/2013 "2007-A A4" 5,300,000 USD 5,359,769 5,515,601 0.90 Wachovia Bank Commercial Mortgage Trust FRN 15/7/2045 "2006-C27 A3" 2,710,000 USD 1,965,992 2,460,544 0.40
Total Securitised Assets 200,321,019 205,447,295 33.55
Total Transferable Securities Admitted to an Official Stock Exchange Listing
or Dealt in on Another Regulated Market 538,774,838 552,527,465 90.22
Unlisted Securities
BONDS
AustraliaCommonwealth Bank of Australia 2.75% 15/10/2012 "144A" 1,500,000 USD 1,499,875 1,513,110 0.25 Commonwealth Bank of Australia 3.75% 15/10/2014 "144A" 1,000,000 USD 997,069 1,005,790 0.16 Macquarie Bank Ltd 4.1% 17/12/2013 "144A" 3,000,000 USD 2,999,691 3,161,625 0.52
5,496,635 5,680,525 0.93
BermudaBacardi Ltd 8.2% 1/4/2019 "144A" 1,300,000 USD 1,299,592 1,542,697 0.25
CanadaCanadian Oil Sands Ltd 7.75% 15/5/2019 "144A" 1,240,000 USD 1,237,588 1,404,596 0.23 Province of Ontario Canada 1.875% 19/11/2012 "1" 3,000,000 USD 2,994,759 2,975,292 0.49
4,232,347 4,379,888 0.72
Cayman IslandsHutchison Whampoa International 09/16 Ltd 4.625% 11/9/2015 "144A" 1,000,000 USD 998,378 1,012,854 0.16
LuxembourgEnel Finance International SA 6% 7/10/2039 "144A" 1,850,000 USD 1,840,148 1,869,094 0.30 Holcim US Finance Sarl & Cie SCS 6% 30/12/2019 "144A" 276,000 USD 272,435 288,564 0.05
2,112,583 2,157,658 0.35
NetherlandsRabobank Nederland NV 2.65% 17/8/2012 "144A" 2,000,000 USD 1,999,007 2,026,206 0.33
Quantity/ Aquisition % net
Description Nominal Currency cost Evaluation assets

156 The accompanying notes form an integral part of these financial statements.
INTERNATIONAL OPPORTUNITIES FUNDS
US BOND (continued)
Statement of Investment as at December 31, 2009
(expressed in USD)
QatarRas Laffan Liquefied Natural Gas Co., Ltd III 5.5% 30/9/2014 "144A" 1,304,000 USD 1,301,229 1,370,543 0.23 Ras Laffan Liquefied Natural Gas Co., Ltd III 6.75% 30/9/2019 "144A" 467,000 USD 465,639 507,418 0.08
1,766,868 1,877,961 0.31
SwedenVolvo Treasury AB 5.95% 1/4/2015 "144A" 638,000 USD 636,825 660,643 0.11
United Arab EmiratesDolphin Energy Ltd 5.888% 15/6/2019 "144A" 1,042,470 USD 1,042,470 1,052,895 0.17
United States of AmericaAllegheny Energy Supply Co. LLC 5.75% 15/10/2019 "144A" 412,000 USD 410,537 401,926 0.06 Allegheny Energy Supply Co. LLC 6.75% 15/10/2039 "144A" 295,000 USD 293,272 282,061 0.05 BAE Systems Holdings, Inc. 4.95% 1/6/2014 "144A" 1,310,000 USD 1,307,672 1,367,835 0.22 Cargill, Inc. 6.625% 15/9/2037 "144A" 1,365,000 USD 1,375,558 1,458,164 0.24 Chevron Phillips Chemical Co. LLC 7% 15/6/2014 "144A" 1,951,000 USD 1,950,361 2,147,905 0.35 Chevron Phillips Chemical Co. LLC 8.25% 15/6/2019 "144A" 199,000 USD 198,990 231,228 0.04 FMR LLC 6.45% 15/11/2039 "144A" 462,000 USD 460,953 432,526 0.07 Guardian Life Insurance Company of America 7.375% 30/9/2039 "144A" 563,000 USD 557,288 577,916 0.09 Metropolitan Life Global Funding I 2.875% 17/9/2012 "144A" 3,000,000 USD 2,992,311 2,997,411 0.49 Metropolitan Life Global Funding I 5.125% 10/6/2014 "144A" 3,400,000 USD 3,384,778 3,608,291 0.59 Monongahela Power Co. 7.95% 15/12/2013 "144A" 1,600,000 USD 1,597,435 1,763,043 0.29 Monumental Global Funding III 5.25% 15/1/2014 "144A" 3,500,000 USD 3,477,026 3,579,975 0.58 Nationwide Mutual Insurance Co. 9.375% 15/8/2039 "144A" 596,000 USD 595,982 631,135 0.10 New York Life Insurance Co. 6.75% 15/11/2039 "144A" 1,000,000 USD 997,708 1,026,639 0.17 Niagara Mohawk Power Corp. 4.881% 15/8/2019 "144A" 452,000 USD 452,000 450,161 0.07 Pacific Life Insurance Co. 9.25% 15/6/2039 "144A" 1,590,000 USD 1,589,251 1,842,172 0.30 Pricoa Global Funding I 5.3% 27/9/2013 "144A" 2,940,000 USD 3,020,273 3,047,954 0.50 Roche Holdings, Inc. 6% 1/3/2019 "144A" 1,640,000 USD 1,639,716 1,809,871 0.30 Teachers Insurance & Annuity Association of America 6.85% 16/12/2039 "144A" 690,000 USD 689,125 716,053 0.12 USAA Capital Corp. 3.5% 17/7/2014 "144A" 2,800,000 USD 2,792,910 2,773,148 0.45 WEA Finance LLC / WT Finance Aust Pty Ltd 5.75% 2/9/2015 "144A" 1,600,000 USD 1,585,340 1,693,419 0.28
31,368,486 32,838,833 5.36
Total Bonds 50,953,191 53,230,160 8.69
SECURITISED ASSETS
United States of AmericaMorgan Stanley Capital I FRN 15/7/2030 "1998-WF2 F" 3,250,000 USD 3,386,791 3,498,081 0.57
Total Securitised Assets 3,386,791 3,498,081 0.57
Total Unlisted Securities 54,339,982 56,728,241 9.26
Total Investments 593,114,820 609,255,706 99.48
Other Net Assets 3,179,489 0.52
Total Net Assets 612,435,195 100.00
Quantity/ Aquisition % net
Description Nominal Currency cost Evaluation assets

The accompanying notes form an integral part of these financial statements. 157
INTERNATIONAL OPPORTUNITIES FUNDS
US CORPORATE BOND
Statement of Investment as at December 31, 2009
(expressed in USD)
Quantity/ Aquisition % net
Description Nominal Currency cost Evaluation assets
Transferable Securities Admitted to an Official Stock Exchange Listingor Dealt in on Another Regulated Market
MUTUAL FUNDS
United States of AmericaBank of New York Mellon Liquidity "B" 6,255,598 USD 6,255,598 6,255,598 0.60
Total Mutual Funds 6,255,598 6,255,598 0.60
BONDS
AustraliaNational Australia Bank Ltd 3.375% 8/7/2014 "144A" 4,200,000 USD 4,186,723 4,248,947 0.41 National Australia Bank Ltd 5.35% 12/6/2013 "144A" 5,500,000 USD 5,499,849 5,934,572 0.57 Rio Tinto Finance USA Ltd 7.125% 15/7/2028 2,915,000 USD 2,427,001 3,312,288 0.32 Rio Tinto Finance USA Ltd 9% 1/5/2019 1,500,000 USD 1,466,358 1,905,966 0.18 Westpac Banking Corp. 4.875% 19/11/2019 2,000,000 USD 1,998,597 1,983,050 0.19
15,578,528 17,384,823 1.67
BelgiumDelhaize Group 5.875% 1/2/2014 2,744,000 USD 2,736,545 2,954,712 0.28
BermudaWeatherford International Ltd 5.15% 15/3/2013 4,000,000 USD 3,994,706 4,198,060 0.40
BrazilBrazilian Government International Bond 5.625% 7/1/2041 3,650,000 USD 3,521,893 3,403,625 0.33
CanadaAnadarko Finance Co. 7.5% 1/5/2031 "B" 375,000 USD 422,075 422,108 0.04 Canadian National Railway Co. 6.25% 1/8/2034 725,000 USD 751,028 796,204 0.08 Canadian National Railway Co. 6.375% 15/11/2037 946,000 USD 993,393 1,058,121 0.10 Canadian Natural Resources Ltd 5.15% 1/2/2013 3,500,000 USD 3,499,381 3,733,415 0.36 Canadian Natural Resources Ltd 5.7% 15/5/2017 576,000 USD 576,928 617,602 0.06 Canadian Natural Resources Ltd 5.85% 1/2/2035 1,250,000 USD 1,176,195 1,229,759 0.12 Canadian Natural Resources Ltd 6.25% 15/3/2038 750,000 USD 740,019 779,969 0.07 Cenovus Energy, Inc. 4.5% 15/9/2014 "144A" 1,129,000 USD 1,127,968 1,169,216 0.11 Cenovus Energy, Inc. 6.75% 15/11/2039 "144A" 1,919,000 USD 1,911,778 2,082,303 0.20 Husky Energy, Inc. 5.9% 15/6/2014 2,763,000 USD 2,760,060 3,021,078 0.29 Husky Energy, Inc. 6.8% 15/9/2037 1,000,000 USD 1,054,780 1,064,314 0.10 Nexen, Inc. 7.5% 30/7/2039 1,224,000 USD 1,217,304 1,409,766 0.13 Province of Ontario Canada 4% 7/10/2019 4,000,000 USD 3,993,293 3,848,152 0.37 Province of Ontario Canada 4.1% 16/6/2014 2,500,000 USD 2,498,511 2,617,270 0.25 Rogers Communications, Inc. 6.8% 15/8/2018 2,830,000 USD 2,826,453 3,181,865 0.31 Suncor Energy, Inc. 6.1% 1/6/2018 1,528,000 USD 1,526,494 1,646,027 0.16
27,075,660 28,677,169 2.75
Cayman IslandsPetrobras International Finance Co. 5.75% 20/1/2020 2,805,000 USD 2,779,098 2,850,491 0.27 Petrobras International Finance Co. 6.875% 20/1/2040 2,092,000 USD 2,059,809 2,163,333 0.21 Petrobras International Finance Co. 7.875% 15/3/2019 3,189,000 USD 3,227,590 3,691,028 0.35 Transocean, Inc. 5.25% 15/3/2013 1,600,000 USD 1,598,712 1,718,618 0.17 Vale Overseas Ltd 5.625% 15/9/2019 1,491,000 USD 1,479,903 1,482,181 0.14 Vale Overseas Ltd 6.875% 21/11/2036 409,000 USD 422,094 407,466 0.04 Vale Overseas Ltd 6.875% 10/11/2039 1,882,000 USD 1,855,115 1,887,241 0.18 Voto-Votorantim Overseas Trading Operations NV 6.625% 25/9/2019 "144A" 737,000 USD 730,565 738,843 0.07 XL Capital Ltd FRN Perpetual "E" 625,000 USD 556,635 471,875 0.05
14,709,521 15,411,076 1.48

158 The accompanying notes form an integral part of these financial statements.
INTERNATIONAL OPPORTUNITIES FUNDS
US CORPORATE BOND (continued)
Statement of Investment as at December 31, 2009
(expressed in USD)
FranceLafarge SA 7.125% 15/7/2036 345,000 USD 377,220 362,843 0.04 Societe Financement de l'Economie Francaise 2.875% 22/9/2014 "144A" 3,500,000 USD 3,482,358 3,484,467 0.33 Vivendi SA 6.625% 4/4/2018 "144A" 500,000 USD 498,730 543,956 0.05
4,358,308 4,391,266 0.42
GermanyDeutsche Bank AG (London) 6% 1/9/2017 1,225,000 USD 1,258,262 1,340,693 0.13 Kreditanstalt fuer Wiederaufbau 2.75% 21/10/2014 11,150,000 USD 11,142,096 11,062,539 1.06 Kreditanstalt fuer Wiederaufbau 4.75% 15/5/2012 "GMTN" 4,500,000 USD 4,789,124 4,829,139 0.47
17,189,482 17,232,371 1.66
ItalyItalian Republic 2.125% 5/10/2012 11,250,000 USD 11,234,858 11,235,802 1.08
LuxembourgCovidien International Finance SA 6.55% 15/10/2037 300,000 USD 314,916 337,359 0.03 Telecom Italia Capital SA 5.25% 15/11/2013 1,150,000 USD 1,140,926 1,212,856 0.12 Telecom Italia Capital SA 6.2% 18/7/2011 2,750,000 USD 2,767,058 2,913,895 0.28 Telecom Italia Capital SA 7.721% 4/6/2038 1,237,000 USD 1,237,000 1,430,615 0.14
5,459,900 5,894,725 0.57
MexicoGrupo Televisa SA 6.625% 15/1/2040 "144A" 1,728,000 USD 1,699,050 1,717,475 0.17 Petroleos Mexicanos 4.875% 15/3/2015 "144A" 4,000,000 USD 3,971,694 3,985,200 0.38 United Mexican States 5.95% 19/3/2019 "EMTN" 5,600,000 USD 5,934,356 5,847,839 0.56
11,605,100 11,550,514 1.11
NetherlandsDeutsche Telekom International Finance BV 5.875% 20/8/2013 2,000,000 USD 1,997,638 2,169,810 0.21 Shell International Finance BV 4.3% 22/9/2019 1,500,000 USD 1,494,960 1,488,863 0.14
3,492,598 3,658,673 0.35
New ZealandWestpac Securities NZ Ltd 3.45% 28/7/2014 "144A" 1,500,000 USD 1,497,019 1,514,766 0.15
NorwayStatoil ASA 2.9% 15/10/2014 3,000,000 USD 2,995,649 3,001,785 0.29
South KoreaHyundai Capital Services, Inc. 6% 5/5/2015 "144A" 1,386,000 USD 1,379,861 1,452,319 0.14 Korea National Oil Corp. 5.375% 30/7/2014 "144A" 933,000 USD 927,414 989,421 0.09
2,307,275 2,441,740 0.23
SpainSpain Government International Bond 2% 17/9/2012 "144A" 3,000,000 USD 2,990,356 2,994,255 0.29 Telefonica Emisiones SAU 4.949% 15/1/2015 2,500,000 USD 2,500,000 2,681,625 0.26 Telefonica Emisiones SAU 5.855% 4/2/2013 1,750,000 USD 1,773,131 1,895,061 0.18 Telefonica Emisiones SAU 5.877% 15/7/2019 889,000 USD 889,000 957,003 0.09
8,152,487 8,527,944 0.82
SupranationalEuropean Investment Bank 5.125% 15/4/2014 5,700,000 USD 6,178,590 6,234,335 0.60 Inter-American Development Bank 1.75% 22/10/2012 "GMTN" 12,000,000 USD 11,986,717 11,969,808 1.15
18,165,307 18,204,143 1.75
SwedenSvensk Exportkredit AB 3.25% 16/9/2014 2,000,000 USD 1,998,272 2,006,350 0.19
Quantity/ Aquisition % net
Description Nominal Currency cost Evaluation assets

The accompanying notes form an integral part of these financial statements. 159
INTERNATIONAL OPPORTUNITIES FUNDS
US CORPORATE BOND (continued)
Statement of Investment as at December 31, 2009
(expressed in USD)
SwitzerlandCredit Suisse (Guernsey) FRN Perpetual 1,775,000 USD 1,580,678 1,491,000 0.14 Credit Suisse (New York NY) 5.3% 13/8/2019 3,218,000 USD 3,215,402 3,319,679 0.32 Credit Suisse (New York NY) 5.5% 1/5/2014 3,700,000 USD 3,696,702 4,026,225 0.39 UBS AG (Stamford Branch) 5.75% 25/4/2018 "MTN" 2,150,000 USD 2,138,885 2,197,345 0.21
10,631,667 11,034,249 1.06
United Arab EmiratesAbu Dhabi National Energy Co. 4.75% 15/9/2014 "144A" 2,783,000 USD 2,768,656 2,682,308 0.26 Abu Dhabi National Energy Co. 7.25% 1/8/2018 "144A" 2,875,000 USD 2,871,182 2,972,109 0.28
5,639,838 5,654,417 0.54
United KingdomAnglo American Capital PLC 9.375% 8/4/2019 "144A" 229,000 USD 229,000 292,021 0.03 Barclays Bank PLC 2.5% 23/1/2013 2,000,000 USD 1,997,436 2,001,818 0.19 Barclays Bank PLC 5% 22/9/2016 "1" 1,026,000 USD 1,024,730 1,052,644 0.10 Barclays Bank PLC 6.75% 22/5/2019 2,920,000 USD 2,914,109 3,270,940 0.31 Barclays Bank PLC FRN Perpetual "144A" 3,000,000 USD 2,745,629 2,250,000 0.22 BP Capital Markets PLC 3.875% 10/3/2015 8,000,000 USD 8,161,345 8,246,744 0.79 British Sky Broadcasting Group PLC 6.1% 15/2/2018 "144A" 1,298,000 USD 1,296,830 1,380,249 0.13 British Sky Broadcasting Group PLC 9.5% 15/11/2018 "144A" 5,000,000 USD 5,453,936 6,434,620 0.62 BSKYB Finance UK PLC 5.625% 15/10/2015 "144A" 850,000 USD 853,266 931,309 0.09 HSBC Holdings PLC 6.5% 2/5/2036 1,340,000 USD 1,271,026 1,410,855 0.14 HSBC Holdings PLC 6.5% 15/9/2037 700,000 USD 663,254 734,233 0.07 HSBC Holdings PLC 6.8% 1/6/2038 2,225,000 USD 2,220,431 2,424,255 0.23 HSBC Holdings PLC 7.35% 27/11/2032 1,500,000 USD 1,568,118 1,554,239 0.15 Nationwide Building Society 2.5% 17/8/2012 "144A" 6,000,000 USD 5,996,237 6,054,306 0.58 SABMiller PLC 5.7% 15/1/2014 "144A" 4,000,000 USD 3,994,841 4,332,568 0.42
40,390,188 42,370,801 4.07
United States of AmericaAllied Waste North America, Inc. 6.875% 1/6/2017 3,276,000 USD 3,097,296 3,476,655 0.33 Allstate Corp. (The) 7.45% 16/5/2019 750,000 USD 748,090 875,000 0.08 Allstate Life Global Funding Trusts 5.375% 30/4/2013 "MTN" 4,200,000 USD 4,197,209 4,494,017 0.43 Altria Group, Inc. 9.95% 10/11/2038 4,057,000 USD 3,982,025 5,306,430 0.51 Altria Group, Inc. 10.2% 6/2/2039 1,700,000 USD 1,940,922 2,275,608 0.22 American Airlines Pass Through Trust 2009-1A 10.375% 2/7/2019 1,614,000 USD 1,614,000 1,783,470 0.17 American Express Bank FSB 5.55% 17/10/2012 "BKN1" 1,190,000 USD 1,195,951 1,274,755 0.12 American Express Credit Corp. 5.125% 25/8/2014 1,300,000 USD 1,298,842 1,373,260 0.13 American Express Credit Corp. 5.875% 2/5/2013 "MTN" 1,700,000 USD 1,696,052 1,828,670 0.18 Ameriprise Financial, Inc. FRN 1/6/2066 1,325,000 USD 1,327,126 1,166,000 0.11 AmerisourceBergen Corp. 4.875% 15/11/2019 569,000 USD 564,357 564,360 0.05 Amgen, Inc. 6.4% 1/2/2039 3,368,000 USD 3,352,773 3,710,950 0.36 Anadarko Petroleum Corp. 5.95% 15/9/2016 700,000 USD 711,295 760,228 0.07 Anadarko Petroleum Corp. 6.45% 15/9/2036 988,000 USD 1,007,456 1,035,859 0.10 Anadarko Petroleum Corp. 7.95% 15/6/2039 1,733,000 USD 1,727,201 2,152,098 0.21 Anheuser-Busch InBev Worldwide, Inc. 3% 15/10/2012 "144A" 5,000,000 USD 4,993,126 5,032,020 0.48 Anheuser-Busch InBev Worldwide, Inc. 4.125% 15/1/2015 "144A" 5,000,000 USD 4,993,401 5,092,780 0.49 Anheuser-Busch InBev Worldwide, Inc. 5.375% 15/1/2020 "144A" 3,941,000 USD 3,915,670 4,039,529 0.39 Appalachian Power Co. 6.7% 15/8/2037 "P" 1,500,000 USD 1,320,454 1,597,388 0.15 Appalachian Power Co. 7% 1/4/2038 1,750,000 USD 1,739,135 1,934,056 0.19 Archer-Daniels-Midland Co. 5.45% 15/3/2018 3,000,000 USD 2,999,952 3,208,158 0.31 Archer-Daniels-Midland Co. 5.935% 1/10/2032 1,400,000 USD 1,227,351 1,412,950 0.14 AT&T, Inc. 6.3% 15/1/2038 2,200,000 USD 2,190,958 2,245,263 0.22 AT&T, Inc. 6.55% 15/2/2039 10,557,000 USD 10,648,465 11,177,034 1.07 BAC Capital Trust VI 5.625% 8/3/2035 800,000 USD 682,472 641,119 0.06 BAC Capital Trust XIV FRN Perpetual 4,845,000 USD 4,307,309 3,343,050 0.32 Baltimore Gas & Electric Co. 6.125% 1/7/2013 1,250,000 USD 1,249,913 1,354,061 0.13 Baltimore Gas & Electric Co. 6.35% 1/10/2036 955,000 USD 948,408 985,535 0.09 Bank of America Corp. 5.65% 1/5/2018 3,150,000 USD 3,135,961 3,222,431 0.31 Bank of America Corp. 5.75% 1/12/2017 8,750,000 USD 8,422,039 8,994,177 0.86
Quantity/ Aquisition % net
Description Nominal Currency cost Evaluation assets

160 The accompanying notes form an integral part of these financial statements.
INTERNATIONAL OPPORTUNITIES FUNDS
US CORPORATE BOND (continued)
Statement of Investment as at December 31, 2009
(expressed in USD)
Bank of America Corp. 6.5% 1/8/2016 2,400,000 USD 2,394,352 2,590,966 0.25 BB&T Corp. 3.375% 25/9/2013 "MTN" 2,500,000 USD 2,497,925 2,526,055 0.24 BB&T Corp. 3.85% 27/7/2012 "MTN" 2,500,000 USD 2,499,168 2,591,440 0.25 Bear Stearns Cos. LLC (The) 5.7% 15/11/2014 1,000,000 USD 924,981 1,103,682 0.11 Bear Stearns Cos. LLC (The) 7.25% 1/2/2018 2,390,000 USD 2,384,707 2,753,751 0.26 Berkshire Hathaway Finance Corp. 4% 15/4/2012 "144A" 1,600,000 USD 1,636,948 1,679,126 0.16 BMC Software, Inc. 7.25% 1/6/2018 1,044,000 USD 1,038,784 1,141,332 0.11 Bunge Ltd Finance Corp. 8.5% 15/6/2019 1,662,000 USD 1,661,953 1,902,157 0.18 Bunge NA Finance LP 5.9% 1/4/2017 3,187,000 USD 3,372,055 3,167,002 0.30 Burlington Northern and Santa Fe Railway Co. 2005-3 Pass Through Trust 4.83% 15/1/2023 385,330 USD 325,766 405,140 0.04 Burlington Northern and Santa Fe Railway Co. 2006-1 Pass Through Trust 5.72% 15/1/2024 "06-1" 605,524 USD 571,549 630,048 0.06 Burlington Northern Santa Fe Corp. 5.75% 15/3/2018 3,500,000 USD 3,493,315 3,732,571 0.36 CA, Inc. 5.375% 1/12/2019 402,000 USD 398,678 406,108 0.04 Capital One Bank USA NA 8.8% 15/7/2019 2,300,000 USD 2,714,401 2,721,542 0.26 Capital One Financial Corp. 7.375% 23/5/2014 1,095,000 USD 1,090,304 1,243,154 0.12 CareFusion Corp. 4.125% 1/8/2012 "144A" 2,222,000 USD 2,209,015 2,294,135 0.22 Cellco Partnership / Verizon Wireless Capital LLC 3.75% 20/5/2011 7,235,000 USD 7,299,324 7,467,562 0.72 Cellco Partnership / Verizon Wireless Capital LLC 5.55% 1/2/2014 5,000,000 USD 4,973,699 5,441,970 0.52 Cellco Partnership / Verizon Wireless Capital LLC 8.5% 15/11/2018 4,317,000 USD 4,392,179 5,375,632 0.52 CenterPoint Energy Houston Electric LLC 6.95% 15/3/2033 "K2" 1,240,000 USD 1,373,863 1,377,187 0.13 Chicago Metropolitan Water Reclamation 5.72% 1/12/2038 968,000 USD 968,000 969,704 0.09 Chubb Corp. 6.5% 15/5/2038 "1" 3,000,000 USD 2,765,371 3,317,142 0.32 Chubb Corp. FRN 29/3/2067 1,885,000 USD 1,199,936 1,753,050 0.17 CIGNA Corp. 8.5% 1/5/2019 3,810,000 USD 3,799,714 4,346,463 0.42 Cisco Systems, Inc. 5.5% 15/1/2040 1,300,000 USD 1,266,861 1,248,415 0.12 Citigroup Capital XXI FRN 21/12/2057 1,926,000 USD 1,921,545 1,851,368 0.18 Citigroup, Inc. 6.01% 15/1/2015 1,950,000 USD 1,986,036 1,997,767 0.19 Citigroup, Inc. 6.125% 21/11/2017 6,500,000 USD 6,258,523 6,564,018 0.63 Citigroup, Inc. 6.125% 15/5/2018 2,000,000 USD 1,996,768 2,018,586 0.19 Citigroup, Inc. 6.5% 19/8/2013 2,800,000 USD 2,798,803 2,989,708 0.29 Citigroup, Inc. 8.125% 15/7/2039 1,331,000 USD 1,304,396 1,507,673 0.14 Citigroup, Inc. 8.5% 22/5/2019 5,394,000 USD 5,399,523 6,232,961 0.60 Cleveland Electric Illuminating Co. (The) 5.5% 15/8/2024 652,000 USD 648,607 649,756 0.06 Comcast Cable Communications Holdings, Inc. 8.375% 15/3/2013 2,380,000 USD 2,557,675 2,749,747 0.26 Comcast Cable Communications Holdings, Inc. 9.455% 15/11/2022 1,050,000 USD 1,304,381 1,356,963 0.13 Comcast Corp. 5.9% 15/3/2016 600,000 USD 604,022 648,157 0.06 Comcast Corp. 6.5% 15/11/2035 825,000 USD 825,354 859,331 0.08 Comcast Corp. 6.55% 1/7/2039 1,000,000 USD 995,110 1,052,018 0.10 Commonwealth Edison Co. 5.8% 15/3/2018 2,933,000 USD 2,928,373 3,122,598 0.30 ConocoPhillips 4.6% 15/1/2015 4,100,000 USD 4,096,751 4,367,910 0.42 ConocoPhillips 5.2% 15/5/2018 650,000 USD 649,953 684,618 0.07 ConocoPhillips Holding Co. 6.95% 15/4/2029 2,040,000 USD 2,324,632 2,320,176 0.22 Consolidated Edison Company of New York, Inc. 5.375% 15/12/2015 "05-C" 804,000 USD 805,296 896,307 0.09 Consumers Energy Co. 5.65% 15/4/2020 1,850,000 USD 1,864,754 1,940,413 0.19 Continental Airlines, Inc. 6.703% 15/6/2021 "01A1" 923,797 USD 917,197 863,750 0.08 Credit Suisse USA, Inc. 6.5% 15/1/2012 1,025,000 USD 1,054,235 1,116,963 0.11 CRH America, Inc. 6% 30/9/2016 602,000 USD 600,706 631,260 0.06 CRH America, Inc. 8.125% 15/7/2018 3,650,000 USD 3,150,456 4,273,471 0.41 CSX Corp. 5.75% 15/3/2013 1,550,000 USD 1,565,660 1,680,493 0.16 CVS Caremark Corp. 6.6% 15/3/2019 2,679,000 USD 2,663,361 2,943,940 0.28 Daimler Finance North America LLC 5.75% 8/9/2011 "MTN" 600,000 USD 606,841 630,861 0.06 Dell, Inc. 5.875% 15/6/2019 814,000 USD 813,485 865,180 0.08 Delta Air Lines, Inc. 7.75% 17/12/2019 "A" 828,000 USD 828,000 852,840 0.08 Dominion Resources, Inc./VA 7% 15/6/2038 1,557,000 USD 1,545,659 1,802,433 0.17 Dow Chemical Co. (The) 5.9% 15/2/2015 2,194,000 USD 2,189,791 2,368,190 0.23 Dow Chemical Co. (The) 8.55% 15/5/2019 5,430,000 USD 5,618,539 6,505,097 0.62 Dr Pepper Snapple Group, Inc. 6.82% 1/5/2018 712,000 USD 711,912 801,854 0.08 DTE Energy Co. 7.625% 15/5/2014 1,240,000 USD 1,240,000 1,388,362 0.13 Duke Realty LP 5.625% 15/8/2011 555,000 USD 561,196 568,666 0.05 Duke Realty LP 6.25% 15/5/2013 3,875,000 USD 3,873,283 3,906,151 0.38
Quantity/ Aquisition % net
Description Nominal Currency cost Evaluation assets

The accompanying notes form an integral part of these financial statements. 161
INTERNATIONAL OPPORTUNITIES FUNDS
US CORPORATE BOND (continued)
Statement of Investment as at December 31, 2009
(expressed in USD)
Dun & Bradstreet Corp. 6% 1/4/2013 3,500,000 USD 3,500,000 3,610,946 0.35 Enbridge Energy Partners LP 7.5% 15/4/2038 "B" 1,212,000 USD 1,208,702 1,384,182 0.13 Enbridge Energy Partners LP 9.875% 1/3/2019 3,210,000 USD 3,208,267 4,080,199 0.39 Energy Transfer Partners LP 6.625% 15/10/2036 937,000 USD 920,503 938,629 0.09 Energy Transfer Partners LP 8.5% 15/4/2014 2,304,000 USD 2,303,921 2,666,502 0.26 Enterprise Products Operating LLC 5.25% 31/1/2020 919,000 USD 913,225 911,203 0.09 Enterprise Products Operating LLC 5.65% 1/4/2013 2,000,000 USD 1,998,778 2,135,776 0.21 Enterprise Products Operating LLC 6.125% 15/10/2039 886,000 USD 880,608 859,382 0.08 Enterprise Products Operating LLC 7.55% 15/4/2038 2,170,000 USD 2,158,790 2,459,697 0.24 Exelon Generation Co. LLC 5.2% 1/10/2019 697,000 USD 695,680 700,434 0.07 Exelon Generation Co. LLC 6.25% 1/10/2039 1,331,000 USD 1,329,194 1,362,719 0.13 Express Scripts, Inc. 6.25% 15/6/2014 1,476,000 USD 1,470,428 1,614,986 0.16 Express Scripts, Inc. 7.25% 15/6/2019 357,000 USD 354,751 407,333 0.04 FirstEnergy Solutions Corp. 6.8% 15/8/2039 1,046,000 USD 1,042,440 1,061,325 0.10 Fiserv, Inc. 6.125% 20/11/2012 1,450,000 USD 1,463,094 1,581,762 0.15 Fiserv, Inc. 6.8% 20/11/2017 700,000 USD 709,591 775,291 0.07 General Electric Capital Corp. 4.875% 4/3/2015 "MTN" 625,000 USD 623,850 651,355 0.06 General Electric Capital Corp. 5.5% 4/6/2014 "MTN" 2,200,000 USD 2,254,313 2,337,491 0.22 General Electric Capital Corp. 5.65% 9/6/2014 "MTN" 3,700,000 USD 3,803,525 3,961,516 0.38 General Electric Capital Corp. 5.875% 14/1/2038 "MTN" 4,842,000 USD 4,651,108 4,500,799 0.43 General Electric Capital Corp. 5.9% 13/5/2014 2,500,000 USD 2,497,585 2,710,033 0.26 General Electric Capital Corp. 6% 7/8/2019 "GMTN" 1,547,000 USD 1,545,337 1,606,985 0.15 General Electric Capital Corp. 6.875% 10/1/2039 "MTN" 5,599,000 USD 5,279,283 5,804,153 0.56 General Electric Capital Corp. FRN 15/11/2067 670,000 USD 677,753 578,713 0.06 General Mills, Inc. 5.2% 17/3/2015 3,150,000 USD 3,144,710 3,372,547 0.32 Genworth Financial, Inc. 8.625% 15/12/2016 1,611,000 USD 1,607,892 1,677,362 0.16 Genworth Global Funding Trusts 5.75% 15/5/2013 "MTN" 1,000,000 USD 1,017,343 996,127 0.10 Georgia Power Co. 5.7% 1/6/2017 "B" 900,000 USD 920,178 980,103 0.09 GlaxoSmithKline Capital, Inc. 6.375% 15/5/2038 2,488,000 USD 2,568,386 2,767,833 0.27 Goldman Sachs Group, Inc. (The) 5.15% 15/1/2014 2,550,000 USD 2,281,853 2,704,492 0.26 Goldman Sachs Group, Inc. (The) 6.15% 1/4/2018 2,586,000 USD 2,583,390 2,775,536 0.27 Goldman Sachs Group, Inc. (The) 6.25% 1/9/2017 5,300,000 USD 4,807,382 5,688,124 0.55 Goldman Sachs Group, Inc. (The) 6.45% 1/5/2036 3,750,000 USD 2,685,690 3,707,434 0.36 Goldman Sachs Group, Inc. (The) 6.75% 1/10/2037 1,527,000 USD 1,458,629 1,575,565 0.15 Goldman Sachs Group, Inc. (The) 7.5% 15/2/2019 1,147,000 USD 1,189,946 1,342,654 0.13 Harris Corp. 6.375% 15/6/2019 754,000 USD 751,804 817,671 0.08 HCC Insurance Holdings, Inc. 6.3% 15/11/2019 578,000 USD 575,081 589,637 0.06 Hospira, Inc. 6.4% 15/5/2015 "GMTN" 738,000 USD 736,657 819,598 0.08 HSBC Finance Corp. 5.9% 19/6/2012 2,450,000 USD 2,473,791 2,612,810 0.25 International Lease Finance Corp. 4.75% 13/1/2012 1,400,000 USD 1,130,607 1,183,150 0.11 International Lease Finance Corp. 5.75% 15/6/2011 "MTN" 1,500,000 USD 1,510,495 1,378,817 0.13 International Paper Co. 7.3% 15/11/2039 1,709,000 USD 1,704,586 1,819,859 0.17 International Paper Co. 7.5% 15/8/2021 1,303,000 USD 1,301,993 1,466,971 0.14 Interstate Power & Light Co. 6.25% 15/7/2039 714,000 USD 709,560 753,388 0.07 JPMorgan Chase & Co. 6% 15/1/2018 7,925,000 USD 8,211,340 8,552,264 0.82 JPMorgan Chase & Co. 6.125% 27/6/2017 760,000 USD 772,884 806,406 0.08 JPMorgan Chase & Co. 6.3% 23/4/2019 4,200,000 USD 4,374,839 4,640,198 0.45 JPMorgan Chase & Co. FRN Perpetual "1" 2,535,000 USD 1,947,149 2,614,574 0.25 JPMorgan Chase Bank NA 6% 1/10/2017 "BKNT" 4,050,000 USD 4,278,651 4,369,148 0.42 JPMorgan Chase Capital XXV 6.8% 1/10/2037 "Y" 1,314,000 USD 1,204,903 1,311,372 0.13 JPMorgan Chase Capital XXVII 7% 1/11/2039 "AA" 3,800,000 USD 3,780,706 3,849,689 0.37 Kansas City Power & Light Co. 5.85% 15/6/2017 1,020,000 USD 1,050,000 1,055,117 0.10 Kellogg Co. 4.45% 30/5/2016 2,700,000 USD 2,693,500 2,791,965 0.27 Keycorp 6.5% 14/5/2013 "MTN" 1,808,000 USD 1,803,000 1,870,307 0.18 Kinder Morgan Energy Partners LP 6.5% 1/9/2039 1,688,000 USD 1,673,259 1,703,422 0.16 Kraft Foods, Inc. 6.875% 26/1/2039 625,000 USD 671,639 658,786 0.06 Kroger Co. (The) 6.9% 15/4/2038 1,200,000 USD 1,193,701 1,340,713 0.13 L-3 Communications Corp. 5.2% 15/10/2019 "144A" 344,000 USD 342,800 341,787 0.03 Lincoln National Corp. 6.25% 15/2/2020 909,000 USD 907,654 899,779 0.09 Lockheed Martin Corp. 4.25% 15/11/2019 2,750,000 USD 2,725,365 2,667,099 0.26 Lockheed Martin Corp. 6.15% 1/9/2036 "B" 1,150,000 USD 1,206,449 1,222,026 0.12 Lowe's Cos., Inc. 6.65% 15/9/2037 469,000 USD 471,195 537,110 0.05
Quantity/ Aquisition % net
Description Nominal Currency cost Evaluation assets

162 The accompanying notes form an integral part of these financial statements.
INTERNATIONAL OPPORTUNITIES FUNDS
US CORPORATE BOND (continued)
Statement of Investment as at December 31, 2009
(expressed in USD)
M&I Marshall & Ilsley Bank 5% 17/1/2017 "BKNT" 760,000 USD 597,641 593,388 0.06 Massachusetts Bay Transportation Authority Revenue 5.569% 1/7/2039 2,500,000 USD 2,500,000 2,379,125 0.23 MBNA Corp. 6.125% 1/3/2013 2,000,000 USD 1,951,880 2,126,298 0.20 Mead Johnson Nutrition Co. 3.5% 1/11/2014 "144A" 2,500,000 USD 2,489,180 2,479,113 0.24 Mead Johnson Nutrition Co. 5.9% 1/11/2039 "144A" 1,488,000 USD 1,487,601 1,471,398 0.14 Medco Health Solutions, Inc. 6.125% 15/3/2013 2,200,000 USD 2,191,898 2,358,759 0.23 Merrill Lynch & Co., Inc. 5.45% 5/2/2013 4,000,000 USD 3,996,790 4,217,768 0.41 Merrill Lynch & Co., Inc. 6.05% 15/8/2012 "MTN" 3,000,000 USD 3,216,352 3,218,628 0.31 Merrill Lynch & Co., Inc. 6.15% 25/4/2013 "MTN" 2,000,000 USD 1,998,250 2,145,276 0.21 Merrill Lynch & Co., Inc. 6.22% 15/9/2026 650,000 USD 600,057 623,255 0.06 Merrill Lynch & Co., Inc. 6.4% 28/8/2017 1,550,000 USD 1,193,339 1,637,330 0.16 MidAmerican Energy Co. 5.3% 15/3/2018 4,250,000 USD 4,238,026 4,396,914 0.42 Morgan Stanley 4.2% 20/11/2014 3,278,000 USD 3,276,720 3,290,283 0.32 Morgan Stanley 5.05% 21/1/2011 3,000,000 USD 3,099,887 3,111,777 0.30 Morgan Stanley 5.625% 23/9/2019 "MTN" 6,150,000 USD 6,144,209 6,222,515 0.60 Morgan Stanley 5.95% 28/12/2017 "MTN" 3,398,000 USD 3,390,308 3,518,085 0.34 Morgan Stanley 6.625% 1/4/2018 "MTN" 7,597,000 USD 7,409,323 8,245,237 0.79 Morgan Stanley 7.3% 13/5/2019 1,438,000 USD 1,437,197 1,617,018 0.16 National City Bank (Cleveland OH) 5.25% 15/12/2016 "BKNT" 1,200,000 USD 1,198,458 1,198,738 0.12 New Cingular Wireless Services, Inc. 8.75% 1/3/2031 400,000 USD 509,373 518,967 0.05 New York City Transitional Finance 5.767% 1/8/2036 5,000,000 USD 5,000,000 4,869,700 0.47 New York N Y City Municipal WTR Finance Authority 5.75% 15/6/2041 3,750,000 USD 3,750,000 3,598,837 0.35 Newmont Mining Corp. 6.25% 1/10/2039 1,500,000 USD 1,482,293 1,507,848 0.14 News America Holdings, Inc. 7.75% 20/1/2024 1,775,000 USD 1,990,866 1,833,051 0.18 News America, Inc. 6.65% 15/11/2037 700,000 USD 692,365 742,312 0.07 News America, Inc. 6.9% 15/8/2039 "144A" 2,313,000 USD 2,394,797 2,533,230 0.24 Nisource Finance Corp. 6.125% 1/3/2022 1,029,000 USD 1,024,594 1,055,519 0.10 Nisource Finance Corp. 10.75% 15/3/2016 1,778,000 USD 1,759,088 2,198,837 0.21 Norfolk Southern Corp. 5.9% 15/6/2019 614,000 USD 612,556 658,478 0.06 Northern States Power Co. (MN) 5.25% 15/7/2035 349,000 USD 322,367 334,563 0.03 Northern States Power Co. (MN) 6.2% 1/7/2037 950,000 USD 992,424 1,035,836 0.10 Nustar Logistics 7.65% 15/4/2018 2,120,000 USD 2,116,534 2,333,698 0.22 Oglethorpe Power Corp. 5.95% 1/11/2039 "144A" 1,961,000 USD 1,961,000 1,995,296 0.19 Ohio Power Co. 5.5% 15/2/2013 "F" 725,000 USD 728,068 767,011 0.07 Pacific Gas & Electric Co. 5.4% 15/1/2040 1,500,000 USD 1,478,782 1,442,913 0.14 Pacific Gas & Electric Co. 6.05% 1/3/2034 1,345,000 USD 1,340,661 1,410,754 0.14 Pacific Gas & Electric Co. 6.25% 1/12/2013 1,050,000 USD 1,043,951 1,172,138 0.11 Panhandle Eastern Pipeline Co. LP 6.2% 1/11/2017 620,000 USD 629,372 657,986 0.06 Peco Energy Co. 5.35% 1/3/2018 3,215,000 USD 3,210,595 3,391,995 0.33 Pfizer, Inc. 4.45% 15/3/2012 8,000,000 USD 8,315,009 8,473,232 0.81 Pfizer, Inc. 7.2% 15/3/2039 3,620,000 USD 3,968,374 4,441,555 0.43 Philip Morris International, Inc. 6.375% 16/5/2038 2,400,000 USD 2,389,765 2,604,850 0.25 Potomac Electric Power Co. 6.5% 15/11/2037 2,170,000 USD 2,107,091 2,392,896 0.23 PPL Energy Supply LLC 6.5% 1/5/2018 90,000 USD 89,749 94,200 0.01 Praxair, Inc. 4.5% 15/8/2019 3,000,000 USD 2,985,755 3,023,175 0.29 Principal Financial Group, Inc. 6.05% 15/10/2036 715,000 USD 696,437 648,396 0.06 Principal Life Income Funding Trusts 5.3% 24/4/2013 "MTN" 2,500,000 USD 2,496,994 2,645,790 0.25 Progress Energy, Inc. 6% 1/12/2039 1,200,000 USD 1,198,972 1,182,696 0.11 Prudential Financial, Inc. 3.625% 17/9/2012 "MTN" 2,902,000 USD 2,901,556 2,949,477 0.28 Prudential Financial, Inc. 4.5% 15/7/2013 "MTNB" 900,000 USD 875,863 912,409 0.09 Prudential Financial, Inc. 5.15% 15/1/2013 "MTN" 3,500,000 USD 3,497,984 3,689,280 0.35 Prudential Financial, Inc. 5.7% 14/12/2036 "MTN" 1,796,000 USD 1,634,789 1,629,076 0.16 Prudential Financial, Inc. 7.375% 15/6/2019 1,660,000 USD 1,659,953 1,868,918 0.18 Public Service Electric & Gas Co. 5.8% 1/5/2037 "MTN" 825,000 USD 818,961 853,168 0.08 Puget Sound Energy, Inc. 5.757% 1/10/2039 664,000 USD 664,000 641,227 0.06 Quest Diagnostics, Inc. (DE) 6.95% 1/7/2037 750,000 USD 793,809 838,797 0.08 Ralcorp Holdings, Inc. 6.625% 15/8/2039 "144A" 1,515,000 USD 1,510,543 1,483,143 0.14 Reed Elsevier Capital, Inc. 8.625% 15/1/2019 2,640,000 USD 2,630,740 3,225,035 0.31 Reinsurance Group of America, Inc. 6.45% 15/11/2019 1,578,000 USD 1,590,861 1,579,630 0.15
Quantity/ Aquisition % net
Description Nominal Currency cost Evaluation assets

The accompanying notes form an integral part of these financial statements. 163
INTERNATIONAL OPPORTUNITIES FUNDS
US CORPORATE BOND (continued)
Statement of Investment as at December 31, 2009
(expressed in USD)
Rowan Cos., Inc. 7.875% 1/8/2019 520,000 USD 516,730 580,939 0.06 San Diego Gas & Electric Co. 6% 1/6/2026 1,500,000 USD 1,539,735 1,587,792 0.15 San Diego Gas & Electric Co. 6.125% 15/9/2037 "FFF" 825,000 USD 861,657 903,425 0.09 SCANA Corp. 6.875% 15/5/2011 "MTN" 575,000 USD 589,077 609,383 0.06 Schering-Plough Corp. 6% 15/9/2017 840,000 USD 862,627 936,490 0.09 Simon Property Group LP 4.6% 15/6/2010 950,000 USD 949,191 964,143 0.09 Simon Property Group LP 5.6% 1/9/2011 1,197,000 USD 1,207,052 1,250,434 0.12 Simon Property Group LP 5.75% 1/12/2015 2,250,000 USD 1,847,134 2,303,413 0.22 Simon Property Group LP 6.75% 15/5/2014 2,500,000 USD 2,701,401 2,671,350 0.26 SLM Corp. 4% 15/1/2010 2,500,000 USD 2,494,181 2,499,883 0.24 Southwestern Public Service Co. 6% 1/10/2036 475,000 USD 454,334 474,633 0.05 St Jude Medical, Inc. 3.75% 15/7/2014 1,095,000 USD 1,093,492 1,110,031 0.11 St Jude Medical, Inc. 4.875% 15/7/2019 400,000 USD 395,143 405,015 0.04 State of Georgia 4.503% 1/11/2025 3,430,000 USD 3,430,000 3,362,806 0.32 State of Texas 5.517% 1/4/2039 4,800,000 USD 4,800,000 4,699,296 0.45 State of Washington 5.481% 1/8/2039 "D" 2,510,000 USD 2,510,000 2,447,200 0.24 Swiss Re Solutions Holding Corp. 7.75% 15/6/2030 1,400,000 USD 1,486,876 1,461,146 0.14 TD Ameritrade Holding Corp. 4.15% 1/12/2014 2,500,000 USD 2,497,576 2,472,360 0.24 Thermo Fisher Scientific, Inc. 2.15% 28/12/2012 "144A" 1,131,000 USD 1,129,425 1,117,387 0.11 Time Warner Cable, Inc. 5.4% 2/7/2012 1,389,000 USD 1,393,913 1,486,343 0.14 Time Warner Cable, Inc. 7.5% 1/4/2014 3,700,000 USD 3,685,409 4,275,531 0.41 Time Warner Entertainment Co., LP 8.375% 15/3/2023 540,000 USD 619,573 642,871 0.06 Time Warner, Inc. 7.7% 1/5/2032 3,050,000 USD 3,183,730 3,596,594 0.35 TJX Cos., Inc. 4.2% 15/8/2015 2,900,000 USD 2,899,785 3,045,542 0.29 Union Electric Co. 6% 1/4/2018 2,115,000 USD 2,109,729 2,214,896 0.21 Union Electric Co. 6.4% 15/6/2017 1,247,000 USD 1,276,448 1,347,612 0.13 Union Electric Co. 8.45% 15/3/2039 1,495,000 USD 1,490,153 1,982,473 0.19 Union Pacific Corp. 5.65% 1/5/2017 541,000 USD 544,648 574,305 0.06 Union Pacific Corp. 7.125% 1/2/2028 545,000 USD 603,553 605,159 0.06 Union Pacific Railroad Co. 2005 Pass Through Trust 5.082% 2/1/2029 "05-1" 473,895 USD 453,948 487,477 0.05 University of California Revenues 5.77% 15/5/2043 3,000,000 USD 2,997,507 2,918,820 0.28 USB Capital XIII Trust 6.625% 15/12/2039 1,500,000 USD 1,494,566 1,510,665 0.15 Valero Energy Corp. 6.625% 15/6/2037 860,000 USD 832,450 809,910 0.08 Valero Energy Corp. 10.5% 15/3/2039 3,200,000 USD 3,192,152 4,124,710 0.40 Verizon Communications, Inc. 5.5% 15/2/2018 2,100,000 USD 2,095,845 2,199,987 0.21 Verizon Communications, Inc. 6.4% 15/2/2038 4,100,000 USD 4,215,505 4,306,747 0.41 Verizon Global Funding Corp. 7.75% 1/12/2030 575,000 USD 676,829 678,211 0.07 Wachovia Corp. 5.5% 1/5/2013 "MTN" 3,850,000 USD 3,844,226 4,099,665 0.39 Wal-Mart Stores, Inc. 6.2% 15/4/2038 4,200,000 USD 4,585,894 4,651,202 0.45 Waste Management, Inc. 6.375% 11/3/2015 3,750,000 USD 3,738,719 4,168,856 0.40 Waste Management, Inc. (Old) 7.1% 1/8/2026 1,425,000 USD 1,541,564 1,548,049 0.15 WellPoint, Inc. 5.95% 15/12/2034 505,000 USD 485,680 480,460 0.05 Wells Fargo & Co. 4.375% 31/1/2013 4,000,000 USD 3,992,462 4,163,356 0.40 Wells Fargo & Co. 5.625% 11/12/2017 14,500,000 USD 15,099,110 15,140,102 1.45 Wells Fargo Bank NA 4.75% 9/2/2015 "AI" 2,310,000 USD 1,920,681 2,362,883 0.23 Wells Fargo Capital XIII FRN Perpetual "GMTN" 5,207,000 USD 4,856,915 5,050,790 0.49 Westar Energy, Inc. 5.1% 15/7/2020 1,319,000 USD 1,270,439 1,294,357 0.12 Willis North America, Inc. 7% 29/9/2019 555,000 USD 552,316 567,517 0.05 Wisconsin Power & Light Co. 6.375% 15/8/2037 600,000 USD 624,333 642,410 0.06 Wyeth 5.95% 1/4/2037 1,050,000 USD 1,056,669 1,099,430 0.11 Xerox Corp. 4.25% 15/2/2015 1,500,000 USD 1,497,164 1,494,764 0.14 Xerox Corp. 5.5% 15/5/2012 3,271,000 USD 3,279,101 3,438,966 0.33 Xerox Corp. 5.625% 15/12/2019 259,000 USD 258,293 259,792 0.03
569,677,560 605,729,084 58.19
Total Bonds 782,412,361 826,478,095 79.39
Quantity/ Aquisition % net
Description Nominal Currency cost Evaluation assets

164 The accompanying notes form an integral part of these financial statements.
INTERNATIONAL OPPORTUNITIES FUNDS
US CORPORATE BOND (continued)
Statement of Investment as at December 31, 2009
(expressed in USD)
SECURITISED ASSETS
United States of AmericaBanc of America Commercial Mortgage, Inc. 5.675% 10/7/2046 "2006-4 AM" 1,367,000 USD 889,264 1,071,377 0.10 Banc of America Commercial Mortgage, Inc. FRN 10/7/2044 "2006-3 AM" 1,025,000 USD 900,521 821,641 0.08 Banc of America Commercial Mortgage, Inc. FRN 10/5/2045 "2006-2 A4" 5,435,000 USD 4,025,158 5,342,273 0.51 Banc of America Commercial Mortgage, Inc. FRN 10/10/2045 "2005-5 A4" 1,500,000 USD 1,436,173 1,474,479 0.14 Banc of America Mortgage Securities, Inc. FRN 25/5/2035 "2005-D 2A4 138,017 USD 137,393 136,575 0.01 Banc of America Securities Auto Trust 5.34% 18/2/2011 "2006-G1 B 1,075,000 USD 1,066,515 1,077,630 0.10 Bear Stearns Commercial Mortgage Securities 4.74% 13/3/2040 "2003-T10 A2" 2,500,000 USD 2,452,109 2,510,645 0.24 Bear Stearns Commercial Mortgage Securities 5.537% 12/10/2041 "2006-T24 A4" 1,462,000 USD 1,170,007 1,457,101 0.14 Bear Stearns Commercial Mortgage Securities FRN 11/9/2038 "2006-PW12 AM" 251,000 USD 220,508 210,683 0.02 Bear Stearns Commercial Mortgage Securities FRN 13/8/2039 "2003-T12 A4" 1,435,000 USD 1,371,087 1,439,842 0.14 Bear Stearns Commercial Mortgage Securities FRN 11/6/2050 "2007-PW17 AM" 2,012,000 USD 1,267,088 1,455,415 0.14 CarMax Auto Owner Trust 4.12% 15/3/2013 "2009-1 A3" 4,662,000 USD 4,823,468 4,833,839 0.47 CarMax Auto Owner Trust 5.81% 16/12/2013 "2009-1 A4" 3,000,000 USD 3,219,382 3,213,831 0.31 Caterpillar Financial Asset Trust 5.34% 25/6/2012 "2007-A A3A" 621,643 USD 571,123 632,868 0.06 Chase Issuance Trust 4.96% 17/9/2012 "2007-A15 A" 10,185,000 USD 10,538,560 10,494,544 1.01 Chase Issuance Trust 5.12% 15/10/2014 "2007-A17 A" 1,741,000 USD 1,879,011 1,878,311 0.18 Citigroup Commercial Mortgage Trust FRN 15/3/2049 "2006-C4 A3" 3,390,000 USD 2,893,840 3,255,456 0.31 Citigroup Commercial Mortgage Trust FRN 10/12/2049 "2007-C6 A4" 600,000 USD 419,908 536,287 0.05 Citigroup Commercial Mortgage Trust FRN 10/12/2049 "2007-C6 AM" 335,000 USD 299,554 241,941 0.02 CNH Equipment Trust 4.78% 16/7/2012 1,700,967 USD 1,700,818 1,729,313 0.17 CNH Equipment Trust 5.27% 15/9/2011 2,366,666 USD 2,361,481 2,371,077 0.23 Credit Suisse Mortgage Capital Certificates 5.343% 15/12/2039 "2006-C5 AM" 517,000 USD 330,091 391,743 0.04 Credit Suisse Mortgage Capital Certificates FRN 15/6/2039 467,000 USD 386,195 283,741 0.03 Credit Suisse Mortgage Capital Certificates FRN 15/6/2039 "2007-C3 A4" 2,000,000 USD 1,289,267 1,602,756 0.15 Credit Suisse Mortgage Capital Certificates FRN 15/9/2040 "2007-C5 AM" 1,070,000 USD 875,663 674,081 0.07 CS First Boston Mortgage Securities Corp. 5.183% 15/11/2036 "2002-CKS4 A2" 3,385,000 USD 3,350,108 3,502,181 0.34 CW Capital Cobalt Ltd FRN 15/5/2046 "2007-C3 A4" 1,035,000 USD 946,055 848,866 0.08 Greenwich Capital Commercial Funding Corp. 5.444% 10/3/2039 "2007-GG9 A4" 1,670,000 USD 1,230,099 1,478,491 0.14 GS Mortgage Securities Corp. II 5.56% 10/11/2039 "2006-GG8 A4" 695,000 USD 477,501 609,938 0.06 GS Mortgage Securities Corp. II FRN 10/4/2038 "2006-GG6 A4" 1,070,000 USD 855,866 978,583 0.10 Household Automotive Trust 5.3% 17/11/2011 "2007-1 A3" 747,107 USD 747,233 756,641 0.07 John Deere Owner Trust 3.96% 16/5/2016 "2009-A A4" 1,491,000 USD 1,563,246 1,555,682 0.15 JP Morgan Chase Commercial Mortgage Securities Corp. 5.308% 12/10/2037 3,050,000 USD 2,725,066 3,075,048 0.30 JP Morgan Chase Commercial Mortgage Securities Corp. 5.716% 15/2/2051 "2007-C1 A4" 700,000 USD 354,392 556,622 0.05 JP Morgan Chase Commercial Mortgage Securities Corp. FRN 12/2/2049 "2007-CB19 AM" 2,310,000 USD 2,150,167 1,676,805 0.16 Merrill Lynch Mortgage Trust FRN 12/10/2041 625,000 USD 601,457 613,648 0.06 Morgan Stanley Capital I FRN 12/12/2049 "2007-IQ16 AM" 331,000 USD 309,099 223,063 0.02 USAA Auto Owner Trust 4.77% 15/9/2014 "2009-1 A4" 15,000,000 USD 15,914,846 15,942,153 1.53 Wachovia Auto Loan Owner Trust 2006-1 4.27% 20/4/2012 "2008-1 A3" 925,916 USD 839,094 940,092 0.09 Wachovia Auto Loan Owner Trust 2006-1 5.29% 20/4/2012 "2007-1 A3A" 3,205,328 USD 3,253,716 3,264,679 0.31
Quantity/ Aquisition % net
Description Nominal Currency cost Evaluation assets

The accompanying notes form an integral part of these financial statements. 165
INTERNATIONAL OPPORTUNITIES FUNDS
US CORPORATE BOND (continued)
Statement of Investment as at December 31, 2009
(expressed in USD)
Wachovia Auto Owner Trust 5.49% 22/4/2013 "2007-A A4" 3,250,000 USD 3,287,833 3,382,208 0.33 Wachovia Bank Commercial Mortgage Trust 4.867% 15/2/2035 1,240,000 USD 1,203,175 1,278,082 0.12 Wachovia Bank Commercial Mortgage Trust FRN 15/7/2042 "2005-C20 A7" 178,000 USD 133,187 172,455 0.02 Wachovia Bank Commercial Mortgage Trust FRN 15/7/2045 "2006-C27 A3" 6,770,000 USD 4,648,320 6,146,819 0.59
Total Securitised Assets 91,114,644 96,139,505 9.24
Total Transferable Securities Admitted to an Official Stock Exchange Listing
or Dealt in on Another Regulated Market 879,782,603 928,873,198 89.23
Unlisted Securities
BONDS
AustraliaCommonwealth Bank of Australia 3.75% 15/10/2014 "144A" 3,500,000 USD 3,489,742 3,520,265 0.34 Macquarie Group Ltd 7.3% 1/8/2014 "144A" 2,300,000 USD 2,295,174 2,492,632 0.24 Macquarie Group Ltd 7.625% 13/8/2019 "144A" 1,005,000 USD 1,000,800 1,124,080 0.11
6,785,716 7,136,977 0.69
BermudaBacardi Ltd 8.2% 1/4/2019 "144A" 2,200,000 USD 2,199,309 2,610,718 0.25 Holcim Capital Corp., Ltd 6.875% 29/9/2039 "144A" 360,000 USD 351,254 379,832 0.04
2,550,563 2,990,550 0.29
CanadaCanadian Oil Sands Ltd 7.75% 15/5/2019 "144A" 1,981,000 USD 1,977,147 2,243,956 0.22 Xstrata Finance Canada Ltd 5.8% 15/11/2016 "144A" 1,120,000 USD 1,132,489 1,152,166 0.11
3,109,636 3,396,122 0.33
Cayman IslandsHutchison Whampoa International 09/16 Ltd 4.625% 11/9/2015 "144A" 2,200,000 USD 2,196,432 2,228,279 0.21
LuxembourgEnel Finance International SA 6% 7/10/2039 "144A" 2,550,000 USD 2,536,420 2,576,319 0.25 Holcim US Finance Sarl & Cie SCS 6% 30/12/2019 "144A" 276,000 USD 272,435 288,564 0.03
2,808,855 2,864,883 0.28
NetherlandsE.ON International Finance BV 6.65% 30/4/2038 "144A" 1,291,000 USD 1,285,784 1,475,204 0.14 Siemens Financieringsmaatschappij NV 6.125% 17/8/2026 "144A" 1,200,000 USD 1,214,030 1,276,193 0.12
2,499,814 2,751,397 0.26
QatarRas Laffan Liquefied Natural Gas Co., Ltd III 5.5% 30/9/2014 "144A" 1,848,000 USD 1,844,072 1,942,303 0.19 Ras Laffan Liquefied Natural Gas Co., Ltd III 5.832% 30/9/2016 "144A" 750,000 USD 774,382 787,785 0.07 Ras Laffan Liquefied Natural Gas Co., Ltd III 5.838% 30/9/2027 "144A" 455,000 USD 437,659 454,386 0.04 Ras Laffan Liquefied Natural Gas Co., Ltd III 6.75% 30/9/2019 "144A" 661,000 USD 659,074 718,209 0.07
3,715,187 3,902,683 0.37
SwedenVolvo Treasury AB 5.95% 1/4/2015 "144A" 1,489,000 USD 1,486,258 1,541,846 0.15
United Arab EmiratesDolphin Energy Ltd 5.888% 15/6/2019 "144A" 3,319,470 USD 3,319,470 3,352,665 0.32
Quantity/ Aquisition % net
Description Nominal Currency cost Evaluation assets

166 The accompanying notes form an integral part of these financial statements.
INTERNATIONAL OPPORTUNITIES FUNDS
US CORPORATE BOND (continued)
Statement of Investment as at December 31, 2009
(expressed in USD)
United States of AmericaAllegheny Energy Supply Co. LLC 5.75% 15/10/2019 "144A" 915,000 USD 911,750 892,627 0.09 Allegheny Energy Supply Co. LLC 6.75% 15/10/2039 "144A" 737,000 USD 732,684 704,674 0.07 ASIF Global Financing XIX 4.9% 17/1/2013 "144A" 950,000 USD 942,063 875,851 0.08 BAE Systems Holdings, Inc. 6.375% 1/6/2019 "144A" 1,370,000 USD 1,365,496 1,480,003 0.14 Cargill, Inc. 6.125% 19/4/2034 "144A" 1,525,000 USD 1,493,449 1,521,959 0.15 Cargill, Inc. 6.125% 15/9/2036 "144A" 854,000 USD 835,591 852,235 0.08 Cargill, Inc. 7.35% 6/3/2019 "144A" 1,650,000 USD 1,647,881 1,908,568 0.18 Chevron Phillips Chemical Co. LLC 7% 15/6/2014 "144A" 3,755,000 USD 3,753,771 4,133,973 0.40 Chevron Phillips Chemical Co. LLC 8.25% 15/6/2019 "144A" 588,000 USD 587,972 683,225 0.07 CVS Pass-Through Trust 6.036% 10/12/2028 5,452,396 USD 5,335,112 5,174,596 0.50 CVS Pass-Through Trust 7.507% 10/1/2032 "144A" 606,000 USD 606,000 636,851 0.06 Erac USA Finance Co. 7% 15/10/2037 "144A" 1,000,000 USD 1,003,671 982,342 0.09 FMR LLC 6.45% 15/11/2039 "144A" 1,692,000 USD 1,688,164 1,584,057 0.15 Guardian Life Insurance Company of America 7.375% 30/9/2039 "144A" 845,000 USD 836,427 867,387 0.08 Kansas Gas & Electric 6.7% 15/6/2019 "144A" 1,551,000 USD 1,668,160 1,730,922 0.17 Metlife Capital Trust IV 7.875% 15/12/2037 "144A" 700,000 USD 693,860 696,500 0.07 MetLife Capital Trust X FRN 8/4/2038 "144A" 1,200,000 USD 1,200,000 1,356,000 0.13 Monongahela Power Co. 7.95% 15/12/2013 "144A" 4,000,000 USD 3,993,589 4,407,608 0.42 Monumental Global Funding III 5.25% 15/1/2014 "144A" 1,800,000 USD 1,752,672 1,841,130 0.18 Nationwide Mutual Insurance Co. 9.375% 15/8/2039 "144A" 894,000 USD 893,973 946,702 0.09 New York Life Insurance Co. 6.75% 15/11/2039 "144A" 1,900,000 USD 1,895,645 1,950,614 0.19 NGPL Pipeco LLC 6.514% 15/12/2012 "144A" 4,080,000 USD 4,140,727 4,442,345 0.43 Niagara Mohawk Power Corp. 4.881% 15/8/2019 "144A" 1,086,000 USD 1,086,000 1,081,581 0.10 Pacific Life Insurance Co. 9.25% 15/6/2039 "144A" 2,886,000 USD 2,938,675 3,343,717 0.32 Pricoa Global Funding I 4.625% 25/6/2012 "144A" 2,300,000 USD 2,083,872 2,384,861 0.23 Pricoa Global Funding I 5.3% 27/9/2013 "144A" 1,550,000 USD 1,592,321 1,606,914 0.15 Principal Life Global Funding I 5.25% 15/1/2013 "144A" 1,100,000 USD 1,120,341 1,121,998 0.11 Sovereign Bank 8.75% 30/5/2018 750,000 USD 671,005 869,776 0.08 Teachers Insurance & Annuity Association of America 6.85% 16/12/2039 "144A" 1,897,000 USD 1,894,595 1,968,627 0.19 USAA Capital Corp. 3.5% 17/7/2014 "144A" 3,500,000 USD 3,491,138 3,466,435 0.33 WEA Finance LLC / WT Finance Aust Pty Ltd 5.75% 2/9/2015 "144A" 2,200,000 USD 2,179,842 2,328,451 0.22 WEA Finance LLC / WT Finance Aust Pty Ltd 6.75% 2/9/2019 "144A" 1,347,000 USD 1,330,040 1,452,463 0.14 WEA Finance LLC / WT Finance Aust Pty Ltd 7.5% 2/6/2014 "144A" 2,000,000 USD 1,982,028 2,257,320 0.22
58,348,514 61,552,312 5.91
Total Bonds 86,820,445 91,717,714 8.81
SECURITISED ASSETS
United States of AmericaMorgan Stanley Capital I FRN 15/7/2030 "1998-WF2 F" 2,750,000 USD 2,865,747 2,959,914 0.28 Morgan Stanley Reremic Trust FRN 12/8/2045 "2009-GG10 A4A" 5,000,000 USD 4,277,693 4,542,255 0.44
Total Securitised Assets 7,143,440 7,502,169 0.72
Total Unlisted Securities 93,963,885 99,219,883 9.53
Total Investments 973,746,488 1,028,093,081 98.76
Other Net Assets 12,917,112 1.24
Total Net Assets 1,041,010,193 100.00
Quantity/ Aquisition % net
Description Nominal Currency cost Evaluation assets

The accompanying notes form an integral part of these financial statements. 167
INTERNATIONAL OPPORTUNITIES FUNDS
US HIGH INVESTMENT GRADE BOND
Statement of Investment as at December 31, 2009
(expressed in USD)
Quantity/ Aquisition % net
Description Nominal Currency cost Evaluation assets
Transferable Securities Admitted to an Official Stock Exchange Listingor Dealt in on Another Regulated Market
MUTUAL FUNDS
United States of AmericaBank of New York Mellon Liquidity "B" 481,138 USD 481,138 481,138 0.22
Total Mutual Funds 481,138 481,138 0.22
BONDS
AustraliaBHP Billiton Finance USA Ltd 6.5% 1/4/2019 384,000 USD 382,767 442,359 0.20 National Australia Bank Ltd 3.375% 8/7/2014 "144A" 1,800,000 USD 1,794,310 1,820,977 0.84 National Australia Bank Ltd 5.35% 12/6/2013 "144A" 1,500,000 USD 1,499,958 1,618,519 0.74 Westpac Banking Corp. 4.875% 19/11/2019 750,000 USD 749,474 743,644 0.34
4,426,509 4,625,499 2.12
CanadaProvince of Ontario Canada 4% 7/10/2019 900,000 USD 898,491 865,834 0.40
FinlandNokia OYJ 6.625% 15/5/2039 417,000 USD 414,937 455,192 0.21
GermanyDeutsche Bank AG (London) 6% 1/9/2017 1,000,000 USD 996,116 1,094,443 0.50
ItalyItalian Republic 2.125% 5/10/2012 2,500,000 USD 2,496,635 2,496,845 1.15
NetherlandsShell International Finance BV 4.3% 22/9/2019 1,500,000 USD 1,494,961 1,488,862 0.68
NorwayStatoil ASA 2.9% 15/10/2014 1,000,000 USD 998,550 1,000,595 0.46 StatoilHydro ASA 5.25% 15/4/2019 625,000 USD 623,891 665,362 0.30
1,622,441 1,665,957 0.76
South KoreaKorea National Oil Corp. 5.375% 30/7/2014 "144A" 350,000 USD 347,904 371,166 0.17
SpainSpain Government International Bond 2% 17/9/2012 "144A" 1,500,000 USD 1,495,178 1,497,127 0.69
SwedenSvensk Exportkredit AB 3.25% 16/9/2014 1,000,000 USD 999,136 1,003,175 0.46
SwitzerlandCredit Suisse (Guernsey) FRN Perpetual 1,000,000 USD 1,000,000 840,000 0.39 Credit Suisse (New York NY) 5.3% 13/8/2019 2,011,000 USD 2,009,376 2,074,542 0.95 Credit Suisse (New York NY) 5.5% 1/5/2014 2,700,000 USD 2,697,593 2,938,056 1.35 UBS AG (Stamford Branch) 5.75% 25/4/2018 "MTN" 750,000 USD 746,124 766,516 0.35
6,453,093 6,619,114 3.04
United Arab EmiratesAbu Dhabi National Energy Co. 4.75% 15/9/2014 "144A" 1,739,000 USD 1,730,037 1,676,081 0.77 Abu Dhabi National Energy Co. 7.25% 1/8/2018 "144A" 722,000 USD 721,042 746,387 0.34
2,451,079 2,422,468 1.11

168 The accompanying notes form an integral part of these financial statements.
INTERNATIONAL OPPORTUNITIES FUNDS
US HIGH INVESTMENT GRADE BOND (continued)
Statement of Investment as at December 31, 2009
(expressed in USD)
United KingdomBarclays Bank PLC 2.5% 23/1/2013 1,000,000 USD 998,718 1,000,909 0.46 Barclays Bank PLC 5% 22/9/2016 "1" 513,000 USD 512,365 526,322 0.24 Barclays Bank PLC 6.75% 22/5/2019 1,300,000 USD 1,297,377 1,456,240 0.67 Barclays Bank PLC FRN Perpetual "144A" 1,000,000 USD 1,020,654 750,000 0.34 BP Capital Markets PLC 3.625% 8/5/2014 2,250,000 USD 2,250,000 2,308,189 1.06 BP Capital Markets PLC 3.875% 10/3/2015 2,000,000 USD 2,040,336 2,061,686 0.95 HSBC Holdings PLC 6.5% 2/5/2036 975,000 USD 1,043,195 1,026,555 0.47 HSBC Holdings PLC 6.5% 15/9/2037 730,000 USD 728,791 765,700 0.35 HSBC Holdings PLC 6.8% 1/6/2038 1,415,000 USD 1,411,326 1,541,717 0.71 Nationwide Building Society 2.5% 17/8/2012 "144A" 2,000,000 USD 1,998,746 2,018,102 0.92
13,301,508 13,455,420 6.17
United States of AmericaAbbott Laboratories 5.125% 1/4/2019 1,000,000 USD 996,031 1,050,609 0.48 Alabama Power Co. 6% 1/3/2039 1,000,000 USD 998,135 1,059,305 0.49 Allstate Life Global Funding Trusts 5.375% 30/4/2013 "MTN" 1,200,000 USD 1,199,204 1,284,005 0.59 Archer-Daniels-Midland Co. 5.935% 1/10/2032 1,125,000 USD 1,138,519 1,135,406 0.52 AT&T, Inc. 5.8% 15/2/2019 2,000,000 USD 1,994,349 2,140,908 0.98 AT&T, Inc. 5.875% 15/8/2012 1,000,000 USD 1,076,123 1,093,479 0.50 AT&T, Inc. 6.3% 15/1/2038 1,050,000 USD 1,045,688 1,071,603 0.49 AT&T, Inc. 6.55% 15/2/2039 2,486,000 USD 2,466,518 2,632,008 1.21 BAC Capital Trust XI 6.625% 23/5/2036 1,500,000 USD 1,613,541 1,323,750 0.61 BAC Capital Trust XIV FRN Perpetual 3,000,000 USD 3,011,113 2,070,000 0.95 Bank of America Corp. 5.65% 1/5/2018 1,250,000 USD 1,244,429 1,278,742 0.59 Bank of America Corp. 5.75% 1/12/2017 3,000,000 USD 2,810,155 3,083,718 1.41 Bank of America Corp. 6.5% 1/8/2016 1,000,000 USD 997,647 1,079,569 0.50 Bank of America Corp. 7.375% 15/5/2014 600,000 USD 597,096 683,692 0.31 Bank of New York Mellon Corp. (The) 4.3% 15/5/2014 2,000,000 USD 1,999,444 2,110,840 0.97 BB&T Corp. 3.375% 25/9/2013 "MTN" 750,000 USD 749,378 757,817 0.35 BB&T Corp. 3.85% 27/7/2012 "MTN" 2,000,000 USD 1,999,334 2,073,152 0.95 BB&T Corp. 5.7% 30/4/2014 1,000,000 USD 999,559 1,085,372 0.50 Bear Stearns Cos. LLC (The) 5.35% 1/2/2012 1,700,000 USD 1,665,656 1,808,902 0.83 Bear Stearns Cos. LLC (The) 7.25% 1/2/2018 970,000 USD 967,853 1,117,631 0.51 Berkshire Hathaway Finance Corp. 4% 15/4/2012 "144A" 1,000,000 USD 1,023,093 1,049,454 0.48 BlackRock, Inc. 2.25% 10/12/2012 500,000 USD 498,815 498,741 0.23 BlackRock, Inc. 3.5% 10/12/2014 1,000,000 USD 998,568 987,860 0.45 Boeing Co. (The) 6.875% 15/3/2039 722,000 USD 707,336 844,208 0.39 Burlington Northern and Santa Fe Railway Co. 2005-3 Pass Through Trust 4.83% 15/1/2023 1,120,312 USD 1,120,312 1,177,908 0.54 Burlington Northern and Santa Fe Railway Co. 2006-1 Pass Through Trust 5.72% 15/1/2024 "06-1" 1,953,303 USD 1,953,303 2,032,412 0.93 Cellco Partnership / Verizon Wireless Capital LLC 3.75% 20/5/2011 500,000 USD 503,375 516,072 0.24 Cellco Partnership / Verizon Wireless Capital LLC 5.55% 1/2/2014 1,500,000 USD 1,492,109 1,632,591 0.75 Cellco Partnership / Verizon Wireless Capital LLC 8.5% 15/11/2018 915,000 USD 906,342 1,139,380 0.52 Chicago Metropolitan Water Reclamation 5.72% 1/12/2038 968,000 USD 968,000 969,704 0.44 Cisco Systems, Inc. 5.5% 15/1/2040 500,000 USD 487,254 480,160 0.22 ConocoPhillips 4.6% 15/1/2015 1,700,000 USD 1,698,652 1,811,085 0.83 ConocoPhillips 5.75% 1/2/2019 2,000,000 USD 1,987,756 2,198,532 1.01 ConocoPhillips 6.5% 1/2/2039 984,000 USD 949,964 1,096,607 0.50 General Electric Capital Corp. 5.25% 19/10/2012 "MTN" 2,500,000 USD 2,464,564 2,665,120 1.22 General Electric Capital Corp. 5.625% 1/5/2018 1,000,000 USD 997,784 1,028,776 0.47 General Electric Capital Corp. 5.875% 14/1/2038 "MTN" 2,590,000 USD 2,495,441 2,407,490 1.10 General Electric Capital Corp. 5.9% 13/5/2014 1,000,000 USD 999,035 1,084,013 0.50 General Electric Capital Corp. 6% 7/8/2019 "GMTN" 773,000 USD 772,170 802,973 0.37 General Electric Capital Corp. 6.15% 7/8/2037 "GMTN" 1,250,000 USD 1,243,119 1,184,949 0.54 General Electric Capital Corp. 6.875% 10/1/2039 "MTN" 2,548,000 USD 2,434,208 2,641,361 1.21 General Electric Capital Corp. FRN 28/4/2011 2,000,000 USD 1,873,757 1,988,290 0.91 General Electric Capital Corp. FRN 15/11/2067 1,480,000 USD 1,480,000 1,278,350 0.59 General Electric Co. 5.25% 6/12/2017 1,500,000 USD 1,490,440 1,538,701 0.71 GlaxoSmithKline Capital, Inc. 5.65% 15/5/2018 881,000 USD 880,552 954,089 0.44
Quantity/ Aquisition % net
Description Nominal Currency cost Evaluation assets

The accompanying notes form an integral part of these financial statements. 169
INTERNATIONAL OPPORTUNITIES FUNDS
US HIGH INVESTMENT GRADE BOND (continued)
Statement of Investment as at December 31, 2009
(expressed in USD)
Goldman Sachs Group, Inc. (The) 3.625% 1/8/2012 1,000,000 USD 999,338 1,031,831 0.47 Goldman Sachs Group, Inc. (The) 4.75% 15/7/2013 1,250,000 USD 1,299,169 1,311,019 0.60 Goldman Sachs Group, Inc. (The) 5% 15/1/2011 2,000,000 USD 1,999,113 2,077,758 0.95 Goldman Sachs Group, Inc. (The) 5.25% 15/10/2013 2,250,000 USD 2,243,224 2,395,361 1.10 Goldman Sachs Group, Inc. (The) 6% 1/5/2014 "MTN" 585,000 USD 584,641 641,599 0.29 Goldman Sachs Group, Inc. (The) 6.15% 1/4/2018 1,508,000 USD 1,507,029 1,618,526 0.74 Goldman Sachs Group, Inc. (The) 6.25% 1/9/2017 1,250,000 USD 1,326,663 1,341,539 0.62 Goldman Sachs Group, Inc. (The) 7.5% 15/2/2019 642,000 USD 666,038 751,512 0.34 HSBC Bank USA NA (New York NY) 5.875% 1/11/2034 "BKNT" 950,000 USD 945,979 927,493 0.43 International Business Machines Corp. 2.1% 6/5/2013 3,000,000 USD 2,997,678 3,001,281 1.38 JPMorgan Chase & Co. 4.65% 1/6/2014 1,500,000 USD 1,496,910 1,584,615 0.73 JPMorgan Chase & Co. 5.375% 1/10/2012 1,220,000 USD 1,219,419 1,322,436 0.61 JPMorgan Chase & Co. 6% 15/1/2018 600,000 USD 609,825 647,490 0.30 JPMorgan Chase & Co. 6.3% 23/4/2019 3,150,000 USD 3,287,230 3,480,148 1.60 JPMorgan Chase & Co. FRN Perpetual "1" 630,000 USD 552,545 649,776 0.30 JPMorgan Chase Bank NA 6% 1/10/2017 "BKNT" 2,300,000 USD 2,447,520 2,481,245 1.14 Lowe's Cos., Inc. 6.65% 15/9/2037 540,000 USD 537,940 618,420 0.28 Medtronic, Inc. 6.5% 15/3/2039 388,000 USD 387,030 436,062 0.20 Merck & Co., Inc. (NJ) 5.85% 30/6/2039 683,000 USD 681,671 721,844 0.33 Merrill Lynch & Co., Inc. 5.45% 5/2/2013 1,500,000 USD 1,498,794 1,581,663 0.73 Merrill Lynch & Co., Inc. 6.05% 15/8/2012 "MTN" 3,100,000 USD 3,243,431 3,325,916 1.53 Merrill Lynch & Co., Inc. 6.4% 28/8/2017 1,250,000 USD 962,370 1,320,427 0.61 Morgan Stanley 4.2% 20/11/2014 1,005,000 USD 1,004,607 1,008,766 0.46 Morgan Stanley 5.05% 21/1/2011 2,000,000 USD 2,066,591 2,074,518 0.95 Morgan Stanley 5.625% 23/9/2019 "MTN" 1,600,000 USD 1,593,551 1,618,866 0.74 Morgan Stanley 5.75% 31/8/2012 "GMTN" 3,000,000 USD 2,990,157 3,222,867 1.48 Morgan Stanley 5.95% 28/12/2017 "MTN" 1,797,000 USD 1,792,944 1,860,506 0.85 Morgan Stanley 6.625% 1/4/2018 "MTN" 1,878,000 USD 1,842,469 2,038,246 0.93 Morgan Stanley 7.3% 13/5/2019 907,000 USD 906,264 1,019,913 0.47 New York City Transitional Finance 5.767% 1/8/2036 700,000 USD 700,000 681,758 0.31 New York N Y City Municipal WTR Finance Authority 5.75% 15/6/2041 500,000 USD 500,000 479,845 0.22 Oracle Corp. 6.125% 8/7/2039 1,000,000 USD 993,451 1,054,439 0.48 Pfizer, Inc. 4.45% 15/3/2012 2,000,000 USD 2,078,752 2,118,308 0.97 Pfizer, Inc. 5.35% 15/3/2015 300,000 USD 299,674 328,951 0.15 Pfizer, Inc. 6.2% 15/3/2019 800,000 USD 799,255 893,118 0.41 Pfizer, Inc. 7.2% 15/3/2039 800,000 USD 799,548 981,559 0.45 Philip Morris International, Inc. 5.65% 16/5/2018 750,000 USD 748,343 791,858 0.36 Philip Morris International, Inc. 6.375% 16/5/2038 750,000 USD 748,198 814,015 0.37 Praxair, Inc. 1.75% 15/11/2012 1,000,000 USD 997,232 992,141 0.46 Praxair, Inc. 4.5% 15/8/2019 2,000,000 USD 1,990,504 2,015,450 0.92 Principal Life Income Funding Trusts 5.125% 1/3/2011 1,040,000 USD 1,039,399 1,070,188 0.49 Principal Life Income Funding Trusts 5.3% 24/4/2013 "MTN" 815,000 USD 814,021 862,528 0.40 San Diego Gas & Electric Co. 6% 1/6/2026 500,000 USD 498,165 529,264 0.24 San Diego Gas & Electric Co. 6% 1/6/2039 650,000 USD 647,073 701,559 0.32 State of Georgia 4.503% 1/11/2025 875,000 USD 875,000 857,859 0.39 State of Texas 5.517% 1/4/2039 1,000,000 USD 1,000,000 979,020 0.45 State of Washington 5.481% 1/8/2039 "D" 400,000 USD 400,000 389,992 0.18 Target Corp. 7% 15/1/2038 750,000 USD 825,559 878,566 0.40 Tennessee Valley Authority 5.25% 15/9/2039 580,000 USD 573,578 569,509 0.26 Union Pacific Railroad Co. 2005 Pass Through Trust 5.082% 2/1/2029 "05-1" 1,063,421 USD 1,063,421 1,093,899 0.50 University of California Revenues 5.77% 15/5/2043 1,000,000 USD 999,169 972,940 0.45 Wachovia Bank NA 4.875% 1/2/2015 "BKNT" 1,500,000 USD 1,499,396 1,536,685 0.71 Wachovia Corp. 5.5% 1/5/2013 "MTN" 2,000,000 USD 1,997,000 2,129,696 0.98 Wachovia Corp. 5.7% 1/8/2013 "MTN" 1,850,000 USD 1,848,109 1,994,648 0.91 Wal-Mart Stores, Inc. 6.2% 15/4/2038 2,000,000 USD 2,139,797 2,214,858 1.02 Wells Fargo & Co. 5.625% 11/12/2017 4,950,000 USD 5,135,324 5,168,518 2.37 Wells Fargo Capital XIII FRN Perpetual "GMTN" 1,261,000 USD 1,219,374 1,223,170 0.56
138,915,203 144,385,318 66.22
Total Bonds 176,313,191 182,446,420 83.68
Quantity/ Aquisition % net
Description Nominal Currency cost Evaluation assets

170 The accompanying notes form an integral part of these financial statements.
INTERNATIONAL OPPORTUNITIES FUNDS
US HIGH INVESTMENT GRADE BOND (continued)
Statement of Investment as at December 31, 2009
(expressed in USD)
SECURITISED ASSETS
United States of AmericaBanc of America Commercial Mortgage, Inc. FRN 10/2/2051 "2008-1 A4" 1,000,000 USD 676,901 913,185 0.42 Bear Stearns Commercial Mortgage Securities 5.201% 11/12/2038 "2006-PW14 A4" 275,000 USD 223,288 264,838 0.12 Bear Stearns Commercial Mortgage Securities FRN 11/9/2038 "2006-PW12 A4" 1,400,000 USD 839,470 1,425,385 0.65 Bear Stearns Commercial Mortgage Securities FRN 11/6/2050 "2007-PW17 AM" 501,000 USD 315,513 362,407 0.17 CarMax Auto Owner Trust 4.12% 15/3/2013 "2009-1 A3" 1,000,000 USD 1,033,290 1,036,859 0.48 CarMax Auto Owner Trust 5.81% 16/12/2013 "2009-1 A4" 1,000,000 USD 1,073,128 1,071,277 0.49 Chase Issuance Trust 4.96% 17/9/2012 "2007-A15 A" 2,000,000 USD 2,067,596 2,060,784 0.95 Citigroup Commercial Mortgage Trust FRN 10/12/2049 "2007-C6 AM" 100,000 USD 92,973 72,221 0.03 Credit Suisse First Boston Mortgage Securities Corp. 4.7% 15/8/2036 "2003-C4 A3" 1,472,248 USD 1,478,388 1,503,793 0.69 Credit Suisse Mortgage Capital Certificates 5.343% 15/12/2039 "2006-C5 AM" 124,000 USD 79,171 93,958 0.04 Daimler Chrysler Auto Trust 5.38% 8/3/2011 "2006-B A4" 512,131 USD 512,385 512,630 0.23 Greenwich Capital Commercial Funding Corp. 5.444% 10/3/2039 "2007-GG9 A4" 1,757,000 USD 1,300,963 1,555,514 0.71 JP Morgan Chase Commercial Mortgage Securities Corp. 5.308% 12/10/2037 1,250,000 USD 1,116,829 1,260,265 0.58 JP Morgan Chase Commercial Mortgage Securities Corp. 5.44% 12/6/2047 "2007-CB18 A4" 2,300,000 USD 2,190,560 2,007,729 0.92 JP Morgan Chase Commercial Mortgage Securities Corp. FRN 12/2/2049 "2007-CB19 AM" 600,000 USD 558,542 435,534 0.20 USAA Auto Owner Trust 2.53% 15/7/2015 "2009-2 A4" 958,000 USD 957,981 954,225 0.44 USAA Auto Owner Trust 3.58% 15/3/2011 "2008-3 A2" 254,180 USD 254,768 254,507 0.12 Wachovia Bank Commercial Mortgage Trust FRN 15/5/2043 "2006-C25 A5" 1,907,000 USD 1,529,325 1,881,971 0.86
Total Securitised Assets 16,301,071 17,667,082 8.10
Total Transferable Securities Admitted to an Official Stock Exchange Listing
or Dealt in on Another Regulated Market 193,095,400 200,594,640 92.00
Unlisted Securities
BONDS
AustraliaCommonwealth Bank of Australia 3.75% 15/10/2014 "144A" 1,000,000 USD 997,069 1,005,790 0.46
NetherlandsE.ON International Finance BV 6.65% 30/4/2038 "144A" 299,000 USD 297,793 341,662 0.16 Siemens Financieringsmaatschappij NV 6.125% 17/8/2026 "144A" 930,000 USD 928,409 989,049 0.45
1,226,202 1,330,711 0.61
QatarRas Laffan Liquefied Natural Gas Co., Ltd III 5.5% 30/9/2014 "144A" 543,000 USD 541,846 570,709 0.26 Ras Laffan Liquefied Natural Gas Co., Ltd III 5.832% 30/9/2016 "144A" 770,000 USD 770,000 808,793 0.37 Ras Laffan Liquefied Natural Gas Co., Ltd III 5.838% 30/9/2027 "144A" 970,000 USD 972,506 968,690 0.44 Ras Laffan Liquefied Natural Gas Co., Ltd III 6.75% 30/9/2019 "144A" 250,000 USD 249,271 271,637 0.13
2,533,623 2,619,829 1.20
United Arab EmiratesDolphin Energy Ltd 5.888% 15/6/2019 "144A" 1,355,310 USD 1,355,310 1,368,863 0.63
Quantity/ Aquisition % net
Description Nominal Currency cost Evaluation assets

The accompanying notes form an integral part of these financial statements. 171
INTERNATIONAL OPPORTUNITIES FUNDS
US HIGH INVESTMENT GRADE BOND (continued)
Statement of Investment as at December 31, 2009
(expressed in USD)
United States of AmericaCargill, Inc. 6.125% 19/4/2034 "144A" 725,000 USD 710,585 723,554 0.33 FMR LLC 6.45% 15/11/2039 "144A" 269,000 USD 268,390 251,839 0.12 Massachusetts Mutual Life Insurance Co. 8.875% 1/6/2039 "144A" 182,000 USD 179,698 224,015 0.10 Metropolitan Life Global Funding I 5.125% 10/6/2014 "144A" 1,500,000 USD 1,493,285 1,591,893 0.73 Monumental Global Funding III 5.25% 15/1/2014 "144A" 1,350,000 USD 1,347,216 1,380,847 0.63 New York Life Insurance Co. 6.75% 15/11/2039 "144A" 700,000 USD 698,396 718,647 0.33 Pricoa Global Funding I 5.3% 27/9/2013 "144A" 1,560,000 USD 1,558,511 1,617,282 0.74 Principal Life Global Funding I 5.25% 15/1/2013 "144A" 810,000 USD 813,331 826,198 0.38 Roche Holdings, Inc. 6% 1/3/2019 "144A" 2,400,000 USD 2,475,698 2,648,592 1.22 Teachers Insurance & Annuity Association of America 6.85% 16/12/2039 "144A" 402,000 USD 401,490 417,179 0.19 USAA Capital Corp. 3.5% 17/7/2014 "144A" 1,500,000 USD 1,496,202 1,485,615 0.68
11,442,802 11,885,661 5.45
Total Unlisted Securities 17,555,006 18,210,854 8.35
Total Investments 210,650,406 218,805,494 100.35
Other Net Liabilities (771,311) (0.35)
Total Net Assets 218,034,183 100.00
Quantity/ Aquisition % net
Description Nominal Currency cost Evaluation assets

172 The accompanying notes form an integral part of these financial statements.
INTERNATIONAL OPPORTUNITIES FUNDS
US HIGH YIELD BOND
Statement of Investment as at December 31, 2009
(expressed in USD)
Quantity/ Aquisition % net
Description Nominal Currency cost Evaluation assets
Transferable Securities Admitted to an Official Stock Exchange Listingor Dealt in on Another Regulated Market
MUTUAL FUNDS
United States of AmericaBank of New York Mellon Liquidity "B" 14,077,609 USD 14,077,609 14,077,609 4.95
Total Mutual Funds 14,077,609 14,077,609 4.95
BONDS
BermudaPetroplus Finance Ltd 9.375% 15/9/2019 "144A" 470,000 USD 462,797 467,650 0.17
BrazilGerdau Holdings, Inc. 7% 20/1/2020 "144A" 1,212,000 USD 1,190,431 1,245,330 0.44
CanadaBombardier, Inc. 8% 15/11/2014 "144A" 300,000 USD 307,334 311,625 0.11 Cascades, Inc. 7.875% 15/1/2020 "144A" 692,000 USD 680,255 702,380 0.25 Kinder Morgan Finance Co. ULC 5.7% 5/1/2016 2,300,000 USD 2,050,591 2,208,000 0.78 MDC Partners, Inc. 11% 1/11/2016 "144A" 1,284,000 USD 1,233,754 1,320,915 0.46 Novelis, Inc. (GA) 7.25% 15/2/2015 500,000 USD 502,950 475,000 0.17 Sun Media Corp. 7.625% 15/2/2013 1,454,000 USD 1,451,843 1,324,957 0.46 Teck Resources Ltd 10.75% 15/5/2019 3,485,000 USD 3,361,826 4,164,575 1.46 Videotron Ltee 6.375% 15/12/2015 750,000 USD 703,023 731,250 0.26 Videotron Ltee 9.125% 15/4/2018 70,000 USD 68,988 77,000 0.03
10,360,564 11,315,702 3.98
GermanyKabel Deutschland GmbH 10.625% 1/7/2014 1,550,000 USD 1,618,110 1,619,750 0.57
LiberiaRoyal Caribbean Cruises Ltd 6.875% 1/12/2013 1,500,000 USD 1,080,059 1,432,500 0.50 Royal Caribbean Cruises Ltd 7% 15/6/2013 3,000,000 USD 2,231,529 2,955,000 1.04 Royal Caribbean Cruises Ltd 7.25% 15/6/2016 575,000 USD 573,853 554,875 0.20 Royal Caribbean Cruises Ltd 7.5% 15/10/2027 1,070,000 USD 981,034 880,075 0.31
4,866,475 5,822,450 2.05
United KingdomVirgin Media Finance PLC 8.375% 15/10/2019 160,000 USD 157,423 164,600 0.06 Virgin Media Finance PLC 9.5% 15/8/2016 "1" 1,000,000 USD 959,306 1,073,750 0.38
1,116,729 1,238,350 0.44
United States of AmericaACCO Brands Corp. 10.625% 15/3/2015 "144A" 190,000 USD 187,296 209,000 0.07 AES Corp. (The) 8% 15/10/2017 3,500,000 USD 3,377,791 3,591,875 1.26 AES Corp. (The) 8% 1/6/2020 1,000,000 USD 965,323 1,017,500 0.36 AES Corp. (The) 9.75% 15/4/2016 "144A" 2,032,000 USD 1,922,698 2,225,040 0.78 AES Eastern Energy LP 9% 2/1/2017 "99-A" 541,982 USD 515,009 544,015 0.19 Alcatel-Lucent USA, Inc. 6.45% 15/3/2029 900,000 USD 838,789 644,625 0.23 Allegheny Technologies, Inc. 9.375% 1/6/2019 1,186,000 USD 1,177,120 1,370,480 0.48 AMC Entertainment, Inc. 8.75% 1/6/2019 1,939,000 USD 1,894,897 1,977,780 0.70 American Airlines Pass Through Trust 2001-01 6.977% 23/5/2021 "01-1" 363,725 USD 339,277 292,799 0.10 American Airlines Pass Through Trust 2009-1A 10.375% 2/7/2019 1,494,000 USD 1,494,000 1,650,870 0.58 American General Finance Corp. 6.5% 15/9/2017 "MTN" 1,150,000 USD 657,539 794,977 0.28 American General Finance Corp. 6.9% 15/12/2017 "MTN" 1,750,000 USD 986,190 1,218,891 0.43 Ameristar Casinos, Inc. 9.25% 1/6/2014 "144A" 1,231,000 USD 1,199,758 1,274,085 0.45 Aquilex Holdings LLC / Aquilex Finance Corp. 11.125% 15/12/2016 "144A" 775,000 USD 759,235 769,187 0.27

The accompanying notes form an integral part of these financial statements. 173
INTERNATIONAL OPPORTUNITIES FUNDS
US HIGH YIELD BOND (continued)
Statement of Investment as at December 31, 2009
(expressed in USD)
ARAMARK Corp. 8.5% 1/2/2015 1,000,000 USD 977,380 1,030,000 0.36 Ashtead Capital, Inc. 9% 15/8/2016 "144A" 3,100,000 USD 2,069,889 3,107,750 1.09 BAC Capital Trust VI 5.625% 8/3/2035 2,000,000 USD 1,104,537 1,602,798 0.56 BE Aerospace, Inc. 8.5% 1/7/2018 2,022,000 USD 1,780,671 2,143,320 0.75 Belo Corp. 8% 15/11/2016 393,000 USD 385,467 403,808 0.14 Berry Plastics Escrow LLC / Berry Plastics Escrow Corp. 8.25% 15/11/2015 "144A" 1,500,000 USD 1,483,111 1,507,500 0.53 Bill Barrett Corp. 9.875% 15/7/2016 250,000 USD 238,789 266,250 0.09 Capital One Capital VI 8.875% 15/5/2040 750,000 USD 751,868 795,937 0.28 Case New Holland, Inc. 7.75% 1/9/2013 "144A" 582,000 USD 566,529 594,367 0.21 Centex Corp. 5.25% 15/6/2015 1,775,000 USD 1,369,256 1,739,500 0.61 Chesapeake Energy Corp. 6.375% 15/6/2015 203,000 USD 203,522 198,940 0.07 Chesapeake Energy Corp. 6.5% 15/8/2017 1,800,000 USD 1,666,208 1,764,000 0.62 Chesapeake Energy Corp. 6.625% 15/1/2016 1,254,000 USD 1,185,679 1,241,460 0.44 Chesapeake Energy Corp. 6.875% 15/1/2016 4,253,000 USD 3,718,695 4,253,000 1.50 Chesapeake Energy Corp. 7.5% 15/6/2014 1,527,000 USD 1,412,565 1,557,540 0.55 Chesapeake Energy Corp. 9.5% 15/2/2015 587,000 USD 562,469 644,232 0.23 Citigroup Capital XXI FRN 21/12/2057 250,000 USD 233,810 240,313 0.08 Cloud Peak Energy Resources LLC / Cloud Peak Energy Finance Corp. 8.5% 15/12/2019 "144A" 465,000 USD 462,894 474,300 0.17 Complete Production Services, Inc. 8% 15/12/2016 1,623,000 USD 1,630,246 1,600,684 0.56 Constellation Brands, Inc. 7.25% 1/9/2016 330,000 USD 327,855 334,950 0.12 Continental Airlines, Inc. 7.875% 2/7/2018 "RJO3" 345,243 USD 349,040 296,046 0.10 Continental Resources, Inc. (OK) 8.25% 1/10/2019 "144A" 100,000 USD 99,183 105,000 0.04 Cricket Communications, Inc. 9.375% 1/11/2014 1,000,000 USD 1,009,231 1,005,000 0.35 Crown Americas LLC / Crown Americas Capital Corp II 7.625% 15/5/2017 "144A" 500,000 USD 486,645 518,750 0.18 Crown Castle International Corp. 9% 15/1/2015 634,000 USD 582,756 675,210 0.24 CSC Holdings, Inc. (United States) 7.625% 15/7/2018 267,000 USD 250,371 275,010 0.10 CSC Holdings, Inc. (United States) 7.875% 15/2/2018 292,000 USD 287,164 302,220 0.11 CSC Holdings, Inc. (United States) 8.5% 15/4/2014 "144A" 3,999,000 USD 3,749,092 4,258,935 1.50 CSC Holdings, Inc. (United States) 8.625% 15/2/2019 "144A" 325,000 USD 310,770 349,781 0.12 Deluxe Corp. 7.375% 1/6/2015 1,744,000 USD 1,757,539 1,678,600 0.59 Denbury Resources, Inc. 9.75% 1/3/2016 502,000 USD 470,461 535,885 0.19 DirecTV Holdings LLC / DirecTV Financing Co. 6.375% 15/6/2015 1,331,000 USD 1,283,177 1,382,576 0.49 DISH DBS Corp. 6.625% 1/10/2014 863,000 USD 849,813 870,551 0.31 DISH DBS Corp. 7% 1/10/2013 887,000 USD 887,824 912,501 0.32 DISH DBS Corp. 7.875% 1/9/2019 "144A" 592,000 USD 602,083 618,640 0.22 Dole Food Co., Inc. 8% 1/10/2016 "144A" 138,000 USD 135,395 140,070 0.05 Domtar Corp. 10.75% 1/6/2017 1,105,000 USD 1,065,590 1,301,137 0.46 DR Horton, Inc. 5.25% 15/2/2015 489,000 USD 437,224 458,438 0.16 DR Horton, Inc. 6.5% 15/4/2016 2,126,000 USD 1,714,908 2,072,850 0.73 Dynegy Holdings, Inc. 7.75% 1/6/2019 4,533,000 USD 3,905,884 3,932,377 1.38 Edison Mission Energy 7% 15/5/2017 4,750,000 USD 4,521,958 3,752,500 1.32 El Paso Corp. 6.95% 1/6/2028 1,000,000 USD 670,523 860,657 0.30 El Paso Corp. 7.375% 15/12/2012 "GMTN" 500,000 USD 505,384 514,470 0.18 El Paso Corp. 7.75% 15/1/2032 "GMTN" 6,564,000 USD 5,794,918 6,229,768 2.19 El Paso Corp. 8.05% 15/10/2030 "GMTN" 1,000,000 USD 737,258 946,495 0.33 El Paso Corp. 8.25% 15/2/2016 479,000 USD 460,355 511,332 0.18 El Paso Natural Gas Co. 7.5% 15/11/2026 38,000 USD 37,402 41,833 0.01 El Paso Natural Gas Co. 8.375% 15/6/2032 36,000 USD 38,581 42,923 0.02 Energy Future Holdings Corp. 11.25% 1/11/2017 54,000 USD 29,564 37,935 0.01 First Data Corp. 9.875% 24/9/2015 300,000 USD 291,015 279,750 0.10 Ford Motor Credit Co. LLC 8.125% 15/1/2020 2,000,000 USD 1,966,291 1,977,320 0.70 Forest Oil Corp. 7.25% 15/6/2019 1,000,000 USD 796,610 987,500 0.35 Forest Oil Corp. 8.5% 15/2/2014 "144A" 388,000 USD 372,495 405,460 0.14 Freedom Group, Inc. 10.25% 1/8/2015 "144A" 157,000 USD 153,849 166,813 0.06 Freeport-McMoRan Copper & Gold, Inc. 8.25% 1/4/2015 1,000,000 USD 842,615 1,090,000 0.38 Freeport-McMoRan Copper & Gold, Inc. 8.375% 1/4/2017 3,522,000 USD 3,171,571 3,856,590 1.36 Frontier Communications Corp. 6.25% 15/1/2013 280,000 USD 273,460 280,700 0.10 Frontier Communications Corp. 6.625% 15/3/2015 1,250,000 USD 1,212,817 1,215,625 0.43 Frontier Communications Corp. 7.125% 15/3/2019 1,000,000 USD 821,867 945,000 0.33
Quantity/ Aquisition % net
Description Nominal Currency cost Evaluation assets

174 The accompanying notes form an integral part of these financial statements.
INTERNATIONAL OPPORTUNITIES FUNDS
US HIGH YIELD BOND (continued)
Statement of Investment as at December 31, 2009
(expressed in USD)
Frontier Communications Corp. 7.45% 1/7/2035 1,500,000 USD 907,766 1,218,750 0.43 Frontier Communications Corp. 8.25% 1/5/2014 1,048,000 USD 969,735 1,092,540 0.38 Frontier Communications Corp. 9% 15/8/2031 1,300,000 USD 996,453 1,277,250 0.45 Georgia-Pacific LLC 7.7% 15/6/2015 1,583,000 USD 1,455,260 1,650,277 0.58 Hanesbrands, Inc. 8% 15/12/2016 154,000 USD 151,998 156,888 0.06 HCA, Inc. (DE) 9.125% 15/11/2014 289,000 USD 289,000 304,895 0.11 HCA, Inc. (DE) 9.25% 15/11/2016 1,820,000 USD 1,885,700 1,954,225 0.69 HCA, Inc. (DE) 9.625% 15/11/2016 7,363,000 USD 5,902,985 7,970,447 2.81 Host Hotels & Resorts LP 6.75% 1/6/2016 "Q" 1,650,000 USD 1,626,560 1,637,625 0.58 Host Hotels & Resorts LP 7.125% 1/11/2013 1,000,000 USD 892,040 1,016,250 0.36 Huntsman International LLC 7.875% 15/11/2014 300,000 USD 286,298 293,250 0.10 Inergy LP / Inergy Finance Corp. 8.75% 1/3/2015 420,000 USD 385,032 431,550 0.15 Intelsat Corp. 9.25% 15/8/2014 300,000 USD 298,281 308,250 0.11 Intelsat Corp. 9.25% 15/6/2016 3,800,000 USD 3,524,752 3,923,500 1.38 Interpublic Group of Cos., Inc. 10% 15/7/2017 594,000 USD 582,703 659,340 0.23 Iron Mountain, Inc. 8.375% 15/8/2021 235,000 USD 234,148 242,638 0.09 Jabil Circuit, Inc. 7.75% 15/7/2016 290,000 USD 279,476 307,038 0.11 JC Penney Corp., Inc. 6.375% 15/10/2036 908,000 USD 677,996 806,304 0.28 JC Penney Corp., Inc. 6.875% 15/10/2015 "MTNA" 700,000 USD 593,809 738,500 0.26 JC Penney Corp., Inc. 7.4% 1/4/2037 325,000 USD 226,767 322,563 0.11 JohnsonDiversey, Inc. 8.25% 15/11/2019 "144A" 307,000 USD 304,481 310,838 0.11 JPMorgan Chase & Co. FRN Perpetual "1" 4,000,000 USD 3,292,306 4,125,560 1.45 KB Home 5.75% 1/2/2014 1,450,000 USD 1,358,907 1,363,000 0.48 KB Home 6.25% 15/6/2015 1,460,000 USD 1,232,951 1,361,450 0.48 L-3 Communications Corp. 6.125% 15/7/2013 600,000 USD 591,812 606,000 0.21 Lamar Media Corp. 6.625% 15/8/2015 1,000,000 USD 968,976 970,000 0.34 Lennar Corp. 5.5% 1/9/2014 "B" 500,000 USD 423,147 465,000 0.16 Lennar Corp. 5.6% 31/5/2015 "B" 5,200,000 USD 3,793,580 4,764,500 1.68 Lennar Corp. 5.95% 1/3/2013 300,000 USD 269,341 293,250 0.10 Levi Strauss & Co. 8.875% 1/4/2016 1,500,000 USD 1,206,614 1,569,375 0.55 Liberty Media LLC 8.25% 1/2/2030 400,000 USD 408,670 366,500 0.13 Macy's Retail Holdings, Inc. 5.875% 15/1/2013 1,050,000 USD 921,901 1,078,875 0.38 Macy's Retail Holdings, Inc. 5.9% 1/12/2016 575,000 USD 444,426 560,625 0.20 Macy's Retail Holdings, Inc. 6.375% 15/3/2037 450,000 USD 325,923 389,250 0.14 Macy's Retail Holdings, Inc. 6.7% 15/7/2034 1,500,000 USD 1,015,511 1,327,413 0.47 MarkWest Energy Partners LP / MarkWest Energy Finance Corp.8.75% 15/4/2018 "B" 2,633,000 USD 2,205,437 2,711,990 0.95 Masco Corp. 5.85% 15/3/2017 300,000 USD 241,943 280,201 0.10 Masco Corp. 6.625% 15/4/2018 450,000 USD 358,964 429,743 0.15 Mediacom Broadband LLC / Mediacom Broadband Corp. 8.5% 15/10/2015 1,000,000 USD 912,969 1,010,000 0.36 Meritage Homes Corp. 6.25% 15/3/2015 803,000 USD 750,018 738,760 0.26 Meritage Homes Corp. 7% 1/5/2014 138,000 USD 131,850 131,100 0.05 MGM Mirage 11.125% 15/11/2017 "144A" 810,000 USD 790,080 897,075 0.32 Mohawk Industries, Inc. 6.625% 15/1/2016 5,550,000 USD 4,640,686 5,508,375 1.94 Nalco Co. 8.875% 15/11/2013 1,600,000 USD 1,514,112 1,648,000 0.58 Navistar International Corp. 8.25% 1/11/2021 527,000 USD 507,953 540,175 0.19 New Albertsons, Inc. 7.45% 1/8/2029 3,232,000 USD 2,582,631 2,771,440 0.98 New Albertsons, Inc. 7.75% 15/6/2026 2,000,000 USD 1,686,136 1,790,000 0.63 New Albertsons, Inc. 8% 1/5/2031 1,500,000 USD 1,240,299 1,361,250 0.48 Newfield Exploration Co. 6.625% 1/9/2014 500,000 USD 508,769 505,000 0.18 Nextel Communications, Inc. 5.95% 15/3/2014 "F" 1,000,000 USD 612,708 932,500 0.33 Nextel Communications, Inc. 6.875% 31/10/2013 "E" 921,000 USD 799,809 893,370 0.31 NRG Energy, Inc. 7.375% 1/2/2016 1,000,000 USD 962,607 1,001,250 0.35 Omnicare, Inc. 6.875% 15/12/2015 476,000 USD 477,666 462,910 0.16 Owens Corning 9% 15/6/2019 1,383,000 USD 1,361,958 1,548,350 0.54 Owens-Brockway Glass Container, Inc. 8.25% 15/5/2013 500,000 USD 506,978 511,250 0.18 PetroHawk Energy Corp. 7.875% 1/6/2015 2,000,000 USD 1,735,935 2,020,000 0.71 PetroHawk Energy Corp. 10.5% 1/8/2014 396,000 USD 367,323 432,630 0.15 Pinnacle Entertainment, Inc. 8.625% 1/8/2017 "144A" 105,000 USD 103,605 106,838 0.04 Pioneer Natural Resources Co. 6.65% 15/3/2017 1,500,000 USD 1,320,877 1,484,319 0.52 Pioneer Natural Resources Co. 6.875% 1/5/2018 1,000,000 USD 981,176 993,073 0.35
Quantity/ Aquisition % net
Description Nominal Currency cost Evaluation assets

The accompanying notes form an integral part of these financial statements. 175
INTERNATIONAL OPPORTUNITIES FUNDS
US HIGH YIELD BOND (continued)
Statement of Investment as at December 31, 2009
(expressed in USD)
Plains Exploration & Production Co. 7% 15/3/2017 159,000 USD 159,000 156,218 0.06 Plains Exploration & Production Co. 7.625% 1/6/2018 1,601,000 USD 1,615,382 1,637,022 0.58 Pulte Homes, Inc. 5.25% 15/1/2014 1,165,000 USD 1,023,673 1,144,612 0.40 Quicksilver Resources, Inc. 9.125% 15/8/2019 475,000 USD 464,094 496,375 0.17 Qwest Capital Funding, Inc. 6.875% 15/7/2028 500,000 USD 421,941 405,000 0.14 Qwest Communications International, Inc. 7.25% 15/2/2011 300,000 USD 301,865 301,125 0.11 Qwest Communications International, Inc. 7.5% 15/2/2014 750,000 USD 735,379 751,875 0.26 Qwest Communications International, Inc. 7.5% 15/2/2014 "B" 1,000,000 USD 851,897 1,002,500 0.35 Qwest Corp. 7.25% 15/10/2035 1,000,000 USD 894,176 880,000 0.31 Qwest Corp. 8.875% 15/3/2012 875,000 USD 900,745 940,625 0.33 Range Resources Corp. 7.25% 1/5/2018 1,096,000 USD 1,114,644 1,117,920 0.39 RRI Energy, Inc. 7.875% 15/6/2017 1,000,000 USD 902,736 982,500 0.35 Salton Sea Funding Corp. 7.84% 30/5/2010 "C" 96,961 USD 96,864 98,150 0.03 SandRidge Energy, Inc. 8.75% 15/1/2020 "144A" 425,000 USD 418,023 425,000 0.15 Scientific Games International, Inc. 9.25% 15/6/2019 417,000 USD 404,566 437,850 0.15 Service Corporation International (US) 6.75% 1/4/2015 1,000,000 USD 939,690 980,000 0.34 Service Corporation International (US) 6.75% 1/4/2016 1,250,000 USD 1,228,991 1,209,375 0.43 Sithe / Independence Funding Corp. 9% 30/12/2013 "A" 697,072 USD 727,975 717,050 0.25 Smithfield Foods, Inc. 7% 1/8/2011 250,000 USD 248,523 249,063 0.09 Smithfield Foods, Inc. 7.75% 15/5/2013 "B" 1,000,000 USD 1,006,654 970,000 0.34 Smithfield Foods, Inc. 7.75% 1/7/2017 250,000 USD 245,443 230,625 0.08 Spirit Aerosystems, Inc. 7.5% 1/10/2017 "144A" 100,000 USD 97,877 98,625 0.04 Sprint Capital Corp. 6.875% 15/11/2028 9,558,000 USD 6,288,537 7,945,087 2.80 Sprint Nextel Corp. 9.25% 15/4/2022 755,000 USD 728,520 736,125 0.26 Starwood Hotels & Resorts Worldwide, Inc. 7.875% 15/10/2014 1,435,000 USD 1,382,998 1,531,862 0.54 Steel Dynamics, Inc. 6.75% 1/4/2015 2,000,000 USD 1,687,500 1,980,000 0.70 Talecris Biotherapeutics Holdings Corp. 7.75% 15/11/2016 "144A" 199,000 USD 197,687 201,985 0.07 Tennessee Gas Pipeline Co. 8.375% 15/6/2032 300,000 USD 318,213 357,695 0.13 Terex Corp. 10.875% 1/6/2016 1,250,000 USD 1,222,867 1,393,750 0.49 Terra Capital, Inc. 7.75% 1/11/2019 "144A" 308,000 USD 302,861 329,560 0.12 Tesoro Corp. 6.25% 1/11/2012 1,500,000 USD 1,337,425 1,492,500 0.53 Tesoro Corp. 6.5% 1/6/2017 1,900,000 USD 1,772,618 1,767,000 0.62 Tesoro Corp. 9.75% 1/6/2019 158,000 USD 152,302 163,530 0.06 Ticketmaster Entertainment, Inc. 10.75% 1/8/2016 450,000 USD 450,000 484,875 0.17 Tops Markets LLC 10.125% 15/10/2015 "144A" 615,000 USD 605,290 633,450 0.22 Toys R Us Property Company I LLC 10.75% 15/7/2017 "144A" 1,100,000 USD 1,073,163 1,204,500 0.42 TransDigm, Inc. 7.75% 15/7/2014 "144A" 300,000 USD 291,824 304,875 0.11 Tyson Foods, Inc. 7.85% 1/4/2016 1,000,000 USD 854,858 1,025,000 0.36 Tyson Foods, Inc. 10.5% 1/3/2014 714,000 USD 670,963 815,745 0.29 United Rentals North America, Inc. 6.5% 15/2/2012 1,000,000 USD 865,424 998,750 0.35 US Oncology, Inc. 9.125% 15/8/2017 828,000 USD 812,027 869,400 0.31 Viasat, Inc. 8.875% 15/9/2016 "144A" 251,000 USD 247,969 258,530 0.09 Wells Fargo Capital XV FRN Perpetual 3,440,000 USD 3,385,217 3,680,800 1.30 Wendy's / Arby's Restaurants LLC 10% 15/7/2016 1,207,000 USD 1,179,471 1,315,630 0.46 Weyerhaeuser Co. 7.375% 1/10/2019 751,000 USD 744,742 788,090 0.28 Windstream Corp. 7% 15/3/2019 1,000,000 USD 864,110 932,500 0.33 Windstream Corp. 8.625% 1/8/2016 2,053,000 USD 2,133,763 2,073,530 0.73 WMG Acquisition Corp. 9.5% 15/6/2016 "144A" 322,000 USD 311,087 344,943 0.12 Wynn Las Vegas LLC / Wynn Las Vegas Capital Corp. 6.625% 1/12/2014 2,200,000 USD 1,827,665 2,128,500 0.75
193,916,078 216,477,058 76.19
Total Bonds 213,531,184 238,186,290 83.84
Total Transferable Securities Admitted to an Official Stock Exchange Listing
or Dealt in on Another Regulated Market 227,608,793 252,263,899 88.79
Quantity/ Aquisition % net
Description Nominal Currency cost Evaluation assets

176 The accompanying notes form an integral part of these financial statements.
INTERNATIONAL OPPORTUNITIES FUNDS
US HIGH YIELD BOND (continued)
Statement of Investment as at December 31, 2009
(expressed in USD)
Unlisted Securities
BONDS
AustriaPE Paper Escrow GmbH 12% 1/8/2014 "144A" 266,000 USD 254,072 293,930 0.11 Sappi Papier Holding AG 6.75% 15/6/2012 "144A" 1,817,000 USD 1,396,393 1,739,777 0.61
1,650,465 2,033,707 0.72
CanadaBombardier, Inc. 7.45% 1/5/2034 "144A" 667,000 USD 647,864 576,955 0.20
LuxembourgWind Acquisition Finance SA 11.75% 15/7/2017 "144A" 518,000 USD 517,763 565,915 0.20
NetherlandsUPC Holding BV 9.875% 15/4/2018 "144A" 573,000 USD 532,584 604,515 0.21
United States of AmericaCC Holdings GS V LLC / Crown Castle GS III Corp. 7.75% 1/5/2017 "144A" 319,000 USD 310,542 339,735 0.12 Cemex Finance LLC 9.5% 14/12/2016 "144A" 149,000 USD 149,000 156,078 0.06 Cequel Communications Holdings I LLC and Cequel Capital Corp.8.625% 15/11/2017 "144A" 1,024,000 USD 1,009,751 1,034,240 0.36 Delta Air Lines, Inc. 9.5% 15/9/2014 "144A" 710,000 USD 700,348 737,513 0.26 Delta Air Lines, Inc. 12.25% 15/3/2015 "144A" 333,000 USD 317,888 333,000 0.12 Fresenius US Finance II, Inc. 9% 15/7/2015 "144A" 390,000 USD 366,971 429,000 0.15 Liberty Mutual Group, Inc. 7.8% 15/3/2037 "144A" 5,175,000 USD 3,275,586 4,269,375 1.50 PNC Preferred Funding Trust I FRN Perpetual "144A" 7,000,000 USD 5,415,087 7,179,690 2.53 Shingle Springs Tribal Gaming Authority 9.375% 15/6/2015 "144A" 3,000,000 USD 2,251,669 2,280,000 0.80 TRW Automotive, Inc. 7% 15/3/2014 "144A" 500,000 USD 481,542 490,000 0.17 TRW Automotive, Inc. 7.25% 15/3/2017 "144A" 2,849,000 USD 1,965,929 2,763,530 0.97 United Air Lines, Inc. 10.4% 1/11/2016 775,000 USD 775,000 807,937 0.29 Yonkers Racing Corp. 11.375% 15/7/2016 "144A" 498,000 USD 484,495 522,900 0.18
17,503,808 21,342,998 7.51
Total Unlisted Securities 20,852,484 25,124,090 8.84
Total Investments 248,461,277 277,387,989 97.63
Other Net Assets 6,731,720 2.37
Total Net Assets 284,119,709 100.00
Quantity/ Aquisition % net
Description Nominal Currency cost Evaluation assets

The accompanying notes form an integral part of these financial statements. 177
INTERNATIONAL OPPORTUNITIES FUNDS
US INVESTMENT GRADE BOND
Statement of Investment as at December 31, 2009
(expressed in USD)
Quantity/ Aquisition % net
Description Nominal Currency cost Evaluation assets
Transferable Securities Admitted to an Official Stock Exchange Listingor Dealt in on Another Regulated Market
MUTUAL FUNDS
United States of AmericaBank of New York Mellon Liquidity "B" 256,597 USD 256,597 256,597 0.06
Total Mutual Funds 256,597 256,597 0.06
BONDS
AustraliaRio Tinto Finance USA Ltd 7.125% 15/7/2028 600,000 USD 499,553 681,775 0.16 Rio Tinto Finance USA Ltd 8.95% 1/5/2014 1,676,000 USD 1,856,470 2,014,240 0.49 Rio Tinto Finance USA Ltd 9% 1/5/2019 1,158,000 USD 1,298,361 1,471,406 0.36
3,654,384 4,167,421 1.01
BelgiumDelhaize Group 5.875% 1/2/2014 496,000 USD 494,652 534,088 0.13
BrazilGerdau Holdings, Inc. 7% 20/1/2020 "144A" 1,616,000 USD 1,587,241 1,660,440 0.40
CanadaCanadian Natural Resources Ltd 5.7% 15/5/2017 1,330,000 USD 1,407,885 1,426,059 0.34 Canadian Natural Resources Ltd 6.25% 15/3/2038 1,620,000 USD 1,656,233 1,684,732 0.41 Cenovus Energy, Inc. 4.5% 15/9/2014 "144A" 1,587,000 USD 1,631,832 1,643,531 0.40 Cenovus Energy, Inc. 5.7% 15/10/2019 "144A" 1,000,000 USD 1,059,828 1,047,699 0.25 Cenovus Energy, Inc. 6.75% 15/11/2039 "144A" 998,000 USD 994,244 1,082,928 0.26 Husky Energy, Inc. 6.8% 15/9/2037 390,000 USD 389,444 415,082 0.10 Nexen, Inc. 6.4% 15/5/2037 520,000 USD 507,364 522,965 0.13 Nexen, Inc. 7.5% 30/7/2039 1,612,000 USD 1,714,688 1,856,653 0.45 Petro-Canada 6.05% 15/5/2018 236,000 USD 235,662 254,688 0.06 Rogers Communications, Inc. 6.8% 15/8/2018 600,000 USD 599,248 674,600 0.16 Suncor Energy, Inc. 6.1% 1/6/2018 1,295,000 USD 1,355,214 1,395,030 0.34 TransCanada Pipelines Ltd 7.25% 15/8/2038 417,000 USD 416,847 493,974 0.12 Vale Inco Ltd 7.75% 15/5/2012 880,000 USD 930,769 969,635 0.23 Xstrata Canada Corp. 7.25% 15/7/2012 3,305,000 USD 3,526,989 3,571,330 0.86
16,426,247 17,038,906 4.11
Cayman IslandsPetrobras International Finance Co. 5.75% 20/1/2020 2,108,000 USD 2,124,464 2,142,188 0.52 Petrobras International Finance Co. 6.875% 20/1/2040 827,000 USD 814,275 855,199 0.21 Petrobras International Finance Co. 7.875% 15/3/2019 972,000 USD 993,637 1,125,017 0.27 Vale Overseas Ltd 5.625% 15/9/2019 894,000 USD 887,346 888,712 0.21 Vale Overseas Ltd 6.875% 10/11/2039 941,000 USD 927,557 943,621 0.23 Voto-Votorantim Overseas Trading Operations NV 6.625% 25/9/2019 "144A" 368,000 USD 364,786 368,920 0.09
6,112,065 6,323,657 1.53
FranceAXA SA 8.6% 15/12/2030 380,000 USD 457,254 443,248 0.11 Vivendi SA 6.625% 4/4/2018 "144A" 500,000 USD 498,730 543,956 0.13
955,984 987,204 0.24
JerseyAtlantic Finance Ltd 8.75% 27/5/2014 "144A" 962,000 USD 962,000 991,014 0.24

178 The accompanying notes form an integral part of these financial statements.
INTERNATIONAL OPPORTUNITIES FUNDS
US INVESTMENT GRADE BOND (continued)
Statement of Investment as at December 31, 2009
(expressed in USD)
LuxembourgTelecom Italia Capital SA 6.175% 18/6/2014 1,000,000 USD 1,006,834 1,087,207 0.26 Telecom Italia Capital SA 6.2% 18/7/2011 640,000 USD 642,944 678,143 0.17 Telecom Italia Capital SA 7.2% 18/7/2036 270,000 USD 281,835 295,013 0.07 Telecom Italia Capital SA 7.721% 4/6/2038 440,000 USD 440,000 508,869 0.12
2,371,613 2,569,232 0.62
MexicoGrupo Televisa SA 6.625% 15/1/2040 "144A" 1,595,000 USD 1,568,278 1,585,285 0.38 Petroleos Mexicanos 4.875% 15/3/2015 "144A" 1,600,000 USD 1,588,678 1,594,080 0.39
3,156,956 3,179,365 0.77
NetherlandsDeutsche Telekom International Finance BV 5.875% 20/8/2013 300,000 USD 299,646 325,472 0.08 Deutsche Telekom International Finance BV 6.75% 20/8/2018 600,000 USD 599,921 674,401 0.16 Diageo Finance BV 3.25% 15/1/2015 4,800,000 USD 4,780,957 4,783,339 1.15
5,680,524 5,783,212 1.39
South KoreaHyundai Capital Services, Inc. 6% 5/5/2015 "144A" 693,000 USD 689,930 726,159 0.17 Korea National Oil Corp. 5.375% 30/7/2014 "144A" 1,050,000 USD 1,086,184 1,113,497 0.27
1,776,114 1,839,656 0.44
SpainTelefonica Emisiones SAU 4.949% 15/1/2015 1,000,000 USD 1,000,000 1,072,650 0.26 Telefonica Emisiones SAU 5.855% 4/2/2013 1,090,000 USD 1,090,000 1,180,352 0.28 Telefonica Emisiones SAU 5.984% 20/6/2011 1,000,000 USD 1,055,961 1,058,739 0.26 Telefonica Emisiones SAU 7.045% 20/6/2036 400,000 USD 475,518 458,876 0.11
3,621,479 3,770,617 0.91
SwitzerlandCredit Suisse (Guernsey) FRN Perpetual 2,170,000 USD 1,734,878 1,822,800 0.44 Credit Suisse (New York NY) 5.3% 13/8/2019 1,207,000 USD 1,206,026 1,245,138 0.30
2,940,904 3,067,938 0.74
United Arab EmiratesAbu Dhabi National Energy Co. 4.75% 15/9/2014 "144A" 1,739,000 USD 1,730,037 1,676,081 0.40 Abu Dhabi National Energy Co. 7.25% 1/8/2018 "144A" 722,000 USD 721,042 746,387 0.18
2,451,079 2,422,468 0.58
United KingdomAnglo American Capital PLC 9.375% 8/4/2019 "144A" 115,000 USD 115,000 146,648 0.03 Barclays Bank PLC 2.5% 23/1/2013 4,000,000 USD 3,994,872 4,003,636 0.97 Barclays Bank PLC 5% 22/9/2016 "1" 513,000 USD 512,365 526,322 0.13 Barclays Bank PLC 6.75% 22/5/2019 1,000,000 USD 997,983 1,120,185 0.27 Barclays Bank PLC FRN Perpetual "144A" 3,920,000 USD 3,079,366 2,940,000 0.71 British Sky Broadcasting Group PLC 6.1% 15/2/2018 "144A" 325,000 USD 324,708 345,594 0.08 British Sky Broadcasting Group PLC 9.5% 15/11/2018 "144A" 1,775,000 USD 2,097,273 2,284,290 0.55 BSKYB Finance UK PLC 5.625% 15/10/2015 "144A" 480,000 USD 474,641 525,916 0.13 HSBC Holdings PLC 6.5% 2/5/2036 270,000 USD 293,372 284,277 0.07 HSBC Holdings PLC 6.8% 1/6/2038 1,560,000 USD 1,620,545 1,699,703 0.41 SABMiller PLC 5.7% 15/1/2014 "144A" 1,000,000 USD 998,709 1,083,142 0.26 SABMiller PLC 6.5% 1/7/2016 "144A" 600,000 USD 671,681 660,819 0.16
15,180,515 15,620,532 3.77
United States of AmericaAflac, Inc. 6.9% 17/12/2039 1,047,000 USD 1,036,033 1,032,744 0.25 AGL Capital Corp. 5.25% 15/8/2019 692,000 USD 690,559 699,970 0.17 Allied Waste North America, Inc. 6.875% 1/6/2017 1,050,000 USD 989,378 1,114,312 0.27 Allstate Corp. (The) 7.45% 16/5/2019 750,000 USD 748,090 874,999 0.21
Quantity/ Aquisition % net
Description Nominal Currency cost Evaluation assets

The accompanying notes form an integral part of these financial statements. 179
INTERNATIONAL OPPORTUNITIES FUNDS
US INVESTMENT GRADE BOND (continued)
Statement of Investment as at December 31, 2009
(expressed in USD)
Alltel Corp. 7.875% 1/7/2032 700,000 USD 735,395 835,909 0.20 Altria Group, Inc. 9.95% 10/11/2038 1,060,000 USD 1,040,636 1,386,447 0.33 Altria Group, Inc. 10.2% 6/2/2039 2,000,000 USD 2,368,609 2,677,186 0.65 American Airlines Pass Through Trust 2009-1A 10.375% 2/7/2019 598,000 USD 598,000 660,790 0.16 American Express Bank FSB 5.55% 17/10/2012 "BKN1" 1,160,000 USD 1,206,619 1,242,619 0.30 American Express Centurion Bank 5.55% 17/10/2012 "BKNT" 1,000,000 USD 1,031,570 1,071,223 0.26 American Express Co. 8.125% 20/5/2019 1,000,000 USD 1,193,542 1,189,933 0.29 American Express Credit Corp. 5.875% 2/5/2013 "MTN" 2,450,000 USD 2,600,450 2,635,436 0.64 American General Finance Corp. 5.2% 15/12/2011 "MTN" 560,000 USD 559,830 481,489 0.12 American General Finance Corp. 6.9% 15/12/2017 "MTN" 1,168,000 USD 698,542 813,523 0.20 AmerisourceBergen Corp. 4.875% 15/11/2019 569,000 USD 564,357 564,360 0.14 Amgen, Inc. 6.4% 1/2/2039 243,000 USD 241,901 267,744 0.06 Anadarko Petroleum Corp. 6.45% 15/9/2036 530,000 USD 534,932 555,673 0.13 Anadarko Petroleum Corp. 7.95% 15/6/2039 1,000,000 USD 996,653 1,241,834 0.30 Anheuser-Busch Cos., Inc. 4.375% 15/1/2013 500,000 USD 506,573 512,625 0.12 Anheuser-Busch InBev Worldwide, Inc. 3% 15/10/2012 "144A" 1,500,000 USD 1,497,938 1,509,606 0.36 Anheuser-Busch InBev Worldwide, Inc. 4.125% 15/1/2015 "144A" 3,500,000 USD 3,557,108 3,564,946 0.86 Anheuser-Busch InBev Worldwide, Inc. 5.375% 15/1/2020 "144A" 1,206,000 USD 1,198,255 1,236,151 0.30 AON Corp. 8.205% 1/1/2027 1,713,000 USD 1,691,801 1,738,695 0.42 Appalachian Power Co. 6.7% 15/8/2037 "P" 1,300,000 USD 1,366,920 1,384,402 0.33 Appalachian Power Co. 7% 1/4/2038 400,000 USD 397,516 442,070 0.11 Assurant, Inc. 5.625% 15/2/2014 770,000 USD 772,630 791,520 0.19 AT&T, Inc. 6.55% 15/2/2039 1,947,000 USD 2,051,621 2,061,351 0.50 BAC Capital Trust XI 6.625% 23/5/2036 220,000 USD 236,888 194,150 0.05 BAC Capital Trust XIV FRN Perpetual 840,000 USD 840,237 579,600 0.14 Baltimore Gas & Electric Co. 6.125% 1/7/2013 833,000 USD 832,942 902,346 0.22 Baltimore Gas & Electric Co. 6.35% 1/10/2036 190,000 USD 189,778 196,075 0.05 Bank of America Corp. 5.65% 1/5/2018 650,000 USD 647,103 664,946 0.16 Bank of America Corp. 5.75% 1/12/2017 1,500,000 USD 1,445,234 1,541,859 0.37 Bank of America Corp. 6.5% 1/8/2016 1,000,000 USD 997,647 1,079,569 0.26 Bank of America NA 6.1% 15/6/2017 "BKNT" 3,000,000 USD 2,852,851 3,060,873 0.74 BB&T Corp. 3.85% 27/7/2012 "MTN" 2,000,000 USD 1,999,334 2,073,152 0.50 BlackRock, Inc. 2.25% 10/12/2012 2,000,000 USD 1,995,261 1,994,962 0.48 BlackRock, Inc. 3.5% 10/12/2014 2,000,000 USD 1,997,137 1,975,720 0.48 BMC Software, Inc. 7.25% 1/6/2018 520,000 USD 517,402 568,480 0.14 Bunge Ltd Finance Corp. 8.5% 15/6/2019 615,000 USD 614,983 703,867 0.17 Bunge NA Finance LP 5.9% 1/4/2017 600,000 USD 593,811 596,235 0.14 Burlington Northern Santa Fe Corp. 5.65% 1/5/2017 1,250,000 USD 1,324,591 1,335,747 0.32 CA, Inc. 5.375% 1/12/2019 402,000 USD 398,678 406,108 0.10 Capital One Bank USA NA 8.8% 15/7/2019 2,600,000 USD 2,988,735 3,076,525 0.74 Capital One Financial Corp. 7.375% 23/5/2014 589,000 USD 586,474 668,692 0.16 CareFusion Corp. 4.125% 1/8/2012 "144A" 966,000 USD 960,355 997,360 0.24 Cellco Partnership / Verizon Wireless Capital LLC 3.75% 20/5/2011 500,000 USD 517,259 516,072 0.12 Cellco Partnership / Verizon Wireless Capital LLC 5.55% 1/2/2014 2,150,000 USD 2,258,863 2,340,047 0.56 Cellco Partnership / Verizon Wireless Capital LLC 8.5% 15/11/2018 1,563,000 USD 1,831,968 1,946,285 0.47 CenterPoint Energy Houston Electric LLC 6.95% 15/3/2033 "K2" 220,000 USD 234,437 244,340 0.06 Chubb Corp. FRN 29/3/2067 300,000 USD 190,970 279,000 0.07 CIGNA Corp. 8.5% 1/5/2019 1,238,000 USD 1,234,657 1,412,315 0.34 Cisco Systems, Inc. 5.5% 15/1/2040 500,000 USD 487,254 480,160 0.12 Citigroup Capital XXI FRN 21/12/2057 435,000 USD 433,995 418,144 0.10 Citigroup, Inc. 5% 15/9/2014 3,870,000 USD 3,542,781 3,741,353 0.90 Citigroup, Inc. 6% 31/10/2033 500,000 USD 363,420 431,722 0.10 Citigroup, Inc. 6.01% 15/1/2015 1,000,000 USD 1,018,480 1,024,496 0.25 Citigroup, Inc. 6.125% 21/11/2017 1,000,000 USD 939,180 1,009,849 0.24 Citigroup, Inc. 6.125% 15/5/2018 500,000 USD 499,192 504,647 0.12 Citigroup, Inc. 6.375% 12/8/2014 385,000 USD 382,603 404,180 0.10 Citigroup, Inc. 8.125% 15/7/2039 496,000 USD 486,086 561,838 0.14 Citigroup, Inc. 8.5% 22/5/2019 2,666,000 USD 2,829,643 3,080,659 0.74 Cleveland Electric Illuminating Co. (The) 5.5% 15/8/2024 1,304,000 USD 1,297,213 1,299,512 0.31 Comcast Cable Communications Holdings, Inc. 9.455% 15/11/2022 410,000 USD 521,334 529,862 0.13 Comcast Corp. 6.3% 15/11/2017 370,000 USD 369,315 406,367 0.10 Comcast Corp. 6.5% 15/11/2035 170,000 USD 169,636 177,074 0.04
Quantity/ Aquisition % net
Description Nominal Currency cost Evaluation assets

180 The accompanying notes form an integral part of these financial statements.
INTERNATIONAL OPPORTUNITIES FUNDS
US INVESTMENT GRADE BOND (continued)
Statement of Investment as at December 31, 2009
(expressed in USD)
Comcast Corp. 6.55% 1/7/2039 700,000 USD 696,577 736,413 0.18 Comcast Corp. 6.95% 15/8/2037 600,000 USD 572,745 656,963 0.16 Commonwealth Edison Co. 5.8% 15/3/2018 733,000 USD 731,845 780,383 0.19 Commonwealth Edison Co. 6.15% 15/9/2017 460,000 USD 459,001 500,014 0.12 Consolidated Edison Company of New York, Inc. 5.5% 1/12/2039 "09-C" 904,000 USD 900,592 883,844 0.21 Consumers Energy Co. 5.65% 15/4/2020 160,000 USD 159,568 167,820 0.04 Continental Airlines, Inc. 6.703% 15/6/2021 "01A1" 468,593 USD 463,291 438,134 0.11 CRH America, Inc. 6% 30/9/2016 220,000 USD 220,256 230,693 0.06 CRH America, Inc. 8.125% 15/7/2018 350,000 USD 349,891 409,785 0.10 CSX Corp. 5.75% 15/3/2013 740,000 USD 738,889 802,300 0.19 CSX Corp. 7.375% 1/2/2019 1,500,000 USD 1,763,715 1,720,641 0.42 CVS Caremark Corp. 6.6% 15/3/2019 2,183,000 USD 2,377,241 2,398,888 0.58 Dell, Inc. 5.875% 15/6/2019 543,000 USD 542,656 577,141 0.14 Delta Air Lines, Inc. 7.75% 17/12/2019 "A" 828,000 USD 828,000 852,840 0.21 Discovery Communications LLC 5.625% 15/8/2019 891,000 USD 886,098 924,085 0.22 Dominion Resources, Inc./VA 5.2% 15/8/2019 1,660,000 USD 1,657,909 1,693,383 0.41 Dow Chemical Co. (The) 4.85% 15/8/2012 1,100,000 USD 1,099,857 1,157,847 0.28 Dow Chemical Co. (The) 5.9% 15/2/2015 2,793,000 USD 2,916,154 3,014,747 0.73 Dow Chemical Co. (The) 8.55% 15/5/2019 1,197,000 USD 1,188,867 1,433,996 0.35 Dow Chemical Co. (The) 9.4% 15/5/2039 486,000 USD 558,539 647,214 0.16 Dr Pepper Snapple Group, Inc. 6.82% 1/5/2018 200,000 USD 199,975 225,240 0.05 DTE Energy Co. 7.625% 15/5/2014 743,000 USD 743,000 831,898 0.20 Duke Energy Corp. 3.95% 15/9/2014 3,000,000 USD 2,998,296 3,049,269 0.74 Duke Realty LP 6.25% 15/5/2013 1,000,000 USD 999,557 1,008,039 0.24 Duke Realty LP 7.375% 15/2/2015 515,000 USD 512,339 544,747 0.13 Eastman Chemical Co. 5.5% 15/11/2019 825,000 USD 824,173 826,151 0.20 EI du Pont de Nemours & Co. 4.625% 15/1/2020 466,000 USD 464,095 458,386 0.11 Enbridge Energy Partners LP 7.5% 15/4/2038 "B" 1,306,000 USD 1,453,525 1,491,536 0.36 Enbridge Energy Partners LP 9.875% 1/3/2019 500,000 USD 499,730 635,545 0.15 Energy Transfer Partners LP 8.5% 15/4/2014 1,265,000 USD 1,264,957 1,464,030 0.35 Enterprise Products Operating LLC 5.65% 1/4/2013 1,000,000 USD 999,389 1,067,888 0.26 Enterprise Products Operating LLC 6.125% 15/10/2039 1,034,000 USD 1,027,707 1,002,936 0.24 Enterprise Products Operating LLC 7.55% 15/4/2038 375,000 USD 373,063 425,063 0.10 Enterprise Products Operating LLC 9.75% 31/1/2014 300,000 USD 300,000 357,710 0.09 Equifax, Inc. 4.45% 1/12/2014 480,000 USD 479,004 483,884 0.12 Equity One, Inc. 6.25% 15/12/2014 2,269,000 USD 2,265,439 2,238,820 0.54 Exelon Generation Co. LLC 5.2% 1/10/2019 371,000 USD 370,297 372,828 0.09 Exelon Generation Co. LLC 6.25% 1/10/2039 709,000 USD 708,038 725,896 0.18 Express Scripts, Inc. 6.25% 15/6/2014 479,000 USD 477,191 524,105 0.13 Express Scripts, Inc. 7.25% 15/6/2019 129,000 USD 128,188 147,188 0.04 FirstEnergy Solutions Corp. 6.8% 15/8/2039 523,000 USD 521,220 530,662 0.13 Fiserv, Inc. 6.125% 20/11/2012 550,000 USD 549,851 599,979 0.14 Fiserv, Inc. 6.8% 20/11/2017 290,000 USD 289,247 321,192 0.08 General Electric Capital Corp. 6% 7/8/2019 "GMTN" 773,000 USD 772,170 802,973 0.19 General Electric Capital Corp. 6.875% 10/1/2039 "MTN" 3,019,000 USD 2,992,831 3,129,619 0.76 General Electric Capital Corp. FRN 15/11/2067 1,350,000 USD 1,267,020 1,166,062 0.28 General Mills, Inc. 5.2% 17/3/2015 818,000 USD 816,626 875,792 0.21 Genworth Financial, Inc. 8.625% 15/12/2016 1,611,000 USD 1,607,892 1,677,362 0.40 Genworth Global Funding Trusts 5.2% 8/10/2010 "MTN" 1,700,000 USD 1,718,660 1,744,904 0.42 Goldman Sachs Group, Inc. (The) 6.25% 1/9/2017 700,000 USD 634,937 751,262 0.18 Goldman Sachs Group, Inc. (The) 6.75% 1/10/2037 3,708,000 USD 3,418,334 3,825,929 0.92 Goldman Sachs Group, Inc. (The) 7.5% 15/2/2019 413,000 USD 428,464 483,449 0.12 Goodrich Corp. 4.875% 1/3/2020 909,000 USD 906,822 903,409 0.22 Harris Corp. 6.375% 15/6/2019 260,000 USD 259,243 281,955 0.07 HCC Insurance Holdings, Inc. 6.3% 15/11/2019 578,000 USD 575,081 589,637 0.14 Hess Corp. 6% 15/1/2040 694,000 USD 688,694 690,081 0.17 Hess Corp. 7% 15/2/2014 762,000 USD 760,279 859,524 0.21 Home Depot, Inc. 5.875% 16/12/2036 1,000,000 USD 973,393 969,094 0.23 Hospira, Inc. 6.4% 15/5/2015 "GMTN" 760,000 USD 758,617 844,031 0.20 HSBC Finance Corp. FRN 19/7/2012 1,300,000 USD 969,733 1,253,568 0.30 International Game Technology 7.5% 15/6/2019 745,000 USD 741,151 810,637 0.20 International Lease Finance Corp. 4.75% 13/1/2012 100,000 USD 80,758 84,511 0.02
Quantity/ Aquisition % net
Description Nominal Currency cost Evaluation assets

The accompanying notes form an integral part of these financial statements. 181
INTERNATIONAL OPPORTUNITIES FUNDS
US INVESTMENT GRADE BOND (continued)
Statement of Investment as at December 31, 2009
(expressed in USD)
International Paper Co. 7.3% 15/11/2039 1,139,000 USD 1,136,058 1,212,885 0.29 International Paper Co. 7.5% 15/8/2021 814,000 USD 813,371 916,435 0.22 Interstate Power & Light Co. 6.25% 15/7/2039 548,000 USD 544,593 578,230 0.14 Jefferies Group, Inc. 8.5% 15/7/2019 714,000 USD 751,851 783,610 0.19 Jersey Central Power & Light Co. 6.4% 15/5/2036 370,000 USD 368,025 376,849 0.09 JPMorgan Chase & Co. 6.3% 23/4/2019 700,000 USD 699,096 773,366 0.19 JPMorgan Chase & Co. FRN Perpetual "1" 2,500,000 USD 2,202,132 2,578,475 0.62 JPMorgan Chase Bank NA 6% 1/10/2017 "BKNT" 1,200,000 USD 1,276,967 1,294,562 0.31 JPMorgan Chase Capital XXV 6.8% 1/10/2037 "Y" 1,030,000 USD 977,895 1,027,940 0.25 JPMorgan Chase Capital XXVII 7% 1/11/2039 "AA" 2,200,000 USD 2,196,375 2,228,767 0.54 Kansas City Power & Light Co. 6.375% 1/3/2018 667,000 USD 667,000 712,377 0.17 Kellogg Co. 4.45% 30/5/2016 1,200,000 USD 1,197,110 1,240,873 0.30 Keycorp 6.5% 14/5/2013 "MTN" 2,250,000 USD 2,315,690 2,327,539 0.56 Kinder Morgan Energy Partners LP 6.5% 1/9/2039 1,125,000 USD 1,115,176 1,135,278 0.27 Kinder Morgan Energy Partners LP 7.75% 15/3/2032 300,000 USD 267,685 338,718 0.08 Kraft Foods, Inc. 6.875% 26/1/2039 750,000 USD 803,876 790,543 0.19 Kroger Co. (The) 7.5% 1/4/2031 140,000 USD 145,211 163,514 0.04 L-3 Communications Corp. 5.2% 15/10/2019 "144A" 344,000 USD 342,800 341,787 0.08 Lincoln National Corp. 6.25% 15/2/2020 909,000 USD 907,654 899,779 0.22 Lincoln National Corp. 8.75% 1/7/2019 2,650,000 USD 2,957,629 3,039,974 0.73 Lockheed Martin Corp. 4.25% 15/11/2019 1,250,000 USD 1,238,802 1,212,317 0.29 Lockheed Martin Corp. 5.5% 15/11/2039 600,000 USD 599,910 590,450 0.14 Los Angeles Calinornia Unified School Distribution 5.75% 1/7/2034 1,500,000 USD 1,416,629 1,388,760 0.34 Magellan Midstream Partners LP 6.4% 1/5/2037 130,000 USD 129,479 130,655 0.03 Magellan Midstream Partners LP 6.55% 15/7/2019 833,000 USD 896,110 908,136 0.22 Mead Johnson Nutrition Co. 3.5% 1/11/2014 "144A" 1,750,000 USD 1,742,426 1,735,379 0.42 Mead Johnson Nutrition Co. 5.9% 1/11/2039 "144A" 638,000 USD 637,829 630,882 0.15 Medco Health Solutions, Inc. 6.125% 15/3/2013 750,000 USD 747,238 804,122 0.19 Merrill Lynch & Co., Inc. 6.05% 15/8/2012 "MTN" 1,500,000 USD 1,608,176 1,609,314 0.39 Merrill Lynch & Co., Inc. 6.4% 28/8/2017 700,000 USD 538,927 739,439 0.18 Merrill Lynch & Co., Inc. 7.75% 14/5/2038 375,000 USD 374,919 413,525 0.10 MetLife, Inc. 6.75% 1/6/2016 1,100,000 USD 1,097,615 1,236,664 0.30 MetLife, Inc. 6.817% 15/8/2018 "A" 470,000 USD 471,418 525,556 0.13 Morgan Stanley 4.2% 20/11/2014 1,836,000 USD 1,835,283 1,842,879 0.44 Morgan Stanley 5.625% 23/9/2019 "MTN" 2,100,000 USD 2,102,180 2,124,761 0.51 Morgan Stanley 5.95% 28/12/2017 "MTN" 469,000 USD 467,941 485,574 0.12 Morgan Stanley 7.3% 13/5/2019 371,000 USD 370,699 417,186 0.10 New York City Transitional Finance 5.767% 1/8/2036 1,200,000 USD 1,200,000 1,168,728 0.28 New York N Y City Municipal WTR Finance Authority 5.75% 15/6/2041 1,000,000 USD 1,000,000 959,690 0.23 Newmont Mining Corp. 6.25% 1/10/2039 1,000,000 USD 988,195 1,005,232 0.24 News America, Inc. 6.65% 15/11/2037 700,000 USD 692,365 742,311 0.18 News America, Inc. 6.9% 15/8/2039 "144A" 969,000 USD 991,768 1,061,262 0.26 Nisource Finance Corp. 6.125% 1/3/2022 1,029,000 USD 1,024,594 1,055,519 0.25 Nisource Finance Corp. 10.75% 15/3/2016 339,000 USD 335,394 419,238 0.10 Nordstrom, Inc. 6.75% 1/6/2014 741,000 USD 738,619 829,830 0.20 Norfolk Southern Corp. 5.9% 15/6/2019 1,023,000 USD 1,020,594 1,097,105 0.26 Nustar Logistics 7.65% 15/4/2018 800,000 USD 798,691 880,641 0.21 Oglethorpe Power Corp. 5.95% 1/11/2039 "144A" 980,000 USD 980,000 997,139 0.24 Pacific Gas & Electric Co. 5.4% 15/1/2040 932,000 USD 918,816 896,530 0.22 Panhandle Eastern Pipeline Co. LP 6.2% 1/11/2017 840,000 USD 838,298 891,464 0.22 Pemex Project Funding Master Trust 7.375% 15/12/2014 600,000 USD 613,354 671,291 0.16 Plains All American Pipeline LP / PAA Finance Corp. 4.25% 1/9/2012 1,500,000 USD 1,497,455 1,550,427 0.37 PPL Electric Utilities Corp. 6.25% 15/5/2039 766,000 USD 761,483 825,078 0.20 Principal Financial Group, Inc. 6.05% 15/10/2036 180,000 USD 178,944 163,233 0.04 Principal Life Income Funding Trusts 5.3% 24/4/2013 "MTN" 435,000 USD 434,477 460,367 0.11 Progress Energy, Inc. 6% 1/12/2039 800,000 USD 799,315 788,464 0.19 Prudential Financial, Inc. 3.625% 17/9/2012 "MTN" 1,195,000 USD 1,194,817 1,214,550 0.29 Prudential Financial, Inc. 6% 1/12/2017 "MTN" 1,800,000 USD 1,869,861 1,864,019 0.45 Prudential Financial, Inc. 7.375% 15/6/2019 2,660,000 USD 2,778,297 2,994,772 0.72 Puget Sound Energy, Inc. 5.757% 1/10/2039 664,000 USD 664,000 641,227 0.15 Quest Diagnostics, Inc. (DE) 6.95% 1/7/2037 330,000 USD 326,648 369,071 0.09 Ralcorp Holdings, Inc. 6.625% 15/8/2039 "144A" 758,000 USD 755,771 742,061 0.18
Quantity/ Aquisition % net
Description Nominal Currency cost Evaluation assets

182 The accompanying notes form an integral part of these financial statements.
INTERNATIONAL OPPORTUNITIES FUNDS
US INVESTMENT GRADE BOND (continued)
Statement of Investment as at December 31, 2009
(expressed in USD)
Realty Income Corp. 5.5% 15/11/2015 560,000 USD 558,552 542,261 0.13 Reed Elsevier Capital, Inc. 8.625% 15/1/2019 560,000 USD 558,035 684,098 0.17 Reinsurance Group of America, Inc. 6.45% 15/11/2019 1,378,000 USD 1,388,453 1,379,423 0.33 Republic Services, Inc. 5.25% 15/11/2021 "144A" 1,250,000 USD 1,249,926 1,235,369 0.30 Republic Services, Inc. 5.5% 15/9/2019 "144A" 531,000 USD 527,329 541,588 0.13 Rowan Cos., Inc. 7.875% 1/8/2019 1,558,000 USD 1,663,359 1,740,582 0.42 Safeway, Inc. 5% 15/8/2019 287,000 USD 284,730 285,901 0.07 Simon Property Group LP 5.1% 15/6/2015 1,000,000 USD 923,233 991,222 0.24 Simon Property Group LP 5.75% 1/12/2015 750,000 USD 615,711 767,804 0.19 Simon Property Group LP 6.75% 15/5/2014 3,500,000 USD 3,792,795 3,739,890 0.90 SLM Corp. 4% 15/1/2010 700,000 USD 698,371 699,967 0.17 St Jude Medical, Inc. 3.75% 15/7/2014 697,000 USD 696,040 706,568 0.17 St Jude Medical, Inc. 4.875% 15/7/2019 255,000 USD 251,904 258,197 0.06 Swiss Re Solutions Holding Corp. 7.75% 15/6/2030 1,000,000 USD 1,057,776 1,043,676 0.25 TD Ameritrade Holding Corp. 4.15% 1/12/2014 3,000,000 USD 2,997,092 2,966,832 0.72 Thermo Fisher Scientific, Inc. 2.15% 28/12/2012 "144A" 1,166,000 USD 1,164,376 1,151,966 0.28 Time Warner Cable, Inc. 5% 1/2/2020 2,273,000 USD 2,226,002 2,214,336 0.53 Time Warner Cable, Inc. 5.4% 2/7/2012 480,000 USD 479,575 513,639 0.12 Time Warner Cable, Inc. 6.75% 1/7/2018 970,000 USD 1,020,123 1,069,746 0.26 Time Warner Cable, Inc. 7.5% 1/4/2014 900,000 USD 896,451 1,039,994 0.25 Time Warner, Inc. 5.5% 15/11/2011 560,000 USD 559,894 595,289 0.14 Time Warner, Inc. 6.5% 15/11/2036 720,000 USD 722,592 755,292 0.18 Time Warner, Inc. 6.875% 1/5/2012 1,930,000 USD 2,093,891 2,115,954 0.51 Time Warner, Inc. 7.7% 1/5/2032 820,000 USD 858,524 966,953 0.23 TJX Cos., Inc. 4.2% 15/8/2015 1,000,000 USD 999,926 1,050,187 0.25 Travelers Property Casualty Corp. 5% 15/3/2013 770,000 USD 762,595 809,143 0.20 Union Electric Co. 5.3% 1/8/2037 420,000 USD 418,774 380,319 0.09 Union Electric Co. 6% 1/4/2018 1,731,000 USD 1,881,891 1,812,759 0.44 Union Electric Co. 8.45% 15/3/2039 539,000 USD 537,252 714,751 0.17 Union Pacific Corp. 7.125% 1/2/2028 320,000 USD 369,636 355,323 0.09 USB Capital XIII Trust 6.625% 15/12/2039 1,500,000 USD 1,494,566 1,510,665 0.36 Valero Energy Corp. 6.125% 15/6/2017 300,000 USD 299,796 308,203 0.07 Valero Energy Corp. 6.625% 15/6/2037 220,000 USD 212,951 207,186 0.05 Valero Energy Corp. 10.5% 15/3/2039 1,060,000 USD 1,207,402 1,366,310 0.33 Verizon Communications, Inc. 5.5% 1/4/2017 2,500,000 USD 2,651,409 2,647,427 0.64 Verizon Communications, Inc. 6.4% 15/2/2038 2,800,000 USD 2,950,284 2,941,193 0.71 Viacom, Inc. 5.625% 15/9/2019 536,000 USD 532,110 562,118 0.14 Virginia Electric and Power Co. 8.875% 15/11/2038 170,000 USD 169,992 241,084 0.06 Waste Management, Inc. 6.375% 11/3/2015 750,000 USD 747,744 833,771 0.20 Waste Management, Inc. (Old) 7.1% 1/8/2026 270,000 USD 300,842 293,315 0.07 Wells Fargo & Co. 5.625% 11/12/2017 2,200,000 USD 2,280,682 2,297,119 0.55 Wells Fargo Capital XIII FRN Perpetual "GMTN" 1,025,000 USD 989,567 994,250 0.24 Willis North America, Inc. 7% 29/9/2019 277,000 USD 275,661 283,247 0.07 WR Berkley Corp. 5.125% 30/9/2010 580,000 USD 579,190 585,786 0.14 WR Berkley Corp. 6.15% 15/8/2019 320,000 USD 318,709 305,036 0.07 Xerox Corp. 4.25% 15/2/2015 1,500,000 USD 1,497,164 1,494,763 0.36 Xerox Corp. 5.5% 15/5/2012 840,000 USD 838,970 883,134 0.21 Xerox Corp. 5.625% 15/12/2019 517,000 USD 515,590 518,581 0.13
241,914,830 252,364,233 60.87
Total Bonds 309,286,587 322,319,983 77.75
SECURITISED ASSETS
United States of AmericaBanc of America Commercial Mortgage, Inc. FRN 10/5/2045 "2006-2 A4" 2,118,000 USD 1,661,921 2,081,865 0.50 Banc of America Commercial Mortgage, Inc. FRN 10/2/2051 "2008-1 A4" 1,000,000 USD 676,901 913,185 0.22 Banc of America Securities Auto Trust 5.34% 18/2/2011 "2006-G1 B 1,375,000 USD 1,378,595 1,378,364 0.33 Bear Stearns Commercial Mortgage Securities 5.201% 11/12/2038 "2006-PW14 A4" 860,000 USD 791,233 828,221 0.20
Quantity/ Aquisition % net
Description Nominal Currency cost Evaluation assets

The accompanying notes form an integral part of these financial statements. 183
INTERNATIONAL OPPORTUNITIES FUNDS
US INVESTMENT GRADE BOND (continued)
Statement of Investment as at December 31, 2009
(expressed in USD)
Bear Stearns Commercial Mortgage Securities FRN 11/9/2038 "2006-PW12 A4" 800,000 USD 479,865 814,506 0.20 Bear Stearns Commercial Mortgage Securities FRN 13/8/2039 "2003-T12 A4" 340,000 USD 324,924 341,147 0.08 CarMax Auto Owner Trust 4.12% 15/3/2013 "2009-1 A3" 2,500,000 USD 2,588,938 2,592,149 0.63 CarMax Auto Owner Trust 5.81% 16/12/2013 "2009-1 A4" 1,000,000 USD 1,073,128 1,071,277 0.26 Chase Issuance Trust 4.96% 17/9/2012 "2007-A15 A" 5,000,000 USD 5,173,569 5,151,960 1.24 Citibank Credit Card Issuance Trust 5% 2/4/2012 "2007-B2 B2" 800,000 USD 808,335 807,657 0.20 Citigroup Commercial Mortgage Trust FRN 15/3/2049 "2006-C4 A3" 2,060,000 USD 1,840,117 1,978,242 0.48 Credit Suisse Mortgage Capital Certificates FRN 15/6/2039 400,000 USD 330,787 243,033 0.06 Daimler Chrysler Auto Trust 5.28% 8/3/2013 "2007-A A4" 1,485,000 USD 1,555,042 1,553,050 0.38 Daimler Chrysler Auto Trust 5.38% 8/3/2011 "2006-B A4" 672,428 USD 672,759 673,083 0.16 Greenwich Capital Commercial Funding Corp. 5.444% 10/3/2039 "2007-GG9 A4" 1,000,000 USD 710,226 885,324 0.21 JP Morgan Chase Commercial Mortgage Securities Corp. 5.308% 12/10/2037 700,000 USD 625,425 705,749 0.17 JP Morgan Chase Commercial Mortgage Securities Corp. 5.429% 12/12/2043 "2006-CB17 A4" 1,232,000 USD 1,132,782 1,166,404 0.28 JP Morgan Chase Commercial Mortgage Securities Corp. 5.44% 12/6/2047 "2007-CB18 A4" 2,500,000 USD 2,154,865 2,182,314 0.53 JP Morgan Chase Commercial Mortgage Securities Corp. 5.716% 15/2/2051 "2007-C1 A4" 300,000 USD 151,882 238,552 0.06 JP Morgan Chase Commercial Mortgage Securities Corp. FRN 12/2/2049 "2007-CB19 A4" 1,200,000 USD 1,038,764 1,052,021 0.25 JP Morgan Chase Commercial Mortgage Securities Corp. FRN 12/2/2049 "2007-CB19 AM" 500,000 USD 465,432 362,945 0.09 Merrill Lynch Mortgage Trust FRN 12/11/2035 "2003-KEY1 A4" 1,100,000 USD 1,138,934 1,118,736 0.27 Morgan Stanley Capital I 5.809% 12/12/2049 "2007-IQ16 A4" 2,760,000 USD 2,443,589 2,356,154 0.57 Morgan Stanley Capital I FRN 12/2/2044 "2007-HQ11 A4" 2,220,000 USD 1,913,124 1,949,406 0.47 Morgan Stanley Capital I FRN 12/12/2049 "2007-IQ16 AM" 200,000 USD 186,768 134,781 0.03 USAA Auto Owner Trust 2.53% 15/7/2015 "2009-2 A4" 767,000 USD 766,985 763,978 0.18 Wachovia Auto Loan Owner Trust 2006-1 5.29% 20/4/2012 "2007-1 A3A" 4,605,488 USD 4,702,576 4,690,766 1.13 Wachovia Bank Commercial Mortgage Trust 4.867% 15/2/2035 660,000 USD 640,500 680,270 0.16 Wachovia Bank Commercial Mortgage Trust FRN 15/5/2043 "2006-C25 A5" 685,000 USD 549,240 676,009 0.16 Wachovia Bank Commercial Mortgage Trust FRN 15/7/2045 "2006-C27 A3" 4,577,000 USD 3,718,991 4,155,686 1.00
Total Securitised Assets 41,696,197 43,546,834 10.50
Total Transferable Securities Admitted to an Official Stock Exchange Listing
or Dealt in on Another Regulated Market 351,239,381 366,123,414 88.31
Unlisted Securities
BONDS
AustraliaMacquarie Group Ltd 7.3% 1/8/2014 "144A" 1,400,000 USD 1,397,062 1,517,254 0.36 Macquarie Group Ltd 7.625% 13/8/2019 "144A" 1,360,000 USD 1,416,482 1,521,144 0.37
2,813,544 3,038,398 0.73
BermudaBacardi Ltd 8.2% 1/4/2019 "144A" 500,000 USD 499,844 593,345 0.14 Holcim Capital Corp., Ltd 6.875% 29/9/2039 "144A" 411,000 USD 401,016 433,642 0.11
900,860 1,026,987 0.25
CanadaCanadian Oil Sands Ltd 7.75% 15/5/2019 "144A" 689,000 USD 687,660 780,457 0.19 Xstrata Finance Canada Ltd 5.8% 15/11/2016 "144A" 550,000 USD 549,228 565,796 0.13
1,236,888 1,346,253 0.32
Quantity/ Aquisition % net
Description Nominal Currency cost Evaluation assets

184 The accompanying notes form an integral part of these financial statements.
INTERNATIONAL OPPORTUNITIES FUNDS
US INVESTMENT GRADE BOND (continued)
Statement of Investment as at December 31, 2009
(expressed in USD)
Cayman IslandsHutchison Whampoa International 09/16 Ltd 4.625% 11/9/2015 "144A" 2,800,000 USD 2,795,459 2,835,991 0.68
LuxembourgEnel Finance International SA 6% 7/10/2039 "144A" 1,500,000 USD 1,492,012 1,515,481 0.37
QatarRas Laffan Liquefied Natural Gas Co., Ltd III 5.832% 30/9/2016 "144A" 570,000 USD 570,776 598,717 0.14 Ras Laffan Liquefied Natural Gas Co., Ltd III 5.838% 30/9/2027 "144A" 180,000 USD 180,110 179,757 0.04 Ras Laffan Liquefied Natural Gas Co., Ltd III 6.75% 30/9/2019 "144A" 250,000 USD 249,271 271,637 0.07
1,000,157 1,050,111 0.25
SwedenVolvo Treasury AB 5.95% 1/4/2015 "144A" 1,418,000 USD 1,415,389 1,468,326 0.36
United Arab EmiratesDolphin Energy Ltd 5.888% 15/6/2019 "144A" 2,345,310 USD 2,355,150 2,368,763 0.57
United States of AmericaAllegheny Energy Supply Co. LLC 5.75% 15/10/2019 "144A" 503,000 USD 501,214 490,701 0.12 Allegheny Energy Supply Co. LLC 6.75% 15/10/2039 "144A" 442,000 USD 439,411 422,613 0.10 Anheuser-Busch InBev Worldwide, Inc. 8.2% 15/1/2039 "144A" 1,200,000 USD 1,205,302 1,523,221 0.37 BAE Systems Holdings, Inc. 6.375% 1/6/2019 "144A" 881,000 USD 878,104 951,739 0.23 CVS Pass-Through Trust 6.036% 10/12/2028 1,809,731 USD 1,809,764 1,717,526 0.41 CVS Pass-Through Trust 7.507% 10/1/2032 "144A" 1,818,000 USD 1,818,000 1,910,554 0.46 Chevron Phillips Chemical Co. LLC 8.25% 15/6/2019 "144A" 199,000 USD 198,990 231,228 0.06 Erac USA Finance Co. 7% 15/10/2037 "144A" 1,880,000 USD 1,848,231 1,846,803 0.45 FMR LLC 6.45% 15/11/2039 "144A" 462,000 USD 460,953 432,526 0.10 FPL Energy National Wind LLC 5.608% 10/3/2024 "144A" 353,467 USD 356,497 348,882 0.08 Guardian Life Insurance Company of America 7.375% 30/9/2039 "144A" 704,000 USD 696,857 722,651 0.17 Gulfstream Natural Gas System LLC 6.95% 1/6/2016 "144A" 754,000 USD 751,769 836,133 0.20 HJ Heinz Finance Co. 7.125% 1/8/2039 "144A" 175,000 USD 174,553 198,630 0.05 ITC Holdings Corp. 5.5% 15/1/2020 "144A" 1,500,000 USD 1,490,084 1,467,895 0.35 Massachusetts Mutual Life Insurance Co. 8.875% 1/6/2039 "144A" 337,000 USD 332,739 414,797 0.10 MetLife Capital Trust IV 7.875% 15/12/2037 "144A" 1,100,000 USD 1,059,449 1,094,500 0.26 MetLife Capital Trust X FRN 8/4/2038 "144A" 300,000 USD 300,000 339,000 0.08 Monongahela Power Co. 7.95% 15/12/2013 "144A" 400,000 USD 399,358 440,761 0.11 NGPL Pipeco LLC 6.514% 15/12/2012 "144A" 625,000 USD 656,409 680,506 0.16 NGPL Pipeco LLC 7.768% 15/12/2037 "144A" 450,000 USD 464,580 520,799 0.13 Nationwide Mutual Insurance Co. 9.375% 15/8/2039 "144A" 745,000 USD 744,978 788,918 0.19 New York Life Insurance Co. 6.75% 15/11/2039 "144A" 900,000 USD 897,937 923,975 0.22 Pacific Life Insurance Co. 9.25% 15/6/2039 "144A" 1,395,000 USD 1,448,378 1,616,246 0.39 Southeast Supply Header LLC 4.85% 15/8/2014 "144A" 1,481,000 USD 1,480,276 1,516,544 0.37 Sovereign Bank 8.75% 30/5/2018 250,000 USD 223,668 289,925 0.07 Teachers Insurance & Annuity Association of America 6.85% 16/12/2039 "144A" 1,034,000 USD 1,032,689 1,073,042 0.26 WEA Finance LLC / WT Finance Aust Pty Ltd 5.75% 2/9/2015 "144A" 1,000,000 USD 990,837 1,058,387 0.26 WEA Finance LLC / WT Finance Aust Pty Ltd 6.75% 2/9/2019 "144A" 505,000 USD 498,642 544,539 0.13 WEA Finance LLC / WT Finance Aust Pty Ltd 7.5% 2/6/2014 "144A" 2,000,000 USD 2,098,864 2,257,320 0.55
25,258,533 26,660,361 6.43
Total Unlisted Securities 39,267,992 41,310,671 9.96
Total Investments 390,507,373 407,434,085 98.27
Other Net Assets 7,176,290 1.73
Total Net Assets 414,610,375 100.00
Quantity/ Aquisition % net
Description Nominal Currency cost Evaluation assets

The accompanying notes form an integral part of these financial statements. 185
INTERNATIONAL OPPORTUNITIES FUNDS
VIETNAM EQUITY
Statement of Investment as at December 31, 2009
(expressed in USD)
Quantity/ Aquisition % net
Description Nominal Currency cost Evaluation assets
Transferable Securities Admitted to an Official Stock Exchange Listingor Dealt in on Another Regulated Market
SHARES & RIGHTS
VietnamBank for Foreign Trade of Vietnam JSC 209,600 VND 871,685 533,247 5.55 Baoviet Holdings 203,500 VND 380,830 337,074 3.51 Danang Rubber JSC 7,300 VND 50,132 48,208 0.50 Development Investment Construction Corp. 34,285 VND 130,694 140,117 1.46 DHG Pharmaceutical JSC 42,546 VND 385,995 262,544 2.73 Dong Phu Rubber JSC 11,200 VND 61,485 35,163 0.37 FPT Corp. 160,670 VND 1,060,131 687,070 7.16 GEMADEPT Corp. 94,110 VND 306,665 397,346 4.14 HAGL JSC 148,850 VND 583,456 628,467 6.55 HCM City Infrastructure Investment JSC 15,800 VND 50,927 50,460 0.52 Hoa Phat Group JSC 59,100 VND 225,739 187,147 1.95 KinhDo Corp. 124,856 VND 527,473 408,887 4.26 North Kinhdo Food JSC 52,592 VND 228,398 109,602 1.14 PetroVietnam Drilling and Well Services JSC 101,504 VND 581,636 370,874 3.86 Petrovietnam Fertilizer & Chemical JSC 324,500 VND 1,016,873 597,218 6.22 PetroVietnam Finance JSC 129,900 VND 314,749 205,320 2.14 Pha Lai Thermal Power JSC 153,900 VND 358,697 157,449 1.64 Refrigeration Electrical Engineering Corp. 110,500 VND 305,221 266,171 2.77 Saigon Securities, Inc. 31,200 VND 322,740 142,709 1.49 Saigon Thuong Tin Commercial JSC 59,700 VND 81,306 77,881 0.81 Songda Urban & Industrial Zone Investment and Development JSC 47,200 VND 117,877 204,395 2.13 Songda Urban & Industrial Zone Investment and Development JSC (Rights) 11,800 VND 168,045 44,711 0.47 Tan Tao Investment Industry Corp. 184,852 VND 524,470 350,212 3.65 Thu Duc Housing Development Corp. 114,675 VND 381,025 415,894 4.33 Tien Phong Plastic JSC 39,200 VND 256,988 231,712 2.41 Tu Liem Urban Development JSC 21,100 VND 152,518 162,185 1.69 Viet Nam Dairy Products JSC 210,840 VND 978,060 855,960 8.92 Viet Nam Export-Import Commercial JSB 223,000 VND 315,251 289,704 3.02 VietNam JSC Commercial Bank For Industry and Trade 86,100 VND 143,583 137,488 1.43 Vincom JSC 85,600 VND 341,504 435,553 4.54 Vinh Son - Song Hinh Hydropower JSC 357,450 VND 651,076 323,125 3.37
Total Investments 11,875,229 9,093,893 94.73
Other Net Assets 506,061 5.27
Total Net Assets 9,599,954 100.00

186 The accompanying notes form an integral part of these financial statements.
INTERNATIONAL OPPORTUNITIES FUNDS
WORLD VALUE EQUITY
Statement of Investment as at December 31, 2009
(expressed in USD)
Quantity/ Aquisition % net
Description Nominal Currency cost Evaluation assets
Transferable Securities Admitted to an Official Stock Exchange Listingor Dealt in on Another Regulated Market
SHARES
AustraliaAristocrat Leisure Ltd 14,543 AUD 73,163 52,465 0.02 Australia & New Zealand Banking Group Ltd 12,253 AUD 263,571 251,587 0.08 Australian Infrastructure Fund 63,376 AUD 99,197 101,236 0.03 AXA Asia Pacific Holdings Ltd 11,752 AUD 50,266 69,184 0.02 BHP Billiton Ltd 9,144 AUD 320,412 353,838 0.11 Foster's Group Ltd 19,775 AUD 101,138 97,604 0.03 Macquarie Group Ltd 2,141 AUD 105,917 92,993 0.03 Metcash Ltd 19,768 AUD 83,090 79,298 0.03 National Australia Bank Ltd 11,173 AUD 312,943 274,732 0.09 Origin Energy Ltd 10,637 AUD 156,970 160,559 0.05 PrimeAg Australia Ltd 69,747 AUD 72,497 64,782 0.02 QBE Insurance Group Ltd 8,139 AUD 170,810 186,982 0.06 Rio Tinto Ltd 3,233 AUD 195,727 217,280 0.07 Suncorp-Metway Ltd 15,346 AUD 132,703 119,675 0.04 Westfield Group – REIT 10,958 AUD 133,888 123,316 0.04
2,272,292 2,245,531 0.72
AustriaTelekom Austria AG 78,879 EUR 1,370,821 1,127,691 0.36
BelgiumGroupe Bruxelles Lambert SA 4,531 EUR 344,517 430,004 0.14 Solvay SA "A" 26,732 EUR 2,379,506 2,901,828 0.92 Tessenderlo Chemie NV 11,188 EUR 417,758 370,535 0.12
3,141,781 3,702,367 1.18
ChinaAAC Acoustic Technologies Holdings, Inc. 64,000 HKD 74,424 105,812 0.03 China Petroleum & Chemical Corp. "H" 100,000 HKD 88,551 89,114 0.03 Travelsky Technology LTD 92,000 HKD 81,220 92,900 0.03
244,195 287,826 0.09
FinlandNokia OYJ 82,279 EUR 1,110,153 1,054,532 0.33
FranceAXA SA 73,547 EUR 1,269,650 1,747,858 0.56 BNP Paribas 48,398 EUR 3,372,156 3,887,272 1.24 CFAO SA 7,555 EUR 296,138 311,220 0.10 Sanofi-Aventis SA 70,712 EUR 5,356,720 5,594,162 1.78 Societe BIC SA 8,093 EUR 399,767 561,646 0.18 Total SA 91,054 EUR 5,793,123 5,887,969 1.88 Valeo SA 35,676 EUR 1,366,678 1,257,417 0.40 Vivendi 127,667 EUR 3,975,428 3,814,550 1.21
21,829,660 23,062,094 7.35
GermanyAllianz SE (Reg) 20,919 EUR 3,145,176 2,619,474 0.83 Bayerische Motoren Werke AG 26,146 EUR 1,230,948 1,194,643 0.38 Daimler AG 32,469 EUR 2,362,495 1,736,871 0.55 Deutsche Bank AG (Reg) 8,021 EUR 1,061,186 569,557 0.18 Deutsche Telekom AG (Reg) 87,372 EUR 1,411,908 1,291,794 0.41 E.ON AG 76,490 EUR 2,293,518 3,212,471 1.03

The accompanying notes form an integral part of these financial statements. 187
INTERNATIONAL OPPORTUNITIES FUNDS
WORLD VALUE EQUITY (continued)
Statement of Investment as at December 31, 2009
(expressed in USD)
Muenchener Rueckversicherungs AG (Reg) 14,872 EUR 2,496,149 2,322,121 0.74 RWE AG 29,450 EUR 3,399,940 2,875,705 0.92 Siemens AG (Reg) 17,151 EUR 1,462,222 1,582,333 0.51
18,863,542 17,404,969 5.55
GibraltarPartyGaming PLC 152,061 GBP 546,445 639,611 0.20
GreeceOPAP SA 41,274 EUR 1,456,309 909,720 0.29 Public Power Corp SA 68,617 EUR 1,816,089 1,281,684 0.41
3,272,398 2,191,404 0.70
Hong KongBOC Hong Kong Holdings Ltd 27,500 HKD 64,148 62,419 0.02 Cheung Kong Holdings Ltd 13,000 HKD 178,297 168,156 0.06 Hang Seng Bank Ltd 5,700 HKD 86,097 84,315 0.03 Link REIT (The) – REIT 26,987 HKD 62,588 68,981 0.02 NWS Holdings Ltd 22,674 HKD 44,623 41,815 0.01 Swire Pacific Ltd 5,855 HKD 70,086 70,978 0.02
505,839 496,664 0.16
ItalyENI SpA 44,932 EUR 1,680,395 1,149,163 0.37 Intesa Sanpaolo SpA 609,228 EUR 3,114,355 2,757,377 0.88
4,794,750 3,906,540 1.25
JapanAdvantest Corp. 14,000 JPY 261,149 362,999 0.12 Ajinomoto Co., Inc. 129,000 JPY 1,258,543 1,216,915 0.39 Asahi Kasei Corp. 221,000 JPY 1,008,990 1,105,536 0.35 Bridgestone Corp. 19,600 JPY 344,114 343,589 0.11 Chiyoda Corp. 37,000 JPY 230,792 285,214 0.09 Credit Saison Co., Ltd 68,300 JPY 913,722 768,748 0.25 Daiichi Sankyo Co., Ltd 28,200 JPY 591,447 592,548 0.19 East Japan Railway Co. 13,000 JPY 757,258 822,705 0.26 Fuji Heavy Industries Ltd 153,000 JPY 584,987 742,278 0.24 Fuji Media Holdings, Inc. 627 JPY 1,046,176 871,331 0.28 Funai Electric Co., Ltd 8,600 JPY 147,224 432,063 0.14 JS Group Corp. 35,700 JPY 625,760 615,431 0.20 Kaneka Corp. 161,000 JPY 1,237,358 1,025,831 0.33 KDDI Corp. 124 JPY 656,267 659,070 0.21 Komeri Co., Ltd 15,200 JPY 371,857 407,223 0.13 Kose Corp. 21,800 JPY 471,499 441,147 0.14 Meitec Corp. 34,600 JPY 776,146 468,147 0.15 Mitsubishi Chemical Holdings Corp. 114,500 JPY 510,146 486,367 0.15 Mitsubishi Corp. 5,600 JPY 60,560 139,162 0.04 Mitsubishi UFJ Financial Group, Inc. 361,500 JPY 2,754,027 1,761,608 0.56 NEC Corp. 285,000 JPY 1,246,594 734,354 0.23 Nintendo Co., Ltd 500 JPY 134,059 118,808 0.04 Nippon Thompson Co., Ltd 91,000 JPY 355,598 452,277 0.14 Nissan Motor Co., Ltd 76,600 JPY 552,781 668,923 0.21 NOK Corp. 51,400 JPY 821,856 708,755 0.23 Obic Co., Ltd 3,450 JPY 638,513 565,732 0.18 Onward Holdings Co., Ltd 76,000 JPY 827,419 471,134 0.15 ORIX Corp. 8,830 JPY 1,003,995 596,885 0.19 Ricoh Co., Ltd 8,000 JPY 173,554 113,331 0.04
Quantity/ Aquisition % net
Description Nominal Currency cost Evaluation assets

188 The accompanying notes form an integral part of these financial statements.
INTERNATIONAL OPPORTUNITIES FUNDS
WORLD VALUE EQUITY (continued)
Statement of Investment as at December 31, 2009
(expressed in USD)
Rohm Co., Ltd 18,500 JPY 1,340,321 1,208,668 0.39 Sato Corp. 23,800 JPY 265,334 246,583 0.08 Seven & I Holdings Co., Ltd 23,100 JPY 683,824 472,435 0.15 SMC Corp. (Japan) 3,200 JPY 398,085 363,280 0.12 Sompo Japan Insurance, Inc. 80,000 JPY 868,244 511,455 0.16 Sony Corp. 54,500 JPY 1,897,759 1,568,810 0.50 Sumisho Computer Systems Corp. 57,400 JPY 889,185 787,776 0.25 Sumitomo Corp. 33,700 JPY 333,086 342,613 0.11 Sumitomo Electric Industries Ltd 35,900 JPY 390,304 445,097 0.14 Sumitomo Forestry Co., Ltd 65,300 JPY 597,636 492,804 0.16 Sumitomo Mitsui Financial Group, Inc. 28,300 JPY 2,020,563 807,002 0.26 Sumitomo Trust & Banking Co., Ltd (The) 136,000 JPY 851,186 664,201 0.21 Takeda Pharmaceutical Co., Ltd 3,700 JPY 176,441 152,779 0.05 TDK Corp. 4,300 JPY 173,884 261,927 0.08 Tokyo Electric Power Co., Inc. (The) 14,200 JPY 353,172 357,469 0.11 Tokyo Gas Co., Ltd 35,000 JPY 124,587 139,992 0.04 Toppan Forms Co., Ltd 24,600 JPY 276,595 255,932 0.08 Toshiba Machine Co., Ltd 118,000 JPY 402,034 451,620 0.14 Toyota Motor Corp. 8,200 JPY 372,901 343,011 0.11 United Arrows Ltd 43,700 JPY 288,501 364,186 0.12 Yamaha Motor Co., Ltd 89,400 JPY 949,896 1,123,825 0.36 Zeon Corp. 73,000 JPY 328,923 328,974 0.10
34,344,852 29,668,550 9.46
LuxembourgReinet Investments SCA 36,680 EUR 313,269 579,733 0.18
NetherlandsAkzo Nobel NV 24,284 EUR 1,192,198 1,618,989 0.52 Heineken Holding NV 57,656 EUR 1,547,966 2,421,884 0.77 Koninklijke KPN NV 100,669 EUR 993,383 1,712,589 0.55 Koninklijke Wessanen NV 35,705 EUR 535,193 215,007 0.07 TNT NV 143,488 EUR 4,022,856 4,432,613 1.41 Unilever NV 74,185 EUR 1,563,219 2,424,952 0.77 Wolters Kluwer NV 81,835 EUR 1,518,385 1,799,021 0.57
11,373,200 14,625,055 4.66
Papua New GuineaLihir Gold Ltd 23,449 AUD 66,211 69,022 0.02 Oil Search Ltd 16,826 AUD 96,940 92,562 0.03
163,151 161,584 0.05
SingaporeAIMS AMP Capital Industrial REIT – REIT 48,000 SGD 12,244 7,359 0.00 United Overseas Bank Ltd 13,000 SGD 157,077 182,628 0.06
169,321 189,987 0.06
SpainRepsol YPF SA 60,028 EUR 1,586,299 1,615,033 0.51
SwedenSvenska Cellulosa AB "B" 149,335 SEK 1,680,605 1,999,208 0.64
SwitzerlandBaloise Holding AG (Reg) 13,982 CHF 913,834 1,164,358 0.37 Credit Suisse Group AG (Reg) 46,137 CHF 2,137,273 2,286,050 0.73 Nestle SA (Reg) 59,794 CHF 1,835,160 2,904,877 0.92 Roche Holding AG (Genusscheine) 15,979 CHF 2,591,735 2,718,535 0.87 Swisscom AG 4,263 CHF 1,443,542 1,632,067 0.52
8,921,544 10,705,887 3.41
Quantity/ Aquisition % net
Description Nominal Currency cost Evaluation assets

The accompanying notes form an integral part of these financial statements. 189
INTERNATIONAL OPPORTUNITIES FUNDS
WORLD VALUE EQUITY (continued)
Statement of Investment as at December 31, 2009
(expressed in USD)
United KingdomAnglo American PLC 15,736 GBP 437,579 690,158 0.22 BP PLC 605,083 GBP 5,410,194 5,873,420 1.87 British American Tobacco PLC 67,509 GBP 1,863,136 2,202,342 0.70 GlaxoSmithKline PLC 147,104 GBP 3,450,254 3,140,210 1.00 Home Retail Group PLC 133,470 GBP 433,235 609,996 0.20 HSBC Holdings PLC 380,366 GBP 4,650,033 4,361,644 1.39 J Sainsbury PLC 188,456 GBP 845,624 986,300 0.32 Smiths Group PLC 98,296 GBP 1,244,485 1,612,496 0.51 Tomkins PLC 190,000 GBP 356,844 593,862 0.19 Unibet Group PLC – SDR 45,105 SEK 1,298,286 1,100,764 0.35 Vodafone Group PLC 1,859,558 GBP 4,256,405 4,323,061 1.38
24,246,075 25,494,253 8.13
United States of AmericaAbbott Laboratories 22,400 USD 1,067,647 1,218,784 0.39 Abercrombie & Fitch Co. "A" 31,400 USD 1,461,475 1,109,362 0.35 Allegheny Technologies, Inc. 52,100 USD 1,973,635 2,365,861 0.75 Allstate Corp. (The) 77,300 USD 3,039,054 2,368,472 0.76 Altria Group, Inc. 162,600 USD 2,872,948 3,212,976 1.02 American Express Co. 19,300 USD 493,445 791,686 0.25 Amgen, Inc. 14,100 USD 791,897 805,251 0.26 Apache Corp. 30,700 USD 2,442,875 3,210,606 1.02 Applied Materials, Inc. 9,600 USD 166,972 135,456 0.04 Archer-Daniels-Midland Co. 96,900 USD 2,681,180 3,079,482 0.98 AT&T, Inc. 129,272 USD 3,461,317 3,651,934 1.16 Avnet, Inc. 42,600 USD 1,181,686 1,310,376 0.42 Bank of America Corp. 244,600 USD 3,953,677 3,698,352 1.18 Bristol-Myers Squibb Co. 25,400 USD 579,305 651,764 0.21 Caterpillar, Inc. 51,500 USD 2,593,040 2,964,340 0.94 CBS Corp. 11,250 USD 228,434 161,325 0.05 Chevron Corp. 48,500 USD 3,129,828 3,765,055 1.20 CIGNA Corp. 84,600 USD 1,952,961 3,030,372 0.97 Cisco Systems, Inc. 86,200 USD 1,912,915 2,077,420 0.66 Citigroup, Inc. 259,600 USD 2,187,460 867,064 0.28 Coca-Cola Co. (The) 35,900 USD 1,721,263 2,062,814 0.66 Comcast Corp. "A" 172,700 USD 3,103,806 2,949,716 0.94 Computer Sciences Corp. 39,000 USD 1,768,784 2,265,510 0.72 ConocoPhillips 46,600 USD 2,326,427 2,379,862 0.76 Dell, Inc. 17,900 USD 485,600 260,445 0.08 Dominion Resources, Inc./VA 9,000 USD 312,278 355,140 0.11 Edison International 75,800 USD 2,565,348 2,682,562 0.86 Eli Lilly & Co. 12,400 USD 656,537 446,648 0.14 Exxon Mobil Corp. 81,100 USD 4,715,328 5,571,570 1.78 Fortune Brands, Inc. 36,000 USD 1,755,733 1,568,880 0.50 General Electric Co. 179,300 USD 5,030,864 2,743,290 0.87 Gilead Sciences, Inc. 8,300 USD 387,896 361,465 0.12 Goldman Sachs Group, Inc. (The) 16,500 USD 2,000,377 2,762,925 0.88 Goodrich Corp. 49,100 USD 2,275,004 3,202,793 1.02 Hartford Financial Services Group, Inc. 114,100 USD 1,736,943 2,725,849 0.87 Hewlett-Packard Co. 61,300 USD 1,756,064 3,217,637 1.03 Home Depot, Inc. 72,700 USD 2,077,120 2,120,659 0.68 Ingram Micro, Inc. "A" 70,700 USD 1,147,973 1,263,409 0.40 Intel Corp. 134,400 USD 2,895,878 2,778,048 0.89 International Business Machines Corp. 31,900 USD 2,979,602 4,228,026 1.35 Johnson & Johnson 58,700 USD 3,285,588 3,811,978 1.22 JPMorgan Chase & Co. 95,300 USD 3,525,172 3,956,856 1.26 Kraft Foods, Inc. "A" 24,988 USD 598,371 686,171 0.22 Lincoln National Corp. 119,700 USD 2,246,912 2,994,894 0.95 Lockheed Martin Corp. 31,400 USD 2,444,760 2,371,014 0.76
Quantity/ Aquisition % net
Description Nominal Currency cost Evaluation assets

190 The accompanying notes form an integral part of these financial statements.
INTERNATIONAL OPPORTUNITIES FUNDS
WORLD VALUE EQUITY (continued)
Statement of Investment as at December 31, 2009
(expressed in USD)
Macy's, Inc. 106,400 USD 1,660,364 1,827,952 0.58 Medtronic, Inc. 14,800 USD 699,208 659,044 0.21 Merck & Co., Inc. 82,000 USD 2,484,767 3,031,540 0.97 Microsoft Corp. 155,700 USD 3,735,891 4,812,687 1.53 Morgan Stanley 100,800 USD 2,064,484 2,983,680 0.95 Newell Rubbermaid, Inc. 115,800 USD 1,944,662 1,750,896 0.56 Newfield Exploration Co. 47,700 USD 1,887,638 2,362,581 0.75 Nucor Corp. 71,700 USD 3,040,971 3,369,900 1.07 Occidental Petroleum Corp. 28,400 USD 1,496,438 2,335,900 0.74 Oracle Corp. 57,300 USD 942,420 1,427,057 0.46 PepsiCo, Inc. (NC) 19,700 USD 1,100,722 1,209,580 0.39 Pfizer, Inc. 201,302 USD 4,514,112 3,703,957 1.18 Philip Morris International, Inc. 24,700 USD 925,717 1,203,631 0.38 PPG Industries, Inc. 30,200 USD 1,770,794 1,791,766 0.57 Procter & Gamble Co. (The) 68,500 USD 3,874,301 4,196,995 1.34 QUALCOMM, Inc. 18,300 USD 750,227 854,464 0.27 Royal Caribbean Cruises Ltd 52,000 USD 848,000 1,326,520 0.42 Spirit Aerosystems Holdings, Inc. "A" 86,100 USD 1,539,463 1,716,834 0.55 Terex Corp. 61,300 USD 1,293,273 1,238,260 0.39 Texas Instruments, Inc. 4,300 USD 95,674 112,359 0.04 Textron, Inc. 135,600 USD 1,340,028 2,565,552 0.82 Time Warner, Inc. 19,633 USD 733,510 577,407 0.18 Time Warner Cable, Inc. 6,275 USD 251,419 262,923 0.08 Travelers Cos., Inc. (The) 59,500 USD 2,653,100 3,002,370 0.96 United Parcel Service, Inc. "B" 9,000 USD 630,247 521,910 0.17 United Technologies Corp. 15,800 USD 905,677 1,115,480 0.36 US Bancorp 14,600 USD 416,185 328,646 0.10 Verizon Communications, Inc. 95,000 USD 3,049,443 3,164,450 1.01 VF Corp. 29,200 USD 1,657,554 2,171,312 0.69 Viacom, Inc. "B" 100,300 USD 2,519,671 3,031,066 0.97 Walgreen Co. 16,200 USD 535,040 600,210 0.19 Wal-Mart Stores, Inc. 28,400 USD 1,474,093 1,535,020 0.49 Walt Disney Co. (The) 30,700 USD 835,840 1,003,890 0.32 WellPoint, Inc. 3,600 USD 180,034 211,464 0.07 Wells Fargo & Co. 120,600 USD 2,767,508 3,251,376 1.04 Western Union Co. (The) 11,700 USD 240,824 222,300 0.07
148,830,678 165,725,078 52.83
Total Investments 289,580,870 306,883,597 97.82
Other Net Assets 6,826,579 2.18
Total Net Assets 313,710,176 100.00
Quantity/ Aquisition % net
Description Nominal Currency cost Evaluation assets

191
INTERNATIONAL OPPORTUNITIES FUNDS
Notes to the Financial Statements as at December 31, 2009
1. OrganisationInternational Opportunities Funds (the “SICAV” or the “Company”) is an open-ended investment company with variablecapital (société d’investissement à capital variable) registered in the Grand Duchy of Luxembourg on the official list ofcollective investment undertakings pursuant to part I of the Luxembourg law of December 20, 2002, relating toundertakings for collective investment, as amended from time to time (the “2002 Law”) and Council DirectiveEEC/85/611, as amended from time to time (the “UCITS Directive”).
The Company is a self-managed investment company, thereby complying with the provisions of article 27 of the 2002 Law.
The SICAV aims to provide subscribers with a choice of Sub-Funds investing in a wide range of transferable securitiesand other permitted assets and featuring a diverse array of investment objectives. As at December 31, 2009, the SICAVhad offered shares in thirty-seven Sub-Funds:
International Opportunities Funds – Asia Pacific Equity (hereinafter called “Asia Pacific Equity”);International Opportunities Funds – Asian Bond (hereinafter called “Asian Bond”);International Opportunities Funds – Asian Dynamic (hereinafter called “Asian Dynamic”);International Opportunities Funds – Asian Equity (hereinafter called “Asian Equity”);International Opportunities Funds – Asian Equity Income (hereinafter called “Asian Equity Income”);International Opportunities Funds – Asian Infrastructure Equity (hereinafter called “Asian Infrastructure Equity”);International Opportunities Funds – Asian Local Bond (hereinafter called “Asian Local Bond”);International Opportunities Funds – Asian Property Securities (hereinafter called “Asian Property Securities”);International Opportunities Funds – China Equity (hereinafter called “China Equity”);International Opportunities Funds – Dragon Peacock (hereinafter called “Dragon Peacock”);International Opportunities Funds – Emerging Europe, Middle East and Africa Dynamic (hereinafter called “EmergingEurope, Middle East and Africa Dynamic”);International Opportunities Funds – European Investment Grade Bond (hereinafter called “European InvestmentGrade Bond”);International Opportunities Funds – Global Market Navigator (hereinafter called “Global Market Navigator”);International Opportunities Funds – Global Technology (hereinafter called “Global Technology”);International Opportunities Funds – Greater China Equity (hereinafter called “Greater China Equity”);International Opportunities Funds – Hong Kong Equity (hereinafter called “Hong Kong Equity”);International Opportunities Funds – India Equity (hereinafter called “India Equity”);International Opportunities Funds – Indonesia Equity (hereinafter called “Indonesia Equity”);International Opportunities Funds – Japan Dynamic (hereinafter called “Japan Dynamic”);International Opportunities Funds – Japan Equity (hereinafter called “Japan Equity”);International Opportunities Funds – Japan Smaller Companies (hereinafter called “Japan Smaller Companies”);International Opportunities Funds – Korea Equity (hereinafter called “Korea Equity”);International Opportunities Funds – Latin American Equity (hereinafter called “Latin American Equity”);International Opportunities Funds – Malaysia Equity (hereinafter called “Malaysia Equity”);International Opportunities Funds – North America (hereinafter called “North America”);International Opportunities Funds – North American Value (hereinafter called “North American Value”);International Opportunities Funds – Pan European (hereinafter called “Pan European”);International Opportunities Funds – Philippines Equity (hereinafter called “Philippines Equity”);International Opportunities Funds – Taiwan Equity (hereinafter called “Taiwan Equity”);International Opportunities Funds – Thailand Equity (hereinafter called “Thailand Equity”);International Opportunities Funds – US Bond (hereinafter called “US Bond”);International Opportunities Funds – US Corporate Bond (hereinafter called “US Corporate Bond”);International Opportunities Funds – US High Investment Grade Bond (hereinafter called “US High Investment GradeBond”);International Opportunities Funds – US High Yield Bond (hereinafter called “US High Yield Bond”);International Opportunities Funds – US Investment Grade Bond (hereinafter called “US Investment Grade Bond”);International Opportunities Funds – Vietnam Equity (hereinafter called “Vietnam Equity”); andInternational Opportunities Funds – World Value Equity (hereinafter called “World Value Equity”).

192
INTERNATIONAL OPPORTUNITIES FUNDS
Notes to the Financial Statements as at December 31, 2009 (continued)
The SICAV currently offers the following shares:
Class A reserved for retail investors and whose reference currency is USD or EUR:
Class ADM (launched June 2, 2009) reserved for retail investors where dividends may be declared on a monthly basisand whose reference currency is USD or EUR:
Asian BondAsian Local BondEuropean Investment Grade BondUS High Investment Grade BondUS High Yield BondUS Investment Grade Bond
Class ADQ (following a name change of former Class AD, effective June 2, 2009) reserved for retail investors wheredividends may be declared on a quarterly basis and whose reference currency is USD or EUR:
Asian BondUS High Investment Grade Bond (launched February 16, 2009)US High Yield Bond (launched February 16, 2009)US Investment Grade Bond (launched February 16, 2009)
Class AJ reserved for retail investors and whose reference currency is JPY: Japan Equity
Class B reserved for institutional investors having subscribed through selected distributors specifically approved bythe SICAV and whose reference currency is USD or EUR:
Asian EquityUS High Investment Grade BondUS Investment Grade Bond
Class C reserved for institutional investors and whose reference currency is USD or EUR:
Asian BondAsian EquityAsian Infrastructure EquityEuropean Investment Grade BondGlobal Market NavigatorGlobal TechnologyGreater China Equity
Pan EuropeanUS BondUS High Investment Grade BondUS High Yield BondUS Investment Grade BondVietnam EquityWorld Value Equity
Asian BondAsian EquityAsian Equity IncomeAsian Infrastructure EquityAsian Local BondAsian Property SecuritiesChina EquityDragon PeacockEuropean Investment Grade BondGlobal Market NavigatorGlobal TechnologyGreater China EquityHong Kong EquityIndia EquityIndonesia EquityJapan Equity
Japan Smaller CompaniesKorea EquityLatin American EquityMalaysia EquityNorth AmericaNorth American ValuePan EuropeanPhilippines EquityTaiwan EquityThailand EquityUS BondUS High Investment Grade BondUS High Yield BondUS Investment Grade BondWorld Value Equity

193
INTERNATIONAL OPPORTUNITIES FUNDS
Notes to the Financial Statements as at December 31, 2009 (continued)
Class D reserved for certain institutional investors as defined from time to time by the Luxembourg authorities andspecifically approved by the SICAV and whose reference currency is USD or EUR:
Class DD reserved for certain institutional investors as defined from time to time by the Luxembourg authorities andspecifically approved by the SICAV, where dividends will be distributed and whose reference currency is USD:
Asian Equity Income (launched May 18, 2009)US Bond
Class DJ reserved for certain institutional investors as defined from time to time by the Luxembourg authorities andspecifically approved by the SICAV and whose reference currency is JPY: Japan Equity
Class DDJ reserved for certain institutional investors as defined from time to time by the Luxembourg authorities andspecifically approved by the SICAV, where dividends will be distributed and whose reference currency is JPY: GlobalMarket Navigator
Class E reserved for institutional investors where dividends will be distributed and whose reference currency is USDor EUR:
Class F reserved for retail investors and whose reference currency is SGD:
Class FD reserved for retail investors and where dividends will be distributed and whose reference currency is SGD:Asian Property Securities
Class J reserved for Japan mutual fund or investment trust that are categorized as fund of funds whose referencecurrency is USD or EUR:
Asian EquityAsian Infrastructure EquityChina EquityIndia EquityIndonesia Equity
Malaysia EquityPhilippines EquityThailand EquityVietnam Equity
Asian BondAsian EquityAsian Infrastructure EquityAsian Local BondAsian Property SecuritiesGlobal TechnologyGreater China Equity
North American ValuePan EuropeanUS BondUS High Investment Grade Bond (reactivated February 2, 2009)US High Yield BondUS Investment Grade Bond (reactivated February 2, 2009)World Value Equity
Asia Pacific EquityAsian BondAsian Local BondEmerging Europe, Middle East and Africa Dynamic(launched November 2, 2009)Japan Equity
Japan Smaller CompaniesLatin American EquityUS BondUS High Investment Grade BondUS High Yield BondUS Investment Grade Bond
Asia Pacific EquityAsian BondAsian DynamicAsian EquityAsian Equity IncomeAsian Local BondAsian Property SecuritiesChina EquityDragon PeacockEuropean Investment Grade BondGlobal Market NavigatorHong Kong EquityIndia EquityIndonesia Equity
Japan DynamicJapan EquityKorea EquityNorth AmericaNorth American ValuePan EuropeanTaiwan EquityThailand EquityUS BondUS Corporate BondUS High Investment Grade BondUS High Yield BondUS Investment Grade BondWorld Value Equity

194
INTERNATIONAL OPPORTUNITIES FUNDS
Notes to the Financial Statements as at December 31, 2009 (continued)
2. Summary of Significant Accounting PoliciesThe financial statements have been prepared in accordance with the format and regulations prescribed by theLuxembourg authorities for Luxembourg investment companies and the following significant accounting policies:
(a) Valuation of Investments and Other Assets
• the value of any cash on hand or on deposit, bills and demand notes and accounts receivables prepaidexpenses, cash and interest declared or accrued as aforesaid and not yet received shall be deemed to be thefull amount thereof, unless in any case the same is unlikely to be paid or received in full, in which case thevalue thereof shall be arrived at after making such discount as the Directors may consider appropriate in suchcase to reflect the true value thereof;
• the value of securities which are quoted or dealt in on any Stock Exchange shall be in respect of eachsecurity, the last known price, and where appropriate, the middle market price on the stock exchange which isnormally the principal market for such security;
• securities dealt in on another Regulated Market are valued in a manner as near as possible to that describedin the preceding paragraph;
• in the event that any of the securities held in any portfolio on the relevant Valuation Day are not quoted ordealt in on a Stock Exchange or another Regulated Market or, for any of the securities, no price quotation isavailable, or if the price as determined pursuant to sub-paragraphs (2) and/or (3) is not in the opinion of theDirectors representative of the fair market value of the relevant securities, the value of such securities will bedetermined based on the reasonably foreseeable sales price determined prudently and in good faith;
• all other assets will be valued at their respective fair values as determined in good faith by the Directors inaccordance with generally accepted valuation principles and procedures.
Valuation of Corporate Bonds and Securitisations
Corporate bonds and securitised assets are valued based on either indicative prices communicated by brokers orcalculated prices from sources such as FT Interactive Data or Valuelink. Given the lack of liquidity inherent insome of these products, there is no guarantee that the SICAV would be able to sell these products at such aprice; the Directors nevertheless believe that such quotes and prices correspond to the market practice valuationof these securities.
(b) Income from Investments
The SICAV takes credit for income from its investments on the following basis:
• on fixed deposits, and bonds on a time apportionment basis;
• on other stocks on the basis of dividends declared.
(c) Forward Foreign Exchange Contracts and Futures Contracts
During the year, the SICAV has entered into a number of forward foreign exchange and futures contracts. Openforward foreign exchange and futures contracts are valued at the cost to close the contracts on the accountingdate. Surpluses/deficits arising from these and closed unsettled contracts are taken to unrealised gain/loss and areincluded under assets or liabilities (as appropriate) in the Combined Statement of Net Assets on pages 56 to 61.
(d) Conversion of Foreign Currencies
The value of the assets denominated in a currency other than the Reference Currency of the relevant Class ofany Sub-Fund will be translated at the rates of exchange prevailing in Luxembourg at the time of thedetermination of the corresponding Net Asset Value on December 31, 2009.
(e) Total Combined Figures
The combined figures of the SICAV are expressed in USD and are equal to the sum of the net assets of thevarious activated Sub-Funds translated into USD (where required) at the rates of exchange prevailing inLuxembourg at the Sub-Fund’s relevant valuation slot:
1 USD = 0.6960 Euro (December 31, 2009)
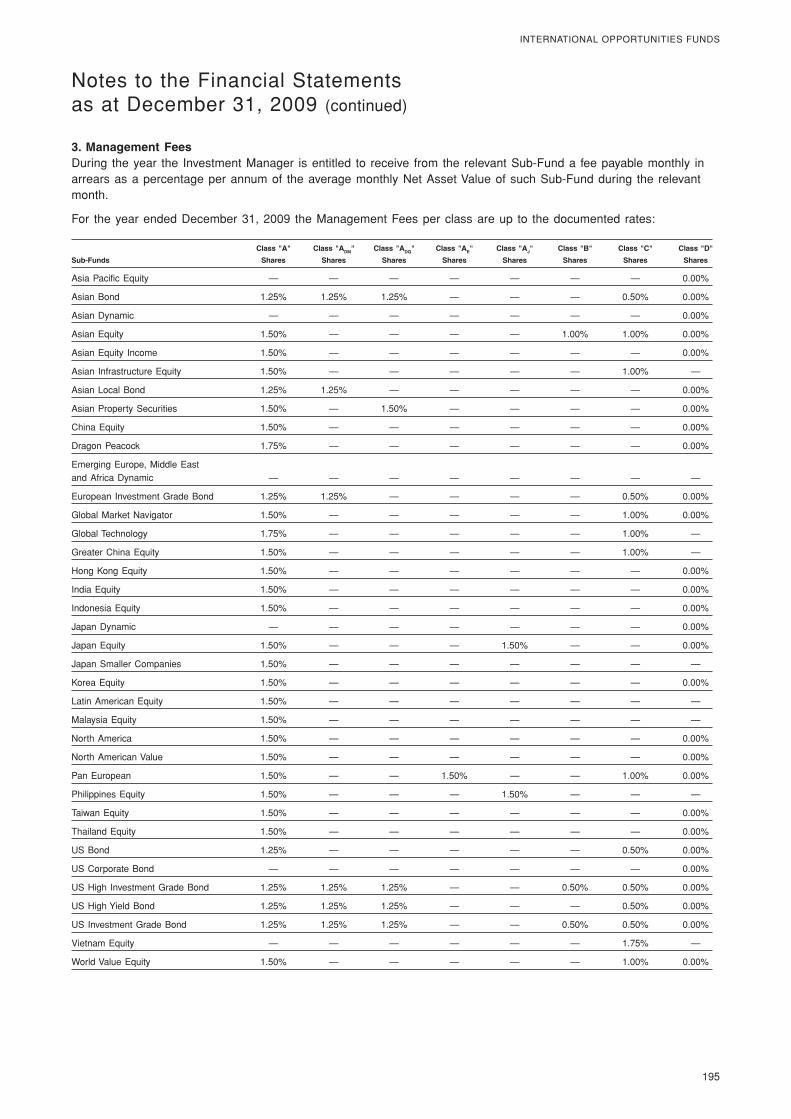
195
INTERNATIONAL OPPORTUNITIES FUNDS
Notes to the Financial Statements as at December 31, 2009 (continued)
3. Management FeesDuring the year the Investment Manager is entitled to receive from the relevant Sub-Fund a fee payable monthly inarrears as a percentage per annum of the average monthly Net Asset Value of such Sub-Fund during the relevantmonth.
For the year ended December 31, 2009 the Management Fees per class are up to the documented rates:
Class "A" Class "ADM" Class "ADQ" Class "AE" Class "AJ" Class "B" Class "C" Class "D"
Sub-Funds Shares Shares Shares Shares Shares Shares Shares Shares
Asia Pacific Equity — — — — — — — 0.00%
Asian Bond 1.25% 1.25% 1.25% — — — 0.50% 0.00%
Asian Dynamic — — — — — — — 0.00%
Asian Equity 1.50% — — — — 1.00% 1.00% 0.00%
Asian Equity Income 1.50% — — — — — — 0.00%
Asian Infrastructure Equity 1.50% — — — — — 1.00% —
Asian Local Bond 1.25% 1.25% — — — — — 0.00%
Asian Property Securities 1.50% — 1.50% — — — — 0.00%
China Equity 1.50% — — — — — — 0.00%
Dragon Peacock 1.75% — — — — — — 0.00%
Emerging Europe, Middle East and Africa Dynamic — — — — — — — —
European Investment Grade Bond 1.25% 1.25% — — — — 0.50% 0.00%
Global Market Navigator 1.50% — — — — — 1.00% 0.00%
Global Technology 1.75% — — — — — 1.00% —
Greater China Equity 1.50% — — — — — 1.00% —
Hong Kong Equity 1.50% — — — — — — 0.00%
India Equity 1.50% — — — — — — 0.00%
Indonesia Equity 1.50% — — — — — — 0.00%
Japan Dynamic — — — — — — — 0.00%
Japan Equity 1.50% — — — 1.50% — — 0.00%
Japan Smaller Companies 1.50% — — — — — — —
Korea Equity 1.50% — — — — — — 0.00%
Latin American Equity 1.50% — — — — — — —
Malaysia Equity 1.50% — — — — — — —
North America 1.50% — — — — — — 0.00%
North American Value 1.50% — — — — — — 0.00%
Pan European 1.50% — — 1.50% — — 1.00% 0.00%
Philippines Equity 1.50% — — — 1.50% — — —
Taiwan Equity 1.50% — — — — — — 0.00%
Thailand Equity 1.50% — — — — — — 0.00%
US Bond 1.25% — — — — — 0.50% 0.00%
US Corporate Bond — — — — — — — 0.00%
US High Investment Grade Bond 1.25% 1.25% 1.25% — — 0.50% 0.50% 0.00%
US High Yield Bond 1.25% 1.25% 1.25% — — — 0.50% 0.00%
US Investment Grade Bond 1.25% 1.25% 1.25% — — 0.50% 0.50% 0.00%
Vietnam Equity — — — — — — 1.75% —
World Value Equity 1.50% — — — — — 1.00% 0.00%
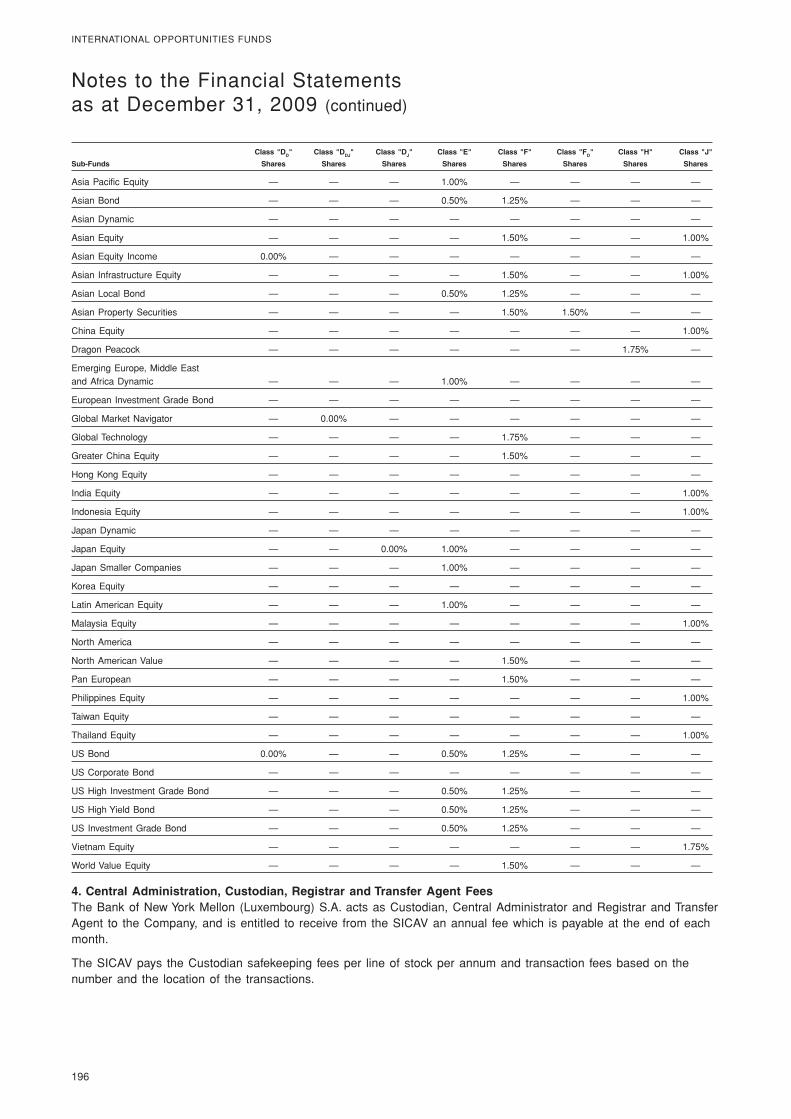
196
INTERNATIONAL OPPORTUNITIES FUNDS
Notes to the Financial Statements as at December 31, 2009 (continued)
Class "DD" Class "DDJ" Class "DJ" Class "E" Class "F" Class "FD" Class "H" Class "J"
Sub-Funds Shares Shares Shares Shares Shares Shares Shares Shares
Asia Pacific Equity — — — 1.00% — — — —
Asian Bond — — — 0.50% 1.25% — — —
Asian Dynamic — — — — — — — —
Asian Equity — — — — 1.50% — — 1.00%
Asian Equity Income 0.00% — — — — — — —
Asian Infrastructure Equity — — — — 1.50% — — 1.00%
Asian Local Bond — — — 0.50% 1.25% — — —
Asian Property Securities — — — — 1.50% 1.50% — —
China Equity — — — — — — — 1.00%
Dragon Peacock — — — — — — 1.75% —
Emerging Europe, Middle East and Africa Dynamic — — — 1.00% — — — —
European Investment Grade Bond — — — — — — — —
Global Market Navigator — 0.00% — — — — — —
Global Technology — — — — 1.75% — — —
Greater China Equity — — — — 1.50% — — —
Hong Kong Equity — — — — — — — —
India Equity — — — — — — — 1.00%
Indonesia Equity — — — — — — — 1.00%
Japan Dynamic — — — — — — — —
Japan Equity — — 0.00% 1.00% — — — —
Japan Smaller Companies — — — 1.00% — — — —
Korea Equity — — — — — — — —
Latin American Equity — — — 1.00% — — — —
Malaysia Equity — — — — — — — 1.00%
North America — — — — — — — —
North American Value — — — — 1.50% — — —
Pan European — — — — 1.50% — — —
Philippines Equity — — — — — — — 1.00%
Taiwan Equity — — — — — — — —
Thailand Equity — — — — — — — 1.00%
US Bond 0.00% — — 0.50% 1.25% — — —
US Corporate Bond — — — — — — — —
US High Investment Grade Bond — — — 0.50% 1.25% — — —
US High Yield Bond — — — 0.50% 1.25% — — —
US Investment Grade Bond — — — 0.50% 1.25% — — —
Vietnam Equity — — — — — — — 1.75%
World Value Equity — — — — 1.50% — — —
4. Central Administration, Custodian, Registrar and Transfer Agent FeesThe Bank of New York Mellon (Luxembourg) S.A. acts as Custodian, Central Administrator and Registrar and TransferAgent to the Company, and is entitled to receive from the SICAV an annual fee which is payable at the end of eachmonth.
The SICAV pays the Custodian safekeeping fees per line of stock per annum and transaction fees based on thenumber and the location of the transactions.

197
INTERNATIONAL OPPORTUNITIES FUNDS
Notes to the Financial Statements as at December 31, 2009 (continued)
5. Tax StatusThe SICAV is registered under Luxembourg law as an investment company. Accordingly, no Luxembourg income orcapital gains tax is at present payable by the Company. However, it is subject to an annual “taxe d’abonnement”calculated at an annual rate of 0.05% of the net assets relative to the Class A, Class ADH, Class ADM, Class ADQ,Class AE, Class AJ, Class F, Class FD, Class H and Class N Shares, such tax being payable quarterly and calculatedon the basis of the net assets of all Sub-Funds at the end of the relevant quarter. This tax is reduced to 0.01% perannum of the net assets relative to the Class B, Class C, Class CD, Class CJ, Class D, Class DD, Class DDJ, Class DJ,Class E, Class EJ, Class J and Class JD Shares.
6. Audit Fees, Printing, Publication Expenses and Other ChargesThe SICAV bears all its operating expenses, including without limitation the costs of buying and selling securities,governmental charges, legal and auditing fees, interest, printing, reporting and publication expenses, paying agencyfees, postage and telephone.
Any charges and costs attributable to a specific Sub-Fund will be allocated directly to that Sub-Fund.
Any charges and costs that cannot be directly attributable to a specific Sub-Fund will be allocated equally to thevarious Sub-Funds or, if the amounts so require, they will be allocated to the Sub-Funds in proportion to theirrespective net assets.
7. Registration and Distribution of Sub-FundsCertain Sub-Funds have been registered for sale in Singapore, Korea, Hong Kong, Macau and Taiwan:
(*) The Sub-Funds were de-registered in 2009 and are not authorised for sale in Hong Kong and Macau as of December 31, 2009.
Singapore Korea Hong Kong & Macau Taiwan
Asian Bond
Asian Equity
Asian Property Securities
Global Market Navigator
Global Technology
Greater China Equity
Pan European
US High Investment Grade Bond
US High Yield Bond
US Investment Grade Bond
World Value Equity
Asian Bond
Asian Equity
Greater China Equity
US High Yield Bond
US Investment Grade Bond
World Value Equity
Asian Bond
Asian Equity
Asian Equity Income
Asian Infrastructure Equity
Asian Local Bond
Asian Property Securities
China Equity
Dragon Peacock
European Investment Grade Bond
Global Market Navigator
Global Technology
Greater China Equity
Hong Kong Equity
India Equity
Indonesia Equity
Japan Equity
Korea Equity (*)
Malaysia Equity
North America
Pan European
Philippines Equity
Taiwan Equity
Thailand Equity
US High Investment Grade Bond
US High Yield Bond
US Investment Grade Bond
Vietnam Equity (*)
World Value Equity
Asian Bond
Asian Local Bond
China Equity
European Investment Grade Bond
Global Technology
Greater China Equity
Hong Kong Equity
Indonesia Equity
Pan European
Thailand Equity
US Bond
US High Investment Grade Bond
US High Yield Bond
US Investment Grade Bond
World Value Equity

198
INTERNATIONAL OPPORTUNITIES FUNDS
Notes to the Financial Statements as at December 31, 2009 (continued)
8. Forward Foreign Exchange ContractsAs at December 31, 2009, the SICAV has the following open forward foreign exchange contracts:
Unrealisedgain/(loss)
Currency Purchased Currency Sales Value Date USD
Asian Bond
USD 3,233,202 MYR 11,000,000 15/3/2010 29,832
Total unrealised gain 29,832
Asian Local Bond
KRW 3,227,400,000 USD 2,750,000 8/1/2010 21,201 KRW 3,393,580,000 USD 2,900,000 19/1/2010 12,880 KRW 1,155,300,000 USD 1,000,000 8/3/2010 (9,828)KRW 1,772,850,000 USD 1,500,000 21/6/2010 11,625 KRW 1,194,500,000 USD 1,000,000 24/6/2010 18,349 IDR 9,900,000,000 USD 1,000,000 30/4/2010 28,123 IDR 9,750,000,000 USD 1,000,000 26/5/2010 6,823 IDR 9,790,000,000 USD 1,000,000 24/5/2010 11,392 MYR 8,475,000 USD 2,500,000 19/1/2010 (26,450)MYR 16,104,725 USD 4,747,855 3/6/2010 (72,515)MYR 5,114,250 USD 1,500,000 16/3/2010 (10,716)USD 2,764,181 PHP 128,645,000 7/1/2010 (17,522)PHP 257,537,500 USD 5,500,000 7/1/2010 68,758 PHP 54,090,800 USD 1,160,000 15/1/2010 8,474 PHP 48,900,000 USD 1,026,448 25/5/2010 14,111 PHP 47,460,000 USD 1,000,000 21/6/2010 7,019 USD 2,923,609 THB 96,961,500 8/1/2010 15,375 USD 2,877,520 THB 95,620,000 11/1/2010 9,544 THB 96,961,500 USD 2,908,918 8/1/2010 (683)THB 95,620,000 USD 2,866,307 11/1/2010 1,670 USD 1,001,559 TWD 32,130,000 8/2/2010 (16,102)TWD 100,154,250 USD 3,150,000 19/1/2010 616 TWD 32,130,000 USD 997,392 8/2/2010 20,268 TWD 57,510,000 USD 1,785,193 9/2/2010 36,594 TWD 162,700,000 USD 5,109,122 10/3/2010 66,929 SGD 5,266,313 USD 3,770,000 19/1/2010 (15,194)SGD 4,893,525 USD 3,500,000 3/5/2010 (14,187)SGD 1,799,850 USD 1,300,000 8/6/2010 (18,239)SGD 1,389,450 USD 1,000,000 9/3/2010 (9,939)
Total unrealised gain 148,376
The net unrealised gains attributed to these transactions are included in the Combined Statement of Net Assets.

199
INTERNATIONAL OPPORTUNITIES FUNDS
Notes to the Financial Statements as at December 31, 2009 (continued)
9. Open Futures ContractsAs at December 31, 2009, the SICAV has the following open futures contracts:
UnrealisedNumber of Expiration Commitments Gain/(Loss)Contracts Contract/Description Date USD USD
Global Market Navigator
160 ISE 30 February 2010 728,468 24,9829 US Long Bond (CBT) March 2010 1,035,000 (53,578)
1,763,468 (28,596)
US Bond
(185) US 10-Year Note March 2010 (21,318,359) 593,992
(21,318,359) 593,992
US Corporate Bond
(222) US 10-Year Note March 2010 (25,582,031) 668,563
(25,582,031) 668,563
US High Investment Grade Bond
(8) US 10-Year Note March 2010 (921,875) 19,875
(921,875) 19,875
US Investment Grade Bond
(63) US 10-Year Note March 2010 (7,259,766) 206,313
(7,259,766) 206,313
The net unrealised gains/(losses) attributed to these transactions are included in the Combined Statement of NetAssets.

200
INTERNATIONAL OPPORTUNITIES FUNDS
Notes to the Financial Statements as at December 31, 2009 (continued)
10. Securities LendingThe SICAV has entered into securities lending transactions for a number of Sub-Funds within a standardised lendingsystem organised by recognised securities clearing institutions. All securities lent are fully collateralised. The grossrevenue earned from securities lending is split between the SICAV (50%), Prudential Asset Management (Singapore)Limited (30%) and The Bank of New York Mellon (Luxembourg) S.A (20%), and shown in the specific fund’sStatement of Operations and Changes in Net Assets on pages 62 to 67. As at 31 December 2009 the total marketvalue of securities on loan is USD 43,134,078.
As at December 31, 2009, the SICAV has participated in securities lending transactions as follows:
Shares on Number of Market Shares on Loan
Shares Value Description Broker Loan Market Value Collateral
Asian Equity15,593,000 11,381,883 China Shanshui Cement Group Ltd Credit Suisse Securities (Europe) Limited 3,040,690 2,219,153 2,432,552 13,845,600 11,142,032 China Zhongwang Holdings Ltd Citigroup Global Markets Inc. 727,600 585,431 618,460
Goldman, Sachs & Company 6,566,000 5,283,042 5,581,100 Merrill Lynch, Pierce, Fenner & Smith, Inc. 1,100,000 885,066 935,000
1,207,558 12,341,243 Shanda Games Ltd – ADR Goldman, Sachs & Company 317,957 3,274,957 3,370,344 241,800 13,896,246 Sohu.com, Inc. Credit Suisse Securities (USA) LLC 29,236 1,681,362 1,717,615
6,222,000 9,628,244 Yanlord Land Group Ltd Citigroup Global Markets Inc. 2,500,000 3,860,935 4,125,000 Merrill Lynch, Pierce, Fenner & Smith, Inc. 1,000,000 1,544,374 1,650,000
19,334,320 20,430,071
Dragon Peacock3,232,000 5,343,519 AAC Acoustic Technologies Holdings, Inc. Citigroup Global Markets Inc. 1,475,600 2,439,244 2,582,300
764,900 6,752,213 Byd Co., Ltd "H" Goldman, Sachs & Company 588,000 5,189,785 5,468,400 976,000 2,220,324 China Resources Land Ltd Nomura Securities International, Inc. 150,000 341,184 360,000
5,214,400 4,196,207 China Zhongwang Holdings Ltd Citigroup Global Markets Inc. 1,079,600 868,653 917,660 Goldman, Sachs & Company 1,873,400 1,507,349 1,592,390 Merrill Lynch, Pierce, Fenner & Smith, Inc. 900,000 724,145 765,000
3,369,000 2,354,878 Fosun International JP Morgan Securities, Ltd. 800,000 559,098 600,000 11,796,460 4,290,114 GOME Electrical Appliances Holdings Ltd Goldman, Sachs & Company 8,000,000 2,908,960 3,200,000
872,500 3,319,369 Li Ning Co., Ltd Goldman, Sachs & Company 436,000 1,658,468 1,744,000
16,196,886 17,229,750
Greater China Equity969,000 707,307 China Shanshui Cement Group Ltd Credit Suisse Securities (Europe) Limited 959,310 700,123 767,448
2,002,000 722,920 China Shipping Container Lines Co., Ltd "H" Citigroup Global Markets Inc. 1,000,000 361,041 400,000 1,291,200 1,039,073 China Zhongwang Holdings Ltd Citigroup Global Markets Inc. 692,800 557,431 588,880
289,500 1,101,384 Li Ning Co., Ltd Goldman, Sachs & Company 107,000 407,009 428,000
2,025,604 2,184,328
Japan Equity582,000 1,781,985 Hitachi Ltd Nomura International PLC 580,000 1,777,298 1,827,000 42,300 855,987 Kose Corp. Citigroup Global Markets Inc. 21,000 425,302 447,300
833,000 2,927,691 Mitsubishi Heavy Industries Ltd Goldman, Sachs & Company 100,000 351,748 375,000 145,900 1,834,072 Yamaha Motor Co., Ltd Nomura International PLC 74,400 936,020 1,026,720
3,490,368 3,676,020
North Amercia164,000 4,183,640 Royal Caribbean Cruises Ltd BMO Capital Markets Corp 300 7,635 7,800
Pershing LLC 81,700 2,079,265 2,124,200
2,086,900 2,132,000
Total 43,134,078 45,652,169
As part of the securities lending program, the SICAV has authorised The Bank of New York Mellon to invest cashcollateral into Reverse Repurchase Agreements.

201
INTERNATIONAL OPPORTUNITIES FUNDS
Notes to the Financial Statements as at December 31, 2009 (continued)
Market value of the Reverse Repurchase Agreements as at December 31, 2009:
Principal Purchase MaturityCurrency Issuer Name Amount Yield Date Date
Asian EquityUSD Deutsche Bank AG 20,430,000 0.01 31/12/2009 4/1/2010
Dragon PeacockUSD Bank of America LLC 3,000,000 0.01 31/12/2009 4/1/2010USD Barclays Capital, Inc. 3,000,000 0.00 31/12/2009 4/1/2010USD Deutsche Bank AG 2,230,000 0.01 31/12/2009 4/1/2010USD BNP Paribas 3,000,000 0.01 31/12/2009 4/1/2010USD Morgan Stanley 3,000,000 0.01 31/12/2009 4/1/2010USD RBS Securities, Inc. 3,000,000 0.02 31/12/2009 4/1/2010
Greater ChinaUSD Deutsche Bank AG 2,184,000 0.01 31/12/2009 4/1/2010
Japan EquityUSD BNP Paribas 3,676,000 0.01 31/12/2009 4/1/2010
North AmericaUSD Bank of America LLC 1,887,000 0.01 31/12/2009 4/1/2010USD Goldman Sachs & Co. 245,000 0.01 31/12/2009 4/1/2010
11. Soft CommissionThe Investment Manager and, where applicable, the Investment Sub-Managers of any Sub-Fund (together, the"Relevant Parties”) may be entitled to receive and/or enter into soft-dollar commissions/arrangements in respect ofthe Company or the Sub-Funds (as the case may be). The Relevant Parties will comply with applicable regulatoryand industry standards on soft-dollars. The soft-dollar commissions/arrangements shall include specific advice as tothe advisability of dealing in, or as to the value of any investments, research and advisory services, economic andpolitical analyses, portfolio analyses including valuation and performance measurements, market analyses data andquotation services, computer hardware and software or any other information facilities to the extent that they areused to support the investment decision making process, the giving of advice, the conduct of research or analysis,or analysis of trade execution, and custodial service in relation to the investments managed for clients.
Soft-dollar commissions/arrangements shall not include travel, accommodation, entertainment, general administrativegoods and services, general office equipment or premises, membership fees, employees’ salaries or direct moneypayment.
Based on the available soft-dollar commission levels available at each broker, the Relevant Parties will instruct thebrokers to pay the vendors the permitted softable costs, based on the percentage of trades attributable to the Company.
12. Transactions with Connected PersonsCertain Directors of the Company are or may also be officers and/or directors of one or more of the InvestmentManager or the Investment Sub-Managers of the Company.
The Management Fees that are paid by the Company to the Investment Managers are detailed in note 3 to thefinancial statements.
No transactions of the Company were effected through a broker who is a connected person of the Company,the Investment Manager or the Directors of the Company.
All transactions with connected parties were entered into in the ordinary course of business and under normalcommercial terms.