Audit & Risk Committee 23 November 2021 - Gisborne District ...
144
Audit & Risk Committee 23 November 2021 1 of 144 AGENDA P O Box 747, Gisborne, Ph 06 867 2049 Fax 06 867 8076 Email [email protected] Web www.gdc.govt.nz MEMBERSHIP: Bruce Robertson (Independent Chair), Andy Cranston, Larry Foster, Pat Seymour, Terry Sheldrake, Rehette Stoltz (Mayor) and Josh Wharehinga AUDIT & RISK Committee DATE: Tuesday 23 November 2021 TIME: 10:00AM AT: Te Ruma Kaunihera (Council Chambers), Awarua, Fitzherbert Street, Gisborne AGENDA – OPEN SECTION 1. Apologies .........................................................................................................................................4 2. Declarations of Interest ...................................................................................................................4 3. Confirmation of non-confidential Minutes ...................................................................................5 3.1. Confirmation of non-confidential Minutes 22 September 2021 .......................................5 3.2. Action Sheet .........................................................................................................................11 3.3. Governance Work Plan ......................................................................................................12 4. Leave of Absence .........................................................................................................................12 5. Acknowledgements and Tributes................................................................................................12 6. Public Input and Petitions .............................................................................................................12 7. Extraordinary Business ...................................................................................................................12 8. Notices of Motion ..........................................................................................................................12 9. Adjourned Business ........................................................................................................................12 10. Reports of the Chief Executive and Staff for DECISION ............................................................13 10.1. 21-224 Woody Beach Debris Across Tairawhiti - Addressing the Short-Term Problem and Establishing a Long Term Council Position ................................................................13
-
Upload
khangminh22 -
Category
Documents
-
view
0 -
download
0
Transcript of Audit & Risk Committee 23 November 2021 - Gisborne District ...

Audit & Risk Committee 23 November 2021 1 of 144
AGENDAP O Box 747, Gisborne, Ph 06 867 2049 Fax 06 867 8076
Email [email protected] Web www.gdc.govt.nz
MEMBERSHIP: Bruce Robertson (Independent Chair), Andy Cranston, Larry Foster, Pat Seymour, Terry Sheldrake, Rehette Stoltz (Mayor) and Josh Wharehinga
AUDIT & RISK Committee DATE: Tuesday 23 November 2021
TIME: 10:00AM
AT: Te Ruma Kaunihera (Council Chambers), Awarua, Fitzherbert Street, Gisborne
AGENDA – OPEN SECTION
1. Apologies .........................................................................................................................................4
2. Declarations of Interest...................................................................................................................4
3. Confirmation of non-confidential Minutes ...................................................................................5
3.1. Confirmation of non-confidential Minutes 22 September 2021 .......................................5
3.2. Action Sheet.........................................................................................................................11
3.3. Governance Work Plan ......................................................................................................12
4. Leave of Absence.........................................................................................................................12
5. Acknowledgements and Tributes................................................................................................12
6. Public Input and Petitions .............................................................................................................12
7. Extraordinary Business ...................................................................................................................12
8. Notices of Motion ..........................................................................................................................12
9. Adjourned Business........................................................................................................................12
10. Reports of the Chief Executive and Staff for DECISION ............................................................13
10.1. 21-224 Woody Beach Debris Across Tairawhiti - Addressing the Short-Term Problem
and Establishing a Long Term Council Position ................................................................13

Audit & Risk Committee 23 November 2021 2 of 144
11. Reports of the Chief Executive and Staff for INFORMATION ....................................................37
11.1. 21-257 Health and Safety Update.....................................................................................37
11.2. 21-177 Internal Audit Update February - November 2021..............................................48
11.3. 21-263 Council Strategic Risk Management Report .......................................................56
11.4. 21-265 Compliance Monitoring and Enforcement Metrics 2020/2021 .........................68
12. Public Excluded Business ............................................................................................................144

Audit & Risk Committee 23 November 2021 3 of 144
Governance StructureDelegations to Committees
Audit and RiskReports to: Council
Chairperson: Independent Chairperson
Membership: Mayor Stoltz, Deputy Mayor Wharehinga, Chairs
Quorum: Half of the members when the number is even and a majority when the membership is uneven.
Meeting frequency: Quarterly (or as required)
PurposeTo assist the Council to exercise due care, diligence and skill in relation to the oversight of:
the robustness of the internal control framework;
the integrity and appropriateness of external reporting, and accountability arrangements within the organisation for these functions;
the robustness of risk management systems, process and practices;
internal and external audit;
accounting practice and, where relevant, accounting policy;
compliance with applicable laws, regulations, standards and best practice guidelines for public entities; and
the establishment and maintenance of controls to safeguard the Council’s financial and non-financial assets.
The Audit and Risk Committee Chair is responsible for submitting an annual report to the Council covering the Committee’s operations and activities during the preceding year.
Terms of ReferenceInternal Control Framework
Consider the adequacy and effectiveness of internal controls and the internal control framework including overseeing privacy and cyber security.
Enquire as to the steps management has taken to embed a culture that is committed to probity and ethical behaviour.
Review the processes or systems in place to capture and effectively investigate fraud or material litigation, should it be required.
Seek confirmation annually, and as necessary, from internal and external auditors, attending Councillors, and management, regarding the completeness, quality and appropriateness of financial and operational information that is provided to the Council.

Audit & Risk Committee 23 November 2021 4 of 144
Risk Management Review and consider Management’s risk management framework in line with Council’s
risk appetite – which includes policies and procedures to effectively identify, treat and monitor significant risks, and regular reporting to the Council.
Assist the Council to determine its appetite for risk.
Review the principal risks that are determined by Council and Management, and consider whether appropriate action is being taken by Management to treat Council’s significant risks. Assess the effectiveness of, and monitor compliance with, the risk management framework. Consider emerging significant risks and report these to Council, where appropriate.
Internal Audit Review and recommend the annual internal audit plan; such plan to be based on the
Council’s risk framework.
Monitor performance against the plan at each regular quarterly meeting.
Monitor all internal audit reports and the adequacy of Management’s response to internal audit recommendations.
Monitor compliance with the Delegations Manual.
External Audit Annually review the independence and confirm the terms of the audit engagement
with the external auditor appointed by the Office of the Auditor General. This includes the adequacy of the nature and scope of the audit, and the timetable and fees.
Review all external audit reporting, discuss with the auditors and review action to be taken by management on significant issues and recommendations and report to Council as appropriate.
Compliance with Legislation, Standards and Best Practice Guidelines Review the effectiveness of the system for monitoring the Council’s compliance with
laws (including governance legislation, regulations and associated government policies), with Council’s own standards, and Best Practice Guidelines.
PowersThe Audit and Risk Committee, within the scope of its role and responsibilities, is authorised to:
obtain any information it needs from any employee and/or external party (subject to their legal obligation to protect information);
discuss any matters with the external auditor, or other external parties (subject to confidentiality considerations);
The Audit and Risk Committee has no executive powers and is directly responsible to Council.1. Apologies
2. Declarations of Interest

Audit & Risk Committee 23 November 2021 5 of 144
3. Confirmation of non-confidential Minutes
3.1. Confirmation of non-confidential Minutes 22 September 2021
MINUTESDraft & Unconfirmed
P O Box 747, Gisborne, Ph 867 2049 Fax 867 8076Email [email protected] Web www.gdc.govt.nz
MEMBERSHIP: Bruce Robertson (Independent Chair), Andy Cranston, Larry Foster, Pat Seymour, Terry Sheldrake, Rehette Stoltz (Mayor) and Josh Wharehinga
MINUTES of the AUDIT & RISK CommitteeHeld in Te Ruma Kaunihera (Council Chambers), Awarua, Fitzherbert Street, Gisborne on Wednesday 22 September 2021 at 10:00AM.
PRESENT:
Independent Chair Bruce Robertson, Bill Burdett, Andy Cranston, Larry Foster, Pat Seymour, Terry Sheldrake Kerry Worsnop, Josh Wharehinga, Kerry Worsnop and Mayor Rehette Stoltz,
IN ATTENDANCE:
Chief Executive Nedine Thatcher Swann, Director Lifelines David Wilson, Director Internal Partnerships James Baty, Director Liveable Communities Michelle Frey, Director Environmental Services & Protection Helen Montgomery, Chief Financial Officer Pauline Foreman, Chief of Strategy & Science Joanne Noble, Finance Manager Melanie Hartung, Health and Safety Manager David Wilkinson, Risk Partner Steve Breen, Democracy & Support Services Manager Heather Kohn and Committee Secretary Coral Dunn.
Secretarial Note: Michelle Frey and Helen Montgomery attended by audio visual.
Secretarial Note: Items were heard out of order described in the agenda. For ease of reference they have been recorded in agenda order.
1. ApologiesThere were no apologies.
2. Declarations of InterestThere were no interests declared.

Audit & Risk Committee 23 November 2021 6 of 144
3. Confirmation of non-confidential Minutes
3.1 Confirmation of non-confidential Minutes 23 June 2021
The two questions raised by Cr Seymour concerning the timeframe for the staff Wellbeing Survey and response from Waka Kotahi about late information would be addressed in Items 11.2 and 12.3.
MOVED by Cr Seymour, seconded by Cr Stoltz
That the Minutes of 23 June 2021 be accepted. CARRIED
3.2 Governance Work PlanNoted.
4. Leave of AbsenceThere were no leaves of absence.
5. Acknowledgements and TributesThere were no acknowledgements or tributes.
6. Public Input and PetitionsThere were no public input or petitions.
7. Extraordinary BusinessThere was no extraordinary business.
8. Notices of MotionThere were no notices of motion.
9. Adjourned BusinessThere was no adjourned business.
10. Reports of the Chief Executive and Staff for DECISION
10.1 21-83 Update to Credit Card Policy
Response to questions:
It was agreed that the scope of the Credit Card Procedural Guidelines (page 20 under Credit Card 1) be amended as follows:
"It may be only used for accommodation, dining in relation to travel or entertainment and civic duties."
MOVED by Cr Seymour, seconded by Cr Wharehinga
That the Audit & Risk Committee:
1. Recommends that Council:
a. Approves the revised Credit Card Policy.
CARRIED

Audit & Risk Committee 23 November 2021 7 of 144
10.2 21-137 Draft Insurance Strategy & Wreck Removal Cover
Presentation by Matt Bilderbeck and Matthew Wilson from Aon who attended by audio visual link.
Response to questions:
Under the Maritime Transport Act the distinction between Council's responsibility and that of the Port regarding wreck removal was murky.
The vessel owner had first responsibility for wreck removal but if the owner did not have adequate insurance this responsibility fell to Councils.
The Port would probably have some responsibility in an incident resulting from maintenance negligence regarding damaged navigation aids.
There was opportunity under the Maritime Transport Act for responsibility to be contracted out to other parties.
The loss modelling approach identified three different versions of the three scenarios, however, there would need to be more investigation of Council's relationship with the Port and whether the Port had assumed any of those responsibilities.
While scenario modelling provided a face value of the extent of potential exposure, contractual amendments might potentially change Council's position in relation to these exposures.
It was prudent to accept the view that Council was the last organisation standing as councils tended to end up as last man standing.
Council's ocean boundary was 12 nautical miles.
The assumption was made that Council's insurance covered its responsibility.
If an incident was a Council fault it was Council's responsibility and if an incident resulted from a Port function the Port would be responsible.
The Committee agreed the recommendations be amended by adding "c" as outlined below.
MOVED by Cr Seymour, seconded by Cr Sheldrake
That the Audit & Risk Committee:
1. Recommends that Council:
a. Approves the Draft Insurance Strategy.
b. Approves to increase the Wreck Removal Liability Policy to $10 million, and thereafter to increase liability cover in line with shipping volumes in Gisborne’s navigable coastal waters.
c. Requests a further update on the relationship between the Port and Gisborne District Council with respect to insurance and risk responsibilities.
CARRIED
Audit & Risk Committee 23 November 2021 8 of 144
11. Reports of the Chief Executive and Staff for INFORMATION
11.1 21-82 Data Analytics 2019/20
Response to questions:
New employees’ reference and police checks were completed prior to employment, and best practice procedures checks were ongoing following their employment.
Testing included source documentation for each transaction ie. invoices, legitimacy of signed bank slips, and that changes of bank details made to correct account and were entered by a different person, etc.
MOVED by Cr Stoltz, seconded by Cr Foster
That the Audit & Risk Committee:
1. Notes the contents of this report.
CARRIED
11.2 21-193 Ernst & Young Closing Report for the Year Ended 30 June 2021
David Borrie and Loren Hunt of Ernst & Young attended by audio visual link.
Response to questions:
A number of stakeholders had raised the timing Waka Kotahi's decisions with them however as yet Waka Kotahi had not given a firm undertaking to anyone.
Estimated the Three Waters reimbursement to Council would be $41m as at 30 June 2024.
The bar graph at the bottom of page nine showed individual measures in each group eg. the two measures in Emergency Management had been achieved.
The non-financial measures essentially described levels of services provided.
Environmental Health had not delivered their four levels of service.
There was a two-part approach to the audit of the non-financial measure. The first being a sample basis of the correct calculation of the results and the second being that an explanation provided context for the result.
The auditors were happy to answer any further questions either by email or attending Council meeting on 30 September 2021.
David Borrie and his team were thanked for their excellent service, and he was wished well in his new role as Audit Partner at Wairoa.
MOVED by Cr Stoltz, seconded by Cr Seymour
That the Audit & Risk Committee:
1. Notes the contents of this report.
CARRIED

Audit & Risk Committee 23 November 2021 9 of 144
11.3 21-205 Health and Safety Update
Response to questions:
Staff and contractors were continually encouraged to report near misses, however, instances of non-report did occur eg. recent damage to a window screen.
Council had in place a robust reporting system, good induction, ongoing training and good Health and Safety (H&S) culture in the organisation resulted in few near misses.
Good input was received from managers and teams.
COVID-19 had had a detrimental effect on August reporting.
Consistent graph colours for near misses would be used in future reports.
The H&S report was high level and significant work had been done by the H&S team with contractors and staff to improve H&S across the organisation.
Regular meetings were held with key contractors who reported on near misses in high-risk activity areas.
The executive team received detailed reports which could be provided to this Committee going forward if that degree of comfort was needed.
It was confirmed that the complete Health & Safety report, considered by the Committee, would be provided to the whole Council.
The Chair advised reported near misses provided early information for preventative action.
MOVED by Cr Seymour, seconded by Cr Foster
That the Audit & Risk Committee:
1. Notes the contents of this report.
CARRIED
11.4 21-204 Council's Strategic Risk and Risk Appetite Progress Report
Response to questions:
The orange columns in the graph on page 166 identified additional actions being taken to return a residual risk to within Council's moderate risk appetite.
Next steps on page 164 should read "to be completed".
MOVED by Cr Stoltz, seconded by Chair Bruce Robertson.
That the Audit & Risk Committee:
1. Notes the contents of this report.
CARRIED

Audit & Risk Committee 23 November 2021 10 of 144
12. Public Excluded Business
Secretarial Note: These Minutes include a public excluded section. They have been separated for receipt in Section 14 Public Excluded Business of Council.
13. READMITTANCE OF THE PUBLICMOVED by Cr Stoltz, seconded by Cr Cranston
That the Council:
1. Re-admits the public.CARRIED
14. Close of MeetingThere being no further business, the meeting concluded at 2.24pm.
Bruce RobertsonINDEPENDENT CHAIR

Audit & Risk Committee 23 November 2021 11 of 144
3.2. Action Sheet
Meeting Date
Item No.
Item Status Action Required Assignee/s Action Taken Due Date
22/09/21 10.2 21-137 Draft
Insurance Strategy & Wreck Removal
Cover
In progress
Provide a further update to the Committee on the relationship between the Port and Gisborne District Council with respect to insurance and risk responsibilities.
Andrew Haughey
12/11/2021 Andrew Haughey
There will be an annual meeting with the Port Company to update shipping movements and any new risks. This will inform Council of the need for insurance cover. Updated shipping movements for the past year have already been supplied. In addition, there is a scheduled meeting with the Port Company to discuss and understand their risks and mitigation covers (eg insurance) that they have in place. This is to inform Council of exposure to any residual risks.
02/11/2021

Audit & Risk Committee 23 November 2021 12 of 144
3.3. Governance Work Plan
Audit & RiskJune – December 2021
Additional meetings or workshops may be scheduled to discuss Council’s position on a range of matters as and when required.
23 November 2021
DECISION Reports
- Woody Beach Debris Across Tairawhiti – Addressing the Short Term Problem and Establishing a Long Term Council Position
INFORMATION Reports
- Health and Safety Update
- Internal Audit Update February – November 2021
- Council Strategic Risk Management Report
- CME Metrics Report 2020-2021
PUBLIC EXCLUDED Reports
- Litigation Risk and Legal Issues
- Strategic Risk Deep Dive Background Report
4. Leave of Absence
5. Acknowledgements and Tributes
6. Public Input and Petitions
7. Extraordinary Business
8. Notices of Motion
9. Adjourned Business

Audit & Risk Committee 23 November 2021 13 of 144
10. Reports of the Chief Executive and Staff for DECISION10.1. 21-224 Woody Beach Debris Across Tairawhiti - Addressing the Short-Term Problem and Establishing a Long Term Council Position
21-224
Title: 21-224 Woody Beach Debris Across Tairawhiti - Addressing the Short-Term Problem and Establishing a Long Term Council Position
Section: Liveable Communities
Prepared by: Michele Frey - Director Liveable Communities
Meeting Date: Tuesday 23 November 2021
Legal: No Financial: Yes Significance: Low
Report to AUDIT & RISK Committee for decision
PURPOSE
The purpose of this report is to request approval to proceed with progressing a methodology to address the medium to long-term management of the woody debris on beaches issue.
SUMMARY
Woody debris on our beaches continues to accumulate, either through one-off storm events or incrementally over time as vegetation makes its way into our rivers and eventually onto the beach. No one owns this regional issue, and it isn’t going away.
This paper outlines:
1. The background context.
2. What is being done immediately to address the issue of woody debris on our beaches for this coming summer, and associated costs.
3. An emergency response plan for a future large-scale woody debris event.
4. A methodology to address the issue in the medium to long-term, forming a policy position on how Council will manage any future woody debris clean-up or beach grooming type activities across the region; considering the costs and effectiveness of approaches proposed. This will also provide clarity on who is responsible for what.
The decisions or matters in this report are considered to be of Low significance in accordance with the Council’s Significance and Engagement Policy.

Audit & Risk Committee 23 November 2021 14 of 144
RECOMMENDATIONS
That the Audit & Risk Committee:
1. Notes the short-term approach to dealing with woody debris this summer, and associated costs, noting these costs are unbudgeted.
2. Endorses the development of a formalised Woody Debris Emergency Response Plan (note this would be an annex to the overarching Flood Response Plan).
3. Approves proceeding with a methodology to address the medium to long-term woody debris issue.
Authorised by:
Michele Frey - Director Liveable Communities
Keywords: beach clean up, woody debris on beaches, Waikanae beach, midway beach, woody debris emergency response plan

Audit & Risk Committee 23 November 2021 15 of 144
BACKGROUND
Problem Definition
1. Woody debris on our beaches continues to accumulate, either through one-off storm events or incrementally over time as vegetation makes its way into our rivers, marine environment and eventually onto the beach.
2. Large amounts of woody debris on the beach are a Health and Safety and environmental risk issue and has an impact on the general amenity of the area. This is a regional issue.
3. While the issue of woody debris is best addressed at source, be it forestry or willow and poplar in riparian margins, once the woody debris has reached the coastline and marine environment, management is no longer the responsibility of the landowner, and thus has become Council's responsibility by default. Refer to the diagram below for a further description of this.
Diagram 1: outlining the various points at which Council and others play a role in reducing the escape of wood material that eventually lands on the beach.
4. Due to community concerns, Council and the forestry industry have taken on the role of beach clean-ups over time, but this has been reactive, and with no formal Council policy position established.
DISCUSSION and OPTIONS
Short-Term Context
5. Beach clean-ups for this summer: So far two clean ups have occurred; a clean-up of woody debris from Midway to the ‘Cut’ on Centennial Parade (the town beach), and north and south beaches in Tolaga Bay. These were undertaken in October 2021.
6. Unfortunately a further storm event occurred in November 2021 and Council staff are currently investigating the scale of clean up works required. It appears that the town beach is the only area requiring a second clean up.

Audit & Risk Committee 23 November 2021 16 of 144
7. The reason for the focus on these two areas is due to the comparatively high use of these areas being close to the City, the overall safety (ensuring woody material has limited remobilisation potential) and amenity expectations within these recreational areas.
8. Further, under the Uawa and Waipaoa Communities Recovery Plan, Council identified the restoration and protection of degraded waterways and the coastal marine area. There was a focus on avoiding future mobilisation of woody debris from forestry harvest sites into the receiving environment as key actions.
9. At Uawa there was also a community concern about the impact of woody debris on kaimoana, and the Cawthron Institute has initiated a study into this issue funded via the Envirolink programme. Uawanui will participate in this project.
Short-Term Approach for Town Beaches
10. The town beach clean-up commenced in October 2021 and was completed in time for Labour weekend, as has been standard annual practice. The clean-up was managed by contractor, Recreational Services. The material was removed off site and chipped elsewhere and will be used in a variety of ways. In the future it is anticipated there may be an opportunity for the community to access chip for gardens, weed suppression etc.
11. As mentioned above a further storm event occurred in November 2021 and Council staff are currently investigating the scale of works required to clean up the town beach. Further clean up works will be required.
Short-Term Approach for Tolaga Bay Beach
12. A meeting with the Uawa community representatives was held to confirm an approach for this summer. Woody debris has been relocated off the beach to the old rugby league field, and chipped. This chip will be made available to Uawanui Sustainability Group for community use as part of the restoration planting programme.
13. Only a limited amount of clean-up was required on the southern beach.
14. As mentioned above a further storm event occurred in November 2021. Council staff have investigated Tolaga Bay Beach and in consultation with community members, agree that no further clean up works are required.
15. No burning is proposed to be undertaken on the beach this season.
16. Woody debris is located on other beaches across Tairāwhiti and a long term policy position needs to be developed in collaboration with our Treaty partners and communities.
Emergency Response Plan
17. An informal Emergency Response Plan for woody debris migration has been used since 2018. At a high level this involves monitoring of potential adverse events and, as soon as safely practicable, undertaking beach assessments, with subsequent drone flights to document distribution and volumes. When there is a potential upstream issue, contact with the most at-risk people is made via text, Facebook Message, and email followed up by visits.

Audit & Risk Committee 23 November 2021 17 of 144
18. For larger events, a helicopter has been used and a detailed helicopter Health and Safety Plan has been prepared (this is now with Council’s Health and Safety Manager). There is a more comprehensive CDEM Severe Flooding Emergency Response Plan.
19. Due to the relatively informal nature of the response currently, we recommend the development of a more formal Woody Debris Emergency Response Plan (note this would be an annex to the overarching Flood Response Plan).
Medium to Long-Term Context and Approach
20. Council has no formal policy position on how Council will manage any future woody debris clean-up or beach grooming type activities across the region, considering the costs and effectiveness of any approaches proposed. The current approach is largely associated with keeping the community safe, as well as community amenity and is not consistently applied across the region. This is now required.
21. Given the location and nature of this issue, it is imperative that this project is facilitated in a manner consistent with Te Tiriti o Waitangi principles. Council must also ensure any additional legislative obligations are included in any planning or decision making. Principle 3 (Toitū te mana tangata) of the Ngā Rohe Moana o Ngā Hapū o Ngāti Porou Deed states “This deed contributes to the legal expression, protection and recognition of the right of ngā hapū o Ngāti Porou to exercise influence over persons carrying out activities within, or impacting upon, ngā rohe moana o ngā hapū o Ngāti Porou.”
22. While the deed is unique to a Ngāti Porou context, it is only logical, and best practice that the same approach be afforded to any affected coastal hapū and iwi in the region. Council and mana whenua will need to define the issue, include key stakeholders, then set about the development of a sustainable policy position inclusive of all interested parties.
23. The following indicative methodology is proposed to achieve this consistent approach. Working through this methodology will also provide clarity on who is responsible for what in the medium to long-term. In order to ensure this methodology is successful, a committed project manager will be required, to work alongside iwi leadership.
Task Detail Led by who When
PHASE 1: Project Establishment and ContextProject Establishment and Problem Definition alongside iwi leadership.
Internal team to set up a meeting with relevant iwi leadership. Develop:- Project scope Problem definition Outcome Timeline
Liveable communities to provide support
for this partnership approach
November 2021
Assign Project Manager. This project requires a committed project manager to ensure delivery of milestones and timely completion of this project.
Liveable Communities
December 2021
Monthly internal working group meeting.
To establish internal working group meeting – with representatives from across Council to inform the policy position development.
Project Manager November 2021

Audit & Risk Committee 23 November 2021 18 of 144
Task Detail Led by who When
Establishment of Regional Interest Group Meeting #1.
Introductory meeting to set the scene, introduce project, and discuss and agree to Interest Groups role/ Terms of Reference. Issues and opportunities workshop.
Project Manager January 2022
Gap Analysis Analysis of information we have about the problem, and gaps in research (any scientific reports required to inform position).Consider work undertaken elsewhere.
Project Manager March 2022
PHASE 2: Project Research Develop Budget & Secure Project Funding (consider Envirolink).
Investigate funding options for: Further research. Policy development. Regional Interest Group
Involvement.
Project Manager March 2022
Commence Further Research.
Undertake further research (to be confirmed following Gap Analysis and funding approval)
Consultants April 2022
Regional Interest Group Meeting #2.
HOLD POINT: Recap on Project scope and
outcome required. Issues and Opportunities
Summary. Gap Analysis Summary. Update on research undertaken
and progress to date.
Project Manager June 2022
Complete Further Research.
Finalise research. Consultants July 2022
Regional Interest Group Meeting #3.
HOLD POINT Results of Research Draft scope of policy
development
Project Manager August 2022
PHASE 3: Policy PositionDraft Policy.
Using the information obtained in earlier stages, prepare a draft Policy position. This will also include consideration of the costs and effectiveness of management approaches proposed, and respective responsibilities.
Consultant October 2022
Regional Interest Group Meeting #4.
HOLD POINT: Draft Policy – opportunity to
provide feedback.
Project Manager November 2022
Finalise Policy and undertake engagement to socialise the outcome.
Finalise policy and undertake engagement to socialise the outcome.
Consultant/ Project Manager
December 2022
Audit & Risk Committee 23 November 2021 19 of 144
ASSESSMENT of SIGNIFICANCEConsideration of consistency with and impact on the Regional Land Transport Plan and its implementationOverall Process: Low SignificanceThis Report: Low Significance
Impacts on Council’s delivery of its Financial Strategy and Long Term PlanOverall Process: Low SignificanceThis Report: Low Significance
Inconsistency with Council’s current strategy and policyOverall Process: Low SignificanceThis Report: Low Significance
The effects on all or a large part of the Gisborne districtOverall Process: Low SignificanceThis Report: Low Significance
The effects on individuals or specific communitiesOverall Process: Low SignificanceThis Report: Low Significance
The level or history of public interest in the matter or issueOverall Process: Low SignificanceThis Report: Low Significance
24. The decisions or matters in this report are considered to be of Low significance in accordance with Council’s Significance and Engagement Policy.
TANGATA WHENUA/MĀORI ENGAGEMENT
External Impact Assessment (Kaitiaki Tairawhiti)
25. We intend to work closely through Te Matapihi and the Engagement and Māori Responsiveness team to provide guidance and ensure that our approach gives effect to our Treaty obligations and legislative responsibilities.
26. A Regional Interest Group is proposed for this project, to ensure the policy position is well informed and the impacts on the wider community are well understood. The members of this group are yet to be established but will be confirmed as part of the project establishment.
27. Also note the existing networks established such as those established through the recovery plans and the Uawa community forum as well as the engagement in relation to the Tikapa Beach assessment. These will be considered when establishing the Regional Interest Group.

Audit & Risk Committee 23 November 2021 20 of 144
COMMUNITY ENGAGEMENT
Internal Impact Assessment (Manaaki Tangata)
28. The short-term approach requires immediate action to resolve prior to summer 2021/22.
29. The medium to long-term approach will involve a wide range of internal inputs to inform the policy position. The members of the internal working group are yet to be confirmed but will be confirmed as part of the project establishment.
Communications
30. While engagement throughout the project will be largely through the Regional Interest Group, a phase of engagement is anticipated upon completion of the Policy.
31. This will best enable a community endorsed approach (or at least increase understanding of the issue and re-set expectations).
32. Note: Engagement may occur with industry experts and interested parties (associated with finding solutions to the problem), and this will be undertaken as the project evolves.
CLIMATE CHANGE – Impacts / Implications
33. The issue of disposal of such volumes of wood waste has significant implications particularly if it is burnt, which releases CO2 as well as particulates. Mulching or chipping provides an opportunity to add to soil carbon thus sequestering CO2. It is not possible to undertake the work without the use of heavy machinery which will emit CO2, however, longer term options will include use of wood wastes as a feedstock offsetting emissions. Allowing pine wood wastes to decompose in “birds’ nests” in forests or end-of-life willow and poplar is not carbon neutral and has an equivalent CO2 profile to burning.
34. In some instances, burning may still be required for either logistical reasons or because it is urgent from an environmental or health and safety risk point of view.
CONSIDERATIONS
Financial /Budget / Implications
Short-Term Approach
35. To relocate, mulch and beach groom from Midway to the ‘Cut’ in Gisborne and the identified material (north beach and previous stockpiles) in Tolaga Bay, is $156k. Three quotes were obtained from contractors in order to identify the preferred contractor. Efforts have been put into achieving collaboration with the contributors to the problem, but the cost offset may not be significant.
36. Due to the storm event in November, it is likely that a further $100K - 150k will be required to complete the beach clean-up.

Audit & Risk Committee 23 November 2021 21 of 144
Medium to Long-Term Approach
37. In order to activate this project, funding is initially required to establish a Project Manager. We anticipate this could be a part-time FTE circa 15 hours/week, for one year. Costs will be approximately $40k.
38. Funding will also be required for: Iwi Leadership Further research Policy development Regional Interest Group involvement
39. Costs for the above items can only be confirmed once the first phase of the project is complete - to completion of Gap Analysis.
40. It is anticipated that there are several external funds available to secure funding for this work including Envirolink and a project to assess potential long term economic utilisation options is being submitted for funding approval. Should further funding not be secured externally, a report will be brought to Council with a quantum of costs, at that time.
Legal
41. Provided the work on the town beaches and at Tolaga are undertaken in accordance with the existing consents the operations will have no legal implications.
42. The work required at Karaka Bay will not necessarily fall within the context of a permitted use but the forestry industry has committed to undertake this work and so further work is required to establish what consents would be required.
43. It will be necessary long-term to ensure that the replacements for existing consents are fit for purpose and carefully considered to eliminate current confusion about what is and what isn’t permitted.
POLICY and PLANNING IMPLICATIONS
44. The short term approach largely complies with the rules of the TRMP, and where required resource consent has been obtained to enable the works to proceed for this coming summer. The methodology for forming the long term Council position will be developed closely with the policy and planning departments of Council to ensure alignment.
RISKS and Issues
45. There is uncertainty about the volumes of woody material remaining in the catchment. An assessment of woody residues to assess residual volumes would be useful but it is noted that this would be a resource heavy project and could involve some cost, for example the cost of acquiring suitable satellite imagery would cost between $5,000 and $16,000 US.

Audit & Risk Committee 23 November 2021 22 of 144
46. The focus to date has been on Uawa due to the lack of good practice from forestry and the community’s high level of concern. The Eastland Wood Council has committed to clean Karaka Beach. Other communities have the same concerns as Uawa but there is no mechanism for addressing these concerns. This is a concern to Council as it creates an impediment to effective management of woody debris if we experience another influx which would require an immediate response to address community concerns (refer appendix).
47. Resourcing the monitoring and compliance has been challenging in previous years; however, this coming season, the Enforcement Team will see additional resourcing with a view to having an increased presence.
48. Tighter requirements required through national legislation and through the TRMP: Consideration can be given to having this addressed in future reviews of the National Environmental Standard – Plantation Forestry (NES-PF) and through the review of the TRMP.
49. Further complexities with removing the material include:
Lack of accountability – whose woody debris is it.
Health and Safety risks associated with large woody debris deposits.
High community concern about the volume of woody debris and who is going to clean it up.
High costs associated with environmentally friendly solutions.
Issues with re-use of the material – sediment and salt in the material potentially limits its value for re-use (this is subject to assessment).
Costs for removing woody debris are currently unbudgeted.
NEXT STEPSDate Action/Milestone Comments
November 2021 Short-term solution.Complete short-term solution for town beach and Tolaga Beach for this summer.
December 2021 – December 2022
Medium to long-term Council policy position.
Undertake research and establish Council policy position.
ATTACHMENTS
1. Attachment 1 - Post Storm Surge May 2021 Clean up of North Tolaga Beach [21-224.1 - 14 pages]

3
Post-Storm Surge May 2021 Clean-up of North Tolaga Beach
Dr M. P. Cave Principal Scientist
Gisborne District Council June 2021
Attachment 21-224.1
Audit & Risk Committee 23 November 2021 23 of 144

Executive Summary Woody Debris cloaking the Tolaga Bay Beaches has been an issue since 2013 but particularly since Cyclone Cook in 2017 and the Queens’ Birthday storms in 2018. Storms since 2018 have remobilised woody material in the catchment. This material has been dominated by forest harvest residues including slash, cut logs, long resident logs and slovens. Between 20 and 30% of the wood waste is willow and poplar, and on farm debris such as fence posts and battens.
Clean ups of this material have been undertaken by the forestry industry with the last clean-up was initiated in March and was completed by 21st April 2021. The forestry industry has been reluctant to remove the material at the far end of North Tolaga Beach and this 200m plus of logs remaining since the 2018 storm remained in place when the forestry operation ceased. On the 21st of May 2021 a heavy swell warning was put in place for Tolaga Bay to East Cape and consideration was given to removing the remaining logs at the north end. By the 23rd of May, this area of logs had started to erode and efforts to initiate engagement of a contractor commenced. Fulton Hogan were contracted to do the but due to sustained heavy seas work did not fully commence until the end of that week. By the end of Tuesday 1st of June a total of 627 cubic metres of wood was removed from the beach and securely stowed above the high tide mark for eventual disposal and a further 120m south of the stowage area had logs and woody debris pushed up to the top of the beach. Overall operations were undertaken along 29% of north Tolaga Beach and the total cost came in under the initial estimates of $20-25,000 by 29%. On the weekend of the 19th-20th June, a further rainstorm with an associated c.4m storm surge impacted the area. This did not result in any erosion from the stowed logs or the shaped berm at the northern end of the beach but a significant volume of new material dominated by willow and poplar was deposited. It is likely that much of this was sourced from a site at Mahanga Creek where large volumes of willow/poplar waste were seen being remobilised from the banks of the creek during flood flows.
Attachment 21-224.1
Audit & Risk Committee 23 November 2021 24 of 144

1
Introduction On Friday May 21st a heavy swell warning for Gisborne was issued by the Metservice. “Easterly swells expected to reach 3.5 metres around midday Sunday 23rd May, with a period of 10 seconds or less. Strong southeast winds reach gale north of Tolaga Bay Sunday morning, and the underlying swell will be masked with large wind waves of up to 4 metres by midday. Combined waves could reach 5 metres by Sunday night and will be ongoing for 2-3 days.”
This storm surge occurred soon after contractors working under the guidance of Aratu Forests Ltd completed a cleanup of harvest residues remaining on the beach after the storms of June through to October 2020. Araru Forests Ltd undertook its operations on behalf of on behalf of the Eastland Wood Council but operated under two Gisborne District Council consents (CO-2014-106480-00, LU-2019-109013-00 and DL-2019-109014-00). An inspection confirming the completion of that cleanup was carried out on the 21st of April 2021. It was noted that the cleanup managed by Aratu Forests did not include a significant volume of logs and other debris estimated at 1030 cubic metres situated on Council land in front of an unconsented dwelling (Figures One and Two).
Figure One. State of the northern end of Tolaga North Beach on the 21stApril 2021 showing the cleared area (shore side of the urapa fence) and the 235m3+logs remaining in front of the informal dwelling.
The Storm Surge The storm surge was significant and characterised by its long duration. While forecast as being expected to have waves reaching 3.5m on midday Sunday with hightide at 2:45pm. Waves higher than forecast occurred earlier than expected with waves of 4m+ occurring at mid tide on the Sunday (Figure Three). The event lasted significantly longer than the forecast 2 to 3 days with high seas lasting for over a week. Observations over the first 2 days of the storm surge indicated that the log pile at the north end was being undercut (Figures Four and Five)
Attachment 21-224.1
Audit & Risk Committee 23 November 2021 25 of 144

and that and estimated 400 cubic metres mainly smaller sized material had been remobilised for here as well additional material from the top of the beach further south. Separately, the storm surge also remobilised material on the south bank of the Uawa river mouth and smaller debris from the top of south Tolaga Beach (reported separately).
Figure Two. Drone map of the north end of Tolaga Beach showing the material left prior to the clean-up operations (Note this image predates the 2021 clean up lead by Aratu Forests Ltd.
Attachment 21-224.1
Audit & Risk Committee 23 November 2021 26 of 144

Figure Three. Waves breaking over Tolaga Bay wharf at midday Sunday 23rd May 2021 (Gisborne Herald supplied).
Figure Four. Storm surge impacting on log pile at northern end of Tolaga Bay 23rd May 2021.
Attachment 21-224.1
Audit & Risk Committee 23 November 2021 27 of 144

Figure Five. Undercutting of log pile at northern end of Tolaga Bay 23rd May 2021. Removal of the harvest residues It was clear by Sunday, the 23rd of May that the logs in front of the informal dwelling were unstable and at risk of remobilisation with calculations based on drone mapping indicating that around 400m3 of mainly smaller sized debris1 was remobilised before the clean-up operation commenced. With heavy swell warnings remaining in place for several days, it was decided that Council would act urgently to dismantle the vulnerable log pile and relocate to the cleared area shown in Figure One to minimise the risk of volumes of large logs being distributed along north Tolaga Beach.
On the 24th of May, Cranswick Contracting, who had undertaken the prior work for Aratu Forests Ltd was contacted and discussions held over the next two days but it became clear that they would be unable to undertake the operation for some time. Thus on the 26th of May, Fulton Hogan were contacted and on the 27th of May agreed to undertake the operation as soon as practicable and a plan of operations agreed to. Fulton Hogan mobilised onto site on the 28th of May and the scope of works refined with Council agreeing that using a Moxy to transport the logs was the most efficient option.
A revised heavy swell warning issued on the 27th May advised that the swells were anticipated to ease to 3 metres on the 28th and after that to ease below the warning threshold. The operation commenced on schedule but continued heavy swells initially restricted good access to the beach and progress was limited on the 28th but with some bigger material relocated from the southern end to clear a route for operations on the following Monday (Figure Five).
1 This volume would have included a significant amount of incorporated sand.
Attachment 21-224.1
Audit & Risk Committee 23 November 2021 28 of 144

Figure Six. View of operations progress on Sunday 30th May showing the two piles of material removed from the beach since operations were initiated on the Friday. Rapid progress was made on Monday the 31st May when more settled weather and suitable tides allowed for a more sustained effort although the large size of many of the logs necessitated cutting them in half before they could be transported away from the Beach (Figures Seven and Eight).
Figure Seven. View of the logs stowed at the far end of Tolaga Bay North Beach. These long logs needed to be cut in half before loading into the Moxy.
Attachment 21-224.1
Audit & Risk Committee 23 November 2021 29 of 144

Figure Eight. View of operations on Monday 31st May showing logs being loaded into the Moxy. Once the majority of material was removed from site, the remaining sand and small woody debris was reshaped into a more normal dune form which would be capable of being replanted in suitable coastal dune species to give long term protection. As the work was progressing faster than anticipated, approval was given to undertake a push up of woody debris for 175m south of the cleared area (Urapa gate).
The operation was completed by the end of day on Tuesday 1st of June and all of the equipment demobilised from site. A small number of logs were left at the end of the operation as these had been buried in the sand and fine debris and were uncovered during the push up in front of the informal dwelling. These logs could not be transported to the storage site as the Moxy had already been demobilised by this time, but were pushed to the back of the shaped dune to reduce risk of remobilising.
A suite of drone photos taken on the 5th of June 2021 were provided by Fulton Hogan as part of their post-operational reporting (Figures Nine, Ten and Eleven) and a drone flight to generate an orthomap of the site was flown by the Council on the 18th of June (Figures Twelve, Thirteen and Fourteen). The council drone footage confirmed the Fulton Hogan imagery and also allowed for the volumes of material stockpiled to be assessed (Table One).
Table One. Calculation of log volumes stockpiled
Pile description M3
Southern small pile 75
Northern small pile 62 Northern long pile 353
Southern mixed pile 137
627
Attachment 21-224.1
Audit & Risk Committee 23 November 2021 30 of 144

Figure Nine. Drone footage dated 5th of June 2021 supplied by Fulton Hogan as part of their post-operational reporting. This shows the area of pushed up logs in the foreground, the log piles in the middle ground and the cleared area at the north end of the beach.
Figure Ten. Drone footage dated 5th of June 2021. This shows the cleared area at the north end of the beach with the remaining material pushed up on a low gradient slope.
Attachment 21-224.1
Audit & Risk Committee 23 November 2021 31 of 144
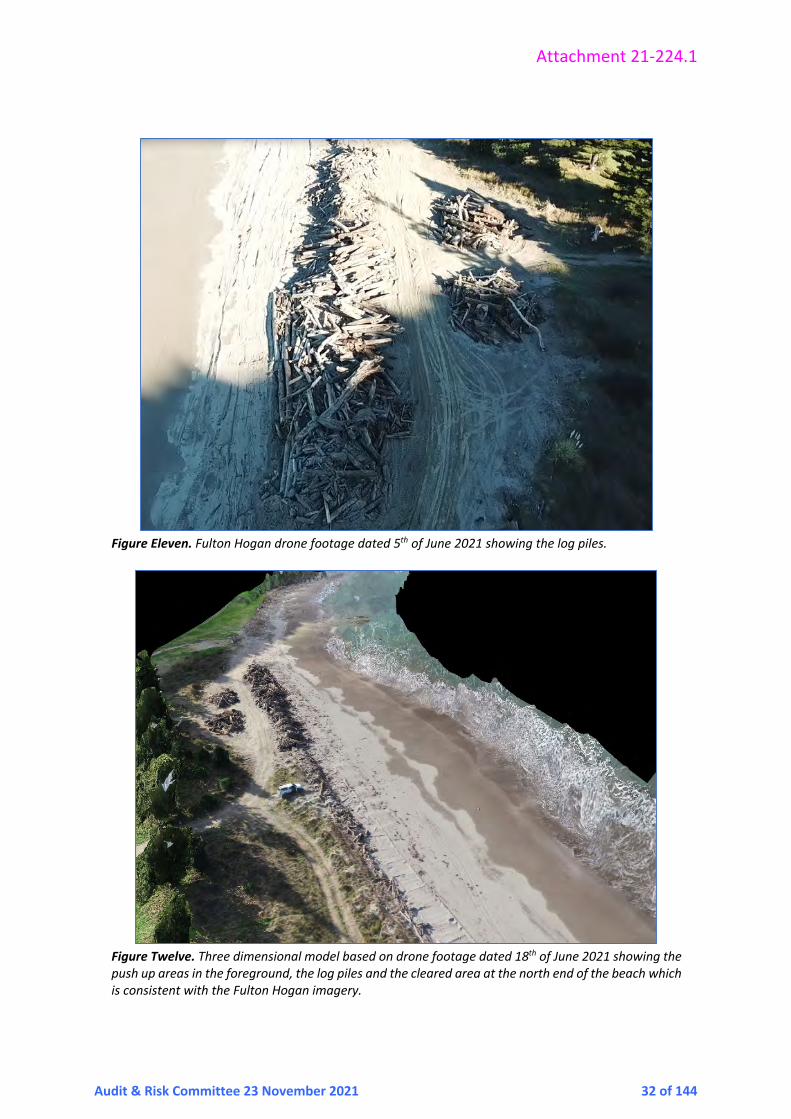
Figure Eleven. Fulton Hogan drone footage dated 5th of June 2021 showing the log piles.
Figure Twelve. Three dimensional model based on drone footage dated 18th of June 2021 showing the push up areas in the foreground, the log piles and the cleared area at the north end of the beach which is consistent with the Fulton Hogan imagery.
Attachment 21-224.1
Audit & Risk Committee 23 November 2021 32 of 144

Figure Thirteen. Orthophotographic image showing the different log piles stowed in the cleared area on the top of the dunes. The two left hand and the northern long pile comprise clean logs while the southern long pile comprises smaller logs mixed with sand. Volumes are in cubic metres.
Attachment 21-224.1
Audit & Risk Committee 23 November 2021 33 of 144

Figure Fourteen. Orthophotographic image showing the cleaned area at the north end of the beach. Health and Safety Health and safety during the operation was good. The site manager for Fulton Hogan was diligent in requiring on site sign in, and personnel inexperienced in such operations were given a brief toolbox talk. Hazard tape was not used to isolate the operational area nor the log piles
Attachment 21-224.1
Audit & Risk Committee 23 November 2021 34 of 144

as these had been previously been found to be ineffective as people would ignore them. Signage and isolating tape is being arranged now that operations are completed.
Operational Efficiency and Cost The operation was undertaken between Friday 28th of May and Tuesday 1st of June with the majority of the work undertaken on the 31st May and 1st of June due to continuing heavy swells on the 28th of May limiting access to the beach. In effect, the operation took around 2.5 days to complete. In this time 200m of the northernmost end of the beach was cleared with 627 cubic metres of logs were relocated to the clearing adjacent to the urapa fence for eventual disposal. The disposal area occupies a length of 75m and a further 120m of beach to the south of the disposal area. Overall, operations were undertaken along 29% of the total north Tolaga beachfront.
A cost of $20,000 to $25,000 was estimated for the project based on prior Tolaga Beach operations but came in under the estimate by around 29%. Postscript Soon after the operations were completed a storm occurring over the weekend of 19-20th June associated with a moderate storm surge resulted in more debris being deposited on north Tolaga Beach. While a full assessment hasn’t been undertaken, a site inspection on the 22nd June indicated that a significant portion appears to be willow and poplar. A drone flight of the Uawa River mouth shows that a significant volume of new wood has been deposited (Figure Fifteen).
Figure Fifteen. Orthophotographic image dated 21st June showing the deposition of fresh wood waste at the Uawa River mouth.
Attachment 21-224.1
Audit & Risk Committee 23 November 2021 35 of 144

A field assessment between Gisborne and Tokomaru Bay on the 20th observed that the Mangaheia and Mangatokerau Rivers which had previously been significant sources of harvest woody debris were dirty but little woody debris was observed. At the Anaura Bay turn off on State Highway 35 flood waters were observed in Mahanga Stream and a significant volume of willow wood stored in piles on the banks of the stream were being eroded and transported downstream to the Hikuwai.
A more detailed assessment of the impacts of this storm will be undertaken when time allows.
Attachment 21-224.1
Audit & Risk Committee 23 November 2021 36 of 144
Audit & Risk Committee 23 November 2021 37 of 144
11. Reports of the Chief Executive and Staff for INFORMATION11.1. 21-257 Health and Safety Update
21-257
Title: 21-257 Health and Safety Update
Section: Health & Safety
Prepared by: David Wilkinson – Health & Safety Manager
Meeting Date: Tuesday 23 November 2021
Legal: No Financial: No Significance: Low
Report to AUDIT & RISK Committee for information
PURPOSE
The purpose of this report is to update the Audit & Risk Committee with specific information on critical health, safety and wellbeing risks, and controls to mitigate these risks at all Gisborne District Council workplaces.
SUMMARY
The Gisborne District Council has duties under the Health and Safety at Work Act 2015 (HSWA) and its associated Regulations. These include:
Applying due diligence to ensure Council, through its Chief Executive, provides resources and support to meet legal health and safety obligations.
Ensuring that significant health and safety risks have been identified and that robust controls are implemented to mitigate these risks, and that they are reviewed regularly.
Assurance that all workers are confident that Council is providing a safe workplace for its workers and other persons.
Confirming that Council is compliant with health and safety legislation and striving to continuously improve health and safety systems and culture.
Ensuring all workers are valued and that their health, safety and wellbeing is essential to the overall success of Gisborne District Council.
This report aims to provide key information relating to these matters at a governance level.
The decisions or matters in this report are considered to be of Low significance in accordance with the Council’s Significance and Engagement Policy.
RECOMMENDATIONS
That the Audit & Risk Committee:
1. Notes the contents of this report.
Authorised by:
James Baty - Director Internal Partnerships
Keywords: health and safety, wellbeing, critical risks, contractor management HSWA, boots on the ground
Audit & Risk Committee 23 November 2021 38 of 144
BACKGROUND1. The Health & Safety at Work Act is now well established with regular opportunities to
review case law and related precedents together with frequent Regulator media reports. Since the last Committee meeting WorkSafe have announced changes to health and safety regulations providing more clarity and certainty for businesses and better health and safety for workers. These proposed changes focus on plant, machinery, structures, scaffolding, vehicles and tools. Consultation will commence early 2022 with the final regulations expected to be in place by late 2022.
2. Our focus continues to be on critical risks, staff wellbeing, and building a culture where all our workers feel supported, understand the risks associated with their work, and what controls are needed to mitigate these. Accordingly, this report provides several updates.
DISCUSSION and OPTIONS3. Gisborne District Council recognises that a well-functioning health and safety system
relies on participation, leadership and accountability. HSWA sets out the principles, duties and rights in relation to workplace health and safety. A guiding principle of HSWA is that workers and others need to be given the highest level of protection from workplace health and safety risks, as is reasonable.
4. A recent review of Council’s strategic risks included Health & Safety and resulted in several options to ensure ongoing continuous improvement.
Identified Health and Safety Operational Risks
5. Healthy and safe work starts with identifying and understanding what our work-related health and safety risks are. It then involves implementing what is reasonable and practicable to eliminate those risks. Where the risk cannot be eliminated, it must be minimised so far as is reasonably practicable.
6. We focus on critical risks first before managing less serious risks. Teams are required to review work activities on an ongoing basis to identify any new risks that need to be managed. We work with other businesses where we have shared work risks (e.g. share a workplace or in a contracting chain). In addition, we ask workers for input on not only identifying health and safety risks but also when choosing solutions. We believe people are more likely to take responsibility and make good choices if they’ve been involved in the conversation, remembering that workers are the eyes and ears of our business. They could suggest practical, cost-effective solutions and often do.
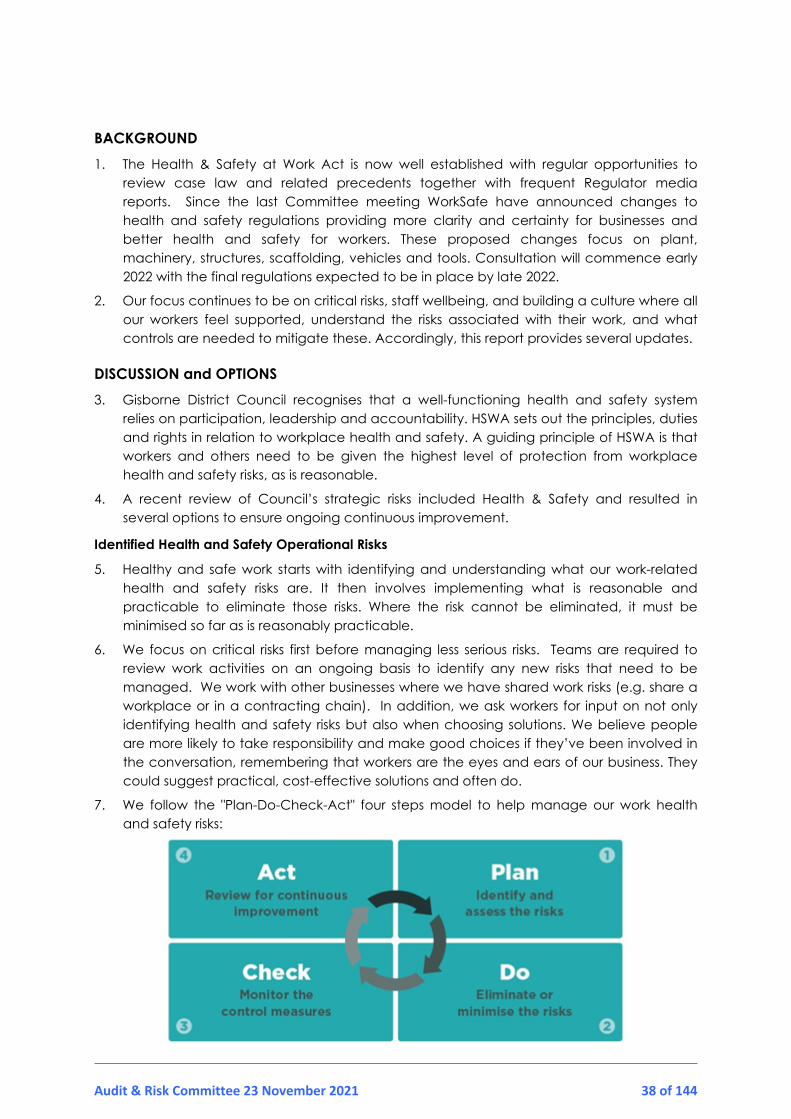
7. We follow the "Plan-Do-Check-Act" four steps model to help manage our work health and safety risks:

Audit & Risk Committee 23 November 2021 39 of 144
8. Teams have identified their operational risks and these, together with controls, are reviewed on an annual basis or post any incident/accident. As previously advised, to support this work we have implemented a Business Partnership Model where the HomeSafe team collaborate and review team risks developing minimum risk guidelines for staff and contractors to follow.
9. A list of 28 critical risks have previously been identified, highlighted and reviewed at regular Central Organising Roopu (COR) meetings. These critical risks include, for example, uncertified lifting equipment and non-compliant edge protection. All but one (Williams Dam Sluice grill) have been closed off, the remaining outstanding risk is planned for completion when conditions permit.
10. Our top ten identified operational risks are:
Conflict, violence and aggression Falls from heights Driving and vehicle safety Working in the road corridor Contractor management Confined spaces and access Isolated, remote, lone working Hazardous substances, including asbestos Mental health and wellbeing
11. The HomeSafe and Risk teams remain vigilant around the changing COVID situation across New Zealand and worldwide. At the time of writing, the proposed Gisborne District Council COVID-19 Vaccine Policy is in the consultation phase. The highly transmissible Delta strain has led to increased focus on vaccination rates to enable movement towards the Government’s COVID-19 protection framework. Clear concise documentation is available to all staff via Naumai (staff intranet) and other communication channels. Ensuring we are well prepared particularly in terms of resources, plans and PPE for any potential COVID-19 resurgence in Tairāwhiti is constantly front of mind.
12. Our summer student recruitment and induction process improvements will focus on education and mitigation controls of key risks young students could face.
Compliance
13. Workplace health and safety is not just about compliance with every letter of the law. It is about making sure our basic proposition about workplace health and safety is cemented in our organisation’s culture. To this end, several compliance initiatives are under way or completed.
14. Gisborne District Council continues to play a key role in the local Te Tairāwhiti Asbestos Liaison Protocols where Council, Hauora Tairāwhiti, Fire & Emergency New Zealand and WorkSafe jointly support the reduction of occupational and public health risks associated with the exposure to asbestos.

Audit & Risk Committee 23 November 2021 40 of 144
Contractor Management
15. Much of Council’s medium to high risk work is undertaken by contractors. Before becoming a Council approved contractor, a health and safety assessment is undertaken with the contractors who are required to pass a pre-qualification check of their health and safety systems using our pre-qualification system SHE. ‘SHE’ helps us make smarter health and safety decisions, all backed by data and supported by rigorous process. Changes to the pre-approval process (cross-accreditation with Totika) have been ratified and will necessitate additional training to staff across Council. Council staff who engage medium or high risk contractors then undertake a check of any qualifications, licensing, safety plans and associated documentation before work commences. Monthly monitoring of contractors undertaking physical work is required by the person who engaged them, or a suitable project consultant/team. An example is the floodwater programme, with monitoring overseen by the HomeSafe team.
16. Working closely with approved contractors includes regular meetings where health and safety is reviewed, including accident and incident data. Additional contractor near miss reporting is under review. The benefit of collaboration not only ensures that Council complies with requirements under Section 34 of HSWA (overlapping duties) but also achieves benefits when exchanging learnings.
17. Gisborne‘s branch of NZISM (New Zealand Institute of Safety Management) continues to promoted safety in Tairāwhiti. Members include many of Council’s key contractors who get opportunities for training and personal development.
Due Diligence by Officers
18. HSWA outlines who is an ‘Officer’ and what their duties are. In councils ‘Officers’ include Mayors, Councillors and Chief Executives. An officer must exercise due diligence to ensure that Council complies with all its duties or obligations under HSWA.
19. To ensure all elected members fulfil due diligence in their capacity as an officer, health and safety reports to the Audit & Risk Committee will also be included in the subsequent Council agenda. The updates to the Governance Structure and Terms of Reference (Report 20-219) will mean that such information in the future will be accompanied by any recommendations from the Audit & Risk Committee.
20. Part of the role of an Officer of a PCBU[1] is to ensure that there is a safe workplace and that Council has required resources available. We achieve this in several ways:
a) COR (including the Chief Executive) meet weekly and discuss health and safety. Regular reviews of health and safety risks are undertaken – including general data, trends, accident data, critical risks and changes to guidance, standard operating procedures and health and safety Information.
b) The Chief Executive and COR ensure sufficient finance is made available as and when required.
c) Directors attend Health and Safety Committee meetings.
[1] Person in Control of a Business or Undertaking
Audit & Risk Committee 23 November 2021 41 of 144
Keep Up-to-date with Health and Safety Matters
21. Due diligence includes taking reasonable steps to acquire, and keep up-to-date, knowledge of work health and safety matters Section 44(4)(a) of HSWA.
22. Recent notifications from WorkSafe include:
Company director fined for health and safety failingsWorkSafe is warning company directors that if they are not making sure their company’s operations are safe and healthy, they face enforcement under the Health and Safety at Work Act 2015.The warning follows the first WorkSafe prosecution and subsequent conviction and sentencing today of a director and his company for health and safety failings.“Directors have explicit legal duties to undertake due diligence on their company’s adherence to health and safety obligations and failing to do so not only puts their workers at risk, but it also puts them in our sights,” WorkSafe’s Head of Specialist Interventions Mr Humphries said.“As governors of their businesses, they have more ability than anyone else to influence their business’ operations to ensure they’re taking all the steps required to protect workers and others on their sites from health and safety risks. If they’re not doing so, they’re failing in their duties,” Mr Humphries saidOn 18 October 2021 in the Tauranga District Court, Jon-Brian Parker and his company Kimberley Tool and Design (NZ) Limited were convicted and fined over a November 2018 incident in which a worker suffered crushing injuries while operating a metal press. The ends of his right middle and ring fingers required amputation as a result.WorkSafe investigated the incident and found that the press was not properly guarded and did not have the required emergency stop button. The investigation also found previous history of the machine not operating as expected and had not identified this as a risk.Mr Humphries said the company’s induction and staff training was haphazard and undocumented, and the company could not produce any evidence of the victim having been properly trained in the press’ use.“What makes this case all the more concerning is that the company has had two previous convictions for incidents involving presses and injuries to workers’ hands and fingers.“At the time of the incident the company was also non-compliant with three WorkSafe Improvement Notices relating to non-implementation of a health and safety manual; inadequate safe operating procedure; and training issues.“With that history, Mr Parker should have known he had to step up and fix the litany of problems evident in his business. He did not, and a worker was unnecessarily injured,” Mr Humphries said.

Audit & Risk Committee 23 November 2021 42 of 144
Notes:
Jon-Brian Parker appeared in the Tauranga District Court on 18 October 2021. He was sentenced under sections 44(1), 48(1) and 48(2)(b) of the Health and Safety
Work at Act 2015. Being a director of a PCBU, namely Kimberley Tool and Design (NZ) Ltd, and having a
duty as an Officer to exercise due diligence to ensure that Kimberley Tool and Design (Ltd) complies with its duties as a PCBU, did fail to comply with that duty, and that failure exposed workers, including the victim, to a risk of serious injury arising from exposure to a crushing hazard created by the moving parts of the press when in operation.
Whakaari/White Island update
22 October 2021
WorkSafe New Zealand welcomed the recommendations in the "Review of WorkSafe New Zealand’s Performance of its Regulatory Functions in Relation to Activities on Whakaari White Island. The review was commissioned by the Minister for Workplace Relations and Safety through the Ministry of Business, Innovation and Employment (MBIE) and was carried out by David Laurenson QC
“WorkSafe accepts that there were significant shortcomings in our implementation and enforcement of the Adventure Activities Regulations in relation to adventure activities on Whakaari. We deeply regret that and fully committed to improving our performance by addressing the review’s recommendations”.
WorkSafe previously laid charges against 13 parties, 3 of which were under HSWA Section 44/ Officers duties. All 13 defendants pleaded not guilty, with the next hearing in March 2022 and trial set for July 2023.
Worker Participation
23. One of the key requirements of health and safety legislation is that it is mandatory to have active worker participation. We formally apply this in two ways:
By having nominated Health and Safety Representatives, who cover a specific work group across Council. Currently each representative operates in this role for a period of two years. Health and Safety Representatives are consulted on worker health and safety matters, involved in investigations, meet quarterly and are given a variety of training opportunities during their term.
All workers are encouraged to report accidents, incidents and near misses through the VAULT system (our health and safety management platform). A mobile VAULT app is available and well used.

Audit & Risk Committee 23 November 2021 43 of 144
Our Key Processes Facilitate Employee Participation process in line with HSWA regulations.
Manage the VAULT health and safety system which aligns with AS/NZ 4801 Occupational Health and Safety Management systems and provides a repository for all health and safety information, hazard registers, risk registers, compliance registers and monitors improvement actions and investigations.
Lead the Health and Safety Risk Management process which is a core function of the VAULT system. The risk module has a sophisticated structure that fully integrates with all outputs of VAULT where risk assessments and controls are monitored and continuously improved.
Contribute to the BOPLASS Mahi Tahi LG Collaboration Portal which provides a shared resource where council health and safety policy, guidance and related material is freely available and members meet on a quarterly basis.
Coordinate the Audit and Review Process from within VAULT. Scheduling and improvement actions are applied to individuals and monitored until close-out.
Process Gaps or Improvement Opportunities
24. Improvement opportunities identified include:
Some aspects of VAULT remain not well understood or utilised. Additional training is required, targeting managers and teams.
Staff and contractors encouraged to ensure prompt reporting of events that include near misses.
Health and wellbeing initiatives require further development and implementation – additional HomeSafe resource engaged.
Managers/Team leaders regularly engage with those working from home.
Health and safety culture recognition and rewards scheme requires formalisation.
Audit and review of major contractors is ongoing and requires further enhancement.
Accountability – annual health and safety KPIs assessment and review requires completion following year-end.

Audit & Risk Committee 23 November 2021 44 of 144
Accident and Incident Statistics
KEY: No Treatment = reported accident requiring no first aid, medical treatment or time off.
First Aid = minor accident requiring first aid.
MTI = Medical Treatment Injury - injury or disease requiring treatment by General Practitioner (GP).
LTI = Lost Time Injury - workplace injury where worker requires time off (GP certified).

Audit & Risk Committee 23 November 2021 45 of 144

Audit & Risk Committee 23 November 2021 46 of 144
Key/Explanation: Total Recordable Injury Frequency Rate (TRIFR): Shows our performance gauged
against similar organisations. It is an industry standard reporting calculation based on (recorded incidents x 200,000) / total number of hours worked.
Events by trend (last 12 months) highlight top 3 events as: vehicle and driving, conflict and aggression and more recently an increase in criminal damage to GDC facilities.
Contractors reporting
With significant numbers of contractors engaged in Council work, many on very short duration works, obtaining accurate and timely data can be challenging. Main Contractors continue to have regular meetings with their GDC counterparts where Health & safety is the first item on the agenda. Incidents, accidents and near misses are reviewed and any recommendations arising shared.
Reporting data to follow will initially be based on our larger Tier 1 contractors.
Notifiable events: In the past 12 months no Council staff have been involved in events requiring
notification to WorkSafe.
2 x notifiable events incurred by contractors were notified to WorkSafe.
o Fulton Hogan/Siteworx - ruptured underground gas pipes.o Waste Management – worker under training fell from refuse truck – injuring arm.
ASSESSMENT of SIGNIFICANCEConsideration of consistency with and impact on the Regional Land Transport Plan and its implementationOverall Process: Low SignificanceThis Report: Low Significance
Impacts on Council’s delivery of its Financial Strategy and Long-Term PlanOverall Process: Low SignificanceThis Report: Low Significance
Inconsistency with Council’s current strategy and policyOverall Process: Low SignificanceThis Report: Low Significance
The effects on all or a large part of the Gisborne districtOverall Process: Low SignificanceThis Report: Low Significance
The effects on individuals or specific communitiesOverall Process: Low SignificanceThis Report: Low Significance
The level or history of public interest in the matter or issueOverall Process: Low SignificanceThis Report: Low Significance
25. The decisions or matters in this report are considered to be of Low significance in accordance with Council’s Significance and Engagement Policy.
Audit & Risk Committee 23 November 2021 47 of 144
TANGATA WHENUA/MĀORI ENGAGEMENT
26. While no tangata whenua engagement was required to complete this report we are respectful when partnering with our community and organisations and ensure Te Tiriti o Waitangi – The Treaty of Waitangi is recognised in our daily work.
27. HomeSafe team actively promote the principles of Te Tiriti o Waitangi – The Treaty of Waitangi.
COMMUNITY ENGAGEMENT
28. No community engagement was required to complete this report. All teams – including HomeSafe – are responsible for the safety and wellbeing of our workers and community. Contractor management and requests for service from our community may require input and guidance from the HomeSafe team.
CLIMATE CHANGE – Impacts / Implications
29. There are no impacts or implications on climate change.
CONSIDERATIONS
Financial/Budget
30. Any financial implications relating to this report will be met from within existing budgets.
Legal
31. HSWA and associated regulations were introduced in 2016 and have now had a chance to acclimatise. Significant fines have been highlighted in the media for PCBUs who have not taken all reasonably practicable steps to mitigate health and safety risks. Any notifiable events have the potential to be investigated by the government regulator (WorkSafe).
POLICY and PLANNING IMPLICATIONS
32. There are no policy and planning implications to consider. health and safety is inherent in all areas of Council work.
RISKS
33. HSWA and its associated regulations require a PCBU[1] to take all reasonably practicable steps to ensure the safety of its workers. There remains a risk to workers, Council reputation and regulatory censure due to any unidentified or unknown risks or failure of workers to follow safe work procedures. Risks to GDC workers’ health and wellbeing have increased, compounded by COVID and associated requirements including working from home. The majority of known critical risks identified are well managed or closed off.
[1] Person in Control of a Business or Undertaking
Audit & Risk Committee 23 November 2021 48 of 144
11.2. 21-177 Internal Audit Update February - November 2021
21-177
Title: 21-177 Internal Audit Update February - November 2021
Section: Internal Audit
Prepared by: Tina Swann - Internal Audit Partner
Meeting Date: Tuesday 23 November 2021
Legal: No Financial: No Significance: Low
Report to AUDIT & RISK Committee for information
PURPOSE
The purpose of this report is to provide an update on activities of internal audit projects completed and/or currently in progress.
SUMMARY
Attachment 1 is an updated high-level summary of completed internal audits and policy reviews. The summary briefly explains the reason for the review, the approach taken and the outcomes or recommendations put in place after discussions with management.
The total external grants and subsidies received for the financial year ending 30 June 2021 was $84.1m. This been the focus of internal audit including supporting the project teams and external agencies with the view to provide assurance that the funding is and has been managed appropriately.
Parking collection has gone through notable changes recently with the implementation of pay by plate meters that have replaced the older pay & display, and standalone. While this will reduce the amount of cash that needs to be collected and counted, a separate standard operating procedure (SOP) for parking meter staff and coin counting staff was developed and is now a part of the conditions of employment.
Further details on this and other work currently under way is included in the report below.
The decisions or matters in this report are considered to be of Low significance in accordance with the Council’s Significance and Engagement Policy.
RECOMMENDATIONS
That the Audit & Risk Committee:
1. Notes the contents of this report.
Authorised by:
Pauline Foreman - Chief Financial Officer
Keywords: Internal audit

Audit & Risk Committee 23 November 2021 49 of 144
BACKGROUND
1. Internal Audit is an independent and objective assurance, consulting and advisory service, which aims to assist the organisation to accomplish its objectives. This is done by bringing a systematic disciplined approach to evaluating and improving the effectiveness of risk management, control and governance processes.
2. The Audit & Risk Committee is responsible for monitoring the work on Internal Audit. In order to facilitate this, Internal Audit provides a quarterly report of its progress which includes a high-level summary of the work completed and an assessment of the level of assurance provided.
3. When reports have been agreed and finalised with the Manager and Director concerned, an action plan is drawn up to implement improvements. These assignments are scheduled for follow up reviews.
DISCUSSION and OPTIONS
External Grant Funding
4. During the past financial year, Council has received over $80m in external grants and subsidies. A substantial portion of this related to the Provincial Growth Funding (PGF) projects and the Tairāwhiti Redevelopment (TRP) projects.
5. Due to the significant external funds, this was an area of focus for our external auditors Ernst and Young (EY) during their audit of the financial statements to 30 June 2021.
6. The work that Internal Audit has done over this period in developing a robust process to support the project teams and provide oversight was instrumental in assisting EY to validate the appropriateness and measurement of costs claimed against the programme of works as set out in the various funding agreements.
7. While the TRP has been completed, there are still a few projects being monitored and supported by Internal Audit within the PGF roading programme.
8. The success of the model applied by Internal Audit for these programmes of work are now being applied to the following major projects:
a. Olympic Pool
b. Wastewater Treatment Plant
c. Waipaoa River Flood Control
9. Our involvement is to provide assurance to our project sponsors and funders that expenditure is being recorded and allocated correctly and that any funding claimed is correct and based on actual expenditure incurred.
10. It also extends to project forecasting and cash flows that help identify any issues or concerns around project timing, tracking against budget and project milestones to meet for funding requirements.
11. We do this in a few ways:
Each project has a dedicated financial advisor that works closely with the project team in monitoring spend, forecasting, cash flow and funding.
Internal Audit review and sign-off on the financial information before the information is released to our funders.

Audit & Risk Committee 23 November 2021 50 of 144
12. The approach Internal Audit has taken has been very collaborative. The goal has been to work smarter and more efficiently together with the project team and various agencies involved, for example, Ministry of Business Innovation and Employment (MBIE), Waka Kotahi and more recently CIP (Crown Infrastructure Partners).
13. What we found that worked well is scheduled monthly meetings with key project team members and agency representatives a few days after the financial reporting and transaction listings have been submitted.
14. This has been great in identifying and raising concerns or issues and often mitigated any perceived risks from the outset.
Road Safety Review
15. The Safer Journeys strategy is to target road safety education programmes to high and medium risk areas. The programme is funded 75% from Waka Kotahi and 25% rate funded.
16. The last internal audit was undertaken in June 2019 and resulted in a few medium to high level recommendations around contract management.
17. Given there has been some time between the last internal audit and having had a change in staffing last year where a new Road Safety Educator was appointed, it is timely that a further review be carried out to assess the integrity of the controls and recommendations put in place.
18. The approach taken to review key risk areas:
a. Contract Management
b. Conflicts of interest disclosed (if any)
c. Appropriateness of expenditure and funding subsidies
d. Delegated approvals
19. This review will be finalised with management and reported at the next Audit & Risk Committee meeting in March 2022.
Non-rateable Maori land application and rates refund review
20. This is a review of the new process around non-rateable Maori land due to changes in the Local Government (Rating of Whenua Maori) Amendment Act 2021 which came into force on 1 July 2021 regarding Maori freehold land.
21. The new Act will provide Council the power to write-off rates arrears and a statutory remission process for development, make unused Maori land unrateable and also provide the opportunity for Council to treat multiple blocks of Maori land as one block for rating purposes.
22. The approach taken is to ensure clear processes are in place with a view to have:
a. Robust controls are in place
b. Separation of duties when decisions need to made (conflict of interest)
c. Delegated approvals; and
d. Reporting of any changes made

Audit & Risk Committee 23 November 2021 51 of 144
23. Put in place the necessary systems so the correct rating treatment can be applied and fine-tune our rates remission process.
24. This is a new process and may take some time to work through with the revenue team. We would expect this to take at minimum six months.
Three Year Programme
25. Management is currently reviewing each of Council’s strategic and organisational risks and apply the risk appetite framework to assess each of their inherent risk, the control environment to manage the risk and the resulting residual risk.
26. Once the overall organisational risk is determined, this will lead into the development of the three-year programme.
ASSESSMENT of SIGNIFICANCE
Consideration of consistency with and impact on the Regional Land Transport Plan and its implementationThis Report: Low Significance
Impacts on Council’s delivery of its Financial Strategy and Long-Term PlanThis Report: Low Significance
Inconsistency with Council’s current strategy and policyThis Report: Low Significance
The effects on all or a large part of the Gisborne districtThis Report: Low Significance
The effects on individuals or specific communitiesThis Report: Low Significance
The level or history of public interest in the matter or issueThis Report: Low Significance
27. The decisions or matters in this report are considered to be of Low significance in accordance with Council’s Significance and Engagement Policy.
TANGATA WHENUA/MĀORI ENGAGEMENT
28. Māori engagement is not required in relation to Internal Audit activities.
COMMUNITY ENGAGEMENT
29. The community will not be engaged in relation to Internal Audit activities.
CLIMATE CHANGE – Impacts / Implications
30. There will be no effect on greenhouse gases or climate change as a result of the matters in this report.

Audit & Risk Committee 23 November 2021 52 of 144
CONSIDERATIONS
Legal
31. While there are no legal requirements in relation to Internal Audit activities, the Internal Audit function assists our statutory requirements. The combined mix of internal and external audit coverage supports the Audit & Risk Committee members to fulfil their governance responsibilities.
POLICY and PLANNING IMPLICATIONS
32. There are no policy and planning implications.
RISKS
33. The risk profile and risk appetite will help focus the Internal Audit programme over the next three years.
NEXT STEPSDate Action/Milestone Comments
Nov 21-June 2024Continue to provide support and oversight of all major projects and PGF funded projects.
Ongoing.
Jan–June 2022Development of a three-year internal audit programme.
Refining risk appetite with Council before programme can be developed.
ATTACHMENTS
1. Attachment 1 - Update of Completed Audit Reviews/Projects [21-177.1 - 3 pages]

APPENDIX 1:
UPDATE OF COMPLETED AUDIT REVIEWS/PROJECTS FOR
AUDIT AND RISK COMMITTEE MEETING ON 24 NOVEMBER 2021
PARKING METER COLLECTION REVIEW
Objective:
Revisit the previous review undertaken in 2018 to assess the integrity of the recommendations and improvements implemented and to observe and/or recommend additional controls as a result of changes during this time.
Approach taken:
Interviews with Parking Team Leader, Director and Enforcements Manager to discuss findings and recommendations of previous review.
Noting new equipment purchased for transporting collection money and recording more efficient pay-by-plate meter upgrades planned for troublesome pay and display meters.
Discussions with Financial Services to check reports from new meters and reconciliations. Discussions with IT Services to check footage review from coin room CCTV and parking
wardens body cameras. Discussions with parking staff, enforcements administrator and coin counting staff to
confirm process changes.
Outcome:
Identified prior recommendations not being followed and discussing solution.o mesh box in counting room not being locked.
Process improvements noted and documented.o Team Leader to utilise locked drawer to store keys to meters and coin bins when
not in use so they are centralised and secure.o Unsealed money bags to be kept in safe with register to be kept of un-sealed bags
and how much money is contained within them. Process documentation updated to reflect new equipment and upgrades with new
procedures required. Prepared separate Standard Operating Procedures for parking meter staff and coin
counting staff to include in new training programme for Enforcement staff.
Attachment 21-177.1
Audit & Risk Committee 23 November 2021 53 of 144

KOHA POLICY REVIEW
Objective:
To review current Koha policy following phasing out of cheque payments on 28 May 2021 to ensure koha fulfils tikanga whilst still meeting the financial reporting requirements of audit and policy.
Approach taken:
Meeting with Maori Responsiveness Team representatives to discuss collective solutions for all our requirements.
Checking how other Councils will manage koha.
Outcome:
Update koha policy and supporting documentation to reflect new changes. Presented to COR and approved on 26 May 2021. Socialise new koha policy via all staff email and Naumai.
PETTY CASH POLICY REVIEW
Objective:
To review current Petty Cash policy following phasing out of cheque payments.
Approach taken:
Discussions with Financial Services to review current petty cash operations and alternative methods available for petty cash reimbursement.
Research business card options with Westpac.
Outcome:
Update petty cash policy and supporting documentation to reflect new changes. Presented to COR and approved on 26 May 2021. Socialise new petty cash policy to Departments utilising petty cash with instructions on using
new Westpac Business cards. Meeting with Customer Services Manager to outline new process for reimbursement.
Attachment 21-177.1
Audit & Risk Committee 23 November 2021 54 of 144

SENSITIVE EXPENDITURE POLICY REVIEWS FOR BOTH ELECTED MEMBERS
AND STAFF
Objective:
To update both policies to include reference to Koru Club membership for Mayor and Chief Executive as per external audit suggestion.
Approach taken:
Review OAG guidelines on sensitive expenditure for airline memberships. Review policy and separately update to include Koru Club expense for Mayor and Chief
Executive under respective policies.
Outcome:
Both Elected Members policy and Staff policy were updated to make the change.
Attachment 21-177.1
Audit & Risk Committee 23 November 2021 55 of 144
Audit & Risk Committee 23 November 2021 56 of 144
11.3. 21-263 Council Strategic Risk Management Report
21-263
Title: 21-263 Council Strategic Risk Management Report
Section: Finance & Affordability - Performance
Prepared by: Steve Breen - Risk Partner
Meeting Date: Tuesday 23 November 2021
Legal: No Financial: Yes Significance: Low
Report to AUDIT & RISK Committee for information
PURPOSE
The purpose of this report is to inform the Audit and Risk Committee on the status of Gisborne District Council’s strategic risks.
SUMMARY
Management continues to review each of Council’s strategic and organisational risks and apply the risk appetite framework to each to assess their inherent risk, the control environment to manage that risk, and the resulting residual risk.
This report provides a status update for the ‘Health and Safety’ and ‘Civil Defence’ strategic risks reported to the 22 September Audit and Risk (A&R) Committee meeting and progress on ‘People and Capability’, and ‘Impact of External Change’ strategic risks.
A deep dive on the ‘Finance’ strategic risk which will include ‘Fraud and Corruption’ and ‘Procurement’ will be conducted as part of the Committee meeting and forms a separate part of the meeting under public excluded and referenced in Public Excluded report 21-269.
The decisions or matters in this report are considered to be of Low significance in accordance with the Council’s Significance and Engagement Policy.
RECOMMENDATIONS
That the Audit & Risk Committee:
1. Notes the updates to the individual strategic risks and their risk appetites contained in this report.
Authorised by:
Pauline Foreman - Chief Financial Officer
Keywords: Risk, Strategic Risk,

Audit & Risk Committee 23 November 2021 57 of 144
BACKGROUND
1. This report provides an update on Council’s top risks and risk activities for the period ending November 2021.
2. The Council is progressively applying its risk appetite framework to each of the Council’s 13 identified strategic risks. Each strategic risk will be assessed in terms of its inherent risk, the control environment to manage that risk, and the resulting residual risk.
3. At the 23 June Audit and Risk Committee (A&R Committee) meeting (report 21-131), the following steps were agreed as part of this process:
Recalibrating the Council’s risk consequence definitions to move the current risk appetite from ‘Minor’ to ‘Moderate’ as based on the risk appetite workshop results.
Determine if the Council is currently exposed to any risks beyond its risk appetite.
Develop the annual Internal Audit Plan (based on a 3 year programme).
Plan and conduct deep dive risk sessions with the A&R Committee.
4. The goals of this current period of work are to:
a) Progressively determine the status of our strategic risks and overall organisational risk now.
b) Map where we need to go in terms of running an across-organisation risk management approach that is consistent for each area of risk and keeps the Council operating within an acceptable level of risk.
5. The 22 September A&R Committee report covered the ‘Health and Safety’ and ‘Civil Defence’ strategic risks and deep dives on ‘Impact of External Change’ and ‘People and Capability’.
6. The ‘Impact of External Change’ deep dive identified a close association of this area of risk with ‘Overall Council Strategy’ (including strategic relationships) that the previously proposed deep dive on ‘Overall Council Strategy’ scheduled for the November A&R Committee meeting will be deferred to allow more work to be done on defining and aligning both risks.
7. The ‘People and Capability’ deep dive identified the need for the Council to take additional actions to meet its recruitment and retention requirements. The Committee agreed that this should form the basis of a separate report to the full Council which management is now progressing.
8. This report is supported by the accompanying Public Excluded Deep Dive report (21-269), which covers the deep dive for ‘Finance’, accompanied by ‘Fraud and Corruption,’ and ‘Procurement’ which will take place in the Public Excluded part of this meeting.
9. Work is being undertaken across all the strategic risks and the Strategic Risk Update Summary Table below shows the completed risk assessments to date and where the risk assessments and deep dives for each risk are proposed.

Audit & Risk Committee 23 November 2021 58 of 144
10. Strategic Risk Update Summary Table:
Strategic Risk Inherent Risk Residual Risk Proposed Deep Dive Risk Assessment completed by
Health and Safety Serious Moderate August 2022 Completed
Civil Defence Serious Moderate August 2022 Completed
People and Capability (including projects/change management and service delivery)
Serious Major Completed 23 November 2021
Impact of Externally Driven Change New risk: level to be determined following deep dive
New risk: level to be determined following deep dive Completed April 2022
Financial (including fraud and corruption) Serious Moderate 23 November 2021 23 November 2021
Procurement Serious Moderate 23 November 2021 23 November 2021
Overall Council Strategy (including strategic relationships)
To be reassessed following deep dive
To be reassessed following deep dive April 2022 April 2022
Treaty Commitments New risk: to be determined following deep dive
New risk: to be determined following deep dive 23 February 2022 April 2022
Capital Projects New risk: to be determined following deep dive
New risk: to be determined following deep dive 23 February 2022 April 2022
Natural Environment (including ability to monitor and report) To be reassessed To be reassessed April 2022 23 February 2022
Legal Compliance To be reassessed To be reassessed June 2022 April 2022
Infrastructure Asset Management To be reassessed To be reassessed April 2022 23 February 2022
Business Continuity (including Information and Technology) To be reassessed To be reassessed August 2022 June 2022

Audit & Risk Committee 23 November 2021 59 of 144
11. A residual risk ‘heat map’ forms part of the risk reporting and has been provided below for the risks assessed to date: ‘Health and Safety’ (H&S); ‘Civil Defence’ (CD), ‘People and Capability’ (P&C); ‘Finance’ (F), ‘Fraud and Corruption’ (F&C); and ‘Procurement’ (P):
12. More risks will be added to the heat maps as they are assessed. The maps are supported by the summary table as below:
13. The previously held workshops with Councillors have identified a shift in the make-up of the strategic risks facing Council and the level of risk it is prepared to accept (its risk appetite). This is to be expected given that the nature of risk changes over time and risk management should be proactive in identifying and responding to this change.

Audit & Risk Committee 23 November 2021 60 of 144
14. It was agreed at the 23 June 2021 A&R Committee meeting (report 21-131), to recalibrate the Council risk appetite from ‘Minor’ to ‘Moderate’ as based on the risk appetite workshop results. This recalibration is being progressively applied to Council’s strategic risks to determine if they meet Council's risk appetite and their potential impact on mitigation resources if they fall outside Council’s risk appetite. Management is reporting to the A&R Committee on each risk as it is and as part of developing the Internal Audit Plan (hence the completion of Step 3 after the risks have been re-assessed).
15. Identifying the residual risk for each strategic risk area involves management reviewing the relevant risk that it reflects its current risk environment by:
a) Assessing what the inherent risk is using the recalibrated risk consequence matrix. This determines the level of risk inherent in the activity before any actions (controls) are put in place to reduce this risk to an acceptable level (the residual risk that remains, even after something is being done to manage it).
b) Assessing the existing controls to determine how effective they are and what the level of residual risk is as a result.
c) If the residual risk is assessed to be outside Council’s risk appetite, identifying further treatments which, if implemented, will bring the residual risk back within Council’s risk appetite. Further assessment of the treatments potential impact on mitigation resources is completed and approvals sought if treatments are identified to exceed available mitigation resources.
16. This approach for determining the residual risk is best summarised for each strategic risk using the ‘bow tie’ method. A 'bowtie' visualises the risk we are dealing with in one, easy to understand picture. The diagram is shaped like a bowtie, creating a clear difference between proactive and reactive risk management. The bowtie gives an overview of multiple plausible scenarios, in a single picture, which would be much more difficult to explain otherwise. Examples of how a bowtie is applied in practice for ‘Health and Safety’ and ‘Civil Defence’ are contained in Attachment 1.
17. The current degree of confidence under each strategic risk is at various levels: some have been developed with the “bowtie” method and of these, some require updating as there have been changes since the bowtie was done; while there are others that are new strategic risks needing to be started from scratch with their own bowtie completed. Regardless, each strategic risk is being reviewed to bring it into line with our risk appetite.
18. Attachment 1 also demonstrates how the bowtie was used for the residual risk assessment for ‘Health and Safety’ and ‘Civil Defence’. The Inherent Risk of each risk area is identified along with the existing actions (controls) in place to bring that risk level within Council's risk appetite (currently set at ‘Moderate’ across the organisation). Where the risk is determined to be outside Council’s risk appetite, further actions (treatments) are identified to bring the risk level back within Council’s risk appetite. This informs other management activities, including monitoring and assessing the risks and the budget and resource allocation for managing each.

Audit & Risk Committee 23 November 2021 61 of 144
19. As a planning and management approach this enables Council to identify the differences between the ideal activity/asset management requirements and the actual – as adjusted by the budget and resource allocation. The difference should articulate the trade-offs made in resource allocation and how these impact on the activity or asset condition for the forthcoming three-year work programme and beyond.
DISCUSSION and OPTIONS
Health and Safety Strategic Risk
20. The current residual risk level for Health and Safety is assessed as ‘Moderate’ which is within our overall Council risk appetite.
21. This ‘Moderate’ level of risk has been achieved through the introduction of several actions (treatments) since the original H&S risk bowtie was completed in 2020 (Attachment 1). These ‘treatments’ are in progress or have been completed across the following themes:
a) Review of H&S incidents to identify lessons learned and develop improvement actions: Ongoing.
b) Efficient recruitment and training programme in place and implemented: In Progress.
c) Personnel training combined with robust assurance and verification audits: In Progress.
d) Standard Operating Procedures in key areas developed and in place: In Progress.
Civil Defence Strategic Risk
22. The current residual risk level for Civil Defence is assessed as ‘Moderate,’ which is within our overall Council risk appetite.
23. This ‘Moderate’ level of risk has been achieved by revising the existing Civil Defence risk bowtie following the September A&R Committee meeting, resulting in several additional actions (treatments) being added. These ‘treatments’ are proposed or in in progress as follows:
a) Further training is scheduled: In Progress. May require additional budget where specific training is required.
b) Workshop with Councillors to assist clarifying Council CDEM operational responsibilities and accountabilities: Proposed.
c) The existing Civil Defence Risk Bowtie has been updated and the revised draft (Attachment 1) is being reviewed for implementation: In Progress.
d) Establish a natural hazards work programme to monitor and manage natural hazards: Proposed. Scope of work to be determined. May require additional budget and/or re-prioritisation of existing work commitments.
e) Implementation of medium-term actions of 2018/19 CDEM Review Plan recommendations: In Progress. Majority of short-term recommendations implemented but ongoing delivery of full recommendations required. May require additional budget and/or re-prioritisation of existing work commitments.
f) Sharing of local and national expertise and resources to ensure the right level of decision-making experience and competency for an event: In Progress. This will also build relationships and the development of consistent operational platforms between regions.

Audit & Risk Committee 23 November 2021 62 of 144
24. Operationally, the Council is able to meet its Civil Defence commitments, however the current risk assessment identifies the need for continued training to ensure the region has suitably qualified and capable personnel as needed. The training requirements will be further developed within the wider CDEM Group Plan.
25. This active focus on the treatments identified will reduce the residual risk level to ‘Moderate’ which meets the Council’s risk appetite.
ASSESSMENT of SIGNIFICANCEConsideration of consistency with and impact on the Regional Land Transport Plan and its implementationOverall Process: Low SignificanceThis Report: Low Significance
Impacts on Council’s delivery of its Financial Strategy and Long Term PlanOverall Process: Medium SignificanceThis Report: Low Significance
Inconsistency with Council’s current strategy and policyOverall Process: Medium SignificanceThis Report: Low Significance
The effects on all or a large part of the Gisborne districtOverall Process: Medium SignificanceThis Report: Low Significance
The effects on individuals or specific communitiesOverall Process: Medium SignificanceThis Report: Low Significance
The level or history of public interest in the matter or issueOverall Process: Medium SignificanceThis Report: Low Significance
26. This report is part of a process to arrive at a decision that will/may be of Low level in accordance with the Council’s Significance and Engagement Policy.
27. This report is part of the Council risk management process and will inform future Council decision-making across Council functions and therefore the level of significance will be informed by the functions this process is applied to.
TANGATA WHENUA/MĀORI ENGAGEMENT28. The level of engagement has primarily been internally facing to date as the areas of risk
are identified. This will then inform the level of engagement and process for engagement to be followed.
CLIMATE CHANGE – Impacts / Implications29. The outcomes of determining the Council’s strategic risks and risk appetite for each will
inform Council’s decision-making and the allocation of resources to deliver the Long-Term Plan objectives supported by an appropriate risk management strategy and approach.
30. The level of community engagement will be determined by the areas of risk identified and the degree to which they directly affect the community.
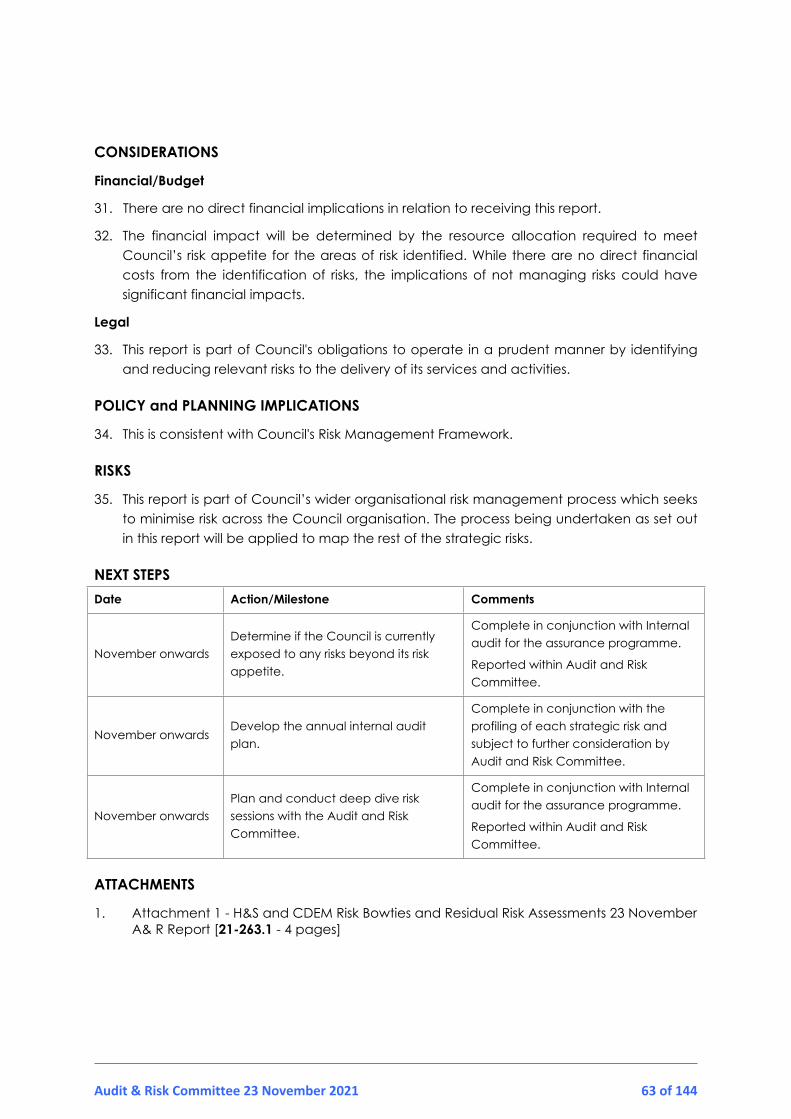
Audit & Risk Committee 23 November 2021 63 of 144
CONSIDERATIONS
Financial/Budget
31. There are no direct financial implications in relation to receiving this report.
32. The financial impact will be determined by the resource allocation required to meet Council’s risk appetite for the areas of risk identified. While there are no direct financial costs from the identification of risks, the implications of not managing risks could have significant financial impacts.
Legal
33. This report is part of Council's obligations to operate in a prudent manner by identifying and reducing relevant risks to the delivery of its services and activities.
POLICY and PLANNING IMPLICATIONS
34. This is consistent with Council's Risk Management Framework.
RISKS
35. This report is part of Council’s wider organisational risk management process which seeks to minimise risk across the Council organisation. The process being undertaken as set out in this report will be applied to map the rest of the strategic risks.
NEXT STEPSDate Action/Milestone Comments
November onwardsDetermine if the Council is currently exposed to any risks beyond its risk appetite.
Complete in conjunction with Internal audit for the assurance programme.
Reported within Audit and Risk Committee.
November onwardsDevelop the annual internal audit plan.
Complete in conjunction with the profiling of each strategic risk and subject to further consideration by Audit and Risk Committee.
November onwardsPlan and conduct deep dive risk sessions with the Audit and Risk Committee.
Complete in conjunction with Internal audit for the assurance programme.
Reported within Audit and Risk Committee.
ATTACHMENTS
1. Attachment 1 - H&S and CDEM Risk Bowties and Residual Risk Assessments 23 November A& R Report [21-263.1 - 4 pages]

Gisborne District Council | Strategic Risk and Assurance Maps
Preventative Action/Controls
1. Policy, framework and reporting align with Worksafe & Safe Places (best practice)
2. Trained, enabled and empowered workforce – culture supports H&S kaupapa
3. Capacity planning across the organisation,budgets are prioritised by managers, and where necessary, COR
4. SHE pre-qualification, contract monitoring and reporting to COR
5. Training and reward (positive recognition for correct behavior)
6. Formal check and review scheduled by Home Safe team with reporting via Vault
Mitigating/Corrective Controls
7. Standard Operating Procedures (SOPs)
8. Staff personal accident insurance and other liability insurances
9. Dedicated and trained crisis management team, succession planning, work prioritisation
10. H&S steering and representative group and communications teamto assist crisis management team with external communications
11. Effective communications from crisis team internally and externally
7 Worksafe investigation, legal action/regulatory sanction, potential fine
8 Financial Impact on victim and victim’s family caused by serious harm or death
9 Loss of productivity
10 Negative impact on the Council’s reputation, loss of public trust and confidence
11 Reduced staff morale and direct impact on victim, family and community
Incomplete Health & Safety framework with ad-hoc due diligence at COR and Council 1
Insufficient training of staff to identify, monitor and report on Health & Safety risks 2
Inadequate Health & Safety resourcing and budget, planning for succession 3
Failure to manage contractors 4
Culture is primarily data driven, rather than behavior-based 5
Deliberate misuse of equipment or serious misconduct 6
Inability to adequately protect council staff and the community, from hazards or events which compromise
their physical and emotional wellbeing, while delivering
Council services
Health and Safety Risk Bowtie and Residual Risk Assessment
Health & Safety Risk Risk Owner: James Baty
Consequence “Then’s”Mitigating ControlRisk EventPreventative ControlCauses “If’s”
Attachment 21-263.1
Audit & Risk Committee 23 November 2021 64 of 144

Health and Safety
Inherent
Risk LevelExisting Controls Control Effectiveness Applicable Categories Likelihood Consequence Result
Residual
Risk Level
Residual risk
outside appetite
(i.e Moderate)
Treatment Options Owner StatusApplicable
CategoriesLikelihood Impact Result
Residual Risk Level
(after treatment)
1. Policy, framework and reporting align with
Worksafe & Safe Places (best practice) Controls are present and effective
H&S incidents are reviewed to identified lessons
learned and develop improvement actions
Homesafe/
ManagersComplete
2. Trained, enabled and empowered
workforce – culture supports H&S kaupapa
Controls ineffective in some areas
Development of LMS system to ensure Managers
are supported (resourced) in team leader and
management roles having clear development
pathways.
Hub
DirectorIn progress
3. Capacity planning across the organisation,
budgets are prioritised by managers, and
where necessary, COR Controls are present and effective
Efficient recruiting process Hub
DirectorIn progress
4. SHE/Totika pre-qualification, contract
monitoring and reporting to COR
Controls ineffective in some areas
Staff training combined with robust assurance
and verification audits
Homesafe/
ManagersIn progress
5. Training and reward (positive recognition
for correct behavior)
Controls ineffective in some areas
Review initiatives - H&S reps acknowledgementHomesafe/
ManagersIn progress
6. Formal check and review scheduled by
Home Safe team with reporting via Vault Controls are present and effective
Full teams in place, Managers and teams trained
& competentHomesafe In progress
7. Standard Operating Procedures (SOPs) Controls ineffective in some areas
SOPs need to be developed within several med-
high risk teams to set clear H&S expectation and
required for staff to meet
Homesafe/
ManagersIn progress
8. Staff personal accident insurance and
other liability insurances Controls are present and effective Ongoing training, recruitment as required
Hub
DirectorIn progress
9. Dedicated and trained crisis management
team, succession planning, work
prioritisation Controls are present and effective
H&S representatives planned 2 year training
regimeHomesafe Complete
10. H&S representative group and
communications team to assist crisis
management team with external
communications Controls are present and effective
11. Effective communications from crisis team
internally and externally Controls are present and effective
Serious ModerateYes Moderate
High
Low
Reputation Unlikely Moderate Moderate
Health, safety &
wellbeing Possible Moderate Moderate
Regulatory and legal
compliancePossible Moderate Moderate
Low
Health, safety &
wellbeing Almost certain Moderate
Regulatory and legal
compliancePossible Minor
Reputation Possible Minor
Attachment 21-263.1
Audit & Risk Committee 23 November 2021 65 of 144
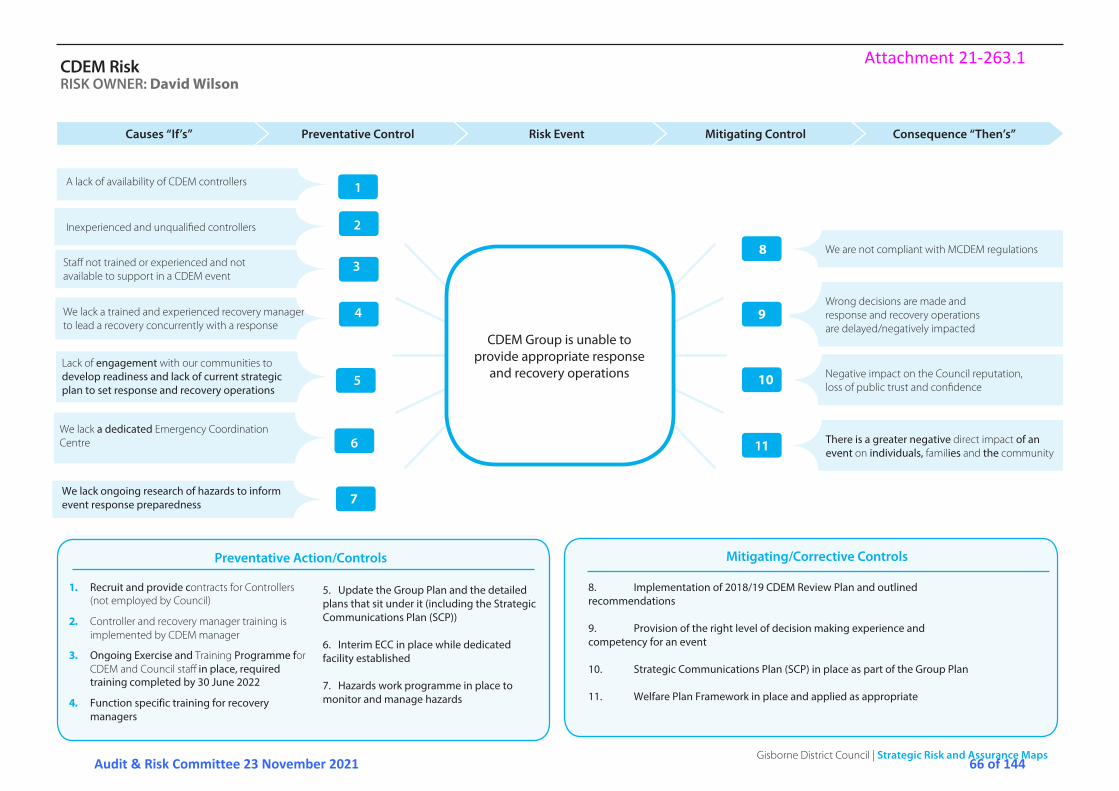
Gisborne District Council | Strategic Risk and Assurance Maps
Preventative Action/Controls
1. Recruit and provide contracts for Controllers (not employed by Council)
2. Controller and recovery manager training is implemented by CDEM manager
3. Ongoing Exercise and Training Programme for CDEM and Council staff in place, required training completed by 30 June 2022
4. Function specific training for recovery managers
5. Update the Group Plan and the detailed plans that sit under it (including the Strategic Communications Plan (SCP))
6. Interim ECC in place while dedicated facility established
7. Hazards work programme in place to monitor and manage hazards
Mitigating/Corrective Controls
8 We are not compliant with MCDEM regulations
9Wrong decisions are made and response and recovery operations are delayed/negatively impacted
10 Negative impact on the Council reputation, loss of public trust and confidence
11 There is a greater negative direct impact of an event on individuals, families and the community
A lack of availability of CDEM controllers 1
Inexperienced and unqualified controllers 2
Staff not trained or experienced and not available to support in a CDEM event
3
We lack a trained and experienced recovery manager to lead a recovery concurrently with a response
4
Lack of engagement with our communities to develop readiness and lack of current strategic plan to set response and recovery operations
5
We lack a dedicated Emergency Coordination Centre 6
CDEM Group is unable to provide appropriate response
and recovery operations
CDEM RiskRISK OWNER: David Wilson
Consequence “Then’s”Mitigating ControlRisk EventPreventative ControlCauses “If’s”
7We lack ongoing research of hazards to inform event response preparedness
8. Implementation of 2018/19 CDEM Review Plan and outlined recommendations
9. Provision of the right level of decision making experience and competency for an event
10. Strategic Communications Plan (SCP) in place as part of the Group Plan
11. Welfare Plan Framework in place and applied as appropriate
Attachment 21-263.1
Audit & Risk Committee 23 November 2021 66 of 144

Civil Defence Residual Risk Assessment
Attachment 21-263.1
Audit & Risk Committee 23 November 2021 67 of 144

Audit & Risk Committee 23 November 2021 68 of 144
11.4. 21-265 Compliance Monitoring and Enforcement Metrics 2020/2021
21-265
Title: 21-265 Compliance Monitoring and Enforcement Metrics 2020/2021
Section: Compliance & Enforcement
Prepared by: Gary McKenzie - Compliance Monitoring and Enforcement Manager
Meeting Date: Tuesday 23 November 2021
Legal: No Financial: No Significance: Low
Report to AUDIT & RISK Committee for informationThe purpose of this report is to provide information to the Committee on the results of the Compliance Monitoring and Enforcement Metrics Report (CME Metrics) 2020/2021 (Attachment 1).
PURPOSE
The CME Metrics report is an annual report put together by the Compliance and Enforcement Special Interest Group (CESIG) which is made up of Compliance, Monitoring and Enforcement Managers (CME) from both regional and unitary councils across New Zealand. The purpose of the report is to measure our own performance and look at areas where we may need to improve. The result of the report impacts the programme of work that each council has.
The questions around the number of consents monitored do not reflect the actual work that the Compliance team do. The questions in this report relate to the regional function of council only and do not capture the number of district consents monitored by staff. The Compliance Officers also deal with enforcement matters that take a considerable amount of staff’s time.
To give some context, the Compliance and Monitoring team was created following an internal review in 2018. What was once district-only compliance monitoring became monitoring for both District and Regional consents. Due to these changes more resourcing was required, and the focus was put on developing new procedures and education programmes around the various activities. These programmes are continuously being developed and we are seeing a lot more consent compliance, but we are also able to detect more breach of the Tairāwhiti Resource Management Plan rules.
To give a snapshot of how the Compliance team is continuing to improve, the team have achieved the following in the last financial year:
40 Warnings issued 35 Abatement Notices Issued 3 Infringement Fines Issued (This figure does not include infringements issued for freedom
camping offences) 1 Enforcement Order application

Audit & Risk Committee 23 November 2021 69 of 144
5 Prosecutions concluded 1 Prosecution in progress 194 Environmental Incidents responded to 681 Regional Consents monitored
The decisions or matters in this report are considered to be of Low significance in accordance with the Council’s Significance and Engagement Policy.
RECOMMENDATIONS
That the Audit & Risk Committee:
1. Notes the contents of this report.
Authorised by:
Helen Montgomery - Director Environmental Services & Protection
Keywords: Compliance, monitoring, enforcement

Audit & Risk Committee 23 November 2021 70 of 144
BACKGROUND1. The Compliance Monitoring and Enforcement (CME) Metrics Report is an annual report
produced by the Compliance and Enforcement Special Interest Group (CESIG). CESIG membership includes CME managers from the 16 regional and unitary authorities across New Zealand. The purpose of the report is to provide insight and improvement to CME delivery and share best practice across the sector. The driver behind initiating these voluntary reports was the self-identified need for greater consistency and best practice across resource management regulation.
2. The report is made available to the public on Local Government New Zealand’s website. This is the fourth report that has been produced by CESIG. Regional and unitary councils across New Zealand administer over 280,000 active resource consents each year (Council administers around 9,000 consents). The sector achieved an 83% national average in consents that required monitoring under the Resource Management Act. This is despite the disruption caused by COVID-19.
3. Council participates in the CME Metrics report to measure our performance in compliance, monitoring and enforcement and assess which areas we may need to focus more attention on and introduce improvements. The results from the report influence the Council’s overall programme of work.
DISCUSSION and OPTIONS4. New Government regulations alongside an increase in the number of consents that
require monitoring has increased the volume of work at both the sector and local level. This increase is not expected to taper off for some time. Key areas driving the increase in monitoring are forestry, water takes, industrial activities, freshwater, biodiversity, and resource management.
5. For the number of consents monitored it is important to note that for some consents the monitoring requires multiple site visits to be considered a completed monitoring action.
6. One area that is absent from the report is the time and resource required for enforcement matters. This currently absorbs a lot of Council’s available resources. Timesheets detailing the time spent dealing with enforcement issues are kept by staff of the Compliance team.
7. As noted above to give a snapshot of how the Compliance team is continuing to improve, some of the key achievements in the last financial year:
(a) 40 Warnings issued.(b) 35 Abatement Notices Issued.(c) 3 Infringement Fines Issued (This figure does not include infringements issued for
freedom camping offences).(d) 1 Enforcement Order application.(e) 5 Prosecutions concluded.(f) 1 Prosecution in progress.(g) 194 Environmental Incidents responded to.(h) 681 Regional Consents monitored.

Audit & Risk Committee 23 November 2021 71 of 144
8. It is important to note that during 2020/21 we had a period where we were unable to monitor due to the COVID-19 restrictions.
ASSESSMENT of SIGNIFICANCE
9. The decisions or matters in this report are considered to be of Low significance in accordance with Council’s Significance and Engagement Policy.
TANGATA WHENUA/MĀORI ENGAGEMENT
10. There has been no engagement with tangata whenua or Māori in the preparation of this report or the CME Metrics report.
COMMUNITY ENGAGEMENT
11. There has been no engagement with the community in the preparation of this report or the CME Metrics report.
CLIMATE CHANGE – Impacts / Implications
12. There are no climate change implications from the preparation of the CME Metrics report.
CONSIDERATIONS
Financial/Budget
13. There are no financial implications for the preparation of the CME Metrics report.
Legal
14. There are no legal requirements for the preparation of the CME Metrics report.
POLICY and PLANNING IMPLICATIONS
15. There are no policy and planning implications due to the preparation of the CME Metrics report.
16. The results of the report are used to inform areas to direct attention to within councils CME function. The majority of the improvements are about operational methods rather than policy and planning processes.
RISKS
17. There are no major risks associated with the matters.
ATTACHMENTS
1. Attachment 1 - CME Metrics Report 2020/2021 [21-265.1 - 72 pages]

ANALYSIS OF THE
2020/2021COMPLIANCE MONITORING AND ENFORCEMENTMETRICS FOR THE REGIONAL SECTOR
PREPARED BY
Attachment 21-265.1
Audit & Risk Committee 23 November 2021 72 of 144

FOREWORD
Michael McCartney Chief Executive Officer at Horizons Regional Council
Kia ora,
Every year the councils of Aotearoa’s regional sector commission a report to measure our own performance in the areas of compliance, monitoring and enforcement, associated with our role under the Resource Management Act.
Compliance, monitoring and enforcement isn’t done for it’s own sake. Our work programmes are some of the key drivers we use to support positive behaviour change and positive outcomes on behalf of New Zealand’s environment.
This is the fourth year of these annual reports with a different appearance this year. Trends in individual CME metrics are becoming more evident.
When compared to the last three years, it was ‘business as usual’ in the 2020-21 year and there’s a consistent delivery of CME work streams across New Zealand. It is great to see more people working in CME roles across the sector since the last report, actively monitoring, responding to and enforcing in favour of the environment. By tracking and providing these metrics on our work, we’re seeing for ourselves an improving record of environmental regulation as well as opportunities for improvement.
The analysis that follows will be a useful reference for the reform that is currently taking place around resource management, Three Waters (stormwater, waste water and drinking water) and the review of Local Government.
The solid evidence base of these metrics in relation to compliance, monitoring and enforcement can assist informed decision-making, both nationally and at a regional level.
Readers should have confidence in our commitment to continuous improvement. The Compliance and Enforcement Special Interest Group (CESIG) is made up from relevant representatives of regional and unitary councils in New Zealand. We will continue to support the funding of this annual survey as we explore ways to improve our own performance and get the most intelligence from what the survey tells us year on year.
Ngā mihi nui
Analysis of the 2020 / 2021 compliance monitoring and enforcement metrics for the regional sector
PAGE 2
Attachment 21-265.1
Audit & Risk Committee 23 November 2021 73 of 144

SUMMARY
OF COMPLAINTSRESPONDED TO
99%
542 FTE’sin CME roles
! !
283,470 active resource
consents
Councils monitored an average of 83% of all consents that required monitoring under the RMA83%
802 formal warnings
5,225 abatement notices
2,150 infringement
fines
Up 11% from last
year
enforcement orders
prosecutions (71 in progress)
$5,187,565 in fines
9545 individuals convicted
1875 corporates convicted
Analysis of the 2020 / 2021 compliance monitoring and enforcement metrics for the regional sector
PAGE 3
Attachment 21-265.1
Audit & Risk Committee 23 November 2021 74 of 144

CONTENTS
PART 1 - INTRODUCTION
Reading this report w6
How does this reporting process differ year on year? 7
Data limitations 7
CME under the Resource Management Act New Zealand 7
PART 2 - ANALYSIS
Regional Context 8
Working with Iwi 9
CME Operations (managing the workload) 10
Registering notifications 10
Complaints received 11
Complaints responded to & attended 11
Confirmed breaches 14
Monitoring resource consents 15
Compliance gradings 17
Compliance assessment 17
Monitoring permitted activities 22
Making decisions on priorities 23
Staffing levels 24
CME Policies and Procedures 30
Educating and Engaging with the Regulated Community 33
Acting on Non-Compliance 34
Prosecutions 39
Penalties 43
CME Reporting 47
PART 3 - REGIONAL SCORECARDS 48
APPENDIX 1 – METRICS SURVEY QUESTIONS 66
APPENDIX 2 - LONG FORM RESPONSES (QUESTION 3) 71
Table 1: Percentage and types of breaches 14
Table 2: Total consents that require monitoring 16
Table 3: Council FTEs for different aspects of the CME role 26
Table 4: Comparison of council FTEs, population and number of formal actions
27
Table 5: Decision making process and delegation to authorise filing of charges
31
Analysis of the 2020 / 2021 compliance monitoring and enforcement metrics for the regional sector
PAGE 4
Attachment 21-265.1
Audit & Risk Committee 23 November 2021 75 of 144

Table 6: Total use of formal instruments against relevant section of the Act
35
Table 7: Other sanctions handed down under the RMA 43
Table 8: Prosecution outcomes: fines 44
Table 9: Prosecutions Involving Other Sanctions Imposed by Courts 45
Table 10: Prosecutions Involving Restorative Justice, Diversion or Other Alternative Justice
46
Table 11: CME reporting channels 47
Figure 1: Regional context data 8
Figure 2: Recording conventions for incoming complaints across the regional sector
10
Figure 3: Number of individual complaints and incidents 12
Figure 4: Number of individual complaints and incidents responded to and physically attended.
13
Figure 5: Total number of consents in different categories of compliance on a per monitoring event basis
18
Figure 6: Percentages of consents in full compliance, low risk/ technical non compliance, moderate non compliance and significant non compliance on a per monitoring event basis.
20
Figure 7: Nationwide percentages of consents in full compliance, low risk/ technical non compliance, moderate non compliance and significant non compliance on a per monitoring event basis.
21
Figure 8: Proportion of permitted activity monitoring programmes for different industries
22
Figure 9: Council FTEs in CME roles 25
Figure 10: Comparison of CME resourcing and number of formal enforcement actions
28
Figure 11: Comparison of CME resourcing and GDP 29
Figure 12: Total use of formal instruments 36
Figure 13: Total formal warnings and abatement notices 37
Figure 14: Total infringement notices and enforcement orders 38
Figure 15: Prosecutions across the regional sector 40
Figure 16: Individuals convicted across the regional sector 41
Analysis of the 2020 / 2021 compliance monitoring and enforcement metrics for the regional sector
PAGE 5
Attachment 21-265.1
Audit & Risk Committee 23 November 2021 76 of 144

INTRODUCTIONPART 1
This report is the fourth report in a series of reports aimed at increasing information available to the sector. Improving the availability of CME functions information is a sector-led effort, under the leadership of CESIG. The questions are designed by the regional sector with the aim of improving and complementing the present national monitoring system’s compliance, monitoring and enforcement related questions and analysis.
All 16 of New Zealand’s regional councils and unitary authorities (the ‘regional sector’) have participated since 2018. Each year we see three distinct groups within the regional sector Auckland Council, the small unitary councils and the regional councils.
CME is a tool in achieving the purpose of the RMA. The RMA is New Zealand’s environmental legislation with the purpose of sustainably managing natural and physical resources. Regional councils, unitary authorities and territorial local authorities have the primary role in compliance, monitoring and enforcement of the Resource Management Act 1991 (RMA).
In February this year the government announced it would repeal the RMA and enact new legislation based on the recommendations of the Resource Management Review Panel, replacing it with three new pieces of legislation. This will be based on the Natural and Build Environments Act, Strategic Planning Act and the Climate Adaption Act.
Monitoring and understanding implementation remains critical to understanding our nations environmental management. The success of that management is largely dependent on the quality of implementation.
In this reporting period we must acknowledge COVID-19 and the impact it is having worldwide. In June 2020 New Zealand was through the initial nationwide lockdown. During the lockdown periods CME monitoring is considered an essential service, so continues as ‘normal’ but this is not at 100%. This year the most significant impacts are to the Auckland Region who went into Alert level 3 on the following dates:• 12th August to the 30th August• 14th of February to the 17th of February• 28th February to the 7th of March
Reading this reportEach council was sent an online survey comprising 44 questions (Appendix 1). They were given 2 weeks to collect and input the data into an online platform. After inputting the initial data, they were sent a link that allowed them to log in and change their information at any time. This report sets out data provided for each section of the survey, as follows: • A short analysis of the findings, at both a regional and national scale • The tables and graphs of the information• A boxed section containing the exact questions relevant to that section• Responses to open-ended questions have been aggregated and analysed and the theme of the response presented
in this report. • Verbatim answers are provided where responses can not be summarised
Analysis of the 2020 / 2021 compliance monitoring and enforcement metrics for the regional sector
PAGE 6
Attachment 21-265.1
Audit & Risk Committee 23 November 2021 77 of 144
How does this reporting process differ year on year?The quest ionnaire has not dif fered fol lowing year two, this al lows us to track the successes and improvements over t ime. For this reason, it is cr it ical the consistency is maintained.
Fol lowing the f i r st year there were s ignif icant learnings and improvements to the quest ionnaire, the quest ionnaire was ref ined based on these improvements .
Throughout this document we have aimed to repor t data from previous years so we can see patterns when they are ar is ing. In year two quest ions were condensed and rearranged, with the purpose of enr iching the data by ensur ing clar ity in wording. This year ’s format fol lows year two, meaning al l result s are direct ly comparable.
In year one and two the repor t was conducted by independent consultant Dr Marie Doole. From year three onwards col lect ion and repor t ing was conducted by Sprout Customer Research.
Data limitationsRepor t ing of act ivit ies in complex, ref lect ive measures can be dif f icult . When reading the repor t keep in mind the fol lowing aspects and data:
• Not all requested information can be provided by all councils which results in gaps in the dataset. • The project does not include any data auditing and it is therefore unknown how accurate the information provided
by councils is. Each council had a representative that sense checked and was responsible for the final data points entered into the survey.
• Throughout the report there are some instances where the way a council reports has changed or improved. Making the data incomparable to prior years.
CME under the Resource Management Act New ZealandThis repor t is a sector led ef for t by the Compliance and Enforcement Special Interest Group (CESIG). It aims to improve the qual ity of information avai lable on the CME functions . Whilst the data set is not per fect it provides interest ing insight into CME operations under the RMA and, it ’s value increases year on year. As we enter the four th year we are seeing trends ar is ing. The outcomes of improvements made by individual counci ls to improve how they implement CME is also evident .
Implementation of CME and the way it is adopted and exercised is up to individual counci ls under the broad framework of the RMA . Implementation in a robust manner leads to posit ive environmental outcomes . L imited national direct ion has placed an emphasis on individual counci ls to develop their own operations under the relat ively broad framework of the RMA . This role has developed dif ferent ly over the jur isdict ions . The regions also dif fer based on GDP, area, population and population growth.
As the sector develops , formalisat ion and standardisation of parameters have been developed. In 2018, the Ministr y re leased Best Practise Guidel ines , this has been inf luential in forming standardised and comparable measures .
Compliance: adherence to the RMA, including the rules established under regional and district plans and meeting resource consent conditions, regulations and national environmental standards.
Monitoring: the activities carried out by councils to assess compliance with the RMA. This can be proactive (e.g., resource consent or permitted activity monitoring) or reactive (e.g., investigation of suspected offences).
Enforcement: the actions taken by councils to respond to non-compliance with the RMA. Actions can be punitive (seek to deter or punish the offender) and/or directive (e.g. direct remediation of the damage or ensure compliance with the RMA).
Key definitions
Analysis of the 2020 / 2021 compliance monitoring and enforcement metrics for the regional sector
PAGE 7
Attachment 21-265.1
Audit & Risk Committee 23 November 2021 78 of 144

ANALYSISPART 2
REGIONAL CONTEXTThe graph below shows the diversity of the regions reported on. Regionally New Zealand is diverse and contextual ly there are large differences.
The population of Auckland is more than double other regions. To demonstrate the diversity of the differences in population the West Coast is home to the equivalent of 2% of Auckland’s population. Population in the West Coast is decl ining, in other regions we see an increase.
The Southmost regions (Southland, Canterbury and Otago) cover the largest geographical area. The area Nelson covers is considerably lower than the rest of New Zealand.
NORTHLAND REGIONAL COUNCIL
WAIKATO REGIONAL COUNCIL
TARANAKI REGIONAL COUNCIL
HORIZONS REGIONAL COUNCIL
AUCKLAND COUNCIL
POPULATIONPOP CHANGE
AREAREGIONAL GDP
POPULATIONPOP CHANGE
AREAREGIONAL GDP
POPULATIONPOP CHANGE
AREAREGIONAL GDP
POPULATIONPOP CHANGE
AREAREGIONAL GDP
POPULATIONPOP CHANGE
AREAREGIONAL GDP
192,50013%13,778km2
$8,222m
492,10013%24,147km2
$27,884m
124,0007%7,256km2
$9,513m
252,0007%22,220km2
$12,426m
1,702,70011%5,945km2
$122,557m
BAY OF PLENTY REGIONAL COUNCIL
HAWKES BAY REGIONAL COUNCIL
GREATER WELLINGTON REGIONAL COUNCIL
GISBORNE DISTRICT COUNCIL
POPULATIONPOP CHANGE
AREAREGIONAL GDP
POPULATIONPOP CHANGE
AREAREGIONAL GDP
POPULATIONPOP CHANGE
AREAREGIONAL GDP
POPULATIONPOP CHANGE
AREAREGIONAL GDP
333,50015%12,303km2
$18,884m
177,2009%14,138km2
$9,093m
538,5008%8,412km2
$40,272
50,5006%8,386km2
$2,299m
SOUTHLAND REGIONAL COUNCIL
TASMAN DISTRICT COUNCIL
WEST COAST REGIONAL COUNCIL
POPULATIONPOP CHANGE
AREAREGIONAL GDP
POPULATIONPOP CHANGE
AREAREGIONAL GDP
POPULATIONPOP CHANGE
AREAREGIONAL GDP
102,3005%32,184km2
$6,718m
56,40010%9,764km2
$6,005m
32,400-2%23,277km2
$1,836m
Figure 1: Regional context data
MARLBOROUGH DISTRICT COUNCIL
NELSON CITY COUNCIL
ENVIRONMENT CANTERBURY
POPULATIONPOP CHANGE
AREAREGIONAL GDP
POPULATIONPOP CHANGE
AREAREGIONAL GDP
POPULATIONPOP CHANGE
AREAREGIONAL GDP
49,9009%10,773km2
$3,290m
54,60010%477km2
$6,005m
641,20011%44,633km2
$39,961m
OTAGO REGIONAL COUNCILPOPULATIONPOP CHANGE
AREAREGIONAL GDP
243,00013%31,280$14,180mRegional CouncilsUnitary Authorities
Analysis of the 2020 / 2021 compliance monitoring and enforcement metrics for the regional sector
PAGE 8
Attachment 21-265.1
Audit & Risk Committee 23 November 2021 79 of 144

WORKING WITH IWI
Having good relationships with iwi and hapū is becoming increasingly important as we str ive towards proper recognit ion to the principles of Te Tir it i of Waitangi and providing greater recognit ion of te ao Māori including mātauranga Māori in the RM reform.
Qualitative reports show there is a commitment from counci ls to strengthen these relationships. Majority of counci ls have formalized agreements or are actively working towards these; four counci ls have no formal agreements.
Many councils:• Advise iwi i f major incident occurs or advise when an incident occurs in waterways• Have iwi involvement in cultural impact assessment• Iwi provide victim impact statements for sentencing
Other commitments included:• Appointed iwi representatives• Paid advisory roles• Posit ions on committees or counci l• Working parties• Identifying iwi prior it ies as part of decis ion making• On going co design processes with mana whenua• Planning and pol icy interactions• Iwi involvement in operational meetings• Meetings with iwi to discuss opportunit ies for iwi and hapū to be involved in compliance and
monitoring• Joint work programs to identify where counci l and iwi can work together to improve incident
response, compliance and enforcement• Mutual education on compliance monitoring• Involvement in monitoring• Involvement of iwi in notif ied consents• Involvement in consents management (or sent consent applications)• Financial support from counci ls to bui ld environmental monitoring capacity• Reporting to iwi on CME (summary updates of enforcement actions (prosecutions, enforcement
orders, abatement notices and infr ingement notices)
Northland Regional Counci l and Southland Regional Counci l show strong commitments to iwi on CME based on historical partnerships.
“Environment Southland, refers to the iwi relationship as te kōura tuia – the ‘golden thread’ that we weave through al l our work. It’s just part of how we operate. There is a commitment to the responsibi l ity of improving Southland’s local government understanding of al l things Māori .”
A ful l set of responses is avai lable in appendix 2.
Question 4: In no more than 300 words describe your regional key commitments to work with iwi/Māori on CME. For example, joint management agreements or other co-management agreements.
Analysis of the 2020 / 2021 compliance monitoring and enforcement metrics for the regional sector
PAGE 9
Attachment 21-265.1
Audit & Risk Committee 23 November 2021 80 of 144

CME Operations - managing the workload
Registering notifications Complaints are registered by individual councils in one of two ways, either as individual incidents or by event. The 2017/2018 report recommends it would be optimal for the sector to work towards a standardised approach.
This year 3 councils have changed the way they register complaints West Coast and Gisborne all opted to change to one incident per event. Horizons changed to an individual incident per notification. Majority of councils now register an “incident“ per notification.
An individual “incident” per notification
One incident per event, regardless of the number of separate complainants
Both an individual “incident” per notification and one incident per event, regardless of the number of separate complainants
Recording conventions for incoming complaints
Question 5. Does your council register/count: • An individual “incident” per notification?
• One incident per event, regardless of the number of separate complainants?
Figure 2: Recording conventions for incoming complaints across the regional sector
Analysis of the 2020 / 2021 compliance monitoring and enforcement metrics for the regional sector
PAGE 10
Attachment 21-265.1
Audit & Risk Committee 23 November 2021 81 of 144

NATIONWIDE COMPLAINTS
RESPONDED TO99%
PHYSICALLY ATTENDED
63%
Complaints receivedNationwide there continues to be a large variation, explained by the contextual differences of regions. At first glance the regional individual complaints look like they are on an upward trend, however this can be accounted for by Horizons Regional Council individual complaints. Similarly at first glance individual complaints appear to be increasing, Southland now have individual incidents. Gisborne’s incidents exclude 1,276 noise complaints accounting for the variation from last year.
Significant points of interest include are the • An increase in complaints for Environment Canterbury (642) and Waikato (495) • A decrease in complaints from Auckland (1,900) and Otago (326) • An increase in incidents from Environment Canterbury (564)• A decrease in incidents in Northland (208)
Complaints Responded & AttendedNearly all complaints made to councils were responded to. Councils responded to 100% of complaints with the exception of 2 regional councils Bay of Plenty responded to 99% of complaints, Environment Canterbury responded to 87% of complaints.
The percentage of events physically attended increases year on year, with the West Coast Regional Council and Southland Regional Council physically attending an increasing number if incidents. This year Gisborne District Council provided data, having the second highest percentage behind Taranaki Regional Council (100% physically attended).
CONFIRMED ASA BREACH
29%
Question 6. How many notifications (complaints) were received from members of the public (or other sources, but excluding information from council monitoring activity) relating to environmental incidents or potential breaches of environmental regulation? This might include information from, for example, emergency services attending an incident or perhaps a council staff member observing something while on other duties but excludes information from council monitoring activity. Please note answer unknown if your council does not record the information requested.
Question 7. How many of these notifications were responded to by council? This response may be in any form – e.g. phone call, site visit, desktop audit.
Question 8. How many of these notifications were physically attended by council staff?
If one incident had multiple visits, only count this as one.
Analysis of the 2020 / 2021 compliance monitoring and enforcement metrics for the regional sector
PAGE 11
Attachment 21-265.1
Audit & Risk Committee 23 November 2021 82 of 144
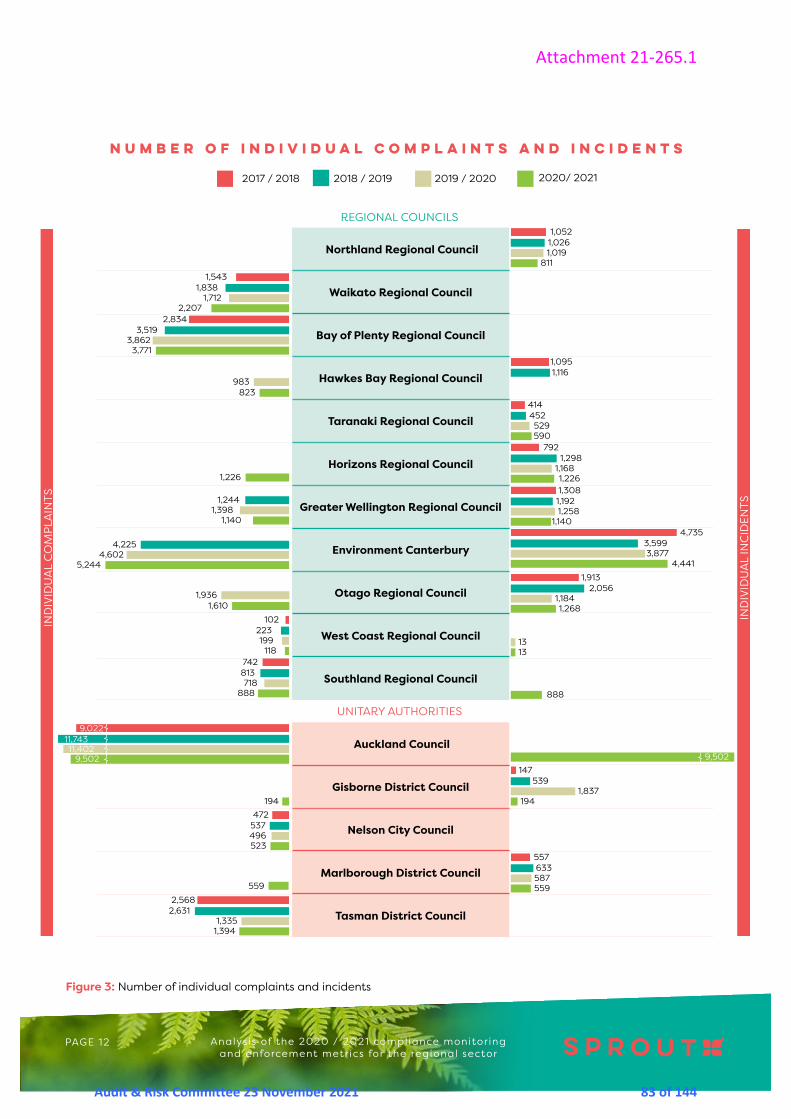
Northland Regional Council
Waikato Regional Council
Bay of Plenty Regional Council
Hawkes Bay Regional Council
Taranaki Regional Council
Horizons Regional Council
Greater Wellington Regional Council
Environment Canterbury
Otago Regional Council
West Coast Regional Council
Southland Regional Council
Auckland Council
Gisborne District Council
Nelson City Council
Marlborough District Council
Tasman District Council
1,052
414
792
1,913
1,308
4,735
147
557
1,095
1,026
452
1,298
2,056
1,192
3,599
539
633
1,116
1,019
529
1,168
1,184
1,258
3,877
1,837
587
13
811
590
1,226
1,268
1,226
1,140
4,441
194
559
13
888
2017 / 2018 2018 / 2019 2019 / 2020 2020/ 2021
1,543
983
1,838
823
1,7122,207
2,834
102
742
472194
559
2,568
3,519
1,244
4,225
223
813
537
2,631
3,862
1,398
4,602
199
718
496
1,335
3,771
1,140
5,244
118
888
523
1,394
Number of individual complaints and incidents
Figure 3: Number of individual complaints and incidents
9,02211,74311,402
9,502
IND
IVID
UA
L C
OM
PLA
INTS
IND
IVID
UA
L IN
CID
ENTS
UNITARY AUTHORITIES
REGIONAL COUNCILS
9,502
1,9361,610
Analysis of the 2020 / 2021 compliance monitoring and enforcement metrics for the regional sector
PAGE 12
Attachment 21-265.1
Audit & Risk Committee 23 November 2021 83 of 144

Northland Regional Council 811 100%
Waikato Regional Council 2,207 100%
Bay of Plenty Regional Council 3,736 99%
Hawkes Bay Regional Council 823 100%
Taranaki Regional Council 590 100%
Horizons Regional Council 1,226 100%
Greater Wellington Regional Council 1,140 100%
Environment Canterbury 3,877 87%
Otago Regional Council 1,610 100%
West Coast Regional Council 131 100%
Southland Regional Council 888 100%
Auckland Council 9,502 100%
Gisborne District Council 194 100%
Nelson City Council 523 100%
Marlborough District Council 559 100%
Tasman District Council 1,394 100%
TOTAL/OVERALL AVERAGE 23,211 99%
UNITARY AUTHORITIES
REGIONAL COUNCILSREPONDED TO
2020/2021 PHYSICALLY ATTENDED
NUMBER OF INDIVIDUAL COMPLAINTS RESPONDED TO AND PHYSICALLY ATTENDED
67%
20%
NO DATA
NO DATA
NO DATA
NO DATA
NO DATA
NO DATA
NO DATA
NO DATA
100%
23%
42%
39%
51%
70%
48%
57%
68%
28%
48%
100%
31%
39%
37%
52%
38%
51%
50%
68%
33%
39%
100%
33%
31%
63%
59%
100%
49%43%
51%
67% (545)
29% (634)
100% (590)
39% (482)
32% (1,428)
82% (108)
77% (684)
85% (165)
43%
63% (4,877)
Figure 4: Number of individual complaints and incidents responded to and physically attended.
2017 / 2018
2018 / 2019
2019 / 2020
2020/ 2021
Analysis of the 2020 / 2021 compliance monitoring and enforcement metrics for the regional sector
PAGE 13
Attachment 21-265.1
Audit & Risk Committee 23 November 2021 84 of 144

10%
58%
50%
16%
30%
23%
28%
55%
90%
42%
50%
84%
70%
NA
NA
45%
Resource consentNon-consented
activity
Confirmed breachesThe average confirmed breaches has remained relatively stable year on year, on both unitary and regional levels. Year on year Waikato Regional Council shows a consistent increase in notifications confirmed as breaches. Environment Canterbury shows a decrease on last year, this year breaches are inline with year 2018/2019. No data was provided by Auckland Council.
Northland Regional Council 48% 42% 47% (379)
Waikato Regional Council 24% 7% 26% 37% (810)
Bay of Plenty Regional Council 25% 20% 23% (866)
Hawkes Bay Regional Council
Taranaki Regional Council 37% 37% 40% 39% (233)
Horizons Regional Council
Greater Wellington Regional Council 17% 15% 18% 19% (213)
Environment Canterbury 23% 29% 68% 24% (1,085)
Otago Regional Council
West Coast Regional Council 50% 41% 17% 21% (28)
Southland Regional Council 17% 18% 29% 34% (298)
Auckland Council 29% 22%
Gisborne District Council 35% (67)
Nelson City Council 70%
Marlborough District Council 34% 23% 21% 22% (122)
Tasman District Council
TOTAL AVERAGE 40% 27% 27% 29% (4,101)
REGIONAL COUNCIL
Percentage of CONFIRMED BREACHES
NO DATA
NO DATA
100%85% (165)
2017
/ 2
018
2018
/ 2
019
2019
/ 2
020
2020
/ 20
21
Question 9. How many of these notifications were confirmed as breaches of the RMA or subsidiary instruments?
Question 10. How many of the breaches were for:Breach of a resource consent?Breach of permitted activity rules?
UNITARY AUTHORITIES
Table 1: Percentage and types of breaches
Analysis of the 2020 / 2021 compliance monitoring and enforcement metrics for the regional sector
PAGE 14
Attachment 21-265.1
Audit & Risk Committee 23 November 2021 85 of 144

NATIONWIDE COMPLIANCE INSPECTIONS
Monitoring resource consentsThis year the number of consents increases a further 11% bringing the total active consents to 283,470.
While it appears that consents that require monitoring are decreasing, Auckland and Waikato were unable to provide data this year. Annually Auckland has the largest consent volumes, this year they have confirmed consent volumes including those that require monitoring have increased but could not provide accurate figures. The largest increases in consents that require monitoring is Southland Regional Council (1,793 more). Environment Canterbury (3,096 less), and Tasman District Council (1,448 less) reported significantly less consents that required monitoring.
For the majority, the proportion monitored is on a par with last year. All regional councils monitored over 70% of consents that required monitoring. Unitary authorities monitored around 60% or above.
Marlborough District Council has a lower proportion monitored (active consents and those that required monitoring were on par with previous years). Gisborne provided data this year.
PERCENTAGE MONITORED
REQUIRED MONITORINGCONSENTS 83%38,214283,470
Question 11. How many individual, active resource consents exist in your region? Exclude Land Use Consents where the activity is completed e.g., Land use subdivisions where the subdivision is complete, and certificates issued or land use – building where the building has been constructed.
Question 12. How many consents required monitoring during this period, in accordance with your monitoring prioritisation model/strategy?
Question 13. How many of these consents were monitored (including desktop audit) in the period?
Analysis of the 2020 / 2021 compliance monitoring and enforcement metrics for the regional sector
PAGE 15
Attachment 21-265.1
Audit & Risk Committee 23 November 2021 86 of 144
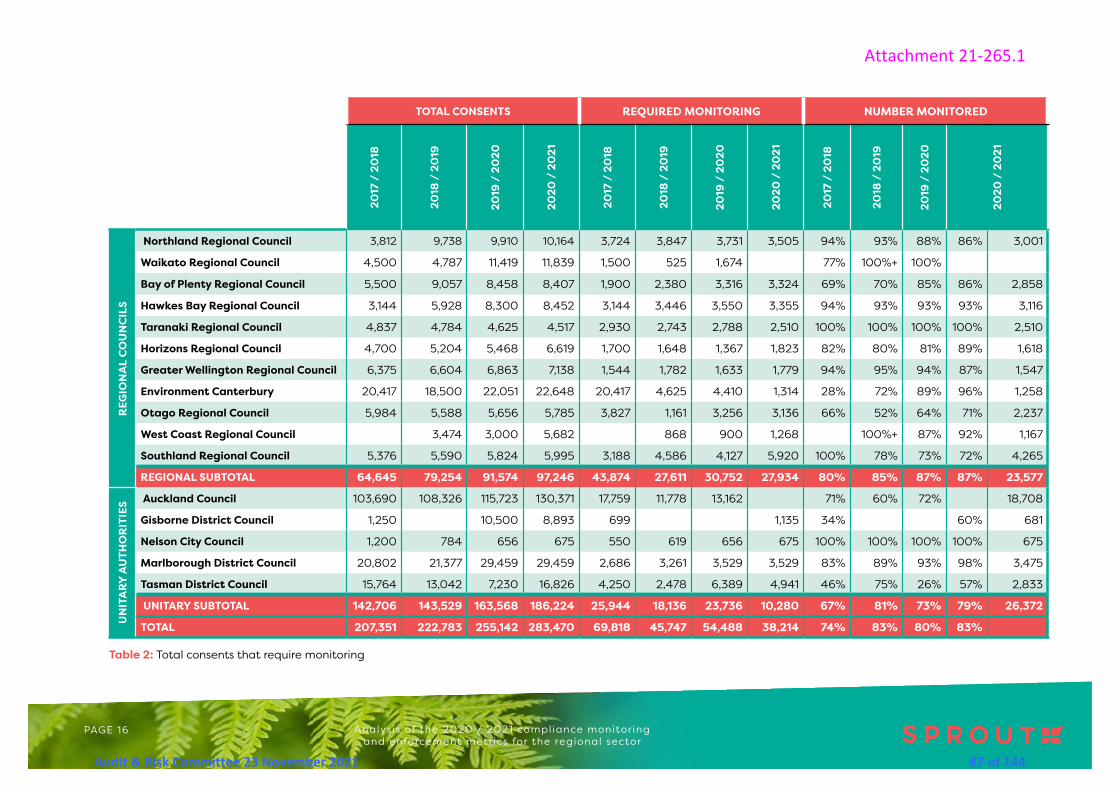
Analysis of the 2020 / 2021 compliance monitoring and enforcement metrics for the regional sector
PAGE 16
TOTAL CONSENTS REQUIRED MONITORING NUMBER MONITORED
2017
/ 2
018
2018
/ 2
019
2019
/ 2
020
2020
/ 2
021
2017
/ 2
018
2018
/ 2
019
2019
/ 2
020
2020
/ 2
021
2017
/ 2
018
2018
/ 2
019
2019
/ 2
020
2020
/ 2
021
REG
ION
AL
CO
UN
CIL
S
Northland Regional Council 3,812 9,738 9,910 10,164 3,724 3,847 3,731 3,505 94% 93% 88% 86% 3,001
Waikato Regional Council 4,500 4,787 11,419 11,839 1,500 525 1,674 77% 100%+ 100%
Bay of Plenty Regional Council 5,500 9,057 8,458 8,407 1,900 2,380 3,316 3,324 69% 70% 85% 86% 2,858
Hawkes Bay Regional Council 3,144 5,928 8,300 8,452 3,144 3,446 3,550 3,355 94% 93% 93% 93% 3,116
Taranaki Regional Council 4,837 4,784 4,625 4,517 2,930 2,743 2,788 2,510 100% 100% 100% 100% 2,510
Horizons Regional Council 4,700 5,204 5,468 6,619 1,700 1,648 1,367 1,823 82% 80% 81% 89% 1,618
Greater Wellington Regional Council 6,375 6,604 6,863 7,138 1,544 1,782 1,633 1,779 94% 95% 94% 87% 1,547
Environment Canterbury 20,417 18,500 22,051 22,648 20,417 4,625 4,410 1,314 28% 72% 89% 96% 1,258
Otago Regional Council 5,984 5,588 5,656 5,785 3,827 1,161 3,256 3,136 66% 52% 64% 71% 2,237
West Coast Regional Council 3,474 3,000 5,682 868 900 1,268 100%+ 87% 92% 1,167
Southland Regional Council 5,376 5,590 5,824 5,995 3,188 4,586 4,127 5,920 100% 78% 73% 72% 4,265
REGIONAL SUBTOTAL 64,645 79,254 91,574 97,246 43,874 27,611 30,752 27,934 80% 85% 87% 87% 23,577
UN
ITA
RY A
UTH
OR
ITIE
S Auckland Council 103,690 108,326 115,723 130,371 17,759 11,778 13,162 71% 60% 72% 18,708
Gisborne District Council 1,250 10,500 8,893 699 1,135 34% 60% 681
Nelson City Council 1,200 784 656 675 550 619 656 675 100% 100% 100% 100% 675
Marlborough District Council 20,802 21,377 29,459 29,459 2,686 3,261 3,529 3,529 83% 89% 93% 98% 3,475
Tasman District Council 15,764 13,042 7,230 16,826 4,250 2,478 6,389 4,941 46% 75% 26% 57% 2,833
UNITARY SUBTOTAL 142,706 143,529 163,568 186,224 25,944 18,136 23,736 10,280 67% 81% 73% 79% 26,372
TOTAL 207,351 222,783 255,142 283,470 69,818 45,747 54,488 38,214 74% 83% 80% 83%
Table 2: Total consents that require monitoring
Attachment 21-265.1
Audit & Risk Committee 23 November 2021 87 of 144

Compliance assessmentThe following section focuses on the levels of compliance amongst those monitored based on the MfE framework. This year Gisborne’s data is included, meaning for the first year there is data available for all regional councils and regulatory authorities based on the MfE framework.
The report analyses the compliance gradings of over 64,000 consent monitoring events, overall this is on a par with last year for both regional councils and unitary authorities.
Levels of full compliance differ between 36% in Otago Regional Council and 95% West Coast Regional Council. Previously we were seeing a downward trend in full compliance, however this year there is a slight increase in full compliance. Northland Regional Council, Waikato Regional Council, Taranaki Regional Council, Horizons Regional Council, West Coast Regional Council, Auckland Council and Nelson City Council are reporting more full compliance than last year, with Hawkes Bay Regional Council, Otago Regional Council, Southland Regional Council and Tasman District Council reporting less.
Southland’s moderate and significant non-compliance is increasing. Hawkes Bay have seen an increase in moderate non-compliance. Gisborne has higher significant-non compliance than others.
*Numbers provided will not equate to the consents totals earlier in this report as some sites had more than one monitoring visit over the year. The tables below relate to the percentage of monitoring visits that fit within different grades.
*GWRC are unable to exclude telemetry water readings from statistics.
Question 15. What grades do you apply to non-compliance? (e.g., technical non-compliance, significant noncompliance)Fully CompliantTechnical/Low Non-ComplianceModerate Non-ComplianceSignificant Non-ComplianceOther (please specify)
Question 15. What were the levels of compliance with consents according to the grades you use? Note 1: Numbers provided under each grade is per monitoring event not per consent. E.g. a consent may be monitored four times in the year: on one occasion it may be Technically Non-Compliance and on three occasions it may be Fully Compliant, this would add three to the total of Fully Compliant and one to the total for Technical Noncompliance. Note 2: The compliance grade is based on the condition with the worst compliance grade. e.g. a consent with five conditions Fully Compliant and one condition Moderate Non-Compliance has an overall compliance grade of Minor Non-Compliance Note 3: Daily telemetry water readings where compliance with water take limits is continuously monitored are to be excluded from compliance grade totals.
Compliance gradingsIn 2018 the MfE released Best Practise Guidelines, including a suite of recommended compliance categories. The intention of this is to make data on compliance levels nationally comparable. Uptake of the framework is now at 100%, with the remaining two councils adopting it this year.
Question 14. In the 2020/2021 year, did you use the four compliance grades as recommended by Ministry for the Environment?Yes / No
Question 16. When will your council be adopting the four compliance grades recommended by Ministry for the Environment?
ADOPTION OF FRAMEWORK
100%
Analysis of the 2020 / 2021 compliance monitoring and enforcement metrics for the regional sector
PAGE 17
Attachment 21-265.1
Audit & Risk Committee 23 November 2021 88 of 144

Northland Regional Council
Waikato Regional Council
Bay of Plenty Regional Council
Hawkes Bay Regional Council
Taranaki Regional Council
Horizons Regional Council
Greater Wellington Regional Council
Environment Canterbury
Otago Regional Council
West Coast Regional Council
Southland Regional Council
Auckland Council
Gisborne District Council
Nelson City Council
Marlborough District Council
Tasman District Council
TOTAL
UNITARY AUTHORITIES
REGIONAL COUNCILS3,803
1,078
1,842
2,943
1,457
7,274
7,025
1,309
3,188
550
2,219
1,940
18,732
58,610
4,119
1,131
3,561
1,157
3,059
3,198
1,692
3,315
607
1,126
3,594
1,245
2,359
1,870
20,188
50,008
2,743
916
5,833
1,674
4,027
3,304
1,633
5,339
5,909
767
681
3,019
1,707
2,212
1,691
19,430
63,825
6,168
1,112
6,349
2,827
4,861
3,116
1,365
6,626
2,237
1,167
4,265
1,122
2,417
2,833
18,708
64,122
3,930
1,618
Total Number of Consents in Different Categories of Compliance on a Per Monitoring Event Basis
2017 / 2018
2018 / 2019
2019 / 2020
2020/ 2021
Question 15. What grades do you apply to non-compliance? (e.g., technical non-compliance, significant noncompliance)• Fully Compliant• Technical/Low Non-Compliance• Moderate Non-Compliance
• Significant Non-Compliance• Other (please specify)
Figure 5: Total Number of Consents in Different Categories of Compliance on a Per Monitoring Event Basis
Analysis of the 2020 / 2021 compliance monitoring and enforcement metrics for the regional sector
PAGE 18
Attachment 21-265.1
Audit & Risk Committee 23 November 2021 89 of 144

77%
47%
81%
82%
92%
73%
71%
65%
36%
13%
25%
12%
5%
1%
11%
19%
4%
40%
8%
14%
7%
12%
6%
5%
7%
17%
16%
2%
2% 12%
1%
1%
2%
11%
3%
5%
6%
9%
2%
OTHER COMPLIANCE GRADING
Northland Regional Council
Waikato Regional Council*
Bay of Plenty Regional Council
Hawkes Bay Regional Council
Taranaki Regional Council
Horizons Regional Council
Greater Wellington Regional Council
Environment Canterbury
Otago Regional Council
Percentages of consents in full compliance, low risk/ technical non compliance, moderate non
compliance and significant non compliance on a per monitoring event basis
FULL COMPLIANCE
LOW RISK/TECHNICAL NON-COMPLIANCE
MODERATE NON-COMPLIANCE
SIGNIFICANT NON-COMPLIANCE
* The non-compliance rating system used at WRC considers multiple factors, and not solely whether the non-compliance results in actual significant environmental effect. As such the data is not directly comparable to those Councils that apply the MfE compliance rating system.
Analysis of the 2020 / 2021 compliance monitoring and enforcement metrics for the regional sector
PAGE 19
Attachment 21-265.1
Audit & Risk Committee 23 November 2021 90 of 144

95% 2%2%
1%
West Coast Regional CouncilWest Coast Regional Council
Southland Regional CouncilSouthland Regional Council
Auckland CouncilAuckland Council
Gisborne District CouncilGisborne District Council
Nelson City CouncilNelson City Council
Marlborough District CouncilMarlborough District Council
Tasman District CouncilTasman District Council
46%
43%
38%
75%
75%
70%
22%
47%
20%
21%
4%
10%
19%
8%
22%
4%
19%
10%
12%
3%
20%
2%
10%1%
Figure 6: Percentages of consents in full compliance, low risk/ technical non compliance, moderate non compliance and significant non compliance on a per monitoring event basis.
Analysis of the 2020 / 2021 compliance monitoring and enforcement metrics for the regional sector
PAGE 20
Attachment 21-265.1
Audit & Risk Committee 23 November 2021 91 of 144

TOTAL CONSENTS MONITORED 64,122
NATIONWIDE COMPLIANCE RATING OF CONSENTS MONITORED
REGIONAL COUNCILS
UNITARY AUTHORITIES
71%
60% 20% 13% 5% 2%
19% 7% 3%
Nationwide Compliance Rating of Consents Monitored
Figure 7: Nation wide percentages of consents in full compliance, low risk/ technical non compliance, moderate non compliance and significant non compliance on a per monitoring event basis.
OTHER COMPLIANCE GRADING
FULL COMPLIANCE
LOW RISK/TECHNICAL NON-COMPLIANCE
MODERATE NON-COMPLIANCE
SIGNIFICANT NON-COMPLIANCE
Analysis of the 2020 / 2021 compliance monitoring and enforcement metrics for the regional sector
PAGE 21
Attachment 21-265.1
Audit & Risk Committee 23 November 2021 92 of 144

Permitted activities remained similar to 2019/2020, with forestry and dairy making up nearly half of permitted activities. Last year Greater Wellington Regional Council did not have a monitoring program for Forestry, this year they have adopted one meaning all regional councils and unitary authorities now have a monitoring program in place.
Monitoring permitted activities
Figure 8: Proportion of permitted activity monitoring programmes for different industries
Question 18. Which permitted activities do you have a monitoring programme for? List of activities with tick box if yes:• Agriculture (excluding dairy)• Aquaculture• Construction• Dairy• Forestry• Horticulture • Mining• Oil and gas• Tourism• Vineyards• Wineries• Wintering• Other (please specify)
Forestry
Dairy
Wintering
Industrial stormwater
Agriculture (excluding dairy)
Aquaculture
Mining
Wineries
Horticulture
Construction
Oil and gas
Tourism
Vineyards
28%
19%
12%
9%
7%
5%
3%
3%
3%
2%
2%
2%
0%
Permitted activity monitoring programmes for different industries
Analysis of the 2020 / 2021 compliance monitoring and enforcement metrics for the regional sector
PAGE 22
Attachment 21-265.1
Audit & Risk Committee 23 November 2021 93 of 144
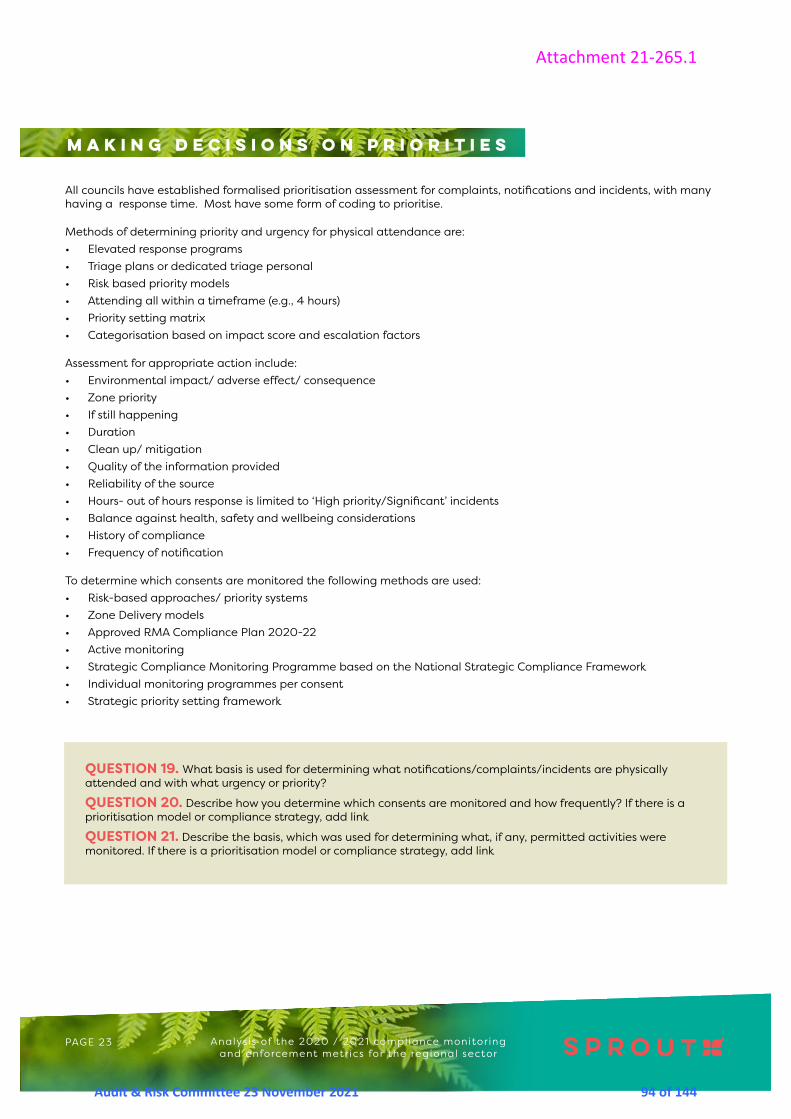
Making decisions on priorities
All councils have established formalised prioritisation assessment for complaints, notifications and incidents, with many having a response time. Most have some form of coding to prioritise.
Methods of determining priority and urgency for physical attendance are:• Elevated response programs• Triage plans or dedicated triage personal• Risk based priority models• Attending all within a timeframe (e.g., 4 hours)• Priority setting matrix• Categorisation based on impact score and escalation factors
Assessment for appropriate action include:• Environmental impact/ adverse effect/ consequence• Zone priority• If still happening• Duration• Clean up/ mitigation• Quality of the information provided• Reliability of the source• Hours- out of hours response is limited to ‘High priority/Significant’ incidents• Balance against health, safety and wellbeing considerations• History of compliance• Frequency of notification
To determine which consents are monitored the following methods are used:• Risk-based approaches/ priority systems• Zone Delivery models• Approved RMA Compliance Plan 2020-22• Active monitoring• Strategic Compliance Monitoring Programme based on the National Strategic Compliance Framework• Individual monitoring programmes per consent• Strategic priority setting framework
QUESTION 19. What basis is used for determining what notifications/complaints/incidents are physically attended and with what urgency or priority?
QUESTION 20. Describe how you determine which consents are monitored and how frequently? If there is a prioritisation model or compliance strategy, add link
QUESTION 21. Describe the basis, which was used for determining what, if any, permitted activities were monitored. If there is a prioritisation model or compliance strategy, add link
Analysis of the 2020 / 2021 compliance monitoring and enforcement metrics for the regional sector
PAGE 23
Attachment 21-265.1
Audit & Risk Committee 23 November 2021 94 of 144

Staffing levels
The number of FTE’s continues to increase, this year there is a 9% increase overall. Most regions report smaller increases of between 1-3 FTE’s. The largest increase is Horizons Regional Council at 13 more FTE’s, followed by Environment Canterbury with 8 more FTE’s. Taranaki Regional Council has an increase of 7 FTE’s. Gisborne District Council has seen an increase of 2 FTE’s and is currently recruiting more. There are no significant decreases in the number of FTE’s.
There continues to be large variation in the total number of FTE’s, this is expected because of the variation in regions (population, area, GDP, development type, intensity and council funding base). Auckland Council has around a third of all FTE’s. Taranaki Regional Council remains the highest ratio of FTE per 100 (0.4), with Greater Wellington Regional Council having the lowest (0.03).
Note: FTEs should only be counted once under each of these categories. However, if a team member has more than one role then calculate what portion of their time is generally spent in each role, or only answer question 24 if your officers do a combination of roles. An example of an answer to each of the questions in this section might look like 22 FTEs spread across 40 individuals. Exclude any in-house or contract lawyers. Include managers in your count. Include any vacant positions in your counts.
Question 22. How many FTEs does your council have who carry out monitoring roles?
Question 23. How many FTEs does your council have who carry out environmental incident or pollution response roles?
Question 24. How many FTEs does your council have who carry out investigation or enforcement roles?
Question 25. How many FTEs does your council have who carry out a combination of the above roles? Note 1: Include contractors Note 2: Only answer this question if you have not included these staff in questions 21, 22 or 23
Question 26. How many FTEs does your council have in CME support roles? This includes administrative roles, e.g. staff who assist with issue of notices, reminder notices, upload of unpaid infringements to Ministry of Justice.
Analysis of the 2020 / 2021 compliance monitoring and enforcement metrics for the regional sector
PAGE 24
Attachment 21-265.1
Audit & Risk Committee 23 November 2021 95 of 144

Figure 9: Council FTEs in CME roles
Northland Regional Council
Waikato Regional Council
Bay of Plenty Regional Council
Hawkes Bay Regional Council
Taranaki Regional Council
Horizons Regional Council
Greater Wellington Regional Council
Environment Canterbury
Otago Regional Council
West Coast Regional Council
Southland Regional Council
Auckland Council
Gisborne District Council
Nelson City Council
Marlborough District Council
Tasman District Council
TOTAL FTEs
UNITARY AUTHORITIES
REGIONAL COUNCILS22
47
31
10
16
44
23
6
8
13
5
9
11
146
436
36
10
23
45
36
14
14
44
24
6
6
13
6
10
12
179
479
38
12
25
44
35
14
16
46
28
6
7
15
7
11
11
182
499
42
12
25
47
37
16
18
54
32
7
9
13
6
13
12
181
542
49
25
Council FTEs in CME roles
2017 / 2018
2018 / 2019
2019 / 2020
2020/ 2021
Analysis of the 2020 / 2021 compliance monitoring and enforcement metrics for the regional sector
PAGE 25
Attachment 21-265.1
Audit & Risk Committee 23 November 2021 96 of 144

Table 3: Council FTEs for different aspects of the CME role
Analysis of the 2020 / 2021 compliance monitoring and enforcement metrics for the regional sector
PAGE 26
MONITORING COMBINATIONENVIRONMENTAL
INCIDENT OR POLLUTION
INVESTIGATION OR ENFORCEMENT SUPPORT
2018
/ 2
019
2019
/ 2
020
2020
/ 2
021
2018
/ 2
019
2019
/ 2
020
2020
/ 2
021
2018
/ 2
019
2019
/ 2
020
2020
/ 2
021
2018
/ 2
019
2019
/ 2
020
2020
/ 2
021
2018
/ 2
019
2019
/ 2
020
2020
/ 2
021
REG
ION
AL
CO
UN
CIL
S
Northland Regional Council 20 21 22 0 0 0 1 1 1 2 3 2
Waikato Regional Council 20 20 22 9 8 9 10 10 10 7 6 6
Bay of Plenty Regional Council 17 16 17 4 4 4 4 3 4 12 12 12
Hawkes Bay Regional Council 9 9 10 0 0 0 2 2 3 1 1 1 2 2 2
Taranaki Regional Council 27 29 35 2 2 2 3 4 5 4 5 5 2 2 2
Horizons Regional Council 0 0 13 10 10 0 0 0 9 1 1 1 1 1 2
Greater Wellington Regional Council 0 0 0 13 15 17 0 0 0 0 0 0 1 1 1
Environment Canterbury 31 31 28 0 0 0 8 5 7 4 4 4 1 6 15
Otago Regional Council 15 15 18 8 3 2 0 3 4 0 3 3 1 4 5
West Coast Regional Council 0 0 0 5 5 6 0 0 0 0 0 0 1 1 1
Southland Regional Council 8 8 8 0 0 0 1 1 1 2 3 2 3 3 2
REGIONAL SUBTOTAL 126 128 151 57 56 49 26 27 42 26 31 31 32 40 50
UN
ITA
RY
AU
THO
RIT
IES
Auckland Council 65 69 69 19 16 88 32 41 0 49 43 0 14 13 24
Gisborne District Council 4 0 0 0 7 8 0 0 0 1 0 0 1 0 1
Nelson City Council 0 0 0 5 6 5 0 0 0 0 0 0 1 1 1
Marlborough District Council 2 2 5 7 8 1 0 0 0 1 0 5 0 1 2
Tasman District Council 0 0 0 10 9 10 0 0 0 0 0 0 2 2 2
UNITARY SUBTOTAL 71 71 74 41 46 112 32 41 0 51 43 5 18 17 30
UNITARY SUBTOTAL MINUS AUCKLAND 6 2 5 22 30 24 0 0 0 2 0 5 4 4 6
TOTAL 197 198 225 98 102 160 58 68 42 77 74 36 50 57 79
TOTAL MINUS AUCKLAND 132 129 156 79 86 72 26 27 42 28 31 36 36 44 55
Council FTE’s in Specific Roles Attachment 21-265.1
Audit & Risk Committee 23 November 2021 97 of 144

FTE/1000
2017
/ 2
018
2018
/ 2
019
2019
/ 2
020
2020
/ 2
021
FTE 2020/2021
Population Estimates
2020
Formal actions
per 1000 2020/2021
REG
ION
AL
CO
UN
CIL
S
Northland Regional Council .13 .13 .13 .13 25.00 192,500 1.59
Waikato Regional Council .10 .10 .09 .10 47.18 492,100 0.95
Bay of Plenty Regional Council .10 .11 .11 .11 37.20 333,500 0.39
Hawkes Bay Regional Council .06 .08 .08 .09 16.00 177,200 0.98
Taranaki Regional Council .31 .32 .34 .40 49.00 124,000 3.29
Horizons Regional Council .04 .05 .05 .10 25.00 252,900 1.83
Greater Wellington Regional Council .03 .03 .03 .03 17.75 538,500 0.25
Environment Canterbury .07 .07 .07 .08 54.00 641,200 0.97
Otago Regional Council .10 .10 .12 .13 31.60 243,000 0.35
West Coast Regional Council .17 .16 .17 .20 6.50 32,400 1.23
Southland Regional Council .13 .13 .15 .12 12.50 102,300 1.63
REGIONAL SUBTOTAL / AVERAGE .11 .12 .12 .14 29.25 284,509 1.22
UN
ITA
RY
AU
THO
RIT
IES
Auckland Council .09 .11 .11 .11 181.00 1,702,700 3.12
Gisborne District Council .18 .13 .14 .18 8.90 50,500 1.56
Nelson City Council .10 .10 .12 .10 5.50 54,600 0.57
Marlborough District Council .20 .20 .21 .25 12.50 49,900 1.12
Tasman District Council .15 .22 .20 .21 12.00 56,400 0.99
UNITARY SUBTOTAL .15 .15 .16 .17 43.98 382,820 1.47
AVERAGE 0.12 0.13 0.13 0.15
TABLE 4: Comparison of council FTEs, population and number of formal actions (excluding prosecutions but including warnings)
Council FTE's and Formal Actions Based on Population
Analysis of the 2020 / 2021 compliance monitoring and enforcement metrics for the regional sector
PAGE 27
Attachment 21-265.1
Audit & Risk Committee 23 November 2021 98 of 144

The relationship between FTE’s per thousand and formal actions per thousand is shown below, councils with higher staffing levels per thousand tend to have more formal actions per thousand.
Taranaki Regional Council has the highest levels of formal actions per thousand and also the highest FTE per thousand. Greater Wellington has the lowest formal actions per thousand and also the lowest FTE’s per thousand.
Horizons Regional Council and Taranaki Regional Council have the largest increases in FTE’s per thousand. Horizons Regional Council has seen a large increase in the number of FTE’s last year, while for Taranaki Regional Council his has happened gradually over time.
Figure 10: Comparison of CME resourcing and number of formal enforcement actions
FTE
per
tho
usa
nd
Formal actions per thousand
0
0.05
0.1
0.15
0.2
0.25
0.3
0.35
0.4
0.45
0.5 1 1.5 2 2.5 3 3.5
CME RESOURCING AND NUMBER OF FORMAL ENFORCEMENT ACTIONS
Taranaki Regional Council
Waikato Regional Council
Bay of Plenty Regional Council
Hawkes Bay Regional Council
Horizons Regional Council
Greater Wellington Regional Council
Environment Canterbury
Otago Regional Council
West Coast Regional Council
Southland Regional Council
Auckland Council
Gisborne District Council
Nelson City Council
Marlborough District Council
Tasman District Council
Northland Regional Council
Analysis of the 2020 / 2021 compliance monitoring and enforcement metrics for the regional sector
PAGE 28
Attachment 21-265.1
Audit & Risk Committee 23 November 2021 99 of 144

Figure 11: Comparison of CME resourcing and GDP
GD
P $m
illio
n
Number of FTE’s
0
5,000
10,000
15,000
20,000
25,000
30,000
35,000
40,000
45,000
10 20 30 40 50 60
COMPARISON OF CME RESOURCING AND GDP
This figure shows regions with higher GDP tend to have more FTE’s. While this holds true for Auckland Council, Environment Canterbury and Waikato Regional Council, Greater Wellington Regional Council has the second highest GDP and is mid range for the number of FTE’s.
Outlier Auckland GDP$Mill 122,557 FTE’s 181
Taranaki Regional Council
Waikato Regional Council
Bay of Plenty Regional Council
Hawkes Bay Regional Council
Horizons Regional Council
Environment Canterbury
Otago Regional Council
West Coast Regional Council
Southland Regional Council
Gisborne District Council
Nelson City Council
Marlborough District Council
Tasman District Council
Northland Regional Council
Greater Wellington Regional Council
Analysis of the 2020 / 2021 compliance monitoring and enforcement metrics for the regional sector
PAGE 29
Attachment 21-265.1
Audit & Risk Committee 23 November 2021 100 of 144

CME POLICIES AND PROCEDURES
Credibility of regulators is maintained through having coherent policy in place. These questions help us understand how policy informs CME operations and the decision-making process with regulators.
This year the remaining councils have adopted enforcement policies. Meaning all councils and unitary authorities have both active enforcement and conflict of interest policies inline with Best Practise Guidelines.
The Guidelines state that all councils ‘should have an operational enforcement policy, which the council uses to determine what enforcement action (if any) to take in response to non-compliance’.
Decisions on prosecutions are usually a process with multiple parties, those involved include:• Investigating officer• Senior officer• Team leader • Manager• Compliance Manager• Regulatory Manager • Group Manager• Director Resource Management• Prosecution panel/ Prosecution Decision Group• Enforcement Decision Group• Enforcement and Prosecution Committee • Enforcement Specialist• Legal council• General Manager• CEO/ CEDelegation usually fell with a Manager, Director, General Manager, Group Manager, General Manager, CE, or CEO.
* MfE Best Practice Guidelines at p73
Question 27. Does your council have an enforcement policy? Yes No
Question 28. What is your process for making decisions on prosecutions?
Question 29. Who has the delegation to authorise filing of charges for a prosecution at your council?
Question 20. Does your council have a conflict of interest policy? Yes No
ENFORCEMENT POLICIES
16/16
CONFLICT OF INTEREST POLICIES
16/16
Analysis of the 2020 / 2021 compliance monitoring and enforcement metrics for the regional sector
PAGE 30
Attachment 21-265.1
Audit & Risk Committee 23 November 2021 101 of 144

DECISIONS ON PROSECUTION DELEGATION
RE
GIO
NA
L C
OU
NC
ILS
Northland Regional CouncilEnforcement decision group meets (this group changes depending on the alleged offence). Usually consists of the investigating officer plus their manager, plus the Enforcement Specialist.
Group Manager - Regulatory Services or the Compliance Monitoring Manager/Deputy GM - Regulatory Services.
Waikato Regional CouncilInvestigating officer reports to a panel of 3 senior managers with recommendations. If the panel authorises prosecutions, this will be conditional on an independent legal review, which studies the file in entirety and applies the Evidential and Public Interest Tests. If the legal review is satisfied that the tests are met, charges are filed.
See decisions on prosecution
Bay of Plenty Regional CouncilSignificant incidents/breaches are delegated to our dedicated investigators, who will undertake a thorough investigation of the matter and present the outcomes to an Enforcement Decision Group (EDG). The EDG makes a recommendation (by consensus) for a response; if the recommendation is to prosecute, then the recommendation is subject to a legal opinion, before being referred to the General Manager for Regulatory Services.
General Manager - Regulatory Services
Hawkes Bay Regional Council1) EDG recommends prosecution. 2) Councils’ solicitor provides a legal opinion. Must pass the evidential and public interest tests. 3) Signed off by GM Policy & Regulation 4) To CEO for final sign off
CEO
Taranaki Regional CouncilChief executive in collaboration with Director Resource Management and Compliance Manager
Chief Executive
Horizons Regional CouncilAll incidents and significantly noncomplying resource consent assessments are assessed. If the matter is deemed serious it is referred to the investigation programme. If a subsequent investigation determines a prosecution is required, then the investigation file is sent for legal review. This review focuses on whether the evidential sufficiency and public interest tests have been satisfied. Once this review is completed a report is prepared and provided to the Regulatory Manager and Group Manager Strategy and Regulation, who then pass the matter onto the Chief Executive for consideration and final decision
Group Manager Strategy and Regulation Regulatory Manager Team Leader Consents Monitoring Senior Consents Monitoring Officer
Greater Wellington Regional CouncilAll decisions on enforcement outcomes for breaches of the RMA are made by the Enforcement Decision Group (EDG) to ensure consistency, transparency and fairness, with the exception of some formal warnings and advice letters . Any EDG recommendations to prosecute are required to go to the Prosecution Decision Group (PDG). Normally and EDG consists of a minimum 3 persons. Delegation on decisions sits at team leader level. Decisions are generally made by consensus of the attendees. Where agreement cannot be reached the person with the delegated authority will make the decision. In extreme circumstances consultation with other delegated authority holders may be required. For recommendations of Infringement or less EDG may consist only of Officer and Team Leader. All enforcement action taken must be in accordance with the Resource Management Act 1991, Summary Proceedings Act 1957, Criminal Procedure Act 2011, Search and Surveillance Act 2012, Disclosure Act 2008, Sentencing Act 2002, Resource Management (Infringement Offences) Regulations 1999 and the GWRC Environmental Regulation Prosecution Guidelines.
General Manager - Environment Group
E
Decision making process and delegation to authorise filing of charges
Analysis of the 2020 / 2021 compliance monitoring and enforcement metrics for the regional sector
PAGE 31
Attachment 21-265.1
Audit & Risk Committee 23 November 2021 102 of 144

Environment Canterbury
RE
GIO
NA
L C
OU
NC
ILS
Follow MfE CME guidelines, and an internal enforcement Decision Panel makes recommendations
Chief Executive
Otago Regional Council
Recommendations for prosecution are considered at an ‘Enforcement Decision Group’ with Compliance Manager, Team Leaders, in-house legal counsel and Senior officer presenting the case. If considered appropriate by EDG, the file is reviewed by legal counsel to consider whether it meets the evidential test for prosecution. If it meets the evidential test, the file is considered by a ‘Prosecution Decision Group’ meeting with CEO, GM Regulatory, Compliance Manager and senior officer presenting the case.
To initiate and/or withdraw a prosecution for an offence against the RMA (GM Regulatory or GM Operations). If a decision has been made to prosecute, authority to file a charging document on decisions to prosecute for offences (Compliance Manager).
West Coast Regional Council
Recommendation on action report submitted to the manager. Approval given to prepare a staff report for consideration at an EGD meeting. EDG consists of The CE, another manager separate from Consents and Compliance, the C & C Manager and officer in charge of the case. Final decision rests with the CE
The CE and the Consents and Compliance Manager
Southland Regional Council
Incident response – investigation – enforcement decision group meeting – legal opinion – CEO approval
Chief Executive
UN
ITA
RY
AU
TH
OR
ITIE
S
Auckland Council
Enforcement criteria is utilized, followed by team leader discussion, then Manager discussion. Prosecution panel made up of Manager(s) and legal counsel is the final step.
Manager Compliance Response and Investigations
Gisborne District Council
Enforcement Decision Group. Director Environmental Services & Protection. Compliance Monitoring and Enforcement Manager. (There is an expectation of consultation with Chief Executive)
Nelson City Council
Recommendation by investigating officer to team leader, then manager, then to two group managers (tier 2) after receiving legal advice
Authorised by two group managers after receiving legal advice
Marlborough District Council
Stage 1: QA per review panel Stage 2: Enforcement and Prosecution Committee Stage 3: Legal Counsel Review
Enforcement and Prosecution Committee
Tasman District Council
Investigating officer prepares a case which is presented to a decision-making group. If case meets the tests a detailed recommendation to proceed goes to the group manager who carries delegated authority to initiate prosecutions.
Group manager (Tier 2)
Question 28. What is your process for making decisions on prosecutions?
Question 29. Who has the delegation to authorise filing of charges for a prosecution at your council?
Table 5: Decision making process and delegation to authorise filing of charges
Analysis of the 2020 / 2021 compliance monitoring and enforcement metrics for the regional sector
PAGE 32
Attachment 21-265.1
Audit & Risk Committee 23 November 2021 103 of 144

EDUCATING AND ENGAGING WITH THE REGULATED COMMUNITY
Inline with the ‘four E approach’ giving clear direction on what is expected to the regulated community creates a robust approach. This question helps us understand the programs councils have in place.
All councils had at least one initiative in place. The most common education was about farming/dairy, earthworks and forestry. Majority did this through workshops and presentations.
Have or support education and
engagement projects
16/16
Delivery methods of information include:
• Workshops• Presentations• Meetings e.g., Industry stakeholder meetings• Hui• Information evenings• Pocket guides• Superhero programs• Engagement programs• Attendance at Fieldays• Attendance at farm dairy effluent forums• Attendance at liaison groups• Contributions to Land Use and other Council
publications• Emails• Newsletters• Website• Advertising campaigns• Citizen science• 0800 number• Educational visits
Areas covered in education or engagement projects include:
• Dairy/ farming• Earthworks• Forestry• Construction• Wineries• Marine Farms• General community• Catchment groups
Question 42. Does your council have, or support, any education or engagement projects relating to compliance with the RMA or any of its derivative regulation? For example, workshops for earthworks contractors around erosion and sediment controls. Yes No If yes, briefly describe
Analysis of the 2020 / 2021 compliance monitoring and enforcement metrics for the regional sector
PAGE 33
Attachment 21-265.1
Audit & Risk Committee 23 November 2021 104 of 144

Question 31 helps us to identify what at sector level is occupying the largest proportion of resources and how/ if that resource allocation is shifting over time. In turn this helps with understanding priority areas and challenges for compliance programs.
In total there were nearly 8,195 actions this year, this is 1,287 more than last year. Councils are highly variable in the number of actions taken. This year Gisborne District Council showed the most significant increase in the proportion of formal actions (5 times last year). Hawkes Bay Regional Council, Taranaki Regional Council, Otago Regional Council, Southland Regional Council and Auckland Council all have more formal actions than last year. Majority of these cases are abatement notices with abatement notices increasing on last year.
Abatement notices make up the largest proportion of formal warnings, this year they have increased by around a quarter. Taranaki Regional Council, Environment Canterbury, Northland Regional Council and Auckland Council issue the most abatement notices. This year Environment Canterbury issued 191 more than last year, Auckland Council issued 843 more than last year.
367 more infringement fines were issued this year, an increase of 21%.
Waikato Regional Council and Environment Canterbury make up seven in ten formal warnings. This year there is an 18% drop in formal warnings, this is driven by Environment Canterbury with 218 less formal warnings compared to last year.
Auckland Council then Taranaki Regional Council have the most infringement notices, both increase in this period (Auckland increases 40%, Taranaki increases 46%).
ACTING ON NON-COMPLIANCE
QUESTION 31. Question 31 relates to the instruments issued in relation to the different sections of the Act (listed once for brevity)• Section 9 Use of land• Section 12 Coastal marine area• Section 13 Beds of lakes and rivers• Section 14 Water• Section 15 Discharges of contaminants• Section 17 Duty to avoid, remedy & mitigate• Other breach e.g., Section 22 Formal warnings issued Abatement notices issued Infringement notices issued Enforcement orders applied for
Analysis of the 2020 / 2021 compliance monitoring and enforcement metrics for the regional sector
PAGE 34
Attachment 21-265.1
Audit & Risk Committee 23 November 2021 105 of 144

NATIONWIDE:ENFORCEMENT ACTIONS AND SECTIONS BREACHED
FORMAL WARNINGS
ABATEMENT NOTICES
INFRINGEMENT ORDERS
ENFORCEMENT ORDERS
TOTAL ACTIONS
802 5,225 2,150 18 8,195
SECTION 9Use of land
45 141 201 7 394
SECTION 12 Coastal marine area
27 24 11 0 62
SECTION 13 Beds of lakes and rivers
51 90 26 3 170
SECTION 14 Water
68 222 28 0 318
SECTION 15 Discharges of contaminants
567 777 1,014 6 2,364
SECTION 17 Duty to avoid, remedy & mitigate
6 12 3 0 21
OTHERe.g. Section 22
38 7 867 2 914
Auckland Council (total abatement notices- no breakdown available this year)
3,965 3,965
Table 6: Total use of formal instruments against relevant section of the Act (i. e., group of possible offences).
*Note this year Auckland Council only had total abatement notices available. These are included in the overall figure. Horizons Regional Council had 13 abatement notices that fell into more than one section these are counted in individual sections, but only count once in totals.
Analysis of the 2020 / 2021 compliance monitoring and enforcement metrics for the regional sector
PAGE 35
Attachment 21-265.1
Audit & Risk Committee 23 November 2021 106 of 144
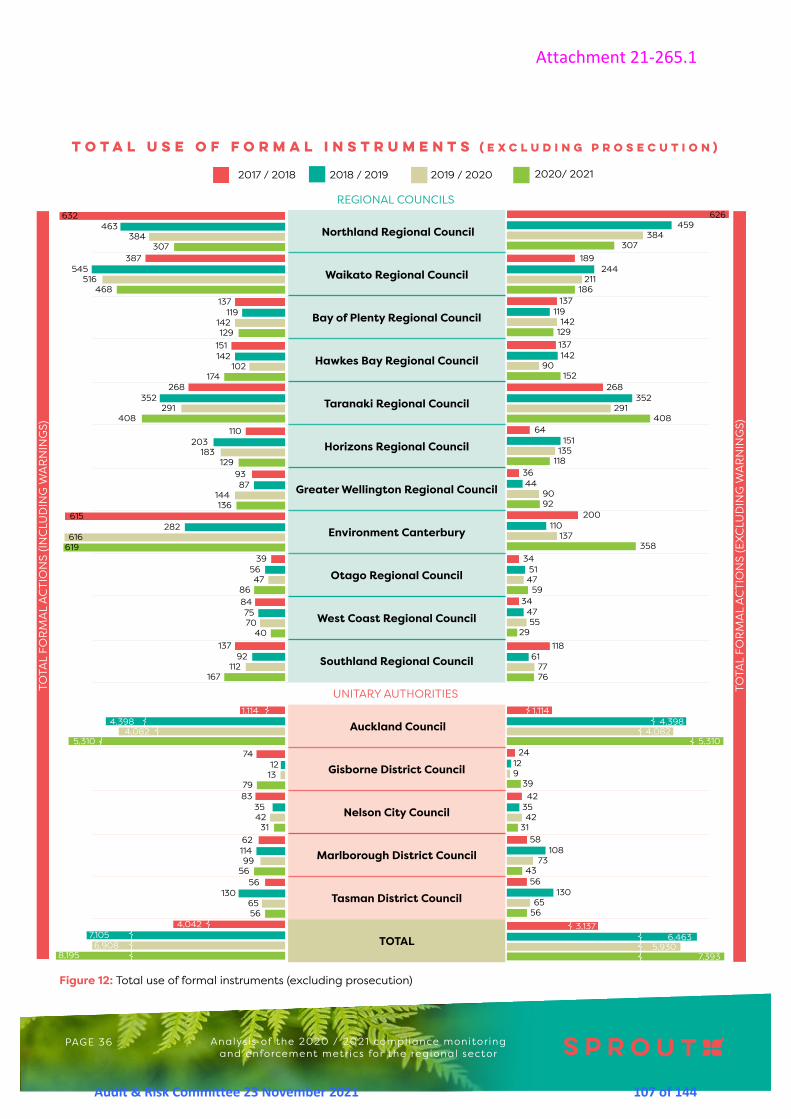
Figure 12: Total use of formal instruments (excluding prosecution)
Northland Regional Council
Waikato Regional Council
Bay of Plenty Regional Council
Hawkes Bay Regional Council
Taranaki Regional Council
Horizons Regional Council
Greater Wellington Regional Council
Environment Canterbury
Otago Regional Council
West Coast Regional Council
Southland Regional Council
Auckland Council
Gisborne District Council
Nelson City Council
Marlborough District Council
Tasman District Council
TOTAL
626
189
137
137
268
64
36
200
34
34
118
24
58
56
42
459
244
119
142
352
151
44
110
51
47
61
12
108
130
35
384
211
142
90
291
135
90
137
47
55
77
9
73
65
42
307
186
129
152
408
118
92
358
59
29
76
39
43
56
31
2017 / 2018 2018 / 2019 2019 / 2020 2020/ 2021
632
387
463
545
384
516
307
468137
151
268
110
93
615
39
84
137
62
83
74
56
4,042
119
142
352
203
87
282
56
75
92
114
35
12
130
7,105
142
102
291
183
144
616
47
70
112
99
42
13
65
6,908
129
174
408
129
136
619
86
40
167
56
31
79
56
8,195
Total use of formal instruments (excluding prosecution)
1,114 1,114
3,137
4,398 4,398
6,463
4,082 4,082
5,930
5,310 5,310
7,393
TOTA
L FO
RM
AL
AC
TIO
NS
(INC
LUD
ING
WA
RN
ING
S)
TOTA
L FO
RM
AL
AC
TIO
NS
(EX
CLU
DIN
G W
AR
NIN
GS)
UNITARY AUTHORITIES
REGIONAL COUNCILS
Analysis of the 2020 / 2021 compliance monitoring and enforcement metrics for the regional sector
PAGE 36
Attachment 21-265.1
Audit & Risk Committee 23 November 2021 107 of 144

Figure 13: Total formal warnings and abatement notices
2017 / 2018 2018 / 2019 2019 / 2020 2020/ 2021
Total formal warnings and abatement notices
Northland Regional Council
Waikato Regional Council
Bay of Plenty Regional Council
Hawkes Bay Regional Council
Taranaki Regional Council
Horizons Regional Council
Greater Wellington Regional Council
Environment Canterbury
Otago Regional Council
West Coast Regional Council
Southland Regional Council
Auckland Council
Gisborne District Council
Nelson City Council
Marlborough District Council
Tasman District Council
TOTAL
373
89
106
46
200
41
11
72
12
24
80
19
45
33
28
271
134
87
40
240
82
17
39
14
20
29
11
56
67
18
230
134
117
20
187
54
24
69
20
20
29
9
38
31
29
210
118
102
66
255
40
26
260
25
12
29
35
28
37
17
6
198
4
301
00
NO DATANO DATA
NO DATANO DATA
305282
14
46
57
415
5
50
19
4
905
41
50
0
0000
52
43
172
5
28
31
6
642
0
12
48
54
479
15
35
26
978
4
22
11
44
261
27
11
91
13
802
40
648
1,827
3,186
4,311
3,122
4,133
3,965
5,225
TOTA
L FO
RM
AL
WA
RN
ING
S
TOTA
L A
BAT
EMEN
T N
OTI
CES
UNITARY AUTHORITIES
REGIONAL COUNCILS
NO DATA
NO DATANO DATA
NO DATANO DATANO DATA
NO DATANO DATA
NO DATANO DATA
NO DATANO DATA
Analysis of the 2020 / 2021 compliance monitoring and enforcement metrics for the regional sector
PAGE 37
Attachment 21-265.1
Audit & Risk Committee 23 November 2021 108 of 144

Figure 14: Total infringement notices and enforcement orders
Northland Regional Council
Waikato Regional Council
Bay of Plenty Regional Council
Hawkes Bay Regional Council
Taranaki Regional Council
Horizons Regional Council
Greater Wellington Regional Council
Environment Canterbury
Otago Regional Council
West Coast Regional Council
Southland Regional Council
Auckland Council
Gisborne District Council
Nelson City Council
Marlborough District Council
Tasman District Council
TOTAL
0
0
0
1
10
21
1
0
0
3
0
0
2
1
1
1
1
0
2
11
0
0
0
0
0
3
1
0
0
1
1
1
4
14
0
0
0
0
0
6
0
0
3
0
0
1
6
18
1
0
0
0
3
1
0
1
2017 / 2018 2018 / 2019 2019 / 2020 2020/ 2021
253
100
187
107
154
71
94
6729
91
67
23
25
127
22
10
35
11
13
4
23
1,289
31
101
112
69
27
71
36
27
32
50
17
1
63
2,141
25
69
104
81
66
67
26
35
48
34
13
0
34
1,783
27
86
152
78
63
97
34
17
47
15
13
3
18
2,150
4561,210
9561,339
TOTA
L IN
FRIN
GEM
ENT
NO
TIC
ES
TOTA
L EN
FOR
CEM
ENT
OR
DER
SUNITARY AUTHORITIES
REGIONAL COUNCILS
1
2
0
2
0
1
1
00001
Total infringement notices and enforcement orders
Analysis of the 2020 / 2021 compliance monitoring and enforcement metrics for the regional sector
PAGE 38
Attachment 21-265.1
Audit & Risk Committee 23 November 2021 109 of 144

Prosecutions
Questions 32 to 37 address prosecutions, defendants and convictions. The degree to which prosecutions are used shows the willingness of agencies to use tools at the heavy end of the spectrum. Prosecutions work to deter offenders, they are valuable in encouraging compliance and behaviour change when used appropriately.
Where councils are unlikely to prosecute it may be perceived that non compliance is unlikely to result in consequence.
The overall prosecutions concluded are up 36% on last year, while those in progress are down on last year (39%). Regionally there are differences, this is between 0 and 20 for those that have concluded, and between 0 and 12 for those still in progress.
Number of individuals convicted remains on par with last year, the number of convictions entered is decreasing year on year. The number of corporates convicted has increased steadily since 2018, this year by around a quarter.
QUESTION 32. How many RMA prosecutions were: Note: For this question please consider an entire case (regardless of number of charges and defendants) as one prosecution.Concluded in the period?Still in progress in the period?
QUESTION 33. What is the total number of individual (person) defendants convicted as a result of RMA prosecutions concluded in this period?
QUESTION 34. For all of these (person) defendants what is the total number of convictions entered against them? For example, there may be a total of 27 separate convictions entered against a total of nine ‘individual’ defendants.
QUESTION 35. What is the total number of corporate (e.g., Crown, company, body corporate etc.) defendants convicted as a result of RMA prosecutions concluded in this period?
QUESTION 36. For all of these (corporate) defendants what is the total number of convictions entered against them? For example, there may be a total of 30 separate convictions entered against a total of 12 corporate defendants.
QUESTION 37. Total number of convictions against an individual [see categories for sections of the Act as above] Total fine potential (Total x $300,000)
Total number of convictions against a corporate entity [see categories for sections of the Act as above] Total fine potential (Total x $600,000)
NATIONWIDE PROSECUTIONS
IN PROGRESSCONCLUDED 7195INDIVIDUALS ON 84 CHARGES
CORPORATESON 175 CHARGES
45
75
Analysis of the 2020 / 2021 compliance monitoring and enforcement metrics for the regional sector
PAGE 39
Attachment 21-265.1
Audit & Risk Committee 23 November 2021 110 of 144

Figure 15: Prosecutions across the regional sector
Northland Regional Council
Waikato Regional Council
Bay of Plenty Regional Council
Hawkes Bay Regional Council
Taranaki Regional Council
Horizons Regional Council
Greater Wellington Regional Council
Environment Canterbury
Otago Regional Council
West Coast Regional Council
Southland Regional Council
Auckland Council
Gisborne District Council
Nelson City Council
Marlborough District Council
Tasman District Council
TOTAL
4
4
2
12
0
2
0
5
27
17
0
3
12
3
8
21
4
4
1
8
22
13
0
4
9
2
2
12
3
3
4
2
6
10
6
0
2018 / 2019
2019 / 2020
2020/ 2021
0
15
4
21
2
20
4 6
12
1
1
5
0
7
4 4
4
3
6
4
0
7
61
0
1
3
0
1
4
52
3
0
10
1
0
10
70
4
0
10
12
4
3
9
2
1
11
1
0
10
95
5
1
NU
MB
ER C
ON
CLU
DED
NU
MB
ER IN
PR
OG
RES
S
UNITARY AUTHORITIES
REGIONAL COUNCILS
12
4
99
7
5
118
1
5
71
011
Nationwide Prosecutions Across the Regional Sector
Analysis of the 2020 / 2021 compliance monitoring and enforcement metrics for the regional sector
PAGE 40
Attachment 21-265.1
Audit & Risk Committee 23 November 2021 111 of 144

Figure 16 : Individuals convicted across the regional sector
Northland Regional Council
Waikato Regional Council
Bay of Plenty Regional Council
Hawkes Bay Regional Council
Taranaki Regional Council
Horizons Regional Council
Greater Wellington Regional Council
Environment Canterbury
Otago Regional Council
West Coast Regional Council
Southland Regional Council
Auckland Council
Gisborne District Council
Nelson City Council
Marlborough District Council
Tasman District Council
TOTAL
1
2
12
2
35
114
3
0
0
41
4
6
0
0
0
0
47
106
0
3
0
11
25
8
0
14
18
2
2
10
95
3
8
0
8
21
5
0
12
4
0
3
10
84
6
4
2
4
17
7
0
2017 / 2018 2018 / 2019 2019 / 2020 2020/ 2021
1
3
0
8
5
12
3
86
1
3
0
0 0
0 0
1
10
0
11
0
0
11
49
0
2
4
0
0
1
0 0
0 0
0
0
5
2
0
7
29
0
2
4
0
2
3
1NO DATA NO DATA
1
0
6
1
0
5
41
1
0
6
4
3
1
2
0
1
4
0
0
6
45
5
2
NU
MB
ER O
F IN
DIV
IDU
ALS
CO
NV
ICTE
D
NU
MB
ER O
F C
ON
VIC
TIO
NS
ENTE
RED
UNITARY AUTHORITIES
REGIONAL COUNCILS
0
0
0
6
2
2
11
08
60
4
Individuals convicted across the regional sector
Analysis of the 2020 / 2021 compliance monitoring and enforcement metrics for the regional sector
PAGE 41
Attachment 21-265.1
Audit & Risk Committee 23 November 2021 112 of 144
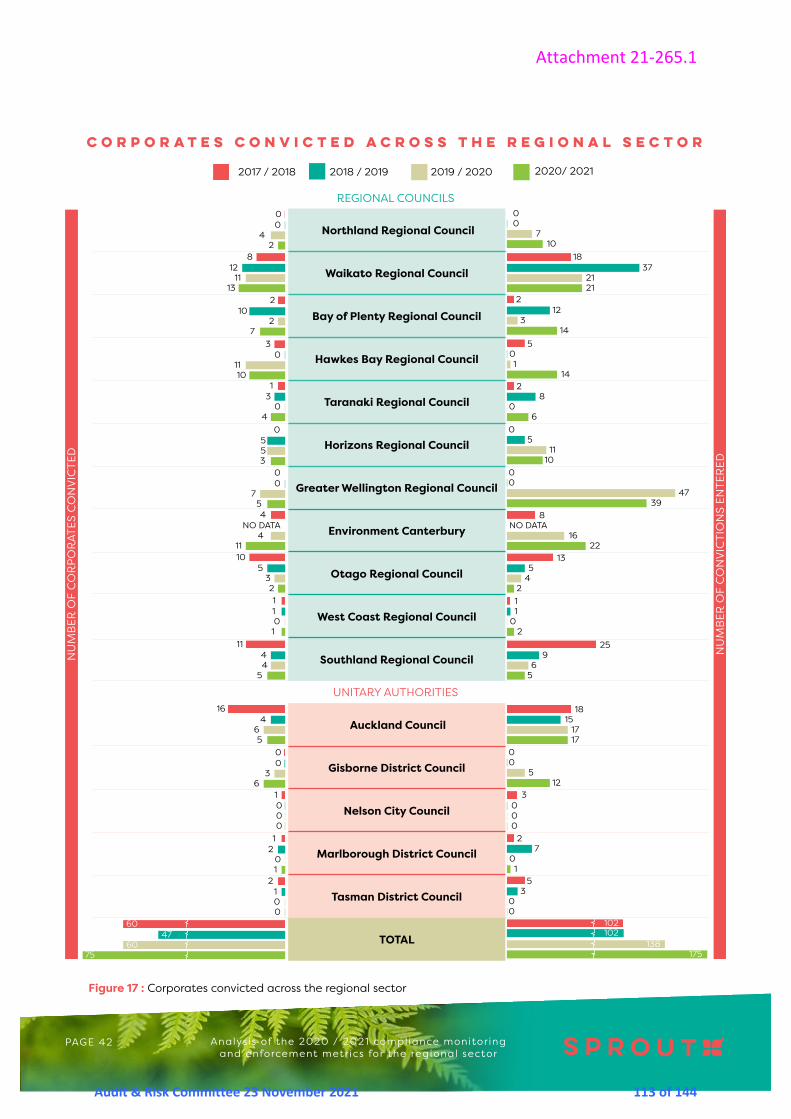
Figure 17 : Corporates convicted across the regional sector
Northland Regional Council
Waikato Regional Council
Bay of Plenty Regional Council
Hawkes Bay Regional Council
Taranaki Regional Council
Horizons Regional Council
Greater Wellington Regional Council
Environment Canterbury
Otago Regional Council
West Coast Regional Council
Southland Regional Council
Auckland Council
Gisborne District Council
Nelson City Council
Marlborough District Council
Tasman District Council
TOTAL
0
5
13
8
18
2
0
1
25
0
18
102102
2
3
0
0
5
15
8
5
1
9
0
37
12
0
7
1
4
16
17
0
11
0
6
47
21
138
3
0
10
14
2
22
17
6
10
2
5
39
21
175
14
0
2017 / 2018 2018 / 2019 2019 / 2020 2020/ 2021
0
8
0
12
4
11
2
132
3
1
0
0
4
10
1
11
1
1
16
60
0
2
10
0
3
5
0
5
1
4
2
0
4
47
0
1
2
11
0
5
7
4NO DATA NO DATA
3
0
4
0
0
6
60
3
0
7
10
4
3
5
11
2
1
5
1
0
5
75
6
0
NU
MB
ER O
F C
OR
POR
ATES
CO
NV
ICTE
D
NU
MB
ER O
F C
ON
VIC
TIO
NS
ENTE
RED
UNITARY AUTHORITIES
REGIONAL COUNCILS
0
2
0
7
5
0
12
15
300
Corporates convicted across the regional sector
Analysis of the 2020 / 2021 compliance monitoring and enforcement metrics for the regional sector
PAGE 42
Attachment 21-265.1
Audit & Risk Committee 23 November 2021 113 of 144

Penalties
Fines increased significantly this year totalling $5,187,565 ($1.7m more than last year). The majority of these are corporate fines $4,273,025. This year 5 councils had no individual fines, 2 had no corporate fines. Following last year Waikato has more fines than other councils with $1.34m of fines.
There were a range of sanctions handed down. This year there were no prison sentences. Nelson City Council was the only council this year to issue no fines or penalties as they had no prosecutions.
Table 7: Other sanctions handed down under the RMA
NUMBER OF COUNCILS
ENFORCEMENT ORDER 7
REPARATION 4
COMMUNITY SERVICE 4
RESTORATIVE JUSTICE 6
DIVERSION 1
ALTERNATIVE JUSTICE 1
DISCHARGE WITHOUT CONVICTION 5
QUESTION 38. What is the total amount of fines imposed by the courts as a result of RMA prosecutions concluded in this period? Individual / Corporate QUESTION 39. What other sanctions, if any, have been imposed by the courts as a result of RMA prosecutions concluded in this period? Prison sentence / Enforcement order / Reparation / Community Service / Discharge without conviction / Other QUESTION 40. How many prosecutions involved restorative justice, diversion or other alternative justice process?• Restorative justice• Diversion• Alternative justice QUESTION 41. Describe any outcomes relating to these processes.
Analysis of the 2020 / 2021 compliance monitoring and enforcement metrics for the regional sector
PAGE 43
Attachment 21-265.1
Audit & Risk Committee 23 November 2021 114 of 144

CORPORATEINDIVIDUAL$4,273,025$914,540
INDIVIDUAL FINES
CORPORATE FINES
REGIONAL COUNCILS
NORTHLAND REGIONAL COUNCIL $3,000 $60,800
WAIKATO REGIONAL COUNCIL $397,000 $948,475
BAY OF PLENTY REGIONAL COUNCIL $69,800 $326,450
HAWKES BAY REGIONAL COUNCIL $34,690 $161,700
TARANAKI REGIONAL COUNCIL $105,000 $600,000
HORIZONS REGIONAL COUNCIL $0 $214,000
GREATER WELLINGTON REGIONAL COUNCIL $0 $310,000
ENVIRONMENT CANTERBURY $36,000 $319,300
OTAGO REGIONAL COUNCIL $0 $547,750
WEST COAST REGIONAL COUNCIL $25,500 $25,500
SOUTHLAND REGIONAL COUNCIL $51,250 $103,500
REGIONAL SUBTOTAL $722,240 $3,617,475
UNITARY AUTHORITIES
AUCKLAND COUNCIL $67,500 $232,250
GISBORNE DISTRICT COUNCIL $96,800 $408,300
NELSON CITY COUNCIL $0 $0
MARLBOROUGH DISTRICT COUNCIL $0 $15,000
TASMAN DISTRICT COUNCIL $28,000 $0
UNITARY SUBTOTAL $192,300 $655,550
TOTAL $914,540 $4,273,025
Table 8: Prosecution outcomes: fines
NATIONWIDE Total fines
QUESTION 42. What is the total amount of fines imposed by the courts as a result of RMA prosecutions concluded in this period?
Analysis of the 2020 / 2021 compliance monitoring and enforcement metrics for the regional sector
PAGE 44
Attachment 21-265.1
Audit & Risk Committee 23 November 2021 115 of 144

ENFORCEMENT ORDER REPARATION COMMUNITY
SERVICE
DISCHARGE WITHOUT
CONVICTION
REGIONAL COUNCILS
NORTHLAND REGIONAL COUNCIL 1 1 (300hrs)
WAIKATO REGIONAL COUNCIL 1 $120,000
BAY OF PLENTY REGIONAL COUNCIL $5,000 1
HAWKES BAY REGIONAL COUNCIL
TARANAKI REGIONAL COUNCIL 1
HORIZONS REGIONAL COUNCIL
GREATER WELLINGTON REGIONAL COUNCIL 1
ENVIRONMENT CANTERBURY 1 1 (45hrs) 1
OTAGO REGIONAL COUNCIL
WEST COAST REGIONAL COUNCIL
SOUTHLAND REGIONAL COUNCIL 1 1 ($15,000) 1
REGIONAL SUBTOTAL 5 4
UNITARY AUTHORITIES
AUCKLAND COUNCIL 4 2
GISBORNE DISTRICT COUNCIL $6,500 (150hrs)
NELSON CITY COUNCIL
MARLBOROUGH DISTRICT COUNCIL
TASMAN DISTRICT COUNCIL 1
UNITARY SUBTOTAL 5 2
TOTAL 10 6
Table 9: Prosecutions involving other sanctions imposed by courts
QUESTION 43. What other sanctions, if any, have been imposed by the courts as a result of RMA prosecutions concluded in this period?
Prosecutions Involving Other Sanctions Imposed by Courts
Analysis of the 2020 / 2021 compliance monitoring and enforcement metrics for the regional sector
PAGE 45
Attachment 21-265.1
Audit & Risk Committee 23 November 2021 116 of 144
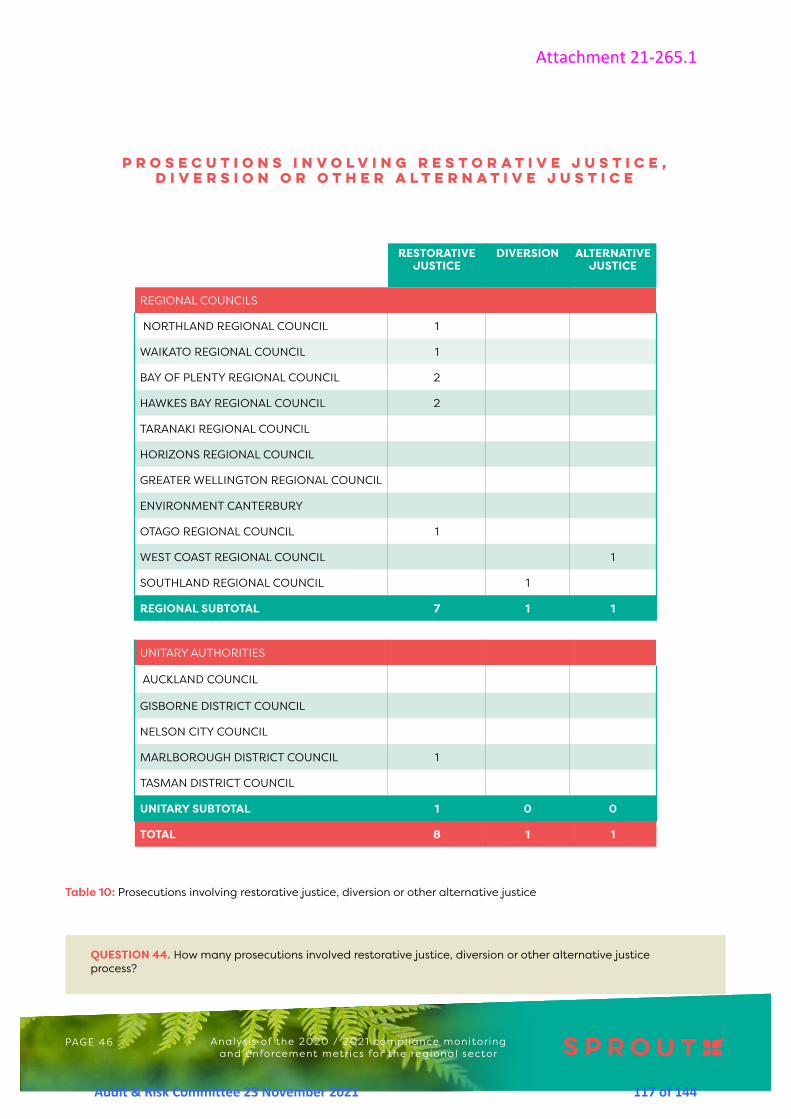
RESTORATIVE JUSTICE
DIVERSION ALTERNATIVE JUSTICE
REGIONAL COUNCILS
NORTHLAND REGIONAL COUNCIL 1
WAIKATO REGIONAL COUNCIL 1
BAY OF PLENTY REGIONAL COUNCIL 2
HAWKES BAY REGIONAL COUNCIL 2
TARANAKI REGIONAL COUNCIL
HORIZONS REGIONAL COUNCIL
GREATER WELLINGTON REGIONAL COUNCIL
ENVIRONMENT CANTERBURY
OTAGO REGIONAL COUNCIL 1
WEST COAST REGIONAL COUNCIL 1
SOUTHLAND REGIONAL COUNCIL 1
REGIONAL SUBTOTAL 7 1 1
UNITARY AUTHORITIES
AUCKLAND COUNCIL
GISBORNE DISTRICT COUNCIL
NELSON CITY COUNCIL
MARLBOROUGH DISTRICT COUNCIL 1
TASMAN DISTRICT COUNCIL
UNITARY SUBTOTAL 1 0 0
TOTAL 8 1 1
Table 10: Prosecutions involving restorative justice, diversion or other alternative justice
QUESTION 44. How many prosecutions involved restorative justice, diversion or other alternative justice process?
Prosecutions Involving Restorative Justice, Diversion or Other Alternative Justice
Analysis of the 2020 / 2021 compliance monitoring and enforcement metrics for the regional sector
PAGE 46
Attachment 21-265.1
Audit & Risk Committee 23 November 2021 117 of 144

CME REPORTING
Question 44 addressed the ways in which this operational function was carried out, providing a range of ‘standard’ options and giving council respondents space to describe alternate approaches.
Most commonly councils use reports to other Councillors and Council committee meetings that are open to the public. Other mechanisms include zone meetings, putting data on the website, regulation committee meetings, compliance monitoring report, rates newsletter, media release and individual prosecutions.
Table 11: CME reporting channels
ANNUAL REPORT
REPORT TO COUNCILLORS SNAPSHOT
REPORT(S) TO COUNCIL COMMITTEE MEETINGS (OPEN TO PUBLIC) OTHER
TOTAL REPORTING CHANNELS
REGIONAL COUNCILS
NORTHLAND REGIONAL COUNCIL 5
WAIKATO REGIONAL COUNCIL 3
BAY OF PLENTY REGIONAL COUNCIL 4
HAWKES BAY REGIONAL COUNCIL 4
TARANAKI REGIONAL COUNCIL 4
HORIZONS REGIONAL COUNCIL 3
GREATER WELLINGTON REGIONAL COUNCIL 3
ENVIRONMENT CANTERBURY 5
OTAGO REGIONAL COUNCIL 2
WEST COAST REGIONAL COUNCIL 3
SOUTHLAND REGIONAL COUNCIL 1
UNITARY AUTHORITIES
AUCKLAND COUNCIL 1
GISBORNE DISTRICT COUNCIL 3
NELSON CITY COUNCIL 3
MARLBOROUGH DISTRICT COUNCIL 4
TASMAN DISTRICT COUNCIL 3
CME Reporting Channels
Analysis of the 2020 / 2021 compliance monitoring and enforcement metrics for the regional sector
PAGE 47
Attachment 21-265.1
Audit & Risk Committee 23 November 2021 118 of 144
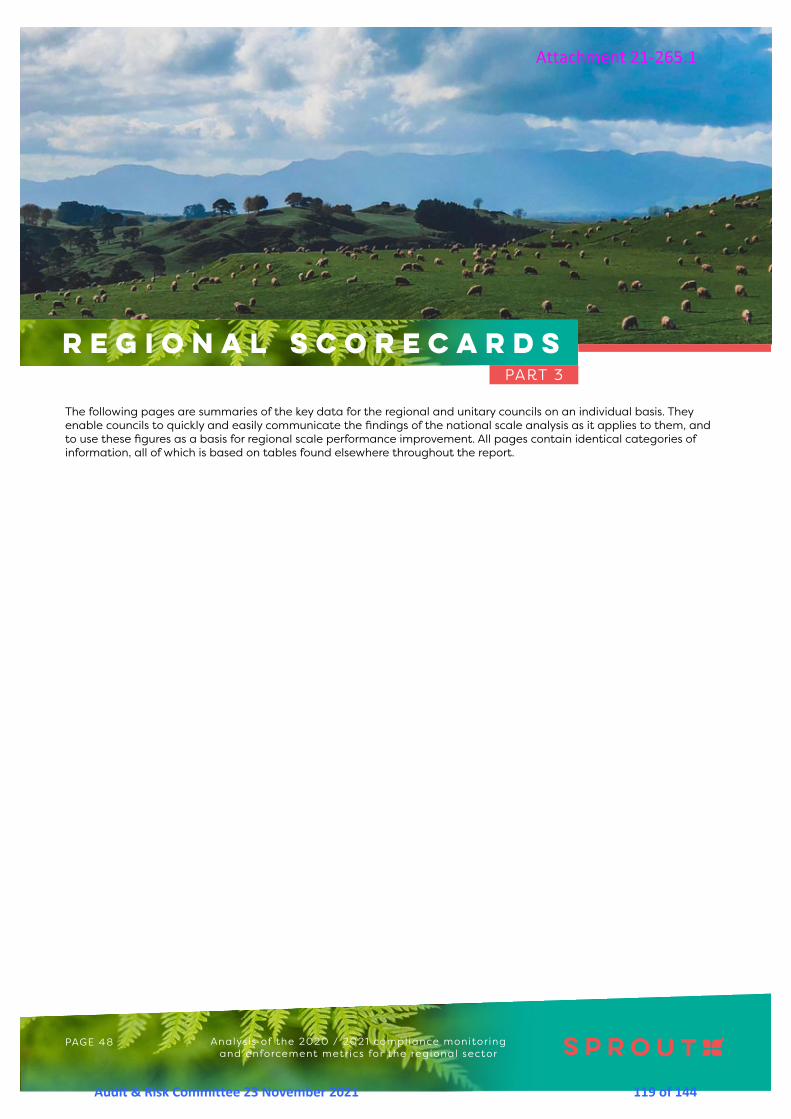
REGIONAL SCORECARDSPART 3
The following pages are summaries of the key data for the regional and unitary councils on an individual basis. They enable councils to quickly and easily communicate the findings of the national scale analysis as it applies to them, and to use these figures as a basis for regional scale performance improvement. All pages contain identical categories of information, all of which is based on tables found elsewhere throughout the report.
Analysis of the 2020 / 2021 compliance monitoring and enforcement metrics for the regional sector
PAGE 48
Attachment 21-265.1
Audit & Risk Committee 23 November 2021 119 of 144

NATIONAL SUMMARY
CME METRICS REPORT 2020/ 2021
!
NEW ZEALAND POPULATION ESTIMATE 2020
POPULATION GROWTH 2015-2020
GEOGRAPHIC AREA
GDP TO MARCH 2020
5,042,900
10.5%
268,000km2
$323,142m
FTE/1000
FULL TIME EMPLOYEES 542
0.15
ADMINISTERED REQUIRED MONITORING
CONSENTS MONITORED OF THOSE REQUIRING IT
ENVIRONMENTAL INCIDENTS REPORTED
RESPONSE RATE
CONSENTS
INCIDENTS
ENFORCEMENT
WARNINGS ISSUED
ENFORCEMENT ORDER APPLICATIONS
ABATEMENT NOTICES ISSUED
PROSECUTIONS CONCLUDED
INFRINGEMENT FINES ISSUED
PROSECUTIONS IN PROGRESS
802 5,225 2,150
719518
283,470 38,214
29,468 99%
83%
CME STAFF
POLICY CHECKLIST
Conflict of interest policy
Education / engagement programmes
Enforcement policy
16/1616/1616/16
Analysis of the 2020 / 2021 compliance monitoring and enforcement metrics for the regional sector
PAGE 49
Attachment 21-265.1
Audit & Risk Committee 23 November 2021 120 of 144

NORTHLAND REGIONAL COUNCIL
CME METRICS REPORT 2020/ 2021
!
NEW ZEALAND POPULATION ESTIMATE 2020
POPULATION GROWTH 2015-2020
GEOGRAPHIC AREA
GDP TO MARCH 2020
192,500
13.1%
13,778km2
$8,222m
FTE/1000
FULL TIME EMPLOYEES 25
0.13
ADMINISTERED REQUIRED MONITORING
CONSENTS MONITORED OF THOSE REQUIRING IT
ENVIRONMENTAL INCIDENTS REPORTED
RESPONSE RATE
CONSENTS
INCIDENTS
ENFORCEMENT
WARNINGS ISSUED
ENFORCEMENT ORDER APPLICATIONS
ABATEMENT NOTICES ISSUED
PROSECUTIONS CONCLUDED
INFRINGEMENT FINES ISSUED
PROSECUTIONS IN PROGRESS
o 210 94
423
10,164 3,505
811 100%
86%
CME STAFF
NATIONAL AVERAGE 83%
NATIONAL AVERAGE 99%
NATIONAL AVERAGE 0.15
Analysis of the 2020 / 2021 compliance monitoring and enforcement metrics for the regional sector
PAGE 50
Attachment 21-265.1
Audit & Risk Committee 23 November 2021 121 of 144

WAIKATO REGIONAL COUNCIL
CME METRICS REPORT 2020/ 2021
!
NEW ZEALAND POPULATION ESTIMATE 2020
POPULATION GROWTH 2015-2020
GEOGRAPHIC AREA
GDP TO MARCH 2020
492,100
12.5%
24,147km2
$27,884m
ADMINISTERED REQUIRED MONITORING
CONSENTS MONITORED OF THOSE REQUIRING IT
ENVIRONMENTAL INCIDENTS REPORTED
RESPONSE RATE
CONSENTS
INCIDENTS
ENFORCEMENT
WARNINGS ISSUED
ENFORCEMENT ORDER APPLICATIONS
ABATEMENT NOTICES ISSUED
PROSECUTIONS CONCLUDED
INFRINGEMENT FINES ISSUED
PROSECUTIONS IN PROGRESS
282 118 67
10201
11,839 no data
2,207 100%
no data
NATIONAL AVERAGE 83%
NATIONAL AVERAGE 99%
FTE/1000
FULL TIME EMPLOYEES 47
0.1
CME STAFF
NATIONAL AVERAGE 0.15
Analysis of the 2020 / 2021 compliance monitoring and enforcement metrics for the regional sector
PAGE 51
Attachment 21-265.1
Audit & Risk Committee 23 November 2021 122 of 144

BAY OF PLENTY REGIONAL COUNCIL
CME METRICS REPORT 2020/ 2021
!
NEW ZEALAND POPULATION ESTIMATE 2020
POPULATION GROWTH 2015-2020
GEOGRAPHIC AREA
GDP TO MARCH 2020
333,500
15.1%
12,303km2
$18,884m
ADMINISTERED REQUIRED MONITORING
CONSENTS MONITORED OF THOSE REQUIRING IT
ENVIRONMENTAL INCIDENTS REPORTED
RESPONSE RATE
CONSENTS
INCIDENTS
ENFORCEMENT
WARNINGS ISSUED
ENFORCEMENT ORDER APPLICATIONS
ABATEMENT NOTICES ISSUED
PROSECUTIONS CONCLUDED
INFRINGEMENT FINES ISSUED
PROSECUTIONS IN PROGRESS
NO data 102 27
6100
8,407 3,324
3,771 100%
86%
NATIONAL AVERAGE 83%
NATIONAL AVERAGE 99%
FTE/1000
FULL TIME EMPLOYEES 37
0.11
CME STAFF
NATIONAL AVERAGE 0.15
Analysis of the 2020 / 2021 compliance monitoring and enforcement metrics for the regional sector
PAGE 52
Attachment 21-265.1
Audit & Risk Committee 23 November 2021 123 of 144

HAWKES BAY REGIONAL COUNCIL
CME METRICS REPORT 2020/ 2021
!
NEW ZEALAND POPULATION ESTIMATE 2020
POPULATION GROWTH 2015-2020
GEOGRAPHIC AREA
GDP TO MARCH 2020
177,200
9.2%
14,138km2
$9,093m
ADMINISTERED REQUIRED MONITORING
CONSENTS MONITORED OF THOSE REQUIRING IT
ENVIRONMENTAL INCIDENTS REPORTED
RESPONSE RATE
CONSENTS
INCIDENTS
ENFORCEMENT
WARNINGS ISSUED
ENFORCEMENT ORDER APPLICATIONS
ABATEMENT NOTICES ISSUED
PROSECUTIONS CONCLUDED
INFRINGEMENT FINES ISSUED
PROSECUTIONS IN PROGRESS
22 66 86
9120
8,452 3,355
823 100%
93%
NATIONAL AVERAGE 83%
NATIONAL AVERAGE 99%
FTE/1000
FULL TIME EMPLOYEES 16
0.09
CME STAFF
NATIONAL AVERAGE 0.15
Analysis of the 2020 / 2021 compliance monitoring and enforcement metrics for the regional sector
PAGE 53
Attachment 21-265.1
Audit & Risk Committee 23 November 2021 124 of 144

TARANAKI REGIONAL COUNCIL
CME METRICS REPORT 2020/ 2021
!
NEW ZEALAND POPULATION ESTIMATE 2020
POPULATION GROWTH 2015-2020
GEOGRAPHIC AREA
GDP TO MARCH 2020
124,000
7.1%
7,256km2
$9,513m
ADMINISTERED REQUIRED MONITORING
CONSENTS MONITORED OF THOSE REQUIRING IT
ENVIRONMENTAL INCIDENTS REPORTED
RESPONSE RATE
CONSENTS
INCIDENTS
ENFORCEMENT
WARNINGS ISSUED
ENFORCEMENT ORDER APPLICATIONS
ABATEMENT NOTICES ISSUED
PROSECUTIONS CONCLUDED
INFRINGEMENT FINES ISSUED
PROSECUTIONS IN PROGRESS
0 255 152
341
4,517 2,510
590 100%
100%
NATIONAL AVERAGE 83%
NATIONAL AVERAGE 99%
FTE/1000
FULL TIME EMPLOYEES 49
0.4
CME STAFF
NATIONAL AVERAGE 0.15
Analysis of the 2020 / 2021 compliance monitoring and enforcement metrics for the regional sector
PAGE 54
Attachment 21-265.1
Audit & Risk Committee 23 November 2021 125 of 144

HORIZONS REGIONAL COUNCIL
CME METRICS REPORT 2020/ 2021
!
NEW ZEALAND POPULATION ESTIMATE 2020
POPULATION GROWTH 2015-2020
GEOGRAPHIC AREA
GDP TO MARCH 2020
252,900
7.2%
22,220km2
$12,426m
ADMINISTERED REQUIRED MONITORING
CONSENTS MONITORED OF THOSE REQUIRING IT
ENVIRONMENTAL INCIDENTS REPORTED
RESPONSE RATE
CONSENTS
INCIDENTS
ENFORCEMENT
WARNINGS ISSUED
ENFORCEMENT ORDER APPLICATIONS
ABATEMENT NOTICES ISSUED
PROSECUTIONS CONCLUDED
INFRINGEMENT FINES ISSUED
PROSECUTIONS IN PROGRESS
11 40 78
43no data
6,619 1,823
1,226 100%
89%
NATIONAL AVERAGE 83%
NATIONAL AVERAGE 99%
FTE/1000
FULL TIME EMPLOYEES 25
0.1
CME STAFF
NATIONAL AVERAGE 0.15
Analysis of the 2020 / 2021 compliance monitoring and enforcement metrics for the regional sector
PAGE 55
Attachment 21-265.1
Audit & Risk Committee 23 November 2021 126 of 144

GREATER WELLINGTON REGIONAL COUNCIL
CME METRICS REPORT 2020/ 2021
!
NEW ZEALAND POPULATION ESTIMATE 2020
POPULATION GROWTH 2015-2020
GEOGRAPHIC AREA
GDP TO MARCH 2020
538,500
8.1%
8,142km2
$40,272m
ADMINISTERED REQUIRED MONITORING
CONSENTS MONITORED OF THOSE REQUIRING IT
ENVIRONMENTAL INCIDENTS REPORTED
RESPONSE RATE
CONSENTS
INCIDENTS
ENFORCEMENT
WARNINGS ISSUED
ENFORCEMENT ORDER APPLICATIONS
ABATEMENT NOTICES ISSUED
PROSECUTIONS CONCLUDED
INFRINGEMENT FINES ISSUED
PROSECUTIONS IN PROGRESS
44 26 63
443
7,138 1,779
1,140 100%
87%
NATIONAL AVERAGE 83%
NATIONAL AVERAGE 99%
FTE/1000
FULL TIME EMPLOYEES 18
0.03
CME STAFF
NATIONAL AVERAGE 0.15
Analysis of the 2020 / 2021 compliance monitoring and enforcement metrics for the regional sector
PAGE 56
Attachment 21-265.1
Audit & Risk Committee 23 November 2021 127 of 144

ENVIROMENT CANTERBURY
CME METRICS REPORT 2020/ 2021
!
NEW ZEALAND POPULATION ESTIMATE 2020
POPULATION GROWTH 2015-2020
GEOGRAPHIC AREA
GDP TO MARCH 2020
641,200
10.8%
44,633km2
$39,961m
ADMINISTERED REQUIRED MONITORING
CONSENTS MONITORED OF THOSE REQUIRING IT
ENVIRONMENTAL INCIDENTS REPORTED
RESPONSE RATE
CONSENTS
INCIDENTS
ENFORCEMENT
WARNINGS ISSUED
ENFORCEMENT ORDER APPLICATIONS
ABATEMENT NOTICES ISSUED
PROSECUTIONS CONCLUDED
INFRINGEMENT FINES ISSUED
PROSECUTIONS IN PROGRESS
261 260 97
291
22,648 1,314
4,441 100%
96%
NATIONAL AVERAGE 83%
NATIONAL AVERAGE 99%
FTE/1000
FULL TIME EMPLOYEES 54
0.08
CME STAFF
NATIONAL AVERAGE 0.15
Analysis of the 2020 / 2021 compliance monitoring and enforcement metrics for the regional sector
PAGE 57
Attachment 21-265.1
Audit & Risk Committee 23 November 2021 128 of 144

OTAGO REGIONAL COUNCIL
CME METRICS REPORT 2020/ 2021
!
NEW ZEALAND POPULATION ESTIMATE 2020
POPULATION GROWTH 2015-2020
GEOGRAPHIC AREA
GDP TO MARCH 2020
243,000
13%
31,280km2
$14,180m
ADMINISTERED REQUIRED MONITORING
CONSENTS MONITORED OF THOSE REQUIRING IT
ENVIRONMENTAL INCIDENTS REPORTED
RESPONSE RATE
CONSENTS
INCIDENTS
ENFORCEMENT
WARNINGS ISSUED
ENFORCEMENT ORDER APPLICATIONS
ABATEMENT NOTICES ISSUED
PROSECUTIONS CONCLUDED
INFRINGEMENT FINES ISSUED
PROSECUTIONS IN PROGRESS
27 25 34
220
5,785 3,136
1,268 100%
71%
NATIONAL AVERAGE 83%
NATIONAL AVERAGE 99%
FTE/1000
FULL TIME EMPLOYEES 32
0.13
CME STAFF
NATIONAL AVERAGE 0.15
Analysis of the 2020 / 2021 compliance monitoring and enforcement metrics for the regional sector
PAGE 58
Attachment 21-265.1
Audit & Risk Committee 23 November 2021 129 of 144

WEST COAST REGIONAL COUNCIL
CME METRICS REPORT 2020/ 2021
!
NEW ZEALAND POPULATION ESTIMATE 2020
POPULATION GROWTH 2015-2020
GEOGRAPHIC AREA
GDP TO MARCH 2020
32,400
-1.5%
23,277km2
$1,836m
ADMINISTERED REQUIRED MONITORING
CONSENTS MONITORED OF THOSE REQUIRING IT
ENVIRONMENTAL INCIDENTS REPORTED
RESPONSE RATE
CONSENTS
INCIDENTS
ENFORCEMENT
WARNINGS ISSUED
ENFORCEMENT ORDER APPLICATIONS
ABATEMENT NOTICES ISSUED
PROSECUTIONS CONCLUDED
INFRINGEMENT FINES ISSUED
PROSECUTIONS IN PROGRESS
11 12 17
21no data
5,682 1,268
131 100%
92%
NATIONAL AVERAGE 83%
NATIONAL AVERAGE 99%
FTE/1000
FULL TIME EMPLOYEES 7
0.20
CME STAFF
NATIONAL AVERAGE 0.15
Analysis of the 2020 / 2021 compliance monitoring and enforcement metrics for the regional sector
PAGE 59
Attachment 21-265.1
Audit & Risk Committee 23 November 2021 130 of 144

SOUTHLAND REGIONAL COUNCIL
CME METRICS REPORT 2020/ 2021
!
NEW ZEALAND POPULATION ESTIMATE 2020
POPULATION GROWTH 2015-2020
GEOGRAPHIC AREA
GDP TO MARCH 2020
102,300
5.1%
32,184km2
$6,718m
ADMINISTERED REQUIRED MONITORING
CONSENTS MONITORED OF THOSE REQUIRING IT
ENVIRONMENTAL INCIDENTS REPORTED
RESPONSE RATE
CONSENTS
INCIDENTS
ENFORCEMENT
WARNINGS ISSUED
ENFORCEMENT ORDER APPLICATIONS
ABATEMENT NOTICES ISSUED
PROSECUTIONS CONCLUDED
INFRINGEMENT FINES ISSUED
PROSECUTIONS IN PROGRESS
91 29 47
6110
5,995 5,920
888 100%
72%
NATIONAL AVERAGE 83%
NATIONAL AVERAGE 99%
FTE/1000
FULL TIME EMPLOYEES 13
0.12
CME STAFF
NATIONAL AVERAGE 0.15
Analysis of the 2020 / 2021 compliance monitoring and enforcement metrics for the regional sector
PAGE 60
Attachment 21-265.1
Audit & Risk Committee 23 November 2021 131 of 144

AUCKLAND COUNCIL
CME METRICS REPORT 2020/ 2021
!
NEW ZEALAND POPULATION ESTIMATE 2020
POPULATION GROWTH 2015-2020
GEOGRAPHIC AREA
GDP TO MARCH 2020
1,702,700
10.8%
5,945km2
$122,557m
ADMINISTERED REQUIRED MONITORING
CONSENTS MONITORED OF THOSE REQUIRING IT
ENVIRONMENTAL INCIDENTS REPORTED
RESPONSE RATE
CONSENTS
INCIDENTS
ENFORCEMENT
WARNINGS ISSUED
ENFORCEMENT ORDER APPLICATIONS
ABATEMENT NOTICES ISSUED
PROSECUTIONS CONCLUDED
INFRINGEMENT FINES ISSUED
PROSECUTIONS IN PROGRESS
NO DATA 3,965 1,339
12106
130,371 NO DATA
9,502 100%
NO DATA
NATIONAL AVERAGE 83%
NATIONAL AVERAGE 99%
FTE/1000
FULL TIME EMPLOYEES 181
0.11
CME STAFF
NATIONAL AVERAGE 0.15
Analysis of the 2020 / 2021 compliance monitoring and enforcement metrics for the regional sector
PAGE 61
Attachment 21-265.1
Audit & Risk Committee 23 November 2021 132 of 144

GISBORNE DISTRICT COUNCIL
CME METRICS REPORT 2020/ 2021
!
NEW ZEALAND POPULATION ESTIMATE 2020
POPULATION GROWTH 2015-2020
GEOGRAPHIC AREA
GDP TO MARCH 2020
50,500
5.6%
8,386km2
$2,299m
ADMINISTERED REQUIRED MONITORING
CONSENTS MONITORED OF THOSE REQUIRING IT
ENVIRONMENTAL INCIDENTS REPORTED
RESPONSE RATE
CONSENTS
INCIDENTS
ENFORCEMENT
WARNINGS ISSUED
ENFORCEMENT ORDER APPLICATIONS
ABATEMENT NOTICES ISSUED
PROSECUTIONS CONCLUDED
INFRINGEMENT FINES ISSUED
PROSECUTIONS IN PROGRESS
40 35 3
151
8,893 1,135
194 100%
60%
NATIONAL AVERAGE 83%
NATIONAL AVERAGE 99%
FTE/1000
FULL TIME EMPLOYEES 9
0.18
CME STAFF
NATIONAL AVERAGE 0.15
Analysis of the 2020 / 2021 compliance monitoring and enforcement metrics for the regional sector
PAGE 62
Attachment 21-265.1
Audit & Risk Committee 23 November 2021 133 of 144
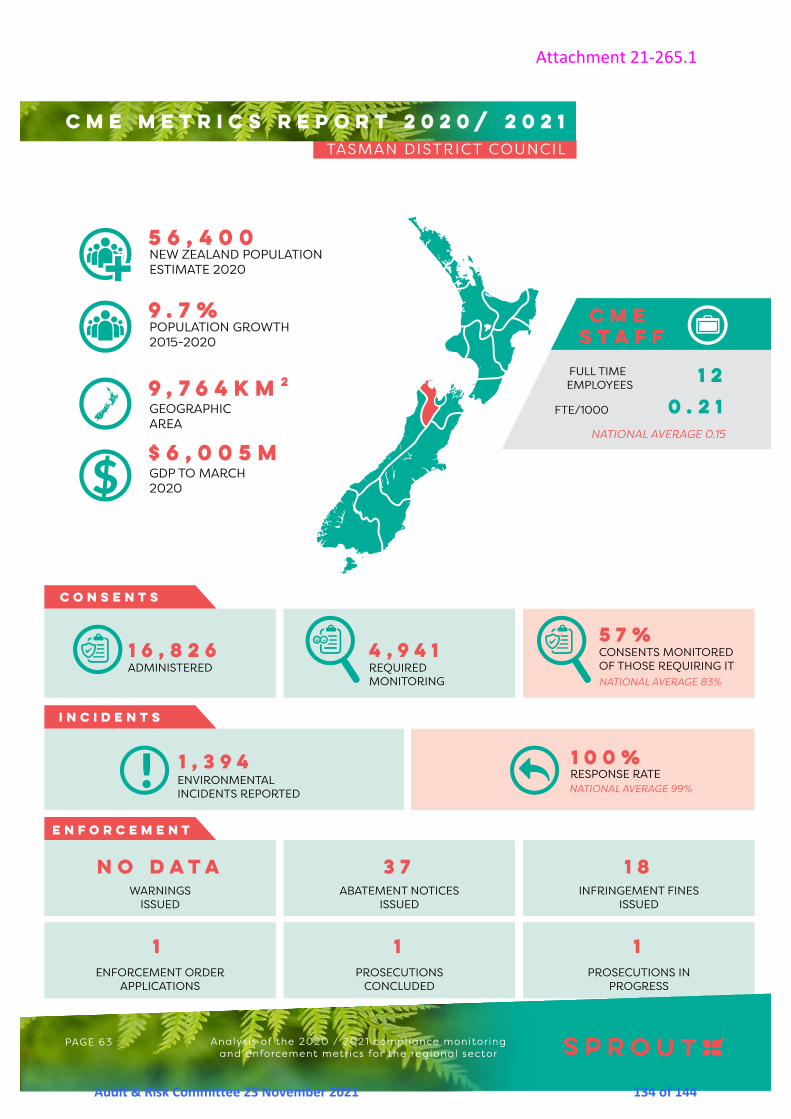
TASMAN DISTRICT COUNCIL
CME METRICS REPORT 2020/ 2021
!
NEW ZEALAND POPULATION ESTIMATE 2020
POPULATION GROWTH 2015-2020
GEOGRAPHIC AREA
GDP TO MARCH 2020
56,400
9.7%
9,764km2
$6,005m
ADMINISTERED REQUIRED MONITORING
CONSENTS MONITORED OF THOSE REQUIRING IT
ENVIRONMENTAL INCIDENTS REPORTED
RESPONSE RATE
CONSENTS
INCIDENTS
ENFORCEMENT
WARNINGS ISSUED
ENFORCEMENT ORDER APPLICATIONS
ABATEMENT NOTICES ISSUED
PROSECUTIONS CONCLUDED
INFRINGEMENT FINES ISSUED
PROSECUTIONS IN PROGRESS
NO DATA 37 18
111
16,826 4,941
1,394 100%
57%
NATIONAL AVERAGE 83%
NATIONAL AVERAGE 99%
FTE/1000
FULL TIME EMPLOYEES 12
0.21
CME STAFF
NATIONAL AVERAGE 0.15
Analysis of the 2020 / 2021 compliance monitoring and enforcement metrics for the regional sector
PAGE 63
Attachment 21-265.1
Audit & Risk Committee 23 November 2021 134 of 144

NELSON CITY COUNCIL
CME METRICS REPORT 2020/ 2021
!
NEW ZEALAND POPULATION ESTIMATE 2020
POPULATION GROWTH 2015-2020
GEOGRAPHIC AREA
GDP TO MARCH 2020
54,600
9.7%
477km2
$6,005m
ADMINISTERED REQUIRED MONITORING
CONSENTS MONITORED OF THOSE REQUIRING IT
ENVIRONMENTAL INCIDENTS REPORTED
RESPONSE RATE
CONSENTS
INCIDENTS
ENFORCEMENT
WARNINGS ISSUED
ENFORCEMENT ORDER APPLICATIONS
ABATEMENT NOTICES ISSUED
PROSECUTIONS CONCLUDED
INFRINGEMENT FINES ISSUED
PROSECUTIONS IN PROGRESS
NO DATA 17 13
001
675 675
523 100%
100%
NATIONAL AVERAGE 83%
NATIONAL AVERAGE 99%
FTE/1000
FULL TIME EMPLOYEES 6
0.1
CME STAFF
NATIONAL AVERAGE 0.15
Analysis of the 2020 / 2021 compliance monitoring and enforcement metrics for the regional sector
PAGE 64
Attachment 21-265.1
Audit & Risk Committee 23 November 2021 135 of 144
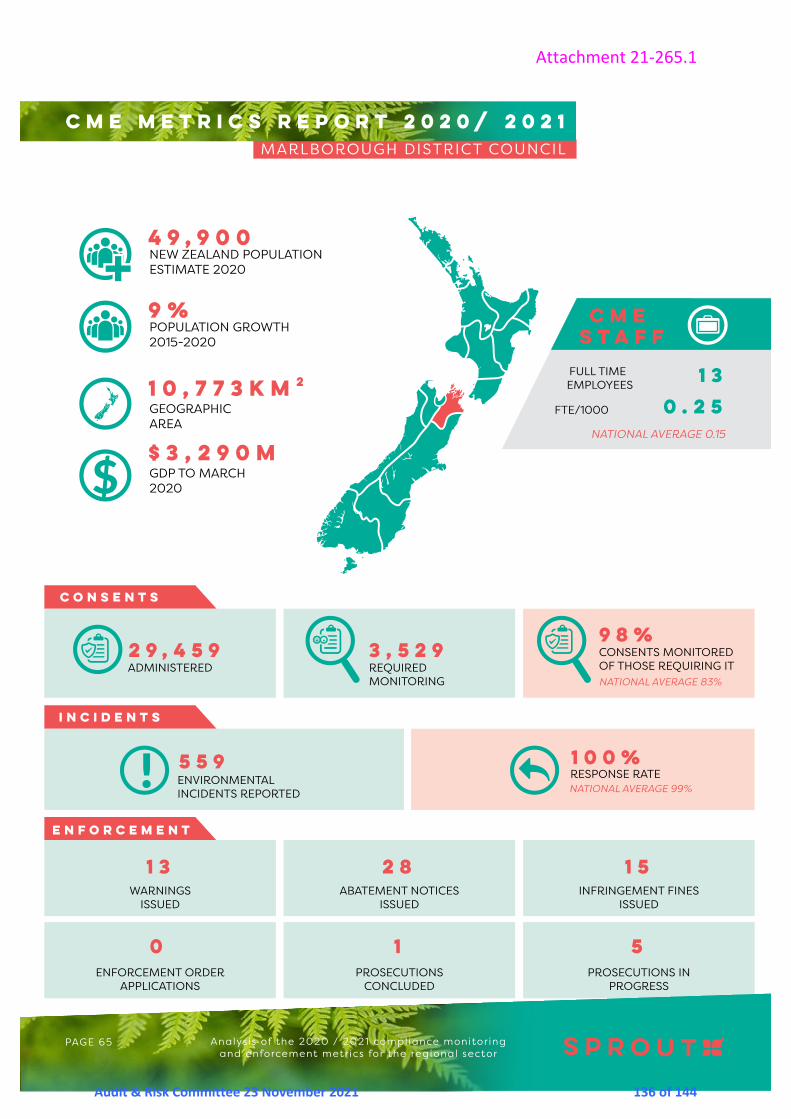
MARLBOROUGH DISTRICT COUNCIL
CME METRICS REPORT 2020/ 2021
!
NEW ZEALAND POPULATION ESTIMATE 2020
POPULATION GROWTH 2015-2020
GEOGRAPHIC AREA
GDP TO MARCH 2020
49,900
9%
10,773km2
$3,290m
ADMINISTERED REQUIRED MONITORING
CONSENTS MONITORED OF THOSE REQUIRING IT
ENVIRONMENTAL INCIDENTS REPORTED
RESPONSE RATE
CONSENTS
INCIDENTS
ENFORCEMENT
WARNINGS ISSUED
ENFORCEMENT ORDER APPLICATIONS
ABATEMENT NOTICES ISSUED
PROSECUTIONS CONCLUDED
INFRINGEMENT FINES ISSUED
PROSECUTIONS IN PROGRESS
13 28 15
510
29,459 3,529
559 100%
98%
NATIONAL AVERAGE 83%
NATIONAL AVERAGE 99%
FTE/1000
FULL TIME EMPLOYEES 13
0.25
CME STAFF
NATIONAL AVERAGE 0.15
Analysis of the 2020 / 2021 compliance monitoring and enforcement metrics for the regional sector
PAGE 65
Attachment 21-265.1
Audit & Risk Committee 23 November 2021 136 of 144
1. Which council are you completing this survey on behalf of? [Regional/ Unitary]2. And this is for?
• Northland Regional Council• Waikato Regional Council• Bay of Plenty Regional Council• Hawkes Bay Regional Council• Taranaki Regional Council• Horizons Regional Council• Greater Wellington Regional Council• Environment Canterbury • Otago Regional Council• West Coast Regional Council• Southland Regional Council• Auckland Council• Gisborne District Council• Nelson City Council• Marlborough District Council• Tasman District Council
3. What is your name and contact details?
Comments to IwiPost 2017/2018 regional context data from common national sources (e.g. Statistics New Zealand) instead of requiring councils to submit it. This also helped ensure comparability
4. In no more than 300 words describe your regional key commitments to work with iwi/Maori on CME. For example, joint management agreements or other co-management agreements.
Note: The report author may contact you for further information or clarification of your response.
CME Operations (managing the workload)
Complaints5. Does your council register/count:
• an individual “incident” per notification?• one incident per event, regardless of the number of separate complainants?
6. How many notifications (complaints) were received from members of the public (or other sources, but excluding information from council monitoring activity) relating to environmental incidents or potential breaches of environmental regulation?
APPENDIX 1
METRICS SURVEY QUESTIONS
Analysis of the 2020 / 2021 compliance monitoring and enforcement metrics for the regional sector
PAGE 66
Attachment 21-265.1
Audit & Risk Committee 23 November 2021 137 of 144
This might include information from, for example, emergency services attending an incident or perhaps a council staff member observing something while on other duties, but excludes information from council monitoring activity.
• No. of individual complaints/calls?• No. of individual incidents logged?• Unknown
7. How many of these notifications were responded to by council? This response may be in any form – e.g. phone call, site visit, desktop audit8. How many of these notifications were physically attended by council staff? If one incident had multiple visits, only count this as one. 9. How many of these notifications were confirmed as breaches of the RMA or subsidiary instruments?10. How many of the breaches were for:
• Breach of a resource consent?• Breach of permitted activity rules?
Monitoring Resource Consents & Permitted ActivitiesResource Consents
11. How many individual, active resource consents exist in your region? Exclude Land Use Consents where the activity is completed e.g. Land use subdivisions where the subdivision is
complete and certificates issued or land use – building where the building has been constructed.12. How many consents required monitoring during this period, in accordance with your monitoring prioritisation model/
strategy?13. How many of these consents were monitored (including desktop audit) in the period?
Compliance Gradings14. In the 2020/2021 year, did you use the four compliance grades as recommended by Ministry for Environment? Yes/No15. What grades do you apply to non-compliance? (e.g. technical non-compliance, significant noncompliance)
• Fully Compliant• Technical/Low Non-Compliance• Moderate Non-Compliance• Significant Non-Compliance• Other (please specify)
16. When will your council be adopting the four compliance grades recommended by Ministry for Environment?17. What were the levels of compliance with consents according to the grades you use?
Note 1: Numbers provided under each grade is per monitoring event not per consent. E.g. a consent may be monitored 4 times in the year on one occasion it may be Technically Non-Compliance and on three occasions it may be Fully Compliant, this would add 3 to the total of Fully Compliant and one to the total for Technical Noncompliance.
Note 2: The compliance grade is based on the condition with the worst compliance grade. (e.g. a consent with five conditions Fully Compliant and one condition Moderate Non-Compliance has an overall compliance grade of Minor Non-Compliance
Note 3: Daily telemetry water readings where compliance with water take limits is continuously monitored are to be excluded from compliance grade totals.
• Fully Compliant• Technical/Low Non-Compliance• Moderate Non-Compliance• Significant Non-Compliance• Other (please specify)
Analysis of the 2020 / 2021 compliance monitoring and enforcement metrics for the regional sector
PAGE 67
Attachment 21-265.1
Audit & Risk Committee 23 November 2021 138 of 144

Monitoring Permitted Activities18. Which permitted activities do you have a monitoring programme for?
• Agriculture (excluding dairy)• Aquaculture• Construction• Dairy• Forestry• Horticulture• Industrial Stormwater• Mining• Oil and gas• Tourism• Vineyards• Wineries• Wintering• Other (please specify)
Making Decisions on Priorities19. What basis is used for determining what notifications/complaints/incidents are physically attended and with what
urgency or priority?20. Describe how you determine which consents are monitored and how frequently? If there is a prioritisation model or compliance strategy, add link21. Describe the basis, which was used for determining what, if any, permitted activities were monitored. If there is a prioritisation model or compliance strategy, add link
Staffing Levels 22. How many FTEs does your council have who carry out monitoring roles? Include contractors.23. How many FTEs does your council have who carry out environmental incident or pollution response roles? Include contractors.24. How many FTEs does your council have who carry out investigation or enforcement roles?25. How many FTEs does your council have who carry out a combination of the above roles? Note 1: Include contractors
Note 2: Only answer this question if you have not included these staff in questions 21, 22 or 23
26. How many FTEs does your council have in CME support roles? This includes administrative roles, e.g. staff who assist with issue of notices, reminder notices, upload of unpaid infringements to MoJ.
CME Policies and Procedures27. Does your council have an enforcement policy? Yes/ No28. What is your process for making decisions on prosecutions?29. Who has the delegation to authorise filing of charges for a prosecution at your council?30. Does your council have a conflict of interest policy? Yes/ No
Analysis of the 2020 / 2021 compliance monitoring and enforcement metrics for the regional sector
PAGE 68
Attachment 21-265.1
Audit & Risk Committee 23 November 2021 139 of 144

Acting on Non-Compliance 31. What was the total number of actions taken during the period for:
• Formal warnings issued• Abatement notices issued• Infringement notices issued• Enforcement orders applied for
Note: This relates to the instruments issued in relation to the different sections of the Act (listed once for brevity)
• Section 9 Use of land• Section 12 Coastal marine area• Section 13 Beds of lakes and rivers• Section 14 Water• Section 15 Discharges of contaminants• Section 17 Duty to avoid, remedy & mitigate• Other breach e.g. Section 22
Prosecution32. How many RMA prosecutions were: Note: For this question please consider an entire case (regardless of number of charges and defendants) as one prosecution.
• Concluded in the period• Still in progress in the period
33. What is the total number of individual (person) defendants convicted as a result of RMA prosecutions concluded in this period?
34. For all of these (person) defendants what is the total number of convictions entered against them?For example, there may be a total of 27 separate convictions entered against a total of nine ‘individual’ defendants.
35. What is the total number of corporate (e.g. Crown, company, body corporate etc) defendants convicted as a result of RMA prosecutions concluded in this period?
36. For all of these (corporate) defendants what is the total number of convictions entered against them? For example, there may be a total of 30 separate convictions entered against a total of 12 corporate defendants.
37. Total number of convictions against: [see categories for sections of the Act as above]• an individual• a corporate entity
Total fine potential (Individual total x $300,000, corporate entity total x $600,000)
38. What is the total amount of fines imposed by the courts as a result of RMA prosecutions concluded in this period?
• Individual fines• Corporate fines
38. What other sanctions, if any, have been imposed by the courts as a result of RMA prosecutions concluded in this period?
• Prison sentence• Enforcement order• Reparation• Community Service• Discharge without conviction• Other
Analysis of the 2020 / 2021 compliance monitoring and enforcement metrics for the regional sector
PAGE 69
Attachment 21-265.1
Audit & Risk Committee 23 November 2021 140 of 144
40. How many prosecutions involved restorative justice, diversion or other alternative justice process?• Restorative justice• Diversion• Alternative justice
41. Describe any outcomes relating to these processes.
Educating and Engaging with the Regulated Community 42. Does your council have, or support, any education or engagement projects relating to compliance with the RMA or
any of its derivative regulation? For example, workshops for earthworks contractors around erosion and sediment controls. Yes/No
43. If yes, briefly describe CME Reporting 44. What mechanisms do your council use to report CME data to the public? e.g. annual reports, reports to councillors
• Annual Report• Report to Councillors• Snapshot• Report(s) to Council committee meetings (open to public)• Other (please specify)
Analysis of the 2020 / 2021 compliance monitoring and enforcement metrics for the regional sector
PAGE 70
Attachment 21-265.1
Audit & Risk Committee 23 November 2021 141 of 144

Northland Regional CouncilNRC has a range of initiatives to work in partnership with Māori. A key one is the Te Tai Tokerau Māori & Council Working Party (TTMAC), which is an advisory committee established in 2014. This group meets monthly. Four of council's five other working parties have an equal number of Maori representatives sitting alongside councilors. This includes the Planning & Regulatory Working Party, which has oversight of CME as part of its purpose. council has signed with two hapū the Mana Whakahono a Rohe; Patuharakeke and Ngatirehia with the intention to sign with Te Uri o Hau and Te Hikutu. This will be reviewed in terms of implementation in 2022. There is an agreed process for hapū signatories to meet with the Northland Regional Council to discuss opportunities for hapū to be involved in council compliance and monitoring activities.
SOUTHLAND REGIONAL COUNCILNgāi Tahu ki Murihiku (tangata whenua) have a particular interest in the work of Environment Southland. And mutually, the council has responsibilities towards Māori and Māori cultural and spiritual values. The approach we have in Southland today is unique in the South Island. Its aim is to ensure Māori values are reflected in the council's decision-making, so that Southland's mauri is protected for now and generations to come. Te Aō Marama Incorporated (the environmental arm of Ngāi Tahu ki Miruhiku) was one of the key facilitators when the relationship between the council and iwi began in the early 90s. Te Aō Marama was delegated the responsibility of dealing with councils on environmental matters, on behalf of the four papatipu rūnanga who hold mana whenua over all ancestral lands in Murihiku – Awarua, Hokonui, Ōraka Aparima and Waihōpai. For 25 years the relationship with Environment Southland continues to grow, with various protocols being developed to ensure smooth and efficient processes for plan development and consents management, a jointly funded iwi policy advisor position, an iwi management plan Te Tangi a Tauira, and a partnership to improve Southland's water and land through the People Water and Land programme – Te Mana o te Tangata, te Wai, te Whenua. The most recent milestone in the council's relationship with iwi is the inclusion of mana whenua positions on two of Environment Southland's committees. The successful candidates for these positions will start their work after the elections in October. Environment Southland, refers to the iwi relationship as te kōura tuia – the 'golden thread' that we weave through all our work. It's just part of how we operate. There is a commitment to the responsibility of improving Southland's local government understanding of all things Māori.
WAIKATO REGIONAL COUNCILThe WRC has operative Joint Management Agreements (JMAs) with five ‘River’ Iwi – Waikato-Tainui, Raukawa, Te Arawa, Ngati Maniapoto and Ngati Tuwharetoa – as required by legislation. A key purpose of JMAs is to provide a framework for Iwi and the Council to discuss and agree processes for enabling co-management of planning, regulatory and other functions within the relevant Iwi’s geographic area of interest. For all currently operative JMAs, this includes RMA compliance, monitoring and enforcement (CME) functions of Council. Whilst each of the JMAs was individually negotiated, there are common themes across all in relation to CME. The key commitments relating to CME within the JMAs generally include biannual operational meetings to discuss monitoring priorities, extent and methods; the potential for Iwi involvement in monitoring and enforcement processes; responses to non-compliance; consent review opportunities; the effectiveness of conditions and the effectiveness of compliance policies and procedures generally. The JMAs require various CME-related information to be provided, at different times – for example, summary updates of enforcement actions (prosecutions, enforcement orders, abatement notices and infringement notices) undertaken by the Council under the RMA for the JMA area. Agreed outcomes and actions from biannual operational meetings will, where appropriate, be reported up to the corresponding co-governance committees. The JMAs have facilitated closer personal and working relationship with Iwi which itself has engendered more effective engagement, co-operation and flow of information in both directions.
TARANAKI REGIONAL COUNCILThe Council has 3 iwi appointed representatives on each of its Consents and Regulatory and Policy and Planning Committees. This provides for CME input at this level. In addition the Council engages directly with iwi over prosecutions and obtains victim impact statements for sentencing. The 4 local authorities in the region are currently trying to develop Iwi Relationship Agreements, under the Mana Wakahono a Rohe provisions of the RMA, with 7 iwi in the region, which potentially includes CME provisions.
HAWKES BAY REGIONAL COUNCIL
Hasn’t changed from last year response which covered more the planning and policy interactions with iwi. We are obtaining cultural impact statements from iwi for most prosecutions as part of the sentencing.
APPENDIX 2
LONG FORM RESPONSES (QUESTION 3)
Analysis of the 2020 / 2021 compliance monitoring and enforcement metrics for the regional sector
PAGE 71
Attachment 21-265.1
Audit & Risk Committee 23 November 2021 142 of 144

ENVIRONMENT CANTERBURY
To give effect to the obligations under the Local Government Act 2002 and the related obligations under the Resource Management Act 1991, we have committed with Ngāi Tahu to improve relationships and interaction and integrate improved working practices across Environment Canterbury. The way we do this falls under the umbrella of our joint work programme Tuia, which includes a commitment to including rūnanga input to our 5-year CME plan. The 5-year plan has identified key areas where Rūnanga and Environment Canterbury can work together to improve Incident Response, compliance and enforcement. For example, we have begun alerting Rūnanga to compliance issues/incidents in their areas through incident response, have identified opportunities with providing and receiving mutual education and training around compliance monitoring, and are identifying Rūnanga priorities to help with decision making. Environment Canterbury are also funding rūnanga to provide advice to help inform our decisions relating to enforcement action.
WEST COAST REGIONAL COUNCIL
The West Coast Regional Council and Poutini Ngai Tahu have signed a Mana Whakahono a Rohe - Iwi Participation Arrangement. The arrangement formally acknowledges the partnership and relationship between Council and Ngai Tahu. The document can be found on Councils web site under Strategies - publications. Te Runanga Ngati Waewae and Te Runanga Makaawhio have representation on Council and in decision making on relevant Council committees such as the Resource management Committee.
AUCKLAND COUNCIL
Our Compliance Monitoring Unit has been part of the Council’s review of the Cultural Values Assessment processes. This is a co-design process with mana whenua that has been on-going for the last few years. We are currently working through a ‘winter works’ shadowing programme with mana whenua and are working across Council departments to improve the application of Accidental Discovery Protocols which apply where cultural sensitive material is unearthed during construction.
GISBORNE DISTRICT COUNCIL
Joint management agreement over Waiapu catchment. Discussions on certain notified resource consent applications. Department of Internal affairs pilot ‘strengthening treaty partnerships’ currently underway.
MARLBOROUGH DISTRICT COUNCIL
MDC engage with Iwi and hapū in relation to CME with cultural impact and prioritises as required. MDC operates a Iwi working group in the development of plans. MDC currently have a draft Iwi Engagement Plan
BAY OF PLENTY REGIONAL COUNCIL
We do not currently have any formal CME focused arrangements with tangatawhenua; however, we are currently in the process of developing agreements in this regard in relation to a number of specific matters. Further to this, the role and importance of Māori as kaitiaki is considered in the day-to-day implementation of our compliance programme. In practical terms, this may include ensuring tangatawhenua are notified of incidents in their rohe(‘no surprises’ approach) and involved in project where appropriate (e.g., marae wastewater). CME information is also formally reported to co-governance groups (eg. Rangitaiki River Authority and TeMaru o Kaituna)
HORIZONS REGIONAL COUNCIL
No formal agreements under CME but is in early-stage development. Currently only engagement is through consent imposed conditions and cultural impacts assessments.
GREATER WELLINGTON
The Council has no formal CME agreements with Iwi. The proposed Natural Resource Plan for the Wellington Region lays out the collaborative work and strategy for involving iwi. Part of that collaborative work is the ongoing establishment of Whaitua’s to engage iwi and communities in a catchment focused approach to management of the environment. This intrinsically includes a CME element.
OTAGO REGIONAL COUNCIL
No formal agreements at this stage with iwi around CME, however, in the event of a major incident or comprehensive investigation iwi are advised. We have used iwi for cultural impact assessment reports on prosecution cases. We also notify Aukaha of any incidents involving waterways. ORC is working with Aukaha and Te Aō Marama Incorporated to improve engagement and involvement in CME activities.
NELSON CITY COUNCIL
No formal agreements are in place, Iwi are involved in revising Plan provisions and Council facilitates having an iwi monitor on site alongside Council’s monitoring officer when this is requested. All iwi are sent a summary of all resource consent applications on a weekly basis. Council is also financially supporting iwi to build capacity in state of the environment monitoring and to establish cultural health monitoring practices.
TASMAN DISTRICT COUNCIL
No formal agreements under CME responsibility at this stage but being developed. At a very early scoping stage.
Analysis of the 2020 / 2021 compliance monitoring and enforcement metrics for the regional sector
PAGE 72
Attachment 21-265.1
Audit & Risk Committee 23 November 2021 143 of 144
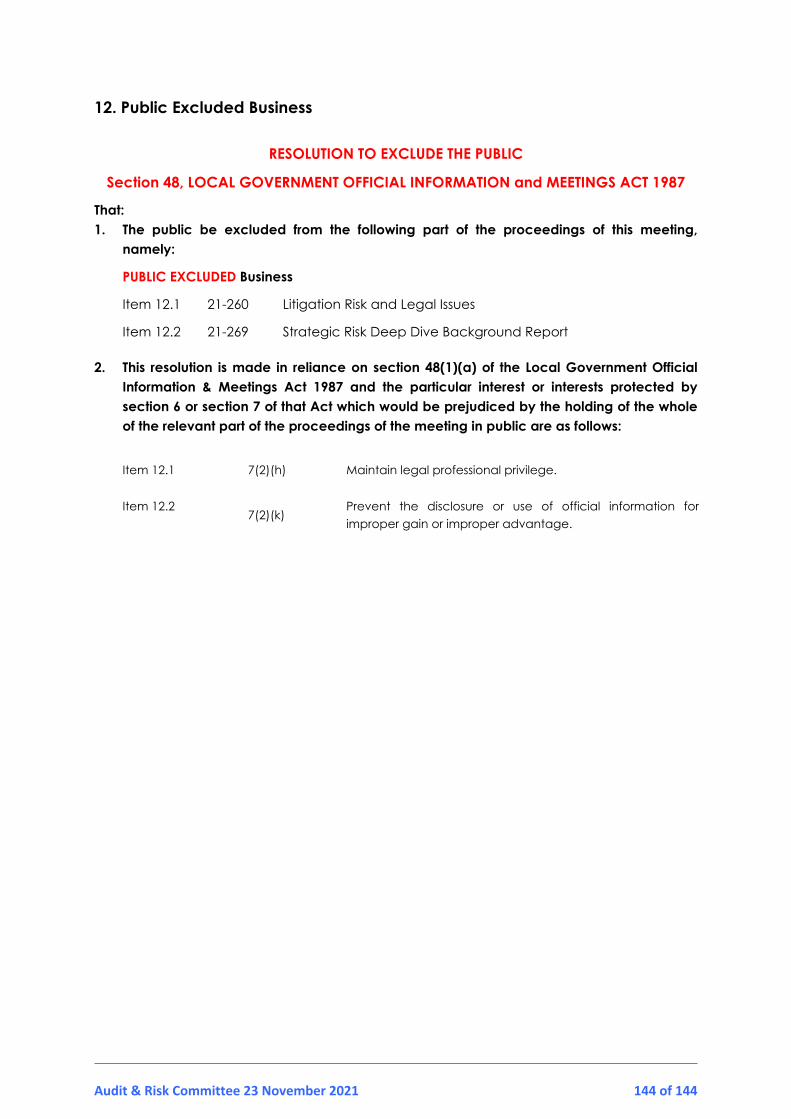
Audit & Risk Committee 23 November 2021 144 of 144
12. Public Excluded Business
RESOLUTION TO EXCLUDE THE PUBLIC
Section 48, LOCAL GOVERNMENT OFFICIAL INFORMATION and MEETINGS ACT 1987
That:1. The public be excluded from the following part of the proceedings of this meeting,
namely:
PUBLIC EXCLUDED Business
Item 12.1 21-260 Litigation Risk and Legal Issues
Item 12.2 21-269 Strategic Risk Deep Dive Background Report
2. This resolution is made in reliance on section 48(1)(a) of the Local Government Official Information & Meetings Act 1987 and the particular interest or interests protected by section 6 or section 7 of that Act which would be prejudiced by the holding of the whole of the relevant part of the proceedings of the meeting in public are as follows:
Item 12.1 7(2)(h) Maintain legal professional privilege.
Item 12.27(2)(k)
Prevent the disclosure or use of official information for improper gain or improper advantage.