an examination of cultural and linguistic - Auburn University
Upload
khangminh22Category
view
0download
0
AUBURN HILLS MEETING SCHEDULE 248-370-9402 | WWW.AUBURNHILLS.ORG
OCTOBER, 2021
DAY
TITLE TIME LOCATION
4 City Council Meeting 7:00 PM Council Chamber 1827 N. Squirrel Road
6 Planning Commission 7:00 PM Council Chamber 1827 N. Squirrel Road
11 Downtown Development Authority 5:30 PM Council Chamber
1827 N. Squirrel Road
11 Library Board 7:00 PM Auburn Hills Public Library 3400 Seyburn Drive
12 Tax Increment Finance Authority 4:00 PM Administrative Conference Room
1827 N. Squirrel Road
12 Brownfield Redevelopment Authority 6:00 PM Administrative Conference Room
1827 N. Squirrel Road
14 Zoning Board of Appeals 4:00 PM Council Chamber 1827 N. Squirrel Road
18 City Council Meeting 7:00 PM Council Chamber 1827 N. Squirrel Road
19 Tax Increment Finance Authority - INFORMATIONAL 4:00 PM VIRTUAL MEETING
19 Tax Increment Finance Authority
Immediately following VIRTUAL MEETING
30 City Clerk’s Office open to accept/issue absentee ballots.
7:00 AM – 3:00 PM
City Clerk’s Office 1827 N. Squirrel Road
NOTE: Anyone planning to attend the meeting who has need of special assistance under the American’s with Disabilities Act (ADA) is asked to contact the City Clerk’s Office at 248.370.9402 48 hours prior to the meeting. Staff will be please to make the necessary arrangements. PLEASE BE ADVISED, DUE TO A LACK OF AGENDA ITEMS, SOME MEETINGS MAY BE CANCELED.

AUBURN HILLS MEETING SCHEDULE 248-370-9402 | WWW.AUBURNHILLS.ORG
NOVEMBER, 2021
DAY
TITLE TIME LOCATION
1 City Council Meeting 7:00 PM Council Chamber 1827 N. Squirrel Road
2 Election Day 7:00 AM 8:00 PM
All Precinct Locations
3 Planning Commission 7:00 PM Council Chamber 1827 N. Squirrel Road
8 Downtown Development Authority 5:30 PM Administrative Conference Room
1827 N. Squirrel Road
8 Library Board 7:00 PM Auburn Hills Public Library 3400 Seyburn Drive
9 Tax Increment Finance Authority 4:00 PM Administrative Conference Room
1827 N. Squirrel Road
11 Zoning Board of Appeals 4:00 PM Council Chamber 1827 N. Squirrel Road
15 City Council Meeting 7:00 PM Council Chamber 1827 N. Squirrel Road
16 Brownfield Redevelopment Authority 6:00 PM Administrative Conference Room
1827 N. Squirrel Road
NOTE: Anyone planning to attend the meeting who has need of special assistance under the American’s with Disabilities Act (ADA) is asked to contact the City Clerk’s Office at 248.370.9402 48 hours prior to the meeting. Staff will be please to make the necessary arrangements. PLEASE BE ADVISED, DUE TO A LACK OF AGENDA ITEMS, SOME MEETINGS MAY BE CANCELED.

City Council meeting minutes are on file in the City Clerk’s Office. NOTE: Anyone planning to attend the meeting who has need of special assistance under the Americans with Disabilities Act (ADA) is asked to contact the City Clerk's Office at 248.370.9402 or the City Manager's Office at 248.370.9440 48 hours prior to the meeting. Staff will be pleased to make the necessary arrangements.
1. MEETING CALLED TO ORDER
2. PLEDGE OF ALLEGIANCE
3. ROLL CALL OF COUNCIL
4. APPROVAL OF MINUTES
4a. City Council Workshop Minutes, September 27, 2021 4b. City Council Regular Meeting Minutes, September 27, 2021
5. APPOINTMENTS AND PRESENTATIONS
6. PUBLIC COMMENT
7. CONSENT AGENDA All items listed are considered to be routine by the City Council and will be enacted by one motion. There will be no separate discussion of these items unless a Council Member so requests, in which event the item will be removed from the Consent Agenda and considered in its normal sequence on the agenda.
7a. Board and Commission Minutes
7a1. Brownfield Redevelopment Authority, August 17, 2021
7a2. Tax Increment Finance Authority Special Meeting, September 21, 2021
7a3. Election Commission, September 27, 2021
7b. Motion – To approve the 2022 City Council Meeting Schedule.
8. OLD BUSINESS 9. NEW BUSINESS
9a. Public Hearing / Motion – Revocation of Planned Unit Development Approval for Primary Place.
9b. Public Hearing/Motion – To adopt the 2022 Budget and Millage Rates. 9c. Motion – Move to Approve Asphalt Pathway Construction at Fieldstone Golf Club
10. COMMENTS AND MOTIONS FROM COUNCIL
11. CITY ATTORNEY REPORT
12. CITY MANAGER REPORT
13. ADJOURNMENT
CITY OF AUBURN HILLS
MONDAY, OCTOBER 4, 2021 Regular City Council Meeting ♦ 7:00 PM
Council Chamber ♦ 1827 N. Squirrel Road ♦ Auburn Hills MI
248‐370‐9402 ♦ www.auburnhills.org

MEETING DATE: OCTOBER 4, 2021 AGENDA ITEM NO. 4A
CITY COUNCIL
CITY OF AUBURN HILLS City Council Workshop
Draft Minutes
September 27, 2021
CALL TO ORDER: Mayor McDaniel at 5:39 PM
LOCATION: Council Conference Room, City Hall, 1827 N. Squirrel Rd, Auburn Hills, MI 48326
Present: Mayor McDaniel, Council Members Burmeister, Hawkins, Kittle, Knight, Marzolf
Absent: Council Member Verbeke
Also Present: City Manager Tanghe, Assistant City Manager Grice, City Attorney Beckerleg, City Clerk Pierce, Assistant to the City Manager Skopek, Police Chief Baker, Fire Chief Taylor, Asst. Fire Chief Robinson, DPW Director Melchert, Mgr of Public Utilities Deman, Mgr of Municipal Properties Baldante, Community Development Director Cohen, Planner Keenan, Finance Director/Treasurer Schulz, Senior Services Director Adcock, Recreation Director Hegdal, Economic Development Mgr Carroll, Assessor Griffin, Fieldstone Golf Club Manager Hierlihy, Engineer Juidici
The topic of the workshop was “Presentation of Proposed 2022 Budget (2 of 2)”.
Ms. Schulz presented the 2022‐2026 Projected Budget. She reviewed the slides and noted the additional information shown as requested by Council. She noted that the debt service analysis for roads is projected through 2033.
Discussion was held regarding adding additional funds into capital improvements for the operations at Fieldstone Golf Club. It was noted that the drainage issue needs to be fixed as revenue is being lost when the range is closed. Council expressed support of amending the budget at the time an improvement is made as opposed to changing the entire budget at this time.
In regards to the Retiree Health Care Trust, Ms. Schulz explained that the required contribution will be transferred, then going forward, the trust will be used to pay related costs.
Ms. Schulz presented the TIFA, Brownfield, and DDA budgets. She reviewed the overall budget slides for revenues and expenditures.

City Council Workshop Minutes – September 27, 2021 Page 2
The meeting adjourned at 6:15 PM.
Kevin R. McDaniel, Mayor Laura M. Pierce, City Clerk

City Council Workshop Minutes – September 27, 2021 Page 3

City Council Workshop Minutes – September 27, 2021 Page 4

City Council Workshop Minutes – September 27, 2021 Page 5

City Council Workshop Minutes – September 27, 2021 Page 6

City Council Workshop Minutes – September 27, 2021 Page 7

City Council Workshop Minutes – September 27, 2021 Page 8

City Council Workshop Minutes – September 27, 2021 Page 9

City Council Workshop Minutes – September 27, 2021 Page 10

City Council Workshop Minutes – September 27, 2021 Page 11

City Council Workshop Minutes – September 27, 2021 Page 12

City Council Workshop Minutes – September 27, 2021 Page 13

City Council Workshop Minutes – September 27, 2021 Page 14

City Council Workshop Minutes – September 27, 2021 Page 15

MEETING DATE: OCTOBER 4, 2021 AGENDA ITEM NO. 4B
CITY COUNCIL
CITY OF AUBURN HILLS REGULAR CITY COUNCIL MEETING
DRAFT
SEPTEMBER 27, 2021
CALL TO ORDER: Mayor McDaniel at 7:00 p.m.
LOCATION: Council Chamber, 1827 N. Squirrel Road, Auburn Hills MI
Present: Mayor McDaniel, Council Members Burmeister, Hawkins, Kittle, Marzolf, and
Knight
Absent: Council Member Verbeke
Also Present: City Manager Tanghe, Assistant City Manager Grice, City Attorney
Beckerleg, City Clerk Pierce, Assistant to the City Manager Skopek, Police Chief Baker,
Fire Chief Taylor, Asst. Fire Chief Robinson, DPW Director Melchert, Mgr of Roads &
Fleet Hefner, Community Development Director Cohen, Economic Development
Manager Carroll, Finance Director/Treasurer Schulz, Engineer Juidici
20 Guests
Workshop Topic: Presentation of Proposed 2022 Budget (2 of 2)
4. APPROVAL OF MINUTES
4a. City Council Workshop Minutes, September 13, 2021
Moved by Burmeister, Seconded by Hawkins.
RESOLVED: To approve the City Council Workshop Minutes of September 13, 2021.
VOTE: Yes: Burmeister, Hawkins, Kittle, Knight, Marzolf, McDaniel
No: None
Resolution No. 21.09.123 Motion Carried (6 ‐ 0)
4b. City Council Regular Meeting Minutes, September 13, 2021
Moved by Knight, Seconded by Marzolf.
RESOLVED: To approve the City Council Regular Meeting Minutes of September 13, 2021.

City Council Meeting – September 27, 2021 Page 2
VOTE: Yes: Burmeister, Hawkins, Kittle, Knight, Marzolf, McDaniel
No: None
Resolution No. 21.09.124 Motion Carried (6 ‐ 0)
5. APPOINTMENTS AND PRESENTATIONS
5a. Recognition of the Fire Department Promotions
This item was postponed to a future meeting.
5b. Motion – To confirm the appointment to the Downtown Development Authority.
Ms. Carroll shared that a vacancy opened up due to Mr. Volk moving out of the City. Mr. Cionka is pleased to help with the downtown area as a resident.
Moved by Hawkins, Seconded by Knight.
RESOLVED: To confirm the appointment of Eric Cionka to the Downtown Development Authority for a term ending October 31, 2024.
VOTE: Yes: Burmeister, Hawkins, Kittle, Knight, Marzolf, McDaniel
No: None
Resolution No. 21.09.125 Motion Carried (6 ‐ 0)
6. PUBLIC COMMENT
Mr. Brian Peers of 3001 Brentwood Road presented his concerns with the chronic flooding on the south side of the condominium complex. The flooding has been taking place for over 2 years. The developer has been contacted. There is concern that the flooding will damage the patio areas and the property values. Mayor McDaniel shared that staff will look into this issue.
7. CONSENT AGENDA
Mr. Marzolf requested that Item 7c (towing agreement) be removed from the Consent Agenda.
7a. Board and Commission Minutes
7a1. Tax Increment Finance Authority, August 10, 2021
7a2. Tax Increment Finance Authority, September 14, 2021
7a3. Planning Commission, September 15, 2021
RESOLVED: To receive and file the Board and Commission Minutes.
7b. Motion – To adopt the 2022 City of Auburn Hills Fee Schedule as submitted.
RESOLVED: To adopt the 2022 City of Auburn Hills Fee Schedule as submitted.
7d. Motion – To approve the purchase of Motorola radio equipment. (Police Dept)
RESOLVED: To approve the purchase of 9 Motorola APX6000 portable radios, 3 Motorola APX6500‐03 mobile radios, and 1 Motorola APX6500 desktop control station from ComSource Inc. under the Oakland County Bid for an amount not to exceed $81,895.70.
7e. Motion – To approve the purchase of Motorola radio equipment. (Fire Dept)
RESOLVED: To approve the purchase of five (5) Motorola APX6000EX portable radios, five (5) Motorola APX6500 mobile radios, five (5) six (6) bank battery chargers NNTN8844, three (3) Impress Speaker Mics HMN4104, and two (2) Motorola Speaker Mics X500 from ComSource Inc. utilizing the Oakland County MIDEAL pricing model for $67,841.45. In addition, a cost of a one‐time user fee of

City Council Meeting – September 27, 2021 Page 3
$2,500 to the State of Michigan not to exceed $70,341.45 allocated in the Fire Department’s GL line item 101‐339‐978.000.
7f. Motion – To approve the Tri‐Party Program Cost Participation Agreement for Baldwin Rd and Brown Rd.
RESOLVED: To approve the Cost Participation Agreement, Board Project No. 56431, with the Board of County Road Commissioners of the County of Oakland, Michigan, and authorize up to $525,000 of Tri‐Party funding toward the Baldwin Road from I‐75 to Brown Road and Brown Road east of Giddings Road concrete slab replacement project, with a City of Auburn Hills contribution not to exceed $175,000.
7g. Motion – To approve the 2021‐2022 Winter Operations Agreement with the Road Commission for Oakland County.
RESOLVED: To approve the 2021‐2022 Winter Operations Agreement between the City of Auburn Hills and the Road Commission for Oakland County. Services to be reimbursed from the Road Commission for Oakland County to the City of Auburn Hills in the amount of $45,503.06.
7h. Motion – To approve the Butler Road Repair Change Order and Surface Treatment Bid.
RESOLVED: To approve a change order of $40,200.00 to Superior Excavating within Division E – Butler Road, 2020 SAD Road Program (West Entrance Drive) contract, approve the Butler Road double chip and slurry seal surface treatment bid award of $63,920.28 to Highway Maintenance & Construction Company. Further, approve a budget amendment adding an additional $73,000.00 to the 2021 Local Roads Fund Budget.
7i. Motion – To amend the General Administration Department of the General Fund and to amend the Retiree Health Care Internal Service Fund.
RESOLVED: To increase the appropriations of the current 2021 Amended budget for the Retiree Health Benefits Internal Services Fund appropriations to $1,818,828.
7j. Motion – To purchase a Ram Promaster 3500 Cargo Van High Roof EXT for the DPW.
RESOLVED: To approve the purchase of a Ram Promaster 3500 Cargo Van High Roof EXT for $43,694.00 The purchase will be made with Lafontaine Chrysler Dodge Jeep Ram FIAT in Lansing, MI under the MiDEAL contract #071B7700183. Funding for the purchase will be made available via account number 661‐594‐981.000 in the 2022 fiscal year.
7k. Motion – To approve the 2021 Storm Structure Rehabilitation Program.
RESOLVED: To award the 2021 Storm Structure Rehabilitation Program to Havener Tech LLC, 433 E. Elmwood Ave., Troy, MI 48083. Funding is provided for in the Roads Operating Budget which will include $4,918.14 in 203‐453‐935.000STORMREHAB and $25,131.66 in 202‐452‐935.000STORMREHAB for a total of $30,049.80.
Moved by Hawkins, Seconded by Burmeister.
RESOLVED: To approve the Consent Agenda.
VOTE: Yes: Burmeister, Hawkins, Kittle, Knight, Marzolf, McDaniel
No: None
Resolution No. 21.09.126 Motion Carried (6 ‐ 0)
7c. Motion – To approve the towing agreement.
Mr. Marzolf asked if the tows are evenly distributed between the three towing companies that are used. Chief Baker clarified that they keep a list of general tows and heavy tows.
Moved by Marzolf, Seconded by Knight.

City Council Meeting – September 27, 2021 Page 4
RESOLVED: To approve the amended towing agreement and direct the Chief of Police to require the tow companies sign the agreement and adhere to the terms of the agreement to provide towing services for police related calls for service.
VOTE: Yes: Burmeister, Hawkins, Kittle, Knight, Marzolf, McDaniel
No: None
Resolution No. 21.09.127 Motion Carried (6 ‐ 0)
8. OLD BUSINESS 9. NEW BUSINESS 9a. Motion – To approve the Special Land Use Permit and Site Plan for University Plaza.
Mr. Cohen presented the request for the expansion of the currently vacant property at 3325 University Drive. The presented plan is to create a four‐unit retail space.
Ms. Haley Jonna of Jonna Properties was present. The unit will approximately be a 8,550 square foot retail center containing four units. At this time a monument sign is not being proposed. Jonna Properties is aware of needing Planning Commission approval should they change their mind on wanting a monument sign.
Moved by Hawkins, Seconded by Kittle.
RESOLVED: To accept the Planning Commission’s recommendation and approve the Special Land Use Permit and Site Plan for University Plaza to construct a retail center with an outdoor seating area subject to the conditions of the City’s Administrative Review Team.
VOTE: Yes: Burmeister, Hawkins, Kittle, Knight, Marzolf, McDaniel
No: None
Resolution No. 21.09.128 Motion Carried (6 ‐ 0)
9b. Motion – To approve the Special Land Use Permit, Site Plan, and Tree Removal Permit for TÜV SÜD America Inc., along with a new Private Road named “New Energy Way”.
Mr. Cohen presented the request from Cunningham‐Limp to construct a 79,084 square foot light industrial building at the southeast corner of Dutton Road and Bald Mountain Road.
Mr. Samuel Ashley of Cunningham‐Limp was present. He shared that TÜV SÜD is currently located in Auburn Hills but will now own and occupy this location as opposed to leasing. This facility will be the largest testing facility for TÜV SÜD globally.
Mr. Jonathan Drew of TÜV SÜD America Inc. was present. He explained that this company provides services as an independent company to a wide range of industries; medical, industrial, commercial, and transportation regarding safety standards.
Moved by Kittle, Seconded by Knight.
RESOLVED: To accept the Planning Commission’s recommendation and approve the Special Land Use Permit, Site Plan, and Tree Removal Permit for TÜV SÜD America Inc., along with a new Private Road named New Energy Way, subject to the conditions of the City’s Administrative Review Team.
VOTE: Yes: Burmeister, Hawkins, Kittle, Knight, Marzolf, McDaniel
No: None

City Council Meeting – September 27, 2021 Page 5
Resolution No. 21.09.129 Motion Carried (6 ‐ 0)
9c. Motion ‐ To appoint the independent financial and compliance auditors for the City of Auburn Hills.
Ms. Schultz presented the company of Yeo & Yeo as the independent financial and compliant auditors for the City of Auburn Hills.
Mr. Mike Rolka and Mr. Alan Panter of Yeo & Yeo were present in the meeting.
Moved by Hawkins, Seconded by Burmeister.
RESOLVED: To appoint Yeo and Yeo, PC as both the City’s and Library’s independent auditor for fiscal years 2021‐2023, with years 2024 and 2025 as optional renewal years requiring a separate action by City Council in 2023. Further, move to authorize the City Manager to execute the appropriate engagement of services at the fees proposed for the City of Auburn Hills audit.
VOTE: Yes: Burmeister, Hawkins, Kittle, Knight, Marzolf, McDaniel
No: None
Resolution No. 21.09.130 Motion Carried (6 ‐ 0)
10. COMMENTS AND MOTIONS FROM COUNCIL
Mr. Marzolf – He enjoyed the extended concert series this year at the Knight Amphitheater and heard great comments from the residents. Mr. Knight – He shared the park is coming along nicely but the park needs more topsoil and some holes filled up to keep it looking nice and to build up the bank of the river. Mr. Burmeister – He enjoyed SeptemBEERfest and thanked all that were involved. Mayor McDaniel – He thanked the Staff for the budget workshop and their time that went into working on it.
11. CITY ATTORNEY REPORT
12. CITY MANAGER REPORT
13. ADJOURNMENT
Hearing no objections, the Mayor adjourned the meeting at 7:43 PM.
Kevin R. McDaniel, Mayor Laura M. Pierce, City Clerk

MEETING DATE: OCTOBER 4, 2021 AGENDA ITEM NO. 7A1
BROWNFIELD REDEVELOPMENT AUTHORITY
“Not Yet Approved”
CITY OF AUBURN HILLS BROWNFIELD REDEVELOPMENT AUTHORITY MEETING
August 17, 2021
CALL TO ORDER: Chairman Slocum called the meeting to order at 6:10 p.m.
ROLL CALL: Present: Knight, Slocum, Douglas, and Schaar Absent: None Also Present: Stephanie Carroll, Economic Development Manager, Board Member Capen (on
speakerphone) Guests: Brian Westhoff and Samantha Seimer, AKT Peerless
LOCATION: Auburn Hills Public Safety Building, 1899 N. Squirrel Road, Auburn Hills, MI 48326 PERSONS WISHING TO BE HEARD None. APPROVAL OF MINUTES Item 3a. Brownfield Redevelopment Authority Regular Meeting Minutes – May 18, 2021. Moved by Mr. Knight to approve the March 16, 2021, minutes as presented. Seconded by Mr. Schaar. Yes: Knight, Slocum, Douglas, Schaar No: None Motion Carried 4. CORRESPONDENCE AND PRESENTATIONS None FINANCIAL REPORT Item 5a. FY 2021 Adopted Budget and YTD Summary – July 31, 2021 Ms. Carroll presented the financial report for the period ending July 31, 2021. Approximately 58% of property tax revenue has been received to date. Approximately 83% of budgeted expenditures has been utilized in FY 2021. Total net position is $3.3 million. Moved by Mr. Knight to receive and file the Brownfield Redevelopment Authority financial report for period ending July 31, 2021. Seconded by Mr. Douglas.

Page 2
Yes: Knight, Slocum, Douglas, Schaar No: None Motion Carried UNFINISHED BUSINESS None. NEW BUSINESS Item 7a. 3180 Auburn Road Update Mr. Westhoff reviewed the site work to date and recent delineation process for the site. He then reviewed photos and a map of the site, outlining the areas of concern with the Board. Mr. Westhoff noted that there is low level contamination over a large portion of the property and that the plume is smaller than anticipated. It was noted that the Boys and Girls Club owns a portion of the edge river area on both sides. Mr. Knight asked if the city should pursue this and offer to purchase the property. Mr. Westhoff indicated they will need access once they start excavating, they will permission from the Boys and Girls Club. Ms. Carroll will follow up with the City Manager. Mr. Douglas inquired about the requirements on the site related to reporting the movement of product on the site. Mr. Westhoff indicated that under Part 213, when you submit the final assessment report, you must show it is delineated. Mr. Douglas asked if the product movement could be a result of excessive rain. Mr. Westhoff indicated that recent rain events have impacted our ground water elevations and they have risen at least a foot across the entire site. Meaning the areas of impact/contamination at nine (9) feet is now at eight (8) feet. Mr. Westhoff then reviewed the details of the borings on the map. He clarified that there were varying levels of contamination throughout, but it does not necessarily mean that it’s above the clean up criteria. The map further demonstrates that the product came from the tank on the northern side of the site. Mr. Westhoff reminded the Board that it’s important to show the delineation points on the site. Mr. Westhoff reviewed the map and areas of product and groundwater contamination with the Board. He also reminded the Board that he will continue to submit reimbursement requests to MUSTA for work being done on the site. Mr. Westhoff also noted that September 30th is the deadline for filing a report with the state on the data and information that was collected on the site. Mr. Slocum asked what the next steps were for the site. Mr. Westhoff explained that he will create a report and outline a corrective action plan with the understanding that MUSTA will reimburse us for a majority of the cleanup costs and ask Ms. Carroll to send it to the board for their review. There is no formal action by the board needed at this time. Item 7b. 2041 Auburn Road Update Mr. Westhoff reviewed the soil borings, PCB assessment and delineation map of activities on the site. Most of the site does have PCB contamination and some metals are also present on the site. It was determined that foundry sand is extensive throughout the site. It appears that the site was originally a wetland and that someone filled it in with foundry sand that contained PCB’s. The site is also a floodplain and brings another set of challenges to the site. Under Part 201, there will be due care obligations because the is impact above direct contact standards. Mr. Knight suggested that the northern portion could perhaps be a solar panel farm with an associated charging station. Mr. Westhoff stated that some of the soils would still have to be removed and disposed of at a special landfill. Mr. Knight suggested perhaps just capping the northern portion. He asked if we could put a clay liner on top to meet requirements. Mr. Westhoff indicated that this is a possibility. He also indicated that we would not have to fence off the area if this was the agreed upon solution.

Page 3
Mr. Westhoff reviewed the map and various indications of exceedances on this site. The northern portion would be the largest and most expensive portion of the site. The Central piece is a wetland and does not support redevelopment. His recommendation is that the Board continues to focus on the southern portion that will eventually become Kayak Point. Chairman Slocum agreed and outlined his concerns related to the northern and central pieces and the need to do something in the future. Item 7c. 2022‐2036 Budget Adoption Ms. Carroll presented the five‐year projected budget to the Board and outlined anticipated expenses in 2022. She noted that for 2022, $360,000 has been budgeted for the 3180 Auburn Road project, and $130,000 has been budgeted for the 2041 Auburn Road project. She reminded the Board that MUSTA reimbursement will assist in offsetting the clean‐up costs for 3180 Auburn Road. Ms. Carroll reviewed the EGLE Loan for 3250 Auburn Road and the repayment schedule. She also pointed out that there is an outstanding loan in the amount of $260,000 for the Primary Place project. Mr. Knight appreciated the thorough presentation of the budget. He also noted that the BRA funds are separate from the City’s budget. Moved by Mr. Douglas to approve the Brownfield Redevelopment Authority’s 2021 Amended Budget and 2022 Proposed budget as presented. Furthermore, recommend to the City Council inclusion of these budgets for adoption in the City’s overall budget documents. Seconded by Mr. Knight. Yes: Knight, Slocum, Douglas, Schaar No: None Motion Carried DIRECTOR UPDATES Ms. Carroll updated the Board on next steps for Primary Place. It looks as though there will need to be another public hearing before City Council to discuss the status of his PUD. There has not been any work done on the site in the last few months. BOARD MEMBER COMMENTS None ADJOURNMENT There being no objections, the Brownfield Redevelopment Authority Board of Directors meeting adjourned at 8:01 p.m.
Respectfully submitted: Stephanie Carroll Executive Director

MEETING DATE: OCTOBER 4, 2021 AGENDA ITEM NO. 7A2
TAX INCREMENT FINANCE AUTHORITY
“Not Yet Approved”
CITY OF AUBURN HILLS
TAX INCREMENT FINANCE AUTHORITY SPECIAL MEETING
September 21, 2021
CALL TO ORDER: Chairman Kneffel called the meeting to order at 4:07 PM.
ROLL CALL: Present: Kneffel, Klemanski, Dolly, Hawkins, Price, Moniz (Arrived at 4:12 PM)
Absent: Goodhall, Thornton, Waltenspiel
Also Present: Brandon Skopek, Assistant to the City Manager, TIFA Executive Director
Guests: None
LOCATION: Virtual Meeting
PERSONS WISHING TO BE HEARD
None.
APPROVAL OF MINUTES
A. TIFA Regular Meeting Minutes – August 10, 2021
Moved by Dr. Klemanski to approve the TIFA Regular Meeting minutes from August 10, 2021 as presented.
Seconded by Dr. Dolly
Yes: Kneffel, Klemanski, Dolly, Hawkins, Price
No: none
Motion carried by roll call vote
B. TIFA Regular Meeting Minutes – September 14, 2021
Moved by Ms. Price to approve the TIFA Regular Meeting minutes from September 14, 2021 as presented.

Page 2 Seconded by Dr. Dolly
Yes: Kneffel, Klemanski, Dolly, Hawkins, Price
No: none
Motion carried by roll call vote
CORRESPONENCE AND PRESENTATIONS
None.
FINANCIAL REPORT
A. FY 2021 Adopted Budget and YTD Summary – August 31, 2021
Mr. Skopek presented the financial report for the period ending August 31, 2021.
Mr. Moniz arrived at 4:12 PM.
Mr. Hawkins inquired about the University Center rental revenue.
Mr. Skopek stated that the University Center is occasionally available for outside rentals when the building is not occupied by one of the partner schools that utilize the building for classroom space. He noted that the University Center has been underutilized by the partner schools and outside renters this year and over the last couple of years. Therefore, there is little rental revenue expected in 2021. Staff has had internal discussions on the redevelopment potential for this building and will plan to have a conversation with the Board in the near future.
Mr. Hawkins inquired about the parking structure lease agreement and whether revenues covered maintenance expenses.
Mr. Skopek provided the terms of the parking lease agreement. He noted that each unit in the connected apartment complex is leased one parking space and the TIFA invoices the property management company twice per year. He added that the lease rate increases on the fourth anniversary of the lease and the increase is based on CPI calculations. He concluded by stating although the lease revenue covers some maintenance expenses, expenses typically exceed revenues.
Vice Chairman Klemanski noted that the percentage of revenues received to date seemed low for this time of the year, as well as expenses, and asked if staff was expecting these numbers to increase.
Mr. Skopek stated that both revenues and expenses are expected to increase before the end of the year. Most of the revenues will be collected by the end of the year through PPT reimbursement and many summer projects are still underway, so those project expenses have not yet hit the budget.
Moved by Mr. Hawkins to receive and file the financial report for period ending August 31, 2021.
Seconded by Dr. Dollt

Page 3 Yes: Kneffel, Klemanski, Dolly, Hawkins, Price, Moniz
No: none
Motion carried by roll call vote
UNFINISHED BUSINESS
None.
NEW BUSINESS
A. Approval of 2021 Amended Budget and 2022 Proposed Budget
Mr. Skopek presented the updated budgets to the Board. The most notable change in the TIF District A budget for FY2022 is an increase in expenses in the amount of $225,000. He explained that staff has discussed constructing an addition to the existing parking structure and that these funds, in addition to the $25,000 budgeted for a downtown parking study, are proposed to be utilized for the engineering/architectural design work for the proposed addition.
The Board discussed the potential configurations for the parking structure addition.
Mr. Skopek noted that before any decision is made on design, staff will need to have a conversation with DTE Energy regarding the existing underground utilities located west of the parking structure.
Mr. Skopek noted a substantial change to the FY2026 budget in TIF District D since the budget presentation. He reminded the Board of the conversations taking place about pathway connections along High Meadow and Cross Creek and possibility of combining these projects with road projects. These two roads are proposed to be reconstructed in FY2026 and it would be beneficial to complete the pathway work at the same time to achieve economies of scale. The total cost for the pathway connections along these two roads is $775,000.
Mr. Skopek noted for the Board that there may be a need for a final year end amendment depending on where final costs come in for projects currently underway.
Moved by Mr. Moniz to approve the 2021 Amended Budget and 2022 Proposed Budget as presented. Furthermore, recommend to the City Council the inclusion of these budgets for adoption in the City’s overall budget documents.
Seconded by Ms. Price
Yes: Kneffel, Klemanski, Dolly, Hawkins, Price, Moniz
No: none
Motion carried by roll call vote
EXECUTIVE DIRECTOR UPDATE
Mr. Skopek updated the Board that Larco Bros. Pizzeria has been unable to utilize the TIFA’s liquor license and has agreed to return it to the TIFA to be placed in escrow. The TIFA will again be able to utilize the liquor license as an additional incentive for prospective restaurants to locate downtown.

Page 4
BOARD MEMBER COMMENTS
Vice Chairman Klemanski updated the Board on the committee’s progress with the review of the Business Recruitment Grant. The committee plans on presenting the recommendations for the Board at the November TIFA meeting.
Mr. Moniz requested a status update on the Public Safety security fencing and the property acquisition in TIF District B.
Mr. Skopek updated the Board that trees have been removed and landscape boulders have been installed. He noted that there were a few delays in the permitting process, but the project is continuing to move forward. He will provide the Board with additional details following a conversation with the Department of Public Works.
Mr. Skopek stated that due diligence items are underway. Staff should have an updated ALTA survey and an environmental report in their possession soon. He added that geotechnical testing will likely begin in the next couple of weeks once staff receives final quotes from contractors.
Dr. Dolly inquired about the development in Bloomfield Township at the southwest corner of South Boulevard and S. Squirrel Road.
Mr. Skopek stated that this is a residential development with some mix of commercial uses. He will seek additional information from the Community Development Department and report back to the Board.
ANNOUNCEMENT OF NEXT MEETING
The next regularly scheduled TIFA Board of Directors meeting is scheduled for Tuesday, October 12, 2021 at 4:00 PM at Auburn Hills City Hall Administrative Conference Room, 1827 N. Squirrel Road, Auburn Hills, Michigan 48326.
ADJOURNMENT
Moved by Ms. Price to adjourn the TIFA Board of Directors meeting.
Seconded by Mr. Moniz
Yes: Kneffel, Klemanski, Dolly, Hawkins, Price, Moniz
No: none
Motion carried by roll call vote
The TIFA Board of Directors meeting adjourned at 4:49 p.m.
Respectfully submitted,
Steve Goodhall Brandon Skopek
Secretary of the Board Executive Director

MEETING DATE: OCTOBER 4, 2021 AGENDA ITEM NO. 7A3
ELECTION COMMISSION
DRAFT MINUTES
1. CALL TO ORDER
The Clerk called the meeting to order at 10:00 AM.
2. ROLL CALL
Present: Jack Brocklebank
Terry Carpenter
Laura Pierce
Absent: None
3. APPROVAL OF THE MINUTES
3a. Minutes of August 30, 2021
MOTION: Motion by Carpenter, seconded by Brocklebank:
RESOLVED: To approve the minutes of August 30, 2021 as presented.
VOTE: Yes: All
No: None MOTION CARRIED
4. NEW BUSINESS
4a. Review List of Election Inspectors
MOTION: Motion by Carpenter, seconded by Brocklebank:
RESOLVED: To approve the list of election inspectors, chairpersons, absentee voter counting board inspectors, and receiving board members for the November 2, 2021 City Election pursuant to MCL 168.674(1) and to authorize the City Clerk to make revisions as needed.
VOTE: Yes: All
No: None MOTION CARRIED
4b. Public Accuracy Test
The Election Commission conducted the Public Accuracy Test in accordance with Michigan Election Law.
ELECTION COMMISSION MEETING September 27, 2021 10:00 AM
Council Conference Room 1827 N. Squirrel Road, Auburn Hills MI 48326
Election Commission, September 27, 2021 Page 2 5. OTHER ITEMS
6. ADJOURNMENT
MOTION: Motion by Carpenter, seconded by Brocklebank:
RESOLVED: To adjourn the meeting.
VOTE: Yes: All
No: None MOTION CARRIED
The meeting adjourned at 10:38 AM.

MEETING DATE: OCTOBER 4, 2021 AGENDA ITEM NO. 7B
CITY CLERK’S OFFICE
To: Mayor and City Council
From: Thomas A. Tanghe, City Manager; Laura M. Pierce, City Clerk
Submitted: September 28, 2021
Subject: Motion – To approve the 2022 City Council Meeting Schedule.
INTRODUCTION AND HISTORY
Every year, City Council approves the annual meeting schedule. The meetings are held on the first and third Monday of the month, except where there is a conflict with a holiday, in which case the meetings are held on the second and fourth Monday.
Section 4.14 of the City Charter requires City Council to meet twice each month. Only one regular meeting was scheduled in December due to the holidays. Per standard practice, a workshop will be held prior to the December meeting which will count as the second meeting for that month.
Attached is the proposed calendar for 2022. Please note that the meetings have been moved to the second and fourth Monday in the following months:
July Due to the Fourth of July Holiday
August Due to the Primary Election
September Due to the Labor Day Holiday
November Due to the General Election
City Council Members are able to amend any dates they wish, either now or during the year.
STAFF RECOMMENDATION
To approve the 2022 City Council Meeting Schedule as presented.
MOTION
Move to approve the 2022 City Council Meeting Schedule.
I CONCUR:
__________________________________________
THOMAS A. TANGHE, CITY MANAGER

2022 Calendar ‐ US Downloaded from WinCalendar.com
Full‐year calendar designed for printing on 1 page.
Date HolidaySun Mon Tue Wed Thu Fri Sat Sun Mon Tue Wed Thu Fri Sat Sun Mon Tue Wed Thu Fri Sat Jan 1 New Year's Day
1 1 2 3 4 5 1 2 3 4 5 Jan 17 Martin Luther King Jr.2 3 4 5 6 7 8 6 7 8 9 10 11 12 6 7 8 9 10 11 12 Feb 21 Presidents Day9 10 11 12 13 14 15 13 14 15 16 17 18 19 13 14 15 16 17 18 19 May 30 Memorial Day16 17 18 19 20 21 22 20 21 22 23 24 25 26 20 21 22 23 24 25 26 Jul 4 Indep. Day23 24 25 26 27 28 29 27 28 27 28 29 30 31 Sep 5 Labor Day30 31 Oct 10 Columbus Day
Nov 11 Veterans DayNov 24 Thanksgiving DayDec 25 Christmas
Sun Mon Tue Wed Thu Fri Sat Sun Mon Tue Wed Thu Fri Sat Sun Mon Tue Wed Thu Fri Sat
1 2 1 2 3 4 5 6 7 1 2 3 4 Proposed City Council Meeting3 4 5 6 7 8 9 8 9 10 11 12 13 14 5 6 7 8 9 10 11 Election Day10 11 12 13 14 15 16 15 16 17 18 19 20 21 12 13 14 15 16 17 18 Holiday (above)17 18 19 20 21 22 23 22 23 24 25 26 27 28 19 20 21 22 23 24 25
24 25 26 27 28 29 30 29 30 31 26 27 28 29 30
Meetings held the first and third Monday,
except in July, August, September and
November.
Sun Mon Tue Wed Thu Fri Sat Sun Mon Tue Wed Thu Fri Sat Sun Mon Tue Wed Thu Fri Sat
1 2 1 2 3 4 5 6 1 2 3
3 4 5 6 7 8 9 7 8 9 10 11 12 13 4 5 6 7 8 9 10
10 11 12 13 14 15 16 14 15 16 17 18 19 20 11 12 13 14 15 16 17
17 18 19 20 21 22 23 21 22 23 24 25 26 27 18 19 20 21 22 23 24
24 25 26 27 28 29 30 28 29 30 31 25 26 27 28 29 30
31
Sun Mon Tue Wed Thu Fri Sat Sun Mon Tue Wed Thu Fri Sat Sun Mon Tue Wed Thu Fri Sat
1 1 2 3 4 5 1 2 3
2 3 4 5 6 7 8 6 7 8 9 10 11 12 4 5 6 7 8 9 10
9 10 11 12 13 14 15 13 14 15 16 17 18 19 11 12 13 14 15 16 17
16 17 18 19 20 21 22 20 21 22 23 24 25 26 18 19 20 21 22 23 24
23 24 25 26 27 28 29 27 28 29 30 25 26 27 28 29 30 31
30 31
For online version of this Calendar see: https://www.wincalendar.com/2022‐Holiday‐Calendar
July 2022 August 2022 September 2022
October 2022 November 2022 December 2022
January 2022 February 2022 March 2022
April 2022 May 2022 June 2022
WinCalendar WinCalendar WinCalendar
WinCalendar WinCalendar WinCalendar
WinCalendar WinCalendar WinCalendar
WinCalendar WinCalendar WinCalendar

MEETING DATE: OCTOBER 4, 2021 AGENDA ITEM NO. 9A
COMMUNITY DEVELOPMENT
To: Mayor and City Council
From: Thomas A. Tanghe, City Manager; Steven J. Cohen, AICP, Director of Community Development
Submitted: September 27, 2021
Subject: Public Hearing / Motion – Revocation of Planned Unit Development Approval / Primary Place
INTRODUCTION AND HISTORY The City Council has scheduled a public hearing to consider the revocation of the combined Planned Unit Development Option Step One – Concept Plan / Step Two – Site Plan approval for Primary Place, which was previously granted by the City Council on October 26, 2014. Notification of the public hearing was provided to David Steuer of Steuer & Associates Inc (Steuer) on August 17, 2021 and September 22, 2021. The public hearing has been triggered since Section 1830 of the Zoning Ordinance states: “If development of approved final plats or site plans is not substantially completed in three (3) years after approval, further final submittals under the approved PUD Plan shall cease until the part in question is completed or cause can be shown for not completing same. Extensions may be granted at the discretion of the City Council.”
Site Condition (September 2021 photo)

Page 2
Rendering of Proposed Buildings
Illustrated Site Plan
PROJECT OVERVIEW Steuer received PUD Step One/Two approval from the City Council on October 26, 2014 for this apartment project. The proposed development included three, six‐unit townhouse buildings on 1.12 acres of vacant land located at the southwest corner of Primary Street and Grey Road. All 18 units would have approximately 1,500 sq. ft. of living space. Each unit would have an attached two‐car garage. The investment was estimated at $3 million.
ENVIRONMENTAL REMEDIATION The cleanup of the site was funded through a loan from the City’s Brownfield Redevelopment Authority (AHBRA). Steuer has been fully reimbursed for $261,036.30 in expenses for site work. Remediation occurred in October 2018. No monies have been paid back for the loan. The remedial excavation activities were conducted to address potential unacceptable exposures at the site, primarily arsenic contaminated soils, to facilitate the proposed residential use. After remedial activities were completed, the entire excavation was brought back to grade with clean backfill material. The site was not revegetated in late 2018 since construction was set to begin shortly after the cleanup.
View of remediation activities (October 2018 photo taken by Steuer’s environmental consultant)

Page 3
STAFF RECOMMENDATION The City Council could proceed to revoke the PUD approval; however, staff recommends “Option B” as outlined below, extending the approval until December 31, 2021 to allow Steuer additional time to start construction this year, as such an extension will include supplemental protections for the City. MOTION (OPTIONS FOR THE CITY COUNCIL TO CONSIDER) OPTION A: Revoke the PUD Approval “Move to revoke the Planned Unit Development approval previously granted on October 26, 2014 by the City Council for Primary Place. The reason for the revocation is the failure to start building construction in a timely manner by Steuer & Associates, Inc. (the applicant). The applicant shall restore the site as directed by staff in accordance with City Ordinances by October 22, 2021. If the applicant fails to restore the site as directed, then the City Manager and/or his designee shall be authorized to take any reasonable action to enforce the City Council’s order including but not limited to legal action, invoicing the applicant for work performed by the City that the applicant fails to complete, and to place a lien against the property if such costs incurred by the City are not paid by the applicant.” OPTION B: Extend the PUD Approval until December 31, 2021 “Move to extend the Planned Unit Development approval for Primary Place until December 31, 2021 subject to the following conditions: 1. Steuer & Associates, Inc. (the applicant) will voluntarily terminate the Planned Unit Development approval
if construction is not substantially underway by December 31, 2021. Substantially underway shall be defined as the installation of underground utilities, completion of the building’s footings and foundations, and the start of vertical construction on the first building.
2. The applicant will submit a cash bond in the amount of $30,000 to the Community Development Department for the cost of regrading and revegetation of the site. The cash bond will be provided as surety for the City that the site will be restored if the Planned Unit Development approval is terminated. The applicant will voluntarily terminate the Planned Unit Development approval if it fails to submit the required cash bond by 5:00 p.m. on Monday, October 18, 2021.
3. If the Planned Unit Development approval is terminated, then the City shall have the right to utilize the cash bond of $30,000 to regrade and revegetate the site. If the applicant fails to submit the $30,000 cash bond and/or restore the site as directed, then the City Manager and/or his designee shall be authorized to take any reasonable action to enforce the City Council’s order including but not limited to legal action, invoicing the applicant for work performed by the City that the applicant fails to complete, and to place a lien against the property if such costs incurred by the City are not paid by the applicant.”
I CONCUR:
__________________________________________
THOMAS A. TANGHE, CITY MANAGER

Community Development Department 1827 N. Squirrel Road - Auburn Hills, MI 48326 Phone: (248) 364-6941 Fax: (248) 364-6939
Website: www.auburnhills.org
PUBLIC NOTICE
September 22, 2021 Mr. David Steuer Steuer & Associates, Inc. 30180 Orchard Lake Road Ste 150 Farmington Hills, MI 48334 RE: Notice - Public Hearing Scheduled for Potential Revocation of Approval Primary Place PUD – 3340 Primary Street Sidwell No. 14-36-129-007 Dear Mr. Steuer: This letter is provided to notify you that the Auburn Hills City Council has scheduled a public hearing for Monday, October 4, 2021, at 7:00 p.m. in the Council Chamber at Auburn Hills City Hall. The public hearing date was moved from September 27, 2021 to October 4, 2021 per your request. The purpose of the public hearing is to consider the potential revocation of the Planned Unit Development Option approval previously granted by the City Council on October 6, 2014 for Primary Place. If you have any further questions regarding the above, please contact City Attorney Derk Beckerleg at (248) 851-9500. Sincerely,
Steven J. Cohen, AICP Director of Community Development cc: Thomas A. Tanghe, City Manager Derk Beckerleg, City Attorney Laura Pierce, City Clerk

Page 1 of 9
Primary Place PUD Construction Time Line
2014 October 7, 2014 City Council approves PUD to develop 1.12 acres of vacant land located at the southwest corner of Primary Street and Grey Road called Primary Place. The developer, David Steuer of Steuer & Associates, Inc., intends to construct three new six‐unit townhome buildings on the property. All 18 units will have approximately 1,500 sq. ft. of living space. Each unit will have an attached two car garage. The investment is estimated at $3 million.
2016 June 20, 2016 City Council approves the Brownfield Plan. AHBRA approved the plan on May 17, 2016. October 16, 2016 Email sent by Cohen to Steuer: “I just wanted to check in with you. The PUD approval for Primary Place is now two years old. It expires on October 6, 2017. When do you plan to submit detailed engineering and building construction drawings to the City? We would typically review those documents now to prepare a site for construction in the Spring. Please provide an update on the status of your project and your timing for construction.”
2017 June 16, 2017 Reimbursement Agreement for loan signed between the Primary Place, LLC (Steuer) and AHBRA. Section 3 of the agreement discusses the order in which Reimbursements should be repaid and Section 5 states that the project is to be complete by March 31, 2019. Eligible activity costs came in lower than the total loan amount. The AHBRA approved a loan for Steuer of up to $364,000 for actual expenditures on eligible activities. Steuer was actually loaned $261,036.30, not the full $364,000. Remediation occurred in October 2018. August 9, 2017 Email sent by Cohen to Steuer: “I am sending this e‐mail as a friendly reminder that your PUD will expire on 10‐06‐17, which is three years after Council approval on 10‐06‐14. If construction does not commence prior to that date, then your project will officially expire. Please advise us if/when you plan to start your project.” Email response to Cohen from Steuer that same day: “The engineering and construction drawings have been complete for years. We have been anxious to start the project, but the city attorney keeps adding liabilities to the environmental cleanup agreement. Just last week they sent us revisions that are more than I bargained for. I am not happy, to say the least. Meanwhile, I asked Glenda to update the plans for the current building code. Perhaps you Tom and I can meet for a few minutes later next week to discuss equitable ways to get this project moving forward.”
CohenSeptember 22, 2021

Page 2 of 9
September 7, 2017 Email sent by Cohen to Steuer: Two items for consideration moving forward: 1. Comments below from Tim Juidici, City consulting engineer”
“They would need a pre‐con and probably ROW bond before starting work on the site. No engineering plans for this site have been submitted as far as I recall. We’d like to see what they’re doing as part of the remediation work and will need to review against the full site engineering plans. They cannot start site grading, utilities, etc. until engineering approval and all fees/escrows are paid with DPW.”
2. See the attached e‐mail regarding the PUD plan expiration. It would be ideal not to have to take this project back through the approval process. Note: If the building permit is pulled and fees are paid prior to 10‐06‐17, then the project will have six months before construction must begin (6 month permit). It appears that building construction plans have not been submitted to our Department for review.
Email response to Cohen from Steuer same day (directed to PEA): “Jim, I thought the plans had been submitted. Please submit as soon as possible, or contact me with any questions. Thank you. Steve please let us know the building fees so we can submit by 10/6.” September 20, 2017 Building Construction Plans submitted September 28, 2017 Email sent by Cohen to Steuer: “If you pay your building permit fees and provide plans, I will determine that you are meeting the requirements of the PUD time approval frame. Based on past practice, your building permit would give you 6 additional months to construct. Thus, allowing you to build in the Spring. Please work directly with Jeff while I am gone. He is aware of your deadline. It is our goal to help you succeed and work in good faith to help you move toward construction.” November 10, 2017 The Engineering Plans were approved by the City Engineer on this date. Steuer pays $12,706 for building permit for 1st building. Revisions still required to plans before construction. Note: The initial Building Plans for the foundation and shell for Buildings A, B, and C were disapproved on November 8, 2017 and the subsequent revised Building Plans submitted for the foundation and shell for Buildings A, B, and C were disapproved on March 5, 2018. December 19, 2017 Email sent by Cohen to Steuer: “I was reviewing your project file and wish to confirm a few things with you. It appears you did not pay all the required building permit fees back on November 10th. Our records show you paid $12,706 on that date. Our records also show that $32,782 is still owed. See attachments. If you have not paid the required fees, they must be paid as soon as possible. When do you intend to start construction in 2018 to preserve your development rights? The PUD approval for the project expired on October 6, 2017. Please update us on how you are doing with lining up contractors to start Building No. 1 and when precisely you plan to break ground?”
2018 March 5, 2018 Revised Building Plans submitted for the foundation and shell for Buildings A, B, and C were disapproved on this date. May 10, 2018 Six months passed since payment of fee on November 10, 2017. No building construction occurs on‐site; therefore, the Building Permit technically expires.

Page 3 of 9
May 16, 2018 Email sent by Cohen to Steuer: “As a follow‐up to my phone message today, please contact me regarding the status of your project.” May 18, 2018 Email sent by Dan Hiramanek, Steuer & Associates to Cohen and Spencer: “Wanted to thank you both for touching base with me over the phone yesterday. I am committed to moving this project forward and wanted to re‐cap our next steps per our conversation: 1) Samantha, I called late yesterday and left you a voicemail. Let me know a convenient time we could touch base on the phone today or Monday. 2) I will check with Oakland County (water resources and engineering) to verify and confirm any regulations they require are satisfied prior to remediation or construction. 3) Please forward any of the outstanding items that needed additional clarification or answers from the Plan Review. 4) I will get in touch with Carl Floor at DTE in regards to the wires near the proposed buildings (if you have his contact info, please send) and put together some potential solutions. If I left anything off from our discussion, please let me know. I did submit the Remediation paperwork to Nick Maloof at Associated Environmental yesterday afternoon. I plan on going over it with him today on the phone to make sure everything is accurate so we can submit to the city for review Monday and get a remediation start date on the Calendar. Look forward to working with you all and the city to get this project started. October 2‐12, 2018 Steuer & Associates’ remediation contractor Sinacola moves forward with soil remediation activities after pre‐con with AKT and City staff. The remediation work left much of the soil on the site bare and exposed to the elements. Upon completion of the work, the City did not require the site be revegetated since the City was informed by Steuer during the October 4th ground‐breaking event, that construction would begin later that year (2018). Clinton River Trail connection was removed/re‐routed to Squirrel as part of the remediation project. October 4, 2018 Strolling ground breaking occurs for new downtown development, including Primary Place. October 30, 2018 Pre‐construction meeting between City staff and Steuer’s team held to review requirements start of site construction.
2019 September 3, 2019 Staff contacts Steuer to fix/secure construction fencing and cut grass. Steuer complies on September 5, 2019. Soil on the site still bare and exposed to the elements. November 19. 2019 Email sent by Keenan to Steuer: “I wanted to touch base with you to see if there has been any progress made on the following: Revised Building Plans/Building Plan Approval, ITC review/approval letter, Financing. It does not appear that construction will be able to start this year as we were informed. Without any of the above actions being competed, that would indicate that the project is moving forward, there is an increasing chance we may end up having to bring this matter to City Council. We still support your project and are eager to see your project move forward.” December 2, 2019 Email sent by Steuer to Keenan in response to Keenan’s November 19, 2019 email: “I hope you enjoyed the Thanksgiving holiday. Per your questions below: I met again with our lender Friday, and hope to have our final approval in a week. I dropped off plans at the building department a month ago. The ITC info was sent by Nick

Page 4 of 9
Maloof, our environmental consultant who has been working on the remediation since the beginning. We may not be able to break ground before year end, but it should be very close. Thank you.”
2020 March 2020 Pandemic hits US/Michigan causing shutdown of non‐essential work including building construction. April 30, 2020 Tom Tanghe met with Mr. Steuer and Mr. Steuer stated that he would put the Clinton River Trail pathway connection immediately since construction on the buildings did not occur in Fall 2018 as planned. The City Council had expressed concern with the condition of the pathway. June 15, 2020 City Council again expresses concern about the Clinton River Trail pathway connection not being done. Cohen calls and leaves a message for David on June 16, 2020 about the City Council’s desire to have this issue resolved. July 6, 2020 Cohen calls Steuer to obtain an update on the pathway. He said PEA had completed the surveying/staking of the pathway location. The contractor will call the City today to arrange the on‐site pre‐con for this week. Cohen asked Steuer to call Tom Tanghe to provide an update on his project. Steuer told Cohen that he is in the process of re‐applying for financing. He said his financing was turned down on March 31st due to the uncertainty surrounding the start of the pandemic. July 27, 2020 Email sent by Cohen to Steuer: “I tried calling you, but your phone mailbox is full and not accepting messages. After several months of discussions, I contacted you two weeks ago on July 6th and you advised me that a contractor had been obtained to build the Clinton River Trail pathway adjacent to your development and that work would start within the next 7 to 10 days. It has now been 21 days and no work has been done. OHM advised us today that your contractor has not contacted them with a start date, as that was discussed during the pre‐construction meeting in the field. Your lack of urgency to meet your obligations and commitments has been very concerning to the City. Please advise us when the pathway segment will be completed. The City expects that the pathway will be completed by your contractor no later than Monday, August 3rd.” July 30, 2020 Email sent by Steuer to Cohen regarding the Clinton River Trail: “Mark Garmo of Outdoor Accents will be following up with you. I apologize he has not gotten the job done yet.” August 7, 2020 Email sent by Cohen to Steuer: “David, I have tried calling both Mark and yourself. However, both of your voicemail boxes are full. As you know, work has not started yet on the pathway. We are very disappointed and confused as to why this is not a priority for you, why you have failed to work in good faith with us, and why you have not communicated with us. Please be advised that if the pathway is not installed and open to the public by noon on Friday, August 14, 2020, City staff will take the necessary steps to place your project on the next available City Council agenda for consideration of the revocation of Primary Place’s PUD approval.” September 2020 Clinton River Trail pathway connection fixed by Steuer contractor around four months after being requested by Tanghe / City Council. Exact date not found in records.

Page 5 of 9
October 15, 2020 Cohen sends email and letter to Steuer notifying him that a public hearing was scheduled for November 16, 2020 for the Auburn Hills City Council to consider the potential revocation of the Primary Place PUD project. October 21, 2020 City Attorney Derk Beckerleg has a phone conversation with Steuer regarding Primary Place. Steuer indicated that he didn’t think there were any time limits on his PUD approval and Beckerleg advised him that wasn’t the case. He explained to Steuer that the City has looked at his poorly maintained construction site in the middle of downtown for the last two years and his responsiveness to City’s inquiries in that regard, as well as regarding the installation of the path (which is now in), has been less than stellar. A MS Teams call was scheduled to work toward a resolution. October 27, 2020 MS Teams meeting held between City staff and Steuer. Staff expressed the City Council’s frustration with his project and the lack of activity, including the conditions that currently exist as well as the detrimental impact it has had on the appearance of the downtown. Email from Cohen to Steuer recapping meeting sent that day: “The following is a general summary of the City’s expectations:
1. We will work together to schedule and hold a MS Teams check‐in meeting with Tim Juidici, OHM, Ron Melchert, DPW Director, and Jeff Spencer, Building Official this week to discuss next steps and clarify any questions you may have on fees.
2. We will work together to schedule a date and time to hold a pre‐construction meeting. Work on‐site must start within the next 30 days, preferably earlier
3. You will pay all required fees and escrows to the DPW needed to allow the start of work. Monies must be received by 9:00 a.m. on November 10, 2020.
4. You will provide the City copies of the signed contracts you have with your various contractors to install underground utilities, footings, and foundations no later than 9:00 a.m. on November 10, 2020.
5. You will comply will all permit and best practices requirements of the DPW and OHM, along with applicable outside agencies.
6. You will provide a schedule to the City, showing your anticipated construction schedule. 7. Once the underground work is complete at the site, you agree to maintain the property in an orderly state
and properly secure its limits as approved by Jeff Spencer, Building Official. Provided the above plan of action is accepted by you, and the listed deadlines are met, staff will postpone the public hearing and not place the revocation of the PUD on the November 16, 2020 City Council meeting agenda.” October 28, 2020 Email from Cohen to Steuer: “Attached are documents which outline the fees due now. In summary, $119,970 should be paid to the DPW at 1500 Brown Road by 9:00 a.m. on November 10th. 1. DPW Water and Sewer Fees ‐ $81,270 2. Construction Fee (Escrow) ‐ $18,700 3. City of Auburn Hills ROW Cash Bond ‐ $20,000” November 2, 2020 MS Teams meeting held between City staff and Steuer Email from Cohen to Steuer recapping meeting sent that day: “As a follow‐up to our MS Teams call today, below is a recap of our discussion:
1. You intend to pay the Construction Fee (Escrow) of $18,700 and the City of Auburn Hills ROW Cash Bond of $20,000 today at the Community Development Department at City Hall.
2. A pre‐construction meeting will be held this Wednesday, November 4th at 11:00 a.m. Confirm meeting details with Andrew Cousino at OHM.
3. You will pay the water and sewer fees of $81,270 to the DPW at 1500 Brown Road by 9:00 a.m. on November 10, 2020.

Page 6 of 9
4. You will work with Dennis Sinacola to provide the City with a schedule of when underground work will start on‐site and when it is anticipated to be completed.
5. You will provide the City copies of the signed contracts you have with your contractor(s) to install underground utilities, footings, and foundations no later than 9:00 a.m. on November 10, 2020.
6. Lastly, you will comply with all the items in the October 27, 2020 e‐mail.” November 4, 2020 On‐site pre‐construction meeting with the contractor who will be in charge of the construction for Primary Place, OHM, DPW, and Building. Steuer did not attend. Keenan reported that the contractor stated that he could not give a definite date for when he would be able to start construction. He indicated that his start date is contingent upon another job he has going on and that he might be able to start in two weeks. November 9, 2020 Steuer pays water and sewer fees of $81,270 to the DPW. November 16, 2020 Email from Cohen to Steuer replying to his question as to whether the PUD revocation would be on the City Council agenda: “David, You are correct. The PUD revocation is not on tonight’s City Council agenda but may be rescheduled for the December 6th meeting. You have paid your fees and held the pre‐construction meeting, but please note you are still deficient in meeting the verbal agreements you made on the MS Teams calls. See the email chain below and the items below. Following important items still unresolved:
1. You did not provide me/City with a schedule of when underground work will start on‐site and when it is anticipated to be completed.
2. You did not provide me/City copies of the signed contract(s) you have with your contractor(s) to install underground utilities, footings, and foundations. That was supposed to be provided no later than 9:00 a.m. on November 10, 2020.
3. Work must start on the project by Wednesday, November 25, 2020 (no later than 30 days from our first meeting of October 27th).
If work does not start by November 25th, as committed to by you, we will proceed to schedule the public hearing for the December 6th City Council meeting.” November 20, 2020 Email from Cohen to Steuer: “David, I attempted to call you again today, but your voicemail is full. I spoke to your assistant Judy on November 18th and asked her to have you call me as soon as possible, and you have not returned my call. I e‐mailed you on November 16th that you were deficient in meeting your commitments, and I have not heard back. So, I am making this final good faith effort to communicate with you. You committed to starting work on‐site by November 25th. See e‐mail chain recapping our MS Teams calls. November 25th is fast approaching, and you have not communicated with me if you will make that date. You also committed to providing the City your signed contract with your contractor (due November 9th), along with a construction schedule. That information has not been received. I will be out of the office all next week. At this point, it is imperative that you now communicate with City Attorney Derk Beckerleg at (248) 851‐9500 moving forward about your intentions.” November 24, 2020 Sinacola is reported to have started some utility construction.
2021 February 4, 2021 Email from Cohen to Steuer: “Hi David, Please give me a call to discuss your plans for Primary Place construction. I attempted to contact you via phone but your voicemail is full and not accepting messages.” No response from Steuer.

Page 7 of 9
March 12, 2021 Cohen sends an email and letter to Steuer notifying him that a public hearing was scheduled for May 17, 2021 for the Auburn Hills City Council to consider the potential revocation of the Primary Place PUD project. Email response sent from Steuer to Cohen that day: “I don’t understand. Sinacola is in the middle of doing all the underground now.” Email response sent from Cohen to Steuer: The City is not aware of your plans for construction as you have failed
to communicate with us. You have also failed to provide your construction schedule as previously requested. If you
intend to proceed with building construction, please provide that schedule to me and instruct your project manager
to communicate with Building Official Jeff Spencer regarding necessary inspections and time frames.”
March 30, 2021 MS Teams meeting held between City and Steuer. Cohen e‐mail on March 31, 2021 to Steuer: “David, This email confirms your commitment yesterday to provide a detailed construction timeline, which includes timing for the vertical construction of all the buildings, along with a written narrative on your intent by Thursday, April 8, 2021. You will also arrange for your site manager to contact Code Enforcement Officer Chris Myers (248‐364‐6934) or Jack Skinner (248‐364‐6948) to arrange a plan of action to keep the site in order/safe, and properly mowed/no weeds. I will arrange a follow‐up MS Teams meeting once we receive your construction schedule and narrative.” April 7, 2021 Email from Steuer to Cohen: “Hi Steve, As we discussed on the zoom call last week, Dennis Sinacola is currently completing the site water, storm & sanitary sewer underground work and prepping the building pads. We plan to install the building footings in May, and proceed with framers in June. It would be our goal to complete the construction within a year so we can market completed townhomes next Spring. Joe Myers has handled our lawn cutting for over 20 years. I will communicate with him to make sure he stays in compliance with the municipality ordinances. If anyone ever has concerns, quickest results are via texting me @ 248.790.4481. Thank you.” April 27, 2021 Email from Cohen to Steuer: “David, As a final courtesy, I wanted to let you know that our packet will be due to the City Council in approximately two weeks for the May 17th meeting. The May 11th deadline in the attached public hearing notice for you to have the project substantially underway is now 14 days away. Substantially underway is defined as the installation of underground utilities and the completion of the building’s footings and foundations. The timeline for construction you provided to us on April 7th was very vague. We hope that you could provide more detail and explanation in the days ahead regarding your intentions. I strongly recommend that your General Contractor speak with Building Official Jeff Spencer (248‐364‐6940) as soon as possible about what needs to be done with your permit to start the installation of the building footings and foundations and to confirm the payment of appropriate fees. The photo below was taken this morning. The only structure on the site that we see movement on is the porta‐potty, which is surrounded by debris. It is located next to a sign announcing your project will begin leasing in the Summer of 2019. You should remove the sign or fix it to state the proper leasing date. Please advise us with a more detailed explanation of your intentions.” April 28, 2021 Email from Steuer to Cohen: “Steve, I did not know that the City required footings & foundations installed. The underground utilities have been completed. Glenda Meads plans have a more costly than necessary foundation design, and upon my request, she reached out to a structural engineer to make them properly cost efficient. I spoke with him last week, and he has it on his list, but everyone has more work than they have time. I spoke with my lender but was told they are declining other projects over material cost increases, and they asked me to give them current lumber pricing for the buildings. I spoke with Church's Lumber and they are updating our costs. I also had John's Lumber update their quote, but they announced a sale this week and then told me it's going to take a little longer to finalize the quote as a result. Lets talk tomorrow.”

Page 8 of 9
May 18, 2021 MS Teams meeting held between City staff and Steuer Email from Cohen to Steuer recapping meeting sent that day: “David, To confirm our conversation today:
1. The City will allow you to proceed with the footings and foundations for the two interior buildings that share the entry drive. The installation is anticipated to occur the week of May 31st. Please coordinate with Building Official Jeff Spencer regarding expectations for inspections.
2. The City will allow you to pay the water and sewer fees ($81,270) at the time of vertical construction of the first building, instead of the start of the building footings and foundations. Note: Water and sewer fees were paid on November 9, 2020
3. The City will allow you to pay partial Building Permit fees, instead of full fees to facilitate the installation of the footings and foundations. The City will accept the $12,737 fee you paid in 2017 as partial payment. The remaining permit fees (approximately $33,000 – to be confirmed) will be due before the final buildings permits are issued/inspections scheduled which would allow the first building to go vertical.
4. No performance bond will be required at this time. As discussed, you will stay in contact with the City in the weeks ahead to keep us updated on the status of your financing and construction.” June 4, 2021 Email from Steuer to Spencer: “Hi Jeff, I called earlier and left a vmail. Our footing contractor is prepared to start Monday Please let me know what we need to do with the city if anything at this point Thank you.” Email from Spencer to Steuer that same day: “David, Please call me Monday morning on the status of the footings started, just to make sure they are starting 248‐249‐4577. Make sure you have the buildings staked and a 3rd party agency on site during all foundations verifying PSF design on bottom of trench, PSI design on concrete 28 day breaks etc. etc. Send all reports to our department. Don’t get any dirt on the road or we will need to have a sweeper come out and back charge the property plus an admin. Fee. Please don’t leave any concrete spoils or anything that will be a blight or keep you from cutting the lot. Thanks” June 21, 2021 Email from Cohen to Steuer: “David, It is my understanding that our staff has attempted to contact you about the status of your construction efforts (with no return response). It appears your project has stalled again. As I expected, the City Council expressed concern tonight with the lack of progress with construction, condition of the site, the Clinton River Trail connection thru the site, and repair cuts in Primary. It is imperative that we meet with Tom Tanghe and Derk Beckerleg in the days ahead to discuss what is happening with your project. In the meantime, please call me tomorrow so that I can update the City Council. Thank you” Email from Steuer to Cohen that same day: “When they excavated, they ran into materials from prior buildings. They contacted miss dig but miss dig did not have records of the underground conduit and wires.” June 22, 2021 Email from Cohen to Steuer: “I tried calling you. Your voicemail is full. Please send me some detail as to where your project is at (timing/next steps) so that I can report back to the City Council.” June 28, 2021 Gravel section of Clinton River Trail is paved by Steuer’s contractor. The area was disturbed in March/April 2021 during underground utility construction by Steuer’s contractor and gravel was left which created a hazard for pathway users. Email from Steuer to Cohen: “Hi Steve, As we discussed last Thursday, PEA staked this morn and Sealrite completed the asphalt reinstall this afternoon. PEA also worked with our footing excavator on site today regarding the old building materials that were underground and did more test holes. It’s going to cost us more money, but is doable.”

Page 9 of 9
Note: This small section of the paved Clinton River Trail pathway was removed for installation of storm sewer. This section was repaved with no notice/no inspection by OHM/DPW. It appears that the pavement mix, compaction, and surface do not meet requirements. This patch area will need to be redone (with proper inspection, submittals, etc) prior to acceptance by the City. August 16, 2021 Project stagnated, no activity had occurred in months, and site is overgrown with weeds. Mayor/City Council request the City Manager to proceed with the public hearing to revoke the PUD approval. August 17, 2021 Cohen sends an email and letter to Steuer notifying him that a public hearing was scheduled for September 27, 2021 for the Auburn Hills City Council to consider the potential revocation of the Primary Place PUD project. September 20, 2021 Email from Steuer to Tanghe: “Hi Tom, I spoke with Steve last Friday. I have to be at a trial in Cleveland starting Monday the 27th and will not be able to attend the public hearing (my attorney asked the judge for a continuance but was denied‐see below). Accordingly, I respectfully request the Primary site plan agenda item be postponed. I also shared the status with Steve: We completed the underground utility installation pursuant to the approved site plan at a significant cost of approx. If the City takes away the site plan approval, how do we address that? We had a contract with a foundation contractor who started in June on the west bldg pad at the side closest to Primary and uncovered prior building debris. We hired PEA and McDowell to do testing and learned the excavation will be much more involved and expensive. Our first contractor decided he would not do the job under the circumstances. I got a 2nd contractor who agreed to do the work, but has now been ghosting me. I am working with a third foundation contractor to try to get the foundations restarted immediately. We have been requesting DTE for price and timing to relocate a pole that blocks the building facing the parking garage. After many months they finally gave us a price of $46k, which seems extraordinary. Steve and I also discussed that previously lumber prices got so high that many multi‐family projects got shelved. Recently lumber futures have been dropping to a level that makes vertical construction feasible again. I reached out to Church's lumber and others, only to be told that while futures are down, it will take awhile to show up in pricing to consumers. However, as we move forward with the foundations, the timing could work well with lumber prices. I am aware that you have had progress with some other buildings and I share your frustration that ours have been delayed. Hopefully, we will be able to up for lost time soon.” September 22, 2021 Cohen sends an email and letter to Steuer notifying him that a public hearing was scheduled for October 4, 2021 for the Auburn Hills City Council to consider the potential revocation of the Primary Place PUD project.

CITY OF AUBURN HILLS
PLANNING COMMISSION
MINUTES - EXCERPT September 18, 2014
1. CALL TO ORDER: Chairperson Ouellette called the meeting to order at 7:01 p.m.
2. ROLL CALL: Present: Beidoun, Hitchcock, Justice, Mendieta, Mitchell, Ouellette, Pierce, Shearer
Absent: None
Also Present: Director of Community Development Cohen, City Manager Tanghe, Senior Director Adcock
Guests: 12
LOCATION: City Council Chamber, 1827 N. Squirrel Road, Auburn Hills, MI 48326
5. PETITIONERS
5a. Primary Place – PUD
Mr. Ouellette explained this is a Combined PUD, which is a two-step Planned Unit Development; Qualification, step one and Site Plan & Tree Removal Permit, step two. Continuing, Mr. Ouellette explained because this is a Public Hearing, Mr. Cohen, Community Development Director will present the project, the developer will offer any additional information, then the Planning Commission will ask questions, and finally the discussion will be opened to the public. Once all questions are answered, the Planning Commission will make a recommendation to the City Council for action. This item will be on the October 6, 2014 City Council meeting.
Mr. Cohen noted his department received one letter from a resident dated September 15, 2014 and asked Secretary Justice to read it for the record:
Dear Mr. Cohen,
I don't often write letters to members of the city government, but am compelled to do so regarding the pending development on Primary St between Squirrel Rd and Grey Rd.
I have lived in my home on Grey Rd since 1982 and have seen many changes to the city, which most people see as improvements. Unfortunately I do not share their opinion. I grew up in Ferndale, a suburb of Detroit. When I moved to Auburn Hills I was ecstatic because I moved to 'the country". Little by little, my "country" has disappeared, making way for industrial parks, automotive giants and mega malls. Once again, I know that to many this is progress, and I have grinned and bared it for a very long time.
Not long ago I was dismayed to find an apartment building going up on Auburn Rd, with the back/side of it practically on Grey Rd. Next to come is a new business development at Auburn Rd and Squirrel. I guess I can live with that because that is part of the downtown business district. But now, in one of the small remaining green spaces nearest my home, I understand that more townhomes will be popping up soon. I feel that the "suburban sprawl" is now practically in my backyard.
A couple months ago I received a survey (from which city department I do not remember) which had pages of questions regarding services needed by aging residents; did I plan to move, would I remain in Auburn Hills, etc. I started completing the survey, but then realized I really do not want to stay in Auburn Hills. I love my home and all
of the work I've put into it in the last 30+ years, but I no longer like the area. If my job did not keep me here, I WOULD move, and it would be out of Auburn Hills.
I will be unable to attend the meeting to be held on the 18th, but wanted my voice to be heard. If there is another meeting to be held on this topic I would like to be notified.
I appreciate your attention.
Thank you,
Christine and Ronald Roddy
599 S. Grey Rd.
Mr. Cohen presented a PowerPoint presentation, noting the development is on the edge of downtown. It is surrounded by Church’s Lumber to the south, as well as a printing business and strip mall to the west; to the north is student housing and the parking garage. Light industrial zoning is to the south and the west of this property, and a residential neighborhood to the east and to the south. This parcel is in the Downtown zoning district.
The project is proposing 18 apartment units that resemble townhomes and will all have garages. This is a very difficult parcel to work with, there are high transmission lines to the south and to the north are big DTE lines.

Planning Commission – September 18, 2014
Page 2 of 4
The units are just under 35 feet at the peak, the mid-point of how buildings are measured, with the highest tip of the roof at 41 feet.
David Steuer, Steuer & Associates, Inc., builder and developer, thanked the City team for being very helpful. His company is a smaller scale builder and developer, who has won many awards for their projects. Being so small, they must carefully choose where they build, and Auburn Hills was chosen as one of those sites. This site will be for rent housing.
The location is great, with shopping and plenty of outdoor activities, with close proximity to the Clinton River Trail.
The units have an attached two car garage, each has their own entrance, two and one-half bathrooms, two bedrooms, and a loft area that could be used as a third bedroom.
Responding to Ms. Shearer, Mr. Steuer believed the rental rates will be in the neighborhood of $1,800 per month; utilities are not included in the rent. The units are approximately 1,500 sq. ft., not including the garage level.
Ms. Mitchell asked for clarification of the perspective tenants as business professions.
Mr. Steuer explained the Chamber of Commerce conducted a study with the local businesses and about 20% were seeking long-term corporate housing. With all the international companies in Auburn Hills, many companies bring employees in for a number of years to work. This type of housing is similar to much of the housing in other countries.
Mr. Ouellette asked about the pavilion and seating area.
Mr. Steuer stated at the northeast corner of the site, at the corner of Grey and Primary, the land is quite narrow. A 10 foot by 14 foot structure will be erected to simulate the old train depot; four posts with a roof and cement floor with a picnic table. Lighting has been discussed, and solar lighting is being investigated. The roofing of the structure will match that of the Primary Place apartment buildings.
Mr. Ouellette asked if the trail will be moved over a bit.
Mr. Cohen explained the City would like to retain ownership of the land the trail occupies, as opposed to an easement. The trail will be redesigned and rerouted, with the City’s property line along the edge of the pathway and then head north.
Mr. Hitchcock asked if there may be any marketability concerns with the proximity of the buildings to each other.
Mr. Steuer explained there are two buildings parallel to each other, with the balconies on the back sides; these are more of an urban style. He is comfortable with the space between buildings.
Mr. Beidoun asked if the trail is being moved to the right, then why not move the building to the right.
Mr. Cohen explained there is a 100 foot easement for ITC, the high transmission lines, so the edge of the building must be outside of that easement. There is not an option of moving the easement because of the safety factor involved with such powerful electric lines.
Mr. Ouellette noted these building look similar to the buildings in Forester Square.
Mr. Steuer explained his project is less dense than Forester Square and the buildings will have a lesser profile.
Mr. Ouellette opened the public hearing at 7:29 p.m.
Brian Aderholdt, 217 S. Grey Road, four houses from this proposed project, asked who will maintain the premises and will sheds and similar outside buildings be allowed.
Mr. Ouellette explained the condo association will be responsible for maintaining the lawn as well as snow removal. Also, there will not be any outside structures allowed, beyond what is on the site plan.
Mr. Aderholdt questioned where the snow will be piled and what the distance is from the road to the garage, the area is quite small.
Mr. Steuer stated that had been taken into consideration, and there is ample space to pile the snow. The distance from the road to the garage is 33 feet.
Mr. Aderholdt noted with the growth, including the 96 unit apartment building, and morning and evening school traffic, Primary Street has become a thoroughfare with fast moving traffic.
Mr. Cohen stated Mr. Steuer will be building the pavilion and gifting it to the City, so the City will maintain the pavilion.
Mr. Aderholdt was pleased to hear the City will maintain the pavilion, noting what a good maintenance job the City currently does.
Karen Wood, 85 S. Grey Road, asked if these building will be taller than the parking structure.
Mr. Cohen explained the midpoint of the roof will be a foot taller than the parking structure.
Ms. Wood stated building sizes are expected to decrease in size when entering a neighborhood, not increase in height. She isn’t sure who will use the pavilion or the purpose of it; and asking if a gathering of people there a good thing or a bad thing. It seems the number of the buildings is excessive for such a small site. She also questioned the need for more rental space; she understood this proposed project was going to be owner occupied.
There have been many changes over the years, and she is okay with that; however, there has also been an increase in traffic in the neighborhood.

Planning Commission – September 18, 2014
Page 3 of 4
Sue Gore, 370 Slocum, she too, is concerned for the neighborhood. She isn’t concerned with the appearance of the buildings, but their location, encroaching into her neighborhood. She recalls a neighborhood of homes that was demolished to make way for Forester Square; a project that hasn’t been finished. She asked with all the Forester Square area that has yet to be developed, why this project has to be constructed on such a small piece of land, and is yet again in another neighborhood.
Mr. Ouellette stated Forester Square is in the process of building out and should be completed within the next two to three years.
Paul McHugh, 242 Grey Road, is concerned with the safety of the children in the area and the traffic situation. The additional traffic from the 96 unit apartment building, and an addition 18 units will certainly increase traffic on Grey Road. There are no stop signs on Grey Road, and is curious if there will be additional police patrolling of the street. He is also concerned with the trees that must be removed for the buildings.
Mr. Steuer stated there is a tree replacement plan that has been submitted to the City, which exceeds the requirements.
Mr. Cohen explained it is a tree-for-tree requirement, but Mr. Steuer will be planting two trees for every one removed; 25 trees as opposed to the required 13 trees. The City planted eight or so trees along the trail, which will be relocated to another site. Mr. Cohen explained though there may be more than 13 trees currently on the site, the City has an ordinance that regulates trees, and the regulated trees will be replaced. Many of the trees on the site are considered junk trees, as determined by arborists, and do not require replacement.
Mr. McHugh asked the time frame of complete occupancy of the new construction, noting the current 96 unit building appears to be 80% empty.
Mr. Tanghe explained with Forester Square, there were 48 single family lots the City acquired along with 6.3 acres, which is planned to have 27 single family homes constructed; an additional 23 acres that will include 148 stacked flats and townhouses; and 160 units of congregate care, independent living for seniors. Some of the infrastructure will begin this fall, with construction beginning in the spring.
The 97 unit downtown apartment building, is 95% occupied. In July there were only six units vacant, and those were in the process of being rented.
Mr. McHugh’s was curious if this new apartment building will increase or decrease the residential home values.
Mr. Ouellette noted the homeowners will do well.
Mr. McHugh’s also mentioned the construction of the retail/lofts project, noting downtown needs more businesses, but there is a commercial building that has been vacant for a number of years.
Mr. Ouellette agreed with the frustration of vacant buildings. He explained Mr. Tanghe has been very involved in the evolution of the downtown, and there will be a number of changes over the next few years.
Mr. Tanghe explained people must come before businesses; businesses will not come to the downtown with hopes of people coming someday, the businesses wouldn’t be able to survive. The City’s focus is on residential density to support what is currently downtown and what is yet to come.
The development at the southwest corner of Auburn and Squirrel Roads had a greater amount of retail space in the early planning stages, but that has been pared down to 1700 sq. ft. of retail, 31 rental units were originally planned, the approved plan has 45 units. The retail space size was reduced so there won’t be a lot of vacant store fronts.
The vacant two story building became a victim of the economy, but at one time was 80% to 85% occupied. The owner of the building is an investor from New York, who purchased the building, sight unseen; Pepsi had occupied the building and had a long-term lease. Pepsi moved out of the building, but because they had a lease, they had to continue paying the rent. The owner had no reason to try to lease the building, because he was continuing to receive rent money from Pepsi. That lease has since run out and as recently as this week, a lease has is currently be negotiated for the entire upper floor.
Mr. Tanghe stated it will be a professional office use.
Mr. McHugh asked what the future intentions are downtown, once all the building are occupied, both residential and commercial. Will the development continue to expand further down the street?
Mr. Tanghe explained there are plans for future opportunities along Auburn Road and develop a larger downtown; there is not any intent of going into the neighborhoods for expansion and becoming a larger city like Rochester. This is a very long term process. Future development is focused on expanding north and east, the old Mound Steel and Superior Concrete, which the City acquired. The City is seeking redevelopment opportunities, which will continue east and connect with a new boulevard that will extend to Adams Road.
Sheila Fleishans, 56 Rosetta Court, calculated approximately 322 cars will be generated through the downtown rental units, and believes is too large of increase of vehicles for such a small area. All of the side roads in the neighborhoods will be used to by-pass all the congestion on Auburn Road. She noted there is a large area of land near Forester Square that could be developed and those vehicles would have easy access to the expressways and Adams Road. She asked what will happen when the new apartments aren’t being occupied because of the price, will the rent drop until there are tenants.

Planning Commission – September 18, 2014
Page 4 of 4
With the additional people there will also be additional crime and more violence, she believes the downtown should remain as is.
Tammy Williams, 106 Cherryland, she concurs with the traffic statements made by others, noting the street size will not accommodate the additional traffic. She isn’t happy having two tall building on either side, she doesn’t believe there will be many people willing to live under the power lines, the rent price is high, and the mature trees that will be removed will be replaced with saplings.
Mr. Ouellette stated the trees will be two to three inch diameter replacement trees.
Ms. Williams doesn’t believe that is reasonable.
Mr. Cohen stated City ordinances must be and will be followed; including the required size replacement trees. The evergreen trees will be eight feet tall and two and one-half inch diameter deciduous trees will be planted; the common standard in the State.
Ms. Williams is concerned, noting the City has declared the site is odd, small and a difficult space, and yet a three or four structures can be constructed on such a site.
Mr. Aderholdt noted all the promises made to the area residents when the parking garage and large apartment complex was being discussed of all the retail space coming. As of now, the only new business is a hookah lounge; and the promise of more retail is unfulfilled. He understands the high-end apartment space for professionals, and commended the City for having so many great businesses in the City. He asked where the rental office will be for the units, assuming the office will be off-site.
Mr. Steuer noted that is correct, the Farmington Hills location will handle the rental. With a total of 18 residences, there isn’t a need to have an onsite manager. These will be more like private residences, no pool or clubhouse.
Mr. Aderholdt noted Grey Road used to go through, but was closed to keep traffic out of the residential area, but now, the City is changing course and encouraging traffic back into the neighborhood.
Addressing Mr. Aderholdt’s concern, Mr. Tanghe reiterated, it is tough to attract retail because there is not enough population density. Some of the proposed retail space has been used as office space, and probably will continue until a time when retail space makes more sense.
Hearing no more comments, Mr. Ouellette closed the public hearing at 8:05 p.m.
Mr. Beidoun noted there was quite a bit of time spent holding town hall meetings and meeting with residents on how to proceed developing downtown.
Mr. Cohen stated it is the goal of the City to maintain the core area and grow the residential out, heading eastward. There was a study conducted a few years ago, helping to determine how to proceed with the downtown. With traffic counts being very low, national retail businesses will not invest themselves downtown; there will be mom & pop type businesses and with increased population density other retailers may choose to locate downtown.
Mr. Cohen agrees people will continue to shop at Great Lakes Crossing, Wal-Mart, Meijer, and Kroger. People like a sense of belonging, a traditional downtown within walking distance of a coffee shop or an ice cream shop.
There are 50,000 people that work in the Squirrel Road corridor; 14,000 at Chrysler as well as students from Oakland University and Oakland Community College that are looking for someplace to go to lunch. The hope is residents will sustain
the downtown businesses, but there will also be a great number of daytime users. This has been the vision for a downtown for 30 years; it is a very slow process.
Moved by Mr. Pierce to recommend to City Council approval of combine PUD Step One – Qualification/Step Two – Site Plan and Tree Removal Permit for the Primary Place PUD, subject to staff and consultants’ conditions.
Mr. Pierce is appreciative of the green building items that are anticipated for this project.
Supported by Mr. Beidoun.
Ms. Mitchell thanked the residents for their input. She noted smart growth is wanted for Auburn Hills and agrees to maintain the integrity of the current neighborhoods. Downtowns are very high density areas, and with continued growth, traffic studies will need to be conducted on how to move vehicles as well as pedestrians safely. She hopes the residents will continue to come and speak about issues and concerns.
Mr. Hitchcock thanked the residents for attending the meeting and voicing their concerns, noting how well the process works.
Ms. Shearer stated this is her neighborhood and her street, and though she has some reservations, she trusts the City will take action if problems arise. She agrees with the other Commissioner that the City must be progressive and will vote to approve the recommendation to City Council.
VOTE: Yes: Beidoun, Hitchcock, Justice, Mendieta, Mitchell, Ouellette, Pierce, Shearer No: None Motion Carried (8-0)


MEETING DATE: OCTOBER 4, 2021 AGENDA ITEM NO. 9B
FINANCE/TREASURER
To: Mayor and City Council
From: Thomas A. Tanghe, City Manager; Michelle Schulz, Finance Director/Treasurer
Submitted: September 29, 2021
Subject: Motion – Adopt the 2022 Budget and Millage Rates
INTRODUCTION AND HISTORY
The City’s proposed 2022 fiscal year budget is attached for your review. The enclosed budget includes the expected revenues, operating expenditures, and capital outlays for each fund. In addition, the budget includes the planned tax millage for the 2021 tax year which provides tax revenues to support the 2022 Budget. Tax Millage The proposed millage of 12.0702 (12.7726 including the Library’s current dedicated millage of .7024) is unchanged from the prior year. Two components of the city’s millage, that remained the same for 25 years, were subject to a Headlee rollback in 2020 and includes 2.1049 mills (rolled back from 2.11 mills) for City operations and 5.9713 (rolled back from 5.9857 mills) for Police. The Fire millage increased in 2016 from 1.7604 mills to 2.5 mills as a result of a successful Headlee override election, was rolled back to 2.4940 mills. The City’s and the Library’s millage rates and the resulting tax revenues collected are used entirely to support the operations of the City and Library respectively. There are no debt millages for either entity. The Library’s millage is subject to change with the November 2021 election. The Auburn Hills Library is proposing 1 mill. The Library is a separate entity from the City. Thus, the Library budget is not approved by City Council. 2022 Budget Overview The City’s total revenue expectations for the 2022 budget is $68.7 million. Total expenditures for the 2022 budget are set at $76.7 million. The General Fund and the Water/Sewer Fund account for 68.7% of total expenditures. The General Fund is the largest fund of the City budget accounting for 46.7% of total expenditures. The General Fund expenditure budget net of revenues for 2022 would utilize $1.3 million of reserves as compared to $236,000 anticipated for 2021. The use of an additional $1 million in fund balance is primarily due to $1.3 million more in debt service transfers due to the 2021 bond issuance which supports over $13.5 million in road and infrastructure projects that began in 2021 and will end in 2023. The operating millage of the City has supported General Fund revenue which include police, fire, and road operations. Anticipated 2022 property tax revenues from the police millage and fire millage are budgeted at $10.3 million and $4.3 million respectively. Road millage tax revenue is budgeted at $2.6 million. Each of these revenue components need to be supported with additional revenues to address related expenditures for each operation. The remaining general fund departments’ operating budgets, including the services of seniors, recreation, facilities, administration, parks, grounds, and technology are supported with $3.6 million in generated property

Page 2 tax revenue captured from 2.1049 mills. Property Tax Revenue in total provides for approximately 59% of total General Fund expenditures. Thus, the City does rely on a number of other revenue sources for its operations. As the City’s growth continues to move closer to capacity for new developments, overall tax revenues will continue to be tempered by personal property tax losses. While reimbursement from the State is anticipated for these losses, the city expects a 10% decline in that funding each year going forward. These reimbursements currently provide support to all areas of the General fund. The General fund reimbursement in 2022 is estimated to be $1.5 million declining to $1.2 million in 2026 and phasing out by 2029. The second largest fund of the City budget, the Water/Sewer Fund, accounts for 22% of the total City expenditures. This fund maintains the infrastructures providing these utilities to the community. From 2022 to 2026, $14.4 million of capital improvements and required debt payments passed on from utility‐related County projects is expected from this fund. Its budget, primarily dependent on the service charge revenue from delivery of water and sewage treatment, includes no increases in water rates, a 1% increase in 2022 sewer rates, as well as a reduction in the irrigation rate. Collaborating with other municipalities through the North Oakland County Water Authority allows the City to continue to pass on its savings in costs and keep its water rates stable. Just as critical to mitigating rate increases to customers, is staff’s careful planning and management of resources keeping the fund’s reserve level sufficient to not only help absorb rate increases from suppliers but to react to emergencies and provide for regular preventative maintenance in lieu of premature rehabilitations. The community, barring any unplanned emergent infrastructure issues or extraordinary passed on costs, should enjoy stable utility rates in near future year projections. While the City appropriates 32% of resources to wages and benefits, the largest expense, it is also projecting to invest 24% of its resources to capital related projects. Of the $16.2 million of capital purchases budgeted, 47% is related to road reconstructions while 22% is for related general fund improvements including $2.7 million for the City’s Fire and Police building infrastructures. The City also invests heavily in preventative maintenance. Of the $4.4 million earmarked for such maintenance, about 29% is specifically supporting roads. Concluding Remarks The 2022 budget reflects “back to normal” operations. Utilizing the low borrowing rates of 2021, the City is moving ahead with many needed projects that were postponed or delayed due to the uncertainty of the 2021 budget year. Staff developed a 2022 budget and projections which are realistic, comprehensive, and conservative. Besides considering normal budgetary concerns such as addressing rising routine operating expenditures, legacy costs funding, and employee retention and attraction, financial attention was given to water/sewer infrastructure, general City equipment, emergency vehicles, City amenities, and City programs. Upon approval of the 2022 proposed budget, staff will have the necessary designated resources to continue to provide for and maintain the distinctive infrastructure and service that define the City of Auburn Hills’ reputation for excellence. The City of Auburn Hills has a remarkable history of withstanding past market declines, unfunded mandates, and economical and environmental changes of its unique community. For these reasons, the City of Auburn Hills budget allows the City to navigate any future unknowns of the next year, while still being progressive and successful in meeting the goals and objectives of its community.
STAFF RECOMMENDATION

Page 3 The staff recommends acceptance of the 2022 Budget as submitted for the City of Auburn Hills. The staff also recommends approval of the proposed millages for the City and the Library for the 2021 tax year as contained in the budget document
MOTION
Move to accept and adopt the proposed 2022 budget for the City and to approve the proposed millage rates for the City and Library for the 2021 tax year.
I CONCUR:
__________________________________________
THOMAS A. TANGHE, CITY MANAGER

CITY OF AUBURN HILLS
2022 PROPOSED BUDGET

2
2022-2026 Assumptions:
2022-2026 reflect increases over 2% in
Property Tax Revenues $21.6 Million 2022
$6.8M Declining PPT Reimbursement$1.2M General
$889K Road$3.3M Police$1.4M Fire
$32.5M in road, pathway, sidewalk and bridge related
maintenance and improvements
Act 51 funding 5yr projection
$15.8M
2022 SAD revenue for Corporate
2026 SAD revenue for Pond Run, Cross Creek,
Valley View, High Meadow
Anticipate Prepayments of
assigned sewer debts for Clinton River
$920KEvergreen Farmington
$334K
2021 Bond Issue road uses$6,313,750 in road related
bond projects in 2022$12,562,4002021-2023
$13.5M Road millage 2022-2026 utilized
100%
1% Sewer Increase each year
No Water Increase projected through
2026
Investment in Fire Stations& Public Safety Building
Infrastructure$2.7M

General Fund46.7% of Total City
Expenditures
Water/Sewer Fund21.9% of Total
City Expenditures
TOTAL CITY AT - A - GLANCE2022 PROPOSED PROPOSED PROPOSED APPROPRIATIONBUDGET REVENUES EXPENDITURES OF FUND EQUITY
General 34,498,392$ 35,832,233$ (1,333,841)$ Major Streets 3,065,275 3,320,542 (255,267) Local Streets 1,606,818 1,605,484 1,334 Wayne Disposal-Oakland 190,000 147,355 42,645 Tree Ordinance - 60,470 (60,470) METRO Act 80,000 90,020 (10,020) Police Drug Forfeiture 31,000 20 30,980 Economic Development - - - CDBG Grant 83,086 83,086 - Capital Improvement Debt 1,863,500 1,863,400 100 Capital Projects Fund - 6,313,750 (6,313,750) Fieldstone Golf Club 1,656,504 1,612,342 44,162 Water/Sewer 18,236,325 16,865,723 1,370,602 Fleet Management 2,846,151 2,270,643 575,508 Special Assessment Debt 163,584 194,375 (30,791) Total Before Component Units 64,320,635$ 70,259,443$ (5,938,808)$
DDA 358,664$ 294,871$ 63,793$ TIFA 85-A 1,411,000 2,374,999 (963,999) TIFA 85-B 1,516,933 1,873,831 (356,898) TIFA 86-D 875,978 785,961 90,017 Brownfield Authority 200,950 1,107,727 (906,777)
Grand Total 68,684,160$ 76,696,832$ (8,012,672)$


FUND DESCRIPTION Salaries & Fringe Contractual Repair & Other Interfund Chg. Capital DPW & Cost of Computer Debt Water & Transfers Total byWages Benefits Supplies Services Utilities Maintenance Expenses Expense Insurance Expenditures Admin Charges Goods Sold Services Service Sewage Costs Out Fund
101 GENERAL FUND 12,976,422$ 5,464,810$ 1,098,025$ 2,379,990$ 538,201$ 1,607,911$ 979,182$ 1,577,811$ 224,139$ 3,610,420$ 472,792$ 68,129$ 4,834,400$ 35,832,233$ 202 MAJOR ROADS 311,437 224,138 144,900 20,000 555,820 4,715 504,106 15,440 1,450,000 89,986 3,320,542 203 LOCAL ROADS 193,862 182,229 46,500 5,000 93,000 3,085 502,519 14,303 475,000 89,986 1,605,484 233 METRO ACT 40,000 50,000 - 20 90,020 227 WAYNE DISPOSAL 15,000 32,355 100,000 147,355 230 TREE ORDINANCE 60,000 470 60,470 244 ECONOMIC DEVELOPMENT - - - 248 DDA 27,898 2,304 2,600 4,000 47,000 96,150 7,149 64,726 43,044 294,871 251 TIFA A - - 2,250 773,200 147,722 788,753 44,930 60,405 4,531 530,000 23,208 2,374,999 252 TIFA B 100,000 6,600 164,000 25,250 53,785 1,510,000 14,196 1,873,831 253 TIFA D - 72,500 297,800 2,700 10,376 386,000 16,585 785,961 256 BROWNFIELD AUTHORITY 983,760 3,050 22,320 43,783 54,814 1,107,727 262 DRUG FORFEITURE-FEDERAL - 265 DRUG FORFEITURE -STATE - 20 20 273 CDBG 83,086 83,086 350 CAPITAL IMPROVEMENT DEBT 1,863,400 1,863,400 401 CAPITAL PROJECTS 615,000 5,698,750 6,313,750 584 FIELDSTONE GOLF 264,409 58,552 27,050 577,978 60,479 40,700 48,178 65,819 15,450 306,500 15,977 81,250 50,000 1,612,342 592 SEWER/WATER 707,241 444,040 321,920 47,000 38,700 42,200 61,850 1,397,615 28,036 1,185,000 1,283,103 93,100 1,805,243 9,410,675 16,865,723 661 FLEET 193,935 96,528 441,900 128,500 45,500 4,330 73,375 51,092 1,062,000 173,483 2,270,643 852 SPECIAL ASSESSMENT DEBT 194,375 194,375
TOTALS 14,675,204$ 6,472,601$ 2,085,145$ 5,074,428$ 914,202$ 4,357,684$ 1,389,371$ 4,275,280$ 352,991$ 16,213,670$ 1,815,033$ 81,250$ 565,892$ 4,029,005$ 9,410,675$ 4,984,400$ 76,696,832$
TOTAL EXPENDITURES LESS INTERFUND CHARGES AND TRANSFERS 65,622,119$ Interfund and transfers include $1,446,000 Retiree Trust Transfers 11,074,713$
2022 TOTAL CITY APPROPRIATIONS
BY FUND AND EXPENDITURE CLASSIFICATION
Primary drivers of 2022 appropriations are Wages, Capital Purchases, and the costs of Water and Sewer Treatments


FUND DESCRIPTION Property Licenses State & Fed State Shared Special Charges for Other Investment Admin Transfers Total byTaxes & Permits Grants & Highway Assess. Services Revenue Income Interfund from Funds Fund
101 GENERAL FUND 21,634,130$ 914,400$ 1,872,702$ 3,602,456$ 220,741$ 1,975,155$ 1,054,793$ 44,945$ 3,129,070$ 50,000$ 34,498,392$ 202 MAJOR ROADS 2,314,153 51,122 700,000 3,065,275 203 LOCAL ROADS 680,813 1,000 5 925,000 1,606,818 227 WAYNE DISPOSAL 190,000 190,000 230 TREE ORDINANCE - 233 METRO ACT 80,000 80,000 243 BROWNFIELD AUTHORITY 187,951 12,999 200,950 248 DDA 338,664 20,000 358,664 251 TIFA A 1,078,733 272,189 500 55,578 4,000 1,411,000 252 TIFA B 1,473,888 40,574 2,471 1,516,933 253 TIFA D 875,228 750 875,978 262 DRUG FORFEITURE-FEDERAL - 265 DRUG FORFEITURE -STATE 31,000 31,000 273 CDBG 83,086 83,086 350 CAPITAL IMPROVEMENT DEBT 100 1,863,400 1,863,500 401 CAPITAL PROJECTS - 584 FIELDSTONE GOLF 1,604,004 52,500 1,656,504 592 SEWER/WATER 16,825,540 1,271,000 24,000 115,785 18,236,325 601 RETIREE HEALTH CARE 0 - 661 FLEET 155 2,845,996 2,846,151 852 SPECIAL ASSESSMENT DEBT 163,434 150 163,584
TOTALS 24,713,366$ 914,400$ 2,247,977$ 7,565,649$ 384,175$ 20,595,949$ 2,557,567$ 75,826$ 6,090,851$ 3,538,400$ 68,684,160$
TOTAL REVENUES LESS INTERNAL ADMIN/INTERFUND CHARGES AND TRANSFERS 59,054,909$
2022 TOTAL CITY REVENUES BY FUND AND REVENUE CLASSIFICATION
72%


Millage Revenues 58% of GF Expense

The Water and Sewer Fund is the City’s 2ND largest fund.Reserves maintained are critical for ongoing maintenance, emergencies, project costs assigned to the City by the County, and most importantly minimizes the likelihood of long-term service interruptions


The 2022 budget is a responsible fiscal plan addressing the financial needs and resources of the upcoming year.
With City Council’s approval, the budget has the flexibility for amendments so the City may reacts to unexpected changes or take advantage of costs savings by bundling out year projects
The budget is a critical stewardship tool to ensure funds are optimized to support City Council’s 2022 goals.
The 2022 budget document includes future estimates through the year 2026.
These projections are considered with the same importance of the 2022 budget and afford the Mayor and City Council the opportunity to proactively plan well ahead for the City’s financial future.


2022 Proposed Budget

2022 BUDGET - 5 YEAR PROJECTIONS
Tab Page1 BUDGET MESSAGE i-ix
2 SUMMARY INFORMATIONMission, Vision, Value Statement 1Organizational Chart 2Elected Officials 3Administrative Staff 4Fund and Department Numbers 5Community Profile 6-10
Millage RatesMillage Rates & Tax Disbursement Summary 2013 - 2021 11Graph - General Fund Tax Disbursements 2013-2026 12Graph - Millage Rate Comparison of Oakland County Municipalities 2020 13Graph - Property Tax Revenue Projections 142021 Tax Rate Request - Form L-4029 15
Fund Balances2021 Amended 2022 Original Revenue, Expense, and Fund Balance Summary 16
Total Revenues and Expenses2022 Total City Revenues by Fund & Revenue Classification 17Graph - 2022 Total Budget Revenues by Account Classification 182022 Total City Expenditures by Fund & Expenditure Classification 19Graph - 2022 Total Budget Expenditures by Account Classification 202022 Budget and Five Year Projections - All Funds Summary 21Budget Assumptions 22
3 GENERAL FUND General Fund - Fund Balance 2020 - 2026 23General Fund Summary - Revenues & Expenses by Classification 2020 - 2026 24Graph - General Fund 2020 - 2026 Budget Revenues Comparison 25Graph - General Fund 2022 Budget Expenditures by Function 26General Fund - General Operating Revenue & Expenses 2020 - 2026 27General Fund Administrative Department Expenses and Personnel 2020 - 2026 28-31
GENERAL FUND - ADMINISTRATIONCity Council 28City Manager 28City Clerk 28Treasurer/Finance 29Assessing 29General Administration 29Human Resources 30DPW Management Services 30Pension RHC Board 30General Fund Administrative Personnel 31
261270441272
101
101172215253257
Table of Contents

2022 BUDGET - 5 YEAR PROJECTIONS
Tab Page3 GENERAL FUND - INFRASTRUCTURE AND CAPITAL OUTLAYS
Storm Water Management 32Street Improvement 32Capital Improvements 32Infrastructure Personnel 32
GENERAL FUND - GENERAL SUPPORTFacilities 33Parks and Grounds 33Information Services 33General Support Personnel 34
GENERAL FUND - COMMUNITY PROGRAMSSeniors 35Smart Grant 35Recreation 35Parks 36Community Program Personnel 36
GENERAL FUND - PLANNING/DEVELOPMENTBuilding 37Community Development 37Planning/Development Personnel 37
GENERAL FUND - POLICE DEPARTMENTPolice Deparment Revenue & Expense Summary 38Police Patrol 39Police Administration 39Police Deparment Personnel 40Graph - Police Revenues & Expenditures 2021-2026 41
GENERAL FUND - FIRE DEPARTMENTFire Department Revenue & Expense Summary 42Fire Administration 42Fire Suppression 43Fire Prevention 43Fire Department Personnel 44Graph - Fire Revenues & Expenditures 2021-2026 45
4 GOVERNMENTAL FUNDSMajor & Local Streets Revenues, Expenses, & Fund Balance 2020-2026 46Graph - Major and Local Roads 2020-2026 47Major Streets Revenues, Expenses, Fund Balance, and Personnel 2020-2026 48Local Street Fund Revenues, Expenses, Fund Balance, and Personnel 2020-2026 49Metro Act Fund 50Wayne Disposal Oakland Fund 50Tree Ordinance Fund 51CDBG Grant Fund 51Police Drug Forfeiture Fund (Federal) 52Police Drug Forfeiture Fund (State) 52Capital Improvement Debt Service Fund 53Capital Projects Fund 53Special Assessment Debt Fund 53
266228
685
265
446
686755
339341
371703
301305
770
537
901
Table of Contents
230273262265350
202203233227
336
401852

2022 BUDGET - 5 YEAR PROJECTIONS
Tab Page5 INTERNAL SERVICE FUNDS
Retiree Health Care 54Fleet Management Revenues, Expenses, Net Position, and Personnal 2020-2026 55Graph - Fleet Revenues and Expenditures 2021-2026 56
6 COMPONENT UNIT FUNDSTIFA - 85A Fund 57TIFA - 85B Fund 57TIFA - 86D Fund 58Downtown Development Authority 58Brownfield Authority Fund 59Economic Development Corporation Fund 59
7 ENTERPRISE FUNDSFieldstone Golf Fund Revenues, Expenses, Cash Balance, and Personnel 2020-2026 60Water and Sewer Fund - Revenues, Expenses, and Cash Balance 2020-2026 61Graph -Water & Sewer Revenues and Expenditures 2021-2026 62Sewer Department (535) Revenues, Expenses, and Personnel 2020-2026 63Graph - Sewer Department Revene, Expenses, and Net Cash Flow 2021-2026 64Water Department (536) Revenues, Expenses, and Personnel 2020-2026 65Graph - Water Department Revene, Expenses, and Net Cash Flow 2021-2026 66
SUPPLEMENTARY SCHEDULES8 Capital Improvement Detail 2021-2026 67-80
General Fund 67-71Major Roads 72Local Roads 73Capital Improvement Fund 74Fieldstone Golf Course 75Sewer Department 76Water Department 77TIFA A 78TIFA B 79TIFA D 80
9 Full-Time Personnel Summary 81-85
Part-Time Personnel Summary 86-88
10 Long-Term Debt Summary 89Debt Service Requirements by Debt Instrument 90-101
592
592
252253248243244
584592
661
251
601
Table of Contents

2022 BUDGET – 5 YEAR PROJECTIONS
i
September 24, 2021
Honorable Mayor Kevin McDaniel and Members of the Auburn Hills City Council 1827 North Squirrel Road Auburn Hills, MI 48326 Mayor McDaniel and Members of City Council:
In accordance with the City of Auburn Hills Charter, staff recommends City Council adopt the enclosed 2022 annual budget. Two workshops were held in September to review the budget. Throughout the year staff has been amending the 2021 budget to adjust for unexpected expenses, changes in operations, and material final expenditures that were not evident when the 2021 budget was set over a year ago. Utilizing the most recent data and the most current amended budget available to us, staff assessed the City’s needs for the 2022 calendar year. Considering changes in funding, development, staffing, and City Council’s goals and objectives, the 2022 budget was assembled. The workshops were held to allow City Council time with staff to review the 2021 proposed budget and future projections. Staff and City Council had in-depth dialogue about the City’s current fiscal health including the continued impact of the pandemic, the impact of the City’s new road millage and 2021 debt issue, anticipated infrastructure needs, and the general community well-being and amenities. These discussions helped to design the 2022 financial plan.
The 2022 budget document meets legal fiscal requirements upon approval by the City Council. The future budget plan projections for 2023 through 2026 are not required for approval. Utilizing the most current departmental capital requests and considering a variety of assumptions to reflect potential future revenues and expenditures, the full document is meant to provide details for stakeholders and other interested parties about the upcoming year’s financial activities, as well as a longer-term financial estimate which City Council can consider in current decision making. While the projections are fluid and will change with unknown items such as unfunded mandates, economic shifts, grant availability, and infrastructure failures, the future projections do consider current growth projections, bargaining contract language, and asset management plans concerning roads, water, and sewer, and immediate facility needs.
Property values continue to rise, but modestly due to the limits on taxable values set by the Headlee Amendment and Proposal A. As the City approaches the 2022 fiscal year, necessary infrastructure and operational needs continue to exceed the property tax revenues generated to support general operations exclusive of public safety and roads. The City has not requested an increase in the General Fund operating millage since 2005.

2022 BUDGET – 5 YEAR PROJECTIONS
ii
Road repairs and improvements required significant funds from the General Fund in
past years. On August 4, 2020, Auburn Hills residents passed a road millage of 1.5 mills. This new perpetual road millage provided for approximately $2.5 million in available funds to support 2021 road projects, thus allowing the City to utilize more of its general operating tax revenue for services, other than roads, and retain additional general operating funds in reserves. In 2022, $2.6 million is projected as road millage support. This revenue source is vital as the city begins to see reductions in other source revenues, especially in development and personal property tax reimbursement.
City Council also approved a Debt Issuance of $13.2 million in 2021. This allowed the
City to address a number of road projects in process and planned into 2023. It also provided some relief to the General Fund in order to address other critical infrastructure projects at the City’s grounds and buildings including HVAC and roof replacements.
The City of Auburn Hills remains in an enviable financial position compared to many
Michigan communities. Management prides itself on continued diligence to retain this distinction in future years. While many public and private entities still continue to navigate out of the chaos the Covid-19 Pandemic has caused nationally, the City is and has remained fully operational and engaged with its community. The City, with the support of City Council and ongoing dialogue with all stakeholders, is optimistic it will continue to proactively provide innovative services and address critical infrastructure and operational needs.
The City’s second largest fund, Water and Sewer, continues to remain funded at
adequate levels to protect the City’s costly infrastructure maintained within that fund. The City is recommending no change in its water rates, a 7% decrease in its irrigation rate and only a 1% increase in its sewer rates for 2022. The city continues to successfully collaborate with the North Oakland County Water Authority (NOCWA) for lower water costs, as well as to continue strategic improvements to its utility infrastructure to coincide with planned roadwork to create cost efficiencies.
The increase in the general sewer rate allows for the continued support of sewer services which is independent of water providers. Sewer revenues are used not only to reimburse the costs of sewer treatment, but also to meet annual debt obligations passed on, or anticipated to be passed on, to the city by other 3rd party entities and governmental agencies. The Oakland Macomb Interceptor Drain, for instance, has had continued work since 2010 and is managed through the County’s Water Resources Commission. The City of Auburn Hills is assigned a proportionate share of each of its related project’s financing from this multi-county drain system. At the end of 2021, the City has approximately $7.2 million in related sewer debt related to OMID and the Clinton River Water Resource Recovery Facility. The City’s 2021 and

2022 BUDGET – 5 YEAR PROJECTIONS
iii
2022 budget currently accommodates up to $2.2 Million in additional assigned debt before the end of 2022.
Staff continues to monitor changes in the Water and Sewer fund’s activity, next year’s costs, and debt responsibilities. Utilizing this data, rates are annually evaluated and adjusted accordingly, to ensure the funds continued flexibility to react quickly to any emergency, but more importantly maintain the water and sewer system to mitigate more costly, unplanned events.
2022 BUDGET OVERVIEW
The total approved budget (appropriations) for fiscal year 2022 for all funds, including component units, is $76,696,832. Overall, this represents about an $824,000 or 1.06% decrease from the current 2021 projected amended budget.
The decrease in expenditures, net of transfers between funds, is made up of a number of things. There has been changes in operations, a continued effort on operational cost containment, increased infrastructure spending utilizing debt, and modest staff increases. Notably, a decrease in required actuarial contributions to both the pension and retiree healthcare trust help to balance increases elsewhere. While contributions to the retiree trusts continue, the City has made a tremendous effort over past years to fund above the requirement and has been able to keep healthcare premiums contained. Because the trusts are appropriately funded, the City, beginning in 2022 will no longer pay retiree health care costs from this fund but directly from the trust. Thus, a decrease from 2021 to 2022 is seen in Internal Service funds.
APPROPRIATIONS 2020 2021 2022ACTIVITY AMENDED BUDGET
General Fund 38,679,195$ 34,203,294$ 35,832,233$ Major/Local Roads Fund 10,463,599 6,145,968 4,926,026 Capital Projects Fund 306,483 1,929,493 6,313,750 Other Non-Major Governmental Funds 549,816 354,028 380,951 Debt Service Funds 762,450 761,674 2,057,775 Internal Service Funds 5,525,517 6,926,532 2,270,643 Water/Sewer Fund 16,236,899 19,903,900 16,865,723 Fieldstone Golf Club Fund 675,780 1,545,088 1,612,342 Component Unit Funds 4,581,258 5,751,005 6,437,389
77,780,998$ 77,520,981$ 76,696,832$ Change from prior year -0.33% -1.06%

2022 BUDGET – 5 YEAR PROJECTIONS
iv
REVENUE COMPARISONS
The pie chart below shows the components of the 2022 Budget revenues (net of interfund transfers and allocations) for the total City. The dependence that the General Fund has on property tax revenues and the support of service charges necessary for the Water and Sewer fund is highlighted.
PROPERTY TAXES
Property Taxes comprise 42% of all 2022 budgeted revenue, excluding transfers of cash between funds and interfund charges for services (transfers are primarily from the General Fund to the Major/Local Roads Fund and Debt Service Funds. Interfund charges are for services spread by a proportionate share of departmental expenditures of one fund to another fund for which it serves). In 2022, property taxes reported in this budget are reported in the General Fund and the Component Units: Tax Increment Finance Authority (TIFA) Districts, Brownfield Redevelopment Authority (BRA), and Downtown Development Authority (DDA).

2022 BUDGET – 5 YEAR PROJECTIONS
v
Total property tax budgeted revenue for 2022 is $24.7 million, of which $21.6 million is planned for in the General Fund. General Fund property tax revenue is used to support the Police, Fire, Roads, and general operations of the City. General Fund property tax revenue will support approximately 58% of General Fund expenditures in 2022. Property tax revenues are intended to be the primary source of funding for the General Fund. General Fund net property tax revenues for 2020-2022 are shown in the table below:
The City’s Library millage, which must also be approved by the City’s governing body, also was reduced from .7041 mills to .7024 mills due to a Headlee reduction. It had not changed since 2003. The Library is seeking a millage increase to 1 mill on the November 2021 ballot. It is not, however, reflected in the previous table as it does not support the General Fund. The City’s previous debt millages for Street Paving and the Library building expansion expired in 2003 and 2004 respectively.
The City collects taxes for many governmental entities. Using the 2021 tax rates, the City retains 34 cents for each dollar collected, spread between general operating, fire, and police as shown below.
General FundOperating Millages 2021
(determine 2022 revenues)2020
ACTIVITY2021
PROJECTED2022
REQUESTEDCity Operational 2.1049 ( was 2.11 2005-2020) 4,299,044$ 4,362,967$ 4,490,829$ Police 5.9713 (was 5.9857 since 2003) 9,744,343 9,966,521 10,291,469Fire 2.4940 (was 2.5 since 2017) 4,012,924 4,159,607 4,283,956Road 1.5(since 2020) - 2,497,837 2,567,876
Total General Fund Property Tax Revenue 18,056,311$ 20,986,932$ 21,634,130$ % change from prior year 16.23% 3.08%

2022 BUDGET – 5 YEAR PROJECTIONS
vi
Where Do Homestead Dollars Go?
The City of Auburn Hills taxable value is heavily dependent on commercial and industrial business, estimated at 80% compared to 20% residential. The City’s General Fund allocation of the State’s personal property tax reimbursement for lost revenue is expected to be $1.7 million in 2021 and dropping to $1.5 million in 2022. While additional reimbursements are expected through 2029, current communications indicate that no further reimbursement will be available beyond that. The City has included $5.3M in cumulative reimbursements in the 2023-2026 projections.
CHARGES FOR SERVICES
Service Charge revenue anticipated for the City is $20.6 million in 2022, of which $16.8 million is attributable to estimated Water and Sewer usage fees. Water and Sewer Fund revenue is not directly used for general operations of the City and is limited to supporting the related infrastructure and operational costs of this particular unit. On January 1, 2022, service charge revenue projections for the use of City water and sewer include a 1.0% increase for Sewer billing rates and no change in Water billing rates. Future projections continue this plan with modest increases in Sewer only. Rates are determined by considering the impact of fees imposed on the City for the purchase of water and treatment of waste, as well as the overall budget necessary to maintain these services by the City to the Auburn Hills community. The
Education $0.47City General Fund
$0.34
Zoo,Huron ClintonMetro Parks,Art Institute, & OC Public
Trans. Authority$.06
City of Auburn Hills
Operating $0.06Fire $.07
Police $0.17Roads $.04
Total: $0.34Library$0.02
State of Michigan
Education Tax
$0.17
Avondale, Lake Orion, Pontiac, & Rochester
Schools (avg.)$0.17
Oakland CountyOperating
$0.11
Oakland CuntyIntermediateSchool District
$0.09
Oakland Community
College$0.04

2022 BUDGET – 5 YEAR PROJECTIONS
vii
fees collected are partially passed on to the agencies billing the City for water purchases and sewage treatment, which are expected to be $9.4 million or 56% of the fees charged. Capital infrastructure repairs and reconstructions and debt passed on to the City from the County are planned to absorb 10% of the fees in 2022 or $1.8 million. This does include the $2.2 million additional project costs anticipated to be passed on which the City anticipates prepaying as opposed to financing. The remaining fees, along with other cash revenue from maintenance and connections fees, capital and lateral fees, and interest, pay for routine operational costs and provide for reserves for future projects. The City responsibly maintains a deliberate unrestricted Water/Sewer net position to respond to emergency events, and to prepare for scheduled annual service and replacement of infrastructure, to ensure its ability to provide the best uninterrupted service possible, regardless of the state of the economy in any given year.
EXPENDITURES

2022 BUDGET – 5 YEAR PROJECTIONS
viii
The chart above identifies where funds are spent in the City. As typical with service organizations, wages and benefits is the largest cost of the City. The cost of purchasing water and sewer is also among the City’s largest expenses. As mentioned earlier, these costs are covered by utility billings for this service and not funded with City tax dollars. Capital expenditures is the second largest expense for fiscal year 2022. Of the total $16.2 million capital purchases planned, 47% is related to road reconstructions, while 22% is related to general fund improvements, including $2.7 million for the City’s Fire and Police building infrastructure. Fleet utilizes 6.6% for planned equipment and vehicle capital purchases. It is worth recognizing that of the $4.4 million accounted for in repair and maintenance expenses of the City, 29% represents preventative maintenance and repairs planned for in the road funds over and above the reconstructive improvements classified and included under capital. The General Fund is intended to be responsible for most of the City’s operational expenditures, including Police and Fire. Of the total 2022 City-wide appropriations of $76,696,832, 47% or $35,832,233 is reflected in the General Fund. The Water/Sewer Fund budget reflects 22% of total City budget or $16,865,723.
Wages and benefits account for 32% of total city expenses. This is approximately 10% lower than what the current 2021 amended budget reflects due in part to the City making both significant contributions over and above required contributions for the last several years to the pension and retiree health care trusts, and not relying on the trusts for current year benefits. Further, the City is anticipating a 6% decrease in dental premiums for 2022 as well. Despite lower wage and expenses, there are wage increases in the budget for 2022 for each employee group in keeping with the City’s goals of retaining and attracting quality employees.
Concluding Remarks
The 2022 budget reflects “back to normal” operations. Utilizing the low borrowing rates of 2021, the City is moving ahead with many needed projects that were postponed or delayed due the uncertainty going into the 2021 budget year.
Revenues from new developments halted in 2020 due to the Pandemic. While related revenue has shifted forward one year, projections still show a slowing of revenue growth as the City nears capacity. Further, while the personal property tax reimbursement is expected to continue for the short term, reimbursement is anticipated to stop in 2029. Thus, the City will continue to rely more heavily on its property tax revenues. The addition of the 2020 approved road millage and the issuance of the 2021 debt, has provided the ability to maintain healthy reserves at least through 2026.
Though the City is projecting a slightly improved fund balance over the next year or two, the 5-year projection still warrants prioritization to avoid prematurely utilizing or committing

2022 BUDGET – 5 YEAR PROJECTIONS
ix
resources. Looking out to 2026, we see road infrastructure plans begin to draw more heavily again on the general fund. Strategically planning road improvements with water and sewer upgrades, delaying improvements to correspond with potential federal or state funding, developing new programs or services based on demand are just a few ways staff continues to extend resources without waste. The City must continue to make the employment of qualified and committed staff a priority. While a continued challenge, even more so as the Pandemic wanes, it is essential to maintaining service excellence across departments. The 2022 budget continues to provide for training and leadership development of existing staff and seeks to be competitive with wages and benefits.
Under the guidance of the 2022 financial plan, ongoing resident support, and continued growth of business partnerships, the City will enjoy the continued ability to maintain the distinctive infrastructure and services that define the City of Auburn Hills’ reputation for excellence. Thank you, Mayor McDaniel and City Council, for your support of our budget.
Sincerely,
Thomas A. Tanghe Michelle Schulz City Manager Finance Director/Treasurer

2022 Budget
1

CITY OF AUBURN HILLS, MICHIGAN ORGANIZATIONAL CHART
CITIZENS OF AUBURN HILLS
COMMITTEES, COMMISSIONS
+BOARDS
Community Relations Business Development
Reception
Utilities Fleet Operations
Roads Municipal Properties
Engineering
Economic Development Building Inspection Code Enforcement Planning + Zoning
Engineering
Payroll, Budget Investments
Accounts Payable Accounts Receivable
Tax Administration
2

2022 BUDGET - 5 YEAR PROJECTIONS
CITY COUNCIL
John Burmeister, Mayor Pro-Tem
Henry V. Knight
Eugene Hawkins
Kevin McDaniel, Mayor
Robert Kittle
Brian Marzolf
Cheryl Verbeke
3

2022 BUDGET - 5 YEAR PROJECTIONS
CITY MANAGER Thomas A. Tanghe
ASSISTANT CITY MANAGER Donald K. Grice
DIRECTOR OF SENIOR SERVICES Karen Adcock
POLICE CHIEF Jeffrey Baker
CITY ATTORNEY Derk W. Beckerleg
DIRECTOR OF COMMUNITY DEVELOPMENT Steven Cohen
CITY ASSESSOR William Griffin
DIRECTOR OF FIELDSTONE GOLF COURSE Chip Hierlihy
DIRECTOR OF RECREATION Sage Hegdal
DIRECTOR OF PUBLIC WORKS Ronald J. Melchert
CITY CLERK Laura Pierce
CITY TREASURER/FINANCE DIRECTOR Michelle Schulz
FIRE CHIEF Ellen Taylor
ADMINISTRATIVE STAFF
4

2022 BUDGET - 5 YEAR PROJECTION
Fund Dept Fund Description Fund Dept Fund Description
101 000 General Revenues 101 336 Fire Administration101 101 City Council 101 339 Suppression101 172 City Manager 101 341 Prevention101 215 City Clerk 101 371 Comm. Development - Building101 228 Information Services Department 101 441 DPS - Administration101 253 Finance/Treasurer 101 446 Street Improvement101 257 Assessor 101 537 Storm Water101 261 General Administration 101 685 Senior Citizen101 265 Facilities 101 686 Smart Grant101 266 Grounds 101 703 Comm. Development - Administration101 270 Human Resources 101 755 Recreation101 272 Pension Board 101 770 Parks101 301 Patrol & Investigations 101 901 Capital Improvements101 305 Police Administration & Tech Services
202 452 Major Streets 248 738 Downtown Development Authority203 453 Local Streets 251 735 TIFA A233 451 Metro Act 252 736 TIFA B227 526 Wayne Disposal-Oakland 253 737 TIFA D230 267 Tree Ordinance 243 740 Brownfield Authority262 313 Forfeitures - Federal 244 728 Econ Develop Corp265 314 Forfeitures - State273 694 CDBG Grant Fund266 309 Police Grants/Donations350 907 Capital Improvement Debt Service 584 753 Fieldstone Golf Club401 901 Capital Projects 592 535 Sewer Fund852 908 Special Assessment Debt Service 592 536 Water Fund
601 274 Retirees Health Benefits 703 Undistributed Taxes661 594 Fleet Management 731 Pension Trust Fund
737 Retiree Health Care Trust Fund
FUND/DEPARTMENT NUMBERS
Internal Service Funds
General Fund
Component Unit Funds:Governmental Funds
Enterprise Funds
Other Funds:
O:\All\2022 budget\Budget Book\Tab 2\22.Fund and Department Numbers
5

2022 BUDGET – 5 YEAR PROJECTIONS
The City of Auburn Hills, Michigan Community Profile The City of Auburn Hills is a proud and dynamic, 17.5 square mile community with a population of approximately 24,360 residents living in a broad array of housing that includes single-family neighborhoods in various price ranges, apartments, condominiums, townhomes, and manufactured housing communities. We are a relatively young city, having been incorporated in 1983 from the former Pontiac Township. Characterized by rolling terrain, beautiful natural resources including the Clinton River and thousands of Michigan hardwoods and evergreens, the community is committed to maintaining part of its rural character among its high-tech businesses. In addition, the City is home to numerous higher education institutions including Oakland University; and exploits its geographic location and the advantages of having the I-75 and M-59 transportation corridors running through the City, making it easy to access throughout southeast Michigan. The availability of large tracts of open land, along with a progressive tax abatement policy, has facilitated unprecedented development over the past 35 years. Auburn Hills has established a reputation for being a financially healthy and innovative community that is home to numerous world-class businesses, a growing center for higher education, and diverse, vibrant neighborhoods. Today, the City is recognized among other accolades, as an “Active Adult Community” and a “Community for a Lifetime” that embraces a high quality of life for all its residents and the workforce of its businesses, which is expected to support steady population growth and non-residential development for decades to come. The Major Building Blocks of Our Community: Global Business Auburn Hills is home to over 80 international corporations. They include many high-tech facilities with our largest employer being Stellantis, a property that represents over 10% of the City’s tax base. Great Lakes Crossing Outlets, Michigan’s second-largest regional shopping center and home to Bass Pro Shops Outdoor World, is one of our many valued retail assets.
Fiat Chrysler Automobiles
6
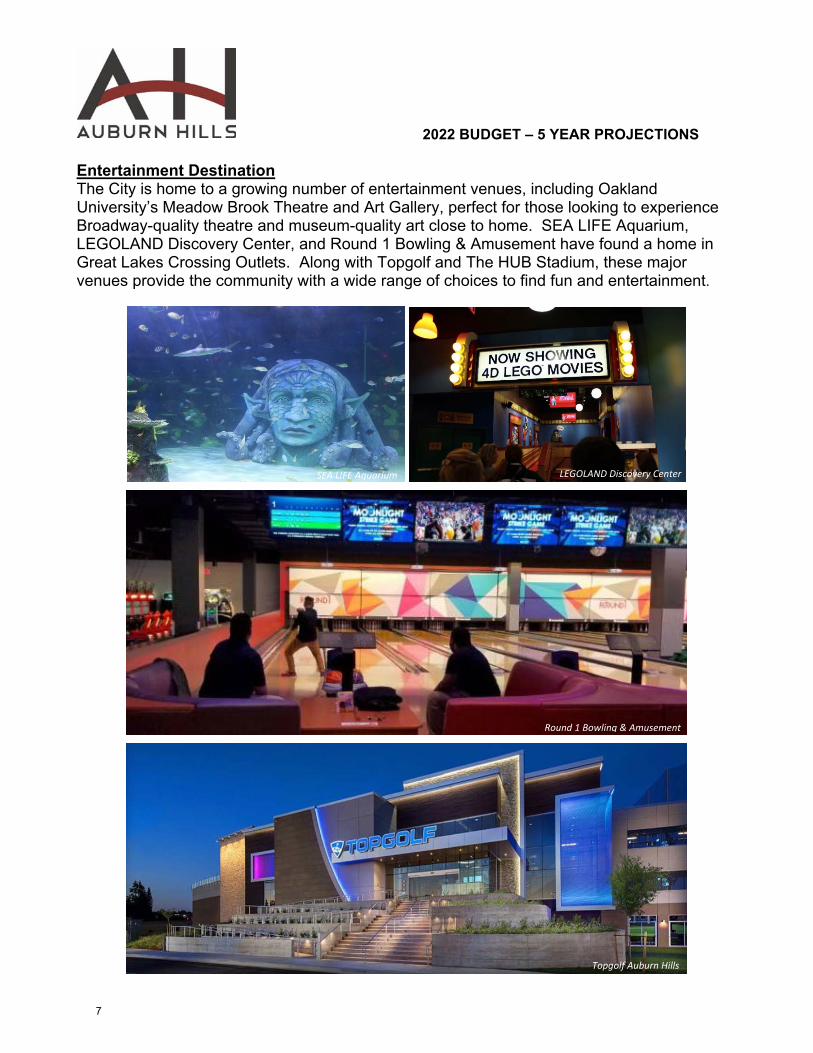
2022 BUDGET – 5 YEAR PROJECTIONS Entertainment Destination The City is home to a growing number of entertainment venues, including Oakland University’s Meadow Brook Theatre and Art Gallery, perfect for those looking to experience Broadway-quality theatre and museum-quality art close to home. SEA LIFE Aquarium, LEGOLAND Discovery Center, and Round 1 Bowling & Amusement have found a home in Great Lakes Crossing Outlets. Along with Topgolf and The HUB Stadium, these major venues provide the community with a wide range of choices to find fun and entertainment.
SEA LIFE Aquarium LEGOLAND Discovery Center
Round 1 Bowling & Amusement
Topgolf Auburn Hills
7

2022 BUDGET – 5 YEAR PROJECTIONS Center of Higher Education The City takes pride in hosting a growing number of institutions of higher learning, including Oakland University, Oakland Community College, Baker College, and the Oakland University-William Beaumont School of Medicine, which together attract over 30,000 students. Diverse Neighborhoods With the influx of growth and development, City leaders have worked hard to protect the community’s residential neighborhoods from the encroachment of non-residential development and the impact of increased traffic. We recognize that healthy, safe, attractive and diverse neighborhoods are essential to encourage a stable residential base. The strong desire to protect and invest in these areas is a core value in Auburn Hills. The City’s recent recognition as a “Community for a Lifetime” demonstrates its commitment to residents of all ages. Fostering a Sense of Community Providing a variety of social and community events is a priority for the City because they help provide a sense of place and of belonging – feelings that can translate into happy and healthy residents. Events like the Easter Egg Hunt, Halloween Spooktacular, and the Tree Lighting Ceremony bring families together during the holidays, while events like the Paddlepalooza, Fishing Derby, Summerfest, Friday Nights Downtown Music Series, and the Fall Festival in the Woods provide opportunities to enjoy the outdoors throughout the year. Downtown activities and outdoor events like the Childrens Music Series, Reels by the Riverside, and SeptemBEERfest, along with amenities like the Splash Pad and Knight Amphitheater, help foster the City’s continued growth.
Paddlepalooza Summerfest
Spooktacular Tree Lighting
8
2022 BUDGET – 5 YEAR PROJECTIONS Active Community The City takes great pride in its six parks and a wide range of award-winning recreational opportunities its residents and visitors can enjoy. Amenities include four major parks with a host of facilities; an Arthur Hills-designed championship golf course (Fieldstone Golf Club); a vibrant Community Center; a Nature Center that features a lodge and overnight campground (Hawk Woods Nature Center); a Skate Park, two neighborhood tot-lots, and a 2-mile section of the popular 16-mile Clinton River Trail. Several miles of sidewalks and pathways throughout the city help make Auburn Hills “walkable” by connecting neighborhoods to parks, schools, businesses, and shopping with up-to-date pedestrian facilities.
The City also offers a full line-up of year-round recreation programs that accommodate people of all ages and abilities. The facilities available to the community are designed to accommodate everyone and offer a wide variety of exceptional opportunities for recreation and leisure time enjoyment by residents and visitors alike. Together, these programs and recreational facilities combine to offer residents an array of opportunities to stay active and healthy. Environmentally Progressive Throughout the years, environmental sustainability, water quality, land stewardship, and the aesthetic appearance of our community have been hallmarks of Auburn Hills’ planning consciousness. Park-like roadways lined with trees, and walking and bike paths linking the community and numerous parks are all evidence of the City’s harmonious integration of planned development and natural resources. Knowing the important role trees play in maintaining the high quality of life of its community, Auburn Hills has one of the strongest tree preservation policies in Michigan and has been recognized as a Tree City USA by the Arbor Day Foundation for the last nineteen years. The community has a long-term strategic plan for a “River Walk” along the Clinton River that will link two major parks and enhance its downtown area as a destination for outdoor recreation. The Civic Center Campus, which includes the City’s Administrative Offices, Public Safety Building, Community Center, and Library, is architecturally consistent with its original historic buildings and illustrates the community’s interest in aesthetic appearance.
Hawk Woods Nature Center Lodge
9

2022 BUDGET – 5 YEAR PROJECTIONS
Strong Tax Base Tax records show that the Auburn Hills tax base is about 77% nonresidential taxpayer and 23% residential, which is uniquely the opposite of most municipalities. The revenue generated has allowed Auburn Hills to invest monies into its roads and infrastructure, municipal facilities, and neighborhoods. The City’s property tax structure has allowed the City Council to maintain one of the lowest city property tax rates in the County without compromising the quantity and quality of the services provided. Auburn Hills continues to nurture and implement its vision as a vibrant, diverse, and innovative community that offers a wide range of residential, business, academic, and development opportunities, while retaining its natural beauty and small-town charm.
10

2022 BUDGET - 5 YEAR PROJECTIONS
PROJECTEDTAX YEAR 2013 2014 2015 2016 2017 2018 2019 2020 2021
OPERATING MILLAGE:General 2.1100 2.1100 2.1100 2.1100 2.1100 2.1100 2.1100 2.1049 2.1049
Fire 1.7604 1.7604 1.7604 1.7604 2.5000 2.5000 2.5000 2.4940 2.4940
Police 5.9857 5.9857 5.9857 5.9857 5.9857 5.9857 5.9857 5.9713 5.9713
Roads 0.0000 0.0000 0.0000 0.0000 0.0000 0.0000 0.0000 1.5000 1.5000
Library 0.7041 0.7041 0.7041 0.7041 0.7041 0.7041 0.7041 0.7024 0.7024
Total Operating Millage 10.5602 10.5602 10.5602 10.5602 11.2998 11.2998 11.2998 12.7726 12.7726
Total City Millage 9.8561 9.8561 9.8561 9.8561 10.5957 10.5957 10.5957 12.0702 12.0702
(excludes Library)
General Fund Tax Disbursements 14,895 14,330 14,281 14,862 15,154 15,624 16,233 17,289 20,141($ in millions)
Change Over Prior Year 8.03% -3.79% -0.34% 4.07% 1.96% 3.10% 3.90% 6.51% 16.50%
MILLAGE RATES AND TAX DISBURSEMENT SUMMARY(LEVIED IN DECEMBER PRIOR TO BUDGET YEAR)
O:\All\2022 budget\Budget Book\Tab 2\22.Millage Rate and Tax Disbursement Summary with graph
11

202
2 B
UD
GE
T -
5 Y
EA
R P
RO
JEC
TIO
N
O:\
All\
2022
bud
get\
Bud
get
Boo
k\T
ab 2
\22.
Mill
age
Rat
e an
d T
ax D
isbu
rsem
ent
Sum
mar
y w
ith g
raph
$14,895
$14,330
$14,281
$14,862
$15,154
$15,624
$16,233
$17,289
$20,141
$20,719
$21,125
$21,574
$22,060
$‐
$5,000
$10,000
$15,000
$20,000
$25,000
2013
2014
2015
2016
2017
2018
2019
2020
2021
Amended
2022
Projected
2023
Projected
2024
Projected
2025
Projected
GEN
ERAL FU
ND TAX DISBURSEMEN
TS
2013‐2026
(in m
illio
ns)
12

202
2 B
UD
GE
T -
5 Y
EA
R P
RO
JEC
TIO
N
O:\
All\
2022
bud
get\
Bud
get
Boo
k\T
ab 2
\22.
OC
Tax
Rat
e C
ompa
rison
202
0
8.31899.9991
10.0003
10.4500
10.5376
10.551
10.975
12.7649
12.7726*
13.0201
14.18715.5931
16.5476
16.8143
17.0393
17.8496
18.0833
18.3307
18.532619.8275
19.8768
19.9902
20.9198
21.4525
23.733225.471
25.8301
26.264627.7923
34.5903
36.4856
05
10
15
20
25
30
35
40
Orchard Lake
Troy
Fenton
Lake Angelus
Novi
Rochester Hills
Bloomfield Hills
Rochester
Auburn Hills
Wixom
Birmingh
am
Kee
go Harbor
Berkley
Northville
South Lyo
n
Royal O
ak
Clarkston Village
Pontiac
Farmington Hills
Sylvan Lake
Farmington
Walled Lake
Lathrup Village
Pleasan
t Ridge
Clawson
Ferndale
Huntington W
oods
Mad
ison Heigh
ts
Southfield
Oak Park
Hazel Park
MILLA
GE RATE
2020 M
illage Rate Comparison
Oakland County M
uncipalities
13

2022
BU
DG
ET
- 5
YE
AR
PR
OJE
CT
ION
S
O:\
All\
2022
bud
get\
Bud
get
Boo
k\T
ab 2
\22.
Tax
Rev
enue
bro
ken
dow
n
OPER
ATING
OPER
ATING
OPER
ATING
OPER
ATING
OPER
ATING
OPER
ATING
OPER
ATING
POLICE
POLICE
POLICE
POLICE
POLICE
POLICE
POLICE
FIRE
FIRE
FIRE
FIRE
FIRE
FIRE
FIRE
ROAD
ROAD
ROAD
ROAD
ROAD
ROAD
ROAD
$-
$5
,000
,000
$10
,00
0,00
0
$15
,00
0,00
0
$20
,00
0,00
0
$25
,00
0,00
0
$30
,00
0,00
0
$35
,00
0,00
0
$40
,00
0,00
0
$45
,00
0,00
0
AC
TIV
ITY
AM
EN
DE
DB
UD
GE
TP
RO
JEC
TE
DP
RO
JEC
TE
DP
RO
JEC
TE
DP
RO
JEC
TE
D
2020
2021
2022
202
320
2420
252
026
PROPER
TY TAX REV
ENUE PROJECTIONS
COMPA
RISON W
ITH GEN
ERAL FU
ND EXPEN
DITURES
OPER
ATING
POLICE
FIRE
ROAD
TOTA
L GEN
ERAL FU
ND PROPER
TY TAX REV
ENUE
EXPEN
DITURES ‐ GEN
ERAL FU
ND ONLY
Gap
in revenues must be fille
d by other sources or
covered with reserved funds
14

202
2 B
UD
GE
T -
5 Y
EA
R P
RO
JEC
TIO
NS
Not
e: T
he li
brar
y m
illag
e is
pre
limin
ary
and
subj
ect
to c
hang
e co
ntin
gent
upo
n th
e re
sults
of
the
upco
min
g el
ectio
n.
15

2022 BUDGET - 5 YEAR PROJECTIONS
ChangeFUND 2021 2022 2021 2022 2021 2022 Inc/(Dec)
REVENUES DESCRIPTION AMENDED BUDGET AMENDED BUDGET AMENDED BUDGET101 GENERAL FUND G 33,967,615$ 34,498,392$ 34,203,294$ 35,832,233$ (235,679)$ (1,333,841)$ (1,098,162)$ 202 MAJOR ROADS G 4,094,715$ 3,065,275 3,927,523$ 3,320,542 167,193 (255,267) (422,460) 203 LOCAL ROADS G 1,373,932$ 1,606,818 2,218,445$ 1,605,484 (844,513) 1,334 845,847 233 METRO ACT G 74,960$ 80,000 47,805$ 90,020 27,155 (10,020) (37,175) 601 RETIREE HEALTH CARE 2,338,000$ 0 3,382,898$ 0 (1,044,898) - 1,044,898 227 WAYNE DISPOSAL G 203,825$ 190,000 188,200$ 147,355 15,625 42,645 27,020 230 TREE ORDINANCE G 19,382$ 0 45,555$ 60,470 (26,173) (60,470) (34,297) 244 ECONOMIC DEVELOPMENT -$ 0 -$ 0 - - - 248 DDA 233,347$ 358,664 191,339$ 294,871 42,008 63,793 21,785 251 TIFA A 1,960,041$ 1,411,000 1,785,732$ 2,374,999 174,309 (963,999) (1,138,308) 252 TIFA B 2,319,972$ 1,516,933 2,270,947$ 1,873,831 49,025 (356,898) (405,923) 253 TIFA D 775,696$ 875,978 1,042,793$ 785,961 (267,097) 90,017 357,114 243 BROWNFIELD AUTHORITY 371,195$ 200,950 460,194$ 1,107,727 (88,999) (906,777) (817,778) 262 DRUG FORFEITURE FEDERAL G -$ 0 -$ 0 - - - 265 DRUG FORFEITURE STATE G 41,000$ 31,000 3,500$ 20 37,500 30,980 (6,520) 273 CDBG G 70,968$ 83,086 68,968$ 83,086 2,000 - (2,000) 350 CAPITAL IMPROVE DEBT G 305,917$ 1,863,500 563,800$ 1,863,400 (257,883) 100 257,983 401 CAPITAL PROJECTS G 12,703,693$ 0 1,929,493$ 6,313,750 10,774,200 (6,313,750) (17,087,950) 584 FIELDSTONE GOLF 1,605,800$ 1,656,504 1,545,088$ 1,612,342 60,712 44,162 (16,550) 592 SEWER/WATER 19,283,629$ 18,236,325 19,903,900$ 16,865,723 (620,271) 1,370,602 1,990,873 661 FLEET 3,045,528$ 2,846,151 3,543,634$ 2,270,643 (498,106) 575,508 1,073,614 852 SPECIAL ASSESSMENT DEBT G 185,570$ 163,584 197,874$ 194,375 (12,304) (30,791) (18,487)
TOTALS 84,974,786$ 68,684,160$ 77,520,981$ 76,696,832$ 7,453,805$ (8,012,672)$ (15,466,477)$
CONSOLIDATED FUND BALANCE CHANGE IN PROPRIETARY, TIFA FUNDS & INTERNAL SERVICES FUNDS (2,193,316)$ (83,592)$
CHANGE IN FUND BALANCES OF GOVERNMENTAL FUNDS 9,647,121$ (7,929,080)$
G GOVERNMENTAL FUNDS
REVENUES EXPENDITURES INC / (DEC) IN FUND BALANCE
REVENUE AND EXPENSE SUMMARY AND FUND BALANCE CHANGES2021 AMENDED AND 2022 BUDGET
16

2022
BU
DG
ET
- 5
YE
AR
PR
OJE
CT
ION
S
FU
ND
D
ES
CR
IPT
ION
Pro
per
tyL
icen
ses
Sta
te &
Fed
Sta
te S
har
edS
pec
ial
Ch
arg
es f
or
Oth
erIn
vest
men
tA
dm
inT
ran
sfer
sT
ota
l by
Tax
es&
Per
mit
sG
ran
ts&
Hig
hw
ayA
sses
s.S
ervi
ces
Rev
enu
eIn
com
eIn
terf
un
dfr
om
Fu
nd
sF
un
d10
1G
EN
ER
AL
FU
ND
21,6
34,1
30$
91
4,40
0$
1,87
2,70
2$
3,
602,
456
$
22
0,74
1$
1,
975,
155
$
1,
054,
793
$
44,9
45$
3,12
9,07
0$
50
,000
$
34,4
98,3
92$
20
2M
AJO
R R
OA
DS
2,31
4,15
3
51,1
22
70
0,00
0
3,
065,
275
20
3L
OC
AL
RO
AD
S68
0,81
3
1,
000
5
92
5,00
0
1,
606,
818
22
7W
AY
NE
DIS
PO
SA
L19
0,00
0
19
0,00
0
23
0T
RE
E O
RD
INA
NC
E-
23
3M
ET
RO
AC
T80
,000
80,0
00
24
3B
RO
WN
FIE
LD
AU
TH
OR
ITY
187,
951
12,9
99
200,
950
24
8D
DA
338,
664
20,0
00
35
8,66
4
25
1T
IFA
A1,
078,
733
27
2,18
9
500
55,5
784,
000
1,41
1,00
0
252
TIF
A B
1,47
3,88
8
40,5
742,
471
1,51
6,93
3
253
TIF
A D
875,
228
750
875,
978
262
DR
UG
FO
RF
EIT
UR
E-F
ED
ER
AL
-
265
DR
UG
FO
RF
EIT
UR
E -
ST
AT
E31
,000
31,0
00
27
3C
DB
G83
,086
83,0
86
35
0C
AP
ITA
L IM
PR
OV
EM
EN
T D
EB
T10
0
1,86
3,40
0
1,86
3,50
0
401
CA
PIT
AL
PR
OJE
CT
S-
584
FIE
LD
ST
ON
E G
OL
F
1,60
4,00
4
52,5
00
1,
656,
504
59
2S
EW
ER
/WA
TE
R16
,825
,540
1,27
1,00
0
24
,000
11
5,78
5
18,2
36,3
25
60
1R
ET
IRE
E H
EA
LT
H C
AR
E0
-
66
1F
LE
ET
155
2,
845,
996
2,84
6,15
1
852
SP
EC
IAL
AS
SE
SS
ME
NT
DE
BT
163,
434
150
16
3,58
4
T
OT
AL
S24
,713
,366
$
914,
400
$
2,
247,
977
$
7,56
5,64
9$
384,
175
$
20,5
95,9
49$
2,
557,
567
$
75,8
26$
6,09
0,85
1$
3,
538,
400
$
68
,684
,160
$
TO
TA
L R
EV
EN
UE
S L
ES
S IN
TE
RN
AL
AD
MIN
/INT
ER
FU
ND
CH
AR
GE
S A
ND
TR
AN
SF
ER
S59
,054
,909
$
Inte
rfun
d an
d tr
ansf
ers
9,62
9,25
1$
2022
TO
TA
L C
ITY
RE
VE
NU
ES
BY
FU
ND
AN
D R
EV
EN
UE
CL
AS
SIF
ICA
TIO
N
17

2022 BUDGET - 5 YEAR PROJECTIONS
O:\All\2022 budget\Budget Book\22.Funds
Property Taxes42%
(88% General Fund)
Grants3%
ACT 515%
State Shared Revenue8%
Charges for Services35%
(82% Water and Sewer Utility Billing)
Licenses/Permits2%
Other Revenues5%
2022 TOTAL BUDGET REVENUES$59,054,909
(Net of Administrative and Interfund Transfers)
18

2022
BU
DG
ET
- 5
YE
AR
PR
OJE
CT
ION
S
FU
ND
D
ES
CR
IPT
ION
Sal
arie
s &
Fri
ng
eC
on
trac
tual
Rep
air
&O
ther
Inte
rfu
nd
Ch
g.
Cap
ital
DP
W &
Co
st o
fC
om
pu
ter
Deb
tW
ater
&T
ran
sfer
s T
ota
l by
Wag
esB
enef
its
Su
pp
lies
Ser
vice
sU
tilit
ies
Mai
nte
nan
ceE
xpen
ses
Exp
ense
Insu
ran
ceE
xpen
dit
ure
sA
dm
in C
har
ges
Go
od
s S
old
Ser
vice
sS
ervi
ceS
ewag
e C
ost
sO
ut
Fu
nd
101
GE
NE
RA
L F
UN
D12
,976
,422
$
5,46
4,81
0$
1,
098,
025
$
2,37
9,99
0$
53
8,20
1$
1,60
7,91
1$
979,
182
$
1,57
7,81
1$
22
4,13
9$
3,61
0,42
0$
47
2,79
2$
68,1
29$
4,83
4,40
0$
35,8
32,2
33$
202
MA
JOR
RO
AD
S31
1,43
7
224,
138
14
4,90
0
20,0
00
555,
820
4,71
5
504,
106
15
,440
1,
450,
000
89,9
86
3,32
0,54
2
203
LO
CA
L R
OA
DS
193,
862
18
2,22
9
46,5
00
5,00
0
93
,000
3,
085
50
2,51
9
14,3
03
475,
000
89
,986
1,
605,
484
23
3M
ET
RO
AC
T40
,000
50
,000
-
20
90,0
20
601
RE
TIR
EE
HE
AL
TH
CA
RE
-
-
-
0
-
227
WA
YN
E D
ISP
OS
AL
15,0
00
32,3
55
100,
000
147,
355
230
TR
EE
OR
DIN
AN
CE
60,0
00
470
60,4
70
244
EC
ON
OM
IC D
EV
EL
OP
ME
NT
-
-
-
248
DD
A27
,898
2,30
4
2,
600
4,00
0
47
,000
96
,150
7,
149
64,7
26
43,0
44
294,
871
251
TIF
A A
-
-
2,25
0
77
3,20
0
14
7,72
278
8,75
3
44
,930
60
,405
4,
531
530,
000
23
,208
2,
374,
999
25
2T
IFA
B10
0,00
0
6,
600
164,
000
25,2
50
53,7
85
1,51
0,00
0
14
,196
1,
873,
831
25
3T
IFA
D-
72
,500
29
7,80
02,
700
10
,376
38
6,00
0
16,5
85
785,
961
256
BR
OW
NF
IEL
D A
UT
HO
RIT
Y98
3,76
0
3,
050
22
,320
43
,783
54
,814
1,
107,
727
26
2D
RU
G F
OR
FE
ITU
RE
-FE
DE
RA
L-
26
5D
RU
G F
OR
FE
ITU
RE
-S
TA
TE
-
20
20
27
3C
DB
G83
,086
83
,086
35
0C
AP
ITA
L IM
PR
OV
EM
EN
T D
EB
T1,
863,
400
1,
863,
400
40
1C
AP
ITA
L P
RO
JEC
TS
615,
000
5,69
8,75
0
6,
313,
750
58
4F
IEL
DS
TO
NE
GO
LF
26
4,40
9
58,5
52
27,0
50
577,
978
60,4
79
40,7
00
48,1
78
65,8
19
15,4
50
306,
500
15
,977
81
,250
50,0
00
1,61
2,34
2
592
SE
WE
R/W
AT
ER
707,
241
44
4,04
0
321,
920
47
,000
38
,700
42
,200
61
,850
1,
397,
615
28,0
36
1,18
5,00
0
1,
283,
103
93
,100
1,80
5,24
3
9,41
0,67
5
16
,865
,723
661
FL
EE
T19
3,93
5
96,5
28
441,
900
12
8,50
0
45
,500
4,
330
73
,375
51
,092
1,
062,
000
173,
483
2,27
0,64
3
852
SP
EC
IAL
AS
SE
SS
ME
NT
DE
BT
194,
375
194,
375
TO
TA
LS
14,6
75,2
04$
6,
472,
601
$
2,08
5,14
5$
5,
074,
428
$
914,
202
$4,
357,
684
$ 1,
389,
371
$ 4,
275,
280
$
352,
991
$16
,213
,670
$ 1,
815,
033
$
81
,250
$
565,
892
$ 4,
029,
005
$ 9,
410,
675
$
4,98
4,40
0$
76,6
96,8
32$
TO
TA
L E
XP
EN
DIT
UR
ES
LE
SS
INT
ER
FU
ND
CH
AR
GE
S A
ND
TR
AN
SF
ER
S65
,622
,119
$
Inte
rfun
d an
d tr
ansf
ers
incl
ude
$1,4
46,0
00 R
etire
e T
rust
Tra
nsfe
rs11
,074
,713
$
2022
TO
TA
L C
ITY
AP
PR
OP
RIA
TIO
NS
BY
FU
ND
AN
D E
XP
EN
DIT
UR
E C
LA
SS
IFIC
AT
ION
19

2022 BUDGET - 5 YEAR PROJECTIONS
O:\All\2022 budget\Budget Book\22.Funds
SUPPLIES3%
WAGES AND BENEFITS
32%
REPAIR AND MAINTENANCE
7%
OTHER EXPENSE INCL. UTILITIES
4%
CONTRACTURAL SERVICES
8%
WATER AND SEWAGE COST
14%
CAPITAL EXPENDITURES
24%
DEBT SERVICE/INTEREST EXPENSE
6%
TRANSFER TO TRUSTS
2%
2022 TOTAL BUDGET EXPENDITURES$67,068,119
(Net of Administrative and Interfund Transfers)
20

2022 BUDGET - 5 YEAR PROJECTIONS
2020 2021 2021 2022 2023 2024 2025 2026FUND DESCRIPTION ACTUAL ORIGINAL AMENDED BUDGET PROJECTED PROJECTED PROJECTED PROJECTED
REVENUES101 GENERAL FUND 32,917,644$ 32,836,410$ 33,967,615$ 34,498,392$ 33,448,295$ 33,901,461$ 34,483,187$ 35,928,513$ 202 MAJOR ROADS 6,934,209$ 3,894,623$ 4,094,715$ 3,065,275$ 2,485,895$ 5,040,243$ 2,534,834$ 9,509,671$ 203 LOCAL ROADS 4,599,662$ 1,228,932$ 1,373,932$ 1,606,818$ 1,447,304$ 1,854,467$ 3,781,702$ 2,809,009$ 233 METRO ACT 83,140$ 74,960$ 74,960$ 80,000$ 80,000$ 80,000$ 80,000$ 80,000$ 601 RETIREE HEALTH CARE 2,754,029$ 2,338,000$ 2,338,000$ -$ -$ -$ -$ -$ 227 WAYNE DISPOSAL 323,648$ 203,825$ 203,825$ 190,000$ 185,000$ 180,000$ 175,000$ 170,000$ 230 TREE ORDINANCE 16,436$ 19,382$ 19,382$ -$ -$ -$ -$ -$ 248 DDA 189,174$ 233,347$ 233,347$ 358,664$ 349,504$ 361,394$ 374,050$ 387,162$ 251 TIFA A 1,282,779$ 1,960,041$ 1,960,041$ 1,411,000$ 1,383,681$ 1,385,928$ 1,391,594$ 1,404,373$ 252 TIFA B 1,696,958$ 2,319,972$ 2,319,972$ 1,516,933$ 1,539,502$ 1,525,989$ 1,558,051$ 1,594,457$ 253 TIFA D 912,505$ 775,696$ 775,696$ 875,978$ 783,455$ 704,685$ 633,792$ 574,987$ 243 BROWNFIELD AUTHORITY 409,137$ 371,195$ 371,195$ 200,950$ 202,322$ 207,279$ 212,761$ 221,474$ 262 DRUG FORFEITURE FEDERAL 1$ -$ -$ -$ -$ -$ -$ -$ 265 DRUG FORFEITURE STATE 30,310$ 41,000$ 41,000$ 31,000$ 31,000$ 31,000$ 31,000$ 31,000$ 273 CDBG 17,910$ 70,968$ 70,968$ 83,086$ 83,086$ 83,086$ 83,086$ 83,086$ 350 CAPITAL IMPROVEMENT DEBT 802,753$ 305,917$ 305,917$ 1,863,500$ 1,861,425$ 1,858,625$ 1,865,000$ 1,865,475$ 401 CAPITAL PROJECTS FUND 2,575$ -$ 12,703,693$ -$ -$ -$ -$ -$ 584 FIELDSTONE GOLF 1,530,948$ 1,605,800$ 1,605,800$ 1,656,504$ 1,702,104$ 1,749,304$ 1,798,604$ 1,848,504$ 592 WATER/SEWER 19,361,165$ 19,283,629$ 19,283,629$ 18,236,325$ 18,328,580$ 18,426,368$ 18,541,010$ 18,748,161$ 661 FLEET 3,068,388$ 3,045,528$ 3,045,528$ 2,846,151$ 2,936,416$ 3,029,546$ 3,125,628$ 3,224,759$ 852 SPECIAL ASSESSMENT DEBT 256,798$ 185,570$ 185,570$ 163,584$ 159,003$ 154,422$ 149,841$ 145,259$
TOTAL REVENUES 77,190,169$ 70,794,795$ 84,974,786$ 68,684,160$ 67,006,572$ 70,573,797$ 70,819,140$ 78,625,890$
EXPENDITURES101 GENERAL FUND 38,679,195$ 34,300,180$ 34,203,294$ 35,832,233$ 30,865,051$ 34,207,030$ 33,665,254$ 40,097,250$ 202 MAJOR ROADS 6,158,439$ 3,878,318$ 3,927,523$ 3,320,542$ 2,466,217$ 5,073,133$ 2,039,706$ 10,011,537$ 203 LOCAL ROADS 4,305,160$ 1,205,874$ 2,218,445$ 1,605,484$ 1,438,058$ 1,857,406$ 3,787,716$ 3,059,797$ 233 METRO ACT 185,032$ 47,805$ 47,805$ 90,020$ 90,020$ 90,000$ 90,000$ 90,000$ 601 RETIREE HEALTH CARE 3,506,403$ 1,564,070$ 3,382,898$ -$ -$ -$ -$ -$ 227 WAYNE DISPOSAL 223,557$ 188,200$ 188,200$ 147,355$ 147,360$ 127,215$ 117,220$ 117,225$ 230 TREE ORDINANCE 21,618$ 45,555$ 45,555$ 60,470$ 10,490$ 10,410$ 10,430$ 10,450$ 244 ECONOMIC DEVELOPMENT 60$ -$ -$ -$ -$ -$ -$ -$ 248 DDA 58,069$ 142,864$ 191,339$ 294,871$ 257,798$ 220,360$ 226,915$ 232,315$ 251 TIFA A 1,557,364$ 1,417,193$ 1,785,732$ 2,374,999$ 1,158,073$ 1,236,607$ 1,022,732$ 959,867$ 252 TIFA B 550,124$ 2,292,414$ 2,270,947$ 1,873,831$ 378,405$ 380,466$ 385,634$ 366,128$ 253 TIFA D 1,415,418$ 631,154$ 1,042,793$ 785,961$ 894,515$ 325,483$ 304,823$ 1,106,793$ 243 BROWNFIELD AUTHORITY 1,000,222$ 425,717$ 460,194$ 1,107,727$ 498,371$ 502,878$ 508,038$ 511,125$ 262 DRUG FORFEITURE FEDERAL 1,333$ -$ -$ -$ -$ -$ -$ -$ 265 DRUG FORFEITURE STATE 88,634$ 3,500$ 3,500$ 20$ 3,520$ 3,500$ 3,500$ -$ 273 CDBG 29,643$ 68,968$ 68,968$ 83,086$ 83,086$ 83,086$ 83,086$ 83,086$ 350 CAPITAL IMPROVEMENT DEBT 560,575$ 563,800$ 563,800$ 1,863,400$ 1,861,325$ 1,858,525$ 1,864,900$ 1,865,375$ 401 CAPITAL PROJECTS FUND 306,483$ -$ 1,929,493$ 6,313,750$ 4,421,483$ -$ -$ -$ 584 FIELDSTONE GOLF (a) 675,780$ 1,630,495$ 1,545,088$ 1,612,342$ 1,622,296$ 1,666,729$ 1,568,227$ 1,378,229$ 592 WATER/SEWER 16,236,899$ 16,118,282$ 19,903,900$ 16,865,723$ 17,284,382$ 19,158,824$ 17,787,996$ 16,409,087$ 661 FLEET 2,019,114$ 3,131,634$ 3,543,634$ 2,270,643$ 1,909,265$ 2,876,072$ 1,954,289$ 1,901,675$ 852 SPECIAL ASSESSMENT DEBT 201,875$ 197,874$ 197,874$ 194,375$ 185,925$ 182,525$ 179,124$ 170,568$
TOTAL EXPENSES 77,780,998$ 67,853,897$ 77,520,981$ 76,696,832$ 65,575,640$ 69,860,249$ 65,599,590$ 78,370,507$
NET REVENUES/EXPENDITURES (590,829)$ 2,940,898$ 7,453,805$ (8,012,672)$ 1,430,932$ 713,548$ 5,219,550$ 255,383$
2020 Audited Financials may reflect total revenues and expenses differently due to combining some accounts for audit purposes
All City Funds Summary
REVENUES and EXPENDITURES
21

2022 BUDGET - 5 YEAR PROJECTION
e Estimate
Assessment Year 2019 2020 2021 2022 2023 2024CPI 1.81% 1.25% 2.26% e 2.40% e 2.50% e 2.45% e
Growth (used to estimate revenue only) 1.00% e 1.00% e 1.00% e 1.00% e
Taxable Value Levied 2020 2021 2022 2023 2024 2025Taxable Value (000) - adjusted for lost PPT 1,748,676 1,804,250 1,843,069 e 1,885,733 e 1,931,734 e 1,978,378 e% Change in Real and Personal Taxable Values 2.46% 3.18% 2.15% 2.31% 2.44% 2.41%
Budget Year 2021 2022 2023 2024 2025 2026General Fund Tax Disbursements 20,067$ 20,719$ e 21,125$ e 21,574$ e 22,060$ e 22,552$ e
City Tax Mills for Government Funds 12.0702 12.0702 12.0702 e 12.0702 e 12.0702 e 12.0702 e
Actual Taxable Values and % Change is based on ad valorem real and personal property reported in the annual Oakland County Equalization Report.
Fiscal years 2022-2026 are increased by the prior years estimated CPI and anticipated tax base growth adjusted for estimated personal property value loss.
Ad Valorem taxable values do not include additional taxable value of the City parcels eligible for application of the Industrial Facility Tax Act (IFT),
Commercial Rehabilitation Act (CRA), or the reduction in taxable value captured by the districts assigned to the City's Tax Increment Finance Authority (TIFA), Brownfield Remediation Authority (BRA), or Downtown Development Authority (DDA).
General Fund Tax Disbursements represent actual collections based on fiscal year tax bills. 2022 estimate is based on tax rolls after the 2021 March Board
of Review. The 2023-2026 estimates include increases for the CPI cap and growth of the year assessed. For example, 2023 uses budget year
2021 CPI and Growth. Tax Disbursements do not reflect other revenue associated with City tax collections (penalties, delinquencies, administrative fees,
chargbacks, and Michigan Tax Tribunal Appeals). Refer to the City's Annual Budget for total tax collection revenues.
Personnel - Full-Time Budget Summary 2020 2021 2022 2023 2024 2025 2026
170 165 169 e 169 e 169 e 169 e 169 e
2021: Changes in full time positions: -5 Assessing
Payroll Compensation-COLA 2020 2021 2022 2023 2024 2025 2026AFSCME Agreement Exp 12/31/2023 2.00% 2.00% 2.00% 2.00% 2.00% e 2.00% e 2.00% eAdmin N/A N/A 3.00% e 3.00% e 3.00% e 3.00% e 3.00% eDetective Agreement Exp 12/31/2024 2.50% 2.25% 2.25% 1.25% 1.25% 2.00% e 2.00% eCommand Agreement Exp 12/31/2022 2.50% 2.25% 2.25% 2.50% e 2.50% e 2.50% e 2.50% ePatrol Agreement Exp 12/31/2023 2.50% 2.00% 2.00% 2.00% 2.00% e 2.00% e 2.00% eIAFF Agreement Exp 12/31/2022 2.00% 2.00% 2.00% 2.50% e 2.50% e 2.50% e 2.50% e
Medical Benefits (Actives) 2020 2021 2022 2023 2024 2025 2026Medical - Alliance Health - PPO 2.00% -11.00% 6.60% e 6.60% e 6.60% e 6.60% e 6.60% eMedical - Alliance Health - EPO 2.00% -9.00% 6.60% e 6.60% e 6.60% e 6.60% e 6.60% eRx Pharmacy -4.00% -10.00% 6.60% e 6.60% e 6.60% e 6.60% e 6.60% eDental - Delta 0.00% 0.00% -6.00% e 4.00% e 4.00% e 4.00% e 4.00% eVision 0.00% 0.00% 0.00% e 0.00% e 0.00% e 0.00% e 0.00% e
Social Security & Medicare 2020 2021 2022 2023 2024 2025 2026Annual SS Wage Base Limit 137,700$ 142,800$ 147,084$ e 151,497$ e 156,041$ e 160,723$ e 165,544$ eChange Percent in SS Base Limit 3.61% 3.70% 3.00% e 3.00% e 3.00% e 3.00% e 3.00% eContribution Rate - Social Security (ER) 6.20% 6.20% 6.20% e 6.20% e 6.20% e 6.20% e 6.20% eContribution Rate - Social Security (EE) 6.20% 6.20% 6.20% e 6.20% e 6.20% e 6.20% e 6.20% eContribution Rate - Medicare (ER & EE) 1.45% 1.45% 1.45% e 1.45% e 1.45% e 1.45% e 1.45% e
Retirement Plans 2020 2021 2022 2023 2024 2025 2026
DB Pension Employer Contribution 2,014,731$ 1,298,526$ e 1,196,000$ e 1,081,000$ e 865,000$ e 770,000$ e 747,000$ ePlanned additional Trust Funding 250,000$ 250,000$
City's funded ratio for its actuarial pension liability increased from 80.3% to 82.6% per the actuary valuation for the year ending 12/31/2020.
Retiree Health CareEmployer Contribution 2,752,310$ 931,828$ e 946,000$ e 882,000$ e 800,000$ e 744,000$ e 718,000$ ePlanned additional Trust Funding 250,000$ e 250,000$ e 250,000$ e 250,000$ e e e
Employer contribution based upon the prior year's ending actuary valuation.
City's funded ratio for its actuarial retiree health care liability increased from 59.3% to 81.6% per the actuary valuation for the year ending 12/31/20.
BUDGET ASSUMPTIONS
Applicable step increases and additional performance increases are not reflected above, but are reserved in the overall budget expenditures.
9/21/2021 O:\All\2022 budget\Budget Book\Tab 2\22.Assumption Summary
22

2022
BU
DG
ET
- 5
YE
AR
PR
OJE
CT
ION
S
20
21
20
20
OR
IGIN
AL
20
21
20
22
20
23
20
24
20
25
20
26
De
sc
rip
tio
nA
CT
UA
LB
UD
GE
TA
ME
ND
ED
BU
DG
ET
PR
OJE
CT
ED
PR
OJE
CT
ED
PR
OJE
CT
ED
PR
OJE
CT
ED
To
tal
Ge
ne
ral
Fu
nd
Re
ven
ue
s3
2,9
17
,64
4$
32
,83
6,4
10
$
33
,96
7,6
15
$
34
,49
8,3
92
$
33
,44
8,2
95
$
33
,90
1,4
61
$
34
,48
3,1
87
$
35
,92
8,5
13
$
To
tal
Ge
ne
ral
Fu
nd
Ex
pe
nd
itu
res
38
,67
9,1
95
3
4,3
00
,18
0
3
4,2
03
,29
4
3
5,8
32
,23
3
3
0,8
65
,05
1
3
4,2
07
,03
0
3
3,6
65
,25
4
4
0,0
97
,25
0
Re
ven
ue
Ove
r (U
nd
er)
Ex
pe
nd
itu
res
(5,7
61
,55
2)
$
(1
,46
3,7
70
)$
(2
35
,67
9)
$
(1,3
33
,84
1)
$
2,5
83
,24
3$
(30
5,5
69
)$
8
17
,93
3$
(4,1
68
,73
7)
$
Fu
nd
Ba
lan
ce
12
7,0
31
,46
2$
25
,56
7,6
92
$
2
6,7
95
,78
3$
25
,46
1,9
42
$
2
8,0
45
,18
6$
27
,73
9,6
17
$
2
8,5
57
,55
0$
24
,38
8,8
12
$
as
% o
f E
xp
en
se
69
.9%
74
.5%
78
.3%
71
.1%
90
.9%
81
.1%
84
.8%
60
.8%
Un
res
tric
ted
Fu
nd
Ba
lan
ce
25
,75
0,6
62
$
2
5,2
61
,48
0$
2
6,4
89
,57
1$
2
5,1
55
,73
0$
2
7,7
40
,34
9$
2
7,4
36
,15
5$
2
8,2
52
,83
8$
2
4,0
84
,10
0$
a
s %
of
Ex
pe
ns
e6
6.5
7%
73
.65
%7
7.4
5%
70
.20
%8
9.8
8%
80
.21
%8
3.9
2%
60
.06
%
1F
un
d B
alan
ce in
clu
des
No
nsp
end
able
, Co
mm
itte
d, A
ssig
ned
, an
d U
nas
sig
ned
bal
ance
s. U
nre
stri
cted
Fu
nd
Bal
ance
co
mb
ines
Un
assi
gn
ed a
nd
Ass
ign
ed F
un
d B
alan
ce.
GE
NE
RA
L F
UN
D
O:\All\2022 budget\Budget Book\Tab 3\22.GF Reven
ues‐Classification
23

2022 BUDGET - 5 YEAR PROJECTIONS
2020 2021 2021 2022 2023 2024 2025 2026ACTIVITY BUDGET AMENDED REQUESTED PROJECTED PROJECTED PROJECTED PROJECTED
REVENUESPROPERTY TAXES 18,056,311$ 20,986,932$ 20,986,932$ 21,634,130$ 22,037,067$ 22,509,767$ 23,021,017$ 23,563,663$ LICENSES AND PERMITS 1,068,331 904,700 904,700 914,400 865,400 816,420 817,460 818,521CHARGES FOR SERVICES 1,640,367 1,827,123 1,827,123 1,975,155 1,961,646 1,962,703 1,972,377 1,971,398GRANTS 1,949,236 184,961 184,961 1,631,174 126,165 37,800 31,400 35,000STATE GRANTS/OTHER 252,052 143,711 143,711 241,528 241,520 241,528 241,528 241,528STATE SHARED REVENUE & REFUNDS 3,833,330 3,518,726 3,518,726 3,602,456 3,593,988 3,557,365 3,464,980 3,441,194RENTALS, FRANCHISE FEES, OTHER REVENUE 1,042,090 1,005,617 1,013,951 1,040,543 1,028,309 1,038,036 1,046,169 1,057,077INTEREST INCOME 694,302 785,720 785,720 44,945 44,265 43,537 42,761 196,556SPECIAL ASSESSMENTS 989,013 328,673 328,673 220,741 221,745 222,799 222,906 823,270NON-OPERATING REVENUE 90,065 14,100 1,490,498 14,250 14,450 14,450 14,450 10,450INTERFUND CHG REVENUE 1,631,612 1,651,838 1,256,190 1,312,037 1,364,650 1,420,543 1,479,929 1,543,033ADMIN CHARGE REVENUE 1,670,935 1,484,309 1,526,430 1,817,033 1,899,090 1,986,513 2,078,210 2,176,823TRANSFERS FROM FUNDS 0 0 0 50,000 50,000 50,000 50,000 50,000
TOTAL REVENUES 32,917,644$ 32,836,410$ 33,967,615$ 34,498,392$ 33,448,295$ 33,901,461$ 34,483,187$ 35,928,513$
% Change from Prior Year -0.25% 3.19% 1.56% -3.04% 1.35% 1.72% 4.19%
EXPENDITURESSALARIES & WAGES 11,575,061$ 12,796,748$ 12,160,712$ 12,976,422$ 13,498,837$ 14,037,079$ 14,388,770$ 14,753,006$ FRINGE BENEFITS 8,621,414 7,613,511 6,615,704 5,714,810 5,544,910 5,556,365 5,654,153 5,821,208SUPPLIES 903,598 900,727 936,422 1,098,025 910,007 922,066 877,272 891,423OTHER EXPENSES 1,636,071 915,482 913,227 978,932 916,635 929,883 893,052 949,014REPAIR & MAINT. 770,650 1,862,870 1,187,296 1,607,911 871,878 852,852 875,629 831,031CONTRACTUAL SERVICES 1,587,988 1,713,667 2,118,047 2,380,240 2,253,568 2,129,168 2,147,842 2,100,482COMPUTER SERVICES 357,460 435,441 442,964 472,792 467,228 467,739 468,249 468,747UTILITIES 511,431 892,842 794,434 538,201 546,448 552,586 554,849 558,467INSURANCE 190,701 196,963 217,880 224,139 228,954 232,495 236,113 238,495CAPITAL EXPENDITURES 1,907,460 2,595,700 4,443,349 3,610,420 311,200 299,200 190,200 104,700DEBT SERVICE 65,691 64,442 64,442 68,129 66,754 65,379 66,629 72,438INTERFUND CHG EXPENSE 1,499,101 1,647,869 1,644,900 1,577,811 1,625,307 1,673,693 1,723,596 1,774,864TRANS TO OTHER FUNDS 9,052,569 2,663,917 2,663,917 4,584,400 3,623,325 6,488,525 5,588,900 11,533,375
TOTAL EXPENDITURES 38,679,195$ 34,300,180$ 34,203,294$ 35,832,233$ 30,865,051$ 34,207,030$ 33,665,254$ 40,097,250$ 35,832,233 30,865,051 34,207,030 33,665,254 40,097,250
% Change from Prior Year -11.32% -11.57% -7.36% -20.20% -11.56% -12.96% 3.67%
NET OF REVENUES/EXPENDITURES (5,761,552)$ (1,463,770)$ (235,679)$ (1,333,841)$ 2,583,243$ (305,569)$ 817,933$ (4,168,737)$
PROJECTED FUND BLANCE:NONSPENDABLE 238,083 238,083 238,083 238,083 238,083 238,083 238,083 238,083
COMMITTED 64,442 68,129 68,129 68,129 66,754 65,379 66,629 66,629ASSIGNED 7,695,146 1,265,712 1,265,712 0 0 0 4,102,108 1,073,564 (a)
UNASSIGNED 19,033,791 23,995,769 25,223,859 25,155,730 27,740,349 27,436,155 24,150,729 23,010,536 TOTAL FUND BALANCE 27,031,462$ 25,567,692$ 26,795,783$ 25,461,942$ 28,045,186$ 27,739,617$ 28,557,550$ 24,388,812$
General Fund Summary
(a) includes an average of the 2021-2025 assigned budgets
22.GF Revenues‐ClassificationBSA DETAIL24

2022 BUDGET - 5 YEAR PROJECTIONS
O:\All\2022 budget\Budget Book\Tab 3\22.GF Revenues-Classification
$18,056,311 $20,986,932 $21,634,130 $22,037,067 $22,509,767 $23,021,017 $23,563,663
$14,861,333
$12,980,683 $12,777,785 $11,411,228 $11,391,694 $11,462,170 $12,272,761
$‐
$5,000,000
$10,000,000
$15,000,000
$20,000,000
$25,000,000
$30,000,000
$35,000,000
$40,000,000
ACTIVITY AMENDED BUDGET PROJECTED PROJECTED PROJECTED PROJECTED
2020 2021 2022 2023 2024 2025 2026
CITY OF AUBURN HILLSGENERAL FUND REVENUE
2020‐2026
PROPERTY TAXES ALL OTHER REVENUE
25

2022 BUDGET - 5 YEAR PROJECTIONS
O:\All\2022 budget\Budget Book\Tab 3\22.GENERAL FUNDpie chart expenditures
ADMINISTRATION16%
STORMWATER, DEBT TRANSFERS, OTHER CAPITAL
6%
ROAD TRANSFERS4%
FACILITIES, GROUNDS, IT11%
SENIORS, RECREATION, PARKS8%
PLANNING & DEVELOPMENT4%
POLICE31%
FIRE20%
2022 General Fund Expenditures by FunctionTotal Expenditures: $35,832,233
(includes transfers between funds)
26

2022 BUDGET - 5 YEAR PROJECTIONS
2021 2021
2020 ORIGINAL AMENDED 2022 2023 2024 2025 2026
ACTUAL BUDGET BUDGET BUDGET PROJECTION PROJECTION PROJECTION PROJECTION
PROPERTY TAXES 4,299,044$ 4,362,967$ 4,362,967$ 4,490,829$ 4,576,675$ 4,671,705$ 4,774,621$ 4,878,759$
STATE SHARED REVENUE & REFUNDS 2,568,946 2,093,864 2,093,864 2,371,315 2,387,316 2,398,693 2,382,716 2,378,671
LICENSES AND PERMITS 1,014,724 772,700 772,700 780,400 730,400 680,400 680,400 680,400
GRANTS 505,235 ‐ ‐ 1,404,189 ‐ ‐ ‐ ‐
STATE GRANTS/OTHER 43,045 51,528 51,528 51,528 51,520 51,528 51,528 51,528
OTHER REVENUE 1,018,922 988,117 988,117 1,026,543 1,014,239 1,023,895 1,031,955 1,042,789
CHARGES FOR SERVICES 462,847 617,750 617,750 662,035 647,710 647,935 656,760 654,915
INTEREST INCOME 694,302 785,720 785,720 44,945 44,265 43,537 42,761 196,556
SPECIAL ASSESSMENTS 989,013 328,673 328,673 220,741 221,745 222,799 222,906 823,270
NONOPERATING REVENUE 51,785 9,100 1,485,498 9,250 9,450 9,450 9,450 5,450
INTERFUND CHG REVENUE 1,631,612 1,651,838 1,256,190 1,312,037 1,364,650 1,420,543 1,479,929 1,543,033
ADMIN CHARGE REVENUES 1,666,809 1,482,909 1,525,030 1,815,033 1,897,690 1,985,113 2,076,810 2,174,823
CONTRIBUTED CAPITAL 37,280 0 0 0 0 0 0 0
TRANSFERS FROM FUNDS 0 0 0 50,000 50,000 50,000 50,000 50,000
TOTAL REVENUES 14,983,563$ 13,145,166$ 14,268,037$ 14,238,845$ 12,995,660$ 13,205,598$ 13,459,836$ 14,480,194$
SALARIES & WAGES 4,175,256$ 4,775,763$ 4,347,794$ 4,609,229$ 4,730,699$ 4,921,334$ 5,005,406$ 5,154,051$
FRINGE BENEFITS 4,877,022 3,779,960 2,996,942 2,023,682 1,830,255 1,894,976 1,955,768 2,027,817
SUPPLIES 389,600 366,085 369,515 541,045 424,779 421,479 417,366 424,436
OTHER EXPENSES 1,482,557 (382,677) 180,743 70,254 55,345 53,949 43,308 53,710
REPAIR & MAINT. 602,340 1,645,374 969,800 1,419,149 642,699 639,199 668,699 640,419
CONTRACTUAL SERVICES 1,032,806 1,037,778 1,409,158 1,728,354 1,576,780 1,479,958 1,467,190 1,454,409
COMPUTER SERVICES 335,150 393,995 393,795 435,114 435,114 435,123 435,120 435,120
UTILITIES 481,566 858,737 760,329 496,751 504,998 511,136 513,399 517,017
INSURANCE 102,128 107,682 118,808 123,507 126,737 128,668 130,651 131,372
CAPITAL EXPENDITURES 1,616,532 2,181,000 3,925,971 660,300 35,000 68,000 100,000 17,500
DEBT SERVICE 65,691 64,442 64,442 68,129 66,754 65,379 66,629 72,438
INTERFUND CHG EXPENSES 745,684 766,357 763,388 780,608 805,366 830,911 857,264 884,454
TRANS TO DEBT 9,052,569 303,917 303,917 3,059,400 2,993,325 2,908,525 2,608,900 2,583,375
TOTAL EXPENSES 24,958,900$ 15,898,414$ 16,604,602$ 16,015,522$ 14,227,851$ 14,358,637$ 14,269,700$ 14,396,118$
NET REVENUES/EXPENSES (9,975,337)$ (2,753,248)$ (2,336,566)$ (1,776,677)$ (1,232,191)$ (1,153,039)$ (809,864)$ 84,076$
General Operating fund consists of Administrative, Infrastructure, General Support, Community Program and Planning Departments
Fund 101 ‐ General Operating Fund(Supported by 2.1049 Operating Millage )
27

2022 BUDGET - 5 YEAR PROJECTIONS
2021 2021
2020 ORIGINAL AMENDED 2022 2023 2024 2025 2026
ACTUAL BUDGET BUDGET BUDGET PROJECTION PROJECTION PROJECTION PROJECTION
SALARIES & WAGES 55,405 58,900 58,900 58,900 58,900 58,900 58,900 58,900
FRINGE BENEFITS 40,368 45,293 45,293 40,672 41,873 43,076 44,533 46,277
SUPPLIES 36 50 50 100 100 100 100 100
CONTRACTUAL SERVICES 500 2,000 2,000 29,000 2,000 2,000 2,000 2,000
OTHER EXPENSES 20,103 29,610 29,610 30,310 30,310 30,310 30,310 30,310
TOTAL EXPENSES 116,411$ 135,853$ 135,853$ 158,982$ 133,183$ 134,386$ 135,843$ 137,587$
2021 2021
2020 ORIGINAL AMENDED 2022 2023 2024 2025 2026
ACTUAL BUDGET BUDGET BUDGET PROJECTION PROJECTION PROJECTION PROJECTION
SALARIES & WAGES 602,287 632,649 577,553 504,372 506,127 508,757 509,689 510,640
FRINGE BENEFITS 336,218 372,706 329,415 149,565 151,987 154,534 157,281 160,385
SUPPLIES 8,585 670 670 4,270 5,270 4,270 4,270 5,270
CONTRACTUAL SERVICES 459 600 600 600 600 600 600 600
OTHER EXPENSES 6,202 20,445 20,445 24,345 24,345 24,345 24,345 24,235
UTILITES 1,236 1,586 1,586 1,617 1,650 1,683 1,718 1,752
REPAIR & MAINTENANCE 6,386 0 0 0 0 0 0 0
FLEET VEHICLE CHARGES 24,614 16,652 16,652 30,622 31,593 32,595 33,629 34,696
TOTAL EXPENSES 985,987$ 1,045,308$ 946,921$ 715,391$ 721,572$ 726,784$ 731,532$ 737,578$
2021 2021
2020 ORIGINAL AMENDED 2022 2023 2024 2025 2026
ACTUAL BUDGET BUDGET BUDGET PROJECTION PROJECTION PROJECTION PROJECTION
SALARIES & WAGES 197,347 170,534 177,614 195,780 178,924 222,324 178,924 197,924
FRINGE BENEFITS 43,900 46,478 47,202 48,771 47,578 50,999 47,781 49,341
SUPPLIES 26,246 13,200 13,200 22,800 11,500 22,500 19,500 18,000
CONTRACTUAL SERVICES 5,723 4,800 4,800 19,300 17,050 18,350 17,050 17,300
OTHER EXPENSES 22,091 15,915 15,915 21,325 18,325 24,400 18,325 21,325
UTILITIES 692 0 0 0 0 0 0 0
REPAIR & MAINTENANCE 18,466 21,200 21,200 21,400 21,400 21,400 21,400 22,600
CAPITAL EXPENDITURES 11,000 0 0 0 0 0 0 0
TOTAL EXPENSES 325,466$ 272,127$ 279,931$ 329,376$ 294,777$ 359,973$ 302,980$ 326,490$
Fund 101 ‐ General Fund
City Manager ‐ 172
City Clerk ‐ 215
City Council ‐ 101
ADMINISTRATIVE DEPARTMENT EXPENDITURES
O:\All\2022 budget\Budget Book\Tab 3\22.GENERAL FUND28

2022 BUDGET - 5 YEAR PROJECTIONS
2021 2021
2020 ORIGINAL AMENDED 2022 2023 2024 2025 2026
ACTUAL BUDGET BUDGET BUDGET PROJECTION PROJECTION PROJECTION PROJECTION
SALARIES & WAGES 446,442 473,570 485,048 488,023 494,668 499,491 504,411 508,017
FRINGE BENEFITS 178,857 190,342 185,668 200,886 206,118 211,399 217,138 223,071
SUPPLIES 22,043 19,785 19,785 20,275 19,792 20,689 20,104 20,777
COMPUTER SERVICES 1,606 1,780 1,780 1,700 1,700 1,700 1,700 1,700
CONTRACTUAL SERVICES 489 700 700 700 700 725 725 725
OTHER EXPENSES 6,541 12,500 12,500 12,075 12,075 12,075 12,075 12,075
UTILITIES 1,208 1,450 1,450 1,350 1,350 1,350 1,350 1,350
TOTAL EXPENSES 657,185$ 700,127$ 706,931$ 725,009$ 736,403$ 747,429$ 757,503$ 767,715$
2021 2021
2020 ORIGINAL AMENDED 2022 2023 2024 2025 2026
ACTUAL BUDGET BUDGET BUDGET PROJECTION PROJECTION PROJECTION PROJECTION
SALARIES & WAGES 285,971 367,525 3,200 3,200 3,200 3,200 3,200 3,200
FRINGE BENEFITS 137,546 183,784 0 0 0 0 0 0
SUPPLIES 6,553 6,500 7,500 7,350 7,350 7,400 7,400 7,400
UTILITIES 303 0 0 0 0 0 0 0
COMPUTER SERVICES 3,555 2,564 2,364 2,304 2,304 2,310 2,310 2,310
CONTRACTUAL SERVICES 90,403 10,200 360,200 302,000 367,400 367,400 367,400 374,744
OTHER EXPENSES 5,180 5,855 3,600 3,500 3,500 3,500 3,500 3,500
FLEET VEHICLE CHARGES 2,578 2,969 0 0 0 0 0 0
TOTAL EXPENSES 532,089$ 579,397$ 376,864$ 318,354$ 383,754$ 383,810$ 383,810$ 391,154$
2021 2021
2020 ORIGINAL AMENDED 2022 2023 2024 2025 2026
ACTUAL BUDGET BUDGET BUDGET PROJECTION PROJECTION PROJECTION PROJECTION
SALARIES & WAGES 0 170,097 (0) 116,416 180,125 261,195 344,698 430,705
FRINGE BENEFITS 2,928,592 1,647,419 1,077,338 273,913 36,072 52,093 68,595 85,593
SUPPLIES 103,118 67,630 67,630 88,630 88,630 88,630 88,630 88,630
OTHER EXPENSES 253,926 164,913 164,913 171,386 171,550 160,690 160,830 166,950
CONTRACTUAL SERVICES 377,822 356,200 356,200 353,100 351,100 351,100 351,100 351,100
COMPUTER SERVICES 6,434 7,000 7,000 7,000 7,000 7,000 7,000 7,000
UTILITIES 63,210 155,020 103,690 51,990 55,295 55,320 55,320 55,320
REPAIR & MAINTENANCE 0 0 0 0 0 0 0 0
INSURANCE 94,131 99,533 110,598 107,760 110,651 112,235 113,865 114,225
TRANSFER TO RETIREE HEALTH 0 0 0 1,196,000 1,132,000 1,050,000 744,000 718,000
FLEET VEHICLE CHARGES 12,605 12,455 12,455 5,080 5,241 5,407 5,578 5,755
TOTAL EXPENSES 3,839,839$ 2,680,267$ 1,899,824$ 2,371,275$ 2,137,664$ 2,143,670$ 1,939,616$ 2,023,278$
Finance/Treasurer ‐ 253
Assessing ‐ 257
General Administration ‐ 261
ADMINISTRATIVE DEPARTMENT EXPENDITURES
Fund 101 ‐ General Fund
O:\All\2022 budget\Budget Book\Tab 3\22.GENERAL FUND29

2022 BUDGET - 5 YEAR PROJECTIONS
2021 2021
2020 ORIGINAL AMENDED 2022 2023 2024 2025 2026
ACTUAL BUDGET BUDGET BUDGET PROJECTION PROJECTION PROJECTION PROJECTION
SALARIES & WAGES 127,633 136,295 140,089 138,480 139,039 139,039 139,039 139,039
FRINGE BENEFITS 75,366 78,369 74,000 74,392 76,498 78,615 81,044 83,816
SUPPLIES 764 750 750 750 750 750 750 750
CONTRACTUAL SERVICES 26,646 31,000 31,000 32,000 31,000 31,000 31,000 31,000
OTHER EXPENSES 37,165 61,200 61,200 61,200 61,200 61,200 61,200 61,200
TOTAL EXPENSES 267,575$ 307,614$ 307,039$ 306,822$ 308,487$ 310,604$ 313,033$ 315,805$
2021 2021
2020 ORIGINAL AMENDED 2022 2023 2024 2025 2026
ACTUAL BUDGET BUDGET BUDGET PROJECTION PROJECTION PROJECTION PROJECTION
SALARIES & WAGES 586,681 603,282 568,411 552,139 556,332 560,380 562,584 564,833
FRINGE BENEFITS 242,866 243,358 248,450 229,822 233,934 238,019 242,713 248,246
SUPPLIES 17,389 11,250 11,250 10,500 10,810 10,500 17,107 21,712
CONTRACTUAL SERVICES 319 10,000 10,000 1,000 1,000 1,000 1,000 1,000
OTHER EXPENSES 8,848 15,500 15,500 6,750 6,750 6,750 6,750 6,750
FLEET VEHICLE CHARGES (195,506) (119,313) (119,313) (117,450) (118,492) (119,519) (120,278) (121,193)
TOTAL EXPENSES 660,597$ 764,077$ 734,298$ 682,761$ 690,334$ 697,130$ 709,876$ 721,348$
2021 2021
2020 ORIGINAL AMENDED 2022 2023 2024 2025 2026
ACTUAL BUDGET BUDGET BUDGET PROJECTION PROJECTION PROJECTION PROJECTION
CONTRACTUAL SERVICES 70,388 82,275 82,275 109,150 109,150 109,450 109,850 109,850
INSURANCE 5,441 5,550 5,550 9,989 10,189 10,393 10,600 10,812
SUPPLIES 34 0 0 0 0 0 0 0
OTHER EXPENSES 200 4,750 4,750 4,410 4,910 4,750 4,750 4,750
TOTAL EXPENSES 76,063$ 92,575$ 92,575$ 123,549$ 124,249$ 124,593$ 125,200$ 125,412$
*combined Retiree Health Fund & Pension Board in 2022
TOTAL ADMIN EXPENSES 7,461,211$ 6,577,344$ 5,480,235$ 5,731,519$ 5,530,423$ 5,628,379$ 5,399,393$ 5,546,367$
ADMINISTRATIVE DEPARTMENT EXPENDITURES
Human Resources ‐ 270
DPW Management Services ‐ 441
Pension RHC Board ‐ 272
Fund 101 ‐ General Fund
O:\All\2022 budget\Budget Book\Tab 3\22.GENERAL FUND30

2022 BUDGET - 5 YEAR PROJECTIONS
2021 2021
2020 ORIGINAL AMENDED 2022 2023 2024 2025 2026
ACTUAL BUDGET BUDGET BUDGET PROJECTION PROJECTION PROJECTION PROJECTION
City Council
Mayor 1.00 1.00 1.00 1.00 1.00 1.00 1.00 1.00
City Council 6.00 6.00 6.00 6.00 6.00 6.00 6.00 6.00
Total City Council 7.00 7.00 7.00 7.00 7.00 7.00 7.00 7.00
City Manager
City Manager 1.00 1.00 1.00 1.00 1.00 1.00 1.00 1.00
Assistant City Manager 1.00 1.00 1.00 1.00 1.00 1.00 1.00 1.00
Director of Authorities (TIFA allocate 1.00 1.00 1.00 0.00 0.00 0.00 0.00 0.00
Executive Assistant 1.00 1.00 1.00 1.00 1.00 1.00 1.00 1.00Business Development ‐
Community Relations 1.00 1.00 0.00 0.00 0.00 0.00 0.00 0.00Coordinator of Media
Communications 1.00 1.00 1.00 1.00 1.00 1.00 1.00 1.00Part‐time Downtown Engagement
Specialist (TIFA allocated) 1.00 1.00 1.00 1.00 1.00 1.00 1.00 1.00
Part‐time Receptionist 2.00 2.00 2.00 2.00 2.00 2.00 2.00 2.00
Part‐time Graphic Designer 1.00 1.00 1.00 1.00 1.00 1.00 1.00 1.00
Part‐time new CM position 0.00 0.00 0.00 1.00 1.00 1.00 1.00 1.00
Interns 2.00 2.00 2.00 2.00 2.00 2.00 2.00 2.00
Total City Manager 12.00 12.00 11.00 11.00 11.00 11.00 11.00 11.00
City Clerk & Elections
City Clerk 1.00 1.00 1.00 1.00 1.00 1.00 1.00 1.00
Deputy Clerk 1.00 1.00 1.00 1.00 1.00 1.00 1.00 1.00
Part‐time Voter Registration Clerk 1.00 1.00 1.00 1.00 1.00 1.00 1.00 1.00
Total City Clerk & Elections 3.00 3.00 3.00 3.00 3.00 3.00 3.00 3.00
Finance/Treasurer
Finance Director ‐ Treasurer 1.00 1.00 1.00 1.00 1.00 1.00 1.00 1.00Deputy Finance Director ‐ Deputy
Treasurer 1.00 1.00 1.00 1.00 1.00 1.00 1.00 1.00
Accounts Receivable Manager 1.00 1.00 1.00 1.00 1.00 1.00 1.00 1.00
Accountant 2.00 2.00 2.00 2.00 2.00 2.00 2.00 2.00
Cashier ‐ Clerk III 2.00 2.00 2.00 2.00 2.00 2.00 2.00 2.00
Intern 1.00 1.00 0.00 0.00 0.00 0.00 0.00 0.00
Total Finance 8.00 8.00 7.00 7.00 7.00 7.00 7.00 7.00
Assessor
Assessor 1.00 1.00 0.00 0.00 0.00 0.00 0.00 0.00
Deputy Assessor 1.00 1.00 0.00 0.00 0.00 0.00 0.00 0.00
Appraiser I 1.00 1.00 0.00 0.00 0.00 0.00 0.00 0.00
Appraiser II 1.00 1.00 0.00 0.00 0.00 0.00 0.00 0.00
Clerk III 1.00 1.00 0.00 0.00 0.00 0.00 0.00 0.00
Total Assessor 5.00 5.00 0.00 0.00 0.00 0.00 0.00 0.00
Human Resources
Human Resources Generalist 1.00 1.00 1.00 1.00 1.00 1.00 1.00 1.00
Human Resources Development 1.00 1.00 1.00 1.00 1.00 1.00 1.00 1.00
Intern 1.00 1.00 1.00 1.00 1.00 1.00 1.00 1.00
Total Human Resources 3.00 3.00 3.00 3.00 3.00 3.00 3.00 3.00
Public Works Adminstration
Director of Public Services 1.00 1.00 1.00 1.00 1.00 1.00 1.00 1.00
Deputy Director 1.00 1.00 0.00 0.00 0.00 0.00 0.00 0.00
Administrative Assistant 1.00 1.00 1.00 1.00 1.00 1.00 1.00 1.00
GIS Technician 1.00 1.00 1.00 1.00 1.00 1.00 1.00 1.00
Manager 3.00 3.00 3.00 3.00 3.00 3.00 3.00 3.00
Clerk III 2.00 2.00 2.00 2.00 2.00 2.00 2.00 2.00
GIS PT 1.00 1.00 1.00 1.00 1.00 1.00 1.00 1.00
Total Public Works 10.00 10.00 9.00 9.00 9.00 9.00 9.00 9.00
Total Administration 48.00 48.00 40.00 40.00 40.00 40.00 40.00 40.00
ADMINISTRATIVE PERSONNEL
Fund 101 ‐ General Fund
O:\All\2022 budget\Budget Book\Tab 3\22.GENERAL FUND31

2022 BUDGET - 5 YEAR PROJECTIONS
2021 2021
2020 ORIGINAL AMENDED 2022 2023 2024 2025 2026
ACTUAL BUDGET BUDGET BUDGET PROJECTION PROJECTION PROJECTION PROJECTION
SALARIES & WAGES 66,835 66,523 67,944 67,853 67,853 67,853 67,853 67,853
FRINGE BENEFITS 31,722 32,343 28,047 27,775 27,883 27,921 28,135 28,554
SUPPLIES 58 850 850 850 850 850 850 850
OTHER EXPENSES 8,135 10,181 10,181 14,406 12,618 12,837 13,061 13,294
CONTRACTUAL SERVICES 11,630 94,203 115,583 254,914 165,290 67,743 54,975 36,000
CAPITAL EXPENDITURES 316,506 0 0 0 0 0 0 0
DEBT SERVICE 65,691 64,442 64,442 68,129 66,754 65,379 66,629 72,438
TOTAL EXPENSES 500,579$ 268,542$ 287,047$ 433,927$ 341,248$ 242,583$ 231,503$ 218,989$
2021 2021
2020 ORIGINAL AMENDED 2022 2023 2024 2025 2026
ACTUAL BUDGET BUDGET BUDGET PROJECTION PROJECTION PROJECTION PROJECTION
PROPERTY TAXES 0 2,497,837 2,497,837 2,567,876 2,633,632 2,705,219 2,781,945 2,859,965
STATE SHARED REVENUE & REFU 0 221,806 221,806 191,056 187,100 179,465 167,311 164,235TOTAL REVENUE ‐$ 2,719,643$ 2,719,643$ 2,758,932$ 2,820,732$ 2,884,684$ 2,949,256$ 3,024,200$
TRANS TO OTHER FUNDS 0 2,360,000 2,360,000 1,525,000 630,000 3,580,000 2,980,000 8,950,000
TOTAL EXPENSES ‐$ 2,360,000$ 2,360,000$ 1,525,000$ 630,000$ 3,580,000$ 2,980,000$ 8,950,000$
2021 2021
2020 ORIGINAL AMENDED 2022 2023 2024 2025 2026
ACTUAL BUDGET BUDGET BUDGET PROJECTION PROJECTION PROJECTION PROJECTION
OTHER EXPENSES 962,221 300 300 300 300 300 300 300
CAPITAL EXPENDITURES 257,932 400,000 1,597,245 0 0 0 0 0
TRANS TO OTHER FUNDS 9,052,569 303,917 303,917 1,863,400 1,861,325 1,858,525 1,864,900 1,865,375
TOTAL EXPENSES 10,272,723$ 704,217$ 1,901,462$ 1,863,700$ 1,861,625$ 1,858,825$ 1,865,200$ 1,865,675$
TOTAL INFRASTRUCTURE
TOTAL EXPENSES 10,773,301$ 3,332,759$ 4,548,509$ 3,822,627$ 2,832,873$ 5,681,408$ 5,076,703$ 11,034,664$
2021 2021
2020 ORIGINAL AMENDED 2022 2023 2024 2025 2026
ACTUAL BUDGET BUDGET BUDGET PROJECTION PROJECTION PROJECTION PROJECTION
Storm Water Management
City Planner 1.00 1.00 1.00 1.00 1.00 1.00 1.00 1.00
Total Storm Water Management 1.00 1.00 1.00 1.00 1.00 1.00 1.00 1.00
Total Infrastructure 1.00 1.00 1.00 1.00 1.00 1.00 1.00 1.00
Fund 101 ‐ General Fund
Storm Water Management ‐ 537
Capital Improvements ‐ 901
INFRASTRUCTURE PERSONNEL
INFRASTRUCTURE ‐ CAPITAL EXPENDITURES
Street Improvement ‐ 446
O:\All\2022 budget\Budget Book\Tab 3\22.GENERAL FUND32

2022 BUDGET - 5 YEAR PROJECTIONS
2021 2021
2020 ORIGINAL AMENDED 2022 2023 2024 2025 2026
ACTUAL BUDGET BUDGET BUDGET PROJECTION PROJECTION PROJECTION PROJECTION
SALARIES & WAGES 462,731 459,427 463,050 457,938 470,958 481,945 491,321 500,885
FRINGE BENEFITS 250,244 272,482 249,435 242,544 249,148 255,272 262,282 270,604
SUPPLIES 55,017 39,100 39,100 39,100 39,100 39,100 39,100 39,100
CONTRACTUAL SERVICES 62,871 10,500 10,500 12,440 12,440 12,440 12,440 12,440
COMPUTER SERVICES 1,795 3,900 3,900 5,700 5,700 5,700 5,700 5,700
OTHER EXPENSES 668 (1,021,056) (455,381) (585,093) (590,979) (596,924) (602,929) (608,994)
UTILITIES 404,428 689,624 642,546 430,175 434,910 439,183 443,111 446,595
REPAIR & MAINTENANCE 339,284 1,070,724 684,350 531,349 454,849 454,849 454,849 454,869
CAPITAL EXPENDITURES 940,212 1,675,000 1,854,326 625,000 15,000 4,000 100,000 17,500
FLEET VEHICLE CHARGES 184,207 150,936 150,936 139,104 142,175 145,319 148,412 151,669
TOTAL EXPENSES 2,701,458$ 3,350,637$ 3,642,762$ 1,898,257$ 1,233,301$ 1,240,884$ 1,354,286$ 1,290,368$
2021 2021
2020 ORIGINAL AMENDED 2022 2023 2024 2025 2026
ACTUAL BUDGET BUDGET BUDGET PROJECTION PROJECTION PROJECTION PROJECTION
SALARIES & WAGES 329,525 395,977 365,113 314,090 325,002 336,777 342,536 348,409
FRINGE BENEFITS 163,505 179,816 161,897 145,988 152,779 159,973 166,326 173,027
SUPPLIES 53,965 81,450 81,450 64,250 64,250 64,250 64,250 64,250
REPAIR & MAINTENANCE 181,502 475,150 185,950 54,900 54,000 52,000 52,000 52,000
CONTRACTUAL SERVICES 74,524 92,000 92,000 92,000 92,000 92,000 92,000 92,000
OTHER EXPENSES 20,575 28,980 28,980 29,160 26,160 26,160 26,160 26,160
CAPITAL EXPENDITURES 41,217 75,000 212,200 0 0 4,000 0 0
EQUIPMENT RENTAL EXPENSES 653,681 636,444 636,444 529,591 545,047 560,969 577,245 594,103
TOTAL EXPENSES 1,518,494$ 1,964,817$ 1,764,034$ 1,229,979$ 1,259,238$ 1,296,129$ 1,320,517$ 1,349,949$
2021 2021
2020 ORIGINAL AMENDED 2022 2023 2024 2025 2026
ACTUAL BUDGET BUDGET BUDGET PROJECTION PROJECTION PROJECTION PROJECTION
SUPPLIES 24,973 53,500 53,500 116,500 55,500 56,500 46,500 56,500
COMPUTER SERVICES 315,737 372,872 372,872 414,910 414,910 414,910 414,910 414,910
CONTRACTUAL SERVICES 0 0 0 50,000 0 0 0 0
REPAIR & MAINTENANCE 38,225 60,700 60,700 76,100 61,100 61,100 61,100 61,100
CAPITAL EXPENDITURES 43,188 0 0 0 20,000 60,000 0 0
TOTAL EXPENSES 422,124$ 487,072$ 487,072$ 657,510$ 551,510$ 592,510$ 522,510$ 532,510$
TOTAL GENERAL SUPPORT 4,642,076$ 5,802,526$ 5,893,868$ 3,785,746$ 3,044,049$ 3,129,523$ 3,197,313$ 3,172,827$
MIS ‐ 228
Fund 101 ‐ General Fund
Facilities ‐ 265
Parks & Grounds ‐ 266
GENERAL SUPPORT DEPARTMENT EXPENDITURES
O:\All\2022 budget\Budget Book\Tab 3\22.GENERAL FUND33

2022 BUDGET - 5 YEAR PROJECTIONS
2021 2021
2020 ORIGINAL AMENDED 2022 2023 2024 2025 2026
ACTUAL BUDGET BUDGET BUDGET PROJECTION PROJECTION PROJECTION PROJECTION
Facilities
Crew Leader 1.00 1.00 1.00 1.00 1.00 1.00 1.00 1.00
General Maintenance 7.00 7.00 7.00 7.00 7.00 7.00 7.00 7.00
Part‐time 5.00 5.00 1.00 0.00 0.00 0.00 0.00 0.00
Seasonal 0.00 0.00 0.00 0.00 0.00 0.00 0.00 0.00
Total Facilities 13.00 13.00 9.00 8.00 8.00 8.00 8.00 8.00
Parks and Grounds
Crew Leader 1.00 1.00 1.00 1.00 1.00 1.00 1.00 1.00
General Maintenance 5.00 4.00 4.00 4.00 4.00 4.00 4.00 4.00
Seasonal 4.00 4.00 4.00 4.00 4.00 4.00 4.00 4.00
Total Parks and Grounds 10.00 9.00 9.00 9.00 9.00 9.00 9.00 9.00
Total General Support 23.00 22.00 18.00 17.00 17.00 17.00 17.00 17.00
GENERAL SUPPORT PERSONNEL
Fund 101 ‐ General Fund
O:\All\2022 budget\Budget Book\Tab 3\22.GENERAL FUND34

2022 BUDGET - 5 YEAR PROJECTIONS
2021 2021
2020 ORIGINAL AMENDED 2022 2023 2024 2025 2026
ACTUAL BUDGET BUDGET BUDGET PROJECTION PROJECTION PROJECTION PROJECTION
SALARIES & WAGES 151,842 173,128 161,942 180,075 181,540 182,028 182,028 182,028
FRINGE BENEFITS 72,953 80,810 76,123 91,457 94,054 96,659 99,563 102,845
SUPPLIES 32,782 14,950 17,380 42,015 15,792 15,970 14,150 15,932
OTHER EXPENSES 110,407 204,093 204,093 224,935 233,526 246,108 249,781 263,300
CONTRACTUAL SERVICES 2,532 6,200 6,200 6,000 6,500 6,500 6,500 6,000
UTLITIES 492 1,138 1,138 1,600 1,600 3,400 1,600 1,600
REPAIR & MAINTENANCE 2,269 3,000 3,000 4,000 4,000 4,000 4,000 4,000
CAPITAL EXPENDITURES 6,475 20,000 20,000 0 0 0 0 0
TOTAL EXPENSES 379,752$ 503,319$ 489,876$ 550,082$ 537,012$ 554,665$ 557,622$ 575,705$
2021 2021
2020 ORIGINAL AMENDED 2022 2023 2024 2025 2026
ACTUAL BUDGET BUDGET BUDGET PROJECTION PROJECTION PROJECTION PROJECTION
SALARIES & WAGES 36,319 41,000 41,000 46,897 46,897 46,897 46,897 46,897
FRINGE BENEFITS 3,719 4,223 4,223 4,859 4,859 4,859 4,859 4,859
OTHER EXPENSES 85 600 600 600 600 600 600 600
UTILITES 1,507 1,800 1,800 1,800 1,800 1,800 1,800 1,800
INSURANCE 2,556 2,599 2,660 2,721 2,783 2,847 2,912 2,978
FLEET VEHICLE CHARGES 16,405 19,296 19,296 19,790 20,417 21,065 21,733 22,422
TOTAL EXPENSES 60,591$ 69,518$ 69,579$ 76,667$ 77,356$ 78,068$ 78,801$ 79,556$
2021 2021
2020 ORIGINAL AMENDED 2022 2023 2024 2025 2026
ACTUAL BUDGET BUDGET BUDGET PROJECTION PROJECTION PROJECTION PROJECTION
SALARIES & WAGES 239,463 419,351 419,351 479,954 493,159 505,615 516,302 527,405
FRINGE BENEFITS 78,308 97,119 97,119 84,414 86,681 88,970 91,205 93,563
SUPPLIES 27,971 43,025 43,025 53,925 41,675 26,700 31,275 21,675
OTHER EXPENSES 2,308 25,902 25,902 10,010 1,769 (788) (3,386) (9,680)
CONTRACTUAL SERVICES 22,531 24,600 24,600 24,850 23,250 22,350 23,250 22,350
UTILITIES 1,085 1,100 1,100 1,200 1,200 1,200 1,200 1,200
REPAIR & MAINTENANCE 144 1,600 1,600 1,600 1,750 1,750 1,750 1,750
CAPITAL EXPENDITURES 0 11,000 11,000 0 0 0 0 0
FLEET VEHICLE CHARGES 8,946 9,516 9,516 0 0 0 0 0
TOTAL EXPENSES 380,757$ 633,213$ 633,213$ 655,953$ 649,484$ 645,797$ 661,596$ 658,263$
Recreation ‐ 755
Fund 101 ‐ General Fund
Senior Citizens ‐ 685
SMART Grant ‐ 686
COMMUNITY PROGRAM EXPENDITURES
O:\All\2022 budget\Budget Book\Tab 3\22.GENERAL FUND35

2022 BUDGET - 5 YEAR PROJECTIONS
2021 2021
2020 ORIGINAL AMENDED 2022 2023 2024 2025 2026
ACTUAL BUDGET BUDGET BUDGET PROJECTION PROJECTION PROJECTION PROJECTION
SALARIES & WAGES 0 0 135,718 309,066 317,855 326,094 328,303 330,555
FRINGE BENEFITS 0 0 45,501 83,878 87,485 91,134 93,823 96,664
SUPPLIES 0 0 0 55,830 49,500 49,250 49,250 49,250
OTHER EXPENSES 0 0 0 5,000 2,750 2,000 2,000 2,000
CONTRACTUAL SERVICES 0 0 0 103,800 103,800 103,800 103,800 103,800
INSURANCE 0 0 0 3,037 3,114 3,193 3,274 3,357
REPAIR & MAINTENANCE 0 0 0 716,800 32,600 31,100 60,600 31,100
CAPITAL EXPENDITURES 0 0 231,200 35,300 0 0 0 0
INTERFUND CHARGES 0 0 0 135,516 139,814 144,249 148,824 153,544
TOTAL EXPENSES ‐$ ‐$ 412,419$ 1,448,227$ 736,918$ 750,820$ 789,874$ 770,270$
TOTAL COMMUNITY PROGRAMS 821,100$ 1,206,050$ 1,605,087$ 2,730,929$ 2,000,770$ 2,029,350$ 2,087,893$ 2,083,794$
2021 2021
2020 ORIGINAL AMENDED 2022 2023 2024 2025 2026
ACTUAL BUDGET BUDGET BUDGET PROJECTION PROJECTION PROJECTION PROJECTION
Senior Services
Senior Services Director 1.00 1.00 1.00 1.00 1.00 1.00 1.00 1.00
Senior Administrative Assistant 1.00 0.00 0.00 0.00 0.00 0.00 0.00 0.00
Program Coordinator 1.00 2.00 2.00 2.00 2.00 2.00 2.00 2.00
Part‐Time Seniors Health ‐
Wellness Coordinator 1.00 1.00 1.00 1.00 1.00 1.00 1.00 1.00
Smart Bus Drivers 4.00 4.00 4.00 4.00 4.00 4.00 4.00 4.00
Total Senior Citizens 8.00 8.00 8.00 8.00 8.00 8.00 8.00 8.00
Recreation
Recreation Director 1.00 1.00 1.00 1.00 1.00 1.00 1.00 1.00
Recreation Coordinator 1.00 1.00 1.00 1.00 1.00 1.00 1.00 1.00
Part‐Time Employees (partially
split with Seniors) 7.00 7.00 7.00 7.00 7.00 7.00 7.00 7.00
Seasonal Employees 21.00 34.00 34.00 34.00 34.00 34.00 34.00 34.00
Total Recreation 30.00 43.00 43.00 43.00 43.00 43.00 43.00 43.00
Parks
Parks Director 1.00 1.00 1.00 1.00 1.00 1.00
General Maintenance 2.00 2.00 2.00 2.00 2.00 2.00
Seasonal 2.00 2.00 2.00 2.00 2.00 2.00
Total Parks 0 0 5 5 5 5 5 5
Total Community Programs 38.00 51.00 56.00 56.00 56.00 56.00 56.00 56.00
COMMUNITY PROGRAM PERSONNEL
Fund 101 ‐ General Fund
Parks ‐ 770
Fund 101 ‐ General Fund
COMMUNITY PROGRAM EXPENDITURES
O:\All\2022 budget\Budget Book\Tab 3\22.GENERAL FUND36

2022 BUDGET - 5 YEAR PROJECTIONS
2021 2021
2020 ORIGINAL AMENDED 2022 2023 2024 2025 2026
ACTUAL BUDGET BUDGET BUDGET PROJECTION PROJECTION PROJECTION PROJECTION
SALARIES & WAGES 429,640 450,636 450,636 462,485 475,038 485,757 493,639 501,679
FRINGE BENEFITS 222,529 233,953 221,065 216,666 223,292 229,668 236,472 244,204
SUPPLIES 9,073 13,375 13,375 13,900 13,910 14,020 14,130 14,240
CONTRACTUAL SERVICES 282,175 301,900 301,900 301,900 282,900 282,900 282,900 282,900
COMPUTER SERVICES 6,023 5,879 5,879 3,500 3,500 3,503 3,500 3,500
OTHER EXPENSES 12,268 22,150 22,150 22,150 22,150 22,150 22,150 22,150
UTILITIES 3,920 4,319 4,319 4,319 4,493 4,500 4,600 4,700
REPAIR & MAINTENANCE 16,064 13,000 13,000 13,000 13,000 13,000 13,000 13,000
FLEET VEHICLE CHARGES 38,153 37,402 37,402 38,355 39,572 40,827 42,122 43,458
TOTAL EXPENSES 1,019,845$ 1,082,614$ 1,069,726$ 1,076,275$ 1,077,855$ 1,096,325$ 1,112,513$ 1,129,831$
2021 2021
2020 ORIGINAL AMENDED 2022 2023 2024 2025 2026
ACTUAL BUDGET BUDGET BUDGET PROJECTION PROJECTION PROJECTION PROJECTION
SALARIES & WAGES 157,137 156,870 232,226 233,561 235,082 235,082 235,082 235,082
FRINGE BENEFITS 70,328 71,465 106,166 108,080 110,014 111,785 114,018 116,768
SUPPLIES 992 0 0 0 0 0 0 0
CONTRACTUAL SERVICES 3,792 10,600 10,600 35,600 10,600 10,600 10,600 10,600
OTHER EXPENSES 5,220 15,485 15,485 13,485 13,485 13,485 13,485 13,485
UTILITIES 3,484 2,700 2,700 2,700 2,700 2,700 2,700 2,700
TOTAL EXPENSES 240,953$ 257,120$ 367,177$ 393,426$ 371,881$ 373,652$ 375,885$ 378,635$
TOTAL PLANNING 1,260,799$ 1,339,734$ 1,436,903$ 1,469,701$ 1,449,736$ 1,469,977$ 1,488,398$ 1,508,466$
2021 2021
2020 ORIGINAL AMENDED 2022 2023 2024 2025 2026
ACTUAL BUDGET BUDGET BUDGET PROJECTION PROJECTION PROJECTION PROJECTION
Building Services
Building Official 1.00 1.00 1.00 1.00 1.00 1.00 1.00 1.00
Building Inspector 2.00 2.00 2.00 2.00 2.00 2.00 2.00 2.00
Ordinance Enforcement Officer 2.00 2.00 2.00 2.00 2.00 2.00 2.00 2.00
Clerk III 2.00 2.00 2.00 2.00 2.00 2.00 2.00 2.00
Part‐time 0.00 0.00 0.00 0.00 0.00 0.00 0.00 0.00
Total Building 7.00 7.00 7.00 7.00 7.00 7.00 7.00 7.00
Comm. Development‐Administration
Comm. Dev. Director 1.00 1.00 1.00 1.00 1.00 1.00 1.00 1.00
Administrative Assistant 1.00 1.00 1.00 1.00 1.00 1.00 1.00 1.00
Economic Dev. Coordinator 0.00 0.00 1.00 1.00 1.00 1.00 1.00 1.00
Total Comm. Dev.‐Admin. 2.00 2.00 3.00 3.00 3.00 3.00 3.00 3.00
Total Planning/Development 9.00 9.00 10.00 10.00 10.00 10.00 10.00 10.00
Fund 101 ‐ General Fund
Building Services ‐ 371
Community Development Administration ‐ 703
PLANNING/DEVELOPMENT PERSONNEL
PLANNING/DEVELOPMENT EXPENDITURES
O:\All\2022 budget\Budget Book\Tab 3\22.GENERAL FUND37

2022 BUDGET - 5 YEAR PROJECTIONS
2021 2021
2020 ORIGINAL AMENDED 2022 2023 2024 2025 2026
ACTUAL BUDGET BUDGET BUDGET PROJECTION PROJECTION PROJECTION PROJECTION
GRANTS 909,264 28,300 28,300 29,000 31,000 37,800 31,400 35,000
STATE GRANTS/OTHER 6,390 7,183 7,183 5,000 5,000 5,000 5,000 5,000
CHARGES FOR SERVICES 498,186 464,813 464,813 466,320 466,320 466,320 466,320 466,320
OTHER REVENUE 20,771 19,000 19,000 15,000 15,000 15,000 15,000 15,000
PROPERTY TAXES 9,744,343 9,966,521 9,966,521 10,291,469 10,448,109 10,650,282 10,869,967 11,116,911
STATE SHARED REVENUE & REFUNDS 901,059 857,572 857,572 742,497 728,145 699,672 654,349 642,476
LICENSES AND PERMITS 10,300 12,000 12,000 12,000 12,000 12,000 12,000 12,000
REIMBURSED EXPENSES ‐ ‐ ‐ ‐ ‐ ‐ ‐ ‐
NONOPERATING REVENUE 4,126 1,400 1,400 2,000 1,400 1,400 1,400 2,000
TOTAL POLICE REVENUES 12,094,440$ 11,356,789$ 11,356,789$ 11,563,286$ 11,706,974$ 11,887,474$ 12,055,436$ 12,294,707$
2021 20212020 ORIGINAL AMENDED 2022 2023 2024 2025 2026
ACTUAL BUDGET BUDGET BUDGET PROJECTION PROJECTION PROJECTION PROJECTION
SALARIES & WAGES 4,933,886 5,316,544 5,136,270 5,398,724 5,657,965 5,856,710 5,965,699 6,079,496
FRINGE BENEFITS 2,829,666 2,848,166 2,694,286 2,596,079 2,574,130 2,472,399 2,459,104 2,503,427
SUPPLIES 238,626 278,150 310,415 288,845 234,801 255,111 230,476 233,079
CONTRACTUAL SERVICES 360,096 347,225 347,225 414,710 401,745 408,245 401,710 401,710
OTHER EXPENSES 103,922 843,871 432,206 560,541 513,512 522,965 496,732 539,422
COMPUTER SERVICES 0 0 0 0 0 0 0 0
UTILITIES 18,504 21,380 21,380 19,750 19,750 19,750 19,750 19,750
REPAIR & MAINTENANCE 128,251 182,620 182,620 155,485 195,635 176,835 172,835 156,235
INSURANCE 49,957 50,395 55,931 56,810 57,703 58,610 59,531 60,467
CAPITAL EXPENDITURES 33,093 278,200 278,200 1,144,200 201,200 131,200 40,200 37,200
EQUIPMENT RENTAL 0 0 0 0 0 0 0 0
FLEET VEHICLE CHARGES 329,422 324,534 324,534 357,871 369,221 380,931 393,012 405,477
TOTAL POLICE EXPENSES 9,025,424$ 10,491,085$ 9,783,067$ 10,993,015$ 10,225,662$ 10,282,756$ 10,239,049$ 10,436,263$
NET REVENUES/EXPENSES 3,069,016$ 865,704$ 1,573,722$ 570,271$ 1,481,312$ 1,604,718$ 1,816,387$ 1,858,444$
Fund 101 ‐ General Fund
(Supported by 5.9713 Mills)
POLICE DEPARTMENT SUMMARY
O:\All\2022 budget\Budget Book\Tab 3\22.GENERAL FUND38

2022 BUDGET - 5 YEAR PROJECTIONS
2021 2021
2020 ORIGINAL AMENDED 2022 2023 2024 2025 2026
ACTUAL BUDGET BUDGET BUDGET PROJECTION PROJECTION PROJECTION PROJECTION
GRANTS 909,264 28,300 28,300 29,000 31,000 37,800 31,400 35,000
STATE GRANTS/OTHER 6,390 7,183 7,183 5,000 5,000 5,000 5,000 5,000
CHARGES FOR SERVICES 122,947 142,813 142,813 168,320 168,320 168,320 168,320 168,320
OTHER REVENUE 3,604 0 0 2,000 2,000 2,000 2,000 2,000
TOTAL REVENUES 1,042,206$ 178,296$ 178,296$ 204,320$ 206,320$ 213,120$ 206,720$ 210,320$
SALARIES & WAGES 4,334,777 4,670,442 4,484,631 4,735,406 4,988,302 5,180,806 5,285,648 5,392,565
FRINGE BENEFITS 2,490,136 2,500,272 2,349,455 2,208,573 2,198,598 2,123,462 2,118,563 2,159,725
SUPPLIES 195,864 225,300 257,565 236,470 173,826 204,136 180,751 189,404
OTHER EXPENSES 90,354 814,821 403,156 532,991 485,962 495,415 469,182 511,872
CONTRACTUAL SERVICES 1,765 4,020 4,020 4,020 4,020 4,020 4,020 4,020
UTILITIES 1,570 1,380 1,380 1,750 1,750 1,750 1,750 1,750
REPAIR & MAINTENANCE 58,252 55,350 55,350 37,200 77,350 58,550 54,550 37,950
CAPITAL EXPENDITURES 33,093 148,200 148,200 34,200 31,200 31,200 40,200 31,200
FLEET VEHICLE CHARGES 312,270 306,427 306,427 348,023 359,061 370,449 382,198 394,320TOTAL EXPENSES 7,518,080$ 8,726,212$ 8,010,184$ 8,138,633$ 8,320,069$ 8,469,788$ 8,536,862$ 8,722,806$
2021 2021
2020 ORIGINAL AMENDED 2022 2023 2024 2025 2026
ACTUAL BUDGET BUDGET BUDGET PROJECTION PROJECTION PROJECTION PROJECTION
PROPERTY TAXES 9,744,343 9,966,521 9,966,521 10,291,469 10,448,109 10,650,282 10,869,967 11,116,911
STATE SHARED REVENUE & REFUNDS 901,059 857,572 857,572 742,497 728,145 699,672 654,349 642,476
LICENSES AND PERMITS 10,300 12,000 12,000 12,000 12,000 12,000 12,000 12,000
CHARGES FOR SERVICES 375,239 322,000 322,000 298,000 298,000 298,000 298,000 298,000
OTHER REVENUE 17,167 19,000 19,000 13,000 13,000 13,000 13,000 13,000
NONOPERATING REVENUE 4,126 1,400 1,400 2,000 1,400 1,400 1,400 2,000
TOTAL REVENUES 11,052,234$ 11,178,493$ 11,178,493$ 11,358,966$ 11,500,654$ 11,674,354$ 11,848,716$ 12,084,387$
SALARIES & WAGES 599,110 646,102 651,639 663,318 669,663 675,904 680,051 686,931
FRINGE BENEFITS 339,531 347,894 344,831 387,506 375,532 348,937 340,541 343,702
SUPPLIES 42,762 52,850 52,850 52,375 60,975 50,975 49,725 43,675
CONTRACTUAL SERVICES 358,331 343,205 343,205 410,690 397,725 404,225 397,690 397,690
OTHER EXPENSES 13,568 29,050 29,050 27,550 27,550 27,550 27,550 27,550
UTILITIES 16,935 20,000 20,000 18,000 18,000 18,000 18,000 18,000
REPAIR & MAINTENANCE 69,999 127,270 127,270 118,285 118,285 118,285 118,285 118,285
INSURANCE 49,957 50,395 55,931 56,810 57,703 58,610 59,531 60,467
CAPITAL EXPENDITURES 0 130,000 130,000 1,110,000 170,000 100,000 0 6,000
FLEET VEHICLE CHARGES 17,152 18,107 18,107 9,848 10,160 10,482 10,814 11,157
TOTAL EXPENSES 1,507,344$ 1,764,873$ 1,772,883$ 2,854,382$ 1,905,593$ 1,812,968$ 1,702,187$ 1,713,457$
TOTAL POLICE EXPENSES 9,025,424$ 10,491,085$ 9,783,067$ 10,993,015$ 10,225,662$ 10,282,756$ 10,239,049$ 10,436,263$
Fund 101 ‐ General Fund
Patrol ‐ 301
Police Administration ‐ 305
O:\All\2022 budget\Budget Book\Tab 3\22.GENERAL FUND39

2022 BUDGET - 5 YEAR PROJECTIONS
2021 2021
2020 ORIGINAL AMENDED 2022 2023 2024 2025 2026
ACTUAL BUDGET BUDGET BUDGET PROJECTION PROJECTION PROJECTION PROJECTION
Patrol
Lieutenant 3.00 3.00 3.00 3.00 3.00 3.00 3.00 3.00
Sergeant 5.00 5.00 5.00 5.00 5.00 5.00 5.00 5.00
Detective 5.00 5.00 5.00 5.00 5.00 5.00 5.00 5.00
Police Officer 38.00 38.00 38.00 38.00 38.00 38.00 38.00 38.00
Part‐time 2.00 6.00 6.00 6.00 6.00 6.00 6.00 6.00
Total Police ‐ Patrol 53.00 57.00 57.00 57.00 57.00 57.00 57.00 57.00
Police‐Administration
Police Chief 1.00 1.00 1.00 1.00 1.00 1.00 1.00 1.00
Deputy Police Chief 1.00 1.00 1.00 1.00 1.00 1.00 1.00 1.00
Administrative Assistant 1.00 1.00 1.00 1.00 1.00 1.00 1.00 1.00
Technical Services Coordinator 1.00 1.00 1.00 1.00 1.00 1.00 1.00 1.00
Clerk III 3.00 3.00 3.00 3.00 3.00 3.00 3.00 3.00
Part‐time/Intern 9.00 9.00 9.00 9.00 9.00 9.00 9.00 9.00
Total Police ‐ Administration 16.00 16.00 16.00 16.00 16.00 16.00 16.00 16.00
Total Police Personnel 69.00 73.00 73.00 73.00 73.00 73.00 73.00 73.00
POLICE DEPARTMENT PERSONNEL
Fund 101 ‐ General Fund
O:\All\2022 budget\Budget Book\Tab 3\22.GENERAL FUND40

2022 BUDGET - 5 YEAR PROJECTIONS
O:\All\2022 budget\Budget Book\Tab 3\22.GENERAL FUND
$‐
$2,000,000
$4,000,000
$6,000,000
$8,000,000
$10,000,000
$12,000,000
$14,000,000
ORIGINAL2021
AMENDED2021
BUDGET2022
PROJECTION2023
PROJECTION2024
PROJECTION2025
PROJECTION2026
CITY OF AUBURN HILLS2022 POLICE BUDGET REVIEW
2021‐2026 OUTLOOK
TOTAL POLICE EXPENDITURES TOTAL POLICE REVENUES NET REV/EXP
41

2022 BUDGET - 5 YEAR PROJECTIONS
2021 2021
2020 ORIGINAL AMENDED 2022 2023 2024 2025 2026
ACTUAL BUDGET BUDGET BUDGET PROJECTION PROJECTION PROJECTION PROJECTION
PROPERTY TAXES 4,012,924 4,159,607 4,159,607 4,283,956 4,378,651 4,482,561 4,594,484 4,708,028
STATE SHARED REVENUE & REFUNDS 565,942 430,484 430,484 482,588 476,427 464,535 445,604 440,812
LICENSES AND PERMITS 43,307 120,000 120,000 122,000 123,000 124,020 125,060 126,121
CHARGES FOR SERVICES 679,334 744,560 744,560 846,800 847,616 848,448 849,297 850,163
OTHER REVENUE 3,396 3,500 11,834 4,000 4,070 4,141 4,214 4,288
GRANTS 534,737 156,661 156,661 197,985 95,165 ‐ ‐ ‐
TOTAL FIRE REVENUES 5,839,640$ 5,614,812$ 5,623,146$ 5,937,329$ 5,924,929$ 5,923,705$ 6,018,659$ 6,129,412$
CAPITAL EXPENDITURES 257,835 136,500 239,178 1,805,920 75,000 100,000 50,000 50,000
COMPUTER SERVICES 22,310 41,446 49,169 37,678 32,114 32,616 33,129 33,627
CONTRACTUAL SERVICES 195,086 328,664 361,664 237,176 275,043 240,965 278,942 244,363
FLEET VEHICLE CHARGES 411,853 544,752 544,752 422,952 433,820 444,415 455,331 466,373
FRINGE BENEFITS 914,727 985,385 924,476 1,095,049 1,140,525 1,188,990 1,239,281 1,289,964
INSURANCE 38,616 38,886 43,141 43,822 44,514 45,217 45,931 46,656
INTERFUND CHG EXPENS 12,142 12,226 12,226 16,380 16,900 17,436 17,989 18,560
OTHER EXPENSES 49,592 454,288 300,278 348,137 347,778 352,969 353,012 355,882
REPAIR & MAINTENANCE 40,059 34,876 34,876 33,277 33,544 36,818 34,095 34,377
SALARIES & WAGES 2,465,919 2,704,441 2,676,648 2,968,469 3,110,173 3,259,035 3,417,665 3,519,459
SUPPLIES 275,371 256,492 256,492 268,135 250,427 245,476 229,430 233,908
UTILITIES 11,360 12,725 12,725 21,700 21,700 21,700 21,700 21,700
TOTAL FIRE EXPENSES 4,694,871$ 5,550,681$ 5,455,625$ 7,298,695$ 5,781,538$ 5,985,637$ 6,176,505$ 6,314,869$
NET REVENUE/EXPENSES 1,144,769$ 64,131$ 167,522$ (1,361,366)$ 143,391$ (61,932)$ (157,846)$ (185,457)$
2021 2021
2020 ORIGINAL AMENDED 2022 2023 2024 2025 2026
ACTUAL BUDGET BUDGET BUDGET PROJECTION PROJECTION PROJECTION PROJECTION
PROPERTY TAXES 4,012,924 4,159,607 4,159,607 4,283,956 4,378,651 4,482,561 4,594,484 4,708,028
STATE SHARED REVENUE & REFUNDS 565,942 430,484 430,484 482,588 476,427 464,535 445,604 440,812
LICENSES AND PERMITS 43,307 120,000 120,000 122,000 123,000 124,020 125,060 126,121
CHARGES FOR SERVICES 24,322 40,000 40,000 40,800 41,616 42,448 43,297 44,163
OTHER REVENUE 2,791 3,500 3,500 4,000 4,070 4,141 4,214 4,288TOTAL REVENUES 4,649,287$ 4,753,591$ 4,753,591$ 4,933,344$ 5,023,764$ 5,117,705$ 5,212,659$ 5,323,412$
SALARIES & WAGES 244,280 252,232 276,875 345,469 352,226 359,540 364,843 368,501
FRINGE BENEFITS 76,355 81,380 100,305 128,757 131,419 134,094 137,155 140,489
SUPPLIES 5,810 9,725 9,725 10,357 13,918 7,883 10,357 13,918
CONTRACTUAL SERVICES 117,021 224,635 257,635 131,244 167,244 131,244 167,244 131,244
OTHER EXPENSES 14,749 43,775 43,775 30,725 27,475 27,700 27,475 27,575
UTILITIES 4,965 5,963 5,963 10,100 10,100 10,100 10,100 10,100
INSURANCE 27,088 27,277 31,527 32,025 32,531 33,045 33,567 34,097
CAPITAL EXPENDITURES 0 0 0 1,622,000 0 50,000 0 0
FLEET VEHICLE CHARGES 24,573 20,377 20,377 39,425 40,675 41,965 43,296 44,669TOTAL EXPENSES 514,841$ 665,364$ 746,182$ 2,350,102$ 775,588$ 795,571$ 794,037$ 770,593$
Fund 101 ‐ General Fund
Fire Administration ‐ 336
FIRE DEPARTMENT SUMMARY(Supported by 2.4940 Mills)
O:\All\2022 budget\Budget Book\Tab 3\22.GENERAL FUND42

2022 BUDGET - 5 YEAR PROJECTIONS
2021 2021
2020 ORIGINAL AMENDED 2022 2023 2024 2025 2026
ACTUAL BUDGET BUDGET BUDGET PROJECTION PROJECTION PROJECTION PROJECTION
GRANTS 523,978 156,661 156,661 197,985 95,165 0 0 0
CHARGES FOR SERVICES 655,012 704,560 704,560 806,000 806,000 806,000 806,000 806,000
OTHER REVENUE 605 0 8,334 0 0 0 0 0TOTAL REVENUES 1,179,594$ 861,221$ 869,555$ 1,003,985$ 901,165$ 806,000$ 806,000$ 806,000$
SALARIES & WAGES 2,032,938 2,284,713 2,232,277 2,428,191 2,558,916 2,696,139 2,845,032 2,938,623
FRINGE BENEFITS 756,859 817,480 747,630 887,419 928,043 971,682 1,016,292 1,060,496
SUPPLIES 263,959 241,392 241,392 251,678 219,926 231,443 213,023 204,007
CONTRACTUAL SERVICES 52,934 63,429 63,429 65,332 67,199 69,121 71,098 72,519
COMPUTER SERVICES 12,202 20,446 20,446 32,678 31,114 31,616 32,129 32,627
UTILITIES 6,396 6,762 6,762 11,600 11,600 11,600 11,600 11,600
OTHER EXPENSES 28,964 406,028 252,018 313,027 315,693 318,334 321,002 323,697
REPAIR & MAINTENANCE 40,059 34,876 34,876 33,277 33,544 36,818 34,095 34,377
INSURANCE 11,528 11,609 11,614 11,797 11,983 12,172 12,364 12,559
CAPITAL EXPENDITURES 257,835 136,500 239,178 183,920 75,000 50,000 50,000 50,000
FLEET VEHICLE CHARGES 387,280 524,375 524,375 383,527 393,145 402,450 412,035 421,704
TOTAL EXPENSES 3,850,952$ 4,547,610$ 4,373,997$ 4,602,446$ 4,646,163$ 4,831,375$ 5,018,670$ 5,162,209$
2021 2021
2020 ORIGINAL AMENDED 2022 2023 2024 2025 2026
ACTUAL BUDGET BUDGET BUDGET PROJECTION PROJECTION PROJECTION PROJECTION
GRANTS 10,759 0 0 0 0 0 0 0
CHARGES FOR SERVICES 0 0 0 0 0 0 0 0
OTHER REVENUE 0 0 0 0 0 0 0 0TOTAL REVENUES 10,759$ ‐$ ‐$ ‐$ ‐$ ‐$ ‐$ ‐$
SALARIES & WAGES 188,701 167,496 167,496 194,809 199,031 203,356 207,790 212,335
FRINGE BENEFITS 81,513 86,525 76,541 78,873 81,063 83,214 85,834 88,979
SUPPLIES 5,602 5,375 5,375 6,100 16,583 6,150 6,050 15,983
COMPUTER SERVICES 10,108 21,000 28,723 5,000 1,000 1,000 1,000 1,000
CONTRACTUAL SERVICES 25,131 40,600 40,600 40,600 40,600 40,600 40,600 40,600
OTHER EXPENSES 5,880 4,485 4,485 4,385 4,610 6,935 4,535 4,610
INTERFUND CHG EXPENS 12,142 12,226 12,226 16,380 16,900 17,436 17,989 18,560
TOTAL EXPENSES 329,078$ 337,707$ 335,446$ 346,147$ 359,787$ 358,691$ 363,798$ 382,067$
TOTAL FIRE REVENUES 5,839,640$ 5,614,812$ 5,623,146$ 5,937,329$ 5,924,929$ 5,923,705$ 6,018,659$ 6,129,412$
TOTAL FIRE EXPENSES 4,694,871$ 5,550,681$ 5,455,625$ 7,298,695$ 5,781,538$ 5,985,637$ 6,176,505$ 6,314,869$
Fund 101 ‐ General Fund
Fire Suppression ‐ 339
Fire ‐ Prevention ‐ 341
O:\All\2022 budget\Budget Book\Tab 3\22.GENERAL FUND43

2022 BUDGET - 5 YEAR PROJECTIONS
2021 2021
2020 ORIGINAL AMENDED 2022 2023 2024 2025 2026
ACTUAL BUDGET BUDGET BUDGET PROJECTION PROJECTION PROJECTION PROJECTION
Fire‐Administration
Fire Chief 1.00 1.00 1.00 1.00 1.00 1.00 1.00 1.00
Deputy Fire Chief 1.00 1.00 1.00 1.00 1.00 1.00 1.00 1.00
Administrative Officer 1.00 1.00 1.00 1.00 1.00
Clerk III 1.00 1.00 1.00 1.00 1.00 1.00 1.00 1.00
Intern 1.00 1.00 1.00 0.00 0.00 0.00 0.00 0.00
Total Fire‐Administration 4.00 4.00 4.00 4.00 4.00 4.00 4.00 4.00
Fire‐Prevention
Fire Marshal 0.00 0.00 0.00 0.00 0.00 0.00 0.00 0.00
Fire Inspector 2.00 2.00 2.00 2.00 2.00 2.00 2.00 2.00
PT position 0.00 0.00 0.00 1.00 1.00 1.00 1.00 1.00
Total Fire‐Prevention 2.00 2.00 2.00 3.00 3.00 3.00 3.00 3.00
Fire‐Suppression
Fire Captain 3.00 3.00 3.00 3.00 3.00 3.00 3.00 3.00
Administrative Officer 1.00 1.00 1.00 0.00 0.00 0.00 0.00 0.00
Lieutenants 3.00 3.00 3.00 3.00 3.00 3.00 3.00 3.00
Firefighter 18.00 18.00 18.00 22.00 22.00 22.00 22.00 22.00
Part‐time/Paid on Call Firefighters 12.00 12.00 12.00 12.00 12.00 12.00 12.00 12.00
Total Fire‐Suppression 37.00 37.00 37.00 40.00 40.00 40.00 40.00 40.00
Total Fire Personnel 43.00 43.00 43.00 47.00 47.00 47.00 47.00 47.00
FIRE DEPARTMENT PERSONNEL
Fund 101 ‐ General Fund
O:\All\2022 budget\Budget Book\Tab 3\22.GENERAL FUND44

2022 BUDGET - 5 YEAR PROJECTIONS
O:\All\2022 budget\Budget Book\Tab 3\22.GENERAL FUND
$(2,000,000)
$(1,000,000)
$‐
$1,000,000
$2,000,000
$3,000,000
$4,000,000
$5,000,000
$6,000,000
$7,000,000
$8,000,000
ORIGINAL AMENDED BUDGET PROJECTION PROJECTION PROJECTION PROJECTION
2021 2021 2022 2023 2024 2025 2026
CITY OF AUBURN HILLS2022 FIRE BUDGET REVIEW
2021‐2026 OUTLOOK
TOTAL FIRE REVENUES TOTAL FIRE EXPENSES NET REVENUE/EXPENSES
45

2022 BUDGET - 5 YEAR PROJECTIONS
2021 2021
2020 ORIGINAL AMENDED 2022 2023 2024 2025 2026
ACTUAL BUDGET BUDGET BUDGET PROJECTION PROJECTION PROJECTION PROJECTION
REVENUES
STATE HIGHWAY FUNDS 2,396,406 2,492,434 2,492,434 2,994,966 3,151,072 3,182,583 3,214,409 3,246,553
STATE GRANTS/OTHER 388,994 ‐ 88,994 ‐ ‐ ‐ ‐ ‐
INTEREST INCOME 1,004 5 5 5 5 5 5 5
OTHER REVENUE 62,467 140,116 396,214 52,122 52,122 52,122 52,122 52,122
CAP CHGS/CONTRIBUTED ‐ ‐ ‐ ‐ ‐ ‐ ‐ ‐
ACT 51/GRANT FUNDING 2,848,871$ 2,632,555$ 2,977,647$ 3,047,093$ 3,203,199$ 3,234,710$ 3,266,536$ 3,298,680$
MAJOR ROAD CITY/MILLAGE FUNDING 5,000,000 1,910,000 1,910,000 700,000 ‐ 2,530,000 ‐ 6,950,000
LOCAL ROAD CITY/MILLAGE FUNDING 3,500,000 450,000 450,000 825,000 630,000 1,050,000 2,980,000 2,000,000
WAYNE DISPOSAL FUNDING TO LOCAL 185,000 131,000 131,000 100,000 100,000 80,000 70,000 70,000 TOTAL REVENUES 11,533,871$ 5,123,555$ 5,468,647$ 4,672,093$ 3,933,199$ 6,894,710$ 6,316,536$ 12,318,680$
TOTAL REVENUE CHANGE (%) ‐55.6% ‐52.6% ‐14.6% ‐15.8% 75.3% ‐8.4% 95.0%
EXPENDITURES
SALARIES & WAGES 432,772 490,626 490,626 505,299 516,585 527,586 536,237 545,061
FRINGE BENEFITS 337,683 378,589 359,113 406,367 391,151 358,223 346,580 348,235
SUPPLIES 125,334 196,600 196,600 191,400 191,600 191,600 191,600 191,600
CONTRACTUAL SERVICES 36,633 25,000 52,038 25,000 25,000 25,000 25,000 25,000
OTHER EXPENSES 8,618 7,080 7,080 7,800 7,990 7,090 7,090 6,910
REPAIR & MAINT. 1,856,835 731,500 1,490,420 648,820 562,500 4,427,500 922,500 1,900,000
INSURANCE 26,396 26,845 29,069 29,743 30,432 31,139 31,862 32,602
ROAD & TRAFFIC IMPROVEMENTS 6,396,905 2,004,500 2,383,475 1,925,000 960,000 110,000 2,480,000 8,700,000
EQUIPMENT FLEET RENTAL 922,028 957,706 957,706 951,799 981,987 1,013,133 1,045,267 1,078,420
INTERFUND & DPW ADMIN CHARGES 320,392 265,746 179,840 234,798 237,030 239,268 241,286 243,506 TOTAL EXPENDITURES 10,463,596$ 5,084,192$ 6,145,968$ 4,926,026$ 3,904,275$ 6,930,539$ 5,827,422$ 13,071,334$
TOTAL EXPENDITURES CHANGE (%) ‐51.4% ‐41.3% ‐19.8% ‐20.7% 77.5% ‐15.9% 124.3%
NET OF REVENUES/EXPENDITURES 1,070,274 39,363 (677,320) (253,933) 28,924 (35,829) 489,114 (752,654)
BEGINNING FUND BALANCE 810,369 1,880,643 1,880,643 1,203,323 949,390 978,314 942,485 1,431,599
ENDING FUND BALANCE 1,880,643$ 1,920,006$ 1,203,323$ 949,390$ 978,314$ 942,485$ 1,431,599$ 678,945$
TOTAL STREETS FUND BALANCE 1,880,643$ 1,920,006$ 1,203,323$ 949,390$ 978,314$ 942,485$ 1,431,599$ 678,945$
Fund 202 & 203 ‐ MAJOR STREETS & LOCAL STREETS
O:\All\2022 budget\Budget Book\Tab 4\22.Governmental Funds, All Funds Detail 1 of 1
46

2022
BU
DG
ET
- 5
YE
AR
PR
OJE
CT
ION
S
$‐
$2,000,000
$4,000,000
$6,000,000
$8,000,000
$10,000,000
$12,000,000
$14,000,000
ACTU
AL
2020
BUDGET
AMEN
DED
2021
BUDGET
2022
PROJECTION
2023
PROJECTION
2024
PROJECTION
2025
PROJECTION
2026
CITY OF AUBURN HILLS
MAJO
R AND LOCAL ROADS
202
0‐2026
(Road
Millage Support begins 2021)
ACT 51
/GRANT FU
NDING
MAJO
R ROAD CITY/M
ILLA
GE FU
NDING
LOCAL ROAD CITY/M
ILLA
GE FU
NDING
WAYNE DISPOSA
L FU
NDING TO LOCAL
TOTA
L EX
PEN
DITURES
ACT 51 Funding 2021‐2026
$18,282,017
Ave
rage ($2.4M) in recurring expen
ses an
nually 2021‐2026 for operations
Does not include road
and road
related
maintenan
ce/improve
men
ts
NOTE
: GRAPHDOES
NOT INCLU
DE
ROAD PROJECTS REFLECTE
D IN
TIFA OR CAPITAL PROJECT FUNDS
47

2022 BUDGET - 5 YEAR PROJECTIONS
2021 2021
2020 ORIGINAL AMENDED 2022 2023 2024 2025 2026
ACTUAL BUDGET BUDGET BUDGET PROJECTION PROJECTION PROJECTION PROJECTION
REVENUES
GRANTS
STATE HIGHWAY FUNDS 1,871,388 1,933,501 1,933,501 2,314,153 2,434,773 2,459,121 2,483,712 2,508,549
STATE GRANTS/OTHER
INTEREST INCOME 622 ‐ ‐ ‐ ‐ ‐ ‐ ‐
OTHER REVENUE 62,199 51,122 251,214 51,122 51,122 51,122 51,122 51,122
CAP CHGS/CONTRIBUTED
1,934,209 1,984,623 2,184,715 2,365,275 2,485,895 2,510,243 2,534,834 2,559,671
TRANSFERS FROM FUNDS 5,000,000 1,910,000 1,910,000 700,000 ‐ 2,530,000 ‐ 6,950,000
TOTAL REVENUES 6,934,209 3,894,623 4,094,715 3,065,275 2,485,895 5,040,243 2,534,834 9,509,671
TOTAL REVENUE CHANGE (%) ‐43.8% ‐40.9% ‐25.1% ‐18.9% 102.8% ‐49.7% 275.2%
EXPENDITURES
SALARIES & WAGES 237,704 298,879 298,879 311,437 319,216 326,639 331,641 336,743
FRINGE BENEFITS 144,624 216,624 205,103 224,138 216,605 199,567 193,664 194,799
SUPPLIES 120,108 150,050 150,050 144,900 145,050 145,050 145,050 145,050
CONTRACTUAL SERVICES 34,016 20,000 44,655 20,000 20,000 20,000 20,000 20,000
OTHER EXPENSES 3,927 4,165 4,165 4,715 4,725 4,175 4,175 4,175
REPAIR & MAINT. 956,668 588,500 793,056 555,820 434,500 3,734,500 359,500 382,000
INSURANCE 13,646 13,874 15,094 15,440 15,794 16,157 16,528 16,908
ROAD & TRAFFIC IMPROVEMENTS 4,026,488 1,974,500 1,847,748 1,450,000 700,000 ‐ 325,000 8,250,000
EQUIPMENT FLEET RENTAL 461,062 478,853 478,853 476,693 491,812 507,411 523,505 540,109
INTERFUND FACILITY CHARGES 71,788 72,865 29,912 27,413 27,687 27,964 28,244 28,526
DPW ADMIN CHARGES 88,408 60,008 60,008 89,986 90,828 91,670 92,399 93,227
TOTAL EXPENDITURES 6,158,439 3,878,318 3,927,523 3,320,542 2,466,217 5,073,133 2,039,706 10,011,537
TOTAL EXPENDITURES CHANGE (%) ‐37.0% ‐36.2% ‐15.5% ‐25.7% 105.7% ‐59.8% 390.8%
NET OF REVENUES/EXPENDITURES 775,770 16,305 167,193 (255,267) 19,678 (32,890) 495,128 (501,866)
BEGINNING FUND BALANCE 391,143 1,166,913 1,166,913 1,334,105 1,078,838 1,098,516 1,065,626 1,560,754
ENDING FUND BALANCE 1,166,913$ 1,183,218$ 1,334,105$ 1,078,838$ 1,098,516$ 1,065,626$ 1,560,754$ 1,058,888$
2021 2021
2020 ORIGINAL AMENDED 2022 2023 2024 2025 2026
ACTUAL BUDGET BUDGET BUDGET PROJECTION PROJECTION PROJECTION PROJECTION
Major Streets
Crew Leader 1.00 1.00 1.00 1.00 1.00 1.00 1.00 1.00
General Maintenance 3.00 3.00 3.00 3.00 3.00 3.00 3.00 3.00
Seasonal 1.00 2.00 2.00 2.00 2.00 2.00 2.00 2.00
Total Major Streets‐DPS 5.00 6.00 6.00 6.00 6.00 6.00 6.00 6.00
Fund 202 MAJOR STREETS
MAJOR STREETS PERSONNEL
O:\All\2022 budget\Budget Book\Tab 4\22.Governmental Funds, All Funds Detail 1 of 1
48

2022 BUDGET - 5 YEAR PROJECTIONS
2021 2021
2020 ORIGINAL AMENDED 2022 2023 2024 2025 2026
ACTUAL BUDGET BUDGET BUDGET PROJECTION PROJECTION PROJECTION PROJECTION
REVENUES
STATE GRANTS/OTHER 300,000 ‐ ‐ ‐ ‐ ‐ ‐ ‐
GRANTS 88,994 ‐ 88,994 ‐ ‐ ‐ ‐ ‐
STATE HIGHWAY FUNDS 525,018 558,933 558,933 680,813 716,299 723,462 730,697 738,004
INTEREST INCOME 382 5 5 5 5 5 5 5
OTHER REVENUE 268 88,994 145,000 1,000 1,000 1,000 1,000 1,000
914,662 647,932 792,932 681,818 717,304 724,467 731,702 739,009
TRANSFERS FROM FUNDS 3,685,000 581,000 581,000 925,000 730,000 1,130,000 3,050,000 2,070,000 TOTAL REVENUES 4,599,662$ 1,228,932$ 1,373,932$ 1,606,818$ 1,447,304$ 1,854,467$ 3,781,702$ 2,809,009$
TOTAL REVENUE CHANGE (%) ‐73.3% 234.8% 17.0% ‐9.9% 28.1% 103.9% ‐25.7%
EXPENDITURES
SALARIES & WAGES 195,072 191,747 191,747 193,862 197,369 200,947 204,596 208,318
FRINGE BENEFITS 193,059 161,965 154,010 182,229 174,546 158,656 152,916 153,436
SUPPLIES 5,226 46,550 46,550 46,500 46,550 46,550 46,550 46,550
OTHER EXPENSES 4,691 2,915 2,915 3,085 3,265 2,915 2,915 2,735
CONTRACTUAL SERVICES 2,617 5,000 7,383 5,000 5,000 5,000 5,000 5,000
REPAIR & MAINTENANCE 900,167 143,000 697,364 93,000 128,000 693,000 563,000 1,518,000
INSURANCE 12,750 12,971 13,975 14,303 14,638 14,982 15,334 15,694
ROAD & TRAFFIC IMPROVEMENTS 2,370,418 30,000 535,728 475,000 260,000 110,000 2,155,000 450,000
EQUIPMENT FLEET RENTAL 460,965 478,853 478,853 475,106 490,175 505,722 521,762 538,311
INTERFUND FACILITIES CHARGES 71,788 72,865 29,912 27,413 27,687 27,964 28,244 28,526
DPW ADMIN CHARGES 88,408 60,008 60,008 89,986 90,828 91,670 92,399 93,227 TOTAL EXPENDITURES 4,305,160$ 1,205,874$ 2,218,445$ 1,605,484$ 1,438,058$ 1,857,406$ 3,787,716$ 3,059,797$
TOTAL EXPENDITURES CHANGE (%) ‐72.0% ‐48.5% ‐27.6% ‐10.4% 29.2% 103.9% ‐19.2%
NET OF REVENUES/EXPENDITURES 294,502 23,058 (844,513) 1,334 9,246 (2,939) (6,014) (250,788)
BEGINNING FUND BALANCE 419,226 713,728 713,728 (130,785) (129,451) (120,205) (123,144) (129,158)
ENDING FUND BALANCE 713,728$ 736,786$ (130,785)$ (129,451)$ (120,205)$ (123,144)$ (129,158)$ (379,946)$
2021 2021
2020 ORIGINAL AMENDED 2022 2023 2024 2025 2026
ACTUAL BUDGET BUDGET BUDGET PROJECTION PROJECTION PROJECTION PROJECTION
Local Streets
Crew Leader 0 0 0 0 0 0 0 0
General Maintenance 3.00 3.00 3.00 3.00 3.00 3.00 3.00 3.00
Seasonal 0.00 1.00 1.00 1.00 1.00 1.00 1.00 1.00
Total Major Streets‐DPS 3.00 4.00 4.00 4.00 4.00 4.00 4.00 4.00
Fund 203 LOCAL STREETS
LOCAL STREETS PERSONNEL
O:\All\2022 budget\Budget Book\Tab 4\22.Governmental Funds, All Funds Detail 1 of 1
49

2022 BUDGET - 5 YEAR PROJECTIONS
2021 2021
2020 ORIGINAL AMENDED 2022 2023 2024 2025 2026
DESCRIPTION ACTUAL BUDGET BUDGET BUDGET PROJECTION PROJECTION PROJECTION PROJECTION
REVENUES
STATE SHARED REVENUE & REFUNDS 80,465 72,000 72,000 80,000 80,000 80,000 80,000 80,000
INTEREST INCOME 2,676 2,960 2,960 ‐ ‐ ‐ ‐ ‐
TOTAL REVENUES 83,140$ 74,960$ 74,960$ 80,000$ 80,000$ 80,000$ 80,000$ 80,000$
TOTAL REVENUE CHANGE PERCENT ‐9.8% 10.9% 6.7% 0.0% 0.0% 0.0% 0.0%
EXPENDITURES
CONTRACTUAL SERVICES 50,230 ‐ ‐ 40,000 40,000 40,000 40,000 40,000
OTHER EXPENSES 67 305 305 20 20 ‐ ‐ ‐
UTILITIES 134,735 45,000 45,000 50,000 50,000 50,000 50,000 50,000
REPAIR & MAINT. ‐ 2,500 2,500 ‐ ‐ ‐ ‐ ‐
CAPITAL EXPENDITURES ‐ ‐ ‐ ‐ ‐ ‐ ‐ ‐
TOTAL EXPENDITURES 185,032$ 47,805$ 47,805$ 90,020$ 90,020$ 90,000$ 90,000$ 90,000$
TOTAL EXPENSES CHANGE PERCENT ‐74.2% 287.1% 88.3% 0.0% 0.0% 0.0% 0.0%
NET OF REVENUES/EXPENSES (101,891) 27,155 27,155 (10,020) (10,020) (10,000) (10,000) (10,000)
BEGINNING FUND BALANCE 204,524 102,633 102,633 129,788 119,768 109,748 99,748 89,748
ENDING FUND BALANCE 102,633$ 129,788$ 129,788$ 119,768$ 109,748$ 99,748$ 89,748$ 79,748$
2021 2021
2020 ORIGINAL AMENDED 2022 2023 2024 2025 2026
DESCRIPTION ACTUAL BUDGET BUDGET BUDGET PROJECTION PROJECTION PROJECTION PROJECTION
REVENUES
CHARGES FOR SERVICES 318,002 197,500 197,500 190,000 185,000 180,000 175,000 170,000
INTEREST INCOME 5,646 6,325 6,325 ‐ ‐ ‐ ‐ ‐ TOTAL REVENUES 323,648$ 203,825$ 203,825$ 190,000$ 185,000$ 180,000$ 175,000$ 170,000$
TOTAL REVENUE CHANGE PERCENT ‐37.0% 58.8% ‐6.8% ‐2.6% ‐2.7% ‐2.8% ‐2.9%
EXPENDITURES
OTHER EXPENSES 26,657 42,200 42,200 32,355 32,360 32,215 32,220 32,225
CONTRACTUAL SERVICES 11,900 15,000 15,000 15,000 15,000 15,000 15,000 15,000
TRANS TO OTHER FUNDS 185,000 131,000 131,000 100,000 100,000 80,000 70,000 70,000 TOTAL EXPENDITURES 223,557$ 188,200$ 188,200$ 147,355$ 147,360$ 127,215$ 117,220$ 117,225$
TOTAL EXPENSES CHANGE PERCENT ‐15.8% 18.8% ‐21.7% 0.0% ‐13.7% ‐7.9% 0.0%
NET OF REVENUES/EXPENSES 100,091 15,625 15,625 42,645 37,640 52,785 57,780 52,775
BEGINNING FUND BALANCE 544,584 644,675 644,675 660,300 702,945 740,585 793,370 851,150 ENDING FUND BALANCE 644,675$ 660,300$ 660,300$ 702,945$ 740,585$ 793,370$ 851,150$ 903,925$
Fund 233 ‐ METRO ‐ BAL ACCTS
Fund 227 ‐ WAYNE DISPOSAL‐OAK. HOST
O:\All\2022 budget\Budget Book\Tab 4\22.Governmental Funds, All Funds Detail 1 of 1
50

2022 BUDGET - 5 YEAR PROJECTIONS
2021 2021
2020 ORIGINAL AMENDED 2022 2023 2024 2025 2026
DESCRIPTION ACTUAL BUDGET BUDGET BUDGET PROJECTION PROJECTION PROJECTION PROJECTION
ESTIMATED REVENUES
CHARGES FOR SERVICES 250 ‐ ‐ ‐ ‐ ‐ ‐ ‐
INTEREST INCOME 16,186 19,382 19,382 ‐ ‐ ‐ ‐ ‐
TOTAL REVENUES 16,436$ 19,382$ 19,382$ ‐$ ‐$ ‐$ ‐$ ‐$
TOTAL REVENUE CHANGE PERCENT 17.9% ‐15.2% ‐100.0% #DIV/0! #DIV/0! #DIV/0! #DIV/0!
EXPENDITURES
OTHER EXPENSES 595 555 555 470 490 410 430 450
REPAIR & MAINT. 21,023 45,000 45,000 60,000 10,000 10,000 10,000 10,000
TOTAL EXPENDITURES 21,618$ 45,555$ 45,555$ 60,470$ 10,490$ 10,410$ 10,430$ 10,450$
TOTAL EXPENSES CHANGE PERCENT 110.7% ‐52.5% 32.7% ‐82.7% ‐0.8% 0.2% 0.2%
NET OF REVENUES/EXPENSES (5,181) (26,173) (26,173) (60,470) (10,490) (10,410) (10,430) (10,450)
BEGINNING FUND BALANCE 701,563 696,382 696,382 670,209 670,209 609,739 659,719 599,329
ENDING FUND BALANCE 696,382$ 670,209$ 670,209$ 609,739$ 659,719$ 599,329$ 649,289$ 588,879$
2021 2021
2020 ORIGINAL AMENDED 2022 2023 2024 2025 2026
DESCRIPTION ACTUAL BUDGET BUDGET BUDGET PROJECTION PROJECTION PROJECTION PROJECTION
REVENUES
GRANTS 17,899 70,968 70,968 83,086 83,086 83,086 83,086 83,086
INTEREST REVENUE 11 ‐ ‐ ‐ ‐ ‐ ‐ ‐
TOTAL REVENUES 17,910$ 70,968$ 70,968$ 83,086$ 83,086$ 83,086$ 83,086$ 83,086$
TOTAL REVENUE CHANGE PERCENT 296.3% ‐74.8% 17.1% 0.0% 0.0% 0.0% 0.0%
EXPENDITURES
OTHER EXPENSES 29,643 68,968 68,968 83,086 83,086 83,086 83,086 83,086
TOTAL EXPENDITURES 29,643$ 68,968$ 68,968$ 83,086$ 83,086$ 83,086$ 83,086$ 83,086$
TOTAL EXPENSES CHANGE PERCENT 132.7% ‐57.0% 20.5% 0.0% 0.0% 0.0% 0.0%
NET OF REVENUES/EXPENSES (11,733) 2,000 2,000 ‐ ‐ ‐ ‐ ‐
BEGINNING FUND BALANCE 22,392 10,659 10,659 12,659 12,659 12,659 12,659 12,659
ENDING FUND BALANCE 10,659$ 12,659$ 12,659$ 12,659$ 12,659$ 12,659$ 12,659$ 12,659$
Fund 230 ‐ TREE ORDINANCE FUND
Fund 273 ‐ CDBG
O:\All\2022 budget\Budget Book\Tab 4\22.Governmental Funds, All Funds Detail 1 of 1
51

2022 BUDGET - 5 YEAR PROJECTIONS
2021 2021
2020 ORIGINAL AMENDED 2021 2022 2023 2024 2025
DESCRIPTION ACTUAL BUDGET BUDGET BUDGET PROJECTION PROJECTION PROJECTION PROJECTION
REVENUES
INTEREST REVENUE 1 ‐ ‐ ‐ ‐ ‐ ‐ ‐
TOTAL REVENUES 1$ ‐$ ‐$ ‐$ ‐$ ‐$ ‐$ ‐$
TOTAL REVENUE CHANGE PERCENT ‐100.0% #DIV/0! #DIV/0!
EXPENDITURES
SUPPLIES 1,333 ‐ ‐ ‐ ‐ ‐ ‐ ‐
TOTAL EXPENDITURES 1,333 ‐ ‐ ‐ ‐ ‐ ‐ ‐
TOTAL EXPENSES CHANGE PERCENT ‐100.0% #DIV/0! #DIV/0!
NET OF REVENUES/EXPENSES (1,332) ‐ ‐ ‐ ‐ ‐ ‐ ‐
BEGINNING FUND BALANCE 1,333 1 1 1 1 1 1 1
ENDING FUND BALANCE 1$ 1$ 1$ 1$ 1$ 1$ 1$ 1$
2021 2021
2020 ORIGINAL AMENDED 2021 2022 2023 2024 2025
DESCRIPTION ACTUAL BUDGET BUDGET BUDGET PROJECTION PROJECTION PROJECTION PROJECTION
REVENUES
OTHER REVENUE 900 1,000 1,000 1,000 1,000 1,000 1,000 1,000
INTEREST REVENUE 113 ‐ ‐ ‐ ‐ ‐ ‐ ‐
DRUG ENFORCEMENT REV 29,297 40,000 40,000 30,000 30,000 30,000 30,000 30,000
TOTAL REVENUES 30,310$ 41,000$ 41,000$ 31,000$ 31,000$ 31,000$ 31,000$ 31,000$
TOTAL REVENUE CHANGE PERCENT 35.3% ‐26.1% ‐24.4% 0.0% 0.0% 0.0% 0.0%
EXPENDITURES
SUPPLIES 84,950 ‐ ‐ ‐ ‐ ‐ ‐ ‐
OTHER EXPENSES 3,684 3,000 3,000 20 3,020 3,000 3,000 ‐
DRUG ENFORCEMENT/DAR ‐ 500 500 ‐ 500 500 500 ‐
CAPITAL EXPENDITURES ‐ ‐ ‐ ‐ ‐ ‐ ‐ ‐
TOTAL EXPENDITURES 88,634$ 3,500$ 3,500$ 20$ 3,520$ 3,500$ 3,500$ ‐$
TOTAL EXPENSES CHANGE PERCENT ‐96.1% ‐96.1% ‐99.4% 17500.0% ‐0.6% 0.0% ‐100.0%
NET OF REVENUES/EXPENSES (58,324) 37,500 37,500 30,980 27,480 27,500 27,500 31,000
BEGINNING FUND BALANCE 106,061 47,738 47,738 85,238 116,218 143,698 171,198 198,698
ENDING FUND BALANCE 47,738$ 85,238$ 85,238$ 116,218$ 143,698$ 171,198$ 198,698$ 229,698$
Fund 262 ‐ DRUG FORFEITURES FEDERAL
Fund 265 ‐ DRUG FORFEITURES STATE
O:\All\2022 budget\Budget Book\Tab 4\22.Governmental Funds, All Funds Detail 1 of 1
52

2022 BUDGET - 5 YEAR PROJECTIONS
2021 2021
2020 ORIGINAL AMENDED 2021 2022 2023 2024 2025
DESCRIPTION ACTUAL BUDGET BUDGET BUDGET PROJECTION PROJECTION PROJECTION PROJECTION
REVENUES
INTEREST INCOME 63 2,000 2,000 100 100 100 100 100
TRANSFERS FROM FUNDS 802,689 303,917 303,917 1,863,400 1,861,325 1,858,525 1,864,900 1,865,375
TOTAL REVENUES 802,752$ 305,917$ 305,917$ 1,863,500$ 1,861,425$ 1,858,625$ 1,865,000$ 1,865,475$
TOTAL REVENUE CHANGE PERCENT ‐61.9% 162.4% 509.2% ‐0.1% ‐0.2% 0.3% 0.0%
EXPENDITURES
DEBT SERVICE 560,575 563,800 563,800 1,863,400 1,861,325 1,858,525 1,864,900 1,865,375
TOTAL EXPENDITURES 560,575$ 563,800$ 563,800$ 1,863,400$ 1,861,325$ 1,858,525$ 1,864,900$ 1,865,375$
TOTAL EXPENSES CHANGE PERCENT 0.6% ‐0.6% 230.5% ‐0.1% ‐0.2% 0.3% 0.0%
NET OF REVENUES/EXPENSES 242,177 (257,883) (257,883) 100 100 100 100 100
BEGINNING FUND BALANCE ‐ 242,177 242,177 (15,706) (15,606) (15,506) (15,406) (15,306)
ENDING FUND BALANCE 242,177$ (15,706)$ (15,706)$ (15,606)$ (15,506)$ (15,406)$ (15,306)$ (15,206)$
2021 2021
2020 ORIGINAL AMENDED 2022 2023 2024 2025 2026
DESCRIPTION ACTUAL BUDGET BUDGET BUDGET PROJECTION PROJECTION PROJECTION PROJECTION
REVENUES
OTHER REVENUE ‐ ‐ 12,703,693 ‐ ‐ ‐ ‐ ‐
INTEREST INCOME 2,575 ‐ ‐ ‐ ‐ ‐ ‐ ‐
TOTAL REVENUES 2,575$ ‐$ 12,703,693$ ‐$ ‐$ ‐$ ‐$ ‐$
TOTAL REVENUE CHANGE PERCENT ‐100.0% ‐100.0% ‐100.0%
EXPENDITURES
OTHER EXPENSES ‐ ‐ 101,474 ‐ ‐ ‐ ‐ ‐
REPAIR & MAINTENANCE ‐ ‐ 25,000 615,000 715,000 ‐ ‐ ‐
TRANS TO OTHER FUNDS 334,477 ‐ ‐ ‐ ‐ ‐ ‐ ‐
CAPITAL EXPENDITURES (27,994) ‐ 1,803,019 5,698,750 3,706,483 ‐ ‐ ‐
TOTAL EXPENDITURES 306,483$ ‐$ 1,929,493$ 6,313,750$ 4,421,483$ ‐$ ‐$ ‐$
TOTAL EXPENSES CHANGE PERCENT ‐100.0% ‐84.1% 227.2%
NET OF REVENUES/EXPENSES (303,908) ‐ 10,774,200 (6,313,750) (4,421,483) ‐ ‐ ‐
BEGINNING FUND BALANCE 303,908 0 0 10,774,200 4,460,450 38,967 38,967 38,967
ENDING FUND BALANCE 0$ 0$ 10,774,200$ 4,460,450$ 38,967$ 38,967$ 38,967$ 38,967$
2021 2021
2020 ORIGINAL AMENDED 2022 2023 2024 2025 2026
DESCRIPTION ACTUAL BUDGET BUDGET BUDGET PROJECTION PROJECTION PROJECTION PROJECTION
REVENUES
INTEREST INCOME 1,455 2,462 2,462 150 150 150 150 150
TRANSFERS FROM OTHER FUNDS 7,462 ‐ ‐ ‐ ‐ ‐ ‐ ‐
SPECIAL ASSESSMENTS 247,881 183,108 183,108 163,434 158,853 154,272 149,691 145,109
TOTAL REVENUES 256,798$ 185,570$ 185,570$ 163,584$ 159,003$ 154,422$ 149,841$ 145,259$
TOTAL REVENUE CHANGE PERCENT ‐27.7% 38.4% ‐11.8% ‐2.8% ‐2.9% ‐3.0% ‐3.1%
EXPENDITURES
OTHER EXPENSES 499 ‐ ‐ ‐ ‐ ‐ ‐ ‐
DEBT SERVICE 201,375 197,874 197,874 194,375 185,925 182,525 179,124 170,568
TOTAL EXPENDITURES 201,874$ 197,874$ 197,874$ 194,375$ 185,925$ 182,525$ 179,124$ 170,568$
TOTAL EXPENSES CHANGE PERCENT ‐2.0% 2.0% ‐1.8% ‐4.3% ‐1.8% ‐1.9% ‐4.8%
NET OF REVENUES/EXPENSES 54,924 (12,304) (12,304) (30,791) (26,922) (28,103) (29,283) (25,309)
BEGINNING FUND BALANCE 266,228 321,152 321,152 308,848 278,057 251,135 223,032 193,749
ENDING FUND BALANCE 321,152$ 308,848$ 308,848$ 278,057$ 251,135$ 223,032$ 193,749$ 168,440$
Fund 401 ‐ Capital Projects Fund
Fund 852 ‐ Special Assessment Debt Fund
Fund 350 ‐ Capital Improvement Debt Service Fund
O:\All\2022 budget\Budget Book\Tab 4\22.Governmental Funds, All Funds Detail 1 of 1
53

2022 BUDGET - 5 YEAR PROJECTIONS
2021 2021
2020 ORIGINAL AMENDED 2022 2023 2024 2025 2026
DESCRIPTION ACTUAL BUDGET BUDGET BUDGET PROJECTION PROJECTION PROJECTION PROJECTION
REVENUES
OTHER REVENUE 2,752,369 2,338,000 2,338,000 ‐ ‐ ‐ ‐ ‐
INTEREST INCOME 1,660 ‐ ‐ ‐ ‐ ‐ ‐ ‐
TOTAL REVENUES 2,754,029$ 2,338,000$ 2,338,000$ ‐$ ‐$ ‐$ ‐$ ‐$
TOTAL REVENUE CHANGE PERCENT ‐15.1% 0.0%
EXPENDITURES
FRINGE BENEFITS 1,423,114 1,527,631 1,527,631
OTHER EXPENSES 159 ‐ ‐ ‐ ‐ ‐ ‐ ‐
CONTRACTUAL SERVICES 40,170 32,000 32,000 ‐ ‐ ‐ ‐ ‐
INSURANCE 4,352 4,439 4,439 ‐ ‐ ‐ ‐ ‐
TRANS TO OTHER FUNDS 2,038,607 ‐ 1,818,828 ‐ ‐ ‐ ‐ ‐
TOTAL EXPENSES 3,506,403$ 1,564,070$ 3,382,898$ ‐$ ‐$ ‐$ ‐$ ‐$
TOTAL EXPENSES CHANGE PERCENT ‐55% 116%
NET OF REVENUES/EXPENSES (752,374) 773,930 (1,044,898) ‐ ‐ ‐ ‐ ‐
BEGINNING NET POSITION 1,240,105 487,730 487,730 ENDING NET POSITION 487,730$ 1,261,660$ (557,168)$
Fund 601 ‐ Retiree Health(This Fund is expected to be closed at the end of 2021)
O:\All\2022 budget\Budget Book\Tab 5\22.Internal Service FundsInternal Service Funds54

2022 BUDGET - 5 YEAR PROJECTIONS
2021 2021
2020 ORIGINAL AMENDED 2022 2023 2024 2025 2026
DESCRIPTION ACTUAL BUDGET BUDGET BUDGET PROJECTION PROJECTION PROJECTION PROJECTION
REVENUES
INTERFUND REVENUE ‐ VEHICLE 772,073 899,186 899,186 800,436 825,823 852,015 879,037 906,918
INTERFUND REVENUE ‐ EQUIPMENT 1,984,577 2,041,171 2,041,171 2,045,560 2,110,438 2,177,376 2,246,436 2,317,686
OTHER REVENUE 224,369 ‐ ‐ ‐ ‐ ‐ ‐ ‐
INTEREST INCOME 87,369 105,171 105,171 155 155 155 155 155
TOTAL REVENUES 3,068,388$ 3,045,528$ 3,045,528$ 2,846,151$ 2,936,416$ 3,029,546$ 3,125,628$ 3,224,759$
TOTAL REVENUES CHANGE PERCENT ‐0.7% 0.0% ‐6.5% 3.2% 3.2% 3.2% 3.2%
EXPENDITURES
SALARIES & WAGES 195,024 188,344 191,136 193,935 197,700 201,540 205,458 209,453
FRINGE BENEFITS 159,020 99,452 95,155 96,528 99,626 102,810 106,338 110,245
SUPPLIES 320,368 443,900 443,900 441,900 441,900 441,900 441,900 441,900
OTHER EXPENSES 4,009 7,231 7,231 4,330 4,430 3,730 3,830 3,930
CONTRACTUAL SERVICES 87,515 128,500 128,500 128,500 128,500 128,500 128,500 128,500
REPAIRS AND MAINTENANCE 47,216 45,500 45,500 45,500 45,500 45,500 45,500 45,500
INSURANCE 57,374 60,461 50,050 51,092 51,942 52,819 53,721 54,653
DEPRECIATION 739,630 ‐ ‐ ‐ ‐ ‐ ‐ ‐
CAPITAL EXPENDITURES 935 1,783,000 2,378,992 1,062,000 686,000 1,638,661 701,000 631,500
ADMIN/INTERFUND CHARGE EXPENSE 408,024 375,246 203,170 246,858 253,667 260,612 268,042 275,994
TOTAL EXPENSES 2,019,115$ 3,131,634$ 3,543,634$ 2,270,643$ 1,909,265$ 2,876,072$ 1,954,289$ 1,901,675$
TOTAL EXPENSES CHANGE PERCENT 55.1% 13.2% ‐35.9% ‐15.9% 50.6% ‐32.1% ‐2.7%
NET OF REVENUES/EXPENSES 1,049,273$ (86,106)$ (498,106)$ 575,508$ 1,027,151$ 153,474$ 1,171,339$ 1,323,084$
Beginning 6,871,220 7,920,493 7,920,493 7,422,388 7,997,896 9,025,047 9,178,521 10,349,860
Ending 7,920,493$ 7,834,387$ 7,422,388$ 7,997,896$ 9,025,047$ 9,178,521$ 10,349,860$ 11,672,944$
2021 2021
2020 ORIGINAL AMENDED 2022 2023 2024 2025 2026
FLEET MANAGEMENT ACTUAL BUDGET BUDGET BUDGET PROJECTION PROJECTION PROJECTION PROJECTION
Manager 0.00 0.00 0.00 0.00 0.00 0.00 0.00 0.00
Garage Helper‐Grade 1 0.00 0.00 0.00 0.00 0.00 0.00 0.00 0.00
Mechanics 3.00 3.00 3.00 3.00 3.00 3.00 3.00 3.00
Total Fleet Management 3.00 3.00 3.00 3.00 3.00 3.00 3.00 3.00
FLEET DEPARTMENT PERSONNEL
Fund 661 ‐ FLEET MANAGEMENT
O:\All\2022 budget\Budget Book\Tab 5\22.Internal Service FundsInternal Service Funds55

2022 BUDGET - 5 YEAR PROJECTIONS
O:\All\2022 budget\Budget Book\Tab 5\22.Internal Service FundsFleet Graph
$2,378,992
$1,062,000 $686,000
$1,638,661
$701,000 $631,500
$3,045,528 $3,224,759
$‐
$500,000
$1,000,000
$1,500,000
$2,000,000
$2,500,000
$3,000,000
$3,500,000
$4,000,000
AMENDED2021
BUDGET2022
PROJECTION2023
PROJECTION2024
PROJECTION2025
PROJECTION2026
CITY OF AUBURN HILLSFLEET FUND INTERNAL SERVICE FUND
2021‐2026
OTHER EXPENDITURES CAPITAL EXPENDITURES CHARGES TO OTHER FUNDS
56

2022 BUDGET - 5 YEAR PROJECTIONS
2021 2021
2020 ORIGINAL AMENDED 2022 2023 2024 2025 2026
DESCRIPTION ACTUAL BUDGET BUDGET BUDGET PROJECTION PROJECTION PROJECTION PROJECTIONREVENUES
PROPERTY TAXES 904,674 1,656,222 1,656,222 1,078,733 1,095,755 1,118,998 1,144,150 1,173,610
STATE SHARED REVENUE & REFUNDS 244,357 219,921 219,921 252,189 226,970 204,273 183,845 165,460
INTEREST INCOME 20,714 27,568 27,568 4,000 4,100 4,200 4,300 4,400
CHARGES FOR SERVICES 251 500 500 500 500 500 500 500
OTHER REVENUE 53,392 55,830 55,830 55,578 56,356 57,957 58,799 60,403
GRANTS ‐ ‐ ‐ 20,000 ‐ ‐ ‐ ‐
CONTRIBUTED CAPITAL 49,391 ‐ ‐ ‐ ‐ ‐ ‐ ‐
TRANSFERS FROM FUNDS 10,000 ‐ ‐ ‐ ‐ ‐ ‐ ‐ TOTAL REVENUES 1,282,779$ 1,960,041$ 1,960,041$ 1,411,000$ 1,383,681$ 1,385,928$ 1,391,594$ 1,404,373$
TOTAL REVENUE CHANGE PERCENT 52.8% 52.8% ‐28.0% ‐1.9% 0.2% 0.4% 0.9%
EXPENDITURES
SALARIES & WAGES 20,853 58,000 36,100 ‐ ‐ ‐ ‐ ‐
FRINGE BENEFITS 1,748 4,613 4,613 ‐ ‐ ‐ ‐ ‐
SUPPLIES 4,942 8,000 8,000 2,250 2,250 2,250 2,250 2,250
UTILITIES 121,302 164,769 151,195 147,722 150,074 152,236 154,411 156,393
REPAIR & MAINTENANCE 322,993 278,203 354,414 788,753 163,953 286,253 163,953 92,453
INSURANCE 5,363 5,400 4,461 4,531 4,603 4,676 4,750 4,825
CAPITAL EXPENDITURES 45,601 375,000 718,680 530,000 180,000 130,000 30,000 30,000
DEPRECIATION & AMORTIZATION 882,504 ‐ ‐ ‐ ‐ ‐ ‐ ‐
ADMIN & DPW ADMIN CHARGES 66,932 67,936 21,790 23,208 24,718 26,326 28,039 29,863
CONTRACTUAL SERVICES 15,055 345,000 366,900 773,200 523,200 523,200 523,200 523,200
OTHER EXPENSES 23,362 62,864 62,864 44,930 44,940 43,145 43,150 43,155
INTERFUND CHARGE EXPENSE 46,707 47,408 56,715 60,405 64,335 68,521 72,979 77,728 TOTAL EXPENSES 1,557,361$ 1,417,193$ 1,785,732$ 2,374,999$ 1,158,073$ 1,236,607$ 1,022,732$ 959,867$
TOTAL EXPENSES CHANGE PERCENT ‐9.0% 14.7% 33.0% ‐51.2% 6.8% ‐17.3% ‐6.1%
NET OF REVENUES/EXPENSES (274,583)$ 542,848$ 174,309$ (963,999)$ 225,608$ 149,321$ 368,862$ 444,506$
ESTIMATED UNRESTRICTED NET POSITION 2,410,366$ 2,953,214$ 2,584,675$ 1,620,676$ 1,846,284$ 1,995,605$ 2,364,467$ 2,808,973$
2021 2021
2020 ORIGINAL AMENDED 2022 2023 2024 2025 2026
DESCRIPTION ACTUAL BUDGET BUDGET BUDGET PROJECTION PROJECTION PROJECTION PROJECTIONREVENUES
PROPERTY TAXES 1,346,848 1,928,907 1,928,907 1,473,888 1,496,457 1,525,989 1,558,051 1,594,457
STATE SHARED REVENUE & REFUNDS 157,791 144,000 144,000 ‐ ‐ ‐ ‐ ‐
INTEREST INCOME 192,319 207,673 207,673 2,471 1,254 ‐ ‐ ‐
OTHER REVENUE ‐ 39,392 39,392 40,574 41,791 ‐ ‐ ‐
TRANSFERS FROM DDA ‐ ‐ ‐ ‐ ‐ ‐ ‐ ‐ TOTAL REVENUES 1,696,958$ 2,319,972$ 2,319,972$ 1,516,933$ 1,539,502$ 1,525,989$ 1,558,051$ 1,594,457$
TOTAL REVENUE CHANGE PERCENT 36.7% 36.7% ‐35% 1.5% ‐0.9% 2.1% 2.3%
EXPENDITURES
REPAIR & MAINTENANCE 98,678 139,000 139,000 164,000 164,000 164,000 164,000 139,000
OTHER EXPENSES 8,995 22,802 22,802 25,250 25,300 22,550 22,600 22,650
CONTRACTUAL SERVICES ‐ 100,000 100,000 100,000 100,000 100,000 100,000 100,000
UTILITIES 16,224 15,700 10,317 6,600 6,700 6,800 6,900 7,000
DEPRECIATION 347,494 ‐ ‐ ‐ ‐ ‐ ‐ ‐
CAPITAL EXPENDITURES ‐ 1,935,000 1,935,000 1,510,000 10,000 10,000 10,000 10,000
ADMIN & DPW ADMIN CHARGES 32,733 33,224 13,329 14,196 15,120 16,104 17,152 18,268
INTERFUND CHARGE EXPENSE 45,998 46,688 50,499 53,785 57,285 61,012 64,982 69,210
TRANSFER TO OTHER FUNDSTOTAL EXPENSES 550,123$ 2,292,414$ 2,270,947$ 1,873,831$ 378,405$ 380,466$ 385,634$ 366,128$
TOTAL EXPENSES CHANGE PERCENT 316.7% 312.8% ‐17.5% ‐79.8% 0.5% 1.4% ‐5.1%
NET OF REVENUES/EXPENSES 1,146,835$ 27,558$ 49,025$ (356,898)$ 1,161,097$ 1,145,523$ 1,172,417$ 1,228,329$
ESTIMATED UNRESTRICTED NET POSITION 10,703,544$ 10,731,102$ 10,752,569$ 10,395,671$ 11,556,768$ 11,541,194$ 12,729,185$ 12,769,523$
Fund 251 ‐ TIFA A
Fund 252 ‐ TIFA B
O:\All\2022 budget\Budget Book\Tab 6\22.Component Unit Funds
57

2022 BUDGET - 5 YEAR PROJECTIONS
2021 2021
2020 ORIGINAL AMENDED 2022 2023 2024 2025 2026
DESCRIPTION ACTUAL BUDGET BUDGET BUDGET PROJECTION PROJECTION PROJECTION PROJECTIONREVENUES
PROPERTY TAXES (7,500) (5,000) (5,000) ‐ (5,000) (5,000) (5,000) ‐
STATE SHARED REVENUE & REFUNDS 808,422 727,580 727,580 875,228 787,705 708,935 638,042 574,237
OTHER REVENUE 427 1,000 1,000 750 750 750 750 750
TRANSFERS FROM FUNDS 66,894 ‐ ‐ ‐ ‐ ‐ ‐ ‐
INVESTMENT INCOME 44,262 52,116 52,116 ‐ ‐ ‐ ‐ ‐ TOTAL REVENUES 912,505$ 775,696$ 775,696$ 875,978$ 783,455$ 704,685$ 633,792$ 574,987$
TOTAL REVENUE CHANGE PERCENT ‐15.0% ‐15.0% 12.9% ‐10.6% ‐10.1% ‐10.1% ‐9.3%
EXPENDITURES
SALARIES & WAGES 3,136 ‐ ‐ ‐ ‐ ‐ ‐ ‐
FRINGE BENEFITS 240 1,148 1,148 ‐ ‐ ‐ ‐ ‐
UTILITIES 161,254 100,500 82,986 72,500 73,500 74,500 75,500 76,500
REPAIR & MAINTENANCE 390,375 145,500 164,414 297,800 289,250 217,500 193,500 217,000
INSURANCE
CAPITAL EXPENDITURES 3,461 350,000 765,981 386,000 500,000 ‐ ‐ 775,000
DEPRECIATION 824,476 ‐ ‐ ‐ ‐ ‐ ‐ ‐
ADMIN & DPW ADMIN CHARGES 21,151 21,468 15,572 16,585 17,664 18,813 20,037 21,341
OTHER EXPENSES 1,881 2,950 2,950 2,700 3,050 2,900 3,250 3,600
INTERFUND CHARGE EXPENSE 9,444 9,588 9,742 10,376 11,051 11,770 12,536 13,352 TOTAL EXPENSES 1,415,417$ 631,154$ 1,042,793$ 785,961$ 894,515$ 325,483$ 304,823$ 1,106,793$
TOTAL EXPENSES CHANGE PERCENT ‐55.4% ‐26.3% ‐24.6% 13.8% ‐63.6% ‐6.3% 263.1%
NET OF REVENUES/EXPENSES (502,912)$ 144,542$ (267,097)$ 90,017$ (111,060)$ 379,202$ 328,969$ (531,806)$
UNRESTRICTED NET POSITION 2,933,065 3,077,607 2,665,968 2,755,985 2,644,925 3,024,127 3,353,096 2,821,290
2021 2021
2020 ORIGINAL AMENDED 2022 2023 2024 2025 2026
DESCRIPTION ACTUAL BUDGET BUDGET BUDGET PROJECTION PROJECTION PROJECTION PROJECTION
REVENUES
PROPERTY TAXES 188,780 233,347 233,347 338,664 349,504 361,394 374,050 387,162
GRANTS ‐ ‐ ‐ 20,000 ‐ ‐ ‐ ‐
INTEREST INCOME 394 ‐ ‐ ‐ ‐ ‐ ‐ ‐ TOTAL REVENUES 189,174$ 233,347$ 233,347$ 358,664$ 349,504$ 361,394$ 374,050$ 387,162$
TOTAL REVENUE CHANGE PERCENT 23.4% 23.4% 53.7% ‐2.6% 3.4% 3.5% 3.5%
EXPENDITURES
SALARIES & WAGES ‐ ‐ ‐ 27,898 27,898 27,898 27,898 27,898
FRINGE BENEFITS ‐ ‐ ‐ 2,304 2,304 2,304 2,304 2,304
SUPPLIES ‐ 2,000 2,000 2,600 2,600 2,600 3,100 2,600
OTHER EXPENSES 25,668 69,060 69,060 96,150 91,400 91,775 92,525 92,775
REPAIR & MAINTENANCE 8,874 7,000 7,000 47,000 7,000 7,000 7,000 7,000
CONTRACTUAL SERVICES ‐ 2,750 2,750 4,000 7,000 7,250 7,250 7,250
UTILITIES ‐ ‐ ‐ ‐ ‐ ‐ ‐ ‐
DEBT SERVICE 4,800 43,045 43,045 43,044 43,044 ‐ ‐ ‐
ADMIN & DPW ADMIN CHARGES 9,064 9,200 60,772 64,726 68,938 73,424 78,201 83,289
INTERFUND CHG EXPENSE 9,664 9,809 6,712 7,149 7,614 8,109 8,637 9,199 TOTAL EXPENSES 58,070$ 142,864$ 191,339$ 294,871$ 257,798$ 220,360$ 226,915$ 232,315$
TOTAL EXPENSES CHANGE PERCENT 146.0% 229.5% 54.1% ‐12.6% ‐14.5% 3.0% 2.4%
NET OF REVENUES/EXPENSES 131,105$ 90,483$ 42,008$ 63,793$ 91,706$ 141,034$ 147,135$ 154,847$
ESTIMATED UNRESTRICTED NET POSITION 264,178$ 354,661$ 306,186$ 369,979$ 461,684$ 602,718$ 749,853$ 904,700$
Fund 253 ‐ TIFA D
Fund 248 ‐ DOWNTOWN DEVELOPMENT AUTHORITY
O:\All\2022 budget\Budget Book\Tab 6\22.Component Unit Funds
58

2022 BUDGET - 5 YEAR PROJECTIONS
2021 2021
2020 ORIGINAL AMENDED 2022 2023 2024 2025 2026
DESCRIPTION ACTUAL BUDGET BUDGET BUDGET PROJECTION PROJECTION PROJECTION PROJECTIONESTIMATED REVENUES
PROPERTY TAXES 163,878 184,522 184,522 187,951 190,622 196,749 203,284 212,945
STATE SHARED REVENUE & REFUNDS 15,294 13,766 13,766 12,999 11,700 10,530 9,477 8,529
STATE GRANTS/OTHER 91,862 ‐ ‐ ‐ ‐ ‐ ‐ ‐
INVESTMENT INCOME 138,103 172,907 172,907 ‐ ‐ ‐ ‐ ‐ TOTAL REVENUES 409,137$ 371,195$ 371,195$ 200,950$ 202,322$ 207,279$ 212,761$ 221,474$
TOTAL REVENUE CHANGE PERCENT ‐9.3% ‐9.3% ‐45.9% 0.7% 2.5% 2.6% 4.1%
EXPENDITURES
CONTRACTUAL SERVICES 968,669 338,534 338,534 983,760 370,076 370,327 370,584 368,450
DEBT SERVICE ‐ 54,815 54,815 54,814 54,816 54,816 54,815 54,814
ADMIN & DPW ADMIN CHARGES 22,488 22,825 41,108 43,783 46,632 49,666 52,898 56,340
OTHER EXPENSES 4,375 4,781 4,781 3,050 3,075 2,750 2,775 2,800
INTERFUND CHG EXPENSE 4,692 4,762 20,956 22,320 23,772 25,319 26,966 28,721 TOTAL EXPENSES 1,000,224$ 425,717$ 460,194$ 1,107,727$ 498,371$ 502,878$ 508,038$ 511,125$
TOTAL EXPENSES CHANGE PERCENT ‐57.4% ‐54.0% 140.7% ‐55.0% 0.9% 1.0% 0.6%
NET OF REVENUES/EXPENSES (591,087)$ (54,522)$ (88,999)$ (906,777)$ (296,049)$ (295,599)$ (295,277)$ (289,651)$
ESTIMATED UNRESTRICTED NET POSITION 3,381,044$ 3,326,522$ 3,292,045$ 2,385,268$ 2,089,219$ 1,793,620$ 1,498,343$ 1,208,692$
2021 2021
2020 ORIGINAL AMENDED 2022 2023 2024 2025 2026
DESCRIPTION ACTUAL BUDGET BUDGET BUDGET PROJECTION PROJECTION PROJECTION PROJECTION
EXPENDITURES
OTHER EXPENSES 60$ ‐$ ‐$ ‐$ ‐$ ‐$ ‐$ ‐$ TOTAL EXPENSES 60$ ‐$ ‐$ ‐$ ‐$ ‐$ ‐$ ‐$
TOTAL EXPENSES CHANGE PERCENT ‐100% ‐100% #DIV/0!
NET OF REVENUES/EXPENSES (60)$ ‐$ ‐$ ‐$ ‐$ ‐$ ‐$ ‐$
ESTIMATED UNRESTRICTED NET POSITION 9,067$ 9,067$ 9,067$ 9,067$ 9,067$ 9,067$ 9,067$ 9,067$
Fund 244 ‐ ECONOMIC DEVELOPMENT
Fund 243 ‐ BROWNFIELD AUTHORITY
O:\All\2022 budget\Budget Book\Tab 6\22.Component Unit Funds
59

2022 BUDGET - 5 YEAR PROJECTIONS
2021 2021
2020 ORIGINAL AMENDED 2022 2023 2024 2025 2026
DESCRIPTION ACTUAL BUDGET BUDGET BUDGET PROJECTION PROJECTION PROJECTION PROJECTION
REVENUES
CHARGES FOR SERVICES 1,486,676 1,552,800 1,552,800 1,604,004 1,649,604 1,696,804 1,746,104 1,796,004
INTEREST INCOME 728 ‐ ‐ ‐ ‐ ‐ ‐ ‐
OTHER REVENUE 43,544 53,000 53,000 52,500 52,500 52,500 52,500 52,500 TOTAL REVENUES 1,530,948$ 1,605,800$ 1,605,800$ 1,656,504$ 1,702,104$ 1,749,304$ 1,798,604$ 1,848,504$
TOTAL REVENUE CHANGE PERCENT 4.9% 4.9% 3.2% 2.8% 2.8% 2.8% 2.8%
EXPENDITURES
SALARIES & WAGES 232,499 252,246 252,246 264,409 271,707 277,064 282,892 286,686
FRINGE BENEFITS (893,238) 57,850 57,850 58,552 60,310 61,995 63,799 65,533
SUPPLIES 27,989 18,860 18,860 27,050 18,050 18,050 18,050 18,050
COST OF GOODS SOLD 58,100 79,560 79,560 81,250 83,200 84,825 86,450 88,400
OTHER EXPENSES 51,489 51,778 51,778 48,178 48,178 47,878 47,928 47,878
REPAIR & MAINTENANCE 38,383 98,200 40,300 40,700 27,700 25,700 25,700 25,700
CONTRACTUAL SERVICES 542,209 584,278 584,278 577,978 577,978 590,978 577,978 577,978
UTILITIES 71,268 77,816 68,533 60,479 60,479 60,479 60,479 60,479
ADMIN & DPW ADMIN CHARGES 75,483 76,615 15,001 15,977 17,017 18,124 19,303 20,559
INTERFUND CHG EXPENSE 122,658 124,497 55,529 65,819 67,015 68,258 69,551 70,896
INSURANCE 13,613 13,695 15,241 15,450 15,662 15,878 16,097 16,070
CAPITAL EXPENDITURES 43,824 195,100 305,912 306,500 325,000 347,500 250,000 50,000
DEPRECIATION & AMORT 291,504 ‐ ‐ ‐ ‐ ‐ ‐ ‐
TRANS TO OTHER FUNDS ‐ ‐ ‐ 50,000 50,000 50,000 50,000 50,000 TOTAL EXPENSES 675,781$ 1,630,495$ 1,545,088$ 1,612,342$ 1,622,296$ 1,666,729$ 1,568,227$ 1,378,229$
TOTAL EXPENSES CHANGE PERCENT 141.3% 128.6% 4.4% 0.6% 2.7% ‐5.9% ‐12.1%
NET OF REVENUES/EXPENSES 855,167$ (24,695)$ 60,712$ 44,162$ 79,808$ 82,575$ 230,377$ 470,275$
ESTIMATED CASH POSITIONBeginning Cash and Investments 704,929$ 891,142$ 891,142$ 951,854$ 996,016$ 1,075,824$ 1,158,399$ 1,388,776$
Projected Change in Cash 186,213 (24,695) 60,712 44,162 79,808 82,575 230,377 470,275 ENDING CASH AND INVESTMENTS 891,142$ 866,447$ 951,854$ 996,016$ 1,075,824$ 1,158,399$ 1,388,776$ 1,859,051$
2021 2021
2020 ORIGINAL AMENDED 2022 2023 2024 2025 2026
DESCRIPTION ACTUAL BUDGET BUDGET BUDGET PROJECTION PROJECTION PROJECTION PROJECTION
Fieldstone Golf Course
Director of Golf 1.00 1.00 1.00 1.00 1.00 1.00 1.00 1.00
Part‐time 5.00 5.00 5.00 5.00 5.00 5.00 5.00 5.00
Seasonal 20.00 20.00 20.00 20.00 20.00 20.00 20.00 20.00
Total Fieldstone Golf Course 26.00 26.00 26.00 26.00 26.00 26.00 26.00 26.00
Fund 584 ‐ Fieldstone Golf Course
PERSONNEL
O:\All\2022 budget\Budget Book\Tab 7\22.EnterpriseFunds
60

2022 BUDGET - 5 YEAR PROJECTIONS
2021 2021
2020 ORIGINAL AMENDED 2022 2023 2024 2025 2026
DESCRIPTION ACTUAL BUDGET BUDGET BUDGET PROJECTION PROJECTION PROJECTION PROJECTION
REVENUES
GRANTS 2,505 ‐ ‐ ‐ ‐ ‐ ‐ ‐
CHARGES FOR SERVICES 16,437,670 17,285,284 17,285,284 16,825,540 17,011,275 17,172,553 17,390,675 17,626,311
CAPITAL CHARGES/CONTRIBUTED 871,816 290,000 290,000 345,000 285,000 280,000 225,000 200,000
OTHER REVENUE 1,417,336 971,000 971,000 926,000 891,000 831,000 781,000 776,000
INTEREST INCOME 517,180 621,830 621,830 24,000 24,170 24,330 24,500 24,665
INTERFUND CHG REVENUE 114,660 115,515 115,515 115,785 117,135 118,485 119,835 121,185 TOTAL REVENUES 19,361,167$ 19,283,629$ 19,283,629$ 18,236,325$ 18,328,580$ 18,426,368$ 18,541,010$ 18,748,161$
TOTAL REVENUE CHANGE PERCENT ‐0.4% ‐0.4% ‐5.4% 0.5% 0.5% 0.6% 1.1%
EXPENDITURES
SALARIES & WAGES 637,409 666,236 634,501 707,241 727,103 740,661 754,256 768,124
FRINGE BENEFITS 606,871 417,784 402,025 444,040 443,853 433,188 434,954 444,926
SUPPLIES 302,460 311,540 311,540 321,920 296,220 327,250 318,450 317,700
CONTRACTUAL SERVICES 64,238 118,500 121,595 47,000 47,000 47,500 47,500 118,000
OTHER EXPENSES 60,693 44,125 44,125 61,850 63,310 41,380 43,910 41,685
COMPUTER SERVICES 67,310 184,400 192,925 93,100 93,800 94,500 95,200 95,900
UTILITIES 32,098 34,400 34,400 38,700 39,500 40,300 41,600 42,400
WATER & SEWAGE COST 9,454,838 9,422,274 9,422,274 9,410,675 9,638,446 9,869,363 10,096,518 10,318,993
REPAIR & MAINTENANCE 967 17,000 17,000 42,200 36,700 39,700 40,700 42,700
INSURANCE 26,032 26,338 27,503 28,036 28,579 29,134 29,700 30,278
DEPRECIATION & AMORT 2,332,388 ‐ ‐ ‐ ‐ ‐ ‐ ‐
CAPITAL EXPENDITURES 3,300 795,000 4,604,578 1,185,000 2,522,000 4,025,000 2,280,000 500,000
DEBT SERVICE 95,121 1,610,653 1,610,653 1,805,243 550,004 548,943 552,863 497,472
INTERFUND CHARGE EXPENSE 1,516,900 1,528,768 1,374,962 1,397,615 1,449,690 1,504,635 1,562,620 1,623,830
ADMIN & DPW ADMIN CHARGES 1,036,273 941,264 1,105,819 1,283,103 1,348,177 1,417,270 1,489,725 1,567,079 TOTAL EXPENSES 16,236,898$ 16,118,282$ 19,903,900$ 16,865,723$ 17,284,382$ 19,158,824$ 17,787,996$ 16,409,087$
TOTAL EXPENSES CHANGE PERCENT ‐0.7% 22.6% ‐15.3% 2.5% 10.8% ‐7.2% ‐7.8%
NET OF REVENUES/EXPENSES 3,124,269$ 3,165,347$ (620,271)$ 1,370,602$ 1,044,198$ (732,456)$ 753,014$ 2,339,074$
ESTIMATED CASH POSITIONBeginning Cash and Investments 32,227,173$ 31,109,663$ 31,109,663$ 30,199,392$ 31,224,994$ 31,984,192$ 30,971,736$ 31,499,750$
Projected Change in Cash (1,117,510) 2,875,347 (910,271) 1,025,602 759,198 (1,012,456) 528,014 2,139,074ENDING CASH AND INVESTMENTS 31,109,663$ 33,985,010$ 30,199,392$ 31,224,994$ 31,984,192$ 30,971,736$ 31,499,750$ 33,638,824$
Fund 592 ‐ WATER & SEWER FUND
O:\All\2022 budget\Budget Book\Tab 7\22.EnterpriseFunds
61

2022 BUDGET - 5 YEAR PROJECTIONS
70
$‐
$2,000,000
$4,000,000
$6,000,000
$8,000,000
$10,000,000
$12,000,000
Original Amended Budget Projection Projection Projection Projection
2021 2021 2022 2023 2024 2025 2026
City of Auburn Hills2021‐2026 Projections
Water Fund
Cost to City for Water Capital Investment Interfund/Admin Charges
Other Water Costs Water Billing Revenues All Water Revenue
62

2022 BUDGET - 5 YEAR PROJECTIONS
2021 2021
2020 ORIGINAL AMENDED 2022 2023 2024 2025 2026
DESCRIPTION ACTUAL BUDGET BUDGET BUDGET PROJECTION PROJECTION PROJECTION PROJECTION
REVENUES
GRANTS 2,505 ‐ ‐ ‐ ‐ ‐ ‐ ‐
CHARGES FOR SERVICES 7,254,135 7,334,701 7,334,701 7,667,809 7,743,852 7,820,660 7,898,742 7,977,104
CAPITAL CHARGES/CONTRIBUTED 160,310 40,000 40,000 45,000 35,000 30,000 25,000 25,000
OTHER REVENUE 1,047,511 640,000 640,000 605,000 585,000 540,000 495,000 500,000
INTEREST INCOME 502,461 621,830 621,830 16,000 16,170 16,330 16,500 16,665 TOTAL REVENUES 8,966,922$ 8,636,531$ 8,636,531$ 8,333,809$ 8,380,022$ 8,406,990$ 8,435,242$ 8,518,769$
TOTAL REVENUE CHANGE PERCENT ‐3.7% ‐3.7% ‐3.5% 0.6% 0.3% 0.3% 1.0%
EXPENDITURES
SALARIES & WAGES 289,691 301,222 267,161 315,640 322,504 328,576 334,769 341,086
FRINGE BENEFITS 483,293 239,014 230,422 259,807 254,455 239,853 236,841 241,043
SUPPLIES 67,305 75,000 75,000 65,110 56,110 57,225 60,325 62,450
OTHER EXPENSES 22,193 22,215 22,215 29,545 31,435 19,900 21,835 19,285
COMPUTER SERVICES 28,722 95,800 95,800 48,750 49,100 49,500 49,850 50,200
CONTRACTUAL SERVICES 9,720 15,000 18,095 15,000 15,000 15,000 15,000 15,000
UTILITIES 6,146 9,300 9,300 9,500 9,700 9,900 10,100 10,300
WATER & SEWAGE COST 5,130,204 4,862,591 4,862,591 4,869,497 4,966,887 5,066,224 5,167,549 5,270,900
REPAIR & MAINTENANCE 620 6,000 6,000 35,100 29,600 31,600 32,600 28,600
INSURANCE 12,231 12,403 12,753 13,020 13,292 13,571 13,856 14,147
DEPRECIATION & AMORT 1,041,251 ‐ ‐ ‐ ‐ ‐ ‐ ‐
CAPITAL EXPENDITURES ‐ 290,000 290,000 1,000,000 250,000 265,000 2,260,000 260,000
DEBT SERVICE 95,121 1,610,653 1,610,653 1,805,243 550,004 548,943 552,863 497,472
INTERFUND CHARGE EXPENSE 861,729 868,842 686,004 676,297 698,487 721,786 746,255 771,962
ADMIN & DPW ADMIN CHARGES 549,308 501,669 415,180 496,334 518,876 542,777 567,666 594,267 TOTAL EXPENSES 8,597,532$ 8,909,709$ 8,601,174$ 9,638,843$ 7,765,450$ 7,909,855$ 10,069,509$ 8,176,712$
TOTAL EXPENSES CHANGE PERCENT 3.6% 0.0% 12.1% ‐19.4% 1.9% 27.3% ‐18.8%
NET OF REVENUES/EXPENSES 369,390$ (273,178)$ 35,357$ (1,305,034)$ 614,572$ 497,135$ (1,634,267)$ 342,057$
2021 2021
2020 ORIGINAL AMENDED 2022 2023 2024 2025 2026
DESCRIPTION ACTUAL BUDGET BUDGET BUDGET PROJECTION PROJECTION PROJECTION PROJECTION
Sewer Department
Crew Leader 1.00 1.00 1.00 1.00 1.00 1.00 1.00 1.00
General Maintenance 4.00 4.00 4.00 4.00 4.00 4.00 4.00 4.00
Seasonal 1.00 1.00 1.00 1.00 1.00 1.00 1.00 1.00
Total Sewer Department 6.00 6.00 6.00 6.00 6.00 6.00 6.00 6.00
Fund 592 ‐ WATER & SEWER FUND
PERSONNEL
SEWER DEPARTMENT ‐ 535
O:\All\2022 budget\Budget Book\Tab 7\22.EnterpriseFunds
63

2022 BUDGET - 5 YEAR PROJECTIONS
O:\All\2022 budget\Budget Book\Tab 7\22.EnterpriseFunds
$‐
$1,000,000
$2,000,000
$3,000,000
$4,000,000
$5,000,000
$6,000,000
2021 AMENDED 2022 BUDGET 2023 PROJECTION 2024 PROJECTION 2025 PROJECTION 2026 PROJECTION
CITY OF AUBURN HILLSSEWER DEPARTMENT PROJECTIONS
2021‐2026
NET SEWER SERVICE REVENUE OTHER REVENUES (NO CONTRIB. CAP.) CAPITAL OUTLAY DEBT SERVICE OTHER EXPENSES
2022‐2026 1% INCREASE
64

2022 BUDGET - 5 YEAR PROJECTIONS
2021 2021
2020 ORIGINAL AMENDED 2022 2023 2024 2025 2026
DESCRIPTION ACTUAL BUDGET BUDGET BUDGET PROJECTION PROJECTION PROJECTION PROJECTION
REVENUES
OTHER REVENUE 369,825 331,000 331,000 321,000 306,000 291,000 286,000 276,000
CAPITAL CHARGES/CONTRIBUTED 711,506 250,000 250,000 300,000 250,000 250,000 200,000 175,000
CHARGES FOR SERVICES 9,183,535 9,950,583 9,950,583 9,157,731 9,267,423 9,351,893 9,491,933 9,649,207
INTEREST INCOME 14,719 ‐ ‐ 8,000 8,000 8,000 8,000 8,000
INTERFUND CHG REVENUE 114,660 115,515 115,515 115,785 117,135 118,485 119,835 121,185
TOTAL REVENUES 10,394,245$ 10,647,098$ 10,647,098$ 9,902,516$ 9,948,558$ 10,019,378$ 10,105,768$ 10,229,392$
TOTAL REVENUE CHANGE PERCENT 2.4% 2.4% ‐7.0% 0.5% 0.7% 0.9% 1.2%
EXPENDITURES
SALARIES & WAGES 347,718 365,014 367,340 391,601 404,599 412,085 419,487 427,038
FRINGE BENEFITS 123,578 178,770 171,603 184,233 189,398 193,335 198,113 203,883
SUPPLIES 235,155 236,540 236,540 256,810 240,110 270,025 258,125 255,250
CONTRACTUAL SERVICES 54,518 103,500 103,500 32,000 32,000 32,500 32,500 103,000
COMPUTER SERVICES 38,588 88,600 97,125 44,350 44,700 45,000 45,350 45,700
OTHER EXPENSES 38,501 21,910 21,910 32,305 31,875 21,480 22,075 22,400
UTILITIES 25,952 25,100 25,100 29,200 29,800 30,400 31,500 32,100
WATER & SEWAGE COST 4,324,634 4,559,683 4,559,683 4,541,178 4,671,559 4,803,139 4,928,969 5,048,093
REPAIR & MAINTENANCE 347 11,000 11,000 7,100 7,100 8,100 8,100 14,100
INSURANCE 13,801 13,935 14,750 15,016 15,287 15,563 15,844 16,131
DEPRECIATION & AMORT 1,291,137 ‐ ‐ ‐ ‐ ‐ ‐ ‐
CAPITAL EXPENDITURES 3,300 505,000 4,314,578 185,000 2,272,000 3,760,000 20,000 240,000
INTERFUND CHARGE EXPENSE 655,171 659,926 688,958 721,318 751,203 782,849 816,365 851,868
ADMIN & DPW ADMIN CHARGES 486,965 439,595 690,639 786,769 829,301 874,493 922,059 972,812
TOTAL EXPENSES 7,639,366$ 7,208,573$ 11,302,726$ 7,226,880$ 9,518,932$ 11,248,969$ 7,718,487$ 8,232,375$
TOTAL EXPENSES CHANGE PERCENT ‐5.6% 48.0% ‐36.1% 31.7% 18.2% ‐31.4% 6.7%
NET OF REVENUES/EXPENSES 2,754,879$ 3,438,525$ (655,628)$ 2,675,636$ 429,626$ (1,229,591)$ 2,387,281$ 1,997,017$
2021 2021
2020 ORIGINAL AMENDED 2022 2023 2024 2025 2026
DESCRIPTION ACTUAL BUDGET BUDGET BUDGET PROJECTION PROJECTION PROJECTION PROJECTION
Water Department
Crew Leader 1.00 1.00 1.00 1.00 1.00 1.00 1.00 1.00
General Maintenance 5.00 5.00 5.00 5.00 5.00 5.00 5.00 5.00
Seasonal 0.00 2.00 2.00 2.00 2.00 2.00 2.00 2.00
Total Water Department 6.00 8.00 8.00 8.00 8.00 8.00 8.00 8.00
Fund 592 ‐ WATER & SEWER FUND
PERSONNEL
WATER DEPARTMENT ‐ 536
O:\All\2022 budget\Budget Book\Tab 7\22.EnterpriseFunds
65
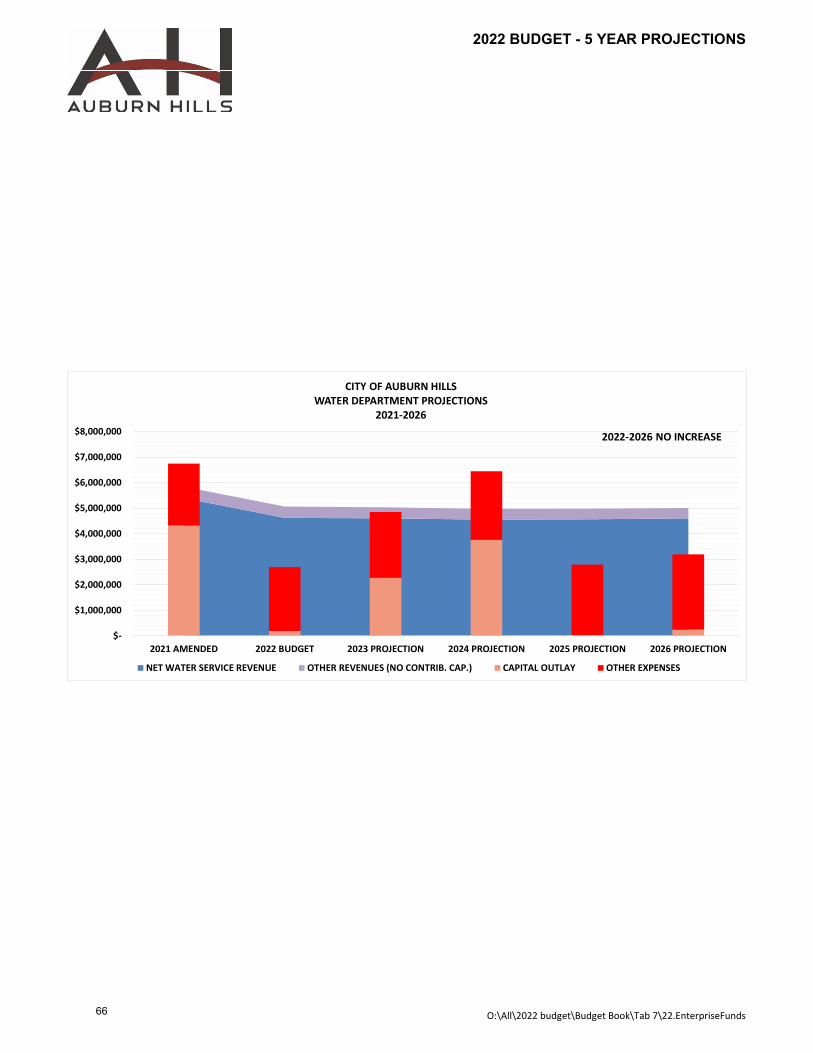
2022 BUDGET - 5 YEAR PROJECTIONS
O:\All\2022 budget\Budget Book\Tab 7\22.EnterpriseFunds
$‐
$1,000,000
$2,000,000
$3,000,000
$4,000,000
$5,000,000
$6,000,000
$7,000,000
$8,000,000
2021 AMENDED 2022 BUDGET 2023 PROJECTION 2024 PROJECTION 2025 PROJECTION 2026 PROJECTION
CITY OF AUBURN HILLSWATER DEPARTMENT PROJECTIONS
2021‐2026
NET WATER SERVICE REVENUE OTHER REVENUES (NO CONTRIB. CAP.) CAPITAL OUTLAY OTHER EXPENSES
2022‐2026 NO INCREASE
66

2022 BUDGET
‐ 5 YEA
R PROJECTIONS
Project
Description
Project
Start Year
2020
2021
2022
2023
2024
2025
2026
Haw
k Woods Lodge
Cap
ital Im
provemen
ts2020
257,932
DPW Salt Barn Roof Rep
lacemen
tRoof Rep
lacemen
t2020
146,802
PSB
Sections A‐E
Roof Rep
lacemen
t2020
307,563
Community Cen
ter Section D
Roof Rep
lacemen
t2020
192,154
LIBRARY HVAC
Bldg Additions & Im
provemen
ts2020
67,900
Administration Build
ing Sections A‐B
Roof Rep
lacemen
t2021
657,326
Fire Station 1 Parking Lot
Reconstruct
2021
30,450
PUBLIC SAFETY HVAC
Bldg Additions & Im
provemen
ts2021
84,000
Fire Station 1 Im
provemen
tsBased
on fire study
2021
50,000
Fire Station 1 Gen
eral M
aintenan
ceGen
eral M
aintenan
ce2021
2,500
Community Cen
ter Sections B‐C
Roof Rep
lacemen
t2021
488,000
PSB
Sections H‐L
Roof Rep
lacemen
t2021
625,000
2424 Seyburn Build
ing Upgrad
es
Windows, Doors, and Flooring
2022
75,000
DPW HVAC
East, M
iddle, W
est, and High
2022
300,000
Library Elevator Upgrad
esBldg Additions & Im
provemen
ts2022
250,000
FS3 HVAC Rep
lacemen
tBldg Additions & Im
provemen
ts2023
15,000
Sportsfield HVAC Rep
lacemen
tBldg Additions & Im
provemen
ts2024
4,000
Civic 2 Gen
erator Rep
lacemen
tBldg Additions & Im
provemen
ts2025
100,000
FS1 HVAC Rep
lacemen
tBldg Additions & Im
provemen
ts2026
17,500
972,351
1,937,276
625,000
15,000
4,000
100,000
17,500
2021‐2026 Cap
ital Project Budge
t Plan
Facilities ‐ 265
General Fund ‐ 101
67

2022 BUDGET
‐ 5 YEA
R PROJECTIONS
Project
Description
Project
Start Year
2021
2022
2023
2024
2025
2026
Man
itoba Park
Park Reconstruct
2021
67,200
Kayak Point
Land and Im
provemen
ts2021
145,000
Haw
kwoods
Surface Seal
2022
4,400
Den
nis Dea
ring
Reconstruct
2024
4,000
Parking Lot Maintenan
ceMaintenan
ce2021‐2026
15,000
15,000
15,000
15,000
15,000
15,000
227,200
19,400
15,000
19,000
15,000
15,000
2021‐2026 Cap
ital Project Budge
t Plan
Grounds ‐ 266
General Fund ‐ 101
68

2022 BUDGET
‐ 5 YEA
R PROJECTIONS
Project
Description
Project
Start Year
2021
2022
2023
2024
2025
2026
Police Office Cubicle Update
Furniture
2021
50,000
Police Chairs
Furniture
2021
15,000
Police Interview Recording Mall
Machinery & Equipmen
t2021
17,000
Police Interview Recording Investigations
Machinery & Equipmen
t2021
48,000
Police Body Cam
sElectronic Equipmen
t2021
52,000
Police Motorola Rad
ios
Electronic Equipmen
t2021
90,000
PSB
Section G (Green
Hea
ted W
alk)
Roof Rep
lacemen
t2022
250,000
Copier for Police Admin Office
Machinery & Equipmen
t2022
9,000
Police Access Control A
dditions
Machinery & Equipmen
t2022
12,000
Police Data Archival
Synology & Drives
2022
9,000
Public Safety Green
Roof
Foundation & Roof Im
provemen
ts2022
750,000
Public Safety Eviden
ce Room
Ren
ovation
2022
10,000
Public Safety Carpet
Bldg Additions & Im
provemen
ts2022
70,000
Police Sh
ooting Ran
ge Upgrad
eMachinery & Equipmen
t2023
170,000
Public Safety Boiler
Boiler an
d M
au Rep
lacemen
ts2024
100,000
Police DP Copier
Machinery & Equipmen
t2025
9,000
Copier for Police Records
Machinery & Equipmen
t2026
6,000
Police In‐Car HD Video
Cam
era Rep
lacemen
tsElectronic Equipmen
t2021‐2026
6,200
6,200
6,200
6,200
6,200
6,200
Police Flock LPR Cam
eras
Machinery & Equipmen
t2022‐2026
28,000
25,000
25,000
25,000
25,000
278,200
1,144,200
201,200
131,200
40,200
37,200
2021‐2026 Cap
ital Project Budge
t Plan
Police ‐ 301 & 305
General Fund ‐ 101
69

2022 BUDGET
‐ 5 YEA
R PROJECTIONS
Project
GL
Description
Amount
2020
2021
2022
2023
2024
2025
2026
Fire Equipmen
t101‐339‐978.000
Rad
io System Equipmen
t78,000
78,000
Fire Equipmen
t101‐339‐978.000
Suppression/Training Eq
uipmen
t22,500
22,500
Fire Equipmen
t101‐339‐978.000
Hyd
raulic Stretcher
47,000
47,000
Fire Equipmen
t101‐339‐978.000
Toning System
150,000
150,000
Fire Station 3 Parking Lot
101‐336‐973.002‐FIRESTA
TION3
Reconstruct
122,000
122,000
Fire Station 1
101‐336‐975.000‐FIRESTA
TION1
Rem
odel
750,000
750,000
Fire Station 3
101‐336‐975.000‐FIRESTA
TION3
Rem
odel
750,000
750,000
Fire Station 1
101‐336‐975.000‐FIRESTA
TION1
Gen
erator Rep
lacemen
t50,000
50,000
Fire Equipmen
t101‐339‐978.000‐FFIGHTERASST
Aeroclave Purchases
151,818
60,140
91,678
Fire Equipmen
t101‐339‐978.000
Suppression/Training Eq
uipmen
t258,920
33,920
75,000
50,000
50,000
50,000
202,640
239,178
1,805,920
75,000
100,000
50,000
50,000
2021‐2026 Cap
ital Project Budge
t Plan
Fire ‐ 336 & 339
General Fund ‐ 101
70

2022 BUDGET
‐ 5 YEA
R PROJECTIONS
Project
Description
Project
Start Year
2021
2022
2023
2024
2025
2026
Haw
kwoods Park Pavilion
Haw
kwoods Park Pavilion
2021
156,200
Man
itoba Park
Park Im
provemen
ts2021
75,000
Haw
kwoods Park
Dumpster Enclosure
2022
13,000
Haw
kwoods Park
Maintenan
ce Shed
2022
8,000
Carryall U
tility Veh
icle
Machinery & Equipmen
t2022
9,800
Haw
kwoods Park
Garden
Bridge
2022
3,000
Haw
kwoods Park
Arched
Wed
ding Arbor
2022
1,500
231,200
35,300
00
00
2021‐2026 Cap
ital Project Budge
t Plan
Parks ‐ 770
General Fund ‐ 101
71

2022 BUDGET
‐ 5 YEA
R PROJECTIONS
Project
Description
Project
Start Year
2020
2021
2022
2023
2024
2025
2026
Atlan
tic Blvd (SA
D)
Asphalt Mill & Resurface
2020
2,746,104
197,694
Chrysler Traffic Signal
Traffic Sign
al2020
14,757
384,562
North Squirrel (Chrysler to Squirrel including bridge)
Concrete Reh
abilitation
2020
1,855,000
506,681
N. Squirrel
Road
Maintenan
ce2020
650,087
59,227
ATLANTIC BLV
DSidew
alks
2020
288,896
Auburn Road
(Opdyke to Churchill in
cluding bridge)
Asphalt Mill & Resurface
2021
238,686
721,290
Taylor Road
(Joslyn
to Giddings)
Asphalt Mill & Resurface
2022
100,000
Shim
mons/Phillps Lapee
r Connection
Asphalt Mill & Resurface
2022
1,100,000
Harmon Road
Asphalt Mill & Resurface
2022
200,000
Shim
mons/Dexter Curve Rea
lignmen
tAsphalt Reconstruction
2023
50,000
700,000
Great Lakes Crossing
Asphalt Mill & Resurface
2024
75,000
2,175,000
Cross Creek (SA
D)
Asphalt Reconstruction
2026
175,000
4,500,000
High M
eadow (SA
D)
Asphalt Reconstruction
2026
150,000
3,750,000
Grey Road
Asphalt Pulverize/Overlay
2027
Gen
eral M
aintenan
ceRoad
Maintenan
ce2021‐2026
12,000
12,000
12,000
12,000
12,000
12,000
Guardrail Maintenan
ceRoad
Maintenan
ce2021‐2026
175,000
100,000
100,000
100,000
100,000
100,000
North Squirrel (Walton to Chrysler) Concrete
Concrete Maintenan
ce2024‐2030
450,000
University Drive (Cross Cr to Squirrel)
Concrete Maintenan
ce2024‐2034
750,000
North Squirrel (Featherstone to Clin
ton River)
Concrete Maintenan
ce2030‐2040
5,793,530
2,056,454
1,562,000
887,000
3,487,000
437,000
8,362,000
2021‐2026 Cap
ital Project Budge
t Plan
Major Road
s ‐ 202
72

2022 BUDGET
‐ 5 YEA
R PROJECTIONS
Project
Description
Project
Start Year
2020
2021
2022
2023
2024
2025
2026
West En
tran
ce (SA
D)
Asphalt Reconstruction
2020
1,943,271
493,618
Bloomfield Orchards
Concrete Maintenan
ce2020
727,518
540,890
Butler Road
Road
Maintenan
ce2020
149,176
7,475
Bald M
ountain Road
Asphalt Pulverize/Overla y
2020
152,500
Parkw
ays Extension
Road
reh
ab to cordinate with W
/M lo
op
2020
244,053
5,685
Parkw
ays Blvd
Loop connection sidew
alks
2020
38,094
6,424
Cam
pus Drives
Road
Maintenan
ce2021
50,000
Corporate (SA
D)
Asphalt Reconstruction
2022
30,000
475,000
Harmon Road
Non M
otorized Pathways
2023
260,000
Hunt Club
Asphalt Mill & Resurface
2024
35,000
575,000
Shim
mons Circle
Asphalt Pulverize/Overla y
2025
35,000
515,000
Thornwood Sub
Asphalt Mill & Resurface
2025
25,000
375,000
Birchfield/Patrick Hen
r yAsphalt Reconstruction
2025
75,000
1,600,000
Pond Run (SA
D)
Asphalt Mill & Resurface
2026
35,000
650,000
Valley View (SA
D)
Asphalt Mill & Resurface
2026
10,000
200,000
Pinnacle/Luella/Automation (SA
D)
Asphalt Mill & Resurface
2026
50,000
575,000
Glenmea
de (SAD)
Asphalt Reconstruction
2026
40,000
450,000
Gen
eral M
aintenan
ceRoad
Maintenan
ce2021‐2026
25,000
25,000
25,000
25,000
25,000
25,000
Guardrail Maintenan
ceRoad
Maintenan
ce2021‐2026
3,000
3,000
3,000
3,000
3,000
3,000
Storm
Reh
abRoad
Maintenan
ce2021‐2026
5,720
50,000
50,000
50,000
50,000
50,000
50,000
Sidew
alk Maintenan
ceSidew
alk Maintenan
ce2021‐2026
3,000
3,000
3,000
3,000
3,000
3,000
Pavem
ent Markings
Pavem
ent Markings
2022‐2026
6,000
18,000
12,000
12,000
12,000
12,000
12,000
3,266,332
1,233,092
568,000
388,000
803,000
2,718,000
1,968,000
2021‐2026 Cap
ital Project Budge
t Plan
Local R
oad
s ‐ 203
73

2022 BUDGET
‐ 5 YEA
R PROJECTIONS
Project
Description
Project
Start Year
2020
2021
2022
2023
2024
2025
2026
Auburn Road
(Opdyke to Churchill in
cluding bridge)
Asphalt Mill & resurface
2021
1,257,071
Admin HVAC
Bldg Additions & Im
provemen
t s2021
61,887
Admin Roof
Bldg Additions & Im
provemen
ts2021
44,161
DPW HVAC
Bldg Additions & Im
provemen
t s2021
102,500
Fieldstone Golf HVAC
Bldg Additions & Im
provemen
ts2021
57,900
Library HVAC
Bldg Additions & Im
provemen
t s2021
77,500
Riverside Park HVAC
Bldg Additions & Im
provemen
ts2021
2,000
Bald M
ountain Road
Asphalt Pulverize/Overla y
2022
2,560,000
Taylor Road
(Joslyn
to Giddings)
Asphalt Mill & resurface
2022
100,000
723,750
Five Points Driv e
Asphalt Reconstruction
2022
100,000
1,715,000
Shim
mons (Phillps to Dexter )
Asphalt Mill & Resurface
2022
25,000
575,000
Bald M
ountain Pathway Connection (Bald M
tn to Squirrel )
Non M
otorized Pathways
2022
440,000
Param
ount Estates
Asphalt Mill & Resurface
2023
40,000
715,000
Can
adian Subdivision
Asphalt Pulverize/Overla y
2023
60,000
1,750,000
Harmon Road
Asphalt Mill & resurface
2023
200,000
1,956,483
1,828,019
6,313,750
4,421,483
00
0
2021‐2026 Cap
ital Project Budge
t Plan
Cap
ital Im
prove
ment Fu
nd ‐ 401
74

2022 BUDGET
‐ 5 YEA
R PROJECTIONS
Project
Description
Project Start
Year
2021
2022
2023
2024
2025
2026
Golf Bunker Refacing
Land & Im
provemen
ts2021
15,000
Golf Sod (Eastside of Green
#6)
Land & Im
provemen
ts2021
5,000
Golf Bridge In
spection/Evaluation
Land & Im
provemen
ts2021
10,000
Golf Restrooms (Front 9)
Land & Im
provemen
ts2021
100,000
150,000
Golf Restrooms (Back 9)
Land & Im
provemen
ts2023
150,000
Golf Pump Rep
airs
Land & Im
provemen
ts2021
92,000
Golf Club Carpet
Land & Im
provemen
ts2021
18,812
Fieldstone Parking Lot
Parking Lot Reh
ab2021
65,100
Golf Bridge Rep
air
Land & Im
provemen
ts2022
17,500
Golf Practice Te
e an
d Chiping Green
Land & Im
provemen
ts2022
25,000
Golf Ran
ge Ball D
ispen
ser
Machinery & Equipmen
t2022
7,500
Golf IT In
frastructure Hardware
Computer Eq
uip. &
Support
2022
6,500
Golf Clubhouse Flat Roof
Bldg Additions & Im
provemen
ts2023
75,000
Golf Ball W
ashing Unit for Practice Facility
Machinery & Equipment
2024
7,500
Fieldstone Golf Course
Clubhouse Roof Rep
lacemen
t2024
240,000
Golf Cart Barn
Bldg Additions & Im
provemen
ts2025
150,000
Cart Path
Land & Im
provemen
ts2022‐2026
100,000
100,000
100,000
100,000
50,000
305,912
306,500
325,000
347,500
250,000
50,000
2021‐2026 Cap
ital Project Budge
t Plan
Fieldstone Golf Course ‐ 584
75

2022 BUDGET
‐ 5 YEA
R PROJECTIONS
Project
Description
Project
Start Year
2021
2022
2023
2024
2025
2026
Taylor Rd Sew
er Lining
Water/Sew
er System Im
p & Ext
2022
750,000
Birchfield Sew
er Rep
lacemen
t12" Sewer Rep
lacemen
t2025
5,000
1,850,000
Noah
's Rep
air
Water/Sew
er System Im
p & Ext
2025
75,000
Joslyn
Rep
air (Taylor an
d Joslyn
)Water/Sew
er System Im
p & Ext
2025
75,000
Sanitary System
Reh
abSewer Lining & M
H Reh
ab2021‐2040
250,000
250,000
250,000
250,000
250,000
250,000
SCADA RTU
Upgrad
e an
d Im
provemen
tWater/Sew
er System Im
p & Ext
2024‐2026
40,000
10,000
10,000
10,000
290,000
1,000,000
250,000
265,000
2,260,000
260,000
2021‐2026 Cap
ital Project Budge
t Plan
Sewer Departm
ent ‐ 535
76
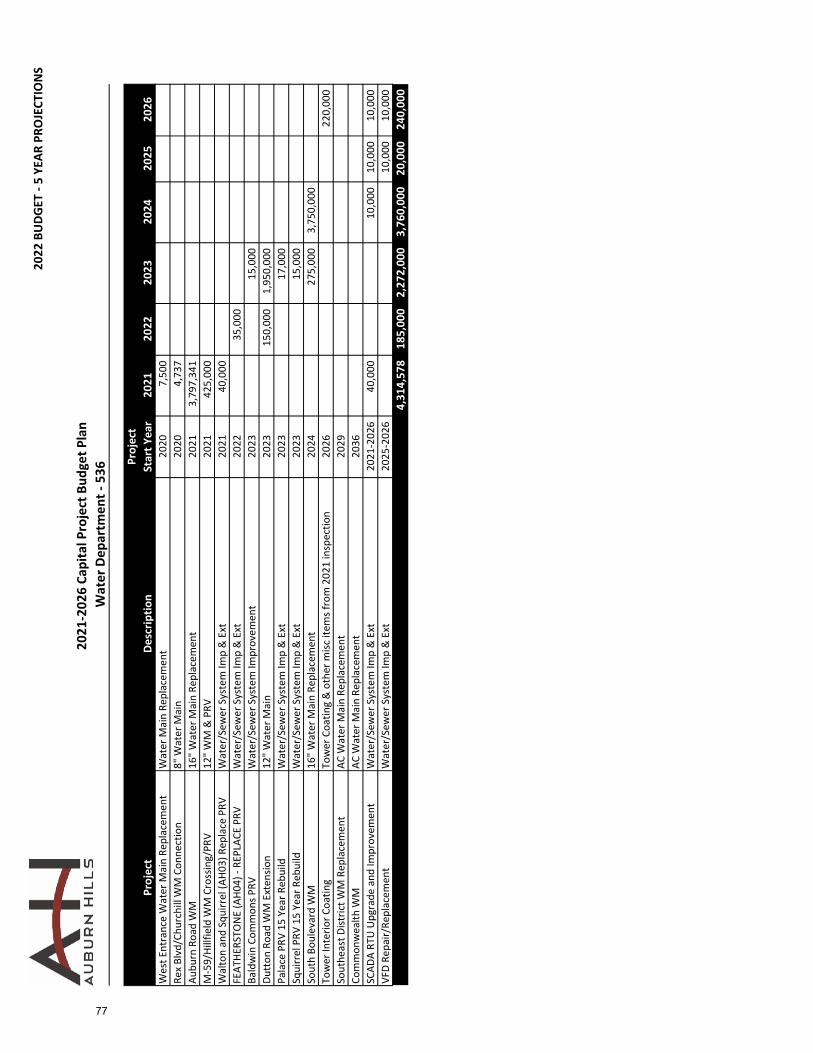
2022 BUDGET
‐ 5 YEA
R PROJECTIONS
Project
Description
Project
Start Year
2021
2022
2023
2024
2025
2026
West En
tran
ce W
ater M
ain Rep
lacemen
tWater M
ain Rep
lacemen
t2020
7,500
Rex Blvd/Churchill W
M Connection
8" Water M
ain
2020
4,737
Auburn Road
WM
16" Water M
ain Rep
lacemen
t2021
3,797,341
M‐59/H
illfield W
M Crossing/PRV
12" WM & PRV
2021
425,000
Walton and Squirrel (AH03) Rep
lace PRV
Water/Sew
er System Im
p & Ext
2021
40,000
FEATH
ERSTONE (AH04) ‐ REP
LACE PRV
Water/Sew
er System Im
p & Ext
2022
35,000
Baldwin Commons PRV
Water/Sew
er System Im
provemen
t2023
15,000
Dutton Road
WM Exten
sion
12" Water M
ain
2023
150,000
1,950,000
Palace PRV 15 Yea
r Reb
uild
Water/Sew
er System Im
p & Ext
2023
17,000
Squirrel PRV 15 Yea
r Reb
uild
Water/Sew
er System Im
p & Ext
2023
15,000
South Boulevard W
M16" Water M
ain Rep
lacemen
t2024
275,000
3,750,000
Tower In
terior Coating
Tower Coating & other m
isc item
s from 2021 in
spection
2026
220,000
Southea
st District WM Rep
lacemen
tAC W
ater M
ain Rep
lacemen
t2029
Commonwea
lth W
MAC W
ater M
ain Rep
lacemen
t2036
SCADA RTU
Upgrad
e an
d Im
provemen
tWater/Sew
er System Im
p & Ext
2021‐2026
40,000
10,000
10,000
10,000
VFD
Rep
air/Rep
lacemen
tWater/Sew
er System Im
p & Ext
2025‐2026
10,000
10,000
4,314,578
185,000
2,272,000
3,760,000
20,000
240,000
2021‐2026 Cap
ital Project Budge
t Plan
Water Departm
ent ‐ 536
77

2022 BUDGET
‐ 5 YEA
R PROJECTIONS
Project
Description
Project
Start Year
2021
2022
2023
2024
2025
2026
Den
/Fieldstone Build
ing
Surface Seal
2021
26,250
River W
oods
Crack Sea
l2021
2,500
Riverside Park
Riverside Park Ban
k Stab
ilization
2021
273,510
Riverside Park
Riverside Park Play Structure
2021
300,000
Riverside Park
Riverside Park Gazeb
o2021
70,000
Ped
estrian Alleyw
ayLand and Im
provemen
ts2021
20,170
Den
Ren
ovation
Bldg Additions & Im
provemen
ts2021
25,000
Parking Structure
Maintenan
ce per 2021 condition assessm
ent
2022
500,000
Public Square
Land and Im
provemen
ts2022
200,000
Skate Park Ren
ovation
Rep
lacemen
t2022
300,000
Skate Park Ren
ovation
Play Structure
2023
150,000
Primary Parking Lot/Sidew
alk
Lot an
d sidew
alk repairs
2024
118,800
Skate Park Ren
ovation
Basketball C
ourt
2024
100,000
Downtown Public Art In
itiative
Land and Im
provemen
ts2021‐2026
30,000
30,000
30,000
30,000
30,000
30,000
747,430
1,030,000
180,000
248,800
30,000
30,000
2021‐2026 Cap
ital Project Budge
t Plan
TIFA
A ‐ 735
78

2022 BUDGET
‐ 5 YEA
R PROJECTIONS
Project
Description
Project
Start Year
2021
2022
2023
2024
2025
2026
M‐59/H
illfield W
M Crossing/PRV
12" WM & PRV
2021
425,000
Strategic Property Purchases
Land and Im
provemen
ts2021‐2022
1,500,000
1,500,000
Non‐M
otorized Pathways
Non M
otorized Pathways
2021‐2026
10,000
10,000
10,000
10,000
10,000
10,000
1,935,000
1,510,000
10,000
10,000
10,000
10,000
2021‐2026 Cap
ital Project Budge
t Plan
TIFA
B ‐ 736
79

2022 BUDGET
‐ 5 YEA
R PROJECTIONS
Project
Description
Project
Start Year
2021
2022
2023
2024
2025
2026
Public Safety Fence
Land and Im
provemen
ts2021
200,000
Cam
pus Sign
Land and Im
provemen
ts2021
125,000
Municipal Cam
pus Pavilion
Land and Im
provemen
ts2021
322,239
City Cam
pus Lot 9 ‐ Ballfield Lot
Surface Seal
2022
11,000
City Cam
pus Lot 4 ‐ Public Safety Build
ing
Surface Seal
2022
8,800
Library Pond Dredging
Land and Im
provemen
ts2022
100,000
Security Upgrad
es for City Hall
Bldg Additions & Im
provemen
ts2022
70,000
Property and Eviden
ce Room Storage Upgrad
esBldg Additions & Im
provemen
ts2022
46,000
Police Uniform
and Equipmen
t Storage
Bldg Additions & Im
provemen
ts2022
20,000
Community Cen
ter Kitchen
Ren
ovation
Bldg Additions & Im
provemen
ts2022
100,000
City Cam
pus Lot 7 ‐ 2424 Seyburn
Surface Seal
2023
10,350
City Cam
pus Lot 3 ‐ 2424 Seyburn
Surface Seal
2023
6,900
City Cam
pus Lot 8 ‐ Community Cen
ter
Surface Seal
2023
23,000
City Cam
pus Lot 5 ‐ Library
Surface Seal
2023
21,850
City Cam
pus Lot 10 ‐ Football Field
Surface Seal
2023
25,300
City Cam
pus Lor 1 ‐ City Man
ager
Surface Seal
2023
10,350
Fire Station 2 Ren
ovation
Bldg Additions & Im
provemen
ts2023
500,000
Cross Creek
Non M
otorized Pathways
2026
475,000
High M
eadow
Non M
otorized Pathways
2026
300,000
Municipal Storage Build
ing
Bldg Additions & Im
provemen
ts2021‐2022
18,742
50,000
Irrigation Systems
Irrigation W
ater and M
aint
2021‐2026
74,000
75,000
76,000
77,000
78,000
79,000
ADA Crosswalk Im
provemen
tsRoad
Maintenan
ce2022‐2026
25,000
25,000
25,000
739,981
505,800
673,750
102,000
78,000
879,000
2021‐2026 Cap
ital Project Budge
t Plan
TIFA
D ‐ 737
80

2022 BUDGET - 5 YEAR PROJECTIONS
Full Time Personnel Summary
2020 2021 2022
GENERAL FUND Actual Amended Budget
City CouncilMayor 1.00 1.00 1.00City Council 6.00 6.00 6.00
Total City Council 7.00 7.00 7.00
City ManagerCity Manager 1.00 1.00 1.00Assistant City Manager 1.00 1.00 1.00Director of Authorities 1.00 1.00 0.00Executive Assistant 1.00 1.00 1.00Business Development/Community Relations 1.00 0.00 0.00Media Communications Specialist 1.00 1.00 1.00
Total City Manager 6.00 5.00 4.00
City Clerk & ElectionsCity Clerk 1.00 1.00 1.00Deputy Clerk 1.00 1.00 1.00Clerk II 0.00 0.00 0.00
Total City Clerk & Elections 2.00 2.00 2.00
Finance/TreasurerFinance Director/Treasurer 1.00 1.00 1.00Deputy Finance Director/Deputy Treasurer 1.00 1.00 1.00Accounts Receivable Manager 1.00 1.00 1.00Accountant 2.00 2.00 2.00Cashier/Clerk III 2.00 2.00 2.00
Total Finance 7.00 7.00 7.00
AssessorAssessor 1.00 0.00 0.00Deputy Assessor 1.00 0.00 0.00Appraiser I 1.00 0.00 0.00Appraiser II 1.00 0.00 0.00Clerk III 1.00 0.00 0.00
Total Assessor 5.00 0.00 0.00
ADMINISTRATION
O:\All\2022 budget\Budget Book\Tab 9\22.Personnel Summary, 202081

2022 BUDGET - 5 YEAR PROJECTIONS
Full Time Personnel Summary
2020 2021 2022Actual Amended Budget
Human ResourcesHuman Resources Generalist 1.00 1.00 1.00Human Resources Development 1.00 1.00 1.00
Total Human Resources 2.00 2.00 2.00
Public Works AdministrationDirector of Public Works 1.00 1.00 1.00Deputy Director 1.00 0.00 0.00Administrative Assistant 1.00 1.00 1.00GIS Technician 1.00 1.00 1.00Manager 3.00 3.00 3.00Clerk III 2.00 2.00 2.00
Total Public Service 9.00 8.00 8.00
Total Administration 38.00 31.00 30.00
Building ServicesBuilding Official 1.00 1.00 1.00Building Inspector II 2.00 2.00 2.00Ordinance Enforcement Officer 2.00 2.00 2.00Clerk III 2.00 2.00 2.00
Total Building 7.00 7.00 7.00
Comm. Development-AdministrationComm. Dev. Director 1.00 1.00 1.00Administrative Assistant 1.00 1.00 1.00Economic Dev. Coordinator 0.00 1.00 1.00
Total Comm. Dev.-Admin. 2.00 3.00 3.00
Total Planning/Development 9.00 10.00 10.00
FacilitiesCrew Leader 1.00 1.00 1.00General Maintenance 7.00 7.00 7.00
Total Facilities 8.00 8.00 8.00
PLANNING/DEVELOPMENT
GENERAL SUPPORT
O:\All\2022 budget\Budget Book\Tab 9\22.Personnel Summary, 202082

2022 BUDGET - 5 YEAR PROJECTIONS
Full Time Personnel Summary
2020 2021 2022Actual Amended Budget
Parks and GroundsCrew Leader 1.00 1.00 1.00General Maintenance 5.00 4.00 4.00
Total Parks and Grounds 6.00 5.00 5.00
Total General Support 14.00 13.00 13.00
RecreationRecreation Director 1.00 1.00 1.00Recreation Coordinator 1.00 1.00 1.00
Total Recreation 2.00 2.00 2.00
Senior ServicesSenior Services Director 1.00 1.00 1.00Program Coordinator 2.00 2.00 2.00
Total Senior Citizens 3.00 3.00 3.00
ParksParks Director 0.00 1.00 1.00 General Maintenance 0.00 2.00 2.00
- 3.00 3.00
Total Community Programs 5.00 8.00 8.00
Fire-AdministrationFire Chief 1.00 1.00 1.00Deputy Fire Chief 1.00 1.00 1.00Administrative Officer 0.00 0.00 1.00Clerk III 1.00 1.00 1.00
Total Fire-Administration 3.00 3.00 4.00
Fire-PreventionFire Marshal 0.00 0.00 0.00Fire Inspector 2.00 2.00 2.00
Total Fire-Prevention 2.00 2.00 2.00
Fire-SuppressionCaptain 3.00 3.00 3.00Administrative Officer 1.00 1.00 0.00Lieutenants 3.00 3.00 3.00Firefighter 18.00 18.00 22.00
Total Fire-Suppression 25.00 25.00 28.00
Total Fire Personnel 30.00 30.00 34.00
COMMUNITY PROGRAMS
FIRE AND POLICE DEPARTMENTS
O:\All\2022 budget\Budget Book\Tab 9\22.Personnel Summary, 202083

2022 BUDGET - 5 YEAR PROJECTIONS
Full Time Personnel Summary
2020 2021 2022Actual Amended Budget
Police-AdministrationPolice Chief 1.00 1.00 1.00Deputy Police Chief 1.00 1.00 1.00Administrative Assistant 1.00 1.00 1.00Technical Services Coordinator 1.00 1.00 1.00Clerk III 3.00 3.00 3.00
Total Police - Administration 7.00 7.00 7.00
Police-PatrolLieutenant 3.00 3.00 3.00Sergeant 5.00 5.00 5.00Detective 5.00 5.00 5.00Police Officer 38.00 38.00 38.00
Total Police - Patrol 51.00 51.00 51.00
Total Police Personnel 58.00 58.00 58.00
Storm Water ManagementAssistant City Planner 1.00 1.00 1.00
Total Storm Water Management 1.00 1.00 1.00
TOTAL GENERAL FUND 155.00 151.00 154.00
ENTERPRISE FUNDS Fieldstone Golf CourseDirector of Golf 1.00 1.00 1.00
Total Fieldstone Golf Course 1.00 1.00 1.00
Sewer FundCrew Leader 1.00 1.00 1.00General Maintenance 4.00 4.00 4.00
Total Sewer Fund 5.00 5.00 5.00
Water FundCrew Leader 1.00 1.00 1.00General Maintenance 5.00 5.00 5.00
Total Water Fund 6.00 6.00 6.00
TOTAL PROPRIETARY FUNDS 12.00 12.00 12.00
INFRASTRUCTURE
O:\All\2022 budget\Budget Book\Tab 9\22.Personnel Summary, 202084

2022 BUDGET - 5 YEAR PROJECTIONS
Full Time Personnel Summary
2020 2021 2022Actual Amended Budget
STREETS, HIGHWAYS, PUBLIC IMPROVEMENTS & FLEET
Local Streets-DPWCrew Leader 0.00 0.00 0.00General Maintenance 3.00 3.00 3.00
Total Local Streets-DPW 3.00 3.00 3.00
Major Streets-DPWCrew Leader 1.00 1.00 1.00General Maintenance 3.00 3.00 3.00
Total Major Streets-DPW 4.00 4.00 4.00
Fleet ManagementManager (see DPW Administration) 0.00 0.00 0.00Mechanics 3.00 3.00 3.00
Total Fleet Management 3.00 3.00 3.00
TOTAL STREETS, PUBLIC IMPROVEMENTS & FLEET 10.00 10.00 10.00
TOTAL CITY OF AUBURN HILLS (1) 177.00 173.00 176.00
(1) Totals include elected officials
O:\All\2022 budget\Budget Book\Tab 9\22.Personnel Summary, 202085

2022 BUDGET - 5 YEAR PROJECTIONS
Part Time Personnel Summary
2020 2021 2022
GENERAL FUND Actual Amended Budget
City ManagerDowntown Engagement Specialist (TIFA allocated) 1 1 1City Manager new Part Time position 1Receptionist 2 2 2Graphic Designer 1 1 1Interns 2 2 2
Total City Manager 6 6 7
City Clerk & ElectionsVoter Registration Clerk 1 1 1
Finance/TreasurerIntern 1 0 0
Human ResourcesIntern 1 1 1
Public Works AdministrationGIS support 1 1 1
Total Administration 10 9 10
FacilitiesCustodian 1 1 0Recreation Custodians (moved to Rec 2021) 4 0 0
Total Facilities 5 1 0
Parks and GroundsSeasonal 4 4 4
Total General Support 9 5 4
RecreationRecreation Custodian (from Facilities 2021) 2 6 6Front Desk Clerk (split with seniors) 6 6 6Park Monitor 2 2 2Program Leader 4 4 4Building Supervisor 4 4 4Rec event/Bldg Supervisor 2 2 2Youth Coordinator 1 1 1Outdoor Education Instructor 1 1 1Seasonal- camp and parks 7 14 14
Total Recreation 29 40 40
ParksSeasonal 2 2
COMMUNITY PROGRAMS
ADMINISTRATION
GENERAL SUPPORT
O:\All\2022 budget\Budget Book\Tab 9\22.Personnel Summary Part time, 202086

2022 BUDGET - 5 YEAR PROJECTIONS
Part Time Personnel Summary
2020 2021 2022
GENERAL FUND Actual Amended Budget
Senior ServicesBus Drivers 4 4 4Seniors Health - Wellness Coordinator 1 1 1
Total Senior Citizens 5 5 5
Total Community Programs 34 47 47
Fire-PreventionPT position 1 1 1
Fire-SuppressionPart-time/Paid on Call Firefighters 12 12 12
Total Fire Personnel 13 13 13
Police-AdministrationPolice Cadet/Front Desk Officer 9 9 9
Police-PatrolSupport Services Tech 1 1Investigations Analyst 1 1Police Officer Trainee/Intern 2 4 4
Total Police Personnel 11 15 15
FIRE AND POLICE DEPARTMENTS
O:\All\2022 budget\Budget Book\Tab 9\22.Personnel Summary Part time, 202087

2022 BUDGET - 5 YEAR PROJECTIONS
Part Time Personnel Summary
2020 2021 2022
GENERAL FUND Actual Amended Budget
ENTERPRISE FUNDS Fieldstone Golf CourseAssistant Golf Professional 1 1 1Senior Assitant Golf Course Manager 1 1 1Outside Golf Services 3 3 3Seasonal 20 20 20
Total Fieldstone Golf Course 25 25 25
Sewer FundSeasonal 1 1 1
Water FundSeasonal 0 2 2
TOTAL PROPRIETARY FUNDS 26 28 28
STREETS, HIGHWAYS, PUBLIC IMPROVEMENTS & FLEET
Local Streets-DPWSeasonal 0 1 1
Major Streets-DPWSeasonal 1 2 2
TOTAL STREETS, PUBLIC IMPROVEMENTS & FLEET 1 3 3
TOTAL CITY OF AUBURN HILLS- Part Time 104 120 120
O:\All\2022 budget\Budget Book\Tab 9\22.Personnel Summary Part time, 202088

2022 BUDGET - 5 YEAR PROJECTIONS
Fund Debt Description Principal Interest Principal Interest
Maturity Year
Government Funds
Storm Water SRF - Galloway Drain 50,000 11,375 480,000 55,750 2030Storm Water SRF - Storm Water Retrofit 5,000 1,754 72,658 9,358 2030SA Debt Roads Special Assessment 175,000 19,374 1,015,000 64,370 2027Cap Imp Debt Capital Improvement Debt 2017 Series 410,000 151,650 5,260,000 913,800 2032Cap Imp Debt Capital Improvement Debt 2021 Series 970,000 331,750 13,240,000 2,347,075 2033
1,610,000 515,903 20,067,658 3,390,353
Proprietary Funds
Sewer/Water SRF - Sanitary Sewer Rehabilitation 60,000 14,125 595,000 69,313 2030Sewer/Water OMID Interceptor Drain 2010A 43,142 11,577 484,645 63,068 2031Sewer/Water OMID Interceptor Drain 2011A 49,315 17,042 729,985 134,023 2033Sewer/Water OMID Interceptor Drain 2013A 106,915 31,387 1,569,364 188,782 2034Sewer/Water OMID Interceptor Drain 2019A 12,067 2,261 128,269 11,293 2030Sewer/Water OMID Interceptor Drain 2019B 55,129 3,507 226,258 8,839 2025Sewer/Water Clinton River SRF 97,263 46,129 2,035,846 407,464 2038
423,830 126,028 5,769,367 882,782
TOTAL LONG-TERM DEBT 2,033,830 641,931 25,837,025 4,273,134
2022 Total Debt Due as of 1/1/2022
2022 - Long-Term Debt Summary
O:\All\2022 budget\Budget Book\Tab 10\22.Debt Service
89

2022 BUDGET - 5 YEAR PROJECTIONS
Issue Date 09/16/09Principal $936,000
Interest Rate 2.50%
101-445-994.000 101-445-995.100Payment Principal Interest Total Total Interest by
Date Due Due Payment Fiscal Year Fiscal Year2011 35,000.00 18,549.42 53,549.42 53,549.42 18,549.42
04/01/12 36,000.00 11,938.64 47,938.6410/01/12 10,812.50 10,812.50 58,751.14 22,751.1404/01/13 40,000.00 10,812.50 50,812.5010/01/13 10,312.50 10,312.50 61,125.00 21,125.0004/01/14 40,000.00 10,312.50 50,312.5010/1/214 9,812.50 9,812.50 60,125.00 20,125.0004/01/15 40,000.00 9,812.50 49,812.5010/01/15 9,312.50 9,312.50 59,125.00 19,125.0004/01/16 40,000.00 9,312.50 49,312.5010/01/16 8,812.50 8,812.50 58,125.00 18,125.0004/01/17 45,000.00 8,812.50 53,812.5010/01/17 8,250.00 8,250.00 62,062.50 17,062.5004/01/18 45,000.00 8,250.00 53,250.0010/01/18 7,687.50 7,687.50 60,937.50 15,937.5004/01/19 45,000.00 7,687.50 52,687.5010/01/19 7,125.00 7,125.00 59,812.50 14,812.5004/01/20 45,000.00 7,125.00 52,125.0010/01/20 6,562.50 6,562.50 58,687.50 13,687.5004/01/21 45,000.00 6,562.50 51,562.5010/01/21 6,000.00 6,000.00 57,562.50 12,562.50
04/01/22 50,000.00 6,000.00 56,000.0010/01/22 5,375.00 5,375.00 61,375.00 11,375.00
04/01/23 50,000.00 5,375.00 55,375.0010/01/23 4,750.00 4,750.00 60,125.00 10,125.0004/01/24 50,000.00 4,750.00 54,750.0010/01/24 4,125.00 4,125.00 58,875.00 8,875.0004/01/25 50,000.00 4,125.00 54,125.0010/01/25 3,500.00 3,500.00 57,625.00 7,625.0004/01/26 55,000.00 3,500.00 58,500.0010/01/26 2,812.50 2,812.50 61,312.50 6,312.5004/01/27 55,000.00 2,812.50 57,812.5010/01/27 2,125.00 2,125.00 59,937.50 4,937.5004/01/28 55,000.00 2,125.00 57,125.0010/01/28 1,437.50 1,437.50 58,562.50 3,562.5004/01/29 55,000.00 1,437.50 56,437.5010/01/29 750.00 750.00 57,187.50 2,187.5004/01/30 60,000.00 750.00 60,750.00 60,750.00 750.00
Total Due $480,000.00 $55,750.00 $535,750.00 $535,750.00 $55,750.00
Total Debt $936,000.00 $249,613.06 $1,185,613.06 $1,185,613.06 $249,613.06
2022 - Debt Service Requirements
State Revolving Fund-Galloway Bond 5296-01Storm Water Management Fund 101-445
O:\All\2022 budget\Budget Book\Tab 10\22.Debt Service
90

2022 BUDGET - 5 YEAR PROJECTIONS
Issue Date 09/21/09Principal $126,658
Interest Rate 2.50%
101-445-994.000 101-445-995.100Payment Principal Interest Total Total Interest by
Date Due Due Payment Fiscal Year Fiscal Year2010 0.00 1,313.55 1,313.55 1,313.55 1,313.552011 4,000.00 2,667.32 6,667.32 6,667.32 2,667.32
04/01/12 5,000.00 1,397.66 6,397.6610/01/12 1,413.17 1,413.17 7,810.83 2,810.8304/01/13 5,000.00 1,462.48 6,462.4810/01/13 1,408.23 1,408.23 7,870.71 2,870.7104/01/14 5,000.00 1,408.23 6,408.2310/01/14 1,345.73 1,345.73 7,753.96 2,753.9604/01/15 5,000.00 1,345.73 6,345.7310/01/15 1,283.23 1,283.23 7,628.96 2,628.9604/01/16 5,000.00 1,283.23 6,283.2310/01/16 1,220.73 1,220.73 7,503.96 2,503.9604/01/17 5,000.00 1,220.73 6,220.7310/01/17 1,158.23 1,158.23 7,378.96 2,378.9604/01/18 5,000.00 1,158.23 6,158.2310/01/18 1,095.73 1,095.73 7,253.96 2,253.9604/01/19 5,000.00 1,095.73 6,095.7310/01/19 1,033.23 1,033.23 7,128.96 2,128.9604/01/20 5,000.00 1,033.23 6,033.2310/01/20 970.73 970.73 7,003.96 2,003.9604/01/21 5,000.00 970.73 5,970.7310/01/21 908.23 908.23 6,878.96 1,878.96
04/01/22 5,000.00 908.23 5,908.2310/01/22 845.73 845.73 6,753.96 1,753.96
04/01/23 5,000.00 845.73 5,845.7310/01/23 783.23 783.23 6,628.96 1,628.9604/01/24 5,000.00 783.23 5,783.2310/01/24 720.73 720.73 6,503.96 1,503.9604/01/25 7,658.00 720.73 8,378.7310/01/25 625.00 625.00 9,003.73 1,345.7304/01/26 10,000.00 625.00 10,625.0010/01/26 500.00 500.00 11,125.00 1,125.0004/01/27 10,000.00 500.00 10,500.0010/01/27 375.00 375.00 10,875.00 875.0004/01/28 10,000.00 375.00 10,375.0010/01/28 250.00 250.00 10,625.00 625.0004/01/29 10,000.00 250.00 10,250.0010/01/29 125.00 125.00 10,375.00 375.0004/01/30 10,000.00 125.00 10,125.00 10,125.00 125.00
Total Due $72,658.00 $9,357.61 $82,015.61 $82,015.61 $9,357.61
Total Debt $126,658.00 $37,551.70 $164,209.70 $164,209.70 $37,551.70
2022 - Debt Service Requirements
State Revolving Fund-Storm Water Retrofit 5295-01Storm Water Management Fund 101-445
O:\All\2022 budget\Budget Book\Tab 10\22.Debt Service
91

2022 BUDGET - 5 YEAR PROJECTIONS
Issue Date 11/02/17Principal $1,665,000
852-908-994.000 852-908-995.100
Payment Principal Interest Interest Total Total Interest byDate Due Rate Due Payment Fiscal Year Fiscal Year
06/01/18 125,000 2.00% 19,811 144,811 35,62312/01/18 15,812 15,812 160,62306/01/19 175,000 2.00% 15,812 190,812 29,87412/01/19 14,062 14,062 204,87406/01/20 175,000 2.00% 14,062 189,062 26,37412/01/20 12,312 12,312 201,37406/01/21 175,000 2.00% 12,312 187,312 22,87412/01/21 10,562 10,562 197,874
06/01/22 175,000 2.00% 10,562 185,562 19,37412/01/22 8,812 8,812 194,374
06/01/23 170,000 2.00% 8,812 178,812 15,92412/01/23 7,112 7,112 185,92406/01/24 170,000 2.00% 7,112 177,112 12,52412/01/24 5,412 5,412 182,52406/01/25 170,000 2.00% 5,412 175,412 9,12412/01/25 3,712 3,712 179,12406/01/26 165,000 2.25% 3,712 168,712 5,56812/01/26 1,856 1,856 170,56806/01/27 165,000 2.25% 1,856 166,856 166,856 1,856
Total Due $1,015,000 $64,370 $1,079,370 $1,079,370 $64,370
Total Debt $1,665,000 $179,115 $1,844,115 $1,844,115 $179,115
2022 - Debt Service RequirementsSpecial Assessment Bond Series 852-908
O:\All\2022 budget\Budget Book\Tab 10\22.Debt Service
92

2022 BUDGET - 5 YEAR PROJECTIONS
Issue Date 11/02/17Principal $6,865,000.00
Interest Rate 3.00%
350-907-994.000 350-907-995.100
Payment Principal Interest Total Total Interest byDate Due Due Payment Fiscal Year Fiscal Year
06/01/18 445,000.00 119,565.42 564,565.42 215,865.4212/01/18 96,300.00 96,300.00 660,865.4206/01/19 375,000.00 96,300.00 471,300.00 186,975.0012/01/19 90,675.00 90,675.00 561,975.0006/01/20 385,000.00 90,675.00 475,675.00 175,575.0012/01/20 84,900.00 84,900.00 560,575.0006/01/21 400,000.00 84,900.00 484,900.00 163,800.0012/01/21 78,900.00 78,900.00 563,800.00
06/01/22 410,000.00 78,900.00 488,900.00 151,650.0012/01/22 72,750.00 72,750.00 561,650.00
06/01/23 425,000.00 72,750.00 497,750.00 139,125.0012/01/23 66,375.00 66,375.00 564,125.0006/01/24 435,000.00 66,375.00 501,375.00 126,225.0012/01/24 59,850.00 59,850.00 561,225.0006/01/25 450,000.00 59,850.00 509,850.00 112,950.0012/01/25 53,100.00 53,100.00 562,950.0006/01/26 465,000.00 53,100.00 518,100.00 99,225.0012/01/26 46,125.00 46,125.00 564,225.0006/01/27 475,000.00 46,125.00 521,125.00 85,125.0012/01/27 39,000.00 39,000.00 560,125.0006/01/28 490,000.00 39,000.00 529,000.00 70,650.0011/30/28 31,650.00 31,650.00 560,650.0006/01/29 505,000.00 31,650.00 536,650.00 55,725.0012/01/29 24,075.00 24,075.00 560,725.0006/01/30 520,000.00 24,075.00 544,075.00 40,350.0012/01/30 16,275.00 16,275.00 560,350.0006/01/31 535,000.00 16,275.00 551,275.00 24,525.0012/01/31 8,250.00 8,250.00 559,525.0006/01/32 550,000.00 8,250.00 558,250.00 8,250.0012/01/32 558,250.00
Total Due $5,260,000.00 $913,800.00 $6,173,800.00 $6,173,800.00 $913,800.00
Total Debt $6,865,000.00 $1,656,015.42 $8,521,015.42 $8,521,015.42 $1,656,015.42
2022 - Debt Service RequirementsCapital Improvement Bond 350-907
O:\All\2022 budget\Budget Book\Tab 10\22.Debt Service
93

2022 BUDGET - 5 YEAR PROJECTIONS
Issue Date 07/13/21Principal $13,240,000
Payment Principal Interest Total TotalDate Due Due Payment Fiscal Year
8/3/2021
12/1/2021 111,920 111,920 111,920
6/1/2022 970,000 2.00% 170,725 1,140,72512/1/2022 161,025 161,025 1,301,750
6/1/2023 985,000 2.00% 161,025 1,146,02512/1/2023 151,175 151,175 1,297,200
6/1/2024 1,005,000 2.00% 151,175 1,156,17512/1/2024 141,125 141,125 1,297,300
6/1/2025 1,030,000 2.00% 141,125 1,171,12512/1/2025 130,825 130,825 1,301,950
6/1/2026 1,050,000 2.00% 130,825 1,180,82512/1/2026 120,325 120,325 1,301,150
6/1/2027 1,070,000 2.50% 120,325 1,190,32512/1/2027 106,950 106,950 1,297,275
6/1/2028 1,100,000 3.00% 106,950 1,206,95012/1/2028 90,450 90,450 1,297,400
6/1/2029 1,135,000 3.00% 90,450 1,225,45012/1/2029 73,425 73,425 1,298,875
6/1/2030 1,170,000 3.00% 73,425 1,243,42512/1/2030 55,875 55,875 1,299,300
6/1/2031 1,205,000 3.00% 55,875 1,260,87512/1/2031 37,800 37,800 1,298,675
6/1/2032 1,240,000 3.00% 37,800 1,277,80012/1/2032 19,200 19,200 1,297,000
6/1/2033 1,280,000 3.00% 19,200 1,299,20012/1/2033 1,299,200
Total Due $13,240,000 $2,347,075 $15,587,075 $15,587,075
Total Debt $13,240,000 $2,458,995 $15,698,995 $15,698,995
Capital Improvement Bond2022 - Debt Service Requirements
94

2022 BUDGET - 5 YEAR PROJECTIONS
Issue Date 09/21/09Principal $1,198,696
Interest Rate 2.50%
592-535-994.000 592-535-995.200Payment Principal Interest Total Total Interest by
Date Due Due Payment Fiscal Year Fiscal Year2010 $2,683.86 $2,683.86 $2,683.86 $2,683.862011 49,000.00 24,894.89 73,894.89 73,894.89 24,894.89
04/01/12 49,696.00 14,217.96 63,913.9610/01/12 13,750.00 13,750.00 77,663.96 27,967.9604/01/13 55,000.00 13,750.00 68,750.0010/01/13 13,062.50 13,062.50 81,812.50 26,812.5004/01/14 55,000.00 13,062.50 68,062.5010/1/214 12,375.00 12,375.00 80,437.50 25,437.5004/01/15 55,000.00 12,375.00 67,375.0010/01/15 11,687.50 11,687.50 79,062.50 24,062.5004/01/16 55,000.00 11,687.50 66,687.5010/01/16 11,000.00 11,000.00 77,687.50 22,687.5004/01/17 55,000.00 11,000.00 66,000.0010/01/17 10,312.50 10,312.50 76,312.50 21,312.5004/01/18 55,000.00 10,312.50 65,312.5010/01/18 9,625.00 9,625.00 74,937.50 19,937.5004/01/19 55,000.00 9,625.00 64,625.0010/01/19 8,937.50 8,937.50 73,562.50 18,562.5004/01/20 60,000.00 8,937.50 68,937.5010/01/20 8,187.50 8,187.50 77,125.00 17,125.0004/01/21 60,000.00 8,187.50 68,187.5010/01/21 7,437.50 7,437.50 75,625.00 15,625.00
04/01/22 60,000.00 7,437.50 67,437.5010/01/22 6,687.50 6,687.50 74,125.00 14,125.00
04/01/23 60,000.00 6,687.50 66,687.5010/01/23 5,937.50 5,937.50 72,625.00 12,625.0004/01/24 60,000.00 5,937.50 65,937.5010/01/24 5,187.50 5,187.50 71,125.00 11,125.0004/01/25 65,000.00 5,187.50 70,187.5010/01/25 4,375.00 4,375.00 74,562.50 9,562.5004/01/26 70,000.00 4,375.00 74,375.0010/01/26 3,500.00 3,500.00 77,875.00 7,875.0004/01/27 70,000.00 3,500.00 73,500.0010/01/27 2,625.00 2,625.00 76,125.00 6,125.0004/01/28 70,000.00 2,625.00 72,625.0010/01/28 1,750.00 1,750.00 74,375.00 4,375.0004/01/29 70,000.00 1,750.00 71,750.0010/01/29 875.00 875.00 72,625.00 2,625.0004/01/30 70,000.00 875.00 70,875.00 70,875.00 875.00
Total Due $595,000.00 $69,312.50 $664,312.50 $664,312.50 $69,312.50
Total Debt $1,198,696.00 $316,421.71 $1,515,117.71 $1,515,117.71 $316,421.71
2022 - Debt Service Requirements
State Revolving Fund-Sanitary Sewer Rehabilitation 5341-01Sewer Fund 592-535
O:\All\2022 budget\Budget Book\Tab 10\22.Debt Service
95

2022 BUDGET - 5 YEAR PROJECTIONS
Project 5368-01 Principal $862,046Issue Date 07/20/10 Interest Rate 2.50%
592-535-994.000 592-535-995.100Payment Principal Interest Total Total Total By
Date Due Due Payment Fiscal Year Fiscal Year10/01/10 14,367.44 14,367.44 14,367.44 14,367.4404/01/11 0.00 10,775.58 10,775.5810/01/11 10,775.68 10,775.68 21,551.26 21,551.2604/01/12 33,587.94 10,775.58 44,363.5210/01/12 10,355.73 10,355.73 54,719.25 21,131.3104/01/13 34,546.66 10,355.73 44,902.3910/01/13 9,923.90 9,923.90 54,826.29 20,279.6304/01/14 35,373.13 9,923.90 45,297.0310/1/214 9,481.73 9,481.73 54,778.76 19,405.6304/01/15 36,199.61 9,481.73 45,681.3410/01/15 9,029.24 9,029.24 54,710.58 18,510.9704/01/16 37,191.38 9,029.24 46,220.6210/01/16 8,564.35 8,564.35 54,784.97 17,593.5904/01/17 38,183.15 8,564.35 46,747.5010/01/17 8,087.06 8,087.06 54,834.56 16,651.4104/01/18 39,009.62 8,087.06 47,096.6810/01/18 7,599.44 7,599.44 54,696.12 15,686.5004/01/19 40,001.39 7,599.44 47,600.8310/01/19 7,099.42 7,099.42 54,700.25 14,698.8604/01/20 41,158.46 7,099.42 48,257.8810/01/20 6,584.94 6,584.94 54,842.82 13,684.36
04/01/21 42,150.23 6,584.94 48,735.17
10/01/21 6,058.06 6,058.06 54,793.23 12,643.00
04/01/22 43,142.00 6,058.06 49,200.0610/01/22 5,518.79 5,518.79 54,718.85 11,576.85
04/01/23 44,299.06 5,518.79 49,817.8510/01/23 4,965.05 4,965.05 54,782.90 10,483.8404/01/24 45,456.13 4,965.05 50,421.1810/01/24 4,396.85 4,396.85 54,818.03 9,361.9004/01/25 46,613.19 4,396.85 51,010.0410/01/25 3,814.18 3,814.18 54,824.22 8,211.0304/01/26 47,770.26 3,814.18 51,584.4410/01/26 3,217.05 3,217.05 54,801.49 7,031.2304/01/27 48,927.32 3,217.05 52,144.3710/01/27 2,605.46 2,605.46 54,749.83 5,822.5104/01/28 50,249.68 2,605.46 52,855.1410/01/28 1,977.34 1,977.34 54,832.48 4,582.8004/01/29 51,406.75 1,977.34 53,384.0910/01/29 1,334.76 1,334.76 54,718.85 3,312.1004/01/30 52,729.11 1,334.76 54,063.8710/01/30 675.64 675.64 54,739.51 2,010.4004/01/31 54,051.47 675.64 54,727.11 54,727.11 675.64
Total Due 484,644.97$ 63,068.30$ 547,713.27$ 547,713.27$ 63,068.30$
Total Debt 862,046.54$ 269,272.26$ 1,131,318.80$ 1,131,318.80$ 269,272.26$
2022 - Debt Service RequirementsOakland-Macomb Interceptor Drain Bond, Series 2010A
Sewer Fund 592-535, Auburn Hills Share3.3059%
O:\All\2022 budget\Budget Book\Tab 10\22.Debt Service
96

2022 BUDGET - 5 YEAR PROJECTIONS
Principal $1,036,225Project 5368-02
Issue Date 01/01/12
592-535-994.000 592-535-995.100Payment Principal Interest Total Total Interest by
Date Due Due 2.5% Payment Fiscal Year Fiscal Year04/01/12 6,476.41 6,476.4110/01/12 12,952.82 12,952.82 19,429.23 19,429.2304/01/13 12,952.82 12,952.8210/01/13 12,952.82 12,952.82 25,905.64 25,905.6404/01/14 12,952.82 12,952.8210/01/14 40,588.54 12,952.82 53,541.36 66,494.18 25,905.6404/01/15 11,484.90 11,484.9010/01/15 41,603.25 11,484.90 53,088.15 64,573.05 22,969.8004/01/16 11,784.28 11,784.2810/01/16 42,617.97 11,925.42 54,543.39 66,327.67 23,709.7004/01/17 11,392.70 11,392.7010/01/17 43,632.68 11,392.70 55,025.38 66,418.08 22,785.4004/01/18 10,847.29 10,847.2910/01/18 44,850.34 10,847.29 55,697.63 66,544.92 21,694.5804/01/19 10,286.66 10,286.6610/01/19 45,865.05 10,286.66 56,151.71 66,438.37 20,573.3204/01/20 9,713.34 9,713.3410/01/20 47,082.71 9,713.34 56,796.05 66,509.39 19,426.6804/01/21 9,124.81 9,124.8110/01/21 48,300.36 9,124.81 57,425.17 66,549.98 18,249.62
04/01/22 8,521.06 8,521.0610/01/22 49,315.08 8,521.06 57,836.14 66,357.20 17,042.12
04/01/23 7,904.62 7,904.6210/01/23 50,735.68 7,904.62 58,640.30 66,544.92 15,809.2404/01/24 7,270.42 7,270.4210/01/24 51,953.33 7,270.42 59,223.75 66,494.17 14,540.8404/01/25 6,621.01 6,621.0110/01/25 53,170.99 6,621.01 59,792.00 66,413.01 13,242.0204/01/26 5,956.37 5,956.3710/01/26 54,591.59 5,956.37 60,547.96 66,504.33 11,912.7404/01/27 5,273.97 5,273.9710/01/27 56,012.19 5,273.97 61,286.16 66,560.13 10,547.9404/01/28 4,573.82 4,573.8210/01/28 57,229.84 4,573.82 61,803.66 66,377.48 9,147.6404/01/29 3,858.45 3,858.4510/01/29 58,650.44 3,858.45 62,508.89 66,367.34 7,716.9004/01/30 3,125.32 3,125.3210/01/30 60,273.98 3,125.32 63,399.30 66,524.62 6,250.6404/01/31 2,371.89 2,371.8910/01/31 61,694.58 2,371.89 64,066.47 66,438.36 4,743.7804/01/32 1,600.71 1,600.7110/01/32 63,318.12 1,600.71 64,918.83 66,519.54 3,201.4204/01/33 809.23 809.2310/01/33 64,738.72 809.23 65,547.95 66,357.18 1,618.46
Total Due $729,984.90 $134,023.36 $864,008.26 $864,008.26 $134,023.36
Total Debt $1,036,225.44 $336,423.35 $1,372,648.79 $1,372,648.79 $336,423.35
2022 - Debt Service RequirementsOakland-Macomb Interceptor Drain Bond, Series 2011
Sewer Fund 592-535, Auburn Hills Share 4.058854%
O:\All\2022 budget\Budget Book\Tab 10\22.Debt Service97

2022 BUDGET - 5 YEAR PROJECTIONS
Project 5368-03Principal $2,261,189
592-535-994.000 592-535-995.100Payment Principal Interest Total Total Interest by
Date Due Due 2.0% Payment Fiscal Year Fiscal Year
10/01/13 $11,305.94 $11,305.94 $11,305.94 $11,305.94
04/01/14 22,611.89 $22,611.89
10/01/14 22,611.89 $22,611.89 45,223.78 45,223.7804/01/15 22,611.89 $22,611.89
10/01/15 $93,030.17 22,611.89 $115,642.06 138,253.95 138,253.95
04/01/16 21,681.58 $21,681.58
10/01/16 94,939.37 21,681.58 $116,620.95 138,302.53 138,302.53
04/01/17 20,732.19 $20,732.19
10/01/17 96,848.57 20,732.19 $117,580.76 138,312.95 138,312.95
04/01/18 19,763.70 $19,763.70
10/01/18 98,757.77 19,763.70 $118,521.47 138,285.17 138,285.17
04/01/19 18,776.13 $18,776.13
10/01/19 100,666.98 18,776.13 $119,443.11 138,219.24 138,219.2404/01/20 17,769.46 $17,769.46
10/01/20 102,749.74 17,769.46 $120,519.20 138,288.66 138,288.66
04/01/21 16,741.96 $16,741.96
10/01/21 104,832.51 16,741.96 $121,574.47 138,316.43 138,316.43
04/01/22 15,693.63 $15,693.6310/01/22 106,915.27 15,693.63 $122,608.90 138,302.53 138,302.53
04/01/23 14,624.48 $14,624.48
10/01/23 108,998.04 14,624.48 $123,622.52 138,247.00 138,247.00
04/01/24 13,534.50 $13,534.50
10/01/24 111,254.36 13,534.50 $124,788.86 138,323.36 138,323.36
04/01/25 12,421.96 $12,421.96
10/01/25 113,337.13 12,421.96 $125,759.09 138,181.05 138,181.05
04/01/26 11,288.59 $11,288.59
10/01/26 115,767.02 11,288.59 $127,055.61 138,344.20 138,344.20
04/01/27 10,130.92 $10,130.92
10/01/27 118,023.35 10,130.92 $128,154.27 138,285.19 138,285.19
04/01/28 8,950.68 $8,950.68
10/01/28 120,453.24 8,950.68 $129,403.92 138,354.60 138,354.60
04/01/29 7,746.15 $7,746.15
10/01/29 122,709.57 7,746.15 $130,455.72 138,201.87 138,201.87
04/01/30
10/01/30 125,313.03 $125,313.03 125,313.03 125,313.03
04/01/31
10/01/31 127,742.92 $127,742.92 127,742.92 127,742.92
04/01/32
10/01/32 130,346.68 $130,346.68 130,346.68 130,346.68
04/01/33
10/01/33 132,949.83 $132,949.83 132,949.83 132,949.83
04/01/34
10/01/34 135,553.29 $135,553.29 135,553.29 135,553.29
Total Due $1,569,363.73 $188,781.82 $1,758,145.55 $1,758,145.55 $1,758,145.55
Total Debt $2,261,188.84 $521,465.36 $2,782,654.20 $2,782,654.20 $2,782,654.20
Oakland-Macomb Interceptor Drain Drainage DistrictDrain Bonds (Series 2013A) (Limited Tax General Obligation)
2022 - Debt Service Requirements
Auburn Hills Share 3.471275%
O:\All\2022 budget\Budget Book\Tab 10\22.Debt Service
98

2022 BUDGET - 5 YEAR PROJECTIONS
Project 5368-01 Principal $149,096Issue Date 11/29/19 Interest Rate 1.850%
592-535-994.000 592-535-995.100Payment Principal Interest Total Total By Total Interest
Date Due Due Payment Year By Year04/01/20 9,091.23 781.51 9,872.7410/01/20 1,295.05 1,295.05 11,167.79 2,076.5604/01/21 11,735.95 1,295.05 13,031.0010/01/21 1,186.49 1,186.49 14,217.49 2,481.54
04/01/22 12,066.54 1,186.49 13,253.0310/01/22 1,074.87 1,074.87 14,327.90 2,261.36
04/01/23 12,562.42 1,074.87 13,637.2910/01/23 958.67 958.67 14,595.96 2,033.5404/01/24 13,223.60 958.67 14,182.2710/01/24 836.35 836.35 15,018.62 1,795.0204/01/25 13,719.49 836.35 14,555.8410/01/25 709.45 709.45 15,265.29 1,545.8004/01/26 14,215.37 709.45 14,924.8210/01/26 577.95 577.95 15,502.77 1,287.4004/01/27 14,711.26 577.95 15,289.2110/01/27 441.87 441.87 15,731.08 1,019.8204/01/28 15,207.14 441.87 15,649.0110/01/28 301.21 301.21 15,950.22 743.0804/01/29 16,033.62 301.21 16,334.8310/01/29 152.90 152.90 16,487.73 454.1104/01/30 16,529.50 152.90 16,682.4010/01/30 16,682.40 152.90
Total Due 128,268.94$ 11,293.03$ 139,561.97$ 139,561.97$ 11,293.03$
Total Debt 149,096.12$ 15,851.13$ 164,947.25$ 164,947.25$ 15,851.13$
Oakland-Macomb Interceptor Drain Bond, Series 2019A2022 - Debt Service RequirementsSewer Fund 592-535, Auburn Hills Share 3.3059%
O:\All\2022 budget\Budget Book\Tab 10\22.Debt Service
99

2022 BUDGET - 5 YEAR PROJECTIONS
Issue Date 11/29/2019Principal $597,804.66
592-535-994.000 592-535-995.100Payment Principal Interest Interest Total Total By Total Interest
Date Due Rate Due Payment Year By Year10/01/20 253,248.66 1.550 7,258.35 260,507.01 260,507.01 7,258.3504/01/21 2,670.31 2,670.3110/01/21 118,297.56 1.550 2,670.31 120,967.87 123,638.18 5,340.62
04/01/22 1,753.50 1,753.5010/01/22 55,128.96 1.550 1,753.50 56,882.46 58,635.96 3,507.00
04/01/23 1,326.25 1,326.2510/01/23 56,277.48 1.550 1,326.25 57,603.73 58,929.98 2,652.5004/01/24 890.10 890.1010/01/24 56,851.74 1.550 890.10 57,741.84 58,631.94 1,780.2004/01/25 449.50 449.5010/01/25 58,000.26 1.550 449.50 58,449.76 58,899.26 899.00
Total Due $226,258.44 $8,838.70 $235,097.14 $235,097.14 $8,838.70
Total Debt $597,804.66 $21,437.67 $619,242.33 $619,242.33 $21,437.67
Oakland-Macomb Interceptor Drain Bond, Series 2019B2022 - Debt Service Requirements
Sewer Fund 592-535, Auburn Hills Share 11.4852%
O:\All\2022 budget\Budget Book\Tab 10\22.Debt Service
100

2022 BUDGET - 5 YEAR PROJECTIONS
592-535-994.000 592-535-995.200
Date Principal InterestTotal Debt
Service Annual Total
04/01/18 - 569.23 569.23 10/01/18 - 2,480.32 2,480.32 3,049.55 04/01/19 - 13,338.41 13,338.41 - 10/01/19 90,203.17 21,294.89 111,498.06 124,836.47 04/01/20 - 24,180.50 24,180.50
10/01/20 92,556.29 25,577.10 118,133.40 142,313.89
04/01/21 - 24,250.77 24,250.77 10/01/21 94,909.42 24,250.77 119,160.19 143,410.95
04/01/22 - 23,064.40 23,064.40 10/01/22 97,262.55 23,064.40 120,326.95 143,391.34
04/01/23 - 21,848.62 21,848.62 10/01/23 99,615.67 21,848.62 121,464.29 143,312.91 04/01/24 - 20,603.42 20,603.42 10/01/24 102,360.99 20,603.42 122,964.41 143,567.83 04/01/25 - 19,323.91 19,323.91 10/01/25 105,106.30 19,323.91 124,430.21 143,754.12 04/01/26 - 18,010.08 18,010.08 10/01/26 107,459.43 18,010.08 125,469.51 143,479.59 04/01/27 - 16,666.84 16,666.84 10/01/27 110,204.74 16,666.84 126,871.58 143,538.41 04/01/28 - 15,289.28 15,289.28 10/01/28 112,950.05 15,289.28 128,239.33 143,528.61 04/01/29 - 13,877.40 13,877.40 10/01/29 116,087.56 13,877.40 129,964.96 143,842.36 04/01/30 - 12,426.31 12,426.31 10/01/30 118,832.87 12,426.31 131,259.18 143,685.48 04/01/31 - 10,940.90 10,940.90 10/01/31 121,970.37 10,940.90 132,911.27 143,852.16 04/01/32 - 9,416.27 9,416.27 10/01/32 125,107.87 9,416.27 134,524.14 143,940.41 04/01/33 - 7,852.42 7,852.42 10/01/33 128,245.37 7,852.42 136,097.79 143,950.21 04/01/34 - 6,249.35 6,249.35 10/01/34 131,382.88 6,249.35 137,632.23 143,881.58 04/01/35 - 4,607.06 4,607.06 10/01/35 134,520.38 4,607.06 139,127.44 143,734.51 04/01/36 - 2,925.56 2,925.56 10/01/36 138,050.07 2,925.56 140,975.63 143,901.19 04/01/37 - 1,199.93 1,199.93 10/01/37 141,579.76 1,199.93 142,779.69 143,979.62 04/01/38 - (569.81) (569.81) 10/01/38 145,109.45 (569.81) 144,539.63 143,969.82
Total Due 2,035,846$ 407,464$ 2,443,310$ 2,443,310$
Total Debt 2,313,515$ 543,406$ 2,856,921$ 2,856,921$
ESTIMATED DEBT SERVICE SCHEDULE - CITY OF AUBURN HILLS PORTION (7.8437538%)
Clinton River Water Resource Recover FacilityDrainage District Drain Bond, Series 2020 (SRF), $4,992,591
2022 - Debt Service Requirements
O:\All\2022 budget\Budget Book\Tab 10\22.Debt Service
101

MEETING DATE: October 4, 2021 AGENDA ITEM NO. 9C
City Manager’s Office
To: Mayor and City Council From: Thomas A. Tanghe, City Manager; Donald K. Grice, Assistant City Manager Submitted: October 1, 2021 Subject: Motion – Move to Approve Asphalt Pathway Construction at Fieldstone Golf Club INTRODUCTION AND HISTORY As you are aware, several projects scheduled for this fiscal year have been cancelled or postponed due to the exorbitant price quotes we are currently receiving from bidding contractors. Our most recent example was the cancellation of the restroom project at Fieldstone Golf Club (FGC). Based on researched estimates, staff budgeted $100,000 in the 2021 Fieldstone budget to construct a two-room facility on the west side of the golf course. Unfortunately, as with several other projects, the bids for construction and utility connections for this facility came in at nearly twice the budgeted amount. With that, the project has been postponed and added to the 2022 budget in hopes that construction costs will contract and stabilize.
With the rescheduling of this project, staff is requesting permission to utilize a portion of the remaining $100,000 for the installation of much needed pathway connections on the course. Representatives from OHM reached out to various asphalt companies to determine if any would be willing to bid on a project this late in the season. Despite those efforts, we could only get one company, Best Asphalt, to commit interest in the project. Fortunately, Best Asphalt is currently scheduled to complete parking lot and pathway work on the City Campus; and therefore, we do have competitive bid pricing for them through our current contract.
On Thursday afternoon we received the attached quote to complete two key pathway connections. The first (Section A) will provide an asphalt pathway connection along hole number 12. The existing path has been comprised of gravel and asphalt millings since the course has opened. The second quote (Section B) will complete a missing pathway section along hole number 15. This area is currently a combination of grass and gravel, and it is often wet and muddy. The completion of these pathway connections is desperately needed and will significantly improve the golfer experience at Fieldstone.

Page 2 STAFF RECOMMENDATION In an effort to provide ongoing investment and improvement to Fieldstone Golf Club, staff recommends the utilization of the unused restroom budget to fund pathway improvements in the 2021 calendar year. Based on the immediate availability of Best Asphalt, for which we already have bid pricing for work they are completing on the city campus, staff recommends awarding the FGC pathway project to Best Asphalt of Romulus, MI. MOTION Move to approve the construction of approximately 1,440 linear feet of 8 foot asphalt pathways to Best Asphalt in the amount of $37,500. Funding is available in the 2021 Fieldstone budget account #584-753-972.000. Additionally, move to direct finance to process the necessary budget amendments to reflect this change.
I CONCUR:
__________________________________________
THOMAS A. TANGHE, CITY MANAGER

Commercial ● Industrial ● Municipal ● Roads ● Parking Lots ● Tennis Courts ● Concrete
- - - - - - - - - - - - - - - - - - - - - - - - - - -
6334 N. Beverly Plaza ● Romulus, Michigan 48174 ● (734)729-9440 ● Fax (734) 729-6414
September 30th, 2021 OHM Advisors 2365 Pontiac Rd. Suite 201 Auburn Hills, MI 48326 Attention: Jerry Ashburn Re: Fieldstone Paths I would like to thank you for the opportunity to quote your current construction needs. Please see below for a detailed scope of work and pricing for the above referenced project: WORKSCOPE: (Asphalt Paving Approx.11,568 sq. ft.)
- Sawcut. - Remove Asphalt up to 3” depth. - Furnish & install 21AA CC (where needed.) - Fine Grade existing stone base. - Apply SS-1H bond coat - Furnish & install 3” 5E1 wearing course. - Clean all debris caused by our work
TOTAL BID AMOUNT: SECTION A: $23,125.00 SECTION B: $14,375.00
*Note price reflects assuming we can use Tri-Axle trucks.
Exclusions:
Above pricing excludes permits, bonds, inspection fees, testing, undercutting, or reflective cracking, power cleaning of asphalt surface.
Sincerely, BEST ASPHALT Keith Umerlik Estimator

Rochester Hills, Auburn Hills work together on road rehab project
Photo by Natalie Broda – Digital First Media Downtown Auburn Hills By NICK MORDOWANEC | [email protected] | The Oakland Press PUBLISHED: September 26, 2021 at 8:30 a.m. | UPDATED: September 26, 2021 at 11:14 a.m.
Auburn Hills and Rochester Hills are collaborating to repair Butler Road.
Paul Davis, deputy director of Rochester Hills public services, said the contractor, Pro-Line Asphalt, requested that Rochester Hills establish a detour to allow the use of the road in Auburn Hills.
Rochester Hills staff agreed and coordinated with the Oakland County Road Commission and Auburn Hills
for detour signage along Adams, Squirrel and Butler roads.
Auburn Hills was concerned that Butler Road would be damaged by construction.
“They wanted to make sure our project didn’t leave their portion damaged,” said Davis, who said the repair
is a good example of communities working together.
He said Butler Road required restoration. Within the last couple years, Auburn Hills put down some
pavement millings as temporary remedies.
“That type of road section isn’t designed to last as long as, say, when you pave a road with asphalt,” Davis said.
Pro-Line Asphalt provided a cost estimate but said it would not agree to use the same unit prices for work in Auburn Hills that was included in the Rochester Hills contract, driving up expenses.
Auburn Hills would covering the larger end of a 60-40 share. The total project cost is estimated to range
between $80,000 and $100,000.
Rochester Hills will likely pay between $32,000 and $40,000, with a cost to not exceed $45,000. Auburn
Hills’ cost will be between $48,000 and $60,000.
The final expense is unknown due to soil excavation at various locations within the Auburn Hills section of Butler Road.
Rochester Hills City Council is scheduled to vote Monday to approve the contract.
Copyright © 2022 FDOKUMEN