Attitudes towards the Diagnosis and Treatment of Depression ...
127
Attitudes towards the Diagnosis and Treatment of Depression among South Asian Muslim Americans Sadia Rahman Chaudhury Submitted in partial fulfillment of the requirements for the degree of Doctor of Philosophy under the Executive Committee of the Graduate School of Arts and Sciences COLUMBIA UNIVERSITY 2011
-
Upload
khangminh22 -
Category
Documents
-
view
2 -
download
0
Transcript of Attitudes towards the Diagnosis and Treatment of Depression ...

Attitudes towards the Diagnosis and Treatment of Depression among South Asian Muslim Americans
Sadia Rahman Chaudhury
Submitted in partial fulfillment of the requirements for the degree of Doctor of Philosophy
under the Executive Committee of the Graduate School of Arts and Sciences
COLUMBIA UNIVERSITY
2011

© 2011
Sadia Rahman Chaudhury All Rights Reserved

ABSTRACT
Attitudes towards the Diagnosis and Treatment of Depression among South Asian
Muslim Americans
Sadia Rahman Chaudhury
While Muslim Americans are one of the fastest growing communities in the
United States, very little is known about their mental health needs or concerns. In an
effort to better understand their mental health needs, this study explores the attitudes
towards the diagnosis and treatment of depression among South Asian Muslim
Americans, specifically examining how acculturation shapes these attitudes. A sample of
427 South Asian Muslim Americans (mean age 30.67 years, 73.8% female) completed an
anonymous survey on the internet. Participants answered questions about how strongly
they agreed with certain diagnostic and treatment recommendations after reading two
clinical vignettes, and completed the Attitudes towards Seeking Professional
Psychological Help Scale and the Acculturation Rating Scale for Mexican-Americans II.
Participants were also asked about their personal experiences with depression, religious
identity; and demographic information. Results indicated that educated participants were
more accepting of a clinical diagnosis of depression, while females and educated
participants had more positive attitudes towards seeking professional psychological help
for depression. Acculturation predicted more positive attitudes toward seeking
professional psychological help for depression, but did not predict acceptance of a
clinical diagnosis of depression, comfort level talking to people outside the family,

likelihood of seeking professional help, or importance of ethnic match with mental health
provider. Exploratory analyses were conducted to determine how personal history of
depression shapes attitudes; however, this variable was not particularly salient in shaping
attitudes in this sample. While the results suggest that acculturation did not play as
strong a role in predicting attitudes as initially anticipated, several limitations, including
the fact that the instrument used to measure acculturation and enculturation in this study
has not been validated in this sample and that the sample may be more acculturated than
the general South Asian Muslim American population, must be taken into consideration.
The results of this study begin to shed light on the attitudes towards depression and its
treatment in this community. Future studies should further explore the roles of
acculturation and enculturation, while also collecting more personal qualitative
information to more fully understand the experiences and needs of South Asian Muslim
Americans.

i
TABLE OF CONTENTS
CHAPTER I- INTRODUCTORY CHAPTER…………………………………..1
CHAPTER II- LITERATURE REVIEW…………………………………………2
The South Asian Muslim Population in America…………………2
Cultural Beliefs and Understanding of Mental Health and
Mental Healthcare among South Asian Muslims…………………5
Collectivism in Muslim and South Asian
Cultures……………………………………………………5
South Asian Muslim understanding of mental health and
mental healthcare………………………………………….7
South Asian Muslim Population and Depression…………………9
Prevalence of depression in Muslim populations…………9
Prevalence of depression in South Asian populations…...10
Cultural trends influencing the expression of depression
among South Asian Muslims…………………………….12
Attitudes towards Mental Healthcare among Immigrant
Populations……………………………………………………….16
Attitudes towards mental healthcare among South Asian
Immigrants. …………………………………………...…16
Attitudes towards mental healthcare among Muslim
Americans………………………………………………..17

ii
Acculturation, mental health, and mental healthcare………….... 21
Historical background…………………………………... 21
The role of acculturation in the diagnosis of
depression………………………………………………..23
The role of acculturation in the treatment of
depression………………………………………………..24
Other Sources of Support for Mental Health among Muslims
Living in the West………………………………………………..29
Hypotheses and Research Questions…………………………….30
Chapter III- METHOD………………………………………………………. 35
Participants……………………………………………………….35
Procedure………………………………………………………...37
Measures…………………………………………………………38
Chapter IV- RESULTS………………………………………………………..43
Descriptive Statistics……………………………………………..43
Factor Analysis…………………………………………………..48
Confirmatory factor analysis……………………………..48
Exploratory principal component analysis……………….49
Summary of factor analysis results………………………55
Inferential Statistics……………………………………………...55
Results for Research Question 1…………………………55
Results for Research Question 2…. ……………………..61

iii
Exploratory Analyses Examining the Role of Personal History of
Depression………………………………………………………..67
Summary of Findings…………………………………………….77
Chapter V- DISCUSSION……………………………………………………81
Limitations……………………………………………………… 87
Future Research………………………………………………….88
References………………………………………………………………………………..90
APPENDIX A- Informed Consent………………………………………………...97
APPENDIX B- Questionnaire for the South Asian Muslim American Depression
Study……………………………………………………………………………………100
APPENDIX C- Model for ARSMA-II-SV Confirmatory Factor Analysis……...110
APPENDIX D- Items for Each Dependent Variable Composite Score…….…...111

iv
LIST OF TABLES
Table 1. Demographic and Background Characteristics of the Sample………………..36
Table 2. Descriptive Statistics for Composite Scores…………………………………...44
Table 3. Correlations between Demographic Variables and Acculturation Scores…….46
Table 4. Correlations among Composite Scores……………………………………......47
Table 5. Results of Exploratory Principal Component Analysis of ARSMA-II-SV Items
with Three Components………………………………………………………………….50
Table 6. Correlations between Age and Principal Component Scores…………………51
Table 7. Principal Component Scores as a Function of Gender, Whether or Not the
Participant was Born in the United States, Marital Status, Income Group, and
Education………………………………………………………………………………...52
Table 8. Results of Exploratory Principal Component Analysis of ARSMA-II-SV Items
with Two Components……………………………………………………………………54
Table 9. Results of ANCOVA with Acceptance of a Clinical Diagnosis of Depression as
the Dependent Variable………………………………………………………………….57
Table 10. Results of ANCOVA with Comfort Level Talking to People Outside the Family
as the Dependent Variable……………………………………………………………….58
Table 11. Results of ANCOVA with Likelihood of Seeking Professional Help for
Depression as the Dependent Variable…………………………………………………..59
Table 12. Results of ANCOVA with Attitudes toward Seeking Professional Psychological
Help for Depression as the Dependent Variable………………………………………...60

v
Table 13. Results of ANCOVA with Importance of Ethnic Match as the Dependent
Variable………………………………………………………………………………….61
Table 14. Results of Regression Analysis with Acceptance of a Clinical Diagnosis of
Depression as the Dependent Variable…………………………………………………..62
Table 15. Results of Regression Analysis with Comfort Level Talking to People Outside
the Family as the Dependent Variable…………………………………………………...63
Table 16. Results of Regression Analysis with Likelihood of Seeking Professional Help
for Depression as the Dependent Variable………………………………………………64
Table 17. Results of Regression Analysis with Attitudes toward Seeking Professional
Psychological Help for Depression as the Dependent Variable………………………...66
Table 18. Results of Regression Analysis with Importance of Ethnic Match as the
Dependent Variable……………………………………………………………………...67
Table 19. Results of ANCOVA with Acceptance of a Clinical Diagnosis of Depression as
the Dependent Variable and Personal History of Depression as an Independent
Variable………………………………………………………………………………….69
Table 20. Results of ANCOVA with Comfort Level Talking to People Outside the Family
as the Dependent Variable and Personal History of Depression as an Independent
Variable………………………………………………………………………………….70
Table 21. Results of ANCOVA with Likelihood of Seeking Professional Help for
Depression as the Dependent Variable and Personal History of Depression as an
Independent Variable…………………………………………………………………….71

vi
Table 22. Results of ANCOVA with Attitudes toward Seeking Professional Psychological
Help for Depression as the Dependent Variable and Personal History of Depression as
an Independent Variable…………………………………………………………………72
Table 23. Results of ANCOVA with Importance of Ethnic Match as the Dependent
Variable and Personal History of Depression as an Independent Variable…………….73
Table 24. Results of Regression Analysis with Attitudes toward Seeking Professional
Psychological Help for Depression as the Dependent Variable and Personal History of
Depression as a Control Variable.....................................................................................76
Table 25. Results of Regression Analysis with Importance of Ethnic Match as the
Dependent Variable and Personal History of Depression as a Control Variable………77

vii
LIST OF FIGURES
Figure C1. Confirmatory factor model for ARSMA-II-SV items……………………..110

viii
ACKNOWLEDGEMENTS
While the credit of a dissertation goes to its writer, there are undoubtedly
numerous people who help that writer during this arduous process. I would like to take a
moment to thank the many people who provided encouragement and support in a
multitude of ways.
First, I would like to acknowledge Dr. Lena Verdeli, who over the years has been
my advisor, mentor, and friend. Your passion for your work is inspiring and has
encouraged me to dream bigger in my own work. Thank you for your steady
encouragement and for helping me grow as a student and a professional. Furthermore,
thank you for helping me learn to juggle my many roles in both the professional and
personal realms. Your words of advice and support through the years have been
invaluable and I will treasure them always.
To Dr. Dinelia Rosa, thank you for your consistent support and for helping a
budding clinician find her voice. To Dr. Lisa Miller, your passion and enthusiasm have
always been inspiring. To Dr. Barry Farber, your steady presence and clinical wisdom
will always stay with me. To Dr. Marla Brassard, your statistical acumen and fresh
perspective helped me reevaluate my work for a different light. Thank you for bringing
your expertise to my committee. To Dr. Anne Conway, thank you for helping a frazzled
doctoral candidate at the last minute by offering to chair my committee. Your friendly
demeanor and encouraging nature were like a breath of fresh air.
I wouldn’t have been able to complete this journey without the help and support
of my classmates. While there are too many to mention, I would in particular like to

ix
thank Beatriz, Karen, Vijay and Anitha. Thank you for your letting me vent, making me
laugh, and reminding me to enjoy the process. To my friends outside of the field, thank
you for keeping me sane and for continuously encouraging me with your love and
kindness.
Finally, to my family, words are not enough to thank you for your unwavering
support throughout the years. I could never have done this without your help. To my
parents, I cannot even begin to list the ways you have inspired and motivated me over a
lifetime. For everything that you have done and continue to do, I thank you from the
bottom of my heart. I am who I am today because of what you have seen in me and
instilled in me. For all of your love, I am eternally grateful. To my brother, thank you
for being the most amazing kid brother a girl could ever ask for. I treasure the bond that
we have and all of the love and encouragement you have given me over the years. I truly
am the luckiest sister in the world because of you. Finally, to my husband, thank you for
your love and support throughout this difficult process. For believing in me, for your
patience when I was unable to spend enough time with you, and for putting up with my
stress and anxiety throughout this process, I will always be thankful.

x
DEDICATION
To my princess, Safiya: I love you more than I ever thought was possible. You have
been my light and my inspiration from the moment I first heard your heartbeat. Your
smile warms my heart and your laughter fills me with joy. Thank you for the happiness
you have brought to my life.

1
Chapter I
Introductory Chapter
Given the rapidly growing population of South Asian Muslims in America, it is
imperative to develop a better understanding of the mental health needs and concerns of
this community. The primary aim of this study is to investigate the attitudes towards the
diagnosis and treatment of depression among South Asian Muslim Americans. While
attitudes can comprise of many different things, in this study “attitudes towards the
diagnosis of depression” will be defined as 1) a person’s acceptance of the clinical
diagnosis of depression in self and/or others; and 2) a person’s willingness to talk to
others, both within and outside of the community, about the diagnosis of depression in
self and/or others. Similarly, “attitudes towards the treatment of depression” will be
defined as 1) a person’s willingness to undergo psychotherapy or psychiatric care or
recommend these treatments to others and for what presentation/degree of severity of
depression; and 2) a person’s willingness to work with mental health providers who are
of similar and/or different backgrounds to treat depression. By exploring these attitudes,
it is hoped that a better understanding of the South Asian Muslim American community’s
beliefs about the diagnosis and treatment of depression will be developed. In particular,
the role of acculturation on shaping these attitudes will be explored. Acculturation is
defined as the process by which a person experiences changes in their cultural values and
behaviors as they come into firsthand, continuous contact with a dominant host culture
(Graves, 1967).

2
The results of this study will ideally help develop effective psychoeducational
tools to increase awareness about depression, to remove possible barriers from treatment,
and also to increase the cultural sensitivity of mental health professionals working with
the South Asian Muslim American community.

3
Chapter II
Literature Review
The South Asian Muslim Population in America
It is estimated that there are approximately 8.5 million Muslims living in the
United States (Institute of Islamic Information and Education, 2005), residing mainly in
large metropolitan cities, such as New York, Chicago, and Houston (Haniff, 2003;
Johnson, 1991; Stone, 1991; Wilgoren, 2001). In recent years, the rate of conversion to
Islam in America has quadrupled, making Islam the fastest growing religion in the United
States (Johnson, 1991; Stone, 1991; Wilgoren, 2001), and the second largest religion in
the world (Al-Mateen & Afzal, 2004). More than half of the Muslims in America hold
graduate degrees and earn more than $50,000 per year. In addition, 7 in 10 Muslim
Americans are actively involved in their mosques (Al-Mateen & Afzal, 2004).
It is believed that the first Muslims may have arrived in America as slaves from
Africa beginning in the 1530’s, though this has not been factually confirmed (Haniff,
2003). Presently, the Muslim community in the United States is remarkably diverse,
comprised of people of African, Arab, European, Central Asian, South Asian and
Southeast Asian ancestry. The three largest Muslim communities are of African
American, South Asian and Arab descent, making up respectively 30%, 33% and 25% of
the total Muslim-American population (Al-Mateen & Afzal, 2004). In the past, Muslim
immigrants to the United States from the Middle East and North Africa outnumbered
those from any region of the world. However, in the past two to three decades, this trend
has shifted so that the largest Muslim immigrant community consists of Muslims who

4
emigrated from South Asia (Mohammad-Arif, 2002; Numan, 1992; Stone, 1991). Most
South Asian Muslim immigrants first moved to the United States after the Immigration
and Naturalization Act was passed in 1965 (Mohammad-Arif, 2002; Haniff, 2003).
South Asia, which is comprised of India, Pakistan and Bangladesh, has two
dominant religions—Hinduism, which is prevalent in India, and Islam, which is prevalent
in Pakistan and Bangladesh; other religions, such as Buddhism, Sikhism and Christianity,
are practiced by smaller groups on the subcontinent. To date, there have been numerous
publications exploring the South Asian experience, both in South Asia and abroad
(Bacon, 1996; Fisher, 1980; Helweg & Helweg, 1990; Jensen, 1988; Das & Kemp, 1997;
Farver, Narang, & Bhadha, 2002; Maselko & Patel, 2008; Patel, Rodrigues, & DeSouza,
2002; Parkar, Dawani, & Weiss, 2008; Pereira, Andrew, Pednekar, Pai, Pelto, & Patel,
2007; Pillai, Andrews, & Patel, 2008; Pillai, Patel, Cardozo, Goodman, Weiss, &
Andrew, 2008; Randhawa & Stein, 2007; Trivedi, Mishra, & Kendurkan, 2007).
However, these studies have focused almost exclusively on South Asian Hindus, and
have overlooked the experience of South Asian Muslims. Because of the religious
differences between South Asian Hindus and Muslims, it is unclear whether it would be
representatively accurate to generalize the South Asian Hindu American experience to
the South Asian Muslim American experience.
At the same time, there are many regions in the world where Islam is the
predominant religion, including the Middle East, North Africa, parts of South Asia, and
Southeast Asia. However, the research to date has focused primarily on Arab Muslims,
both in their native country and abroad (Sayed, 2003; Ali, 2005; Douki, Zineb, Nacef, &
Halbreich, 2007; Dubovsky, 1983; Dwairy, 2006; Erickson & Al-Timimi, 2001; Farooqi,

5
2006; Haque, 2004); though a few studies have focused on South Asian Muslims
(Ganatra, Zafar, Qidwai, & Rozi, 2008; Messent, 1992; Mirza & Jenkins, 2004;
Mohammad-Arif, 2002; Syed & Khan, 2008). When reviewing the literature on the
Muslim experience, the cultural distinction between Arab and South Asian Muslims is
important to keep in mind, as it is unclear whether the experience of Arab Muslims can
be generalized to the population of interest in this study.
In the literature review below, research on both South Asian and Muslim
populations will be highlighted. The literature on the South Asian community focuses on
South Asian Hindus, while a large portion of the literature on Islamic populations focuses
on non-South Asian Muslims. It is hoped that the research on these two distinct
populations together will help develop an understanding of the South Asian Muslim
experience.
Cultural Beliefs and Understanding of Mental Health and Mental Healthcare
among South Asian Muslims
Collectivism in Muslim and South Asian Cultures.
As is common in many cultures throughout the world (Greenfield & Cocking,
1994; Uba, 1994; Phinney, 1996), both Muslim and South Asian cultures encourage a
collectivist family structure, where members of the family are interdependent (Dwairy,
2006). Collectivism is defined as “a social pattern consisting of closely linked
individuals who see themselves as part of one or more collectives (family, coworkers,
tribe, nation); are primarily motivated by the norms of, and duties imposed by, those
collectives; are willing to give priority to the goals of those collectives over their own
personal goals; and emphasize their connectedness to members of their collectives”

6
(Dwairy, 2006). In collectivist cultures, opinions and decisions of individuals are shaped
and dictated by the collective’s point of view. Furthermore, there is a great deal of
respect for elders and their opinions, as they are viewed as very knowledgeable and wise
(Al-Mateen & Afzal, 2004). Taking this into consideration, it is possible that a South
Asian Muslim American’s decision to seek help for depression will be shaped by the
attitudes that his or her family and community have towards the diagnosis and treatment
of the disorder. By understanding the attitudes of the community as a whole, it is hoped
that reasons for seeking treatment, as well as barriers against seeking treatment will be
better understood.
At the same time, it is important to keep in mind the role of immigration on the
collectivism perspective. The preference for individualism in Western society may have
some influence on how members of this community interact with one another,
particularly among younger South Asian Muslim Americans, or those who have lived in
America for several generations. More specifically, younger South Asian Muslim
Americans or those who have lived in the United States for several generations may be
less inclined to be influenced by their family’s and/or community’s attitudes towards
mental illness and mental healthcare and be more willing to develop their individual
attitudes on these matters. While this trend has not been studied directly in the South
Asian Muslim American community, there is indication based on other immigrant
communities in Western countries that this may be taking place.
A study of Chinese immigrants was conducted in Canada to determine whether
this population identified more with the collectivist perspective of their country of origin
or the more individualistic perspective of their country of migration (Dyson, 2004). An

7
immigrant group of 125 Chinese immigrants and a non-immigrant group of 90 Canadians
of European ancestry were recruited for the study and the Individualism-Collectivism
scale was administered to all subjects. Interestingly, Dyson found that the Chinese
immigrant group scored higher on individualism compared to the non-immigrant
Canadian group. This is a dramatic departure from what has been found in studies
conducted in China, suggesting that immigration and country of residence may have a
significant impact on a group’s adherence to collectivist or individualistic perspectives.
It is possible that Chinese immigrants, in an attempt to assimilate into Canadian culture,
adopted, or even potentially over-adopted, the Canadian principle of individualism.
Similarly, among South Asian Muslim Americans, there may be a tendency to abandon
the collectivist ideals of the older generations, and adopt a more individualistic
perspective as assimilation occurs. Further research is required to determine whether this
is actually occurring.
South Asian Muslim understanding of mental health and mental healthcare.
In India, the term for madness, “pagalami”, can refer to three different phenomena—
ghost possession, black magic or sorcery, and malfunctioning of the head. The first two
phenomena are treated by a folk-healer; however, a doctor will be consulted for a
“malfunctioning of the head”. This treatment for the latter problem is likely a result of
the influence of Western medicine. It is believed that malfunctioning of the head is
caused by a shock, such as grief or some kind of loss, which leads to an imbalance that
can be cured with medication and diet. Indians, who are predominantly Hindu, tend to
utilize both folk-healers and medical doctors either simultaneously or sequentially to treat
mental illness (Messent, 1992).

8
The Islamic perspective of mental health is also dramatically different from the
Western nosology of mental health. In Islam, it is believed that good mental health
comes from “the unblemished belief in Allah as the Ultimate Maker and Doer, and hence
any deviation from the firm acceptance of Allah’s ultimate dominance over the lives of
his followers leads to disintegration and disruption of inner harmony” (Sayed, 2003, p.
449-450). The Qur’an explicitly states that certain virtues will preserve good mental
health, including acts of worship, doing good to others and following Islamic rules of
attire, eating, cleanliness, relationships, good intentions, and a desire to seek knowledge
of self and knowledge of God (Haque, 2004). Thus, mental illness stems from doubt or
uncertainty about the basic teachings of Islam, as well as a direct result of acting in a
manner that is in direct opposition to the teachings of Islam (Farooqi, 2006). This is
consistent with what Al-Mateen and Afzal (2004) found in Pakistan, where there is a
tendency to believe that depression is caused by spiritual weakness and an inability to
believe in God. In other words, while the overall South Asian understanding of mental
health attributes mental illness to spirit possession, the belief among South Asian
Muslims is that mental illness stems from straying away from God and Islamic principles.
It is possible, however, that this perspective of mental illness may be more
dominant among South Asian Muslims living in Eastern countries, and especially in more
indigenous communities, compared to South Asian Muslim immigrants living in the
West. With modernization and awareness of Western views of medicine, the
perspectives of South Asian Muslims throughout the world with regard to mental health
may be changing. Further research is required to determine how modernization and

9
possibly Westernization have altered the understanding of mental health and mental
healthcare in this population.
South Asian Muslim Population and Depression
Prevalence of depression in Muslim populations.
To date, there are no published large-scale epidemiological studies of overall
prevalence rates of depression in Islamic countries. The two prevalence studies that have
been conducted in nations that are predominantly Muslim have taken place in the United
Arab Emirates, a Middle Eastern nation, and Tunisia, a North African nation. These
two studies have surprisingly different findings, making it difficult to generalize their
results to Muslims as a whole.
Srairi (1995) conducted a study of 5000 Tunisian adults sampled from the general
population and found a 9% lifetime prevalence rate of major depression in women and
7.4% in men (as cited in Douki, Zineb, Nacef, & Halbreich, 2007). On the other hand, a
second study conducted by Ghubash (2001) in the United Arab Emirates with a sample of
1,394 subjects, also collected from the general population, found that women were six
times as likely to have a lifetime prevalence of depression compared to men (as cited in
Douki, Zineb, Nacef, & Halbreich, 2007). The disparity in gender differences between
Tunisia and the United Arab Emirates has been partially attributed to the fact that while
women in the United Arab Emirates suffer under severe discrimination, women in
Tunisia are protected by very strict legislation outlawing discrimination (Douki, Zineb,
Nacef, & Halbreich, 2007). In both of these studies, major depression was assessed using
the Composite International Diagnostic Interview (CIDI). The CIDI is a standardized
diagnostic interview designed to assess for psychiatric disorders using the definitions of

10
the Diagnostic Criteria for Research of ICD-10 and DSM-III-R. The instrument has been
found to be highly reliable and appropriate for use in different settings and countries
(Wittchen, 1994). In addition, the gender difference in the prevalence of depression in
both of these countries may be partially attributed to the fact that it is more socially
acceptable for women to suffer emotionally than men. Alternately, the ICD and DSM
may be better able to capture depressive symptoms in women compared to men. These
hypotheses have not yet been explored in this population.
Prevalence of depression in South Asian populations.
The Global Burden of Disease Study funded by the World Health Organization
(WHO) found that in 2000, depression was the fourth leading cause of disease burden in
the world, and the largest cause of non-fatal burden, accounting for almost 12% of years
lived with disability worldwide (DALYs) (Ustun, Ayuso-Mateos, Chatterji, Mathers, &
Murray, 2004). Based on this study, the estimated yearly prevalence of depression in
South Asian countries was 1.75% for males, and 2.96% for females. Furthermore, the
researchers found that unipolar depression was the fourth leading cause of disease burden
in South Asia, contributing to 4.7% of total disability adjusted life years for this region.
Most large-scale epidemiological studies of the prevalence of depression in South
Asia have focused on different regions in India, rather than South Asia as a whole. In
these studies, the population has been predominantly Hindu; nevertheless, these studies
suggest that there is significant evidence that depression is a serious and debilitating
problem in South Asia. In a community study of 2,494 women living in Goa, India, Patel
et al. (2006) found that 6.5% (n=162) of women surveyed met ICD-10 criteria for either a
current depressive or anxiety disorder. In terms of depressive diagnoses, mixed anxiety-

11
depressive disorder (n=105), mild depressive disorder (n=36), and moderate or severe
depressive disorder (n=13) were the most common diagnoses. Furthermore, 2.5% of the
women surveyed (n=62) reported having made at least one suicide attempt in their
lifetime. Numerous other studies have suggested that depression and suicide are
significant problems in India (Parker, Dawani & Weiss, 2008; Pillai, Andrews & Patel,
2008; Maselko & Patel, 2008; Pillai, Patel, Cardozo, Goodman, Weiss & Andrew, 2008)
and that often depression occurs either postpartum or along with certain reproductive or
gynecological problems (Pereira, Andrew, Pednekar, Pai, Pelto & Patel, 2007; Patel,
Rodrigues & DeSouza, 2002).
Similarly, depression is a serious problem in Pakistan and is indeed a cause for
concern among South Asian Muslims. In a systematic review of 20 studies conducted in
Pakistan (19 cross-sectional studies and 1 case-control study), the overall prevalence for
depression in Pakistan was found to be approximately 33%, with women having a higher
prevalence rate than men (Mirza & Jenkins, 2004). Specifically, the point prevalence for
women was found to vary between 28.8% to 66% (overall mean 45.5%), whereas the
point prevalence for men was found to range from 10% to 33% (overall mean 21.7%).
Pakistanis of all age groups are affected by depression. A cross-sectional study of
402 elderly subjects aged 65 and above in Pakistan was conducted to determine the
prevalence and risk factors related to depression (Ganatra, Zafar, Qidwai & Rozi, 2008).
The subjects were all seeking medical care at the Community Health Center of the Aga
Khan University in Karachi, Pakistan. In this sample, the prevalence of depression was
found to be 22.9% (n=92), based on the 15-item Geriatric Depression Scale. It was also
found that a higher number of daily medications (p=0.03), total number of health

12
problems (p=0.002), financial problems (p<0.001), urinary incontinence (p=0.08) and
inadequately fulfilled spiritual needs (p=0.067) were all associated with depressive
symptoms in this sample. However, depression does not seem to be a problem for the
elderly exclusively. Syed and Khan (2008) conducted a retrospective descriptive case
note study of 69 children and adolescents under the age of 18 who were admitted to a
university hospital in Karachi, Pakistan for deliberate self-harm. The most frequent
diagnosis in this sample was major depressive disorder (18%). The authors noted that
even though 98% of the sample self-identified as practicing Islam, where it is strictly
forbidden to commit suicide, 76.8% of subjects reported an intent to die at the time of
their suicide attempt.
Cultural trends influencing the expression of depression among South Asian
Muslims.
In order to understand the attitudes towards the diagnosis and treatment of
depression among South Asian Muslim Americans, it is first important to understand how
this population talks about depression and its symptoms. There has been significant
debate between two schools of thought with regard to the expression of depression. The
universalist perpective adheres to the biomedical model of mental disorders. In this
perspective, mental disorders are believed to be biological in nature, and given the
physiology of human beings is the same throughout the world, the manifestation of
depressive symptoms will be consistent worldwide as well. Proponents of this
perspective believe that the DSM is accurate in terms of capturing depressive symptoms
regardless of what population is being assessed. On the other hand, the relativist
perspective argues that there are significant cultural differences in the expression of

13
depression. Since the expression of depression can vary in different cultural contexts,
relativists argue that no single criteria for depression will capture its manifestation in
different populations (Thakker & Ward, 1998).
A great deal of research has been conducted in recent years to understand the
expression of depression in different cultures, and has found that in numerous non-
Western cultures, including Asian, Hispanic and American Indian, there is a significant
overlap between depressive mood and somatic symptoms (Kuo, 1984; Ying, 1988;
Garcia & Marks, 1989; Guarnaccia, Good & Kleinman, 1990; Baron, Manson &
Ackerson, 1990; Manson, Ackerson & Dick, 1990). Halbreich et al. (2007) conducted a
qualitative study to explore the complaints of depression around anxiety in women from
various cultures, including Asia, Latin America, North Africa and Eastern Europe. In
this study, participants, who were clinicians (psychiatrists and psychologists) interested in
women’s mental health from various parts of the world were invited to a series of round
tables and workshops on cross-cultural diversity of the phenomenology of depression and
anxieties in women. In total, there were eleven groups representing nine countries,
including India (2 groups), Brazil (2 groups), Chile, Peru, Venezuela, Morocco, Tunisia,
Serbia and Hungary. During the round tables and workshops, participants were asked to
elaborate on the main symptoms and complaints that were interpreted by the clinicians as
a manifestation of a depressive or anxiety disorder. Ten groups (and five out of eight
countries, including India, Brazil, Peru, Morocco and Tunisia) reported that the main
complaints of depression in women were manifested as multiple somatic complaints,
such as multiple aches, sleep disturbances and tiredness.

14
Since the expression of emotion is often seen as a cultural artifact, it is not
surprising that in non-Western cultures where the expression of emotion is discouraged,
depressed patients express their complaints in somatic rather than psychological terms
(Dwairy, 2006). In fact, it has been noted that in Asian cultures, there is no distinction
made between the ‘psyche’ and ‘soma’ as there is in Western philosophy; therefore, the
Asian patient will not view the expression of physical symptoms for an emotional
problem as problematic or incomprehensible (Messent, 1992).
Bhugra and Mastrogianni (2004) conducted a review of studies focusing on the
transcultural aspects of depression, looking specifically at the role of globalization on the
expression of depression. Globalization is defined as the process by which traditional
boundaries of culture change over time due to the effects of industrialization,
urbanization and media influence. Bhugra and Mastrogianni have found that
globalization has influenced how idioms of distress are expressed in different cultures.
The authors highlight the difference between somatic metaphors and somatic complaints.
They argue that while it is a common misconception that certain populations, including
Asians, typically present with somatic complaints, what actually occurs is that
psychological distress is described through the use of somatic metaphors. While physical
symptoms may be present, oftentimes, the somatic metaphors (such as “my heart is
heavy”) allude to emotional, rather than physical pain. The authors also note that while
somatic metaphors are common in certain regions of the world, including Asia, as
acceptable cultural idioms of distress, when further probed, psychological symptoms can
usually be found. Because depression may not be properly assessed for in certain

15
cultures, including South Asian and Muslim populations, depression may actually be
underdiagnosed in these populations.
In Arab Muslim communities, physical symptoms are accepted as legitimate and
morally appropriate expressions of emotional pain (Trivedi, Mishra & Kendurkan, 2007).
In addition, since Islam condemns suicide, many Arab Muslim patients are reluctant to
divulge suicidal feelings to a therapist. Rather, when asked directly about suicidal
thoughts, Muslim patients often respond by saying that they are good people and would
never consider such an idea (Dubovsky, 1983). However, this does not mean that
suicidal ideation does not exist in this population. Rather, it is found to be more
culturally appropriate to state a wish for God to end their lives, rather than an active plan
to kill themselves (Trivedi, Mishra & Kendurkan, 2007).
Research has also been conducted to better understand the expression of
depression in South Asian populations. Pereira et al. (2007) conducted a qualitative
study in Goa, India to better understand “the explanatory models of illness in depressed
women, in particular, their idioms of distress, and their views of their social
circumstances and how this related to their illness” (p. 209). For this study, thirty-five
women were recruited based on two eligibility criteria—they were married at some point
in their life and they were currently suffering from a depressive disorder, as assessed by
the Revised Clinical Interview Schedule (CISR). Most of the women had mild
depressive disorders or mixed anxiety-depressive disorders. In-depth qualitative
interviews were conducted with the participants to gather information on the participants’
personal narrative for depression and also to explore the relationship between depression
and stressors in the women’s lives. Interviewers were instructed to 1) ask about stressors

16
in the women’s lives; 2) collect a 24-hour timeline of the women’s daily activities; and 3)
obtain illness narratives. Secondary interviews were conducted to collect necessary
supplemental information as needed. Qualitative analyses suggested that the most
common category of symptoms reported by these women were physical aches and pains
(n=32), in particular pain in the limbs and joints and headaches. The next most common
type of complaint was autonomic symptoms (n=25), including palpitations, numbness,
blood pressure and difficulty breathing. This was followed by complaints of weakness
and tiredness (n=23); behavioral symptoms (n=23), such as lack of sleep or appetite;
gynecological problems (n=18) and mental problems (n=7), such as poor concentration,
forgetfulness and nightmares. The authors also found that the most common causes cited
by the women for their depression were economic difficulties and interpersonal problems,
particularly marital problems. The women were reluctant to attribute their depression to
a biomedical reason, though most of the participants sought medical treatment for
somatic and reproductive complaints associated with their depression. This study
underlines the importance of taking note of the somatic complaints South Asians may
report, as they may be indicative of an underlying depressive disorder.
Attitudes towards Mental Healthcare among Immigrant Populations
Attitudes towards mental healthcare among South Asian immigrants.
To date, there are no studies exploring the attitudes towards mental healthcare
among South Asian immigrants living in the United States. There is, however, research
on this population in other Western nations, specifically the United Kingdom. An
exploratory study examining attitudes toward mental health and mental health services
was conducted among South Asian adolescents living in the United Kingdom (Randhawa

17
& Stein, 2007). They recruited Pakistani Muslims (n=27, average age=14.0 years) and
Indian Sikhs (n=22, average age=14.3) in ninth through eleventh grade from two schools
in Luton and Bedford. Semi-structured interviews were conducted, focusing on the
adolescents’ knowledge of local support clinics, experience with Child and Adolescent
Mental Health Services (CAMHS), sources of CAMHS-related information and
“suggestions on how to improve local support and CAMHS services so that they are more
accessible for young people” (p. 27). Based on the exploratory interviews conducted,
Randhawa and Stein found that while South Asian adolescents in the United Kingdom
were aware of mental health support services, they were not willing to seek assistance for
their difficulties from these services. The study also found that the South Asian
adolescents felt that their friends and family would also likely avoid these services,
suggesting that the resistance to treatment has less to do with awareness and more to do
with a concern with confiding in strangers and social stigma
Attitudes towards mental healthcare among Muslim Americans.
Research suggests that Muslim communities in the United States are burdened
with many of the same social burdens as other immigrant and non-immigrant
communities in this country, including emotional disturbances, substance abuse,
unemployment, marital problems and divorce, domestic violence, child abuse, and
suicide (Das & Kemp, 1997; Erickson & Al-Timimi, 2001). However, when Muslim
immigrants do seek treatment, they often feel misunderstood, misrepresented, and even
stereotyped (Dwairy, 2006; Erickson & Al-Timini, 2001). Sayed (2003) notes that
Muslims in Western countries face a double quandary because they are foreign to the

18
culture in which they are seeking treatment and are being subjected to a conceptualization
of mental illness that is both foreign and a disservice to them.
Furthermore, following the events of September 11, 2001, Muslim Americans
may be more hesitant to utilize healthcare services, and mental healthcare services in
particular, because of the “Islamophobia” that exists in the community. Laird, Amer,
Barnett and Barnes (2007) argues that “Islamophobia”, a term referring to rising
prejudice, exclusion and violence toward Muslims, leads to health disparities among
Muslim Americans. Muslim Americans may be reluctant to seek help from American
healthcare providers because of fears of being stereotyped or discriminated. Alternately,
American healthcare providers are often poorly equipped to understand and deal with the
cultural concerns that come with treating this population. Al-Krenawi and Graham
(2003) suggest that when working with Muslim clients, it is important to keep in mind
not only their religious background, but also the importance of the community’s history
and the individual’s age, gender, acculturation and socioeconomic status. In other words,
the experience of each Muslim American patient is unique and individual and should be
treated in this manner.
A study exploring attitudes towards counseling and alternative support among
African-American, Arab and South Asian Muslims in Toledo, Ohio found that while the
majority of Muslims interviewed possessed a positive attitude towards counseling, mental
health services were underutilized (Khan, 2006). In this study, 459 Muslims (44 African
American, 240 Arab, 119 South Asians and 56 others) were recruited from four different
mosques in or around Toledo, Ohio, with the African American sample coming primarily
from the two inner city mosques, and the Arab and South Asian samples primarily

19
recruited from two suburban mosques. Participants were asked to complete anonymous
self-report questionnaires, that included a demographic data sheet and an abbreviated
form of Fischer and Turner’s Attitudes Toward Seeking Professional Psychological Help
Scale (Fischer & Farina, 1995). Participants in this study were primarily male (59.7%)
and Arab (52.3%). Among the overall sample, it was found that Muslim Americans
between the ages of 18 and 44 were 2.5 times more likely to have negative attitudes
towards help-seeking for mental problem compared to those over the age of 45 ((p<0.05).
Furthermore, in the overall sample, Muslim American males were 1.8 times more likely
to have negative attitudes towards mental healthcare compared to females (p<0.05).
Among the South Asian Muslim Americans, males were 2.7 times more likely to have
these negative attitudes (p<0.05). Khan also found that education was not significantly
associated with attitudes towards help-seeking for mental illness in this sample. Not
surprisingly, Muslim males were 2.1 times more likely than Muslim females to indicate
no need for counseling (p<0.01). Among the South Asian Muslim sample, males were
3.8 times as likely to indicate no need for counseling (p<0.05). In addition, for the
sample as a whole, those between the age of 18 to 44 were 2.8 times more likely to
indicate no use of professional counseling than those over the age of 45, while within the
South Asian sample, those in the 18 to 44 year age range were 6.8 times more likely to
indicate no use of professional counseling. Among the overall sample, Khan found that
need for counseling and positive attitudes towards counseling were the strongest
predictors of use of professional counseling. When interpreting Khan’s results, it is
important to note that more than half of his sample was of Arab descent; therefore, his
findings, which are suggested to be representative of the Muslim community as a whole,

20
may actually be more representative of Arab Muslim attitudes. Nevertheless, given the
rates found among the South Asian Muslim Americans in his sample, there is strong
indication that South Asian Muslim Americans, particularly males of this background,
have more negative attitudes about mental healthcare and are more reluctant to utilize
available resources.
In his study, Khan failed to explore generational and acculturative factors that
may influence the attitudes of this community towards depression. Furthermore, the role
of other demographic variables aside from age and gender, including country of birth,
marital status, income, and educational background, on the attitudes of this community
toward depression were not assessed. While this study has shed some information on the
attitudes of the Muslim American community, it is apparent that many questions still
remain. To date, there have been no studies looking into how these demographic
variables affect attitudes towards depression among the South Asian Muslim American
community.
Among Muslims in the West who do decide to utilize mental healthcare, the
overwhelming majority prefer the medical model and opt to treat their mental illness with
pharmacotherapy. Due to cultural constraints, namely the discouragement of expressing
emotions, psychotherapy is often viewed as “just talk” and not helpful to improving a
mental disorder (Sayed, 2003). Kelly and Aridi (1996) conducted a study to better
understand counseling-related issues among Muslims living in the United States.
Participants (43 women and 78 men from Washington, D.C. and Chicago between the
ages of 12 and 62) were asked to complete surveys which included Schwartz’s Universal
Values Questionnaire (SUVQ), the Mental Health Value Survey (MHVS), and a

21
demographic and religious practice information form. Slightly more than half (n=64 or
52.9%) reported that they would prefer receiving counseling from a Muslim counselor
over a non-Muslim counselor. The participants also noted that if they had to see a non-
Muslim counselor, approximately 56.2% felt that it was crucial to have a counselor who
had at least a basic understanding of Islamic values.
Acculturation, Mental Health, and Mental Healthcare
Historical background.
Acculturation is defined as the process by which a person experiences changes in
their cultural values and behaviors as they come into firsthand, continuous contact with a
dominant host culture (Graves, 1967). This concept first originated in the field of
anthropology, but was later adopted by the field of cultural psychology. Redfield, Linton
and Herskovits (1936) argued that due to conflicting cultural norms between the native
culture and the host culture, acculturation can lead to psychological and social stress.
Numerous studies have found that acculturation is significantly associated with mental
illness, particularly depression and suicide (Hovey, 2000; Shen & Takeuchi, 2001;
Escobar, Nervi & Gara, 2000; Yeh, 2003). However, other studies have found that lower
levels of acculturation are associated with psychological distress (Sam, Vedder, Ward &
Horenczyk, 2006; Gonzalez, Hann & Hinton, 2001).
Berry (2003) notes that acculturation occurs in progressive stages. As an
individual acculturates into the host culture, the first tendency is to change his or her
behaviors in accordance with the behaviors of the dominant culture. Most often,
behaviors will change though attitudes and beliefs will remain consistent with that of the

22
native culture. In fact, it has been found that attitudes, beliefs and values are the most
difficult and resistant to acculturation and may take years and even generations to change.
Kim and Abreu (2001) defined enculturation as the process of retaining the norms
of the indigenous group. While at first enculturation was considered a part of the process
of acculturation, recent theorists have suggested that these two processes are two
orthogonal phenomena (Kim & Omizo, 2006). The combination of these two processes
can be categorized into four statuses defined by different levels of acculturation and
enculturation: integration, assimilation, separation, and marginalization. Integrated
individuals have high levels of acculturation and enculturation and are highly proficient
in both the dominant culture and their native culture. Assimilated individuals are defined
as those with high levels of acculturation and low levels of enculturation, and are
proficient in the dominant culture while retaining very little of their native culture. On
the other hand, separated individuals are those with low levels of acculturation and high
levels of enculturation, and reject the dominant culture while remaining closely attached
to the native culture. Finally, marginalized individuals have low levels of both
acculturation and enculturation and identify with neither the dominant nor their native
culture (Berry, Kim, Power, Young & Bajaki, 1989).
While acculturation and enculturation may work together to shape attitudes
towards diagnosis and treatment of depression among South Asian Muslim Americans,
this study will focus exclusively on the role of acculturation in this process. Given the
aforementioned research, it is quite possible that South Asian Muslim Americans may in
fact have changed their behavior by utilizing mental health resources, while continuing to
hold onto feelings shame and stigma with regards to the diagnosis and treatment of

23
depression. There is no research to date on how acculturation shapes this process,
making this study particularly relevant.
The role of acculturation in the diagnosis of depression.
While there has not been a great deal of literature on the attitudes towards mental
health and mental healthcare among Muslim and South Asian populations in America,
there has been extensive research on the attitudes of other ethnic minority populations
living in this country. In particular, the role of acculturation on shaping these attitudes
among Hispanic Americans and East Asian Americans has been explored and may
provide some indication as to how the attitudes towards the diagnosis and treatment of
depression among South Asian Muslim Americans may be influenced by acculturation.
Studies have shown that acculturation plays an important role in the prevalence
and treatment of depression among Hispanic-Americans. Gonzalez, Hann and Hinton
(2001) found that Latino immigrants with lower levels of acculturation had higher
prevalence rates of depression. A cross-sectional analysis was conducted with a sample
of 1,789 Latino-American elderly subjects (mean age=71 years). Acculturation was
measured using the ARSMA-II while depression symptoms were assessed using the
CES-D. The overall prevalence of depression in this sample was 25.4%, with women
having approximately twice the risk for depression (32%) compared to men (16%).
Gonzales, Hann and Hinton found that depressive symptoms were more prevalent among
subjects who were immigrants, and less acculturated, compared to subjects who were
born in the United States and were more acculturated. Even after controlling for
education, income, psychosocial factors, behavioral factors, and health-problem factors,
subjects with the lowest levels of acculturation had a significantly higher risk of

24
depression compared to highly acculturated Mexican Americans. The findings of this
study are in marked contrast to several other studies which found that higher levels of
acculturation were associated with greater risk of depression and suicide among Hispanic
Americans (Hovey, 2000; Escobar, Nervi & Gara, 2000).
A study was conducted to determine whether Mexican Americans with different
levels of acculturation would differ in the way they report their experience of depression
(Chiriboga, Jang, Banks & Kim, 2007). The authors hypothesized that low levels of
acculturation would lead to higher levels of distress and therefore higher levels of
depression symptoms reported. In this study, 3,050 Mexican Americans over the age of
65 were recruited from five different states: California, New Mexico, Texas, Colorado
and Arizona. The interview included sixteen items about acculturation (13 of which
focus on linguistic acculturation) and the twenty-item Center for Epidemiological Studies
Depression Scale (CES-D) scale. Analyses indicated that subjects with higher levels of
acculturation were less likely to report symptoms of depression on the CES-D. Those
with higher levels of acculturation were more likely to report feeling depressed, which
was the eighth mostly likely symptom in the low acculturation group. For the low
acculturation group, the highest ranking symptoms were a general malaise and troubled
interpersonal relationships. The results strongly suggest that within this immigrant
population, the expression of depression varies based on level of acculturation.
The role of acculturation in the treatment of depression.
Research has shown that within the Latino population in America, Hispanic
immigrants are less likely to seek treatment for psychiatric disorders when compared to
Latinos born in the United States (Cabassa & Zayas, 2007). In this study, Cabassa and

25
Zayas explored how three cognitive processes—1) illness perceptions, 2) attitudes
towards depression treatments and 3) subjective norms towards seeking professional
mental healthcare—influenced the decision of Latino immigrants to seek both informal
and formal treatment for depression. The authors hypothesized that each of these
cognitive processes would independently be associated with the patient’s intention to
seek depression care, after controlling for patient characteristics, specifically
demographics, health insurance, acculturation, clinical characteristics, past service use for
mental health problems and perceived barriers to care. A convenience sample of 95
Latino immigrant adult patients was recruited from a primary health care clinic in St.
Louis, Missouri. Patients were asked to complete a structured face-to-face interview,
which included questions about patient demographics; health insurance status;
acculturation (the Bidimensional Acculturation Scale, BAS); depressive symptoms
(Center for Epidemiological Studies Depression Scale, CES-D); perceived barriers to
care (asked to indicate if any of the 11 provided situations, including lack of
transportation, lack of insurance, and inability to pay for services, prevented individuals
from seeking treatment); attitudes towards depression treatments (Patients Attitudes
Toward and Ratings of Care for Depression short version, PARC-D); and past service use
for mental health problems. In addition, a clinical vignette of a depressed individual was
included as part of the interview in order to probe about the patient’s views of depression
(using the Illness Perception Questionnaire, IPQ-R) and intentions to seek either informal
or formal care when placed in a similar situation. In terms of intentions to seek informal
and formal care, questions were asked regarding the patient’s likelihood of talking to
someone (either informal or formal) about their depression; how comfortable they would

26
feel doing so; and finally, how helpful they would find these sources of care. Cabassa
and Zayas found that the most common perceived barrier to seeking mental healthcare in
this population included lack of health insurance, inability to pay for services, language
difficulties, not knowing where to seek services, and long waiting times at clinics. In
terms of the clinical vignette, 55% of the patients were able to identify the case as
depression, while the other 45% identified the case as an individual coping with either
interpersonal, econonomic or other external problems. However, it is unclear how the
patients’ responses were operationalized, or whether any of the subjects responded that
the case was depression caused by external factors. None of the patients attributed the
vignette to internal mechanisms, such as biological or genetic factors. With regards to
treatments for depression, the majority of patients (87%) believed that their doctors acted
in their best interests. In addition, a large majority of the patients held positive attitudes
towards depression treatments, though there was a preference for counseling over
antidepressants. Patients also reported that they would first try informal sources of care,
specifically family members and religious leaders, before trying formal sources. Among
formal sources of care, patients appeared to prefer mental health professionals
(psychologists, social workers, counselors, psychiatrists) over their general medical
provider. The tendency to combine sources of care by Latino immigrants suggests that
when depressed, these individuals first seek help from those within their immediate social
circle. If these attempts are not successful, the Latino immigrant then goes on to seek
more professional help for their depression. In order to improve healthcare for Latino
immigrants, and likely for all immigrant populations in the United States, it is essential to

27
address both structural barriers to care while also addressing attitudes that these
immigrants have towards mental illness and mental healthcare.
Acculturation also appears to affect preferences of Latino immigrants for mental
health providers. Gamst et al. (2002) conducted a study on 204 Latino-American patients
and parents/caregivers of patients at the Tri-City Mental Health Center (TCMHC).
Patients were asked to complete questionnaires collecting information on basic
demographic information; client-therapist ethnic match; the Acculturation Rating Scale
for Mexican Americans-II (ARSMA-II); and the Multigroup Ethnic Identity Measure
(MEIM). Patients who appeared more Mexican-oriented showed a strong desire for a
therapist of the same culture as themselves. However, those who were more Anglo-
oriented were ambivalent about the issue of client-therapist ethnic match.
In order to better understand mental health concerns in the Korean American
community, Bernstein (2007) conducted a study with 34 Korean Americans, most of
whom where female, married, educated, and had lived in the United States for over ten
years. In order to avoid the stigma surrounding mental health in this community, a
seminar program was developed using the theme “Are you happy with your life in
America?” The terms mental health and psychiatric illness were intentionally avoided in
the discussion of seminar topics in order to draw in Korean-American subjects from the
community. Monthly seminars were conducted over a 4-month period that explored the
impact of stress on Korean women; problems with children and adolescents of Korean
immigrants; alcoholism in the Korean immigrant community; and the multiple roles of
Korean immigrant women. At the end of each seminar, participants were asked to
complete an anonymous questionnaire to evaluate their perception of mental illness and

28
help-seeking and coping behaviors. The majority of patients in this study reported that
they recognized a need for mental health services, but avoided seeking professional help.
Rather, they opted to cope using endurance, patience, and religion.
The role of generational status on the utilization of mental health resources has
also been explored. Researchers have defined first-generation immigrants in two
different ways—1) people who left their country of origin and immigrated to a new
country; and 2) children born in the new country to parents who immigrated to this new
country from their native country. Abe-Kim et al. (2007) conducted a study of 2,095
Asian-Americans and found that subjects underutilized mental health services compared
to the general population. Asian-Americans who were born in the United States (second-
generation Asian-Americans) exhibited higher rates of utilization of mental health
services compared to immigrants of the same background. Finally, third-generation
Asian Americans had the highest rate of mental service utilization in this sample.
In order to explore factors influencing attitudes towards seeking professional help
within the Asian immigrant community in Canada, Fung and Wong (2007) conducted a
study on 1000 immigrant and refugee women from China, Hong Kong, Taiwan, Korea
and Vietnam living in Canada. Subjects completed questionnaires which collected socio-
demographic information and a number of self-report instruments, including the Mental
Distress/Illness Explanatory Model Questionnaire (MDEMQ), the Attitudes towards
Seeking Professional Psychological Help Scale (ATSPPHS), and the Vancouver Index of
Acculturation (VIA). For the overall sample, the strongest predictor of attitudes toward
seeking help was the perceived access of resources. While subjects who held onto a more
Western-focused point of view with regard to stress being a cause for depression were

29
more likely to seek treatment from a professional, subjects who held to a more spiritual or
Eastern-focused understanding of depression tended to have more negative attitudes
towards seeking professional help.
While the South Asian Muslim American population is certainly different from the
Hispanic American or East Asian American communities mentioned above, our
population of interest must also acculturate into the host culture. As such, this
community will face many of these same difficulties. Given the aforementioned
research, it would not be surprising if South Asian Muslim Americans recognized a need
for mental health services and yet were reluctant to utilize these services. However,
further research is required to further understand the attitudes towards the diagnosis and
treatment of depression among South Asian Muslim Americans.
Other Sources of Support for Mental Health Issues among Muslims Living in the
West
Loewenthal, Cinnirella, Evdoka & Murphy (2001) conducted a comparative study
of the perceived efficacy of different kinds of religious activity in coping with depression
among followers of different religions in the United Kingdom. In this study, 282
participants completed a 114-item questionnaire inquiring about the perceived efficacy of
different forms of help for depression and intention of seeking different forms of help if
ever suffering from depression. Six forms of religious coping were incorporated in the
questionnaire and included 1) faith in God; 2) praying for yourself; 3) others praying for
you; 4) maintaining one’s religious practices; 5) going to see a religious leader; and 6)
attending a place of religious worship. The participants identified themselves as being
Christian (n=130); Jewish (n=35); Muslim (n=33); Hindu (n=18); other (Sikh, Buddhist

30
and New Age, n=15); and Atheist or no religion (n=56). The authors found that
compared to the other religious groups, Muslims most strongly believed in the efficacy of
religious coping methods for depression. Of the six coping skills, they believed that
prayer and faith were the most effective, but also believed strongly that religious practice,
attending a place of worship, going to see a religious leader and having others pray for
you were also effective tools for fighting depression. Muslims were also most likely to
say they would use religious coping tools against depression when compared to other
groups, and were also least likely to say that they would seek social support or
professional help for depression compared to the other groups.
Hypotheses and Research Questions
The following research questions and hypotheses were developed with regard to
the attitudes of South Asian Muslim Americans towards the diagnosis and treatment of
major depression:
Research Question 1.
Which demographic variables (age; gender; being born in the United States;
marital status, income or education) affect attitudes of South Asian Muslim Americans
towards the diagnosis and treatment of depression?
· Hypothesis 1A: It is predicted that South Asian Muslim Americans who
are—
� younger (≤ 30 years old)
� female
� born in the United States
� single

31
� making an income greater than $75,000
� college graduates or higher
will be more accepting of a clinical diagnosis of depression compared to their
counterparts who are older (>30 years old); male; not born in the United States;
married; making an income less than $75,000; and not college graduates.
· Hypothesis 1B: It is predicted that South Asian Muslim Americans who
are—
� younger (≤ 30 years old)
� female
� born in the United States
� single
� making an income greater than $75,000
� college graduates or higher
will feel more comfortable talking to people outside of their family about a
diagnosis of depression, whereas their counterparts who are older (> 30 years
old); male; not born in the United States; making an income of less than $75,000;
and not college graduates will rely almost exclusively on family members to
discuss the diagnosis.
· Hypothesis 1C: It is predicted that South Asian Muslim Americans who
are—
� younger (≤ 30 years old)
� female
� born in the United States

32
� single
� making an income greater than $75,000
� college graduates or higher
will be more likely to seek professional care for depression, including
psychotherapy and psychiatric care, when compared to their counterparts who are
older (> 30 years old); male; not born in the United States; making an income of
less than $75,000; and not college graduates.
· Hypothesis 1D: It is predicted that South Asian Muslim Americans who
are—
� younger (≤ 30 years old)
� female
� born in the United States
� single
� making an income greater than $75,000
� college graduates or higher
will seek professional treatment for lower severity depressive symptoms, whereas
their counterparts who are older (>30 years old); male; not born in the United
States; married; making an income of less than $75,000; and not college graduates
will seek professional treatment for more severe depressive symptoms.
· Hypothesis 1E: It is predicted that South Asian Muslim Americans who
are—
� older (> 30 years old)
� male

33
� not born in the United States
� married
� making an income less than $75,000
� not college graduates
will feel that an ethnic match with their therapist or psychiatrist is more important
than their counterparts who are younger (≤ 30 years old); female; born in the
United States; single; making an income greater than $75,000; and college
graduates.
Research Question 2.
Controlling for the aforementioned demographic variables (age; gender; being
born in the United States; marital status, income or education), how will overall
acculturation scores affect attitudes of South Asian Muslim Americans towards the
diagnosis and treatment of depression?
· Hypothesis 2: It is predicted that South Asian Muslim Americans with
higher overall acculturation scores—
� will be more accepting of a clinical diagnosis of depression.
� will feel more comfortable talking to people outside of their
family about a diagnosis of depression.
� will be more likely to seek professional care for depression,
including psychotherapy and psychiatric care.
� will seek professional treatment for lower severity depressive
symptoms.

34
� will feel that an ethnic match with their therapist or psychiatrist
is not as important
compared to their counterparts with lower overall acculturation scores.

35
Chapter III Method
Participants
The sample consisted of 427 Muslim-American participants of South Asian
(Bangladeshi, Indian, or Pakistani) ancestry. Table 1 shows descriptive statistics for the
demographic and background characteristics of the sample. There were more females in
the sample (73.8%) than males (26.2%). Nearly half of the participants were single
(48.7%), with 44.5% married, 4.0% divorced, 2.3% separated, and .5% widowed. The
most common country of birth was the USA (42.9%), followed by Bangladesh (19.9%),
Pakistan (18.7%), and India (7.5%), with 11.0% of the sample indicating some other
nation. A total of 37.9% of the sample stated that their ancestors were from Bangladesh,
while 23.2% stated that their ancestors were from India; 38.9% of the sample stated that
their ancestors were from Pakistan.
Nearly one-third of the sample (32.8%) stated that they were currently students,
and nearly half of the sample (48.7%) stated that they had obtained a bachelor’s degree.
Only 9.8% of the sample stated that their highest level of education was high school, with
an additional 41.5% stating that they had obtained an undergraduate degree. Most of the
participants (65.8%) stated that they were currently employed, with over half (55.3%)
stating that they had an annual household income in excess of $75,000 per year. The
average age of the participants was 30.67 years old (SD = 9.18). A total of 244
participants stated that they had not been born in the USA, and for these participants the
average number of years living in the USA was 17.26 (SD = 8.92).
Table 1

36
Demographic and Background Characteristics of the Sample (N = 427)
Frequency (M) Percentage (S.D.)
Age ( 30.67) ( 9.18) Gender
Male 112 26.2 Female 315 73.8
Marital status Single (never married) 208 48.7 Married 190 44.5 Separated 10 2.3 Divorced 17 4.0 Widowed 2 .5
Country of birth USA 183 42.9 Bangladesh 85 19.9 India 32 7.5 Pakistan 80 18.7 Other 47 11.0
Years living in the U.S. (n = 244) ( 17.26) ( 8.92) Where ancestors were from
Bangladesh 162 37.9 India 99 23.2 Pakistan 166 38.9
Currently a student No 287 67.2 Yes 140 32.8
Highest degree received High school 42 9.8 Undergraduate degree 177 41.5 Graduate degree 208 48.7
Currently employed No 146 34.2 Yes 281 65.8
Annual household income Less than $75,000 191 44.7 More than $75,000 236 55.3

37
Subjects were asked a series of questions to better understand the role of Islam in
their daily lives. Nearly three-quarters of the sample (74.9%) identified as being
moderately religious. Over half of participants reported praying five times per day
(n=245, 57.4%) and fasting daily during Ramadan (n=203, 47.5%). In addition,
approximately a quarter of all participants in this study (n=104, 24.4%) reported reading
the Qur’an at least weekly. Finally, 87 participants (20.4%) reported consulting with an
imam at least monthly about personal issues. This suggests that this sample self-
identifies as a fairly religious group with approximately half of the subjects routinely
following the basic tenets of Islam. However, there was a fairly broad range of practices
with some subjects following the basic tenets more strictly and others being less routine
in their practice. This should be taken into consideration when considering the results
and generalizing to the greater South Asian Muslim American population.
Procedure
The primary method of recruitment in this study was through electronic mailing
lists of various secular South Asian Muslim networking organizations. Specifically, e-
mails were sent to graduate school chapters of Muslim Students Associations, various
chapters of Council for the Advancement of Muslim Professionals (CAMP), and the
Muslim Public Affairs Council. Also, an event page was created on Facebook inviting
individuals who self-identified as South Asian Muslim Americans to participate in the
study. Furthermore, awareness of this study was further spread by word-of-mouth, as
interested individuals forwarded information about the study to others. Subjects were
recruited for this study were between the ages of 18 and 65 years old; self-identified
Sunni Muslims; of South Asian origin; first generation (immigrated to the U.S.) or

38
second generation (have parents who immigrated to the U.S.) immigrants; and were
fluent in English. Given the fact that participants completed the study over the internet
and were not asked where in the U.S. they currently lived, it is not possible to ascertain
where most participants cam from (e.g., large metropolitan cities, suburbs, or rural
locations). This, unfortunately, is a limitation of the study and limits the generalizability
of the results.
Subjects were asked to complete an online survey on beliefs and attitudes towards
mental health issues and were told that they would be answering questions pertaining to
attitudes, social behavior, cultural beliefs and practices that may influence their feelings
towards emotional problems. The questionnaire was posted online on
www.SurveyMonkey.com and took approximately 30 minutes to complete. Subjects
provided informed consent before completing the questionnaire (see Appendix A, page
112) and were given the option to discontinue participation at any time without any
negative impact.
Information collected in this study was kept strictly confidential. No identifying
information was collected from subjects, and all subjects were assigned a numerical ID
number after signing consent. All electronic questionnaire data was stored on a password
protected computer.
Measures
Subjects were asked to complete a questionnaire regarding attitudes towards the
diagnosis and treatment of depression. The questionnaire (see Appendix B, page 115)
consisted of six distinct sections.

39
Section I—Clinical vignettes.
In the first section of the questionnaire, the subject was instructed to read
vignettes about two people with depression (one moderate and one severe) and answer
several questions regarding each vignette. On the online version, the two vignettes were
alternated between subjects in order to control for order and gender effects. The subject
was asked to identify how strongly they agreed with the diagnosis given based on the
vignette, how strongly they agreed with several different interventions for the depression,
and how effective they felt that the interventions would be. The purpose of the vignettes
was to allow subjects to express their understanding and beliefs about depression, its
diagnosis, and treatment even if the subject did not have any personal experience with the
subject matter. It was also believed that subjects may have felt more comfortable
answering questions about depression when the questions are of a hypothetical nature.
Section II— Emotional history.
In this section, the subject was asked about his or her emotional history, including
whether the subject felt he or she was ever depressed, or if family members ever
suggested that the subject may have been depressed. Furthermore, the subject was asked
how they dealt with the depression. If the subject had previously sought professional
treatment, the subject was also asked if he or she felt that an ethnic or religious match
between the subject and the provider was important.
Section III—Attitudes towards seeking professional psychological help scale
(abbreviated form).
In the third section, the subject was asked to complete the abbreviated form of the
Attitudes towards Seeking Professional Psychological Help Scale (Fischer and Farina,

40
1995). This unidimensional scale is a 10-item version of the original 29-item Attitudes
towards Seeking Professional Psychological Help (Fischer and Turner, 1970). Subjects
were asked to rate each of the ten statements on a 4-point Likert scale (0- disagree; 1-
partly disagree; 2- partly agree; 3- agree). Five of the items are scored as “straight” pro-
help-seeking items, while the other five are scored as “reverse” anti-help-seeking items,
totaling to a potential score range of 0 to 30. The abbreviated scale, like the original
scale, was able to reliably differentiate those who have sought professional psychological
treatment from those who have not (p<.0001). In addition, the scores from the
abbreviated form of the scale correlated 0.87 (N=62) with the original version of the
scale. Finally, the test-retest correlation for the abbreviated form with a 1-month interval
administrations was 0.80, while the test-retest reliability of the original form with a 1-
month interval was 0.82. Given the fact that the psychometric properties of the
abbreviated scale are similar to those of the original scale, while reducing the burden of
time on subjects having to complete the measure, it was decided that the abbreviated
form of the Attitudes towards Seeking Professional Psychological Help was appropriate
for this study.
Section IV—Religious identity.
The fourth section asked questions about the subject’s religious practices and
religious identity. Subjects were asked how religious they consider themselves, how
often they read the Quran or other religious texts, as well as how often they pray, fast,
and consult a religious leader for advice.
Section V—Acculturation rating scale for Mexican Americans-II (ARSMA-
II)—shortened version.

41
The fifth section of the questionnaire is a modified version of the short version of
the revised Acculturation Rating Scale for Mexican Americans-II (ARSMA-II), a
multidimensional instrument that measures the subject’s orientation toward his native and
American culture independently (Cuéllar, Arnold, and Maldonado, 1995). The
ASRMA-II-SV scale consists of 12 statements with which the subject is asked to indicate
his or her agreement (1= Not at all; 2= Very little or not very often; 3= Moderately; 4=
Much or very often; 5= Extremely often or almost always). It has been found to be
reliable (α = 0.87), and consists of two subscales, measuring Mexican orientation (6
items) and Anglo orientation (6 items). Past research on Mexican culture has shown that
there were two primary factors: Mexican Acculturation, composed of Items 1, 3, 6, 7, 8,
and 11, and Anglo (Caucasian) Acculturation, composed of Items 2, 4, 5, 9, 10, and 12
(Campos et al., 2007). An overall acculturation score is calculated by subtracting the
mean score for Mexican orientation from the mean score for Anglo orientation. Higher
overall acculturation scores indicate greater English preference, whereas lower scores
indicate greater Spanish preference.
In this study, the ARSMA-II-SV was modified so that the term “Mexican” was
replaced with “South Asian”. This is similar to techniques used in other studies of Asian
populations (Farver, Narang & Badha, 2002; Lee, Choe, Kim & Ngo, 2000). While there
are several acculturation scales available, the ARSMA-II-SV was chosen because it has
been validated in an Asian-American population (Lee, Yoon, Liu-Tom, 2006). In this
study, a confirmatory factor analysis was done to determine if the two aforementioned
factors (Mexican orientation and Anglo orientation) translated into a South Asian
Acculturation factor and a Caucasian Acculturation factor (See Appendix C, Figure C1,

42
page 125 for model). Following the method described in the previous paragraph, an
overall acculturation score was calculated by subtracting the mean score for South Asian
orientation from the mean score for Anglo orientation.
Section VI—Demographic information.
The final section collected basic demographic information, including gender, age,
marital
status, country of birth, number of years living in the United States, educational status,
employment status, and household income.

43
Chapter IV
Results
This chapter focuses on the results of the analyses performed to address the
research questions of this study. In the first section, the composite scores for
acculturation and attitudes regarding seeking help from professional psychologists are
described. Next, the results of the confirmatory factor analysis and exploratory principal
component analysis of the ARSMA-II-SV are discussed. Next, each of the two research
question is addressed and the results of additional exploratory analyses are presented.
Finally, a summary of findings is provided.
Descriptive Statistics
In this section of the results, descriptive statistics for the composite scores utilized
in this analysis are provided. Table 2 contains descriptive statistics for the Attitudes
toward Professional Psychological Help and Acculturation composite scores. Scores for
the Attitudes toward Professional Psychological Help scale have a possible range from 0
(indicating an entirely negative attitude toward professional psychological help) to 30
(indicating an entirely positive attitude toward professional psychological help).
Therefore the mean of 21.20 (SD = 3.74) indicates a substantially positive attitude toward
psychological help in this sample.

44
With regard to the acculturation scores, a higher score on the South Asian
Orientation scale or the Caucasian Orientation scale indicate a stronger orientation
toward the named culture. Therefore, the fact that the Caucasian Orientation scores had a
higher mean (M = 4.25, SD = .75) than the South Asian Orientation scores (M = 2.52,
SD = 75) indicates that the sample exhibited higher level of orientation towards
Caucasian culture than to South Asian culture. In other words, the sample is positively
acculturated towards the Caucasian culture. This is also reflected in the positive Total
Acculturation score (M = 1.73, SD = .94), which was computed as the difference
between Caucasian Orientation score and the South Asian Orientation score.
Table 2
Descriptive Statistics for Composite Scores (N = 427)
M SD
Attitudes toward Professional Psychological Help 21.20 3.74
Acculturation
South Asian Orientation 2.52 .75
Caucasian Orientation 4.25 .57
Total Acculturation 1.73 .94

45
Table 3 shows the correlations between the demographic variables and the
Caucasian Orientation, South Asian Orientation, and Total Acculturation scores. For age,
the correlations are Pearson correlation coefficients, while for the dichotomous variables
the correlations are point biserial coefficients. Gender was negatively correlated with
Caucasian Orientation scores (rpb = -.11, p = .029). Given that gender was coded as 0 =
female and 1 = male, the negative correlation indicated that females had higher Caucasian
Orientation scores than males. Being born in the U.S. had a negative correlation with
South Asian Orientation (rpb = -.14, p = .003) and a positive correlation with Total
Acculturation (rpb = .15, p = .002). This indicated that those who were born in the U.S.
had lower South Asian Orientation scores and higher Total Acculturation scores. Income
was positively correlated with Caucasian Orientation (rpb = .14, p = .005), indicating that
those with incomes above $75,000 tended to have higher Caucasian Orientation scores.
Finally, having an undergraduate degree was positively correlated with Caucasian
Orientation (rpb = .11, p = .025) and negatively correlated with Total Acculturation scores
(rpb = -.11, p = .027), indicating that those with an undergraduate degree tended to have
higher Caucasian Orientation scores and lower Total Acculturation scores. In summary,
higher Caucasian Orientation scores were found for female participants, those with higher
incomes, and those with undergraduate degrees, while higher South Asian Orientation
scores were found for those who were not born in the U.S. Age, marital status, and
having a graduate degree were not correlated with either Caucasian Orientation or South
Asian Orientation. Higher Total Acculturation scores were found for those who were
born in the U.S. and did not have an undergraduate degree.

46
Table 3
Correlations Between Demographic Variables and Acculturation Scores (N = 427)
Item Caucasian Orientation South Asian Orientation Total Acculturation
Age .01 .02 .00
Gender -.11* .00 -.07
Born in the U.S. .06 -.14** .15**
Marital status .02 .03 -.01
Income .14** .02 .06
Undergraduate degree .11* -.05 -.11*
Graduate degree -.07 .02 -.06
*p < .05. **p < .01. Table 4 shows the correlations among the eight composite scores used in this
study. Acceptance of a Clinical Diagnosis of Depression scores were positively correlated
with scores on the Comfort Level Talking to People Outside the Family scale (r = .15, p
= .002), the Likelihood of Seeking Professional Help for Depression scale (r = .22, p <
.001), Attitudes toward Seeking Professional Psychological Help for Depression scale (r
= .17, p = .001), and Importance of the Ethnic Match scale (r = .10, p = .038). Scores on
the Comfort Level Talking to People Outside the Family scale were positively correlated
with scores on the Likelihood of Seeking Professional Help for Depression scale (r = .28,
p < .001) and scores on the Importance of the Ethnic Match scale (r = .26, p < .001). In
addition, scores on the Likelihood of Seeking Professional Help for Depression scale
were positively correlated with Attitudes toward Seeking Professional Psychological
Help for Depression scale (r = .26, p < .001) and scores on the Importance of the Ethnic
Match scale (r = .39, p < .001).

47
Scores on the Attitudes toward Seeking Professional Psychological Help for
Depression scale were positively correlated with scores on the Importance of the Ethnic
Match scale (r = .13, p = .006), Caucasian Orientation scores (r = .19, p < .001), and
Total Acculturation scores (r = .22, p < .001), and negatively correlated with South
Asian Orientation scores (r = -.13, p = .006). Caucasian Orientation scores were not
correlated with South Asian Orientation scores (r = -.01, p = .794), but were positively
correlated with Total Acculturation scores (r = .61, p < .001). South Asian Orientation
scores were negatively correlated with Total Acculturation scores (r = .80, p < .001).
Table 4
Correlations Among Composite Scores (N = 427)
Score 1. 2. 3. 4. 5. 6. 7. 8.
1. Acceptance of a Clinical Diagnosis of Depress
1.00
2. Comfort Level Talking to People Outside the Family
.15** 1.00
3. Likelihood of Seeking Professional Help for Depression
.22** .28** 1.00
4. Attitudes toward Seeking Professional Psychological Help for Depression
.17** .04 .26** 1.00
5. Importance of Ethnic Match .10* .26** .39** .13** 1.00
6. Caucasian Acculturation .08 -.03 -.02 .19** -.06 1.00
7. South Asian Acculturation .01 .01 .06 -.13** .06 -.01 1.00
8. Total Acculturation .04 -.03 -.06 .22** -.09 .61** -.80** 1.00
*p < .05. **p < .01.

48
In summary, among the five composite variables related to diagnosis and
treatment of depression, all correlations were positive and statistically significant with the
exception of the correlation between Comfort Level Talking to People Outside the
Family and Attitudes toward Seeking Professional Psychological Help for Depression.
The strongest correlation among these variables was between the Importance of the
Ethnic Match and the Likelihood of Seeking Professional Help for Depression scales.
Among these five scales, the only scale with statistically significant correlations with the
acculturation scales was the Attitudes toward Seeking Professional Psychological Help
for Depression scale, which was positively correlated with both Caucasian Orientation
and Total Acculturation, and negatively correlated with South Asian Orientation. Finally,
the three scores were correlated in the expected directions, with Caucasian Orientation
having a positive correlation with Total Acculturation scores while South Asian
Orientation had a negative correlation with Total Acculturation.
Factor Analysis
Confirmatory factor analysis.
A confirmatory factor analysis was conducted to examine the factor structure of
the ARSMA-II-SV items. The results from the confirmatory factor analysis indicated that
the hypothesized factor structure did not fit well. Specifically, the model was rejected via
the χ2 test, χ2(53) = 543.44, p < .001. Similarly, the fit indices indicated poor fit for the
model: GFI = .80, AGFI = .71, PGFI = .55, NFI = .55, TLI = .47.

49
Exploratory principal component analysis.
An exploratory principal component analysis (with varimax rotation) was
performed to examine the factor structure of the ARSMA-II-SV items, with results
shown in Table 5. There were three eigenvalues greater than one in the initial analysis:
2.74, 2.31, and 1.36. Therefore, three components were extracted and rotated via
varimax. Table 5 shows that the first component (20.8% of the variance explained)
consisted of high loadings for the six Caucasian Orientation items. The second
component consisted of four of the six South Asian Orientation items: Items 6, 7, 8, and
11 (18.0% of the variance explained). The third component consisted of the remaining
two South Asian Orientation items: Items 1 and 3 (14.7% of the variance explained).
Both of these items relate to South Asian language, which may explain why a third
component was found in this analysis.

50
Table 5
Results of Exploratory Principal Component Analysis of ASRMA-II-SV Items with Three Components (N = 427)
Item Component 1 (Caucasian Orientation)
Component 2 (South Asian Orientation)
Component 3 (South Asian Language)
1. I speak a South Asian Language .00 .17 .87
3. I enjoy speaking a South Asian Language
.19 .05 .86
6. I enjoy South Asian TV -.04 .81 .05
7. I enjoy South Asian movies .14 .72 -.01
8. I enjoy reading South Asian books -.19 .56 .13
11. I think in a South Asian language -.36 .57 .35
2. I speak English .64 -.23 .03
4. I associate with Caucasians .67 .13 .16
5. I enjoy listening to English music .58 -.05 .02
9. I write letters in English .43 -.07 .23
10. I think in English .73 -.30 -.12
12. My friends are Caucasian .61 .38 -.10
Sum of Squared Loadings 2.50 2.16 1.76
Percentage of Variance Explained 20.8% 18.0% 14.7%
Comparisons were made for the three component scores resulting from the
exploratory principal component analysis based on the participants’ demographic
characteristics of age, gender, whether or not the participant was born in the United
States, marital status, income group, and education. The correlations between participant
age and the three component scores are shown in Table 6. Age was not significantly

51
correlated with the principal scores for Caucasian Orientation (r = .00, p = .935), South
Asian Orientation (r = .00, p = .928), or South Asian Language (r = .07, p = .170).
Table 6
Correlations between Age and Exploratory Principal Component Scores
Variable
Component 1 (Caucasian Orientation)
Component 2 (South Asian Orientation)
Component 3 (South Asian Language)
Age r = .00 (p = .935) r = .00 (p = .928) r =.07 (p = .170)
Table 7 shows the mean scores for the three component scores based on gender,
whether or not the participant was born in the United States, marital status, income group,
and education. The independent samples t test comparing Caucasian Orientation scores
between males and females was statistically significant, t(425) = 2.31, p = .021, with
males (M = -.19, SD = 1.04) having lower scores than females (M = .07, SD = .98).
There was no difference between males and females in terms of South Asian Orientation
scores, t(425) = -.78, p = .437, or South Asian Language scores, t(425) = .63, p = .526.
There were no differences on the principal component scores on the basis of
whether or not the participant was born in the United States for Caucasian Orientation
scores, t(425) = -1.88, p = .061, or South Asian Orientation scores, t(425) = 1.94, p =
.053, but the difference was statistically significant for South Asian Language scores,
t(425) = 2.85, p = .005. Participants who were born in the U.S. had lower scores (M = -
.16, SD = 1.00) than those who were not born in the U.S. (M = .12, SD = .99).
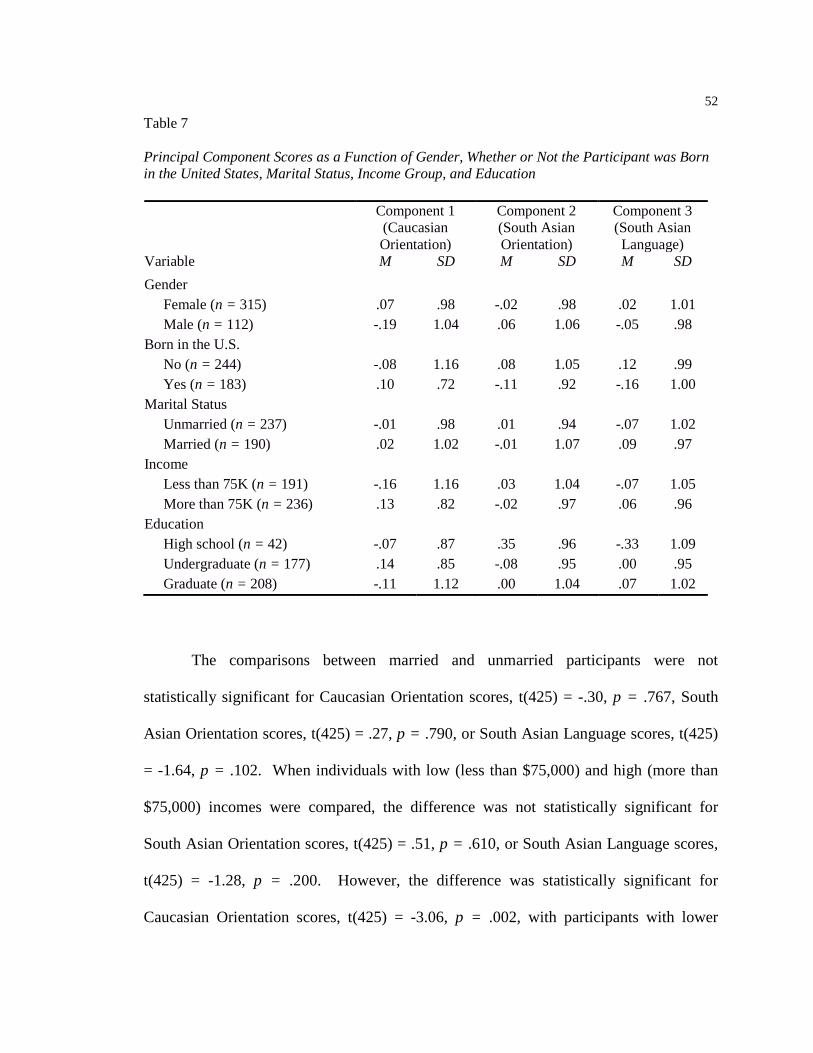
52
Table 7
Principal Component Scores as a Function of Gender, Whether or Not the Participant was Born in the United States, Marital Status, Income Group, and Education Component 1
(Caucasian Orientation)
Component 2 (South Asian Orientation)
Component 3 (South Asian Language)
Variable M SD M SD M SD
Gender
Female (n = 315) .07 .98 -.02 .98 .02 1.01 Male (n = 112) -.19 1.04 .06 1.06 -.05 .98
Born in the U.S.
No (n = 244) -.08 1.16 .08 1.05 .12 .99 Yes (n = 183) .10 .72 -.11 .92 -.16 1.00
Marital Status
Unmarried (n = 237) -.01 .98 .01 .94 -.07 1.02 Married (n = 190) .02 1.02 -.01 1.07 .09 .97
Income
Less than 75K (n = 191) -.16 1.16 .03 1.04 -.07 1.05 More than 75K (n = 236) .13 .82 -.02 .97 .06 .96
Education
High school (n = 42) -.07 .87 .35 .96 -.33 1.09 Undergraduate (n = 177) .14 .85 -.08 .95 .00 .95 Graduate (n = 208) -.11 1.12 .00 1.04 .07 1.02
The comparisons between married and unmarried participants were not
statistically significant for Caucasian Orientation scores, t(425) = -.30, p = .767, South
Asian Orientation scores, t(425) = .27, p = .790, or South Asian Language scores, t(425)
= -1.64, p = .102. When individuals with low (less than $75,000) and high (more than
$75,000) incomes were compared, the difference was not statistically significant for
South Asian Orientation scores, t(425) = .51, p = .610, or South Asian Language scores,
t(425) = -1.28, p = .200. However, the difference was statistically significant for
Caucasian Orientation scores, t(425) = -3.06, p = .002, with participants with lower

53
incomes having lower Caucasian Acculturation scores (M = -.16, SD = 1.16) than those
with higher incomes (M = .13, SD = .82).
In the comparisons based on education, the differences were not statistically
significant for South Asian Language scores, F(2, 424) = 2.82, p = .061. The difference
between the three education groups was statistically significant, however, for Caucasian
Orientation scores, F(2, 424) = 3.21, p = .041. Follow up Tukey HSD tests indicated that
participants with undergraduate degrees had higher scores (M = .14, SD = .85) than those
with graduate degrees (M = -.11, SD = 1.12), p = .035, but no other group pairs differed
significantly. In addition, the difference between the three education groups was
statistically significant for South Asian Orientation scores, F(2, 424) = 3.20, p = .042.
Follow up Tukey HSD tests showed that participants with a high school education had
lower scores (M = -.33, SD = 1.09) than those with graduate degrees (M = .07, SD =
1.02), p = .047, but no other pairs of groups differed significantly.
In summary, males and participants with lower incomes had lower Caucasian
Orientation scores than their counterparts. Participants with undergraduate degrees also
had higher Caucasian Orientation scores than their counterparts with graduate degrees.
Furthermore, participants with a high school education had lower South Asian
Orientation scores than participants with graduate degrees. Finally, participants born in
the United States had lower South Asian language scores than their counterparts who
were not born in the United States.
A second exploratory principal component analysis was conducted specifying two
components (rather than using the eigenvalues-greater-than-one rule). The results of this
analysis are shown in Table 8. There is a clear distinction between the Caucasian

54
Orientation items (Component 1) and the South Asian Orientation items (Component 2).
Item 3, “I enjoy speaking a South Asian language” had moderate loadings on both
components (0.396) , while Item 10, “I think in English” had a secondary negative
loading on the South Asian Orientation component (-0.38). While these two potential
cross-loadings emerged, both of these values were below the conventional criterion of
0.40. Therefore, a two-component model was decided to be appropriate for this study
and was used for subsequent analyses.
Table 8
Results of Exploratory Principal Component Analysis of ASRMA-II-SV Items with Two Components (N = 427)
Item Component 1 (Caucasian
Acculturation)
Component 2 (South Asian
Acculturation)
1. I speak a South Asian Language .20 .64
3. I enjoy speaking a South Asian Language 0.40 .52
6. I enjoy South Asian TV -.08 .69
7. I enjoy South Asian movies .08 .56
8. I enjoy reading South Asian books -.19 .55
11. I think in a South Asian language -.29 .70
2. I speak English .64 -.23
4. I associate with Caucasians .68 .14
5. I enjoy listening to English music .57 -.08
9. I write letters in English .47 .04
10. I think in English .70 -.38
12. My friends are Caucasian .54 .20
Sum of Squared Loadings 2.53 2.53
Percentage of Variance Explained 21.1% 21.0%

55
Summary of factor analysis results.
In conclusion, while the confirmatory factor analysis, which allows for no cross-
loadings between components, suggested that the hypothesized two-factor solution did
not provide a good fit to the data, subsequent exploratory principal component analyses,
which allow for minimal cross-loadings between components, suggested that a two-factor
model could still be used. Exploratory results using the eigenvalue greater than one
method indicated that a separate component may be required distinguishing South Asian
language orientation to other forms of South Asian orientation. In a secondary
exploratory principal component analysis, the factors were forced into two components
and there were no significant cross-loadings for the items. Furthermore, a reliability
analysis was also conducted (using Cronbach’s α) for the two scores, resulting in
coefficients of .67 for South Asian Orientation and .64 for Caucasian Orientation. While
these values are slightly below the conventional criterion of .70, they demonstrate that
there is some reliability to the two scores. Therefore, while there are some psychometric
weaknesses to the two orientation scores, there is enough evidence to use these scores,
along with the Total Acculturation scores, in answering the two research questions of this
study.
Inferential Statistics
Results for Research Question 1.
The first research question of this study was: Which demographic variables (age;
gender; being born in the United States; marital status, income or education) affect
attitudes of South Asian Muslim Americans towards the diagnosis and treatment of

56
depression? To answer this research question, a series of ANCOVA analyses were
performed with the following dependent variables:
1. Acceptance of a clinical diagnosis of depression (4 items)
2. Comfort level talking to people outside of their family about depression (6 items)
3. Likelihood of seeking professional care for depression (4 items)
4. Attitudes toward Professional Psychological Help scale (10 items)
5. Importance of an ethnic match with their mental health provider (4 items)
The items composing each of these dependent variables are reviewed in Appendix D
(page 126). In each analysis, the independent variables were:
1. Age (continuous)
2. Gender (0 = female, 1 = male)
3. Whether or not the participant was born in the U.S. (0 = no, 1 = yes)
4. Marital status (0 = unmarried, 1 = married)
5. Income (0 = less than $75,000, 1 = more than $75,000)
6. Educational status (coded into two dummy variables representing undergraduate
degrees (0 = not undergraduate degree, 1 = undergraduate degree) and graduate
degrees (0 = not graduate degree, 1 = graduate degree).
The results of the ANCOVA with scores on the Acceptance of a Clinical
Diagnosis of Depression scale as the dependent variable are shown in Table 9. Two of the
independent variables were statistically significant as predictors of scores on the
Acceptance of a Clinical Diagnosis of Depression composite score. First, having an
undergraduate degree was statistically significant, F(1, 419) = 8.71, p = .003. An
examination of the estimated marginal means indicated that those who had an

57
undergraduate degree tended to have higher scores on this scale (M = 3.83, SE = .07)
than those who did not (M = 3.54, SE = .05). Second, having a graduate degree was
statistically significant, F(1, 419) = 5.23, p = .023. The marginal means indicated that
those with a graduate degree (M = 3.80, SE = .07) had higher scores on this dependent
variable than those who did not (M = 3.57, SE = .05). Therefore, based on the results of
the ANCOVA analysis, more educated participants were more accepting of a clinical
diagnosis of clinical depression.
Table 9
Results of ANCOVA with Acceptance of a Clinical Diagnosis of Depression as the Dependent Variable (N = 427)
Sum of Squares
df Mean Squares
F P η2
Age .34 1 .34 1.13 .288 .00
Gender .47 1 .47 1.58 .210 .00
Born in the U.S. .06 1 .06 .21 .647 .00
Marital status .08 1 .08 .26 .610 .00
Income .08 1 .08 .27 .601 .00
Undergraduate degree 2.61 1 2.61 8.71 .003 .02
Graduate degree 1.57 1 1.57 5.23 .023 .01
Error 125.71 419 .30
Total 129.88 426

58
Table 10 shows the results of the ANCOVA with the composite score for Comfort
Level Talking to People Outside the Family serving as the dependent variable. In this
analysis, none of the independent variables were statistically significant. Therefore, it can
be concluded that age, gender, being born in the U.S., martial status, income, and
education were not related to the how likely the participants were to speak with someone
outside their family about depression.
Table 10
Results of ANCOVA with Comfort Level Talking to People Outside the Family as the Dependent Variable (N = 427)
Sum of Squares
df Mean Squares
F P η2
Age .44 1 .44 3.13 .077 .01
Gender .20 1 .20 1.43 .232 .00
Born in the U.S. .00 1 .00 .00 .983 .00
Marital status .23 1 .23 1.68 .196 .00
Income .03 1 .03 .18 .670 .00
Undergraduate degree .03 1 .03 .20 .656 .00
Graduate degree .01 1 .01 .07 .796 .00
Error 58.67 419 .14
Total 59.49 426
The next analysis included the Likelihood of Seeking Professional Help for
Depression scores as the dependent variable, with results shown in Table 11. Again, none
of the independent variables had a statistically significant effect in this analysis. This

59
indicated that age, gender, being born in the U.S., marital status, income, and education
did not have an effect on how likely the participants were to seek professional help for
depression.
Table 11
Results of ANCOVA with Likelihood of Seeking Professional Help for Depression as the Dependent Variable (N = 427)
Sum of Squares
df Mean Squares
F P η2
Age .13 1 .13 .69 .407 .00
Gender .25 1 .25 1.31 .253 .00
Born in the U.S. .00 1 .00 .00 .986 .00
Marital status .01 1 .01 .05 .829 .00
Income .02 1 .02 .11 .737 .00
Undergraduate degree .02 1 .02 .11 .746 .00
Graduate degree .12 1 .12 .66 .417 .00
Error 79.17 419 .19
Total 80.01 426
Table 12 shows the results of the ANCOVA with composite scores for Attitudes
toward Seeking Professional Psychological Help for Depression as the dependent
variable. Here, there were three statistically significant effects. Gender had a statistically
significant effect, F(1, 419) = 9.63, p = .002, with males (M = 20.49, SE = .36) having
lower scores than females (M = 21.75, SE = .22). Second, those with an undergraduate
degree had higher scores (M = 22.20, SED=.44) than those who did not (M = 20.04, SE

60
= .34), F(1, 419) = 10.51, p = .001. Third, those who had a graduate degree had higher
scores (M = 22.20, SE = .44) than those who did not (M = 20.04, SE = .36), F(1, 419) =
10.46, p = .001. Therefore, the individuals with the most positive attitudes about seeking
professional psychological help for depression were females and those with higher
education degrees.
Table 12
Results of ANCOVA with Attitudes toward Seeking Professional Psychological Help for Depression as the Dependent Variable (N = 427)
Sum of Squares
df Mean Squares
F P η2
Age 16.15 1 16.15 1.20 .274 .00
Gender 129.44 1 129.44 9.63 .002 .02
Born in the U.S. 2.12 1 2.12 .16 .692 .00
Marital status 2.10 1 2.10 .16 .693 .00
Income .02 1 .02 .00 .968 .00
Undergraduate degree 141.30 1 141.30 10.51 .001 .02
Graduate degree 140.62 1 140.62 10.46 .001 .02
Error 5633.93 419 13.45
Total 5967.27 426
The final ANCOVA included the composite score for the Importance of the
Ethnic Match as the dependent variable, with results shown in Table 13. None of the
independent variables were statistically significant. This indicated that age, gender, being

61
born in the U.S., marital status, income, and education did not have an effect on the
perceived importance of an ethnic match with the psychological service provider.
Table 13
Results of ANCOVA with Importance of Ethnic Match as the Dependent Variable (N =
427)
Sum of Squares
df Mean Squares
F p Η2
Age .13 1 .13 .60 .439 .00
Gender .03 1 .03 .15 .696 .00
Born in the U.S. .02 1 .02 .08 .780 .00
Marital status .04 1 .04 .20 .656 .00
Income .07 1 .07 .33 .567 .00
Undergraduate degree .02 1 .02 .09 .761 .00
Graduate degree .68 1 .68 3.11 .079 .01
Error 92.26 419 .22
Total 94.60 426
Results for Research Question 2.
The second research question was: Controlling for the aforementioned
demographic variables (age; gender; being born in the United States; marital status,
income or education), how will overall acculturation scores affect attitudes of South
Asian Muslim Americans towards the diagnosis and treatment of depression? To answer
this question, five multiple regression analyses were performed, one for each of the five
dependent variables listed above. The control variables were the demographic variables,

62
and the independent variable was the overall Acculturation score. The demographic
variables were entered in a stepwise fashion, then the independent variable
(Acculturation) was entered into the model.
Table 14 shows the results of the regression analysis with Acceptance of a
Clinical Diagnosis of Depression scores as the dependent variable. In the stepwise entry
of the control variable, there were no statistically significant effects, and therefore none
of the control variables were entered into the model. When Acculturation scores were
entered, the model was not statistically significant, R2 <.01, F(1, 425) = .73, p = .393. The
results indicated that neither the control variables nor scores on the Acculturation scale
were related to scores on the Acceptance of a Clinical Diagnosis of Depression scale.
Table 14
Results of Regression Analysis with Acceptance of a Clinical Diagnosis of Depression as the Dependent Variable (N = 427)
B SEB β t p
Block 1
*No control variables were statistically significant
Block 2
Constant 3.59 .06 64.34 .000
Acculturation .02 .03 .04 .86 .393
Note. Block 2 R2 <.01, F(1, 425) = .73, p = .393.
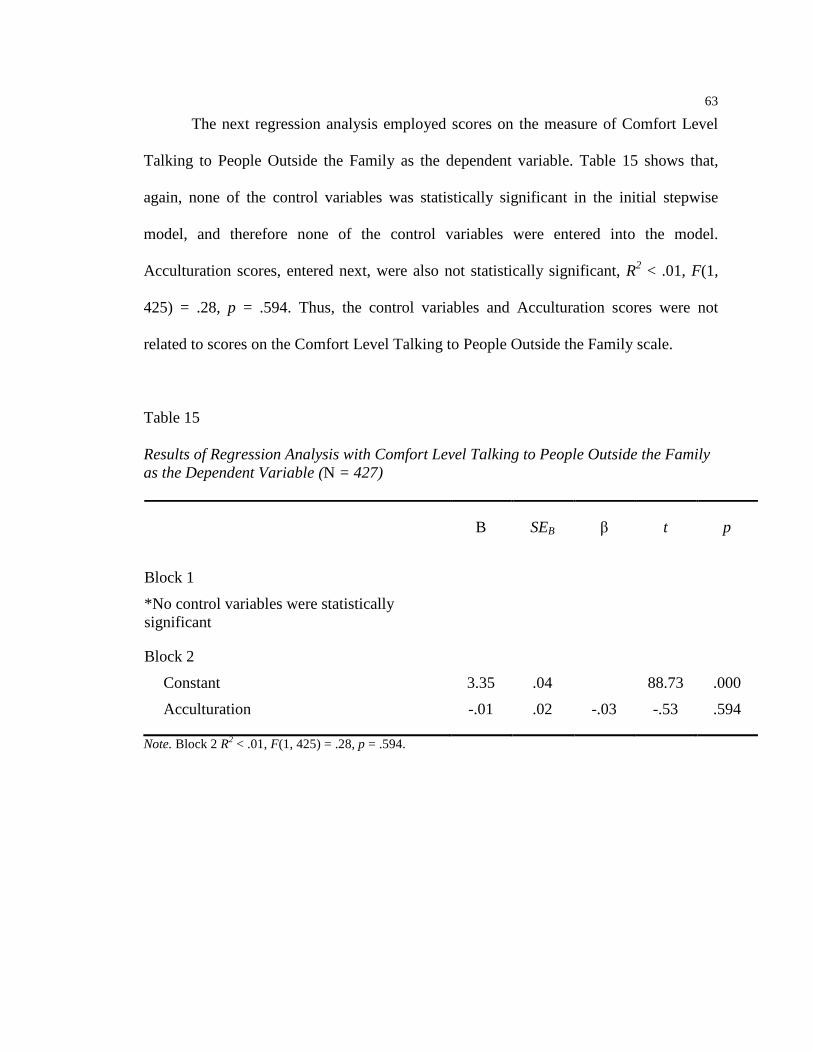
63
The next regression analysis employed scores on the measure of Comfort Level
Talking to People Outside the Family as the dependent variable. Table 15 shows that,
again, none of the control variables was statistically significant in the initial stepwise
model, and therefore none of the control variables were entered into the model.
Acculturation scores, entered next, were also not statistically significant, R2 < .01, F(1,
425) = .28, p = .594. Thus, the control variables and Acculturation scores were not
related to scores on the Comfort Level Talking to People Outside the Family scale.
Table 15
Results of Regression Analysis with Comfort Level Talking to People Outside the Family as the Dependent Variable (N = 427)
B SEB β t p
Block 1
*No control variables were statistically significant
Block 2
Constant 3.35 .04 88.73 .000
Acculturation -.01 .02 -.03 -.53 .594
Note. Block 2 R2 < .01, F(1, 425) = .28, p = .594.

64
Table 16 shows the results of regression analysis with Likelihood of Seeking
Professional Help for Depression as the dependent variable. None of the control variables
was statistically significant in the initial stepwise model. When Acculturation scores were
then entered, the result was not statistically significant, R2 < .01, F(1, 425) = 1.55, p =
.214. Therefore, it can be concluded that none of the control variables were related to
scores on the Likelihood of Seeking Professional Help for Depression scale, and
Acculturation scores were similarly not statistically significant.
Table 16
Results of Regression Analysis with Likelihood of Seeking Professional Help for Depression as the Dependent Variable (N = 427)
B SEB β t p
Block 1
*No control variables were statistically significant
Block 2
Constant 3.61 .04 82.41 .000
Acculturation -.03 .02 -.06 -1.25 .214
Note. Block 2 R2 < .01, F(1, 425) = 1.55, p = .214.

65
Table 17 shows the results of the regression analysis with scores on the Attitudes
toward Seeking Professional Psychological Help for Depression scale as the dependent
variable. In this analysis, two of the control variables were statistically significant. The
first variable entered into the regression equation was gender, and this regression model
was statistically significant, R2 = .02, F(1, 425) = 8.07, p = .005. The negative regression
coefficient for gender (β = -.14) indicated that females had more positive scores on this
scale than males. The second control variable entered into the regression model was age,
which resulted in a statistically significant increase in the prediction of scores on the
Attitudes toward Seeking Professional Psychological Help for Depression scale, Change
R2 = .01, Change F(1, 424) = 4.45, p = .035. The positive regression coefficient for age (β
= .10) indicated that older participants tended to have more positive attitudes toward
seeking professional psychological help for depression. None of the other control
variables was statistically significant, and therefore the final control variable model
contained only gender and age. When Acculturation scores were added in the third block
of this model the increase in the prediction of Attitudes toward Seeking Professional
Psychological Help for Depression scores was statistically significant, Change R2 = .05,
Change F(1, 423) = 20.42, p < .001. The positive regression coefficient for Acculturation
scores (β= .21) indicated that participants with higher Acculturation scores also tended to
have higher scores on the Attitudes toward Seeking Professional Psychological Help for
Depression scale. Therefore, the results showed that Acculturation scores were able to
predict Attitudes toward Seeking Professional Psychological Help for Depression scores,
even when controlling for the demographic variables.

66
Table 17
Results of Regression Analysis with Attitudes toward Seeking Professional Psychological Help for Depression as the Dependent Variable (N = 427)
B SEB β t p
Block 1
Constant 21.51 .21 102.84 .000
Gender -1.16 .41 -.14 -2.84 .005
Block 2
Constant 20.26 .63 32.26 .000
Gender -1.22 .41 -.14 -2.99 .003
Age .04 .02 .10 2.11 .035
Block 3
Constant 18.78 .70 26.97 .000
Gender -1.10 .40 -.13 -2.75 .006
Age .04 .02 .10 2.15 .032
Acculturation .84 .19 .21 4.52 .000
Note. Block 1 R2 = .02, F(1, 425) = 8.07, p = .005; Block 2 Change R2 = .01, Change F(1, 424) = 4.45, p = .035; Block 3 Change R2 = .05, Change F(1, 423) = 20.42, p < .001.
The results of the final regression analysis are shown in Table 18, for which
Importance of Ethnic Match scores served as the dependent variable. In the stepwise
analysis of the control variables, having a graduate degree was statistically significant.
The regression model was statistically significant, R2 = .02, F(1, 425) = 9.38, p = .002.
The positive regression coefficient for having a graduate degree (β= .15) indicated that
participants with a graduate degree tended to place greater importance on ethnic match
with a mental health provider. No other control variables were statistically significant.
When Acculturation scores were added in the second block, the additional variance

67
explained was not statistically significant, Change F (1, 424) = 2.59, p = .108. Thus,
Acculturation scores were not predictive of scores on the Importance of Ethnic Match
scale when controlling for having a graduate degree.
Table 18
Results of Regression Analysis with Importance of Ethnic Match as the Dependent Variable (N = 427)
B SEB β t p
Block 1
Constant 3.28 .03 103.86 .000
Graduate degree .14 .05 .15 3.06 .002
Block 2
Constant 3.34 .05 63.01 .000
Graduate degree .13 .05 .14 2.97 .003
Acculturation -.04 .02 -.08 -1.61 .108
Note. Block 1 R2 = .02, F(1, 425) = 9.38, p = .002; Block 2 Change R2 = .01, Change F (1, 424) = 2.59, p = .108. Exploratory Analyses Examing the Role of Personal History of Depression.
Given that the main findings of this study were for gender and education, it was
posited that perhaps females and more educated participants had more positive attitudes
towards the diagnosis and treatment of depression because they had personal experience
with depression. Subsequent exploratory analyses were conducted to examine the role of
personal history of depression on attitudes towards the diagnosis and treatment of
depression in this sample. In this study, “personal history of depression” was a computed

68
variable coded “yes” if the subject responded positively to any of the following
questions: 1) have you ever suspected that you may have been depressed; 2) have family
members suggested that you may have been depressed; and 3) has a professional ever
diagnosed you with depression? In total, 270 participants (63.2% of sample) reported
having a personal history of depression. The analyses for Research Questions 1 and 2
were rerun adding “personal history of depression” as a variable with the following
results.
Results of Research Question 1 with Personal History of Depression as an
Additional Independent Variable.
The results of the ANCOVA with scores on the Acceptance of a Clinical
Diagnosis of Depression scale as the dependent variable are shown in Table 19. The same
two independent variables that were statistically significant in the initial analysis were
found to be statistically significant predictors of scores on the Acceptance of a Clinical
Diagnosis of Depression composite score in this analysis. First, having an undergraduate
degree was statistically significant, F(1, 419) = 8.64, p = .003. An examination of the
estimated marginal means indicated that those who had an undergraduate degree tended
to have higher scores on this scale (M = 3.83, SE = .07) than those who did not (M =
3.53, SE = .05). Second, having a graduate degree was statistically significant, F(1, 419)
= 5.10, p = .024. The marginal means indicated that those with a graduate degree (M =
3.80, SE = .07) had higher scores on this dependent variable than those who did not (M =
3.57, SE = .05). Therefore, based on the results of this ANCOVA analysis, more
educated participants were still more accepting of a clinical diagnosis of clinical
depression.

69
Table 19 Results of ANCOVA with Acceptance of a Clinical Diagnosis of Depression as the Dependent Variable and Personal History of Depression as an Independent Variable (N = 427)
Sum of Squares
df Mean Squares
F p η2
Age 0.35 1 0.35 1.15 0.285 .00
Gender 0.48 1 0.48 1.60 0.206 .00
Born in the U.S. 0.06 1 .06 .21 0.650 .00
Marital status 0.07 1 0.07 0.24 0.624 .00
Income 0.09 1 0.09 0.29 0.593 .00
Undergraduate degree 2.60 1 2.60 8.64 0.003 .02
Graduate degree 1.53 1 1.53 5.10 0.024 .01
Personal History of Depression
0.037 1 0.04 0.12 0.725 0.00
Error 125.67 418 .30
Total 129.88 426
Table 20 shows the results of the ANCOVA with the composite score for Comfort
Level Talking to People Outside the Family serving as the dependent variable. In this
analysis, none of the independent variables were statistically significant. In other words,
age, gender, being born in the U.S., marital status, income, education and personal history
of depression did not have an effect on the participant’s responses on the Comfort Level
Talking to People Outside the Family scale.

70
Table 20
Results of ANCOVA with Comfort Level Talking to People Outside the Family as the Dependent Variable and Personal History of Depression as an Independent Variable (N = 427)
Sum of Squares
df Mean Squares
F p η2
Age 0.44 1 .44 3.10 0.08 .01
Gender 0.20 1 .20 1.40 0.237 .00
Born in the U.S. .00 1 .00 .00 0.985 .00
Marital status 0.24 1 0.24 1.71 0.192 .00
Income 0.02 1 0.02 0.17 0.678 .00
Undergraduate degree 0.03 1 .03 0.19 0.661 .00
Graduate degree .01 1 .01 0.06 0.811 .00
Personal History of Depression
0.01 1 0.01 0.08 0.773 0.00
Error 58.66 418 .14
Total 59.49 426
In the next analysis, Likelihood of Seeking Professional Help for Depression
scores were used as the dependent variable. As seen in Table 21, none of the independent
variables had a statistically significant effect in this analysis. This indicated that age,
gender, being born in the U.S., marital status, income, education, and personal history of
depression did not have an effect on how likely the participants were to seek professional
help for depression.

71
Table 21
Results of ANCOVA with Likelihood of Seeking Professional Help for Depression as the Dependent Variable and Personal History of Depression as an Independent Variable (N = 427)
Sum of Squares
df Mean Squares
F p η2
Age 0.12 1 0.12 0.65 0.420 .00
Gender 0.23 1 0.23 1.24 0.267 .00
Born in the U.S. .00 1 .00 .00 0.979 .00
Marital status .01 1 .01 0.07 0.794 .00
Income .02 1 .02 0.10 0.760 .00
Undergraduate degree .02 1 .02 0.12 0.731 .00
Graduate degree 0.14 1 0.14 0.75 0.386 .00
Personal History of Depression
0.14 1 0.14 0.76 0.383 0.00
Error 79.03 418 .19
Total 80.01 426
Table 22 shows the results of the ANCOVA with composite scores for Attitudes
toward Seeking Professional Psychological Help for Depression as the dependent
variable. Four statistically significant effects were found. Gender had a statistically
significant effect, F(1, 419) = 10.14, p = .002, with males (M = 20.56, SE = .36) having
lower scores than females (M = 21.86, SE = .23). Those with undergraduate degrees had
higher scores (M = 22.30, SE = .45) than those who did not (M = 20.12, SE = .34), F(1,
419) = 10.88, p = .001. Third, those who had a graduate degree had higher scores (M =
22.34, SE = .44) than those who did not (M = 20.08, SE = .36), F(1, 419) = 11.34, p =

72
.001. Finally, those with a personal history of depression had lower scores (M = 20.84,
SE = .26) than those without a personal history (M = 21.58, SE = .32), F(1, 419) = 4.01,
p = .046. Therefore, the individuals with the most positive attitudes about seeking
professional psychological help for depression were females, those with undergraduate
and graduate degrees, and those without a personal history of depression.
Table 22
Results of ANCOVA with Attitudes toward Seeking Professional Psychological Help for Depression as the Dependent Variable and Personal History of Depression as an Independent Variable (N = 427)
Sum of Squares
df Mean Squares
F p η2
Age 14.64 1 14.64 1.10 0.296 .00
Gender 135.42 1 135.42 10.14 .002 .02
Born in the U.S. 2.35 1 2.35 0.18 0.675 .00
Marital status 3.33 1 3.33 0.25 0.618 .00
Income 0.01 1 0.01 .00 0.977 .00
Undergraduate degree 145.24 1 145.24 10.88 .001 0.03
Graduate degree 151.43 1 151.43 11.34 .001 0.03
Personal History of Depression
53.52 1 53.52 4.01 0.046 0.01
Error 5580.42 418 13.35
Total 5967.27 426
Finally, the results of the ANCOVA with composite score for the Importance of
the Ethnic Match as the dependent variable are shown in Table 23. None of the
independent variables were statistically significant. Therefore, age, gender, being born in

73
the U.S., marital status, income, education, and personal history of depression did not
affect the perceived importance of an ethnic match with the psychological service
provider.
Table 23
Results of ANCOVA with Importance of Ethnic Match as the Dependent Variable and
Personal History of Depression as an Independent Variable (N = 427)
Sum of Squares
df Mean Squares
F p η2
Age .13 1 .13 0.59 0.444 .00
Gender .03 1 .03 .15 0.703 .00
Born in the U.S. .02 1 .02 .08 0.778 .00
Marital status 0.05 1 0.05 0.21 0.647 .00
Income .07 1 .07 0.32 0.574 .00
Undergraduate degree .02 1 .02 0.10 0.757 .00
Graduate degree 0.70 1 0.70 3.15 0.077 .01
Personal History of Depression
0.02 1 0.02 0.07 0.796 0.00
Error 92.25 418 .22
Total 94.60 426

74
Results of Research Question 2 with Personal History of Depression as an
Additional Control Variable.
Next, the statistical analyses for Research Question 2 were rerun adding personal
history of depression as a control variable. When Acceptance of a Clinical Diagnosis of
Depression was used as the dependent variable and the control variables were entered in a
stepwise fashion, there were no statistically significant effects, and therefore none of the
control variables were entered into the model. When Acculturation scores were entered,
the model was not statistically significant, R2 <.01, F(1, 425) = .73, p = .393. The results
indicated that neither the control variables nor scores on the Acculturation scale were
related to scores on the Acceptance of a Clinical Diagnosis of Depression scale.
In the next regression analysis, Comfort Level Talking to People Outside the
Family was the dependent variable. Once again, none of the control variables were
statistically significant, and were not entered into the model. When Acculturation scores
were entered, the model was not statistically significant, R2 <.01, F(1, 425) = .28, p =
.594. Therefore, the control variables and acculturation scores were not predictive of
scores on the Comfort Level Talking to People Outside the Family scale.
When the regression analysis with Likelihood of Seeking Professional Help for
Depression was conducted, once again, none of the control variables were found to be
statistically significant and were not entered into the model. When Acculturation scores
were entered, the model was not statistically significant, R2 <.01, F(1, 425) = 1.55, p =
.214. The results indicated that neither the control variables nor scores on the
Acculturation scale were related to scores on the Likelihood of Seeking Professional Help
for Depression scale.

75
Table 24 shows the results of the regression analysis with scores on the Attitudes
toward Seeking Professional Psychological Help for Depression scale as the dependent
variable. Two of the control variables were found to be statistically significant. The first
variable entered into the regression equation was gender, and this regression model was
statistically significant, R2 = .02, F(1, 425) = 8.07, p = .005. The negative regression
coefficient for gender (β = -1.16) indicated that females had higher scores on this scale
than males. The second control variable entered into the regression model was age, which
resulted in a statistically significant increase in the prediction of scores on the Attitudes
toward Seeking Professional Psychological Help for Depression scale, Change R2 = .01,
Change F(1, 424) = 4.45, p = .035. The positive regression coefficient for age (β = .04)
indicated that older participants tended to have higher scores on the Attitudes toward
Seeking Professional Psychological Help for Depression scale. None of the other control
variables was statistically significant; therefore, the final control variable model
contained only gender and age. When Acculturation scores were added in the third block
of this model the increase in the prediction of Attitudes toward Seeking Professional
Psychological Help for Depression scores was statistically significant, Change R2 = .05,
Change F(1, 423) = 20.42, p < .001. The positive regression coefficient for Acculturation
scores (β= .84) indicated that participants with higher Acculturation scores had higher
scores on the Attitudes toward Seeking Professional Psychological Help for Depression
scale. In summary, the results showed that, as in the original analyses, Acculturation
scores were able to predict Attitudes toward Seeking Professional Psychological Help for
Depression scores, when controlling gender and age.

76
Table 24
Results of Regression Analysis with Attitudes toward Seeking Professional Psychological Help for Depression as the Dependent Variable and Personal History of Depression as a Control Variable (N = 427)
B SEB β t p
Block 1
Constant 21.51 .21 102.84 .000
Gender -1.16 .41 -.14 -2.84 .005
Block 2
Constant 20.26 .63 32.27 .000
Gender -1.22 .41 -.14 -2.99 .003
Age .04 .02 .10 2.11 .035
Block 3
Constant 18.78 .70 26.97 .000
Gender -1.10 .40 -.13 -2.75 .006
Age .04 .02 .10 2.15 .032
Acculturation .84 .19 .21 4.52 .000
Note. Block 1 R2 = .02, F(1, 425) = 8.07, p = .005; Block 2 Change R2 = .01, Change F(1, 424) = 4.45, p = .035; Block 3 Change R2 = .05, Change F(1, 423) = 20.42, p < .001.
The results of the regression analysis with importance of ethnic match as the
dependent variable are shown in Table 25. In the stepwise analysis of the control
variables, having a graduate degree was statistically significant, R2 = .02, F(1, 425) =
9.38, p = .002. The positive regression coefficient for having a graduate degree (β= .14)
indicated that participants with a graduate degree tended to have higher scores on the
Importance of Ethnic Match scale. No other control variables were statistically
significant. When Acculturation scores were added in the second block, the additional
variance explained was not statistically significant, Change F (1, 424) = 2.59, p = .108.

77
Thus, as in the original analyses, Acculturation scores were not predictive of scores on
the Importance of Ethnic Match scale when controlling for having a graduate degree.
Table 25
Results of Regression Analysis with Importance of Ethnic Match as the Dependent Variable and Personal History of Depression as a Control Variable (N = 427)
B SEB β t p
Block 1
Constant 3.28 .03 103.86 .000
Graduate degree .14 .05 .15 3.06 .002
Block 2
Constant 3.34 .05 63.01 .000
Graduate degree .13 .05 .14 2.97 .003
Acculturation -.04 .02 -.08 -1.61 .108
Note. Block 1 R2 = .02, F(1, 425) = 9.38, p = .002; Block 2 Change R2 = .01, Change F (1, 424) = 2.59, p = .108.
Summary of Findings
Preliminary analyses in this study consisted of a confirmatory factor analytic
examination of the ARSMA-II-SV Acculturation scale items. The results indicated that
the data did not fit the a priori two-factor model. Exploratory principal component
analyses were then conducted and indicated that a third factor related to South Asian
language orientation may be required. However, when two components were extracted
and rotated, the items separated into the two expected components with minimal, but no
significant cross-loadings.

78
The first research question of this study was: Which demographic variables (age;
gender; being born in the United States; marital status, income or education) affect
attitudes of South Asian Muslim Americans towards the diagnosis and treatment of
depression? Five dependent variables were examined for this research question: (a)
acceptance of a clinical diagnosis of depression, (b) feeling comfortable talking to people
outside of their family about depression, (c) likelihood of seeking professional care for
depression, (d) overall attitudes toward professional psychological help, and (e) the
perceived importance of an ethnic match with the professional. The primary results were:
1. More educated participants were more accepting of a clinical diagnosis of clinical
depression than less educated participants.
2. Females and more educated participants tended to have the most positive attitudes
about seeking professional psychological help for depression.
3. None of the demographic variables were related to feeling comfortable talking to
people outside the family about depression, the likelihood of seeking professional
help for depression, or the perceived importance of an ethnic match.
The second research question was: Controlling for the aforementioned
demographic variables (age; gender; being born in the United States; marital status,
income or education), how will overall acculturation scores affect attitudes of South
Asian Muslim Americans towards the diagnosis and treatment of depression? The same
five dependent variables were used for this research question.
1. Neither the control variables nor Acculturation scores were predictive of
acceptance of a clinical diagnosis of depression, the level of comfort talking to

79
people outside the family about depression, or the likelihood of seeking
professional help for depression.
2. Females and older participants had more positive attitudes toward seeking
professional psychological help for depression. In addition, those with a higher
level of acculturation tended to have more positive attitudes toward seeking
professional psychological help for depression even when controlling for gender
and age.
3. For the importance of the ethnic match, more educated participants tended to feel
that this was more important than less educated participants. However, level of
acculturation was not related to the perceived importance of the ethnic match.
Finally, exploratory analyses were conducted to determine the role of personal history of
depression on attitudes towards the diagnosis and treatment of depression. Both research
questions were rerun adding personal history of depression as an independent variable.
The findings were:
1. More educated participants continued to have more acceptance of a clinical
diagnosis of depression.
2. In addition to females and participants with undergraduate and graduate
degrees,
participants without a personal history of depression also had more positive
attitudes
about seeking professional psychological help.
3. When the regression analyses for Research Question 2 were rerun with
personal history of depression as an additional control variable, the same

80
statistically significant results were found as listed on page 89. In other words,
females and older participants had more positive attitudes toward seeking
professional psychological help for depression. Those with higher levels of
acculturation also had more positive attitudes toward seeking professional
psychological help for depression, after controlling for gender and age. More
educated participants found ethnic match to be less important. Level of
acculturation was not related to the perceived importance of the ethnic match.

81
Chapter V Discussion
The primary aim of this study is to explore attitudes towards the diagnosis and
treatment of depression among South Asian Muslim Americans. In particular, the role of
acculturation in shaping these attitudes was explored. In this study “attitudes towards the
diagnosis and treatment of depression” was defined as 1) a person’s acceptance of the
clinical diagnosis of depression in self and/or others; and 2) a person’s willingness to talk
to others, both within and outside of the community, about the diagnosis of depression in
self and/or others. Similarly, “attitudes towards the treatment of depression” was defined
as 1) a person’s willingness to undergo psychotherapy or psychiatric care or recommend
these treatments to others and for what presentation/degree of severity of depression; and
2) a person’s willingness work with mental health providers who are of similar and/or
different backgrounds to treat depression. Based on the literature, two research questions
were developed. First, which demographic variables (age, gender, being born in the
United States, marital status, income or education) affect attitudes of South Asian Muslim
Americans towards the diagnosis and treatment of major depression. Second, controlling
for the aforementioned demographic variables, how do overall acculturation scores affect
attitudes towards the diagnosis and treatment of depression in this population?
For the first research question, five hypotheses were developed and tested. First,
it was predicted that South Asian Muslim Americans who were younger (less than 30
years old), female, born in the United States, single, earning higher incomes (greater than
$75,000), and possessing at least an undergraduate degree would be more accepting of a

82
clinical diagnosis of depression compared to their counterparts who were older, male,
immigrants to the United States, married, earning lower incomes, and not possessing
undergraduate degrees. This hypothesis was partially confirmed. More educated
participants, specifically those with undergraduate and graduate degrees, were more
accepting of a clinical diagnosis of depression than their less educated counterparts. Age,
gender, being born in the United States, marital status and income were not found to be
significantly associated with acceptance of a clinical diagnosis of depression.
Second, it was predicted that South Asian Muslim Americans who were younger,
female, born in the United States, single, earning higher incomes, and possessing college
degrees or higher would feel more comfortable talking to people outside of their family
about a diagnosis of depression compared to their counterparts who were older; male;
immigrants to the United States; earning lower incomes, and not possessing an
undergraduate degree. Third, it was predicted that South Asian Muslim Americans who
were younger, female, born in the United States, single, earning higher incomes, and
possessing at least an undergraduate degree would be more likely to seek professional
care for depression, including psychotherapy and psychiatric care, when compared to
their counterparts. Neither of these hypotheses were confirmed.
Fourth, it was predicted that South Asian Muslim Americans who were younger,
female, born in the United States, single, earning higher incomes, and possessing at least
an undergraduate degree would seek professional treatment for lower severity depressive
symptoms compared to their counterparts. This hypothesis was partially confirmed;
females and those who were more educated had the most positive attitudes about seeking
professional psychological help for depression.

83
Finally it was predicted that South Asian Muslim Americans who were older,
male, immigrants to the United States, married, earning lower incomes, and not
possessing an undergraduate degree would feel that an ethnic match with their therapist
or psychiatrist was more important than their counterparts who were younger, female,
born in the United States, single, earning higher incomes, and possessing at least an
undergraduate degree. This hypothesis was also not confirmed.
The second research question examined the role acculturation plays in shaping
attitudes of South Asian Muslim Americans towards the diagnosis and treatment of
depression. It was hypothesized that South Asian Muslim Americans with higher overall
acculturation scores as measured by the ARSMA-II would be more accepting of a clinical
diagnosis of depression than their counterparts with lower overall acculturation scores. It
was also hypothesized that participants with higher overall acculturation scores would
feel more comfortable talking to people outside of their family about a diagnosis of
depression. Next, it was hypothesized that South Asian Muslim Americans with higher
overall acculturation scores would be more likely to seek professional care for
depression, including psychotherapy and psychiatric care. The aforementioned three
hypotheses were not confirmed. It was also hypothesized that South Asian Muslim
Americans with higher overall acculturation scores would seek professional treatment for
lower severity depressive symptoms. This hypothesis was confirmed. The results found
that those with higher acculturation scores had more positive attitudes toward seeking
professional psychological help for depression even when controlling for gender and age.
Finally, South Asian Muslim Americans with higher overall acculturation scores would
feel that an ethnic match with their therapist or psychiatrist was not as important as their

84
counterparts with lower overall acculturation scores. This hypothesis was not confirmed.
While more educated participants felt that ethnic match with a mental health professional
was more important than their less educated counterparts, level of acculturation was not
significantly associated with perceived importance of ethnic match.
In summary, acculturation did not appear to as strongly shape attitudes towards
the diagnosis and treatment of depression as initially predicted. These findings are in
marked contrast to studies in other immigrant populations, including Mexican-Americans
and Korean-Americans, where higher levels of acculturation (Gamst et al., 2002),
generational status (Abe-Kim et al, 2007), and possessing a Western view regarding
stress and depression (Fung and Wong, 2007), were found to be significantly associated
with positive attitudes towards mental healthcare and increased utilization of mental
health resources. However, it is important to keep in mind that the sample recruited for
this study was skewed in part due to the manner in which it was recruited. This sample
was very highly acculturated and came from a higher socioeconomic background than the
overall South Asian Muslim American population in America. Portes and Zhou (1993)
posit that assimilation into a mainstream culture is not the same for all immigrants.
Rather, socioeconomic obstacles, such as poor urban school and limited employment
opportunities, prevent certain classes of immigrants to assimilate into the mainstream
culture in the manner of other immigrants who do not face similar socioeconomic
obstacles. A large portion of the participants in this study lived in the U.S. for many
years, obtained graduate degrees, and had at least an upper middle class family income.
Therefore, it can be suggested that these participants may not have faced the same
socioeconomic obstacles of their South Asian Muslim American counterparts living in

85
poorer circumstances. Perhaps, the attitudes towards the diagnosis and treatment of
depression among these lower class Muslim Americans would be different than what was
seen in this study. Given what is known about segmented assimilation, further research is
required to better understand the attitudes towards mental health and mental healthcare
among all facets of the Sotuh Asian Muslim American community.
On the other hand, the primary findings indicated that females and educated
participants generally had the most positive attitudes towards the diagnosis and treatment
of depression. Studies have shown that females are more prone to depression than males
(Weissman and Klerman, 1985; Piccinelli and Wilkinson, 2000). This has been
attributed to numerous causes, including it being more culturally and socially acceptable
for women to endorse symptoms of depression and diagnostic instruments being more
sensitive to depressive symptoms endorsed by women (Piccinelli and Wilkinson, 2000).
Previous studies have shown that education is a protective factor against depression, with
more educated individuals being less likely to develop depression (Ross and Mirowsky,
2006). While education can reduce the stressors that may lead to depression, it can also
be argued that more educated individuals are more knowledgeable about mental health
resources and thus more likely to seek treatment for lower levels of depressive symptoms.
Therefore, it is possible that the main findings for females and education level in this
study is actually an artifact for another variable, personal history of depression. In other
words, are women and more educated participants more likely to have positive attitudes
towards the diagnosis and treatment of depression because they have personal experience
with depression?

86
To answer this question, the analyses in Research Questions 1 and 2 were rerun
adding “personal history of depression” as an independent variable. It is interesting to
note that in this sample, there was a relatively high rate of individuals who reported
having a personal history of depression (n=270, 63.2% of sample). Because the
prevalence rate is significantly higher than what is expected in the general population,
there appears to be a sampling bias in this study. Females, particularly those, with a
personal history of depression, were more likely to complete this study than other South
Asian Muslim Americans. Therefore, results should be interpreted with caution as the
sample in this study is not representative of the South Asian Muslim American
population as a whole.
When the analyses were rerun with “personal history of depression” as an
additional independent variable, it was found that more educated participants continued
to have greater acceptance of a clinical diagnosis of depression and females, educated
participants and those without a personal history of depression had the most positive
attitudes towards seeking professional psychological help. The main findings for
Research Question 2 remained the same after adding “personal history of depression” as
a control variable. Thus, personal experience with depression did not appear to shape
attitudes towards the diagnosis and treatment of depression in this sample, nor could the
findings for females and more educated participants be explained by having more
personal experience with depression. Most striking is the fact that those without a
personal history of depression appeared to have more positive attitudes towards seeking
professional psychological help. Perhaps, this is due to potentially negative experiences
of South Asian Muslim Americans who sought treatment for depression in the past. Prior

87
research has shown that when Muslim Americans seek treatment for mental illness, they
often feel misunderstood, misrepresented and stereotyped (Dwairy, 2006; Erickson & Al-
Timini, 2001; Sayed, 2003; Laird, 2007).
Limitations
While the results of this study may suggest that acculturation does not play as
significant a role in shaping attitudes towards the diagnosis and treatment of depression
as initially anticipated, there are several limitations that must be kept in mind when
considering the results of this study. Most significantly, the tool used to measure
acculturation in this study, the ARSMA-II, has not been validated for use with the South
Asian Muslim American population. Perhaps, a more refined instrument that touches
more specifically on their cultural norms and practices is required to better measure
levels of acculturation in this community. The ARSMA-II items focuses primarily on
individual activities, such as music, movies and writing. Perhaps, having more items of
an interpersonal nature would be more relevant in a community that places strong
emphasis on family and community ties (Al-Mateen and Afzal, 2004; Dwairy, 2006). In
the future, a scale that is validated to measure both acculturation and enculturation in this
population would be ideal in terms of accurately measuring how these constructs affect
attitudes towards the diagnosis and treatment of depression.
When considering these results, the manner in which subjects were recruited must
be taken into consideration. Since the study was conducted via the internet, it is possible
that the sample recruited is not representative of the South Asian Muslim American
community as a whole, as the internet is primarily used by younger and more educated
individuals. This sample appears to be a fairly acculturated sample, with a mean overall

88
acculturation score of 1.73, with a distribution range of -2.33 to 4. This suggests that
despite the potential ascertation bias, a fairly broad range of subjects with regard to
acculturation status were recruited. The distribution of acculturation scores in this
sample are similar to what has been found in studies with other immigrant groups
(Cuellar, Arnold and Maldonado, 1995).
Thus, the results cannot be generalized to the community at large; rather, they
should be used to develop a preliminary understanding of what attitudes towards the
diagnosis and treatment of depression in this community may be. Furthermore, the
results are based on responses provided by self-report. As with any self-report data, it is
quite possible that there is a discrepancy between what the subjects are stating and what
they are actually doing. Berry (2003) noted that acculturation occurs in progressive
phases, and oftentimes behaviors change to be in accordance with the main culture while
beliefs take longer to change. Therefore, while the South Asian Muslim Americans in
this sample may be reporting a certain set of attitudes towards the diagnosis and treatment
of depression, their real-life behaviors may be very different.
Future Research
This study is the first of its kind to explore the attitudes towards the diagnosis and
treatment of depression among South Asian Muslim Americans. However, as discussed
above, there are several limitations to this study. Most significantly, due to the
recruitment method used in this study, the findings cannot be generalized to the overall
South Asian Muslim American population. Future research should look to recreate this
study and use a more varied recruitment method in order to obtain a more varied and
representative sample of the South Asian Muslim American community. Special

89
consideration should be made to ensure that both genders and varying socioeconomic
backgrounds are recruited.
Furthermore, the method used to measure acculturation in this study may not have
been appropriate for this population, as discussed above. In addition, However, recent
theorists have suggested that the processes of acculturation and enculturation are two
orthogonal phenomena (Kim & Omizo, 2006). The combination of these two processes
is categorized into four statuses defined by different levels of acculturation and
enculturation: integration (high levels of acculturation and enculturation), assimilation
(high level of acculturation and low level of enculturation), separation (low level of
acculturation and high level of enculturation), and marginalization (low levels of
acculturation and enculturation) (Berry, Kim, Power, Young & Bajaki, 1989). While the
original research questions for this study focused on acculturation exclusively, further
research should be conducted to determine if enculturation played a role in attitudes
towards the diagnosis and treatment of depression among South Asian Muslim
Americans.
In addition, in order to develop an in-depth understanding, more specific
instruments that are validated to measure acculturation and enculturation in this
community are required. Collecting information from in-person interviews and
supplementing with qualitative data on personal experiences with mental health
professionals could further elaborate our understanding of how the South Asian Muslim
American community feels about mental illness and mental healthcare. While this study
has begun to explore attitudes towards the diagnosis and treatment of depression in the
South Asian Muslim American community, much is left to be understood.

90
References
Abe-Kim, J., Takeuchi, D.T., Hong, S., Zane, N., Sue, S., Spencer, M.S. et al. (2007).
Use of mental health-related services among immigrant and US-Born Asian Americans: Results from the National Latino and Asian American study. American Journal of Mental Health, 97(1), 91-98.
Al-Krenawi, A & Graham, J.R. (2003). Multicultural social work in Canada. Canada:
Oxford University Press Canada. Al-Mateen, C.S. & Afzal, A. (2004). The Muslim child, adolescent, and family. Child
Adolescent Psychiatric Clinics of North America, 13, 183-200. Ali, O.M., Milstein, G., & Marzuk, P.M. (2005). The Imam’s role in meeting the
counseling needs of Muslim communities in the United States. Psychiatric Services, 56, 202-205.
Bacon, J. (1996). Lifelines; Community, family and assimilation among Asian Indian
immigrants. Oxford: Oxford University Press. Baron, A.E., Manson, S.M., & Ackerson, L.M. (1990). Depressive symptomatology in
older American Indians with chronic disease: Some psychometric considerations. In C. Attkinsson & J. Zich (Eds.) Screening for depression in primary care (pp. 217-231). New York: Routledge.
Bernstein, K.S. (2007). Mental health issues among urban Korean American immigrants.
Journal of Transcultural Nursing, 18(2), 175-180. Berry, J.W. (2003). Conceptual approaches to acculturation. In K.M. Chun, P.B.
Organista, G. Marín (Eds.), Acculturation: Advances in Theory, Measurement and Applied Research (pp. 17-37). Washington, DC: American Psychological Association.
Berry, J.W., Kim, U., Power, S., Young, M., & Bajaki, M. (1989). Acculturation
attitudes in plural societies. Applied Psychology: An International Review, 38, 185-206.
Bhugra, D. & Mastrogianni, A. (2004). Globalisation and mental disorders—Overview
with relation to depression. British Journal of Psychiatry, 184, 10-20. Cabassa, L.J. & Zayas, L.H. (2007). Latino immigrants’ intention to seek depression
care. American Journal of Orthopsychiatry, 77(2), 231-242.

91
Campos, B., Schetter, C.D., Walsh, J.A., & Schenker, M. (2007). Sharpening the focus on acculturative change: ARSMA-II, stress, pregnancy anxiety, and infant birthweight in recently immigrated Latinas. Hispanic Journal of Behavioral Sciences, 29, 209-224.
Chiriboga, D.A., Jang, Y., Banks, S., & Kim, G. (2007) Acculturation and its effects on
depressive symptom structure in a sample of Mexican American elders. Hispanic Journal of Behavioral Sciences, 29(1), 83-100.
Cuéllar, I., Arnold, B., & Maldonado, R. (1995). Acculturation rating scale for Mexican
Americans-II: A revision of the original ARSMA scale. Hispanic Journal of Behavioral Sciences, 17(3), 275-304.
Das, A., & Kemp, S. (1997). Between two worlds: Counseling South Asian Americans.
Journal of Multicultural Counseling and Development, 25(1), 23-34. Douki, S., Zineb, S.B., Nacef, F., & Halbreich, U. (2007). Women’s mental health in the
Muslim world: Cultural, religious, and social issues. Journal of Affective Disorders, 102, 177-189.
Dubovsky, S. (1983). Psychiatry in Saudi Arabia. American Journal of Psychiatry, 140,
1455-1459. Dwairy, M.A. (2006). Counseling and psychotherapy with Arabs and Muslims: A
culturally sensitive approach. New York: Teachers College Press. Dyson (2004). Is the individualism-collectivism dichotomy a credible measure of
cultural beliefs? In B.L. Hall & M. del Carmen Rodriguez de France (Eds.), Learning and the world we want—Intersecting conversations on education, culture and community (pp. 61-67). Victoria, Canada: University of Victoria Press.
Erickson, C., & Al-Timimi, N. (2001). Providing mental health services to Arab
Americans: Recommendations and considerations. Cultural Diversity and Ethnic Minority Psychology, 72(24), 308-327.
Escobar, J.I., Nervi, C.H., & Gara, M.A. (2000). Immigration and mental health:
Mexican Americans in the United States. Harvard Review of Psychiatry, 8(2), 64-72.
Farooqi, Y.N. (2006). Understanding Islamic perspective of mental health and
psychotherapy. Journal of Psychology in Africa, 1, 101-111.

92
Farver, J.M., Narang, S.K., & Bhadha, B.R. (2002). East meets west: Ethnic identity, acculturation, and conflict in Asian Indian families. Journal of Family Psychology, 16, 338-350.
Fischer, E.H., & Farina, A. (1995). Attitudes toward seeking professional psychological
help—A shortened form and considerations for research. Journal of College Student Development, 36(4), 368-373.
Fischer, E.H., & Turner, J.L. (1970). Orientations to seeking professional help:
Development and research utility of an attitude scale. Jorunal of Consulting and Clinical Psychology, 35(1), 79-90.
Fisher, M. (1980). The Indians of New York City. Delhi: Heritage Publishers. Fung, K. & Wong, Y.R. (2007). Factors influencing attitudes towards seeking
professional help among East and Southeast Asian immigrant and refugee women. International Journal of Social Psychiatry, 53(3), 216-231.
Gamst, G., Dana, R.H., Der-Karabetian, A., Aragon, M., Arellano, L.M., & Kramer, T.
(2002) Effects of Latino acculturation and ethnic identity on mental health outcomes. Hispanic Journal of Behavioral Sciences, 24(4), 479-504.
Ganatra, H.A., Zafar, S.N., Qidwai, W., & Rozi, S. (2008). Prevalence and predictors of
depression among an elderly population of Pakistan. Aging Mental Health, 12(3), 349-356.
Garcia, M. & Marks, G. (1989). Depressed symptomatology among Mexican-American
adults: An examination of the CES-D scale. Psychiatry Research, 27, 137-148. Gonzales, H., Haan, M.N., & Hinton, L. (2001). Acculturation and the prevalence of
depression in older Mexican Americans: Baseline results of the Sacramento area Latino study on aging. Journal of American Geriatric Society, 49, 948-953.
Graves, T.D. (1967). Psychological acculturation in a tri-ethnic community.
Southwestern Journal of Anthropology, 23, 337-350. Greenfield, P.M. & Cocking, R.R. (1994). Cross-cultural roots of minority child
development. Hillsdale, NJ: Erlbaum. Guarnaccia, P.J.; Good, B.J.; & Kleinman, A. (1990). A critical review of
epidemiological studies of Puerto Rican mental health. American Journal of Psychiatry, 147, 1449-1456.

93
Halbreich U., Alarcon, R.D., Calil, H., Douki, S., Gaszner, P., Jadresic, E., et al. (2007). Culturally-sensitive complaints of depressions and anxieties in women. Journal of Affective Disorders, 102, 159-176.
Haniff, G.M. (2003). The Muslim community in America: A brief profile. Jorunal of
Muslim Minority Affairs, 23(2), 303-311. Haque, A. (2004). Religion and mental health: The case of American Muslims. Journal
of Religion and Health, 43(1), 45-58. Helweg, A. & Helweg, U. (1990). An immigrant success story: East Insians in America.
Philadelphia: University of Pennsylvania Press. Hovey, J.D. (2000). Acculturative stress, depression and suicidal ideation among Central
American immigrants. Suicide and life-threatening behavior, 30(2), 125-139. Institute of Islamic Information and Education (2005). Muslim population statistics.
Retrieved April 6, 2008, from http://www.iiie.net/node/65. Jensen, J.M. (1988). Passage from India: Asian Indian immigrants in North America.
New Haven: Yale University Press. Johnson, S.A. (1991). Political activity of Muslims in America. In Y. Haddad (Ed.), The
Muslims of America. Oxford, UK: Oxford University Press. Kelly, Jr., E.W. & Aridi, A. Muslims in the United States: An exploratory study of
universal and mental health values. Counseling and Values, 40(3), 206-214. Khan, Z. (2006). Attitudes towards counseling and alternative support among Muslims
in Toledo, Ohio. Journal of Muslim Mental Health, 1, 21-42. Kim, B.S.K. & Abreu, J.M. (2001). Acculturation measurement: Theory, current
instruments, and future directions. In J.G. Ponterotto, J.M. Casas, L.A. Suzuki, & C.M. Alexander (Eds.), Handbook of multicultural counseling (2nd ed., pp. 394-424). Thousand Oaks, CA: Sage.
Kim, B.S. & Omizo, M.M. (2006). Behavioral acculturation and enculturation and
psychological functioning among Asian American college students. Cultural Diversity and Ethnic Minority Psychology, 12(2), 245-258.
Kuo, W. (1984). Prevalence of depression among Asian Americans. Journal of Nervous
and Mental Disease, 172, 449-457.

94
Laird, L.D., Amer, M.M., Barnett, E.D., & Barnes, L.L. (2007). Muslim patients and health disparities in the UK and the US. Archives of Disease in Childhood, 92, 922-926.
Lee, R.M., Choe, J., Kim, G., & Ngo, V. (2000). Construction of the Asian American
family conflicts scale. Journal of Counseling Psychology, 47(2), 211-222. Lee, R.M., Yoon, E., & Liu-Tom, H.T. (2006). Structure and measurement of
acculturation/enculturation for Asian Americans using the ARSMA-II. Measurement and Evaluation in Counseling and Development, 39, 42-54.
Loewenthal, K.M., Cinnirella, M., Evdoka, G. & Murphy, P. Faith conquers all? Beliefs
about the role of religious factors in coping with depression among different cultural-religious groups in the UK. British Journal of Medical Psychology, 74, 293-303.
Manson, S.M.; Ackerson, L.M.; & Dick, R.W. (1990). Depressive symptoms among
American Indian adolescents: Psychometric characteristics of the Center for Epidemiologic Studies Depression Scale (CES-D). Psychological Assessment, 2, 231-237.
Maselko, J. & Patel, V. (2008). Why women attempt suicide: the role of mental illness
and social disadvantage in a community cohort study in India. Journal of Epidemiological Community Health, 62(9), 817-822.
Messent, P. (1992). Working with Bangladeshi families in the East End of London.
Journtal of Family Therapy, 14, 287-304. Mirza, I., & Jenkins, R. (2004). Risk factors, prevalence and treatment of anxiety and
depressive disorders in Pakistan: a systematic review. British Medical Journal, 328, 794.
Mohammad-Arif, A. (2002). Salaam America—South Asian Muslims in New York. New
York: Anthem Press. Numan, F. (1992, December). A brief statement: The Muslim population in the United
States. American Muslim Council. www.islam101.com/history/population2_usa.html.
Parkar, S.R., Dawani, V., & Weiss, M.G. (2008). Gender, suicide and the sociocultural
context of deliberate self-harm in an urban general hospital in Mumbia, India. Cult Med Psychiatry, Sep. 19, E-pub ahead of print.

95
Patel, V., Kirkwood, B.R., Pednekar, S., Pereira, B., Barros P., Fernandes J., et al. (2006). Gender disadvantage and reproductive health risk factors for common mental disorders in women. Archives of General Psychiatry, 63, 404-413.
Patel, V., Rodrigues, M., DeSouza, N. (2002). Gender, poverty and postnatal depression:
A study of mothers in Goa, India. American Journal of Psychiatry, 159, 43-47. Pereira, B., Andrew, G., Pednekar, S., Pai, R., Pelto, P. & Patel, V. (2007). The
explanatory models of depression in low income countries: Listening to women in India. Journal of Affective Disorders, 102, 209-218.
Phinney, J.S. (1996). The multigroup ethnic identity measure: A new scale for use with
diverse groups. Journal of Adolescent Research 7(2): 156-176. Piccinelli, M. & Wilkinson, G. (2000). Gender differences in depression. British
Journal of Psychiatry, 177, 486-492. Pillai, A., Andrews, T. & Patel, V. (2008). Violence, psychological distress and the risk
of suicidal behavior in young people in India. International Journal of Epidemiology, Aug. 28, E-pub ahead of print.
Pillai, A., Patel, V., Cardozo, P., Goodman R, Weiss, H.A., & Andrew, G. (2008). Non-
traditional lifestyles and prevalence of mental disorders in adolescents in Goa, India. British Journal of Psychiatry, 192(1), 45-51.
Portes, A., & Zhou, M. (1993). The new second generation: segmented assimilation and
its variants. The Annals of the American Academy of Political and Social Science, 530, 74-96.
Randhawa, G. & Stein, S. (2007). An exploratory study examining attitudes towards
mental health and mental health services among young South Asians in the United Kingdom. Journal of Muslim Mental Health, 2, 21-37.
Redfield R., Linton R., Herskovits M.J. (1936). Memorandum for the study of
acculturation. American Anthropologist, 38(1), 149-152. Ross, C.E. & Murowsky, J. (2006). Sex differences in the effect of education on
depression: Resource multiplication or resource substitution? Social Science & Medicine, 63, 1400-1413.
Sam, D. L., Vedder, P., Ward, C., & Hoarenczyk, G. (2006). Psychological and
sociocultural adaptation of immigrant youth. In J. W. Berry, J. S. Phinney, D. L. Sam, & P. Vedder (Eds.), Immigrant youth in cultural transition: Acculturation, identity and adaptation across national contexts (pp. 117-141). London: Lawrence Erlbaum.

96
Sayed, M.A. (2003). Psychotherapy of Arab patients in the West: Uniqueness, empathy and “otherness”. American Journal of Psychotherapy, 57(4), 445-459.
Shen, B-J & Takeuchi, D.T. (2001). A structural model of acculturation and mental
health status among Chinese Americans. American Journal of Community Psychology, 29(3), 387-418.
Stone, C.L. (1991). Estimate of Muslims living in American. In Y. Haddad (Ed.), The
Muslims of America. Oxford, UK: Oxford University Press. Syed, E.U. & Khan, M.M. (2008). Pattern of deliberate self-harm in young people in
Karachi, Pakistan. Crisis, 29(3), 159-163. Thakker, J. & Ward, T. (1998). Culture and classification: the cross-cultural application
of the DSM-IV. Clinical Psychology Review, 18(5), 501-529. Trivedi, J.K., Mishra, M., & Kendurkan, A. (2007). Depression among women in the
South-Asian region: The underlying issues. Journal of Affective Disorders, 102, 219-255.
Uba, L. (1994) Asian Americans: Personality patterns, identity, and mental health. New
York: Guilford Press. Ustun, T.B., Ayuso-Mateos, J.L., Chatterji, S., Mathers, C., & Murray, J.L. (2004).
Global burden of depressive disorders in the year 2000. The British Journal of Psychiatry, 184, 386-392.
Weissman, M.M. & Klerman, G.L. (1985). Gender and depression. Trends in
Neurosciences, 8, 416-420. Wilgoren, J. (2001, October 22). Islam attracts converts by the thousands, drawn before
and after attacks. New York Times. Retrieved April 24, 2005, from http://www.nytimes.com.
Wittchen, H. (1994). Reliability and validity studies of the WHO—Composite
International Diagnostic Interview (CIDI): a critical review. Journal of Psychiatric Research, 28(1), 57-84.
Yeh, C.J. (2003). Age, acculturation, cultural adjustment, and mental health symptoms
of Chinese, Korean and Japanese immigrant youths. Cultural Diversity and Ethnic Minority Psychology, 9(1), 34-48.
Ying, Y. (1988). Depressive symptomatology among Chinese-Americans as measured
by the CES-D. Journal of Clinical Psychology, 44, 739-746.

97
Appendix A Informed Consent
Description of Research:
You are invited to participate in a research study on your beliefs and attitudes towards
mental health issues. The types of questions that you will be asked pertain to attitudes,
social behavior, cultural beliefs and practices that may influence your feelings towards
emotional problems. You will be asked to complete a web-based survey for this study.
Risks and Benefits:
Risks associated with participation in this study include potential emotional discomfort
when thinking about emotional problems that you or someone you know may have faced.
You may regard a question as personal or difficult to answer. If this is the case, feel free
to skip over that question and try to continue. If you feel too uncomfortable, you do not
have to continue and the survey will come to an end. You are free to skip over any
questions and end the survey process at any time without any negative consequences.
You may also contact the principal investigator directly for appropriate referrals if you
continue to feel upset. The principal investigator, Sadia Chaudhury, may be reached by
phone at 347-233-2364 or via e-mail at [email protected]. There are no direct benefits for
research subjects. However, the findings of this study may eventually lead to greater
understanding about how different communities cope with emotional problems.
Data Storage to Protect Confidentiality:
Information collected in this study will be kept strictly confidential. All participants will
be assigned a coded ID number and no identifying information will be collected.

98
Electronic data will be stored on a password-protected computer, identified by the coded
ID number only. No personal data will be recorded. Only the Principal Investigator and
Faculty Sponsor will have access to the research material.
Time Involvement:
The web-based survey will take approximately 20-30 minutes to complete.
How Will Results Be Used:
This study is being completed for the Principal Investigator’s dissertation research. It is
the Principal Investigator’s hope that results may one day be published in an academic
journal, or be presented at research meetings and national conferences. No confidential
information will be used in these publications. The results of the study will be used to
inform healthcare providers about potential barriers that may prevent certain communities
from seeking help for emotional problems.
PARTICIPANT'S RIGHTS
Principal Investigator: Sadia R. Chaudhury, M.S.
Research Title: The Muslim Health Care Project
I have read and discussed the Research Description with the researcher. I have had the
opportunity to ask questions about the purposes and procedures regarding this study.
• My participation in research is voluntary. I may refuse to participate or
withdraw from participation at any time without jeopardy to future medical
care, employment, student status or other entitlements.

99
• The researcher may withdraw me from the research at his/her professional
discretion.
• If, during the course of the study, significant new information that has been
developed becomes available which may relate to my willingness to continue to
participate, the investigator will provide this information to me.
• Any information derived from the research project that personally identifies me
will not be voluntarily released or disclosed without my separate consent,
except as specifically required by law.
• If at any time I have any questions regarding the research or my participation, I
can contact the investigator, who will answer my questions. The investigator's
phone number is (347)233-2364 and e-mail address is
• If at any time I have comments, or concerns regarding the conduct of the
research or questions about my rights as a research subject, I should contact the
Teachers College, Columbia University Institutional Review Board.
Please choose one of the following:
I have read this page, and I would like to take the web-based survey.
(Please proceed to the next page).
I have read this page, and I would NOT like to take the web-based survey.
(Please exit survey).

100
Appendix B—
Questionnaire for the South Asian Muslim American Depression Study

101
I. Clinical Vignettes
a. Please read the following vignette and answer the questions that follow.
Fatima is a female who is in your circle of peers (of the same age, ethnic and religious
background). Since completing her undergraduate degree, she has been working at a
large corporate firm. Her grandmother, with whom she was very close, passed away a
year ago. Since then, Fatima has been unable to complete her chores or do anything
around the house when she is not at work. When she comes home from work, she goes
straight to bed complaining that she does not have the energy to do anything. She has
frequent crying spells and is noticeably more emotional than usual. She also stays in bed
all weekend, complaining that though she sleeps more than usual she feels tired, does not
have any energy, and does not want to do anything. She finds herself blaming herself for
things both big and small. While Fatima used to be a very social girl, for the past several
months, she has spent all of her spare time at home either watching television or eating
junk food. She feels insecure and worthless, and often feels that there is no point to her
life. Her appetite has increased significantly during the past year, and she has gained at
least 25 pounds in the past six months. While she continues to go to work and complete
her assignments on time, she has isolated herself from her family and peers for the past
year.
1. What do you think is wrong with Fatima?
________________________________________________________________________
________________________________________________________________________
________________________________________________________________________

102
1= Strongly Disagree; 2=Somewhat Disagree; 3=Somewhat Agree; 4=Strongly Agree 2. Fatima’s general practitioner diagnosed her with depression. How strongly do you agree with this diagnosis?
1 2 3 4
3. Fatima obtained a second opinion from a mental health professional, who also diagnosed her with depression. How strongly do you agree with this diagnosis?
1 2 3 4
4. Fatima decided that she would like to get help for her depression. How strongly would you recommend the following interventions?
a. Fatima should consult with her physician (general practitioner).
1 2 3 4
b. Fatima should talk to her family. 1 2 3 4 c. Fatima should reconnect with her friends. 1 2 3 4 d. Fatima should consult with her imam or another local religious elder.
1 2 3 4
e. Fatima should pray to Allah. 1 2 3 4 f. Fatima should seek the help of a counselor or a psychotherapist.
1 2 3 4
g. Fatima should consult with a psychiatrist. 1 2 3 4 h. Fatima should take antidepressants. 1 2 3 4 i. Fatima should use holistic treatments. 1 2 3 4 j. Fatima should be admitted to a psychiatric hospital. 1 2 3 4
1= Highly Ineffective; 2=Somewhat Ineffective; 3=Somewhat Effective; 4=Highly Effective 1. How effective do you think the following interventions
would be in alleviating her depression?
a. Consulting with her physician (general practitioner). 1 2 3 4 b. Talking with her family. 1 2 3 4 c. Reconnecting with her friends. 1 2 3 4 d. Consulting with her imam or another local religious elder. 1 2 3 4 e. Praying to Allah. 1 2 3 4 f. Seeing a counselor or a therapist for talk therapy. 1 2 3 4 g. Seeing a counselor/therapist of the same ethnic/religious background.
1 2 3 4
h. Seeing a psychiatrist for medication. 1 2 3 4 i. Seeing a psychiatrist of the same ethnic/religious background.
1 2 3 4
j. Taking antidepressants. 1 2 3 4 k. Using holistic treatments. 1 2 3 4 l. Being admitted to a psychiatric hospital. 1 2 3 4

103
b. Please read the following vignette and answer the questions that follow.
Mohammed is a male who is in your circle of peers (of the same age, ethnic and religious
background). For the past several years, Mohammed has been running a family-owned
grocery store. Because of poor sales, the store shut down six months ago and
Mohammed has not been able to find a new source of income to provide for wife and
three children. He feels hopeless about his job prospects and feels that he is not living up
to his responsibilities as the man of the household. He has been extremely irritable with
those around him, and has been getting into repeated arguments with his wife. He has
also been yelling at his children much more frequently. He feels no motivation to look
for a job and has lost interest in his favorite activities, including walking in the park and
reading the Qur’an. He also finds that he does not have the energy to pray, and has been
skipping his daily prayers. He goes to bed earlier than usual, and also takes frequent naps
throughout the day. Though he does not enjoy his food, he finds himself eating a lot
more than usual. He begins to feel very hopeless when thinking of the future and feels
guilty about his inability to provide for his family. Mohammed feels that his situation
will not change and that things will not get better for him or his family. More recently,
he been thinking a lot about death and considering whether things would be better if he
were not alive. He has had thoughts of taking his own life, but has not acted on these
thoughts. He feels, however, that if things do not improve, he may seriously consider
killing himself.
1. What do you think is wrong with Mohammed?
________________________________________________________________________
________________________________________________________________________

104
1= Strongly Disagree; 2=Somewhat Disagree; 3=Somewhat Agree; 4=Strongly Agree 2. Mohammed’s general practitioner diagnosed him with depression. How strongly do you agree with this diagnosis?
1 2 3 4
3. Mohammed obtained a second opinion from a mental health professional, who also diagnosed him with depression. How strongly do you agree with this diagnosis?
1 2 3 4
4. Mohammed decided that he would like to get help for his depression. How strongly would you recommend the following interventions?
a. Mohammed should consult with his physician (general practitioner).
1 2 3 4
b. Mohammed should talk to his family. 1 2 3 4 c. Mohammed should reconnect with his friends. 1 2 3 4 d. Mohammed should consult with his imam/local religious elder.
1 2 3 4
e. Mohammed should pray to Allah. 1 2 3 4 f. Mohammed should seek the help of a counselor or a psychotherapist.
1 2 3 4
g. Mohammed should consult with a psychiatrist. 1 2 3 4 h. Mohammed should take antidepressants. 1 2 3 4 i. Mohammed should use holistic treatments. 1 2 3 4 j. Mohammed should be admitted to a psychiatric hospital. 1 2 3 4
1= Highly Ineffective; 2=Somewhat Ineffective; 3=Somewhat Effective; 4=Highly Effective 1. How effective do you think the following interventions
would be in alleviating his depression?
a. Consulting with his physician (general practitioner). 1 2 3 4 b. Talking with his family. 1 2 3 4 c. Reconnecting with his friends. 1 2 3 4 d. Consulting with his imam/local religious elder. 1 2 3 4 e. Praying to Allah. 1 2 3 4 f. Seeing a counselor or a therapist for talk therapy. 1 2 3 4 g. Seeing a counselor/therapist of the same ethnic/religious background.
1 2 3 4
h. Seeing a psychiatrist for medication. 1 2 3 4 i. Seeing a psychiatrist of the same ethnic/religious background.
1 2 3 4
j. Taking antidepressants. 1 2 3 4 k. Using holistic treatments. 1 2 3 4 l. Being admitted to a psychiatric hospital. 1 2 3 4

105
II. Emotional History
1. Have you ever suspected that you may have been depressed? ____ Yes ______No
2. Have your family members ever suggested that you may have been depressed?
__ Yes __No
3. Has a professional ever diagnosed you with depression? ___ Yes ___ No
4. If you have a history of depression, what did you do to help you feel better?
________________________________________________________________________
________________________________________________________________________
________________________________________________________________________
5. Have you ever sought therapy with a counselor or therapist for depression?
___ Yes ___ No
5a. If yes, did you feel that it was important for the therapist to be of the same
ethnic background as yourself? ___ Yes ___ No
5b. If yes, did you feel that it was important for the therapist to be of the same
religious background as yourself? ___ Yes ___ No
6. Have you ever seen a psychiatrist for depression? ___ Yes ___ No
6a. If yes, did you feel that it was important for the psychiatrist to be of the same
ethnic background as yourself? ___ Yes ___ No
6b. If yes, did you feel that it was important for the psychiatrist to be of the same
religious background as yourself? ___ Yes ___ No

106
Attitudes Towards Seeking Professional Psychological Help Scale
Please identify how strongly you identify with the following statements. 0= Disagree; 1=Partly Disagree; 2=Partly Agree; 3= Agree
1. If I believed I was having a mental breakdown, my first inclination would be to get professional attention.
0 1 2 3
2. The idea of talking about problems with a psychologist strikes me as a poor way to get rid of emotional conflicts.
0 1 2 3
3. If I were experiencing a serious emotional crisis at this point in my life, I would be confident that I could find relief in psychotherapy.
0 1 2 3
4. There is something admirable in the attitude of a person who is willing to cope with his or her conflicts without resorting to professional help.
0 1 2 3
5. I would want to get psychological help if I were worried or upset for a long period of time.
0 1 2 3
6. I might want to have psychological counseling in the future. 0 1 2 3 7. A person with an emotional problem is not likely to solve it alone; he or she is likely to solve it with professional help.
0 1 2 3
8. Considering the time and expense involved in psychotherapy, it would have doubtful value for a person like me.
0 1 2 3
9. A person should work out his or her own problems; getting psychological counseling would be a last resort.
0 1 2 3
10. Personal and emotional troubles, like many things, tend to work out by themselves.
0 1 2 3
Note: Adapted from Fischer, E.H., & Farina, A. (1995). Attitudes toward seeking professional psychological help—A shortened form and considerations for research. Journal of College Student Development, 36(4), 368-373.

107
Religious Identity 1. How religious do you consider yourself to be?
a. Very religious b. Moderately religious c. Slightly religious d. Not religious at all
2. How often do you read the Quran or other religious literature? a. Daily or almost daily b. Several times per week c. A couple of times per week d. Several times per month e. A couple of times per month f. Several times per year g. A couple of times per year h. Hardly ever or never
3. On average, how often do you pray daily? a. Five times a day b. 3-4 times a day c. 1-2 times a day d. Almost never e. Never
4. During Ramadan, I fast: a. The entire month b. More than half the month c. Approximately half the month d. Less than half the month e. A few days at most f. Not at all
5. I consult a religious leader (imam) for advice a. More than once a day b. Once a day c. A few times a week d. Once a week e. A few times a month f. Once a month g. Less than once a month h. Never

108
Revised Acculturation Scale for Mexican Americans—Short Version (ARSMA-II-SV)
In the following statements, “South Asian” refers to people whose ancestry is from India,
Pakistan, or Bangladesh.
[Circle a number between 1-5 next to each item that best applies.] 1= Not at all; 2= Not very often; 3= Moderately; 4= Very often; 5= Almost always 1. I speak a South Asian language. 1 2 3 4 5 2. I speak English. 1 2 3 4 5 3. I enjoy speaking a South Asian language. 1 2 3 4 5 4. I associate with Caucasians. 1 2 3 4 5 5. I enjoy listening to English music. 1 2 3 4 5 6. I enjoy South Asian TV. 1 2 3 4 5 7. I enjoy South Asian movies. 1 2 3 4 5 8. I enjoy reading South Asian books. 1 2 3 4 5 9. I write letters in English. 1 2 3 4 5 10. I think in English. 1 2 3 4 5 11. I think in a South Asian language. 1 2 3 4 5 12. My friends are Caucasian. 1 2 3 4 5
Note: Adapted from Campos, B., Schetter, C.D., Walsh, J.A., & Schenker, M. (2007). Sharpening the focus on acculturative change: ARSMA-II, stress, pregnancy anxiety, and infant birthweight in recently immigrated Latinas. Hispanic Journal of Behavioral Sciences, 29, 209-224.

109
VI. Demographic Information 1. What is your gender? ____ Male ____ Female
2. What is your age? _________
3. What is your marital status?
___ Single (Never Married) ___ Married __ Separated __ Divorced ___ Widowed
4. In what country were you born? ___________________________
5. Where are your ancestors from? ________________________
6. If you were not born in the U.S., how many years have you lived in the U.S.? _______
7. Are you currently a student? ______ Yes ______No
8. What is the highest level of education you have completed?
_____ High-school ____ Undergraduate Degree _____ Graduate Degree
9. Are you currently employed? ______ Yes ______No
10. What is your annual household income?
_____ Less than $75,000 _____ Greater than or equal to $75,000

110
Appendix C
Model for ARSMA-II-SV Confirmatory Factor Analysis
Figure C1. Confirmatory factor model for ARSMA-II-SV items.

111
Appendix D Items for Each Dependent Variable Composite Score
A. Acceptance of a clinical diagnosis of depression (4 items)
1. Fatima- General Practitioner diagnosed her with depression
2. Fatima- Mental health professional diagnosed her with depression
3. Mohammed- General Practitioner diagnosed her with depression
4. Mohammed- Mental health professional diagnosed her with depression
B. Comfort level talking to people outside of their family about depression (6 items)
1. Fatima should go to her physician
2. Fatima should get help from her friends
3. Fatima should consult with an imam
4. Mohammed should go to his physician
5. Mohammed should get help from his friends
6. Mohammed should consult with an imam
C. Likelihood of seeking professional care for depression (4 items)
1. Fatima should seek the help of a counselor/therapist
2. Fatima should see a psychiatrist
3. Mohammed should seek the help of a counselor/therapist
4. Mohammed should see a psychiatrist
D. Attitudes toward Professional Psychological Help scale (10 items)
1. If I believed I was having a mental breakdown, my first inclination would be to
get professional attention.

112
2. The idea of talking about problems with a psychologist strikes me as a poor way
to get rid of emotional conflicts.
3. If I were experiencing a serious emotional crisis at this point in my life, I would
be confident that I could find relief in psychotherapy.
4. There is something admirable in the attitude of a person who is willing to cope
with his or her conflicts without resorting to professional help.
5. I would want to get psychological help if I were worried or upset for a long period
of time.
6. I might want to have psychological counseling in the future.
7. A person with an emotional problem is not likely to solve it alone; he or she is
likely to solve it with professional help.
8. Considering the time and expense involved in psychotherapy, it would have
doubtful value for a person like me.
9. A person should work out his or her own problems; getting psychological
counseling would be a last resort.
10. Personal and emotional troubles, like many things, tend to work out by
themselves.
E. Importance of ethnic match with mental health provider (4 items)
1. Fatima- How effective is seeing a therapist of the same ethnicity?
2. Fatima-How effective is seeing a psychiatrist of the same ethnicity?
3. Mohammed- How effective is seeing a therapist of the same ethnicity?
4. Mohammed- How effective is seeing a psychiatrist of the same ethnicity?

113