Attachments to O-Recirculated-1, Ellen Van Dyke
372
Attachments to O‐Recirculated‐1, Ellen Van Dyke
-
Upload
khangminh22 -
Category
Documents
-
view
0 -
download
0
Transcript of Attachments to O-Recirculated-1, Ellen Van Dyke

Attachments to O‐Recirculated‐1, Ellen Van Dyke

Assembly Bill No. 1739
CHAPTER 347
An act to amend Sections 65352 and 65352.5 of, and to add Section 65350.5 to, the Government Code, and to amend Sections 348, 1120, 1552,1831, 10721, 10726.4, and 10726.8 of, to add Sections 1529.5 and 10726.9 to, to add Part 5.2 (commencing with Section 5200) to Division 2 of,and to add Chapter 7 (commencing with Section 10729), Chapter 8 (commencing with Section 10730), Chapter 9 (commencing with Section10732), Chapter 10 (commencing with Section 10733), and Chapter 11 (commencing with Section 10735) to Part 2.74 of Division 6 of, the WaterCode, relating to groundwater.
[ Approved by Governor September 16, 2014. Filed with Secretary of
State September 16, 2014. ]
LEGISLATIVE COUNSEL'S DIGEST
AB 1739, Dickinson. Groundwater management.
(1) Existing law authorizes local agencies to adopt and implement a groundwater management plan. Existing law requires agroundwater management plan to contain specified components and requires a local agency seeking state funds administered bythe Department of Water Resources for groundwater projects or groundwater quality projects to do certain things, including, butnot limited to, preparing and implementing a groundwater management plan that includes basin management objectives for thegroundwater basin.
This bill would provide specific authority to a groundwater sustainability agency, as defined in SB 1168 of the 2013–14 RegularSession, to impose certain fees. The bill would authorize the department or a groundwater sustainability agency to providetechnical assistance to entities that extract or use groundwater to promote water conservation and protect groundwater resources.This bill would require the department, by January 1, 2017, to publish on its Internet Web site best management practices for thesustainable management of groundwater, and would require the department to prepare and release a report by December 31,2016, on the department’s best estimate of water available for replenishment of groundwater in the state.
This bill would require a groundwater sustainability agency to submit a groundwater sustainability plan to the department forreview upon adoption. This bill would require the department to periodically review groundwater sustainability plans, and byJune 1, 2016, would require the department to adopt certain regulations. This bill would authorize a local agency to submit to thedepartment for evaluation and assessment an alternative that the local agency believes satisfies the objectives of these provisions.This bill would require the department to review any of the above-described submissions at least every 5 years after initialsubmission to the department.
This bill would authorize the board to conduct inspections and would authorize the board to obtain an inspection warrant.Because the willful refusal of an inspection lawfully authorized by an inspection warrant is a misdemeanor, this bill wouldimpose a state-mandated local program by expanding the application of a crime.
This bill would authorize the board to designate a basin as a probationary basin if the board makes a certain determination. Thisbill would authorize the board to develop an interim plan for a probationary basin if the board, in consultation with thedepartment, determines that a local agency has not remedied a deficiency that resulted in designating the basin as a probationarybasin within a certain timeframe. This bill would authorize the board to adopt an interim plan for a probationary basin after notice

and a public hearing and would require state entities to comply with an interim plan. This bill would specifically authorize theboard to rescind all or a portion of an interim plan if the board determines at the request of specified petitioners that agroundwater sustainability plan or adjudication action is adequate to eliminate the condition of long-term overdraft or conditionwhere groundwater extractions result in significant depletions of interconnected surface waters. This bill would provide that theboard has authority to stay its proceedings relating to an interim plan or to rescind or amend an interim plan based on the progressmade by a groundwater sustainability agency or in an adjudication action.
(2) Existing law establishes the Water Rights Fund, which consists of various fees and penalties. The moneys in the Water RightsFund are available, upon appropriation by the Legislature, for, among other things, the administration of the State WaterResource Control Board’s water rights program.
This bill would provide that the moneys in the Water Rights Fund are available for expenditure, upon appropriation by theLegislature, for the purpose of state board enforcement of the provisions of this bill. This bill would require the board to adopt aschedule of fees in an amount sufficient to recover all costs incurred and expended from the Water Rights Fund by the board forthis bill.
Under existing law, a person who violates a cease and desist order of the board may be liable in an amount not to exceed $1,000for each day in which the violation occurs. Revenue generated from these penalties is deposited in the Water Rights Fund.
This bill would authorize the board to issue a cease and desist order in response to a violation or threatened violation of anydecision or order of the board or any extraction restriction, limitation, order, or regulation adopted or issued under the provisionsof this bill.
(3) Existing law, with certain exceptions, requires each person who diverts water after December 31, 1965, to file with the StateWater Resources Control Board a prescribed statement of diversion and use. Existing law subjects a person to civil liability if thatperson fails to file, as required, a diversion and use statement for a diversion or use that occurs after January 1, 2009, tamperswith any measuring device, or makes a material misstatement in connection with the filing of a diversion or use statement.Existing law provides that the making of any willful misstatement in connection with these provisions is a misdemeanorpunishable as prescribed.
This bill would establish groundwater reporting requirements for a person extracting groundwater in an area within a basin that isnot within the management area of a groundwater sustainability agency or a probationary basin. The bill would require thereports to be submitted to the board or, in certain areas, to an entity designated as a local agency by the board, as specified. Thisbill would require each report to be accompanied by a specified fee. This bill would apply the above-described criminal and civilliability provisions to a report or measuring device required by this reporting requirement. By expanding the definition of acrime, this bill would impose a state-mandated local program.
Existing law authorizes the board or the Department of Water Resources to adopt emergency regulations providing for the filingof reports of water diversion or use that are required to be filed.
This bill would authorize the board or the department to adopt emergency regulations providing for the filing of reports of waterextraction.
(4) Existing law requires the legislative body of each county and city to adopt a comprehensive, long-term general plan for thephysical development of the county or city with specified elements, including, among others, land use and conservation elements.Existing law requires a city or county, upon the adoption or revision of its general plan, on or after January 1, 1996, to utilize as asource document any urban water management plan submitted to the city or county by a water agency.
This bill would require, prior to the adoption or any substantial amendment of a general plan, the planning agency to review andconsider a groundwater sustainability plan, groundwater management plan, groundwater management court order, judgment, ordecree, adjudication of water rights, or a certain order or interim plan by the State Water Resources Control Board. This billwould require the planning agency to refer a proposed action to adopt or substantially amend a general plan to any groundwatersustainability agency that has adopted a groundwater sustainability plan or local agency that otherwise manages groundwater andto the State Water Resources Control Board if it has adopted an interim plan that includes territory within the planning area.
Existing law requires a public water system to provide a planning agency with certain information upon receiving notification ofa city’s or a county’s proposed action to adopt or substantially amend a general plan.
This bill would also require a groundwater sustainability agency or an entity that submits an alternative to provide the planningagency with certain information as is appropriate and relevant, including a report on the anticipated effect of the proposed actionon implementation of a groundwater sustainability plan.
By imposing new duties on a city or county, this bill would impose a state-mandated local program.

(5) Senate Bill 1168 of the 2013–14 Regular Session, if enacted, would enact the Sustainable Groundwater Management Act, andwould define “undesirable result” for purposes of those provisions. The act would grant specified authority to a groundwatersustainability agency relating to controlling groundwater extractions, and would specify that various provisions do not supersedethe land use authority of cities and counties, as specified.
This bill would revise the definition of “undesirable result,” and would specify that certain authority granted to a groundwatersustainability agency to control groundwater extractions shall be consistent with applicable elements of a city or county generalplan, except as specified. The bill would provide that the provisions against superseding the land use authority of cities andcounties apply to that authority within the overlying basin, including the city or county general plan, and would require agroundwater sustainability plan to take into account the most recent planning assumptions stated in local general plans overlyingthe basin.
(6) The California Constitution requires the state to reimburse local agencies and school districts for certain costs mandated bythe state. Statutory provisions establish procedures for making that reimbursement.
This bill would provide that with regard to certain mandates no reimbursement is required by this act for a specified reason.
With regard to any other mandates, this bill would provide that, if the Commission on State Mandates determines that the billcontains costs so mandated by the state, reimbursement for those costs shall be made pursuant to the statutory provisions notedabove.
(7) Existing constitutional provisions require that a statute that limits the right of access to the meetings of public bodies or thewritings of public officials and agencies be adopted with findings demonstrating the interest protected by the limitation and theneed for protecting that interest.
This bill would make legislative findings to that effect.
(8) This bill would make its operation contingent on the enactment of SB 1168 of the 2013–14 Regular Session.
DIGEST KEYVote: MAJORITY Appropriation: NO Fiscal Committee: YES Local Program: YES
BILL TEXT
THE PEOPLE OF THE STATE OF CALIFORNIA DO ENACT AS FOLLOWS:
SECTION 1.(a) The Legislature finds and declares as follows:
(1) The people of the state have a primary interest in the protection, management, and reasonable beneficial use of the waterresources of the state, both surface and underground, and that the integrated management of the state’s water resources isessential to meeting its water management goals.
(2) Groundwater provides a significant portion of California’s water supply. Groundwater accounts for more than one-third of thewater used by Californians in an average year and more than one-half of the water used by Californians in a drought year whenother sources are unavailable.
(3) Excessive groundwater extraction can cause overdraft, failed wells, deteriorated water quality, environmental damage, andirreversible land subsidence that damages infrastructure and diminishes the capacity of aquifers to store water for the future.
(4) When properly managed, groundwater resources will help protect communities, farms, and the environment against prolongeddry periods and climate change, preserving water supplies for existing and potential beneficial use.
(5) Failure to manage groundwater to prevent long-term overdraft infringes on groundwater rights.
(6) Groundwater resources are most effectively managed at the local or regional level.
(7) Groundwater management will not be effective unless local actions to sustainably manage groundwater basins and subbasinsare taken.

(8) Local and regional agencies need to have the necessary support and authority to manage groundwater sustainably.
(9) In those circumstances where a local groundwater management agency is not managing its groundwater sustainably, the stateneeds to protect the resource until it is determined that a local groundwater management agency can sustainably manage thegroundwater basin or subbasin.
(10) Information on the amount of groundwater extraction, natural and artificial recharge, and groundwater evaluations arecritical for effective management of groundwater.
(11) Sustainable groundwater management in California depends upon creating more opportunities for robust conjunctivemanagement of surface water and groundwater resources. Climate change will intensify the need to recalibrate and reconcilesurface water and groundwater management strategies.
(12) Sustainability groundwater management is part of implementation of the California Water Action Plan.
(b) It is, therefore, the intent of the Legislature to do all of the following:
(1) To provide local and regional agencies the authority to sustainably manage groundwater.
(2) To provide that if no local groundwater agency or agencies provide sustainable groundwater management for a groundwaterbasin or subbasin, the state has the authority to develop and implement an interim plan until the time the local groundwatersustainability agency or agencies can assume management of the basin or subbasin.
(3) To require the development and reporting of those data necessary to support sustainable groundwater management, includingthose data that help describe the basin’s geology, the short- and long-term trends of the basin’s water balance, and other measuresof sustainability, and those data necessary to resolve disputes regarding sustainable yield, beneficial uses, and water rights.
(4) To respect overlying and other proprietary rights to groundwater, consistent with Section 1200 of the Water Code.
(5) To recognize and preserve the authority of cities and counties to manage groundwater pursuant to their police powers.
SEC. 2.Section 65350.5 is added to the Government Code, to read:
65350.5.Before the adoption or any substantial amendment of a city’s or county’s general plan, the planning agency shall review andconsider all of the following:
(a) An adoption of, or update to, a groundwater sustainability plan or groundwater management plan pursuant to Part 2.74(commencing with Section 10720) or Part 2.75 (commencing with Section 10750) of Division 6 of the Water Code orgroundwater management court order, judgment, or decree.
(b) An adjudication of water rights.
(c) An order or interim plan by the State Water Resources Control Board pursuant to Chapter 11 (commencing with Section10735) of Part 2.74 of Division 6 of the Water Code.
SEC. 3.Section 65352 of the Government Code is amended to read:
65352.(a) Before a legislative body takes action to adopt or substantially amend a general plan, the planning agency shall refer theproposed action to all of the following entities:
(1) A city or county, within or abutting the area covered by the proposal, and any special district that may be significantlyaffected by the proposed action, as determined by the planning agency.
(2) An elementary, high school, or unified school district within the area covered by the proposed action.
(3) The local agency formation commission.

(4) An areawide planning agency whose operations may be significantly affected by the proposed action, as determined by theplanning agency.
(5) A federal agency, if its operations or lands within its jurisdiction may be significantly affected by the proposed action, asdetermined by the planning agency.
(6) (A) The branches of the United States Armed Forces that have provided the Office of Planning and Research with aCalifornia mailing address pursuant to subdivision (d) of Section 65944, if the proposed action is within 1,000 feet of a militaryinstallation, or lies within special use airspace, or beneath a low-level flight path, as defined in Section 21098 of the PublicResources Code, and if the United States Department of Defense provides electronic maps of low-level flight paths, special useairspace, and military installations at a scale and in an electronic format that is acceptable to the Office of Planning and Research.
(B) Within 30 days of a determination by the Office of Planning and Research that the information provided by the Departmentof Defense is sufficient and in an acceptable scale and format, the office shall notify cities, counties, and cities and counties of theavailability of the information on the Internet. Cities, counties, and cities and counties shall comply with subparagraph (A) within30 days of receiving this notice from the office.
(7) A public water system, as defined in Section 116275 of the Health and Safety Code, with 3,000 or more service connections,that serves water to customers within the area covered by the proposal. The public water system shall have at least 45 days tocomment on the proposed plan, in accordance with subdivision (b), and to provide the planning agency with the information setforth in Section 65352.5.
(8) Any groundwater sustainability agency that has adopted a groundwater sustainability plan pursuant to Part 2.74 (commencingwith Section 10720) of Division 6 of the Water Code or local agency that otherwise manages groundwater pursuant to otherprovisions of law or a court order, judgment, or decree within the planning area of the proposed general plan.
(9) The State Water Resources Control Board, if it has adopted an interim plan pursuant to Chapter 11 (commencing with Section10735) of Part 2.74 of Division 6 of the Water Code that includes territory within the planning area of the proposed general plan.
(10) The Bay Area Air Quality Management District for a proposed action within the boundaries of the district.
(11) A California Native American tribe that is on the contact list maintained by the Native American Heritage Commission andthat has traditional lands located within the city’s or county’s jurisdiction.
(12) The Central Valley Flood Protection Board for a proposed action within the boundaries of the Sacramento and San JoaquinDrainage District, as set forth in Section 8501 of the Water Code.
(b) An entity receiving a proposed general plan or amendment of a general plan pursuant to this section shall have 45 days fromthe date the referring agency mails it or delivers it to comment unless a longer period is specified by the planning agency.
(c) (1) This section is directory, not mandatory, and the failure to refer a proposed action to the entities specified in this sectiondoes not affect the validity of the action, if adopted.
(2) To the extent that the requirements of this section conflict with the requirements of Chapter 4.4 (commencing with Section65919), the requirements of Chapter 4.4 shall prevail.
SEC. 4.Section 65352.5 of the Government Code is amended to read:
65352.5.(a) The Legislature finds and declares that it is vital that there be close coordination and consultation between California’s watersupply or management agencies and California’s land use approval agencies to ensure that proper water supply and managementplanning occurs to accommodate projects that will result in increased demands on water supplies or impact water resourcemanagement.
(b) It is, therefore, the intent of the Legislature to provide a standardized process for determining the adequacy of existing andplanned future water supplies to meet existing and planned future demands on these water supplies and the impact of land usedecisions on the management of California’s water supply resources.
(c) Upon receiving, pursuant to Section 65352, notification of a city’s or a county’s proposed action to adopt or substantiallyamend a general plan, a public water system, as defined in Section 116275 of the Health and Safety Code, with 3,000 or moreservice connections, shall provide the planning agency with the following information, as is appropriate and relevant:

(1) The current version of its urban water management plan, adopted pursuant to Part 2.6 (commencing with Section 10610) ofDivision 6 of the Water Code.
(2) The current version of its capital improvement program or plan, as reported pursuant to Section 31144.73 of the Water Code.
(3) A description of the source or sources of the total water supply currently available to the water supplier by water right orcontract, taking into account historical data concerning wet, normal, and dry runoff years.
(4) A description of the quantity of surface water that was purveyed by the water supplier in each of the previous five years.
(5) A description of the quantity of groundwater that was purveyed by the water supplier in each of the previous five years.
(6) A description of all proposed additional sources of water supplies for the water supplier, including the estimated dates bywhich these additional sources should be available and the quantities of additional water supplies that are being proposed.
(7) A description of the total number of customers currently served by the water supplier, as identified by the followingcategories and by the amount of water served to each category:
(A) Agricultural users.
(B) Commercial users.
(C) Industrial users.
(D) Residential users.
(8) Quantification of the expected reduction in total water demand, identified by each customer category set forth in paragraph(7), associated with future implementation of water use reduction measures identified in the water supplier’s urban watermanagement plan.
(9) Any additional information that is relevant to determining the adequacy of existing and planned future water supplies to meetexisting and planned future demands on these water supplies.
(d) Upon receiving, pursuant to Section 65352, notification of a city’s or a county’s proposed action to adopt or substantiallyamend a general plan, a groundwater sustainability agency, as defined in Section 10721 of the Water Code, or an entity thatsubmits an alternative under Section 10733.6 shall provide the planning agency with the following information, as is appropriateand relevant:
(1) The current version of its groundwater sustainability plan or alternative adopted pursuant to Part 2.74 (commencing withSection 10720) of Division 6 of the Water Code.
(2) If the groundwater sustainability agency manages groundwater pursuant to a court order, judgment, decree, or agreementamong affected water rights holders, or if the State Water Resources Control Board has adopted an interim plan pursuant toChapter 11 (commencing with Section 10735) of Part 2.74 of Division 6 of the Water Code, the groundwater sustainabilityagency shall provide the planning agency with maps of recharge basins and percolation ponds, extraction limitations, and otherrelevant information, or the court order, judgment, or decree.
(3) A report on the anticipated effect of proposed action to adopt or substantially amend a general plan on implementation of agroundwater sustainability plan pursuant to Part 2.74 (commencing with Section 10720) of Division 6 of the Water Code.
SEC. 5.Section 348 of the Water Code is amended to read:
348.(a) The department or the board may adopt emergency regulations providing for the electronic filing of reports of waterextraction or water diversion or use required to be filed with the department or board under this code, including, but not limitedto, any report required to be filed under Part 5.1 (commencing with Section 5100) or Part 5.2 (commencing with Section 5200) ofDivision 2 and any report required to be filed by a water right permittee or licensee.
(b) Emergency regulations adopted pursuant to this section, or any amendments thereto, shall be adopted by the department or theboard in accordance with Chapter 3.5 (commencing with Section 11340) of Part 1 of Division 3 of Title 2 of the GovernmentCode. The adoption of these regulations is an emergency and shall be considered by the Office of Administrative Law as

necessary for the immediate preservation of the public peace, health, safety, and general welfare. Notwithstanding Chapter 3.5(commencing with Section 11340) of Part 1 of Division 3 of Title 2 of the Government Code, any emergency regulations oramendments to those regulations adopted under this section shall remain in effect until revised by the department or the boardthat adopted the regulations or amendments.
SEC. 6.Section 1120 of the Water Code is amended to read:
1120.This chapter applies to any decision or order issued under this part or Section 275, Part 2 (commencing with Section 1200), Part2 (commencing with Section 10500) of Division 6, Chapter 11 (commencing with Section 10735) of Part 2.74 of Division 6,Article 7 (commencing with Section 13550) of Chapter 7 of Division 7, or the public trust doctrine.
SEC. 7.Section 1529.5 is added to the Water Code, to read:
1529.5.(a) The board shall adopt a schedule of fees pursuant to Section 1530 to recover costs incurred in administering Chapter 11(commencing with Section 10735) of Part 2.74 of Division 6. Recoverable costs include, but are not limited to, costs incurred inconnection with investigations, facilitation, monitoring, hearings, enforcement, and administrative costs in carrying out theseactions.
(b) The fee schedule adopted under this section may include, but is not limited to, the following:
(1) A fee for participation as a petitioner or party to an adjudicative proceeding.
(2) A fee for the filing of a report pursuant to Part 5.2 (commencing with Section 5200) of Division 2.
(c) Consistent with Section 3 of Article XIII A of the California Constitution, the board shall set the fees under this section in anamount sufficient to cover all costs incurred and expended from the Water Rights Fund for the purposes of Part 5.2 (commencingwith Section 5200) and Chapter 11 (commencing with Section 10735) of Part 2.74 of Division 6. In setting these fees, the boardis not required to fully recover these costs in the year or the year immediately after the costs are incurred, but the board mayprovide for recovery of these costs over a period of years.
SEC. 8.Section 1552 of the Water Code is amended to read:
1552.The money in the Water Rights Fund is available for expenditure, upon appropriation by the Legislature, for the followingpurposes:
(a) For expenditure by the State Board of Equalization in the administration of this chapter and the Fee Collection ProceduresLaw (Part 30 (commencing with Section 55001) of Division 2 of the Revenue and Taxation Code) in connection with any fee orexpense subject to this chapter.
(b) For the payment of refunds, pursuant to Part 30 (commencing with Section 55001) of Division 2 of the Revenue and TaxationCode, of fees or expenses collected pursuant to this chapter.
(c) For expenditure by the board for the purposes of carrying out this division, Division 1 (commencing with Section 100), Part 2(commencing with Section 10500) and Chapter 11 (commencing with Section 10735) of Part 2.74 of Division 6, and Article 7(commencing with Section 13550) of Chapter 7 of Division 7.
(d) For expenditures by the board for the purposes of carrying out Sections 13160 and 13160.1 in connection with activitiesinvolving hydroelectric power projects subject to licensing by the Federal Energy Regulatory Commission.
(e) For expenditures by the board for the purposes of carrying out Sections 13140 and 13170 in connection with plans andpolicies that address the diversion or use of water.
SEC. 9.Section 1831 of the Water Code is amended to read:

1831.(a) When the board determines that any person is violating, or threatening to violate, any requirement described in subdivision(d), the board may issue an order to that person to cease and desist from that violation.
(b) The cease and desist order shall require that person to comply forthwith or in accordance with a time schedule set by theboard.
(c) The board may issue a cease and desist order only after notice and an opportunity for hearing pursuant to Section 1834.
(d) The board may issue a cease and desist order in response to a violation or threatened violation of any of the following:
(1) The prohibition set forth in Section 1052 against the unauthorized diversion or use of water subject to this division.
(2) Any term or condition of a permit, license, certification, or registration issued under this division.
(3) Any decision or order of the board issued under this part, Section 275, Chapter 11 (commencing with Section 10735) of Part2.74 of Division 6, or Article 7 (commencing with Section 13550) of Chapter 7 of Division 7, in which decision or order theperson to whom the cease and desist order will be issued, or a predecessor in interest to that person, was named as a party directlyaffected by the decision or order.
(4) A regulation adopted under Section 1058.5.
(5) Any extraction restriction, limitation, order, or regulation adopted or issued under Chapter 11 (commencing with Section10735) of Part 2.74 of Division 6.
(e) This article does not authorize the board to regulate in any manner, the diversion or use of water not otherwise subject toregulation of the board under this part.
SEC. 10.Part 5.2 (commencing with Section 5200) is added to Division 2 of the Water Code, to read:
PART 5.2. Groundwater Extraction Reporting for Probationary Basins and Basins Without a Groundwater
Sustainability Agency5200.The Legislature finds and declares that this part establishes groundwater reporting requirements for the purposes of subdivision(b) of Section 10724 and Chapter 11 (commencing with Section 10735) of Part 2.74 of Division 6.
5201.As used in this part:
(a) “Basin” has the same meaning as defined in Section 10721.
(b) “Board-designated local area” has the same meaning as defined in Section 5009.
(c) “De minimis extractor” has the same meaning as defined in Section 10721.
(d) “Groundwater” has the same meaning as defined in Section 10721.
(e) “Groundwater extraction facility” has the same meaning as defined in Section 10721.
(f) “Groundwater sustainability agency” has the same meaning as defined in Section 10721.
(g) “Person” has the same meaning as defined in Section 10735.
(h) “Personal information” has the same meaning as defined in Section 1798.3 of the Civil Code.
(i) “Probationary basin” has the same meaning as defined in Section 10735.
(j) “Water year” has the same meaning as defined in Section 10721.
5202.(a) This section applies to a person who does either of the following:

(1) Extracts groundwater from a probationary basin 90 days or more after the board designates the basin as a probationary basinpursuant to Section 10735.2.
(2) Extracts groundwater on or after July 1, 2017, in an area within a basin that is not within the management area of agroundwater sustainability agency and where the county does not assume responsibility to be the groundwater sustainabilityagency, as provided in subdivision (b) of Section 10724.
(b) Except as provided in subdivision (c), a person subject to this section shall file a report of groundwater extraction byDecember 15 of each year for extractions made in the preceding water year.
(c) Unless reporting is required pursuant to paragraph (2) of subdivision (c) of Section 10735.2, this section does not apply to anyof the following:
(1) An extraction by a de minimis extractor.
(2) An extraction excluded from reporting pursuant to paragraph (1) of subdivision (c) of Section 10735.2.
(3) An extraction reported pursuant to Part 5 (commencing with Section 4999).
(4) An extraction that is included in annual reports filed with a court or the board by a watermaster appointed by a court orpursuant to statute to administer a final judgment determining rights to water. The reports shall identify the persons who haveextracted water and give the general place of use and the quantity of water that has been extracted from each source.
(d) Except as provided in Section 5209, the report shall be filed with the board.
(e) The report may be filed by the person extracting water or on that person’s behalf by an agency that person designates and thatmaintains a record of the water extracted.
(f) Each report shall be accompanied by the fee imposed pursuant to Section 1529.5.
5203.Each report shall be prepared on a form provided by the board. The report shall include all of the following information:
(a) The name and address of the person who extracted groundwater and of the person filing the report.
(b) The name of the basin from which groundwater was extracted.
(c) The place of groundwater extraction. The location of the groundwater extraction facilities shall be depicted on a specificUnited States Geological Survey topographic map or shall be identified using the California Coordinate System or a latitude andlongitude measurement. If assigned, the public land description to the nearest 40-acre subdivision and the assessor’s parcelnumber shall be provided.
(d) The capacity of the groundwater extraction facilities.
(e) Monthly records of groundwater extractions. The measurements of the extractions shall be made by a methodology, water-measuring device, or combination thereof satisfactory to the board.
(f) The purpose of use.
(g) A general description of the area in which the water was used. The location of the place of use shall be depicted on a specificUnited States Geological Survey topographic map or on any other maps with identifiable landmarks. If assigned, the public landdescription to the nearest 40-acre subdivision and the assessor’s parcel number shall also be provided.
(h) As near as is known, the year in which the groundwater extraction was commenced.
(i) Any information required pursuant to paragraph (3) of subdivision (c) of Section 10735.2.
(j) Any other information that the board may require by regulation and that is reasonably necessary for purposes of this divisionor Part 2.74 (commencing with Section 10720) of Division 6.
5204.(a) If a person fails to file a report as required by this part, the board may, at the expense of that person, investigate anddetermine the information required to be reported pursuant to this part.

(b) The board shall give a person described in subdivision (a) notice of its intention to investigate and determine the informationrequired to be reported pursuant to this part and 60 days in which to file a required report without penalty.
5205.A report submitted under this part or a determination of facts by the board pursuant to Section 5104 shall not establish orconstitute evidence of a right to divert or use water.
5206.Personal information included in a report of groundwater extraction shall have the same protection from disclosure as isprovided for information concerning utility customers of local agencies pursuant to Section 6254.16 of the Government Code.
5207.A right to extract groundwater that may otherwise occur shall not arise or accrue to, and a statute of limitations shall not operatein favor of, a person required to file a report pursuant to this part until the person files the report.
5208.Section 5107 applies to a report or measuring device required pursuant to this part. For purposes of Section 5107, a report ofgroundwater extraction, measuring device, or misstatement required, used, or made pursuant to this part shall be considered theequivalent of a statement, measuring device, or misstatement required, used, or made pursuant to Part 5.1 (commencing withSection 5100).
5209.For groundwater extractions in a board-designated local area, reports required pursuant to this part shall be submitted to theentity designated pursuant to subdivision (e) of Section 5009 if both of the following occur:
(a) The board determines that the requirements of subdivision (e) of Section 5009 have been satisfied with respect to extractionssubject to reporting pursuant to this part, in addition to any groundwater extractions subject to Part 5 (commencing with Section4999).
(b) The designated entity has made satisfactory arrangements to collect and transmit to the board any fees imposed pursuant toparagraph (2) of subdivision (b) of Section 1529.5.
SEC. 11.Section 10721 of the Water Code, as added by Senate Bill 1168 of the 2013–14 Regular Session, is amended to read:
10721.Unless the context otherwise requires, the following definitions govern the construction of this part:
(a) “Adjudication action” means an action filed in the superior or federal district court to determine the rights to extractgroundwater from a basin or store water within a basin, including, but not limited to, actions to quiet title respecting rights toextract or store groundwater or an action brought to impose a physical solution on a basin.
(b) “Basin” means a groundwater basin or subbasin identified and defined in Bulletin 118 or as modified pursuant to Chapter 3(commencing with Section 10722).
(c) “Bulletin 118” means the department’s report entitled “California’s Groundwater: Bulletin 118” updated in 2003, as it may besubsequently updated or revised in accordance with Section 12924.
(d) “Coordination agreement” means a legal agreement adopted between two or more groundwater sustainability agencies thatprovides the basis for coordinating multiple agencies or groundwater sustainability plans within a basin pursuant to this part.
(e) “De minimis extractor” means a person who extracts, for domestic purposes, two acre-feet or less per year.
(f) “Governing body” means the legislative body of a groundwater sustainability agency.
(g) “Groundwater” means water beneath the surface of the earth within the zone below the water table in which the soil iscompletely saturated with water, but does not include water that flows in known and definite channels.
(h) “Groundwater extraction facility” means a device or method for extracting groundwater from within a basin.
(i) “Groundwater recharge” means the augmentation of groundwater, by natural or artificial means.

(j) “Groundwater sustainability agency” means one or more local agencies that implement the provisions of this part. Forpurposes of imposing fees pursuant to Chapter 8 (commencing with Section 10730) or taking action to enforce a groundwatersustainability plan, “groundwater sustainability agency” also means each local agency comprising the groundwater sustainabilityagency if the plan authorizes separate agency action.
(k) “Groundwater sustainability plan” or “plan” means a plan of a groundwater sustainability agency proposed or adoptedpursuant to this part.
(l) “Groundwater sustainability program” means a coordinated and ongoing activity undertaken to benefit a basin, pursuant to agroundwater sustainability plan.
(m) “Local agency” means a local public agency that has water supply, water management, or land use responsibilities within agroundwater basin.
(n) “Operator” means a person operating a groundwater extraction facility. The owner of a groundwater extraction facility shallbe conclusively presumed to be the operator unless a satisfactory showing is made to the governing body of the groundwatersustainability agency that the groundwater extraction facility actually is operated by some other person.
(o) “Owner” means a person owning a groundwater extraction facility or an interest in a groundwater extraction facility otherthan a lien to secure the payment of a debt or other obligation.
(p) “Personal information” has the same meaning as defined in Section 1798.3 of the Civil Code.
(q) “Planning and implementation horizon” means a 50-year time period over which a groundwater sustainability agencydetermines that plans and measures will be implemented in a basin to ensure that the basin is operated within its sustainable yield.
(r) “Public water system” has the same meaning as defined in Section 116275 of the Health and Safety Code.
(s) “Recharge area” means the area that supplies water to an aquifer in a groundwater basin.
(t) “Sustainability goal” means the existence and implementation of one or more groundwater sustainability plans that achievesustainable groundwater management by identifying and causing the implementation of measures targeted to ensure that theapplicable basin is operated within its sustainable yield.
(u) “Sustainable groundwater management” means the management and use of groundwater in a manner that can be maintainedduring the planning and implementation horizon without causing undesirable results.
(v) “Sustainable yield” means the maximum quantity of water, calculated over a base period representative of long-termconditions in the basin and including any temporary surplus, that can be withdrawn annually from a groundwater supply withoutcausing an undesirable result.
(w) “Undesirable result” means one or more of the following effects caused by groundwater conditions occurring throughout thebasin:
(1) Chronic lowering of groundwater levels indicating a significant and unreasonable depletion of supply if continued over theplanning and implementation horizon. Overdraft during a period of drought is not sufficient to establish a chronic lowering ofgroundwater levels if extractions and recharge are managed as necessary to ensure that reductions in groundwater levels orstorage during a period of drought are offset by increases in groundwater levels or storage during other periods.
(2) Significant and unreasonable reduction of groundwater storage.
(3) Significant and unreasonable seawater intrusion.
(4) Significant and unreasonable degraded water quality, including the migration of contaminant plumes that impair watersupplies.
(5) Significant and unreasonable land subsidence that substantially interferes with surface land uses.
(6) Depletions of interconnected surface water that have significant and unreasonable adverse impacts on beneficial uses of thesurface water.
(x) “Water budget” means an accounting of the total groundwater and surface water entering and leaving a basin including thechanges in the amount of water stored.

(y) “Watermaster” means a watermaster appointed by a court or pursuant to other law.
(z) “Water year” means the period from October 1 through the following September 30, inclusive.
(aa) “Wellhead protection area” means the surface and subsurface area surrounding a water well or well field that supplies apublic water system through which contaminants are reasonably likely to migrate toward the water well or well field.
SEC. 12.Section 10726.4 of the Water Code, as added by Senate Bill 1168 of the 2013–14 Regular Session, is amended to read:
10726.4.(a) A groundwater sustainability agency shall have the following additional authority and may regulate groundwater extractionusing that authority:
(1) To impose spacing requirements on new groundwater well construction to minimize well interference and impose reasonableoperating regulations on existing groundwater wells to minimize well interference, including requiring extractors to operate on arotation basis.
(2) To control groundwater extractions by regulating, limiting, or suspending extractions from individual groundwater wells orextractions from groundwater wells in the aggregate, construction of new groundwater wells, enlargement of existinggroundwater wells, or reactivation of abandoned groundwater wells, or otherwise establishing groundwater extraction allocations.Those actions shall be consistent with the applicable elements of the city or county general plan, unless there is insufficientsustainable yield in the basin to serve a land use designated in the city or county general plan. A limitation on extractions by agroundwater sustainability agency shall not be construed to be a final determination of rights to extract groundwater from thebasin or any portion of the basin.
(3) To authorize temporary and permanent transfers of groundwater extraction allocations within the agency’s boundaries, if thetotal quantity of groundwater extracted in any water year is consistent with the provisions of the groundwater sustainability plan.The transfer is subject to applicable city and county ordinances.
(4) To establish accounting rules to allow unused groundwater extraction allocations issued by the agency to be carried over fromone year to another and voluntarily transferred, if the total quantity of groundwater extracted in any five-year period is consistentwith the provisions of the groundwater sustainability plan.
(b) This section does not authorize a groundwater sustainability agency to issue permits for the construction, modification, orabandonment of groundwater wells, except as authorized by a county with authority to issue those permits. A groundwatersustainability agency may request of the county, and the county shall consider, that the county forward permit requests for theconstruction of new groundwater wells, the enlarging of existing groundwater wells, and the reactivation of abandonedgroundwater wells to the groundwater sustainability agency before permit approval.
SEC. 13.Section 10726.8 of the Water Code, as added by Senate Bill 1168 of the 2013–14 Regular Session, is amended to read:
10726.8.(a) This part is in addition to, and not a limitation on, the authority granted to a local agency under any other law. The localagency may use the local agency’s authority under any other law to apply and enforce any requirements of this part, including,but not limited to, the collection of fees.
(b) Nothing in this part shall be construed as authorizing a local agency to make a binding determination of the water rights ofany person or entity.
(c) Nothing in this part is a limitation on the authority of the board, the department, or the State Department of Public Health.
(d) Notwithstanding Section 6103 of the Government Code, a state or local agency that extracts groundwater shall be subject to afee imposed under this part to the same extent as any nongovernmental entity.
(e) Except as provided in subdivision (d), this part does not authorize a local agency to impose any requirement on the state orany agency, department, or officer of the state. State agencies and departments shall work cooperatively with a local agency on avoluntary basis.
(f) Nothing in this chapter or a groundwater sustainability plan shall be interpreted as superseding the land use authority of citiesand counties, including the city or county general plan, within the overlying basin.

SEC. 14.Section 10726.9 is added to the Water Code, to read:
10726.9.A groundwater sustainability plan shall take into account the most recent planning assumptions stated in local general plans ofjurisdictions overlying the basin.
SEC. 15.Chapter 7 (commencing with Section 10729) is added to Part 2.74 of Division 6 of the Water Code, to read:
CHAPTER 7. Technical Assistance10729.(a) The department or a groundwater sustainability agency may provide technical assistance to entities that extract or usegroundwater to promote water conservation and protect groundwater resources.
(b) The department may provide technical assistance to any groundwater sustainability agency in response to that agency’srequest for assistance in the development and implementation of a groundwater sustainability plan. The department shall use itsbest efforts to provide the requested assistance.
(c) The department shall prepare and publish a report by December 31, 2016, on its Internet Web site that presents thedepartment’s best estimate, based on available information, of water available for replenishment of groundwater in the state.
(d) (1) By January 1, 2017, the department shall publish on its Internet Web site best management practices for the sustainablemanagement of groundwater.
(2) The department shall develop the best management practices through a public process involving one public meetingconducted at a location in northern California, one public meeting conducted at a location in the San Joaquin Valley, one publicmeeting conducted at a location in southern California, and one public meeting of the California Water Commission.
SEC. 16.Chapter 8 (commencing with Section 10730) is added to Part 2.74 of Division 6 of the Water Code, to read:
CHAPTER 8. Financial Authority10730.(a) A groundwater sustainability agency may impose fees, including, but not limited to, permit fees and fees on groundwaterextraction or other regulated activity, to fund the costs of a groundwater sustainability program, including, but not limited to,preparation, adoption, and amendment of a groundwater sustainability plan, and investigations, inspections, complianceassistance, enforcement, and program administration, including a prudent reserve. A groundwater sustainability agency shall notimpose a fee pursuant to this subdivision on a de minimis extractor unless the agency has regulated the users pursuant to this part.
(b) (1) Prior to imposing or increasing a fee, a groundwater sustainability agency shall hold at least one public meeting, at whichoral or written presentations may be made as part of the meeting.
(2) Notice of the time and place of the meeting shall include a general explanation of the matter to be considered and a statementthat the data required by this section is available. The notice shall be provided by publication pursuant to Section 6066 of theGovernment Code, by posting notice on the Internet Web site of the groundwater sustainability agency, and by mail to anyinterested party who files a written request with the agency for mailed notice of the meeting on new or increased fees. A writtenrequest for mailed notices shall be valid for one year from the date that the request is made and may be renewed by making awritten request on or before April 1 of each year.
(3) At least 10 days prior to the meeting, the groundwater sustainability agency shall make available to the public data uponwhich the proposed fee is based.
(c) Any action by a groundwater sustainability agency to impose or increase a fee shall be taken only by ordinance or resolution.
(d) (1) As an alternative method for the collection of fees imposed pursuant to this section, a groundwater sustainability agencymay adopt a resolution requesting collection of the fees in the same manner as ordinary municipal ad valorem taxes.
(2) A resolution described in paragraph (1) shall be adopted and furnished to the county auditor-controller and board ofsupervisors on or before August 1 of each year that the alternative collection of the fees is being requested. The resolution shallinclude a list of parcels and the amount to be collected for each parcel.

(e) The power granted by this section is in addition to any powers a groundwater sustainability agency has under any other law.
10730.2.(a) A groundwater sustainability agency that adopts a groundwater sustainability plan pursuant to this part may impose fees onthe extraction of groundwater from the basin to fund costs of groundwater management, including, but not limited to, the costs ofthe following:
(1) Administration, operation, and maintenance, including a prudent reserve.
(2) Acquisition of lands or other property, facilities, and services.
(3) Supply, production, treatment, or distribution of water.
(4) Other activities necessary or convenient to implement the plan.
(b) Until a groundwater sustainability plan is adopted pursuant to this part, a local agency may impose fees in accordance withthe procedures provided in this section for the purposes of Part 2.75 (commencing with Section 10750) as long as a groundwatermanagement plan adopted before January 1, 2015, is in effect for the basin.
(c) Fees imposed pursuant to this section shall be adopted in accordance with subdivisions (a) and (b) of Section 6 of Article XIIID of the California Constitution.
(d) Fees imposed pursuant to this section may include fixed fees and fees charged on a volumetric basis, including, but notlimited to, fees that increase based on the quantity of groundwater produced annually, the year in which the production ofgroundwater commenced from a groundwater extraction facility, and impacts to the basin.
(e) The power granted by this section is in addition to any powers a groundwater sustainability agency has under any other law.
10730.4.A groundwater sustainability agency may fund activities pursuant to Part 2.75 (commencing with Section 10750) and mayimpose fees pursuant to Section 10730.2 to fund activities undertaken by the agency pursuant to Part 2.75 (commencing withSection 10750).
10730.6.(a) A groundwater fee levied pursuant to this chapter shall be due and payable to the groundwater sustainability agency by eachowner or operator on a day established by the groundwater sustainability agency.
(b) If an owner or operator knowingly fails to pay a groundwater fee within 30 days of it becoming due, the owner or operatorshall be liable to the groundwater sustainability agency for interest at the rate of 1 percent per month on the delinquent amount ofthe groundwater fee and a 10-percent penalty.
(c) The groundwater sustainability agency may bring a suit in the court having jurisdiction against any owner or operator of agroundwater extraction facility within the area covered by the plan for the collection of any delinquent groundwater fees, interest,or penalties imposed under this chapter. If the groundwater sustainability agency seeks an attachment against the property of anynamed defendant in the suit, the groundwater sustainability agency shall not be required to furnish a bond or other undertaking asprovided in Title 6.5 (commencing with Section 481.010) of Part 2 of the Code of Civil Procedure.
(d) In the alternative to bringing a suit pursuant to subdivision (c), a groundwater sustainability agency may collect anydelinquent groundwater charge and any civil penalties and interest on the delinquent groundwater charge pursuant to the lawsapplicable to the local agency or, if a joint powers authority, to the entity designated pursuant to Section 6509 of the GovernmentCode. The collection shall be in the same manner as it would be applicable to the collection of delinquent assessments, watercharges, or tolls.
(e) As an additional remedy, a groundwater sustainability agency, after a public hearing, may order an owner or operator to ceaseextraction of groundwater until all delinquent fees are paid. The groundwater sustainability agency shall give notice to the owneror operator by certified mail not less than 15 days in advance of the public hearing.
(f) The remedies specified in this section for collecting and enforcing fees are cumulative and may be pursued alternatively ormay be used consecutively as determined by the governing body.
10730.8.(a) Nothing in this chapter shall affect or interfere with the authority of a groundwater sustainability agency to levy and collecttaxes, assessments, charges, and tolls as otherwise provided by law.

(b) Personal information included in a report or record pursuant to this chapter has the same protection from disclosure as isprovided for information concerning utility customers of local agencies pursuant to Section 6254.16 of the Government Code.
10731.(a) Following an investigation pursuant to Section 10725.4, the governing body may make a determination fixing the amount ofgroundwater production from the groundwater extraction facility at an amount not to exceed the maximum production capacity ofthe facility for purposes of levying a groundwater charge. If a water-measuring device is permanently attached to thegroundwater extraction facility, the record of production as disclosed by the water-measuring device shall be presumed to beaccurate unless the contrary is established by the groundwater sustainability agency after investigation.
(b) After the governing body makes a determination fixing the amount of groundwater production pursuant to subdivision (a), awritten notice of the determination shall be mailed to the owner or operator of the groundwater extraction facility at the addressas shown by the groundwater sustainability agency’s records. A determination made by the governing body shall be conclusiveon the owner or operator and the groundwater charges, based on the determination together with any interest and penalties, shallbe payable immediately unless within 20 days after the mailing of the notice the owner or operator files with the governing bodya written protest setting forth the ground for protesting the amount of production or the groundwater charges, interest, andpenalties. If a protest is filed pursuant to this subdivision, the governing body shall hold a hearing to determine the total amountof the groundwater production and the groundwater charges, interest, and penalties. Notice of the hearing shall be mailed to eachprotestant at least 20 days before the date fixed for the hearing. Notice of the determination of the governing body hearing shallbe mailed to each protestant. The owner or operator shall have 20 days from the date of mailing of the determination to pay thegroundwater charges, interest, and penalties determined by the governing body.
SEC. 17.Chapter 9 (commencing with Section 10732) is added to Part 2.74 of Division 6 of the Water Code, to read:
CHAPTER 9. Groundwater Sustainability Agency Enforcement Powers10732.(a) (1) A person who extracts groundwater in excess of the amount that person is authorized to extract under a rule, regulation,ordinance, or resolution adopted pursuant to Section 10725.2, shall be subject to a civil penalty not to exceed five hundred dollars($500) per acre-foot extracted in excess of the amount that person is authorized to extract. Liability under this subdivision is inaddition to any liability imposed under paragraph (2) and any fee imposed for the extraction.
(2) A person who violates any rule, regulation, ordinance, or resolution adopted pursuant to Section 10725.2 shall be liable for acivil penalty not to exceed one thousand dollars ($1,000) plus one hundred dollars ($100) for each additional day on which theviolation continues if the person fails to comply within 30 days after the local agency has notified the person of the violation.
(b) (1) A groundwater sustainability agency may bring an action in the superior court to determine whether a violation occurredand to impose a civil penalty described in subdivision (a).
(2) A groundwater sustainability agency may administratively impose a civil penalty described in subdivision (a) after providingnotice and an opportunity for a hearing.
(3) In determining the amount of the penalty, the superior court or the groundwater sustainability agency shall take intoconsideration all relevant circumstances, including, but not limited to, the nature and persistence of the violation, the extent of theharm caused by the violation, the length of time over which the violation occurs, and any corrective action taken by the violator.
(c) A penalty imposed pursuant to this section shall be paid to the groundwater sustainability agency and shall be expended solelyfor purposes of this part.
(d) Penalties imposed pursuant to this section are in addition to any civil penalty or criminal fine under any other law.
SEC. 18.Chapter 10 (commencing with Section 10733) is added to Part 2.74 of Division 6 of the Water Code, to read:
CHAPTER 10. State Evaluation and Assessment10733.(a) The department shall periodically review the groundwater sustainability plans developed by groundwater sustainabilityagencies pursuant to this part to evaluate whether a plan conforms with Sections 10727.2 and 10727.4 and is likely to achieve thesustainability goal for the basin covered by the groundwater sustainability plan.

(b) If a groundwater sustainability agency develops multiple groundwater sustainability plans for a basin, the department shallevaluate whether the plans conform with Sections 10727.2, 10727.4, and 10727.6 and are together likely to achieve thesustainability goal for the basin covered by the groundwater sustainability plans.
(c) The department shall evaluate whether a groundwater sustainability plan adversely affects the ability of an adjacent basin toimplement their groundwater sustainability plan or impedes achievement of sustainability goals in an adjacent basin.
10733.2.(a) (1) By June 1, 2016, the department shall adopt regulations for evaluating groundwater sustainability plans, theimplementation of groundwater sustainability plans, and coordination agreements pursuant to this chapter.
(2) The regulations shall identify the necessary plan components specified in Sections 10727.2, 10727.4, and 10727.6 and otherinformation that will assist local agencies in developing and implementing groundwater sustainability plans and coordinationagreements.
(b) (1) The department may update the regulations, including to incorporate the best management practices identified pursuant toSection 10729.
(2) The regulations adopted pursuant to paragraph (1) of subdivision (a) shall identify appropriate methodologies andassumptions for baseline conditions concerning hydrology, water demand, regulatory restrictions that affect the availability ofsurface water, and unreliability of, or reductions in, surface water deliveries to the agency or water users in the basin, and theimpact of those conditions on achieving sustainability. The baseline for measuring unreliability and reductions shall include thehistoric average reliability and deliveries of surface water to the agency or water users in the basin.
(c) By June 1, 2016, the department shall adopt regulations for evaluating alternatives submitted pursuant to Section 10733.6.
(d) The department shall adopt the regulations, including any amendments thereto, authorized by this section as emergencyregulations in accordance with the Administrative Procedure Act (Chapter 3.5 (commencing with Section 11340) of Part 1 ofDivision 3 of Title 2 of the Government Code). The adoption of these regulations is an emergency and shall be considered by theOffice of Administrative Law as necessary for the immediate preservation of the public peace, health and safety, or generalwelfare. Notwithstanding the Administrative Procedure Act, emergency regulations adopted by the department pursuant to thissection shall not be subject to review by the Office of Administrative Law and shall remain in effect until revised by thedepartment.
(e) Before adopting and finalizing the regulations, the department shall conduct three public meetings to consider publiccomments. The department shall publish the draft regulations on its Internet Web site at least 30 days before the public meetings.One meeting shall be conducted at a location in northern California, one meeting shall be conducted at a location in the centralvalley of California, and one meeting shall be conducted at a location in southern California.
10733.3.The department shall post all notices it receives pursuant to Section 10723 or 10723.8 on its Internet Web site within 15 days ofreceipt.
10733.4.(a) Upon adoption of a groundwater sustainability plan, a groundwater sustainability agency shall submit the groundwatersustainability plan to the department for review pursuant to this chapter.
(b) If groundwater sustainability agencies develop multiple groundwater sustainability plans for a basin, the submission requiredby subdivision (a) shall not occur until the entire basin is covered by groundwater sustainability plans. When the entire basin iscovered by groundwater sustainability plans, the groundwater sustainability agencies shall jointly submit to the department all ofthe following:
(1) The groundwater sustainability plans.
(2) An explanation of how the groundwater sustainability plans implemented together satisfy Sections 10727.2, 10727.4, and10727.6 for the entire basin.
(3) A copy of the coordination agreement between the groundwater sustainability agencies to ensure the coordinatedimplementation of the groundwater sustainability plans for the entire basin.
(c) Upon receipt of a groundwater sustainability plan, the department shall post the plan on the department’s Internet Web siteand provide 60 days for persons to submit comments to the department about the plan.

(d) The department shall evaluate the groundwater sustainability plan within two years of its submission by a groundwatersustainability agency and issue an assessment of the plan. The assessment may include recommended corrective actions toaddress any deficiencies identified by the department.
10733.6.(a) If a local agency believes that an alternative described in subdivision (b) satisfies the objectives of this part, the local agencymay submit the alternative to the department for evaluation and assessment of whether the alternative satisfies the objectives ofthis part for the basin.
(b) An alternative is any of the following:
(1) A plan developed pursuant to Part 2.75 (commencing with Section 10750) or other law authorizing groundwater management.
(2) Management pursuant to an adjudication action.
(3) An analysis of basin conditions that demonstrates that the basin has operated within its sustainable yield over a period of atleast 10 years. The submission of an alternative described by this paragraph shall include a report prepared by a registeredprofessional engineer or geologist who is licensed by the state and submitted under that engineer’s or geologist’s seal.
(c) A local agency shall submit an alternative pursuant to this section no later than January 1, 2017, and every five yearsthereafter.
(d) The assessment required by subdivision (a) shall include an assessment of whether the alternative is within a basin that is incompliance with Part 2.11 (commencing with Section 10920). If the alternative is within a basin that is not in compliance withPart 2.11 (commencing with Section 10920), the department shall find the alternative does not satisfy the objectives of this part.
10733.8.At least every five years after initial submission of a plan pursuant to Section 10733.4, the department shall review any availablegroundwater sustainability plan or alternative submitted in accordance with Section 10733.6, and the implementation of thecorresponding groundwater sustainability program for consistency with this part, including achieving the sustainability goal. Thedepartment shall issue an assessment for each basin for which a plan or alternative has been submitted in accordance with thischapter, with an emphasis on assessing progress in achieving the sustainability goal within the basin. The assessment may includerecommended corrective actions to address any deficiencies identified by the department.
SEC. 19.Chapter 11 (commencing with Section 10735) is added to Part 2.74 of Division 6 of the Water Code, to read:
CHAPTER 11. State Intervention10735.As used in this chapter, the following terms have the following meanings:
(a) “Condition of long-term overdraft” means the condition of a groundwater basin where the average annual amount of waterextracted for a long-term period, generally 10 years or more, exceeds the long-term average annual supply of water to the basin,plus any temporary surplus. Overdraft during a period of drought is not sufficient to establish a condition of long-term overdraftif extractions and recharge are managed as necessary to ensure that reductions in groundwater levels or storage during a period ofdrought are offset by increases in groundwater levels or storage during other periods.
(b) “Person” means any person, firm, association, organization, partnership, business, trust, corporation, limited liabilitycompany, or public agency, including any city, county, city and county, district, joint powers authority, state, or any agency ordepartment of those entities. “Person” includes, to the extent authorized by federal or tribal law and subject to the limitationsdescribed in subdivisions (c) and (d) of Section 10720.3, the United States, a department, agency or instrumentality of the federalgovernment, an Indian tribe, an authorized Indian tribal organization, or interstate body.
(c) “Probationary basin” means a basin for which the board has issued a determination under Section 10735.2.
(d) “Significant depletions of interconnected surface waters” means reductions in flow or levels of surface water that ishydrologically connected to the basin such that the reduced surface water flow or levels have a significant and unreasonableadverse impact on beneficial uses of the surface water.
10735.2.(a) The board, after notice and a public hearing, may designate a basin as a probationary basin, if the board finds one or more ofthe following applies to the basin:

(1) After June 30, 2017, none of the following have occurred:
(A) A local agency has elected to be a groundwater sustainability agency that intends to develop a groundwater sustainabilityplan for the entire basin.
(B) A collection of local agencies has formed a groundwater sustainability agency or prepared agreements to develop one ormore groundwater sustainability plans that will collectively serve as a groundwater sustainability plan for the entire basin.
(C) A local agency has submitted an alternative that has been approved or is pending approval pursuant to Section 10733.6. Ifthe department disapproves an alternative pursuant to Section 10733.6, the board shall not act under this paragraph until at least180 days after the department disapproved the alternative.
(2) The basin is subject to paragraph (1) of subdivision (a) of Section 10720.7, and after January 31, 2020, none of the followinghave occurred:
(A) A groundwater sustainability agency has adopted a groundwater sustainability plan for the entire basin.
(B) A collection of local agencies has adopted groundwater sustainability plans that collectively serve as a groundwatersustainability plan for the entire basin.
(C) The department has approved an alternative pursuant to Section 10733.6.
(3) After January 31, 2020, the department, in consultation with the board, determines that a groundwater sustainability plan isinadequate or that the groundwater sustainability program is not being implemented in a manner that will likely achieve thesustainability goal.
(4) The basin is subject to paragraph (2) of subdivision (a) of Section 10720.7, and after January 31, 2022, none of the followinghave occurred:
(A) A groundwater sustainability agency has adopted a groundwater sustainability plan for the entire basin.
(B) A collection of local agencies has adopted groundwater sustainability plans that collectively serve as a groundwatersustainability plan for the entire basin.
(C) The department has approved an alternative pursuant to Section 10733.6.
(5) The basin is subject to paragraph (2) of subdivision (a) of Section 10720.7, and after January 31, 2022, both of the followinghave occurred:
(A) The department, in consultation with the board, determines that a groundwater sustainability plan is inadequate or that thegroundwater sustainability plan is not being implemented in a manner that will likely achieve the sustainability goal.
(B) The board determines that the basin is in a condition of long-term overdraft or in a condition where groundwater extractionsresult in significant depletions of interconnected surface waters.
(b) In making the findings associated with paragraph (3) or (5) of subdivision (a), the department and board may rely on periodicassessments the department has prepared pursuant to Chapter 10 (commencing with Section 10733). The board may request thatthe department conduct additional assessments utilizing the regulations developed pursuant to Chapter 10 (commencing withSection 10733) and make determinations pursuant to this section. The board shall post on its Internet Web site and provide atleast 30 days for the public to comment on any determinations provided by the department pursuant to this subdivision.
(c) (1) The determination may exclude a class or category of extractions from the requirement for reporting pursuant to Part 5.2(commencing with Section 5200) of Division 2 if those extractions are subject to a local plan or program that adequately managesgroundwater within the portion of the basin to which that plan or program applies, or if those extractions are likely to have aminimal impact on basin withdrawals.
(2) The determination may require reporting of a class or category of extractions that would otherwise be exempt from reportingpursuant to paragraph (1) of subdivision (c) of Section 5202 if those extractions are likely to have a substantial impact on basinwithdrawals or requiring reporting of those extractions is reasonably necessary to obtain information for purposes of this chapter.
(3) The determination may establish requirements for information required to be included in reports of groundwater extraction,for installation of measuring devices, or for use of a methodology, measuring device, or both, pursuant to Part 5.2 (commencingwith Section 5200) of Division 2.

(4) The determination may modify the water year or reporting date for a report of groundwater extraction pursuant to Section5202.
(d) If the board finds that litigation challenging the formation of a groundwater sustainability agency prevented its formationbefore July 1, 2017, pursuant to paragraph (1) of subdivision (a) or prevented a groundwater sustainability program from beingimplemented in a manner likely to achieve the sustainability goal pursuant to paragraph (3) of subdivision (a), the board shall notdesignate a basin as a probationary basin for a period of time equal to the delay caused by the litigation.
10735.4.(a) If the board designates a basin as a probationary basin pursuant to paragraph (1) or (2) of subdivision (a) of Section 10735.2,a local agency or groundwater sustainability agency shall have 180 days to remedy the deficiency. The board may appoint amediator or other facilitator, after consultation with affected local agencies, to assist in resolving disputes, and identifying andimplementing actions that will remedy the deficiency.
(b) After the 180-day period provided by subdivision (a), the board may provide additional time to remedy the deficiency if itfinds that a local agency is making substantial progress toward remedying the deficiency.
(c) The board may develop an interim plan pursuant to Section 10735.8 for the probationary basin at the end of the periodprovided by subdivision (a) or any extension provided pursuant to subdivision (b), if the board, in consultation with thedepartment, determines that a local agency has not remedied the deficiency that resulted in designating the basin as aprobationary basin.
10735.6.(a) If the board designates a basin as a probationary basin pursuant to paragraph (3) of subdivision (a) of Section 10735.2, theboard shall identify the specific deficiencies and identify potential actions to address the deficiencies. The board may request thedepartment to provide local agencies, within 90 days of the designation of a probationary basin, with technical recommendationsto remedy the deficiencies.
(b) The board may develop an interim plan pursuant to Section 10735.8 for the probationary basin one year after the designationof the basin pursuant to paragraph (3) of subdivision (a) of Section 10735.2, if the board, in consultation with the department,determines that a local agency has not remedied the deficiency that resulted in designating the basin a probationary basin.
10735.8.(a) The board, after notice and a public hearing, may adopt an interim plan for a probationary basin.
(b) The interim plan shall include all of the following:
(1) Identification of the actions that are necessary to correct a condition of long-term overdraft or a condition where groundwaterextractions result in significant depletions of interconnected surface waters, including recommendations for appropriate action byany person.
(2) A time schedule for the actions to be taken.
(3) A description of the monitoring to be undertaken to determine effectiveness of the plan.
(c) The interim plan may include the following:
(1) Restrictions on groundwater extraction.
(2) A physical solution.
(3) Principles and guidelines for the administration of rights to surface waters that are connected to the basin.
(d) Except as provided in subdivision (e), the interim plan shall be consistent with water right priorities, subject to Section 2 ofArticle X of the California Constitution.
(e) Where, in the judgment of the board, a groundwater sustainability plan, groundwater sustainability program, or anadjudication action can be relied on as part of the interim plan, either throughout the basin or in an area within the basin, theboard may rely on, or incorporate elements of, that plan, program, or adjudication into the interim plan adopted by the board orallow local agencies to continue implementing those parts of a plan or program that the board determines are adequate.

(f) In carrying out activities that may affect the probationary basin, state entities shall comply with an interim plan adopted by theboard pursuant to this section unless otherwise directed or authorized by statute and the state entity shall indicate to the board inwriting the authority for not complying with the interim plan.
(g) (1) After the board adopts an interim plan under this section, the board shall determine if a groundwater sustainability plan oran adjudication action is adequate to eliminate the condition of long-term overdraft or condition where groundwater extractionsresult in significant depletions of interconnected surface waters, upon petition of either of the following:
(A) A groundwater sustainability agency that has adopted a groundwater sustainability plan for the probationary basin or aportion thereof.
(B) A person authorized to file the petition by a judicial order or decree entered in an adjudication action in the probationarybasin.
(2) The board shall act on a petition filed pursuant to paragraph (1) within 90 days after the petition is complete. If the board, inconsultation with the department, determines that the groundwater sustainability plan or adjudication action is adequate, theboard shall rescind the interim plan adopted by the board for the probationary basin, except as provided in paragraphs (3) and (4).
(3) Upon request of the petitioner, the board may amend an interim plan adopted under this section to eliminate portions of theinterim plan, while allowing other portions of the interim plan to continue in effect.
(4) The board may decline to rescind an interim plan adopted pursuant to this section if the board determines that the petitionerhas not provided adequate assurances that the groundwater sustainability plan or judicial order or decree will be implemented.
(5) This subdivision is not a limitation on the authority of the board to stay its proceedings under this section or to rescind oramend an interim plan adopted pursuant to this section based on the progress made by a groundwater sustainability agency or inan adjudication action, even if the board cannot make a determination of adequacy in accordance with paragraph (1).
(h) The board’s authority to adopt an interim plan under this section does not alter the law establishing water rights priorities orany other authority of the board.
10736.(a) The board shall adopt or amend a determination or interim plan under Section 10735.2 or 10735.8 in accordance withprocedures for quasi-legislative action.
(b) The board shall provide notice of a hearing described in subdivision (a) of Section 10735.2 or subdivision (a) of Section10735.8 as follows:
(1) At least 90 days before the hearing, the board shall publish notice of the hearing on its Internet Web site.
(2) At least 90 days before the hearing, the board shall notify the department and each city, county, or city and county in whichany part of the basin is situated.
(3) (A) For the purposes of this paragraph, the terms “board-designated local area” and “local agency” have the same meaning asdefined in Section 5009.
(B) At least 60 days before the hearing, the board shall mail or send by electronic mail notice to all persons known to the boardwho extract or who propose to extract water from the basin, or who have made written or electronic mail requests to the board forspecial notice of hearing pursuant to this part. If any portion of the basin is within a board-designated local area, the records madeavailable to the board by the local agency in accordance with paragraph (4) of subdivision (d) of Section 5009 shall include thenames and addresses of persons and entities known to the local agency who extract water from the basin, and the board shall mailor send by electronic mail notice to those persons.
(c) The board shall provide notice of proceedings to amend or repeal a determination or plan under Section 10735.2 or 10735.8 asappropriate to the proceedings, taking into account the nature of the proposed revision and the person likely to be affected.
(d) (1) Except as provided in paragraphs (2) and (3), Chapter 3.5 (commencing with Section 11340) of Part 1 of Division 2 ofTitle 2 of the Government Code does not apply to any action authorized pursuant to Section 10735.2 or 10735.8.
(2) The board may adopt a regulation in accordance with Chapter 3.5 (commencing with Section 11340) of Part 1 of Division 2of Title 2 of the Government Code setting procedures for adopting a determination or plan.

(3) The board may adopt a regulation applying or interpreting this part pursuant to Section 1530 if the board determines that theemergency regulation is reasonably necessary for the allocation, administration, or collection of fees authorized pursuant toSection 1529.5.
10736.2.Division 13 (commencing with Section 21000) of the Public Resources Code does not apply to any action or failure to act by theboard under this chapter, other than the adoption or amendment of an interim plan pursuant to Section 10735.8.
10736.4.The extraction or use of water extracted in violation of an interim plan under this part shall not be relied upon as a basis forestablishing the extraction or use of water to support a claim in an action or proceeding for determination of water rights.
10736.6.(a) The board may order a person that extracts or uses water from a basin that is subject to an investigation or proceeding underthis chapter to prepare and submit to the board any technical or monitoring program reports related to that person’s or entity’sextraction or use of water as the board may specify. The costs incurred by the person in the preparation of those reports shall beara reasonable relationship to the need for the report and the benefit to be obtained from the report. If the preparation of individualreports would result in a duplication of effort, or if the reports are necessary to evaluate the cumulative effect of severaldiversions or uses of water, the board may order any person subject to this subdivision to pay a reasonable share of the cost ofpreparing reports.
(b) (1) An order issued pursuant to this section shall be served by personal service or registered mail on the party to submittechnical or monitoring program reports or to pay a share of the costs of preparing reports. Unless the board issues the order aftera hearing, the order shall inform the party of the right to request a hearing within 30 days after the party has been served. If theparty does not request a hearing within that 30-day period, the order shall take effect as issued. If the party requests a hearingwithin that 30-day period, the board may adopt a decision and order after conducting a hearing.
(2) In lieu of adopting an order directed at named persons in accordance with the procedures specified in paragraph (1), the boardmay adopt a regulation applicable to a category or class of persons in accordance with Chapter 3.5 (commencing with Section11340) of Part 1 of Division 2 of Title 2 of the Government Code.
(c) Upon application of a person or upon its own motion, the board may review and revise an order issued or regulation adoptedpursuant to this section in accordance with the procedures set forth in subdivision (b).
(d) In conducting an investigation or proceeding pursuant to this part, the board may inspect the property or facilities of a personto ascertain whether the purposes of this part are being met and to ascertain compliance with this part. The board may obtain aninspection warrant pursuant to the procedures set forth in Title 13 (commencing with Section 1822.50) of Part 3 of the Code ofCivil Procedure for the purposes of an inspection pursuant to this subdivision.
SEC. 20.The provisions of this act are severable. If any provision of this act or its application is held invalid, that invalidity shall notaffect other provisions or applications that can be given effect without the invalid provision or application.
SEC. 21. No reimbursement is required by this act pursuant to Section 6 of Article XIII B of the California Constitution for certain costs that may be incurred by a local agency or school district because, in that regard, this act creates a new crime or infraction,eliminates a crime or infraction, or changes the penalty for a crime or infraction, within the meaning of Section 17556 of theGovernment Code, or changes the definition of a crime within the meaning of Section 6 of Article XIII B of the California Constitution.
However, if the Commission on State Mandates determines that this act contains other costs mandated by the state,reimbursement to local agencies and school districts for those costs shall be made pursuant to Part 7 (commencing with Section17500) of Division 4 of Title 2 of the Government Code.
SEC. 22.The Legislature finds and declares that Section 10 of this act, which adds Section 5206 to the Water Code and Section 16 of thisact, which adds Section 10730.8 to the Water Code, impose a limitation on the public’s right of access to the meetings of publicbodies or the writings of public officials and agencies within the meaning of Section 3 of Article I of the California Constitution.Pursuant to that constitutional provision, the Legislature makes the following findings to demonstrate the interest protected bythis limitation and the need for protecting that interest:

In order to allow this act to fully accomplish its goals, it is necessary to protect proprietary information submitted pursuant to thisact as confidential. Therefore, it is in the state’s interest to limit public access to this information.
SEC. 23.This act shall only become operative if Senate Bill 1168 of the 2013–14 Regular Session is enacted and becomes effective.

1992 Assembly Bill 3030 (AB3030)
With AB 3030 in 1992, sections 10750‐10756 of the California Water Code (AB 3030) provided a systematic procedure for an existing local agency to develop a groundwater management plan. This section of the code provides such an agency with the powers of a water replenishment district to raise revenue to pay for facilities to manage the basin (extraction, recharge, conveyance, quality).
Groundwater Management entrance in CA Water Code
AB 3030 (California Water Code Section 10750 et seq.) allowed certain defined existing local agencies to develop a groundwater management plan in groundwater basins defined in DWR Bulletin 118. No new level of government is formed. Action is voluntary not mandatory.
The plan can be developed only after a public hearing and adoption of a resolution of intention to adopt a groundwater management plan. If there is no majority opposition of assessed land value (no improvements), the plan can be adopted within 35 days. If the majority is opposed the plan cannot be adopted and no new plan may be attempted for 1 year. Once the plan is adopted, rules and regulations must be adopted to implement the program called for in the plan.
Given the involvement and jurisdiction of the courts, AB 3030 plans cannot be adopted in adjudicated basins or in basins where groundwater is managed under other sections of the Water Code without the permission of the court or the other agency.
AB 3030 also introduced twelve technical components that may be included in the groundwater
management plan. It is highly encouraged by DWR to include as many of the twelve components as
necessary for the successful management of the basin groundwater resources. The following is the list
of the twelve voluntary components:
1. The control of saline water intrusion. 2. Identification and management of wellhead protection areas and recharge areas. 3. Regulation of the migration of contaminated groundwater. 4. The administration of a well abandonment and well destruction program. 5. Mitigation of conditions of overdraft. 6. Replenishment of groundwater extracted by water producers. 7. Monitoring of groundwater levels and storage. 8. Facilitating conjunctive use operations. 9. Identification of well construction policies. 10. The construction and operation by the local agency of groundwater contamination cleanup,
recharge, storage, conservation, water recycling, and extraction projects. 11. The development of relationships with state and federal regulatory agencies. 12. The review of land use plans and coordination with land use planning agencies to assess
activities which create a reasonable risk of groundwater contamination.

File is secured, see separate PDF

California Sportfishing Protection Alliance “An Advocate for Fisheries, Habitat and Water Quality” 3536 Rainier Avenue, Stockton, CA 95204 T: 209-464-5067, F: 209-464-1028, E: [email protected], W: www.calsport.org 1 May 2011 Ms. Pamela Creedon, Executive Officer Mr. Ken Landau, Assistant Executive Officer Ms. Diana Messina, Supervising WRCE Mr. Josh Palmer, WRCE Regional Water Quality Control Board Central Valley Region VIA: Electronic Submission 11020 Sun Center Drive, Suite 200 Hardcopy if Requested Rancho Cordova, CA 95670-6144 RE: Order Amending Waste Discharge Requirements Order R5-2008-0173 (NPDES Permit
No. CA0078662) for El Dorado Irrigation District, Deer Creek Wastewater Treatment Plant, Eldorado County
Dear Mesdames Creedon, Messina and Messrs. Landau, Palmer, The California Sportfishing Protection Alliance (CSPA) has reviewed the proposed Amended Waste Discharge Requirements (NPDES No. CA0078662) for the Deer Creek Wastewater Treatment Plant (Permit) and submits the following comments. CSPA requests status as a designated party for this proceeding. CSPA is a 501(c)(3) public benefit conservation and research organization established in 1983 for the purpose of conserving, restoring, and enhancing the state’s water quality and fishery resources and their aquatic ecosystems and associated riparian habitats. CSPA has actively promoted the protection of water quality and fisheries throughout California before state and federal agencies, the State Legislature and Congress and regularly participates in administrative and judicial proceedings on behalf of its members to protect, enhance, and restore California’s degraded water quality and fisheries. CSPA members reside, boat, fish and recreate in and along waterways throughout the Central Valley, including El Dorado County. 1. The proposed Permit establishes Effluent Limitations for metals based on the
hardness of the effluent as opposed to the ambient instream receiving water hardness and fails to use the mandated equations as required by Federal Regulations, the California Toxics Rule (CTR, 40 CFR 131.38(c)(4)).

CSPA Comments, Amended NPDES Permit, Deer Creek Wastewater Treatment Plant. 1 May 2011, page 2 of 25.
Hardness The Court’s Ruling
The California Toxics Rule (CTR) Federal Regulation 40 CFR 131.38(c)(4) states that: “For purposes of calculating freshwater aquatic life criteria for metals from the equations in paragraph (b)(2) of this section, for waters with a hardness of 400 mg/l or less as calcium carbonate, the actual ambient hardness of the surface water shall be used in those equations.” (Emphasis added). As is stated in the proposed Permit, the permit is being amended based on a ruling of the Superior Court of California (Case number 34-2009-80000309) (County of Sacramento, Judge Timothy M. Frawley, 26 January 2011). With regard to the development of effluent limitations for hardness dependant metals and an objection by the Regional Board the court found that:
“Ruling. Respondent Board's objection is denied. The Court finds no ambiguity in the footnote. If the Board calculates the fresh aquatic life criteria for hardness-dependent metals based on the hardness value of the downstream receiving water, it must use the actual ambient hardness of the surface water after the effluent and receiving water have fully mixed It cannot use the hardness values of the receiving water "at or immediately downstream of the discharge outfall," since this is (for all intents and purposes) the same as using the hardness values of the effluent, which is prohibited.”
With regard to hardness dependant metals the Court ruling, in part, also contains the following:
On balance, the Court is persuaded that the term "ambient," as applied in the CTR, refers to the surface water surrounding the aquatic life. In light of the purpose of the CTR, it would be unreasonable to interpret the regulation as requiring States to ignore the effect of the effluent on the hardness (and consequent toxicity) of the downstream receiving water. The most reasonable interpretation of the regulation, therefore, is that the metal criteria should be calculated based on the actual ambient hardness of the surface water after the effluent and receiving water mix.7 Stated differently, the criteria should be based on the upstream receiving water hardness, adjusted, as necessary, for the effects of the effluent. (Footnote No. 7 on page 14 of the final court order states that: “This means after the effluent and receiving water fully mix”) For the determination of the CTR hardness-dependent metals criteria, the Board has the discretion to use either the upstream receiving water hardness values or the hardness values of the downstream mixture of the effluent and the receiving water, whichever is most protective.
The final court ruling is quite clear that when developing effluent limitations for hardness dependant metals that: (1) The hardness of the surface water must be used;

CSPA Comments, Amended NPDES Permit, Deer Creek Wastewater Treatment Plant. 1 May 2011, page 3 of 25.
(2) Use of the effluent hardness is prohibited; and (3) The term ambient means that the hardness must be taken from outside the area where the
effluent mixes with the receiving stream. (4) Either the upstream surface water hardness or the downstream surface water hardness
(following complete mixing with the effluent) may be used to develop effluent limitations for hardness dependant metals, whichever is most protective.
The Effluent Hardness Was Used in the Revised Permit
The proposed Permit, page F-23, states that:
“For both copper and zinc, using the “fully mixed” hardness value results in criteria that are higher (less stringent) than using the effluent-dominated (100% effluent) condition in the receiving water. Effluent limitations based on the less stringent criteria would allow the effluent to cause receiving water toxicity during low-flow conditions. Even assuming that would be a correct interpretation of the CTR and SIP or the EID Court Order, a more stringent effluent limitation would required to comply with the Basin Plan’s narrative toxicity objective unless the Board approves a mixing zone.14 Accordingly, this Order sets effluent limitations for copper and zinc based on low-flow conditions as shown in the above tables.” (Emphasis added)
The “above tables” referred to in the permit are Tables F-4 and F-5 on pages F-21 and F-22. The “low flow conditions” described in the text can be observed in Tables F-4 and F-5 in the far left hand lower column of the tables. The “low flow condition” in the tables represents “100% effluent” with a recorded effluent hardness value of 42 mg/l. Throughout the text in the proposed Permit, pages F-16 through F-26, discussing the development of effluent limitations for hardness dependant metals, the discussion is limited to the effluent and upstream ambient hardness. The downstream surface water ambient hardness, as defined by the court; following complete mixing is not discussed or numerically cited. While the Regional Board attempts to calculate this value, we can only conclude based on the total absence of downstream surface water ambient hardness values that it has not been sampled by the Discharger. On page F-20 of the proposed Permit, the discussion, equation 3 and the following Table F-4 are all based on the lowest observed effluent hardness of 42 mg/l. Again, based on the total absence of discussion of any downstream surface water sampling for hardness, the Regional Board’s decision process is based on the effluent hardness, which was confirmed by the Superior Court is prohibited. The proposed Permit discussion beginning on page F-23 again focuses on the effluent hardness. This can be observed by evaluation of equation 4 (page F-23) where the input value He represents the lowest observed effluent value. The data in Table F-5 are based on equation 4 and is therefore also based on the effluent hardness.

CSPA Comments, Amended NPDES Permit, Deer Creek Wastewater Treatment Plant. 1 May 2011, page 4 of 25.
The development of effluent limitations for hardness dependant metals in the proposed Permit is based on the effluent hardness or a combination of the effluent and upstream hardnesses. The use of the effluent hardness rather than the CTR prescribed “actual ambient hardness of the surface water” is contrary to the requirements of the CTR and directly violates the mandate of the Superior Court’s Order. As cited above the Superior Court clearly stated that use of the effluent hardness is prohibited.
The Wrong Equations Were Used The California Toxics Rule (CTR) Federal Regulation 40 CFR 131.38(c)(4) states that: “For purposes of calculating freshwater aquatic life criteria for metals from the equations in paragraph (b)(2) of this section, for waters with a hardness of 400 mg/l or less as calcium carbonate, the actual ambient hardness of the surface water shall be used in those equations.” (Emphasis added). The CTR requires the use of the equations presented in paragraph (b)(2) of 40 CFR 131.38 for the development of effluent limitations for hardness dependant metals. The required CTR equation is:
CTR Criterion = WER x (exp(m[ln(H)]+b)
where: H = hardness (mg/L as CaCO3), WER = water-effect ratio (with a default value of 1) and m, b = metal and criterion specific constants.
The CTR equation is cited as “equation 1” in the proposed Permit (page F-18). The proposed Permit cites a 2006 technical paper prepared by Robert Emerick (see footnote 7 on page F-18) as the source of the equations used by the Regional Board in developing the Permit effluent limitations for some hardness dependant metals (see Table F-6 footnote 2). Dr. Emerick’s equation 4 is presented on page F-23 of the proposed Permit. Equation 4 is not the same as equation 1 which is prescribed by the CTR. The use of equations other than those prescribed by the CTR for development of effluent limitations for hardness dependant metals is contrary to the requirements of the CTR.
The “ambient” hardness was not used Federal Regulation 40 CFR 131.38(c)(4) states that: “For purposes of calculating freshwater aquatic life criteria for metals from the equations in paragraph (b)(2) of this section, for waters with a hardness of 400 mg/l or less as calcium carbonate, the actual ambient hardness of the surface water shall be used in those equations.” (Emphasis added). The common dictionary definition of ambient is “in the surrounding area”, “encompassing on all sides”.

CSPA Comments, Amended NPDES Permit, Deer Creek Wastewater Treatment Plant. 1 May 2011, page 5 of 25.
In petitioning the Deer Creek permit, CSPA argued that the common definition of ambient of surrounding would eliminate any areas that included the wastewater effluent in consideration of the hardness used in determining criteria for hardness dependant metals. It is reasonable to assume, after considering the definition of ambient, that EPA is referring to the hardness of the receiving stream before it is potentially impacted by an effluent discharge. It is also reasonable to make this assumption based on past interpretations and since EPA, in permit writers’ guidance and other reference documents, generally assumes receiving streams have dilution, which would ultimately “encompass” the discharge. Ambient conditions are in-stream conditions unimpacted by the discharge. Confirming this definition, the SIP Sections 1.4.3.1 Ambient Background Concentration as an Observed Maximum and 1.4.3.2 state in part that: “If possible, preference should be given to ambient water column concentrations measured immediately upstream or near the discharge, but not within an allowed mixing zone for the discharge. The RWQCB shall have discretion to consider if any samples are invalid for use as applicable data due to evidence that the sample has been erroneously reported or the sample is not representative of the ambient receiving water column that will mix with the discharge.” CSPA’s view regarding the term ambient is also supported by a biological opinion issued by the US Fish and Wildlife Service (Service) and the National Marine Fisheries Service (NMFS) on March 24th 2000. On March 24, 2000 the US Fish and Wildlife Service (Service) and the National Marine Fisheries Service (NMFS) issued a biological opinion on the effects of the final promulgation of the CTR on listed species and critical habitats in California in accordance with section 7 of the Endangered Species Act of 1973, as amended (16 USC 1531 et seq.; Act). The biological opinion was issued to the U.S. Environmental Protection Agency, Region 9, with regard to the “Final Rule for the Promulgation of Water Quality Standards: Establishment of Numeric Criteria for Priority Toxic Pollutants for the State of California” (CTR)”. The document represented the Services’ final biological opinion on the effects of the final promulgation of the CTR on listed species and critical habitats in California in accordance with section 7 of the Endangered Species Act of 1973, as amended (16 USC 1531 et seq.; Act). The biological opinion contains the following discussion, beginning on page 205, regarding the use of hardness in developing limitations for toxic metals:
“The CTR should more clearly identify what is actually to be measured in a site water to determine a site-specific hardness value. Is the measure of hardness referred to in the CTR equations a measure of the water hardness due to calcium and magnesium ions only? If hardness computations were specified to be derived from data obtained in site water calcium and magnesium determinations alone, confusion could be avoided and more accurate results obtained (APHA 1985). Site hardness values would thus not include contributions from other multivalent cations (e.g., iron, aluminum, manganese), would not rise above calcium + magnesium hardness values, or result in greater-than-intended site criteria when used in formulas. In this Biological opinion, what the Services refer to as hardness is the water hardness due to calcium + magnesium ions only.

CSPA Comments, Amended NPDES Permit, Deer Creek Wastewater Treatment Plant. 1 May 2011, page 6 of 25.
The CTR should clearly state that to obtain a site hardness value, samples should be collected upstream of the effluent source(s). Clearly stating this requirement in the CTR would avoid the computation of greater-than-intended site criteria in cases where samples were collected downstream of effluents that raise ambient hardness, but not other important water qualities that affect metal toxicity (e.g., pH, alkalinity, dissolved organic carbon, calcium, sodium, chloride, etc.). Clearly, it is inappropriate to use downstream site water quality variables for input into criteria formulas because they may be greatly altered by the effluent under regulation. Alterations in receiving water chemistry by a discharger (e.g., abrupt elevation of hardness, changes in pH, exhaustion of alkalinity, abrupt increases in organic matter etc.) should not result, through application of hardness in criteria formulas, in increased allowable discharges of toxic metals. If the use of downstream site water quality variables were allowed, discharges that alter the existing, naturally-occurring water composition would be encouraged rather than discouraged. Discharges should not change water chemistry even if the alterations do not result in toxicity, because the aquatic communities present in a water body may prefer the unaltered environment over the discharge-affected environment. Biological criteria may be necessary to detect adverse ecological effects downstream of discharges, whether or not toxicity is expressed.”
The Regional Board has argued however that they had discretion to redefine “ambient” and were not constrained by common dictionary definitions. The Regional Board’s definition of “ambient” included the wastewater effluent. The Superior Court (Superior Court of California (Case number 34-2009-80000309) (County of Sacramento, Judge Timothy M. Frawley, 26 January 2011) ruled that the common dictionary definition of ambient was applicable, but that “ambient” also included the downstream waters after complete mix with the wastewater effluent had occurred. The proposed Permit continues to utilize the wastewater effluent hardness when establishing criteria for hardness dependant metals. This can best be observed by review of Tables F-4, F-5 and F-6 in which the “Fully Mixed Downstream Ambient Conditions” are based on the “Effluent Fraction” which ranges from 1% to 100%. This is also confirmed in the text regarding hardness in the Fact Sheet and by “equation 4” on page F-23 which is partly based on the “lowest observed effluent hardness”. The Regional Board in the proposed Permit continues to use the effluent as “ambient” in their calculation of criteria for hardness dependant metals contrary to common definition, the language in the SIP, guidance from the US Fish and Wildlife Service and the National Marine Fisheries Service and a ruling by the Superior Court.

CSPA Comments, Amended NPDES Permit, Deer Creek Wastewater Treatment Plant. 1 May 2011, page 7 of 25.
Use of the “Surface Water Hardness” Federal Regulation 40 CFR 131.38(c)(4) states that: “For purposes of calculating freshwater aquatic life criteria for metals from the equations in paragraph (b)(2) of this section, for waters with a hardness of 400 mg/l or less as calcium carbonate, the actual ambient hardness of the surface water shall be used in those equations.” (Emphasis added). As is stated above, the proposed Permit continues to utilize the wastewater effluent hardness when establishing criteria for hardness dependant metals. This can best be observed by review of Tables F-4, F-5 and F-6 in which the “Fully Mixed Downstream Ambient Conditions” are based on the “Effluent Fraction” which ranges from 1% to 100%. This is also confirmed in the text regarding hardness in the Fact Sheet and by “equation 4” on page F-23 which is partly based on the “lowest observed effluent hardness”. The wastewater effluent is not “surface water”. The Regional Board has not argued this point but has steadfastly refused to acknowledge or discuss the CTR requirement that the hardness of the surface water be used in calculating the criteria for hardness dependant metals. The proposed Permit is again based on the hardness of the effluent, not surface water, for hardness dependant metals.
The “Emerick” Paper cannot be used
The proposed Permit relies on the “Emerick” paper in developing effluent limitations for hardness dependant metals. The “Emerick” paper is inappropriate for use based on the following:
• The “Emerick” paper does not utilize the hardness of the surface water but also heavily relies on the effluent hardness. Recall that 40 CFR 131.38 requires use of the actual ambient hardness of the surface water.
• The “Emerick” paper does not solely use the equations specified in 40 CFR 131.38(c)(4). • The “Emerick” paper does not utilize the ambient hardness also heavily relies on the
effluent hardness. • The “Emerick” paper ignores the other important water qualities that affect metal toxicity
(e.g., pH, alkalinity, dissolved organic carbon, calcium, sodium, chloride, etc.) and focuses solely on hardness. As can be seen the U.S. EPA’s latest ambient criteria for copper (Aquatic Life Ambient Freshwater Quality Criteria—Copper 2007 Revision), the latest science utilizes these other quality that affect metal toxicity. Since EPA published the hardness-based recommendation for copper criteria in 1984, new data have become available on copper toxicity and its effects on aquatic life. The Biotic Ligand Model (BLM) – a metal bioavailability model that uses receiving water body characteristics to develop site-specific water quality criteria – utilizes the best available science and serves as the basis for the new national recommended criteria. The BLM requires ten input parameters to calculate a freshwater copper criterion (a saltwater BLM is not yet available): temperature, pH, dissolved organic carbon (DOC), calcium, magnesium, sodium, potassium, sulfate, chloride, and alkalinity. The BLM is used to derive the criteria rather than as a post-derivation adjustment as was the case with the hardness-

CSPA Comments, Amended NPDES Permit, Deer Creek Wastewater Treatment Plant. 1 May 2011, page 8 of 25.
based criteria. This allows the BLM-based criteria to be customized to the particular water under consideration. The Regional Board failed to utilize the latest science in developing the proposed Permit.
Establishing a protective limitation
For the great majority of wastewater discharges to surface waters the hardness of the effluent is much greater than the hardness or the upstream surface water. In such cases, use of the higher hardness of the effluent to calculate discharge limitations for hardness dependant metals results in significantly less stringent discharge limitations. The “Emerick” method uses the higher effluent hardness to determine criteria as the effluent mixes with surface water. The Regional Board has used the “Emerick” method to generate these less stringent limitations stating that the methodology only eliminates what would have otherwise been overly protective limitations1. Adherence to the required CTR methodology using the lower surface water hardness would, under these circumstances, produce more stringent criteria. In reviewing the Central Valley Regional Board’s NPDES permits it can be seen that use of the “Emerick” method is used by default, ignoring the mandated CTR method of calculating criteria for hardness dependant metals. It has been questioned whether the Regional Board’s default use of the “Emerick” method constitutes an underground regulation. "Regulation" means every rule, regulation, order, or standard of general application or the amendment, supplement, or revision of any rule, regulation, order or standard adopted by any state agency to implement, interpret, or make specific the law enforced or administered by it, or to govern its procedure.” (Government Code section 11342.600). The Regional Board cannot produce a technical defense that use of the CTR prescribed methods is overly protective. To the contrary, the US Fish and Wildlife Service and the National Marine Fisheries Service in their biological opinion and U.S. EPA in developing new ambient criteria for copper, all state that the use of hardness alone, ignoring temperature, pH, dissolved organic carbon (DOC), calcium, magnesium, sodium, potassium, sulfate, chloride, and alkalinity, may not be protective of water quality. The agencies, in their biological opinion, state that only the lower upstream hardness should be used to account for the inaccuracies of using hardness alone. The Regional Board does not present any technical information to rebut the technical fisheries and water quality standards development experts at US Fish and Wildlife Service, the National Marine Fisheries Service or U.S. EPA. The Regional Board has refused to discuss the technical merits of the opinions given by the US Fish and Wildlife Service, the National Marine Fisheries Service and U.S. EPA, stating only that the opinions address the CTR and are not applicable to individual permitting actions. 1 See permits for Sacramento Regional (http://www.swrcb.ca.gov/centralvalley/board_decisions/adopted_orders/sacramento/r5-2010-0114_npdes.pdf, at pages F-22 and 23), The City of Auburn (http://www.swrcb.ca.gov/centralvalley/board_decisions/adopted_orders/placer/r5-2010-0090-01.pdf, page F-23 “An ECA based on a lower hardness (e.g., lowest upstream receiving water hardness) would also be protective, but would result in unreasonably stringent effluent limits considering the known conditions.”), Placer County SMD-1 (http://www.swrcb.ca.gov/centralvalley/board_decisions/adopted_orders/placer/r5-2010-0092.pdf, page F-26, “Use of a lower ECA (e.g., calculated based solely on the lowest upstream receiving water hardness) is also protective, but would lead to unreasonably stringent effluent limits considering the known conditions.”)

CSPA Comments, Amended NPDES Permit, Deer Creek Wastewater Treatment Plant. 1 May 2011, page 9 of 25.
There are a few unique circumstances when a wastewater discharge occurs at the headwaters of a stream or where the natural upstream surface water hardness is higher than the effluent hardness. Under the first circumstance there is no upstream surface water hardness. Under the circumstance where the upstream hardness is higher than the effluent hardness; use of the upstream surface water hardness will produce criteria that are not sufficiently protective of water quality. This is the condition observed at Deer Creek. The unique circumstances do not nullify the regulatory requirements to use the ambient surface water hardness or to use the CTR prescribed equations when calculating criteria for hardness dependant metals. There is however a legal and technically correct way to properly address these situations. The methodology to protect water quality in these rare events is prescribed in the federal regulations: the CTR method must be followed to show that the developed criteria are not protective of water quality; 40 CFR 122.44 (d)(1) should be cited as requiring the development of limitations more stringent than the promulgated effluent limitations, and; use of the CTR prescribed method using the lower hardness used to develop the more protective limitations. The Regional Board’s consistent use of the “Emerick” method, and the Regional Board’s assessment that use of the CTR prescribed methodology using the lowest observed hardness is overly protective, are without technical or legal merit. 2. The Proposed Permit Fails to Include an Effluent Limitation for Aluminum that is
Protective of the Aquatic Life Beneficial Use of the Receiving Stream With Regard to Chronic Toxicity. The Proposed Permit Cites the Development of a Site Specific Water Quality Standard for Aluminum But Fails to Comply with all Regulatory Requirements for Development of such a Standard.
The Superior Court of California (Case number 34-2009-80000309) (County of Sacramento, Judge Timothy M. Frawley, 26 January 2011) ruled that:
“The Court finds that this matter should be remanded to the Board to reconsider its effluent limitation for aluminum. In developing an effluent limitation for aluminum, the Board shall (a) either use the EPA chronic criterion for aluminum, or develop a site-specific standard for aluminum sufficient to protect freshwater aquatic life; and (b) conduct a pollutant variability analysis in determining the MEC for aluminum.”
The proposed Permit, page 2 Finding No. 5, states that:
“The Court required the Central Valley Water Board to either use the USEPA chronic criterion for aluminum or develop a site-specific standard for aluminum to protect freshwater aquatic life. A site-specific objective was developed by using site-specific data and studies, including the establishment of the arid West Technical Report as an applicable study for use at Deer Creek. Based on the site-specific data the narrative toxicity objective is not exceeded but a conservative limit of 200 µg/L per year was added because the pollutant variability analysis estimated the MEC to be greater than 200 µg/L.”

CSPA Comments, Amended NPDES Permit, Deer Creek Wastewater Treatment Plant. 1 May 2011, page 10 of 25.
The maximum measured wastewater effluent aluminum concentration at the Deer Creek wastewater treatment plant was 150 ug/l. The statistically projected maximum effluent concentration was 705 ug/l. (Permit F-37 and F-38)
Federal Regulations, 40 CFR 122.44 (d)(i), requires that; “Limitations must control all pollutants or pollutant parameters (either conventional, nonconventional, or toxic pollutants) which the Director determines are or may be discharged at a level which will cause, have the reasonable potential to cause, or contribute to an excursion above any State water quality standard, including State narrative criteria for water quality.” The Basin Plan contains a narrative water quality objective for toxicity that states in part that “[a]ll waters shall be maintained free of toxic substances in concentrations that produce detrimental physiological responses in human, plant, animal, or aquatic life” (narrative toxicity objective). Where numeric water quality objectives have not been established, 40 CFR §122.44(d) specifies that WQBELs may be established using USEPA criteria guidance under CWA section 304(a), proposed State criteria or a State policy interpreting narrative criteria supplemented with other relevant information, or an indicator parameter. U.S. EPA developed National Recommended Ambient Water Quality Criteria for protection of freshwater aquatic life for aluminum to prevent toxicity to freshwater aquatic life. The recommended ambient criteria four-day average (chronic) and one-hour average (acute) criteria for aluminum are 87 µg/l and 750 µg/l, respectively. US EPA’s 87 ug/l chronic criterion was developed using low pH and hardness testing. California Central Valley waters, the Sacramento River, at the Valley floor, have been sampled to have hardnesses as low as 39 mg/l CaCO3 by the USGS in February 1996 for the National Water Quality Assessment Program. Contributory streams, especially foothill streams, have also been sampled and shown to contain even lower hardness levels. US EPA recognized in their ambient criteria development document, (Ambient Water Quality Criteria for Aluminum, EPA 440/5-86-008) that the pH was in the range 6.5 to 6.6 and that the hardness was below 20 mg/l. Typical values for pH and hardness in the Central Valley alone warrant use of the chronic ambient criteria for aluminum. Despite the hardness and pH values used in the development of the criteria; U.S. EPA’s conclusions in their Ambient Criteria for the Protection of Freshwater Aquatic Life recommends that application of the ambient criteria as necessary to be protective of the aquatic beneficial uses of receiving waters in lieu of site-specific criteria. The Regional Board and their proposed Permit cites US EPA’s Ambient Criteria for the Protection of Freshwater Aquatic Life for Aluminum (criteria) as not being representative or necessary because the chronic criteria were based on a low hardness and low pH. The Regional Board cites one section of the criteria development document but ignores the final recommendation to use the recommended criteria absent a site-specific objective for aluminum. The Regional Board’s citation of the criteria development document is incomplete its review, for example the criteria development document (EPA 440/5-86-008) also cites that:
169 ug/l of aluminum caused a 24% reduction in the growth of young brook trout. 174 ug/l of aluminum killed 58% of the exposed striped bass.

CSPA Comments, Amended NPDES Permit, Deer Creek Wastewater Treatment Plant. 1 May 2011, page 11 of 25.
Bioaccumulation factors ranged from 50 to 231 for young brook trout exposed to aluminum for 15 days. Aluminum at 169 ug/l caused a 24% reduction in the weight of young brook trout.
These citations are particularly important as the Regional Board ignores the chronic toxicity impacts from the criteria document. The chronic toxicity endpoints are not only those that produce mortality but impact growth and reproduction in aquatic life where aquatic life is not limited to fish but also includes invertebrates and aquatic plants. The cited numbers from EPA’s criteria document are particularly relevant in Deer Creek as trout have been documented to be present. US EPA recommends that understanding the Guidelines for Deriving Numerical National Water Quality Criteria for the Protection of Aquatic Organisms and Their Uses is necessary in order to understand the text, tables and calculations of a criteria document. The Regional Board’s assessment of the use of low hardness and low pH clearly shows they did not heed EPA’s advice in reviewing the criteria development procedures for water quality criteria or the final recommendations. The Regional Board occasionally cites individual aluminum toxicity testing at various locations; again individual testing is not a valid replacement for developing fully protective criteria. A prime example of a state utilizing good water quality standards development techniques for developing a site specific standard for aluminum is the state of Indiana where a final chronic criterion of 174 ug/l was established in 1997. In 2003, Canada adopted pH dependant freshwater aquatic life criteria for aluminum that ranges from 84 ug/l to 252 ug/l. Ignoring the final recommendation of the criteria misses the protective intermediate measures to protect against mortality and reductions to growth and reproduction. The Regional Board claims to have developed a site specific objective for aluminum. EPA’s criteria document states that they did a complete literature search and evaluated all of the available scientifically valid information. As one can see from the Regional Board’s inclusion of very limited aluminum data in their analysis, they only included the data that agrees with their desired outcome; the Arid West Report and limited toxicity tests under local wastewater discharger control. The Regional Board excluded all of the above cited data that indicate that lower levels of aluminum cause chronic toxicity.
Limitation time frames Federal Regulation 40 CFR 122.45 (d)(2) requires that permit for POTWs establish Effluent Limitations as average weekly and average monthly unless impracticable. The proposed Permit, page 11, establishes Effluent Limitations for aluminum as an annual average contrary to the cited Federal Regulation. Establishing the Effluent Limitation for aluminum in accordance with the Federal Regulation is not impracticable. Proof of impracticability is properly a steep slope and the Regional Board has not presented any evidence that properly and legally limiting aluminum is impracticable. Impracticable – incapable of being put into practice with the available means; incapable of being performed or accomplished by the means employed or at hand.
Legal Requirements for Site specific Limitations

CSPA Comments, Amended NPDES Permit, Deer Creek Wastewater Treatment Plant. 1 May 2011, page 12 of 25.
The proposed Permit, page 2 Finding 5, states that a site specific objective for aluminum was developed and is the basis for the limitations in the Permit. Federal and State laws and regulations specify the minimum requirements for developing site-specific standards and objectives. The Regional Board failed to cite or comply with any legal requirement in their development of the cited site specific objective for aluminum. Federal Regulations 40 CFR 122.44
(vi) Where a State has not established a water quality criterion for a specific chemical pollutant that is present in an effluent at a concentration that causes, has the reasonable potential to cause, or contributes to an excursion above a narrative criterion within an applicable State water quality standard, the permitting authority must establish effluent limits using one or more of the following options:
(A) Establish effluent limits using a calculated numeric water quality criterion for the pollutant which the permitting authority demonstrates will attain and maintain applicable narrative water quality criteria and will fully protect the designated use. Such a criterion may be derived using a proposed State criterion, or an explicit State policy or regulation interpreting its narrative water quality criterion, supplemented with other relevant information which may include: EPA's Water Quality Standards Handbook, October 1983, risk assessment data, exposure data, information about the pollutant from the Food and Drug Administration, and current EPA criteria documents; or
(B) Establish effluent limits on a case-by-case basis, using EPA's water quality criteria, published under section 304(a) of the CWA, supplemented where necessary by other relevant information; or
(C) Establish effluent limitations on an indicator parameter for the pollutant of concern, provided:
( 1 ) The permit identifies which pollutants are intended to be controlled by the use of the effluent limitation;
( 2 ) The fact sheet required by §124.56 sets forth the basis for the limit, including a finding that compliance with the effluent limit on the indicator parameter will result in controls on the pollutant of concern which are sufficient to attain and maintain applicable water quality standards;
( 3 ) The permit requires all effluent and ambient monitoring necessary to show that during the term of the permit the limit on the indicator parameter continues to attain and maintain applicable water quality standards; and

CSPA Comments, Amended NPDES Permit, Deer Creek Wastewater Treatment Plant. 1 May 2011, page 13 of 25.
( 4 ) The permit contains a reopener clause allowing the permitting authority to modify or revoke and reissue the permit if the limits on the indicator parameter no longer attain and maintain applicable water quality standards.
Federal Regulations 40 CFR 131
§ 131.1 Scope.
This part describes the requirements and procedures for developing, reviewing, revising, and approving water quality standards by the States as authorized by section 303(c) of the Clean Water Act.
§ 131.5 EPA authority.
(a) Under section 303(c) of the Act, EPA is to review and to approve or disapprove State-adopted water quality standards. The review involves a determination of:
(1) Whether the State has adopted water uses which are consistent with the requirements of the Clean Water Act;
(2) Whether the State has adopted criteria that protect the designated water uses;
(3) Whether the State has followed its legal procedures for revising or adopting standards;
(4) Whether the State standards which do not include the uses specified in section 101(a)(2) of the Act are based upon appropriate technical and scientific data and analyses, and
(5) Whether the State submission meets the requirements included in §131.6 of this part and, for Great Lakes States or Great Lakes Tribes (as defined in 40 CFR 132.2) to conform to section 118 of the Act, the requirements of 40 CFR part 132.
(b) If EPA determines that the State's or Tribe's water quality standards are consistent with the factors listed in paragraphs (a)(1) through (a)(5) of this section, EPA approves the standards. EPA must disapprove the State's or Tribe's water quality standards and promulgate Federal standards under section 303(c)(4), and for Great Lakes States or Great Lakes Tribes under section 118(c)(2)(C) of the Act, if State or Tribal adopted standards are not consistent with the factors listed in paragraphs (a)(1) through (a)(5) of this section. EPA may also promulgate a new or revised standard when necessary to meet the requirements of the Act.
(c) Section 401 of the Clean Water Act authorizes EPA to issue certifications pursuant to the requirements of section 401 in any case where a State or interstate agency has no authority for issuing such certifications.

CSPA Comments, Amended NPDES Permit, Deer Creek Wastewater Treatment Plant. 1 May 2011, page 14 of 25.
§ 131.6 Minimum requirements for water quality standards submission.
The following elements must be included in each State's water quality standards submitted to EPA for review:
(a) Use designations consistent with the provisions of sections 101(a)(2) and 303(c)(2) of the Act.
(b) Methods used and analyses conducted to support water quality standards revisions.
(c) Water quality criteria sufficient to protect the designated uses.
(d) An antidegradation policy consistent with §131.12.
(e) Certification by the State Attorney General or other appropriate legal authority within the State that the water quality standards were duly adopted pursuant to State law.
(f) General information which will aid the Agency in determining the adequacy of the scientific basis of the standards which do not include the uses specified in section 101(a)(2) of the Act as well as information on general policies applicable to State standards which may affect their application and implementation.
State Law California Water Code, § 13241. Water quality objectives
Each regional board shall establish such water quality objectives in water quality control plans as in its judgment will ensure the reasonable protection of beneficial uses and the prevention of nuisance; however, it is recognized that it may be possible for the quality of water to be changed to some degree without unreasonably affecting beneficial uses. Factors to be considered by a regional board in establishing water quality objectives shall include, but not necessarily be limited to, all of the following: (a) Past, present, and probable future beneficial uses of water. (b) Environmental characteristics of the hydrographic unit under consideration, including the quality of water available thereto. (c) Water quality conditions that could reasonably be achieved through the coordinated control of all factors which affect water quality in the area. (d) Economic considerations. (e) The need for developing housing within the region. (f) The need to develop and use recycled water.
Federal regulation 40 CFR 131.11(b)(1)
(a) Inclusion of pollutants: (1) States must adopt those water quality criteria that protect the designated use. Such criteria must be based on sound scientific rationale and must

CSPA Comments, Amended NPDES Permit, Deer Creek Wastewater Treatment Plant. 1 May 2011, page 15 of 25.
contain sufficient parameters or constituents to protect the designated use. For waters with multiple use designations, the criteria shall support the most sensitive use. (b) Form of criteria: In establishing criteria, States should: (1) Establish numerical values based on: (i) 304(a) Guidance; or (ii) 304(a) Guidance modified to reflect site-specific conditions; or (iii) Other scientifically defensible methods; (2) Establish narrative criteria or criteria based upon biomonitoring methods where numerical criteria cannot be established or to supplement numerical criteria.
Policy for Implementation of Toxics Standards for Inland Surface Waters, Enclosed Bays, and Estuaries of California, 2005, (SIP)
5.2 Site-Specific Objectives: If a priority pollutant criterion or objective is inappropriate for a particular water body (i.e., it does not protect the beneficial uses or, based on site-specific conditions, a less stringent standard may be warranted), a water quality objective that differs from the applicable criterion or objective may be developed for the site.
Development of Site-Specific Objectives Water quality objectives shall be developed in a manner consistent with State and federal law and regulations. In accordance with the State’s Porter-Cologne Water Quality Control Act (Division 7 of the Water Code), objectives must provide for the reasonable protection of beneficial uses based on consideration of the factors listed in Water Code Section 13241. In accordance with federal law (CWA) and regulations (40 CFR 131.11, revised as of July 1, 1997), the objectives must be based on sound scientific rationale and protect the designated beneficial uses of the receiving water. The RWQCB shall use scientifically defensible methods appropriate to the situation to derive the objectives. Such methods may include U.S. EPA-approved methods (e.g., Water Effects Ratio [WER] procedure, recalculation procedure, a combination of recalculation and WER procedures, Resident Species Procedure), and/or other methods specified in the workplan. A site-specific objective adopted by the RWQCB may include a compliance schedule. However, if attainment of the potential objective(s) developed under the study is anticipated to be infeasible (as defined in 40 CFR 131.10(g), revised as of July 1, 1997), or if the RWQCB otherwise determines it is appropriate, a *use attainability analysis (UAA) may be conducted. The RWQCB shall conduct, with the participation of interested persons, as appropriate, the UAA in accordance with 40 CFR 131.10(j) (revised as of July 1, 1997). If the UAA shows that attainment of the designated beneficial use(s) is not feasible (pursuant to 40 CFR 131.10(g) (revised as of July 1, 1997), the RWQCB shall designate an alternative beneficial use or subcategory of use, and develop appropriate water quality objectives to

CSPA Comments, Amended NPDES Permit, Deer Creek Wastewater Treatment Plant. 1 May 2011, page 16 of 25.
protect the new use(s). Both the use(s) and the objective(s) established to protect it would be reevaluated during the triennial reviews of the State’s water quality standards.
Use of the Arid West Report The Arid West Report is not applicable to this discharge. 1. The Arid West Report clearly states this is the case by presenting the map on page 3-1. The map clearly shows that the central valley is excluded from the report. 2. Page 3-2 of the Arid West Report characterizes the applicable water bodies for which the report is developed. “The hydrology of arid west streams can affect the application of water quality standards, especially for ephemeral and effluent-dependent waters. For example:
� Flashy nature of flow in ephemeral streams means that they are dry for significant lengths of time and then temporarily filled with water. Accordingly, the exposure duration assumptions inherent in federally recommended criteria may not be appropriate, and as such could be modified. Deer Creek flows year round. The Deer Creek Wastewater treatment plant is mandated by the State Board, division of water rights to discharge a minimum flow year round. � Effluent-dependent streams are artificially created habitats where the ecological community present is, by definition, adapted to the flow regime, i.e., the existing aquatic life use is dependent on the nature of the waterbody created. The extent to which aquatic life becomes established in an effluent-dependent stream will be influenced by the duration and frequency of the effluent discharge. For example, some wastewater facilities are designed primarily to provide reclaimed water for reuse. However, occasionally these facilities may have to discharge to an ephemeral waterbody for a few days or weeks. The expectations for the aquatic community that develops downstream of these intermittently discharging facilities systems will be quite different from the community that develops in a waterbody that receives effluent all of the time. The Deer Creek Wastewater treatment plant is mandated by the State Board, division of water rights to discharge a minimum flow year round.
The Arid West report states on page 3-4 that: “Effluent-dependent streams support valuable riparian communities with high biodiversity of terrestrial plants and animals. In arid west waters, the differences between terrestrial vegetation upstream and downstream of a discharge can be striking, especially where the water is effluent-dependent.” The permit contains no information, and there is no information in the record showing that there is any difference between the upstream and downstream vegetation. To the contrary, CSPA representatives2 have
2 Richard McHenry as a Civil Engineer, worked for the Central Valley Regional Board from 1987 through 2006, for much of that time he was assigned direct responsibility as a senior engineer for the regulation of EID’s Deer Creek

CSPA Comments, Amended NPDES Permit, Deer Creek Wastewater Treatment Plant. 1 May 2011, page 17 of 25.
visited the Deer Creek wastewater treatment plant site on numerous occasions and found both the upstream and downstream vegetation along the Deer Creek riparian corridor to be lush and fully developed. The Regional Board states in the proposed Permit, page F-31, that Deer Creek has the same characteristics as Arid West waters. Arid west waters are typified as dry stream beds where vegetation only exists downstream based on the wastewater being discharged; dry desert streambeds (see figure 3.2 on page 3.2 of the Arid West Report). Deer Creek is located east of Sacramento as the central valley rises into the Sierra Foothills south of the community of Cameron Park. There is nothing in the Deer Creek watershed that is similar to the waters described in the Arid West Report. An aerial map of the Deer Creek wastewater treatment plant, showing the surrounding vegetation can be seen at http://wikimapia.org/#lat=38.6274321&lon=-120.9842777&z=15&l=0&m=b&v=8&ifr=1. The Arid West Report states on page 4-13 that: “Although AWQC are designed to protect most species nationwide, criteria are derived from toxicity tests primarily with surrogate laboratory organisms. These surrogates are usually those species encountered in perennial streams in mesic environments, e.g., the eastern U.S., the Pacific Northwest, and the intermountain Rocky Mountains, such as rainbow trout. A much smaller body of toxicological knowledge exists for stream biota characteristic of the arid parts of the West. The responses of species adapted to effluent-dependent waters to discharged pollutants are even less well understood. EPA regulations and guidance documents provide a procedure to recalculate site-specific water quality criteria that reflect local, unique conditions, or exposed populations." Deer Creek support a population of rainbow trout3 unlike the waterbodies described in the Arid West Report. The Regional Board has cited Evaluation of the EPA Recalculation Procedure in the Arid West Technical Report (May 2006). The title of the document infers recalculation of water quality criteria with the intent of developing site specific water quality criteria. This is confirmed in the Forward of the report presented on page ii (AR014031) which states that:
“The purpose of this fifth report, Evaluation of EPA Recalculation Procedure in Arid West Effluent Dependent Waters, (“Recalculation Procedure Study”) was to evaluate use of the Recalculation Procedure on selected water quality criteria with different modes of toxicity in specific arid West waters. In addition, based on the findings from this evaluation, a User’s Guide for Development of Site-Specific Water Quality Standards in
wastewater treatment plant. Mr. McHenry was present and participated in numerous compliance inspections at the Deer Creek wastewater treatment plant. 3 Direct observation by Mr. Richard McHenry and as cited from the Deer Creek permit R5-2002-0210, page 4 (e): “e. Preservation and Enhancement of Fish, Wildlife and Other Aquatic Resources. Deer Creek flows to the Cosumnes River. The California Department of Fish and Game (DFG) has verified that the fish species present in Deer Creek and downstream waters are consistent with both cold and warm water fisheries, that there is a potential for anadromous fish migration necessitating a cold water designation and that trout, a cold water species, have been found both upstream and downstream of the wastewater treatment plant. The Basin Plan (Table II-1) designates the Cosumnes River as being both a cold and warm freshwater habitat. Therefore, pursuant to the Basin Plan (Table II-1, Footnote (2)), the cold designation applies to Deer Creek. The cold-water habitat designation necessitates that the in-stream dissolved oxygen concentration be maintained at, or above, 7.0 mg/l.”

CSPA Comments, Amended NPDES Permit, Deer Creek Wastewater Treatment Plant. 1 May 2011, page 18 of 25.
Arid West Effluent-dependent Streams Using USEPA’s Recalculation Procedure was also prepared as a practical guide for water quality standards practitioners regarding use of the Recalculation Procedure for developing site-specific water quality standards.”
The Regional Board has not however recalculated the criteria and begun the legally required process of modifying the water quality criteria. The Regional Board has circumvented the legal water quality standards development process and applied the recommended water quality levels for Arid West waterbodies in NPDES permits. This is not only contrary to the stated intent of the report but conflicts with federal and state requirements for developing water quality standards, including site-specific standards. The Regional Board has failed to follow the legally required procedures for developing water quality standards, 40 CFR Part 131. The Regional Board has also failed to comply with the California Water Code, Porter Cologne Section 13241. The proposed Permit, page F-31, states that: “The Technical Report found that “speciation and/or complexation of aluminum is highly dependent on ambient water quality characteristics and ultimately determines the mechanism of toxicity. [Increased] Concentrations of calcium in the water was shown to decrease toxic effects to fish.” Yet, any analysis of calcium concentrations in Deer Creek is not presented. The proposed Permit then states in the next paragraph that: “There is no evidence that aluminum behaves differently in Deer Creek than in the Arid West Project water bodies, and no basis to expect that it would behave differently.” Clearly, if the Regional Board wishes to develop a site-specific objective for aluminum, the burden of proof is for them to prove that the proposed objective is fully protective of the beneficial uses of Deer Creek. None of the citations of the Arid west report appear to be applicable to Deer Creek.
Arid West Fish The proposed Permit spends a lot of space discussing fish populations in Arid West waters and compares them to Deer Creek fish. Since the proposed permit fails to show that any other non-Arid West stream has different fish, the point is lost. The proposed Permit finally get to their point on page F-34 by stating that: “Also, note that neither brook trout nor striped bass reside in Deer Creek, which are the two species USEPA developed the chronic criterion at 87 µg/L to protect. Additionally, Deer Creek does not support a resident, self-sustaining population of rainbow trout, which exhibits similar sensitivities as brook trout.” The operable word in the previous sentence is apparently “self sustaining” since the following documentation confirms the presence of trout in Deer Creek. Waste Discharge Requirements, Order No. R5-2002-0210 states that:
“Preservation and Enhancement of Fish, Wildlife and Other Aquatic Resources. Deer Creek flows to the Cosumnes River. The California Department of Fish and Game (DFG) has verified that the fish species present in Deer Creek and downstream waters are consistent with both cold and warm water fisheries, that there is a potential for anadromous fish migration necessitating a cold water designation and that trout, a cold water species, have been found both upstream and downstream of the wastewater

CSPA Comments, Amended NPDES Permit, Deer Creek Wastewater Treatment Plant. 1 May 2011, page 19 of 25.
treatment plant. The Basin Plan (Table II-1) designates the Cosumnes River as being both a cold and warm freshwater habitat. Therefore, pursuant to the Basin Plan (Table II-1, Footnote (2)), the cold designation applies to Deer Creek. The cold-water habitat designation necessitates that the in-stream dissolved oxygen concentration be maintained at, or above, 7.0 mg/l.” The Permit Finding was apparently based on a letter from the Department of Fish and Game dated 2 June 1999, which states in part that: “… the fish species present in Deer Creek are consistent with both cold and warm water fisheries, that the potential for anadromous migration in Deer Creek necessitates a cold water designation and that trout, a cold water species, have been found both upstream and downstream of the wastewater treatment plant.”
The presence of trout on Deer Creek is also confirmed by El Dorado Irrigation District’s consultants:
The three benthic macroinvertebrate surveys (CDFG 1995, 1998; SWRI 1996) and 5 fish surveys (JSA 1993; CDFG 1994; SWRI 1996; CDFG 1997; Nature Conservancy 1999) that have been conducted in Deer Creek between 1993 and 1999 (collectively from north of Hwy 50 to the confluence with the Cosumnes River – see Figure 1) documented that Deer Creek supports warm water ecosystems upstream and downstream of the Deer Creek Wastewater Treatment Plant (DCWWTP). Three rainbow trout were observed in the 1994 survey conducted by CDFG, but rainbow trout were not observed in any of the other 4 fish surveys that were conducted between 1993 and 1999. Hence, Deer Creek does not support a viable, self-sustaining population of rainbow trout, either upstream or downstream of the DCWWTP (Staff Report, Volume II, section 7.4.2 and Appendices G and H; SWRI 1996 for detailed biological and water temperature data for Deer Creek).
The above cited CDFG fish survey identifies that the study area was upstream and downstream of the wastewater treatment plant. The locations of the other fish surveys were not clearly identified. However, areas identified as north of highway 50 or at the confluence with the Cosumnes River would not be located near the wastewater treatment plant. The information in the record is contrary to the proposed Permit conclusion that the fish used by U.S. EPA in evaluating the toxicity of aluminum are absent in Deer Creek. Clearly, trout are present in Deer Creek and U.S. EPA’s ambient criteria for aluminum are applicable.
The effects of pH and hardness
The proposed permit cites an Arid West based projected chronic toxicity limitation at the City of Auburn for aluminum of 287 ug/l, but discounts an association since the pH and hardness at Deer Creek are higher. Although not stated by the Regional Board their statement allowing that

CSPA Comments, Amended NPDES Permit, Deer Creek Wastewater Treatment Plant. 1 May 2011, page 20 of 25.
hardness and pH at higher values will render aluminum less toxic is from the footnote to U.S. EPA’s ambient criteria for aluminum 1999 update. We must remind the Regional Board of their oft cited revised ambient criteria footnote for aluminum which also states in part that: “but the effects of pH and hardness are not well quantified at this time”. The Regional Board uses the fact that Auburn and Deer Creek are located in the foothills at approximately the same elevation to conclude that they support the same aquatic life.
Arid West Calculations Finally, in evaluating the Arid West Studies and developing their “site-specific” objective, permit page F-37, the Regional Board uses the mean hardness rather than the most protective lowest hardness in their calculations. The mean hardness would not represent the worst case, most protective, limitation for chronic toxicity. It would be comical if it were not so potentially lethal, that the Regional Board has gone to such extreme measures to use the effluent hardness in developing limitations for toxic metals, yet uses the even more relaxed mean downstream hardness when developing their “objective” for aluminum. 3. The proposed Permit fails to require that analysis of water quality be performed by
a certified laboratory, contrary to the California Water Code Section 13176.
The Superior Court Order CalSPA's contented that the Board abused its discretion by failing to require that monitoring for pH and temperature be conducted by a properly certified laboratory, as mandated by California Water Code section 13176.The Court concludes that this issue should be decided in the first instance by the Board, not by the Court. Accordingly, the Court shall issue a writ remanding this matter to the Board to consider whether it is legally and factually possible for the District to comply with the requirements of Water Code section 13176 in the manner suggested by CalSPA.
Legal Requirements The law states that:
CWC § 13176. Certified laboratories (a) The analysis of any material required by this division shall be performed by a laboratory that has accreditation or certification pursuant to Article 3 (commencing with Section 100825) of Chapter 4 of Part 1 of Division 101 of the Health and Safety Code. (b) No person or public entity of the state shall contract with a laboratory for environmental analyses for which the State Department of Health Services requires accreditation or certification pursuant to this chapter, unless the laboratory holds a valid certification or accreditation. CWC § 13383. Monitoring requirements (a) The state board or a regional board may establish monitoring, inspection, entry, reporting, and recordkeeping requirements, as authorized by Sections 13160, 13376, or 13377 or by subdivisions (b) and (c) of this

CSPA Comments, Amended NPDES Permit, Deer Creek Wastewater Treatment Plant. 1 May 2011, page 21 of 25.
section, for any person who discharges, or proposes to discharge, to navigable waters, any person who introduces pollutants into a publicly owned treatment works, any person who owns or operates, or proposes to own or operate, a publicly owned treatment works or other treatment works treating domestic sewage, or any person who uses or disposes, or proposes to use or dispose, of sewage sludge. (b) The state board or the regional boards may require any person subject to this section to establish and maintain monitoring equipment or methods, including, where appropriate, biological monitoring methods, sample effluent as prescribed, and provide other information as may be reasonably required. (c) The state board or a regional board may inspect the facilities of any person subject to this section pursuant to the procedure set forth in subdivision (c) of Section 13267.
California Health and Safety Code (HSC) section 100825 (b) Laboratories that perform analyses on any combination of environmental samples, …for regulatory purposes shall obtain a certificate of accreditation pursuant to this article.
HSC section 100825 (c) (3) “Certificate” means a document issued to a laboratory that has received certification or accreditation pursuant to this article.
HSC 100825 (c) (16) “Regulatory purposes” means a statutory or regulatory requirement of a state board, office, or department, or of a division or program that requires a laboratory certified under this article or of any other state or federal agency that requires a laboratory to be accredited.
The laws included in both the California Water Code and the Health and Safety Code is clear in the requirement that laboratories doing environmental analyses be certified. The Regional Board failed to require certification in the NPDES permit issued to El Dorado Irrigation District’s Deer Creek Wastewater Treatment Plant for pH and temperature. Both pH and temperature are regulated under the permit and therefore subject to the cited laws. The original permit, which was the subject of CSPA’s petition and eventual legal action, exempted El Dorado Irrigation District from conduction pH and temperature analyses at a certified laboratory without explanation. In response to the Superior Court’s order; the permit has been modified to state that a $20,000 annual cost to conduct the analyses at a certified laboratory is overly expensive. The Regional Board does not cite any legal authority to exempt any Discharger from the legal requirements for laboratory certification.
A matter of routine Since there was originally no explanation of exempting a Discharger from using certified laboratories to conduct required monitoring; recently adopted permits for other Dischargers were reviewed for similar exemptions.

CSPA Comments, Amended NPDES Permit, Deer Creek Wastewater Treatment Plant. 1 May 2011, page 22 of 25.
Sacramento Regional County Sanitation District, Order No. R5-2010-0114, page E-2 No. C exempts the Discharger from lab certification for pH, turbidity, temperature and chlorine residual. (http://www.swrcb.ca.gov/centralvalley/board_decisions/adopted_orders/sacramento/r5-2010-0114_npdes.pdf) City of Auburn, Wastewater Treatment Plant, Order No. R5-2010-0090-01, page E-1 No. C: “In the event a certified laboratory is not available to the Discharger, analyses performed by a noncertified laboratory will be accepted provided a Quality Assurance-Quality Control Program is instituted by the laboratory.” (http://www.swrcb.ca.gov/centralvalley/board_decisions/adopted_orders/placer/r5-2010-0090-01.pdf) Based on a review of the above regional Board permits, it appears that the Regional Board routinely exempts wastewater Dischargers from the legal responsibility of conducting compliance monitoring at a certified laboratory, in the case of Auburn for apparently all parameters. An explanation of the technical or legal authority for such exemption could not be located in the permits.
The Regional Board’s explanation The following is an excerpt from the Deer Creek revised permit responding to the Court’s Order:
“The Court required the Central Valley Water Board to “consider whether it is legally and factually possible for the District to comply with the requirements of Water Code section 13176 either (i) by having its on-site laboratory re-certified or (ii) by having certified laboratory personnel travel to the District’s facility and conduct the testing on site.” California Water Code section 13176 requires that the analysis of water qualify be performed by a laboratory that has accreditation or certification under the Health and Safety Code (Cal Water Code § 13176). To comply, Central Valley Water Board staff communicated separately with the District, with California Department of Public Health and State Water Board staff, and with three private laboratories within the vicinity of the Deer Creek Facility, and the findings are summarized below. Last year the El Dorado Irrigation District leased its on-site laboratory at its El Dorado Hills Wastewater Treatment Plant to a certified private contract lab in an effort to save costs, and therefore, it is factually impossible for the District to recertify their on-site lab at the El Dorado Hills Wastewater Treatment Plant until the lease agreement expires. There are four private certified labs with mobile units located within the vicinity of the District’s facilities, which includes the private contract lab now located on-site. However, none of the labs’ mobile units are currently certified nor provide this service. Based on conversations with three of the four private labs, it would be possible to acquire certification, and the monitoring fees are approximately $100 per hour, which includes travel time to and from the monitoring locations. Thus, the cost to the District ranges from $51,000 to $81,000 per year for each Facility.

CSPA Comments, Amended NPDES Permit, Deer Creek Wastewater Treatment Plant. 1 May 2011, page 23 of 25.
The District provided information that the on-site private lab at the El Dorado Hills Wastewater Treatment Plant can conduct the in-situ monitoring for an approximate annual cost of $20,000 per facility; however, the District’s current budget is $19.661 million per year after recent local sewer fee increases, and the 2012 budget is projected at $20.362 million per year (www.eid.org/2011- 2012_OpBudget.pdf). The District states that they have reduced staff since 2008 by 34.8%, and increased sewerage fees up to 15%. Therefore, The Central Valley Water Board finds that the additional monitoring expense makes it economically impossible for the District to comply with the requirements of Water Code section 13176 without a further increase in local sewer fees”.
Closing their laboratory
The following is copied from EID News, 22 March 2010 (http://www.eid.org/doc_lib/03_news/2010/20100322_eidnews.pdf):
“We also laid off the four-person staff at our state-certified laboratory, where we test for water quality and perform other functions required by regulations,” Abercrombie said. “We are contracting with a private firm that will rent our lab facilities, perform our testing, and seek other business in the area. The district achieves overall savings of $536,000 the first year and $322,000 per year thereafter through the reduced personnel costs at the lab and the rental income.”
Wastewater Chemistry and Operations
An easy fix for certification In addition to compliance monitoring, wastewater treatment plant processes are monitored frequently by staff to assure the plant is operating properly. The following are excerpts from Operation of Wastewater Treatment Plants (A field Study Training Program, Fourth edition, Volume II) which is training guide for wastewater treatment plant operators:
“The pH test indicates whether a treatment process may continue to function properly at the pH measured. Each process in the plant has its own favorable range of pH which must be checked routinely.” (Page 555) “Temperature is one of the most important factors affecting biological growth. Temperature measurements can be helpful in detecting changes in raw wastewater quality. For example, an influent temperature drop may indicate large volumes of cold water from infiltration. An increase in temperature may indicate that hot water by industry are reaching your plant Temperature is one of the most frequently taken tests. One of the many uses is to calculate the prevent saturation of dissolved oxygen in the DO test.”

CSPA Comments, Amended NPDES Permit, Deer Creek Wastewater Treatment Plant. 1 May 2011, page 24 of 25.
Wastewater Treatment plants maintain a laboratory for operations control. Temperature and pH are typically measured using hand held devices; a thermometer and a pH meter. Even if EID did not maintain an operations laboratory, hand held devices would not require a dedicated area and could be certified independently. An option for EID’s Deer Creek wastewater treatment plant is to have the operations lab certified for pH and temperature.
Laboratory costs for pH and temperature sampling The proposed Permit states that: “the District’s current budget is $19.661 million per year after recent local sewer fee increases, and the 2012 budget is projected at $20.362 million per year.” The proposed Permit also indicates that the cost for an outside lab to conduct certified sampling and analysis is $20,000 per year. $20,000 is a small percentage of the total operating cost of $20,362,000. Wastewater treatment plants have ever-changing conditions and maintenance requirements. One never knows when a pump or a sewer line may break. It is also not uncommon that engineering services are required for system analysis or to prepare a technical report. For these reasons, wastewater treatment plants generally keep a reserve fund to cover unexpected costs. It would be highly unusual for a utility with an annual budget of over $20 million not to have a reserve fund well in excess of $20,000, a tenth of a percent of the total budget. The Regional Board’s assessment that a $20,000 expense at a facility with a budget over $20 million would necessitate a rate increase would appear at best to be without merit. The proposed Permit cites that the average dry weather flow at the Deer Creek wastewater treatment plant is 3.6 million gallons per day. Without any significant industrial discharges, at an approximate discharge level of 100 gallons per person per day, the plant would serve approximately 36,000 people. Assuming a household is 2.5 people, $20,000 per year divided equally between the local households would not be significantly over a dollar per year.
Ready means of compliance The Regional Board’s explanation for failing to requiring analyses at certified labs only comes down to the cost to the district, no other defense, technical or legal, is presented. In any of the cases, whether the District can certify their operations laboratory for pH and temperature or certify only their handheld pH and temperature devices or utilize reserve funds to cover the costs from outside laboratory analysis. There are options other than raising sewer rates to achieve certification for pH and temperature analyses. While no one is in favor of higher serer rates; the Regional Board has not presented any technical or legal reason why an increased sewer rate excuses a wastewater Discharger from the requirement to conduct environmental analyses at a certified laboratory. The Regional Board has also not cited, if they believe this case is based on an economical hardship, why are other new permits being written with the same exemption (see above Sacramento Regional and City of Auburn citations).

CSPA Comments, Amended NPDES Permit, Deer Creek Wastewater Treatment Plant. 1 May 2011, page 25 of 25.
Thank you for considering these comments. If you have questions or require clarification, please don’t hesitate to contact us. Sincerely,
Bill Jennings, Executive Director California Sportfishing Protection Alliance Attachment 1: Emerick, Developing Protective Hardness-Based Metal Effluent Limitations Attachment 2: Canadian Water Quality Guidelines for the Protection of Aquatic Life, Factsheet
April 03 Attachment 3: Memorandum, Indiana Department of Environmental Management, Recalculation
of Water Quality Criteria for Iron and Aluminum Attachment 4: EID News, 22 March 2010 Attachment 5: EID 2011-2012 Operating Budget Attachment 6: Memorandum From Mark Bradley Enforcement Manager, State Water Resources
Control Board, titled Must Any Sample Used for Regulatory Purposes be Analyzed By A Certified Laboratory?

Under the rocks and stones, there is water underground – Talking Heads
By Jay R. Lund and Thomas Harter
Groundwater is one of California’s most ubiquitous, widely used resources that is
unseen and misunderstood. Aquifers gather and store water and contaminants from
large areas over decades to eons to support many human and ecosystem functions. We
must manage groundwater wisely.
Groundwater is important to California in many ways. Roughly 30 percent of
water deliveries in California come directly from groundwater, with much more in
drought years, particularly long droughts (CDWR 2005, Megdal et al. 2009). Smaller
urban and rural areas depend entirely on groundwater, as do many sizable cities,
including Fresno. In all, 85 percent of Californians depend on groundwater for at least
part of their drinking water. (SWRCB, 2012). The state’s groundwater storage capacity is
more than 10 times that of all its surface reservoirs. Groundwater removes some, but
not all, forms of drinking water contaminants. Groundwater also accumulates
contaminants with time, particularly salts and nitrate. Groundwater pumping energy is
about 2% of California’s electricity use (5,800 GwH/yr of total 280,000 GwH/yr). And
many native species depend on streamflows and wetlands fed by springs and supported
by high groundwater tables. California’s multifaceted dependence on groundwater leads
to diverse controversies and myths.

Where does groundwater come from? Groundwater comes from surface water,
natural landscape recharge and irrigation return water. When pumping exceeds
recharge, it depletes aquifer storage. Recharge from streams occurs when the
groundwater table is lower than the stream. Natural landscape and irrigation water
recharge occurs when unused water percolates to below the root zone of plants and
crops. Percolation is vital to crops and ecosystems. Without some percolation, the root
zone accumulates salinity that kills plant life. In some areas, recharge basins, injection
wells and irrigation management are used to intentionally recharge and bank
groundwater during wet years or winters when ample water is available, for long-term
storage and use in dry years or summer. In much of California, groundwater pumping
has significantly lowered groundwater levels, which often increases recharge from
streams. Increased losses from streams to groundwater can reduce downstream flows
and affect ecosystems, if not regulated by upstream dams. Ultimately, almost all
groundwater used for irrigation and drinking water would have become streamflow
were it not pumped. (The largest exception is chronically overdrafted aquifers, less than
10% of California’s groundwater use.) .
Irrigation “inefficiency” is a major source of groundwater recharge. In the
Central Valley and other agricultural regions of California, irrigation inefficiency is a
major source of aquifer recharge (Ruud et al. 2004). In many areas, drought-year
groundwater supplies depend substantially on irrigation inefficiency in wetter years,
when surface water is available and used by farmers. Ironically, local inefficiency often
improves regional water use efficiency and sustainability. However, excessive
groundwater pumping causes long-term continual decline in groundwater levels
(“overdraft”) and irrigation inefficiency increases salt and nitrate loads to
groundwater. There are few perfect solutions in water.
Groundwater problems in California vary greatly and are locally quite
important.
Overdraft in California today occurs in parts of the Central Valley, especially the
Tulare Lake Basin, but also in some coastal and southern California basins with
limited surface water supplies and intensive agriculture. During wet periods with
more surface water deliveries, some overdraft reverses temporarily. Still,
statewide overdraft is estimated diversely to average between 500,000 acre-feet a
year to more than 1.5 million acre-feet a year, which amounts to 10-20 percent of

all water use in the Tulare Lake Basin (Faunt et al 2009). Other Central Valley
areas with groundwater overdraft are along the eastern margin of the San Joaquin
Valley, including east of the Delta. Overdraft in much of the Sacramento Valley
has been limited due to increased infiltration from streams induced by lower
groundwater tables (Harou and Lund 2008; Faunt, et al. 2009). Overdraft in
most of Southern California has largely ended by regulation from local
groundwater adjudications and water imports (Blomquist 1998). In Southern
California, the Tulare Lake Basin and elsewhere, drawdown of aquifers has
created empty groundwater storage capacity used to store water from wet years
for droughts (Vaux 1986; Jenkins 1998; Hanak et al. 2012). The Tulare Lake
Basin’s long dependence on the Delta and overdraft for about 60 percent of its
water supplies is a major regional and statewide challenge. The Tulare Lake Basin
uses more water than any other region of California – about 8 million acre-feet a
year. Delta imports and San Joaquin River diversion supply about 3 million acre-
feet; local streams, 3.2 million acre-feet; local groundwater inflows from
precipitation, 1.1 million acre-feet; and 0.7-1.5 million acre-feet from groundwater
overdraft (Hanak et al. 2011; CDWR 2009). The high value of Tulare Lake Basin
agriculture, its dependence on water imports and overdraft, and the accumulation
of salts and nitrate in this closed basin raise substantial long-term economic and
social challenges for this region and the state (Chou 2012).
Nitrate contamination is one of the most widespread groundwater problems
worldwide and in California, affecting drinking water supplies in many
agricultural or historically agricultural areas. While even large cities such as
Fresno are affected, nitrate contamination is most expensive for small rural water
supplies that lack economies of scale. Nitrate contamination affects many
groundwater-dependent systems in California, including more than 200,000
people in small and household wells in the Tulare and Salinas basins (Harter et al.
2012). Most nitrate contamination is from agricultural fertilizers, although other
sources, notably septic tanks and dairies, can be important locally. Most
agricultural areas can expect nitrate contamination of drinking water supplies.
Source control of nitrate discharge is only a partial long-term solution because of
the large extent of contamination and its decades of travel in
groundwater. Providing drinking water solutions and compensation for affected
communities now and into the foreseeable future is an unavoidable and urgently
needed response (Harter et al 2012). Nitrate problems for drinking water are

often compounded by naturally occurring arsenic, chromium, uranium, and other
groundwater contaminants (SWRCB 2012).
Salinity accumulation is another long-term groundwater quality challenge.
Salt accumulation is particularly problematic on the Westside of the Tulare Lake
and San Joaquin basins, which lack much ability to export salt from imported
water or local soils – affecting about 500,000 acres of farmland (SJVDP 1990). In
many other parts of California, such as the cities of Davis and Woodland, the
accumulation of salts in groundwater is threatening the viability of urban
groundwater water use, because of wastewater regulations regarding the
consequently higher salinity in urban wastewater discharges. Statewide, major
sources of salt are local soils and aquifers, irrigation water, animal farming, and
municipal and industrial wastes – including salts from water softeners. Salts in
irrigation water and wastewater applied to crops or urban landscapes are
concentrated by evapotranspiration from plants, leaving salts behind. Salinity
accumulation has a history of ending agriculture in arid regions (Hillel 2000).
Land subsidence resulting from groundwater use has been considerable in
some areas, particularly in the Tulare Lake and San Joaquin basins. In the mid-
20th century, land subsidence in the San Joaquin Valley and Tulare Lake basins
has ranged from a few feet to over 30 feet (Poland et al 1975; Faunt et al. 2009).
Due to decreasing groundwater levels, land subsidence is recurring and remains a
threat in these regions (Corbett et al. 2011). While physically remarkable, there
has been insufficient analysis of the occurrence and implications of subsidence
and little accounting of the long-term economic costs. However, regional
subsidence can incur potentially large costs from flooding and insufficient slopes
on canal and drainage systems.
Decreased streamflows have occurred on many California streams, as
groundwater levels were lowered from pre-development levels. Lowered
groundwater levels drain water from rivers, stressing ecosystems during low-flow
times (Harou and Lund 2008; Faunt et al. 2009). Ironically, streams with an
upstream dam now often have higher summer streamflows than they would have
with natural runoff, despite surrounding groundwater levels being lowered.
Reservoir operations delivering summer streamflow significantly contribute to
groundwater recharge. But in unmanaged rivers, pumping drains water from

riparian ecosystems (Fleckenstein et al. 2004; Harter and Hines 2008; Howard
and Merrifield 2010) and more generally undermines surface supplies for junior
surface water right holders (who sometimes respond by increasing their own
groundwater pumping).
Should the State do anything?
The sky is not falling, in most places. California has widespread
groundwater problems, and probably always will. California is a dry place, after
all. Many groundwater problems are severe, growing and local. Some
groundwater problems could benefit from state action, but California’s
groundwater problems must be solved mostly at local and regional levels, perhaps
with some state legal, financial, and technical help. The state can provide better
institutional and information frameworks to help locals solve local and regional
groundwater problems.
Many local groundwater problems are being handled well locally.
California has had a remarkable record of effective local groundwater
management (Nelson 2011, 2012; ACWA 2011; Blomquist 1992). Historical
overdraft in some areas of California has been eliminated or limited by build-out
of surface water projects, and more recently by effective local conjunctive use in
much of the Central Valley or groundwater adjudication in Southern California. In
other areas, problems of groundwater depletion remain. Groundwater quality
management has been much more difficult, with accumulations of salt and nitrate
having so far defied local solutions. Groundwater quality and groundwater
overdraft management are closely linked, as are groundwater and surface water.
Creative regional solutions that consider these broader scales and
interconnections are needed. Support for successful development of stakeholder
supported local-regional management is also critical.
Some state reforms would be useful.
1. Official information is important. State agencies should declare areas at risk
of nitrate and salinity contamination. Many domestic well users will not know of
contamination without such official declarations. And local governments and

interests are likely to lack capacity or incentive to address long-term groundwater
contamination issues without the attention of state agencies.
2. Effective compensation is needed more than source control. Source
control for large-scale groundwater problems, such as nitrate and salt
contamination, often take decades to be effective, but people drink from and use
these aquifers every day. Declarations of at-risk areas should trigger
compensation mechanisms for affected water users, while long-term source
control policies are developed and implemented. Long-term source control poses
a dilemma for the state, as even the best source control may not provide clean
recharge and large-scale groundwater degradation often requires decades of
response time. Because degradation in some aquifers is long-term and perhaps
permanent for nitrate and salinity, providing mechanisms for information and
compensation are key state roles.
3. Better data and science. Much data is available on groundwater in California,
but too much of it is poorly organized, not in electronic format or hidden by
secrecy rules. Consequently, little synthetic work is done to develop insights from
these data. A serious technical program is needed, at arm’s length from
stakeholders, to develop the perspective and insights needed for informed public
policy and management discussions and actions. State efforts to account for and
model groundwater have been missing and hindered by data problems, but
advanced substantially for the Central Valley with the recent California
Department of Water Resources C2VSIM model and the U.S. Geological Survey
model, CVHM. While both substantially improve answers to major groundwater
questions, they still have great potential for further improvement.
4. Security of groundwater rights and integrated regional water
management. Except in adjudicated groundwater basins, where courts have
divided and allocated groundwater rights and established watermasters and
enforcement mechanisms, most groundwater use in California is largely
unregulated. Environmental limits on some surface water supplies for agriculture
and urban users have stressed groundwater to levels not seen since the 1950s and
‘60s. In addition, large-scale groundwater quality management, driven by the
state’s nutrient and salt management policy, is becoming intimately intertwined
with water quantity management. The state needs to find a way to more
expeditiously establish groundwater use rights in ways compatible with separately
regulated water quality and with physically connected, but legally separated
surface water rights. Groundwater recharge management, integrated with

groundwater quality management, in both urban areas and agricultural areas
must become part of state and local groundwater protection strategies.
5. The major overdraft areas of California create substantial economic
value. In the Tulare Lake Basin and numerous smaller basins, groundwater is
mined, as one would deplete gold, oil and other mineral deposits. Are there areas
of California where depletion of water should be viewed and accepted
economically? In many areas, new solutions should be sought to increase
groundwater banking and conjunctive use that allow water users to work within a
long-term water budget, particularly in agricultural regions. This approach would
provide a sustainable future for groundwater reservoirs (Scanlon et al., 2012;
Hanak et al. 2012).
California will always have groundwater problems, and its dependence on groundwater
is likely to increase with changes in demands, climate and environmental
regulations. Success will be in how effectively groundwater is managed, especially in
managing groundwater together with other water supplies and demands. Effective
management will require state and regional frameworks of information, organization
and authorities that help local water managers work effectively and transparently.
Effective management of overdraft, salinization and contamination also will require a
long-term perspective and serious technical efforts – through the end of the 21st century
and beyond. This requires an important, if limited, role for the state.
Jay R. Lund is the Ray B. Krone Professor of Civil and Environmental Engineering at
UC Davis and director of the university’s Center for Watershed Sciences. Thomas
Harter holds the Robert M. Hagan Endowed Chair in Water Management and Policy
at UC Davis.
Further reading
Association of California Water Agencies (ACWA) (2011), Sustainability from the
Ground Up – Groundwater Management in California – a Framework, Association of
California Water Agencies, Sacramento, CA, April.
Blomquist, W.A. (1992), Dividing the waters: governing groundwater in southern
California, ICS Press, San Francisco, CA.

California Department of Water Resources, California Water Plan Update 2005.
Corbett, F., T. Schetrit, and T. Harter, 2011. Crop Water Use, Groundwater Flow, and
Subsidence at Naval Air Station Lemoore, Fresno and Kings County, California, Final
Report, University of California, Davis, 353 p.
Chou, H. (2012), “Groundwater Overdraft in California’s Central Valley: Updated
CALVIN Modeling Using Recent CVHM and C2VSIM Representations,” Master’s thesis,
Department of Civil and Environmental Engineering, UC Davis.
Faunt, C.C., ed. (2009), Groundwater Availability of the Central Valley Aquifer,
California: U.S. Geological Survey Professional Paper 1766, 225 pp.
Fleckenstein, J., M. Anderson, G. Fogg, and J. Mount (2004), “Managing Surface
Water-Groundwater to Restore Fall Flows in the Cosumnes River,” Journal of Water
Resources Planning and Management, Vol. 130, No. 4, July.
Hanak, E., J. Lund, A. Dinar, B. Gray, R. Howitt, J. Mount, P. Moyle, and B. Thompson
(2011), Managing California’s Water: From Conflict to Reconciliation, Public Policy
Institute of California, San Francisco, CA, 500 pp.
Hanak, E. and E. Stryjewski (2012), “California’s Water Market, By the Numbers:
Update 2012,” Public Policy Institute of California, San Francisco, CA.
Harou, J.J. and J.R. Lund (2008), “Ending groundwater overdraft in hydrologic-
economic systems,” Hydrogeology Journal, Volume 16, Number 6, September, pp.
1039–1055.
Harter, T., et al. (2012), Addressing Nitrate in California’s Drinking Water with a
Focus on Tulare Lake Basin and Salinas Valley Groundwater. Report for the State
Water Resources Control Board Report to the Legislature. Center for Watershed
Sciences, University of California, Davis. 78 p.
Harter, T. (2008), Watersheds, Groundwater, and Drinking Water: A Practical Guide,
University of California, Agriculture and Natural Resources, 274 pp.

Harter, T. and R. Hines (2008), Scott Valley Community Groundwater Study Plan,
North Coast Regional Water Quality Control Board, 93 p.
Hillel, D. (2000), Salinity Management for Sustainable Irrigation: Integrating
Science, Environment, and Economics, World Bank, Washington DC.
Howard, J. and Merrifield, M. (2010), “Mapping Groundwater Dependent Ecosystems
in California.” PLoS ONE 5(6): e11249. doi:10.1371/journal.pone.0011249
San Joaquin Valley Drainage Program, 1990, A Management Plan for Agricultural
Subsurface Drainage and Related Problems on the Westside San Joaquin Valley,
Sacramento, California, 183 pages.
Nelson, Rebecca (2011), Uncommon Innovation: Developments in Groundwater
Management Planning in California, Water in the West Working Paper 1, Water in the
West Program, Stanford University, California, 43 pp., March 2011
Nelson, Rebecca (2012), “Improving Regional Groundwater Management in California,”
Prepared for the Natural Resources Defense Council, 44 pp., May 2012.
Megdal, S., R. Hamann, T. Harter, J. Jawitz, M. Jess (2009), Water, People, and the
Future: Water Availability for Agriculture in the United States, CAST Issue Paper 44, 20
pages.
Poland, J. F., B. E. Lofgren, R. L. Ireland, and R. G. Pugh (1975), Land subsidence in the
San Joaquin Valley as of 1972, USGS Geological Survey Professional Paper 437-H.
Ruud, N. C., T. Harter, and A. W. Naugle (2004), Estimation of groundwater pumping
as closure to the water balance of a semi-arid irrigated agricultural basin, J. of
Hydrology 297:51-73.
Scanlon, B.R., C.C. Faunt, L. Longuevergne, R.C. Reedy, W.M. Alley, V.L. McGuire, and
P.B. McMahon (2012), Groundwater depletion and sustainability of irrigation in the US
High Plains and Central Valley, Proceed. National Academy of Sci., Vol. 109, No. 24, pp.
9320-9325.

State Water Resources Control Board (SWRCB, 2012), California Communities That
Rely on Contaminated Groundwater, Draft Report to the Legislature.


(This page left blank to facilitate double sided printing)

Final Draft
Preamble – Purpose and Scope – Structure of the Policy
3/20/2012
3
Preamble Onsite wastewater treatment systems (OWTS) are useful and necessary structures that allow habitation at locations that are removed from centralized wastewater treatment systems. When properly sited, designed, operated, and maintained, OWTS treat domestic wastewater to reduce its polluting impact on the environment and most importantly protect public health. Estimates for the number of installations of OWTS in California at the time of this Policy are that more than 1.2 million systems are installed and operating. The vast majority of these are functioning in a satisfactory manner and meeting their intended purpose. However there have been occasions in California where OWTS for a varied list of reasons have not satisfactorily protected either water quality or public health. Some instances of these failures are related to the OWTS not being able to adequately treat and dispose of waste as a result of poor design or improper site conditions. Others have occurred where the systems are operating as designed but their densities are such that the combined effluent resulting from multiple systems is more than can be assimilated into the environment. From these failures we must learn how to improve our usage of OWTS and prevent such failures from happening again. As California’s population continues to grow, and we see both increased rural housing densities and the building of residences and other structures in more varied terrain than we ever have before, we increase the risks of causing environmental damage and creating public health risks from the use of OWTS. What may have been effective in the past may not continue to be as conditions and circumstances surrounding particular locations change. So necessarily more scrutiny of our installation of OWTS is demanded of all those involved, while maintaining an appropriate balance of only the necessary requirements so that the use of OWTS remains viable.
Purpose and Scope of the Policy The purpose of this Policy is to allow the continued use of OWTS, while protecting water quality and public health. This Policy recognizes that responsible local agencies can provide the most effective means to manage OWTS on a routine basis. Therefore as an important element, it is the intent of this policy to efficiently utilize and improve upon where necessary existing local programs through coordination between the State and local agencies. To accomplish this purpose, this Policy establishes a statewide, risk-based, tiered approach for the regulation and management of OWTS installations and replacements and sets the level of performance and protection expected from OWTS. In particular, the Policy requires actions for identified areas where OWTS contribute to water quality degradation that adversely affect beneficial uses.

Final Draft
Preamble – Purpose and Scope – Structure of the Policy
3/20/2012
4
This Policy only authorizes subsurface disposal of domestic strength, and in limited instances high strength, wastewater and establishes minimum requirements for the permitting, monitoring, and operation of OWTS for protecting beneficial uses of waters of the State and preventing or correcting conditions of pollution and nuisance. And finally, this Policy also conditionally waives the requirement for owners of OWTS to apply for and receive Waste Discharge Requirements in order to operate their systems when they meet the conditions set forth in the Policy. Nothing in this Policy supersedes or requires modification of Total Maximum Daily Loads or Basin Plan prohibitions of discharges from OWTS. This Policy applies to OWTS on federal, state, and Tribal lands to the extent authorized by law or agreement.
Structure of the Policy This Policy is structured into ten major parts: Definitions Definitions for all the major terms used in this Policy are provided within this part and wherever used in the Policy the definition given here overrides any other possible definition. [Section 1] Responsibilities and Duties Implementation of this Policy involves individual OWTS owners; local agencies, be they counties, cities, or any other subdivision of state government with permitting powers over OWTS; Regional Water Quality Control Boards; and the State Water Resources Control Board. [Sections 2, 3, 4, and 5] Tier 0 – Existing OWTS Existing OWTS that are properly functioning, and do not meet the conditions of failing systems or otherwise require corrective action (for example, to prevent groundwater impairment) as specifically described in Tier 4, and are not determined to be contributing to an impairment of surface water as specifically described in Tier 3, are automatically included in Tier 0. [Section 6]

Final Draft
Preamble – Purpose and Scope – Structure of the Policy
3/20/2012
5
Tier 1 – Low-Risk New or Replacement OWTS New or replacement OWTS that meet low risk siting and design requirements as specified in Tier 1, where there is not an approved Local Agency Management Program per Tier 2. [Sections 7 and 8] Tier 2 – Local Agency Management Program for New or Replacement OWTS California is well known for its extreme range of geological and climatic conditions. As such, the establishment of a single set of criteria for OWTS would either be too restrictive so as to protect for the most sensitive case, or would have broad allowances that would not be protective enough under some circumstances. To accommodate this extreme variance, local agencies may submit management programs (“Local Agency Management Programs”) for approval, and upon approval then manage the installation of new and replacement OWTS under that program. Local Agency Management Programs approved under Tier 2 provide an alternate method from Tier 1 programs to achieve the same policy purpose, which is to protect water quality and public health. In order to address local conditions, Local Agency Management Programs may include standards that differ from the Tier 1 requirements for new and replacement OWTS contained in Sections 7 and 8. As examples, a Local Agency Management Program may authorize different soil characteristics, usage of seepage pits, and different densities for new developments. Once the Local Agency Management Program is approved, new and replacement OWTS that are included within the Local Agency Management Program may be approved by the Local Agency. A Local Agency, at its discretion, may include Tier 1 standards within its Tier 2 Local Agency Management Program for some or all of its jurisdiction. However, once a Local Agency Management Program is approved, it shall supersede Tier 1 and all future OWTS decisions will be governed by the Tier 2 Local Agency Management Program until it is modified, withdrawn, or revoked.
[Section 9] Tier 3 – Impaired Areas OWTS that are near impaired water bodes may be addressed by a TMDL and its implementation program, or special provisions contained in a Local Agency Management Program. If there is no TMDL or special provisions, new or replacement OWTS within 600 feet of impaired water bodies listed in Attachment 2 must meet the specific requirements of Tier 3. [Section 10]

Final Draft
Preamble – Purpose and Scope – Structure of the Policy
3/20/2012
6
Tier 4 – OWTS Requiring Corrective Action OWTS that require corrective action or are either presently failing or fail at any time while this Policy is in effect are automatically included in Tier 4 and must follow the requirements as specified. [Section 11] Conditional Waiver of Waste Discharge Requirements The requirement to submit a report of waste discharge for discharges from OWTS that are in conformance with this policy is waived. [Section 12] Effective Date When this Policy becomes effective. [Section 13] Financial Assistance Procedures for local agencies to apply for funds to establish low interest loan programs for the assistance of OWTS owners in meeting the requirements of this Policy. [Section 14]
Attachment 1 AB 885 Regulatory Program Timelines. Attachment 2
Tables 4 and 5 specifically identify those impaired water bodies that have Tier 3 requirements and must have a completed TMDL by the date specified.
Attachment 3
Table 6 shows where one Regional Water Board has been designated to review and, if appropriate, approve new Local Agency Management Plans for a local agency that is within multiple Regional Water Boards’ jurisdiction.
What Tier Applies to my OWTS?
Existing OWTS that conform to the requirements for Tier 0 will remain in Tier 0 as long as they continue to meet those requirements. An existing OWTS will temporarily move from Tier 0 to Tier 4 if it is determined that corrective action is needed. The existing OWTS will return to Tier 0 once the corrective action is completed. Any major repairs conducted as corrective action must comply with Tier 1 requirements or Tier 2 requirements, whichever are in effect for that local area. An existing OWTS will move from Tier 0 to Tier 3 if it is adjacent to an impaired water body listed on Attachment 2, or is covered by a TMDL implementation plan.

Final Draft
Preamble – Purpose and Scope – Structure of the Policy
3/20/2012
7
In areas with no approved Local Agency Management Plan, new and replacement OWTS that conform to the requirements of Tier 1 will remain in Tier 1 as long as they continue to meet those requirements. A new or replacement OWTS will temporarily move from Tier 1 to Tier 4 if it is determined that corrective action is needed. The new or replacement OWTS will return to Tier 1 once the corrective action is completed. A new or replacement OWTS will move from Tier 1 to Tier 3 if it is adjacent to an impaired water body, or is covered by a TMDL implementation plan.
In areas with an approved Local Agency Management Plan, new and replacement OWTS that conform to the requirements of the Tier 2 Local Agency Management Plan will remain in Tier 2 as long as they continue to meet those requirements. A new or replacement OWTS will temporarily move from Tier 2 to Tier 4 if it is determined that corrective action is needed. The new or replacement OWTS will return to Tier 2 once the corrective action is completed. A new or replacement OWTS will move from Tier 2 to Tier 3 if it is adjacent to an impaired water body, or is covered by a TMDL implementation plan, or is covered by special provisions for impaired water bodies contained in a Local Agency Management Program.
Existing, new, and replacement OWTS in specified areas adjacent to water bodies that are identified by the State Water Board as impaired for pathogens or nitrogen and listed in Attachment 2 are in Tier 3. Existing, new, and replacement OWTS covered by a TMDL implementation plan, or covered by special provisions for impaired water bodies contained in a Local Agency Management Program are also in Tier 3. These OWTS will temporarily move from Tier 3 to Tier 4 if it is determined that corrective action is needed. The new or replacement OWTS will return to Tier 3 once the corrective action is completed.
Existing, new, and replacement OWTS that do not conform with the requirements to receive coverage under any of the Tiers (e.g., existing OWTS with a projected flow of more than 10,000 gpd) do not qualify for this Policy’s conditional waiver of waste discharge requirements, and will be regulated separately by the applicable Regional Water Board.

Final Draft
Definitions
3/20/2012
8
1.0 Definitions. The following definitions apply to this Policy:
“303 (d) list” means the same as "Impaired Water Bodies."
“At-grade system” means an OWTS dispersal system with a discharge point located at the preconstruction grade (ground surface elevation). The discharge from an at-grade system is always subsurface.
“Basin Plan” means the same as “water quality control plan” as defined in Division 7 (commencing with Section 13000) of the Water Code. Basin Plans are adopted by each Regional Water Board, approved by the State Water Board and the Office of Administrative Law, and identify surface water and groundwater bodies within each Region’s boundaries and establish, for each, its respective beneficial uses and water quality objectives. Copies are available from the Regional Water Boards, electronically at each Regional Water Boards website, or at the State Water Board’s Plans and Policies web page (http://www.waterboards.ca.gov/plans_policies/).
“Bedrock” means the rock, usually solid, that underlies soil or other unconsolidated, surficial material.
“CEDEN” means California Environmental Data Exchange Network and information about it is available at the State Water Boards website or http://www.ceden.org/index.shtml.
“Cesspool” means an excavation in the ground receiving domestic wastewater, designed to retain the organic matter and solids, while allowing the liquids to seep into the soil. Cesspools differ from seepage pits because cesspool systems do not have septic tanks and are not authorized under this Policy. The term cesspool does not include pit-privies and out-houses which are not regulated under this Policy.
“Clay” means a soil particle; the term also refers to a type of soil texture. As a soil particle, clay consists of individual rock or mineral particles in soils having diameters <0.002 mm. As a soil texture, clay is the soil material that is comprised of 40 percent or more clay particles, not more than 45 percent sand and not more than 40 percent silt particles using the USDA soil classification system.
“Cobbles” means rock fragments 76 mm or larger using the USDA soil classification systems.
“Dispersal system” means a leachfield, seepage pit, mound, at-grade, subsurface drip field, evapotranspiration and infiltration bed, or other type of system for final wastewater treatment and subsurface discharge.

Final Draft
Definitions
3/20/2012
9
“Domestic wastewater” means wastewater with a measured strength less then high-strength wastewater and is the type of wastewater normally discharged from, or similar to, that discharged from plumbing fixtures, appliances and other household devices including, but not limited to toilets, bathtubs, showers, laundry facilities, dishwashing facilities, and garbage disposals. Domestic wastewater may include wastewater from commercial buildings such as office buildings, retail stores, and some restaurants, or from industrial facilities where the domestic wastewater is segregated from the industrial wastewater. Domestic wastewater does not include wastewater from industrial processes or RV dump stations.
“Dump Station” means a facility intended to receive the discharge of wastewater from a holding tank installed on a recreational vehicle. A dump station does not include a full hook-up sewer connection similar to those used at a recreational vehicle park.
“Domestic well” means a groundwater well that provides water for human consumption and is not regulated by the California Department of Public Health.
“Earthen material” means a substance composed of the earth’s crust (i.e. soil and rock).
“EDF” see “electronic deliverable format.”
“Effluent” means sewage, water, or other liquid, partially or completely treated or in its natural state, flowing out of a septic tank, aerobic treatment unit, dispersal system, or other OWTS component.
“Electronic deliverable format” or “EDF” means the data standard adopted by the State Water Board for submittal of groundwater quality monitoring data to the State Water Board’s internet-accessible database system Geotracker (http://geotracker.waterboards.ca.gov/).
“Escherichia coli” means a group of bacteria predominantly inhabiting the intestines of humans or other warm-blooded animals, but also occasionally found elsewhere. Used as an indicator of human fecal contamination.
“Existing OWTS” means an OWTS that was constructed and operating prior to the effective date of this Policy, and OWTS for which a construction permit has been issued prior to the effective date of the Policy.
“Gravel-less chamber” system means a buried structure used to create an aggregate-free absorption area for infiltration and treatment of wastewater.
“Grease interceptor” means a passive interceptor that has a rate of flow exceeding 50 gallons-per-minute and that is located outside a building. Grease interceptors are used for separating and collecting grease from wastewater.
“Groundwater” means water below the land surface that is at or above atmospheric pressure.

Final Draft
Definitions
3/20/2012
10
“High-strength wastewater” means wastewater having a 30-day average concentration of biochemical oxygen demand (BOD) greater than 300 milligrams-per-liter (mg/L) or of total suspended solids (TSS) greater than 330 mg/L or a fats, oil, and grease (FOG) concentration greater than 100 mg/L prior to the septic tank or other OWTS treatment component.
“IAPMO” means the International Association of Plumbing and Mechanical Officials.
“Impaired Water Bodies” means those surface water bodies or segments thereof that are identified on a list approved first by the State Water Board and then approved by US EPA pursuant to Section 303(d) of the federal Clean Water Act.
“Local agency” means any subdivision of state government that has responsibility for permitting the installation of and regulating OWTS within its jurisdictional boundaries; typically a county, city, or special district.
“Major repair” means either: (1) for a dispersal system, repairs required for an OWTS dispersal system due to surfacing wastewater effluent from the dispersal field and/or wastewater backed up into plumbing fixtures because the dispersal system is not able to percolate the design flow of wastewater associated with the structure served, or (2) for a septic tank, repairs required to the tank for a compartment baffle failure or tank structural integrity failure such that either wastewater is exfiltrating or groundwater is infiltrating.
“Mottling” means a soil condition that results from oxidizing or reducing minerals due to soil moisture changes from saturated to unsaturated over time. Mottling is characterized by spots or blotches of different colors or shades of color (grays and reds) interspersed within the dominant color as described by the USDA soil classification system. This soil condition can be indicative of historic seasonal high groundwater level, but the lack of this condition may not demonstrate the absence of groundwater.
“Mound system” means an aboveground dispersal system (covered sand bed with effluent leachfield elevated above original ground surface inside) used to enhance soil treatment, dispersal, and absorption of effluent discharged from an OWTS treatment unit such as a septic tank. Mound systems have a subsurface discharge.
“New OWTS” means an OWTS permitted after the effective date of this Policy.
“NSF” means NSF International (a.k.a. National Sanitation Foundation), a not for profit, non-governmental organization that develops health and safety standards and performs product certification.
“Onsite wastewater treatment system(s)” (OWTS) means individual disposal systems, community collection and disposal systems, and alternative collection and disposal systems that use subsurface disposal. The short form of the term may be singular or plural. OWTS do not include “graywater” systems pursuant to Health and Safety Code Section 17922.12.

Final Draft
Definitions
3/20/2012
11
“Percolation test” means a method of testing water absorption of the soil. The test is conducted with clean water and test results can be used to establish the dispersal system design.
“Permit” means a document issued by a local agency that allows the installation and use of an OWTS, or waste discharge requirements or a waiver of waste discharge requirements that authorizes discharges from an OWTS.
“Person” means any individual, firm, association, organization, partnership, business trust, corporation, company, State agency or department, or unit of local government who is, or that is, subject to this Policy.
“Pit-privy” (a.k.a. outhouse, pit-toilet) means self-contained waterless toilet used for disposal of non-water carried human waste; consists of a shelter built above a pit in the ground into which human waste falls.
“Policy” means this Policy for Siting, Design, Operation and Management of OWTS.
“Pollutant” means any substance that alters water quality of the waters of the State to a degree that it may potentially affect the beneficial uses of water, as listed in a Basin Plan.
“Projected flows” means wastewater flows into the OWTS determined in accordance with any of the applicable methods for determining average daily flow in the USEPA Onsite Wastewater Treatment System Manual, 2002, or for Tier 2 in accordance with an approved Local Agency Management Program.
“Public Water System” is a water system regulated by the California Department of Public Health or a Local Primacy Agency pursuant to Chapter 12, Part 4, California Safe Drinking Water Act, Section 116275 (h) of the California Health and Safety Code.
“Public Water Well” is a ground water well serving a public water system. A spring which is not subject to the California Surface Water Treatment Rule (SWTR), CCR, Title 22, sections 64650 through 64666 is a public well.
“Qualified professional” means an individual licensed or certified by a State of California agency to design OWTS and practice as professionals for other associated reports, as allowed under their license or registration. Depending on the work to be performed and various licensing and registration requirements, this may include an individual who possesses a registered environmental health specialist certificate or is currently licensed as a professional engineer or professional geologist. For the purposes of performing site evaluations, Soil Scientists certified by the Soil Science Society of America are considered qualified professionals. A local agency may modify this definition as part of its Local Agency Management Program.

Final Draft
Definitions
3/20/2012
12
“Regional Water Board” is any of the Regional Water Quality Control Boards designated by Water Code Section 13200. Any reference to an action of the Regional Water Board in this Policy also refers to an action of its Executive Officer, including the conducting of public hearings, pursuant to any general or specific delegation under Water Code Section 13223.
“Replaced OWTS” means an OWTS that has its treatment capacity expanded, or its dispersal system replaced or added onto, after the effective date of this Policy.
“Sand” means a soil particle; this term also refers to a type of soil texture. As a soil particle, sand consists of individual rock or mineral particles in soils having diameters ranging from 0.05 to 2.0 millimeters. As a soil texture, sand is soil that is comprised of 85 percent or more sand particles, with the percentage of silt plus 1.5 times the percentage of clay particles comprising less than 15 percent.
“Seepage pit” means a drilled or dug excavation, three to six feet in diameter, either lined or gravel filled, that receives the effluent discharge from a septic tank or other OWTS treatment unit for dispersal.
“Septic tank” means a watertight, covered receptacle designed for primary treatment of wastewater and constructed to:
1. Receive wastewater discharged from a building;
2. Separate settleable and floating solids from the liquid;
3. Digest organic matter by anaerobic bacterial action;
4. Store digested solids; and
5. Clarify wastewater for further treatment with final subsurface discharge.
“Service provider” means a person capable of operating, monitoring, and maintaining an OWTS in accordance to this Policy.
“Silt” means a soil particle; this term also refers to a type of soil texture. As a soil particle, silt consists of individual rock or mineral particles in soils having diameters ranging from between 0.05 and 0.002 mm. As a soil texture, silt is soil that is comprised as approximately 80 percent or more silt particles and not more than 12 percent clay particles using the USDA soil classification system.
“Site” means the location of the OWTS and, where applicable, a reserve dispersal area capable of disposing 100 percent of the design flow from all sources the OWTS is intended to serve.
“Site Evaluation” means an assessment of the characteristics of the site sufficient to determine its suitability for an OWTS to meet the requirements of this Policy.

Final Draft
Definitions
3/20/2012
13
“Soil” means the naturally occurring body of porous mineral and organic materials on the land surface, which is composed of unconsolidated materials, including sand-sized, silt-sized, and clay-sized particles mixed with varying amounts of larger fragments and organic material. The various combinations of particles differentiate specific soil textures identified in the soil textural triangle developed by the United States Department of Agriculture (USDA) as found in Soil Survey Staff, USDA; Soil Survey Manual, Handbook 18, U.S. Government Printing Office, Washington, DC, 1993, p. 138. For the purposes of this Policy, soil shall contain earthen material of particles smaller than 0.08 inches (2 mm) in size.
“Soil Structure” means the arrangement of primary soil particles into compound particles, peds, or clusters that are separated by natural planes of weakness from adjoining aggregates.
“Soil texture” means the soil class that describes the relative amount of sand, clay, silt and combinations thereof as defined by the classes of the soil textural triangle developed by the USDA (referenced above).
“State Water Board” is the State Water Resources Control Board
“Supplemental treatment” means any OWTS or component of an OWTS, except a septic tank or dosing tank, that performs additional wastewater treatment so that the effluent meets the performance requirements prior to discharge of effluent into the dispersal field.
“SWAMP” means Surface Water Ambient Monitoring Program and more information is available at: http://www.waterboards.ca.gov/water_issues/programs/swamp/
“Telemetric” means the ability to automatically measure and transmit OWTS data by wire, radio, or other means.
“TMDL” is the acronym for "total maximum daily load." Section 303(d)(1) of the Clean Water Act requires each State to establish a TMDL for each impaired water body to address the pollutant(s) causing the impairment. In California, TMDLs are usually adopted as Basin Plan amendments and contain implementation plans detailing how water quality standards will be attained.
“Total coliform” means a group of bacteria consisting of several genera belonging to the family Enterobacteriaceae, which includes Escherichia coli bacteria.
“USDA” means the U.S. Department of Agriculture.
“Waste discharge requirement” or “WDR” means an operation and discharge permit issued for the discharge of waste pursuant to Section 13260 of the California Water Code.

Final Draft
Responsibilities and Duties
3/20/2012
14
Responsibilities and Duties
2.0 OWTS Owners Responsibilities and Duties
2.1 All new, replaced, or existing OWTS within an area that is subject to a Basin Plan prohibition of discharges from OWTS, must comply with the prohibition. If the prohibition authorizes discharges under specified conditions, the discharge must comply with those conditions and the applicable provisions of this Policy.
2.2 Owners of OWTS shall adhere to the requirements prescribed in local codes and ordinances. Owners of new and replaced OWTS shall also meet the minimum standards contained in Tier 1, or an alternate standard provided by a Local Agency Management Program per Tier 2, or shall comply with the requirements of Tier 3 if near an impaired water body and subject to Tier 3, or shall provide corrective action for their OWTS if their system meets conditions that place it in Tier 4.
2.3 Owners of OWTS shall comply with any and all permitting conditions imposed by a local agency implementing its approved Local Agency Management Program per Section 9 of this Policy, including if those conditions are more stringent than required by this Policy.
2.4 To receive coverage under this Policy and the included waiver of waste discharges, OWTS shall only accept and treat flows of domestic wastewater. In addition, OWTS that accept high-strength wastewater from commercial food service buildings are covered under this Policy and the waiver of waste discharge requirements if the wastewater does not exceed 900 mg/L BOD and there is a properly sized and functioning oil/grease interceptor (a.k.a grease trap).
2.5 Owners of OWTS shall maintain their OWTS in good working condition including inspections and pumping of solids as necessary, or as required by local ordinances, to maintain proper function and assure adequate treatment.
2.6 The following owners of OWTS shall notify the Regional Water Board by submitting a Report of Waste Discharge for the following:
2.6.1 a new or replaced OWTS that does not meet the conditions and requirements set forth in this Policy;
2.6.2 a new or replacement OWTS with the projected flow of over 3,500 gallons-per-day where the local permitting authority does not have an approved Local Agency Management Program that includes regulations of flows greater than or equal to the projected flow of the OWTS;

Final Draft
Responsibilities and Duties
3/20/2012
15
2.6.3 an existing OWTS, not currently under individual waste discharge requirements or a waiver of individual waste discharge requirements issued by a Regional Water Board, with the projected flow of over 10,000 gallons-per-day;
2.6.4 an existing OWTS that will be receiving or has received after the effective date of this Policy a change in the nature of the waste stream from domestic wastewater to high-strength wastewater, unless the waste stream is from a commercial food service building;
2.6.5 a new or replaced OWTS that receives high-strength wastewater, unless the wastewater is from a commercial food service building;
2.6.6 a new, replacement, or existing OWTS that will be or already is receiving high-strength wastewater with: (1) a BOD higher than 900 mg/L from a commercial food service building, or (2) does not have a properly sized and functioning oil/grease interceptor, after the effective date of this Policy.
2.7 All Reports of Waste Discharge shall be accompanied by the required application fee pursuant to California Code of Regulations, title 23, section 2200.
3.0 Local Agency Requirements and Responsibilities
3.1 Local agencies, in addition to implementing their own local codes and ordinances, shall determine whether the requirements within their local jurisdiction will be limited to the water quality protection afforded by the statewide minimum standards in Tier 0, Tier 1, Tier 3, and Tier 4, which this Policy authorizes them to implement, or whether the local agency will implement a Local Agency Management Program in accordance with Tier 2 that provides protection to water quality and public health using standards differing from Tier 1. Except for Tier 3, local agencies may continue to implement their existing OWTS permitting programs in compliance with the Basin Plan in place at the effective date of the Policy and Tier 3 until 60 months after the effective date of this Policy, or approval of a Local Agency Management Program, whichever comes first, and may make minor adjustments as necessary that are in compliance with the applicable Basin Plan and this Policy. Tier 3 requirements take effect on the effective date of this Policy. In the absence of a Tier 2 Local Agency Management Program, to the extent that there is a direct conflict between the applicable minimum standards and the local codes or ordinances (such that it is impossible to comply with both the applicable minimum standards and the local ordinances or codes), the more restrictive standards shall govern.

Final Draft
Responsibilities and Duties
3/20/2012
16
3.2 If preferred, the local agency may at any time provide the State Water Board and all affected Regional Water Board(s) written notice of its intent to regulate OWTS using a Local Agency Management Program with alternative standards as authorized in Tier 2 of this Policy. A proposed Local Agency Management Program that conforms to the requirements of that Section shall be included with the notice. A local agency shall not implement a program different than the minimum standards contained in Tier 1 and 3 of this Policy after 60 months from the effective date of this Policy until approval of the proposed Local Agency Management Program is granted by either the Regional Water Board or State Water Board. All initial program submittals desiring approval prior to the 60 month limit shall be received no later than 36 months from the effective date of this Policy. Once approved, the local agency shall adhere to the Local Agency Management Program, including all requirements, monitoring, and reporting. If at any time a local agency wishes to modify its Local Agency Management Program, it shall provide the State Water Board and all affected Regional Water Board(s) written notice of its intended modifications and will continue to implement its existing Local Agency Management Program until the modifications are approved.
3.3 All local agencies permitting OWTS shall report annually to the Regional Water Board(s). If a local agency’s jurisdictional area is within the boundary of multiple Regional Water Boards, the local agency shall send a copy of the annual report to each Regional Water Board. The annual report shall include the following information (organized in a tabular spreadsheet format) and summarize whether any further actions are warranted to protect water quality or public health:
3.3.1 number and location of complaints pertaining to OWTS operation and maintenance, and identification of those which were investigated and how they were resolved;
3.3.2 shall provide the applications and registrations issued as part of the local septic tank cleaning registration program pursuant to Section 117400 et seq. of the California Health and Safety Code;
3.3.3 number, location, and description of permits issued for new and repaired OWTS and which Tier the permit is issued.
3.4 All local agencies permitting OWTS shall retain permanent records of their permitting actions and will make those records available within 10 working days upon written request for review by a Regional Water Board. The records for each permit shall reference the Tier under which the permit was issued.
3.5 A local agency shall notify the owner of a public well or water intake and the California Department of Public Health as soon as practicable, but not later than 72 hours, upon its discovery of a failing OWTS as described in sections 11.1 and 11.2 within the setbacks described in sections 7.5.6 through 7.5.10.

Final Draft
Responsibilities and Duties
3/20/2012
17
3.6 A local agency may implement this Policy, or a portion thereof, using its local authority to enforce the policy, as authorized by an approval from the State Water Board or by the appropriate Regional Water Board.
3.7 Nothing in the Policy shall preclude a local agency from adopting or retaining standards for OWTS in an approved Local Agency Management Program that are more protective of the public health or the environment than are contained in this Policy.
3.8 If at any time a local agency wishes to withdraw its previously submitted and approved Tier 2 Local Agency Management Program, it may do so upon 60 days written notice. The notice of withdrawal shall specify the reason for withdrawing its Tier 2 program, the effective date for cessation of the program and resumption of permitting of OWTS only under Tiers 1, 3, and 4.
4.0 Regional Water Board Functions and Duties
4.1 The Regional Water Boards have the principal responsibility for overseeing the implementation of this Policy.
4.2 Regional Water Boards shall incorporate the requirements established in this Policy by amending their Basin Plans within 12 months of the effective date of this Policy, pursuant to Water Code Section 13291(e). The Regional Water Boards may also consider whether it is necessary and appropriate to retain or adopt any more protective standards. To the extent that a Regional Water Board determines that it is necessary and appropriate to retain or adopt any more protective standards, it shall reconcile those region-specific standards with this Policy to the extent feasible, and shall provide a detailed basis for its determination that each of the more protective standards is necessary and appropriate.
4.2.1 Notwithstanding 4.2 above, the North Coast Regional Water Board will continue to implement its existing Basin Plan requirements pertaining to OWTS within the Russian River watershed until it adopts the Russian River TMDL, at which time it will comply with section 4.2 for the Russian River watershed.
4.3 The Regional Water Board designated in Attachment 3 shall review, and if appropriate, approve a Local Agency Management Program submitted by the local agency pursuant to Tier 2 in this Policy. Upon receipt of a proposed Local Agency Management Program, the Regional Water Board designated in Attachment 3 shall have 90 days to notify the local agency whether the submittal contains all the elements of a Tier 2 program, but may request additional information based on review of the proposed program. Approval must follow a noticed hearing with opportunity for public comment. If a Local Agency Management Program is disapproved, the Regional Water Board designated in Attachment 3 shall provide a written explanation of the reasons for the

Final Draft
Responsibilities and Duties
3/20/2012
18
disapproval. A Regional Water Board may approve a Local Agency Management Program while disapproving any proposed special provisions for impaired water bodies contained in the Local Agency Management Program. If no action is taken by the respective Regional Water Board within 12 months of the submission date of a complete Local Agency Management Program, the program shall be forwarded to the State Water Board for review and approval pursuant to Section 5 of this Policy.
4.3.1 Where the local agency’s jurisdiction lies within more than one Regional Water Board, staff from the affected Regional Water Boards shall work cooperatively to assure that water quality protection in each region is adequately protected. If the Regional Water Board designated in Attachment 3 approves the Local Agency Management Program over the written objection of an affected Regional Water Board, that Regional Water Board may submit the dispute to the State Water Board under Section 5.3.
4.3.2 Within 30 days of receipt of a proposed Local Agency Management Program, a Regional Water Board will forward a copy to and solicit comments from the California Department of Public Health regarding a Local Agency Management Programs’ proposed procedures for notifying local water purveyors prior to OWTS permitting.
4.4 Once a Local Agency Management Program has been approved, any affected Regional Water Board may require modifications or revoke authorization of a local agency to implement a Tier 2 program, in accordance with the following:
4.4.1 The Regional Water Board shall consult with any other Regional Water Board(s) having jurisdiction over the local agency before providing the notice described in section 4.4.2.
4.4.2 Written notice shall be provided to the local agency detailing the Regional Water Board’s action, the cause for such action, remedies to prevent the action from continuing to completion, and appeal process and rights. The local agency shall have 90 days from the date of the written notice to respond with a corrective action plan to address the areas of non-compliance, or to request the Regional Water Board to reconsider its findings.
4.4.3 The Regional Water Board shall approve, approve conditionally, or deny a corrective action plan within 90 days of receipt. The local agency will have 90 days to begin implementation of a corrective action plan from the date of approval or 60 days to request reconsideration from the date of denial. If the local agency fails to submit an acceptable corrective action plan, fails to implement an approved corrective action plan, or request reconsideration, the Regional Water Board may require modifications to the Local Agency Management Program, or may revoke the local agency’s authorization to implement a Tier 2 program.

Final Draft
Responsibilities and Duties
3/20/2012
19
4.4.4 Requests for reconsideration by the local agency shall be decided by the Regional Water Board within 90 days and the previously approved Local Agency Management Program shall remain in effect while the reconsideration is pending.
4.4.5 If the request for reconsideration is denied, the local agency may appeal to the State Water Board and the previously approved Local Agency Management Program shall remain in effect while the appeal is under consideration. The State Water Board shall decide the appeal within 90 days. All decisions of the State Water Board are final.
4.5 The appropriate Regional Water Board shall accept and consider any requests for modification or revocation of a Local Agency Management Program submitted by any person. The Regional Water Board will notify the person making the request and the local agency implementing the Local Agency Management Program at issue by letter within 90 days whether it intends to proceed with the modification or revocation process per Section 4.4 above, or is dismissing the request. The Regional Water Board will post the request and its response letter on its website.
4.6 A Regional Water Board may issue or deny waste discharge requirements or waivers of waste discharge requirements for any new or replaced OWTS within a jurisdiction of a local agency without an approved Local Agency Management Program if that OWTS does not meet the minimum standards contained in Tier 1.
4.7 The Regional Water Boards will implement any notifications and enforcement requirements for OWTS determined to be in Tier 3 of this Policy.
4.8 Regional Water Boards may adopt waste discharge requirements, or conditional waivers of waste discharge requirements, that exempt individual OWTS from requirements contained in this Policy.
5.0 State Water Board Functions and Duties
5.1 As the state agency charged with the development and adoption of this Policy, the State Water Board shall periodically review, amend and/or update this Policy as required.
5.2 The State Water Board may take any action assigned to the Regional Water Boards in this Policy.
5.3 The State Water Board shall resolve disputes between Regional Water Boards and local agencies as needed within 12 months of receiving such a request by a Regional Water Board or local agency, and may take action on its own motion in furtherance of this Policy. As part of this function, the State Water Board shall review and, if appropriate, approve Local Agency Management Programs in cases where the respective Regional Water Board has failed to

Final Draft
Responsibilities and Duties
3/20/2012
20
consider for approval a Local Agency Management Program. The State Water Board shall approve Local Agency Management Programs at a regularly noticed board hearing and shall provide for public participation, including notice and opportunity for public comment. Once taken up by the State Water Board, Local Agency Management Programs shall be approved or denied within 180 days.
5.4 A member of the public may request the State Water Board to resolve any dispute regarding the Regional Water Board’s approval of a Local Agency Management Program if the member of the public timely raised the disputed issue before the Regional Water Board. Such requests shall be submitted within 30 days after the Regional Water Board’s approval of the Local Agency Management Program. The State Water Board shall notify the member of the public, the local agency, and the Regional Water Board within 90 days whether it intends to proceed with dispute resolution.
5.5 The State Water Board shall accept and consider any requests for modification or revocation of a Local Agency Management Program submitted by any person, where that person has previously submitted said request to the Regional Water Board and has received notice from the Regional Water Board of its dismissal of the request. The State Water Board will notify the person making the request and the local agency implementing the Local Agency Management Program at issue by letter within 90 days whether it intends to proceed with the modification or revocation process per Section 4.4 above, or is dismissing the request. The State Water Board will post the request and its response letter on its website.
5.6 The State Water Board, at the time of approving any Impaired Water Bodies [303 (d)] List, and for the purpose of implementing Tier 3 of this Policy, shall identify in Attachment 2 those water bodies where: (1) it is likely that operating OWTS will subsequently be determined to be a contributing source of pathogens or nitrogen and therefore it is anticipated that OWTS would receive a loading reduction, and (2) it is likely that new OWTS installations discharging within 600 feet of the water body would contribute to the impairment. This identification shall be based on information available at the time of 303 (d) listing and may be updated based on new information.
5.7 The State Water Board will make available to local agencies funds from its Clean Water State Revolving Fund loan program for mini-loan programs to be operated by the local agencies for the making of low interest loans to assist private property owners with complying with this Policy.

Final Draft
Tier 0 – Existing OWTS
3/20/2012
21
Tier 0 – Existing OWTS
Existing OWTS that are properly functioning and do not meet the conditions of failing systems or otherwise require corrective action (for example, to prevent groundwater impairment) as specifically described in Tier 4, and are not determined to be contributing to an impairment of surface water as specifically described in Tier 3, are automatically included in Tier 0.
6.0 Coverage for Properly Operating Existing OWTS
6.1 Existing OWTS are automatically covered by Tier 0 and the herein included waiver of waste discharge requirements if they meet the following requirements:
6.1.1 have a projected flow of 10,000 gallons-per-day or less;
6.1.2 receive only domestic wastewater from residential or commercial buildings, or high-strength wastewater from commercial food service buildings that does not exceed 900 mg/L BOD and has a properly sized and functioning oil/grease interceptor (a.k.a. grease trap);
6.1.3 do not require supplemental treatment under Tier 3;
6.1.4 do not require corrective action under Tier 4; and
6.1.5 do not consist of a cesspool as a means of wastewater disposal.
6.2 A Regional Water Board or local agency may deny coverage under this Policy to any OWTS that is:
6.2.1 Not in compliance with Section 6.1;
6.2.2 In the opinion of the Regional Water Board not able to adequately protect the water quality of the waters of the State and should therefore submit a report of waste discharge to receive Region specific waste discharge requirements or waiver of waste discharge requirements so as to be protective.
6.3 Existing OWTS currently under waste discharge requirements or individual waiver of waste discharge requirements will remain under those orders until notified in writing by the appropriate Regional Water Board that they are covered under this Policy.

Final Draft
Tier 1 – Low Risk New or Replacement OWTS
3/20/2012
22
Tier 1 – Low Risk New or Replacement OWTS
New or replacement OWTS meet low risk siting and design requirements as specified in Tier 1, where there is not an approved Local Agency Management Program per Tier 2.
7.0 Minimum Site Evaluation and Siting Standards
7.1 A qualified professional shall perform all necessary soil and site evaluations for all new OWTS and for existing OWTS where the treatment or dispersal system will be replaced or expanded.
7.2 A site evaluation shall determine that adequate soil depth is present in the dispersal area. Soil depth is measured vertically to the point where bedrock, hardpan, impermeable soils, or saturated soils are encountered or an adequate depth has been determined. Soil depth shall be determined through the use of soil profile(s) in the dispersal area and the designated dispersal system replacement area, as viewed in excavations exposing the soil profiles in representative areas, unless the local agency has determined through historical or regional information that a specific site soil profile evaluation is unwarranted.
7.3 A site evaluation shall determine the anticipated highest level of groundwater within the dispersal field and its required minimum dispersal zone by estimation using one or a combination of the following methods:
7.3.1 Direct observation of the highest extent of soil mottling observed in the examination of soil profiles, recognizing that soil mottling is not always an indicator of the uppermost extent of high groundwater; or
7.3.2 Direct observation of groundwater levels during the anticipated period of high groundwater. Methods for groundwater monitoring and determinations shall be decided by the local agency; or
7.3.3 Other methods, such as historical records, acceptable to the local agency.
7.3.4 Where a conflict in the above methods of examination exists, the direct observation method indicating the highest level shall govern.
7.4 Percolation test results in the effluent disposal area shall not be faster than one minute per inch (1 MPI) or slower than ninety minutes per inch (90 MPI). Other percolation rates may be used under a Tier 2 Local Agency Management Program. All percolation rates shall be based on actual or simulated wet weather conditions by performing the test during the wet weather period as determined by the local agency or by presoaking of percolation test holes and shall be a stabilized rate.

Final Draft
Tier 1 – Low Risk New or Replacement OWTS
3/20/2012
23
7.5 Minimum horizontal setbacks shall be as follows:
7.5.1 5 feet from parcel property lines;
7.5.2 100 feet from water wells and monitoring wells, unless regulatory or legitimate data requirements necessitate that monitoring wells be located closer;
7.5.3 100 feet from any unstable land mass or any areas subject to earth slides identified by a registered engineer or registered geologist; other setback distance are allowed, if recommended by a geotechnical report prepared by a qualified professional.
7.5.4 100 feet from springs and flowing surface water bodies where the edge of that water body is the natural or levied bank for creeks and rivers, or may be less where site conditions prevent migration of wastewater to the water body;
7.5.5 200 feet from vernal pools, wetlands, lakes, ponds, or other surface water bodies where the edge of that water body is the high water mark for lakes and reservoirs, and the mean high tide line for tidally influenced water bodies;
7.5.6 150 feet from a public water well where the depth of the effluent dispersal system does not exceed 10 feet;
7.5.7 200 feet from a public water well where the depth of the effluent dispersal system exceeds 10 feet in depth;
7.5.8 Where the effluent dispersal system is within 600 feet of a public water well and exceeds 20 feet in depth and the separation from the bottom of the system and ground water is less than five feet, the horizontal setback required to achieve a two-year travel time for microbiological contaminants shall be evaluated. A qualified professional shall conduct this evaluation. However in no case shall the setback be less than 200 feet.
7.5.9 Where the effluent dispersal system is within 1,200 feet from a public water systems’ surface water intake and within the catchment of the drainage, the dispersal system shall be no less than 400 feet from the high water mark of the reservoir, lake or flowing water body.
7.5.10 Where the effluent dispersal system is located more than 1,200 but less than 2,500 feet from a public water systems’ surface water intake and within the catchment of the drainage, the dispersal system shall be no less than 200 feet from the high water mark of the reservoir, lake or flowing water body.
7.6 Prior to issuing a permit to install an OWTS the permitting agency shall determine if the OWTS is within 1,200 feet of an intake for a surface water treatment plant for drinking water and is in the drainage catchment in which the intake is located. If the OWTS is within 1,200 feet of an intake for a surface

Final Draft
Tier 1 – Low Risk New or Replacement OWTS
3/20/2012
24
water treatment plant for drinking water and is in the drainage catchment in which the intake is located:
7.6.1 The permitting agency shall provide a copy of the permit application to the owner of the water system of their proposal to install an OWTS within 1,200 of an intake for a surface water treatment. If the owner of the water system cannot be identified, then the permitting agency will notify California Department of Public Health Drinking Water Program.
7.6.2 The permit application shall include a topographical plot plan for the parcel showing the OWTS components, the property boundaries, proposed structures, physical address, and name of property owner.
7.6.3 The permitting agency shall provide the estimated wastewater flows, intended use of proposed structure generating the wastewater, soil data, and estimated depth to seasonally saturated soils.
7.6.4 The public water system owner shall have 5 days from receipt of the permit application to provide recommendations and comments to the permitting agency.
7.7 Natural ground slope in all areas used for effluent disposal shall not be greater than 25 percent.
7.8 The average density for any subdivision of property occurring after the effective date of this Policy and implemented under Tier 1 shall not exceed one single-family dwelling unit, or its equivalent, per 2.5 acres for those units that rely on OWTS.
8.0 Minimum OWTS Design and Construction Standards
8.1 OWTS Design Requirements
8.1.1 A qualified professional shall design all new OWTS and modifications to existing OWTS where the treatment or dispersal system will be replaced or expanded. A qualified professional employed by a local agency, while acting in that capacity may design or review and approve a design for a proposed OWTS.
8.1.2 OWTS shall be located, designed, and constructed in a manner to ensure that effluent does not surface at any time, and that percolation of effluent will not adversely affect beneficial uses of waters of the State.
8.1.3 The design of new and replaced OWTS shall be based on the expected influent wastewater quality with a projected flow not to exceed 3,500 gallons per day, the peak wastewater quantity for purposes of hydraulic sizing, the characteristics of the site, and the required level of treatment for protection of water quality and public health.
8.1.4 All dispersal systems shall have at least twelve (12) inches of soil cover.

Final Draft
Tier 1 – Low Risk New or Replacement OWTS
3/20/2012
25
8.1.5 The minimum depth to the anticipated highest level of groundwater below the bottom of the leaching trench, and the native soil depth immediately below the leaching trench, shall not be less than prescribed in Table 1.
Table 1: Tier 1 Minimum Depths to Groundwater and Minimum Soil Depth from the Bottom of the Dispersal System
Percolation Rate Depth to groundwater
Percolation Rate ≤1 MPI Only as authorized in a Tier 2 Local Agency Management Program
1 MPI< Percolation Rate ≤ 5 MPI
Twenty (20) feet
5 MPI< Percolation Rate ≤ 30 MPI
Eight (8) feet
30 MPI< Percolation Rate ≤ 90 MPI
Five (5) feet
Percolation Rate > 90 MPI Only as authorized in a Tier 2 Local Agency Management Program
MPI = minutes per inch
8.1.6 Dispersal systems shall be a leachfield, designed using not more than 4 square-feet of infiltrative area per linear foot of trench as the infiltrative surface, and with trench width no wider than 3 feet. Seepage pits and other dispersal systems may only be authorized for repairs where siting limitations require a variance. Maximum application rates shall be determined from stabilized percolation rate as provided in Table 2, or from soil texture and structure determination as provided in Table 3.

Final Draft
Tier 1 – Low Risk New or Replacement OWTS
3/20/2012
26
Table 2: Application rates as determined from stabilized percolation rate
Percolation Rate
Application Rate
Percolation Rate
Application Rate
Percolation Rate
Application Rate
(minutes per Inch)
(gallons per day per
square foot)
(minutes per Inch)
(gallons per day per
square foot)
(minutes per Inch)
(gallons per day per
square foot)
<1 Requires Local
Manage-ment
Program
31 0.522 61 0.197
1 0.8 32 0.511 62 0.194
2 0.8 33 0.5 63 0.19
3 0.8 34 0.489 64 0.187
4 0.8 35 0.478 65 0.184
5 0.8 36 0.467 66 0.18
6 0.8 37 0.456 67 0.177
7 0.8 38 0.445 68 0.174
8 0.8 39 0.434 69 0.17
9 0.8 40 0.422 70 0.167
10 0.8 41 0.411 71 0.164
11 0.786 42 0.4 72 0.16
12 0.771 43 0.389 73 0.157
13 0.757 44 0.378 74 0.154
14 0.743 45 0.367 75 0.15
15 0.729 46 0.356 76 0.147
16 0.714 47 0.345 77 0.144
17 0.7 48 0.334 78 0.14
18 0.686 49 0.323 79 0.137
19 0.671 50 0.311 80 0.133
20 0.657 51 0.3 81 0.13
21 0.643 52 0.289 82 0.127
22 0.629 53 0.278 83 0.123
23 0.614 54 0.267 84 0.12
24 0.6 55 0.256 85 0.117
25 0.589 56 0.245 86 0.113
26 0.578 57 0.234 87 0.11
27 0.567 58 0.223 88 0.107
28 0.556 59 0.212 89 0.103
29 0.545 60 0.2 90 0.1
30 0.533 >90 Requires Local
Agency Management
Program

Final Draft
Tier 1 – Low Risk New or Replacement OWTS
3/20/2012
27
Table 3: Design Soil Application Rates
(Source: USEPA Onsite Wastewater Treatment Systems Manual, February 2002)
Soil Texture
(per the USDA soil classification system)
Soil Structure Shape Grade Maximum Soil Application Rate(gallons per day per square foot)
1
Coarse Sand, Sand, Loamy Coarse Sand, Loamy Sand
Single grain Structureless 0.8
Fine Sand, Very Fine Sand, Loamy Fine Sand, Loamy Very Fine Sand
Single grain Structureless 0.4
Coarse Sandy Loam, Sandy Loam Massive Structureless 0.2
Platy Weak 0.2
Moderate, Strong Prohibited
Prismatic, Blocky, Granular
Weak 0.4
Moderate, Strong 0.6
Fine Sandy Loam, very fine Sandy Loam
Massive Structureless 0.2
Platy Weak, Moderate, Strong Prohibited
Prismatic, Blocky, Granular
Weak 0.2
Moderate, Strong 0.4
Loam Massive Structureless 0.2
Platy Weak, Moderate, Strong Prohibited
Prismatic, Blocky, Granular
Weak 0.4
Moderate, Strong 0.6
Silt Loam Massive Structureless Prohibited
Platy Weak, Moderate, Strong Prohibited
Prismatic, Blocky, Granular
Weak 0.4
Moderate, Strong 0.6
Sandy Clay Loam, Clay Loam, Silty Clay Loam
Massive Structureless Prohibited
Platy Weak, Moderate, Strong Prohibited
Prismatic, Blocky, Granular
Weak 0.2
Moderate, Strong 0.4
Sandy Clay, Clay, or Silty Clay Massive Structureless Prohibited
Platy Weak, Moderate, Strong Prohibited
Prismatic, Blocky, Granular
Weak Prohibited
Moderate, Strong 0.2
1 Soils listed as prohibited may be allowed under the authority of the Regional Water Board ,or as allowed under an
approved Local Agency Management Program per Tier 2.

Final Draft
Tier 1 – Low Risk New or Replacement OWTS
3/20/2012
28
8.1.7 Dispersal systems shall not exceed a maximum depth of 10 feet as measured from the ground surface to the bottom of the trench.
8.1.8 All new dispersal systems shall have 100 percent replacement area that is equivalent and separate, and available for future use.
8.1.9 No dispersal systems or replacement areas shall be covered by an impermeable surface, such as paving, building foundation slabs, plastic sheeting, or any other material that prevents oxygen transfer to the soil.
8.1.10 Rock fragment content of native soil surrounding the dispersal system shall not exceed 50 percent by volume for rock fragments sized as cobbles or larger and shall be estimated using either the point-count or line-intercept methods.
8.1.11 Increased allowance for gravel-less chamber systems is only allowed under a Tier 2 Local Agency Management Program.
8.2 Septic Tank Construction and Installation
8.2.1 All new or replaced septic tanks and new or replaced grease interceptor tanks shall comply with the standards contained in Sections K5(b), K5(c), K5(d), K5(e), K5(k), K5(m)(1), and K5(m)(3)(ii) of Appendix K, of Part 5, Title 24 of the 2007 California Code of Regulations.
8.2.2 All new septic tanks shall comply with the following requirements:
8.2.2.1 Access openings shall have watertight risers, the tops of which shall be set within 6 inches of finished grade; and
8.2.2.2 Access openings shall be secured to prevent unauthorized access.
8.2.3 New and replaced OWTS septic tanks shall be limited to those approved by the International Association of Plumbing and Mechanical Officials (IAPMO) or stamped and certified by a California registered civil engineer as meeting the industry standards, and their installation shall be according to the manufacturer’s instructions.
8.2.4 New and replaced OWTS septic tanks shall be designed to prevent solids in excess of three-sixteenths (3/16) of an inch in diameter from passing to the dispersal system. Septic tanks that use a National Sanitation Foundation/American National Standard Institute (NSF/ANSI) Standard 46 certified septic tank filter at the final point of effluent discharge from the OWTS and prior to the dispersal system shall be deemed in compliance with this requirement.

Final Draft
Tier 1 – Low Risk New or Replacement OWTS
3/20/2012
29
8.2.5 A Licensed General Engineering Contractor (Class A), General Building Contractor (Class B), Sanitation System Contractor (Specialty Class C-42), or Plumbing Contractor (Specialty Class C-36) shall install all new OWTS and replaced OWTS in accordance with California Business and Professions Code Sections 7056, 7057, and 7058 and Article 3, Division 8, Title 16 of the California Code of Regulations. A property owner may also install his/her own OWTS if the as-built diagram and the installation are inspected and approved by the Regional Water Board or local agency at a time when the OWTS is in an open condition (not covered by soil and exposed for inspection).

Final Draft
Tier 2 – Local Agency OWTS Management Program
3/20/2012
30
Tier 2 – Local Agency OWTS Management Program
Local agencies may submit management programs for approval, and upon approval then manage the installation of new and replacement OWTS under that program. Local Agency Management Programs approved under Tier 2 provide an alternate method from Tier 1 programs to achieve the same policy purpose, which is to protect water quality and public health. In order to address local conditions, Local Agency Management Programs may include standards that differ from the Tier 1 requirements for new and replacement OWTS contained in Sections 7 and 8. As examples, a Local Agency Management Program may authorize different soil characteristics, usage of seepage pits, and different densities for new developments. Once the Local Agency Management Program is approved, new and replacement OWTS that are included within the Local Agency Management Program may be approved by the Local Agency. A Local Agency, at its discretion, may include Tier 1 standards within its Tier 2 Local Agency Management Program for some or all of its jurisdiction. However, once a Local Agency Management Program is approved, it shall supersede Tier 1 and all future OWTS decisions will be governed by the Tier 2 Local Agency Management Program until it is modified, withdrawn, or revoked.
9.0 Local Agency Management Program for Minimum OWTS Standards
The Local Agency Management Program for minimum OWTS Standards is a management program where local agencies can establish minimum standards that are differing requirements from those specified in Tier 1 (Section 7 and Section 8), including the areas that cannot meet those minimum standards and still achieve this Policy’s purpose, which is to protect water quality and public health. Local Agency Management Programs may include any one or combination of the following to achieve this purpose:
Differing system design requirements;
Differing siting controls such as system density and setback requirements;
Requirements for owners to enter monitoring and maintenance agreements; and/or
Creation of an onsite management district.
9.1 Where different and/or additional requirements are needed to protect water quality the local agency may consider any of the following, as well as any other conditions deemed appropriate, when developing Local Agency Management Program requirements:
9.1.1 Degree of vulnerability to pollution from OWTS due to hydrogeological conditions.
9.1.2 High Quality waters or other environmental conditions requiring enhanced protection from the effects of OWTS.

Final Draft
Tier 2 – Local Agency OWTS Management Program
3/20/2012
31
9.1.3 Shallow soils requiring a dispersal system installation that is closer to ground surface than is standard.
9.1.4 OWTS is located in area with high domestic well usage.
9.1.5 Dispersal system is located in an area with fractured bedrock.
9.1.6 Dispersal system is located in an area with poorly drained soils.
9.1.7 Surface water is vulnerable to pollution from OWTS.
9.1.8 Surface water within the watershed is listed as impaired for nitrogen or pathogens.
9.1.9 OWTS is located within an area of high OWTS density.
9.2 The Local Agency Management Program shall detail the scope of its coverage, such as the maximum authorized projected flows for OWTS, as well as a clear delineation of those types of OWTS included within and to be permitted by the program, and provide the local site evaluation, siting, design, and construction requirements, and in addition each of the following:
9.2.1 Any local agency requirements for onsite wastewater system inspection, monitoring, maintenance, and repairs, including procedures to ensure that replacements or repairs to failing systems are done under permit from the local governing jurisdiction.
9.2.2 Any special provisions applicable to OWTS within specified geographic area near specific impaired water bodies listed for pathogens or nitrogen. The special provisions may be substantive and/or procedural, and may include, as examples: consultation with the Regional Water Board prior to issuing permits, supplemental treatment, development of a management district, special siting requirements, additional inspection and monitoring.
9.2.3 Local Agency Management Program variances, for new installations and repairs in substantial conformance, to the greatest extent practicable. Variances are not allowed for the requirements stated in sections 9.4.1 through 9.4.9.
9.2.4 Any educational, training, certification, and/or licensing requirements that will be required of OWTS service providers, site evaluators, designers, installers, pumpers, maintenance contractors, and any other person relating to OWTS activities.
9.2.5 Education and/or outreach program including informational materials to inform OWTS owners about how to locate, operate, and maintain their OWTS as well as any Water Board order (e.g., Basin Plan prohibitions) regarding OWTS restrictions within its jurisdiction. The education and/or outreach program shall also include procedures to ensure that alternative onsite system owners are provided an informational maintenance or replacement document by the system designer or installer. This document

Final Draft
Tier 2 – Local Agency OWTS Management Program
3/20/2012
32
shall cite homeowner procedures to ensure maintenance, repair, or replacement of critical items within 48 hours following failure.
9.2.6 An analysis of existing and proposed disposal locations for septage, the volume of septage anticipated, and whether adequate capacity is available.
9.2.7 Any consideration given to onsite maintenance districts.
9.2.8 Any consideration given to the development and implementation of, or coordination with, Regional Salt and Nutrient Management Plans.
9.2.9 Any consideration given to coordination with watershed management groups.
9.2.10 Procedures for evaluating the proximity of sewer systems to new or replacement OWTS installations.
9.2.11 Procedures for notifying the owner of a public water system prior to issuing an installation or repair permit for an OWTS, if the OWTS is within 1,200 feet of an intake for a surface water treatment plant for drinking water and is in the drainage area catchment in which the intake is located, or if the OWTS is within a horizontal sanitary setback from a public well.
9.2.12 Policies and procedures that will be followed when a proposed OWTS dispersal area is within the horizontal sanitary setback of a public well or a surface water intake. These policies and procedures shall either indicate that supplemental treatment as specified in 10.9 and 10.10 of this policy are required for OWTS that are within a horizontal sanitary setback of a public well or surface water intake, or will establish alternate siting and operational criteria for the proposed OWTS that would similarly mitigate the potential adverse impact to the public water source.
9.3 The minimum responsibilities of the local agency for management of the Local Agency Management Program include:
9.3.1 Maintain records of the number, location, and description of permits issued for OWTS where a variance is granted.
9.3.2 Maintain a water quality assessment program to evaluate the impact of OWTS discharges and assess the extent to which groundwater and local surface water quality may be adversely impacted. The focus of the assessment should be areas with characteristics listed under section 9.1. The assessment program will include monitoring and analysis of water quality data, review of complaints, variances, failures, and any information resulting from inspections. The assessment may use existing water quality data from other monitoring programs and/or establish the terms, conditions, and timing for monitoring done by the local agency. At a minimum this assessment will include monitoring data for nitrates and pathogens, and may include data for other constituents which are needed

Final Draft
Tier 2 – Local Agency OWTS Management Program
3/20/2012
33
to adequately characterize the impacts of OWTS on water quality. Other monitoring programs for which data may be used include but are not limited to any of the following:
9.3.2.1. Random well samples from a domestic well sampling program.
9.3.2.2. Routine real estate transfer samples if those are performed and reported.
9.3.2.3. Review of public system sampling reports done by the local agency or another municipality responsible for the public system.
9.3.2.4. Water quality testing reports done at the time of new well development if those are reported.
9.3.2.5. Beach water quality testing data performed as part of Health and Safety Code Section 115885.
9.3.2.6. Receiving water sampling performed as a part of a NPDES permit.
9.3.2.7. Data contained in the California Water Quality Assessment Database.
9.3.2.8. Groundwater sampling performed as part of Waste Discharge Requirements.
9.3.2.9. Groundwater data collected as part of the Groundwater Ambient Monitoring and Assessment Program and available in the Geotracker Database.
9.3.3 Submit an annual report by February 1 to the applicable Regional Water Board summarizing the status of items 9.3.1 through 9.3.2 above. Every fifth year, submit an evaluation of the monitoring program and an assessment of whether water quality is being impacted by OWTS, identifying any changes in the Local Agency Management Program that will be undertaken to address impacts from OWTS. The first report will commence one year after approval of the local agency’s Local Agency Management Program. In addition to summarizing monitoring data collected per 9.3.8 above, all groundwater monitoring data generated by the local agency shall be submitted in EDF format for inclusion into Geotracker, and surface water monitoring shall be submitted to CEDEN in a SWAMP comparable format.
9.4 The following are not allowed to be included in a Local Agency Management Program:
9.4.1 Cesspools of any kind or size.
9.4.2 OWTS receiving a projected flow over 10,000 gallons per day.

Final Draft
Tier 2 – Local Agency OWTS Management Program
3/20/2012
34
9.4.3 OWTS that utilize any form of effluent disposal that discharges on or above the post installation ground surface such as sprinklers, exposed drip lines, free-surface wetlands, or a pond.
9.4.4 Slopes greater than 30 percent without a slope stability report approved by a registered professional.
9.4.5 Decreased leaching area for IAPMO-approved dispersal systems using a multiplier less than 0.70.
9.4.6 Supplemental OWTS without requirements for periodic monitoring or inspections.
9.4.7 OWTS dedicated to receiving wastes from RV dumps.
9.4.8 Separation of the bottom of dispersal system to groundwater less than two (2) feet.
9.4.9 Installation of OWTS where public sewer is available. The public sewer may be considered as not available when such public sewer or any building or exterior drainage facility connected thereto is located more than 200 feet from any proposed building or exterior drainage facility on any lot or premises that abuts and is served by such public sewer.
9.4.10 Except as provided for in sections 9.4.11 and 9.4.12, new or repaired onsite systems with minimum horizontal setbacks less than any of the following:
9.4.10.1 150 feet from a public water well where the depth of the effluent dispersal system does not exceed 10 feet in depth.
9.4.10.2 200 feet from a public water well where the depth of the effluent dispersal system exceeds 10 feet in depth.
9.4.10.3 Where the effluent dispersal system is within 600 feet of a public water well and exceeds 20 feet in depth and the separation from the bottom of the system and ground water is less than five feet the horizontal setback required to achieve a two-year travel time for microbiological contaminants shall be evaluated. A qualified professional shall conduct this evaluation. However in no case shall the setback be less than 200 feet.
9.4.10.4 Where the effluent dispersal system is within 1,200 feet from a public water systems’ surface water intake and within the catchment of the drainage, the dispersal system shall be no less than 400 feet from the high water mark of the reservoir, lake or flowing water body.
9.4.10.5 Where the effluent dispersal system is located more than 1,200 but less than 2,500 feet from a public water systems’ surface water intake and within the catchment area of the drainage, the dispersal

Final Draft
Tier 2 – Local Agency OWTS Management Program
3/20/2012
35
system shall be no less than 200 feet from the high water mark of the reservoir, lake or flowing water body.
9.4.11 For replacement OWTS that do not meet the above horizontal separation requirements, the replacement OWTS shall meet the horizontal separation to the greatest extent practicable. In such case, the replacement OWTS shall utilize supplemental treatment and other mitigation measures, unless the permitting authority finds that there is no indication that the existing system is adversely affecting the public water source, and there is limited potential that the system could impact the water source based on topography, soil depth, soil texture, and groundwater separation.
9.4.12 For new OWTS, installed on parcels of record existing at the time of the effective date of this Policy, that cannot meet the above horizontal separation requirements, the OWTS shall meet the horizontal separation to the greatest extent practicable and shall utilize supplemental treatment for pathogens as specified in section 10.8 and any other mitigation measures prescribed by the permitting authority.
9.5 A Local Agency Management Program for OWTS must include adequate technical detail to support how all the criteria in their program work together to protect water quality and public health.
9.6 A Regional Water Board reviewing a Local Agency Management Program shall consider, among other things, the past performance of the local program to adequately protect water quality, and where this has been achieved with criteria differing from Tier 1, shall not unnecessarily require modifications to the program for purposes of uniformity, as long as the Local Agency Management Program meets the requirements of Tier 2.

Final Draft
Tier 3 – Impaired Areas
3/20/2012
36
Tier 3 – Impaired Areas OWTS that are near impaired water bodes may be addressed by a TMDL and its implementation program, or special provisions contained in a Local Agency Management Program. If there is no TMDL or special provisions, new or replacement OWTS within 600 feet of impaired water bodies listed in Attachment 2 must meet the specific requirements of Tier 3. 10.0 Advanced Protection Management Program
The Advanced Protection Management Program is the minimum required management program for all local agencies where an OWTS is located near a water body that has been listed as an impaired water body due to nitrogen or pathogen indicators pursuant to Section 303(d) of the Clean Water Act. This Tier 3 contains the OWTS requirements within the Advanced Protection Management Program. Local agencies are authorized to implement Advanced Protection Management Programs in conjunction with an approved Local Agency Management Program or, if there is no approved Local Agency Management Program, Tier 1. Local agencies are encouraged to collaborate with the Regional Water Boards by sharing any information pertaining to the impairment, provide advice on potential remedies, and regulate OWTS to the extent that their authority allows for the improvement of the impairment.
10.1 The geographic area for each water body’s Advanced Protection Management Program is defined by the applicable TMDL, if one has been approved. If there is not an approved TMDL, it is defined by an approved Local Agency Management Program, if it contains special provisions for that water body. If it is not defined in an approved TMDL or Local Agency Management Program, it shall be 600 linear feet [in the horizontal (map) direction] of a water body listed in Attachment 2 where the edge of that water body is the natural or levied bank for creeks and rivers, the high water mark for lakes and reservoirs, and the mean high tide line for tidally influenced water bodies, as appropriate. OWTS near impaired water bodies that are not listed on Attachment 2, and do not have a TMDL and are not covered by a Local Agency Management Program with special provisions, are not addressed by Tier 3.
10.2 The requirements of an Advanced Protection Management Program for all OWTS will be in accordance with an adopted TMDL, and its implementation program, if one has been adopted to address the impairment. An adopted TMDL supersedes all requirements in Tier 3, except that, for TMDL implementation plans adopted after the effective date of this Policy, all required OWTS implementation actions shall commence within 5 years after the TMDL’s effective date. The TMDL may use some or all of the Tier 3 requirements and shall establish the applicable area of implementation for OWTS requirements within the watershed. For those impaired water bodies that do have an adopted TMDL addressing the impairment, but the TMDL does not assign a

Final Draft
Tier 3 – Impaired Areas
3/20/2012
37
load allocation to OWTS, no further action is required unless the TMDL is modified at some point in the future to include actions for OWTS.
10.3 If no TMDL has been adopted, the requirements of an Advanced Protection Management Program for all OWTS will be in accordance with the Local Agency Management Program, if any special provisions for the water body have been approved.
10.4 The Regional Water Boards shall adopt TMDLs for impaired water bodies identified in Attachment 2, in accordance with the specified dates.
10.4.1 If a Regional Water Board does not complete a TMDL within two years of the time period specified in Attachment 2, coverage under this Policy’s waiver of waste discharge requirements shall expire for any OWTS that has any part of its dispersal system discharging within the geographic area of an Advanced Protection Management Program. The Regional Water Board shall issue waste discharge requirements, general waste discharge requirements, waivers of waste discharge requirements, or require corrective action for such OWTS. The Regional Water Board will consider the following when establishing the waste discharge requirements, general waste discharge requirements, waivers of waste discharge requirements, or requirement for corrective action:
10.4.1.1 Whether supplemental treatment should be required.
10.4.1.2 Whether routine inspection of the OWTS should be required.
10.4.1.3 Whether monitoring of surface and groundwater should be performed.
10.4.1.4 The collection of a fee for those OWTS covered by the order.
10.4.1.5 Whether owners of previously-constructed OWTS should file a report by a qualified professional in accordance with section 10.5.
10.4.1.6 Whether owners of new or replaced OWTS should file a report of waste discharge with additional supporting technical information as required by the Regional Water Board.
10.5 If the Regional Water Board requires owners of OWTS to submit a qualified professional’s report, the report may include a determination of whether the OWTS is functioning properly and as designed or requires corrective actions per Tier 4, and regardless of its state of function, whether it is contributing to impairment of the water body.
10.5.1 The qualified professional’s report may also include, but is not limited to:
10.5.1.1 A general description of system components, their physical layout, and horizontal setback distances from property lines, buildings, wells, and surface waters.

Final Draft
Tier 3 – Impaired Areas
3/20/2012
38
10.5.1.2 A description of the type of wastewater discharged to the OWTS such as domestic, commercial, or industrial and classification of it as domestic wastewater or high-strength waste.
10.5.1.3 A determination of the systems design flow and the volume of wastewater discharged daily derived from water use, either estimated or actual if metered.
10.5.1.4 A description of the septic tank, including age, size, material of construction, internal and external condition, water level, scum layer thickness, depth of solids, and the results of a one-hour hydrostatic test.
10.5.1.5 A description of the distribution box, dosing siphon, or distribution pump, and if flow is being equally distributed throughout the dispersal system, as well as any evidence of solids carryover, clear water infiltration, or evidence of system backup.
10.5.1.6 A description of the dispersal system including signs of hydraulic failure, condition of surface vegetation over the dispersal system, level of ponding above the infiltrative surface within the dispersal system, other possible sources of hydraulic loading to the dispersal area, and depth of the seasonally high groundwater level.
10.5.1.7 A determination of whether the OWTS is discharging to the ground’s surface.
10.5.1.8 For a water body listed as an impaired water body for pathogens, a determination of the OWTS dispersal system’s separation from its deepest most infiltrative surface to the highest seasonal groundwater level or fractured bedrock.
10.5.1.9 For a water body listed as an impaired water body for nitrogen, a determination of whether the groundwater under the dispersal field is reaching the water body, and a description of the method used to make the determination.
10.6 For new, replaced, and existing OWTS in an Advanced Protection Management Program, the following are not covered by this Policy’s waiver but may be authorized by a separate Regional Water Board order:
10.6.1 Cesspools of any kind or size.
10.6.2 OWTS receiving a projected flow over 10,000 gallons per day.
10.6.3 OWTS that utilize any form of effluent disposal on or above the ground surface.
10.6.4 Slopes greater than 30 percent without a slope stability report approved by a registered professional.

Final Draft
Tier 3 – Impaired Areas
3/20/2012
39
10.6.5 Decreased leaching area for IAPMO-approved dispersal systems using a multiplier less than 0.70.
10.6.6 OWTS utilizing supplemental treatment without requirements for periodic monitoring.
10.6.7 OWTS dedicated to receiving wastes from RV dumps.
10.6.8 Separation of the bottom of dispersal system to groundwater less than two (2) feet.
10.6.9 Minimum horizontal setbacks less than any of the following:
10.6.9.1 150 feet from a public water well where the depth of the effluent dispersal system does not exceed 10 feet in depth;
10.6.9.2 200 feet from a public water well where the depth of the effluent dispersal system exceeds 10 feet in depth:
10.6.9.3 Where the effluent dispersal system is within 600 feet of a public water well and exceeds 20 feet in depth and the separation from the bottom of the system and ground water is less than five feet the horizontal setback required to achieve a two-year travel time for microbiological contaminants shall be evaluated. A qualified professional shall conduct this evaluation. However in no case shall the setback be less than 200 feet.
10.6.9.4 Where the effluent dispersal system is within 1,200 feet from a public water systems’ surface water intake and within the catchment of the drainage, the dispersal system shall be no less than 400 feet from the high water mark of the reservoir, lake or flowing water body.
10.6.9.5 Where the effluent dispersal system is located more than 1,200 but less than 2,500 feet from a public water systems’ surface water intake and within the catchment of the drainage, the dispersal system shall be no less than 200 feet from the high water mark of the reservoir, lake or flowing water body.
10.6.9.6 For replacement OWTS that do not meet the above horizontal separation requirements, the replacement OWTS shall meet the horizontal separation to the greatest extent practicable. In such case, the replacement OWTS shall utilize supplemental treatment and other mitigation measures.
10.6.9.7 For new OWTS, installed on parcels of record existing at the time of the effective date of this Policy, that cannot meet the above horizontal separation requirements, the OWTS shall meet the horizontal separation to the greatest extent practicable and shall utilize supplemental treatment for pathogens as specified in section

Final Draft
Tier 3 – Impaired Areas
3/20/2012
40
10.8 and any other mitigation measures as prescribed by the permitting authority.
10.7 The requirements contained in Section 10 shall not apply to owners of OWTS that are constructed and operating, or permitted, on or prior to the date that the nearby water body is added to Attachment 2 who commit by way of a legally binding document to connect to a centralized wastewater collection and treatment system regulated through WDRs as specified within the following timeframes:
10.7.1 The owner must sign the document within forty-eight months of the date that the nearby water body is initially listed on Attachment 2.
10.7.2 The specified date for the connection to the centralized community wastewater collection and treatment system shall not extend beyond nine years following the date that the nearby water body is added to Attachment 2.
10.8 In the absence of an adopted TMDL or Local Agency Management Program containing special provisions for the water body, all new or replaced OWTS permitted after the date that the water body is initially listed in Attachment 2 that have any discharge within the geographic area of an Advanced Protection Management Program shall meet the following requirements:
10.8.1 Utilize supplemental treatment and meet performance requirements in 10.9 if impaired for nitrogen and 10.10 if impaired for pathogens,
10.8.2 Comply with the setback requirements of Section 7.5.1 to 7.5.5, and
10.8.3 Comply with any applicable Local Agency Management Program requirements.
10.9 Supplemental treatment requirements for nitrogen
10.9.1 Effluent from the supplemental treatment components designed to reduce nitrogen shall be certified by NSF, or other approved third party tester, to meet a 50 percent reduction in total nitrogen when comparing the 30-day average influent to the 30-day average effluent.
10.9.2 Where a drip-line dispersal system is used to enhance vegetative nitrogen uptake, the dispersal system shall have at least six (6) inches of soil cover.

Final Draft
Tier 3 – Impaired Areas
3/20/2012
41
10.10 Supplemental treatment requirements for pathogens
10.10.1 Supplemental treatment components designed to perform disinfection shall provide sufficient pretreatment of the wastewater so that effluent from the supplemental treatment components does not exceed a 30-day average TSS of 30 mg/L and shall further achieve an effluent fecal coliform bacteria concentration less than or equal to 200 Most Probable Number (MPN) per 100 milliliters.
10.10.2 The minimum soil depth and the minimum depth to the anticipated highest level of groundwater below the bottom of the dispersal system shall not be less than three (3) feet. All dispersal systems shall have at least twelve (12) inches of soil cover.
10.11 OWTS in an Advanced Protection Management Program with supplemental treatment shall be designed to meet the applicable performance requirements above and shall be stamped or approved by a Qualified Professional.
10.12 Prior to the installation of any proprietary treatment OWTS in an Advanced Protection Management Program, all such treatment components shall be tested by an independent third party testing laboratory.
10.13 The ongoing monitoring of OWTS in an Advanced Protection Management Program with supplemental treatment components designed to meet the performance requirements in Sections 10.9 and 10.10 shall be monitored in accordance with the operation and maintenance manual for the OWTS or more frequently as required by the local agency or Regional Water Board.
10.14 OWTS in an Advanced Protection Management Program with supplemental treatment components shall be equipped with a visual or audible alarm as well as a telemetric alarm that alerts the owner and service provider in the event of system malfunction. OWTS using supplemental treatment shall, at a minimum, provide for 24-hour wastewater storage based on design flow as a means to minimize pollution from overflow discharge after a system malfunction or power outage. Where telemetry is not possible, the owner shall inspect the system at least monthly as directed and instructed by a service provider and notify the service provider not less than quarterly of the observed operating parameters of the OWTS.
10.15 OWTS in an Advanced Protection Management Program designed to meet the disinfection requirements in Section 10.10 shall be inspected for proper operation quarterly by a service provider unless a telemetric monitoring system is capable of continuously assessing the operation of the disinfection system. Testing of the wastewater flowing from supplemental treatment components that perform disinfection shall be sampled at a point in the system after the treatment components and prior to the dispersal system and shall be conducted quarterly based on analysis of total coliform with a minimum detection limit of 2.2 MPN. All effluent samples must include the

Final Draft
Tier 3 – Impaired Areas
3/20/2012
42
geographic coordinates of the sample’s location. Effluent samples shall be taken by a service provider and analyzed by a California Department of Public Health certified laboratory.
10.16 The minimum responsibilities of the local agency administering an Advanced Protection Management Program include those prescribed for the Local Agency Management Programs in Section 9.3 of this policy, as well as monitoring owner compliance with Sections 10.13, 10.14,and 10.15.

Final Draft
Tier 4 – OWTS Requiring Corrective Action
3/20/2012
43
Tier 4 – OWTS Requiring Corrective Action
OWTS that require corrective action or are either presently failing or fail at any time while this Policy is in effect are automatically included in Tier 4 and must follow the requirements as specified. OWTS included in Tier 4 must continue to meet applicable requirements of Tier 0, 1, 2 or 3 pending completion of corrective action.
11.0 Corrective Action for OWTS
11.1 Any OWTS that has pooling effluent, discharges wastewater to the surface, or has wastewater backed up into plumbing fixtures, because its dispersal system is no longer adequately percolating the wastewater is deemed to be failing, no longer meeting its primary purpose to protect public health, and requires major repair, and as such the dispersal system must be replaced, repaired, or modified so as to return to proper function and comply with Tier 1, 2, or 3 as appropriate.
11.2 Any OWTS septic tank failure, such as a baffle failure or tank structural integrity failure such that either wastewater is exfiltrating or groundwater is infiltrating is deemed to be failing, no longer meeting its primary purpose to protect public health, and requires major repair, and as such shall require the septic tank to be brought into compliance with the requirements of Section 8 in Tier 1 or a Local Agency Management Program per Tier 2.
11.3 Any OWTS that has a failure of one of its components other than those covered by 11.1 and 11.2 above, such as a distribution box or broken piping connection, shall have that component repaired so as to return the OWTS to a proper functioning condition and return to Tier 0, 1, 2, or 3.
11.4 Any OWTS that has affected, or will affect, groundwater or surface water to a degree that makes it unfit for drinking or other uses, or is causing a human health or other public nuisance condition shall be modified or upgraded so as to abate its impact.
11.5 If the owner of the OWTS is not able to comply with corrective action requirements of this section, the Regional Water Board may authorize repairs that are in substantial conformance, to the greatest extent practicable, with Tiers 1 or 3, or may require the owner of the OWTS to submit a report of waste discharge for evaluation on a case-by-case basis. Regional Water Board response to such reports of waste discharge may include, but is not limited to, enrollment in general waste discharge requirements, issuance of individual waste discharge requirements, or issuance of waiver of waste discharge requirements. A local agency may authorize repairs that are in substantial conformance, to the greatest extent practicable, with Tier 2 in accordance with section 9.2.3 if there is an approved Local Agency Management Program, or with an existing program if a Local Agency

Final Draft
Tier 4 – OWTS Requiring Corrective Action
3/20/2012
44
Management Program has not been approved and it is less than 5 years from the effective date of the Policy.
11.6 Owners of OWTS will address any corrective action requirement of Tier 4 as soon as is reasonably possible, and must comply with the time schedule of any corrective action notice received from a local agency or Regional Water Board, to retain coverage under this Policy. In no case shall the time schedule be allowed to extend beyond three months for a corrective action, with the exception of seasonal high groundwater or snow conditions.
11.7 Failure to meet the requirements of Tier 4 constitute a failure to meet the conditions of the waiver of waste discharge requirements contained in this Policy, and is subject to further enforcement action.

Final Draft
Waiver – Effective Date – Financial Assistance
3/20/2012
45
Conditional Waiver of Waste Discharge Requirements
12.0 In accordance with Water Code section 13269, the State Water Board hereby waives the requirements to submit a report of waste discharge, obtain waste discharge requirements, and pay fees for discharges from OWTS covered by this Policy. Owners of OWTS covered by this Policy shall comply with the following conditions:
12.0.1 The OWTS shall function as designed with no surfacing effluent.
12.0.2 The OWTS shall not utilize a dispersal system that is in soil saturated with groundwater.
12.0.3 The OWTS shall not be operated while inundated by a storm or flood event.
12.0.4 The OWTS shall not cause or contribute to a nuisance or pollution.
12.0.5 The OWTS shall comply with all applicable local agency codes, ordinances, and requirements.
12.0.6 The OWTS shall comply with and meet any applicable TMDL implementation requirements, special provisions for impaired water bodies, or supplemental treatment requirements imposed by Tier 3.
12.0.7 The OWTS shall comply with any corrective action requirements of Tier 4.
12.1 This waiver may be revoked by the State Water Board or the applicable Regional Water Board for any discharge from an OWTS, or from a category of OWTS.
Effective Date
13.0 This Policy becomes effective six months after its approval by the Office of
Administrative Law, and all deadlines and compliance dates stated herein start at such time.

Final Draft
Waiver – Effective Date – Financial Assistance
3/20/2012
46
Financial Assistance
14.0 Local Agencies may apply to the State Water Board for funds from the Clean Water State Revolving Fund for use in mini-loan programs that provide low interest loan assistance to private property owners with costs associated with complying with this Policy.
14.1 Loan interest rates for loans to local agencies will be set by the State Water Board using its policies, procedures, and strategies for implementing the Clean Water State Revolving Fund program, but will typically be one-half of the States most recent General Obligation bond sale. Historically interest rates have ranged between 2.0 and 3.0 percent.
14.2 Local agencies may add additional interest points to their loans made to private entities to cover their costs of administering the mini-loan program.
14.3 Local agencies may submit their suggested loan eligibility criteria for the min-loan program they wish to establish to the State Water Board for approval, but should consider the legislative intent stated in Water Code Section 13291.5 is that assistance is encouraged for private property owners whose cost of complying with the requirements of this policy exceeds one-half of one percent of the current assessed value of the property on which the OWTS is located.

Attachment 1 – Final Draft 3/20/2012
47
Initial Waiver 2nd
Waiver 3rd
Waiver
2 yrs 1 yr 1 yr
Lo
ca
l Au
tho
rities D
eve
lop
an
d s
ub
mit P
rog
ram
RB
revie
w a
nd
ap
pro
va
l
SB
Dis
pu
te R
eso
lutio
n
Po
licy a
nd
Wa
ive
r Ad
op
ted
1 yr
Lo
ca
l Au
tho
rity a
dju
stm
en
t pe
riod
½
yr2 yrs
RB
req
ue
sts
pro
gra
m c
ha
ng
es
Lo
ca
l Au
tho
rity m
od
ifies p
rog
ram
Lo
ca
l Ag
en
cy A
nn
ua
l Re
po
rts
AB 885 Regulatory Program Time Lines
V6 2/14/2012
Firs
t rep
ort s
tarts
on
4th y
ea
r
½
yr2 yrs
RB
req
ue
sts
pro
gra
m c
ha
ng
es
Lo
ca
l Au
tho
rity m
od
ifies p
rog
ram
Year 5 Year 10 Year 15
Effe
ctiv
e D
ate
RB
s a
lign
Ba
sin
Pla
ns
With
Po
licy
1 yr6
mth
Asse
ssm
en
t rep
ort o
f
OW
TS
imp
acts
eve
ry
third
ye
ar
Asse
ssm
en
t rep
ort

Attachment 2 – Final Draft 3/20/2012
48
The tables below specifically identify those impaired water bodies where: (1) it is likely that operating OWTS will subsequently be determined to be a contributing source of pathogens or nitrogen and therefore it is anticipated that OWTS would receive a loading reduction, and (2) it is likely that new OWTS installations discharging within 600 feet of the water body would contribute to the impairment. Per this Policy (Tier 3, Section 10) the Regional Water Boards must adopt a TMDL by the date specified in the table. The State Water Board, at the time of approving future 303 (d) Lists, will specifically identify those impaired water bodies that are to be added or removed from the tables below.
Table 4. Water Bodies impaired for pathogens that are subject to Tier 3 as of 2012.
RE
GIO
N
NO
.
REGION NAME WATERBODY NAME COUNTIES
TMDL Completion Date
1 North Coast Clam Beach Humboldt 2020
1 North Coast Luffenholtz Beach Humboldt 2020
1 North Coast Moonstone County Park Humboldt 2020
1 North Coast Russian River HU, Lower Russian River HA, Guerneville HSA, mainstem Russian River from Fife Creek to Dutch Bill Creek
Sonoma 2016
1 North Coast Russian River HU, Lower Russian River HA, Guerneville HSA, Green Valley Creek watershed
Sonoma 2016
1 North Coast Russian River HU, Middle Russian River HA, Geyserville HSA, mainstem Russian River at Healdsburg Memorial Beach and unnamed tributary at Fitch Mountain
Sonoma 2016
1 North Coast Russian River HU, Middle Russian River HA, mainstem Laguna de Santa Rosa
Sonoma 2016
1 North Coast Russian River HU, Middle Russian River HA, mainstem Santa Rosa Creek
Sonoma 2016
1 North Coast Trinidad State Beach Humboldt 2020
2 San Francisco Bay
China Camp Beach Marin 2014
2 San Francisco Bay
Lawsons Landing Marin 2015
2 San Francisco Bay Pacific Ocean at Bolinas Beach Marin 2014

Attachment 2 – Final Draft 3/20/2012
49
R
EG
ION
N
O.
REGION NAME WATERBODY NAME COUNTIES
TMDL Completion Date
2 San Francisco Bay
Pacific Ocean at Fitzgerald Marine Reserve San Mateo 2016
2 San Francisco Bay
Pacific Ocean at Muir Beach Marin 2015
2 San Francisco Bay
Pacific Ocean at Pillar Point Beach San Mateo 2016
2 San Francisco Bay
Petaluma River Marin, Sonoma 2017
2 San Francisco Bay
Petaluma River (tidal portion) Marin, Sonoma 2017
2 San Francisco Bay
San Gregorio Creek San Mateo 2019
3 Central Coast Pacific Ocean at Point Rincon (mouth of Rincon Cr, Santa Barbara County)
Santa Barbara
2015
3 Central Coast Rincon Creek Santa Barbara, Ventura 2015
4 Los Angeles Canada Larga (Ventura River Watershed) Ventura 2017
4 Los Angeles Coyote Creek Los Angeles, Orange 2015
4 Los Angeles Rincon Beach Ventura 2017
4 Los Angeles San Antonio Creek (Tributary to Ventura River Reach 4) Ventura 2017
4 Los Angeles San Gabriel River Reach 1 (Estuary to Firestone) Los Angeles 2015
4 Los Angeles San Gabriel River Reach 2 (Firestone to Whittier Narrows Dam
Los Angeles 2015
4 Los Angeles San Gabriel River Reach 3 (Whittier Narrows to Ramona) Los Angeles 2015
4 Los Angeles San Jose Creek Reach 1 (SG Confluence to Temple St.) Los Angeles 2015
4 Los Angeles San Jose Creek Reach 2 (Temple to I-10 at White Ave.) Los Angeles 2015
4 Los Angeles Sawpit Creek Los Angeles 2015
4 Los Angeles Ventura River Reach 3 (Weldon Canyon to Confl. w/ Coyote Cr)
Ventura 2017
4 Los Angeles Walnut Creek Wash (Drains from Puddingstone Res) Los Angeles 2015
5 Central Valley Wolf Creek (Nevada County) Nevada, Placer 2020
5 Central Valley Woods Creek (Tuolumne County) Tuolumne 2020

Attachment 2 – Final Draft 3/20/2012
50
R
EG
ION
N
O.
REGION NAME WATERBODY NAME COUNTIES
TMDL Completion Date
7 Colorado River Alamo River Imperial 2017
7 Colorado River Palo Verde Outfall Drain and Lagoon Imperial, Riverside 2017
8 Santa Ana Canyon Lake (Railroad Canyon Reservoir) Riverside 2019
8 Santa Ana Fulmor, Lake Riverside 2019
8 Santa Ana Goldenstar Creek Riverside 2019
8 Santa Ana Los Trancos Creek (Crystal Cove Creek) Orange 2017
8 Santa Ana Lytle Creek San Bernardino 2019
8 Santa Ana Mill Creek Reach 1 San Bernardino 2015
8 Santa Ana Mill Creek Reach 2 San Bernardino 2015
8 Santa Ana Morning Canyon Creek Orange 2017
8 Santa Ana Mountain Home Creek San Bernardino 2019
8 Santa Ana Mountain Home Creek, East Fork San Bernardino 2019
8 Santa Ana Silverado Creek Orange 2017
8 Santa Ana Peters Canyon Channel Orange 2017
8 Santa Ana Santa Ana River, Reach 2 Orange, Riverside 2019
8 Santa Ana Temescal Creek, Reach 6 (Elsinore Groundwater sub basin boundary to Lake Elsinore Outlet) Riverside 2019
8 Santa Ana Seal Beach Orange 2017
8 Santa Ana Serrano Creek Orange 2017
8 Santa Ana Huntington Harbour Orange 2017

Attachment 2 – Final Draft 3/20/2012
51
Table 5. Water Bodies impaired for nitrogen that are subject to Tier 3.
RE
GIO
N N
O.
REGION NAME WATERBODY NAME COUNTIES
TMDL Completion
Date
1 North Coast Russian River HU, Middle Russian River HA, mainstem Laguna de Santa Rosa Sonoma 2015
2 San Francisco Bay Lagunitas Creek Marin 2016
2 San Francisco Bay Napa River Napa, Solano 2014
2 San Francisco Bay Petaluma River Marin, Sonoma 2017
2 San Francisco Bay Petaluma River (tidal portion) Marin, Sonoma 2017
2 San Francisco Bay Sonoma Creek Sonoma 2014
2 San Francisco Bay Tomales Bay Marin 2019
2 San Francisco Bay Walker Creek Marin 2016
4 Los Angeles Lake Calabasas Los Angeles 2012
4 Los Angeles Legg Lake Los Angeles 2012
4 Los Angeles San Antonio Creek (Tributary to Ventura River Reach 4) Ventura 2013
8 Santa Ana East Garden Grove Wintersburg Channel Orange 2017
8 Santa Ana Grout Creek San Bernardino 2015
8 Santa Ana Rathbone (Rathbun) Creek San Bernardino 2015
8 Santa Ana Summit Creek San Bernardino 2015
8 Santa Ana Serrano Creek Orange 2017

Attachment 3 – Final Draft 3/20/2012
52
Regional Water Boards, upon mutual agreement, may designate one Regional Water Board to regulate a person or entity that is under the jurisdiction of both (Water Code Section 13228). The following table identifies the designated Regional Water Board for all counties within the State for purposes of reviewing and, if appropriate, approving new Local Agency Management Plans.
Table 6. Regional Water Board designations by County.
County Regions with Jurisdiction
Designated Region
Alameda 2,5 2
Alpine 5,6 6
Amador 5 5
Butte 5 5
Calaveras 5 5
Colusa 5 5
Contra Costa 2,5 2
Del Norte 1 1
El Dorado 5,6 5
Fresno 5 5
Glenn 5,1 5
Humboldt 1 1
Imperial 7 7
Inyo 6 6
Kern 5,6 5
Kings 5 5
Lake 5,1 5
Lassen 5,6 6
Los Angeles 4,6 4
Madera 5 5
Marin 2,1 2
Mariposa 5 5
Mendocino 1 1
Merced 5 5
Modoc 1,5,6 5
Mono 6 6
Monterey 3 3
Napa 2,5 2
Nevada 5,6 5
Orange 8,9 8
County Regions with Jurisdiction
Designated Region
Placer 5,6 5
Plumas 5 5
Riverside 7,8,9 7
Sacramento 5 5
San Benito 3,5 3
San Bernardino 6,7,8 6
San Diego 9,7 9
San Francisco 2 2
San Joaquin 5 5
San Luis Obispo 3,5 3
San Mateo 2,3 2
Santa Barbara 3 3
Santa Clara 2,3 2
Santa Cruz 3 3
Shasta 5 5
Sierra 5,6 5
Siskiyou 1,5 1
Solano 2,5 5
Sonoma 1,2 1
Stanislaus 5 5
Sutter 5 5
Tehama 5 5
Trinity 1 1
Tulare 5 5
Tuolumne 5 5
Ventura 4,3 4
Yolo 5 5
Yuba 5 5


El Dorado County 2010-11
E c o n o m i c a n d D e m o g r a p h i c P r o f i l e
Center for Economic DevelopmentCalifornia State University, Chico
Chico, CA 95929-0765Phone: (530) 898-4598
Fax: (530) 898-4734http://www.cedcal.com

ii
2010-11 Economic & Demographic Profile
AcknowledgementsThe CED wishes to acknowledge the work of the staff who produced this profile:
Michael Suplita, Project Manager (Document Production)Warren Jensen, Project Manager (Data Collaboration)
Everett Straus, Research AssistantShaun Carrigan, Research AssistantMarcy McCormick, Research Assistant Thomas Whitcomb, Research AssistantMelissa Smith, Research AssistantRyan Stephens, Research AssistantBrittney Doty, Cover Design
Dan Ripke, CED DirectorDon Kryskowski, CED Assistant DirectorJ. Joshua Brown, CED Information TechnologyAndria Gilbert, CED Administrative Manager
Copyright © 2011 by the Center for Economic Development, CSU, Chico Research Foundation. All rights reserved.This report or any part thereof may not be reproduced without the written permission of the Center for Economic Development or the CSU, Chico Research Foundation.
The CED is funded in part by the U.S. Department of Commerce, Economic Development Administration (EDA), and the Small Business Administration (SBA).

iii www.cedcal.com
Introduction
Introduction
Welcome to the 2010-11 El Dorado County Economic & Demographic Profile. This document contains important information about El Dorado County’s resi-dents and communities. The data have been compiled to represent trends over the past ten to twenty years, where comparable data are available, and in some cases include projections for the next 20 years. The information can be used for many purposes, including workforce and small business development, market analysis, and grant writing. By exploring the structure of El Dorado County in various aspects, the Center for Economic Development (CED) and its partners hope to facilitate development and planning for both business, communities, and residents of the county.
As a community outreach organization of the CSU, Chico Research Foundation, CED receives funding from several sources, including the Economic Development Administration of the U.S. Department of Commerce, the U.S. Small Business Administration, the California Public Utilities Commission, and many non-profit and local government organizations throughout California.
Based on client surveys and requests, as well as new research, CED updated this series to include more accurate and up-to-date information, revised narratives, and improvements in data display.
CED continues to welcome any comments and/or suggestions for improvement. In addition, we have access to community research and analysis professionals both in-house and within the communities we serve, and upon request will gladly facilitate to our fullest capacity additional community data research not included in this profile. For additional data on this county, please call (530) 898-4598.
CED cordially thanks El Dorado County and the El Dorado County Economic Development Department for sponsoring the 2010-11 El Dorado County Economic and Demographic Profile.
This document was compiled by the Center for Economic Development (CED) at California State University, Chico, this profile is distributed without charge by CED through the sponsor. For information about sponsoring other county profiles, please contact us at 530-898-4598.

iv
2010-11 Economic & Demographic Profile
El Dorado County
Location and Demographics El Dorado County is thirty miles east of Sacramento, and offers many nice suburbs for those who commute to Sacramento during the workweek. As the site of James Marshall’s first gold finding in 1848, El Dorado County became the epicenter for the gold rush madness that seized California in the nineteenth century. The gold rush brought visitors from Europe and Mexico, as well as other U.S. states. Their diverse cultural influence is still seen today in El Dorado County. El Dorado County encompasses 1,711 square miles and is home to approximately 182,000 people.
Recreation For anyone who enjoys nature or outdoor sports and recreation, El Dorado Coutny is one of the most diverse, exciting, and beautiful areas in Northern California. When not enjoying world-class skiing at Lake Tahoe, visitors can enjoy river rafting and kayaking on the South Fork of the American River. For history buffs, the Marshall Gold Discovery State Park Historic Museum celebrates the origins of the gold rush and offers a unique perspective on the past. Several nineteenth century houses in El Dorado County have been converted into bed and breakfast inns, providing visitors with quaint, affordable lodging.
Economy The Lake Tahoe area and the ski resorts within are excellent sources of revenue for El Dorado County. Skiers from all over the world visit during the winter months. El Dorado County has a largely agricultural economic base during the rest of the year. Apple orchards grow throughout the eastern parts of the county, and apple exports are a reliable source of seasonal income when the hustle and bustle of ski season ceases. The Sierra Nevada range is also in El Dorado County, where logging industries provide additional economic stimulus. Gold is still found in El Dorado County, lending a feeling of excitement to the area’s economic environment.

v www.cedcal.com
Table of Contents

vi
2010-11 Economic & Demographic Profile
Table of Contents
1. Demographics1.1 Total Population . . . . . . . . . . . . . . . . . . . . . . . . . . . . . . . . . . . . . .21.2 City Population . . . . . . . . . . . . . . . . . . . . . . . . . . . . . . . . . . . . . . .41.3 Components of Population Change . . . . . . . . . . . . . . . . . . . . .61.4 Age Distribution . . . . . . . . . . . . . . . . . . . . . . . . . . . . . . . . . . . . . .71.5 Population by Race/Ethnicity. . . . . . . . . . . . . . . . . . . . . . . . . . .91.6 Population by Educational Attainment. . . . . . . . . . . . . . . . .111.7 Net Migration. . . . . . . . . . . . . . . . . . . . . . . . . . . . . . . . . . . . . . . .131.8 Voter Registration. . . . . . . . . . . . . . . . . . . . . . . . . . . . . . . . . . . .14
2. Environmental Factors2.1 Land Area Population Density . . . . . . . . . . . . . . . . . . . . . . . .182.2 Urban Land Consumption . . . . . . . . . . . . . . . . . . . . . . . . . . . .202.3 Climate. . . . . . . . . . . . . . . . . . . . . . . . . . . . . . . . . . . . . . . . . . . . . .212.4 Air Quality . . . . . . . . . . . . . . . . . . . . . . . . . . . . . . . . . . . . . . . . . .232.5 Water Depth table. . . . . . . . . . . . . . . . . . . . . . . . . . . . . . . . . . . .252.6 Generation Capacity. . . . . . . . . . . . . . . . . . . . . . . . . . . . . . . . . .27
3. Labor Market3.1 Labor Force. . . . . . . . . . . . . . . . . . . . . . . . . . . . . . . . . . . . . . . . . .303.2 Total Employment . . . . . . . . . . . . . . . . . . . . . . . . . . . . . . . . . . .323.3 Unemployment . . . . . . . . . . . . . . . . . . . . . . . . . . . . . . . . . . . . . .343.4 Average Monthly Labor Statistics . . . . . . . . . . . . . . . . . . . . . .373.5 Jobs by industry . . . . . . . . . . . . . . . . . . . . . . . . . . . . . . . . . . . . . .413.6 Employers by Employment Size and Industry . . . . . . . . . .44
4. Income4.1 Total Personal Income. . . . . . . . . . . . . . . . . . . . . . . . . . . . . . . .484.2 Components of Total Personal Income. . . . . . . . . . . . . . . . .504.3 Components of Transfer Payments . . . . . . . . . . . . . . . . . . . .534.4 Per Capita Income . . . . . . . . . . . . . . . . . . . . . . . . . . . . . . . . . . .554.5 Median Household Income . . . . . . . . . . . . . . . . . . . . . . . . . . .574.6 Poverty Rate . . . . . . . . . . . . . . . . . . . . . . . . . . . . . . . . . . . . . . . . .584.7 Business Taxable Sales . . . . . . . . . . . . . . . . . . . . . . . . . . . . . . . .594.8 Earnings by Industry . . . . . . . . . . . . . . . . . . . . . . . . . . . . . . . . .62

vii www.cedcal.com
Table of Contents
5. Agriculutre5.1 Harvested Acreage . . . . . . . . . . . . . . . . . . . . . . . . . . . . . . . . . . .665.2 Value of Agricultural Production . . . . . . . . . . . . . . . . . . . . . .685.3 Top Crops by Value . . . . . . . . . . . . . . . . . . . . . . . . . . . . . . . . . .695.4 Farm Revenue . . . . . . . . . . . . . . . . . . . . . . . . . . . . . . . . . . . . . . .70
6. Housing & Real Estate6.1 Total Housing Units. . . . . . . . . . . . . . . . . . . . . . . . . . . . . . . . . .726.2 New Housing Units Authorized by Building Permits . . . .776.3 Value of New Construction . . . . . . . . . . . . . . . . . . . . . . . . . . .836.4 Fair Market Rent . . . . . . . . . . . . . . . . . . . . . . . . . . . . . . . . . . . . .89
7. Travel7.1 Travel Expenditures . . . . . . . . . . . . . . . . . . . . . . . . . . . . . . . . . .927.2 Travel-Generated Employment. . . . . . . . . . . . . . . . . . . . . . . .947.3 Total Annual Tourism Earnings . . . . . . . . . . . . . . . . . . . . . . .967.4 Tax Revenues Generated by Travel Expenditures . . . . . . .987.5 Selected Highway Traffic Volume . . . . . . . . . . . . . . . . . . . 1007.6 Travel Time to Work . . . . . . . . . . . . . . . . . . . . . . . . . . . . . . . 1017.7 Means of Transporation to Work. . . . . . . . . . . . . . . . . . . . 1037.8 Vehicle Registration . . . . . . . . . . . . . . . . . . . . . . . . . . . . . . . . 105
8. Community Health8.1 Death Rate. . . . . . . . . . . . . . . . . . . . . . . . . . . . . . . . . . . . . . . . . 1088.2 Birth Rate. . . . . . . . . . . . . . . . . . . . . . . . . . . . . . . . . . . . . . . . . . 1098.3 Leading Causes of Death. . . . . . . . . . . . . . . . . . . . . . . . . . . . 1108.4 Infant Mortality . . . . . . . . . . . . . . . . . . . . . . . . . . . . . . . . . . . . 1128.5 Low Birth Weight Infants . . . . . . . . . . . . . . . . . . . . . . . . . . . 1148.6 Teenage Pregnancy. . . . . . . . . . . . . . . . . . . . . . . . . . . . . . . . . 1168.7 Late Prenatal Care. . . . . . . . . . . . . . . . . . . . . . . . . . . . . . . . . . 1178.8 Medical Service Providers . . . . . . . . . . . . . . . . . . . . . . . . . . 119
9. Welfare9.1 TANF/CalWORKs Caseload & Expenditures. . . . . . . . . 1229.2 Food Stamps Caseload & Expenditures. . . . . . . . . . . . . . . 1249.3 Medi-Cal Beneficiaries. . . . . . . . . . . . . . . . . . . . . . . . . . . . . . 1269.4 Foster Care Entries . . . . . . . . . . . . . . . . . . . . . . . . . . . . . . . . . 1289.5 School Free and Reduced Meals . . . . . . . . . . . . . . . . . . . . . 130

viii
2010-11 Economic & Demographic Profile
10. Education10.1 School Enrollment . . . . . . . . . . . . . . . . . . . . . . . . . . . . . . . . 13210.2 High School Dropout Rates . . . . . . . . . . . . . . . . . . . . . . . . 13410.3 Graduates Eligible for UC or CSU System. . . . . . . . . . . 13610.4 English Learners Enrollment . . . . . . . . . . . . . . . . . . . . . . . 13810.5 Average SAT Scores . . . . . . . . . . . . . . . . . . . . . . . . . . . . . . . 13910.6 Academic Performance Index (API). . . . . . . . . . . . . . . . . 140
11. Crime11.1 Reported Crime & Crime Rates . . . . . . . . . . . . . . . . . . . . . 14411.2 Criminal Justice Personnel . . . . . . . . . . . . . . . . . . . . . . . . . 14711.3 Crime Expenditures . . . . . . . . . . . . . . . . . . . . . . . . . . . . . . . 14911.4 Probation Caseload. . . . . . . . . . . . . . . . . . . . . . . . . . . . . . . . 151

ix www.cedcal.com
Table of Contents

1 www.cedcal.com
1. Demographics
Demographic indicators describe the characteris-tics of human populations and population segments, and are especially helpful in determining consumer spending patterns. Knowledge about the age, ethnic, and cultural aspects of the population provides more specific infor-mation regarding consumer preferences. This approach, known as market segmentation, is particularly useful for businesses needing to determine the extent of the market for a particular good or service. This informa-tion is also useful in evaluating education, housing, and employment opportunities and needs. In addition, demographic information is useful to grant writers and local governments during the process of determining the need and acquiring funding for specific public ser-vices in the area.
Demographic trends are typically the founda-tion upon which other community indicators are built. While this section focuses mostly on population counts and breakdowns of population (by age, race/ethnicity, etc.), most other sections focus on the characteristics of the population (such as Community Health) or of por-tions of the population (such as Labor Market).
When analyzing population data, it is important to understand the difference between an estimate and a projection. An estimate is based on other related data or change in this data, during the year for which the estimate is made. A projection is based on data trends, calculated over a number of years, and is used to fore-cast or project future levels, assuming past trends are unchanged. For example, total population in past years is an estimate because it is based on housing growth (among other factors) during the year in which total population is estimated and future total population is a projection.
Population by age is a projection because there is no data after the 2000 Census that can be used to accu-
rately estimate how many people there are in each age group. The projection is based on 2000 Census data and past trends, including those for in migration and death rates by age group. The resulting forecast is only reliable if those trends continue for the years between the census data and the year for which the projection is made.
In this section:
1.1 Total Population . . . . . . . . . . . . . . . . . . . . . . . . . . . 2
1.2 City Population . . . . . . . . . . . . . . . . . . . . . . . . . . . . 4
1.3 Components of Population Change . . . . . . . . . . 6
1.4 Age Distribution . . . . . . . . . . . . . . . . . . . . . . . . . . . 7
1.5 Population by Race/Ethnicity . . . . . . . . . . . . . . . 9
1.6 Population by Educational Attainment . . . . . . 11
1.7 Net Migration . . . . . . . . . . . . . . . . . . . . . . . . . . . . 13
1.8 Voter Registration . . . . . . . . . . . . . . . . . . . . . . . . . 14
1. Demographics

2
2010-11 Economic & Demographic Profile
Overview Total population is the number of people who consider the area their primary residence. It does not include persons residing here less than half the year, or persons who are here temporarily, only for work (unless they consider this area their primary residence). The data is estimated annually by the California Department of Finance and reflects population estimates on January 1 of that year. The data is released annually on or around May 1.
The three-year average change is the compound annual change over the past three years.
Population represents a general overview of the size of the consumer market, labor availability, and the potential impact of human habitation on the environ-ment. The data is often required for grant applications and business and community development plans.
El Dorado County El Dorado County is currently home to 182,019 people, with a projected population of over 225,439 by 2020. This projection is supported by the fact that popu-lation increase has been steady for the last ten years, with an average annual increase of almost 2 percent. Between 2000 and 2010, the total population increased 17 percent in the county. This steady increase is due to a greater number of births than deaths in the area and a steady growth in employment opportunities (see section 1.3, Components of Population Change). NOTE: An estimate is based on other related data or change in this data during the year for which the esti-mate is made. A projection is based on the same data measured in previous years, calculated out to what it would be in the year for which the projection is made if past trends remained constant.
Year Population1-year change
CA 1-year change
1991 130,181 n/a n/a 1992 134,898 3.6 % 1.9 % 1993 138,788 2.9 % 1.4 % 1994 141,843 2.2 % 0.9 % 1995 143,863 1.4 % 0.6 % 1996 145,949 1.4 % 0.7 % 1997 148,373 1.7 % 1.2 % 1998 150,857 1.7 % 1.4 % 1999 153,232 1.6 % 1.5 % 2000 155,702 1.6 % 1.8 % 2001 160,448 3.0 % 2.1 % 2002 163,938 2.2 % 1.8 % 2003 167,010 1.9 % 1.7 % 2004 170,058 1.8 % 1.5 % 2005 173,153 1.8 % 1.3 % 2006 175,768 1.5 % 1.1 % 2007 177,712 1.1 % 1.0 % 2008 179,373 0.9 % 1.1 % 2009 180,713 0.7 % 1.0 % 2010 182,019 0.7 % 1.0 %2020(p) 225,439 2.2 % 1.3 %2030(p) 267,535 1.7 % 1.1 %
Created by: Center for Economic Development, California State University, Chico.
County Population
Source: California Department of Finance, Demographic Research UnitProjections (p): Woods & Poole Economics
1.1 Total population

3 www.cedcal.com
1. Demographics
0
50,000
100,000
150,000
200,000
250,000
300,000
1990 1995 2000 2005 2010 2015 2020 2025 2030
C ounty Population
0.0%0.5%1.0%1.5%2.0%2.5%3.0%3.5%
1994 1996 1998 2000 2002 2004 2006 2008 2010
Population Annual PercentC hange (Three-Year Average)
CaliforniaEl Dorado County

4
2010-11 Economic & Demographic Profile
Overview The California Department of Finance estimates the number of people living within each incorporated place in California as of January 1 of each year. An incorporated place is one with its own governmental body, including a city or town council. Not all places are incorporated.
El Dorado County Of the two incorporated cities in El Dorado County, the city of South Lake Tahoe was the most populous, with 24,087 people in 2010. However, the city of Placerville was the fastest growing incorporated city in the county, with an annual average population increase of 1 percent between 2000 and 2010.
The following figures present population data by city from 2000 to 2010.
9,000
9,500
10,000
10,500
2000 2002 2004 2006 2008 2010
C ity Population Placerville
Year PlacervilleSouth Lake
Tahoe
2000 9,570 23,578 2001 9,956 23,976 2002 10,260 24,003 2003 10,283 24,003 2004 10,318 23,997 2005 10,287 23,928 2006 10,246 23,773 2007 10,281 23,814 2008 10,349 23,919 2009 10,402 23,966 2010 10,429 24,087 Source: California Department of Finance, Demographic Research UnitCreated by: Center for Economic Development, California State University, Chico
City Population
1.2 Population by City
23,200
23,400
23,600
23,800
24,000
24,200
2000 2002 2004 2006 2008 2010
C ity Population South Lake Tahoe

5 www.cedcal.com
1. Demographics
-1.0%
0.0%
1.0%
2.0%
3.0%
4.0%
2003 2004 2005 2006 2007 2008 2009 2010
Population Annual Percent C hange (Three-Year Average)
El Dorado County
South Lake Tahoe
-0.5%0.0%0.5%1.0%1.5%2.0%2.5%3.0%3.5%
2003 2004 2005 2006 2007 2008 2009 2010
Population Annual Percent C hange (Three-Year Average)
El Dorado County
Placerville

6
2010-11 Economic & Demographic Profile
Overview The California Department of Finance does annu-al estimates on how births, deaths, and net migration influence annual population change at the county level. The number of births and deaths is on record from the California Department of Public Health. Births minus deaths equals the natural rate of change. The remain-ing change in population is due to net migration. Net migration is in-migration minus out-migration. In- and out-migration are not independently estimated by the Department of Finance.
If growth is primarily due to natural increase, then the community may be a place where families are grow-ing. If natural rate of change is negative (more deaths than births), then generally age distribution is weighted towards the elderly. Migration can occur for several rea-sons. People may migrate either in or out due to employ-ment opportunities, housing prices, quality of life, etc.
NOTE: Birth and Death estimates in this section do not precisely match those in the health section because the sections show different cutoff dates. This section is July 1 through June 30, while birth and death data in section 8 is for the calendar year.
El Dorado County In 2009, there was a net migration of 670 peo-ple to El Dorado County. There were 1,754 births and 1,227 deaths in the county in the same year, resulting in a natural increase of 527 people. The figures below present the components of population change in El Dorado County since 2000.
Year Births DeathsNet Foreign Migration
Net Domestic Migration
Total Change
2000 1,575 1,096 256 3,283 4,018 2001 1,679 1,142 336 2,975 3,848 2002 1,737 1,180 273 2,296 3,126 2003 1,781 1,174 257 2,153 3,017 2004 1,834 1,258 209 2,295 3,080 2005 1,871 1,256 287 2,209 3,111 2006 2,022 1,269 279 1,082 2,114 2007 1,937 1,243 365 792 1,851 2008 1,902 1,235 401 576 1,644 2009 1,754 1,227 272 398 1,197
Components of Population Change
Source: California Department of Finance, Demographic Research UnitCreated by: Center for Economic Development, California State University, Chico
0
1,000
2,000
3,000
4,000
5,000
2000 2001 2002 2003 2004 2005 2006 2007 2008 2009
C omponents of Population C hangeNatural IncreaseNet MigrationTotal Change
1.3 Components of Population Change

7 www.cedcal.com
1. Demographics
Overview Population breakdowns by age are projected by the California Department of Finance (DOF) as of July 1st of each year. The projections use the 2000 Census as a base. These models are based on total net migration and fertil-ity rates by ethnicity. There is little data available, other than what is collected for the census, that would produce more accurate projections of population by age.
Age distribution information is valuable to compa-nies that target specific age groups. It is used for revenue projections, business plans, and for marketing purposes. The age distribution in a given area affects the area’s school system, public services, and overall economy. It is also an important measure of diversity within a com-munity. A large older teen and young adult demographic has a greater need for higher education and vocational training facilities, while a large middle-aged group cre-ates more focus on employment opportunities. An area with a large mature or retired population typically has fewer employment concerns, but a greater need for
medical services. A county with a large number of young children is attractive to day care centers, and other family related services. Age distribution information is also used in conjunction with components of popula-tion change in order to project population growth in the future.
El Dorado County The largest age group in El Dorado County in 2010 is the 50-59 year-old range which represents 17.6 percent of the total county population. This group is followed by those ages 40-49 with 16 percent. Since 2000, the number of people ages 50-59 increased over 55 per-cent, while those ages 30-39 decreased nearly 27 percent, causing a 5 percent decrease among children in the 0-9 year-old range. Simultaneously, residents 60-69 make up a higher percentage of the population in El Dorado County than the state average.
See the chart for more details on age distribution in El Dorado County since 2000.
Year 0-9 10-19 20-29 30-39 40-49 50-59 60-69 70-79 80+2000 20,471 24,817 13,312 21,933 30,080 21,472 12,847 9,210 4,4792001 20,012 26,175 12,986 21,722 31,017 23,018 13,452 9,362 4,8192002 19,538 27,065 13,243 21,091 31,697 24,441 14,132 9,540 5,1072003 19,234 27,551 13,846 20,408 32,045 25,808 15,013 9,753 5,3702004 18,973 27,936 14,717 19,667 32,324 27,269 15,838 9,976 5,6202005 18,866 28,153 15,671 19,158 32,418 28,717 16,667 10,155 5,8142006 18,640 27,990 16,949 18,303 32,058 29,875 17,494 10,353 5,9852007 18,649 27,739 18,291 17,829 31,630 30,716 18,922 10,588 6,1472008 18,758 27,361 19,740 17,330 31,099 31,709 20,158 10,967 6,2772009 19,035 26,904 21,195 16,742 30,725 32,577 21,430 11,314 6,4142010 19,458 26,245 22,714 16,113 30,351 33,377 22,790 11,692 6,568Source: California Department of Finance, Demographic Research UnitCreated by: Center for Economic Development, California State University, Chico
Age Distribution
1.4 Age Distribution

8
2010-11 Economic & Demographic Profile
0%
5%
10%
15%
20%
0-9 10-19 20-29 30-39 40-49 50-59 60-69 70-79 80+
Percent of Total Population by Age2000
2010

9 www.cedcal.com
1. Demographics
Overview While sometimes difficult to classify, race and eth-nicity of a population is self-determined, meaning that individuals identify their own race or ethnicity in the census. There are five race categories: American Indian, Asian, Black, White, and other. Alternative names for these classifications are also used to address matters of social sensitivity, although the people classified in each of these categories remains the same. The CED uses these classifications only because these are the names used by the U.S. Census Bureau.
The 1990 Census asked people to choose their pri-mary racial category. The question changed for the 2000 Census, which allowed respondents to choose as many race categories as they deemed appropriate, leading to a change in the data categories for 2000.
Hispanic is an ethnic classification. Some people who consider themselves Hispanic do not consider themselves to be members of one of the four specific race categories, and therefore classify themselves as “other.” The California Department of Finance responded by adding Hispanic origin as a separate category in its pro-jections of population by race. In the data table, Hispanic includes all persons who consider themselves to be of Hispanic origin, while all other categories exclude this group. Therefore, the sum of all categories is equal to the projected population in each year.
As with age distribution, population by race/ethnicity is a projection based on data from the 2000 Census. All projections are for July 1 of the given year.
Population by race statistics are used by advertis-ers to market products to a particular ethnic group and
Year Total White Hispanic Asian BlackAmerican
Indian O ther2000 158,621 135,355 14,787 3,340 776 1,306 3,0572001 162,563 138,547 15,453 3,362 779 1,309 3,1132002 165,854 141,112 16,085 3,388 784 1,309 3,1762003 169,028 143,599 16,722 3,418 786 1,308 3,1952004 172,320 146,181 17,374 3,443 792 1,307 3,2232005 175,619 148,678 18,068 3,484 796 1,315 3,2782006 177,647 150,142 18,636 3,532 804 1,323 3,2102007 180,511 152,303 19,238 3,581 812 1,331 3,2462008 183,399 154,480 19,848 3,628 820 1,339 3,2842009 186,336 156,683 20,478 3,674 828 1,347 3,3262010 189,308 158,918 21,116 3,717 836 1,355 3,3662020(p) 225,439 174,965 33,483 11,133 3,378 2,480 n/a2030(p) 267,535 197,336 47,742 15,119 4,324 3,014 n/aSource: California Department of Finance, Demographic Research Unit (p): Woods & Poole EconomicsCreated by: Center for Economic Development, California State University, Chico
Population by Race/Ethnicity
1.5 Population by Race/Ethnicity

10
2010-11 Economic & Demographic Profile
to determine whether investments in businesses with race specific target markets are likely to be lucrative. For example, investing in a start-up Spanish radio station may be a better investment in a predominantly Hispanic area. Advertising companies use race/ethnicity data in order to make their advertisements appealing to the dominant ethnic groups in a given area.
Grant writers use race/ethnicity data to create arguments to acquire funding for programs targeted toward specific groups, or to show population dis-parities that are favorable in grant priority scoring. Government offi-cials and political candidates also use race/ethnicity data in order to tailor their campaigns to distinct ethnic groups in certain locations.
El Dorado County Approximately 84 percent of residents in El Dorado County clas-sify themselves as white in 2010, while statewide the white population is 42 percent. Hispanics represented the next largest group, with 11 per-cent of the population, compared to 37 percent in California. Asians and American Indians are the next largest groups, with 2 percent and 0.7 percent, respectively. Blacks are the smallest census-classified group, with 0.4 percent.
NOTE: The multi-race data is reported on July 1 of each year. This creates a discrepancy between the total population data (section 1.1) and the total population by race/eth-nicity data because total population data is collected on January 1 of each year.
0%
20%
40%
60%
80%
100%
White Hispanic Asian Black American Indian
Percent of Population by Race/Ethnicity 2000
2010
0%
20%
40%
60%
80%
100%
White Hispanic Asian Black American Indian
Percent of Population by Race/Ethnicity, 2010 El Dorado CountyCalifornia

11 www.cedcal.com
1. Demographics
Overview Educational attainment is requested by the U.S. Census Bureau during the decennial census. The data represents the number of people 18 years and over who have achieved a specified level of education.
Educational attainment has a direct influence on family income. Often gains in annual income for men and women result from more education. Conversely, a family’s income affects their ability to pay the high costs of pursuing a two-year, four-year, or graduate degree. High educational attainment by the local population exhibits a degree of permanence and can be a factor in attracting new businesses to an area, particularly those requiring skilled workers. Increased income, whether linked to higher educational attainment or other factors, increases tax revenues generated in a particular county through increased taxable retail sales.
Educational attainment information is also used by businesses for market research, primarily by those wish-ing to target customers of a particular educational level.
El Dorado County In 2008, 30 percent of El Dorado County residents had some college education with no degree, making them the largest educational group in the area. This rate is higher than the rest of the state, in which 25 percent of all residents had some college education as their highest level of education. High school graduates and residents holding bachelor’s degrees were the next most common educational groups in El Dorado County, at 26 and 19 percent, respectively. In 2008, El Dorado County was above the statewide average for residents having an associate’s degrees, as their highest level of education.
Educational Attainment 2000 2008Less than 9th grade 3,162 2,3299th to 12th grade, no diploma 10,993 9,756High school graduate, GED, or alternative 27,199 36,163Some college, no degree 36,430 41,389Associate's degree 9,633 12,032Bachelor's degree 19,318 26,190Graduate or professional degree 8,876 10,321Total 115,611 138,180Source: U.S. Department of Commerce, Bureau of the CensusCreated by: Center for Economic Development, California State University, Chico
Population by Educational Attainment, Population 18 and O ver
1.6 Population by Educational Attainment

12
2010-11 Economic & Demographic Profile
0%5%
10%15%20%25%30%35%
Less than 9th grade
9th to 12th grade, no diploma
High school graduate, GED,
or alternative
Some college, no degree
Associate's degree
Bachelor's degree
Graduate or professional
degree
Population by Educational Attainment (Percent of Total) El Dorado CountyCalifornia
0%5%
10%15%20%25%30%35%
Less than 9th grade
9th to 12th grade, no diploma
High school graduate, GED,
or alternative
Some college, no degree
Associate's degree
Bachelor's degree
Graduate or professional
degree
Population by Educational Attainment (C ounty Percent of Total) 2000 2008

13 www.cedcal.com
1. Demographics
driven by in migration is the product of some economic factor or amenity attracting new residents. The attrac-tion could be an increase in employment opportunities, the recognition of the environmental advantages of the area, or expanding business opportunities. In general, new residents do not move to an area without good rea-son, and when they do, they fuel economic expansion.
El Dorado County Two of the top five counties for in migration lie within close proximity of El Dorado County, while two Bay Area counties are also among them. Interestingly, El Dorado County had a Southern California county among its top five for in migration.
Overview This indicator includes information concerning migration patterns between El Dorado and other nearby counties with the highest levels of migration interaction. It includes the top five counties in terms of out-migration, the top five in terms of in-migration, and their respec-tive median income levels. Collected from the Internal Revenue Service (IRS) database, these numbers are based on taxes paid by all citizens.
In-migration is the number of people moving into El Dorado County from some other area in the world and out-migration is the number moving from El Dorado County to other areas. Net migration is in-migration minus out-migration.
This indicator provides information on likely chang-es in the economic, political, and social structure of an area based on the characteristics of the area from which the migrants originate. For example, migrants coming from large cities bring with them a particular set of character-istics and values that may affect the local political climate. They also bring their patterns of consumer spending that create opportunities for businesses to provide the kinds of products and services these individuals are accustomed to receiving at their urban place of origin.
Neighboring counties, as well as those with higher population totals, generally show the most migration activity. However, if a non-neighboring county, even one with a smaller total population, is present among the top five counties in terms of migration, there may be a unique interaction that is worth further evaluation.
That portion of population growth
County NumberSacramento, CA 5,022Placer, CA 952Santa Clara, CA 686Los Angeles, CA 640Contra Costa, CA 460
Top 5 In-Migration by County 2007-08
Source: Internal Revenue Service, 2009Created by: Center for Economic Development, California State University, Chico
County NumberSacramento, CA 4,154Placer, CA 1,098Douglas, NV 768Santa Clara, CA 422Washoe, NV 382
Top 5 O ut-Migration by County 2007-08
Source: Internal Revenue Service, 2009Created by: Center for Economic Development, California State University, Chico
1.7 Net Migration

14
2010-11 Economic & Demographic Profile
Overview Voter information includes voter registration and political party affiliation. The choice of a party generally reflects certain attitudes towards government including relative tolerance for higher taxes, land preservation, and allocation of local government funds. The information made available from voter registration data may provide general guidance to local government in terms of its role in public policy and fiscal matters.
A registered voter may or may not choose a political party. The data presented shows the number of registered voters for each party, and party members as a percentage of the total number of registered voters. The accuracy of this data depends on the ability of the county clerk to update their voter rolls and remove those who no longer live at the address where they registered.
NOTE: In the following table, those persons registered to vote are shown as a percent of the total eligible.
People typically choose a political party repre-senting social and economic values close to their own. Therefore, political party membership may allow a busi-ness or organization to evaluate whether the community may or may not support particular proposals for devel-opment or regulation.
Registrants as a percentage of those estimated to be eligible to vote may indicate the level of civic participa-tion and political involvement within the community. Communities with high levels of voter participation ordinarily have a strong sense of community and that may be a characteristic attractive to potential new resi-dents and also to new businesses and potential employ-ers.
El Dorado County As of May 2010, of the nearly 129,000 El Dorado County residents eligible to vote, 81.6 percent were registered. In comparison, 72.4 percent of eligibles in California, were registered. In the county, 30.6 percent of registered voters were registered Democrat and 44.9 percent were regis-tered Republican. In California, 44.5 percent of eligible voters were registered Democrat and 30.8 percent were registered Republican. For a complete listing of regis-tered voters by political affiliation, please see the chart to the left.
1.8 Voter Registration
Political affiliation Number of peoplePercent of total
eligblesEligible 128,827 n/aRegistered 105,163 81.6 %Democratic 32,173 30.6 %Republican 47,249 44.9 %American Independent 3,373 3.2 %Green 895 0.9 %Libertarian 768 0.7 %Peace and Freedom 262 0.2 %Miscellaneous 772 0.7 %Decline to affiliate 19,671 18.7 %Source: California Secretary of State, Elections Divisions
Voter Registration as of May 24, 2010
Created by: Center for Economic Development, California State University, Chico

15 www.cedcal.com
1. Demographics
Democratic30.6 %
Republican44.9 %
Other party5.8 %
Decline to affiliate18.7 %
C ounty Political Party Affiliation, 2010
Democratic44.5 %
Republican30.8 %
Other party4.5 %
Decline to affiliate20.2 %
C alifornia Political Party Membership, 2010

16
2010-11 Economic & Demographic Profile

17 www.cedcal.com
2. Environmental Factors
Environmental factors can influence a county’s agriculture, economic standing, recreation, and the quality of life of its residents. Climate is a key factor in determining what types of limitations or opportunities exist for agricultural production or recreational activities. This section provides infor-mation useful for making decisions concerning resi-dential and business location.
Many state parks in El Dorado County offer a vari-ety of recreational opportunities. Due to the mountain-ous geography and extreme seasonal weather changes, the recreational opportunities are ever-changing.
In this section:2.1 Land Area Population Density . . . . . . . . . . . . .20
2.2 Urban Land Consumption . . . . . . . . . . . . . . . . .22
2.3 Climate . . . . . . . . . . . . . . . . . . . . . . . . . . . . . . . . . . .23
2.4 Air Quality . . . . . . . . . . . . . . . . . . . . . . . . . . . . . . .25
2.5 Water Depth Table . . . . . . . . . . . . . . . . . . . . . . . .27
2.6 Generation Capacity . . . . . . . . . . . . . . . . . . . . . . .29
2. Environmental Factors

18
2010-11 Economic & Demographic Profile
Overview Population density is determined by dividing the total population of the area by its size in land area. This section shows population density in persons per square mile of land area, a commonly used measure.
The concept of “urban” versus “rural” is a relative one. For example, people living in Sacramento might consider the city of Placerville to be rural, while residents of Pollock Pines may consider Placerville to be “the city.” Population density provides a quantitative measure of the degree of an area’s urbanization.
This measure can be an important quality of life indicator for an area. Economic use for land includes the production of raw materials, factories and other pro-duction facilities, office space, housing, food production, recreation, and transportation of goods and people. As population density rises, certain activities become more expensive to maintain. Farming can be crowded out by more profitable industrial or residential development. This structural change is likely to be associated with increasing area economic activity, but can also lead to adverse impacts on the quality of life. Vehicle use also rises and as more vehicle miles are traveled in a confined location, traffic slows down causing more congestion. This not only increases commute time, but also increases air pollution emissions per square mile. As a result, in addition to the positive impacts of the associated eco-nomic growth, an increase in population density can have negative impacts on the mental health (stress) and physical well-being (increased exposure to toxins) of a community.
Persons per acre, rather than persons per square mile, is a measure more commonly found in large dense cities, or by local government planning departments when evaluating community density or the density of a proposed development. To convert persons per square mile to persons per acre, divide persons per square mile by 640.
Population density can be used in grant writing and when comparing the degree of urbanization of dif-ferent counties or areas.
YearLand area (sq. miles)
Total population
Population density (per sq.
mile)1991 1,711 130,181 761992 1,711 134,898 791993 1,711 138,788 811994 1,711 141,843 831995 1,711 143,863 841996 1,711 145,949 851997 1,711 148,373 871998 1,711 150,857 881999 1,711 153,232 902000 1,711 155,702 912001 1,711 160,419 942002 1,711 163,871 962003 1,711 166,908 982004 1,711 169,926 992005 1,711 172,987 1012006 1,711 175,530 1032007 1,711 177,379 1042008 1,711 178,860 1052009 1,711 180,185 1052010 1,711 182,019 1062020(p) 1,711 225,439 1322030(p) 1,711 267,535 156
Land Area and Population Density
Source: California Department of FinanceCreated by: Center for Economic Development, California State University, Chico
2.1 Land Area & Population Density

19 www.cedcal.com
2. Environmental Factors
El Dorado County El Dorado County’s total land area is 1,710.8 square miles. Because population has increased while land area has remained constant, El Dorado County’s population density has steadily risen over time. As of 2010, the population density in the county was 106 resi-dents per square mile, putting it well below the statewide average population density of 248 people per square mile. It is projected that by 2020 the population density in El Dorado County will reach 132 people per square mile.
0
50
100
150
200
250
300
350
1991 1993 1995 1997 1999 2001 2003 2005 2007 2009 2020(p)
Population Density (per sq. mile) El Dorado County
California

20
2010-11 Economic & Demographic Profile
Overview Every two years, the California Department of Conservation conducts aerial land surveys in agricultural areas to determine the extent to which farmland may or may not be replaced by other uses over time. Generally, the most common use into which agricultural land is converted is developed urban land.
Reductions in agricultural land perma-nently reduce agriculture as an industry in the county, which may be a critically important base industry in some counties. Many planners consider development that does not consume agricultural land as being more beneficial to the community. El Dorado County Since 1984, urban land has consumed not only farmland, but grazing land as well. Urban land has increased by over 12,000 acres, an increase of 63 percent, while farm-land has decreased by nearly 13,000 acres, or 16 percent. There has also been a decrease in grazing land of 6,000 acres and an increase in other land of 6,000 acres.
2.2 Urban Land Consumption
Year FarmlandGrazing
LandUrban and
Built-Up LandWater Area
O ther Land
1984 77,949 200,664 19,803 6,937 231,0511986 77,970 199,623 21,131 6,924 230,7561988 78,094 197,964 23,008 6,924 230,4131990 78,064 195,365 23,779 6,924 232,2721992 88,125 186,196 24,295 6,924 230,8631994 88,531 186,126 24,339 6,893 230,5151996 88,254 185,418 25,360 6,893 230,4791998 88,146 185,283 25,690 6,880 230,4042000 68,292 203,798 26,132 6,819 231,3612002 67,508 201,738 28,557 6,819 231,7802004 66,681 196,900 30,670 6,820 235,3322006 65,844 195,958 31,359 6,819 236,4262008 65,105 194,779 32,195 6,819 237,508Source: California Department of Conservationn/a: Data not reported by sourceCreated by: Center for Economic Development, California State University, Chico
Urban Land Consumption (acres)
- 1,500
- 1,000
- 500
n/a
500
1,000
1,500
2,000
2,500
3,000
1984 1986 1988 1990 1992 1994 1996 1998 2000 2002 2004 2006
Urban Land C onsumption Farmland
Urban and Built-Up Land

21 www.cedcal.com
2. Environmental Factors
2.3 Climate
Overview This indicator shows climate readings from select-ed weather stations in El Dorado County. Climate data is collected on an ongoing basis and is reported by the Western Regional Climate Center in December of each year unless otherwise noted. The data expresses an annu-al average calculated over the time indicated below.
It is important to know what types of weather a certain area may experience because of extremes of heat and cold, and severe storms may reduce the desirability of an area for tourists or retirees. These conditions may occur in a particular season and limit the attractiveness of an area at certain times of the year. This information can be useful for determining which particular busi-nesses might be viable in a specific area.
El Dorado County Weather in El Dorado County is wildly variable. The County spans from the Central Valley to Lake Taho so it is difficult to identify a weather station that represents the El Dorado County climate. The following figure shows the average temperatures and precipitation
rates in winter and summer for each weather station in the county. NOTE: The data here reflects an average of monthly readings taken between the following years for each site:
Georgetown: 1/1/1893 to 11/30/1967Placerville: 1/1/1900 to presentSquaw Valley Lodge: 10/13/1955 to 10/31/1975Tahoe: 9/13/1903 to 9/30/2010
Georgetown PlacervilleSquaw Valley
Lodge TahoeAverage July maximum temp. (deg.) 89.4 92.7 80.1 77.9Average January maximum temp. (deg.) 51.2 53.4 39.5 38.5Average July minimum temp. (deg.) 59.5 51.9 42.1 44.4Average January minimum temp. (deg.) 35.2 32.6 14.6 19.0Average July precipitation (in.) 0.0 0.1 0.7 0.3Average January precipitation (in.) 10.6 6.9 9.7 6.0Average annual precipitation (in.) 53.0 38.1 51.0 31.4Average January snowfall (in.) 9.2 1.2 54.9 45.9Average annual snowfall (in.) 31.8 2.5 246.6 190.7
Climate Station Readings as of July 2010
Source: Western Regional Climate CenterCreated by: Center for Economic Development, California State University, Chico

22
2010-11 Economic & Demographic Profile
0102030405060708090
100
Georgetown Placerville Squaw Valley Lodge Tahoe
Average Maximum Temperature, July and January (degrees Fahrenheit)
July
January
0
50
100
150
200
250
300
Georgetown Placerville Squaw Valley Lodge Tahoe
Average Annual Precipitation and Snowfall (inches) Precipitation
Snowfall
23 www.cedcal.com
2. Environmental Factors
Overview Air quality is the general term used to describe various aspects of the air that plants and human popula-tions are exposed to in their daily lives. There are four main contaminants that decrease air quality: particulates (PM 10 and PM 2.5), tropospheric ozone (O3), carbon monoxide (CO), and oxides of nitrogen (NOX). Air pol-lutants are emitted by both stationary and mobile sourc-es. Stationary sources include factories, power plants, and agricultural burning (forest fires and field burning). Mobile sources of pollution include automobiles, motor-cycles, trucks, buses, and various types of recreational vehicles. Mobile sources are primarily responsible for the decrease in air quality in Northern California.
Air quality standards are set at both state and fed-eral levels. The allowable levels for a particular pollutant are established in affect to protect human health, avoid damage to sensitive vegetation, and preserve aesthetic values. If a region is in violation of one or more stan-dards for allowable levels of the above four pollutants, the state may limit the type of new industrial facilities that can be built in the area and place more restrictions on existing operations in the future.
PM2.5 and Ozone are shown in this report because the California Air Resources Board includes metrics indicating long-term (8-hr) exposure to these pollutants. Long-term exposure is far more detrimental to human health than short-term (1-hr.) exposure. State standards are reported because they are higher than federal stan-dards.
As industry, agricultural production, and traf-fic continues to increase across California, air quality becomes an important issue. Air quality affects all popu-lations, especially the young, the elderly, and those with heart or lung problems. Ultimately, a county with high levels of pollutants will also see an increased need for
health services. Air quality can be an important factor in determining where people are willing or able to live.
El Dorado County In 2009, the county air quality did not exceed state or federal standards, however, the county did spend 40 days over the state 8 hour ozone average in the same year. See the table on the next page.
PM2.5 - Particulate matter over 2.5 microns in diameter composed of very small bits of ash, wood tars, soot and other substances created by combus-tion. Examples of sources include cars and trucks (especially diesels), woodstoves, and open burning. PM2.5 particles are so small that they can evade the body’s natural defense mechanisms and penetrate deep into lung tissue. They can damage lung tissue, which can lead to serious respiratory problems.
O3 - Ozone. Concentrations are measured in parts per million. Sources include cars and trucks (especially diesels), industrial sources like chrome platers, neighborhood businesses, such as dry clean-ers and service stations, and building materials and products. Overexposure to O3 can cause breathing difficulties and lung damage. Ozone is an invisible pollutant formed by chemical reactions involv-ing nitrogen oxides, reactive hydrocarbons, and sunlight. It is a powerful respiratory irritant that can cause coughing, shortness of breath, head-aches, fatigue and lung damage, especially among children, the elderly, the ill, and people who exer-cise outdoors. Ozone also damages plants, includ-ing agricultural crops, and degrades manufactured materials such as rubber and paint.
2.4 Air Quality

24
2010-11 Economic & Demographic Profile
Year
Number of Days Above State 8 hour
O zone Average
Number of Days Above State
PM2.5 Average1999 94 02000 77 02001 88 02002 102 02003 85 02004 66 02005 60 02006 80 02007 51 02008 55 02009 40 0
Air Q uality
Source: California Air Resource BoardCreated by: Center for Economic Development, California State University, Chico

25 www.cedcal.com
2. Environmental Factors
Overview Periodically, the California Department of Water Resources tests groundwater wells for pollution or con-taminants. One of the outputs of this testing includes depth to groundwater. The CED used wells in the coun-ty with consistent measurement between 1999 and 2010, and corrected for wells not measured in any particular year.
Water is scarce in most parts of California, creat-ing tremendous pressure to redistribute the state’s water resources and to find new sources and ways to store and deliver water more efficiently. In addition, water is only plentiful parts of the year. Typically, whenever water shortages occur, groundwater is used to supple-ment surface water storage and delivery. Therefore, groundwater levels are the best measure to determine the sustainability of water availability, whether or not significant amounts of groundwater are used.
El Dorado County Overall, El Dorado County has experienced little groundwater change over the past ten years. Depths have fluctuated between 22 and 30 feet deep, with an increasing long-term trend. Between 1999 and 2010 water table depths increased an average of 3.2 percent per year with a net change of approximately 8 feet.
2.5 Water Depth Table
YearAverage Depth to groundwater (ft)
1999 26.292000 29.402001 33.712002 32.482003 31.362004 31.802005 30.582006 28.252007 30.892008 32.302009 31.20
County W ater Table Depth
Created by: Center for Economic Development, California State University, Chico
Source: California Department of Water Resources
YearAverage Depth to groundwater (ft)
1999 94.442000 76.882001 83.692002 73.362003 75.112004 73.372005 80.742006 83.502007 87.222008 89.682009 68.24
Created by: Center for Economic Development, California State University, Chico
Source: California Department of Water Resources
California W ater Table Depth

26
2010-11 Economic & Demographic Profile
0
20
40
60
80
100
1999 2000 2001 2002 2003 2004 2005 2006 2007 2008 2009 2010
Depth to G roundwater California
El Dorado County

27 www.cedcal.com
2. Environmental Factors
Overview The California Department of Energy is respon-sible for licensing and monitoring of all electrical power plants in California with a capacity greater than 1/10 of a megawatt. Actual electricity production is not col-lected and reported by the state. Although the federal government requires production reporting for power plants with greater than 100 megawatts of capacity, this represents a small fraction of generation in most areas.
Electricity production provides economic value of environmental features to the local community. Depending upon the type of generation, it indicates the degree to which renewable or green electricity if pro-duced in and benefits the local community.
El Dorado County All of El Dorado County’s generation capacity comes in the form of hydroelectric power, generating a total of 739.5 megawatts of power.
2.6 Generation Capacity
Facility MegawattsCoal 0.0Geothermal 0.0Hydroelectric 739.5Nuclear 0.0Oil/Gas 0.0Solar 0.0Wind 0.0WTE 0.0Source: The California Energy CommissionCreated by: Center for Economic Development, California State University, Chico
Generation Capacity

28
2010-11 Economic & Demographic Profile

29 www.cedcal.com
3. Labor Market
Labor market conditions are an important indi-cator of an area’s economic well-being. Of particular importance is the relationship among all of these factors: labor force, employment, unemployment, and monthly employment. While alone, one of these factors might project an incomplete image of the economy’s perfor-mance, taken together, they provide a comprehensive assessment of the health of the labor market and the associated well-being of affected residents.
Labor market information can be used to draw conclusions about the availability of jobs, the social cli-mate, and the standard of living in the area.
The following is a brief summary of the statistical relationship between each of the indicators discussed in this section:
Labor force is equal to employment plusunemployment.
Employment refers to people working at least one hour per week.
Unemployment refers to people working less than one hour per week, but is actively seeking work. Unemployment rate is equal to unemployment divided by labor force.
The U.S. Department of Labor, Bureau of Labor Statistics uses the twelfth of each month to determine a person’s employment status. This date was originally chosen because at one time, there were no holidays in the week that included the twelfth. Although that may not be true now, mid-month time periods are less volatile to changes in the overall business climate.
The average unemployment rate in El Dorado County from 1999 to 2009 was 5.6 percent. Tracking monthly unemployment trends during that time revealed sea-sonal changes in the level of employment with January seeing the lowest average employment and September and August having the highest employment.
In this section:3.1 Labor Force . . . . . . . . . . . . . . . . . . . . . . . . . . . . . . . 30
3.2 Total Employment . . . . . . . . . . . . . . . . . . . . . . . . 32
3.3 Unemployment . . . . . . . . . . . . . . . . . . . . . . . . . . . 34
3.4 Average Monthly Labor Statistics . . . . . . . . . . . 37
3.5 Jobs by industry . . . . . . . . . . . . . . . . . . . . . . . . . . . 41
3.6 Employers by Employment Size and Industry . . . . . . . . . . . . . . . . . . . . . . . . . . . . . . . . . . 44
3. Labor Market

30
2010-11 Economic & Demographic Profile
Overview The labor force is the number of people living in the specified area who are willing and able to work. It is the sum of employment (persons currently working) and unemployment (persons actively seeking work). Therefore, changes in both employment and unemploy-ment affect the labor force. The labor force is estimated monthly by the California Employment Development Department. Annual data is the average of the twelve months of the year.
An increasing labor force indicates a growing economy only if it is the result of increasing employ-ment. If the labor force is growing due primarily to increasing unemployment, then population growth may be occurring in excess of the ability of the economy to provide jobs for new workforce entrants.
El Dorado County In 2009, 91,800 residents, or 51 percent of El Dorado County’s population, were members of the labor force, compared to 48 percent in California. The labor force has increased steadily over the last twenty years, with a 1 percent growth in 2009. This steady increase indicates a perpetual increase in available employment and business growth.
YearLabor Force
1-year change
1990 63,900 n/a 1991 65,500 2.5 % 1992 67,300 2.7 % 1993 67,500 0.3 % 1994 70,500 4.4 % 1995 72,200 2.4 % 1996 74,100 2.6 % 1997 75,700 2.2 % 1998 77,000 1.7 % 1999 79,300 3.0 % 2000 82,100 3.5 % 2001 84,100 2.4 % 2002 86,600 3.0 % 2003 88,100 1.7 % 2004 89,200 1.2 % 2005 91,200 2.2 % 2006 92,100 1.0 % 2007 90,900 - 1.3 % 2008 91,100 0.2 % 2009 91,800 0.8 %
Total Labor Force
Source: California Employment Development Department, Labor Market Information DivisionCreated by: Center for Economic Development, California State University, Chico
3.1 Labor Force
0
20,000
40,000
60,000
80,000
100,000
1990 1992 1994 1996 1998 2000 2002 2004 2006 2008
Labor Force

31 www.cedcal.com
3. Labor Market
-1.0%
0.0%
1.0%
2.0%
3.0%
4.0%
1993 1995 1997 1999 2001 2003 2005 2007 2009
Labor Force Annual Percent C hange (Three-Year Average)
El Dorado CountyCalifornia
Year Placerville South Lake Tahoe2000 4,700 13,500 2001 4,900 13,800 2002 5,000 14,300 2003 5,100 14,600 2004 5,200 14,700 2005 5,300 15,100 2006 5,300 15,200 2007 5,300 15,100 2008 5,300 15,200 2009 5,500 15,600 Source: California Employment Development Department, Labor Market Information DivisionCreated by: Center for Economic Development, California State University, Chico
Labor Force By City

32
2010-11 Economic & Demographic Profile
Overview The California Employment Development Department (EDD) defines employment as the number of residents who are employed, regardless of whether they work in the county or city of residence: “Civilian employment includes all individuals who worked at least one hour for a wage or salary, were self employed, or were working at least fifteen unpaid hours in a family business or on a family farm during the week including the twelfth of the month. Those who were on vacation, other kinds of leave, or involved in a labor dispute, were also counted as employed.”
Increasing employment indicates an increase in economic activity within the area, either by increasing local jobs or increasing the number of workers in resi-dence. Workers spend a large portion of their income at their place of residence (the percentage of which typically depends on the availability and relative price of retail goods in the community). Employment by place of residence is an economic indicator that is typically evalu-ated alongside the count of jobs by place of work.
El Dorado County As of 2009, 81,500 members, or 89 percent of El Dorado County’s labor force, were employed, a 4 percent decrease from the preceding year. 89 percent of California’s total labor force was also employed in the same year. Total employment had been experienc-ing steady growth since 1990 but experienced its first declines in 2007, 2008, and 2009.
Year Empl.1-year change
1990 61,000 n/a 1991 61,100 0.2 % 1992 61,500 0.7 % 1993 61,600 0.2 % 1994 65,400 6.2 % 1995 67,200 2.8 % 1996 69,300 3.1 % 1997 71,500 3.2 % 1998 73,100 2.2 % 1999 76,200 4.2 % 2000 78,700 3.3 % 2001 80,500 2.3 % 2002 82,100 2.0 % 2003 83,200 1.3 % 2004 84,500 1.6 % 2005 86,800 2.7 % 2006 87,800 1.2 % 2007 86,200 - 1.8 % 2008 84,800 - 1.6 % 2009 81,500 - 3.9 %
Total Employment
Source: California Employment Development Department, Labor Market Information DivisionCreated by: Center for Economic Development, California State University, Chico
3.2 Total Employment

33 www.cedcal.com
3. Labor Market
-4.0%
-2.0%
0.0%
2.0%
4.0%
6.0%
1993 1995 1997 1999 2001 2003 2005 2007 2009
Employment Annual Percent C hange (Three-Year Average)
El Dorado CountyCalifornia
0
20,000
40,000
60,000
80,000
100,000
1990 1992 1994 1996 1998 2000 2002 2004 2006 2008
Employment Year Placerville South Lake Tahoe2000 4,400 12,700 2001 4,500 13,000 2002 4,600 13,300 2003 4,700 13,500 2004 4,800 13,700 2005 4,900 14,100 2006 4,800 13,700 2007 4,900 14,000 2008 4,800 13,700 2009 4,600 13,200 Source: California Employment Development Department, Labor Market Information DivisionCreated by: Center for Economic Development, California State University, Chico
Employment By City

34
2010-11 Economic & Demographic Profile
Overview Unemployment is the estimated number of people who are actively seeking work and are not working at least one hour per week for pay and who are not self-employed. As with employment, it is estimated at the place of residence. Annual average unemployment is the average of twelve monthly unemployment estimates developed by the California Employment Development Department (EDD).
Unemployment is not a simple count of people who are receiving unemployment insurance payments, although the EDD uses unemployment insurance recipi-ents to help produce its estimates. Not everyone who the EDD considers to be unemployed, including those whose employment is terminated due to poor perfor-mance, is eligible for these benefits. Unemployment includes workers who have been laid off and are waiting to be called back to work, though it does not include people who are in prisons, mental hospitals, nursing homes, or those under the age of sixteen, regardless of whether they are seeking work or not.
The unemployment rate is the percent of the labor force that is unemployed. It is often used as a primary measure of economic health, although by itself, changes in the unemployment rate may misrepresent economic performance. For example, take the case of rising employment with a simultaneous rise in unemployment (a common situation in Northern California in the early 2000s). This situation typically produces an increase in the unemployment rate, even when the employment sit-uation is improving. Therefore, employment growth or labor force growth combined with employment growth, are better measures of economic performance.
Still, the unemployment rate is a valuable com-munity indicator. Sustained high unemployment rates typically indicate the presence of societal issues within
the community, although what is considered “high” may vary from one community to the next. For communities with a high unemployment rate, social issues may vary as well. See the social indicators sections, nine through twelve, to find connections between the unemployment rate and social issues.
3.3 Unemployment
Year Unempl.Unempl.
Rate1-year change
1990 2,900 4.5 % n/a 1991 4,400 6.7 % 51.7 % 1992 5,800 8.6 % 31.8 % 1993 5,900 8.7 % 1.7 % 1994 5,100 7.2 % - 13.6 % 1995 5,000 6.9 % - 2.0 % 1996 4,700 6.4 % - 6.0 % 1997 4,200 5.5 % - 10.6 % 1998 3,800 5.0 % - 9.5 % 1999 3,100 3.9 % - 18.4 % 2000 3,400 4.1 % 9.7 % 2001 3,600 4.3 % 5.9 % 2002 4,500 5.2 % 25.0 % 2003 4,900 5.6 % 8.9 % 2004 4,700 5.3 % - 4.1 % 2005 4,400 4.8 % - 6.4 % 2006 4,200 4.6 % - 4.5 % 2007 4,700 5.1 % 11.9 % 2008 6,300 6.9 % 34.0 % 2009 10,300 11.3 % 63.5 %
Total Unemployment
Source: California Employment Development Department, Labor Market Information DivisionCreated by: Center for Economic Development, California State University, Chico

35 www.cedcal.com
3. Labor Market
Another important issue exposed by unemploy-ment statistics is the number of potentially qualified workers available in the community. As unemployment falls, employers start having a difficult time attracting qualified employees at their offered rates of pay. High-skill workers are typically affected first, such as those in management, technical, and professional occupations, with moderate-skill workers being affected as the unem-ployment rate continues to fall. Results typically include higher average pay, in combination with out migration of some firms in search of the employees they can no longer find locally.
The lowest unemployment rate calculated over the past ten years, or the lowest unemployment number, can be used to estimate the level at which employers have dif-ficulty finding qualified employees. At the national level the lowest sustainable unemployment rate is called the full-employment unemployment rate, and at that rate, the remaining unemployment is not due to a lack of jobs, but rather structural, frictional, and seasonal factors.
El Dorado County In 2009, 10,300 members of El Dorado County’s labor force were unemployed, making up 11 percent of the labor force. El Dorado County’s unemployment rate has been consistently lower than the California average since 1990. For example, when statewide unemploy-ment swelled to 9.5 percent in 1993, El Dorado County’s unemployment rate was at 8.7 percent.
Year Placerville South Lake Tahoe2000 6.3 % 5.7 %2001 6.6 % 5.9 %2002 7.9 % 7.2 %2003 8.4 % 7.7 %2004 8.0 % 7.3 %2005 7.3 % 6.7 %2006 10.4 % 9.6 %2007 7.8 % 7.2 %2008 10.4 % 9.6 %2009 16.6 % 15.3 %
Unemployment rate by City
Source: California Employment Development Department, Labor Market Information DivisionCreated by: Center for Economic Development, California State University, Chico

36
2010-11 Economic & Demographic Profile
0.0 %
2.0 %
4.0 %
6.0 %
8.0 %
10.0 %
12.0 %
1990 1992 1994 1996 1998 2000 2002 2004 2006 2008
Unemployment rate El Dorado County California
0
2,000
4,000
6,000
8,000
10,000
12,000
1990 1992 1994 1996 1998 2000 2002 2004 2006 2008
Unemployment

37 www.cedcal.com
3. Labor Market
Overview The California Employment Development Department estimates labor market data (labor force, employment, unemployment, and the unemployment rate) for each month. The department uses the week including the twelfth of each month to determine a person’s employment status. Mid-month time periods are less sensitive to changes in the overall business cli-mate and are more representative of average conditions. For specific definitions of each measure, please see the previous three indicators in this section.
Average monthly labor statistics are used to evalu-ate seasonal trends in employment. Areas dependent on agriculture, forestry, or seasonal recreation tend to experience fluctuations in employment over the course of the year that cannot be observed when using the annual average as a measure. The difference in employ-ment in the low and high months can be used to evalu-ate the degree to which an economy is dependent upon seasonal employment. Many seasonal employees locate temporarily (at winter ski resorts or some types of farms) and leave during the off-season, but some remain year-round and are unemployed during the months of lower employment.
El Dorado County Between 1990 and 2009, unemployment was low-est in August through October. The highest unemploy-ment rates occurred in January through March, peaking in January at 6.7 percent and decreasing throughout the year.
In all cases, the average monthly unemployment rate for El Dorado County was lower than the statewide average from 1990-2009.
3.4 Average Monthly Labor Statistics
Month Labor Force Empl. Unempl.Unempl.
RateJan 16,085,287 14,881,780 1,203,523 7.5 %Feb 16,137,333 14,945,307 1,192,027 7.4 %Mar 16,149,107 14,973,807 1,175,313 7.3 %Apr 16,099,450 15,002,853 1,096,597 6.9 %May 16,126,343 15,051,397 1,074,967 6.7 %Jun 16,233,207 15,091,097 1,142,110 7.1 %Jul 16,356,390 15,145,223 1,211,160 7.4 %Aug 16,321,913 15,179,517 1,142,407 7.0 %Sep 16,233,370 15,122,543 1,110,840 6.9 %Oct 16,283,997 15,173,163 1,110,840 6.8 %Nov 16,261,833 15,132,967 1,128,863 7.0 %Dec 16,248,480 15,138,770 1,109,727 6.9 %
Created by: Center for Economic Development, California State University, Chico
California Average Monthly Labor Statistics, 1990-2009
Source: California Employment Development Department, Labor Market Information Division

38
2010-11 Economic & Demographic Profile
Month Labor Force Empl. Unempl.Unempl.
RateJan 92,400 82,900 9,500 10.2 %Feb 92,400 82,700 9,700 10.5 %Mar 92,500 82,300 10,200 11.1 %Apr 91,800 82,400 9,400 10.3 %May 91,700 81,700 10,000 10.9 %Jun 92,200 81,500 10,700 11.6 %Jul 92,800 82,100 10,700 11.5 %Aug 92,300 81,800 10,500 11.3 %Sep 91,200 80,800 10,400 11.4 %Oct 91,100 80,300 10,800 11.9 %Nov 91,000 80,200 10,800 11.9 %Dec 90,700 79,400 11,300 12.5 %
El Dorado County Average Monthly Labor Statistics, 2009
Source: California Employment Development Department, Labor Market Information DivisionCreated by: Center for Economic Development, California State University, Chico
Month Labor Force Empl. Unempl.Unempl.
RateJan 79,825 74,535 5,270 6.7 %Feb 79,880 74,685 5,190 6.6 %Mar 80,010 74,835 5,185 6.5 %Apr 79,500 74,735 4,770 6.1 %May 79,530 74,745 4,790 6.1 %Jun 79,875 75,125 4,750 6.0 %Jul 80,375 75,670 4,700 5.9 %Aug 80,285 75,865 4,425 5.5 %Sep 79,655 75,300 4,355 5.5 %Oct 80,055 75,575 4,490 5.7 %Nov 80,410 75,620 4,790 6.0 %Dec 80,665 75,825 4,855 6.1 %
El Dorado County Average Monthly Labor Statistics, 1990-2009
Source: California Employment Development Department, Labor Market Information DivisionCreated by: Center for Economic Development, California State University, Chico

39 www.cedcal.com
3. Labor Market
78,80079,00079,20079,40079,60079,80080,00080,20080,40080,60080,800
Jan Feb Mar Apr May Jun Jul Aug Sep Oct Nov Dec
C ounty Average Monthly Labor Force, 1990-2009
73,500
74,000
74,500
75,000
75,500
76,000
Jan Feb Mar Apr May Jun Jul Aug Sep Oct Nov Dec
C ounty Average Monthly Employment,1990-2009

40
2010-11 Economic & Demographic Profile
0.0%1.0%2.0%3.0%4.0%5.0%6.0%7.0%8.0%
Jan Feb Mar Apr May Jun Jul Aug Sep Oct Nov Dec
Average Monthly Unemployment Rate, 1990-2009
El Dorado County
California
0
1,000
2,000
3,000
4,000
5,000
6,000
Jan Feb Mar Apr May Jun Jul Aug Sep Oct Nov Dec
C ounty Average Monthly Unemployment, 1990-2009

41 www.cedcal.com
3. Labor Market
Overview Published by the U.S. Department of Commerce, Bureau of Economic Analysis (BEA), this measure of jobs is by place of work; that is, where the job is being performed regardless of where its worker lives. The BEA uses business tax returns from the Internal Revenue Service to calculate jobs by industry. Therefore, each person who worked for a company for pay or profit over the course of a year is counted. That means if a person changed jobs once over the course of a year, they are counted twice—once for each company at which they worked. The same holds true for part-time and seasonal employees who hold more than one job over the course of a year. Self-employed proprietors and members of business partnerships are counted as well. A person with a full-time job who owns or co-owns a business on the side is counted for each job. Unpaid family workers and volunteers, however, are not included.
Some industries may be so small that publish-ing data could disclose confidential information about an individual business. The BEA will withhold data if there are fewer than four businesses or if one business is responsible for more than 80 percent of the industry’s sales. If a withholding occurs, the BEA must withhold data in another category to preserve confidentiality.
Before 2000, jobs by industry was published accord-ing to the Standard Industrial Classification. In 2001, that changed to the new North American Industrial Classification (NAICS). The NAICS system of industrial classification was an improvement over the old system because it allowed the separation of important indus-try groups, such as recreation. Therefore, recreation is its own category starting in 2001. Before 2001, jobs in recreation were classified mostly under retail trade and services.
Job growth by industry sector is a measure of the
economic diversity and stability of the local economy. A healthy economy will have a balance between industries. If too many jobs are concentrated in one sector, a down-turn in that sector could easily and rapidly weaken the economy.
Job growth is an important indicator for busi-ness and government planning, allowing for a better understanding of which sectors are the major generators of jobs in the area and which sectors are continuing to grow. This can provide insight into which industries have the greatest potential for growth in the near future.
El Dorado County According to the available data, the mining sector had the largest growth in employment between 2007 and 2008 in El Dorado County with a 19 percent increase. Real estate, rental, and leasing employment had the next highest with a 10 percent growth in the county. In El Dorado County, management of companies and enter-prises employment decreased 53 percent, and informa-tion employment decreased 9 percent in the same year.
3.5 Jobs by Industry

42
2010-11 Economic & Demographic Profile
Year 2001 2002 2003 2004 2005 2006 2007 2008Farm jobs 1,388 1,436 1,392 1,368 1,315 1,287 1,373 1,344Forestry, fishing, related activities, and other
548 605 490 505 508 488 523 548
Mining 168 147 162 175 175 169 217 259Utilities 167 147 139 137 131 128 140 145Construction 8,723 8,348 8,649 9,659 10,436 10,322 10,269 9,499Manufacturing 2,365 2,117 2,124 2,090 2,132 2,377 2,395 2,255Wholesale trade 1,355 1,508 1,533 1,619 1,668 1,804 1,736 1,737Retail trade 9,683 9,442 9,593 9,595 9,799 9,804 9,907 9,913Transportation and warehousing 976 1,052 939 979 1,161 1,187 1,208 1,149Information 1,047 953 951 1,144 1,183 1,256 1,368 1,245Finance and insurance 3,605 4,412 5,054 5,210 5,406 5,364 5,905 6,451Real estate and rental and leasing 5,696 5,681 6,079 6,899 7,827 8,395 8,757 9,641Professional, scientific, and technical services
8,808 8,724 9,003 9,588 9,654 9,683 10,112 10,230
Management of companies and enterprises
230 196 262 259 265 260 273 128
Administrative and waste services 3,825 3,915 3,863 5,447 5,267 5,868 6,011 6,157Educational services 863 969 969 995 1,158 1,565 1,597 1,743Health care and social assistance 6,240 6,406 6,864 7,273 7,367 7,439 7,679 8,066Arts, entertainment, and recreation 3,366 3,336 3,260 3,582 3,538 3,450 3,222 3,342Accommodation and food services 6,062 6,236 6,678 7,090 7,137 7,040 7,016 6,801Other services, except public administration
5,197 5,389 5,674 6,322 6,460 6,349 6,449 6,561
Government and government enterprises
9,201 9,414 9,314 9,261 9,354 9,550 9,677 10,035
*Value of withheld "(D)" employment 0 0 0 0 0 0 0 0
Total Jobs 79,513 80,433 82,992 89,197 91,941 93,785 95,834 97,249
Jobs by Industry
Source: U.S. Department of Commerce, Bureau of Economic AnalysisCreated by: Center for Economic Development, California State University, Chico

43 www.cedcal.com
3. Labor Market
0.0 % 2.0 % 4.0 % 6.0 % 8.0 %
10.0 % 12.0 % 14.0 %
Prof
essio
nal,
scie
ntifi
c, an
d te
chni
cal s
ervi
ces
Gov
ernm
ent a
nd
gove
rnm
ent
ente
rpris
es
Reta
il tr
ade
Real
esta
te an
d re
ntal
an
d le
asin
g
Cons
truc
tion
Hea
lth ca
re an
d so
cial
assis
tanc
e
Acc
omm
odat
ion
and
food
serv
ices
Oth
er se
rvic
es,
exce
pt p
ublic
ad
min
istra
tion
Fina
nce a
nd
insu
ranc
e
Adm
inist
rativ
e and
w
aste
serv
ices
Jobs by Industry Sector, 2008 2008 El Dorado County2008 California
0.0 % 2.0 % 4.0 % 6.0 % 8.0 %
10.0 % 12.0 % 14.0 %
Prof
essio
nal,
scie
ntifi
c, an
d te
chni
cal s
ervi
ces
Gov
ernm
ent a
nd
gove
rnm
ent
ente
rpris
es
Reta
il tr
ade
Real
esta
te an
d re
ntal
and
leas
ing
Cons
truc
tion
Hea
lth ca
re an
d so
cial
assis
tanc
e
Acc
omm
odat
ion
and
food
serv
ices
Oth
er se
rvic
es,
exce
pt p
ublic
ad
min
istra
tion
Fina
nce a
nd
insu
ranc
e
Adm
inist
rativ
e and
w
aste
serv
ices
Jobs by Industry Sector, C ounty 2008 El Dorado County
2001 El Dorado County

44
2010-11 Economic & Demographic Profile
Overview Each year, the U.S. Department of Commerce’s Census Bureau tabulates the number of employers with employees on which taxes are paid. As with Jobs by Industry (the previous section), the tabulations are based on tax returns are collected by the Internal Revenue Service. Establishments without payroll are not includ-ed. Most businesses are non-employers, although most jobs are employee positions.
The stability of a local economy is dependent
upon a diverse mix of businesses, both in terms of size and industry sector. A diverse employer mix allows an economy to weather economic downturns more easily than one that is dependent on a few types of businesses. For example, during the previous recession the Bay Area was heavily dependent upon computer technology employers when the dot-com crisis hit in 2000. The national economy experienced a small recession during a few months in 2001, but the Bay Area suffered from a much deeper economic downturn that lasted several years.
El Dorado County In 2008, businesses with one to four employees were the most common in El Dorado County, and made up 62 percent of all establishments. Another 17 percent of the businesses in El Dorado County con-sisted of five to nine employees, suggesting a strong trend of small local businesses in the county. Statewide, businesses with one to four employees were the most common, making up 54 percent of all businesses in the state.
3.6 Employers by Employment Size & Industry
0.0 % 10.0 % 20.0 % 30.0 % 40.0 % 50.0 % 60.0 % 70.0 %
1 to 4 5 to 9 10 to 19
20 to 49
50 to 99
100 to 249
250 to 499
500 to 999
1,000 or
more
Establishments by Employment Size, 2008
El Dorado County 2008
California 2008
0.0 % 10.0 % 20.0 % 30.0 % 40.0 % 50.0 % 60.0 % 70.0 %
1 to 4 5 to 9 10 to 19
20 to 49
50 to 99
100 to 249
250 to 499
500 to 999
1,000 or
more
Establishments by Employment Size, 1998 and 2008
El Dorado County 2008
El Dorado County 1998

45 www.cedcal.com
3. Labor Market
Industry1 to 4 Empl.
5 to 9 Empl.
10-19 Empl.
20 to 49 Empl.
50 to 99 Empl.
100 to 249
Empl.
250 to 499
Empl.
500 to 999
Empl.
1,000 or more Empl.
Agriculture, Forestry, Fishing, and Hunting
16 3 2 1 0 0 0 0 0
Mining 4 1 2 0 0 0 0 0 0Utilities 6 1 1 0 1 0 0 0 0Construction 637 132 53 29 8 4 0 1 0Manufacturing 104 37 24 18 8 3 0 0 1Wholesale Trade 101 28 9 3 1 1 0 0 0Retail Trade 278 146 70 44 10 13 1 0 0Transportation and Warehousing
49 7 4 1 2 0 0 0 0
Information 38 9 13 5 4 2 0 0 0Finance and Insurance 164 55 26 6 3 1 4 0 0Real Estate and Rental and Leasing
199 30 9 5 1 1 1 0 0
Professional, Scientific, and Technical Services
439 62 41 11 4 2 1 0 0
Management of Companies and Enterprises
11 2 6 0 1 0 0 0 0
Administrative and Waste Services
143 39 20 8 7 7 0 0 0
Educational Services 27 8 10 6 3 0 0 0 0Health Care and Social Assistance
236 127 55 32 8 4 0 1 1
Arts, Entertainment, and Recreation
50 11 5 6 2 2 0 1 1
Accommodation and Food Services
149 90 104 70 17 0 1 0 0
Other Services (except Public Administration)
202 66 35 17 3 0 0 0 0
Unclassified 7 0 0 0 0 0 0 0 0Total Establishments 2,860 854 489 262 83 40 8 3 3Source: U.S. Bureau of the Census, County Business PatternsCreated by: Center for Economic Development, California State University, Chico
Number of Establishments by Employment Size and Industry, 2008

46
2010-11 Economic & Demographic Profile
Industry1 to 4 Empl.
5 to 9 Empl.
10-19 Empl.
20 to 49 Empl.
50 to 99 Empl.
100 to 249
Empl.
250 to 499
Empl.
500 to 999
Empl.
1,000 or more Empl.
Agriculture, Forestry, Fishing, and Hunting
23 5 4 3 0 0 0 0 0
Mining 1 0 2 1 0 0 0 0 0Utilities 5 2 0 0 0 0 0 0 0Construction 484 74 41 20 5 3 1 0 0Manufacturing 86 31 21 16 5 4 0 0 0Wholesale Trade 58 23 15 7 1 0 0 0 0Retail Trade 285 128 70 33 11 7 0 0 0Transportation and Warehousing
38 12 4 5 3 0 0 0 0
Information 27 12 8 4 2 1 0 0 1Finance and Insurance 88 41 16 7 1 0 0 0 0Real Estate and Rental and Leasing
132 31 11 5 1 1 0 0 0
Professional, Scientific, and Technical Services
275 50 14 9 1 1 0 1 0
Management of Companies and Enterprises
6 2 0 0 1 0 0 0 0
Administrative and Waste Services
121 32 12 14 2 4 1 0 0
Educational Services 19 7 7 4 0 0 0 0 0Health Care and Social Assistance
204 118 38 16 3 2 0 2 0
Arts, Entertainment, and Recreation
39 7 9 5 2 1 0 0 1
Accommodation and Food Services
162 81 71 72 13 3 0 2 0
Other Services (except Public Administration)
199 69 28 7 1 0 0 0 0
Unclassified 38 1 0 0 0 0 0 0 0Total Establishments 2,290 726 371 228 52 27 2 5 2Source: U.S. Bureau of the Census, County Business PatternsCreated by: Center for Economic Development, California State University, Chico
Number of Establishments by Employment Size and Industry, 1998

47 www.cedcal.com
4. Income
Income affects consumer choice, local retail sales, and is an indicator of current economic condi-tions. Income influences buying power and income changes allow comparison of local economic perfor-mance to that of surrounding areas.
Income is one measure of the benefits to people provided by employment, government, or their own investments. It is the primary connection between employment and the overall benefit jobs provide for residents.
In this section:
4.1 Total Personal Income . . . . . . . . . . . . . . . . . . . . 48
4.2 Components of Total Personal Income . . . . 50
4.3 Components of Transfer Payments . . . . . . . . 53
4.4 Per Capita Income . . . . . . . . . . . . . . . . . . . . . . . 55
4.5 Median Household Income . . . . . . . . . . . . . . . 57
4.6 Poverty Rate . . . . . . . . . . . . . . . . . . . . . . . . . . . . . 58
4.7 Business Taxable Sales . . . . . . . . . . . . . . . . . . . . 59
4.8 Earnings by Industry . . . . . . . . . . . . . . . . . . . . . 62
4. Income

48
2010-11 Economic & Demographic Profile
Overview Total personal income is calculated by the U.S. Department of Commerce, Bureau of Economic Analysis. It is the sum of all income collected by indi-viduals, including but not limited to earned income, government payments, and returns on investment. It does not include personal contributions for social insur-
ance (such as payments to Social Security or Medicare).
Total personal income is the basis for several other income indicators in this section. Growing personal income indicates a growing economy, as long as the growth is greater than the annual average inflation rate of 2.3 percent. The growth may be due to increasing
incomes, increasing population, or some combination. See the demographics sec-tion (section one) and the indicator for per capita personal income later in this section to see which factor is more promi-nent.
El Dorado County The total personal income in El Dorado County was over $8.8 billion in 2008, a 10 percent increase from the pre-vious year. When income was adjusted for inflation, the increase was 6 percent. Adjusted personal income is expected to increase to over $9.4 billion by 2020. This projection indicates an economy that is steadily growing, with a consumer driven market that will gain spending power going forward. As the following figure shows, total personal income in El Dorado County has followed a similar rate of change to the statewide average since 1991.
Year
Current-dollar personal income
(thousands)1-year change
Inflation-adjusted personal income
(thousands, 2004$)1-year change
1990 $ 2,591,889 n/a $ 3,746,043 n/a 1991 $ 2,741,503 5.8 % $ 3,802,275 1.5 %1992 $ 2,996,875 9.3 % $ 4,034,994 6.1 %1993 $ 3,142,981 4.9 % $ 4,108,714 1.8 %1994 $ 3,404,865 8.3 % $ 4,339,939 5.6 %1995 $ 3,655,705 7.4 % $ 4,531,251 4.4 %1996 $ 3,947,070 8.0 % $ 4,752,081 4.9 %1997 $ 4,277,644 8.4 % $ 5,034,560 5.9 %1998 $ 4,684,243 9.5 % $ 5,428,549 7.8 %1999 $ 5,117,082 9.2 % $ 5,802,022 6.9 %2000 $ 5,595,834 9.4 % $ 6,138,519 5.8 %2001 $ 5,762,650 3.0 % $ 6,146,610 0.1 %2002 $ 5,993,822 4.0 % $ 6,293,680 2.4 %2003 $ 6,280,680 4.8 % $ 6,447,937 2.5 %2004 $ 6,766,107 7.7 % $ 6,766,107 4.9 %2005 $ 7,299,144 7.9 % $ 7,059,950 4.3 %2006 $ 7,797,681 6.8 % $ 7,306,458 3.5 %2007 $ 8,011,051 2.7 % $ 7,298,509 - 0.1 %2008 $ 8,822,782 10.1 % $ 7,740,828 6.1 % 2020(p) n/a n/a $ 9,476,355 n/a 2030(p) n/a n/a $ 12,646,121 n/a
Total Personal Income
Source: California Department of Finance, Demographic Research Unit; Projections (p): Woods & Poole EconomicsCreated by: Center for Economic Development, California State University, Chico
4.1 Total Personal Income

49 www.cedcal.com
4. Income
02,000,0004,000,0006,000,0008,000,000
10,000,00012,000,00014,000,000
1990 1995 2000 2005 2010 2015 2020 2025 2030
Inflation-Adjusted Total Personal Income (Thousands, 2004$)
0.0%
2.0%
4.0%
6.0%
8.0%
10.0%
1993 1995 1997 1999 2001 2003 2005 2007
C urrent-Dollar Personal Income AnnualPercent C hange (Three-Year Average)
California
El Dorado County

50
2010-11 Economic & Demographic Profile
Overview According to the U.S. Department of Commerce, total personal income can be broken down into the fol-lowing five major categories shown in this indicator: earnings by place of work; dividends, interest, and rent; personal contributions for social insurance, adjustment by place of residence, and transfer payments.
Understanding how income is earned in the
community can shed light on the structure of the local economy. If a greater proportion is in earnings by place of work, then industry performance is driving economic growth. If there is a greater proportion of adjustment by place of residence or of transfer payments, then people living in the community are importing income into the area, which means that the community’s economic performance may be driven by factors currently outside the area’s influence. A negative adjustment by place of
4.2 Components of Total Personal Income
YearEarnings by workplace
Dividends, interest, and rent
Transfer payments
Contributions for social insurance
Adjustments for residence
Total personal income
1990 $ 1,097,781 $ 522,545 $ 290,145 $ 116,183 $ 797,601 $ 2,591,889 1991 $ 1,121,817 $ 544,219 $ 331,774 $ 123,889 $ 867,582 $ 2,741,5031992 $ 1,210,149 $ 555,377 $ 385,774 $ 130,985 $ 976,560 $ 2,996,8751993 $ 1,258,739 $ 555,806 $ 411,166 $ 135,918 $ 1,053,188 $ 3,142,9811994 $ 1,330,384 $ 611,427 $ 410,403 $ 143,864 $ 1,196,515 $ 3,404,8651995 $ 1,357,740 $ 657,393 $ 434,816 $ 147,477 $ 1,353,233 $ 3,655,7051996 $ 1,432,823 $ 709,040 $ 460,993 $ 149,456 $ 1,493,670 $ 3,947,0701997 $ 1,548,212 $ 789,374 $ 471,663 $ 158,315 $ 1,626,710 $ 4,277,6441998 $ 1,773,963 $ 840,572 $ 495,310 $ 178,729 $ 1,753,127 $ 4,684,2431999 $ 2,019,761 $ 869,377 $ 520,235 $ 201,290 $ 1,908,999 $ 5,117,0822000 $ 2,307,625 $ 975,666 $ 553,338 $ 230,055 $ 1,989,260 $ 5,595,8342001 $ 2,465,159 $ 1,005,507 $ 617,731 $ 256,482 $ 1,930,735 $ 5,762,6502002 $ 2,647,527 $ 986,349 $ 671,289 $ 282,413 $ 1,971,070 $ 5,993,8222003 $ 2,807,444 $ 964,804 $ 714,562 $ 303,715 $ 2,097,585 $ 6,280,6802004 $ 3,073,217 $ 1,012,483 $ 755,677 $ 340,711 $ 2,265,441 $ 6,766,1072005 $ 3,317,202 $ 1,093,881 $ 802,666 $ 368,758 $ 2,454,153 $ 7,299,1442006 $ 3,515,289 $ 1,150,302 $ 873,629 $ 385,303 $ 2,643,764 $ 7,797,6812007 $ 3,559,576 $ 1,240,952 $ 942,478 $ 394,298 $ 2,662,343 $ 8,011,0512008 $ 3,789,351 $ 1,538,666 $ 1,020,325 $ 403,791 $ 2,878,231 $ 8,822,782 2020(p) $ 4,203,056 $ 1,608,237 $ 1,497,516 $ 497,366 $ 2,664,912 $ 9,476,355 2030(p) $ 2,295,606 $ 2,295,606 $ 2,103,950 $ 662,111 $ 3,382,868 $ 12,646,121Source: California Department of Finance, Demographic Research Unit; Projections (p): Woods & Poole EconomicsCreated by: Center for Economic Development, California State University, Chico
Components of Total Personal Income (Thousands)

51 www.cedcal.com
4. Income
residence typically means that the community is not pro-viding enough opportunities to house people working in the community in terms of price, availability, or quality.
El Dorado County Approximately 43 percent of the income of El Dorado County residents came from earnings by place of work in 2008. Another 17 percent of income in the county came from dividends, interest, and rent, and 12 percent came from transfer payments. There was a 33 percent adjustment for residence in the county in 2008, indicating that a large number of residents commuted outside of El Dorado County for work; therefore, wages earned by those persons were a part of the county’s total
personal income, but were not earned there.
Earnings by place of work is the total income earned from jobs located in a given county. Based on business tax returns, these earnings can be wages, salary disbursements, other labor income, or proprietor (the owner’s) income earned within the county regardless of the employee’s place of residence.
Dividends, interest, and rent are various types of returns on investments. These include payments by corporations, located at home and abroad, to U.S. resident stockholders, as well as monetary and/or imputed interest received by individuals, nonprofit institutions, estates, and trusts. An individual’s income from real property rentals and royal-ties received from patents, copyrights, and rights to natural resources is also included.
Personal contributions for social insurance are a compo-nent of earnings, but not a component of income because the income is counted when the social insurance is received as a benefit, such as Social Security payments, rather that when it was earned. In other words, contributions are taken out of a paycheck prior to disbursement. Therefore, as a com-
ponent of personal income, this measure is always negative. These contributions include payments made by employers, employees, the self-employed, and by other individuals to programs. In addition to Social Security, payments include those to the Federal Deposit Insurance Corporation (FDIC) and Medicare.
Adjustment by place of residence is made so that total per-sonal income is an indicator that reveals income by place of residence instead of by place of work. This is helpful when evaluating the economic well-being of people who live and work within the county, not counting commuters. Positive residence adjustments indicate that more people live in the county and work outside the county. Negative residence adjustments indicate that more people work in the county, but live outside of it.
Transfer payments are compensations for work not imme-diately performed. They include payments made by govern-ment and businesses to individuals and nonprofit institu-tions. Transfer payments include a wide variety of payments that are described in the following indicator.

52
2010-11 Economic & Demographic Profile
-10%
0%
10%
20%
30%
40%
50%
60%
70%
80%
90%
Earnings by place of work
Dividends, interest, and rent
Transfer payments Contributions for social insurance
Adjustment for residence
C omponents of Total Personal Income (Percent of Total), 1990 El Dorado County
California
-10.0%
0.0%
10.0%
20.0%
30.0%
40.0%
50.0%
60.0%
70.0%
80.0%
Earnings by place of work
Dividends, interest, and rent
Transfer payments Contributions for social insurance
Adjustment for residence
C omponents of Total Personal Income (Percent of Total), 2008 El Dorado CountyCalifornia

53 www.cedcal.com
4. Income
Overview Transfer payments are a component of total per-sonal income. They are payments made by the govern-ment or a business to an individual or nonprofit institu-tion. The payment cannot be compensation for current work, or else it would be considered earnings. Returns on investments, such as dividends, interest, and rent, are not considered to be transfer payments. Transfer pay-ments can be broken down into the following nine major categories:
Understanding the routes through which trans-fer payments are being distributed to individuals in the community can further understanding about the structure of the economy. If a greater proportion of pay-ments are from retirement and medical payments, then retirees are a relatively important part of the economy. If the greater proportion is in income maintenance and unemployment insurance payments, then there may be some social issues affecting employment growth within the community.
4.3 Components of Transfer Payments
Year
Ret. & disab. Insurance
benefit payments
Medical payments
Income maintenence
benefit paymentts
Unemp. Insurance
benefit payments
Veterans' benefit
payments
Fed. edu. & training
assistance payments
O ther payments
to individuals
Payments to non-profit
institutions
Business payments
to individuals
1990 $ 146,835 $ 77,345 $ 29,088 $ 8,548 $ 8,465 $ 1,616 $ 967 $ 8,283 $ 8,9981991 $ 165,420 $ 90,736 $ 32,276 $ 15,623 $ 8,627 $ 1,393 $ 981 $ 9,788 $ 6,9301992 $ 182,126 $ 114,179 $ 35,351 $ 26,608 $ 8,509 $ 1,482 $ 1,319 $ 10,672 $ 5,5281993 $ 191,604 $ 127,973 $ 36,912 $ 27,903 $ 8,670 $ 1,407 $ 622 $ 11,910 $ 4,1651994 $ 186,877 $ 137,181 $ 40,204 $ 17,597 $ 9,194 $ 1,693 $ 631 $ 13,687 $ 3,3391995 $ 196,112 $ 147,142 $ 42,776 $ 15,594 $ 9,375 $ 2,337 $ 540 $ 14,799 $ 6,1411996 $ 206,477 $ 159,403 $ 44,480 $ 14,944 $ 10,361 $ 2,108 $ 495 $ 14,479 $ 8,2461997 $ 216,721 $ 165,559 $ 40,336 $ 13,188 $ 10,427 $ 3,398 $ 490 $ 15,440 $ 6,1041998 $ 227,910 $ 173,608 $ 40,321 $ 12,472 $ 11,946 $ 2,820 $ 477 $ 16,161 $ 9,5951999 $ 238,953 $ 182,121 $ 40,544 $ 11,759 $ 12,684 $ 2,947 $ 480 $ 17,854 $ 12,8932000 $ 256,127 $ 190,831 $ 42,573 $ 11,181 $ 13,611 $ 2,352 $ 759 $ 18,141 $ 17,7632001 $ 279,149 $ 222,398 $ 42,976 $ 14,169 $ 14,672 $ 2,501 $ 1,297 $ 20,325 $ 20,2442002 $ 299,984 $ 236,579 $ 46,599 $ 30,152 $ 16,030 $ 2,108 $ 798 $ 23,452 $ 15,5872003 $ 319,919 $ 253,049 $ 50,273 $ 32,453 $ 17,725 $ 1,747 $ 496 $ 25,192 $ 13,7082004 $ 343,771 $ 277,411 $ 52,394 $ 25,595 $ 19,752 $ 2,009 $ 465 $ 27,770 $ 6,5102005 $ 367,080 $ 294,169 $ 55,918 $ 23,599 $ 21,783 $ 2,617 $ 673 $ 30,573 $ 6,2542006 $ 392,461 $ 336,621 $ 57,527 $ 24,128 $ 22,729 $ 2,850 $ 545 $ 30,739 $ 6,0292007 $ 419,321 $ 364,968 $ 60,011 $ 28,224 $ 24,216 $ 3,093 $ 787 $ 31,552 $ 10,306
Created by: Center for Economic Development, California State University, Chico
Components of Transfer Payments (Thousands)Government Payments to Individuals
Source: U.S. Department of Commerce, Bureau of Economic Analysis

54
2010-11 Economic & Demographic Profile
El Dorado County In El Dorado County, retirement and disability insurance benefit payments accounted for 44 percent of total transfer payments in 2007, compared to 32 percent in California. Medical payments made up the next larg-est portion with 39 percent of total transfer payments, and saw the highest increase (472 percent) between 1990 and 2007. A similar trend occurred throughout the state, with medical payments increasing 419 percent. Total government payments to individuals in El Dorado County accounted for 51 percent of all transfer pay-ments in 2007, compared to 64 percent in California.
Retirement and disability insurance benefit pay-ments include the Old Age, Survivors and Disability Insurance (OASDI), commonly known as Social Security, and a variety of other programs, such as fed-eral, state, and local government employee retirement benefits.
Medical payments include Medicare, Medicaid, and the Civilian Health and Medical Plan of the Uniformed Services program (CHAMPUS) payments.
Income maintenance benefit payments include SSI, TANF, CalWORKs, food stamps, and other income supplements.
Unemployment insurance benefit payments include state, federal, veteran, and other unemployment com-pensation.
Veteran benefit payments include veteran pensions, life insurance, educational assistance, and other pay-ments to veterans and their survivors.
Federal education and training assistance payments include payments to nonveterans in the form of fellow-ships, loan interest subsidies, educational grants, and Job Corps payments.
Other payments to individuals include Indian affairs payments, compensation to survivors of fallen public safety officers and victims of crime or disaster, com-pensation for Japanese internment, and other special payments to individuals.
Payments to nonprofit institutions consist of the pay-ments made by the federal government, state govern-ments, local governments, and businesses to nonprofit organizations that serve individuals. These payments exclude federal government payments for work under research and development contracts.
Business payments to individuals include any pay-ments to nonemployees and consist largely of personal injury liability payments to individuals.

55 www.cedcal.com
4. Income
Overview Per capita income is calculated by the Bureau of Economic Analysis using its total personal income and the Census Bureau’s population estimates. It is defined as total personal income divided by total population. It is one of the primary measures of economic well-being in a community. Changes in per capita income can indicate trends in a county’s standard of living, or the availabil-
ity of resources to an individual, family, or society. Per capita income tends to follow the business cycle, rising during expansions and falling during contractions.
It is important to evaluate per capita income growth against inflation. Growth in excess of the infla-tion rate indicates real per capita income growth. If growth is less than the rate of inflation then real per
capita income levels are falling.
It is also important to evaluate relative per capita income with cost of living differentials. This comparison is reflected in the inflation-adjusted figures seen here.
El Dorado County The nominal per capita income in El Dorado County in 2008 was $49,187 or 9.1 percent more than the previous year. When adjusted for inflation, the increase was 5.1 percent between 2007 and 2008. Inflation adjusted per capita income is expected to rise to $47,269 by 2030.
Year
Current-dollar per capita income
(thousands)1-year change
Inflation-adjusted per capita income
(thousands, 2004$)1-year change
1990 $ 20,257 n/a $ 29,277 n/a 1991 $ 21,059 4.0 % $ 29,208 - 0.2 %1992 $ 22,216 5.5 % $ 29,911 2.4 %1993 $ 22,646 1.9 % $ 29,604 - 1.0 %1994 $ 24,004 6.0 % $ 30,597 3.4 %1995 $ 25,411 5.9 % $ 31,497 2.9 %1996 $ 27,044 6.4 % $ 32,560 3.4 %1997 $ 28,830 6.6 % $ 33,932 4.2 %1998 $ 31,051 7.7 % $ 35,985 6.1 %1999 $ 33,394 7.5 % $ 37,864 5.2 %2000 $ 35,939 7.6 % $ 39,425 4.1 %2001 $ 35,916 - 0.1 % $ 38,309 - 2.8 %2002 $ 36,562 1.8 % $ 38,391 0.2 %2003 $ 37,607 2.9 % $ 38,608 0.6 %2004 $ 39,787 5.8 % $ 39,787 3.1 %2005 $ 42,154 5.9 % $ 40,773 2.5 %2006 $ 44,363 5.2 % $ 41,569 2.0 %2007 $ 45,079 1.6 % $ 41,069 - 1.2 %2008 $ 49,187 9.1 % $ 43,155 5.1 % 2020(p) n/a n/a $ 42,035 n/a 2030(p) n/a n/a $ 47,269 n/a
Per Capita Income
Source: California Department of Finance, Demographic Research Unit; Projections (p): Woods & Poole EconomicsCreated by: Center for Economic Development, California State University, Chico
4.4 Per Capita Income

56
2010-11 Economic & Demographic Profile
-1.0%
0.0%
1.0%
2.0%
3.0%
4.0%
5.0%
6.0%
1993 1995 1997 1999 2001 2003 2005 2007
C urrent-Dollar Per C apita Income AnnualPercent C hange (Three-Year Average)
California
El Dorado County
0
10,000
20,000
30,000
40,000
50,000
1990 1993 1996 1999 2002 2005 2008
Inflation-Adjusted Per C apita Income (Thousands, 2004$)

57 www.cedcal.com
4. Income
Overview Median household income is the income level at which half of the area’s households earn more and the other half earn less. It can be conceptualized as the income midpoint. It is measured every ten years and estimated annually by the U.S. Census Bureau.
Median household income is a better measure of average income than per capita income when evaluating income growth among all economic classes. Changes in per capita income may be driven by growth increases in the high income ranges only, whereas growth in median household income indicates expansion across the full range of incomes.
El Dorado County The total nominal median household income in El Dorado County in 2008 was $67,019 very compatible to the $61,017 average in California in the same year. El Dorado County’s median household income has been higher than the state average since 2000, indicating that its residents have more spending power than the aver-age Californian.
$0$10,000$20,000$30,000$40,000$50,000$60,000$70,000$80,000
2000 2001 2002 2003 2004 2005 2006 2007 2008
Median H ousehold Income, 2000-2008
El Dorado County
California
Year County California2000 $ 52,155 $ 46,8362001 $ 51,861 $ 47,0642002 $ 53,182 $ 47,3232003 $ 54,131 $ 48,4402004 $ 56,629 $ 49,8942005 $ 62,199 $ 53,6272006 $ 67,605 $ 56,6462007 $ 64,256 $ 59,9282008 $ 67,019 $ 61,017
Median Household Income (Nominal)
Source: U.S. Department of Commerce, Bureau of the CensusCreated by: Center for Economic Development, California State University, Chico
4.5 Median Household Income

58
2010-11 Economic & Demographic Profile
Overview Poverty is a situation where people do not earn enough income to achieve a basic standard of living con-sidered acceptable by society. Measurement of poverty is challenging in general because an assumption must be made about the standard of living society considers acceptable. The U.S. Census Bureau measures poverty as that level of income where a household is able to live in a community with an average cost of living and spend no more than 30 percent of their income on basic food items and 35 percent on basic housing. This measure is controversial because of disagreements over the assumed standard of living and the higher average cost of living in some areas, especially in California.
Poverty status is defined for each household; either everyone or no one in the household is in poverty. The characteristics of the household used to deter-mine poverty status are: number of people, number of related children under 18, and whether the primary householder is over age 65. If a family’s total income is less than the poverty threshold, then that family is con-sidered to be impoverished. The poverty thresholds do not change geographically, but they are updated annu-ally for inflation using Consumer Price Index (CPI-U). The official poverty definition includes money income before taxes and does not include capital gains or noncash benefits, such as public housing, Medi-Cal, or food stamps.
Poverty is not defined for peo-ple in military barracks, institutional group quarters (such as prisons or nursing homes), or for unrelated indi-viduals under the age of 15, such as foster children.
A high poverty rate in an area
can indicate social issues within the community. It may also indicate a scarcity of available employment. The poverty rate also affects such indicators as educational attainment and cost of living.
El Dorado County The average poverty rate in El Dorado County in 2008 was 7.8 percent, well below the statewide average of 13.3 percent. The poverty rate through-out California as a whole has remained relatively constant between 2000 and 2008, increasing less than 1 percent. El Dorado showed a decrease of 0.4 percent between 2007 to 2008. This is certainly a positive trend for the coun-ty, and indicates a healthy and growing economy.
Year County California2000 7.3 % 12.7 %2001 7.3 % 12.9 %2002 7.1 % 13.3 %2003 7.5 % 13.7 %2004 6.9 % 13.2 %2005 7.4 % 13.3 %2006 7.6 % 13.1 %2007 8.2 % 12.4 %2008 7.8 % 13.3 %
Poverty Rates
Source: U.S. Department of Commerce, Bureau of the CensusCreated by: Center for Economic Development, California State University, Chico
4.6 Poverty Rate
0.0%2.0%4.0%6.0%8.0%
10.0%12.0%14.0%16.0%
2000 2001 2002 2003 2004 2005 2006 2007 2008
Poverty Rates, 2000-2008 El Dorado CountyCalifornia

59 www.cedcal.com
4. Income
Overview The taxable sales indicator is the value of all transactions subject to sales and use tax in California. Collected and published by the California Board of Equalization, sales and use taxes are imposed on the sale and use of tangible personal property. Total taxable sales do not necessarily reflect the gross sales of retail busi-nesses because not all transactions are subject to sales and use tax, including nonprepared food items, prescrip-tion medicines, and services, whether or not the service is tied to the sale of a taxed product.
Taxable sales generate a substantial amount of income for local and state governments; however, rather than reflecting the revenue earned by a local govern-ment, taxable sales act as a gauge for consumer spending and local economic performance. Compared with total population, this is a helpful indicator for retail businesses to measure the potential for sales volume in a certain area. Changes in taxable sales are a measure of changes in both local government revenue and the economic health of the area. NOTE: There is a lag time of one year and one quarter in the availability of the following data.
El Dorado County In 2008, total taxable sales in El Dorado County were almost $1.8 billion, and retail sales made up 69 percent of that total. Retail sales made up 71 percent of total taxable sales in California in 2008. Between 1998 and 2008, the city of South Lake Tahoe saw a 32 percent increase in total sales, while the city of Placerville saw a 39 percent increase. As the follow-ing figures show, El Dorado County’s total taxable sales have matched similar statewide trends in the last decade.
Year Taxable retail sales Total taxable sales1997 $ 701,638 $ 1,011,2221998 $ 711,083 $ 1,041,6541999 $ 803,857 $ 1,193,6772000 $ 891,966 $ 1,324,4162001 $ 964,304 $ 1,422,0982002 $ 994,293 $ 1,451,3342003 $ 1,071,096 $ 1,539,0712004 $ 1,191,979 $ 1,697,8882005 $ 1,292,107 $ 1,851,2312006 $ 1,310,701 $ 1,898,8052007 $ 1,303,337 $ 1,896,9952008 $ 1,230,164 $ 1,787,804
Total Taxable Retail Sales and Total Taxable Sales (Thousands)
Source: California Board of EqualizationCreated by: Center for Economic Development, California State University, Chico
4.7 Business Taxable Sales
$ 0
$ 500,000
$ 1,000,000
$ 1,500,000
$ 2,000,000
1997 1999 2001 2003 2005 2007
Total Taxable Sales (Thousands) El Dorado County

60
2010-11 Economic & Demographic Profile
-4.0%
-2.0%
0.0%
2.0%
4.0%
6.0%
8.0%
10.0%
12.0%
2000 2002 2004 2006 2008
Total Taxable Sales Annual Percent C hange (Three-Year Average)
California El Dorado County
Year PlacervilleSouth Lake
Tahoe1997 $ 188,769 $ 254,1531998 $ 195,982 $ 257,5921999 $ 221,457 $ 282,0512000 $ 242,721 $ 307,8252001 $ 275,229 $ 306,8752002 $ 285,842 $ 301,6332003 $ 272,457 $ 305,2742004 $ 288,125 $ 330,2932005 $ 307,159 $ 357,9442006 $ 334,334 $ 357,0952007 $ 315,604 $ 354,5142008 $ 269,799 $ 339,826
Source: California Board of EqualizationCreated by: Center for Economic Development, California State University, Chico
Total Taxable Sales (Thousands)

61 www.cedcal.com
4. Income
$ 0
$ 200,000
$ 400,000
$ 600,000
$ 800,000
$ 1,000,000
$ 1,200,000
$ 1,400,000
1997 1999 2001 2003 2005 2007
Taxable Retail Sales (Thousands) El Dorado County
-4.0%-2.0%0.0%2.0%4.0%6.0%8.0%
10.0%12.0%14.0%16.0%
2000 2002 2004 2006 2008
Taxable Retail Sales Annual Percent C hange (Three-Year Average)
California El Dorado County

62
2010-11 Economic & Demographic Profile
Overview Earnings by industry is the total personal earnings from jobs in individual industries. It is not equivalent to the total revenue a business generates. The total earnings of an industry are calculated by taking the sum of three components: wage and salary disbursements, supple-ments to wages and salaries, and proprietor income.
Earnings by industry serves as a proxy and allows comparisons between industries or geographic areas because sales by industry are not reliably available at the county level.
Growth in earnings by industry can provide some insight into the relative competitiveness of an industry in a local economy, as well as which industries have the potential for expansion. For example, if the proportion of an industry’s earnings is higher than in the state, then there is likely a competitive advantage to that industry’s location in the county. Locations where an industry has a competitive advantage and/or has been growing rap-idly in the past may have greater potential for expansion in the near future.
NOTE: (D) Figure not shown to avoid disclosure of con-fidential information, but the estimates for this item are included in the totals.
El Dorado County The construction sector, and the government and public administration sector earned totals of $563 million and over $639 million, respectively, in the same year.
Within the services sector, professional, scientific, and technical services earned the highest reported total, with over $469 million in 2008. Health care and social assistance services followed with $412 million in earn-ings in the same year.
4.8 Earnings by Industry

63 www.cedcal.com
4. Income
Industry 2001 2002 2003 2004 2005 2006 2007 2008Farm $ 666 $ 707 $ 760 $ 831 $ 898 $ 913 $ 843 $ 1,000Forestry, fishing, related activities, and other
$ 23 $ 21 $ 21 $ 19 $ 19 $ 20 $ 21 $ 21
Mining $ 6 $ 5 $ 7 $ 9 $ 10 $ 11 $ 13 $ 10Utilities $ 10 $ 11 $ 12 $ 13 $ 12 $ 12 $ 13 $ 16Construction $ 400 $ 414 $ 456 $ 512 $ 568 $ 595 $ 569 $ 563Manufacturing $ 120 $ 105 $ 112 $ 115 $ 122 $ 134 $ 142 $ 137Wholesale trade $ 53 $ 61 $ 59 $ 65 $ 70 $ 79 $ 81 $ 90Retail trade $ 234 $ 238 $ 236 $ 245 $ 256 $ 265 $ 263 $ 294Transportation and warehousing $ 25 $ 32 $ 31 $ 36 $ 39 $ 41 $ 39 $ 34Information $ 31 $ 32 $ 34 $ 41 $ 41 $ 46 $ 53 $ 48Finance and insurance $ 103 $ 150 $ 178 $ 194 $ 208 $ 224 $ 242 $ 272Real estate and rental and leasing $ 102 $ 119 $ 137 $ 154 $ 172 $ 150 $ 137 $ 83Professional, scientific, and technical services
$ 403 $ 394 $ 392 $ 420 $ 465 $ 523 $ 491 $ 469
Management of companies and enterprises
$ 10 $ 10 $ 11 $ 11 $ 12 $ 12 $ 12 $ 6
Administrative and waste services $ 75 $ 96 $ 100 $ 140 $ 146 $ 161 $ 170 $ 189Educational services $ 9 $ 11 $ 9 $ 11 $ 13 $ 26 $ 29 $ 36Health care and social assistance $ 226 $ 257 $ 280 $ 309 $ 330 $ 344 $ 363 $ 412
Arts, entertainment, and recreation $ 55 $ 54 $ 49 $ 48 $ 50 $ 50 $ 50 $ 58
Accommodation and food services $ 86 $ 93 $ 105 $ 118 $ 127 $ 124 $ 131 $ 145Other services, except public administration
$ 91 $ 106 $ 116 $ 124 $ 133 $ 139 $ 143 $ 273
Government and government enterprises
$ 402 $ 436 $ 460 $ 485 $ 517 $ 557 $ 592 $ 639
*Value of withheld "(D)" employment $ 2,633 $ 2,642 $ 2,715 $ 2,867 $ 3,088 $ 3,373 $ 3,614 $ 4,030
Total Earnings $ 5,763 $ 5,994 $ 6,281 $ 6,766 $ 7,299 $ 7,798 $ 8,011 $ 8,823
Earnings by Industry (Millions)
Therefore, past data may not be comparable to that for 2001 and forward
*In 2001, the Standard Industrial Classification (SIC) System was converted to the North American Industrial Classification System (NAICS).
Source: U.S. Department of Commerce, Bureau of Economic Analysis
Created by: Center for Economic Development, California State University, Chico

64
2010-11 Economic & Demographic Profile

65 www.cedcal.com
5. Agriculture
In certain areas of Northern California, agricul-tural production constitutes a significant portion of the economic base. The relative importance of agricultural production in an area affects the volatility of the local economy and determines what businesses are success-ful. Areas particularly dependent on a few agricultural crops can experience considerable instability in their economic performance as commodity prices fluctuate. In addition, seasonal unemployment is more pervasive in economies with a large agricultural sector, raising the average annual unemployment rate.
All information for this section was collected from the California Agricultural Statistics Service. It should be noted that the California Agricultural Statistics Service compiles data from each county’s agricultural commis-sioner, who in turn collects data from farmers. In some cases, crops are classified under varying titles from year to year and deadlines are not always met for report-ing information; therefore, some discrepancies exist in historical data and no crop specific historical data was analyzed in this section..
In this section:
5.1 Harvested Acreage . . . . . . . . . . . . . . . . . . . . . . . . 66
5.2 Value of Agricultural Production . . . . . . . . . . . 68
5.3 Top Crops by Value . . . . . . . . . . . . . . . . . . . . . . . 69
5.4 Farm Revenue . . . . . . . . . . . . . . . . . . . . . . . . . . . . 70
5. Agriculture

66
2010-11 Economic & Demographic Profile
Overview Total harvested acreage is the amount of land that is harvested for agricultural products in a given year. This includes field crops, vegetable crops, seed crops, with pasture and rangeland included. Harvested acreage can fluctuate due to flooding, severe storms, fields that are left fallow for a season, government programs and regulations, pest control, and other factors. The county agricultural commissioner collects this data and reports it to the California Department of Food and Agriculture.
A decline in agricultural land availability may indicate urban expansion, a permanent removal of land from the production cycle. In some cases, crop types such as vines and orchards must grow for three to four years before being harvested, creating a cyclical pattern in harvested acreage. Therefore, evaluation of long-term patterns is more revealing than year-to-year compari-sons.
NOTE: Estimates of harvested acreage can fluctu-ate primarily due to fluctuations in range pasture acre-age. New county agricultural commissioners sometimes employ different methods for estimating range pasture than their predecessors. El Dorado County A total of 237,399 acres of land considered was har-vested acreage, including pasture in El Dorado County in 2008, which accounts for 21.7 percent of the land area in the county and 1 percent of the total harvested land in California. Pasture for rangeland made up 98.1 percent of harvested acreage in the county. See the following illustrations for more detail on the county’s harvested acreage by year, harvests of the most important crops, as well as rangeland.
Wine grapes were the dominant harvested crop in El Dorado County, with 1,901 acres harvested in
2008. This accounted for 0.2 percent of all wine grapes harvested in California. Bartlett pears comprised only eighty-four acres of harvested land in the county, yet accounted for 0.4 percent of the California total. Apples made up the next most abundant harvest, with 845 acres in 2008, or 3 percent of the state total.
5.1 Harvested Acreage
YearTotal Acres Harvested
Percent of Total Land Area
1990 255,577 23.3 %1991 250,970 22.9 %1992 250,775 22.9 %1993 250,536 22.9 %1994 250,376 22.9 %1995 250,354 22.9 %1996 249,744 22.8 %1997 249,733 22.8 %1998 249,777 22.8 %1999 249,539 22.8 %2000 249,404 22.8 %2001 249,341 22.8 %2002 249,533 22.8 %2003 249,716 22.8 %2004 249,674 22.8 %2005 290,452 26.5 %2006 290,495 26.5 %2007 237,226 21.7 %2008 237,399 21.7 %
Created by: Center for Economic Development, California State University, Chico
Source: California Agricultural Statistics Service, California Department of Finance
Total Harvested Acreage

67 www.cedcal.com
5. Agriculture
0
100,000
200,000
300,000
400,000
1990 1992 1994 1996 1998 2000 2002 2004 2006 2008
Total H arvested AcreageEl Dorado County
Crop 2008Percent of
TotalPasture Range 233,000 98.1 %Grapes Wine 1,901 0.8 %Pasture, Irrigated 927 0.4 %Apples, All 845 0.4 %Hay Other Unspecified 216 0.1 %Walnuts, English 145 0.1 %Peaches, Unspecified 105 0.0 %Pears, Bartlett 84 0.0 %Plums 52 0.0 %Cherries, Sweet 50 0.0 %
Created by: Center for Economic Development, California State University, Chico
Top Crops Harvested Acreage
Source: California Agricultural Statistics Service

68
2010-11 Economic & Demographic Profile
Overview This is the total value of agricul-tural products producedThis is the total value of agricultural products produced in the county. The products do not have to be sold to be counted in the value of production. The data on crop produc-tion and prices is estimated by the county agricultural commissioner and reported to the California Department of Food and Agriculture. Included are the ten most important crops in the area, classified in terms of gross production value.
Agricultural production affects many aspects of a county’s economy, including jobs, income, and the economic output of related industries. When agri-cultural production declines, so do pur-chases from some local businesses. Not all crops have the same impact on local employment and income. Increasing val-ues of agricultural production is generally associated with higher local income.
El Dorado County Total agricultural production totaled over $35 million in El Dorado County in 2008, a decrease of 34 percent from 2007. The decrease in total produc-tion had a lot to do with the 87% decrease in timber production since 1990. Decreasing timber production is a consistent trend across northern California.
YearAgricultural
ProductionTimber
ProductionTimber as a Percent of Total Production Total Production
1990 $ 16,814 $ 47,456 73.8 % $ 64,2701991 $ 18,819 $ 29,035 60.7 % $ 47,8541992 $ 19,902 $ 33,784 62.9 % $ 53,6861993 $ 19,467 $ 95,521 83.1 % $ 114,9881994 $ 18,869 $ 57,355 75.2 % $ 76,2241995 $ 14,872 $ 45,800 75.5 % $ 60,6721996 $ 21,567 $ 25,676 54.3 % $ 47,2431997 $ 23,193 $ 27,050 53.8 % $ 50,2431998 $ 18,724 $ 27,640 59.6 % $ 46,3641999 $ 19,677 $ 31,761 61.7 % $ 51,4382000 $ 24,166 $ 28,208 53.9 % $ 52,3742001 $ 25,544 $ 23,665 48.1 % $ 49,2092002 $ 26,544 $ 19,445 42.3 % $ 45,9892003 $ 22,698 $ 17,442 43.5 % $ 40,1402004 $ 25,874 $ 23,333 47.4 % $ 49,2072005 $ 26,100 $ 16,798 39.2 % $ 42,8982006 $ 29,340 $ 22,847 43.8 % $ 52,1872007 $ 34,643 $ 18,521 34.8 % $ 53,1642008 $ 29,359 $ 5,964 16.9 % $ 35,323
Agricultural and Timber Production (Thousands)
Source: California Agricultural Statistics Service, California Department of FinanceCreated by: Center for Economic Development, California State University, Chico
5.2 Value of Agricultural Production
$ 0
$ 20,000
$ 40,000
$ 60,000
$ 80,000
$ 100,000
$ 120,000
1990 1992 1994 1996 1998 2000 2002 2004 2006 2008
Value of Agricultural and Timber Production (Thousands)
Agricultural Production
Timber Production

69 www.cedcal.com
5. Agriculture
Overview This section includes the top ten agricultural products in the county in terms of gross production value. Gross production value is measured for the calen-dar year and includes what is sold on the market and the portion used on the farm. The information is collected by the County Agricultural Commissioner, who in turn reports the data to the California Department of Food and Agriculture.
High prices and stable prices are important for agricultural producers and the local economy dependent on agriculture. When prices are too low or fluctuate excessively, profitability cannot be guaranteed and local production may weaken.
El Dorado County Cattle and calves generated over $5.8 million in 2008, accounting for 19 percent of total agricultural pro-duction.
The production of apples, the most valuable crop in El Dorado County, generated over $5.8 million and made up 20 percent of the county’s total agricultural value in 2008. The next most valuable crop in the county were wine grapes, with a value of $5.2 million in 2008, or 18 percent of the county’s production value. Both wine grapes and apples are extremely important to the local economy of the county because their successful harvest contributes to the livelihood of the farming community.
Pasture for rangeland and cattle are also highly valuable in El Dorado County, as well as Christmas trees and nursery products. Please see the graphs for illustra-tions of El Dorado County’s agricultural production value.
5.3 Top Crops by Value
Crop ValueApples, All $ 5,845,500Cattle & Calves Unspecified $ 5,431,500Grapes Wine $ 5,229,100Pasture Range $ 2,796,000Christmas Trees & Cut Greens $ 2,520,300Nursery Products Misc. $ 1,560,000Pears, Asian $ 1,422,700Livestock Unspecified $ 1,254,800Pears, Bartlett $ 676,400Apiary Products Bees Unspecif $ 650,000
Top Crops by Value, 2008
Source: California Agricultural Statistics Service, California Department of FinanceCreated by: Center for Economic Development, California State University, Chico

70
2010-11 Economic & Demographic Profile
Overview Farm revenue is derived by the U.S. Department of Commerce from annual income tax returns delivered to the Internal Revenue Service. It is a tabulation of income from farms filing taxes in the county.
Farm revenue is what links agricultural production to economic impact in the county. The value of produc-tion may not include products sold, or income to local farmers. Production value also does not include govern-ment payments or other subsidies that would not be seen
in the county if county farms did not exist.
El Dorado County Although agricultal production was down signifi-cantly in 2008, total farm revenue exceeded $30 million for the first time in 2008. The average annual growth rate in farm revenue since 1990 is 6.6 percent. Most revenue comes from crop sales with a significant portion (about 24 percent) from miscellaneous income. Less than 1 percent of farm revenue comes from government payments.
5.4 Total Farm Revenue
Year
Cash Receipts from Livestock and Products
Cash Receipts from Crops
Government Payments
Miscellaneous Income
Total Revenue
1990 $ 3,207 $ 5,922 $ 0 $ 2,009 $ 11,1841991 $ 4,111 $ 6,023 $ 0 $ 2,137 $ 12,2971992 $ 3,511 $ 6,906 $ 68 $ 1,842 $ 12,3271993 $ 4,030 $ 6,803 $ 76 $ 1,962 $ 12,8711994 $ 3,254 $ 6,908 $ 69 $ 1,644 $ 11,8751995 $ 2,673 $ 5,837 $ 53 $ 1,507 $ 10,0701996 $ 2,691 $ 9,643 $ 0 $ 1,803 $ 14,1641997 $ 4,058 $ 11,016 $ 0 $ 1,818 $ 16,9121998 $ 2,624 $ 8,727 $ 57 $ 1,966 $ 13,3741999 $ 3,025 $ 8,823 $ 393 $ 2,282 $ 14,5232000 $ 3,446 $ 10,934 $ 562 $ 2,037 $ 16,9792001 $ 3,050 $ 11,978 $ 313 $ 2,468 $ 17,8092002 $ 2,637 $ 12,880 $ 136 $ 2,399 $ 18,0522003 $ 2,646 $ 10,722 $ 383 $ 4,635 $ 18,3862004 $ 3,070 $ 12,070 $ 146 $ 7,251 $ 22,5372005 $ 3,756 $ 10,108 $ 423 $ 8,206 $ 22,4932006 $ 3,820 $ 13,708 $ 92 $ 11,866 $ 29,4862007 $ 3,239 $ 17,066 $ 0 $ 9,573 $ 29,8782008 $ 3,119 $ 16,640 $ 302 $ 15,074 $ 35,135Source: U.S. Department of Commerce, Bureau of Economic Analysis
Total Farm Revenue (Thousands)
Created by: Center for Economic Development, California State University, Chico

71 www.cedcal.com
6. Housing & Real Estate
In this section, we explore issues regarding housing and real estate. This includes how economic activity affects housing and real estate markets and how housing and real estate affect the local econo-my.
Generally, housing stock keeps pace with popu-lation, although in an economy that is intricately linked with those of surrounding counties, growth in housing stock can drive growth in population, rather than population changes the housing stock. Therefore, housing built locally often satisfies a regional demand. However, it is important for a community to allow the construction of housing to meet local demand as well. Not meeting this need can result in rapid increases in home prices. That said, home price increases, and most recently, price declines, are attributable to the housing bubble and its subsequent burst. Currently, home prices are more affordable than they have been in at least a decade.
Non-residential construction and real estate followed a similar, but lagging path. Commercial building was not originally affected by the housing bubble burst, although a lack of residential construc-tion eventually resulted in a severe reduction in commercial construction because the local retail and service market failed to grow as quickly as in the past. Vacancy rates for retail have more than doubled the past few years, while vacancy for office and industrial space has increased significantly as well.
In this section:
6.1 Total Housing Units . . . . . . . . . . . . . . . . . . . . . . . . 72
6.2 New Housing Units Authorized by
Building Permits . . . . . . . . . . . . . . . . . . . . . . . . . . . 77
6.3 Value of New Construction . . . . . . . . . . . . . . . . . 83
6.4 Fair Market Rent . . . . . . . . . . . . . . . . . . . . . . . . . . . 89
6. Housing & Real Estate

72
2010-11 Economic & Demographic Profile
Overview Total housing units is the number of single- and multiple-family dwellings, mobile homes, and other dwelling units located within a given jurisdiction. A housing unit may be the permanent residence for a family, a seasonal or second home, or it can be vacant. Occupancy may be by a single family, one per-son living alone, two or more families living together, or any other group of related or unre-lated persons who share living arrangements. The number of housing units is estimated annu-ally by the California Department of Finance and the department uses this data to estimate population change (section one).
Growth in the number of housing units typically keeps pace with population growth. A disparity between housing and population growth indicates something about a community. Housing growth without population growth may indicate an increase in the number of second homes in the community. Population growth without hous-ing growth may result in a housing shortage and an increase in home prices, affecting housing affordability and the overall cost of living.
NOTE: The California Department of Finance uses the decennial census as a base for esti-mating total housing units. The esti-mates are produced by adding new construction with annexations and subtracting demolitions from the census benchmark.
El Dorado County The total number of housing
units in El Dorado County increased at an average annual rate of 1.7 percent between 2000 and 2010, compared to 1 percent in California. Single-family units have increased the most in the county, with a 20 percent increase since 2000. In 2010, about 82 percent of single-family units and 82 percent of mobile homes are outside
YearSingle-family
unitsMultiple-family
unitsMobile Homes
Total Housing Units
Annual percent change
2000 58,692 8,213 4,373 71,278 n/a2001 59,488 8,367 4,373 72,228 1.3 %2002 60,974 8,444 4,373 73,791 2.2 %2003 62,510 8,452 4,374 75,336 2.1 %2004 64,227 8,580 4,374 77,181 2.4 %2005 66,078 8,996 4,374 79,448 2.9 %2006 67,699 9,404 4,375 81,478 2.6 %2007 68,876 9,442 4,377 82,695 1.5 %2008 69,429 9,469 4,377 83,275 0.7 %2009 69,965 9,552 4,354 83,871 0.7 %2010 70,395 9,685 4,369 84,449 0.7 %Source: California Department of Finance, Demographic Research UnitCreated by: Center for Economic Development, California State University, Chico
County Total Housing Units
6.1 Total Housing Units
60,000
65,000
70,000
75,000
80,000
85,000
90,000
2000 2001 2002 2003 2004 2005 2006 2007 2008 2009 2010
Total H ousing Units El Dorado County

73 www.cedcal.com
6. Housing & Real Estate
city limits, while the majority of multiple-fam-ily units are within the county’s incorporated areas.
The city of South Lake Tahoe had 14,450 total housing units in 2010, the largest amount in the county, and yet the city has only had an annual average increase of 0.3 percent over the last ten years. Placerville has had an average annual increase in total housing units of 1 per-cent over the last decade. 0.0 %
0.5 %
1.0 %
1.5 %
2.0 %
2.5 %
3.0 %
2003 2004 2005 2006 2007 2008 2009 2010
C ounty Total H ousing Units Annual Percent C hange (Three-Year Moving Average)
El Dorado CountyCalifornia
According to the California Construction Industry Research Board, single-family units include the fol-lowing:
-Disconnected or detached units that stand apart from other units
-Semi-detached units that are attached to another unit on one side only
-Row houses and townhouses that are sepa-rated unit by unit by an unbroken ground-to-roof partition or firewall
-Condominiums are considered single-family units if they include the following:
-A zero-lot-line or zero-property-line con-struction (these terms can be used inter-changeably referring to a lot that has no side yard but extends to the property line)
-A dividing line that separates two or more lots for the purpose of maintenance, repair, improvements, and reconstruction of the original dwelling
-Each unit is separated by an air space
-The units are separated by an unbroken ground-to-roof partition or firewall
Multi-family units include the following:
-Duplexes Three- to four-unit structures
-Apartment structures (with five or more units)
-Condominiums that do not meet the single-family definitions

74
2010-11 Economic & Demographic Profile
YearSingle-family
unitsMultiple-family
unitsMobile Homes
Total Housing Units
Annual percent change
2000 9,120 4,217 668 14,005 n/a2001 9,159 4,219 668 14,046 0.3 %2002 9,188 4,217 668 14,073 0.2 %2003 9,227 4,221 668 14,116 0.3 %2004 9,268 4,209 668 14,145 0.2 %2005 9,331 4,221 668 14,220 0.5 %2006 9,346 4,245 668 14,259 0.3 %2007 9,384 4,259 668 14,311 0.4 %2008 9,424 4,263 668 14,355 0.3 %2009 9,448 4,289 645 14,382 0.2 %2010 9,512 4,293 645 14,450 0.5 %Source: California Department of Finance, Demographic Research UnitCreated by: Center for Economic Development, California State University, Chico
South Lake Tahoe Total Housing Units
YearSingle-family
unitsMultiple-family
unitsMobile Homes
Total Housing Units
Annual percent change
2000 2,896 1,187 159 4,242 n/a2001 2,920 1,265 159 4,344 2.4 %2002 2,979 1,346 159 4,484 3.2 %2003 3,000 1,348 160 4,508 0.5 %2004 3,019 1,350 160 4,529 0.5 %2005 3,044 1,356 160 4,560 0.7 %2006 3,065 1,356 161 4,582 0.5 %2007 3,088 1,356 163 4,607 0.5 %2008 3,121 1,348 163 4,632 0.5 %2009 3,145 1,348 163 4,656 0.5 %2010 3,156 1,348 163 4,667 0.2 %Source: California Department of Finance, Demographic Research UnitCreated by: Center for Economic Development, California State University, Chico
Placerville Total Housing Units

75 www.cedcal.com
6. Housing & Real Estate
4,000
4,100
4,200
4,300
4,400
4,500
4,600
4,700
2000 2002 2004 2006 2008 2010
C ity Total H ousing Units Placerville
0.0 %
0.5 %
1.0 %
1.5 %
2.0 %
2.5 %
3.0 %
2003 2005 2007 2009
City T otal H ousing Units A nnual Percent Change (T hree-Year Moving A verage)
El Dorado County
Placerville

76
2010-11 Economic & Demographic Profile
13,700
13,800
13,900
14,000
14,100
14,200
14,300
14,400
14,500
2000 2002 2004 2006 2008 2010
C ity Total H ousing Units South Lake Tahoe
0.0 %
0.5 %
1.0 %
1.5 %
2.0 %
2.5 %
3.0 %
2003 2005 2007 2009
City T otal H ousing Units A nnual Percent Change (T hree-Year Moving A verage)
El Dorado County
South Lake Tahoe

77 www.cedcal.com
6. Housing & Real Estate
Overview A building permit is required for all new con-struction. A permit may allow one or more homes in a subdivision. The number of housing units authorized by building permits is the primary factor used to calculate the changes in total housing units. The data is collected by every city and county, then reported to and dissemi-nated by the California Construction Industry Research
Board. The number of building permits typically indicates building activity in the near future, either during the year the permit was issued or the next. An increase in the number of building permits issued indicates expansion in construction sector activity. That expansion may be a response to any number of factors including falling
mortgage interest rates, economic growth, or the expectation of rising housing prices due to hous-ing shortages or speculative activity.
El Dorado County An average of 1,432 new housing units have been authorized by building permits each year in El Dorado County between 1999 and 2009. During that same time, there was an average annual decrease of over 20 percent in new hous-ing permits and a 2 percent increase in popula-tion. In comparison, California saw a 13 percent annual average decrease in housing permits, and a 1.4 percent average annual increase in population during the same time.
Between 1999 and 2009, there have been an average twenty-nine new single-family and six-teen multiple-family unit building permits each year in Placerville. In South Lake Tahoe, there were an average fourty-seven single-family and thirteen multiple-family unit permits during the same period of time. The combination of permits in these two cities accounted for 17 percent of the county total in 2009. This means that most of the construction of new housing units took place in unincorporated areas in El Dorado County that year, while 100 percent of new multiple-family units are in the City of Placerville.
YearNew single-family units
New multiple-family units
Total new housing units
Annual percent change
1990 1,837 115 1,952 n/a1991 1,478 238 1,716 - 12.1 %1992 1,046 24 1,070 - 37.6 %1993 783 25 808 - 24.5 %1994 967 57 1,024 26.7 %1995 874 6 880 - 14.1 %1996 1,106 380 1,486 68.9 %1997 1,079 0 1,079 - 27.4 %1998 977 195 1,172 8.6 %1999 1,212 223 1,435 22.4 %2000 1,475 87 1,562 8.9 %2001 1,470 704 2,174 39.2 %2002 1,741 206 1,947 - 10.4 %2003 1,911 28 1,939 - 0.4 %2004 2,055 141 2,196 13.3 %2005 1,566 165 1,731 - 21.2 %2006 1,137 52 1,189 - 31.3 %2007 714 180 894 - 24.8 %2008 379 142 521 - 41.7 %2009 160 2 162 - 68.9 %
New Housing Units Authorized by Building Permits, County
Source: California Construction Industry Research BoardCreated by: Center for Economic Development, California State University, Chico
6.2 New Housing Units Authorized by Building

78
2010-11 Economic & Demographic Profile
0
500
1,000
1,500
2,000
2,500
1990 1992 1994 1996 1998 2000 2002 2004 2006 2008
C ounty C omponents of New H ousing Units
New single-family units
New multiple-family units
-60.0%
-40.0%
-20.0%
0.0%
20.0%
40.0%
1993 1995 1997 1999 2001 2003 2005 2007
C ounty New H ousing Units Annual Percent C hange (Three-Year Moving Average)
El Dorado County
California
0
500
1,000
1,500
2,000
2,500
1990 1992 1994 1996 1998 2000 2002 2004 2006 2008
C ounty New H ousing Units

79 www.cedcal.com
6. Housing & Real Estate
YearNew single-family units
New multiple-family units
Total new housing units
Annual percent change
1990 75 4 79 n/a1991 39 0 39 - 50.6 %1992 39 0 39 0.0 %1993 19 0 19 - 51.3 %1994 26 2 28 47.4 %1995 20 0 20 - 28.6 %1996 53 76 129 545.0 %1997 31 0 31 - 76.0 %1998 29 2 31 0.0 %1999 30 81 111 258.1 %2000 56 81 137 23.4 %2001 38 0 38 - 72.3 %2002 21 4 25 - 34.2 %2003 25 6 31 24.0 %2004 30 0 30 - 3.2 %2005 19 0 19 - 36.7 %2006 21 2 23 21.1 %2007 70 0 70 204.3 %2008 8 0 8 - 88.6 %2009 3 2 5 - 37.5 %
Placerville New Housing Units Authorized by Building Permits
Source: California Construction Industry Research BoardCreated by: Center for Economic Development, California State University, Chico

80
2010-11 Economic & Demographic Profile
0
50
100
150
1990 1992 1994 1996 1998 2000 2002 2004 2006 2008
C ity New H ousing Units Placerville
-100.0%
-50.0%
0.0%
50.0%
100.0%
1994 1996 1998 2000 2002 2004 2006 2008
C iy New H ousing Units Annual Percent C hange (Three-Year MovingAverage)
El Dorado County
Placerville
0
20
40
60
80
100
1990 1993 1996 1999 2002 2005 2008
C ity C omponents of New H ousing Units
Placerville New single-family units
Placerville New multiple-family units

81 www.cedcal.com
6. Housing & Real Estate
YearNew single-family units
New multiple-family units
Total new housing units
Annual percent change
1990 67 7 74 n/a1991 56 8 64 - 13.5 %1992 37 20 57 - 10.9 %1993 38 19 57 0.0 %1994 34 32 66 15.8 %1995 36 6 42 - 36.4 %1996 30 2 32 - 23.8 %1997 31 0 31 - 3.1 %1998 55 45 100 222.6 %1999 40 2 42 - 58.0 %2000 47 2 49 16.7 %2001 37 2 39 - 20.4 %2002 50 16 66 69.2 %2003 52 12 64 - 3.0 %2004 68 41 109 70.3 %2005 54 37 91 - 16.5 %2006 72 24 96 5.5 %2007 52 0 52 - 45.8 %2008 27 2 29 - 44.2 %2009 23 0 23 - 20.7 %
South Lake Tahoe New Housing Units Authorized by Building Permits
Source: California Construction Industry Research BoardCreated by: Center for Economic Development, California State University, Chico

82
2010-11 Economic & Demographic Profile
0
50
100
150
1990 1992 1994 1996 1998 2000 2002 2004 2006 2008
C ity New H ousing Units South Lake Tahoe
-60.0%-40.0%-20.0%
0.0%20.0%40.0%60.0%
1994 1996 1998 2000 2002 2004 2006 2008
C iy New H ousing Units Annual Percent C hange (Three-Year MovingAverage)
El Dorado County
South Lake Tahoe
0
20
40
60
80
1990 1993 1996 1999 2002 2005 2008
C ity C omponents of New H ousing Units
South Lake Tahoe New single-family units
South Lake Tahoe New multiple-family units

83 www.cedcal.com
6. Housing & Real Estate
Overview Building permits are required for all new construc-tion, not just housing units as shown in the previous sec-tion. Permits are required not only for new commercial and industrial construction, but also for the demolition, remodeling, expansion, additions, and repairs made to existing residential, commercial, and industrial struc-tures.
The value of new construction in this section is
the total value reported in building permits. This often understates the true value of construction because many development impact fees are based on the value of permitted construction, giving builders an incentive to underestimate the cost of the completed structure. The valuation estimate is based on costs that include labor, materials, and architectural and engineering expertise.
Residential units are single-family and multi-fam-ily units, and typically account for about half of all per-
mitted construction valuation.
Major components of nonresi-dential construction includecommercial offices, commercial stores, other commercial, industrial buildings, and other construction
This section excludes public buildings when a building permit is not necessary for construction. This usually includes public schools and local government buildings.
The value of construction activ-ity, especially of commercial and industrial buildings, is one of the primary indicators of economic expansion. It indicates economic investment in the community for which the investor is expecting a return. Because the building may not be complete and operational until the next year, building activity is often a leading indicator of near-term economic growth.
$0$100,000$200,000$300,000$400,000$500,000$600,000$700,000$800,000
1990 1992 1994 1996 1998 2000 2002 2004 2006 2008
C ounty Value of New C onstruction (Thousands) El Dorado County
-50.0%-40.0%-30.0%-20.0%-10.0%
0.0%10.0%20.0%30.0%40.0%
1993 1995 1997 1999 2001 2003 2005 2007 2009
C ounty Value of New C onstruction Annual Percent C hange (Three-Year Moving Average)
California
El Dorado County
6.3 Value of New Construction (Building Permit Valuation in Dollars)

84
2010-11 Economic & Demographic Profile
El Dorado County The value of new construction decreased 10 percent on average each year between 1999 and 2009 in El Dorado County. California saw an average annual decrease of 6 percent the same time period. In 2009, single-family units made up 39 percent of all new construction value in the county, while multiple-family units made up less than 1 percent. Total commercial and industrial construction accounted for 9 percent of the total value in the county in the same year. The city of South Lake Tahoe had the high-
est new single-family unit valuation at $6 million, followed by the city of Placerville at over $726 thousand.
Year
Single-family units
Multiple-family units
Residential alterations
Comml. offices
Comml. stores
O ther Comml. Industrial
O ther construction
Non-residential alterations
Total valuation
1990 $230,573 $5,978 $19,524 $3,667 $6,369 $34,000 $426 $12,568 $7,187 $320,291 1991 $185,284 $12,797 $23,934 $ 0 $9,885 $675 $122 $10,986 $5,623 $249,306 1992 $129,089 $2,037 $20,349 $ 0 $4,557 $1,827 $182 $11,734 $6,496 $176,271 1993 $103,794 $2,497 $17,884 $478 $4,313 $ 0 $ 0 $9,723 $9,322 $148,012 1994 $127,179 $3,877 $16,830 $371 $11,422 $ 0 $ 0 $10,984 $10,164 $180,826 1995 $121,798 $535 $16,088 $580 $6,080 $ 0 $490 $10,742 $12,488 $168,800 1996 $167,748 $22,751 $18,426 $4,360 $4,984 $13,194 $444 $15,074 $10,777 $257,756 1997 $173,320 $ 0 $21,973 $5,525 $3,499 $7,856 $5,771 $18,010 $6,564 $242,517 1998 $190,783 $12,178 $23,537 $901 $5,958 $3,270 $3,283 $17,902 $12,834 $270,645 1999 $263,487 $17,013 $25,356 $11,909 $7,316 $908 $1,287 $19,774 $10,182 $357,233 2000 $347,610 $6,513 $24,350 $18,531 $14,544 $3,563 $464 $18,324 $11,109 $445,007 2001 $350,215 $56,506 $24,300 $3,905 $9,564 $61,941 $ 0 $27,014 $30,534 $563,978 2002 $437,738 $16,483 $25,826 $5,930 $23,541 $272 $ 0 $27,052 $13,491 $550,333 2003 $507,969 $3,524 $33,497 $886 $21,500 $322 $1,098 $29,295 $15,528 $613,619 2004 $558,216 $13,381 $33,014 $1,456 $20,554 $14,409 $ 0 $37,808 $19,252 $698,091 2005 $428,836 $13,418 $41,595 $2,777 $18,633 $20,622 $2,223 $38,370 $17,657 $584,132 2006 $368,126 $6,190 $40,044 $2,337 $23,609 $6,211 $ 0 $37,911 $26,380 $510,808 2007 $246,294 $24,850 $43,467 $ 0 $23,330 $17,099 $902 $39,225 $30,920 $426,087 2008 $122,588 $15,519 $41,035 $1,961 $19,252 $288 $ 0 $28,666 $13,261 $242,570 2009 $50,041 $358 $26,611 $2,078 $4,020 $4,799 $ 0 $24,827 $15,377 $128,112
Created by: Center for Economic Development, California State University, Chico
County Value of New Construction (Thousands)
Source: California Construction Industry Research Board

85 www.cedcal.com
6. Housing & Real Estate
Year
Single-family units
Multiple-family units
Residential alterations
Comml. offices
Comml. stores
O ther Comml. Industrial
O ther construction
Non-residential alterations
Total valuation
1990 $9,293 $189 $993 $2,311 $461 $ 0 $ 0 $531 $1,824 $15,6011991 $4,452 $ 0 $1,861 $ 0 $ 0 $550 $ 0 $387 $2,844 $10,0931992 $4,975 $ 0 $812 $ 0 $ 0 $ 0 $ 0 $40 $644 $6,4721993 $2,824 $ 0 $531 $94 $ 0 $ 0 $ 0 $734 $2,163 $6,3471994 $3,424 $275 $794 $ 0 $ 0 $ 0 $ 0 $36 $150 $4,6791995 $3,245 $ 0 $385 $ 0 $ 0 $ 0 $ 0 $81 $336 $4,0471996 $6,468 $5,417 $555 $ 0 $238 $ 0 $ 0 $3,598 $1,925 $18,2011997 $3,599 $ 0 $537 $ 0 $265 $ 0 $ 0 $1,138 $332 $5,8711998 $3,809 $180 $260 $159 $1,548 $ 0 $ 0 $2,259 $92 $8,3081999 $4,780 $6,893 $570 $ 0 $ 0 $ 0 $ 0 $829 $342 $13,4142000 $9,133 $5,860 $829 $ 0 $667 $ 0 $ 0 $1,385 $140 $18,0142001 $6,979 $ 0 $583 $ 0 $3,665 $ 0 $ 0 $1,337 $516 $13,0802002 $4,306 $491 $1,025 $ 0 $ 0 $ 0 $ 0 $2,359 $1,322 $9,5022003 $5,651 $761 $815 $ 0 $200 $ 0 $ 0 $459 $234 $8,1192004 $6,945 $ 0 $1,007 $1,068 $5,774 $ 0 $ 0 $1,986 $1,078 $17,8572005 $4,812 $ 0 $1,302 $ 0 $ 0 $ 0 $ 0 $3,244 $1,251 $10,6092006 $4,588 $273 $855 $ 0 $329 $ 0 $ 0 $3,377 $387 $9,8112007 $11,100 $ 0 $1,290 $ 0 $2,046 $ 0 $ 0 $7,649 $2,196 $24,2822008 $1,502 $ 0 $1,255 $ 0 $155 $ 0 $ 0 $2,068 $711 $5,6912009 $726 $358 $1,815 $ 0 $ 0 $4,799 $ 0 $2,293 $1,766 $11,757
Created by: Center for Economic Development, California State University, Chico
Placerville Value of New Construction (Thousands)
Source: California Construction Industry Research Board

86
2010-11 Economic & Demographic Profile
$0
$5,000
$10,000
$15,000
$20,000
$25,000
$30,000
1990 1993 1996 1999 2002 2005 2008
C ity Value of New C onstruction (Thousands) Placerville
-100.0%
-50.0%
0.0%
50.0%
100.0%
150.0%
1993 1995 1997 1999 2001 2003 2005 2007 2009
Value of New C onstruction Annual Percent C hange (Three-Year Moving Average)
El Dorado County
Placerville

87 www.cedcal.com
6. Housing & Real Estate
Year
Single-family units
Multiple-family units
Residential alterations
Comml. offices
Comml. stores
O ther Comml. Industrial
O ther construction
Non-residential alterations
Total valuation
1990 $10,692 $605 $3,045 $318 $ 0 $34,000 $ 0 $122 $1,263 $50,0441991 $8,420 $738 $3,374 $ 0 $314 $125 $ 0 $35 $1,175 $14,1801992 $6,131 $1,674 $2,898 $ 0 $192 $1,827 $ 0 $288 $2,444 $15,4541993 $5,837 $2,106 $5,350 $384 $74 $ 0 $ 0 $174 $3,005 $16,9301994 $4,913 $2,033 $3,787 $371 $ 0 $ 0 $ 0 $2,295 $3,920 $17,3181995 $4,896 $535 $4,076 $491 $557 $ 0 $ 0 $846 $2,409 $13,8091996 $4,780 $195 $4,446 $156 $1,432 $13,090 $ 0 $1,962 $3,210 $29,2721997 $3,592 $ 0 $5,059 $ 0 $760 $7,255 $ 0 $196 $2,222 $19,0841998 $8,740 $2,729 $4,837 $ 0 $ 0 $2,007 $ 0 $197 $4,406 $22,9161999 $5,714 $274 $5,451 $454 $ 0 $ 0 $ 0 $2,572 $2,127 $16,5912000 $7,188 $212 $5,769 $935 $6,107 $ 0 $ 0 $399 $3,165 $23,7742001 $8,103 $259 $4,120 $ 0 $111 $61,941 $ 0 $13 $9,583 $84,1302002 $10,784 $2,228 $3,950 $927 $2,598 $ 0 $ 0 $103 $2,333 $22,9242003 $11,198 $1,494 $5,910 $ 0 $5,215 $ 0 $ 0 $286 $5,519 $29,6222004 $15,588 $6,955 $6,284 $ 0 $247 $ 0 $ 0 $243 $7,173 $36,4902005 $13,964 $3,888 $4,933 $ 0 $3,464 $20,202 $ 0 $284 $3,770 $50,5042006 $17,974 $2,459 $4,244 $ 0 $173 $4,079 $ 0 $466 $5,666 $35,0612007 $12,729 $ 0 $4,263 $ 0 $1,250 $17,099 $ 0 $480 $5,684 $41,5062008 $6,050 $262 $4,091 $ 0 $3,363 $ 0 $ 0 $932 $2,039 $16,7372009 $5,966 $ 0 $5,727 $ 0 $ 0 $ 0 $ 0 $661 $4,730 $17,085
Created by: Center for Economic Development, California State University, Chico
South Lake Tahoe Value of New Construction (Thousands)
Source: California Construction Industry Research Board

88
2010-11 Economic & Demographic Profile
$0$10,000$20,000$30,000$40,000$50,000$60,000$70,000$80,000$90,000
1990 1993 1996 1999 2002 2005 2008
C ity Value of New C onstruction (Thousands) South Lake Tahoe
-100.0%
-50.0%
0.0%
50.0%
100.0%
150.0%
1993 1995 1997 1999 2001 2003 2005 2007 2009
Value of New C onstruction Annual Percent C hange (Three-Year Moving Average)
El Dorado County
South Lake Tahoe

89 www.cedcal.com
6. Housing & Real Estate
Overview Fair market rent acts as a proxy for monthly rent values. It is calculated by the U.S. Department of Housing and Urban Development using surveys of pri-vately-owned dwellings with standard sanitary facilities. Fair market rent is set at the fortieth percentile, which means that 40 percent of the units in a given area pay less than the fair market rent and 60 percent pay more. It is calculated for various numbers of bedrooms in the house or apartment. Fair market rental values are gross rent estimates and they include shelter, rent, and the cost of utilities, except telephone.
Most wealthy households can afford a home. Fair market rent is an indicator of housing costs for poorer households in a county and is used to determine whether families or individuals qualify for rent and utility assis-tance. Fair market rent figures are descriptive of the local rental housing market in the region and are useful for individuals or businesses contemplating a move to the area.
Fair market rent also allows community leaders to evaluate the adequacy of the supply of rental housing in the community by calculating how much a household must earn to afford a certain type of unit. A rental unit is defined as affordable if rent plus utilities is not more than 30 percent of income.
El Dorado County From 2009 to 2010, El Dorado County rent prices consistently increased between 1.6 percent and 1.7 per-cent regardless of the number of bedrooms. Between 2000 and 2010, county rent prices increased on average approximatley 54 percent.
Year 0-Bedroom 1-Bedroom 2-Bedroom 3-Bedroom 4-Bedroom 5-Bedroom 6-Bedroom2000 $ 447 $ 504 $ 631 $ 875 $ 1,031 $ 1,186 $ 1,3632001 $ 486 $ 547 $ 685 $ 950 $ 1,120 $ 1,288 $ 1,4812002 $ 503 $ 566 $ 709 $ 983 $ 1,159 $ 1,333 $ 1,5332003 $ 651 $ 733 $ 918 $ 1,273 $ 1,501 $ 1,726 $ 1,9852004 $ 674 $ 759 $ 950 $ 1,318 $ 1,554 $ 1,787 $ 2,0552005 $ 707 $ 812 $ 971 $ 1,403 $ 1,639 $ 1,885 $ 2,1682006 $ 959 $ 691 $ 786 $ 1,384 $ 1,586 $ 1,824 $ 2,0972007 $ 715 $ 813 $ 992 $ 1,431 $ 1,641 $ 1,887 $ 2,1702008 $ 708 $ 805 $ 982 $ 1,417 $ 1,624 $ 1,868 $ 2,1482009 $ 737 $ 838 $ 1,022 $ 1,475 $ 1,690 $ 1,944 $ 2,2352010 $ 749 $ 852 $ 1,039 $ 1,499 $ 1,719 $ 1,977 $ 2,273
Fair Market Rent
Source: U.S. Department of Housing and Urban DevelopmentCreated by: Center for Economic Development, California State University, Chico
6.4 Fair Market Rent

90
2010-11 Economic & Demographic Profile

91 www.cedcal.com
7. Travel & Tourism
People travel away from home for many rea-sons, including business, pleasure, and other per-sonal reasons. A traveler is considered to be anyone who spends time in a community other than the one in which they reside, whether it is a day trip or an overnight stay. Many areas of Northern California rely on visitor spending as a significant part of the economy. This section presents data on travel to El Dorado County including data resulting from tour-ism and daily commutes. Estimates of the economic impacts of tourism travel are also presented in this section, including sales, income, and employment.
Tourism in El Dorado County is important due to a number of attractions in the area, including wilderness areas, camping, hiking, and fishing opportunities.
In this section:
7.1 Travel Expenditures . . . . . . . . . . . . . . . . . . . . . . . . 92
7.2 Travel-Generated Employment . . . . . . . . . . . . . . 94
7.3 Total Annual Tourism Earnings . . . . . . . . . . . . . 96
7.4 Tax Revenues Generated by Travel
Expenditures . . . . . . . . . . . . . . . . . . . . . . . . . . . . . . 98
7.5 Selected Highway Traffic Volume . . . . . . . . . . 100
7.6 Travel Time to Work . . . . . . . . . . . . . . . . . . . . . . 101
7.7 Means of Transporation to Work . . . . . . . . . . . 103
7.8 Vehicle Registration . . . . . . . . . . . . . . . . . . . . . . . 105
7. Travel & Tourism

92
2010-11 Economic & Demographic Profile
Overview Every year, the California Travel and Tourism Commission hires Dean Runyan Associates on con-tract to estimate the impacts of travel spending by county in California. Dean Runyan specializes in economic and market research related to travel, tour-ism, and recreation. They are on contract with ten U.S. states to produce travel spending estimates.
Travel and tourism spending includes all pur-chases made by a traveler at the point of sale while visiting a county. Travelers include those making day trips, staying overnight, and people just passing through (buying gasoline, etc.). The travel can be for any reason, including but not limited to recreation, business, personal, and family visits.
Travel expenditures is the base indicator for evaluating the impacts of travel and tourism in El Dorado County. It is an estimate from which the fol-lowing three important indicators are calculated.
El Dorado County Over the past few decades, the travel and tour-ism industry has been responsible for a steady rise in the amount of money spent in California. Total travel expenditures in California in 2008 reached $97.5 bil-lion, a 3 percent increase from the previous year. Travel expenditures in El Dorado County decreased by 1 per-cent in the same year, to $604.3 million. Between 1992 and 2008, El Dorado County was respon-sible for an annual average of 0.7 percent of all travel expenditures in California.
YearExpenditures
in County
Annual percent change
Expenditure in California
Annual percent change
1992 $ 425.0 n/a $ 50,700 n/a 1993 $ 438.1 3.1 % $ 51,600 1.8 % 1994 $ 449.8 2.7 % $ 52,600 1.9 % 1995 $ 455.7 1.3 % $ 54,200 3.0 % 1996 $ 462.1 1.4 % $ 58,900 8.7 % 1997 $ 484.4 4.8 % $ 64,100 8.8 % 1998 $ 502.1 3.7 % $ 66,500 3.7 % 1999 $ 528.1 5.2 % $ 70,900 6.6 % 2000 $ 541.2 2.5 % $ 76,500 7.9 % 2001 $ 542.5 0.2 % $ 73,300 - 4.2 % 2002 $ 552.2 1.8 % $ 72,700 - 0.8 % 2003 $ 595.3 7.8 % $ 75,600 4.0 % 2004 $ 611.9 2.8 % $ 80,700 6.7 % 2005 $ 629.4 2.9 % $ 87,000 7.8 % 2006 $ 631.0 0.3 % $ 91,800 5.5 % 2007 $ 608.5 - 3.6 % $ 95,100 3.6 % 2008 $ 604.3 - 0.7 % $ 97,500 2.5 %
Total Annual Travel Expenditures by County and State (Millions)
Created by: Center for Economic Development, California State University, Chico
Source: California Travel and Tourism Commission, Dean Runyan Associates
7.1 Travel Expenditures

93 www.cedcal.com
7. Travel & Tourism
$0
$100
$200
$300
$400
$500
$600
$700
1992 1994 1996 1998 2000 2002 2004 2006 2008
Total Annual Travel Expenditures (Millions) El Dorado
-6%-4%-2%0%2%4%6%8%
10%
1993 1995 1997 1999 2001 2003 2005 2007
Annual Percent C hange El Dorado California
The expenditures shown in the graph are estimated in current dollars and include the following:
Accommodations refer to spending by travelers on lodging in hotels, motels, camping sites, and rented vacation homes.
Eating/drinking refers to purchases made by travelers at restaurants and other businesses that serve food and beverages for consumption on the premises.
Retail sales refer to spending by trav-elers on gifts and souvenirs, or any items other than food and recre-ation.
Transportation refers to spending by travelers for travel arrangements to and from their destinations.
Recreation refers to spending by travelers for amusement and enjoy-ment, such as admission to tourist attractions.

94
2010-11 Economic & Demographic Profile
Overview The employment indicator is an estimate of the number of jobs generated in the county from travel spending shown in the previous indicator. Travel generated employment is spread across nearly all industries evaluated by the U.S. Department of Commerce. Travel-generated employment is the impact of travel spending on jobs and job growth in the county. It is a measure of the benefit to workers.
Travel and tourism can play a vital role in the economy and economic growth of small towns,
particularly those in Northern California dependent on visitors to wine country. It is a source of jobs for many otherwise less-skilled or -educated workers in the county.
El Dorado County Travel-generated employment produced 8,500 jobs in El Dorado County in 2008, accounting for 9 percent of the total employment in the county. Between 2002 and 2004, El Dorado County experi-enced increases in travel-generated employment, but over the last four years employment has decreased.
Between 1998 and 2008, El Dorado County was responsible for an annual average of 1 per-cent of the total travel-generated employment in the state.
Year
Travel-generated
employment
Annual percent change
Total employment
County Travel-generated employment as a percent of total
employment
California Travel-generated employment as a percent of total
employment 1992 9.6 n/a 53.1 18.0 % 4.7 % 1993 9.7 1.6 % 53.6 18.2 % 4.7 % 1994 10.1 3.8 % 56.6 17.9 % 4.8 % 1995 10.0 - 1.1 % 58.2 17.2 % 4.8 % 1996 9.7 - 2.7 % 59.7 16.3 % 4.9 % 1997 9.8 0.7 % 61.3 16.0 % 5.0 % 1998 9.7 - 1.2 % 68.6 14.1 % 4.9 % 1999 10.2 5.2 % 72.1 14.1 % 4.9 % 2000 10.2 0.5 % 76.3 13.4 % 4.8 % 2001 9.8 - 4.2 % 79.5 12.3 % 4.5 % 2002 9.9 0.6 % 80.4 12.3 % 4.4 % 2003 10.6 7.4 % 83.0 12.8 % 4.5 % 2004 10.8 2.4 % 89.2 12.1 % 4.5 % 2005 10.4 - 3.9 % 91.9 11.3 % 4.5 % 2006 10.2 - 2.3 % 93.8 10.8 % 4.5 % 2007 9.0 - 11.6 % 95.8 9.4 % 4.4 % 2008 8.5 - 5.3 % 97.2 8.8 % 4.4 %
Total Travel-Generated Employment (Thousands of Jobs)
Source: California Travel and Tourism Commission, Dean Runyan AssociatesCreated by: Center for Economic Development, California State University, Chico
7.2 Travel-Generated Employment

95 www.cedcal.com
7. Travel & Tourism
-
2.0
4.0
6.0
8.0
10.0
12.0
1992 1994 1996 1998 2000 2002 2004 2006 2008
C ounty Total Travel G enerated Employment(Thousands of Jobs)
El Dorado County
-15%
-10%
-5%
0%
5%
10%
1993 1995 1997 1999 2001 2003 2005 2007
Annual Percent C hange El Dorado CountyCalifornia
0%
5%
10%
15%
20%
1992 1994 1996 1998 2000 2002 2004 2006 2008
C ounty Travel-G enerated Employmentas a Percent of Total Employment
El Dorado CountyCalifornia

96
2010-11 Economic & Demographic Profile
Overview Earnings listed in this indicator are an esti-mate of the amount of personal income generated from the jobs shown in the previous indicator. As with employment, the earnings indicator represents those in nearly all industries evaluated by the U.S. Department of Commerce. Total annual tourism earnings are all the earnings of employees and busi-ness owners over the course of a year that can be attributed to travel expenditures, including wages and salaries, earned benefits, and proprietor income. Other earnings that do not directly relate to travel are excluded.
Tourism earnings measure the personal finan-cial benefit of travel and tourism in El Dorado County. If earnings are increasing faster than the number of jobs, then travel and tourism jobs are generating higher wage jobs or the work season (if employment is seasonal) is expanding.
El Dorado County El Dorado County’s tourism industry generated $224.8 million in 2008, which is a 1 percent decrease from the previous year, and $42.1 million more than the county generated in 1998. Statewide, tourism earnings increased 2 percent in 2008. Between 1992 and 2008, El Dorado County’s tourism earnings made up an annual average of 0.8 percent of all the tourism earnings in California.
NOTE: Data prior to 1997 was not revised by Dean Runyan and Associates to include NAICS revisions at the time of writing. Therefore, data may not be compa-rable to previous years. Please contact the CED for any available updates in the near future.
YearEarnings
in County
Annual percent change
Earnings in California
Annual percent change
1992 $ 154.2 n/a $ 16,400 n/a 1993 $ 159.1 3.2 % $ 16,500 0.6 % 1994 $ 163.4 2.7 % $ 16,900 2.4 % 1995 $ 165.4 1.2 % $ 17,400 3.0 % 1996 $ 165.8 0.2 % $ 18,700 7.5 % 1997 $ 172.5 4.0 % $ 20,200 8.0 % 1998 $ 182.7 5.9 % $ 21,600 6.9 % 1999 $ 192.4 5.3 % $ 23,100 6.9 % 2000 $ 197.2 2.5 % $ 24,900 7.8 % 2001 $ 197.8 0.3 % $ 24,300 - 2.4 % 2002 $ 206.4 4.3 % $ 24,600 1.2 % 2003 $ 226.1 9.5 % $ 25,300 2.8 % 2004 $ 230.3 1.9 % $ 26,600 5.1 % 2005 $ 232.1 0.8 % $ 27,400 3.0 % 2006 $ 232.7 0.3 % $ 29,000 5.8 % 2007 $ 226.2 - 2.8 % $ 30,400 4.8 % 2008 $ 224.8 - 0.6 % $ 31,000 2.0 %
Created by: Center for Economic Development, California State University, Chico
Total Annual Travel Earnings by County and State (Millions)
Source: California Travel and Tourism Commission, Dean Runyan Associates
7.3 Total Annual Travel Earnings

97 www.cedcal.com
7. Travel & Tourism
-4%-2%0%2%4%6%8%
10%12%
1993 1995 1997 1999 2001 2003 2005 2007
Annual Percent C hange El Dorado County
California
$0
$50
$100
$150
$200
$250
1992 1994 1996 1998 2000 2002 2004 2006 2008
Total Annual Travel Earnings (Millions)
El Dorado County

98
2010-11 Economic & Demographic Profile
Overview The tax revenues indicator is an estimate of rev-enue generated by local government from travel expen-ditures shown earlier in this section. The revenue can be in the form of taxes, fees for service, fines, or any other source. The totals are not limited to general revenue, which can be spent at the discretion of the local govern-mental jurisdiction, but also include functional revenue that must be spent for a specific purpose.
Local sales taxes and transient occupancy taxes (TOT) are typically the largest components of tax rev-enues generated by travel expenditures. This represents a portion of the revenues generated by sales of taxable items shown in section six.
Tax revenues generated by travel expenditures are a measure of the fiscal benefit to local governments in El Dorado County that is derived from travel and tourism. The size of the revenue impact can help determine the desirability of local government investment in promot-ing travel and tourism within its jurisdiction.
El Dorado County Tourism tax revenues in El Dorado County decreased each of the last 2 years. In 1997, El Dorado County generated over $27.7 million in tax revenues, including both local and state taxes. By 2008, total tax revenues in El Dorado County increased to $34.6 mil-lion, a 19 percent increase since 1998. This was behind the state of California, which saw a 46 percent increase. During the same time period, El Dorado County’s travel-generated local tax revenue increased 18 percent, while state tax revenues in the county increased 20 percent. Many attractions in the county offer untaxed goods and services, so the numbers may not reflect the total tourism activity in the county.
YearLocal rax revenues
State tax revenues
Total tax revenues
County Annual percent change
California Annual percent change
1992 $ 9.7 $ 14.7 $ 24.4 n/a n/a 1993 $ 10.1 $ 15.1 $ 25.2 3.3 % 2.3 % 1994 $ 10.4 $ 15.4 $ 25.8 2.4 % 3.7 % 1995 $ 10.5 $ 15.8 $ 26.3 1.9 % 6.7 % 1996 $ 10.4 $ 16.2 $ 26.6 1.1 % 9.1 % 1997 $ 10.7 $ 17.0 $ 27.7 4.1 % 9.3 % 1998 $ 11.3 $ 17.7 $ 29.0 4.7 % 5.4 % 1999 $ 12.1 $ 18.6 $ 30.7 5.9 % 6.7 % 2000 $ 12.6 $ 18.9 $ 31.5 2.6 % 7.5 % 2001 $ 12.4 $ 18.4 $ 30.8 - 2.2 % - 5.9 % 2002 $ 12.7 $ 19.2 $ 31.9 3.6 % 0.8 % 2003 $ 13.7 $ 20.6 $ 34.3 7.5 % 4.4 % 2004 $ 13.8 $ 21.5 $ 35.3 2.9 % 6.2 % 2005 $ 14.2 $ 22.3 $ 36.5 3.4 % 7.8 % 2006 $ 14.4 $ 22.3 $ 36.7 0.5 % 5.3 % 2007 $ 13.6 $ 21.5 $ 35.1 - 4.4 % 4.1 % 2008 $ 13.3 $ 21.3 $ 34.6 - 1.4 % 2.1 %Source: California Travel and Tourism Commission, Dean Runyan AssociatesCreated by: Center for Economic Development, California State University, Chico
Tax Revenues Generated by Travel Expenditures, County and State (Millions)
7.4 Tax Revenues Generated by Travel Expenditures

99 www.cedcal.com
7. Travel & Tourism
$0.0$5.0
$10.0$15.0$20.0$25.0$30.0$35.0$40.0
1992 1994 1996 1998 2000 2002 2004 2006 2008
C ounty Total Tax Revenues G enerated by Travel Expenditures (Millions)
-10%
-5%
0%
5%
10%
15%
1993 1995 1997 1999 2001 2003 2005 2007
Total Tax Revenues Annual Percent C hange El Dorado CountyCalifornia

100
2010-11 Economic & Demographic Profile
Overview Traffic volumes on California State Highways are estimated annually and measured on-the-ground peri-odically by the California Department of Transportation. The data is collected to help the state understand where traffic volume is growing and for planning traffic improvements.
Traffic volume is an indicator of change in eco-nomic interconnectivity between regions and communi-ties. Most traffic growth over a ten-year period reflects increases in commute patterns, although other factors include increased shopping trips and commercial traf-fic.
7.5 Selected Highway Traffic Volumes
Highway/ Interstate Location
North/East
South/West
North/East
South/West
North/East
South/West
49 MISSOURI FLAT RD 13,400 12,300 15,000 13,500 11.9% 9.8%49 PLACERVILLE, PACIFIC/ MAIN STS 15,600 2,600 5,400 3,500 -65.4% 34.6%49 COOL, JCT. RTE. 193 EAST 8,300 5,300 8,600 14,000 3.6% 164.2%50 LATROBE RD 60,000 67,000 72,000 95,000 20.0% 41.8%50 PLACERVILLE, JCT. RTE. 49 38,000 45,000 40,000 45,000 5.3% 0.0%50 SOUTH LAKE TAHOE, PIONEER TRAIL RD 41,000 35,500 31,500 31,500 -23.2% -11.3%89 JCT. RTE. 50 18,000 4,400 16,900 4,500 -6.1% 2.3%
193 GEORGETOWN, LOWER MAIN ST 2,050 4,950 3,550 5,300 73.2% 7.1%
Percent Change
Source: California Department of TransportationCreated by: Center for Economic Development, California State University, Chico
Average Annual Daily Traffic Volumes1999 2009

101 www.cedcal.com
7. Travel & Tourism
Overview Travel time to work is the amount of time, in minutes, workers estimate it takes them to get to work on a normal workday. Travel time can be influenced by distance to work, traffic levels, and the means of trans-portation utilized (evaluated in the following indicator). It is measured every ten years by the decennial census.
As the U.S. economy heads toward a broader glob-al market, the dynamics of transportation to and from work change as well. Commuting has become a way of life. People spend an increasing number of hours on the road traveling to and from work, and lose valuable time that otherwise might be spent working, at home, or in the marketplace. In addition, the increasing use of the Internet to conduct business has had an impact on the number of people working from their homes or nearby offices, while the expansion of large businesses in metropolitan areas attracts employees from rural areas. Commuting has had a tremendous effect on local economies, increasing the need for alternative forms of transportation, including public transit.
El Dorado County For many residents in El Dorado County, com-muting to work is a ten- to nineteen-minute drive in a personal car, truck, or van. As of 2000, 19,619 residents in El Dorado County, which is 27.2 percent of total employed residents, commuted to their place of employ-ment in a ten- to nineteen-minute drive, while 15.3 per-cent faced a commute of twenty to twenty-nine minutes. These were also the two most common commute times statewide. A significant number of El Dorado County residents had much easier commutes, with 9,407 people reporting a commute time of less than ten minutes. This number, which is 13.1 percent of all employed El Dorado County residents, is higher than the 11 percent of work-ers with similar commutes throughout California.
Travel Time to Work Number Percent Number PercentDid not work at home 55,290 96.1% 67,904 94.2%Less than 5 minutes 2,398 4.2% 2,139 3.0%5 to 9 minutes 7,161 12.4% 7,268 10.1%10 to 19 minutes 18,158 31.6% 19,619 27.2%20 to 29 minutes 8,391 14.6% 11,004 15.3%30 to 39 minutes 6,956 12.1% 8,783 12.2%40 to 44 minutes 2,326 4.0% 3,108 4.3%45 to 59 minutes 5,193 9.0% 7,258 10.1%60 to 89 minutes 3,533 6.1% 5,894 8.2%90 or more minutes 1,174 2.0% 2,831 3.9%Worked at home 2,257 3.9% 4,215 5.8%Total 57,547 100.0% 72,119 100.0%
Travel Time to W ork1990 2000
Source: Bureau of the CensusCreated by: Center for Economic Development, California State University, Chico
7.6 Travel Time to Work

102
2010-11 Economic & Demographic Profile
0.0%
5.0%
10.0%
15.0%
20.0%
25.0%
30.0%
0-5 5-9 10-19 20-29 30-39 40-44 45-59 60-89 90+
Travel Time to Work (Minutes)Percent of Total, 2000
El Dorado
California

103 www.cedcal.com
7. Travel & Tourism
Overview Means of transportation to work is the type of vehicle or mode used to get from home to work on work days. As with travel time, it is only consistently measured by the decennial census unless a local survey is conduct-ed during noncensus years.
Commuting is a necessary and regular part of life for most people in the workforce. The means by which the population travels to and from work can be used to analyze the need and importance of public transporta-tion in a county.
El Dorado County As of 2000, the vast majority of El Dorado County workers, 89.1 percent, got to work via car, truck, or van. Of those residents, 85.1 percent drove alone, compared to 83.2 percent throughout California in 2000. In the county, 14.9 percent of that group carpooled in the same year.
In 2000, 3.1 percent of El Dorado County’s employed residents used nonmotorized means to get to work: 0.3 percent rode a bicycle, 2.2 percent walked, and 0.6 percent got to work using some other mode of transportation. Only 1.8 percent of the total number of employed residents in El Dorado County used public transportation of some kind, which can either be attrib-uted to a lack of available public transportation, or a negative connotation associated with it.
Means of Transportation Number Percent Number PercentCar, truck, or van 51,610 89.7% 64,255 89.1%Drove alone 43,213 75.1% 54,656 75.8%Carpooled 8,397 14.6% 9,599 13.3%Public Transportation 920 1.6% 1,294 1.8%Motorcycle 132 0.2% 123 0.2%Bicycle 213 0.4% 244 0.3%Walked 1,947 3.4% 1,570 2.2%Other means 468 0.8% 418 0.6%Worked at Home 2,257 3.9% 4,215 5.8%Total 57,547 100.0% 72,119 100.0%
Means of Transportation to W ork
Source: California Travel and Tourism Commission, Dean Runyan AssociatesCreated by: Center for Economic Development, California State University, Chico
1990 2000
7.7 Means of Transportation to Work

104
2010-11 Economic & Demographic Profile
0.0%10.0%20.0%30.0%40.0%50.0%60.0%70.0%80.0%
Drove alone Carpooled Public Transportation
Bicycle Walked
Means of Transportation to Work,Percent of Total, 2000
El Dorado California

105 www.cedcal.com
7. Travel & Tourism
Overview Registration is an annual fee based on vehicle type and required for all vehicles intended for use on the highway or in town. A biennial smog check is required for all gasoline vehicles made made after 1975. Models made before that time are exempt, as well as models made within the last six years, some diesel powered vehicles, motorcycles, hybrids, and electric vehicles.
Vehicle registration, per capit, a has generally
increased over time, meaning more cars on the road for every living person. Increasing volume of vehicles can indicate increasing traffic levels, the impacts of which may need to be addressed by state and local government bodies.
The California Highway Patrol (CHP) and the Department of Motor Vehicles (DMV) use vehi-cle registration fees to offset costs for road safety, maintenance, and repairs. Registration fees also benefit local projects, such as fingerprint identifica-tion for children in the community, the disposal of abandoned vehicles, Service Authority for Freeway Emergencies (SAFE), auto theft deterrence/DUI edu-cational prevention tactics, and air quality monitor-ing and management programs.
El Dorado County The number of total vehicle registrations had increased steadily in El Dorado County until reaching a peak of 229,791 in 2006. It has since fallen to 220,799 in 2009. Of these, 121,768 were automobiles, 47,309 were trucks, 41,555 were trailers, and 8,158 were motor-cycles. These numbers are expected to rise as more people obtain their driver’s license and begin driving in El Dorado County. Because registration fees in certain cases can be more than $400, vehicle registration and
Year Autos Trucks Trailers Mortorcycles Total1990 81,941 40,362 22,185 3,841 150,3191991 85,323 38,460 20,404 4,253 150,4311992 83,601 36,674 20,357 4,126 146,7501993 84,125 36,415 21,678 4,081 148,2921994 85,135 36,672 20,981 4,071 148,8531995 87,043 37,181 22,684 4,161 153,0641996 88,725 37,956 23,207 4,184 156,0681997 85,369 35,885 23,571 3,296 150,1181998 93,259 38,606 23,949 3,421 161,2331999 95,962 39,977 26,161 3,674 167,7732000 100,916 41,915 30,473 4,161 179,4652001 105,836 43,438 34,403 4,736 190,4142002 110,817 46,075 33,075 5,126 197,0952003 110,652 46,069 35,320 5,667 199,7112004 119,460 49,593 41,050 6,534 218,6412005 119,094 49,152 46,586 7,003 223,8402006 121,335 50,063 48,761 7,626 229,7912007 122,360 50,190 43,773 7,935 226,2652008 122,082 48,376 43,066 8,393 223,9252009 121,768 47,309 41,555 8,158 220,799
Source: California Department of Motor Vehicles
Estimated Fee Paid Vehicle Registrations
Created by: Center for Economic Development, California State University, Chico
0
50,000
100,000
150,000
200,000
250,000
1990 1992 1994 1996 1998 2000 2002 2004 2006 2008
Total Vehicle Registration
7.8 Vehicle Registration

106
2010-11 Economic & Demographic Profile

107 www.cedcal.com
8. Community Health
Health and human service agencies are involved in treating and monitoring the health care needs of the community. Community health indicators measure the success of programs and services that provide access to physical and mental support for the community.
When considering community health indica-tors, it is helpful to look not only at traditional medical indicators (births, deaths, etc.), but those that measure individual and collective health as well. Individual health may be influenced by a variety of factors, including educational attainment, employ-ment, environmental factors, and even community relations. Other indicators measure the availability, and perhaps the adequacy, of health care services in the area.
Indicators in this section can be linked to issues of unemployment and poverty as poverty can affect a persons ability to recieve adequate health care. Conversley health issues can affect a person’s ability to work and improve their standard of living.
In this section:
8.1 Death Rate . . . . . . . . . . . . . . . . . . . . . . . . . . . . . . . . 108
8.2 Birth Rate . . . . . . . . . . . . . . . . . . . . . . . . . . . . . . . . 109
8.3 Leading Causes of Death . . . . . . . . . . . . . . . . . . . 110
8.4 Infant Mortality . . . . . . . . . . . . . . . . . . . . . . . . . . . 112
8.5 Low Birth Weight Infants . . . . . . . . . . . . . . . . . . 114
8.6 Teenage Pregnancy . . . . . . . . . . . . . . . . . . . . . . . . 116
8.7 Late Prenatal Care . . . . . . . . . . . . . . . . . . . . . . . . . 117
8.8 Medical Service Providers . . . . . . . . . . . . . . . . . 119
8. Community Health

108
2010-11 Economic & Demographic Profile
Overview The data is reported by place of residence at the time of death; as long as the decedent was a per-manent resident of El Dorado County at the time of death, they are included. Age and race/ethnic-ity of decedent, place of death, and cause of death, among other characteristics are also reported to the California Department of Public Health.
Death statistics are essential when evaluating public health and generally identifies the degree to which the county has an aging population. This data is used for identifying health issues in the com-munity, and targeting public health programs and services. Age-adjusted death rates are not published by CDPH at the county level. El Dorado County 1,227 El Dorado County residents died in 2008. The death rate in El Dorado County decreased from 7.1 deaths per 1,000 residents in 1998 to 6.8 in 2008. In comparison, California had a lower death rate of 6.2 deaths in 2008 per 1,000 resi-dents, and it also has a decreas-ing death rate. A death rate high-er than that of California’s death rate means either or both of the following are true: the popula-tion of the county is much older than that of California’s popula-tion, or El Dorado County resi-dents have a lower standard of living/health than the California average.
Year Number Rate per 1,0001991 214,220 7.11992 214,586 7.01993 220,271 7.11994 222,854 7.11995 222,626 7.01996 222,308 7.01997 223,438 6.91998 225,450 6.91999 227,965 6.92000 228,281 6.82001 232,790 6.82002 233,246 6.72003 239,325 6.72004 232,464 6.42005 236,220 6.42006 236,452 6.42007 233,467 6.22008 234,072 6.2
Number of Deaths, California
Source: California Department of Public HealthCreated by: Center for Economic Development, California State University, Chico
Year Number Rate per 1,0001991 901 6.91992 827 6.11993 856 6.21994 1,004 7.11995 1,026 7.11996 1,024 7.01997 1,053 7.11998 1,078 7.11999 1,149 7.52000 1,101 7.12001 1,161 7.22002 1,191 7.32003 1,213 7.32004 1,235 7.32005 1,303 7.52006 1,233 7.02007 1,275 7.22008 1,227 6.8
Created by: Center for Economic Development, California State University, Chico
Number of Deaths, County
Source: California Department of Public Health
8.1 Death Rate
0.0
2.0
4.0
6.0
8.0
1992 1994 1996 1998 2000 2002 2004 2006 2008
Death Rates per 1,000Population
El Dorado County
California

109 www.cedcal.com
8. Community Health
8.2 Birth Rate
Overview The birth rate is the number of live births that occur for every 1,000 people in the county. The num-ber of births and rate is tabulated by the California Department of Public Health from records of the state’s county health departments.
Birth rates indicate the degree to which the popula-tion reproduces. High birth rates can indicate a healthier population, although lower birth rates may be due to fewer family-age adults in the community, or a greater propensity for lifestyles that include smaller than aver-age families. Birth rates tend to increase slightly during economic booms and decrease slightly during reces-sions, although long-term trends in birth rates are not an indicator of long-term economic activity.
El Dorado County County birth rates are consistently below average compared to the state, which is attributable to the higher senior population of the county. Rates have been declin-ing along with those of the state since 1991.
Year NumberRate per
1,0001991 1,956 15.01992 1,773 13.11993 1,789 12.91994 1,792 12.61995 1,726 12.01996 1,664 11.41997 1,666 11.21998 1,677 11.11999 1,637 10.72000 1,628 10.52001 1,698 10.62002 1,765 10.82003 1,751 10.52004 1,897 11.22005 1,930 11.12006 2,036 11.62007 1,881 10.62008 1,814 10.1
Number of Live Births, County
Source: California Department of Public Created by: Center for Economic Development, California State University, Chico
Year NumberRate per
1,0001991 609,228 20.21992 600,838 19.61993 584,483 18.81994 567,034 18.01995 551,226 17.41996 538,628 16.91997 524,174 16.31998 521,265 16.01999 518,073 15.62000 531,285 15.82001 527,371 15.32002 529,245 15.12003 540,827 15.22004 544,685 15.02005 548,700 15.02006 562,157 15.22007 566,137 15.12008 551,567 14.6
Number of Live Births, California
Source: California Department of Public HealthCreated by: Center for Economic Development, California State University, Chico
0
5
10
15
20
25
1992 1994 1996 1998 2000 2002 2004 2006 2008
Live Birth Rates per 1,000 Population
El Dorado County

110
2010-11 Economic & Demographic Profile
Overview Each death in the county is reported with certain characteristic information, including age and race/eth-nicity of decedent, place of residence at time of death, and cause of death, among other characteristics. This indicator includes data on the ten leading causes of death in California each year, broken out by county. The tables show the number of deaths in El Dorado and in California in order of California’s top ten most common causes of death in California between 1999 and 2008.
El Dorado County The leading cause of death in El Dorado County is cancer, which is the second leading cause of death in the state. The second leading cause of death in El Dorado County is heart disease, California’s leading cause of death. In the last ten years, the number of deaths caused by heart disease has fluctuated between 343 with 301 deaths in 2008.
8.3 Leading Causes of Death
Cause of Death 1999 2000 2001 2002 2003 2004 2005 2006 2007 2008All Causes 1,149 1,101 1,161 1,191 1,213 1,235 1,303 1,233 1,275 1,227Heart Disease 343 275 324 329 292 341 304 313 298 301Cancer 302 300 295 323 324 296 319 300 319 333Cerebro-Vascular Disease 76 69 66 72 74 76 83 52 56 56Pulmonary Disease 51 67 71 84 75 73 104 70 79 76Accidents 47 54 65 47 55 59 74 86 96 70Alzheimers 40 22 33 32 36 33 41 32 48 59Diabetes 28 28 23 19 18 26 23 24 29 20Pneumonia & Influenza 17 29 38 35 24 33 33 36 18 23Cirrhosis 21 18 13 17 22 30 23 22 23 16Suicide 21 19 25 22 29 14 34 31 21 16All other causes 203 220 208 211 264 254 265 267 288 257
Created by: Center for Economic Development, California State University, ChicoSource: California Department of Public Health
Leading Causes of Death, County

111 www.cedcal.com
8. Community Health
Cause of Death 1999 2000 2001 2002 2003 2004 2005 2006 2007 2008All Causes 227,965 228,281 232,790 233,246 239,325 232,464 236,220 236,452 233,467 234,072Heart Disease 69,900 68,533 69,004 68,387 69,013 65,002 64,689 64,648 62,220 60,739Cancer 52,880 53,005 53,810 53,926 54,307 53,708 54,613 54,043 54,918 54,579Cerebro-Vascular Disease 18,079 18,090 18,078 17,551 17,686 16,884 15,551 15,011 13,724 13,792Pulmonary Disease 13,187 12,754 13,056 12,643 13,380 12,519 13,167 12,807 12,497 13,346Accidents 8,940 8,814 9,274 9,882 10,470 10,614 10,926 11,236 11,426 10,667Alzheimers 8,014 4,398 4,897 5,405 6,585 6,962 7,694 8,141 8,495 10,095Diabetes 6,004 6,203 6,457 6,783 7,088 7,119 7,679 7,367 7,395 7,349Pneumonia & Influenza 3,934 8,355 8,167 8,098 8,184 7,331 7,537 7,329 6,522 6,576Cirrhosis 3,546 3,673 3,759 3,725 3,832 3,686 3,819 3,826 4,052 4,142Suicide 3,047 3,113 3,256 3,210 3,396 3,364 3,188 3,296 3,543 3,729All other causes 40,434 41,343 43,032 43,636 45,384 45,275 47,357 48,748 48,675 49,058Source: California Department of Public HealthCreated by: Center for Economic Development, California State University, Chico
Leading Causes of Death, California
0.0 %
5.0 %
10.0 %
15.0 %
20.0 %
25.0 %
30.0 %
Hea
rt D
iseas
e
Canc
er
Cere
bro
-Vas
cula
r D
iseas
e
Pulm
onar
y D
iseas
e
Acc
iden
ts
Alzh
eim
ers
Dia
bete
s
Pneu
mon
ia &
In
fluen
za
Cirr
hosis
Suic
ide
All
othe
r cau
ses
Leading C auses of Death as Percent of Total, C ounty and State El Dorado CountyCalifornia

112
2010-11 Economic & Demographic Profile
Overview Infant mortality is used to compare the health and well-being of populations across and within countries.
Infant mortality rates are a subset of total deaths presented earlier in this section and are the sum of infant and neonatal deaths, which are described below:
·Neonatal death is a death occurring within the first twenty-eight days of life.
·Infant death is a death occurring during the first year of life.
Infant mortality represents many factors surround-ing birth, including but not limited to the health and socioeconomic status of the mother, prenatal care, qual-ity of the health services delivered to the mother and child, and infant care. In addition, high infant mortality rates are often considered preventable and can be influenced by various education and care programs.
El Dorado County There were a total of eight infant deaths in El Dorado County in 2007, an increase of one death from the previous year. In 2002, El Dorado County saw the highest number of infant deaths since 1994. At the time of data collection the most current data available was from 2007.
Year Number
Deaths per 1,000 live
births1999 2,787 5.4 2000 2,884 5.4 2001 2,815 5.3 2002 2,875 5.4 2003 2,819 5.2 2004 2,811 5.2 2005 2,913 5.3 2006 2,829 5.0 2007 2,941 5.2
Number of Infant Deaths, California
Source: California Department of Public HealthCreated by: Center for Economic Development, California State University, Chico
8.4 Infant Mortality
Year Number
Deaths per 1,000 live
births1999 8 4.9 2000 3 1.8 2001 9 5.3 2002 12 6.8 2003 4 2.3 2004 10 5.3 2005 5 2.6 2006 7 3.4 2007 8 4.3
Number of Infant Deaths, County
Source: California Department of Public HealthCreated by: Center for Economic Development, California State University, Chico

113 www.cedcal.com
8. Community Health
0.01.02.03.04.05.06.07.08.0
1999 2000 2001 2002 2003 2004 2005 2006 2007
Infant Death Rate El Dorado County
California
0
2
4
6
8
10
12
14
1999 2000 2001 2002 2003 2004 2005 2006 2007
Total Infant Deaths El Dorado County

114
2010-11 Economic & Demographic Profile
Overview Births of infants with a low birth weight (less than 2,500 grams, about 5.5 pounds) are reported by the California Department of Health Services as a subset of birth data.
Low birth weight is a major cause of infant mortal-ity. Birth weight is also an important element in child-hood development. There are many factors that lead to low birth weights, such as smoking tobacco during preg-nancy, using alcohol or other nonprescribed substances, poor nutrition, inadequate prenatal care, and premature birth.
Low birth weight babies are at a higher risk to be born with underdeveloped organs. This can lead to lung problems, such as respiratory distress syndrome, bleed-ing of the brain, vision loss, and/or serious intestinal problems. Low birth weight babies are more than twenty times more likely to die in their first year of life than babies born at a normal weight.
El Dorado County The total number of low birth weight babies was 120 in El Dorado County in 2008, which was 6.6 percent of the total number of births in the same year. This per-centage has decreased from 7 percent in 2002 and 2003, and is 0.2 percent less than the rate of low birth weight babies across California.
Year NumberPercent of live births
1990 35,474 5.8 %1991 35,359 5.8 %1992 35,608 5.9 %1993 35,116 6.0 %1994 34,876 6.2 %1995 33,588 6.1 %1996 32,649 6.1 %1997 32,232 6.1 %1998 32,438 6.2 %1999 31,686 6.1 %2000 32,853 6.2 %2001 33,196 6.3 %2002 33,859 6.4 %2003 35,659 6.6 %2004 36,481 6.7 %2005 37,653 6.9 %2006 38,517 6.9 %2007 38,923 6.9 %2008 37,507 6.8 %
Low Birth W eight Infants, California
Source: California Department of Public HealthCreated by: Center for Economic Development, California State University, Chico
8.5 Low Birth Weight Infants
Year NumberPercent of live births
1990 91 4.6 %1991 116 5.9 %1992 104 5.9 %1993 104 5.8 %1994 98 5.5 %1995 96 5.6 %1996 107 6.4 %1997 110 6.6 %1998 86 5.1 %1999 81 4.9 %2000 93 5.7 %2001 84 4.9 %2002 122 6.9 %2003 121 6.9 %2004 119 6.3 %2005 107 5.5 %2006 134 6.6 %2007 114 6.1 %2008 120 6.6 %
Low Birth W eight Infants, County
Source: California Department of Public HealthCreated by: Center for Economic Development, California State University, Chico

115 www.cedcal.com
8. Community Health
0
50
100
150
1990 1992 1994 1996 1998 2000 2002 2004 2006 2008
Total Low Weight Birth Infants (Under 2,500 G rams)
El Dorado County
0.0 %
2.0 %
4.0 %
6.0 %
8.0 %
1990 1992 1994 1996 1998 2000 2002 2004 2006 2008
Low Birth Weight Infants (Under 2,500G rams) as Percent of Live Births
El Dorado County
California

116
2010-11 Economic & Demographic Profile
Overview Teen births are reported by the California Department of Health Services as births to mothers under the age of twenty. It is a subset of the birth data published by the California Department of Public Health.
Teen pregnancy is a major national and state con-
cern because teen mothers and their babies face increased risks to their health and economic status. According to the National Center for Health Statistics, teen mothers are more likely than mothers over age twenty to give birth prematurely (before thirty-seven completed weeks of pregnancy). Many factors contribute to the increased risk of health problems of babies born to teenage moth-ers. Teens often have poor eating habits and neglect tak-ing vitamins. Many teens smoke, drink alcohol, or even take drugs.
Teenage mothers are more likely to drop out of high school than those who wait until later years to have their own children. Usually lacking necessary education skills, teenage mothers potentially have a harder time finding and keeping well-paying jobs.
El Dorado County Births to teenage mothers in El Dorado County represented 10 percent of all live births in 1995, but have since been decreasing even though the population has grown. Also, teen pregnancy rates in El Dorado County have always been lower than the overall incidence throughout California. Only 6.2 percent of all births in the county were from teen mothers in 2008, lower than the California average of 9.4 percent.
Year NumberPercent of live births
1990 159 8.0 %1991 174 8.9 %1992 135 7.6 %1993 167 9.3 %1994 167 9.3 %1995 176 10.2 %1996 150 9.0 %1997 155 9.3 %1998 149 8.9 %1999 153 9.3 %2000 129 7.9 %2001 148 8.7 %2002 144 8.2 %2003 113 6.5 %2004 122 6.4 %2005 131 6.8 %2006 111 5.5 %2007 123 6.5 %2008 112 6.2 %
Total Teen Births, County
Source: California Department of Public HealthCreated by: Center for Economic Development, California State University, Chico
Year NumberPercent of live births
1990 69,560 11.4 %1991 70,322 11.5 %1992 69,272 11.5 %1993 68,519 11.7 %1994 68,198 12.0 %1995 66,644 12.1 %1996 63,118 11.7 %1997 59,851 11.4 %1998 58,141 11.2 %1999 56,577 10.9 %2000 55,373 10.4 %2001 52,966 10.0 %2002 50,201 9.5 %2003 49,330 9.1 %2004 49,737 9.1 %2005 50,017 9.1 %2006 52,770 9.4 %2007 53,393 9.4 %2008 51,704 9.4 %
Total Teen Births, California
Source: California Department of Public HealthCreated by: Center for Economic Development, California State University, Chico
8.6 Teenage Pregnancy
0.0 % 2.0 % 4.0 % 6.0 % 8.0 %
10.0 % 12.0 % 14.0 %
1990 1992 1994 1996 1998 2000 2002 2004 2006 2008
Live Births to Teenage Mothers as Percent of Live Births
El Dorado County
California

117 www.cedcal.com
8. Community Health
Overview Late prenatal care is a count of births where the mother first saw a physician about her pregnancy after her third trimester began. Data is collected by county health departments from surveys of every birth and reported to the California Department of Public Health. The survey includes a question about when the mother
first sought medical care during her pregnancy.
Late prenatal care is one of the more prominent risk factors for many medical complications later in pregnancy, during childbirth, or among the children themselves. Early medical care can help expectant moth-ers with lifestyle and medication changes that might otherwise affect their child.
El Dorado County In 2008 the percent of live births with late prena-tal care in the county was 2.9 percent compared to 3.2 percent in the state. However, county rates have been similar to state rates since 1996.
8.7 Late Prenatal Care
Year NumberPercent of live births
1990 42,553 7.0 %1991 38,277 6.3 %1992 31,755 5.3 %1993 29,185 5.0 %1994 27,458 4.8 %1995 25,099 4.6 %1996 20,328 3.8 %1997 19,244 3.7 %1998 18,650 3.6 %1999 16,319 3.1 %2000 16,051 3.0 %2001 15,258 2.9 %2002 13,606 2.6 %2003 13,447 2.5 %2004 14,123 2.6 %2005 14,635 2.7 %2006 15,658 2.8 %2007 17,847 3.2 %2008 17,388 3.2 %
Births W ith Late or No Prenatal Care, California
Source: California Department of Public HealthCreated by: Center for Economic Development, California State University, Chico
Year NumberPercent of live births
1990 126 6.3 %1991 75 3.8 %1992 48 2.7 %1993 79 4.4 %1994 42 2.3 %1995 51 3.0 %1996 45 2.7 %1997 53 3.2 %1998 34 2.0 %1999 53 3.2 %2000 32 2.0 %2001 37 2.2 %2002 27 1.5 %2003 31 1.8 %2004 41 2.2 %2005 49 2.5 %2006 43 2.1 %2007 50 2.7 %2008 52 2.9 %
Created by: Center for Economic Development, California State University, Chico
Births W ith Late or No Prenatal Care, County
Source: California Department of Public Health

118
2010-11 Economic & Demographic Profile
0
20
40
60
80
100
120
140
1990 1992 1994 1996 1998 2000 2002 2004 2006 2008
Total Births with Late or No Prenatal C are El Dorado County
0.0 %
2.0 %
4.0 %
6.0 %
8.0 %
1990 1992 1994 1996 1998 2000 2002 2004 2006 2008
Births with Late or No Prenatal C are as Percent of Live Births
El Dorado County
California

119 www.cedcal.com
8. Community Health
Overview The Medical Board of California is the state’s licensing agency for practicing physicians. The table in this section presents the number of licenses where the primary address of the practice is in El Dorado County. This may not entirely represent health care availability in the area if there are a significant number of physi-cians practicing part-time in El Dorado County with a primary address in neighboring places.
The number of practitioners providing services within an area can indicate the available health care resources in a community. Access to health care and preventative services, such as immunizations and health screenings, are important to an individual’s health. Those lacking preventative services are at a higher risk for some diseases, especially those that are preventable by vaccine.
El Dorado County As of 2008, there were 302 physicians actively practicing in El Dorado County, a decrease of one physi-cian from the previous year, although there is a general upward trend over the last decade. As the number of physicians in California and El Dorado County continue to rise, community health and preventative care services will continue to improve. Also, an influx of physicians in a particular area raises that area’s economic and educational status.
Fiscal Year
Number of physicians
Total physicians in California
1999 242 82,8722000 251 84,6752001 261 86,9342002 274 89,0252003 276 91,0492004 282 92,8522005 292 94,5462006 297 96,2992007 303 97,8782008 302 99,900
Number of Physicians
Source: Medical Board of CaliforniaCreated by: Center for Economic Development, California State University, Chico
0.0
0.5
1.0
1.5
2.0
2.5
3.0
1999 2000 2001 2002 2003 2004 2005 2006 2007 2008
Number of Physicians per 1,000 PeopleEl Dorado County
California
8.8 Medical Service Providers

120
2010-11 Economic & Demographic Profile

121 www.cedcal.com
9. Welfare
The amount of assistance utilized by families and individuals in need is an indication of how well the com-munity is meeting the basic needs of the less fortunate in our society. Also, by assessing the available services and the amount of existing need, it becomes apparent what addi-tional services and/or assistance might improve the quality of life in a specific area. Welfare indicators are also a good indication of the county’s socio-economic make-up.
In this section:
9.1 TANF/CalWORKs Caseload & Expenditures . . .122
9.2 Food Stamps Caseload & Expenditures . . . . . . . .124
9.3 Medi-Cal Beneficiaries . . . . . . . . . . . . . . . . . . . . . . . .126
9.4 Foster Care Entries . . . . . . . . . . . . . . . . . . . . . . . . . . .128
9.5 School Free and Reduced Meals . . . . . . . . . . . . . . .130
9. Welfare
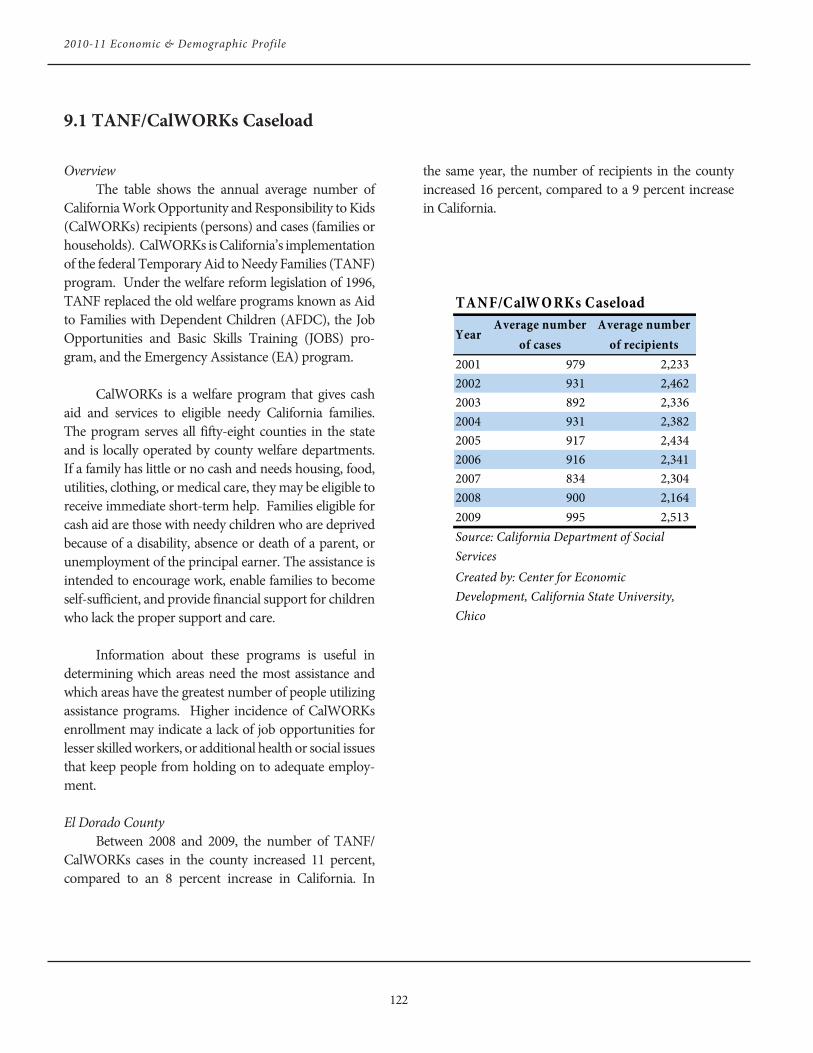
122
2010-11 Economic & Demographic Profile
Overview The table shows the annual average number of California Work Opportunity and Responsibility to Kids (CalWORKs) recipients (persons) and cases (families or households). CalWORKs is California’s implementation of the federal Temporary Aid to Needy Families (TANF) program. Under the welfare reform legislation of 1996, TANF replaced the old welfare programs known as Aid to Families with Dependent Children (AFDC), the Job Opportunities and Basic Skills Training (JOBS) pro-gram, and the Emergency Assistance (EA) program.
CalWORKs is a welfare program that gives cash aid and services to eligible needy California families. The program serves all fifty-eight counties in the state and is locally operated by county welfare departments. If a family has little or no cash and needs housing, food, utilities, clothing, or medical care, they may be eligible to receive immediate short-term help. Families eligible for cash aid are those with needy children who are deprived because of a disability, absence or death of a parent, or unemployment of the principal earner. The assistance is intended to encourage work, enable families to become self-sufficient, and provide financial support for children who lack the proper support and care.
Information about these programs is useful in determining which areas need the most assistance and which areas have the greatest number of people utilizing assistance programs. Higher incidence of CalWORKs enrollment may indicate a lack of job opportunities for lesser skilled workers, or additional health or social issues that keep people from holding on to adequate employ-ment.
El Dorado County Between 2008 and 2009, the number of TANF/CalWORKs cases in the county increased 11 percent, compared to an 8 percent increase in California. In
the same year, the number of recipients in the county increased 16 percent, compared to a 9 percent increase in California.
YearAverage number
of casesAverage number
of recipients2001 979 2,2332002 931 2,4622003 892 2,3362004 931 2,3822005 917 2,4342006 916 2,3412007 834 2,3042008 900 2,1642009 995 2,513Source: California Department of Social ServicesCreated by: Center for Economic Development, California State University, Chico
TANF/CalW O RKs Caseload
9.1 TANF/CalWORKs Caseload

123 www.cedcal.com
9. Welfare
750
800
850
900
950
1,000
1,050
2001 2003 2005 2007 2009
Average Number of C ases El Dorado County
0.0 % 0.5 % 1.0 % 1.5 % 2.0 % 2.5 % 3.0 % 3.5 % 4.0 % 4.5 %
2001 2003 2005 2007 2009
Average Recipients as a Percent of Total Population
El Dorado County
California

124
2010-11 Economic & Demographic Profile
Overview The food stamp program is a federally funded pro-gram aimed at ending hunger and improving nutrition and health. The program is available to people whose income falls below a certain level, but who are actively seeking employment or are currently employed.
The food stamp program is administered through the U.S. Department of Agriculture (USDA). The department pays all of the costs of the food stamps issued and half of the administrative costs of the program. The state and county share the other half of the administrative costs. Through this system a county can provide for the basic nutrition needs of its population without suffering a major drain on its economy. Food stamps cannot be used to buy items such as pet food, soap, paper products, household supplies, alcoholic beverages, vitamins, or any food prepared in the store or ready-to-eat.
As with CalWORKs, food stamp caseloads and expen-ditures may be an indication that issues exist in the county affecting the ability of people to work, either due to lack of jobs or lack of ability to do paid work. Since those working may also be eligible for food stamp assistance, a high food stamp caseload may also indicate that a large percentage of households are supported by employment paying relatively low wages.
El Dorado County Between 2008 and 2009, the number of households receiving food stamps increased 9 percent, while the number of persons increased 8 percent. In comparison, the average number of households receiving food stamps in California increased 9 percent, and the average num-ber of persons receiving food stamps increased 7 percent in the same year.
Total expenditures in the county rose to its highest
point ever in 2009, increasing by 14 percent , compared to a 15 percent increase in California.
Year
Average number of households
Average number of
personsTotal
expenditures2000 1,513 3,478 $ 3,051,7482001 1,453 3,285 $ 2,984,0372002 1,555 3,502 $ 3,357,1842003 1,633 3,586 $ 3,704,3412004 1,766 3,971 $ 4,337,4842005 1,856 4,153 $ 4,984,5682006 1,919 4,318 $ 5,394,6802007 1,960 4,379 $ 5,804,2782008 2,426 5,324 $ 7,593,0142009 3,362 7,067 $ 12,266,308Source: California Department of Social ServicesCreated by: Center for Economic Development, California State University, Chico
Food Stamps, Recipients, and Expenditures
9.2 Food Stamps Caseload & Expenditures

125 www.cedcal.com
9. Welfare
0 500
1,000 1,500 2,000 2,500 3,000 3,500 4,000
2000
2001
2002
2003
2004
2005
2006
2007
2008
2009Average Number of H ouseholds Participating in Food Stamp Program El Dorado County

126
2010-11 Economic & Demographic Profile
Overview Medi-Cal is California’s program that replaces the federal Medicaid program in the state. It was created before Medicaid and, therefore, California legislators suc-cessfully requested that the federal government exclude this state from their program. It covers people who are disadvantaged physically or financially. Some examples of Medi-Cal eligibles are people aged 65 or older, those who are blind or disabled, those who receive a check through the Supplemental Security Income/State Supplemental Payments program, children and parents who receive financial assistance through the CalWORKs program, and women who are pregnant or diagnosed with cervical or breast cancer. Many Medi-Cal recipients are also either CalWORKs or food stamp recipients, creating an overlap in program enrollment.
Information on Medi-Cal programs is helpful in determining the need for public medical assistance in a particular community. As with CalWORKs and food stamps, the relative need for assistance is also an indicator of the social and/or economic status of area residents.
El Dorado County In 2009, approximately 10 percent of the population in El Dorado County was eligible for Medi-Cal programs (17,192 people). In com-parison, 18 percent of the population throughout California was eligible. The number of eligibles in the county has been increasing since 2003.
Year Beneficiaries
Percentage of County
PopulationCalifornia
Beneficiaries
Percentage of California
Population2003 13,621 8.1 % 6,478,049 18.0 %2004 14,004 8.2 % 6,489,774 17.8 %2005 14,455 8.3 % 6,560,346 17.8 %2006 14,927 8.4 % 6,534,983 17.5 %2007 14,917 8.3 % 6,553,258 17.4 %2008 15,687 8.7 % 6,721,003 17.6 %2009 17,192 9.5 % 7,094,877 18.4 %
Medi-Cal Users
Source: California Department of Healthcare ServicesCreated by: Center for Economic Development, California State University, Chico
9.3 Medi-Cal Caseload & Expenditures

127 www.cedcal.com
9. Welfare
0.0 %
5.0 %
10.0 %
15.0 %
20.0 %
2003 2004 2005 2006 2007 2008 2009
Medi-C al Beneficiares as Percent of Total Population
El Dorado CountyCalifornia
0
5,000
10,000
15,000
20,000
2003 2004 2005 2006 2007 2008 2009
Medi-C al Beneficiares El Dorado County

128
2010-11 Economic & Demographic Profile
Overview Foster care is an out-of-home care system designed to protect children who cannot safely remain in the care of their families. Child abuse and/or neglect are the main causes of child removal from the home, making the child a dependent of the court. The foster care program is aimed at placing these children (who have been removed from their families) in an environ-ment where they will receive proper care and atten-tion. Foster care entries can be of many different types, including kinship, foster, foster family agencies, group homes, shelters, and guardian care.
It is common for children placed in foster care to remain in the system, with multiple placements, until age eighteen. Depending on the success of the initial placements, the time spent in the welfare foster system can have lasting effects on the child’s adult life follow-ing emancipation. For example, statistics show that children with over five placements suffer more hard-ships than a child who had fewer than five placements. A small but disturbing number of males enter the state prison system after they leave the child welfare system, while those women who become mothers while in foster care are four times as likely to receive welfare or
state aid compared to other young females in their age group. It has been determined by the California Youth Connection that many emancipating foster youth are not made aware of their eligibility for benefits that could support their housing, child care, and employment needs. Roughly two-thirds of foster youth have college ambitions, but many emancipating youths do not attend because information on higher education and financial aid opportunities is not consistently provided in a timely manner.
El Dorado County A total of 183 children entered foster care in El Dorado County in 2008, an increase of 54 percent from the previous year. The age of these children varied greatly, ranging from less than one year old to over 16 years of age. Of the 183 children who entered foster care in 2008, eighteen were less than one year old.
9.4 Foster Care Entries
Less than 1-year9.8 %
1 - 2 years16.9 %
3 - 5 years18.6 %
6 - 10 years22.4 %
11 - 15 years25.7 %
16+ years6.6 %
C ounty Foster C are Entries by Age, Percent of Total, 2008
0
50
100
150
200
1998 2000 2002 2004 2006 2008
C ounty Total Foster C are Entries El Dorado County

129 www.cedcal.com
9. Welfare
Year Kinship Foster FFA Group Shelter Guardian Missing Court O ther Total1998 15 23 33 4 0 6 0 1 0 821999 13 15 32 4 0 2 0 3 0 692000 7 23 22 3 0 5 0 0 0 602001 12 27 33 7 0 3 0 0 0 822002 5 13 20 10 0 5 0 0 0 532003 10 15 30 5 0 2 0 0 0 622004 5 45 57 11 0 2 0 1 0 1212005 26 36 39 18 0 2 0 0 0 1212006 22 31 57 16 0 0 0 0 0 1262007 22 43 42 11 0 1 0 0 0 1192008 19 41 91 26 0 6 0 0 0 183
Created by: Center for Economic Development, California State University, Chico
County Foster Care Entries by Placement Type
Source: CWS/CMS 2009 Q3 Extract *8 days or more
YearLess than
1-year1 - 2 years
3 - 5 years
6 - 10 years
11 - 15 years
16+ years Total
Annual percent change
1998 6 9 15 22 26 4 82 n/a1999 8 9 15 17 19 1 69 - 15.9 %2000 6 12 7 12 17 6 60 - 13.0 %2001 11 12 17 19 19 4 82 36.7 %2002 9 8 4 12 16 4 53 - 35.4 %2003 4 8 15 19 14 2 62 17.0 %2004 19 21 23 31 22 5 121 95.2 %2005 21 24 18 26 24 8 121 0.0 %2006 30 15 17 24 34 6 126 4.1 %2007 20 20 17 29 24 9 119 - 5.6 %2008 18 31 34 41 47 12 183 53.8 %
County Foster Care Entries by Age
Source: CWS/CMS 2009 Q3 Extract *8 days or moreCreated by: Center for Economic Development, California State University, Chico

130
2010-11 Economic & Demographic Profile
Overview This indicator is the count of K-12 students enrolled in the free or reduced-priced meal program. The program provides meals to students from income-qualifying families. Families only have to claim a certain income level to enroll their children in the program, and no evidence or auditing is required. Periodically, schools will actively promote the program, which can temporar-ily boost enrollment.
NOTE: Total enrollment numbers differ between this indicator and section 10.1 because total enrollment for the free and reduced meal is calculated for total enroll-ment in October of a given year, students between ages 5 and 17.
El Dorado County The percent of students enrolled in the free and reduced price meal program has increased significantly since 2000, from 21 percent to 31 percent in 2009. Program enrollment went from a low of 5,925 in 2000 to a high of 8,980 in 2009.
9.5 School Free and Reduced Meals
0.0 %
5.0 %
10.0 %
15.0 %
20.0 %
25.0 %
30.0 %
35.0 %
1999 2000 2001 2002 2003 2004 2005 2006 2007 2008 2009
C ounty Percent of Students Using Free and Reduced Meals Program
El Dorado County
Year
Total Free and Reduced
MealsTotal
EnrollmentPercent of Students
1999 6,334 27,844 22.7 %2000 5,925 28,096 21.1 %2001 5,965 28,690 20.8 %2002 5,948 28,874 20.6 %2003 6,105 29,072 21.0 %2004 6,242 29,396 21.2 %2005 6,449 29,183 22.1 %2006 6,561 29,138 22.5 %2007 6,826 28,950 23.6 %2008 7,392 28,686 25.8 %2009 8,980 29,021 30.9 %Source: California Department of EducationCreated by: Center for Economic Development, California State University, Chico
School Free and Reduced Meals

131 www.cedcal.com
10. Education
The quality of an area’s educational institutions can be a critical factor in a person’s decision on where to live, raise a family, and locate his or her business. Education is considered one of the most fundamental socio-eco-nomic indicators of a successful life, and a county with substantial, respectable schools is very attractive to par-ents.
The indicators in this section cover enrollment vol-ume and student performance, each indicating different aspects of the local community. Enrollment data can be used to refine the estimate of population by age (section one) and school performance can influence employment and income potential. Good performance in schools can help residents avoid the need for public assistance health and welfare programs in the future. Often, the amount of education a person achieves has a strong influence on occupations, earnings, poverty, and health care.
In this section:
10.1 School Enrollment . . . . . . . . . . . . . . . . . . . . . . 132
10.2 High School Dropout Rates . . . . . . . . . . . . . . 134
10.3 Graduates Eligible for UC or CSU System . . . . . . . . . . . . . . . . . . . . . . . . . . . . . . . . . 136
10.4 English Learners Enrollment . . . . . . . . . . . . . 138
10.5 Average SAT Scores . . . . . . . . . . . . . . . . . . . . . 139
10.6 Academic Performance Index (API) . . . . . . 140
10. Education

132
2010-11 Economic & Demographic Profile
Overview Total enrollment as reported by the California Department of Education is shown for the 2001-2002 school year through the 2008-2009 school year. The data was compiled from the California Basic Education Data System (CBEDS). On October 4th of each year, the number of students enrolled in public schools that day is reported to CBEDS. California Youth Authority schools (CYA) are also included in enrollment figures. CYA schools provide institutional training and parole supervision for juvenile and young adult offenders.
School enrollment is the most useful indicator of change in the child population after the 2000 Census. As discussed in the age distribution indicator in section one, the decennial census is the only time when population by age is counted, and any data for later years is typically a projection of 2000 Census data. The child population is the most difficult to project because of changing family migration and fertility patterns. School enrollment pro-vides the best data with which to estimate the population of children in the community.
Enrollment trends provide insight into a school’s financial stability. Funding is based primarily on enroll-ment and average daily attendance. Since school districts often face funding challenges, understanding trends in enrollment will help them produce more accurate finan-cial plans.
El Dorado County In the 2008-2009 school year, 29,336 students were enrolled in El Dorado County schools. This number represents a 1 percent decrease from the 2007-2008 year. Total enrollment has increased by 232 students since the 2001-2002 school year.
School Year
Total Enrollment
Annual Percent Change
2001-2002 29,104 n/a 2002-2003 29,147 0.1 %2003-2004 29,072 - 0.3 %2004-2005 29,368 1.0 %2005-2006 29,332 - 0.1 %2006-2007 29,417 0.3 %2007-2008 29,662 0.8 %2008-2009 29,336 - 1.1 %
Total School Enrollment
Source: California Department of EducationCreated by: Center for Economic Development, California State University, Chico
10.1 School Enrollment

133 www.cedcal.com
10. Education
-1.5%-1.0%-0.5%0.0%0.5%1.0%1.5%2.0%
2001-2002 2003-2004 2005-2006 2007-2008
Total Enrollment Annual Percent C hange CaliforniaEl Dorado County
28,600
28,800
29,000
29,200
29,400
29,600
29,800
2001-2002 2003-2004 2005-2006 2007-2008
School Enrollment El Dorado County

134
2010-11 Economic & Demographic Profile
Overview High school dropout rates measure how many students fail to complete state-mandated curriculum requirements. In order for a student to be officially designated as a dropout, he or she must have been previously enrolled in any grade level, 9-12, and left school without re-enrolling in another public or private educational institution or school program for forty-five consecutive days. The one-year dropout rate is the number of dropouts in grades 9-12 divided by the total enrollment in those grades.
The completion of high school is a requirement for most jobs. Even many lower skilled jobs require a high school diploma. According to the U.S. Census Bureau, people with a high school diploma who did not attend college earn 23 percent more per year on average than those without a diploma. The employment rate for high school dropouts is 11 percent less than rate for high school graduates.
High dropout rates may indicate social issues with families in the community. It may also indicate a workforce that is not skilled enough to attract higher wage jobs to the area, which is important for economic development.
NOTE: Due to Department of Education data discrepencies 2006 - 2008 drop out numbers are not historically comparable.
El Dorado County There were 373 students designated as high school dropouts in El Dorado County in 2007, or a 3.7 dropout rate. This number is lower than the 4.9 one-year drop-out rate in California.
YearNumber of dropouts
1-year dropout rate
CA 1-year dropout rate
1993-1994 233 3.0 % 4.9 %1994-1995 184 2.3 % 4.4 %1995-1996 189 2.2 % 3.9 %1996-1997 217 2.4 % 3.3 %1997-1998 176 1.9 % 2.9 %1998-1999 119 1.3 % 2.8 %1999-2000 171 1.9 % 2.8 %2000-2001 115 1.2 % 2.8 %2001-2002 154 1.6 % 2.7 %2002-2003 170 1.8 % 3.1 %2003-2004 166 1.7 % 3.2 %2004-2005 184 1.8 % 3.0 %2005-2006 289 2.8 % 3.3 %2006-2007 289 2.8 % 5.5 %2007-2008 373 3.7 % 4.9 %
High School Dropouts, County (Percent of Total Enrollment)
Source: California Department of EducationCreated by: Center for Economic Development, California State University, Chico
10.2 High School Dropout Rate

135 www.cedcal.com
10. Education
0.0%
1.0%
2.0%
3.0%
4.0%
5.0%
6.0%
1993-94 1995-96 1997-98 1999-00 2001-02 2003-04 2005-06 2007-08
H igh School Dropout Rate California
El Dorado County
0
50
100
150
200
250
300
350
400
1993-94 1995-96 1997-98 1999-00 2001-02 2003-04 2005-06 2007-08
Number of H igh School Dropouts El Dorado County

136
2010-11 Economic & Demographic Profile
Overview This indicator is the count of high school graduates who have completed coursework required by either the California State University or University of California postsecondary education systems. The data is reported by schools to the California Department of Education in their annual California Basic Educational Data System (CBEDS) reports. Further eligibility based on SAT or other college entrance exams are not included here.
A college education is critical for most students looking for higher-wage employment. Also, this is an indicator of the support provided to K-12 students from a combination of the local school system, parents, and the community. El Dorado County Between 2000 and 2007, the county has had a similar percentage of its gradu-ates complete coursework to be CSU/UC eligibile to that of California. However, that percentage decreased significantly in 2007-08. This decrease may be temporary or due to incomplete reporting, which can happen – forthcoming data for 2008-09 will help clarify the picture.
With the exception of the 2007-2008 school year the percent of El Dorado County graduates eligible for the UC or CSU system has been very comprable to the state average.
Year
County Graduates eligible for UC or
CSU System
County Percent of Graduates eligible for
UC or CSU System
CA Percent of Graduates eligible for
UC or CSU System2000-01 560 31.5 % 35.6 %2001-02 743 36.9 % 34.6 %2002-03 701 35.9 % 33.6 %2003-04 685 34.4 % 33.8 %2004-05 693 34.2 % 35.2 %2005-06 782 36.1 % 36.1 %2006-07 821 39.2 % 35.5 %2007-08 860 38.5 % 33.9 %
Graduates Eligible for UC or CSU System
Source: California Department of EducationCreated by: Center for Economic Development, California State University, Chico
10.3 Graduates Eligible for UC or CSU System

137 www.cedcal.com
10. Education
0.0%5.0%
10.0%15.0%20.0%25.0%30.0%35.0%40.0%45.0%
C ounty G raduates Eligible for UC or C SU System
El Dorado CountyCalifornia
0
200
400
600
800
1,000
2000-01 2001-02 2002-03 2003-04 2004-05 2005-06 2006-07 2007-08
G raduates Eligible for UC or C SU System El Dorado County

138
2010-11 Economic & Demographic Profile
Overview This is the count of K-12 students enrolled in English language learning (ELL) programs. These pro-grams were once referred to as “English as a second language” (ESL).
ELL programs require additional school resources per student, although enrollment in the program does not increase school funding, so this can be a measure of hardship for local school districts. It is also a measure of community culture – children and families who contin-ue to primarily use a non-English language can indicate adherence to native culture and may have less access to high paying employment opportunities.
El Dorado County The total English learner enrollment has increased steadily over the past two decades. From 1990 to 2009 the total increase in English learners was 161 percent compared to a 53 percent increase in California. The sharp increase seems to have flattened out somewhat as there was a 2.2 percent increase from the 2007-2008 scchool year to the 2008-2009 school year.
10.4 English Learners Enrollment
Year Enrollment1990-1991 711 1991-1992 825 1992-1993 977 1993-1994 1,064 1994-1995 1,127 1995-1996 1,252 1996-1997 1,352 1997-1998 1,305 1998-1999 1,352 1999-2000 1,187 2000-2001 1,294 2001-2002 1,495 2002-2003 1,537 2003-2004 1,501 2004-2005 1,450 2005-2006 1,464 2006-2007 1,565 2007-2008 1,814 2008-2009 1,854 Source: California Department of EducationCreated by: Center for Economic Development, California State University, Chico
English Learners Enrollment
0200400600800
1,0001,2001,4001,6001,8002,000
1990-91 1993-94 1996-97 1999-00 2002-03 2005-06 2008-09
English Learners Enrollment

139 www.cedcal.com
10. Education
Overview The SAT is designed to measure verbal and math-ematical reasoning abilities that are related to success-ful performance in college, according to the California Department of Education. Academic, demographic, and socioeconomic factors can affect the results of the test scores. The largest factor affecting average SAT scores is the number of students taking the test; as the number of test takers increases, scores tend to fall.
Students are required to take the test only if they plan on attending a college that requires it for admis-sion. This is the primary reason the SAT is not an accurate measure of the effectiveness of school curriculum or teaching. If a small percentage of students from a school take the test, then the average score could reflect selective testing; a school may encourage only those students who are identified as high achievers to participate. For this reason, the percentage of students who took the exam is provided. The highest possible score a student can receive is 2400.
NOTE: Average SAT scores are only reported for graduating seniors. The scores from
students who take the SAT as juniors are included with their graduating class.
El Dorado County Average SAT scores in the county are significantly higher than those in California. During the 2008-2009 school year, the average score was 1594 compared to 1492 in the state as a whole.
School Year
County % of Students who
took SAT
County Average
SAT Scores
CA % of Students who
took SATCA Average SAT Scores
2005-06 34.4% 1613 36.7% 14982006-07 34.7% 1583 36.9% 14892007-08 35.4% 1580 35.9% 14932008-09 37.2% 1594 34.7% 1492
Average SAT Scores (out of 2400)
Created by: Center for Economic Development, California State University, Chico
Source: California Department of Education
1,4201,4401,4601,4801,5001,5201,5401,5601,5801,6001,6201,640
2005-06 2006-07 2007-08 2008-09
Average SAT Scores (out of 2400)El Dorado CountyCalifornia
10.5 Average SAT Scores

140
2010-11 Economic & Demographic Profile
Overview The purpose of the Academic Performance Index is to measure the academic performance and progress of schools. It is a reliable measure of academic performance and progress because it uses a test that every student is required to take yearly beginning in second grade and continuing through eleventh grade. The base year for a school’s API result is 2006. These results will be used to monitor academic growth.
The 2006 base API incorporates the results of school performance in California’s Standardized Testing and Reporting (STAR) program, the California High School Exit Examination (CAHSEE), and the California Alternate Performance Assessment (CAPA). The API is calculated on a scale from 200-1000, using individual student performance on four different tests.
The State Board of Education adopted a perfor-mance target of 800 for the 1999 API. This target will serve as an interim statewide target until state perfor-mance standards are adopted. The annual growth rate target for schools is equal to 5 percent of the distance between a school’s API and the interim state perfor-mance target of 800. Schools that receive an API less than 800 have a minimum target of a one-point increase. Schools that meet or exceed the interim target must maintain an API of 800.
The California Department of Education did not calculate API scores for schools with less than 100 students with valid Stanford 9 test scores, or county administered, alternative, continuation, independent, or community day schools.
Combined with SAT scores, API scores can indi-cate either the learning ability of children in the commu-nity, or measure the effect of broader social or economic maladies in the community on children.
It is also important to keep track of a school’s API scores because federal No Child Left Behind includes provisions allowing the state to assume more financial and administrative control over local schools that do not make the required improvements in test scores toward a national benchmark.
El Dorado County El Dorado County’s average API has been steadily increasing since 2000. As stated, the goal for county schools is to make an annual minimum increase that is equal to 5 percent of the differance between the school or county’s API and 800. El Dorado County has reached the State Board of Educations’s performance target each year since 2006.
10.6 Academic Performance Index (API)
Year Average API 1 Year Change2000 758 n/a2001 765 1.0 %2002 753 - 1.5 %2003 777 3.1 %2004 780 0.4 %2005 795 1.9 %2006 807 1.5 %2007 818 1.3 %2008 825 0.8 %2009 837 1.5 %
Average County API
Source: California Department of EducationCreated by: Center for Economic Development, California State University, Chico

141 www.cedcal.com
10. Education
700720740760780800820840860
2000 2002 2004 2006 2008
Average C ounty API El Dorado County

142
2010-11 Economic & Demographic Profile

143 www.cedcal.com
11. Crime
Crime rate statistics include information on crimes reported, staffing of the criminal justice system, and the probation caseload. Interpretation of crime statistics is difficult because they may be indicative of any number of local conditions and attitudes, both negative and posi-tive. An above average rate of reported crime in an area can be a direct reflection of social problems in a com-munity. It can also indicate a greater willingness within the community to report crime, perhaps due to a more cooperative relationship between local law enforcement and the citizens. The adequacy of local law enforcement cannot be determined by the information presented in this section.
In this section:
11.1 Reported Crime & Crime Rates . . . . . . . . . . 144
11.2 Criminal Justice Personnel . . . . . . . . . . . . . . 147
11.3 Crime Expenditures . . . . . . . . . . . . . . . . . . . . 149
11.4 Probation Caseload . . . . . . . . . . . . . . . . . . . . 151
11. Crime

144
2010-11 Economic & Demographic Profile
Overview Crime counts are a summation of crimes reported to local law enforcement agencies. They include misde-meanor and felony reports, but not infractions such as traffic violations. Reported crimes are counted whether or not the criminal is apprehended.
The crime rate is the number of crimes committed per 100,000 people, and includes both violent and prop-erty crimes.
Crime rate data can be used to determine whether the amount of crime in a given area is increasing or decreasing, and also to show how crime rates from vari-ous areas compare to each other. Crime is an important factor in terms of an area’s quality of life. An area with a high crime rate is usually a much less attractive place to live than one with a low crime rate. While it is impos-sible to predict when or where a crime will occur, indi-viduals and communities can help with prevention by taking note of patterns and trends collected by legitimate agencies.
Crime rates can rise and fall with increasing or decreasing incidence of crime, but rates could also change if more or fewer crimes are reported to local law enforcement agencies. Therefore, careful analysis is needed when evaluating change in crime rates.
El Dorado County There were 2,027 property crimes and 451 violent crimes in El Dorado County in 2008. The crime rate in the county in 2008 was 14 crimes per 1,000 people, which reflects no significant change in the number of crimes per 1,000 from the preceding year.
11.1 Reported Crime & Crime Rates
YearCounty property
crime rateCounty violent
crime rateCounty
totalState property
crime rateState violent
crime rateState total
1999 10 4 14 17 6 23 2000 11 5 16 17 6 23 2001 12 4 16 18 6 24 2002 14 3 17 19 6 25 2003 14 3 16 19 6 25 2004 15 3 18 20 5 25 2005 13 3 16 20 5 25 2006 13 3 17 19 5 24 2007 11 3 14 18 5 23 2008 11 3 14 17 5 22
Created by: Center for Economic Development, California State University, ChicoSource: California Department of Justice, Criminal Justice Statistics Center
County and California Crime Rate per 1,000 Population

145 www.cedcal.com
11. Crime
Year HomicideForcible
rape RobberyAggravated
assault Total 1999 3 38 41 468 550 2000 3 37 29 633 702 2001 5 43 42 473 563 2002 4 41 50 429 524 2003 2 44 61 374 481 2004 2 45 59 361 467 2005 5 21 42 414 482 2006 4 40 51 519 614 2007 4 39 55 373 471 2008 8 29 60 354 451
Created by: Center for Economic Development, California State University, Chico
Violent Crimes
Source: California Department of Justice, Criminal Justice Statistics Center
Year BurglaryMotor
vehicle theftLarceny
over $400 Total 1999 820 209 534 1,563 2000 807 293 612 1,712 2001 1,059 271 602 1,932 2002 1,212 371 643 2,226 2003 1,009 446 811 2,266 2004 1,149 516 873 2,538 2005 1,010 518 780 2,308 2006 993 468 850 2,311 2007 958 297 774 2,029 2008 1,086 244 697 2,027
Property Crimes
Source: California Department of Justice, Criminal Justice Statistics CenterCreated by: Center for Economic Development, California State University, Chico

146
2010-11 Economic & Demographic Profile
0
1
2
3
4
5
6
7
1999 2000 2001 2002 2003 2004 2005 2006 2007 2008
Violent C rime Rate per 1,000 PopulationEl Dorado County
California
0
5
10
15
20
25
1999 2000 2001 2002 2003 2004 2005 2006 2007 2008
Property C rime Rate per 1,000 Population El Dorado County
California

147 www.cedcal.com
11. Crime
Overview Criminal justice personnel includes the law enforcement employees working in the different agen-cies as reported by the California Department of Justice. NOTE: The California Department of Justice relies on local agencies to report the number of criminal justice personnel in their area every year.
Criminal justice personnel information helps iden-tify the types of criminal justice employment within a county. Counties with higher incidence of crime need greater numbers of criminal justice personnel to handle the caseload. If crime is rising and the number of crimi-nal justice personnel is not keeping pace, then local per-sonnel are likely handling greater workloads.
El Dorado County The total number of criminal justice personnel in El Dorado County increased slightly between 2007 and 2008. There was an increase of 34 sheriff’s department person-nel in the same year. In the state of California, the total number of law enforcement personnel increased from 210,797 in 2007 to 227,958 in 2008, according to the California Department of Justice.
YearPolice depts.
Sheriff's dept.
O ther law enforcement
Total law enforcement
Prosecution staff
Public defense staff
Court staff
1999 92 354 55 501 112 16 8 2000 96 376 59 531 115 17 8 2001 95 347 57 499 117 17 8 2002 97 372 10 479 56 18 9 2003 94 384 9 487 52 17 9 2004 96 376 9 481 50 17 9 2005 89 393 9 491 51 19 9 2006 89 368 13 470 59 30 9 2007 86 372 12 470 73 32 9 2008 89 406 11 506 64 35 9Source: California Department of Justice, Criminal Justice Statistics Center
Created by: Center for Economic Development, California State University, Chico
Criminal Justice Personnel
n/a: Data not reported by source
11.2 Criminal Justice Personnel
The following types of criminal justice personnel are shown:
Law enforcement or sworn officers and civil-ian employees in local law enforcement agen-cies, including city police and county sheriff’s departments
Prosecution or personnel involved in the pros-ecution of the accused
Public defense or personnel primarily respon-sible for representing those unable to hire a private lawyer
Trial courts or primary and auxiliary judges employed during trials

148
2010-11 Economic & Demographic Profile
0
100
200
300
400
500
1999 2000 2001 2002 2003 2004 2005 2006 2007 2008
C riminal Justice Personnel Police depts. Sheriff's dept.
00.5
11.5
22.5
33.5
4
2000 2001 2002 2003 2004 2005 2006 2007 2008
Law Enforcement Personnel per 1,000 PopulationEl Dorado CountyCalifornia

149 www.cedcal.com
11. Crime
Overview Expenditures for criminal justice programs in a county measure the amount of money allocated to local law enforcement each year. Criminal justice expendi-tures include the amount of money spent by a county in a fiscal year, according to the California Department of Justice. These expenses include employee salaries and benefits, as well as services and supplies. Capital expendi-tures (expenditures made to acquire, add to, or improve property, plant, and equipment) and construction and maintenance of structures are not included in the data.
NOTE: The California Department of Justice relies on local agencies to report criminal justice expenditures in their area. Local government expenditure reports may show different spending patterns on criminal justice line-items, which usually include capital expenditures. The data reported to the department should include some expenditures entered in administrative line items, as well.
The criminal justice expenditures sta-tistic is somewhat ambiguous because higher expenditures may imply a local problem with crime or a budgetary priority for prevention or prosecution of crimes. Evaluation must be included with trends in crimes and personnel.
NOTE: Criminal Justice Expenditures are not inflation adjusted.
El Dorado County In FY06, approximately $52.5 million was spent on criminal justice expenditures in El Dorado County. Those expenditures have increased $15.7 million since FY98. Between FY98 and FY07, public defense expenditures increased the most, with a 126 percent increase. This increase in expenditures was followed by
law enforcement expenditures (64 percent). Judicial expenditures (-4.4 percent) and prosecution expendi-tures (-0.3 percent) experienced a decrease over the same time period.
YearLaw
enforcement Judicial ProsecutionPublic
defense Total1998-99 $ 22,827 $ 5,970 $ 6,843 $ 1,148 $ 36,7881999-00 $ 22,714 $ 4,068 $ 7,372 $ 1,266 $ 35,4202000-01 $ 21,646 $ 4,112 $ 7,905 $ 1,312 $ 34,9752001-02 $ 24,596 $ 4,469 $ 4,349 $ 1,481 $ 34,8952002-03 $ 29,422 $ 4,723 $ 4,477 $ 1,677 $ 40,2992003-04 $ 30,863 $ 4,963 $ 4,673 $ 1,596 $ 42,0952004-05 $ 33,293 $ 5,773 $ 5,251 $ 1,826 $ 46,1432005-06 $ 38,251 $ 5,806 $ 5,914 $ 2,309 $ 52,2802006-07 $ 37,346 $ 5,706 $ 6,821 $ 2,597 $ 52,470
Criminal Justice Expenditures (Thousands)
Source: California Department of Justice, Criminal Justice Statistics CenterCreated by: Center for Economic Development, California State University, Chico
11.3 Crime Expenditures

150
2010-11 Economic & Demographic Profile
0
10,000
20,000
30,000
40,000
50,000
60,000
1998-99 2000-01 2002-03 2004-05 2006-07
C riminal Justice Expenditures (Thousands)
050
100150200250300350400
1998-99 2000-01 2002-03 2004-05 2006-07
C riminal Justice Expenditures Per C apita El Dorado CountyCalifornia

151 www.cedcal.com
11. Crime
Overview Probation allows people who have been convicted of a minor crime to serve time outside criminal justice facilities, performing various duties such as trash col-lection, park cleanup, and landscape maintenance of the surrounding community. Data is representative of December 31 of a given year.
Significant probation caseloads in a county can be indicative of minor criminal activity within the com-munity, a criminal justice system that relies on commu-nity-based rehabilitation programs, or any number of additional factors.
El Dorado County There were a total of 1,512 probation cases in El Dorado County in 2008, with 1,211 cases related to felony offenses (a decrease of 95 from the previous year) and 301 related to misdemeanors (an increase of 23 from the previous year).
YearFelony
O ffenseMisdemeanor
O ffense Total 1999 552 568 1,120 2000 541 562 1,103 2001 506 597 1,103 2002 613 706 1,319 2003 820 768 1,588 2004 929 748 1,677 2005 1,116 796 1,912 2006 1,494 184 1,678 2007 1,306 278 1,584 2008 1,211 301 1,512Source: California Department of Justice, Criminal Justice Statistics CenterCreated by: Center for Economic Development, California State University, Chico
County Probation Caseload
0
200
400
600
800
1,000
1,200
1,400
1,600
1999 2000 2001 2002 2003 2004 2005 2006 2007 2008
Probation C aseloadFelony Offense
Misdemeanor Offense
11.4 Probation Caseload

152
2010-11 Economic & Demographic Profile

COSUMNES RIVER FLOW AUGMENTATION PROJECT
2005 PROJECT DELIVERABLES
Prepared for:
Southeast Sacramento County Agricultural Water Authority The Nature Conservancy
Sacramento County Water Agency
Prepared by:
April 4, 2006

COSUMNES RIVER FLOW AUGMENTATION PROJECT
2005 PROJECT DELIVERABLES
Prepared for:
Southeast Sacramento County Agricultural Water Authority The Nature Conservancy
Sacramento County Water Agency
Prepared by:
9888 Kent Street Elk Grove, CA 95624
(530) 714-1801
April 4, 2006

REPORTS

COSUMNES RIVER FLOW AUGMENTATION PROJECT
PROJECT SUMMARY
Introduction
The Cosumnes River Flow Augmentation Project (Project) is being proposed by a Coalition of interests1 to provide supplemental flows to the Cosumnes River that will provide fish passage improvements for fall-run chinook salmon and for evaluation of groundwater recharge rates from the Cosumnes River channel. This project will be facilitated by releasing supplemental water from the Folsom South Canal into the Cosumnes River to pre-wet the river channel prior to the onset of natural fall flows in the lower reaches of the river. Figure 1 shows the project location and major features. The Project will provide critical information regarding the effectiveness of releasing supplemental water for local groundwater recharge and of supplementing the natural flow regime to restore a historical flow pattern for the improvement of fall-run chinook salmon passage.
The Cosumnes River is a keystone of fishery conservation efforts in the North Delta. The Anadromous Fish Restoration Program (AFRP), The Nature Conservancy (TNC), and the University of California, Davis (UCD), have sponsored numerous research projects on the health of the salmon fishery of the Cosumnes River. AFRP has also identified the Cosumnes as having potential for contributing to the fish doubling goals of the Central Valley Project Improvement Act (CVPIA). The AFRP has also set program objectives specifically directed at the Cosumnes River and the acquisition and restoration of fish habitat, primarily directed at improving passage and spawning habitat for fall-run chinook salmon.
The geologic setting and unregulated nature of the Cosumnes River has also made it a focus of regional water management strategies for Sacramento County, and particularly for the Southeast Sacramento County Agricultural Water Authority (SSCAWA). The SSCAWA, in partnership with the Sacramento County Water Agency (SCWA), the TNC and UCD are sponsoring a number of programs aimed at evaluating and developing a conjunctive use strategy that capitalizes on the natural geology of the region for groundwater recharge and surface water management.
1 The Coalition consists of the Sacramento County Water Agency, The Nature Conservancy, the Southeast Sacramento County Agricultural Water Authority (members include Omochumne-Hartnell Water District, Galt Irrigation District, and Clay Water District), the Fisheries Foundation of California, and the UCD Center for Integrated Watershed Science and Management.
ROBERTSON-BRYAN, INC. PAGE 1

Cosumnes River Flow Augmentation Project
Figure 1. Project Area.
Project Overview The Project will release up to 5,000 acre-feet (af) of water into the Cosumnes River from an existing turnout of the Folsom South Canal. The objectives are to 1) improve upstream fall migration of salmon, and 2) to evaluate groundwater recharge from the Cosumnes River channel. The first objective will be accomplished by allowing the Cosumnes to connect to tidewater earlier in the fall and sustaining non-barrier flow conditions after initial connection. The second objective will be accomplished by making controlled releases into the river channel and monitoring the surface water–groundwater exchange processes along the length of the channel.
Project Water Supply
The long-term water supply for the Project will be provided by Sacramento County Water Agency (SCWA) using water developed from the Eastern Sacramento County Replacement Water Supply Project (RWSP). The RWSP is intended to provide for the beneficial use of remediated water generated by groundwater extraction and treatment (GET) facilities of the Aerojet / Boeing groundwater cleanup project mandated by the Regional Water Quality Control Board.
ROBERTSON-BRYAN, INC. PAGE 2

Cosumnes River Flow Augmentation Project
Currently, GET facilities are discharging approximately 11,600 acre-feet annually (afa) to Alder Creek, which discharges to Lake Natoma, and 8,600 afa to Buffalo Creek, which discharges to the American River below Lake Natoma. None of the current discharges are being reclaimed for beneficial uses. At full development the RSWP will provide 30,465 afa of water for potable use and 5,000 afa to the CRFAP. Remediated water from the GET facilities will be discharged to the American River via various creeks and drainages and rediverted from the American and Sacramento River at the following locations:
Discharge Points: Diversion Points:Alder Creek to Lake Natoma(15,951 afa) Folsom South Canal to American States Water
Company (5,000 afa)
Buffalo Creek (6,693 afa) Folsom South Canal to Cosumnes River (5,000 afa)
Boyd Station Channel (8,798 afa) Fairbairn Diversion to City of Sacramento (5,000)
Local storm drain (3,709 afa) Freeport Diversion to SCWA (20,465 afa)
Cordova Drainage Channel (323 afa) Project Operations
The Project is designed to create river conditions similar to what might have been experienced prior to the reduction of groundwater levels underlying the Cosumnes River between Highway 16 and the Cosumnes River Preserve (downstream of Twin Cities Road). The Project is not intended to create a hydraulic connection with the tidewater area of the Cosumnes River and the Delta before it naturally occurs from run-off generated by fall precipitation in the Sierra Nevada foothills.
A preliminary flow-release schedule (Figure 2) has been develop that meets the following criteria: (1) pre-wet the greatest length of channel possible, and (2) maintain sufficient water in reserve for augmenting river flow to sustain the connection with tidewater during the optimal salmon migration period of November 1 to December 31.
Channel pre-wetting flows will begin on October 15 and continue through December 31. By beginning flow releases on October 15, the Cosumnes River channel would receive approximately 2,000 af of water before the river typically connects with tidewater (mid-November).
Water not used for channel pre-wetting will be held in reserve and used to supplement natural flows through December 31 to eliminate stranding conditions during the migration period. Flow augmentation releases will be made when Cosumnes River flows fall below that required to maintain upstream migration conditions, estimated to be 65–70 cubic feet per second (cfs), measured at the U.S. Geological Survey (USGS), Michigan Bar gauging station. Historical flow record for the Cosumnes River, with consideration
ROBERTSON-BRYAN, INC. PAGE 3

Cosumnes River Flow Augmentation Project
of today’s groundwater conditions, indicates that supplement releases to maintain migration conditions would be needed in about 93% of the years.
0
10
20
30
40
50
60
70
80
90
100
1-Oct 11-Oct 21-Oct 31-Oct 10-Nov 20-Nov 30-Nov 10-Dec 20-Dec 30-Dec
Cha
nnel
Pre
-wet
ting
Flow
Rel
ease
s (c
fs)
Figure 2. Cosumnes River channel pre-wetting releases from the Folsom South Canal.
Monitoring Program
Escapement and Out-Migration Monitoring
The Fisheries Foundation of California (FFC) will conduct Escapement and Out-Migration Monitoring. The FFC will either be funded through the SSCAWA, if the SSCAWA and Coalition partners develop the funding for this task, or the FFC may fund this task directly.
This task will evaluate the adequacy of flows for salmon passage by life stage. Flow needs will focus on the lower critical passage reach, below Folsom South Canal, to above tidewater (Twin Cities Road crossing) where passage presents the biggest problem. The duration and rate of flow needed to allow the run to proceed upstream and successfully reach spawning grounds will be a focused evaluation building on information gathered in previous years. The duration and rate of flow needed to maintain a successful migration pattern will be determined through adaptive management of flow releases from the Folsom South Canal. The FFC will also conduct out-migration surveys to provide information on the success of fall spawning in the Cosumnes River.
Groundwater-Surface Water Interaction Monitoring
Professor Graham Fogg, Ph.D., of the Land, Air, and Water Resources and Geology Department at UCD, will lead the Groundwater–Surface Water Interaction Monitoring
ROBERTSON-BRYAN, INC. PAGE 4

Cosumnes River Flow Augmentation Project
Task. UCD will either be funded through the SSCAWA, if the SSCAWA and Coalition partners develop the funding for this task, or UCD may fund this task directly.
Ongoing work on hydrogeology of the Cosumnes River aquifer system has shown that the river is the major source of recharge to the local groundwater system and that most of this recharge probably occurs over a small percentage of the channel between Michigan Bar and Twin Cities Road. Successful management of river flows to sustain salmon migration in the fall requires more detailed information on river–aquifer water exchange along this entire reach. This more detailed information can be obtained through careful hydrologic monitoring before and after a controlled flow release experiment, wherein a known amount of water is diverted into the channel near Folsom South Canal. Instrumentation deployed for such an experiment will also be useful for studying interaction between groundwater and surface water in the system on a continuous basis.
ROBERTSON-BRYAN, INC. PAGE 5

COSUMNES RIVER FLOW AUGMENTATION PROJECT
2005 PILOT PROJECT OPERATION PLAN
Introduction
The Cosumnes River Flow Augmentation Project (Project) is being proposed by a coalition of interests1 to provide supplemental flows to the Cosumnes River that will provide fish passage improvements for fall-run chinook salmon and for evaluation of groundwater recharge rates from the Cosumnes River channel. This project will be facilitated by releasing supplemental water from the Folsom South Canal into the Cosumnes River to pre-wet the river channel prior to the onset of natural fall flows in the lower reaches of the river. Figure 1 shows the project location and major features.
The pilot project phase of the Project is aimed at implementing the releases to the Cosumnes River in the fall of 2005, to evaluate the effectiveness and adequacy of project operations. Information gained in during the pilot project phase will be used to refine long-term project operations planning. The pilot project will have a duration of only one season (October 2005 through January 2006) for which a temporary non-permanent water supply is being requested from the U.S. Bureau of Reclamation (Reclamation).
Project Objectives
The pilot project phase of this Project proposed to release up to 5,000 acre-feet (af) of water into the Cosumnes River from an existing turnout of the Folsom South Canal. The objectives are to: 1) improve upstream fall migration of salmon, and 2) evaluate groundwater recharge from the Cosumnes River channel. The first objective will be accomplished by allowing the nature flows of the Cosumnes River to connect to tidewater earlier in the fall, and sustaining non-barrier flow conditions after initial connection. The second objective will be accomplished by making controlled releases into the river channel and monitoring the surface water–groundwater exchange processes along the length of the channel.
The Cosumnes River is a keystone of fishery conservation efforts in the North Delta. The Anadromous Fish Restoration Program (AFRP), The Nature Conservancy (TNC), and the University of California, Davis (UCD), have sponsored numerous research projects on the health of the salmon fishery of the Cosumnes River. AFRP has also identified the
1 The Coalition consists of the The Nature Conservancy, the Southeast Sacramento County Agricultural Water Authority (members include Omochumne-Hartnell Water District, Galt Irrigation District, and Clay Water District), the Sacramento County Water Agency (SCWA), the Fisheries Foundation of California, and the UCD Center for Integrated Watershed Science and Management.
ROBERTSON-BRYAN, INC. PAGE 1 JULY 28, 2005

Cosumnes River Flow Augmentation Project
Figure 1. Project Area.
Cosumnes as having potential for contributing to the fish doubling goals of the Central Valley Project Improvement Act (CVPIA). The AFRP has also set program objectives specifically directed at the Cosumnes River and the acquisition and restoration of fish habitat, primarily directed at improving passage and spawning habitat for fall-run chinook salmon.
The geologic setting and unregulated nature of the Cosumnes River has also made it a focus of regional water management strategies for Sacramento County, and particularly for the Southeast Sacramento County Agricultural Water Authority (SSCAWA). The SSCAWA, in partnership with the Sacramento County Water Agency (SCWA), the TNC and UCD are sponsoring a number of programs aimed at evaluating and developing a conjunctive use strategy that capitalizes on the natural geology of the region for groundwater recharge and surface water management.
Pilot Project Water Supply
The Project proponents are requesting the assistance of the Reclamation in identifying a source of surplus or environmental water for implementation of this pilot project. The Project proponents make this request in light of the surplus water conditions that exist
ROBERTSON-BRYAN, INC. PAGE 2 JULY 28, 2005

Cosumnes River Flow Augmentation Project
within the State this year. This request is aimed at acquiring a one-time commitment of 5,000 ac-ft in the fall of 2005, as described in the following sections. The Project proponents also understand that should Reclamation identify and provide water for this pilot project that this supply will be for one year only. The intent of the pilot project is to allow the Project proponents and Reclamation to identify and address issue that will be faced under long-term implementation of the Project. The Project proponents are committed to addressing the concerns raised by Reclamation regarding the source of water identified for the long-term implementation of the Project.
Pilot Project Operations
The Project is designed to create river conditions similar to what might have been experienced prior to the reduction of groundwater levels underlying the Cosumnes River between Highway 16 and the Cosumnes River Preserve (downstream of Twin Cities Road). The Project is not intended to create a hydraulic connection with the tidewater area of the Cosumnes River and the Delta before it naturally occurs from run-off generated by fall precipitation in the Sierra Nevada foothills.
A preliminary flow-release schedule (Figure 2) has been developed that meets the following criteria: (1) pre-wet the greatest length of channel possible, and (2) maintain sufficient water in reserve for augmenting river flow to sustain the connection with tidewater during the optimal salmon migration period of November 1 to December 31.
Channel pre-wetting flows will begin on October 15 and continue through December 31. By beginning flow releases on October 15, the Cosumnes River channel would receive approximately 2,000 af of water before the river typically connects with tidewater (mid-November).
Water not used for channel pre-wetting will be held in reserve and used to supplement natural flows through December 31 to eliminate stranding conditions during the migration period. Flow augmentation releases will be made when Cosumnes River flows fall below that required to maintain upstream migration conditions, estimated to be 65–70 cubic feet per second (cfs), measured at the U.S. Geological Survey (USGS), Michigan Bar gauging station. Historical flow record for the Cosumnes River, with consideration of today’s groundwater conditions, indicates that supplement releases to maintain migration conditions would be needed in about 93% of the years.
ROBERTSON-BRYAN, INC. PAGE 3 JULY 28, 2005

Cosumnes River Flow Augmentation Project
0
10
20
30
40
50
60
70
80
90
100
1-Oct 11-Oct 21-Oct 31-Oct 10-Nov 20-Nov 30-Nov 10-Dec 20-Dec 30-Dec
Cha
nnel
Pre
-wet
ting
Flow
Rel
ease
s (c
fs)
Figure 2. Cosumnes River channel pre-wetting releases from the Folsom South Canal.
Monitoring Program
Escapement and Out-Migration Monitoring
The Fisheries Foundation of California (FFC) will conduct Escapement and Out-Migration Monitoring. The FFC will either be funded through the SSCAWA, if the SSCAWA and Coalition partners develop the funding for this task, or the FFC may fund this task directly.
This task will evaluate the adequacy of flows for salmon passage by life stage. Flow needs will focus on the lower critical passage reach, below Folsom South Canal, to above tidewater (Twin Cities Road crossing) where passage presents the biggest problem. The duration and rate of flow needed to allow the run to proceed upstream and successfully reach spawning grounds will be a focused evaluation building on information gathered in previous years. The duration and rate of flow needed to maintain a successful migration pattern will be determined through adaptive management of flow releases from the Folsom South Canal. The FFC will also conduct out-migration surveys to provide information on the success of fall spawning in the Cosumnes River.
Groundwater-Surface Water Interaction Monitoring
Professor Graham Fogg, Ph.D., of the Land, Air, and Water Resources and Geology Department at UCD, will lead the Groundwater–Surface Water Interaction Monitoring Task. UCD will either be funded through the SSCAWA, if the SSCAWA and Coalition partners develop the funding for this task, or UCD may fund this task directly.
ROBERTSON-BRYAN, INC. PAGE 4 JULY 28, 2005

Cosumnes River Flow Augmentation Project
Ongoing work on hydrogeology of the Cosumnes River aquifer system has shown that the river is the major source of recharge to the local groundwater system and that most of this recharge probably occurs over a small percentage of the channel between Michigan Bar and Twin Cities Road. Successful management of river flows to sustain salmon migration in the fall requires more detailed information on river–aquifer water exchange along this entire reach. This more detailed information can be obtained through careful hydrologic monitoring before and after a controlled flow release experiment, wherein a known amount of water is diverted into the channel near Folsom South Canal. Instrumentation deployed for such an experiment will also be useful for studying interaction between groundwater and surface water in the system on a continuous basis.
ROBERTSON-BRYAN, INC. PAGE 5 JULY 28, 2005

COSUMNES RIVER FLOW AUGMENTATION PILOT PROJECT
MONITORING PLAN
Prepared for:
Southeast Sacramento County Agricultural Water Authority The Nature Conservancy
Sacramento County Water Agency
Prepared by:
September 26, 2005

COSUMNES RIVER FLOW AUGMENTATION PILOT PROJECT
MONITORING PLAN
Prepared for:
Southeast Sacramento County Agricultural Water Authority The Nature Conservancy
Sacramento County Water Agency
Prepared by:
9888 Kent Street Elk Grove, CA 95624
(530) 714-1801
September 26, 2005

Cosumnes River Flow Augmentation Pilot Project Robertson-Bryan, Inc. Draft Monitoring Plan
TABLE OF CONTENTS
Section page 1 INTRODUCTION.................................................................................................................................................1 2 PROJECT BACKGROUND ................................................................................................................................2 3 MONITORING PLAN ELEMENTS......................................................................................................................3
Task 1 – Flow Release Scheduling and Management .......................................................................... 4 Flow Schedule......................................................................................................................... 4 Flow-Monitoring Locations .................................................................................................... 6
Task 2 –Fall-run Chinook Salmon Run Size (Escapement) and Juvenile Downstream Migration (Emigration) Monitoring.......................................................................................................................... 7
Run Size (Escapement) Surveys ............................................................................................. 7 Juvenile Downstream Migration (Emigration) Surveys ......................................................... 8
Task 3 – Groundwater-Surface Water Interaction Monitoring............................................................. 9 Channel Instrumentation....................................................................................................... 10
Task 4 – Project Reporting ................................................................................................................... 10 4 LITERATURE CITED........................................................................................................................................11
List of Figures
Figure 1. Location map for the Cosumnes River Flow Augmentation Pilot Project. ...................................... 2
Figure 2. Planned Cosumnes River channel pre-wetting releases from the Folsom South Canal. ................ 5

Cosumnes River Flow Augmentation Pilot Project 1 Robertson-Bryan, Inc. Draft Monitoring Plan
1 INTRODUCTION
A coalition of interests1 supports and developed the Cosumnes River Flow Augmentation Pilot Project (Project) to provide supplemental flows to the Cosumnes River that will improve fish passage for fall-run chinook salmon (Oncorhynchus tshawytscha) and provide an opportunity to evaluate the interaction of groundwater and surface water in the Cosumnes River channel. The objectives of the Project are twofold:
• To improve fall-run chinook salmon migration conditions by: (1) allowing the Cosumnes River to connect to tidewater earlier in the fall, and (2) sustaining surface flow continuity within the Cosumnes River after its initial connection.
• To evaluate the rate of groundwater recharge from the river channel between the Folsom South Canal and Twin Cities Road to better guide future groundwater management and environmental restoration efforts along the Cosumnes River corridor.
The Project will release up to 5,000 acre-feet of water into the Cosumnes River from an existing turnout of the Folsom South Canal. The project constitutes the first year of augmenting Cosumnes River flows to meet the above objectives. It is the intent of the coalition of interests that are supporting the Project to continue the Pilot Project through 2010, after which it will become an ongoing annual operation. Hence, this first year effort largely constitutes a demonstration effort to help the Project proponents develop and improve the long-term management of this action. The U.S. Bureau of Reclamation (Reclamation) and the B2 Environmental Water Program will provide the water supply for the Project during its demonstration phase.
This Monitoring Plan identifies the monitoring programs necessary to evaluate the effectiveness of the Project. Monitoring will include:
1) flow-release scheduling performed by Robertson-Bryan, Inc. (RBI), under contract with the Southeast Sacramento County Agricultural Water Authority (SSCAWA);
2) passage of low-flow migration barriers by immigrating adult fall-run salmon and location and timing of spawning by the Fisheries Foundation of California (FFC), under contract with the Anadromous Fish Restoration Program (AFRP); and
1 The Coalition consists of the Sacramento County Water Agency (SCWA), The Nature Conservancy (TNC), the Southeast Sacramento County Agricultural Water Authority (SSCAWA) (members include Omochumne-Hartnell Water District, Galt Irrigation District, and Clay Water District), the Fisheries Foundation of California (FFC), and the UCD Center for Integrated Watershed Science and Management (UCD).

Cosumnes River Flow Augmentation Pilot Project 2 Robertson-Bryan, Inc. Draft Monitoring Plan
3) groundwater recharge quantification performed by the Center for Integrated Watershed Science and Management at the University of California, Davis (UCD).
2 PROJECT BACKGROUND
The Cosumnes River corridor provides habitat for a number of special-status plants and animals and is considered an ecological area of statewide importance. The Cosumnes River is the last unregulated major river draining the western slope of the Sierra Nevada having no major dams (Figure 1). Historically, the lower reach of the river supported a matrix of riparian habitats, freshwater marshes, and large tracts of valley oak woodlands.
Figure 1. Location map for the Cosumnes River Flow Augmentation Pilot Project. Recent field and modeling efforts conducted by UCD and others indicate that extensive regional and local groundwater withdrawals over the past 50 years substantially lowered groundwater tables and reduced the base flow of the Cosumnes River and its major tributaries. The Cosumnes River now frequently ceases to flow during summer months, stays dry longer into the fall, and has a dry river bed over an increasingly longer reach compared to historical conditions.

Cosumnes River Flow Augmentation Pilot Project 3 Robertson-Bryan, Inc. Draft Monitoring Plan
Diminished surface flows have reduced the quality and quantity of aquatic and riparian habitats and the species associated with those habitats.
The Cosumnes River is a cornerstone of fishery conservation efforts in the North Delta. The Anadromous Fish Restoration Program (AFRP) sponsored research on surface flows in the Cosumnes River, the relationship of surface flows to groundwater conditions, and the health of the salmon fishery. The AFRP also identified the Cosumnes as having potential for contributing to the fish doubling goals of the Central Valley Project Improvement Act (CVPIA). The AFRP work plan for Fiscal Year 2004 identifies program objectives specifically directed at the Cosumnes River and the acquisition and restoration of fish habitat, primarily directed at improving passage and spawning habitat for fall-run chinook salmon. In addition, the Nature Conservancy and its partners established the Cosumnes River Preserve on approximately 30,000 acres upstream of the river’s confluence with the Mokelumne River. The Preserve provides protection for important biological resources associated with the Cosumnes River through land conservation, habitat restoration, and research.
The size of the Cosumnes River’s fall-run chinook salmon population has declined over the past several decades, which has been related to a decline in fall streamflow in the lower Cosumnes River and a shortage of spawning and rearing habitat. Adult fall-run chinook salmon generally migrate up the river with the first fall rains, sometimes becoming stranded by receding flows following the initial storms. Groundwater pumping in the lower basin increased beginning in the 195’s, resulting in reduced groundwater levels, such that the river is now disconnected from the regional groundwater table. Summer and fall flow in the lower river below Highway 16 is generally zero, leaving a barren channel of dry substrate. Above Highway 16, in the Sierra foothills, the stream is perennial with some minimal flow even in late summer. Most of the spawning occurs in the upper 10 miles of the reach extending from Latrobe Falls (a natural barrier to upstream passage of anadromous fish) downstream to Meiss Road at Sloughhouse, several miles below the Highway 16 crossing. Some additional spawning occurs below Meiss Road for several miles to the town of Wilton (observations from FFC 2002 survey). The problem for chinook salmon has been lack of fall flows between Highway 16 and tidewater to provide upstream passage to spawning grounds in the perennial flow reach in the foothills. In some years the river remained disconnected with a dry riverbed between tidewater and the spawning grounds (about 20 miles) during the entire fall spawning season.
3 MONITORING PLAN ELEMENTS
Information developed by the monitoring efforts will be used to refine Project operations and to assist in the development of a long-term program for improvement of fall-run chinook salmon

Cosumnes River Flow Augmentation Pilot Project 4 Robertson-Bryan, Inc. Draft Monitoring Plan
migration conditions in the Cosumnes River. The following section describes the approaches that will be used to:
1. monitor and adaptively manage releases from the Folsom South Canal to the Cosumnes River to achieve Project objectives;
2. monitor the abundance, distribution, and lifestage-specific migration timing of fall-run chinook salmon in the Cosumnes River and compare these data to historical data to determine Project effectiveness; and
3. monitor groundwater-surface water interactions to develop a better understanding of the rate and locations of groundwater affected from the river channel.
TASK 1 – FLOW RELEASE SCHEDULING AND MANAGEMENT
The SSCAWA will take the lead in scheduling and managing releases from the Folsom South Canal. On behalf of the SSCAWA, RBI will facilitate the task of flow release scheduling and management. RBI also will coordinate with all members of the Coalition, Reclamation, and permitting and other regulatory authorities regarding the flow releases, as needed. RBI also will also perform field measurements of flows to monitor the effect of releasing channel-wetting flows and regulate flow releases as needed to meet the multiple objectives of the Project.
Flow Schedule
The Project is designed to create river conditions similar to what might have been experienced before the lowering of groundwater levels underlying the Cosumnes River between Highway 16 and the Cosumnes River Preserve (downstream of Twin Cities Road). The Project is not intended to create a hydraulic surface-flow connection with the Mokelumne River and the Delta before it would naturally occur from run-off generated by fall precipitation in the Sierra Nevada foothills (i.e., following the first few substantial storm events).
The flow-release schedule is designed to meet the following operational objectives: (1) to pre-wet the channel (i.e., saturate the channel’s underlying substrates), and (2) maintain sufficient water in reserve for purposes of augmenting the Cosumnes River flow in the event additional water is needed to sustain surface water flows to tidewater during the peak salmon migration period during November and December. Figure 2 shows flow-release schedule developed for the demonstration phase of the Project. This schedule provides a framework for managing releases; however, flows may change through adaptive management to maximize the benefits of the available water supply. Channel pre-wetting releases will be made until natural flows sustain a surface-flow connection to tidewater. Studies indicate that in most years, a minimum flow of 75 cfs is required at Michigan Bar to create a connection to tidewater, when the river channel is

Cosumnes River Flow Augmentation Pilot Project 5 Robertson-Bryan, Inc. Draft Monitoring Plan
properly wetted. Therefore, pre-wetting releases from the Folsom South Canal will likely stop once flows measured at Michigan Bar reach 75 cfs.
Once surface flows connect to tidewater as a result of pre-wetting and natural flows, RBI and Fisheries Foundation will monitor river conditions to ensure that upstream passage is maintained free of low-flow barriers. In the event that flows measured at Michigan Bar fall below 75 cfs, augmentation releases will likely begin to prevent stranding of adult salmon in the river reach between the Folsom South Canal and tidewater, with releases to maintain a minimum flow of 75 cfs at Blodgett Dam, immediately downstream of the canal. RBI will evaluate the adequacy of this flow through field measurements and observation of known, low-flow barriers, and make changes to canal releases as appropriate.
0
10
20
30
40
50
60
70
80
90
100
1-Oct 11-Oct 21-Oct 31-Oct 10-Nov 20-Nov 30-Nov 10-Dec 20-Dec 30-Dec
Chan
nel P
re-w
ettin
g Fl
ow R
elea
ses
(cfs
)
Figure 2. Planned Cosumnes River channel pre-wetting releases from the Folsom South Canal. The following additional operational criteria will govern releases to achieve Project objectives.
1. Channel pre-wetting flows will be released from the Folsom South Canal beginning on or about October 15, and continue until natural runoff is predicted to create a surface-flow connection with tidewater.
2. The flow-release schedule represents a proposed maximum rate of release. Release rates will be modified, as necessary, to prevent channel erosion at the outlet facility, increase the extent of channel wetting, or improve fish passage conditions.
3. The rate of release of channel-wetting flows will be managed to avoid prematurely creating a surface-flow connection to tidewater. In the event that either the rate of channel wetting releases or a combination of channel wetting releases plus natural run-off creates a connection, the rate of release from the Folsom South Canal will be reduced to avoid an “unnatural” connection.

Cosumnes River Flow Augmentation Pilot Project 6 Robertson-Bryan, Inc. Draft Monitoring Plan
4. Water not released for channel wetting purposes will be credited to the volume of water allocated for flow augmentation purposes. During most years, the Cosumnes River connects around mid-November and, therefore, will not require the use of the entire 5,000 acre-feet. Water not used for channel pre-wetting will be allocated for surface-flow augmentation following initial connection to tidewater.
5. The flow-release schedule for channel pre-wetting and the volume of water for flow augmentation will be re-evaluated and modified based on results of Project implementation, research findings, and/or coordination with other projects that provide mutually acceptable benefits.
By beginning flow releases on October 15, the Cosumnes River channel would receive approximately 2,400 acre-feet of water prior to the time the river typically has surface flow continuity to tidewater (mid-November). To the extent that water allocated for channel pre-wetting is not required for that purpose, it would be held in reserve and used for sustaining surface-flow continuity during salmon migration or, if excess water is available, for enhancing critical habitat along the Cosumnes River or its tributaries.
Flow-Monitoring Locations
Monitoring flows in the Cosumnes River resulting from natural and/or released flows will require constant field monitoring and reporting during the October 15 through December 31 period. RBI will conduct flow and temperature measurements at two-day intervals at the following five locations along the river (Figure 1) to determine the progress of channel-wetting flows and to determine the need to change Cosumnes River releases from the Folsom South Canal:
1. Rooney Dam (RM 24) – approximately 1.1 miles upstream of the Folsom South Canal,
2. Blodgett Dam (RM 22.8) – approximately 500 feet downstream of the Folsom South Canal,
3. Elk Grove Hop Ranch (RM 16.2) – approximately 6.7 miles downstream of the Folsom South Canal,
4. Mahon Ranch (RM 11.5) – approximately 11.4 miles downstream of the Folsom South Canal,
5. Box Culvert Structure (Oneto Property; RM 6.5) – 16.4 miles downstream of the Folsom South Canal.
Flows from the Michigan Bar USGS gauging station (Figure 1), and precipitation forecasts, will be reviewed daily to assist in managing flow releases.

Cosumnes River Flow Augmentation Pilot Project 7 Robertson-Bryan, Inc. Draft Monitoring Plan
TASK 2 – FALL-RUN CHINOOK SALMON RUN SIZE (ESCAPEMENT) AND JUVENILE DOWNSTREAM MIGRATION (EMIGRATION) MONITORING
This task will evaluate the effects of the Project on adult and juvenile fall-run chinook salmon migration. Flow needs will focus on the lower critical passage reach, from Folsom South Canal to tidewater, where low-flow barriers have historically existed. The duration and rate of river flow needed at Blodgett Dam immediately downstream of the Folsom South Canal to eliminate all downstream low flow barriers will be a focused evaluation building on information gathered in previous years. The duration and rate of flow needed to maintain successful upstream adult migration will be determined through adaptive management of flow releases from the Folsom South Canal.
Flow needs for successful juvenile downstream migration (emigration) will depend directly on the timing of emigration and the rate at which young salmon travel from the spawning/rearing reaches to tidewater. Screw trap sampling in the lower river in the winter and spring of 2003 indicated that salmon emigrate as fry, fingerlings, pre-smolts, and smolts. This Project’s findings, combined with information from past surveys, will be useful in determining flow needs for emigrating salmon. Emigration surveys will, indirectly, provide information on the success of fall spawning in the Cosumnes River.
Run Size (Escapement) Surveys
Field crews will closely monitor critical riffles and barriers during the October through December 2005 migration period to determine the success of adult upstream migration and to determine if additional flows need to be released from the Folsom South Canal to minimize delays in migration and stranding. Ultimately, the distribution of spawners and redds in the river in relation to critical riffles and weirs among and within years, and their relationship to flow, will be the primary indicator of migration delay or hindrance, as well as success of the run reaching spawning habitat in the upper river. Carcass and spawner surveys will be conducted weekly throughout the spawning season to determine spawning distribution, mortality of fish that fail to reach spawning grounds, and total run size or “escapement”. In addition, carcasses will be examined for the presence of markings (e.g., fin clips, coded wire tags) indicating whether fish are of hatchery origin. All observations of markings will be recorded for subsequent estimation of straying rates from other (e.g., Mokelumne River) systems. Two independent escapement estimates will be made for adult spawners: (1) carcass tag returns, and (2) redd counts. Estimates will be made of the proportion of the run that passes known barriers to spawning in the Cosumnes River between Latrobe Falls and Meiss Road. During the surveys, this section of the Cosumnes River will be divided into two reaches based on historic protocol and local access to survey crews: (1) Michigan Bar to Highway 16, and (2) Highway 16 to Meiss Road.

Cosumnes River Flow Augmentation Pilot Project 8 Robertson-Bryan, Inc. Draft Monitoring Plan
Total escapement and escapement relative to improved sites will be estimated using the standard Peterson Index (Lincoln Index) as employed by Snider and Reavis (2000):
N = MC/R
where,
• N = estimated spawning population,
• M = number of carcasses marked during the survey,
• C = total number of carcasses examined during the survey, and
• R = number of marked carcasses recovered during the survey.
The Petersen index is a consistent estimator of the population size under the following conditions:
1. Either or both of the samples is a simple random sample (i.e., all fish in the population have the same probability of being tagged or all fish have the same probability of being captured in the second sample, or tagged fish mix uniformly with untagged fish).
2. The population is closed.
3. There is no tag loss.
4. The tagging status of each fish is determined without error.
5. Tagging has no effect on the subsequent behavior of the fish.
Employing the Peterson Index under these circumstances has the potential of severe bias (Snider and Reavis 2000, Law 1994); particularly when fish numbers are low (Ricker 1975). If observations at the weirs suggest that the run size on a given year will be low, Bailey’s (1951) modification, which allows for multiple recaptures of marked fish, may be employed as an alternative. The equation for the Bailey’s Modification is:
N = M(C+1)/(R+1)
The parameters for Bailey’s Modification are the same as the Peterson Index described above.
Escapement also will be estimated by expanding total redd counts by a factor of 2.5. This information also will add to information gathered as part of the AFRP sponsored Project, “Flow Requirements for Salmon Passage, Cosumnes River, Sacramento County, California”.
Juvenile Downstream Migration (Emigration) Surveys
The FFC will continue to operate a screw trap during the winter-spring juvenile emigration period (typically mid-January to May, depending on initiation of spawning) at river mile 6.7 to

Cosumnes River Flow Augmentation Pilot Project 9 Robertson-Bryan, Inc. Draft Monitoring Plan
estimate emigration timing and production, relative to total escapement. As juvenile salmon migrate downstream, they will be intercepted at a five-foot rotary screw trap. The number of juvenile emigrants will be estimated by using a trap efficiency method of releasing marked fish upstream of the trap. Fish will be marked with Bismark Brown dye prior to being released 1 mile upstream of the trap. Trap efficiency tests will be conducted when numbers captured merit the effort (i.e., when more than 100 fish are available to be marked and released). Trap efficiency will be estimated using a modification to the Petersen estimate from the equation:
e = (R+1)/(M+1),
where:
• e is the estimated trap efficiency,
• M is the number of marked fish released upstream of the trap, and
• R is the number of marked fish recaptured.
Murphy et al. (1996) listed the standard assumptions of the Petersen method. The same assumptions apply in trap-efficiency experiments: (1) the population is closed, (2) all fish have the same probability of capture in the first sample, (3) marking does not affect catchability, (4) the second sample is either a simple random sample, or if the second sample is systematic, marked and unmarked fish mix randomly, (5) fish do not lose their marks, and (6) all recaptured marks are recognized. Specific performance measures will be juvenile abundance relative to total escapement and emigration timing.
These data will be used to monitor the overall success of emigration and determine rates of migration at various flow rates. Data collected under this monitoring plan will be incorporated with data collected in the fall of 2004 as part of the AFRP-sponsored Project, “Flow Requirements for Salmon Passage, Cosumnes River, Sacramento County, California”.
TASK 3 – GROUNDWATER-SURFACE WATER INTERACTION MONITORING
Professor Graham Fogg, Ph.D., of the Land, Air, and Water Resources and Geology Department at UCD, will lead the Groundwater–Surface Water Interaction Monitoring Task. UCD will either be funded through the SSCAWA, if the SSCAWA and Coalition partners develop the funding for this task, or UCD may fund this task directly.
Ongoing work on hydrogeology of the Cosumnes River aquifer system has shown that the river is the major source of recharge to the local groundwater system, and that most of this recharge probably occurs over a small percentage of the channel between Michigan Bar and Twin Cities Road. Successful management of river flows to sustain salmon migration in the fall requires

Cosumnes River Flow Augmentation Pilot Project 10 Robertson-Bryan, Inc. Draft Monitoring Plan
more detailed information on water exchange between the river and the underlying groundwater aquifer along this entire reach. This more detailed information can be obtained through careful hydrologic monitoring before and after a controlled flow release experiment, wherein a known amount of water is diverted into the channel near the Folsom South Canal. Instrumentation deployed for such an experiment also will be useful for studying interaction between groundwater and surface water in the system on a continuous basis.
Channel Instrumentation
Portions of the Cosumnes River channel between the Folsom South Canal and Twin Cities Road will be instrumented in order to detect, in real time, spatially and temporally varying losses and gains of streamflow due to interplay with groundwater. Observations will attempt to detect key river reaches within which most of the streamflow losses (groundwater recharge) are occurring.
Instrumentation will include the following:
• Automatic monitoring of river bed temperature along 6 to 8 transects to provide higher-resolution information on the rate of downstream movement of flow pulses during dry and wet conditions (100 Tidbit temperature loggers). This also will help detect sub-reaches that are most active in terms of groundwater interaction.
• Additional installation of shallow piezometers in near-channel and floodplain areas to
provide more groundwater level information beyond our existing triangular floodplain and Highway 99 sites. This also will help us pin down the role of little-studied and little-understood perched aquifers in regulation of baseflow into the summer and fall months.
• Additional streamflow monitoring at strategic locations.
This task would begin prior to water releases and continue through July 2006.
TASK 4 – PROJECT REPORTING
The SSCAWA and RBI will lead the task of reporting Project activities and results. RBI will provide the SSCAWA and Coalition partners with periodic report of operations for flow management activities, during all periods in which flows are being released. The FFC will provide a report on escapement and juvenile emigration monitoring, approximately 3 months after the completion of emigration monitoring activities. Information gathered by UCD will be included in a report on groundwater and surface water Interaction, approximately 6 months after the completion of monitoring activities.

Cosumnes River Flow Augmentation Pilot Project 11 Robertson-Bryan, Inc. Draft Monitoring Plan
4 LITERATURE CITED
Bailey, N.J. 1951. On estimating the size of mobile populations from recapture data. Biometrika 38:293-306.
Law, P.M.W. 1994. A simulation study of salmon carcass survey by capture-recapture method. California Department of Fish and Game 80(1): 14-28.
Murphy, M.L., J.F. Thedinga, and J.J. Pella. 1996. Bootstrap confidence intervals for trap-
efficiency estimates of migrating fish. U.S. Department of Commerce, National Marine Fisheries Service, Alaska Fisheries Science Center, Juneau, Alaska.
Ricker, W.E. 1975. Computation and interpretation of biological statistics of fish populations. Bulletin of Fisheries Research Board of Canada (23) Suppl.1(2):519–29.
Snider, B., B. Reavis, and R. Titus. 2000. 1999 Upper Sacramento River winter-run chinook salmon escapement survey, April – August 1999. CDFG Environmental Service Division, Sacramento, California.

ENVIRONMENTAL DOCUMENTATION

California State Clearinghouse Handbook • 27
Name of Person or Agency Carrying Out Project:
Description of Project:
Project Location - Specific:
Notice of Exemption
To: □ Office of Planning and ResearchPO Box 3044, 1400 Tenth Street, Room 212Sacramento, CA 95812-3044
□ County ClerkCounty of
January 2004
From: (Public Agency)
Project Title:
Project Location – County:Project Location – City:
Name of Public Agency Approving Project:
Exempt Status: (check one)
□ Ministerial (Sec. 21080(b)(1); 15268);
□ Declared Emergency (Sec. 21080(b)(3); 15269(a));
□ Emergency Project (Sec. 21080(b)(4); 15269(b)(c));
□ Categorical Exemption. State type and section number:
□ Statutory Exemptions. State code number:
(Address)
Reasons why project is exempt:
Lead AgencyContact Person: Area Code/Telephone/Extension:
Signature: Date: Title:
□ Signed by Lead Agency
□ Signed by ApplicantDate received for filing at OPR:
If filed by applicant:1. Attach certified document of exemption finding.2. Has a Notice of Exemption been filed by the public agency approving the project? □ Yes □ No
27
Form D
Anamarie Malone
Governor's Office of Planning and Research


COSUMNES RIVER FLOW AUGMENTATION PROJECT
CATEGORICAL EXEMPTION
Prepared for:
Southeast Sacramento County Agricultural Water Authority
Prepared by:
October 10, 2005

COSUMNES RIVER FLOW AUGMENTATION PROJECT
CATEGORICAL EXEMPTION
Prepared for:
Southeast Sacramento County Agricultural Water Authority
P.O. Box 445 Herald, CA 95638
Prepared by:
9888 Kent Street Elk Grove, CA 95624
(916) 714-1801
October 10, 2005

TABLE OF CONTENTS
1 INTRODUCTION................................................................................................................................... 1
2 PROJECT DESCRIPTION .................................................................................................................... 1
2.1 Introduction .............................................................................................................................. 1 2.2 Demonstration Project Operations......................................................................................... 2
Demonstration Phase Water Supply.........................................................................................................3 Flow Release Operations .........................................................................................................................4
2.3 Monitoring Program................................................................................................................. 5 Flow Release Scheduling .........................................................................................................................5 Fall-run Chinook Salmon Run Size (Escapement) and Juvenile Downstream Migration (Emigration) Monitoring ............................................................................................................................5 Groundwater-Surface Water Interaction Monitoring .................................................................................6
3 PROJECT DETERMINATION............................................................................................................... 6
3.1 Analysis of Potential CEQA Exceptions to the Categorical Exemption .............................. 7 3.2 Environmental Impact Analysis .............................................................................................. 9
Biological Resources ................................................................................................................................9 Hydrology and Water Quality..................................................................................................................10 Other CEQA Issues ................................................................................................................................10
LIST OF TABLES
Table 1. Categorical Exemption Exceptions (CEQA Guidelines Section 15300.2)......................8
LIST OF FIGURES
Figure 1. Location map for the Cosumnes River Flow Augmentation Project..............................3
Figure 2. Cosumnes River channel pre-wetting releases from the Folsom South Canal. ...........4
Cosumnes River Flow Augmentation Project ROBERTSON-BRYAN, INC. Southeast Sacramento County Agricultural Water Authority i Categorical Exemption

1 INTRODUCTION
The Southeast Sacramento County Agricultural Water Authority (SSCAWA) will be undertaking the Cosumnes River Flow Augmentation Project (Project) – 2005 Demonstration Phase from October through December 2005. The activity is specifically designed to collect basic operational and research information to refine a long-term program of fisheries enhancement and groundwater recharge. Because the activity will not cause adverse environmental effects, the Project qualifies for a categorical exemption as outlined in State California Environmental Quality Act (CEQA) Guidelines Sections 15061, 15062, and 15306. The following information describes the activities that will occur during the demonstration phase of the Project and the regulatory determination for supporting a CEQA categorical exemption.
2 PROJECT DESCRIPTION
2.1 Introduction
The Cosumnes River is a keystone of anadromous salmon fishery conservation efforts in the North Delta. The Anadromous Fish Restoration Program (AFRP), The Nature Conservancy (TNC), and the University of California, Davis (UCD), have sponsored numerous research projects on the health of the salmon fishery of the Cosumnes River. Historical decline of the Cosumnes River fall-run chinook salmon (Oncorhynchus tshawytscha) populations are apparently due to the altered hydrology of the system during the critical salmon migration period coupled with a short supply of suitable spawning and rearing habitat. AFRP has identified the Cosumnes as having potential for contributing to the fish doubling goals of the Central Valley Project Improvement Act (CVPIA). The AFRP has also set forth program objectives specifically directed at the Cosumnes River and the acquisition and restoration of fish habitat, primarily directed at improving passage and spawning habitat for fall-run chinook salmon.
The geologic setting and unregulated nature of the Cosumnes River has also made it a focus of regional water management strategies for south Sacramento County, and particularly for SSCAWA and its member district, Omochumne-Hartnell Water District (OHWD), through which the Cosumnes River flows. SSCAWA and OHWD, in partnership with the Sacramento County Water Agency (SCWA), TNC, and UCD are sponsoring a number of programs aimed at evaluating and developing a conjunctive use strategy that capitalizes on the natural geology of the region for groundwater recharge and surface water management.
Recent field and modeling efforts conducted by UCD researchers and others indicate that extensive regional and local groundwater withdrawals over the past 50 years substantially lowered groundwater tables and reduced the base flow of the Cosumnes River and its major
Cosumnes River Flow Augmentation Project ROBERTSON-BRYAN, INC. Southeast Sacramento County Agricultural Water Authority 1 Categorical Exemption

tributaries. The Cosumnes River now frequently ceases to flow during summer months, stays dry longer into the fall, and has a dry river bed over an increasingly longer reach compared to historical conditions.
A Coalition of interests1 support this project that will provide supplemental flows to the Cosumnes River to improve fish passage for fall-run chinook salmon and provide a controlled environment to evaluate the interaction of groundwater and surface water in the Cosumnes River channel. Figure 1 shows the project area and major features. The objectives of the Project are twofold:
• To improve fall-run chinook salmon migration conditions by: (1) allowing the Cosumnes River to connect to tidewater earlier in the fall, and (2) sustaining surface flow continuity within the Cosumnes River after its initial connection.
• To evaluate the rate of groundwater recharge from the river channel between the Folsom South Canal and Twin Cities Road to better guide future groundwater management and environmental restoration efforts along the Cosumnes River corridor.
2.2 Demonstration Project Operations
The Project will release up to 5,000 acre-feet (af) of water into the Cosumnes River starting on or about October 15, 2005, from an existing turnout of the Folsom South Canal. The Folsom South Canal diverts water from the lower American River at Lake Natoma and conveys it to the south Sacramento County area. The Project is designed to create river conditions similar to what might have been experienced prior to the reduction of groundwater levels underlying the Cosumnes River between Highway 16 and the Cosumnes River Preserve (downstream of Twin Cities Road). The Project is not intended to create a hydraulic connection with the tidally influenced area of the Cosumnes River and the Delta before it would historically have occurred naturally from run-off generated by fall precipitation in the Sierra Nevada foothills.
The intent of the Coalition is that the Project continue into a Pilot Project phase from 2006 through 2010, after which it will become a permanent annual operation. Hence, the 2005 effort constitutes a demonstration phase to help the project proponents develop and improve the long-term management strategy of the Project. Sacramento County Water Agency (SCWA) will provide the long-term water supply for the Project using water developed from the Eastern Sacramento County Replacement Water Supply Project (RWSP). CEQA compliance for the
1 The Coalition consists of the Sacramento County Water Agency, The Nature Conservancy, Southeast Sacramento County Agricultural Water Authority (members include Omochumne-Hartnell Water District, Galt Irrigation District, and Clay Water District), Fisheries Foundation of California, and the UCD Center for Integrated Watershed Science and Management.
Cosumnes River Flow Augmentation Project ROBERTSON-BRYAN, INC. Southeast Sacramento County Agricultural Water Authority 2 Categorical Exemption

Pilot Project phase (2005–2010) will be prepared by the end of 2005, and any necessary regulatory permits or approvals for construction of permanent features associated with the Project would be secured in early 2006.
Figure 1. Location map for the Cosumnes River Flow Augmentation Project.
Demonstration Phase Water Supply
The U.S. Bureau of Reclamation (Reclamation) and the B2 Environmental Water Program will provide the water supply for the demonstration phase of the Project. Up to 40 cubic feet per second (cfs) will be diverted from the American River system, supplied from storage in Folsom Reservoir, between October 15 and December 31. This water is allocated to the B2 Environmental Water Program and, as such, will be diverted entirely from storage, thereby leaving streamflow in the American River unaffected. Water released from Folsom Reservoir for the Project will fall within Reclamation’s normal operating ranges for the fall period.
Cosumnes River Flow Augmentation Project ROBERTSON-BRYAN, INC. Southeast Sacramento County Agricultural Water Authority 3 Categorical Exemption

Cosumnes River Flow Augmentation Project ROBERTSON-BRYAN, INC.
Flow Release Operations
The demonstration phase of the Project will not require construction or physical alteration of existing facilities, streambed or streambank modifications, or vegetation removal to implement the release of water from the Folsom South Canal to the Cosumnes River. Releases will be made from the canal via an existing outlet structure on the canal abutment on the south side of the Cosumnes River. The outlet structure consists of an operable gate located on the canal leading into a buried 48-inch pipeline. The gravity-fed pipeline terminates on the south bank of the river, approximately three feet above the normal water surface elevation. Releases will be controlled and monitored to ensure that the hydraulic energy of the water entering the river does not cause adverse localized channel or streambank scour, erosion, or excessive turbidity in the water column. In addition, there is natural streamflow in the Cosumnes River in this section of the river because of the large 2004-05 winter snowpack in the Sierra Nevada. Existing streamflow currently extends downstream to the vicinity of Wilton Road (river mile 15) where percolation into the stream channel is complete and the channel becomes dry from that point downstream to the area of tidal influence (river mile 5). Natural streamflow is expected to continue through the 2005 implementation period. The existing streamflow will also serve to dissipate the hydraulic energy of the discharge from the canal, eliminating the need for streambed erosion controls.
Figure 2 depicts the flow release schedule developed to meet the following criteria: (1) pre-wet the greatest length of channel possible without reaching the tidally influenced area, and (2) maintain sufficient water in reserve for augmenting river flow to sustain the connection with tidewater during the optimal salmon migration period of November 1 to December 31.
0
10
20
30
40
50
60
70
80
90
100
1-Oct 11-Oct 21-Oct 31-Oct 10-Nov 20-Nov 30-Nov 10-Dec 20-Dec 30-Dec
Cha
nnel
Pre
-wet
ting
Flow
Rel
ease
s (c
fs)
Figure 2. Cosumnes River channel pre-wetting releases from the Folsom South Canal.
Southeast Sacramento County Agricultural Water Authority 4 Categorical Exemption

Channel pre-wetting flows will begin on or about October 15 and continue through December 31. By beginning flow releases in mid-October, the Cosumnes River channel will receive approximately 2,400 af of water before the river typically connects to tidewater in mid-November. Water not used for channel pre-wetting will be reserved and used to supplement natural flows through December 31 in an effort to eliminate stranding conditions during the migration period. Flow augmentation releases will be made when Cosumnes River flows fall below that required to maintain upstream migration conditions, estimated to be 65–70 cfs, measured at the U.S. Geological Survey (USGS), Michigan Bar gauging station. Historical flow records for the Cosumnes River, with consideration of today’s groundwater conditions, indicate that supplemental flows to maintain barrier-free migration conditions would be needed in about 93% of years.
2.3 Monitoring Program
SSCAWA and partner organizations of the Coalition will conduct fisheries and hydrologic monitoring as an element of the Project. Information developed by the monitoring efforts will be used to refine Project operations and to assist in the development of the long-term streamflow augmentation program for improvement of fall-run chinook salmon migration conditions in the Cosumnes River.
Flow Release Scheduling
SSCAWA will take the lead in scheduling and managing releases from the Folsom South Canal. On behalf of SSCAWA, Robertson-Bryan, Inc. (RBI) will facilitate the task of flow release scheduling and management. RBI will perform field measurements of flows to monitor the effect of releasing channel-wetting flows and regulate flow releases as needed to meet the multiple objectives of the Project. RBI will coordinate with all members of the Coalition, Reclamation, and permitting and other regulatory authorities regarding flow releases, as needed.
Fall-run Chinook Salmon Run Size (Escapement) and Juvenile Downstream Migration (Emigration) Monitoring
The Fisheries Foundation of California (FFC) will monitor the abundance, distribution, and lifestage-specific migration timing of fall-run chinook salmon in the Cosumnes River and compare these data to historical data to determine Project effectiveness. This task will evaluate the adequacy of flows for salmon passage by life stage. Flow needs will focus on the lower river reach, from below the Folsom South Canal to the tidal area, where passage of migrating adult salmon presents the biggest problem. The duration and rate of flow needed to allow the run to proceed upstream and successfully reach spawning grounds will be a focused evaluation building on information gathered in previous years. The duration and rate of flow needed to maintain a
Cosumnes River Flow Augmentation Project ROBERTSON-BRYAN, INC. Southeast Sacramento County Agricultural Water Authority 5 Categorical Exemption

successful migration pattern will be determined through adaptive management of flow releases from the Folsom South Canal. The FFC will also conduct out-migration surveys to provide information on the relative success of fall spawning in the Cosumnes River.
Groundwater-Surface Water Interaction Monitoring
Professor Graham Fogg, Ph.D., of the Land, Air, and Water Resources and Geology Department at UCD, will lead the Groundwater–Surface Water Interaction Monitoring task. Ongoing work on hydrogeology of the Cosumnes River aquifer system has shown that the river is the major source of recharge to the local groundwater system and that most of this recharge probably occurs over a small percentage of the channel between Michigan Bar and Twin Cities Road. Successful management of river flows to sustain salmon migration in the fall requires more detailed information on river–aquifer water exchange along this entire reach. This more detailed information can be obtained through careful hydrologic monitoring before and after a controlled flow release experiment, wherein a known amount of water is diverted into the channel near Folsom South Canal. Instrumentation deployed for such an experiment will also be useful for studying interaction between groundwater and surface water in the system on a continuous basis.
3 PROJECT DETERMINATION
In compliance with the State CEQA Guidelines, the potential environmental effects of the demonstration phase of the Project were evaluated and it was determined that its implementation is exempt from CEQA under the State CEQA Guidelines; specifically, Title 14, California Code of Regulations (CCR) Section 15061(b)(3), and subject to a Category Exemption under Title 14, CCR Section 15306 (Class 6, Information Collection).
Pursuant to CEQA, a categorical exemption provides for an exemption from CEQA environmental documentation requirements for a class of projects determined not to have a significant effect on the environment. The demonstration phase of the Project is consistent with the designated Class 6 categorical exemption and thus determined to be exempt from the provisions of CEQA. The Class 6 – Information Collection class of categorical exemptions is defined as follows:
Class 6 consists of basic data collection, research, experimental management, and resource evaluation activities, which do not result in a serious or major disturbance to an environmental resource. These may be strictly for information gathering purposes, or as part of a study leading to an action, which a public agency has not yet approved, adopted, or funded.
Cosumnes River Flow Augmentation Project ROBERTSON-BRYAN, INC. Southeast Sacramento County Agricultural Water Authority 6 Categorical Exemption

The demonstration phase of the Project meets this definition in that the Project serves to develop and evaluate research data in support of planning and design options for long-term resource management that would benefit anadromous fisheries and groundwater recharge in the Cosumnes River. Additionally, any subsequent projects that would be developed to address this problem have not yet been approved, adopted, or funded by SSCAWA.
In addition, the demonstration phase of the Project is covered by the general rule that CEQA does not apply to activities where it can be seen with certainty that there is no possibility that a significant effect on the environment could occur (State CEQA Guidelines Section 15061[b][3]). The project consists of a temporary discharge of American River water from the Folsom South Canal to the Cosumnes River for the specific purpose of anadromous fisheries enhancement and groundwater recharge. Thus, the Project is similar to a temporary water transfer program for which the State Water Resources Control Board has found to be subject to a CEQA Statutory Exemption under State CEQA Guidelines Section 15282(v) and the California Water Code, Section 1729.
Reclamation has determined that the use of B2 Environmental Water for the Project is consistent with Reclamation policy for a Categorical Exclusion for the “Conduct of programs of demonstration, educational, and technical assistance to water user organizations for improvement of project and on-farm irrigation water use and management” pursuant to the National Environmental Policy Act (NEPA), Code of Federal Regulations (CFR) Section 1508.4.
No other local, state, or federal regulatory approvals or permits are required for implementation of the Project.
3.1 Analysis of Potential CEQA Exceptions to the Categorical Exemption
Categorical exemptions represent activities that generally do not result in significant environmental impacts. However, there are six exceptions to categorical exemptions, defined in CEQA Guidelines Section 15300.2. Generally, a categorical exemption does not apply if a project would occur in certain specified sensitive environments, would affect scenic resources within official state scenic highways, or is located on a designated hazardous waste site. In addition, a categorical exemption would not apply if the project causes substantial adverse changes in the significance of a historical resource or would be considered significant within a cumulative context. Table 1 identifies specific exceptions from CEQA Guidelines Section 15300.2 and a brief discussion as to why each exception does not apply to the demonstration phase of the Project.
Cosumnes River Flow Augmentation Project ROBERTSON-BRYAN, INC. Southeast Sacramento County Agricultural Water Authority 7 Categorical Exemption

Table 1. Categorical Exemption Exceptions (CEQA Guidelines Section 15300.2)
Exception Applicability
(a) Location. Classes 3, 4, 5, 6, and 11 are qualified by consideration of where the project is to be located—a project that is ordinarily insignificant in its impact on the environment may in a particularly sensitive environment be significant. Therefore, these classes are considered to apply in all instances, except where the project may impact an environmental resource of hazardous or critical concern where designated, precisely mapped, and officially adopted pursuant to law by federal, state, or local agencies.
The Project is specifically designed to benefit fisheries resources and local water supplies associated with Cosumnes River where resource conditions are known to be limited by the historical reduction in favorable seasonal streamflow conditions. Central Valley steelhead are threatened under the federal Endangered Species Act and the Mokelumne River downstream of the project area is designated critical habitat for steelhead. The Project will not create early attraction flows or false attraction flows that would lead to straying of fish from their native stream of origin. In addition, the Project would not involve any construction activity or operations that would cause an impact to any resource of hazardous or critical concern.
(b) Cumulative Impact. All exemptions for these classes are inapplicable when the cumulative impact of successive projects of the same type in the same place, over time is significant.
Resource data collection conducted during the Project will specifically be used to refine the design of the long-term streamflow augmentation project. Consequently, it is anticipated that the long-term project will be constructed and operated so as to not cause any significant cumulative environmental effects.
(c) Significant Effect. A categorical exemption shall not be used for an activity where there is a reasonable possibility that the activity will have a significant effect on the environment due to unusual circumstances.
The proposed study design incorporates measures to ensure that no significant impacts will occur as a result of study activities. These include manually controlling and monitoring the flow augmentation operations, conducting hydrologic and fisheries monitoring downstream of the discharge to ensure that adverse effects do not occur, and using the data that is collected to refine the design of the long-term flow augmentation project.
Cosumnes River Flow Augmentation Project ROBERTSON-BRYAN, INC. Southeast Sacramento County Agricultural Water Authority 8 Categorical Exemption

Table 1. Categorical Exemption Exceptions (CEQA Guidelines Section 15300.2)
Exception Applicability
(d) Scenic Highways. A categorical exemption shall not be used for a project which may result in damage to scenic resources, including but not limited to, trees, historic buildings, rock outcroppings, or similar resources, within a highway officially designated as a state scenic highway. This does not apply to improvements, which are required as mitigation by an adopted negative declaration or certified EIR.
There are no officially designated state scenic highways in the proposed study area. The Project will not cause any aesthetic effects.
(e) Hazardous Waste Sites. A categorical exemption shall not be used for a project located on a site, which is included on any list compiled pursuant to Section 65962.5 of the Government Code.
The Project does not involve any construction or operations that would disturb, and/or alter the fate and transport, of any known or unknown hazardous waste sites.
(f) Historical Resources. A categorical exemption shall not be used for a project, which may cause a substantial adverse change in the significance of a historical resource.
The Project does not involve any construction or operations that would disturb any known or unknown cultural resources.
3.2 Environmental Impact Analysis
The following briefly describes the environmental setting in the project area, the environmental effects of the demonstration phase of the Project, and supporting evidence for this categorical exemption.
Biological Resources
The Cosumnes River is a tributary of the Mokelumne River. The discharge location is approximately 23 river miles upstream of the confluence of the two rivers. The Mokelumne River supports an annual run of Central Valley Evolutionarily Significant Unit (ESU) steelhead (Oncorhynchus mykiss), which are listed as threatened under the federal Endangered Species Act, and the Mokelumne River is within the designated critical habitat for the species. Anecdotal evidence suggests that Central Valley ESU steelhead may occur, seasonally, in the Cosumnes River upstream of Rancho Murrieta during some years. However, the Cosumnes River is excluded from the critical habitat designation, and steelhead occurring in the Cosumnes River are likely strays from the Mokelumne River. It is highly unlikely that the Cosumnes River can support a naturally reproducing steelhead population because juvenile fish rear in their natal streams for a period of one to three years and require perennial flow and cool summertime water temperatures during this rearing period. The Cosumnes River does not provide perennial flows and cool summertime water temperatures below Latrobe Falls, the section of the river accessible to steelhead.
Cosumnes River Flow Augmentation Project ROBERTSON-BRYAN, INC. Southeast Sacramento County Agricultural Water Authority 9 Categorical Exemption

It is unlikely that steelhead from the American River or Mokelumne River will be falsely attracted into the Cosumnes River, or attracted earlier than would occur without the Project, for several reasons. First, American River water will be used to “pre-wet” dry reaches of the Cosumnes River channel primarily during October and November and possibly into December (depending on when initial rains occur). Because the time at which active flow will extend to the tidal area from the discharge location will not differ appreciably from existing conditions, the discharge will not produce early attraction flow. Second, adult American River steelhead migrate upstream through the Sacramento River and are primarily attracted by a combination of olfactory cues and increased flows. Transferred water will be diluted by Cosumnes River, Mokelumne River, and numerous other tributaries to the extent that it is not expected to alter the migratory cues for American River steelhead coming up through the Delta to levels that would cause them to stray, with greater frequency, into the Cosumnes River. The small and short-term increase in flows will be regulated to pre-wet the Cosumnes River channel only, and will not be substantial enough to artificially create or increase attraction flows at the confluence of the Mokelumne and Cosumnes rivers. In addition, monitoring of the fisheries and hydrologic conditions will occur during the Project.
Folsom and Nimbus operations will not be affected by the demonstration phase of the Project. The Project will not adversely affect coldwater pool management at Folsom Reservoir, nor will it alter lower American River flows or temperatures.
Hydrology and Water Quality
The temporary interbasin transfer of water from the American River to the Cosumnes River would not cause or contribute to any substantial adverse hydrologic or water quality effects. American River water and Cosumnes River water physical and chemical characteristics are generally similar with respect to their origin from Sierra Nevada sources and suitability for designated beneficial uses supported in both rivers.
Other CEQA Issues
The demonstration phase of the Project will have no other direct or indirect environmental effects for CEQA resource issues of concern (i.e., aesthetics, agricultural resources, air quality, cultural resources, geology and soils, hazards and hazardous materials, land use and planning, mineral resources, noise, population and housing, public services, recreation, transportation/ traffic, utilities and service systems) or any cumulative impacts.
Cosumnes River Flow Augmentation Project ROBERTSON-BRYAN, INC. Southeast Sacramento County Agricultural Water Authority 10 Categorical Exemption

Memorandums

9888 Kent Street • Elk Grove, CA 95624 Phone: (916) 714-1801 • Fax: (916) 714-1804
1
MEMORANDUM
DATE: SEPTEMBER 15, 2005
TO: DAVE ROBINSON, US BUREAU OF RECLAMATION
FROM: LARRY RODRIGUEZ DAVE THOMAS MICHAEL BRYAN
PROJECT: COSUMNES RIVER FLOW AUGMENTATION PROJECT
SUBJECT: NO ADVERSE AFFECT TO CENTRAL VALLEY STEELHEAD
Robertson-Bryan, Inc. (RBI) has prepared the following to support the U.S. Bureau of Reclamation’s (Reclamation) determination of no adverse affect to Central Valley Evolutionarily Significant Unit (ESU) steelhead or designated critical habitat as a result of implementation of the demonstration phase of the Cosumnes River Flow Augmentation Pilot Project using water available through the B2 Environmental Water Program.
Anecdotal evidence suggests that Central Valley ESU steelhead (Oncorhynchus mykiss) may occur seasonally in the Cosumnes River upstream of Rancho Murrieta during some years. Central Valley ESU steelhead are currently listed as threatened under the federal Endangered Species Act (63 FR 13347, May 18, 1998); no State designation has been made. NOAA Fisheries issued its final designation for critical habitat on September 2, 2005 (50 CFR Part 226). The designation includes the Mokelumne River; however, the Cosumnes River was considered and excluded because the watersheds containing this river were of “…low conservation value.” Steelhead occurring in the Cosumnes River are likely strays from the Mokelumne River, which supports an annual run of steelhead. In contrast, it is unlikely that the Cosumnes River can support a naturally reproducing steelhead population because juvenile fish rear in their natal streams for a period of one to three years and require perennial flow and cool summertime water temperatures during this rearing period. The Cosumnes River does not provide perennial flows and cool summertime water temperatures below Latrobe Falls, the section of the river accessible to steelhead. Latrobe Falls, located at river mile 40 where elevation is approximately 350 feet (msl), is a natural barrier to upstream migration
The proposed Pilot Project will augment the natural flow regime of the Cosumnes River with American River water conveyed through the Folsom South Canal. The potential adverse effects of such an action on Central Valley ESU steelhead include: (1) false attraction of non-natal (i.e., American River- or Mokelumne River-derived) fish into the Cosumnes River as a result of the

2
inter-basin water transfer, (2) early attraction and potential stranding of steelhead because of early hydraulic connectivity, and (3) adverse alteration of designated critical habitat, including habitats of the lower American River.
It is unlikely that steelhead from the American River or Mokelumne River will be falsely attracted into the Cosumnes River, or attracted earlier than would occur without the Pilot Project, for several reasons. First, American River water will be used to “pre-wet” dry reaches of the Cosumnes River channel primarily during October and November and possibly into December (depending on when initial rains occur). Second, adult American River steelhead migrate upstream through the Sacramento River and are primarily attracted by a combination of olfactory cues and increased flows. Transferred water will be diluted by Cosumnes River, Mokelumne River, and numerous other tributaries to the extent that it is not expected to alter the migratory cues for American River steelhead coming up through the Delta to levels that would cause them to stray, with greater frequency, into the Cosumnes River. The small and short-term increase in flows will be regulated to pre-wet the Cosumnes River channel only, and will not be substantial enough to artificially create or increase attraction flows at the confluence of the Mokelumne and Cosumnes rivers.
It is unlikely that critical habitat will be adversely affected by increases in flow for several reasons. First, the Cosumnes River, which will be directly affected by the Pilot Project, is not designated critical habitat for steelhead. Second, increases in flow will be short-term in nature. Third, the incremental increase in flow will be small in the Cosumnes River and negligible in the Mokelumne River, thereby leaving critical habitat virtually unaffected. The American River, which also is designated critical habitat for steelhead, will not be adversely affected by the Pilot Project. The water to be diverted (up to 40 cfs) from the American River system will be taken from storage in Folsom Reservoir between October 15 and December 31. This water is allocated to the B2 Environmental Water Program and, as such, will be diverted entirely from storage, thereby leaving stream flow in the American River unaffected. Water released from Folsom Reservoir for the Pilot Project will fall within Reclamation’s normal operational parameters for the fall period. Folsom and Nimbus operations are not anticipated to be affected by the Pilot Project. Any minor effect on operations would not adversely affect coldwater pool management at Folsom Reservoir, nor would it alter lower American River flows or temperatures by magnitudes that would adversely affect steelhead or critical habitat.
For the reasons stated herein, the proposed Pilot Project will not adversely affect Central Valley ESU steelhead or designated critical habitat.

9888 Kent Street • Elk Grove, CA 95624 Phone: (916) 714-1801 • Fax: (916) 714-1804
Page 1 of 2
MEMORANDUM
Date: October 12, 2005
To: David Robinson, US Bureau of Reclamation
From: Larry Rodriguez
Project: Cosumnes River Flow Augmentation Project
Subject: Flow Release Scheduling
On behalf of the Southeast Sacramento County Agricultural Water Authority (SSCAWA), Robertson-Bryan, Inc. (RBI) prepared this memorandum to provide US Bureau of Reclamation (Reclamation) with an updated flow release schedule and communication protocols for the Cosumnes River Flow Augmentation Project – Demonstration Phase (Project). Conditions in the Cosumnes River, readiness of Folsom South Canal (FSC) turnout facilities, and the timing of the availability of US Bureau of Reclamation (Reclamation) water supplies have prompted these changes to the release schedule provided to Reclamation in the Project Monitoring Plan (September 26, 2005).
Release Schedule
The Monitoring Plan indicates that releases from the FSC will be ramped up to 40 cubic-feet-per-second (cfs) beginning on October 15. The intent of ramping flows was to first wet then fill the in-channel pool located at the FSC crossing, presuming that the channel is typically dry in October. However, the Cosumnes River at the FSC crossing is currently flowing at about 16 cfs, therefore, we do not feel the need to ramp up flows to 40 cfs. Instead, we are requesting that Reclamation start releases at 40 cfs. RBI will monitor releases to ensure that no excessive erosion occurs. If it is determined that releases need to be reduced to avoid erosion, RBI will request a change from Reclamation.
RBI is requesting that Reclamation adopt the following schedule to facilitate the initial release of water and to allow for channel erosion evaluation.
• Monday October 17, 2005, 10:00 – Release begin at a rate of 40 cfs. First releases will be coordinated with a project initiation ceremony and media coverage.
• Thursday October 20, 2005, afternoon – Shut off releases to allow for channel erosion evaluation on Friday morning.
• Friday October 21, 2005, afternoon – Reinitiate releases at a rate determined by RBI. Flows will be maintained at the determined rate until natural river flows increase or the channel

wetting front progresses to downstream of Twin Cities Road. RBI will determine when changes to releases are needed and will notify Reclamation of the needed change. Requests for changes in releases will be made 3 days prior to needed change.
As a component of the monitoring program, RBI will conduct regular flow measurements in the Cosumnes River. Flow monitoring locations include the seasonal dam located immediately downstream of the FSC and a location above the FSC that captures the inflow to the in-channel pool formed at the FSC crossing. These monitoring points will assist RBI and Reclamation in calibrating the releases from the FSC. All flow measurements and FSC meter readings will be conducted by RBI at two-day intervals and will be recorded onto a project data sheet that will be distributed to all project partners.
Communication Protocols
RBI will direct all communication for changes in release rates to the following parties:
1. David Robinson via phone at (916) 979-7179 and email at [email protected],
2. Dave Lawson via email at [email protected] and by phone at (916) 979-7233, if David Robinson is not available, and
3. James Taylor via email at [email protected] and by phone at (916) 979-7252, if either David Robinson or Dave Lawson are not available.
4. In the case of an emergency, RBI will contact the Reclamation Control Room at (916) 979-7251.
RBI will direct regular communications of project status and flow reporting to David Robinson and Dave Lawson via email.
Reclamation will direct all communications regarding release management to following parties:
1. Brook Edwards via phone at (916) 714-8351 (office) or (916) 216-7330 (cell phone), and by email at [email protected],
2. Larry Rodriguez via email at [email protected], or by phone at (916) 714-1806 (office) or (916) 212-4678 (cell phone), if Brook Edwards is not available, and
3. Stuart Robertson via phone at (916) 687-7799, if either Brook Edwards or Larry Rodriguez is not available.
Reclamation will direct all general communications about project status and management to Larry Rodriguez.
Page 2 of 2

9888 Kent Street • Elk Grove, CA 95624 Phone: (916) 714-1801 • Fax: (916) 714-1804
Page 1
MEMORANDUM
Date: November 18, 2005
To: B2 Environmental Water Program – Interagency Management Team
From: Project Partners: The Nature Conservancy Fisheries Foundation of California Southeast Sacramento County Agricultural Water Authority
Project Management Team (RBI): Larry J. Rodriguez David Thomas Michael Bryan, Ph.D.
Project: Cosumnes River Flow Augmentation Project
Subject: Proposed Operational Changes to the Cosumnes River Flow Augmentation Project
INTRODUCTION
The operational approach for the Demonstration Phase of the Cosumnes River Flow Augmentation Project (Project) is being reconsidered in light of current conditions on the Cosumnes River, and the small amount of allocated water used to date. Due to rather unique hydrologic conditions this year, it required only 760 acre-feet (ac-ft) of B2 water to “pre-wet” the river channel, which was the original goal of the Project. Although the channel is now pre-wetted, there have been no significant precipitation events and none are projected in the near future. Salmon are likely waiting to enter the Cosumnes River, but cannot due to the lack of surface flow continuity between the tidal reach and the upper watershed. Based on this situation, coupled with availability of over 4,000 ac-ft of allocated water, we now propose to release water from the Folsom South Canal sufficient to attract salmon into the river and ultimately to historic spawning reaches. The Project partners have determined that creating an attraction flow would be a reasonable use of available water and would offer a unique opportunity to assess numerous additional research questions regarding salmon behavior.
This memorandum provides a summary of the original project objectives and operations, 2005 operations and conditions, and proposed next steps for the Demonstration Phase of the Project.
PROJECT OBJECTIVES AND OPERATIONS
The intent of the 2005 Demonstration Phase of the Project is to allow the Project partners to refine and improve the long-term operations plan for the Project. During the Demonstration Phase up to 5,000 acre-feet (ac-ft) of water is available from the B2 Environmental Water Program and the U.S. Bureau of Reclamation (Reclamation). The objectives of the Project are twofold:

November 18, 2005
Page 2
Figure 1. Cosumnes River Flow Augmentation Project location map.
• To improve fall-run chinook salmon migration conditions by: (1) allowing the Cosumnes River to connect to tidewater earlier in the fall, and (2) sustaining surface flow continuity within the Cosumnes River after its initial connection.
• To evaluate the rate of groundwater recharge from the river channel between the Folsom South Canal and Twin Cities Road to better guide future groundwater management and environmental restoration efforts along the Cosumnes River corridor.
To achieve the above objectives the Project design is to create river conditions similar to what might have existed prior to the reduction of groundwater levels underlying the Cosumnes River. This historical condition is a “gaining” riverine system connected to and receiving water input from the underlying groundwater table. This system would have remained wet, if not flowing, in all but the driest of conditions and flow would have been reestablished each fall with even small amounts of precipitation in its watershed.
The Project will accomplish this by releasing pre-wetting flows into the Cosumnes River from the Folsom South Canal (Figure 1). Pre-wetting release will be managed to wet the river channel from the Folsom South Canal to Twin Cities Road beginning on October 15 and continue through December 31, depending

November 18, 2005
Page 3
0
10
20
30
40
50
60
70
Oct 1 Oct 11 Oct 21 Oct 31 Nov 10 Nov 20 Nov 30 Dec 10 Dec 20 Dec 30
Pre
-wet
ting
Rel
ease
s (c
fs)
Figure 2. Cosumnes River channel pre-wetting releases from the Folsom South Canal.
Figure 3. Historical daily average flow and 2005 flow at Michigan Bar.
0
10
20
30
40
50
60
70
80
90
100
1-Ju
l
11-J
ul
21-J
ul
31-J
ul
10-A
ug
20-A
ug
30-A
ug
9-S
ep
19-S
ep
29-S
ep
9-O
ct
19-O
ct
29-O
ct
8-N
ov
Flow
at M
ichi
gan
Bar
(c
fs)
Historical Daily Average (1907 - 2004)
2005
on precipitation and natural flow conditions. Figure 2 shows the schedule for pre-wetting flow releases. Creating a connection with tidewater during the pre-wetting phase will be avoided to avoid attracting salmon into the river during the pre-wetting phase. During the pre-wetting period the Cosumnes River upstream of the Folsom South Canal is typically dry or has very little flow and, therefore, conditions above the canal would not support salmon passage or provide adequate spawning habitat.
Water not used for pre-wetting will be available to augment natural flows through December 31 to eliminate stranding conditions after a natural connection with tidewater is been established. Flow augmentation releases will be made when Cosumnes River flows fall below that required to maintain upstream migration conditions, estimated to be 65–70 cubic feet per second (cfs), measured at the Michigan Bar gauging station. Historical flow records for the Cosumnes River, with consideration of today’s groundwater conditions, indicate that 93% of all years would require supplement releases to maintain migration conditions through December 31.
2005 OPERATIONS AND CONDITIONS
The 2005 Demonstration Phase of the Project has presented several unique challenges. Implementation of the Demonstration Phase is possible because of available surplus water in the B2 Program resulting from a wetter than normal winter and spring. On the Cosumnes River, wet conditions sustained higher flows on the river throughout the summer (Figure 3). These higher flows kept the river channel wet to about river mile 13, near Wilton. Typically, summer flows will only maintain a wet channel to about river mile 32, just below the Highway 16 crossing.
At the start of the Demonstration Phase, October 17 2005, the Cosumnes River at the Folsom South Canal had a flow of 20 cfs (Figure 1). Because the river channel at the Folsom South Canal outfall was full of water, canal releases were not ramped up as shown in Figure 2; rather, the initial release was set at 40 cfs. The purpose of ramping up releases was to fill the in-channel pool at the canal outfall, which would dissipate the energy of full releases from the canal.
Not surprisingly, the first weeks of operation revealed that the seepage losses in the

November 18, 2005
Page 4
channel were much lower than expected. Lower seepage losses meant that the river was very responsive to pre-wetting flows and the wetting front moved quickly downstream. Figure 4 shows the rate of release from the Folsom South Canal and the combined flow of the river and canal releases at Blodgett Dam, immediately downstream of the canal. Figure 5 shows the location of the wetting front resulting from the combination of canal releases and natural river flow. As Figure 5 shows, connection to tidewater occurred on two separate occasions. The first was a result of pre-wetting releases from the canal. During this occurrence a maximum of 8 cfs flowed into tidewater over a period of about 5 days. The second occurrence was the result of unpredicted precipitation in the upper watershed. This resulted in a maximum of 12 cfs entering tidewater for another 5 days. Neither occurrence attracted salmon into the river.
Erosion at the canal outfall was evaluated on October 21, after 4 days of 40 cfs releases into the river. Streambed surveys taken on the 21st were compared to surveys taken prior to the start of the Project. This comparison indicated that while some shifting of the sandy channel bottom has occurred, no significant scouring below the outfall or on the stream bank has occurred as a result of canal releases.
Because of the higher than normal natural river flow, only 740 ac-ft of the available 5,000 ac-ft has been released from the canal. In addition, as Figure 4 indicates, canal releases have been shut off since November 2. The current natural flow of about 40 cfs is maintaining a wetted channel to river mile 8, approximately 3.5 miles upstream of tidewater.
The current forecast for the Sacramento area is for dry and warm conditions through November 24. Under these conditions, the flows at Michigan Bar are expected to remain stable at just above 30 cfs and the wetting front is expected to maintain its position at about river mile 8.
If current weather and river conditions persist, additional pre-wetting releases will not be required. Additionally, continued dry conditions may jeopardize this year’s entire salmon run on the Cosumnes River if no significant precipitation occurs until December.
0
10
20
30
40
50
60
70
80
10-Oct 15-Oct 20-Oct 25-Oct 30-Oct 4-Nov 9-Nov 14-Nov
Flow
(cfs
)
Cosumnes River downstream of Folsom South Canal
Folsom South Canal releases
Figure 4. Folsom South Canal releases and flow in the Cosumnes River immediately downstream.
Twin Cities Road
Hwy 99
Wilton Road
Tidewater
0
2
4
6
8
10
12
14
16
18
20
10-Oct 15-Oct 20-Oct 25-Oct 30-Oct 4-Nov 9-Nov 14-Nov
Rive
r M
iles
from
Con
fluen
ce
Figure 5. Location of wetting front on the Cosumnes River.

November 18, 2005
Page 5
PROPOSED NEXT STEPS
Unique conditions on the Cosumnes River make it possible to consider changing the Project’s operation to make canal releases that will provide attraction flows for salmon. The Project partners have determined that creating an attraction flow would be a reasonable use of available water and would offer a unique opportunity to assess numerous research questions regarding salmon behavior. This section details proposed Project operations for the remainder of 2005, provides justification for these operations, and identifies the research questions that will be addressed based on proposed operational changes.
Proposed Operational Changes
The proposed change to the original operations plan, summarized above, would entail making canal releases sufficient to augment natural flows to create a total river flow adequate to attract salmon into the Cosumnes River. Observations from this year’s operations and historical hydrology suggest that a total flow of approximately 100 cfs immediately downstream of the Folsom South Canal for a period of 7 days would be sufficient to provide a freshwater pulse through the tidal portion of the lower Cosumnes River (river mile 4.5 to 0) and into the Mokelumne River. Based on observations from previous years, such a pulse should attract salmon into the Cosumnes River.
After completion of the pulse flow, Project operations will shift to maintaining viable upstream passage conditions from tidewater to the Folsom South Canal, according to the original operations plan. A total flow of approximately 70 cfs immediately below the canal is required to maintain upstream migration conditions for salmon. According to the original operation plan, release will be made from the Folsom South Canal to meet the required flow.
Figure 6 shows the proposed pulse and augmentation flow releases needed to maintain passage under the worse case scenario that natural river flows remain near 33 cfs through December 31. Under this scenario, the Project would release an additional 3,910 ac-ft of the remaining 4,260 ac-ft available to the Project.
Justification for Operational Changes
River Conditions – Several conditions exist that justify the proposed changes to the original operations plan. Foremost of these is the natural flow condition of the Cosumnes River. As shown in Figure 3, flows have been much higher than normal this year. These higher flows have created acceptable salmon spawning conditions in the main spawning reach (river mile 27.5 to 51) of the river, as verified by Fisheries Foundation of California (FFC) biologists during several field surveys conducted since the
0
10
20
30
40
50
60
70
80
90
100
110
120
130
15-N
ov
20-N
ov
25-N
ov
30-N
ov
5-D
ec
10-D
ec
15-D
ec
20-D
ec
25-D
ec
30-D
ec
4-Ja
n
Flow
(cfs
)
Cosumnes River downstream of Folsom South Canal
Folsom South Canal releases
Pulse Flow Passage
Maintenance
Figure 6. Proposed Folsom South Canal releases.

November 18, 2005
Page 6
November 1. FFC monitoring indicates that water temperatures at the bottom of the spawning reach (river mile 17.5) are ranging from 55°C to 59°C. The current availability of spawning habitat provides spawning opportunities similar to conditions experienced in 2002, when the Cosumnes experienced a run of over 1,300 salmon. In 2002, the river experienced 4 days of high flows in early November, peaking at nearly 300 cfs, after which flows receded to 34-38 cfs until early December.
In most years, fall river conditions, in the absence of significant precipitation, would not provide suitable conditions for salmon spawning. Therefore, the original project objectives included language that specifically precluded creating attraction flows which would draw salmon into inhospitable conditions. As described in this document, conditions in the river are not typical and as such warrant consideration of alternative operations that would overcome the lack of precipitation and take advantage of acceptable spawning conditions that currently exist in the upper river.
Water Availability – With the dedication of 5,000 ac-ft of B2 water to the Demonstration Phase of the Project there is ample water supply to make the pulse flow release and to sustain upstream migration conditions through December 31. To date the project has only utilized 740 ac-ft of the available supply. The proposed pulse flow operation will require 2,240 ac-ft. Augmentation releases to maintain upstream
migration will require 1,670 ac-ft, in the worse case scenario that no precipitation occurs
before December 31. With the proposed operational changes, an additional 3,910 ac-ft is needed to complete the Demonstration Phase, bringing the total projected water need to 4,650 ac-ft.
Rescuing the 2005 Cosumnes River Salmon Run – While it has been eluded to extensively in this document, the primary justification for using canal releases to create an attraction flow is to simply rescue the 2005 fall chinook salmon run on the Cosumnes River. River conditions and the availability of water have converged to present the fisheries and water management interests on the Cosumnes River with an opportunity to rescue this year’s salmon run, which has suffered significant declines due to groundwater pumping and habitat degradation.
Research Questions and Assessment Approaches
The implementation of proposed operational changes will allow the FFC, The Nature Conservancy (TNC), UC Davis, and the Southeast Sacramento County Agricultural Water Authority (SSCAWA) to assess the following list of research questions. The FFC, TNC, and SSCAWA will collect much of the data required to perform these assessments through existing monitoring program.
1. Will release of American River via the Folsom South Canal (FSC) result in immediate immigration of fall-run chinook salmon presumably holding in the tidal reach of the lower Cosumnes River? a. Examine the confluence pool prior to connection for the presence of holding fish;
“…conditions in the river… warrant consideration of alternative operations that would overcome the lack of precipitation and take advantage of acceptable spawning conditions.”
“With the proposed operational changes, an additional 3,910 ac-ft is needed to complete the Demonstration Phase, bringing the total projected water need to 4,650 ac-ft “
“…the primary justification for using canal releases to create an attraction flow is to simply rescue the 2005 fall chinook salmon run on the Cosumnes River.“

November 18, 2005
Page 7
b. Monitor the number of fish moving upstream immediately following connection (e.g., at the box culvert).
2. Will artificially creating passage by releasing water from the FSC increase attraction of non-natal fall-run chinook salmon? a. Conduct carcass surveys of the Cosumnes River; b. Examine carcasses for adipose fin clips (indicating the presence of a coded wire tag) to
determine the hatchery origin of marked fall-run chinook salmon in the Cosumnes River; c. Determine the origin of coded wire tags to obtain abundance of fish from other systems (e.g.,
American River, Mokelumne River, Merced River); d. Compare numbers of fish derived from other systems this year with numbers from previous
years; e. Determine the proportion of any fish derived from the American River that spawned in the
lower reach of the Cosumnes River where flows are influenced/dominated by releases from the FSC.
3. Will artificially creating passage affect pre-spawning mortality relative to past years? a. Determine the relative numbers of spawned-out carcasses and non-spawned carcasses; b. Calculate the proportion of each; c. Compare the proportions of each to previous years.
4. At what water temperature does chinook salmon spawning activity begin? Peak? a. Monitor spawning activity throughout historic spawning reaches of the Cosumnes River; b. Monitor water temperatures at several locations using Onset StowAway loggers; deploy
additional units at the following locations: 1) in the FSC and 2) at Blodgett Dam; c. Characterize the relationship between water temperature and the onset and peak of spawning
activity.
5. Will release of American River water affect the spawning distributions of fall-run chinook salmon within the Cosumnes River? a. Determine the relative numbers of fish spawning upstream and downstream of the FSC; b. Compare upstream/downstream spawning distributions to historic data.
6. Will release of water from the FSC turnout delay or disrupt migrating fishes, causing them to congregate at the outfall? a. Examine the outfall of the FSC for the presence of milling fish and/or fish trying to jump into
the outfall; b. Survey the Cosumnes River upstream of the FSC for potential migration barriers.

Monitoring Reports

Date
10/11/051
10/17/05 10/19/05 10/20/05
NOTES: 1 – SFlow release
MEASURED OR GAUGED FLOWS FOR THE COSUMNES RIVER FLOW AUGMENTATION PROJECT
River Gauge at Michigan
Bar (RM 32.8)
Release From Folsom S.
Canal (RM 22.9)
Totalizer From
Folsom S. Canal
Flow at Rooney
Dam (RM 24)
Blodgett Dam (RM
22.8)
Flow at Elk Grove Hop Ranch Dam (RM 16.2)
River Flow at Mahon Ranch
(RM 12.5)
River Flow at Box Culvert
Structure (RM 6.5)
cfs cfs af cfs cfs cfs cfs cfs 24 4,980.8 20.85 19.81 6.70 0 028 36-40 28 24.10 65.20 56.0 43.90 0
36-40 5,214.2 tarting condition
began at approximately 10:30 on October 17, 2005 at a rate of 40 cfs.

Wetting Front on 10/21/05
MEASURED OR GAUGED FLOWS FOR THE COSUMNES RIVER FLOW AUGMENTATION PROJECT
River Gauge at Michigan
Bar (RM 32.8)
Release From Folsom S.
Canal (RM 22.9)
Totalizer From
Folsom S. Canal
Flow at Rooney
Dam (RM 24)
Blodgett Dam (RM
22.8)
Flow at Elk Grove Hop Ranch Dam (RM 16.2)
River Flow at Mahon Ranch
(RM 12.5)
River Flow at Box Culvert
Structure (RM 6.5)
Date
cfs cfs af cfs cfs cfs cfs cfs 10/19/05 28 36-40 24.1 65.2 56.0 43.9 010/20/051
2636-40(am),
0 (pm)5,214.2
10/21/05 27 28-30 19.7 19.9 15.6 1.3 0NOTES: 1 – Flow was shut off in the afternoon of October 20, 2005 to survey canal outlet and river channel for erosion. No erosion problems were found. Flows re-initiated at 11am on October 21, 2005 at a rate of 28-30 cfs.

Wetting Front on 10/21/05
Connection to tidewater on 10/24/05
Date
10/17/051
Starting condition
10/21/05 10/24/052
10/25/053
10/26/054
NOTES: 1 – Flow 2 – Conn 3 – Flow 4 – Conn
MEASURED OR GAUGED FLOWS FOR THE COSUMNES RIVER FLOW AUGMENTATION PROJECT
River Gauge at Michigan
Bar (RM 32.8)
Flow at Rooney Dam
(RM 24)
Release From Folsom S.
Canal (RM 22.9)
Totalizer From
Folsom S. Canal
Blodgett Dam (RM
22.8)
Flow at Elk Grove Hop Ranch Dam (RM 16.2)
River Flow at Mahon Ranch (RM 12.5)
River Flow at Box Culvert Structure
(RM 6.5) cfs cfs cfs af cfs cfs cfs cfs 28 20.9 0 4,980.8 19.8 6.7 0 0
27 19.70 28-30 19.90 15.60 1.30 028 24.80 28-30 5,424.0 55.80 48.30 29.50 9.9027 20 27 27 20 5,525.8 48.50 41.10 19.60 3.30
from the Folsom South Canal was initiated at 11am.
ection to tidewater at 8 cfs. s reduced to 20 cfs at 8:30am. ection to tidewater at 2.47 cfs.
Monitoring Report October 27, 2005

Wetting Front on 10/21/05
Tidewater
Date
10/17/051
Starting condition
10/26/05 10/28/052
10/31/053
NOTES: 1 – Flow 2 – Flow 3 – Conn
obs
MEASURED OR GAUGED FLOWS FOR THE COSUMNES RIVER FLOW AUGMENTATION PROJECT
River Gauge at Michigan
Bar (RM 32.8)
Flow at Rooney Dam
(RM 24)
Release From Folsom S.
Canal (RM 22.9)
Totalizer From
Folsom S. Canal
Blodgett Dam (RM
22.8)
Flow at Elk Grove Hop Ranch Dam (RM 16.2)
River Flow at Mahon Ranch (RM 12.5)
River Flow at Box Culvert Structure
(RM 6.5) cfs cfs cfs af cfs cfs cfs cfs 28 20.9 0 4,980.8 19.8 6.7 0 0
27 27 20 5,525.8 48.50 41.10 19.60 3.3029 22.4 10 5,611.0 38.20 36.7 23.6 8.0237 40.07 10 5,676.5 48.62 44.3 31.96 14.99
from the Folsom South Canal was initiated at 11am at a rate of 40 cfs. s reduced to 10 cfs at 8:45am, river disconnected from tidewater during the weekend, 10/29/05-10/30/05. ection to tidewater at 11.34 cfs, as a result of increased flows caused by precipitation in the upper watershed. No salmon have been erved migrating into the Cosumnes River.
Monitoring Report November 1, 2005

Tidewater
MEASURED OR GAUGED FLOWS FOR THE COSUMNES RIVER FLOW AUGMENTATION PROJECT
River Gauge at Michigan
Bar (RM 32.8)
Flow at Rooney Dam
(RM 24)
Release From Folsom S.
Canal (RM 22.9)
Totalizer From
Folsom S. Canal
Blodgett Dam (RM
22.8)
Flow at Elk Grove Hop Ranch Dam (RM 16.2)
River Flow at Mahon Ranch (RM 12.5)
River Flow at Box Culvert Structure
(RM 6.5)
Date
cfs cfs cfs af cfs cfs cfs cfs 10/17/051
Starting condition 28 20.9 0 4,980.8 19.8 6.7 0 0
10/26/05 27 27 20 5,525.8 48.5 41.1 19.6 3.310/28/052 29 22.4 10 5,611.0 38.2 36.7 23.6 8.010/31/053 37 40.0 10 5,676.5 48.6 44.3 31.9 14.911/02/054 34 34.0 0 43.8 37.2 22.1 8.8NOTES: 1 – Flow from the Folsom South Canal was initiated at 11am at a rate of 40 cfs. 2 – Flows reduced to 10 cfs at 8:45am, river disconnected from tidewater during the weekend, 10/29/05-10/30/05. 3 – Connection to tidewater at 11.34 cfs, as a result of increased flows caused by precipitation in the upper watershed. No salmon have been
observed migrating into the Cosumnes River. 4 – Flow from Folsom South Canal was shut off at 10:10 am.
Monitoring Report November 4, 2005

Wetting Front 11/7/05
Wetting Front 11/4/05
Tidewater
MEASURED OR GAUGED FLOWS FOR THE COSUMNES RIVER FLOW AUGMENTATION PROJECT
River Gauge at Michigan
Bar (RM 32.8)
Flow at Rooney Dam
(RM 24)
Release From Folsom S.
Canal (RM 22.9)
Totalizer From
Folsom S. Canal
Blodgett Dam (RM
22.8)
Flow at Elk Grove Hop Ranch Dam (RM 16.2)
River Flow at Mahon Ranch (RM 12.5)
River Flow at Box Culvert Structure
(RM 6.5)
Date
cfs cfs cfs af cfs cfs cfs cfs 10/17/051
Starting condition 28 20.9 0 4,980.8 19.8 6.7 0 0
10/28/052 29 22.4 10 5,611.0 38.2 36.7 23.6 8.010/31/053 37 40.0 10 5,676.5 48.6 44.3 31.9 14.911/2/054 34 34.0 0 5,721.1 43.8 37.2 22.1 8.811/4/05 33 31.6 0 5,721.1 31.7 24.8 9.0 011/7/05 38 37.9 0 5,721.1 39.1 30.8 15.7 0NOTES: 1 – Flow from the Folsom South Canal was initiated at 11am at a rate of 40 cfs. 2 – Flows reduced to 10 cfs at 8:45am, river disconnected from tidewater during the weekend, 10/29/05-10/30/05. 3 – Connection to tidewater at 11.34 cfs, as a result of increased flows caused by precipitation in the upper watershed. No salmon have been
observed migrating into the Cosumnes River. 4 – Flow from Folsom South Canal was shut off at 10:10 am.
Monitoring Report November 8, 2005

Tidewater
MEASURED OR GAUGED FLOWS FOR THE COSUMNES RIVER FLOW AUGMENTATION PROJECT
River Gauge at Michigan
Bar (RM 32.8)
Flow at Rooney Dam
(RM 24)
Release From Folsom S.
Canal (RM 22.9)
Totalizer From
Folsom S. Canal
Blodgett Dam (RM
22.8)
Flow at Elk Grove Hop Ranch Dam (RM 16.2)
River Flow at Mahon Ranch (RM 12.5)
River Flow at Box Culvert Structure
(RM 6.5)
Date
cfs cfs cfs af cfs cfs cfs cfs 10/17/051
Starting condition 28 20.9 0 4,980.8 19.8 6.7 0 0
11/4/05 33 31.6 0 5,721.1 31.7 24.8 9.0 011/7/05 38 37.9 0 5,721.1 39.1 30.8 15.7 011/9/05 37 38.1 0 5,721.1 40.8 33.1 14.7 011/11/05 38 39.3 0 5,721.1 40.6 30.8 15.2 011/14/052 34 34.6 0 5,721.1 39.7 28.5 12.1 0NOTES: 1 – Flow from the Folsom South Canal was initiated at 11am at a rate of 40 cfs. 2 – Flow for Blodgett Dam is being verified.
Monitoring Report November 14, 2005

Tidewater
MEASURED OR GAUGED FLOWS FOR THE COSUMNES RIVER FLOW AUGMENTATION PROJECT
River Gauge at Michigan
Bar (RM 32.8)
Flow at Rooney Dam
(RM 24)
Release From Folsom S.
Canal (RM 22.9)
Totalizer From
Folsom S. Canal
Blodgett Dam (RM
22.8)
Flow at Elk Grove Hop Ranch Dam (RM 16.2)
River Flow at Mahon Ranch (RM 12.5)
River Flow at Box Culvert Structure
(RM 6.5)
Date
cfs cfs cfs af cfs cfs cfs cfs 10/17/051
Starting condition 28 20.9 0 4,980.8 19.8 6.7 0 0
11/7/05 38 37.9 0 5,721.1 39.1 30.8 15.7 011/9/05 37 38.1 0 5,721.1 40.8 33.1 14.7 011/11/05 38 39.3 0 5,721.1 40.6 30.8 15.2 011/14/05 34 34.6 0 5,721.1 39.7 28.5 12.1 011/16/05 33 31.5 0 5,721.1 31.7 22.4 14.7 0NOTES: 1 – Flow from the Folsom South Canal was initiated at 11am at a rate of 40 cfs.
Monitoring Report November 18, 2005

Tidewater
MEASURED OR GAUGED FLOWS FOR THE COSUMNES RIVER FLOW AUGMENTATION PROJECT
River Gauge at Michigan
Bar (RM 32.8)
Flow at Rooney Dam
(RM 24)
Release From Folsom S.
Canal (RM 22.9)
Totalizer From
Folsom S. Canal
Blodgett Dam (RM
22.8)
Flow at Elk Grove Hop Ranch Dam (RM 16.2)
River Flow at Mahon Ranch (RM 12.5)
River Flow at Box Culvert Structure
(RM 6.5)
Date
cfs cfs cfs af cfs cfs cfs cfs 10/17/051
Starting condition 28 20.9 0 4,980.8 19.8 6.7 0 0
11/21/05 30 29.0 0 5,721.1 37.5 27.5 16.1 011/23/052 30 26.2 6 5,744.4 34.0 25.4 13.8 011/25/05 32 28.1 6 N/A 35.7 28.7 13.5 011/28/05 52 55.2 6 5,807.5 60.8 50.0 35.1 0NOTES: 1 – Flow from the Folsom South Canal was initiated at 11am at a rate of 40 cfs. 2 – Flow from the Folsom South Canal was re-initiated at a rate of 6 cfs on 11/22/05.
Monitoring Report November 28, 2005

Correspondence

From: David Robinson [mailto:[email protected]] Sent: Friday, August 12, 2005 2:01 PM To: Larry Rodriguez Subject: NEPA info Here is the information I referenced regarding Categorical Exclusions (CE). The problem with this approach is that the proposed action has to qualify under one of our previously approved catagories. We have developed a variety of CEs for normal planning activities, research/data collection but only for non-manipulative studies, minor consruction, O&M, etc, but none of them really apply to pre-wetting. The next step we can try is the mini-EA if we can demonstrate that all the criteria on the attached checklist are possible, but there is no CE that applies. This is a farily abbreviated process, but will take some time to write, review and finalize. There will also be ESA to complete. I assume that we could get by with an informal consultation with a finding of not likely to adversely effect. This requires concurrance from the Services before we can take the action. They can require up to 30 working days to review and issue their concurrance letter. Finally, I think you are aware that the project proponent will be responsible for preparing the environmental documents. All the agency folks plates are already full, particularlly with the end of our fiscal year comming up. Hope this helps....we can visit again next week. David B. Robinson Bureau of Reclamation Central California Area Office 7794 Folsom Dam Road (CC-413) Folsom, CA 95630-1799 (916) 989-7179 - voice (916) 989-7208 - fax [email protected]

From: David Robinson [mailto:[email protected]] Sent: Monday, August 29, 2005 11:31 AM To: Larry Rodriguez Cc: Paul Fujitani; Robert Schroeder; Shawn Oliver Subject: RE: NEPA info First, let me give you my understanding of where we are in the process right now. I think the fish agencies are basically ok with the proposal, but with some qualifiers. The first is that the Service is willing to dedicate some supply so long as it is banked b2. The behind the scenes issue is that we have never had the potential for having water in the bank, nor have we sorted through how we would implement banking. There continues to be discussion between Reclamation and the Service directed towards the issues. It is also my understanding that DFG had some lingering concerns over trans-basin movement of water. I have only secondhand knowledge of this concern, but it seems that the one way to deal with it would be in an analysis suitable for inclusion in an environmental document. Regarding the environmental documentation hoops, Reclamation does not have a CE that applies to the proposed action. I am not aware of what the Service may have in place, or what they perceive to be their need for environmental documentation. CEs are generally for administrative types of actions or for routine ongoing operations where there has been a history demonstrating no impacts. In the case of this action, it seems clear that there are some potentially significant environmental issues that would need addressed. That bumps us into the EA realm. It is possible, although challenging, for you to complete an EA by the time you expect to start the action. It also presumes that there are no unresolved controversies or impacts that can not be mitigated though agreed to modifications to the project description. A common problem early in process like yours is that the project description is not of sufficient detail to fully describe and analyze the effects, nor does it articulate the measures needed to avoid all the potential impacts. Related to this is that the EA needs to meet the needs of the agenciesthat would use it and be consistent with the Federal authorities used to take the action. Assuming you are successful in getting a commitment of b2 water, then the purpose and need and project description in the EA would need to emphasize the fisheries aspects of the action given our reliance on 3406 (b)(2) as our authority to take the action. Another key aspect is the potential for effects to listed species. We will need to comply with the section 7 of the ESA consultation requirements irrespective of the level of NEPA required. Key to having the section 7 go quickly will be an ability to make a determination of "no effect." This is for all species, not just the aquatic, and will depend on the reach of potential impacts (direct, indirect, and cumulative). If there are effects that are positive, are small, or the are completely discountable, we would still have to make a finding of "not likely to adversely effect" which requires concurrence from both of the Services. The Services generally require at least 30 days to complete their analyses and issue a concurrence letter. One way or another, a definitive analyses of effects to all potential listed species is needed.

I do not know how far you are in your processes or to what extent you have documentation and analyses available, but you can see that there is a lot of additional process needed before we could take any kind of action. I also do not know if there is a CEQA obligation for the water district that would also be needed to deliver the water from the Folsom South Canal to the river. Regarding your section 215 water question, this term came to be used after section 215 of Reclamation Reform Act of October 12, 1982 (Public Law 97-293) defined temporary supplies of water as: "(1) an unusually large water supply not otherwise storable for project purposes; or (2) infrequent and otherwise unmanaged flood flows of short duration." The term excess water is often used to describe situations where there is more water in the system needed to meet all environmental, regulatory, and water user downstream demands. The two do not always match. I hope this helps give you a better picture of what I see as the remaining challenges to using b2 water for your proposed project. I recognize that having a firm supply would help justify committing to the effort needed to button up the environmental documentation, but regardless of source, you will need to help Reclamation jump through all the above hoops before we would authorize use of our facilities. My personal opinion is that you have a better than 50/50 chance of there being b2 water to use, but it will take a focused effort to complete the environmental due diligence in the time remaining. Give me a call if you want to discuss the issues further. David B. Robinson Bureau of Reclamation Central California Area Office 7794 Folsom Dam Road (CC-413) Folsom, CA 95630-1799 (916) 989-7179 - voice (916) 989-7208 - fax [email protected]

From: Larry Rodriguez Sent: Tuesday, October 11, 2005 3:05 PM To: David Robinson; Campbell Ingram ([email protected]) Subject: Cosumnes River Flow Aug Proj. CAT-EX David /.Campbell Attached is the CEQA categorical exemption that was adopted today by the Southeast Sacramento County Agricultural Water Authority. Would you please send me a copy of the exemptions that your respective agencies prepared and adopted.
Larry J. Rodriguez Senior Water Resources Specialist Robertson-Bryan, Inc. Phone: (916) 714-1806 email: [email protected] 9888 Kent Street, Elk Grove CA 95624

From: Larry Rodriguez Sent: Thursday, October 13, 2005 9:50 AM To: David Robinson; Dave Lawson; James Taylor Subject: Flow Release Schedule for Cosumnes River Dave, et al Attached is a memo describing our revised flow schedule and communications protocols. Please contact me if have any questions. Larry J. Rodriguez Senior Water Resources Specialist Robertson-Bryan, Inc. Phone: (916) 714-1806 email: [email protected] 9888 Kent Street, Elk Grove CA 95624

From: David Robinson [mailto:[email protected]] Sent: Friday, October 14, 2005 10:01 AM To: [email protected]; [email protected]; David Jones; David Lawson; James Taylor; Margaret Gidding; Larry Rodriguez Cc: Mike Finnegan; Ronald MILLIGAN; Richard Johnson; Robert Schroeder Subject: Cosumnes Project a go We are go for a 10 am start next Monday with the following proviso.....check you e-mail first thing Monday am. A discussion with State Board personnel is scheduled for this afternoon. It is expected to be information sharing and there are not expected to be any showstopper issues. However, if something unexpected comes up, I will notify all by e-mail this weekend, and follow-up with a phone call by 8 am Monday morning. The Project Proponents have also canceled their plan to have media present during the initial release. Additional plans will follow. Thanks to all for your patience and support in making this happen. I'll be following up with some of you on your specific questions, but meatime, let me know if you have any questions....... David B. Robinson Bureau of Reclamation Central California Area Office 7794 Folsom Dam Road (CC-413) Folsom, CA 95630-1799 (916) 989-7179 - voice (916) 989-7208 - fax [email protected]

From: Jeffrey Mount [mailto:[email protected]] Sent: Monday, October 17, 2005 9:46 PM To: Jan Fleckenstein; Bill Fleenor; Gregory Pasternack; G.Schladow; [email protected] Cc: Wendy Trowbridge; Anthony Saracino; Dylan Ahearn; Peter Moyle; Mike Eaton; Keith Whitener; Larry Rodriguez; Michael L.Anderson; Ramona Swenson; Randy Dahlgren; Evan Buckland Subject: Thanks To all: Today was one of those days in applied research that makes the effort worthwhile. About 9 years ago, Rich Reiner, then the project ecologist on the Cosumnes River Preserve, came to UC Davis to ask if a partnership could be developed to look at the causes and the cures for the decline of fall flows and salmon on the Cosumnes River. Graham Fogg and his students, Jan Fleckenstein and Rich Niswonger, along with Michael Anderson from engineering, took on the task of describing the complex interaction between surface water and groundwater in the Cosumnes and prescribing what flows might be necessary to restore flows for fall run chinook salmon while not hurting groundwater resources. Wendy Trowbridge, Carson Jeffres and others helped with the calibration work for this effort. Keith Whitener had done a lot of the preliminary work, along with Trevor Ford and others, to show that salmon escapement roughly coincided with declines in fall flow conditions, thus building the case for restoring fall flows. Mike Eaton, with the help of Larry Rodriguez, Anthony Saracino and others did the heavy political lifting with the locals and the Bureau of Reclamation. So many more to mention, with apologies to all who are left out. The bottom line, as picture 1 and 2 show, the Bureau released B2 Environmental Water into the Cosumnes at around 10:00 a.m. this morning. 40 cfs added to the low flows of the Cosumnes will help reduce infiltration capacities, possibly charge perched, local aquifers, and wet up the bed before the first rains fall on the watershed, hopefully opening up the river to chinook salmon. This triumph of persistence and will is owed to many people. Specifically Mike, Larry, Graham, Jan, Rich N., Rich R., Keith, Carson, Wendy, and a bunch of others. It is a unique experiment: unprecedented in California and beyond. Thanks to everyone who worked on this. What seemed so simple at the start was tough, but worth it to do. Please forward to those I have left out. Again, thanks to all. What a treat. Jeff

From: David Robinson [mailto:[email protected]] Sent: Tuesday, October 18, 2005 11:15 AM To: Larry Rodriguez Subject: good start I'm glad all went well yesterday. I do have to bring up that the volume of press present was surprising and unexpected. Please convey to the other project proponents that any other outreach that involves access to Reclamation facilities or representations of the facts involving our role/involvement must be coordinated with me/us first. (especially if Leo is going to be taking the credit for "negotiating the deal"). The starting reading on the totalizer was 498080.8 Please have your monitoring crews regularly record the time, date, and reading on the totalizer as part of their routine monitoring. The gauge is located on the bottom of the flow meter which is in the vault adjacent to the waste way valve. The locks on the vault and gate providing access to the river are now the same as the main gate key. Be sure your crews lock the vault/gate when not in use. When you come up for air, we can discuss a more comprehensive tour for the fish agency folks. We look forward to your first progress update.

From: Larry Rodriguez Sent: Thursday, October 20, 2005 11:09 AM To: David Robinson; Dave Lawson; James Taylor Cc: Brook Edwards; Stuart Robertson Subject: REQUEST FOR CHANGE IN FSC RELEASES Gentlemen, After reviewing the progression of the wetting front on the Cosumnes River, we are anticipating the need to change the rate of release from the Folsom South Canal to the Cosumnes River. The exact change will be dependant on Reclamation’s schedule. Please let us know the date and time that you will be available and RBI will provide you with the target release rate. Our desire is to have this change made at your soonest convenience, but by Tuesday Oct 25 at the latest. As all project materials indicate, releases to the Cosumnes River will be adaptively managed based antecedent conditions, progression of the wetting front, and rates of channel losses. Not all of these factors are known at this time, hence the demonstration project. Therefore, Reclamation may be called upon to effect changes to the release on a frequent basis, and in some cases with short notice. Please understand that this is the nature of this project. Please respond to this email with Reclamation’s schedule meeting this request.
Larry J. Rodriguez Senior Water Resources Specialist Robertson-Bryan, Inc. Phone: (916) 714-1806 email: [email protected] 9888 Kent Street, Elk Grove CA 95624

From: Larry Rodriguez Sent: Thursday, October 20, 2005 5:43 PM To: Anthony Saracino; 'Bob Caikoski'; Bruce Oppenheim ([email protected]); Campbell Ingram ([email protected]); Cesar Blanco; Dave Lawson; David Robinson; David Hu ([email protected]); [email protected]; James Taylor; Jeffery Mount ([email protected]); Keith Whitener; Michael R. Eaton; Graham Fogg Ph.D; Ronald R. Lowry; Trevor Kennedy; Carson Jeffres Cc: Brook Edwards ([email protected]); [email protected]; Tina K. Lunt Subject: Cosumnes River Flow Augmentation Report 1 All, Attached is a brief report of the progression of flows on the Cosumnes River resulting from the additional 40 cfs being released from the Folsom South Canal. RBI will provide this report every couple of days. If you know of anybody else that would like to receive this data please forward it, or provide me their email and I will include them in the future. If you have any questions please contact me at the email or phone number listed below.
Larry J. Rodriguez Senior Water Resources Specialist Robertson-Bryan, Inc. Phone: (916) 714-1806 email: [email protected] 9888 Kent Street, Elk Grove CA 95624

From: Brook Edwards Sent: Monday, October 24, 2005 1:43 PM To: Larry Rodriguez; 'Anthony Saracino'; 'Bob Caikoski'; 'Bruce Oppenheim ([email protected])'; 'Campbell Ingram ([email protected])'; 'Cesar Blanco'; 'Dave Lawson'; 'David Robinson'; 'David Hu ([email protected])'; '[email protected]'; 'James Taylor'; 'Jeffery Mount ([email protected])'; 'Keith Whitener'; 'Michael R. Eaton'; 'Graham Fogg Ph.D'; 'Ronald R. Lowry'; 'Trevor Kennedy'; 'Carson Jeffres' Cc: Brook Edwards; Stuart Robertson; 'Tina K. Lunt' Subject: Cosumnes River Flow Augmentation Report for 10/21/05 All, Attached is a brief report of the progression of flows on the Cosumnes River. Flows were shut offin the afternoon of October 20th to survey the canal outlet and river channel for erosion. No erosion problems were found. Flows were re-initiated at 11am on October 21st at a rate of 28-30 cfs. If you have any questions please contact Larry or me at the email or phone numbers listed below. Brook R. Edwards Restoration Ecologist Robertson-Bryan, Inc. 9888 Kent Street Elk Grove, CA 95624 Office: 916.714.8351 Cell: 916.216.7330

From: Brook Edwards Sent: Monday, October 24, 2005 5:02 PM To: Larry Rodriguez; 'David Lawson'; 'David Robinson'; 'James Taylor' Cc: Stuart Robertson Subject: RE: REQUEST FOR CHANGE IN FSC RELEASES Gentlemen, After reviewing the progression of the wetting front on the Cosumnes River, we need to change the rate of release from the Folsom South Canal to the Cosumnes River. The river has connected to tide-water and we need the flows to be reduced to 20 cfs. We would appreciate it if this could be done as soon as possible. Please respond to this email with Reclamation's schedule meeting this request. Thanks, Brook R. Edwards Restoration Ecologist Robertson-Bryan, Inc. 9888 Kent Street Elk Grove, CA 95624 Office: 916.714.8351 Cell: 916.216.7330

From: Larry Rodriguez Sent: Tuesday, October 25, 2005 1:19 PM To: David Robinson Subject: RE: REQUEST FOR CHANGE IN FSC RELEASES See response below. Larry J. Rodriguez Robertson-Bryan, Inc. -----Original Message----- From: David Robinson [mailto:[email protected]] Sent: Tuesday, October 25, 2005 7:46 AM To: David Lawson; James Taylor; Brook Edwards; Larry Rodriguez Cc: Stuart Robertson Subject: RE: REQUEST FOR CHANGE IN FSC RELEASES Order recieved. Will implement asap and expect that it will be done by around 8 am today. You guys have let the one thing the Fish Agency folks were most concerned about happen. I spoke with Nick Hindmen this morning, He does not feel that this a big deal. We are adaptively managing flows to maximize extent of wetted channel, without intentionally creating a connection that would support upstream migration. I informed him that we were cutting back flows to eliminate any possible opportunity for upstream migration. He was comfortable with that. He understood that the reason for the pilot project is help determine how the system will respond, that every year is expected to be different, and that the primary purpose is to refine project operations based on expected system responses and varying annual conditions. That is what we are now doing. Have any fish gotten up in the system? Survey crews have not seen any evidence of upstream migration. We also don’t believe that rate of flow entering tide water (>8 cfs) is enough to create attraction. How long befor a cut is manifested at the mouth? Based on our observations over the past several days, it appears the change in release made this morning will manifest itself at Twin Cities Road by tomorrow morning. This response time is much quicker then all previous studies have indicated. This is probably due to several factors. First, a portion of the channel was already flowing and is not experiencing the magnitude of loss (seepage) that would normally be expected. And second, the portion of the channel that was dry is not experiencing expected loss rates. What do you expect 20 cfs to result in and why? We expect that a 10 cfs reduction in flow will eliminate any connect to tide water. Specifically, we don’t “expect” to see flow passing Twin Cities Road. This is based on

our observation of 10 cfs at the box culvert, consequently a 10 cfs reduction should almost eliminate flow at that point (several miles above Twin Cities Road). What are you plans now?,disconnect, maintain connection at a low flow, something else?? We are sticking to our original plan to not maintain a connection that allows for upstream migration prior to a “natural” conenction. That’s why we asked for a reduction in the canal release. We will monitor current conditions and request changes as needed. Once rainfall generates sufficient natural flow we will request that releases be shut off. If after that point, natural flows do not maintain connection we will request additional releases to maintain connection. All of this is according to our original project plan. Are you soliciting input from the fish agencies? I have spoken with FWS. I'm in meetings this morning,but expect that I will have another 8 messages from the fish guys/management when I return asking me what your plans are. Please feel free to forward all 8 emails to me and I will respond appropriately. >>> "Brook Edwards" <[email protected]> 10/24/2005 5:02:23 PM >>> Gentlemen, After reviewing the progression of the wetting front on the Cosumnes River, we need to change the rate of release from the Folsom South Canal to the Cosumnes River. The river has connected to tide-water and we need the flows to be reduced to 20 cfs. We would appreciate it if this could be done as soon as possible. Please respond to this email with Reclamation's schedule meeting this request. Thanks, Brook R. Edwards Restoration Ecologist Robertson-Bryan, Inc. 9888 Kent Street Elk Grove, CA 95624 Office: 916.714.8351 Cell: 916.216.7330

From: Brook Edwards Sent: Thursday, October 27, 2005 4:30 PM To: Brook Edwards; Larry Rodriguez; 'David Lawson'; 'David Robinson'; 'James Taylor' Cc: Stuart Robertson Subject: REQUEST FOR CHANGE IN FSC RELEASES Gentlemen, After reviewing flows on the Cosumnes River, we need to change the rate of release from the Folsom South Canal to the Cosumnes River. Currently, the connection to tidewater is very weak and is flowing at about 2.5 cfs. We would appreciate it if you could schedule a reduction in flow to 10 cfs within the next 3 days. Please respond to this email with Reclamation's schedule meeting this request. Thanks, Brook R. Edwards Restoration Ecologist Robertson-Bryan, Inc. 9888 Kent Street Elk Grove, CA 95624 Office: 916.714.8351 Cell: 916.216.7330

From: Brook Edwards Sent: Tuesday, November 01, 2005 3:25 PM To: 'James Taylor'; 'David Lawson'; 'David Robinson'; Larry Rodriguez; '[email protected]'; '[email protected]'; '[email protected]'; '[email protected]'; '[email protected]'; '[email protected]'; '[email protected]' Cc: Stuart Robertson Subject: RE: REQUEST FOR CHANGE IN FSC RELEASES All, After reviewing flows on the Cosumnes River, we would appreciate it if you could schedule to shut off the flow from the Folsom South Canal in anticipation of upcoming precipitation. Please respond to this email with Reclamation's schedule meeting this request. Thanks, Brook R. Edwards Restoration Ecologist Robertson-Bryan, Inc. 9888 Kent Street Elk Grove, CA 95624 Office: 916.714.8351 Cell: 916.216.7330

From: Larry Rodriguez <[email protected]> Date: Thu, 3 Nov 2005 10:08:11 -0800 To: Sylvia Wright <[email protected]> Conversation: Cosumnes Project new Coverage Subject: Cosumnes Project new Coverage Sylvia, I am trying to run down all of the media coverage for the Cosumnes River Flow Augmentation Project. So far I have found the Sac Bee Article, Sac Bee Editorial, the Davis Enterprise article, and I know there was a KVIE/UCD spot. Can you give me more info on the KVIE/UCD spot and any other media coverage that I don’t know about. I am compiling a summary of media coverage for the SSCAWA and others. Also, I would like to get a copy of photos that were taken that day, if you can make them available. Hope all is well and thanks for getting all the great coverage of this project.
Larry J. Rodriguez Senior Water Resources Specialist Robertson-Bryan, Inc. Phone: (916) 714-1806 email: [email protected] <mailto:[email protected]> 9888 Kent Street, Elk Grove CA 95624

From: Sylvia Wright [mailto:[email protected]] Sent: Thursday, November 03, 2005 3:46 PM To: Larry Rodriguez Subject: Re: Cosumnes Project new Coverage In external media were these stories; I have full text of all but the Ch. 3 story (I have a dvd of the Ch. 3 story but it has not been transcribed): 10/21/05 Editorial: A river, reborn: Cosumnes gets a new lease on life The Sacramento Bee 10/19/05 River resource KCRA Channel 3 (NBC) 10/19/05 Salmon run restored: Creative flow helps UCD researchers lead way Davis Enterprise 10/18/05 A watershed deal: Increased flows on Cosumnes River will recharge groundwater, aid salmon run The Sacramento Bee In internal media (that is, from my office) were the UC Davis NewsWatch story on KVIE (1 minute, 30 secs) and a story in the campus newspaper, Dateline UC Davis. The Dateline story is online: http://www.dateline.ucdavis.edu/dl_detail.lasso?id=8493 The NewsWatch story may be online; let me check. Will send URL if so. It was satisfying to work on this project. Thank you for all the hard work you did to make it happen. Sylvia .............................................. SYLVIA WRIGHT Public information officer for environmental science & policy News Service University of California, Davis Office (530) 752-7704 Cell (530) 219-8849 E-mail: [email protected] Office location: 334 Mrak Hall News home page: <http://www.news.ucdavis.edu/>

From: Larry Rodriguez Sent: Tuesday, November 08, 2005 5:52 PM To: David Robinson; Trevor Kennedy; James Taylor; David Lawson Cc: Stuart Robertson; Brook Edwards; [email protected] Subject: New Release Procedures for Cosumnes River All, After evaluating the Cosumnes River’s responses to flow releases, the background flow of the river, and projected weather conditions, we would like to request the following changes in operating procedures. Our original project design was based on having a constant controllable flow from the canal, which translated to a constant controllable flow in the Cosumnes River just below the canal. This was based on the fact that there is typically no background flow in the river and all river flows would be derived from canal releases. Under this condition, changes to canal release would be expected to be minimal. This year presents a quite different situation. Background flows in the river have made predicting the river’s response a bit more challenging. However, based on our observations the best approach for creating a stable flow at Blodgett Dam, immediately downstream of the canal, will be to make more frequent adjustments to canal releases based on flows measured at Blodgett. Therefore, we would like to implement the following procedure:
• Field crews measure flows at Blodgett Dam every Monday, Wednesday and Friday morning before 10:00 am. The measured flow value will be transmitted to RBI before 10:30 am. RBI will determine what, if any change needs to be made to canal releases.
• Reclamation be available to make adjustments to canal releases every Monday, Wednesday, and Friday after 12:00 pm. RBI will contact Reclamation with required release changes prior by 11:00 pm.
• Implement this procedure beginning Friday, November 11. The objective is to maintain a flow at Blodgett of 40 cfs, which we estimate will push water to about the Box Culvert. In some cases, there will be no need to change releases from the canal, in other cases there may be a need to change the release by only a few cfs to 10s of cfs. The 40 cfs target will be maintained until natural flows connect the river to tidewater. Given the dry weather pattern ahead of us, that will be weeks away. After we get a “natural” connection, we will reevaluate our target flow at Blodgett, with the goal of maintaining a barrier free migration corridor. The amount of canal release will depend on natural flow conditions.

I intentionally did not send this out to the larger ops email group, because I wanted to make sure that we could work out the kinks of implementing this procedure before we go too “public”. However, we welcome input from all interested parties and other Reclamation or agency reps not included in this email. Thank you,
Larry J. Rodriguez Senior Water Resources Specialist Robertson-Bryan, Inc. Phone: (916) 714-1806 email: [email protected] 9888 Kent Street, Elk Grove CA 95624

From: Larry Rodriguez Sent: Friday, November 11, 2005 10:48 AM To: Keith Whitener; Trevor Kennedy; [email protected]; Cesar Blanco; Nick Hindman ([email protected]) Cc: David Robinson Subject: Cosumnes Flow Releases Folks, I’ve discussed this with some of you and some of you have brought this up independently. If dry conditions continue in the Cosumnes River watershed, do we want to release water from the canal to force a connection to tidewater and attract salmon into the river? This type of action is not part of the typical operations plan, because we surmised that if natural flows were not sufficient to create a connection then the flows in the river would be really low and conditions for salmon would be unacceptable. However, this year is not typical. We have had flow in an extended portion of the river all summer. Meaning, conditions for salmon spawning may be acceptable. I defer to Trevor, in particular, to determine whether this is the case. It would seem like a reasonable use of this year’s water to create an attraction flow for salmon, rather then risking a zero run year. However, the water is being provided from Reclamation and the B2 Program. Therefore, I am not in a position to ask Reclamation to make this adjustment to the operations plan. I believe that the request should come from FWS and AFRP. I am willing to help in whatever manner I can. We have only used 740 ac-ft of the available 5,000 ac-ft. Currently there are no releases being made from the canal and the flow past the canal is just less than 40 cfs. The wetting front is located about 1.5 miles downstream of Hwy 99. The seven day forecast (NOAA) calls for temps in the 70s and no precipitation. Please let me know how you would like to proceed.
Larry J. Rodriguez Senior Water Resources Specialist Robertson-Bryan, Inc. Phone: (916) 714-1806 email: [email protected] 9888 Kent Street, Elk Grove CA 95624

From: Larry Rodriguez Sent: Tuesday, November 15, 2005 2:56 PM To: Keith Whitener; Trevor Kennedy; Cesar Blanco; [email protected]; Jeffery Mount ([email protected]); Peter B. Moyle; Anthony Saracino; Tom Cc: David Thomas; Brook Edwards; Michael Bryan Subject: Cosumnes Flow Release Strategy - Conference call All, To coordinate our request to change the Cosumnes River Flow Augmentation Project, I am requesting a conference call for this Thursday at 9:00 am. Please let me know your availability to participate. As you all know, we are considering changing the operation of the flow augmentation project from a “pre-wetting” program to a “salmon attraction” program. This change is contemplated because of the sustained dry weather pattern we are experiencing (which is jeopardizing this year’s salmon run), our availability of water for this proposed use, the favorable ambient condition of the main spawning reach of the river, and to broaden our experimental design to address additional questions regarding salmon behavior on the Cosumnes River. The B2 Water Program management group will be discussing this issue at their regular Thursday meeting. I am anticipating that USFWS and Reclamation will want to discuss this request with us after that meeting, potentially as early as this Thursday afternoon or Friday. To ensure that “our side” is on the same page, I am requesting the above conference call. To facilitate our coordination RBI, with assistance from Trevor Kennedy, is preparing a brief memo addressing the following issues:
• Original project operations • Reasons for changing operations • Hypotheses that will to evaluated through this new “experiment.”
Our experience tell us that USFWS will want to know what benefit will be derived from this program and use of the B2 water. A clear and coordinated response to that question will strengthen our case and, more importantly, will facilitate a quick response. Ideally, we would like to begin attraction release before Thanksgiving. Please provide a response regarding your availability for the conference call or if you have any other questions.
Larry J. Rodriguez Senior Water Resources Specialist Robertson-Bryan, Inc. Phone: (916) 714-1806 email: [email protected] 9888 Kent Street, Elk Grove CA 95624

From: Larry Rodriguez Sent: Friday, November 18, 2005 9:27 AM To: David Robinson; [email protected]; [email protected]; [email protected]; [email protected]; Paul Fujitani; Thuy Washburn; [email protected]; <"Keith Whitener" Subject: RE: Cosumnes conference # All, To help facilitate this morning's conference call, attached is a memo outlining the conditions on the Cosumnes River and proposed operational changes being requested by The Nature Conservancy, Fisheries Foundation and Southeast Sacramento County Agricultural Water Agency. Thank you, Larry J. Rodriguez Robertson-Bryan, Inc.

From: Larry Rodriguez Sent: Monday, November 21, 2005 11:24 AM To: 'James Taylor'; 'David Lawson'; 'David Robinson'; '[email protected]'; '[email protected]'; '[email protected]'; '[email protected]'; '[email protected]'; '[email protected]'; '[email protected]' Cc: Stuart Robertson; Brook Edwards; Trevor Kennedy; Cesar Blanco; [email protected] Subject: REQUEST FOR CHANGE IN FSC RELEASES
Gentlemen, We would like to request that releases from Folsom South Canal to the Cosumnes River be reinitiated at a rate of 5-8 cfs, closer to 8 cfs if possible. We will be trying to maintain 40 cfs just below the canal, within the infrastructure capabilities. Our goal is to try to move the wetting front a few more miles downstream. The front has been creeping back upstream as a results of slightly declining flows at Michigan Bar (currently at 30 cfs) and dry conditions in the lower river channel. This supplemental release should move the wetting front back to about 2 mile upstream of tidewater. Thank you,
Larry J. Rodriguez Senior Water Resources Specialist Robertson-Bryan, Inc. Phone: (916) 714-1806 email: [email protected] 9888 Kent Street, Elk Grove CA 95624

From: [email protected] [mailto:[email protected]] Sent: Monday, November 21, 2005 3:31 PM To: Tom Cc: [email protected]; Gary Bobker; Randy Brown; Michael Bryan; [email protected]; cosumnes; [email protected]; CSBA-Jack (E-mail); Dan B. Odenweller; [email protected]; [email protected]; [email protected]; [email protected]; Douglas W. Lovell; [email protected]; Ed Pert; Erwin Van Nieuwenhuyse; Felix E Smith; Zeke Grader; Gary Adams; Gary Adams; Gonzalo Castillo; [email protected]; John Beuttler; Gerald Meral; Joe Merz; John Nelson; John C Baker; [email protected]; Jim White; Kenneth Lentz; [email protected]; [email protected]; Lester Snow; Leo Winternitz; [email protected]; Marty Gingras; [email protected]; [email protected]; Matt Weiser; Peter B. Moyle; Dick Shannon; Fris, Rebecca; Whitey Rasmussen (E-mail); [email protected]; Guillen, Sergio@CalWater; Spaar, Stephani; [email protected]; Red Bartley (E-mail); Tina Swanson; [email protected]; Tom Philp Subject: Re: Fw: Cosumnes Flow Release Strategy - Conference call Tom, I think it is important for everyone to understand that the b2 releases were never meant to serve as supplemental surface flows. The intent of the "COSUMNES RIVER FLOW AUGMENTATION PROJECT 2005 PILOT PROJECT OPERATION PLAN" was to use water from the Folsom South Canal to pre-wet the channel bed so that when natural rain-fall occurred the connection to the spawning reaches would occur sooner. There was never any agreement that we would use this water for supplemental surface flow. In fact it was my understanding that b2 managers explicitly stated that the water was not to be used for supplementing surface flow. This decision, however, does not affect the originally stated purpose of the Pilot Study and that is to pre-wet the channel bed and hope for rain. Cesar Cadena Blanco, Ph.D. Habitat Restoration Coordinator U.S. Fish and Wildlife Service Anadromous Fish Restoration Program 4001 N. Wilson Way Stockton, CA 95205 (209) 946-6400 x. 315 (209)403-1457 (cell) (209)946-6355 (FAX) http://www.delta.dfg.ca.gov/afrp/

From: Brook Edwards Sent: Wednesday, November 30, 2005 10:31 AM To: Larry Rodriguez; 'James Taylor'; 'David Lawson'; 'David Robinson'; '[email protected]'; '[email protected]'; '[email protected]'; '[email protected]'; '[email protected]'; '[email protected]'; '[email protected]' Cc: Stuart Robertson; 'Trevor Kennedy'; 'Cesar Blanco'; '[email protected]' Subject: RE: REQUEST FOR CHANGE IN FSC RELEASES
Gentlemen, We would like to request that releases from Folsom South Canal to the Cosumnes River be shut off. Thank you, Brook R. Edwards Restoration Ecologist Robertson-Bryan, Inc. 9888 Kent Street Elk Grove, CA 95624 Office: 916.714.8351 Cell: 916.216.7330

From: Larry Rodriguez Sent: Friday, December 16, 2005 1:48 PM To: '[email protected]'; David Robinson Subject: Cosumnes River Project for next year.
Nick & Dave, The flow augmentation program is coming to a close and I think that we can call this a successful experiment. When we finally received enough precipitation to increase the natural river flow the river was able to establish a connection to tidewater at about 50-55 cfs (measured at Michigan Bar). This connection was strong enough that we also saw fish moving into the river. Compare this to our original estimate of needing a minimum of 110 cfs flow spike or more than 65 cfs for a sustained period (+7 days) to create connection. Given the wet conditions in the river, prior to the start of the project, we have released less than 1,000 af into the river. Looking forward to next, I am unsure whether our permanent water supply from the County will be available by next October. Therefore, I would like to start the ball rolling on trying to secure water from the B2 Program next year. The simplest approach might be to allow us to retain the unused portion of water, slightly more then 4,000 af, for next year. I have sent this email to just you two, to seek some input on the best approach to making this request. Larry J. Rodriguez Senior Water Resources Specialist Robertson-Bryan, Inc. Phone: (916) 714-1806 email: [email protected] 9888 Kent Street, Elk Grove CA 95624

From: [email protected] [mailto:[email protected]] Sent: Monday, December 19, 2005 3:15 PM To: Larry Rodriguez Cc: David Robinson Subject: Re: Cosumnes River Project for next year. Larry and Dave, I agree that this year's pilot project on the Cosumnes was worthwhile and I hope it proves to be successful. That said, the B2IT group was very clear that this was a one-time pilot effort using 5 TAF of banked b2 water. In all likelyhood the remaining 4 TAF of banked water earmarked for the Cosumnes study will spill if/when Folsom goes into flood control releases. You're welcome to pitch the idea of another Cosumnes effort in 2006 to B2IT, but I wouldn't be too optimistic. Nick Hindman Fishery Biologist USF&WS, Sacramento CA (916) 414-6543

From: David Robinson [mailto:[email protected]] Sent: Tuesday, December 20, 2005 8:00 AM To: Larry Rodriguez Subject: Re: Cosumnes River Project for next year. Nick responded as I expected, hoever, you might try a couple of strategies. First try and get the project dayligheted in some of the annual science conferences/reviews. I know that when the EWA Science Review Panel looked at past EWA actions, the one they thought was one of the more beneficial actions taken was bypassing power production at Folsom to provide cold water. To the extent you can get independent reviewers to laud the merits of the project, the easier it would be to get the Service to dedicate some water in the future. Meantime, we should have some conversations about how we would account for the Aerojet water and what it will take to utilize that supply for your purposes. I know that ball is really in the County's court, but the sooner we get a group on the same page, the sooner you might have a more reliable supply. It is going to require quite a bit of analysis and discussion to come up with a proposal for use that Reclamation can live with.

From: Larry Rodriguez Sent: Tuesday, December 20, 2005 8:28 AM To: David Robinson Subject: RE: Cosumnes River Project for next year. Thanks for you input Dave. I put some thouhght into our approach with FWS with others. As for the long-term supply I am trying to get the county to re-work their management strategy to avoid an excahnge agreement. They will be supplying more then 40 cfs to the American River on a daily basis, so if we can manage that with all the other user, then we can simply divert wants needed on the Cosumnes (Oct-Dec) and in the remainder of the year the other users can take all the Aeroject discharge. I think that are coming round to the idea. I'll try to get something set up to explore this option from all sides. Have a Merry Christmas and Best in the New Year. Larry J. Rodriguez Robertson-Bryan, Inc.