Exhibit C - Attachments to Settlement Agreement - California ...
250
-
Upload
khangminh22 -
Category
Documents
-
view
5 -
download
0
Transcript of Exhibit C - Attachments to Settlement Agreement - California ...

sbf
Typewritten Text
A.15-07-015 ALJ/DB3/sbf
sbf
Typewritten Text
EXHIBIT C
sbf
Typewritten Text
ATTACHMENT TO SETTLEMENT AGREEMENT
sbf
Typewritten Text
sbf
Typewritten Text
sbf
Typewritten Text
sbf
Typewritten Text
sbf
Typewritten Text
sbf
Typewritten Text
sbf
Typewritten Text
sbf
Typewritten Text
sbf
Typewritten Text

Attachment 1
REVENUE INCREASE TABLES
SUMMARY OF EARNINGS COMPARISON TABLESAND
A.15-07-015 ALJ/DB3/sbf

TOTAL COMPANY
Attachment 1
SECTION A
SUMMARY OF EARNINGS COMPARISON TABLES
REVENUE INCREASE TABLESAND
2

Dist
rict
Sett
lem
ent
Reve
nue
Last
Ado
pted
Re
venu
e
2017
$ In
crea
se
(000
s)
2017
%
Incr
ease
2018
$ In
crea
se
(000
s)
2018
%
Incr
ease
201
9$
Incr
ease
(0
00s)
2019
%
Incr
ease
Bay
Area
Reg
ion*
85,3
53.5
$
84
,822
.1$
53
1.4
$
0.6%
2,14
4.5
$
2.5%
1,46
2.1
$
1.
7%Ba
kers
field
76,6
71.8
$
72
,535
.1$
4,
136.
6$
5.7%
3,13
9.0
$
4.1%
3,09
6.0
$
3.
9%Be
ar G
ulch
54,1
51.0
$
50
,302
.2$
3,
848.
8$
7.7%
1,35
9.0
$
2.5%
1,31
7.1
$
2.
4%Ch
ico
23,3
53.6
$
21
,873
.5$
1,
480.
1$
6.8%
527.
2$
2.3%
518.
1$
2.
2%Di
xon
3,42
7.0
$
3,07
3.5
$
353.
5$
11
.5%
20.8
$
0.6%
20.4
$
0.
6%Do
min
guez
70,4
56.4
$
62
,092
.8$
8,
363.
6$
13.5
%85
1.4
$
1.
2%81
6.5
$
1.1%
East
Los
Ang
eles
34,3
59.2
$
34
,905
.3$
(5
46.1
)$
-1
.6%
1,41
7.0
$
4.1%
1,38
0.3
$
3.
9%
Herm
osa
Redo
ndo
29,7
12.0
$
29
,982
.1$
(2
70.2
)$
-0
.9%
285.
5$
1.0%
286.
0$
1.
0%
Kern
Riv
er V
alle
y6,
717.
6$
6,
248.
6$
46
9.0
$
7.5%
89.6
$
1.3%
66.6
$
1.
0%Li
verm
ore
24,3
63.3
$
23
,153
.5$
1,
209.
8$
5.2%
457.
9$
1.9%
457.
2$
1.
8%Lo
s Alto
s35
,761
.7$
29,2
73.4
$
6,48
8.3
$
22
.2%
1,25
1.7
$
3.5%
1,25
9.2
$
3.
4%
L.A.
Cou
nty
Regi
on*
49,5
25.7
$
47
,681
.3$
1,
844.
4$
3.9%
952.
5$
1.9%
996.
7$
2.
0%M
arys
ville
3,95
3.8
$
3,73
7.8
$
216.
0$
5.
8%63
.7$
1.
6%63
.9$
1.6%
Mon
tere
y Re
gion
*37
,623
.9$
32,1
81.3
$
5,44
2.7
$
16
.9%
1,31
6.7
$
3.5%
1,31
6.7
$
3.
4%O
rovi
lle5,
222.
6$
4,
515.
4$
70
7.2
$
15.7
%13
5.2
$
2.
6%13
5.6
$
2.5%
Selm
a5,
631.
4$
5,
100.
2$
53
1.2
$
10.4
%28
.0$
0.
5%25
.8$
0.5%
Stoc
kton
48,8
88.2
$
41
,710
.2$
7,
178.
0$
17.2
%2,
180.
7$
4.
5%2,
120.
4$
4.2%
Visa
lia29
,554
.7$
26,8
65.1
$
2,68
9.6
$
10
.0%
748.
9$
2.5%
756.
7$
2.
5%W
estla
ke18
,380
.7$
18,1
67.4
$
213.
4$
1.
2%13
5.8
$
0.
7%13
6.0
$
0.7%
Will
ows
2,46
7.8
$
2,38
3.9
$
83.9
$
3.
5%53
.6$
2.
2%53
.3$
2.1%
Tota
l64
5,57
5.9
$
60
0,60
4.6
$
44
,971
.3$
7.
5%17
,158
.7$
2.
7%16
,284
.7$
2.
5%
Sett
lem
ent C
hang
e fr
om L
ast A
dopt
ed R
even
ue -
with
Con
solid
ated
Dis
tric
ts*
($ in
1,0
00s)
\\file
serv
er\c
alw
ater
\Rat
es\R
ate
Cas
e 20
15\S
Set
tlem
ent\A
ttach
men
t to
Settl
emen
t Agr
eem
ent\P
re-fi
nals
for O
RA
9-2\
Atta
ch 1
- SO
E T
able
s - C
WS
9-2
- v0
2Rev
Inc
Sum
mar
y (C
onso
lidat
ed)9
/2/2
0161
2:34
PM

2015
GRC
Dist
rict
Sett
lem
ent
Reve
nue
Last
Ado
pted
Re
venu
e
2017
$ In
crea
se
(000
s)
2017
%
Incr
ease
2018
$ In
crea
se
(000
s)
2018
%
Incr
ease
201
9$
Incr
ease
(0
00s)
2019
%
Incr
ease
Ante
lope
Val
ley*
3,18
1.4
$
2,44
8.0
$
73
3.5
$
30.0
%57
.7$
1.
8%68
.1$
2.1%
Bays
hore
*81
,478
.4$
81,2
87.4
$
190.
9$
0.
2%2,
105.
4$
2.
6%1,
950.
1$
2.3%
Bake
rsfie
ld76
,671
.8$
72,5
35.1
$
4,13
6.6
$
5.
7%3,
139.
0$
4.
1%3,
096.
0$
3.9%
Bear
Gul
ch54
,151
.0$
50,3
02.2
$
3,84
8.8
$
7.
7%1,
359.
0$
2.
5%1,
317.
1$
2.4%
Chic
o23
,353
.6$
21,8
73.5
$
1,48
0.1
$
6.
8%52
7.2
$
2.
3%51
8.1
$
2.2%
Dixo
n3,
427.
0$
3,
073.
5$
353.
5$
11
.5%
20.8
$
0.6%
20.4
$
0.
6%Do
min
guez
70,4
56.4
$
62
,092
.8$
8,
363.
6$
13.5
%85
1.4
$
1.
2%81
6.5
$
1.1%
East
Los
Ang
eles
34,3
59.2
$
34
,905
.3$
(5
46.1
)$
-1
.6%
1,41
7.0
$
4.1%
1,38
0.3
$
3.
9%He
rmos
a Re
dond
o29
,712
.0$
29,9
82.1
$
(270
.2)
$
-0.9
%28
5.5
$
1.
0%28
6.0
$
1.0%
Kern
Riv
er V
alle
y6,
717.
6$
6,
248.
6$
469.
0$
7.
5%89
.6$
1.
3%66
.6$
1.0%
King
City
*3,
586.
8$
3,
403.
1$
183.
7$
5.
4%87
.3$
2.
4%92
.6$
2.5%
Live
rmor
e24
,363
.3$
23,1
53.5
$
1,20
9.8
$
5.
2%45
7.9
$
1.
9%45
7.2
$
1.8%
Los A
ltos
35,7
61.7
$
29
,273
.4$
6,
488.
3$
22.2
%1,
251.
7$
3.
5%1,
259.
2$
3.4%
Ma r
ysvi
lle3,
953.
8$
3,
737.
8$
216.
0$
5.
8%63
.7$
1.
6%63
.9$
1.6%
Oro
ville
5,22
2.6
$
4,51
5.4
$
70
7.2
$
15.7
%13
5.2
$
2.
6%13
5.6
$
2.5%
Palo
s Ver
des*
46,9
22.5
$
45
,233
.3$
1,
689.
3$
3.7%
921.
2$
2.0%
938.
8$
2.
0%Re
dwoo
d - C
oast
Spr
ings
*54
2.6
$
51
9.2
$
23.5
$
4.
5%2.
9$
0.5%
2.9
$
0.5%
Redw
ood
- Luc
erne
*2,
544.
5$
2,
213.
1$
331.
4$
15
.0%
38.4
$
1.5%
35.5
$
1.
4%Re
dwoo
d - U
nifie
d*78
9.5
$
80
2.4
$
(12.
9)$
-1.6
%13
.3$
1.
7%17
.2$
2.1%
Salin
as*
33,7
34.1
$
28
,778
.2$
4,
955.
9$
17.2
%1,
478.
6$
4.
4%1,
472.
1$
4.2%
Selm
a5,
631.
4$
5,
100.
2$
531.
2$
10
.4%
28.0
$
0.5%
25.8
$
0.
5%St
ockt
on48
,888
.2$
41,7
10.2
$
7,17
8.0
$
17
.2%
2,18
0.7
$
4.5%
2,12
0.4
$
4.
2%Vi
salia
29,5
54.7
$
26
,865
.1$
2,
689.
6$
10.0
%74
8.9
$
2.
5%75
6.7
$
2.5%
Wes
tlake
18,3
80.7
$
18
,167
.4$
21
3.4
$
1.2%
135.
8$
0.7%
136.
0$
0.
7%W
illow
s2,
467.
8$
2,
383.
9$
83.9
$
3.
5%53
.6$
2.
2%53
.3$
2.1%
Tota
l64
5,85
2.7
$
60
0,60
4.6
$
45
,248
.1$
7.
5%17
,449
.8$
2.
7%17
,086
.4$
2.
6%
2015
GRC
Regi
onSe
ttle
men
t Re
venu
eLa
st A
dopt
ed
Reve
nue
2017
$ In
crea
se
(000
s)
2017
%
Incr
ease
2018
$ In
crea
se
(000
s)
2018
%
Incr
ease
201
9$
Incr
ease
(0
00s)
2019
%
Incr
ease
Bay
Area
Reg
ion
85,3
53.5
$
84
,822
.1$
53
1.4
$
0.6%
2,14
4.5
$
2.5%
1,46
2.1
$
1.
7%Lo
s Ang
eles
Cou
nty
Regi
on49
,525
.7$
47,6
81.3
$
1,84
4.4
$
3.
9%95
2.5
$
1.
9%99
6.7
$
2.0%
Mon
tere
y Re
gion
37,6
23.9
$
32
,181
.3$
5,
442.
7$
16.9
%1,
316.
7$
3.
5%1,
316.
7$
3.4%
Tota
l87
,149
.6$
79,8
62.5
$
7,28
7.1
$
9.
1%2,
269.
2$
2.
6%2,
313.
4$
2.6%
Sum
mar
y of
Rev
enue
Cha
nges
from
Las
t Ado
pted
Rev
enue
s (w
ith In
divi
dual
Dis
tric
ts F
or In
form
atio
n O
nly*
)
Sum
mar
y of
Rev
enue
Cha
nges
from
Las
t Ado
pted
Rev
enue
s - C
onso
lidat
ed R
egio
ns
\\file
serv
er\c
alw
ater
\Rat
es\R
ate
Cas
e 20
15\S
Set
tlem
ent\A
ttach
men
t to
Settl
emen
t Agr
eem
ent\P
re-fi
nals
for O
RA
9-2\
Atta
ch 1
- SO
E Ta
bles
- C
WS
9-2
- v02
Prop
osed
Rev
vs
Adop
ted
Rev
9/2/
2016
12:3
4 PM

Utility ORAItem Estimate Estimate Settlement
(Thousands of $)
Operating revenues 586,009.6$ 587,476.9$ 622,073.3$
Operating expenses: Operation & Maintenance 281,104.1$ 280,340.7$ 301,388.3$ Administrative & General 31,526.2$ 22,715.2$ 28,652.5$ Payroll 45,907.3$ 45,324.8$ 46,085.3$ G. O. Prorated Exp. 81,906.7$ 69,453.2$ 76,451.3$ Dep'n & Amortization 67,790.8$ 59,779.9$ 61,947.8$ Taxes other than income 19,508.9$ 17,596.4$ 19,118.5$ State Corp. Franchise Tax (2,067.6)$ 6,588.4$ 3,007.4$ Federal Income Tax 10,627.3$ 21,034.8$ 20,450.3$
Total operating exp. 536,303.8$ 522,833.5$ 557,101.2$
Net operating revenue 49,705.9$ 64,643.4$ 64,972.0$
Rate base 1,248,245.0$ 871,728.4$ 996,416.0$
Return on rate base 3.98% 7.42% 6.52%
Attachment 1 to Settlement Agreement
SUMMARY OF EARNINGS COMPARISON TABLE
California Water Service Company (Total Company)
Test Year 2017
Present Rates
(With Consolidated Regions)
5

Utility ORAItem Estimate Estimate Settlement
(Thousands of $)
Operating revenues 669,439.8$ 594,963.1$ 645,575.9$
Operating expenses: Operation & Maintenance 281,312.0$ 280,349.1$ 301,463.3$ Administrative & General 31,526.2$ 22,715.2$ 28,652.5$ Payroll 45,907.3$ 45,324.8$ 46,085.3$ G. O. Prorated Exp. 82,576.4$ 69,453.2$ 76,451.3$ Dep'n & Amortization 67,790.8$ 59,779.9$ 61,947.8$ Taxes other than income 20,228.4$ 17,681.4$ 19,340.7$ State Corp. Franchise Tax 5,227.8$ 7,241.9$ 5,083.0$ Federal Income Tax 35,760.0$ 23,172.1$ 27,436.2$
Total operating exp. 570,329.0$ 525,717.7$ 566,460.0$
Net operating revenue 99,110.7$ 69,245.3$ 79,115.9$
Rate base 1,248,245.0$ 871,728.4$ 996,416.0$
Return on rate base 7.94% 7.94% 7.94%
Attachment 1 to Settlement Agreement
California Water Service Company (Total Company)
Test Year 2017
PROPOSED RATES
SUMMARY OF EARNINGS COMPARISON TABLE
(With Consolidated Regions)
6

SUMMARY OF EARNINGS COMPARISON TABLES
INDIVIDUAL DISTRICTS
Attachment 1
SECTION B
7

Utility ORAItem Estimate Estimate Settlement
Operating revenues 2,486.3$ 2,488.3$ 2,695.8$
Operating expenses: Operation & Maintenance 600.8$ 565.5$ 587.7$ Administrative & General 281.1$ 207.6$ 255.2$ Payroll 322.9$ 301.3$ 311.1$ G. O. Prorated Exp. 305.7$ 238.7$ 382.6$ Depreciation 511.3$ 480.9$ 500.7$ Taxes other than income 154.8$ 146.4$ 150.8$ State Corp. Franchise Tax 2.0$ 43.9$ 23.0$ Federal Income Tax (2.6)$ 85.9$ 74.7$
Total operating exp. 2,175.9$ 2,070.1$ 2,286.0$
Net operating revenue 310.4$ 418.2$ 409.8$
Rate base 10,972.2$ 8,025.5$ 8,884.4$
Return on rate base 2.83% 5.21% 4.61%
Attachment 1 to Settlement Agreement
SUMMARY OF EARNINGS COMPARISON TABLE
Antelope Valley District
Test Year 2017
Present Rates
(Thousands of $)
(Now consolidated into LA County Region - see Section C of this attachment)
8

Utility ORAItem Estimate Estimate Settlement
Operating revenues 3,407.8$ 2,848.6$ 3,181.4$
Operating expenses: Operation & Maintenance 607.7$ 568.3$ 591.3$ Administrative & General 281.1$ 207.6$ 255.2$ Payroll 322.9$ 301.3$ 311.1$ G. O. Prorated Exp. 305.7$ 238.7$ 382.6$ Depreciation 511.3$ 480.9$ 500.7$ Taxes other than income 159.9$ 148.4$ 153.5$ State Corp. Franchise Tax 82.4$ 75.3$ 65.4$ Federal Income Tax 265.6$ 190.7$ 216.1$
Total operating exp. 2,536.5$ 2,211.1$ 2,475.9$
Net operating revenue 871.3$ 637.5$ 705.5$
Rate base 10,972.2$ 8,025.5$ 8,884.4$
Return on rate base 7.94% 7.94% 7.94%
Attachment 1 to Settlement Agreement
(Thousands of $)
Antelope Valley District
Test Year 2017
PROPOSED RATES
SUMMARY OF EARNINGS COMPARISON TABLE
(Now consolidated into LA County Region - see Section C of this attachment)
9

Utility ORAItem Estimate Estimate Settlement
Operating revenues 73,421.7$ 73,014.1$ 75,142.1$
Operating expenses: Operation & Maintenance 26,545.9$ 25,547.0$ 26,927.6$ Administrative & General 3,231.6$ 1,994.6$ 2,919.2$ Payroll 5,801.4$ 5,737.0$ 6,107.1$ G. O. Prorated Exp. 12,641.3$ 10,707.8$ 11,738.0$ Depreciation 10,529.2$ 9,677.2$ 10,104.1$ Taxes other than income 2,968.5$ 2,787.3$ 2,922.2$ State Corp. Franchise Tax 512.2$ 1,383.7$ 834.3$ Federal Income Tax 2,156.3$ 3,980.8$ 3,325.2$
Total operating exp. 64,386.4$ 61,815.4$ 64,877.8$
Net operating revenue 9,035.3$ 11,198.7$ 10,264.3$
Rate base 162,459.8$ 116,422.2$ 141,269.9$
Return on rate base 5.56% 9.62% 7.27%
Attachment 1 to Settlement Agreement
SUMMARY OF EARNINGS COMPARISON TABLE
Bakersfield District
Test Year 2017
Present Rates
(Thousands of $)
10

Utility ORAItem Estimate Estimate Settlement
Operating revenues 79,845.9$ 69,526.4$ 76,671.8$
Operating expenses: Operation & Maintenance 26,586.5$ 25,524.9$ 26,937.3$ Administrative & General 3,231.6$ 1,994.6$ 2,919.2$ Payroll 5,801.4$ 5,737.0$ 6,107.1$ G. O. Prorated Exp. 12,641.3$ 10,707.8$ 11,738.0$ Depreciation 10,529.2$ 9,677.2$ 10,104.1$ Taxes other than income 3,053.9$ 2,741.0$ 2,942.5$ State Corp. Franchise Tax 1,069.0$ 1,081.4$ 966.8$ Federal Income Tax 4,033.7$ 2,814.5$ 3,739.9$
Total operating exp. 66,946.6$ 60,278.4$ 65,454.9$
Net operating revenue 12,899.3$ 9,248.0$ 11,216.8$
Rate base 162,459.8$ 116,422.2$ 141,269.9$
Return on rate base 7.94% 7.94% 7.94%
Attachment 1 to Settlement Agreement
(Thousands of $)
SUMMARY OF EARNINGS COMPARISON TABLE
Bakersfield District
Test Year 2017
PROPOSED RATES
11

Utility ORAItem Estimate Estimate Settlement
Operating revenues 73,976.1$ 73,432.6$ 78,048.9$
Operating expenses: Operation & Maintenance 47,568.0$ 46,919.3$ 50,157.3$ Administrative & General 2,150.1$ 1,544.4$ 1,964.8$ Payroll 3,311.9$ 3,258.3$ 3,306.9$ G. O. Prorated Exp. 8,238.8$ 6,978.5$ 7,650.0$ Depreciation 6,931.6$ 6,224.1$ 6,085.4$ Taxes other than income 1,314.9$ 1,164.6$ 1,235.6$ State Corp. Franchise Tax (7.2)$ 486.2$ 262.4$ Federal Income Tax 613.5$ 1,673.6$ 1,861.7$
Total operating exp. 70,121.6$ 68,249.0$ 72,524.3$
Net operating revenue 3,854.5$ 5,183.6$ 5,524.6$
Rate base 117,415.8$ 90,633.7$ 95,165.4$
Return on rate base 3.28% 5.72% 5.81%
Attachment 1 to Settlement Agreement
SUMMARY OF EARNINGS COMPARISON TABLE
Bayshore District
Test Year 2017
Present Rates
(Thousands of $)
(Now consolidated into Bay Area Region - see Section C of this attachment)
12

Utility ORAItem Estimate Estimate Settlement
Operating revenues 83,210.7$ 76,834.9$ 81,478.4$
Operating expenses: Operation & Maintenance 47,575.5$ 46,921.3$ 50,160.1$ Administrative & General 2,150.1$ 1,544.4$ 1,964.8$ Payroll 3,311.9$ 3,258.3$ 3,306.9$ G. O. Prorated Exp. 8,238.8$ 6,978.5$ 7,650.0$ Depreciation 6,931.6$ 6,224.1$ 6,085.4$ Taxes other than income 1,314.9$ 1,164.6$ 1,235.6$ State Corp. Franchise Tax 808.5$ 786.8$ 565.3$ Federal Income Tax 3,556.5$ 2,757.6$ 2,954.0$
Total operating exp. 73,887.8$ 69,635.4$ 73,922.2$
Net operating revenue 9,322.8$ 7,199.5$ 7,556.1$
Rate base 117,415.8$ 90,633.7$ 95,165.4$
Return on rate base 7.94% 7.94% 7.94%
Attachment 1 to Settlement Agreement
(Thousands of $)
SUMMARY OF EARNINGS COMPARISON TABLE
Bayshore District
Test Year 2017
PROPOSED RATES
(Now consolidated into Bay Area Region - see Section C of this attachment)
13

Utility ORAItem Estimate Estimate Settlement
Operating revenues 49,244.4$ 48,994.6$ 52,642.0$
Operating expenses: Operation & Maintenance 28,407.2$ 28,029.3$ 30,319.0$ Administrative & General 1,894.5$ 1,459.6$ 1,774.3$ Payroll 2,375.5$ 2,353.0$ 2,373.6$ G. O. Prorated Exp. 5,020.5$ 4,252.5$ 4,661.7$ Depreciation 4,712.5$ 4,147.5$ 4,325.1$ Taxes other than income 1,558.6$ 1,411.2$ 1,542.1$ State Corp. Franchise Tax (51.0)$ 547.2$ 324.1$ Federal Income Tax 954.8$ 1,758.7$ 1,813.2$
Total operating exp. 44,872.6$ 43,958.9$ 47,133.1$
Net operating revenue 4,371.9$ 5,035.7$ 5,508.9$
Rate base 97,851.9$ 67,250.2$ 80,585.2$
Return on rate base 4.47% 7.49% 6.84%
Attachment 1 to Settlement Agreement
SUMMARY OF EARNINGS COMPARISON TABLE
Bear Gulch District
Test Year 2017
Present Rates
(Thousands of $)
14

Utility ORAItem Estimate Estimate Settlement
Operating revenues 55,029.6$ 49,509.2$ 54,151.0$
Operating expenses: Operation & Maintenance 28,411.8$ 28,029.7$ 30,320.2$ Administrative & General 1,894.5$ 1,459.6$ 1,774.3$ Payroll 2,375.5$ 2,353.0$ 2,373.6$ G. O. Prorated Exp. 5,020.5$ 4,252.5$ 4,661.7$ Depreciation 4,712.5$ 4,147.5$ 4,325.1$ Taxes other than income 1,613.0$ 1,416.0$ 1,556.3$ State Corp. Franchise Tax 455.2$ 592.2$ 456.1$ Federal Income Tax 2,777.3$ 1,916.7$ 2,285.2$
Total operating exp. 47,260.2$ 44,167.2$ 47,752.5$
Net operating revenue 7,769.4$ 5,342.0$ 6,398.5$
Rate base 97,851.9$ 67,250.2$ 80,585.2$
Return on rate base 7.94% 7.94% 7.94%
Attachment 1 to Settlement Agreement
(Thousands of $)
SUMMARY OF EARNINGS COMPARISON TABLE
Bear Gulch District
Test Year 2017
PROPOSED RATES
15

Utility ORAItem Estimate Estimate Settlement
Operating revenues 23,065.9$ 22,966.7$ 24,765.4$
Operating expenses: Operation & Maintenance 4,034.0$ 3,763.7$ 3,784.1$ Administrative & General 1,959.5$ 1,435.6$ 1,819.8$ Payroll 3,038.6$ 2,987.0$ 2,996.7$ G. O. Prorated Exp. 4,823.2$ 4,085.3$ 4,478.5$ Depreciation 3,911.3$ 3,789.7$ 3,801.2$ Taxes other than income 979.6$ 867.4$ 924.0$ State Corp. Franchise Tax (2.1)$ 428.4$ 413.9$ Federal Income Tax 920.7$ 1,441.4$ 1,692.0$
Total operating exp. 19,664.7$ 18,798.5$ 19,910.2$
Net operating revenue 3,401.2$ 4,168.2$ 4,855.2$
Rate base 64,530.8$ 44,938.6$ 50,122.6$
Return on rate base 5.27% 9.28% 9.69%
Attachment 1 to Settlement Agreement
SUMMARY OF EARNINGS COMPARISON TABLE
Chico District
Test Year 2017
Present Rates
(Thousands of $)
16

Utility ORAItem Estimate Estimate Settlement
Operating revenues 25,843.8$ 22,001.7$ 23,353.6$
Operating expenses: Operation & Maintenance 4,039.2$ 3,762.0$ 3,781.6$ Administrative & General 1,959.5$ 1,435.6$ 1,819.8$ Payroll 3,038.6$ 2,987.0$ 2,996.7$ G. O. Prorated Exp. 4,823.2$ 4,085.3$ 4,478.5$ Depreciation 3,911.3$ 3,789.7$ 3,801.2$ Taxes other than income 979.6$ 867.4$ 924.0$ State Corp. Franchise Tax 243.0$ 343.2$ 289.3$ Federal Income Tax 1,725.7$ 1,161.8$ 1,282.8$
Total operating exp. 20,720.1$ 18,432.0$ 19,373.9$
Net operating revenue 5,123.7$ 3,569.7$ 3,979.7$
Rate base 64,530.8$ 44,938.6$ 50,122.6$
Return on rate base 7.94% 7.94% 7.94%
Attachment 1 to Settlement Agreement
(Thousands of $)
SUMMARY OF EARNINGS COMPARISON TABLE
Chico District
Test Year 2017
PROPOSED RATES
17

Utility ORAItem Estimate Estimate Settlement
Operating revenues 3,030.2$ 2,989.5$ 3,256.2$
Operating expenses: Operation & Maintenance 602.4$ 441.3$ 468.1$ Administrative & General 334.4$ 268.5$ 316.5$ Payroll 322.9$ 312.1$ 321.8$ G. O. Prorated Exp. 506.5$ 428.9$ 470.1$ Depreciation 447.7$ 434.3$ 447.4$ Taxes other than income 182.7$ 179.1$ 185.8$ State Corp. Franchise Tax 12.7$ 52.6$ 47.0$ Federal Income Tax 116.7$ 193.0$ 240.3$
Total operating exp. 2,526.1$ 2,309.8$ 2,497.1$
Net operating revenue 504.2$ 679.7$ 759.1$
Rate base 12,795.4$ 10,408.3$ 10,893.4$
Return on rate base 3.94% 6.53% 6.97%
Attachment 1 to Settlement Agreement
SUMMARY OF EARNINGS COMPARISON TABLE
Dixon District
Test Year 2017
Present Rates
(Thousands of $)
18
Utility ORAItem Estimate Estimate Settlement
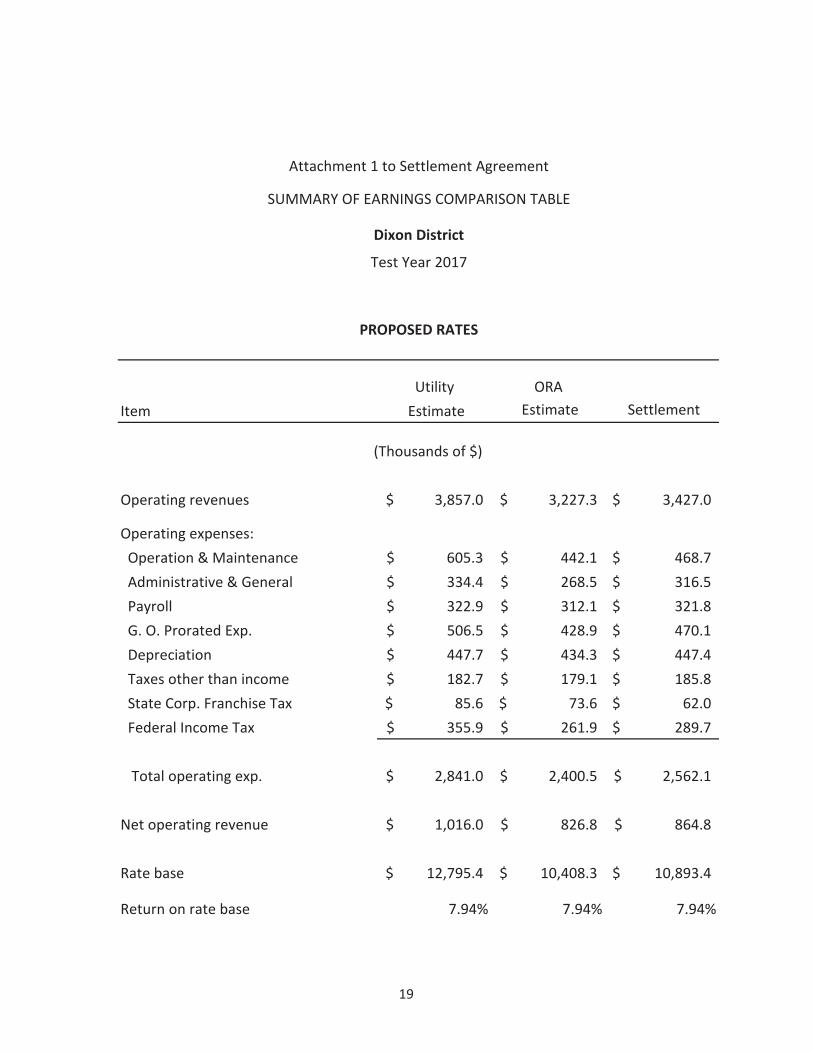
Operating revenues 3,857.0$ 3,227.3$ 3,427.0$
Operating expenses: Operation & Maintenance 605.3$ 442.1$ 468.7$ Administrative & General 334.4$ 268.5$ 316.5$ Payroll 322.9$ 312.1$ 321.8$ G. O. Prorated Exp. 506.5$ 428.9$ 470.1$ Depreciation 447.7$ 434.3$ 447.4$ Taxes other than income 182.7$ 179.1$ 185.8$ State Corp. Franchise Tax 85.6$ 73.6$ 62.0$ Federal Income Tax 355.9$ 261.9$ 289.7$
Total operating exp. 2,841.0$ 2,400.5$ 2,562.1$
Net operating revenue 1,016.0$ 826.8$ 864.8$
Rate base 12,795.4$ 10,408.3$ 10,893.4$
Return on rate base 7.94% 7.94% 7.94%
Attachment 1 to Settlement Agreement
(Thousands of $)
SUMMARY OF EARNINGS COMPARISON TABLE
Dixon District
Test Year 2017
PROPOSED RATES
19

Utility ORAItem Estimate Estimate Settlement
Operating revenues 62,109.2$ 67,877.2$ 65,120.1$
Operating expenses: Operation & Maintenance 43,053.7$ 48,250.9$ 47,367.2$ Administrative & General 3,168.2$ 2,497.2$ 3,009.9$ Payroll 3,489.4$ 3,468.2$ 3,487.5$ G. O. Prorated Exp. 4,773.9$ 3,601.6$ 3,963.1$ Depreciation 5,072.5$ 2,990.7$ 3,035.6$ Taxes other than income 1,117.9$ 739.7$ 844.5$ State Corp. Franchise Tax (249.1)$ 428.5$ (13.8)$ Federal Income Tax (503.7)$ 1,289.1$ 383.4$
Total operating exp. 59,922.8$ 63,265.9$ 62,077.3$
Net operating revenue 2,186.3$ 4,611.3$ 3,042.8$
Rate base 117,297.8$ 67,173.2$ 78,621.6$
Return on rate base 1.86% 6.86% 3.87%
Attachment 1 to Settlement Agreement
SUMMARY OF EARNINGS COMPARISON TABLE
Dominguez So. Bay District
Test Year 2017
Present Rates
(Thousands of $)
20

Utility ORAItem Estimate Estimate Settlement
Operating revenues 73,901.5$ 69,238.1$ 70,456.4$
Operating expenses: Operation & Maintenance 43,053.8$ 48,252.3$ 47,377.0$ Administrative & General 3,168.2$ 2,497.2$ 3,009.9$ Payroll 3,489.4$ 3,468.2$ 3,487.5$ G. O. Prorated Exp. 4,773.9$ 3,601.6$ 3,963.1$ Depreciation 5,072.5$ 2,990.7$ 3,035.6$ Taxes other than income 1,126.8$ 740.8$ 848.5$ State Corp. Franchise Tax 792.6$ 548.6$ 456.7$ Federal Income Tax 3,111.0$ 1,802.9$ 2,035.6$
Total operating exp. 64,588.1$ 63,902.3$ 64,213.8$
Net operating revenue 9,313.4$ 5,335.8$ 6,242.6$
Rate base 117,297.8$ 67,173.2$ 78,621.6$
Return on rate base 7.94% 7.94% 7.94%
Attachment 1 to Settlement Agreement
(Thousands of $)
SUMMARY OF EARNINGS COMPARISON TABLE
Dominguez So. Bay District
Test Year 2017
PROPOSED RATES
21

Utility ORAItem Estimate Estimate Settlement
Operating revenues 33,893.0$ 33,612.5$ 36,031.9$
Operating expenses: Operation & Maintenance 13,340.4$ 12,332.2$ 12,457.1$ Administrative & General 1,863.6$ 1,344.1$ 1,763.5$ Payroll 3,429.1$ 3,246.9$ 3,276.1$ G. O. Prorated Exp. 5,183.6$ 4,390.7$ 4,813.2$ Depreciation 3,091.7$ 2,675.7$ 2,880.9$ Taxes other than income 1,594.8$ 1,422.3$ 1,596.0$ State Corp. Franchise Tax (67.6)$ 549.3$ 297.2$ Federal Income Tax 1,226.5$ 2,097.7$ 2,502.3$
Total operating exp. 29,662.2$ 28,058.9$ 29,586.3$
Net operating revenue 4,230.8$ 5,553.6$ 6,445.6$
Rate base 83,019.6$ 58,197.4$ 68,532.6$
Return on rate base 5.10% 9.54% 9.41%
Attachment 1 to Settlement Agreement
SUMMARY OF EARNINGS COMPARISON TABLE
East Los Angeles District
Test Year 2017
Present Rates
(Thousands of $)
22

Utility ORAItem Estimate Estimate Settlement
Operating revenues 37,818.3$ 32,062.9$ 34,359.2$
Operating expenses: Operation & Maintenance 13,340.4$ 12,329.3$ 12,453.8$ Administrative & General 1,863.6$ 1,344.1$ 1,763.5$ Payroll 3,429.1$ 3,246.9$ 3,276.1$ G. O. Prorated Exp. 5,183.6$ 4,390.7$ 4,813.2$ Depreciation 3,091.7$ 2,675.7$ 2,880.9$ Taxes other than income 1,653.3$ 1,399.2$ 1,571.1$ State Corp. Franchise Tax 274.2$ 414.7$ 151.9$ Federal Income Tax 2,390.5$ 1,639.5$ 2,007.2$
Total operating exp. 31,226.6$ 27,440.1$ 28,917.7$
Net operating revenue 6,591.8$ 4,622.8$ 5,441.5$
Rate base 83,019.6$ 58,197.4$ 68,532.6$
Return on rate base 7.94% 7.94% 7.94%
Attachment 1 to Settlement Agreement
(Thousands of $)
SUMMARY OF EARNINGS COMPARISON TABLE
East Los Angeles District
Test Year 2017
PROPOSED RATES
23

Utility ORAItem Estimate Estimate Settlement
Operating revenues 27,948.9$ 28,035.6$ 29,026.5$
Operating expenses: Operation & Maintenance 14,267.7$ 14,091.2$ 14,769.7$ Administrative & General 1,691.8$ 1,041.0$ 1,349.7$ Payroll 2,157.9$ 2,032.4$ 2,047.9$ G. O. Prorated Exp. 4,222.2$ 3,576.5$ 3,920.6$ Depreciation 2,874.7$ 2,668.7$ 2,750.2$ Taxes other than income 566.7$ 518.4$ 556.4$ State Corp. Franchise Tax (333.9)$ 388.9$ 246.4$ Federal Income Tax 388.0$ 912.9$ 776.4$
Total operating exp. 25,835.1$ 25,230.0$ 26,417.5$
Net operating revenue 2,113.8$ 2,805.6$ 2,609.1$
Rate base 48,036.5$ 33,277.6$ 38,012.3$
Return on rate base 4.40% 8.43% 6.86%
Attachment 1 to Settlement Agreement
SUMMARY OF EARNINGS COMPARISON TABLE
Hermosa Redondo District
Test Year 2017
Present Rates
(Thousands of $)
24

Utility ORAItem Estimate Estimate Settlement
Operating revenues 30,815.3$ 27,764.0$ 29,712.0$
Operating expenses: Operation & Maintenance 14,270.0$ 14,091.0$ 14,770.2$ Administrative & General 1,691.8$ 1,041.0$ 1,349.7$ Payroll 2,157.9$ 2,032.4$ 2,047.9$ G. O. Prorated Exp. 4,222.2$ 3,576.5$ 3,920.6$ Depreciation 2,874.7$ 2,668.7$ 2,750.2$ Taxes other than income 567.8$ 518.3$ 556.7$ State Corp. Franchise Tax (78.6)$ 364.9$ 306.9$ Federal Income Tax 1,295.3$ 827.7$ 991.5$
Total operating exp. 27,001.2$ 25,120.5$ 26,693.8$
Net operating revenue 3,814.1$ 2,643.5$ 3,018.2$
Rate base 48,036.5$ 33,277.6$ 38,012.3$
Return on rate base 7.94% 7.94% 7.94%
Attachment 1 to Settlement Agreement
(Thousands of $)
SUMMARY OF EARNINGS COMPARISON TABLE
Hermosa Redondo District
Test Year 2017
PROPOSED RATES
25

Utility ORAItem Estimate Estimate Settlement
Operating revenues 6,228.8$ 6,183.9$ 6,450.9$
Operating expenses: Operation & Maintenance 1,345.9$ 1,335.5$ 1,340.0$ Administrative & General 519.5$ 387.5$ 484.0$ Payroll 816.4$ 805.6$ 815.4$ G. O. Prorated Exp. 824.6$ 668.3$ 912.8$ Depreciation 957.9$ 848.9$ 948.3$ Taxes other than income 316.1$ 287.9$ 300.7$ State Corp. Franchise Tax 54.0$ 137.3$ 81.7$ Federal Income Tax 256.8$ 394.5$ 317.4$
Total operating exp. 5,091.2$ 4,865.5$ 5,200.4$
Net operating revenue 1,137.5$ 1,318.4$ 1,250.4$
Rate base 19,249.3$ 15,127.8$ 17,777.6$
Return on rate base 5.91% 8.72% 7.03%
Attachment 1 to Settlement Agreement
SUMMARY OF EARNINGS COMPARISON TABLE
Kern River Valley District
Test Year 2017
Present Rates
(Thousands of $)
26

Utility ORAItem Estimate Estimate Settlement
Operating revenues 6,876.3$ 5,990.5$ 6,717.6$
Operating expenses: Operation & Maintenance 1,350.5$ 1,334.1$ 1,341.8$ Administrative & General 519.5$ 387.5$ 484.0$ Payroll 816.4$ 805.6$ 815.4$ G. O. Prorated Exp. 824.6$ 668.3$ 912.8$ Depreciation 957.9$ 848.9$ 948.3$ Taxes other than income 320.7$ 286.5$ 302.6$ State Corp. Franchise Tax 110.4$ 120.4$ 104.9$ Federal Income Tax 447.9$ 337.4$ 396.1$
Total operating exp. 5,347.9$ 4,788.7$ 5,306.0$
Net operating revenue 1,528.4$ 1,201.8$ 1,411.5$
Rate base 19,249.3$ 15,127.8$ 17,777.6$
Return on rate base 7.94% 7.94% 7.94%
Attachment 1 to Settlement Agreement
(Thousands of $)
SUMMARY OF EARNINGS COMPARISON TABLE
Kern River Valley District
Test Year 2017
PROPOSED RATES
27
Utility ORAItem Estimate Estimate Settlement
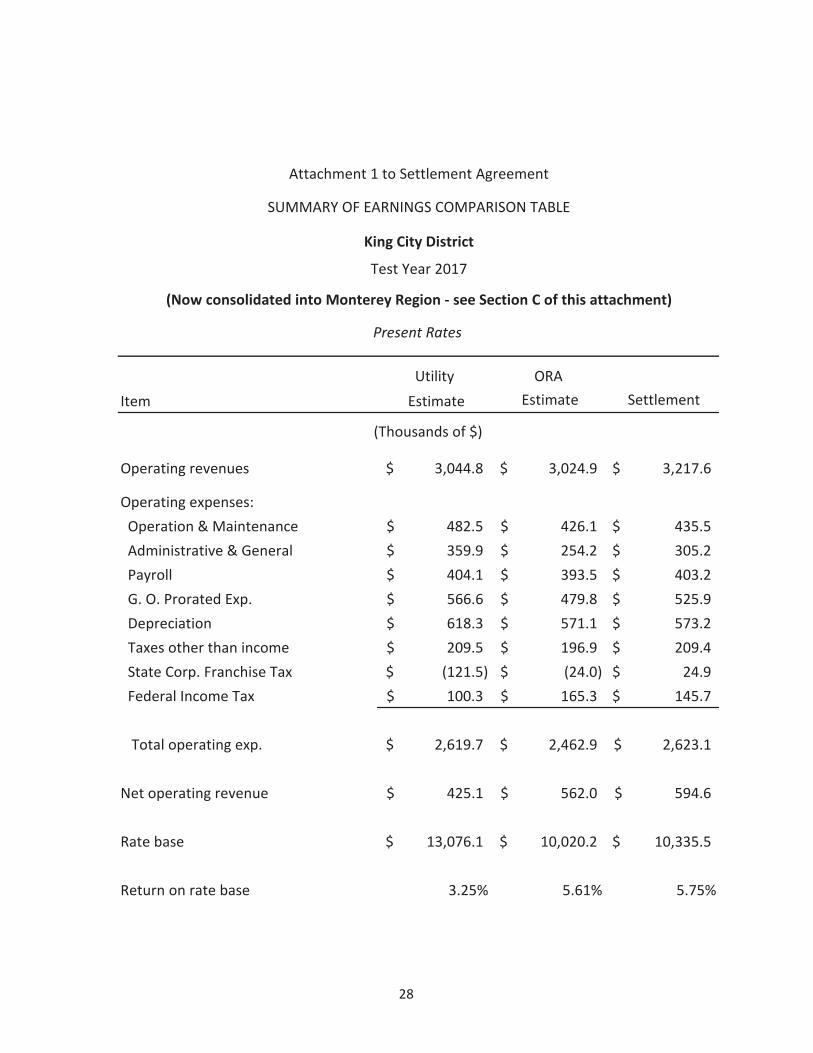
Operating revenues 3,044.8$ 3,024.9$ 3,217.6$
Operating expenses: Operation & Maintenance 482.5$ 426.1$ 435.5$ Administrative & General 359.9$ 254.2$ 305.2$ Payroll 404.1$ 393.5$ 403.2$ G. O. Prorated Exp. 566.6$ 479.8$ 525.9$ Depreciation 618.3$ 571.1$ 573.2$ Taxes other than income 209.5$ 196.9$ 209.4$ State Corp. Franchise Tax (121.5)$ (24.0)$ 24.9$ Federal Income Tax 100.3$ 165.3$ 145.7$
Total operating exp. 2,619.7$ 2,462.9$ 2,623.1$
Net operating revenue 425.1$ 562.0$ 594.6$
Rate base 13,076.1$ 10,020.2$ 10,335.5$
Return on rate base 3.25% 5.61% 5.75%
Attachment 1 to Settlement Agreement
SUMMARY OF EARNINGS COMPARISON TABLE
King City District
Test Year 2017
Present Rates
(Thousands of $)
(Now consolidated into Monterey Region - see Section C of this attachment)
28

Utility ORAItem Estimate Estimate Settlement
Operating revenues 4,046.6$ 3,407.3$ 3,586.8$
Operating expenses: Operation & Maintenance 486.5$ 427.6$ 436.9$ Administrative & General 359.9$ 254.2$ 305.2$ Payroll 404.1$ 393.5$ 403.2$ G. O. Prorated Exp. 566.6$ 479.8$ 525.9$ Depreciation 618.3$ 571.1$ 573.2$ Taxes other than income 220.4$ 201.0$ 213.4$ State Corp. Franchise Tax (34.2)$ 9.2$ 57.1$ Federal Income Tax 386.9$ 274.7$ 251.3$
Total operating exp. 3,008.4$ 2,611.3$ 2,766.2$
Net operating revenue 1,038.2$ 796.0$ 820.6$
Rate base 13,076.1$ 10,020.2$ 10,335.5$
Return on rate base 7.94% 7.94% 7.94%
Attachment 1 to Settlement Agreement
(Thousands of $)
SUMMARY OF EARNINGS COMPARISON TABLE
King City District
Test Year 2017
PROPOSED RATES
(Now consolidated into Monterey Region - see Section C of this attachment)
29

Utility ORAItem Estimate Estimate Settlement
Operating revenues 21,351.8$ 21,371.8$ 23,332.3$
Operating expenses: Operation & Maintenance 10,503.8$ 10,548.3$ 13,469.3$ Administrative & General 804.5$ 557.2$ 732.2$ Payroll 1,233.1$ 1,222.4$ 1,232.1$ G. O. Prorated Exp. 2,754.9$ 2,333.4$ 2,558.0$ Depreciation 2,469.5$ 2,222.8$ 2,327.5$ Taxes other than income 635.9$ 556.7$ 626.7$ State Corp. Franchise Tax 11.4$ 274.1$ 66.9$ Federal Income Tax 736.8$ 1,104.1$ 597.2$
Total operating exp. 19,150.0$ 18,819.0$ 21,610.0$
Net operating revenue 2,201.9$ 2,552.8$ 1,722.3$
Rate base 36,460.0$ 23,687.1$ 29,322.7$
Return on rate base 6.04% 10.78% 5.87%
Attachment 1 to Settlement Agreement
SUMMARY OF EARNINGS COMPARISON TABLE
Livermore District
Test Year 2017
Present Rates
(Thousands of $)
30

Utility ORAItem Estimate Estimate Settlement
Operating revenues 22,531.6$ 20,226.0$ 24,363.3$
Operating expenses: Operation & Maintenance 10,505.3$ 10,546.9$ 13,470.6$ Administrative & General 804.5$ 557.2$ 732.2$ Payroll 1,233.1$ 1,222.4$ 1,232.1$ G. O. Prorated Exp. 2,754.9$ 2,333.4$ 2,558.0$ Depreciation 2,469.5$ 2,222.8$ 2,327.5$ Taxes other than income 646.3$ 546.7$ 635.8$ State Corp. Franchise Tax 114.7$ 173.8$ 157.2$ Federal Income Tax 1,108.4$ 741.2$ 921.8$
Total operating exp. 19,636.6$ 18,344.4$ 22,035.1$
Net operating revenue 2,894.9$ 1,881.6$ 2,328.2$
Rate base 36,460.0$ 23,687.1$ 29,322.7$
Return on rate base 7.94% 7.94% 7.94%
Attachment 1 to Settlement Agreement
(Thousands of $)
SUMMARY OF EARNINGS COMPARISON TABLE
Livermore District
Test Year 2017
PROPOSED RATES
31

Utility ORAItem Estimate Estimate Settlement
Operating revenues 30,985.1$ 30,814.1$ 34,793.6$
Operating expenses: Operation & Maintenance 17,245.0$ 17,103.3$ 19,755.3$ Administrative & General 1,336.0$ 979.4$ 1,231.4$ Payroll 1,805.1$ 1,783.6$ 1,803.1$ G. O. Prorated Exp. 3,673.1$ 3,111.5$ 3,410.6$ Depreciation 3,018.7$ 2,842.6$ 2,922.3$ Taxes other than income 1,016.0$ 980.3$ 1,169.4$ State Corp. Franchise Tax (92.6)$ 233.3$ 155.7$ Federal Income Tax 362.5$ 917.6$ 1,061.6$
Total operating exp. 28,363.7$ 27,951.6$ 31,509.5$
Net operating revenue 2,621.4$ 2,862.5$ 3,284.1$
Rate base 52,772.1$ 42,752.7$ 48,627.2$
Return on rate base 4.97% 6.70% 6.75%
Attachment 1 to Settlement Agreement
SUMMARY OF EARNINGS COMPARISON TABLE
Los Altos District
Test Year 2017
Present Rates
(Thousands of $)
32

Utility ORAItem Estimate Estimate Settlement
Operating revenues 33,624.7$ 31,709.7$ 35,761.7$
Operating expenses: Operation & Maintenance 17,245.8$ 17,103.6$ 19,755.5$ Administrative & General 1,336.0$ 979.4$ 1,231.4$ Payroll 1,805.1$ 1,783.6$ 1,803.1$ G. O. Prorated Exp. 3,673.1$ 3,111.5$ 3,410.6$ Depreciation 3,018.7$ 2,842.6$ 2,922.3$ Taxes other than income 1,054.6$ 993.4$ 1,183.6$ State Corp. Franchise Tax 137.2$ 311.3$ 240.1$ Federal Income Tax 1,164.1$ 1,188.3$ 1,354.2$
Total operating exp. 29,434.6$ 28,313.7$ 31,900.7$
Net operating revenue 4,190.1$ 3,396.0$ 3,861.0$
Rate base 52,772.1$ 42,752.7$ 48,627.2$
Return on rate base 7.94% 7.94% 7.94%
Attachment 1 to Settlement Agreement
(Thousands of $)
SUMMARY OF EARNINGS COMPARISON TABLE
Los Altos District
Test Year 2017
PROPOSED RATES
33

Utility ORAItem Estimate Estimate Settlement
Operating revenues 3,415.4$ 3,287.1$ 3,564.4$
Operating expenses: Operation & Maintenance 525.7$ 501.8$ 523.1$ Administrative & General 330.5$ 285.6$ 356.4$ Payroll 563.3$ 552.5$ 562.2$ G. O. Prorated Exp. 755.2$ 639.8$ 701.3$ Depreciation 532.8$ 523.5$ 519.4$ Taxes other than income 163.9$ 150.9$ 150.9$ State Corp. Franchise Tax 24.0$ 47.5$ 19.8$ Federal Income Tax 66.6$ 107.3$ 164.9$
Total operating exp. 2,962.0$ 2,808.9$ 2,998.1$
Net operating revenue 453.4$ 478.2$ 566.3$
Rate base 12,052.6$ 9,913.7$ 10,165.3$
Return on rate base 3.76% 4.82% 5.57%
Attachment 1 to Settlement Agreement
SUMMARY OF EARNINGS COMPARISON TABLE
Marysville District
Test Year 2017
Present Rates
(Thousands of $)
34

Utility ORAItem Estimate Estimate Settlement
Operating revenues 4,229.7$ 3,787.3$ 3,953.8$
Operating expenses: Operation & Maintenance 528.4$ 503.1$ 524.1$ Administrative & General 330.5$ 285.6$ 356.4$ Payroll 563.3$ 552.5$ 562.2$ G. O. Prorated Exp. 755.2$ 639.8$ 701.3$ Depreciation 532.8$ 523.5$ 519.4$ Taxes other than income 164.9$ 151.9$ 151.9$ State Corp. Franchise Tax 95.6$ 91.5$ 54.0$ Federal Income Tax 301.9$ 251.9$ 277.4$
Total operating exp. 3,272.7$ 2,999.8$ 3,146.7$
Net operating revenue 957.0$ 787.5$ 807.1$
Rate base 12,052.6$ 9,913.7$ 10,165.3$
Return on rate base 7.94% 7.94% 7.94%
Attachment 1 to Settlement Agreement
(Thousands of $)
SUMMARY OF EARNINGS COMPARISON TABLE
Marysville District
Test Year 2017
PROPOSED RATES
35

Utility ORAItem Estimate Estimate Settlement
Operating revenues 4,904.6$ 4,803.1$ 5,747.4$
Operating expenses: Operation & Maintenance 950.8$ 936.7$ 954.9$ Administrative & General 563.3$ 421.7$ 511.5$ Payroll 807.4$ 796.0$ 805.7$ G. O. Prorated Exp. 901.1$ 763.2$ 836.7$ Depreciation 710.6$ 652.4$ 690.7$ Taxes other than income 144.4$ 144.4$ 170.1$ State Corp. Franchise Tax 5.4$ 44.5$ 94.2$ Federal Income Tax 219.7$ 306.2$ 506.4$
Total operating exp. 4,302.8$ 4,065.1$ 4,570.3$
Net operating revenue 601.8$ 738.0$ 1,177.1$
Rate base 11,187.4$ 8,648.3$ 10,822.9$
Return on rate base 5.38% 8.53% 10.88%
Attachment 1 to Settlement Agreement
SUMMARY OF EARNINGS COMPARISON TABLE
Oroville District
Test Year 2017
Present Rates
(Thousands of $)
36

Utility ORAItem Estimate Estimate Settlement
Operating revenues 5,383.0$ 4,718.9$ 5,222.6$
Operating expenses: Operation & Maintenance 953.3$ 936.3$ 952.3$ Administrative & General 563.3$ 421.7$ 511.5$ Payroll 807.4$ 796.0$ 805.7$ G. O. Prorated Exp. 901.1$ 763.2$ 836.7$ Depreciation 710.6$ 652.4$ 690.7$ Taxes other than income 159.7$ 144.4$ 170.1$ State Corp. Franchise Tax 46.1$ 37.1$ 48.0$ Federal Income Tax 353.2$ 280.8$ 348.3$
Total operating exp. 4,494.8$ 4,031.9$ 4,363.3$
Net operating revenue 888.3$ 687.0$ 859.3$
Rate base 11,187.4$ 8,648.3$ 10,822.9$
Return on rate base 7.94% 7.94% 7.94%
Attachment 1 to Settlement Agreement
(Thousands of $)
SUMMARY OF EARNINGS COMPARISON TABLE
Oroville District
Test Year 2017
PROPOSED RATES
37

Utility ORAItem Estimate Estimate Settlement
Operating revenues 42,808.0$ 42,778.2$ 44,899.5$
Operating expenses: Operation & Maintenance 29,698.9$ 29,468.2$ 30,537.9$ Administrative & General 1,827.0$ 1,251.9$ 1,509.1$ Payroll 2,328.1$ 2,297.2$ 2,311.2$ G. O. Prorated Exp. 5,209.2$ 4,412.5$ 4,837.1$ Depreciation 2,719.9$ 2,378.2$ 2,425.5$ Taxes other than income 1,105.4$ 978.2$ 1,047.7$ State Corp. Franchise Tax (368.1)$ 172.9$ (11.1)$ Federal Income Tax (521.3)$ 264.8$ 374.2$
Total operating exp. 41,999.1$ 41,223.9$ 43,031.7$
Net operating revenue 809.0$ 1,554.3$ 1,867.8$
Rate base 58,233.6$ 32,530.3$ 38,450.3$
Return on rate base 1.39% 4.78% 4.86%
Attachment 1 to Settlement Agreement
SUMMARY OF EARNINGS COMPARISON TABLE
Palos Verdes District
Test Year 2017
Present Rates
(Thousands of $)
(Now consolidated into LA County Region - see Section C of this attachment)
38

Utility ORAItem Estimate Estimate Settlement
Operating revenues 49,408.3$ 44,536.0$ 46,922.5$
Operating expenses: Operation & Maintenance 29,703.3$ 29,469.4$ 30,539.3$ Administrative & General 1,827.0$ 1,251.9$ 1,509.1$ Payroll 2,328.1$ 2,297.2$ 2,311.2$ G. O. Prorated Exp. 5,209.2$ 4,412.5$ 4,837.1$ Depreciation 2,719.9$ 2,378.2$ 2,425.5$ Taxes other than income 1,176.3$ 997.1$ 1,069.4$ State Corp. Franchise Tax 208.7$ 326.5$ 165.7$ Federal Income Tax 1,612.0$ 819.3$ 1,012.3$
Total operating exp. 44,784.6$ 41,952.1$ 43,869.6$
Net operating revenue 4,623.7$ 2,583.9$ 3,053.0$
Rate base 58,233.6$ 32,530.3$ 38,450.3$
Return on rate base 7.94% 7.94% 7.94%
Attachment 1 to Settlement Agreement
(Thousands of $)
SUMMARY OF EARNINGS COMPARISON TABLE
Palos Verdes District
Test Year 2017
PROPOSED RATES
(Now consolidated into LA County Region - see Section C of this attachment)
39

Utility ORAItem Estimate Estimate Settlement
Operating revenues 502.1$ 502.1$ 502.2$
Operating expenses: Operation & Maintenance 144.1$ 137.4$ 138.2$ Administrative & General 35.9$ 30.9$ 34.5$ Payroll 47.6$ 56.8$ 56.8$ G. O. Prorated Exp. 77.3$ 65.4$ 71.7$ Depreciation 81.8$ 78.7$ 77.3$ Taxes other than income 10.9$ 10.8$ 11.4$ State Corp. Franchise Tax (6.2)$ 2.8$ 5.1$ Federal Income Tax 25.2$ 29.0$ 21.7$
Total operating exp. 416.6$ 411.8$ 416.9$
Net operating revenue 85.5$ 90.3$ 85.3$
Rate base 1,557.8$ 1,292.0$ 1,392.4$
Return on rate base 5.49% 6.99% 6.13%
Attachment 1 to Settlement Agreement
SUMMARY OF EARNINGS COMPARISON TABLE
Redwood - Coast Springs District
Test Year 2017
Present Rates
(Thousands of $)
(Now consolidated into Bay Area Region - see Section C of this attachment)
40

Utility ORAItem Estimate Estimate Settlement
Operating revenues 563.5$ 522.9$ 542.6$
Operating expenses: Operation & Maintenance 144.1$ 137.4$ 138.2$ Administrative & General 35.9$ 30.9$ 34.5$ Payroll 47.6$ 56.8$ 56.8$ G. O. Prorated Exp. 77.3$ 65.4$ 71.7$ Depreciation 81.8$ 78.7$ 77.3$ Taxes other than income 10.9$ 10.8$ 11.4$ State Corp. Franchise Tax (0.8)$ 4.6$ 8.7$ Federal Income Tax 43.0$ 35.7$ 33.5$
Total operating exp. 439.8$ 420.3$ 432.1$
Net operating revenue 123.7$ 102.6$ 110.6$
Rate base 1,557.8$ 1,292.0$ 1,392.4$
Return on rate base 7.94% 7.94% 7.94%
Attachment 1 to Settlement Agreement
(Thousands of $)
SUMMARY OF EARNINGS COMPARISON TABLE
Redwood - Coast Springs District
Test Year 2017
PROPOSED RATES
(Now consolidated into Bay Area Region - see Section C of this attachment)
41

Utility ORAItem Estimate Estimate Settlement
Operating revenues 2,120.1$ 2,156.3$ 2,254.6$
Operating expenses: Operation & Maintenance 537.9$ 522.3$ 532.1$ Administrative & General 329.6$ 246.9$ 292.9$ Payroll 531.7$ 521.0$ 530.8$ G. O. Prorated Exp. 463.6$ 392.6$ 430.3$ Depreciation 213.2$ 191.9$ 183.9$ Taxes other than income 53.3$ 52.6$ 53.3$ State Corp. Franchise Tax (7.6)$ 8.0$ (0.8)$ Federal Income Tax 84.2$ 30.7$ 31.1$
Total operating exp. 2,206.0$ 1,966.0$ 2,053.5$
Net operating revenue (85.8)$ 190.3$ 201.0$
Rate base 5,696.6$ 4,562.3$ 4,680.3$
Return on rate base -1.51% 4.17% 4.30%
Attachment 1 to Settlement Agreement
SUMMARY OF EARNINGS COMPARISON TABLE
Redwood - Lucerne District
Test Year 2017
Present Rates
(Thousands of $)
(Now consolidated into Bay Area Region - see Section C of this attachment)
42
Utility ORAItem Estimate Estimate Settlement
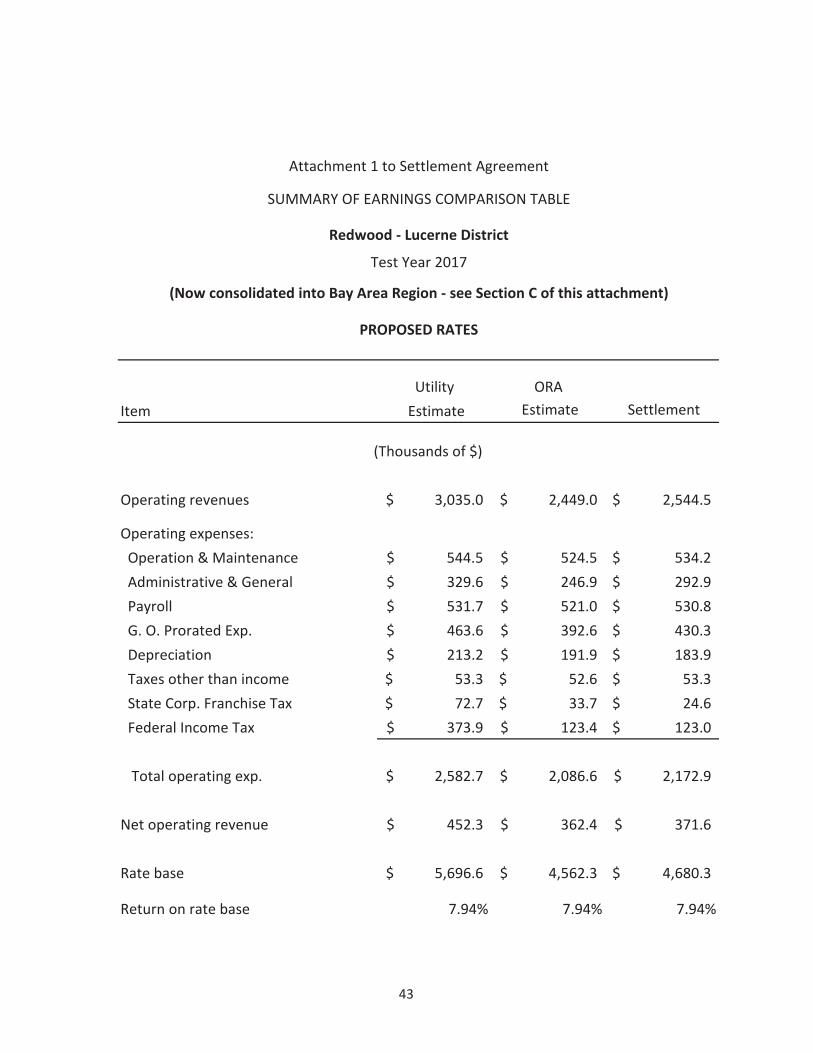
Operating revenues 3,035.0$ 2,449.0$ 2,544.5$
Operating expenses: Operation & Maintenance 544.5$ 524.5$ 534.2$ Administrative & General 329.6$ 246.9$ 292.9$ Payroll 531.7$ 521.0$ 530.8$ G. O. Prorated Exp. 463.6$ 392.6$ 430.3$ Depreciation 213.2$ 191.9$ 183.9$ Taxes other than income 53.3$ 52.6$ 53.3$ State Corp. Franchise Tax 72.7$ 33.7$ 24.6$ Federal Income Tax 373.9$ 123.4$ 123.0$
Total operating exp. 2,582.7$ 2,086.6$ 2,172.9$
Net operating revenue 452.3$ 362.4$ 371.6$
Rate base 5,696.6$ 4,562.3$ 4,680.3$
Return on rate base 7.94% 7.94% 7.94%
Attachment 1 to Settlement Agreement
(Thousands of $)
SUMMARY OF EARNINGS COMPARISON TABLE
Redwood - Lucerne District
Test Year 2017
PROPOSED RATES
(Now consolidated into Bay Area Region - see Section C of this attachment)
43

Utility ORAItem Estimate Estimate Settlement
Operating revenues 790.2$ 788.6$ 827.3$
Operating expenses: Operation & Maintenance 171.3$ 169.7$ 171.1$ Administrative & General 79.6$ 66.6$ 76.1$ Payroll 92.6$ 81.9$ 81.9$ G. O. Prorated Exp. 128.8$ 109.1$ 119.4$ Depreciation 111.6$ 100.3$ 112.1$ Taxes other than income 19.4$ 16.8$ 17.1$ State Corp. Franchise Tax (16.2)$ 17.6$ 14.1$ Federal Income Tax 47.8$ 59.0$ 55.3$
Total operating exp. 635.0$ 621.1$ 647.2$
Net operating revenue 155.3$ 167.5$ 180.0$
Rate base 2,546.7$ 1,784.8$ 1,974.8$
Return on rate base 6.10% 9.39% 9.12%
Attachment 1 to Settlement Agreement
SUMMARY OF EARNINGS COMPARISON TABLE
Redwood - Unified Area District
Test Year 2017
Present Rates
(Thousands of $)
(Now consolidated into Bay Area Region - see Section C of this attachment)
44
Utility ORAItem Estimate Estimate Settlement
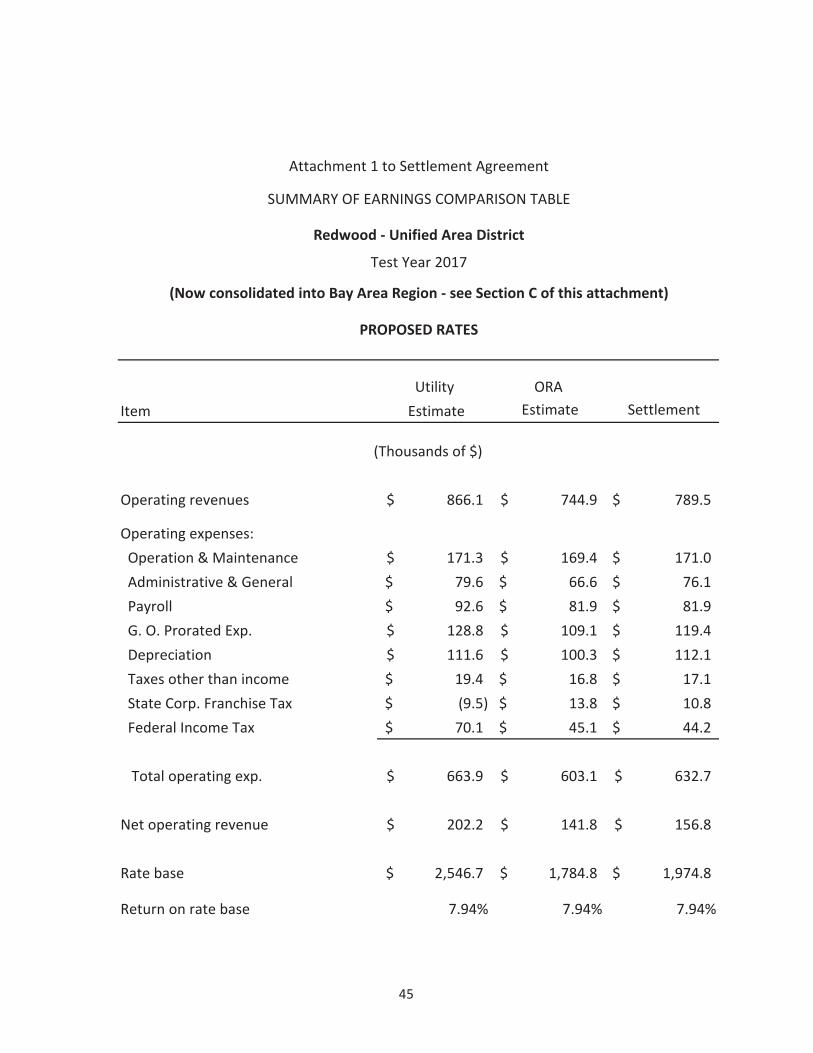
Operating revenues 866.1$ 744.9$ 789.5$
Operating expenses: Operation & Maintenance 171.3$ 169.4$ 171.0$ Administrative & General 79.6$ 66.6$ 76.1$ Payroll 92.6$ 81.9$ 81.9$ G. O. Prorated Exp. 128.8$ 109.1$ 119.4$ Depreciation 111.6$ 100.3$ 112.1$ Taxes other than income 19.4$ 16.8$ 17.1$ State Corp. Franchise Tax (9.5)$ 13.8$ 10.8$ Federal Income Tax 70.1$ 45.1$ 44.2$
Total operating exp. 663.9$ 603.1$ 632.7$
Net operating revenue 202.2$ 141.8$ 156.8$
Rate base 2,546.7$ 1,784.8$ 1,974.8$
Return on rate base 7.94% 7.94% 7.94%
Attachment 1 to Settlement Agreement
(Thousands of $)
SUMMARY OF EARNINGS COMPARISON TABLE
Redwood - Unified Area District
Test Year 2017
PROPOSED RATES
(Now consolidated into Bay Area Region - see Section C of this attachment)
45

Utility ORAItem Estimate Estimate Settlement
Operating revenues 28,411.8$ 28,094.9$ 29,668.0$
Operating expenses: Operation & Maintenance 6,820.1$ 6,384.3$ 6,666.7$ Administrative & General 2,205.5$ 1,649.6$ 2,041.7$ Payroll 3,428.0$ 3,385.0$ 3,423.9$ G. O. Prorated Exp. 5,209.2$ 4,412.5$ 4,837.1$ Depreciation 5,992.7$ 5,402.5$ 5,648.1$ Taxes other than income 2,029.5$ 1,890.2$ 2,040.7$ State Corp. Franchise Tax (299.7)$ 325.7$ 23.5$ Federal Income Tax 190.2$ 853.4$ 938.5$
Total operating exp. 25,575.6$ 24,303.2$ 25,620.4$
Net operating revenue 2,836.2$ 3,791.7$ 4,047.6$
Rate base 100,835.6$ 71,948.8$ 81,761.6$
Return on rate base 2.81% 5.27% 4.95%
Attachment 1 to Settlement Agreement
SUMMARY OF EARNINGS COMPARISON TABLE
Salinas District
Test Year 2017
Present Rates
(Thousands of $)
(Now consolidated into Monterey Region - see Section C of this attachment)
46

Utility ORAItem Estimate Estimate Settlement
Operating revenues 37,012.9$ 31,295.0$ 33,734.1$
Operating expenses: Operation & Maintenance 6,841.7$ 6,392.3$ 6,676.9$ Administrative & General 2,205.5$ 1,649.6$ 2,041.7$ Payroll 3,428.0$ 3,385.0$ 3,423.9$ G. O. Prorated Exp. 5,209.2$ 4,412.5$ 4,837.1$ Depreciation 5,992.7$ 5,402.5$ 5,648.1$ Taxes other than income 2,287.0$ 1,986.0$ 2,162.4$ State Corp. Franchise Tax 436.0$ 599.4$ 371.3$ Federal Income Tax 2,606.5$ 1,752.5$ 2,080.8$
Total operating exp. 29,006.6$ 25,579.8$ 27,242.2$
Net operating revenue 8,006.3$ 5,715.2$ 6,491.9$
Rate base 100,835.6$ 71,948.8$ 81,761.6$
Return on rate base 7.94% 7.94% 7.94%
Attachment 1 to Settlement Agreement
(Thousands of $)
SUMMARY OF EARNINGS COMPARISON TABLE
Salinas District
Test Year 2017
PROPOSED RATES
(Now consolidated into Monterey Region - see Section C of this attachment)
47

Utility ORAItem Estimate Estimate Settlement
Operating revenues 4,677.6$ 4,832.4$ 5,083.2$
Operating expenses: Operation & Maintenance 904.7$ 895.4$ 910.6$ Administrative & General 508.6$ 390.5$ 469.7$ Payroll 618.0$ 607.3$ 616.9$ G. O. Prorated Exp. 995.5$ 843.3$ 924.4$ Depreciation 895.3$ 823.5$ 850.1$ Taxes other than income 286.9$ 275.9$ 293.5$ State Corp. Franchise Tax 0.6$ 53.5$ 62.4$ Federal Income Tax 187.9$ 194.2$ 198.2$
Total operating exp. 4,397.5$ 4,083.6$ 4,325.9$
Net operating revenue 280.1$ 748.8$ 757.2$
Rate base 15,882.1$ 12,709.8$ 13,729.0$
Return on rate base 1.76% 5.89% 5.52%
Attachment 1 to Settlement Agreement
SUMMARY OF EARNINGS COMPARISON TABLE
Selma District
Test Year 2017
Present Rates
(Thousands of $)
48

Utility ORAItem Estimate Estimate Settlement
Operating revenues 6,293.9$ 5,262.2$ 5,631.4$
Operating expenses: Operation & Maintenance 909.7$ 896.7$ 912.3$ Administrative & General 508.6$ 390.5$ 469.7$ Payroll 618.0$ 607.3$ 616.9$ G. O. Prorated Exp. 995.5$ 843.3$ 924.4$ Depreciation 895.3$ 823.5$ 850.1$ Taxes other than income 319.1$ 284.5$ 304.5$ State Corp. Franchise Tax 140.2$ 90.6$ 109.8$ Federal Income Tax 646.4$ 316.1$ 353.7$
Total operating exp. 5,032.9$ 4,252.5$ 4,541.3$
Net operating revenue 1,261.0$ 1,009.7$ 1,090.1$
Rate base 15,882.1$ 12,709.8$ 13,729.0$
Return on rate base 7.94% 7.94% 7.94%
Attachment 1 to Settlement Agreement
(Thousands of $)
SUMMARY OF EARNINGS COMPARISON TABLE
Selma District
Test Year 2017
PROPOSED RATES
49

Utility ORAItem Estimate Estimate Settlement
Operating revenues 38,137.5$ 37,911.8$ 44,858.8$
Operating expenses: Operation & Maintenance 15,214.7$ 14,939.3$ 21,927.0$ Administrative & General 2,661.8$ 1,991.6$ 2,474.9$ Payroll 4,149.8$ 4,106.8$ 4,145.8$ G. O. Prorated Exp. 6,642.4$ 5,626.5$ 6,167.7$ Depreciation 4,970.0$ 4,162.2$ 4,367.3$ Taxes other than income 1,495.6$ 1,366.8$ 1,504.0$ State Corp. Franchise Tax (1,610.8)$ 317.8$ (574.1)$ Federal Income Tax 787.2$ 1,217.0$ 1,152.8$
Total operating exp. 34,310.6$ 33,728.0$ 41,165.5$
Net operating revenue 3,826.9$ 4,183.8$ 3,693.2$
Rate base 101,850.7$ 67,903.3$ 77,975.0$
Return on rate base 3.76% 6.16% 4.74%
Attachment 1 to Settlement Agreement
SUMMARY OF EARNINGS COMPARISON TABLE
Stockton District
Test Year 2017
Present Rates
(Thousands of $)
50

Utility ORAItem Estimate Estimate Settlement
Operating revenues 45,325.6$ 39,954.7$ 48,888.2$
Operating expenses: Operation & Maintenance 15,278.5$ 14,957.4$ 21,962.7$ Administrative & General 2,661.8$ 1,991.6$ 2,474.9$ Payroll 4,149.8$ 4,106.8$ 4,145.8$ G. O. Prorated Exp. 6,642.4$ 5,626.5$ 6,167.7$ Depreciation 4,970.0$ 4,162.2$ 4,367.3$ Taxes other than income 1,528.2$ 1,376.0$ 1,522.2$ State Corp. Franchise Tax (983.9)$ 496.0$ (222.7)$ Federal Income Tax 2,991.9$ 1,844.3$ 2,279.0$
Total operating exp. 37,238.7$ 34,560.8$ 42,697.0$
Net operating revenue 8,086.9$ 5,393.9$ 6,191.2$
Rate base 101,850.7$ 67,903.3$ 77,975.0$
Return on rate base 7.94% 7.94% 7.94%
Attachment 1 to Settlement Agreement
(Thousands of $)
SUMMARY OF EARNINGS COMPARISON TABLE
Stockton District
Test Year 2017
PROPOSED RATES
51

Utility ORAItem Estimate Estimate Settlement
Operating revenues 29,714.1$ 28,076.2$ 29,535.7$
Operating expenses: Operation & Maintenance 5,918.9$ 5,294.1$ 5,314.3$ Administrative & General 2,476.8$ 1,786.9$ 2,207.4$ Payroll 3,702.4$ 3,820.1$ 3,849.3$ G. O. Prorated Exp. 6,153.4$ 5,212.1$ 5,713.6$ Depreciation 5,060.8$ 4,617.4$ 4,808.6$ Taxes other than income 1,007.2$ 905.2$ 984.1$ State Corp. Franchise Tax 563.7$ 555.5$ 482.4$ Federal Income Tax 1,941.5$ 1,563.5$ 1,611.8$
Total operating exp. 26,824.6$ 23,754.8$ 24,971.6$
Net operating revenue 2,889.5$ 4,321.4$ 4,564.1$
Rate base 72,450.7$ 49,836.8$ 59,335.1$
Return on rate base 3.99% 8.67% 7.69%
Attachment 1 to Settlement Agreement
SUMMARY OF EARNINGS COMPARISON TABLE
Visalia District
Test Year 2017
Present Rates
(Thousands of $)
52

Utility ORAItem Estimate Estimate Settlement
Operating revenues 34,083.7$ 27,270.2$ 29,554.7$
Operating expenses: Operation & Maintenance 5,934.4$ 5,291.3$ 5,314.4$ Administrative & General 2,476.8$ 1,786.9$ 2,207.4$ Payroll 3,702.4$ 3,820.1$ 3,849.3$ G. O. Prorated Exp. 6,153.4$ 5,212.1$ 5,713.6$ Depreciation 5,060.8$ 4,617.4$ 4,808.6$ Taxes other than income 1,007.2$ 905.2$ 984.1$ State Corp. Franchise Tax 948.6$ 484.5$ 484.0$ Federal Income Tax 3,047.5$ 1,194.2$ 1,482.1$
Total operating exp. 28,331.1$ 23,311.7$ 24,843.5$
Net operating revenue 5,752.6$ 3,958.5$ 4,711.2$
Rate base 72,450.7$ 49,836.8$ 59,335.1$
Return on rate base 7.94% 7.94% 7.94%
Attachment 1 to Settlement Agreement
(Thousands of $)
SUMMARY OF EARNINGS COMPARISON TABLE
Visalia District
Test Year 2017
PROPOSED RATES
53
Utility ORAItem Estimate Estimate Settlement
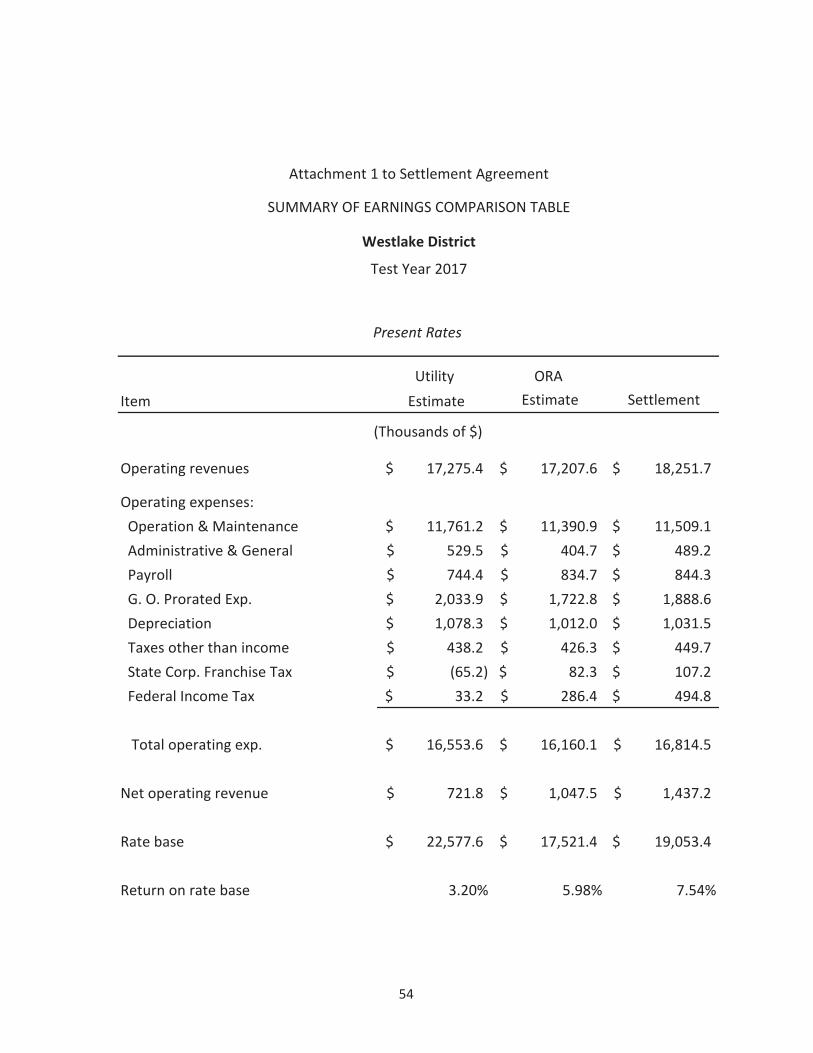
Operating revenues 17,275.4$ 17,207.6$ 18,251.7$
Operating expenses: Operation & Maintenance 11,761.2$ 11,390.9$ 11,509.1$ Administrative & General 529.5$ 404.7$ 489.2$ Payroll 744.4$ 834.7$ 844.3$ G. O. Prorated Exp. 2,033.9$ 1,722.8$ 1,888.6$ Depreciation 1,078.3$ 1,012.0$ 1,031.5$ Taxes other than income 438.2$ 426.3$ 449.7$ State Corp. Franchise Tax (65.2)$ 82.3$ 107.2$ Federal Income Tax 33.2$ 286.4$ 494.8$
Total operating exp. 16,553.6$ 16,160.1$ 16,814.5$
Net operating revenue 721.8$ 1,047.5$ 1,437.2$
Rate base 22,577.6$ 17,521.4$ 19,053.4$
Return on rate base 3.20% 5.98% 7.54%
Attachment 1 to Settlement Agreement
SUMMARY OF EARNINGS COMPARISON TABLE
Westlake District
Test Year 2017
Present Rates
(Thousands of $)
54

Utility ORAItem Estimate Estimate Settlement
Operating revenues 19,104.7$ 17,795.3$ 18,380.7$
Operating expenses: Operation & Maintenance 11,762.3$ 11,391.0$ 11,509.2$ Administrative & General 529.5$ 404.7$ 489.2$ Payroll 744.4$ 834.7$ 844.3$ G. O. Prorated Exp. 2,033.9$ 1,722.8$ 1,888.6$ Depreciation 1,078.3$ 1,012.0$ 1,031.5$ Taxes other than income 459.2$ 433.0$ 451.2$ State Corp. Franchise Tax 94.6$ 133.7$ 118.5$ Federal Income Tax 609.8$ 471.7$ 535.5$
Total operating exp. 17,312.0$ 16,403.6$ 16,867.9$
Net operating revenue 1,792.5$ 1,391.7$ 1,512.8$
Rate base 22,577.6$ 17,521.4$ 19,053.4$
Return on rate base 7.94% 7.94% 7.94%
Attachment 1 to Settlement Agreement
(Thousands of $)
SUMMARY OF EARNINGS COMPARISON TABLE
Westlake District
Test Year 2017
PROPOSED RATES
55

Utility ORAItem Estimate Estimate Settlement
Operating revenues 2,466.6$ 2,232.8$ 2,357.4$
Operating expenses: Operation & Maintenance 458.4$ 347.0$ 356.2$ Administrative & General 383.3$ 217.4$ 263.5$ Payroll 385.7$ 364.2$ 374.0$ G. O. Prorated Exp. 472.0$ 399.9$ 438.3$ Depreciation 277.0$ 263.1$ 258.0$ Taxes other than income 138.1$ 120.1$ 132.3$ State Corp. Franchise Tax 45.2$ 31.0$ 21.0$ Federal Income Tax 240.2$ 108.8$ 109.5$
Total operating exp. 2,389.7$ 1,851.5$ 1,952.8$
Net operating revenue 77.0$ 381.3$ 404.6$
Rate base 7,436.1$ 5,162.4$ 5,945.4$
Return on rate base 1.03% 7.39% 6.81%
Attachment 1 to Settlement Agreement
SUMMARY OF EARNINGS COMPARISON TABLE
Willows District
Test Year 2017
Present Rates
(Thousands of $)
56

Utility ORAItem Estimate Estimate Settlement
Operating revenues 3,324.4$ 2,280.1$ 2,467.8$
Operating expenses: Operation & Maintenance 461.9$ 347.2$ 356.6$ Administrative & General 383.3$ 217.4$ 263.5$ Payroll 385.7$ 364.2$ 374.0$ G. O. Prorated Exp. 472.0$ 399.9$ 438.3$ Depreciation 277.0$ 263.1$ 258.0$ Taxes other than income 149.5$ 120.7$ 133.7$ State Corp. Franchise Tax 119.7$ 35.1$ 30.6$ Federal Income Tax 484.9$ 122.3$ 141.0$
Total operating exp. 2,734.0$ 1,870.0$ 1,995.7$
Net operating revenue 590.4$ 410.1$ 472.1$
Rate base 7,436.1$ 5,162.4$ 5,945.4$
Return on rate base 7.94% 7.94% 7.94%
Attachment 1 to Settlement Agreement
(Thousands of $)
SUMMARY OF EARNINGS COMPARISON TABLE
Willows District
Test Year 2017
PROPOSED RATES
57

SUMMARY OF EARNINGS COMPARISON TABLES
CONSOLIDATED REGIONS
Attachment 1
SECTION C
58
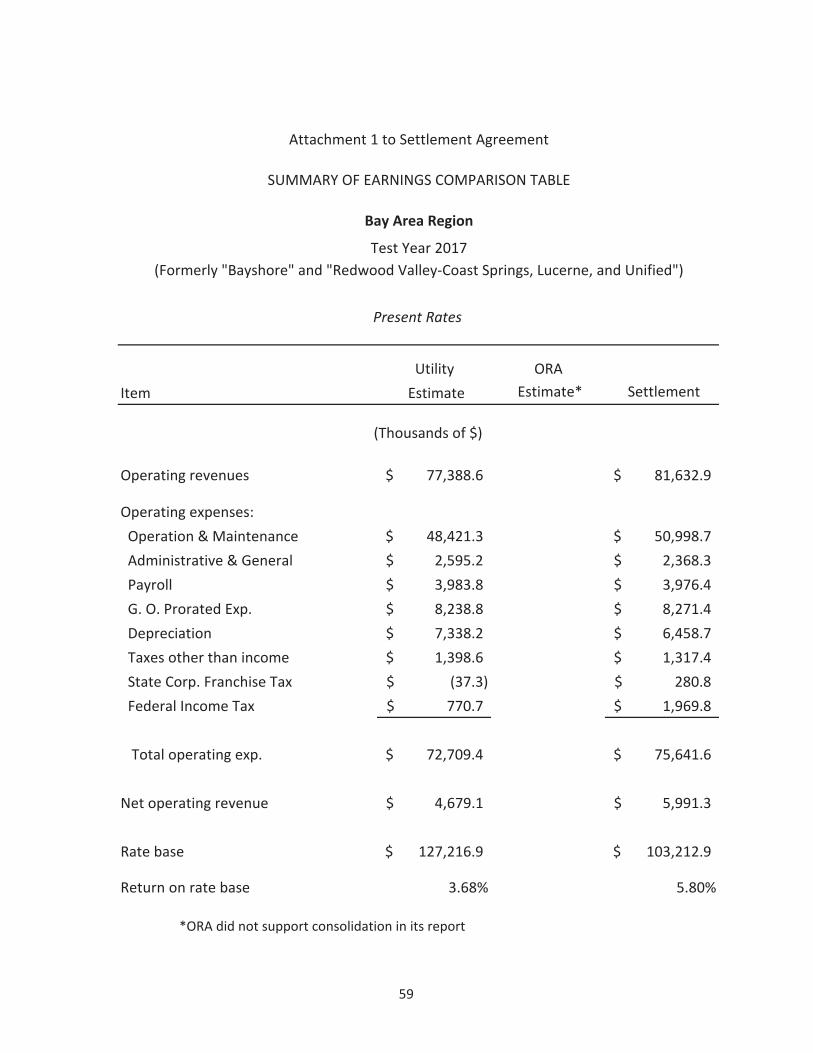
Utility ORAItem Estimate Estimate* Settlement
Operating revenues 77,388.6$ 81,632.9$
Operating expenses: Operation & Maintenance 48,421.3$ 50,998.7$ Administrative & General 2,595.2$ 2,368.3$ Payroll 3,983.8$ 3,976.4$ G. O. Prorated Exp. 8,238.8$ 8,271.4$ Depreciation 7,338.2$ 6,458.7$ Taxes other than income 1,398.6$ 1,317.4$ State Corp. Franchise Tax (37.3)$ 280.8$ Federal Income Tax 770.7$ 1,969.8$
Total operating exp. 72,709.4$ 75,641.6$
Net operating revenue 4,679.1$ 5,991.3$
Rate base 127,216.9$ 103,212.9$
Return on rate base 3.68% 5.80%
*ORA did not support consolidation in its report
Attachment 1 to Settlement Agreement
SUMMARY OF EARNINGS COMPARISON TABLE
Bay Area Region
Test Year 2017
Present Rates
(Thousands of $)
(Formerly "Bayshore" and "Redwood Valley-Coast Springs, Lucerne, and Unified")
59

Utility ORAItem Estimate Estimate* Settlement
Operating revenues 87,675.2$ 85,353.5$
Operating expenses: Operation & Maintenance 48,435.5$ 51,002.0$ Administrative & General 2,595.2$ 2,368.3$ Payroll 3,983.8$ 3,976.4$ G. O. Prorated Exp. 8,908.5$ 8,271.4$ Depreciation 7,338.2$ 6,458.7$ Taxes other than income 1,398.6$ 1,317.4$ State Corp. Franchise Tax 870.8$ 609.4$ Federal Income Tax 4,043.6$ 3,154.7$
Total operating exp. 77,574.2$ 77,158.4$
Net operating revenue 10,101.0$ 8,195.1$
Rate base 127,216.9$ 103,212.9$ Return on rate base 7.94% 7.94%
*ORA did not support consolidation in its report
Attachment 1 to Settlement Agreement
(Thousands of $)
SUMMARY OF EARNINGS COMPARISON TABLE
Bay Area Region
Test Year 2017
PROPOSED RATES
(Formerly "Bayshore" and "Redwood Valley-Coast Springs, Lucerne, and Unified")
60
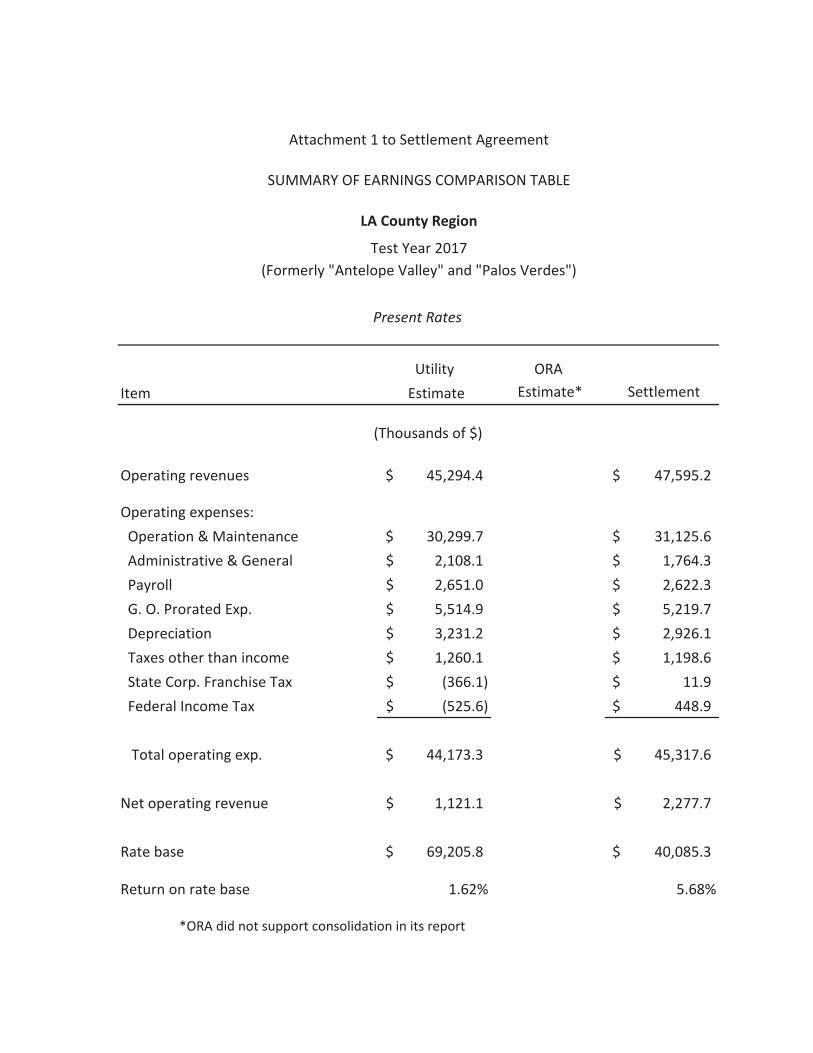
Utility ORAItem Estimate Estimate* Settlement
Operating revenues 45,294.4$ 47,595.2$
Operating expenses: Operation & Maintenance 30,299.7$ 31,125.6$ Administrative & General 2,108.1$ 1,764.3$ Payroll 2,651.0$ 2,622.3$ G. O. Prorated Exp. 5,514.9$ 5,219.7$ Depreciation 3,231.2$ 2,926.1$ Taxes other than income 1,260.1$ 1,198.6$ State Corp. Franchise Tax (366.1)$ 11.9$ Federal Income Tax (525.6)$ 448.9$
Total operating exp. 44,173.3$ 45,317.6$
Net operating revenue 1,121.1$ 2,277.7$
Rate base 69,205.8$ 40,085.3$
Return on rate base 1.62% 5.68%
*ORA did not support consolidation in its report
Attachment 1 to Settlement Agreement
SUMMARY OF EARNINGS COMPARISON TABLE
LA County Region
Test Year 2017
Present Rates
(Thousands of $)
(Formerly "Antelope Valley" and "Palos Verdes")

Utility ORAItem Estimate Estimate* Settlement
Operating revenues 52,816.1$ 49,525.7$
Operating expenses: Operation & Maintenance 30,311.0$ 31,127.6$ Administrative & General 2,108.1$ 1,764.3$ Payroll 2,651.0$ 2,622.3$ G. O. Prorated Exp. 5,514.9$ 5,219.7$ Depreciation 3,231.2$ 2,926.1$ Taxes other than income 1,336.2$ 1,223.0$ State Corp. Franchise Tax 291.1$ 231.1$ Federal Income Tax 1,877.6$ 1,228.4$
Total operating exp. 47,321.0$ 46,342.5$
Net operating revenue 5,495.1$ 3,183.1$
Rate base 69,205.8$ 40,085.3$
Return on rate base 7.94% 7.94%
*ORA did not support consolidation in its report
Attachment 1 to Settlement Agreement
(Thousands of $)
SUMMARY OF EARNINGS COMPARISON TABLE
LA County Region
Test Year 2017
PROPOSED RATES
(Formerly "Antelope Valley" and "Palos Verdes")

Utility ORAItem Estimate Estimate* Settlement
Operating revenues 31,456.6$ 32,885.6$
Operating expenses: Operation & Maintenance 7,302.6$ 7,111.3$ Administrative & General 2,565.3$ 2,346.9$ Payroll 3,832.1$ 3,827.1$ G. O. Prorated Exp. 5,775.8$ 5,363.0$ Depreciation 6,611.0$ 6,494.8$ Taxes other than income 2,239.0$ 2,250.1$ State Corp. Franchise Tax (421.1)$ 48.4$ Federal Income Tax 290.6$ 1,084.2$
Total operating exp. 28,195.3$ 28,525.8$
Net operating revenue 3,261.3$ 4,359.8$
Rate base 113,911.7$ 92,326.7$
Return on rate base 2.86% 4.72%
*ORA did not support consolidation in its report
Attachment 1 to Settlement Agreement
SUMMARY OF EARNINGS COMPARISON TABLE
Monterey Region
Test Year 2017
Present Rates
(Thousands of $)
(Formerly "King City" and "Salinas")
63
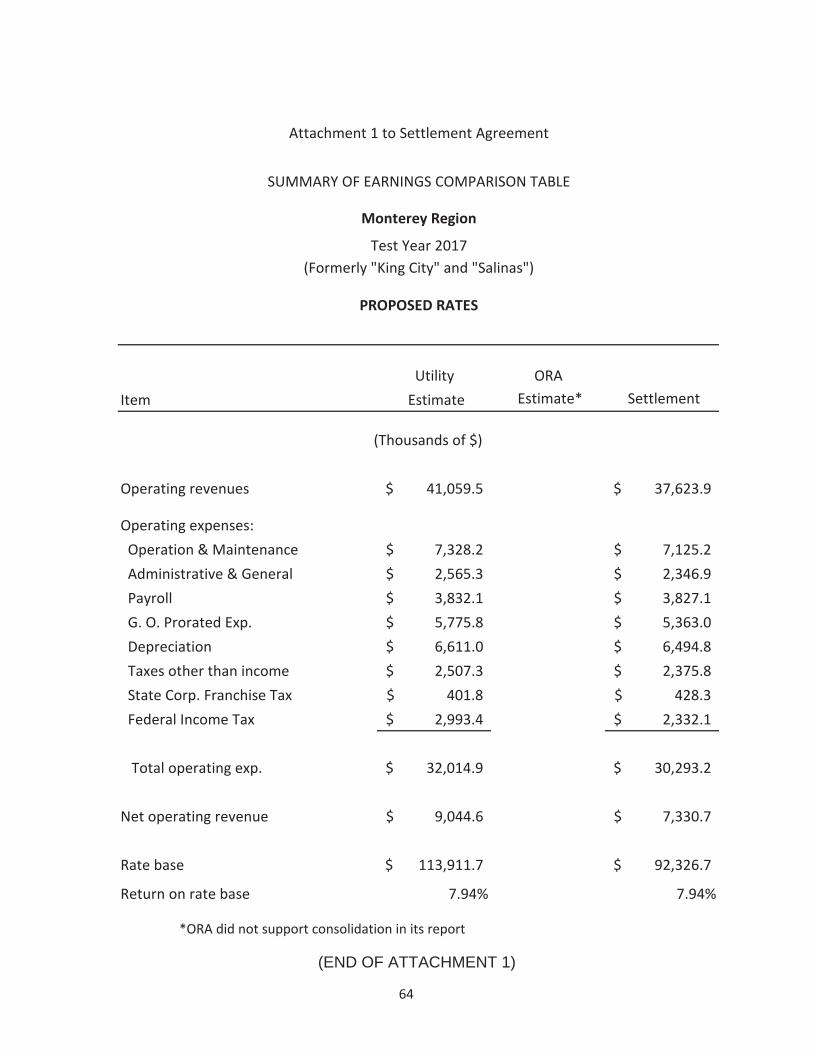
Utility ORAItem Estimate Estimate* Settlement
Operating revenues 41,059.5$ 37,623.9$
Operating expenses: Operation & Maintenance 7,328.2$ 7,125.2$ Administrative & General 2,565.3$ 2,346.9$ Payroll 3,832.1$ 3,827.1$ G. O. Prorated Exp. 5,775.8$ 5,363.0$ Depreciation 6,611.0$ 6,494.8$ Taxes other than income 2,507.3$ 2,375.8$ State Corp. Franchise Tax 401.8$ 428.3$ Federal Income Tax 2,993.4$ 2,332.1$
Total operating exp. 32,014.9$ 30,293.2$
Net operating revenue 9,044.6$ 7,330.7$
Rate base 113,911.7$ 92,326.7$
Return on rate base 7.94% 7.94%
*ORA did not support consolidation in its report
Attachment 1 to Settlement Agreement
(Thousands of $)
SUMMARY OF EARNINGS COMPARISON TABLE
Monterey Region
Test Year 2017
PROPOSED RATES
(Formerly "King City" and "Salinas")
64
(END OF ATTACHMENT 1)

Attachment 2
RATE BASE COMPARISON TABLES
A.15-07-015 ALJ/DB3/SBF

TOTAL COMPANY
Attachment 2
SECTION A
RATE BASE COMPARISON TABLES
2

Utility ORAItem Estimate Estimate Settlement
Wtd.Avg. Construction in Progress $66,920.1 $0.0 $0.0Wtd.Avg. Plant in Serv. $2,353,234.0 $1,567,209.4 $2,172,395.5Wtd. Avg. Depreciation Reserve ($801,377.6) ($615,044.1) ($793,123.4)Net Utility Plant $1,618,776.5 $952,165.3 $1,379,272.2
Deductions from Rate Base: Contributions In Aid of Construction $147,681.2 $104,363.7 $148,089.5 Advances $181,422.6 $159,189.7 $175,766.5 Reserve for Amortization of Intangibles $8,986.3 $5,937.3 $8,921.7 Deferred Taxes $162,625.5 $95,114.3 $149,254.6 Unamortized Investment Tax Credit $1,320.2 $924.2 $1,320.3 Total Deductions from Rate Base $502,035.7 $365,529.2 $483,352.6
Additions to Rate Base:Working Capital:
Materials and Supplies $5,438.3 $3,940.5 $5,516.9 Tank Painting $13,466.9 $9,652.3 $12,321.0 Working Cash - Lead Lag $11,590.7 $7,795.2 $13,460.0 Amount Withheld from Employees ($186.9) ($142.1) ($187.5)
Total Working Capital $30,308.9 $21,245.9 $31,110.3 Taxes on - Advances $6,201.8 $5,630.6 $6,201.8 Taxes on - CIAC $4,705.2 $3,316.6 $4,768.0 Total Additions to Rate Base $41,215.9 $30,193.1 $42,080.1
Wtd. Avg. Rate Base - District $1,157,956.7 $616,829.2 $937,999.7Rancho & Redwood Allocations $2,985.3 $1,163.2 $1,669.9Wtd. Avg. Rate Base - GO Allocation $86,748.3 $32,938.8 $56,746.5Total Weighted Average Rate Base $1,247,690.2 $650,931.2 $996,416.0
RATE BASE COMPARISON TABLE
California Water Service Company (Total Company)
WEIGHTED AVERAGE DEPRECIATED RATE BASE
TEST YEAR 2017
(In $1,000)
Attachment 2 to Settlement Agreement
(With Consolidated Regions)
3

Utility ORAItem Estimate Estimate Settlement
Wtd.Avg. Construction in Progress $66,920.1 -$ $0.0Wtd.Avg. Plant in Serv. $2,562,991.7 $2,062,438.2 $2,296,812.0Wtd. Avg. Depreciation Reserve ($867,500.5) ($848,413.2) ($852,702.1)Net Utility Plant $1,762,411.3 $1,214,025.0 $1,444,109.9
Deductions from Rate Base: Contributions In Aid of Construction $149,704.3 $151,694.6 $151,084.4 Advancess $187,583.0 $178,787.0 $177,517.1 Reserve for Amortization of Intangibles $9,994.9 $9,680.9 $9,892.1 Deferred Taxes $181,250.3 $124,469.3 $160,070.7 Unamortized Investment Tax Credit $1,246.0 $1,246.1 $1,246.0 Total Deductions from Rate Base $529,778.5 $465,877.9 $499,810.3
Additions to Rate Base:Working Capital:
Materials and Supplies $5,438.3 $5,438.2 $5,516.9 Tank Painting $13,793.9 $12,894.2 $12,901.4 Working Cash - Lead Lag $12,719.0 $12,405.1 $14,082.8 Amount Withheld from Employees ($186.9) ($186.9) ($187.5)
Total Working Capital $31,764.2 $30,550.6 $32,313.6 Taxes on - Advances $5,982.7 $5,982.7 $5,982.7 Taxes on - CIAC $4,900.0 $5,025.7 $4,930.1 Total Additions to Rate Base $42,646.9 $41,559.0 $43,226.4
Wtd. Avg. Rate Base - District $1,275,279.7 $789,706.1 $987,526.0Rancho & Redwood Allocations $2,981.1 $1,760.4 $1,638.5Wtd. Avg. Rate Base - GO Allocation $90,398.9 $36,498.7 $57,071.6Total Weighted Average Rate Base $1,368,659.7 $827,965.2 $1,046,236.2
ESCALATION YEAR 2018
(In $1,000)
RATE BASE COMPARISON TABLE
Attachment 2 to Settlement Agreement
(With Consolidated Regions)
WEIGHTED AVERAGE DEPRECIATED RATE BASE
California Water Service Company (Total Company)
4

Utility ORAItem Estimate Estimate Settlement
Wtd.Avg. Construction in Progress $66,920.1 $0.0 $0.0Wtd.Avg. Plant in Serv. $2,353,234.0 $2,039,728.5 $2,179,223.4Wtd. Avg. Depreciation Reserve ($801,377.7) ($792,156.0) ($792,931.4)Net Utility Plant $1,618,776.5 $1,247,572.5 $1,386,292.0
Deductions from Rate Base: Contributions In Aid of Construction $147,681.1 $148,502.1 $148,089.5 Advances $181,422.6 $177,069.5 $175,766.5 Reserve for Amortization of Intangibles $8,986.2 $8,786.7 $8,921.7 Deferred Taxes $162,625.6 $125,737.1 $149,254.6 Unamortized Investment Tax Credit $1,320.3 $1,320.1 $1,320.3 Total Deductions from Rate Base $502,035.7 $461,415.5 $483,352.6
Additions to Rate Base:Working Capital:
Materials and Supplies $5,438.3 $5,438.2 $5,516.9 Tank Painting $13,466.9 $12,458.0 $12,321.0 Working Cash - Lead Lag $11,590.7 $11,741.2 $13,460.0 Amount Withheld from Employees ($186.9) ($186.9) ($187.5)
Total Working Capital $30,308.9 $29,450.5 $31,110.3 Taxes on - Advances $6,201.8 $6,201.9 $6,201.8 Taxes on - CIAC $4,705.2 $4,835.2 $4,768.0
Total Additions to Rate Base $41,215.9 $40,487.6 $42,080.1
Wtd. Avg. Rate Base - District $1,157,956.7 $826,644.6 $945,019.5Rancho & Redwood Allocations $3,540.0 $5,908.6 $1,669.9Wtd. Avg. Rate Base - GO Allocation $86,748.3 $43,168.3 $56,746.5
Total Weighted Average Rate Base $1,248,245.0 $875,721.5 $1,003,435.9
(In $1,000)
TEST YEAR 2017
Attachment 2 to Settlement Agreement
RATE BASE COMPARISON TABLE
California Water Service Company (Total Company)
(With Individual Districts - For Information Only)
WEIGHTED AVERAGE DEPRECIATED RATE BASE
5

Utility ORAItem Estimate Estimate Settlement
Wtd.Avg. Construction in Progress 66,920.1$ -$ -$ Wtd.Avg. Plant in Serv. 2,562,991.6$ 2,062,438.2$ 2,302,886.7$ Wtd. Avg. Depreciation Reserve (867,500.5)$ (848,413.2)$ (852,428.7)$ Net Utility Plant 1,762,411.3$ 1,214,025.0$ 1,450,458.1$
Deductions from Rate Base: Contributions In Aid of Construction 149,704.3$ 151,694.6$ 151,084.4$ Advancess 187,583.0$ 178,787.0$ 177,517.1$ Reserve for Amortization of Intangibles 9,994.8$ 9,680.9$ 9,892.1$ Deferred Taxes 181,250.3$ 124,469.3$ 160,070.7$ Unamortized Investment Tax Credit 1,246.0$ 1,246.1$ 1,246.0$ Total Deductions from Rate Base 529,778.5$ 465,877.9$ 499,810.3$
Additions to Rate Base:Working Capital:
Materials and Supplies 5,438.3$ 5,438.2$ 5,516.9$ Tank Painting 13,793.9$ 12,894.2$ 12,901.4$ Working Cash - Lead Lag 12,719.0$ 12,405.1$ 14,082.8$ Amount Withheld from Employees (186.9)$ (186.9)$ (187.5)$
Total Working Capital 31,764.2$ 30,550.6$ 32,313.6$ Taxes on - Advances 5,982.7$ 5,982.7$ 5,982.7$ Taxes on - CIAC 4,900.0$ 5,025.7$ 4,930.1$ Total Additions to Rate Base $ 42,646.9 $ 41,559.0 $ 43,226.4
Wtd. Avg. Rate Base - District 1,275,279.7$ 789,706.1$ 993,874.2$ Rancho & Redwood Allocations 3,733.7$ 1,760.4$ 1,638.5$ Wtd. Avg. Rate Base - GO Allocation 90,398.9$ 36,498.7$ 57,071.6$ Total Weighted Average Rate Base $1,369,412.3 $827,965.2 $1,052,584.3
WEIGHTED AVERAGE DEPRECIATED RATE BASE
ESCALATION YEAR 2018
(In $1,000)
Attachment 2 to Settlement Agreement
RATE BASE COMPARISON TABLE
California Water Service Company (Total Company)
(With Individual Districts - For Information Only)
6

RATE BASE COMPARISON TABLES
INDIVIDUAL DISTRICTS
Attachment 2
SECTION B
7

Utility ORAItem Estimate Estimate Settlement
Wtd.Avg. Construction in Progress $1,940.3 $0.0 $0.0Wtd.Avg. Plant in Serv. $13,413.5 $12,478.6 $13,668.4Wtd. Avg. Depreciation Reserve -$3,965.1 -$3,933.8 -$3,947.3Net Utility Plant $11,388.6 $8,544.8 $9,721.1
Deductions from Rate Base: Contributions In Aid of Construction $289.8 $289.8 $290.3 Advances $259.6 $259.6 $259.6 Reserve for Amortization of Intangibles $52.3 $39.1 $39.1 Deferred Taxes $474.6 $360.1 $761.2 Unamortized Investment Tax Credit $0.7 $0.7 $0.7 Total Deductions from Rate Base $1,077.1 $949.4 $1,350.9
Additions to Rate Base:Working Capital:
Materials and Supplies $9.0 $9.0 $9.0 Tank Painting $70.6 $70.6 $70.6 Working Cash - Lead Lag $124.7 $116.4 $131.3 Amount Withheld from Employees -$1.0 -$1.0 -$1.0
Total Working Capital $203.3 $195.0 $209.9 Taxes on - Advances $0.0 $0.0 $0.0 Taxes on - CIAC $14.8 $14.8 $14.8 Total Additions to Rate Base $218.2 $209.9 $224.7
Wtd. Avg. Rate Base - District $10,529.7 $7,805.3 $8,594.9
Wtd. Avg. Rate Base - GO Allocation $442.5 $220.2 $289.5Total Weighted Average Rate Base $10,972.2 $8,025.5 $8,884.4
RATE BASE COMPARISON TABLE
ANTELOPE VALLEY DISTRICT
WEIGHTED AVERAGE DEPRECIATED RATE BASE
TEST YEAR 2017
Attachment 2 to Settlement Agreement
(Now consolidated into LA County Region - see Section C of this attachment)
(In $1,000)
8

Utility ORAItem Estimate Estimate Settlement
Wtd.Avg. Construction in Progress $1,940.3 $0.0 $0.0Wtd.Avg. Plant in Serv. $13,580.2 $12,376.3 $13,886.9Wtd. Avg. Depreciation Reserve -$4,335.9 -$4,270.1 -$4,316.0Net Utility Plant $11,184.5 $8,106.2 $9,570.9
Deductions from Rate Base: Contributions In Aid of Construction $292.4 $292.5 $292.9 Advances $241.2 $241.2 $241.2 Reserve for Amortization of Intangibles $66.2 $44.2 $44.2 Deferred Taxes $587.4 $421.1 $878.8 Unamortized Investment Tax Credit $0.1 $0.1 $0.1 Total Deductions from Rate Base $1,187.3 $999.2 $1,457.2
Additions to Rate Base:Working Capital:
Materials and Supplies $9.0 $9.0 $9.0 Tank Painting $164.2 $136.8 $164.2 Working Cash - Lead Lag $95.1 $88.1 $103.7 Amount Withheld from Employees -$1.0 -$1.0 -$1.0
Total Working Capital $267.3 $232.9 $275.9 Taxes on - Advances $0.0 $0.0 $0.0 Taxes on - CIAC $14.1 $14.1 $14.1 Total Additions to Rate Base $281.4 $247.0 $290.0
Wtd. Avg. Rate Base - District $10,278.6 $7,354.0 $8,403.6
Wtd. Avg. Rate Base - GO Allocation $461.0 $186.1 $291.1
Total Weighted Average Rate Base $10,739.6 $7,540.1 $8,694.7
(In $1,000)
WEIGHTED AVERAGE DEPRECIATED RATE BASE
ESCALATION YEAR 2018
Attachment 2 to Settlement Agreement
ANTELOPE VALLEY DISTRICT
RATE BASE COMPARISON TABLE
(Now consolidated into LA County Region - see Section C of this attachment)
9
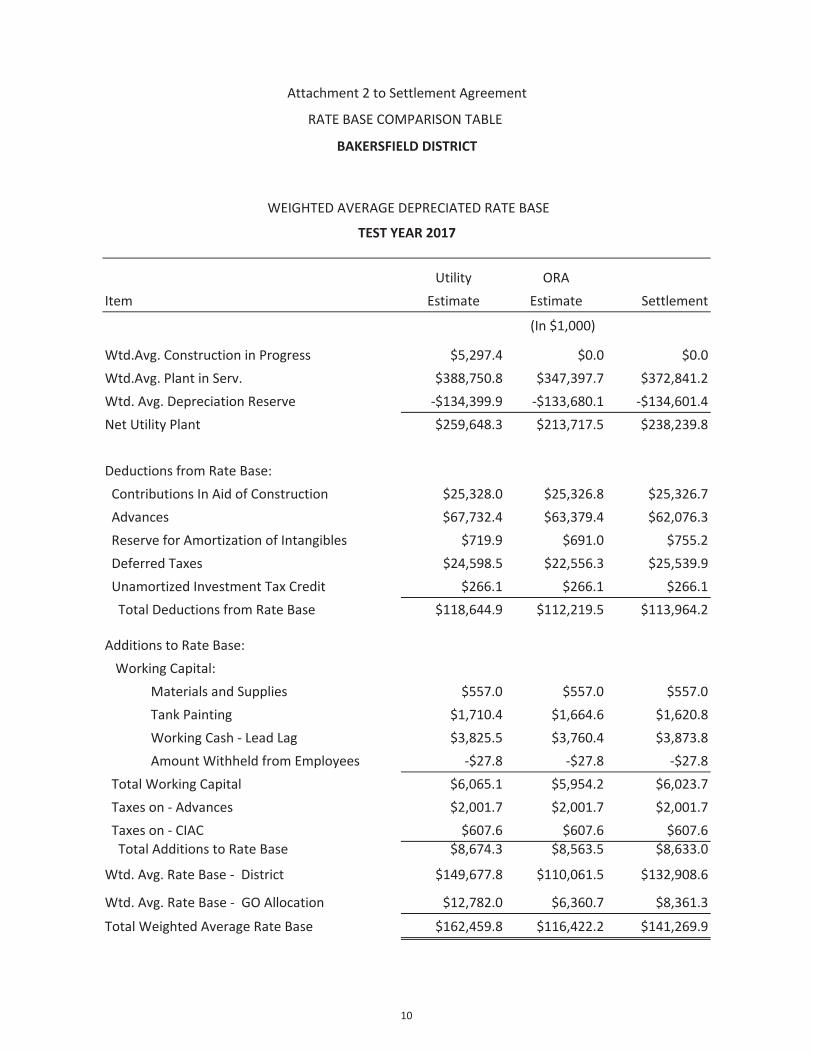
Utility ORAItem Estimate Estimate Settlement
Wtd.Avg. Construction in Progress $5,297.4 $0.0 $0.0Wtd.Avg. Plant in Serv. $388,750.8 $347,397.7 $372,841.2Wtd. Avg. Depreciation Reserve -$134,399.9 -$133,680.1 -$134,601.4Net Utility Plant $259,648.3 $213,717.5 $238,239.8
Deductions from Rate Base: Contributions In Aid of Construction $25,328.0 $25,326.8 $25,326.7 Advances $67,732.4 $63,379.4 $62,076.3 Reserve for Amortization of Intangibles $719.9 $691.0 $755.2 Deferred Taxes $24,598.5 $22,556.3 $25,539.9 Unamortized Investment Tax Credit $266.1 $266.1 $266.1 Total Deductions from Rate Base $118,644.9 $112,219.5 $113,964.2
Additions to Rate Base:Working Capital:
Materials and Supplies $557.0 $557.0 $557.0 Tank Painting $1,710.4 $1,664.6 $1,620.8 Working Cash - Lead Lag $3,825.5 $3,760.4 $3,873.8 Amount Withheld from Employees -$27.8 -$27.8 -$27.8
Total Working Capital $6,065.1 $5,954.2 $6,023.7 Taxes on - Advances $2,001.7 $2,001.7 $2,001.7 Taxes on - CIAC $607.6 $607.6 $607.6 Total Additions to Rate Base $8,674.3 $8,563.5 $8,633.0
Wtd. Avg. Rate Base - District $149,677.8 $110,061.5 $132,908.6
Wtd. Avg. Rate Base - GO Allocation $12,782.0 $6,360.7 $8,361.3
Total Weighted Average Rate Base $162,459.8 $116,422.2 $141,269.9
RATE BASE COMPARISON TABLE
BAKERSFIELD DISTRICT
WEIGHTED AVERAGE DEPRECIATED RATE BASE
TEST YEAR 2017
Attachment 2 to Settlement Agreement
(In $1,000)
10

Utility ORAItem Estimate Estimate Settlement
Wtd.Avg. Construction in Progress $5,297.4 $0.0 $0.0Wtd.Avg. Plant in Serv. $417,924.9 $353,139.4 $394,355.3Wtd. Avg. Depreciation Reserve -$145,894.9 -$143,861.6 -$145,733.0Net Utility Plant $277,327.4 $209,277.9 $248,622.3
Deductions from Rate Base: Contributions In Aid of Construction $25,222.6 $25,218.5 $25,219.1 Advances $76,113.4 $67,317.1 $66,047.4 Reserve for Amortization of Intangibles $813.8 $761.4 $861.1 Deferred Taxes $24,998.4 $21,907.3 $26,182.3 Unamortized Investment Tax Credit $259.6 $259.6 $259.6 Total Deductions from Rate Base $127,407.8 $115,463.9 $118,569.5
Additions to Rate Base:Working Capital:
Materials and Supplies $557.0 $557.0 $557.0 Tank Painting $2,394.4 $2,388.1 $2,313.7 Working Cash - Lead Lag $3,903.2 $3,884.2 $4,049.1 Amount Withheld from Employees -$27.8 -$27.8 -$27.8
Total Working Capital $6,826.7 $6,801.5 $6,892.0 Taxes on - Advances $2,087.4 $2,087.4 $2,087.4 Taxes on - CIAC $651.3 $651.3 $651.3 Total Additions to Rate Base $9,565.3 $9,540.1 $9,630.6
Wtd. Avg. Rate Base - District $159,485.0 $103,354.0 $139,683.4
Wtd. Avg. Rate Base - GO Allocation $13,319.8 $5,378.0 $8,409.2Total Weighted Average Rate Base $172,804.8 $108,732.0 $148,092.6
(In $1,000)
WEIGHTED AVERAGE DEPRECIATED RATE BASE
ESCALATION YEAR 2018
Attachment 2 to Settlement Agreement
BAKERSFIELD DISTRICT
RATE BASE COMPARISON TABLE
11

Utility ORAItem Estimate Estimate Settlement
Wtd.Avg. Construction in Progress $5,377.3 $0.0 $0.0Wtd.Avg. Plant in Serv. $208,165.4 $190,255.8 $193,573.1Wtd. Avg. Depreciation Reserve -$75,043.7 -$74,374.2 -$73,159.5Net Utility Plant $138,498.9 $115,881.7 $120,413.6
Deductions from Rate Base: Contributions In Aid of Construction $15,363.7 $16,217.8 $16,215.8 Advances $4,112.2 $4,112.2 $4,112.2 Reserve for Amortization of Intangibles $1,029.8 $1,026.4 $1,026.4 Deferred Taxes $13,390.9 $12,436.6 $13,743.7 Unamortized Investment Tax Credit $174.7 $174.7 $174.7 Total Deductions from Rate Base $34,071.3 $33,967.8 $35,272.9
Additions to Rate Base:Working Capital:
Materials and Supplies $321.7 $321.7 $321.7 Tank Painting $1,795.3 $1,701.5 $1,701.5 Working Cash - Lead Lag $1,788.6 $1,668.2 $1,669.1 Amount Withheld from Employees -$18.1 -$18.1 -$18.1
Total Working Capital $3,887.5 $3,673.2 $3,674.1 Taxes on - Advances $19.5 $19.5 $19.5 Taxes on - CIAC $750.9 $881.7 $881.7 Total Additions to Rate Base $4,657.9 $4,574.4 $4,575.3
Wtd. Avg. Rate Base - District $109,085.5 $86,488.3 $89,716.1
Wtd. Avg. Rate Base - GO Allocation $8,330.3 $4,145.4 $5,449.3Total Weighted Average Rate Base $117,415.8 $90,633.7 $95,165.4
RATE BASE COMPARISON TABLE
TEST YEAR 2017
WEIGHTED AVERAGE DEPRECIATED RATE BASE
BAYSHORE DISTRICT
Attachment 2 to Settlement Agreement
(Now consolidated into Bay Area Region - see Section C of this attachment)
(In $1,000)
12

Utility ORAItem Estimate Estimate Settlement
Wtd.Avg. Construction in Progress $5,377.3 $0.0 $0.0Wtd.Avg. Plant in Serv. $220,781.6 $195,840.9 $207,469.6Wtd. Avg. Depreciation Reserve -$81,837.5 -$80,400.9 -$78,642.9Net Utility Plant $144,321.3 $115,440.0 $128,826.7
Deductions from Rate Base: Contributions In Aid of Construction $15,506.9 $17,531.7 $17,532.1 Advances $3,849.0 $3,849.0 $3,849.0 Reserve for Amortization of Intangibles $1,097.9 $1,091.4 $1,091.4 Deferred Taxes $13,934.1 $12,331.0 $14,595.0 Unamortized Investment Tax Credit $163.6 $163.6 $163.6 Total Deductions from Rate Base $34,551.4 $34,966.6 $37,231.1
Additions to Rate Base:Working Capital:
Materials and Supplies $321.7 $321.7 $321.7 Tank Painting $1,608.3 $1,523.8 $1,523.8 Working Cash - Lead Lag $1,850.6 $1,718.6 $1,765.9 Amount Withheld from Employees -$18.1 -$18.1 -$18.1
Total Working Capital $3,762.5 $3,546.0 $3,593.2 Taxes on - Advances $18.8 $18.8 $18.8 Taxes on - CIAC $763.8 $890.1 $890.1 Total Additions to Rate Base $4,545.1 $4,454.8 $4,502.1
Wtd. Avg. Rate Base - District $114,315.1 $84,928.2 $96,097.8
Wtd. Avg. Rate Base - GO Allocation $8,680.9 $3,504.9 $5,480.5Total Weighted Average Rate Base $122,996.0 $88,433.1 $101,578.3
(In $1,000)
Attachment 2 to Settlement Agreement
BAYSHORE DISTRICT
WEIGHTED AVERAGE DEPRECIATED RATE BASE
ESCALATION YEAR 2018
RATE BASE COMPARISON TABLE
(Now consolidated into Bay Area Region - see Section C of this attachment)
13

Utility ORAItem Estimate Estimate Settlement
Wtd.Avg. Construction in Progress $5,499.6 $0.0 $0.0Wtd.Avg. Plant in Serv. $162,593.2 $135,661.1 $147,558.9Wtd. Avg. Depreciation Reserve -$54,315.5 -$53,788.0 -$53,144.0Net Utility Plant $113,777.3 $81,873.1 $94,414.9
Deductions from Rate Base: Contributions In Aid of Construction $9,197.0 $9,197.9 $9,197.0 Advances $1,145.5 $1,145.5 $1,145.5 Reserve for Amortization of Intangibles $906.6 $881.3 $904.9 Deferred Taxes $11,470.7 $7,509.5 $7,509.5 Unamortized Investment Tax Credit $95.5 $95.5 $95.5 Total Deductions from Rate Base $22,815.3 $18,829.7 $18,852.4
Additions to Rate Base:Working Capital:
Materials and Supplies $299.4 $299.4 $299.4 Tank Painting $948.9 $885.0 $885.6 Working Cash - Lead Lag $310.9 $242.1 $262.7 Amount Withheld from Employees -$11.0 -$11.0 -$11.0
Total Working Capital $1,548.2 $1,415.4 $1,436.7 Taxes on - Advances $35.0 $35.0 $35.0 Taxes on - CIAC $230.3 $230.3 $230.3 Total Additions to Rate Base $1,813.5 $1,680.8 $1,702.0
Wtd. Avg. Rate Base - District $92,775.5 $64,724.1 $77,264.5
Wtd. Avg. Rate Base - GO Allocation $5,076.4 $2,526.1 $3,320.7Total Weighted Average Rate Base $97,851.9 $67,250.2 $80,585.2
Attachment 2 to Settlement Agreement
RATE BASE COMPARISON TABLE
BEAR GULCH DISTRICT
WEIGHTED AVERAGE DEPRECIATED RATE BASE
TEST YEAR 2017
(In $1,000)
14

Utility ORAItem Estimate Estimate Settlement
Wtd.Avg. Construction in Progress $5,499.6 $0.0 $0.0Wtd.Avg. Plant in Serv. $182,557.7 $137,319.1 $158,130.9Wtd. Avg. Depreciation Reserve -$59,085.4 -$57,801.7 -$57,122.1Net Utility Plant $128,972.0 $79,517.5 $101,008.8
Deductions from Rate Base: Contributions In Aid of Construction $9,634.0 $9,632.2 $9,633.2 Advances $1,085.5 $1,085.5 $1,085.5 Reserve for Amortization of Intangibles $1,041.5 $1,004.5 $1,036.9 Deferred Taxes $13,154.7 $7,634.1 $7,634.1 Unamortized Investment Tax Credit $89.9 $89.9 $89.9 Total Deductions from Rate Base $25,005.5 $19,446.2 $19,479.5
Additions to Rate Base:Working Capital:
Materials and Supplies $299.4 $299.4 $299.4 Tank Painting $866.3 $809.0 $809.6 Working Cash - Lead Lag $330.7 $266.3 $279.5 Amount Withheld from Employees -$11.0 -$11.0 -$11.0
Total Working Capital $1,485.3 $1,363.7 $1,377.5 Taxes on - Advances $16.7 $16.7 $16.7 Taxes on - CIAC $247.8 $247.8 $247.8 Total Additions to Rate Base $1,749.9 $1,628.2 $1,642.0
Wtd. Avg. Rate Base - District $105,716.3 $61,699.5 $83,171.4
Wtd. Avg. Rate Base - GO Allocation $5,290.0 $2,135.8 $3,339.7Total Weighted Average Rate Base $111,006.3 $63,835.3 $86,511.1
RATE BASE COMPARISON TABLE
(In $1,000)
WEIGHTED AVERAGE DEPRECIATED RATE BASE
ESCALATION YEAR 2018
Attachment 2 to Settlement Agreement
BEAR GULCH DISTRICT
15

Utility ORAItem Estimate Estimate Settlement
Wtd.Avg. Construction in Progress $3,855.8 $0.0 $0.0Wtd.Avg. Plant in Serv. $157,006.4 $142,144.6 $148,175.8Wtd. Avg. Depreciation Reserve -$56,454.0 -$56,164.2 -$56,649.6Net Utility Plant $104,408.2 $85,980.4 $91,526.2
Deductions from Rate Base: Contributions In Aid of Construction $10,682.2 $10,675.7 $10,675.3 Advances $25,292.5 $25,292.5 $25,292.5 Reserve for Amortization of Intangibles $338.8 $338.8 $338.8 Deferred Taxes $10,191.0 $8,837.0 $9,925.9 Unamortized Investment Tax Credit $197.8 $197.8 $197.8 Total Deductions from Rate Base $46,702.3 $45,341.8 $46,430.3
Additions to Rate Base:Working Capital:
Materials and Supplies $279.1 $279.1 $279.1 Tank Painting $183.0 $8.0 $8.0 Working Cash - Lead Lag $304.5 $404.4 $367.7 Amount Withheld from Employees -$10.6 -$10.6 -$10.6
Total Working Capital $756.1 $680.9 $644.2 Taxes on - Advances $1,008.8 $1,008.8 $1,008.8 Taxes on - CIAC $183.5 $183.5 $183.5 Total Additions to Rate Base $1,948.4 $1,873.2 $1,836.6
Wtd. Avg. Rate Base - District $59,654.2 $42,511.8 $46,932.4
Wtd. Avg. Rate Base - GO Allocation $4,876.6 $2,426.8 $3,190.2Total Weighted Average Rate Base $64,530.8 $44,938.6 $50,122.6
Attachment 2 to Settlement Agreement
RATE BASE COMPARISON TABLE
CHICO DISTRICT
WEIGHTED AVERAGE DEPRECIATED RATE BASE
TEST YEAR 2017
(In $1,000)
16

Utility ORAItem Estimate Estimate Settlement
Wtd.Avg. Construction in Progress $3,855.8 $0.0 $0.0Wtd.Avg. Plant in Serv. $164,708.2 $145,157.4 $153,934.9Wtd. Avg. Depreciation Reserve -$60,044.6 -$59,630.1 -$60,241.7Net Utility Plant $108,519.4 $85,527.3 $93,693.1
Deductions from Rate Base: Contributions In Aid of Construction $10,681.6 $10,674.8 $10,674.7 Advances $24,896.2 $24,896.2 $24,896.2 Reserve for Amortization of Intangibles $360.3 $360.3 $360.3 Deferred Taxes $11,051.6 $8,767.6 $10,336.8 Unamortized Investment Tax Credit $196.3 $196.3 $196.3 Total Deductions from Rate Base $47,186.1 $44,895.2 $46,464.3
Additions to Rate Base:Working Capital:
Materials and Supplies $279.1 $279.1 $279.1 Tank Painting $339.3 $6.8 $6.8 Working Cash - Lead Lag $291.1 $412.2 $361.7 Amount Withheld from Employees -$10.6 -$10.6 -$10.6
Total Working Capital $898.9 $687.5 $637.0 Taxes on - Advances $975.8 $975.8 $975.8 Taxes on - CIAC $184.4 $184.4 $184.4 Total Additions to Rate Base $2,059.2 $1,847.7 $1,797.3
Wtd. Avg. Rate Base - District $63,392.4 $42,479.8 $49,026.0
Wtd. Avg. Rate Base - GO Allocation $5,082.0 $2,051.9 $3,208.5Total Weighted Average Rate Base $68,474.4 $44,531.7 $52,234.5
RATE BASE COMPARISON TABLE
(In $1,000)
WEIGHTED AVERAGE DEPRECIATED RATE BASE
ESCALATION YEAR 2018
Attachment 2 to Settlement Agreement
CHICO DISTRICT
17

Utility ORAItem Estimate Estimate Settlement
Wtd.Avg. Construction in Progress $1,705.8 $0.0 $0.0Wtd.Avg. Plant in Serv. $16,771.1 $16,246.5 $16,768.8Wtd. Avg. Depreciation Reserve -$4,482.9 -$4,452.2 -$4,459.3Net Utility Plant $13,993.9 $11,794.2 $12,309.5
Deductions from Rate Base: Contributions In Aid of Construction $391.0 $391.0 $391.0 Advances $302.2 $302.2 $302.2 Reserve for Amortization of Intangibles $314.0 $313.9 $314.2 Deferred Taxes $1,048.3 $963.2 $1,079.4 Unamortized Investment Tax Credit $7.3 $7.3 $7.3 Total Deductions from Rate Base $2,062.8 $1,977.7 $2,094.1
Additions to Rate Base:Working Capital:
Materials and Supplies $77.0 $77.0 $77.0 Tank Painting $104.4 $104.4 $104.4 Working Cash - Lead Lag $162.3 $146.9 $153.0 Amount Withheld from Employees -$1.1 -$1.1 -$1.1
Total Working Capital $342.6 $327.2 $333.3 Taxes on - Advances $3.6 $3.6 $3.6 Taxes on - CIAC $6.2 $6.2 $6.2 Total Additions to Rate Base $352.4 $337.1 $343.2
Wtd. Avg. Rate Base - District $12,283.5 $10,153.6 $10,558.5
Wtd. Avg. Rate Base - GO Allocation $511.9 $254.7 $334.9Total Weighted Average Rate Base $12,795.4 $10,408.3 $10,893.4
Attachment 2 to Settlement Agreement
RATE BASE COMPARISON TABLE
DIXON DISTRICT
WEIGHTED AVERAGE DEPRECIATED RATE BASE
TEST YEAR 2017
(In $1,000)
18

Utility ORAItem Estimate Estimate Settlement
Wtd.Avg. Construction in Progress $1,705.8 $0.0 $0.0Wtd.Avg. Plant in Serv. $18,262.2 $16,176.1 $17,066.5Wtd. Avg. Depreciation Reserve -$4,959.0 -$4,896.9 -$4,934.2Net Utility Plant $15,009.0 $11,279.2 $12,132.3
Deductions from Rate Base: Contributions In Aid of Construction $404.1 $404.1 $404.1 Advances $285.1 $285.1 $285.1 Reserve for Amortization of Intangibles $359.0 $358.8 $359.0 Deferred Taxes $1,086.7 $942.1 $1,112.7 Unamortized Investment Tax Credit $6.8 $6.8 $6.8 Total Deductions from Rate Base $2,141.6 $1,996.8 $2,167.7
Additions to Rate Base:Working Capital:
Materials and Supplies $77.0 $77.0 $77.0 Tank Painting $91.3 $91.3 $91.3 Working Cash - Lead Lag $164.2 $150.7 $157.9 Amount Withheld from Employees -$1.1 -$1.1 -$1.1
Total Working Capital $331.5 $317.9 $325.1 Taxes on - Advances $3.4 $3.4 $3.4 Taxes on - CIAC $6.3 $6.3 $6.3 Total Additions to Rate Base $341.2 $327.6 $334.8
Wtd. Avg. Rate Base - District $13,208.5 $9,610.0 $10,299.4
Wtd. Avg. Rate Base - GO Allocation $533.4 $215.4 $336.8Total Weighted Average Rate Base $13,741.9 $9,825.4 $10,636.2
RATE BASE COMPARISON TABLE
(In $1,000)
WEIGHTED AVERAGE DEPRECIATED RATE BASE
ESCALATION YEAR 2018
Attachment 2 to Settlement Agreement
DIXON DISTRICT
19

Utility ORAItem Estimate Estimate Settlement
Wtd.Avg. Construction in Progress $5,947.5 $0.0 $0.0Wtd.Avg. Plant in Serv. $181,808.0 $137,233.3 $149,017.8Wtd. Avg. Depreciation Reserve -$62,789.3 -$59,916.8 -$59,986.8Net Utility Plant $124,966.2 $77,316.5 $89,030.9
Deductions from Rate Base: Contributions In Aid of Construction $11,668.9 $11,656.4 $11,654.4 Advances $2,426.9 $2,426.9 $2,426.9 Reserve for Amortization of Intangibles $512.5 $454.3 $466.1 Deferred Taxes $4,400.0 $1,780.2 $3,377.4 Unamortized Investment Tax Credit $114.1 $114.1 $114.1 Total Deductions from Rate Base $19,122.4 $16,431.9 $18,038.9
Additions to Rate Base:Working Capital:
Materials and Supplies $273.4 $273.4 $273.4 Tank Painting $1,460.0 $1,275.3 $1,460.0 Working Cash - Lead Lag $249.0 -$250.5 -$212.2 Amount Withheld from Employees -$16.9 -$16.9 -$16.9
Total Working Capital $1,965.6 $1,281.3 $1,504.3 Taxes on - Advances $21.7 $21.7 $21.7 Taxes on - CIAC $379.4 $379.4 $379.4 Total Additions to Rate Base $2,366.7 $1,682.3 $1,905.4
Wtd. Avg. Rate Base - District $108,210.5 $62,567.0 $72,897.4Wtd. Avg. Rate Base - Rancho Dom Allocation $1,338.3 $750.0 $655.2
Wtd. Avg. Rate Base - GO Allocation $7,749.0 $3,856.1 $5,069.0Total Weighted Average Rate Base $117,297.8 $67,173.2 $78,621.6
(In $1,000)
RATE BASE COMPARISON TABLE
DOMINGUEZ DISTRICT
WEIGHTED AVERAGE DEPRECIATED RATE BASE
TEST YEAR 2017
Attachment 2 to Settlement Agreement
20

Utility ORAItem Estimate Estimate Settlement
Wtd.Avg. Construction in Progress $5,947.5 $0.0 $0.0Wtd.Avg. Plant in Serv. $197,840.4 $136,244.8 $154,602.0Wtd. Avg. Depreciation Reserve -$67,249.5 -$62,651.2 -$62,893.1Net Utility Plant $136,538.4 $73,593.6 $91,709.0
Deductions from Rate Base: Contributions In Aid of Construction $11,655.6 $11,669.4 $11,670.0 Advances $2,281.2 $2,281.2 $2,281.2 Reserve for Amortization of Intangibles $618.0 $528.9 $551.2 Deferred Taxes $4,550.7 $1,494.2 $3,736.9 Unamortized Investment Tax Credit $105.9 $105.9 $105.9 Total Deductions from Rate Base $19,211.3 $16,079.6 $18,345.1
Additionsto Rate Base:Working Capital:
Materials and Supplies $273.4 $273.4 $273.4 Tank Painting $1,293.5 $1,129.3 $1,293.5 Working Cash - Lead Lag $295.3 -$246.6 -$138.2 Amount Withheld from Employees -$16.9 -$16.9 -$16.9
Total Working Capital $1,845.3 $1,139.2 $1,411.9 Taxes on - Advances $20.9 $20.9 $20.9 Taxes on - CIAC $389.7 $389.7 $389.7 Total Additions to Rate Base $2,255.9 $1,549.8 $1,822.4
Wtd. Avg. Rate Base - District $119,583.0 $59,063.8 $75,186.3Wtd. Avg. Rate Base - Rancho Dom Allocation $1,336.4 $696.5 $564.4
Wtd. Avg. Rate Base - GO Allocation $8,075.2 $3,260.4 $5,098.0Total Weighted Average Rate Base $128,994.6 $63,020.7 $80,848.7
(In $1,000)
RATE BASE COMPARISON TABLE
Attachment 2 to Settlement Agreement
ESCALATION YEAR 2018
WEIGHTED AVERAGE DEPRECIATED RATE BASE
DOMINGUEZ DISTRICT
21

Utility ORAItem Estimate Estimate Settlement
Wtd.Avg. Construction in Progress $4,911.4 $0.0 $0.0Wtd.Avg. Plant in Serv. $126,739.6 $107,955.1 $119,357.8Wtd. Avg. Depreciation Reserve -$40,342.0 -$39,818.8 -$40,136.9Net Utility Plant $91,309.0 $68,136.3 $79,220.9
Deductions from Rate Base: Contributions In Aid of Construction $6,671.9 $6,670.2 $6,670.2 Advances $67.6 $67.6 $67.6 Reserve for Amortization of Intangibles $422.5 $422.5 $422.5 Deferred Taxes $9,404.3 $8,007.4 $9,885.1 Unamortized Investment Tax Credit -$166.7 -$166.7 -$166.7 Total Deductions from Rate Base $16,399.7 $15,001.1 $16,878.7
Additions to Rate Base:Working Capital:
Materials and Supplies $345.6 $345.6 $345.6 Tank Painting $1,949.2 $1,581.3 $1,938.7 Working Cash - Lead Lag $367.0 $319.8 $270.4 Amount Withheld from Employees -$11.4 -$11.4 -$11.4
Total Working Capital $2,650.4 $2,235.2 $2,543.2 Taxes on - Advances $0.0 $0.0 $0.0 Taxes on - CIAC $218.8 $218.8 $218.8 Total Additions to Rate Base $2,869.2 $2,454.0 $2,762.0
Wtd. Avg. Rate Base - District $77,778.4 $55,589.2 $65,104.1
Wtd. Avg. Rate Base - GO Allocation $5,241.2 $2,608.2 $3,428.5Total Weighted Average Rate Base $83,019.6 $58,197.4 $68,532.6
Attachment 2 to Settlement Agreement
RATE BASE COMPARISON TABLE
EAST LOS ANGELES DISTRICT
WEIGHTED AVERAGE DEPRECIATED RATE BASE
TEST YEAR 2017
(In $1,000)
22

Utility ORAItem Estimate Estimate Settlement
Wtd.Avg. Construction in Progress $4,911.4 $0.0 $0.0Wtd.Avg. Plant in Serv. $137,646.1 $108,640.2 $128,966.3Wtd. Avg. Depreciation Reserve -$43,065.0 -$41,998.6 -$42,723.5Net Utility Plant $99,492.5 $66,641.6 $86,242.8
Deductions from Rate Base: Contributions In Aid of Construction $6,519.9 $6,514.9 $6,514.9 Advances $60.0 $60.0 $60.0 Reserve for Amortization of Intangibles $455.2 $455.2 $455.2 Deferred Taxes $10,769.5 $8,193.6 $11,391.0 Unamortized Investment Tax Credit -$172.5 -$172.5 -$172.5 Total Deductions from Rate Base $17,632.1 $15,051.2 $18,248.6
Additions to Rate Base:Working Capital:
Materials and Supplies $345.6 $345.6 $345.6 Tank Painting $1,708.6 $1,379.7 $1,699.2 Working Cash - Lead Lag $380.3 $361.1 $311.1 Amount Withheld from Employees -$11.4 -$11.4 -$11.4
Total Working Capital $2,423.1 $2,075.0 $2,344.5 Taxes on - Advances $0.0 $0.0 $0.0 Taxes on - CIAC $220.9 $220.9 $220.9 Total Additions to Rate Base $2,643.9 $2,295.9 $2,565.3
Wtd. Avg. Rate Base - District $84,504.3 $53,886.3 $70,559.5
Wtd. Avg. Rate Base - GO Allocation $5,461.8 $2,205.2 $3,448.1Total Weighted Average Rate Base $89,966.1 $56,091.5 $74,007.6
RATE BASE COMPARISON TABLE
(In $1,000)
WEIGHTED AVERAGE DEPRECIATED RATE BASE
ESCALATION YEAR 2018
Attachment 2 to Settlement Agreement
EAST LOS ANGELES DISTRICT
23

Utility ORAItem Estimate Estimate Settlement
Wtd.Avg. Construction in Progress $1,089.8 $0.0 $0.0Wtd.Avg. Plant in Serv. $85,551.1 $72,181.3 $77,372.8Wtd. Avg. Depreciation Reserve -$34,519.5 -$33,987.4 -$34,072.9Net Utility Plant $52,121.4 $38,193.9 $43,299.9
Deductions from Rate Base: Contributions In Aid of Construction $2,145.2 $2,146.2 $2,145.4 Advances $246.0 $246.0 $246.0 Reserve for Amortization of Intangibles $271.9 $271.9 $271.9 Deferred Taxes $7,922.7 $5,777.5 $7,079.6 Unamortized Investment Tax Credit $61.8 $61.8 $61.8 Total Deductions from Rate Base $10,647.6 $8,503.4 $9,804.7
Additions to Rate Base:Working Capital:
Materials and Supplies $150.6 $150.6 $150.6 Tank Painting $868.5 $333.5 $664.8 Working Cash - Lead Lag $403.8 $432.0 $445.9 Amount Withheld from Employees -$9.3 -$9.3 -$9.3
Total Working Capital $1,413.6 $906.8 $1,252.0 Taxes on - Advances $5.2 $5.2 $5.2 Taxes on - CIAC $137.4 $137.4 $106.2 Total Additions to Rate Base $1,556.1 $1,049.4 $1,363.4
Wtd. Avg. Rate Base - District $43,030.0 $30,739.9 $34,858.5Wtd. Avg. Rate Base - Rancho Dom Allocation $737.3 $413.2 $361.0Wtd. Avg. Rate Base - GO Allocation $4,269.2 $2,124.5 $2,792.8Total Weighted Average Rate Base $48,036.5 $33,277.7 $38,012.3
Attachment 2 to Settlement Agreement
RATE BASE COMPARISON TABLE
HERMOSA REDONDO DISTRICT
WEIGHTED AVERAGE DEPRECIATED RATE BASE
TEST YEAR 2017
(In $1,000)
24

Utility ORAItem Estimate Estimate Settlement
Wtd.Avg. Construction in Progress $1,089.8 $0.0 $0.0Wtd.Avg. Plant in Serv. $95,966.7 $71,913.2 $82,230.1Wtd. Avg. Depreciation Reserve -$37,324.5 -$36,236.4 -$36,485.8Net Utility Plant $59,732.0 $35,676.7 $45,744.3
Deductions from Rate Base: Contributions In Aid of Construction $2,127.6 $2,129.2 $2,130.1 Advances $230.8 $230.8 $230.8 Reserve for Amortization of Intangibles $308.4 $308.4 $308.4 Deferred Taxes $8,765.2 $5,450.2 $7,789.0 Unamortized Investment Tax Credit $56.9 $56.9 $56.9 Total Deductions from Rate Base $11,488.8 $8,175.5 $10,515.1
Additionsto Rate Base:Working Capital:
Materials and Supplies $150.6 $150.6 $150.6 Tank Painting $861.4 $380.2 $678.3 Working Cash - Lead Lag $610.1 $456.8 $370.7 Amount Withheld from Employees -$9.3 -$9.3 -$9.3
Total Working Capital $1,612.8 $978.3 $1,190.3 Taxes on - Advances $4.5 $4.5 $4.5 Taxes on - CIAC $138.0 $138.0 $97.1 Total Additions to Rate Base $1,755.4 $1,120.9 $1,292.0
Wtd. Avg. Rate Base - District $49,998.6 $28,622.1 $36,521.2$736.3 $383.7 $310.9
Wtd. Avg. Rate Base - GO Allocation $4,449.0 $1,796.2 $2,808.8Total Weighted Average Rate Base $55,183.9 $30,802.0 $39,641.0
Wtd. Avg. Rate Base - Rancho Dom Allocation
(In $1,000)
Attachment 2 to Settlement Agreement
WEIGHTED AVERAGE DEPRECIATED RATE BASE
ESCALATION YEAR 2018
HERMOSA REDONDO DISTRICT
RATE BASE COMPARISON TABLE
25

Utility ORAItem Estimate Estimate Settlement
Wtd.Avg. Construction in Progress $690.5 $0.0 $0.0Wtd.Avg. Plant in Serv. $30,823.0 $27,575.6 $30,342.8Wtd. Avg. Depreciation Reserve -$12,551.7 -$12,406.3 -$12,472.7Net Utility Plant $18,961.8 $15,169.3 $17,870.0
Deductions from Rate Base: Contributions In Aid of Construction $601.6 $601.8 $601.4 Advances $10.8 $10.8 $10.8 Reserve for Amortization of Intangibles $62.4 $62.7 $62.4 Deferred Taxes $893.0 $683.8 $929.5 Unamortized Investment Tax Credit $3.1 $3.1 $3.1 Total Deductions from Rate Base $1,570.8 $1,362.1 $1,607.2
Additions to Rate Base:Working Capital:
Materials and Supplies $5.1 $5.1 $5.1 Tank Painting $472.1 $472.1 $472.1 Working Cash - Lead Lag $306.4 $287.4 $320.1 Amount Withheld from Employees -$2.2 -$2.2 -$2.2
Total Working Capital $781.3 $762.4 $795.0 Taxes on - Advances $0.0 $0.0 $0.0 Taxes on - CIAC $44.4 $44.4 $44.4 Total Additions to Rate Base $825.7 $806.7 $839.4
Wtd. Avg. Rate Base - District $18,216.7 $14,613.9 $17,102.2
Wtd. Avg. Rate Base - GO Allocation $1,032.6 $513.9 $675.4Total Weighted Average Rate Base $19,249.3 $15,127.8 $17,777.6
Attachment 2 to Settlement Agreement
RATE BASE COMPARISON TABLE
KERN RIVER VALLEY DISTRICT
WEIGHTED AVERAGE DEPRECIATED RATE BASE
TEST YEAR 2017
(In $1,000)
26

Utility ORAItem Estimate Estimate Settlement
Wtd.Avg. Construction in Progress $690.5 $0.0 $0.0Wtd.Avg. Plant in Serv. $31,564.6 $27,566.6 $31,025.3Wtd. Avg. Depreciation Reserve -$13,535.1 -$13,270.5 -$13,474.0Net Utility Plant $18,720.0 $14,296.1 $17,551.3
Deductions from Rate Base: Contributions In Aid of Construction $635.2 $635.4 $635.0 Advances $9.6 $9.6 $9.6 Reserve for Amortization of Intangibles $70.4 $70.8 $70.4 Deferred Taxes $1,004.3 $663.8 $1,013.5 Unamortized Investment Tax Credit $2.6 $2.6 $2.6 Total Deductions from Rate Base $1,722.1 $1,382.3 $1,731.2
Additions to Rate Base:Working Capital:
Materials and Supplies $5.1 $5.1 $5.1 Tank Painting $474.2 $474.2 $474.2 Working Cash - Lead Lag $314.4 $295.4 $330.0 Amount Withheld from Employees -$2.2 -$2.2 -$2.2
Total Working Capital $791.5 $772.5 $807.0 Taxes on - Advances $0.0 $0.0 $0.0 Taxes on - CIAC $42.0 $42.0 $42.0 Total Additions to Rate Base $833.5 $814.4 $849.0
Wtd. Avg. Rate Base - District $17,831.4 $13,728.2 $16,669.1
Wtd. Avg. Rate Base - GO Allocation $1,076.1 $434.4 $679.3Total Weighted Average Rate Base $18,907.5 $14,162.6 $17,348.4
RATE BASE COMPARISON TABLE
(In $1,000)
WEIGHTED AVERAGE DEPRECIATED RATE BASE
ESCALATION YEAR 2018
Attachment 2 to Settlement Agreement
KERN RIVER VALLEY DISTRICT
27

Utility ORAItem Estimate Estimate Settlement
Wtd.Avg. Construction in Progress $883.5 $0.0 $0.0Wtd.Avg. Plant in Serv. $21,855.3 $19,818.6 $20,057.6Wtd. Avg. Depreciation Reserve -$5,340.8 -$5,363.3 -$5,378.5Net Utility Plant $17,398.1 $14,455.4 $14,679.1
Deductions from Rate Base: Contributions In Aid of Construction $849.9 $849.9 $849.9 Advances $2,517.3 $2,517.3 $2,517.3 Reserve for Amortization of Intangibles $346.2 $345.3 $346.1 Deferred Taxes $1,533.6 $1,245.3 $1,269.3 Unamortized Investment Tax Credit $7.7 $7.7 $7.7 Total Deductions from Rate Base $5,254.7 $4,965.4 $4,990.2
Additions to Rate Base:Working Capital:
Materials and Supplies $53.3 $53.3 $53.3 Tank Painting $120.6 $0.0 $0.0 Working Cash - Lead Lag $100.3 $106.2 $132.8 Amount Withheld from Employees -$1.2 -$1.2 -$1.2
Total Working Capital $273.0 $158.3 $184.9 Taxes on - Advances $74.2 $74.2 $74.2 Taxes on - CIAC $12.9 $12.9 $12.9 Total Additions to Rate Base $360.1 $245.4 $271.9
Wtd. Avg. Rate Base - District $12,503.4 $9,735.3 $9,960.8
Wtd. Avg. Rate Base - GO Allocation $572.7 $284.9 $374.7Total Weighted Average Rate Base $13,076.1 $10,020.2 $10,335.5
Attachment 2 to Settlement Agreement
RATE BASE COMPARISON TABLE
KING CITY DISTRICT
WEIGHTED AVERAGE DEPRECIATED RATE BASE
TEST YEAR 2017
(In $1,000)
28

(N lid d i R i S i C f hi A h )
Utility ORAItem Estimate Estimate Settlement
Wtd.Avg. Construction in Progress $883.5 $0.0 $0.0Wtd.Avg. Plant in Serv. $23,967.4 $20,658.4 $21,521.6Wtd. Avg. Depreciation Reserve -$5,889.9 -$5,875.0 -$5,899.4Net Utility Plant $18,961.1 $14,783.4 $15,622.2
Deductions from Rate Base: Contributions In Aid of Construction $874.1 $874.0 $874.0 Advances $2,666.2 $2,666.2 $2,666.2 Reserve for Amortization of Intangibles $374.0 $372.5 $373.8 Deferred Taxes $1,911.8 $1,424.1 $1,588.1 Unamortized Investment Tax Credit $7.6 $7.6 $7.6 Total Deductions from Rate Base $5,833.7 $5,344.4 $5,509.6
Additions to Rate Base:Working Capital:
Materials and Supplies $53.3 $53.3 $53.3 Tank Painting $169.5 $0.0 $64.0 Working Cash - Lead Lag $126.3 $124.4 $89.5 Amount Withheld from Employees -$1.2 -$1.2 -$1.2
Total Working Capital $348.0 $176.5 $205.6 Taxes on - Advances $76.2 $76.2 $76.2 Taxes on - CIAC $12.0 $12.0 $12.0 Total Additions to Rate Base $436.1 $264.7 $293.7
Wtd. Avg. Rate Base - District $13,563.5 $9,703.7 $10,406.3
Wtd. Avg. Rate Base - GO Allocation $596.8 $240.9 $376.7Total Weighted Average Rate Base $14,160.3 $9,944.6 $10,783.0
(Now consolidated into Monterey Region - see Section C of this attachment)
RATE BASE COMPARISON TABLE
(In $1,000)
WEIGHTED AVERAGE DEPRECIATED RATE BASE
ESCALATION YEAR 2018
Attachment 2 to Settlement Agreement
KING CITY DISTRICT
29

Utility ORAItem Estimate Estimate Settlement
Wtd.Avg. Construction in Progress $2,171.0 $0.0 $0.0Wtd.Avg. Plant in Serv. $80,407.2 $69,866.4 $75,143.4Wtd. Avg. Depreciation Reserve -$29,970.5 -$29,658.7 -$29,331.2Net Utility Plant $52,607.8 $40,207.7 $45,812.3
Deductions from Rate Base: Contributions In Aid of Construction $3,116.2 $3,116.8 $3,115.9 Advances $10,974.0 $10,974.0 $10,974.0 Reserve for Amortization of Intangibles $145.2 $145.0 $145.1 Deferred Taxes $6,361.4 $5,272.0 $5,709.5 Unamortized Investment Tax Credit $84.3 $84.3 $84.3 Total Deductions from Rate Base $20,681.1 $19,592.1 $20,028.8
Additions to Rate Base:Working Capital:
Materials and Supplies $133.6 $133.6 $133.6 Tank Painting $501.0 $463.6 $463.6 Working Cash - Lead Lag $722.1 $697.0 $728.8 Amount Withheld from Employees -$6.1 -$6.1 -$6.1
Total Working Capital $1,350.7 $1,288.2 $1,319.9 Taxes on - Advances $286.2 $286.2 $286.2 Taxes on - CIAC $110.9 $110.9 $110.9 Total Additions to Rate Base $1,747.9 $1,685.3 $1,717.1
Wtd. Avg. Rate Base - District $33,674.5 $22,300.9 $27,500.6
Wtd. Avg. Rate Base - GO Allocation $2,785.5 $1,386.2 $1,822.1Total Weighted Average Rate Base $36,460.0 $23,687.1 $29,322.7
Attachment 2 to Settlement Agreement
RATE BASE COMPARISON TABLE
LIVERMORE DISTRICT
WEIGHTED AVERAGE DEPRECIATED RATE BASE
TEST YEAR 2017
Attachment 2 to Settlement Agreement
(In $1,000)
30

Utility ORAItem Estimate Estimate Settlement
Wtd.Avg. Construction in Progress $2,171.0 $0.0 $0.0Wtd.Avg. Plant in Serv. $85,646.3 $71,946.8 $78,320.5Wtd. Avg. Depreciation Reserve -$32,463.1 -$31,872.0 -$31,521.8Net Utility Plant $55,354.2 $40,074.8 $46,798.6
Deductions from Rate Base: Contributions In Aid of Construction $3,078.2 $3,078.1 $3,078.8 Advances $10,707.6 $10,707.6 $10,707.6 Reserve for Amortization of Intangibles $156.5 $156.3 $156.3 Deferred Taxes $7,114.9 $5,495.8 $6,092.2 Unamortized Investment Tax Credit $82.9 $82.9 $82.9 Total Deductions from Rate Base $21,140.1 $19,520.7 $20,117.9
Additions to Rate Base:Working Capital:
Materials and Supplies $133.6 $133.6 $133.6 Tank Painting $441.4 $407.9 $407.9 Working Cash - Lead Lag $747.4 $709.8 $756.7 Amount Withheld from Employees -$6.1 -$6.1 -$6.1
Total Working Capital $1,316.3 $1,245.2 $1,292.1 Taxes on - Advances $303.0 $303.0 $303.0 Taxes on - CIAC $112.4 $112.4 $112.4 Total Additions to Rate Base $1,731.6 $1,660.6 $1,707.5
Wtd. Avg. Rate Base - District $35,945.7 $22,214.7 $28,388.2
Wtd. Avg. Rate Base - GO Allocation $2,902.7 $1,172.0 $1,832.6Total Weighted Average Rate Base $38,848.4 $23,386.7 $30,220.8
RATE BASE COMPARISON TABLE
(In $1,000)
WEIGHTED AVERAGE DEPRECIATED RATE BASE
ESCALATION YEAR 2018
LIVERMORE DISTRICT
31

Utility ORAItem Estimate Estimate Settlement
Wtd.Avg. Construction in Progress $2,023.9 $0.0 $0.0Wtd.Avg. Plant in Serv. $96,460.1 $87,946.6 $93,452.6Wtd. Avg. Depreciation Reserve -$34,342.6 -$34,155.4 -$34,302.2Net Utility Plant $64,141.3 $53,791.2 $59,150.4
Deductions from Rate Base: Contributions In Aid of Construction $7,775.2 $7,766.4 $7,768.3 Advances $1,491.4 $1,491.4 $1,491.4 Reserve for Amortization of Intangibles $228.0 $189.4 $189.4 Deferred Taxes $7,150.3 $5,660.2 $5,660.2 Unamortized Investment Tax Credit $69.2 $69.2 $69.2 Total Deductions from Rate Base $16,714.1 $15,176.7 $15,178.6
Additions to Rate Base:Working Capital:
Materials and Supplies $323.8 $323.8 $323.8 Tank Painting $397.6 $1,012.7 $1,012.7 Working Cash - Lead Lag $414.7 $458.8 $394.6 Amount Withheld from Employees -$7.1 -$7.1 -$7.1
Total Working Capital $1,129.0 $1,788.2 $1,724.0 Taxes on - Advances $177.1 $177.1 $177.1 Taxes on - CIAC $324.7 $324.7 $324.7 Total Additions to Rate Base $1,630.9 $2,290.0 $2,225.8
Wtd. Avg. Rate Base - District $49,058.1 $40,904.5 $46,197.7Wtd. Avg. Rate Base - GO Allocation $3,714.0 $1,848.2 $2,429.5Total Weighted Average Rate Base $52,772.1 $42,752.7 $48,627.2
Attachment 2 to Settlement Agreement
RATE BASE COMPARISON TABLE
LOS ALTOS DISTRICT
WEIGHTED AVERAGE DEPRECIATED RATE BASE
TEST YEAR 2017
(In $1,000)
32

Utility ORAItem Estimate Estimate Settlement
Wtd.Avg. Construction in Progress $2,023.9 $0.0 $0.0Wtd.Avg. Plant in Serv. $102,153.5 $91,724.8 $99,981.8Wtd. Avg. Depreciation Reserve -$37,207.5 -$36,828.0 -$37,159.9Net Utility Plant $66,969.9 $54,896.8 $62,821.9
Deductions from Rate Base: Contributions In Aid of Construction $8,001.6 $7,985.2 $7,993.4 Advances $1,429.2 $1,429.2 $1,429.2 Reserve for Amortization of Intangibles $242.7 $190.6 $190.6 Deferred Taxes $7,863.8 $5,800.8 $5,800.8 Unamortized Investment Tax Credit $65.1 $65.1 $65.1 Total Deductions from Rate Base $17,602.3 $15,470.9 $15,479.1
Additions to Rate Base:Working Capital:
Materials and Supplies $323.8 $323.8 $323.8 Tank Painting $353.5 $1,139.0 $1,139.0 Working Cash - Lead Lag $336.6 $381.2 $335.8 Amount Withheld from Employees -$7.1 -$7.1 -$7.1
Total Working Capital $1,006.8 $1,837.0 $1,791.5 Taxes on - Advances $150.7 $150.7 $150.7 Taxes on - CIAC $334.6 $334.6 $334.6 Total Additions to Rate Base $1,492.1 $2,322.3 $2,276.9
Wtd. Avg. Rate Base - District $50,859.7 $41,748.3 $49,619.6
Wtd. Avg. Rate Base - GO Allocation $3,870.2 $1,562.6 $2,443.4Total Weighted Average Rate Base $54,729.9 $43,310.9 $52,063.0
RATE BASE COMPARISON TABLE
(In $1,000)
WEIGHTED AVERAGE DEPRECIATED RATE BASE
ESCALATION YEAR 2018
Attachment 2 to Settlement Agreement
LOS ALTOS DISTRICT
33

Utility ORAItem Estimate Estimate Settlement
Wtd.Avg. Construction in Progress 462.1$ -$ -$ Wtd.Avg. Plant in Serv. 22,635.9$ 21,268.5$ 21,585.7$ Wtd. Avg. Depreciation Reserve (6,386.9)$ (6,355.4)$ (6,358.3)$ Net Utility Plant 16,711.1$ 14,913.1$ 15,227.4$
Deductions from Rate Base: Contributions In Aid of Construction 4,339.0$ 4,338.9$ 4,338.8$ Advances 253.3$ 253.3$ 253.3$ Reserve for Amortization of Intangibles 179.2$ 179.2$ 179.2$ Deferred Taxes 743.2$ 708.9$ 886.3$ Unamortized Investment Tax Credit 12.4$ 12.4$ 12.4$ Total Deductions from Rate Base 5,527.1$ 5,492.8$ 5,670.1$
Additions to Rate Base:Working Capital:
Materials and Supplies 98.2$ 98.2$ 98.2$ Tank Painting -$ -$ -$ Working Cash - Lead Lag (28.8)$ (20.4)$ (25.5)$ Amount Withheld from Employees (1.7)$ (1.7)$ (1.7)$
Total Working Capital 67.7$ 76.2$ 71.1$ Taxes on - Advances 18.8$ 18.8$ 18.8$ Taxes on - CIAC 18.6$ 18.6$ 18.6$ Total Additions to Rate Base $ 105.2 $ 113.6 $ 108.5
Wtd. Avg. Rate Base - District 11,289.1$ 9,533.8$ 9,665.9$ Wtd. Avg. Rate Base - GO Allocation 763.5$ 379.9$ 499.4$ Total Weighted Average Rate Base 12,052.6$ 9,913.7$ 10,165.3$
Attachment 2 to Settlement Agreement
RATE BASE COMPARISON TABLE
MARYSVILLE DISTRICT
WEIGHTED AVERAGE DEPRECIATED RATE BASE
TEST YEAR 2017
(In $1,000)
34

Utility ORAItem Estimate Estimate Settlement
Wtd.Avg. Construction in Progress 462.1$ -$ -$ Wtd.Avg. Plant in Serv. 23,697.8$ 21,783.2$ 22,359.4$ Wtd. Avg. Depreciation Reserve (6,859.8)$ (6,820.4)$ (6,823.3)$ Net Utility Plant 17,300.1$ 14,962.8$ 15,536.2$
Deductions from Rate Base: Contributions In Aid of Construction 4,278.1$ 4,278.1$ 4,277.9$ Advances 257.4$ 257.4$ 257.4$ Reserve for Amortization of Intangibles 197.0$ 197.0$ 197.0$ Deferred Taxes 745.6$ 691.1$ 974.9$ Unamortized Investment Tax Credit 11.6$ 11.6$ 11.6$ Total Deductions from Rate Base 5,489.6$ 5,435.1$ 5,718.7$
Additions to Rate Base:Working Capital:
Materials and Supplies 98.2$ 98.2$ 98.2$ Tank Painting -$ -$ -$ Working Cash - Lead Lag (32.6)$ (20.9)$ (28.4)$ Amount Withheld from Employees (1.7)$ (1.7)$ (1.7)$
Total Working Capital 63.9$ 75.6$ 68.1$ Taxes on - Advances 6.2$ 6.2$ 6.2$ Taxes on - CIAC 14.3$ 14.3$ 14.3$ Total Additions to Rate Base $ 84.3 $ 96.1 $ 88.5
Wtd. Avg. Rate Base - District 11,894.8$ 9,623.8$ 9,906.0$
Wtd. Avg. Rate Base - GO Allocation 795.7$ 321.2$ 502.3$ Total Weighted Average Rate Base 12,690.5$ 9,945.0$ 10,408.3$
RATE BASE COMPARISON TABLE
(In $1,000)
WEIGHTED AVERAGE DEPRECIATED RATE BASE
ESCALATION YEAR 2018
Attachment 2 to Settlement Agreement
MARYSVILLE DISTRICT
35

Utility ORAItem Estimate Estimate Settlement
Wtd.Avg. Construction in Progress $462.1 $0.0 $0.0Wtd.Avg. Plant in Serv. $22,676.9 $20,712.1 $22,924.5Wtd. Avg. Depreciation Reserve -$9,523.3 -$9,457.9 -$9,491.7Net Utility Plant $13,615.7 $11,254.1 $13,432.8
Deductions from Rate Base: Contributions In Aid of Construction $1,033.8 $1,033.4 $1,033.7 Advances $198.6 $198.6 $198.6 Reserve for Amortization of Intangibles $282.5 $282.5 $282.5 Deferred Taxes $2,210.6 $1,921.4 $2,076.7 Unamortized Investment Tax Credit $7.2 $7.2 $7.2 Total Deductions from Rate Base $3,732.7 $3,443.1 $3,598.7
Additions to Rate Base:Working Capital:
Materials and Supplies $98.2 $98.2 $98.2 Tank Painting $0.0 $0.0 $0.0 Working Cash - Lead Lag $254.0 $244.5 $253.4 Amount Withheld from Employees -$1.7 -$1.7 -$1.7
Total Working Capital $350.3 $340.9 $349.8 Taxes on - Advances $19.0 $19.0 $19.0 Taxes on - CIAC $24.0 $24.0 $24.0 Total Additions to Rate Base $393.3 $383.9 $392.8
Wtd. Avg. Rate Base - District $10,276.2 $8,194.9 $10,226.9Wtd. Avg. Rate Base - GO Allocation $911.1 $453.4 $596.0Total Weighted Average Rate Base $11,187.3 $8,648.3 $10,822.9
Attachment 2 to Settlement Agreement
RATE BASE COMPARISON TABLE
OROVILLE DISTRICT
WEIGHTED AVERAGE DEPRECIATED RATE BASE
TEST YEAR 2017
(In $1,000)
36

Utility ORAItem Estimate Estimate Settlement
Wtd.Avg. Construction in Progress $462.1 $0.0 $0.0Wtd.Avg. Plant in Serv. $24,030.3 $21,521.1 $23,873.9Wtd. Avg. Depreciation Reserve -$10,209.0 -$10,077.3 -$10,164.1Net Utility Plant $14,283.4 $11,443.7 $13,709.9
Deductions from Rate Base: Contributions In Aid of Construction $1,075.5 $1,075.0 $1,075.2 Advances $203.6 $203.6 $203.6 Reserve for Amortization of Intangibles $304.0 $304.0 $304.0 Deferred Taxes $2,353.2 $2,037.5 $2,183.7 Unamortized Investment Tax Credit $3.1 $3.1 $3.1 Total Deductions from Rate Base $3,939.2 $3,623.1 $3,769.4
Additions to Rate Base:Working Capital:
Materials and Supplies $98.2 $98.2 $98.2 Tank Painting $0.0 $0.0 $0.0 Working Cash - Lead Lag $278.7 $268.1 $275.9 Amount Withheld from Employees -$1.7 -$1.7 -$1.7
Total Working Capital $375.2 $364.5 $372.3 Taxes on - Advances $19.4 $19.4 $19.4 Taxes on - CIAC $26.4 $26.4 $26.4 Total Additions to Rate Base $421.0 $410.3 $418.1
Wtd. Avg. Rate Base - District $10,765.2 $8,230.9 $10,358.6Wtd. Avg. Rate Base - GO Allocation $949.4 $383.3 $599.4Total Weighted Average Rate Base $11,714.6 $8,614.2 $10,958.0
RATE BASE COMPARISON TABLE
(In $1,000)
WEIGHTED AVERAGE DEPRECIATED RATE BASE
ESCALATION YEAR 2018
Attachment 2 to Settlement Agreement
OROVILLE DISTRICT
37

Utility ORAItem Estimate Estimate Settlement
Wtd.Avg. Construction in Progress $3,219.2 $0.0 $0.0Wtd.Avg. Plant in Serv. $100,337.0 $78,089.9 $85,066.5Wtd. Avg. Depreciation Reserve -$40,290.7 -$39,710.7 -$39,746.4Net Utility Plant $63,265.5 $38,379.2 $45,320.0
Deductions from Rate Base: Contributions In Aid of Construction $2,661.9 $2,662.4 $2,662.0 Advances $1,479.1 $1,479.1 $1,479.1 Reserve for Amortization of Intangibles $319.3 $316.1 $317.6 Deferred Taxes $7,690.5 $5,433.7 $7,149.0 Unamortized Investment Tax Credit $108.0 $108.0 $108.0 Total Deductions from Rate Base $12,258.8 $9,999.3 $11,715.7
Additions to Rate Base:Working Capital:
Materials and Supplies $541.0 $541.0 $541.0 Tank Painting $487.5 $487.5 $487.5 Working Cash - Lead Lag -$122.2 -$152.8 -$217.2 Amount Withheld from Employees -$11.5 -$11.5 -$11.5
Total Working Capital $894.9 $864.2 $799.8 Taxes on - Advances $58.2 $58.2 $58.2 Taxes on - CIAC $97.1 $97.1 $97.1 Total Additions to Rate Base $1,050.1 $1,019.5 $955.1
Wtd. Avg. Rate Base - District $52,056.7 $29,399.4 $34,559.4Wtd. Avg. Rate Base - Rancho Dom Allocation $909.7 $509.8 $445.4Wtd. Avg. Rate Base - GO Allocation $5,267.2 $2,621.1 $3,445.6Total Weighted Average Rate Base $58,233.6 $32,530.3 $38,450.3
RATE BASE COMPARISON TABLE
PALOS VERDES DISTRICT
WEIGHTED AVERAGE DEPRECIATED RATE BASE
TEST YEAR 2017
(Now consolidated into LA County Region - see Section C of this attachment)
Attachment 2 to Settlement Agreement
(In $1,000)
38

(N lid d i R i S i C f hi A h )
Utility ORAItem Estimate Estimate Settlement
Wtd.Avg. Construction in Progress $3,219.2 $0.0 $0.0Wtd.Avg. Plant in Serv. $129,404.8 $74,128.5 $90,772.3Wtd. Avg. Depreciation Reserve -$42,859.8 -$41,716.8 -$41,910.2Net Utility Plant $89,764.2 $32,411.6 $48,862.1
Deductions from Rate Base: Contributions In Aid of Construction $2,776.3 $2,776.1 $2,776.3 Advances $1,412.1 $1,412.1 $1,412.1 Reserve for Amortization of Intangibles $359.6 $354.3 $357.0 Deferred Taxes $8,801.8 $5,161.3 $7,666.8 Unamortized Investment Tax Credit $99.4 $99.4 $99.4 Total Deductions from Rate Base $13,449.2 $9,803.3 $12,311.5
Additionsto Rate Base:Working Capital:
Materials and Supplies $541.0 $541.0 $541.0 Tank Painting $416.1 $416.1 $590.9 Working Cash - Lead Lag -$175.9 -$129.5 -$172.4 Amount Withheld from Employees -$11.5 -$11.5 -$11.5
Total Working Capital $769.8 $816.2 $948.1 Taxes on - Advances $84.8 $84.8 $84.8 Taxes on - CIAC $95.0 $95.0 $95.0 Total Additions to Rate Base $949.5 $996.0 $1,127.8
Wtd. Avg. Rate Base - District $77,264.5 $23,604.4 $37,678.4Wtd. Avg. Rate Base - Rancho Dom Allocation $908.4 $473.4 $383.6Wtd. Avg. Rate Base - GO Allocation $5,488.9 $2,216.1 $3,465.3Total Weighted Average Rate Base $83,661.8 $26,293.9 $41,527.4
(In $1,000)
ESCALATION YEAR 2018
RATE BASE COMPARISON TABLE
Attachment 2 to Settlement Agreement
(Now consolidated into LA County Region - see Section C of this attachment)
WEIGHTED AVERAGE DEPRECIATED RATE BASE
PALOS VERDES DISTRICT
39

Utility ORAItem Estimate Estimate Settlement
Wtd.Avg. Construction in Progress $102.9 $0.0 $0.0Wtd.Avg. Plant in Serv. $2,480.5 $2,344.1 $2,402.8Wtd. Avg. Depreciation Reserve -$815.8 -$814.1 -$803.8Net Utility Plant $1,767.7 $1,530.0 $1,599.0
Deductions from Rate Base: Contributions In Aid of Construction $114.2 $114.2 $114.3 Advances $0.0 $0.0 $0.0 Reserve for Amortization of Intangibles $80.5 $80.5 $80.5 Deferred Taxes $182.9 $137.8 $117.1 Unamortized Investment Tax Credit $0.0 $0.0 $0.0 Total Deductions from Rate Base $377.6 $332.6 $311.8
Additions to Rate Base:Working Capital:
Materials and Supplies $1.5 $1.5 $1.5 Tank Painting $0.0 $0.0 $0.0 Working Cash - Lead Lag $24.4 $26.4 $28.8 Amount Withheld from Employees -$0.2 -$0.2 -$0.2
Total Working Capital $25.7 $27.8 $30.1 Taxes on - Advances $0.0 $0.0 $0.0 Taxes on - CIAC $0.0 $0.0 $0.0 Total Additions to Rate Base $25.7 $27.8 $30.1Wtd. Avg. Rate Base - District $1,415.8 $1,225.2 $1,317.3Wtd. Avg. Rate Base - Redwood Valley Alocation $64.0 $28.0 $24.0Wtd. Avg. Rate Base - GO Allocation $78.0 $38.8 $51.1Total Weighted Average Rate Base $1,557.8 $1,292.0 $1,392.4
RATE BASE COMPARISON TABLE
REDWOOD VALLEY - COAST SPRINGS DISTRICT
WEIGHTED AVERAGE DEPRECIATED RATE BASE
TEST YEAR 2017
Attachment 2 to Settlement Agreement
(Now consolidated into Bay Area Region - see Section C of this attachment)
(In $1,000)
40
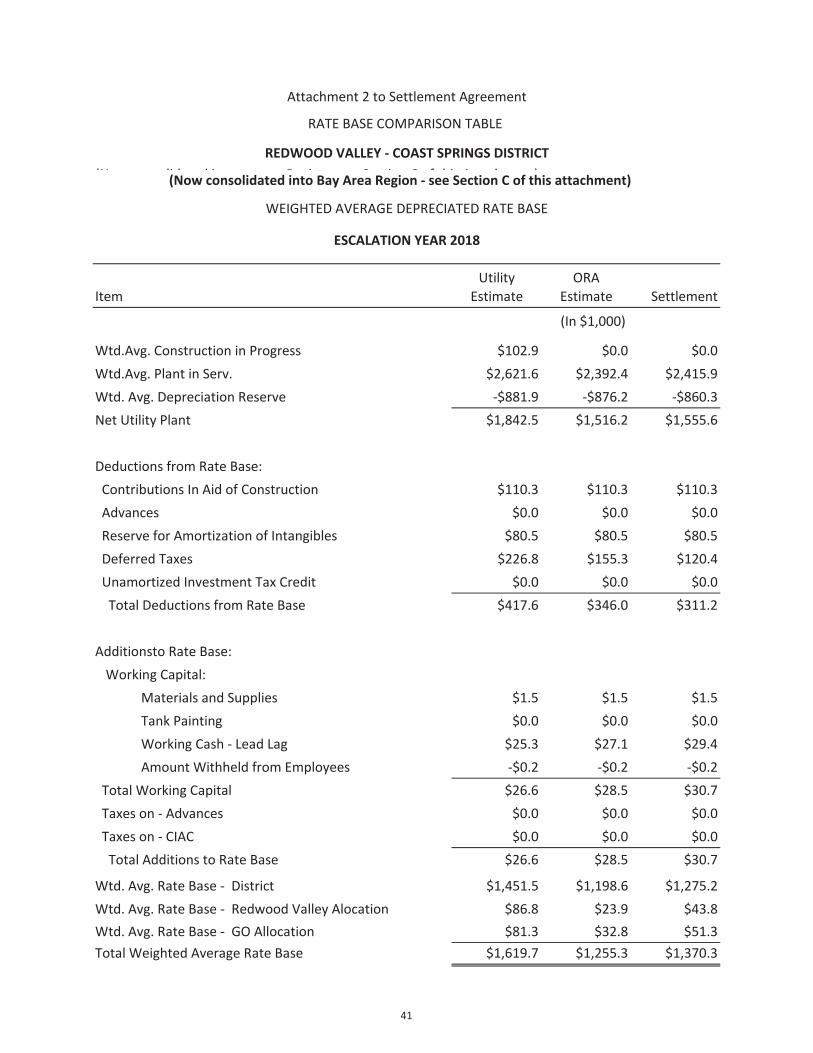
(N lid d i R i S i C f hi A h )
Utility ORAItem Estimate Estimate Settlement
Wtd.Avg. Construction in Progress $102.9 $0.0 $0.0Wtd.Avg. Plant in Serv. $2,621.6 $2,392.4 $2,415.9Wtd. Avg. Depreciation Reserve -$881.9 -$876.2 -$860.3Net Utility Plant $1,842.5 $1,516.2 $1,555.6
Deductions from Rate Base: Contributions In Aid of Construction $110.3 $110.3 $110.3 Advances $0.0 $0.0 $0.0 Reserve for Amortization of Intangibles $80.5 $80.5 $80.5 Deferred Taxes $226.8 $155.3 $120.4 Unamortized Investment Tax Credit $0.0 $0.0 $0.0 Total Deductions from Rate Base $417.6 $346.0 $311.2
Additionsto Rate Base:Working Capital:
Materials and Supplies $1.5 $1.5 $1.5 Tank Painting $0.0 $0.0 $0.0 Working Cash - Lead Lag $25.3 $27.1 $29.4 Amount Withheld from Employees -$0.2 -$0.2 -$0.2
Total Working Capital $26.6 $28.5 $30.7 Taxes on - Advances $0.0 $0.0 $0.0 Taxes on - CIAC $0.0 $0.0 $0.0 Total Additions to Rate Base $26.6 $28.5 $30.7
Wtd. Avg. Rate Base - District $1,451.5 $1,198.6 $1,275.2Wtd. Avg. Rate Base - Redwood Valley Alocation $86.8 $23.9 $43.8Wtd. Avg. Rate Base - GO Allocation $81.3 $32.8 $51.3Total Weighted Average Rate Base $1,619.7 $1,255.3 $1,370.3
(In $1,000)
ESCALATION YEAR 2018
RATE BASE COMPARISON TABLE
Attachment 2 to Settlement Agreement
(Now consolidated into Bay Area Region - see Section C of this attachment)
WEIGHTED AVERAGE DEPRECIATED RATE BASE
REDWOOD VALLEY - COAST SPRINGS DISTRICT
41
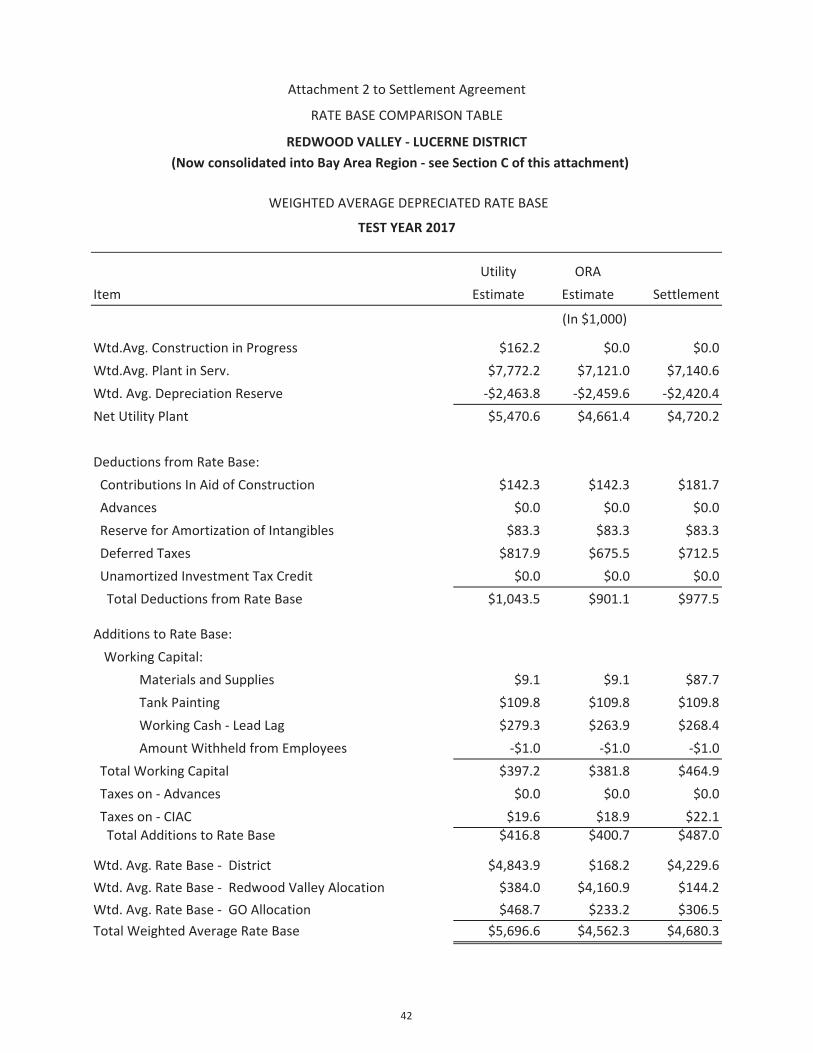
Utility ORAItem Estimate Estimate Settlement
Wtd.Avg. Construction in Progress $162.2 $0.0 $0.0Wtd.Avg. Plant in Serv. $7,772.2 $7,121.0 $7,140.6Wtd. Avg. Depreciation Reserve -$2,463.8 -$2,459.6 -$2,420.4Net Utility Plant $5,470.6 $4,661.4 $4,720.2
Deductions from Rate Base: Contributions In Aid of Construction $142.3 $142.3 $181.7 Advances $0.0 $0.0 $0.0 Reserve for Amortization of Intangibles $83.3 $83.3 $83.3 Deferred Taxes $817.9 $675.5 $712.5 Unamortized Investment Tax Credit $0.0 $0.0 $0.0 Total Deductions from Rate Base $1,043.5 $901.1 $977.5
Additions to Rate Base:Working Capital:
Materials and Supplies $9.1 $9.1 $87.7 Tank Painting $109.8 $109.8 $109.8 Working Cash - Lead Lag $279.3 $263.9 $268.4 Amount Withheld from Employees -$1.0 -$1.0 -$1.0
Total Working Capital $397.2 $381.8 $464.9 Taxes on - Advances $0.0 $0.0 $0.0 Taxes on - CIAC $19.6 $18.9 $22.1 Total Additions to Rate Base $416.8 $400.7 $487.0
Wtd. Avg. Rate Base - District $4,843.9 $168.2 $4,229.6Wtd. Avg. Rate Base - Redwood Valley Alocation $384.0 $4,160.9 $144.2Wtd. Avg. Rate Base - GO Allocation $468.7 $233.2 $306.5Total Weighted Average Rate Base $5,696.6 $4,562.3 $4,680.3
RATE BASE COMPARISON TABLE
REDWOOD VALLEY - LUCERNE DISTRICT
WEIGHTED AVERAGE DEPRECIATED RATE BASE
TEST YEAR 2017
Attachment 2 to Settlement Agreement
(Now consolidated into Bay Area Region - see Section C of this attachment)
(In $1,000)
42

(N lid d i R i S i C f hi A h )
Utility ORAItem Estimate Estimate Settlement
Wtd.Avg. Construction in Progress $162.2 $0.0 $0.0Wtd.Avg. Plant in Serv. $8,122.8 $7,115.0 $7,364.3Wtd. Avg. Depreciation Reserve -$2,638.2 -$2,625.8 -$2,577.1Net Utility Plant $5,646.9 $4,489.2 $4,787.2
Deductions from Rate Base: Contributions In Aid of Construction $145.5 $145.6 $283.4 Advances $0.0 $0.0 $0.0 Reserve for Amortization of Intangibles $87.8 $87.8 $87.8 Deferred Taxes $982.3 $733.6 $795.0 Unamortized Investment Tax Credit $0.0 $0.0 $0.0 Total Deductions from Rate Base $1,215.6 $967.0 $1,166.3
Additionsto Rate Base:Working Capital:
Materials and Supplies $9.1 $9.1 $87.7 Tank Painting $98.0 $98.0 $98.0 Working Cash - Lead Lag $264.9 $262.4 $270.2 Amount Withheld from Employees -$1.0 -$1.0 -$1.0
Total Working Capital $370.9 $368.4 $454.8 Taxes on - Advances $0.0 $0.0 $0.0 Taxes on - CIAC $19.0 $18.4 $21.3 Total Additions to Rate Base $390.0 $386.8 $476.0
Wtd. Avg. Rate Base - District $4,821.2 $3,909.1 $4,097.0Wtd. Avg. Rate Base - Redwood Valley Alocation $521.0 $143.1 $262.8Wtd. Avg. Rate Base - GO Allocation $488.3 $197.2 $308.4Total Weighted Average Rate Base $5,830.5 $4,249.4 $4,668.2
(In $1,000)
ESCALATION YEAR 2018
RATE BASE COMPARISON TABLE
Attachment 2 to Settlement Agreement
(Now consolidated into Bay Area Region - see Section C of this attachment)
WEIGHTED AVERAGE DEPRECIATED RATE BASE
REDWOOD VALLEY - LUCERNE DISTRICT
43

Utility ORAItem Estimate Estimate Settlement
Wtd.Avg. Construction in Progress $188.6 $0.0 $0.0Wtd.Avg. Plant in Serv. $3,440.9 $2,787.7 $3,039.3Wtd. Avg. Depreciation Reserve -$1,083.8 -$1,073.6 -$1,095.2Net Utility Plant $2,545.6 $1,714.1 $1,944.1
Deductions from Rate Base: Contributions In Aid of Construction $28.4 $28.4 $28.4 Advances $9.8 $9.8 $9.8 Reserve for Amortization of Intangibles $3.9 $3.9 $3.9 Deferred Taxes $276.8 $90.0 $148.0 Unamortized Investment Tax Credit $0.0 $0.0 $0.0 Total Deductions from Rate Base $318.8 $132.1 $190.1
Additions to Rate Base:Working Capital:
Materials and Supplies $2.5 $2.5 $2.5 Tank Painting $0.0 $0.0 $0.0 Working Cash - Lead Lag $76.5 $84.9 $89.0 Amount Withheld from Employees -$0.3 -$0.3 -$0.3
Total Working Capital $78.8 $87.1 $91.3 Taxes on - Advances $0.2 $0.2 $0.2 Taxes on - CIAC $4.0 $4.0 $4.0 Total Additions to Rate Base $83.0 $91.3 $95.5
Wtd. Avg. Rate Base - District $2,309.8 $1,673.3 $1,849.5Wtd. Avg. Rate Base - Redwood Valley Alocation $106.7 $46.7 $40.1Wtd. Avg. Rate Base - GO Allocation $130.2 $64.8 $85.2Total Weighted Average Rate Base $2,546.7 $1,784.8 $1,974.8
RATE BASE COMPARISON TABLE
REDWOOD VALLEY - UNIFIED AREA DISTRICT
WEIGHTED AVERAGE DEPRECIATED RATE BASE
TEST YEAR 2017
Attachment 2 to Settlement Agreement
(Now consolidated into Bay Area Region - see Section C of this attachment)
(In $1,000)
44

(N lid d i R i S i C f hi A h )
Utility ORAItem Estimate Estimate Settlement
Wtd.Avg. Construction in Progress $188.6 $0.0 $0.0Wtd.Avg. Plant in Serv. $3,792.2 $2,763.6 $3,114.5Wtd. Avg. Depreciation Reserve -$1,200.2 -$1,175.1 -$1,209.1Net Utility Plant $2,780.7 $1,588.5 $1,905.4
Deductions from Rate Base: Contributions In Aid of Construction $28.9 $28.8 $28.9 Advances $13.2 $13.2 $13.2 Reserve for Amortization of Intangibles $5.3 $5.3 $5.3 Deferred Taxes $391.5 $101.3 $169.9 Unamortized Investment Tax Credit $0.0 $0.0 $0.0 Total Deductions from Rate Base $438.9 $148.7 $217.3
Additionsto Rate Base:Working Capital:
Materials and Supplies $2.5 $2.5 $2.5 Tank Painting $37.9 $37.9 $37.9 Working Cash - Lead Lag $100.1 $88.0 $95.1 Amount Withheld from Employees -$0.3 -$0.3 -$0.3
Total Working Capital $140.3 $128.2 $135.3 Taxes on - Advances $0.2 $0.2 $0.2 Taxes on - CIAC $3.8 $3.8 $3.8 Total Additions to Rate Base $144.3 $132.2 $139.3
Wtd. Avg. Rate Base - District $2,486.0 $1,572.0 $1,827.4Wtd. Avg. Rate Base - Redwood Valley Alocation $144.7 $39.8 $73.0Wtd. Avg. Rate Base - GO Allocation $135.6 $54.8 $85.6Total Weighted Average Rate Base $2,766.4 $1,666.6 $1,986.0
(In $1,000)
ESCALATION YEAR 2018
RATE BASE COMPARISON TABLE
Attachment 2 to Settlement Agreement
(Now consolidated into Bay Area Region - see Section C of this attachment)
WEIGHTED AVERAGE DEPRECIATED RATE BASE
REDWOOD VALLEY - UNIFIED AREA DISTRICT
45

Utility ORAItem Estimate Estimate Settlement
Wtd.Avg. Construction in Progress $7,943.9 $0.0 $0.0Wtd.Avg. Plant in Serv. $180,750.3 $159,623.4 $170,790.4Wtd. Avg. Depreciation Reserve -$49,904.0 -$49,382.6 -$49,619.8Net Utility Plant $138,790.2 $110,240.9 $121,170.7
Deductions from Rate Base: Contributions In Aid of Construction $23,832.2 $23,833.6 $23,384.1 Advances $9,501.8 $9,501.8 $9,501.8 Reserve for Amortization of Intangibles $966.5 $954.8 $967.6 Deferred Taxes $12,552.1 $10,243.8 $12,602.8 Unamortized Investment Tax Credit $104.8 $104.8 $104.8 Total Deductions from Rate Base $46,957.5 $44,638.8 $46,561.1
Additions to Rate Base:Working Capital:
Materials and Supplies $559.6 $559.6 $559.6 Tank Painting $436.3 $436.3 $436.3 Working Cash - Lead Lag $1,842.8 $1,832.8 $1,852.9 Amount Withheld from Employees -$11.5 -$11.5 -$11.5
Total Working Capital $2,827.2 $2,817.2 $2,837.2 Taxes on - Advances $419.2 $419.2 $419.2 Taxes on - CIAC $489.2 $489.2 $449.9 Total Additions to Rate Base $3,735.7 $3,725.6 $3,706.4
Wtd. Avg. Rate Base - District $95,568.4 $69,327.7 $78,316.0Wtd. Avg. Rate Base - GO Allocation $5,267.2 $2,621.1 $3,445.6Total Weighted Average Rate Base $100,835.6 $71,948.8 $81,761.6
Attachment 2 to Settlement Agreement
(Now consolidated into Monterey Region - see Section C of this attachment)
RATE BASE COMPARISON TABLE
SALINAS DISTRICT
WEIGHTED AVERAGE DEPRECIATED RATE BASE
TEST YEAR 2017
(In $1,000)
46
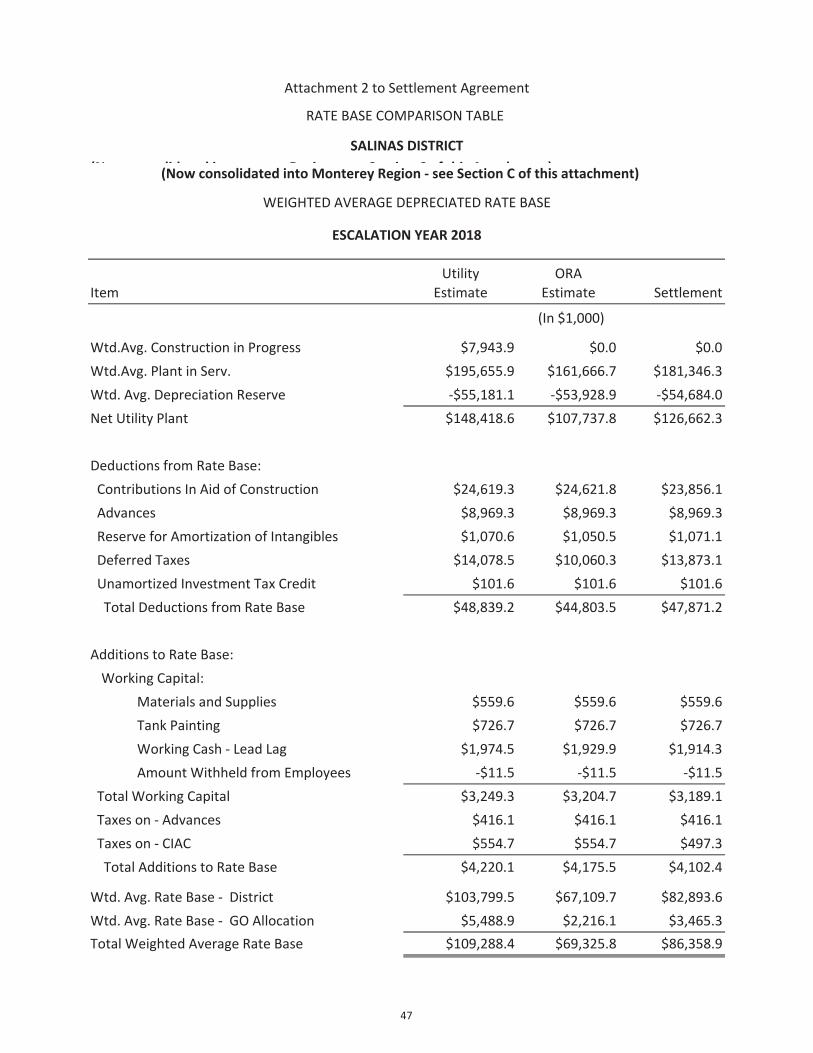
(N lid d i R i S i C f hi A h )
Utility ORAItem Estimate Estimate Settlement
Wtd.Avg. Construction in Progress $7,943.9 $0.0 $0.0Wtd.Avg. Plant in Serv. $195,655.9 $161,666.7 $181,346.3Wtd. Avg. Depreciation Reserve -$55,181.1 -$53,928.9 -$54,684.0Net Utility Plant $148,418.6 $107,737.8 $126,662.3
Deductions from Rate Base: Contributions In Aid of Construction $24,619.3 $24,621.8 $23,856.1 Advances $8,969.3 $8,969.3 $8,969.3 Reserve for Amortization of Intangibles $1,070.6 $1,050.5 $1,071.1 Deferred Taxes $14,078.5 $10,060.3 $13,873.1 Unamortized Investment Tax Credit $101.6 $101.6 $101.6 Total Deductions from Rate Base $48,839.2 $44,803.5 $47,871.2
Additions to Rate Base:Working Capital:
Materials and Supplies $559.6 $559.6 $559.6 Tank Painting $726.7 $726.7 $726.7 Working Cash - Lead Lag $1,974.5 $1,929.9 $1,914.3 Amount Withheld from Employees -$11.5 -$11.5 -$11.5
Total Working Capital $3,249.3 $3,204.7 $3,189.1 Taxes on - Advances $416.1 $416.1 $416.1 Taxes on - CIAC $554.7 $554.7 $497.3 Total Additions to Rate Base $4,220.1 $4,175.5 $4,102.4
Wtd. Avg. Rate Base - District $103,799.5 $67,109.7 $82,893.6Wtd. Avg. Rate Base - GO Allocation $5,488.9 $2,216.1 $3,465.3Total Weighted Average Rate Base $109,288.4 $69,325.8 $86,358.9
(Now consolidated into Monterey Region - see Section C of this attachment)
RATE BASE COMPARISON TABLE
(In $1,000)
WEIGHTED AVERAGE DEPRECIATED RATE BASE
ESCALATION YEAR 2018
Attachment 2 to Settlement Agreement
SALINAS DISTRICT
47

Utility ORAItem Estimate Estimate Settlement
Wtd.Avg. Construction in Progress $564.1 $0.0 $0.0Wtd.Avg. Plant in Serv. $30,763.1 $28,210.5 $29,129.3Wtd. Avg. Depreciation Reserve -$9,849.5 -$9,783.9 -$9,870.6Net Utility Plant $21,477.8 $18,426.6 $19,258.7
Deductions from Rate Base: Contributions In Aid of Construction $1,946.0 $1,946.0 $1,945.7 Advances $2,778.4 $2,778.4 $2,778.4 Reserve for Amortization of Intangibles $257.6 $257.3 $257.9 Deferred Taxes $2,111.0 $1,742.5 $1,721.0 Unamortized Investment Tax Credit $20.2 $20.2 $20.2 Total Deductions from Rate Base $7,113.2 $6,744.3 $6,723.3
Additions to Rate Base:Working Capital:
Materials and Supplies $202.9 $202.9 $202.9 Tank Painting $0.0 $0.0 $0.0 Working Cash - Lead Lag $92.3 $107.9 $116.4 Amount Withheld from Employees -$2.2 -$2.2 -$2.2
Total Working Capital $293.0 $308.6 $317.1 Taxes on - Advances $173.6 $173.6 $173.6 Taxes on - CIAC $44.3 $44.3 $44.3 Total Additions to Rate Base $511.0 $526.6 $535.1
Wtd. Avg. Rate Base - District $14,875.6 $12,208.9 $13,070.5Wtd. Avg. Rate Base - GO Allocation $1,006.5 $500.9 $658.5Total Weighted Average Rate Base $15,882.1 $12,709.8 $13,729.0
Attachment 2 to Settlement Agreement
RATE BASE COMPARISON TABLE
SELMA DISTRICT
WEIGHTED AVERAGE DEPRECIATED RATE BASE
TEST YEAR 2017
(In $1,000)
48

Utility ORAItem Estimate Estimate Settlement
Wtd.Avg. Construction in Progress $564.1 $0.0 $0.0Wtd.Avg. Plant in Serv. $32,039.5 $28,626.1 $29,403.7Wtd. Avg. Depreciation Reserve -$10,687.2 -$10,535.1 -$10,662.8Net Utility Plant $21,916.4 $18,091.0 $18,740.9
Deductions from Rate Base: Contributions In Aid of Construction $2,016.4 $2,016.2 $2,015.4 Advances $2,730.4 $2,730.4 $2,730.4 Reserve for Amortization of Intangibles $288.2 $287.8 $288.7 Deferred Taxes $2,258.8 $1,742.3 $1,673.4 Unamortized Investment Tax Credit $19.8 $19.8 $19.8 Total Deductions from Rate Base $7,313.5 $6,796.4 $6,727.7
Additions to Rate Base:Working Capital:
Materials and Supplies $202.9 $202.9 $202.9 Tank Painting $0.0 $0.0 $0.0 Working Cash - Lead Lag $80.1 $107.0 $114.9 Amount Withheld from Employees -$2.2 -$2.2 -$2.2
Total Working Capital $280.8 $307.7 $315.7 Taxes on - Advances $178.7 $178.7 $178.7 Taxes on - CIAC $51.5 $51.5 $51.5 Total Additions to Rate Base $511.0 $537.9 $545.9
Wtd. Avg. Rate Base - District $15,113.9 $11,832.5 $12,559.1Wtd. Avg. Rate Base - GO Allocation $1,049.0 $423.5 $662.2Total Weighted Average Rate Base $16,162.9 $12,256.0 $13,221.3
RATE BASE COMPARISON TABLE
(In $1,000)
WEIGHTED AVERAGE DEPRECIATED RATE BASE
ESCALATION YEAR 2018
Attachment 2 to Settlement Agreement
SELMA DISTRICT
49

Utility ORAItem Estimate Estimate Settlement
Wtd.Avg. Construction in Progress $5,582.7 $0.0 $0.0Wtd.Avg. Plant in Serv. $172,139.0 $135,972.9 $150,925.2Wtd. Avg. Depreciation Reserve -$54,301.9 -$53,761.9 -$53,918.8Net Utility Plant $123,419.8 $82,211.0 $97,006.5
Deductions from Rate Base: Contributions In Aid of Construction $4,567.7 $4,565.2 $4,566.8 Advances $5,351.8 $5,351.8 $5,351.8 Reserve for Amortization of Intangibles $793.3 $779.3 $798.8 Deferred Taxes $20,496.7 $10,232.0 $16,018.3 Unamortized Investment Tax Credit $92.2 $92.2 $92.2 Total Deductions from Rate Base $31,301.7 $21,020.5 $26,827.9
Additions to Rate Base:Working Capital:
Materials and Supplies $527.4 $527.4 $527.4 Tank Painting $696.0 $696.0 $696.0 Working Cash - Lead Lag $1,429.3 $1,783.6 $1,816.1 Amount Withheld from Employees -$14.6 -$14.6 -$14.6
Total Working Capital $2,638.1 $2,992.4 $3,024.9 Taxes on - Advances $145.5 $145.5 $145.5 Taxes on - CIAC $232.5 $232.5 $232.5 Total Additions to Rate Base $3,016.2 $3,370.4 $3,402.9
Wtd. Avg. Rate Base - District $95,134.2 $64,561.0 $73,581.5Wtd. Avg. Rate Base - GO Allocation $6,716.5 $3,342.3 $4,393.5Total Weighted Average Rate Base $101,850.7 $67,903.3 $77,975.0
Attachment 2 to Settlement Agreement
RATE BASE COMPARISON TABLE
STOCKTON DISTRICT
WEIGHTED AVERAGE DEPRECIATED RATE BASE
TEST YEAR 2017
(In $1,000)
50

Utility ORAItem Estimate Estimate Settlement
Wtd.Avg. Construction in Progress $5,582.7 $0.0 $0.0Wtd.Avg. Plant in Serv. $199,361.2 $134,779.3 $165,458.2Wtd. Avg. Depreciation Reserve -$59,615.0 -$57,882.1 -$58,562.3Net Utility Plant $145,328.9 $76,897.2 $106,895.9
Deductions from Rate Base: Contributions In Aid of Construction $4,792.6 $4,787.5 $4,790.1 Advances $5,116.2 $5,116.2 $5,116.2 Reserve for Amortization of Intangibles $880.7 $855.6 $887.0 Deferred Taxes $26,802.2 $10,237.8 $19,016.6 Unamortized Investment Tax Credit $86.9 $86.9 $86.9 Total Deductions from Rate Base $37,678.6 $21,083.9 $29,896.7
Additions to Rate Base:Working Capital:
Materials and Supplies $527.4 $527.4 $527.4 Tank Painting $617.2 $617.2 $617.2 Working Cash - Lead Lag $1,480.5 $1,813.6 $1,849.1 Amount Withheld from Employees -$14.6 -$14.6 -$14.6
Total Working Capital $2,610.5 $2,943.6 $2,979.1 Taxes on - Advances $140.6 $140.6 $140.6 Taxes on - CIAC $240.1 $240.1 $240.1 Total Additions to Rate Base $2,991.3 $3,324.4 $3,359.9
Wtd. Avg. Rate Base - District $110,641.6 $59,137.6 $80,359.0
Wtd. Avg. Rate Base - GO Allocation $6,999.1 $2,825.9 $4,418.8Total Weighted Average Rate Base $117,640.7 $61,963.5 $84,777.8
RATE BASE COMPARISON TABLE
(In $1,000)
STOCKTON DISTRICT
WEIGHTED AVERAGE DEPRECIATED RATE BASE
ESCALATION YEAR 2018
Attachment 2 to Settlement Agreement
51

Utility ORAItem Estimate Estimate Settlement
Wtd.Avg. Construction in Progress 4,941.7$ -$ -$ Wtd.Avg. Plant in Serv. 182,211.2$ 164,248.3$ 173,810.8$ Wtd. Avg. Depreciation Reserve (57,959.2)$ (57,439.0)$ (57,681.5)$ Net Utility Plant 129,193.6$ 106,809.3$ 116,129.3$
Deductions from Rate Base: Contributions In Aid of Construction 11,677.8$ 11,676.8$ 11,676.6$ Advances 41,809.8$ 41,809.8$ 41,809.8$ Reserve for Amortization of Intangibles 249.6$ 247.7$ 247.7$ Deferred Taxes 11,387.0$ 8,952.7$ 10,321.2$ Unamortized Investment Tax Credit 89.4$ 89.4$ 89.4$ Total Deductions from Rate Base 65,213.6$ 62,776.4$ 64,144.8$
Additions to Rate Base:Working Capital:
Materials and Supplies 324.7$ 324.7$ 324.7$ Tank Painting 967.1$ 967.1$ -$ Working Cash - Lead Lag (1,473.8)$ (1,014.8)$ 525.1$ Amount Withheld from Employees (13.5)$ (13.5)$ (13.5)$
Total Working Capital (195.5)$ 263.4$ 836.3$ Taxes on - Advances 1,715.8$ 1,715.8$ 1,715.8$ Taxes on - CIAC 728.6$ 728.6$ 728.6$ Total Additions to Rate Base $ 2,248.9 $ 2,707.8 $ 3,280.7
Wtd. Avg. Rate Base - District 66,229.0$ 46,740.7$ 55,265.2$
Wtd. Avg. Rate Base - GO Allocation 6,221.7$ 3,096.1$ 4,069.9$ Total Weighted Average Rate Base 72,450.7$ 49,836.8$ 59,335.1$
Attachment 2 to Settlement Agreement
RATE BASE COMPARISON TABLE
VISALIA DISTRICT
WEIGHTED AVERAGE DEPRECIATED RATE BASE
TEST YEAR 2017
(In $1,000)
52

Utility ORAItem Estimate Estimate Settlement
Wtd.Avg. Construction in Progress 4,941.7$ -$ -$ Wtd.Avg. Plant in Serv. 191,490.2$ 166,013.1$ 179,011.1$ Wtd. Avg. Depreciation Reserve (62,885.9)$ (61,753.6)$ (62,291.1)$ Net Utility Plant 133,546.0$ 104,259.5$ 116,720.0$
Deductions from Rate Base: Contributions In Aid of Construction 12,060.7$ 12,056.9$ 12,056.6$ Advances 41,764.9$ 41,764.9$ 41,764.9$ Reserve for Amortization of Intangibles 286.1$ 283.5$ 283.5$ Deferred Taxes 12,238.9$ 8,644.2$ 10,412.3$ Unamortized Investment Tax Credit 88.0$ 88.0$ 88.0$ Total Deductions from Rate Base 66,438.7$ 62,837.6$ 64,605.3$
Additions to Rate Base:Working Capital:
Materials and Supplies 324.7$ 324.7$ 324.7$ Tank Painting 967.1$ 967.1$ -$ Working Cash - Lead Lag (899.6)$ (752.7)$ 723.2$ Amount Withheld from Employees (13.5)$ (13.5)$ (13.5)$
Total Working Capital 378.6$ 525.6$ 1,034.4$ Taxes on - Advances 1,461.4$ 1,461.4$ 1,461.4$ Taxes on - CIAC 749.6$ 749.6$ 749.6$ Total Additions to Rate Base $ 2,589.6 $ 2,736.6 $ 3,245.4
Wtd. Avg. Rate Base - District 69,696.9$ 44,158.5$ 55,360.1$ Wtd. Avg. Rate Base - GO Allocation 6,483.5$ 2,617.9$ 4,093.3$ Total Weighted Average Rate Base 76,180.4$ 46,776.4$ 59,453.4$
RATE BASE COMPARISON TABLE
(In $1,000)
WEIGHTED AVERAGE DEPRECIATED RATE BASE
ESCALATION YEAR 2018
Attachment 2 to Settlement Agreement
VISALIA DISTRICT
53

Utility ORAItem Estimate Estimate Settlement
Wtd.Avg. Construction in Progress $1,604.8 $0.0 $0.0Wtd.Avg. Plant in Serv. $42,915.6 $39,831.7 $41,455.1Wtd. Avg. Depreciation Reserve -$15,618.6 -$15,575.3 -$15,619.4Net Utility Plant $28,901.9 $24,256.4 $25,835.7
Deductions from Rate Base: Contributions In Aid of Construction $2,566.7 $2,565.5 $2,565.9 Advances $1,955.7 $1,955.7 $1,955.7 Reserve for Amortization of Intangibles $211.7 $211.7 $211.7 Deferred Taxes $4,218.9 $3,625.8 $4,012.0 Unamortized Investment Tax Credit -$36.9 -$36.9 -$36.9 Total Deductions from Rate Base $8,916.1 $8,321.7 $8,708.4
Additions to Rate Base:Working Capital:
Materials and Supplies $203.4 $203.4 $203.4 Tank Painting $188.7 $188.7 $188.7 Working Cash - Lead Lag $116.1 $144.3 $162.4 Amount Withheld from Employees -$3.9 -$3.9 -$4.5
Total Working Capital $504.3 $532.5 $550.0 Taxes on - Advances $12.8 $12.8 $12.8 Taxes on - CIAC $18.2 $18.2 $18.2 Total Additions to Rate Base $535.2 $563.4 $581.0
Wtd. Avg. Rate Base - District $20,521.0 $16,498.1 $17,708.2Wtd. Avg. Rate Base - GO Allocation $2,056.6 $1,023.3 $1,345.2Total Weighted Average Rate Base $22,577.6 $17,521.4 $19,053.4
Attachment 2 to Settlement Agreement
RATE BASE COMPARISON TABLE
WESTLAKE DISTRICT
WEIGHTED AVERAGE DEPRECIATED RATE BASE
TEST YEAR 2017
(In $1,000)
54

Utility ORAItem Estimate Estimate Settlement
Wtd.Avg. Construction in Progress $1,604.8 $0.0 $0.0Wtd.Avg. Plant in Serv. $44,493.9 $40,006.7 $42,249.2Wtd. Avg. Depreciation Reserve -$16,667.4 -$16,539.9 -$16,626.5Net Utility Plant $29,431.4 $23,466.9 $25,622.6
Deductions from Rate Base: Contributions In Aid of Construction $2,426.8 $2,422.6 $2,424.0 Advances $1,777.0 $1,777.0 $1,777.0 Reserve for Amortization of Intangibles $235.0 $235.0 $235.0 Deferred Taxes $4,389.7 $3,493.9 $3,978.2 Unamortized Investment Tax Credit -$35.9 -$35.9 -$35.9 Total Deductions from Rate Base $8,792.6 $7,892.7 $8,378.2
Additions to Rate Base:Working Capital:
Materials and Supplies $203.4 $203.4 $203.4 Tank Painting $165.1 $165.1 $165.1 Working Cash - Lead Lag $103.1 $149.4 $173.3 Amount Withheld from Employees -$3.9 -$3.9 -$4.5
Total Working Capital $467.7 $513.9 $537.4 Taxes on - Advances $12.3 $12.3 $12.3 Taxes on - CIAC $19.3 $19.3 $19.3 Total Additions to Rate Base $499.3 $545.6 $569.0
Wtd. Avg. Rate Base - District $21,138.1 $16,119.8 $17,813.4Wtd. Avg. Rate Base - GO Allocation $2,143.0 $865.3 $1,353.0Total Weighted Average Rate Base $23,281.1 $16,985.1 $19,166.4
RATE BASE COMPARISON TABLE
(In $1,000)
WEIGHTED AVERAGE DEPRECIATED RATE BASE
ESCALATION YEAR 2018
Attachment 2 to Settlement Agreement
WESTLAKE DISTRICT
55

Utility ORAItem Estimate Estimate Settlement
Wtd.Avg. Construction in Progress 292.1$ -$ -$ Wtd.Avg. Plant in Serv. 14,766.7$ 12,757.2$ 13,622.3$ Wtd. Avg. Depreciation Reserve (4,662.6)$ (4,642.8)$ (4,663.2)$ Net Utility Plant 10,396.2$ 8,114.4$ 8,959.1$
Deductions from Rate Base: Contributions In Aid of Construction 690.7$ 688.7$ 690.0$ Advances 1,505.8$ 1,505.8$ 1,505.8$ Reserve for Amortization of Intangibles 208.8$ 208.8$ 208.8$ Deferred Taxes 1,098.7$ 883.9$ 1,019.6$ Unamortized Investment Tax Credit 7.2$ 7.2$ 7.2$ Total Deductions from Rate Base 3,511.1$ 3,294.3$ 3,431.3$
Additions to Rate Base:Working Capital:
Materials and Supplies 41.1$ 41.1$ 41.1$ Tank Painting -$ -$ -$ Working Cash - Lead Lag 20.7$ 51.8$ 52.4$ Amount Withheld from Employees (1.0)$ (1.0)$ (1.0)$
Total Working Capital 60.8$ 91.8$ 92.4$ Taxes on - Advances 5.8$ 5.8$ 5.8$ Taxes on - CIAC 7.2$ 7.2$ 7.2$ Total Additions to Rate Base $ 73.7 $ 104.8 $ 105.4
Wtd. Avg. Rate Base - District 6,958.9$ 4,924.9$ 5,633.3$
Wtd. Avg. Rate Base - GO Allocation 477.2$ 237.5$ 312.1$ Total Weighted Average Rate Base 7,436.1$ 5,162.4$ 5,945.4$
Attachment 2 to Settlement Agreement
RATE BASE COMPARISON TABLE
Willows District
WEIGHTED AVERAGE DEPRECIATED RATE BASE
TEST YEAR 2017
(In $1,000)
56

Utility ORAItem Estimate Estimate Settlement
Wtd.Avg. Construction in Progress 292.1$ -$ -$ Wtd.Avg. Plant in Serv. 15,681.5$ 12,938.5$ 14,026.1$ Wtd. Avg. Depreciation Reserve (4,923.2)$ (4,889.0)$ (4,910.4)$ Net Utility Plant 11,050.4$ 8,049.5$ 9,115.8$
Deductions from Rate Base: Contributions In Aid of Construction 740.1$ 735.7$ 738.2$ Advances 1,484.2$ 1,484.2$ 1,484.2$ Reserve for Amortization of Intangibles 236.3$ 236.3$ 236.3$ Deferred Taxes 1,188.0$ 885.0$ 1,055.4$ Unamortized Investment Tax Credit 6.8$ 6.8$ 6.8$ Total Deductions from Rate Base 3,655.4$ 3,348.1$ 3,520.9$
Additions to Rate Base:Working Capital:
Materials and Supplies 41.1$ 41.1$ 41.1$ Tank Painting -$ -$ -$ Working Cash - Lead Lag 74.8$ 60.5$ 64.9$ Amount Withheld from Employees (1.0)$ (1.0)$ (1.0)$
Total Working Capital 114.9$ 100.5$ 104.9$ Taxes on - Advances 5.6$ 5.6$ 5.6$ Taxes on - CIAC 9.0$ 9.0$ 9.0$ Total Additions to Rate Base $ 129.5 $ 115.1 $ 119.5
Wtd. Avg. Rate Base - District 7,524.4$ 4,816.5$ 5,714.4$
Wtd. Avg. Rate Base - GO Allocation 497.3$ 200.8$ 314.0$ Total Weighted Average Rate Base 8,021.7$ 5,017.3$ 6,028.4$
RATE BASE COMPARISON TABLE
(In $1,000)
WEIGHTED AVERAGE DEPRECIATED RATE BASE
ESCALATION YEAR 2018
Attachment 2 to Settlement Agreement
Willows District
57

RATE BASE COMPARISON TABLES
CONSOLIDATED REGIONS
Attachment 2
SECTION C
58

Utility ORAItem Estimate Estimate* Settlement
Wtd.Avg. Construction in Progress $5,830.9 $0.0Wtd.Avg. Plant in Serv. $221,859.0 $206,155.8Wtd. Avg. Depreciation Reserve -$79,407.1 -$77,478.9Net Utility Plant $148,282.8 $128,676.9
Deductions from Rate Base: Contributions In Aid of Construction $15,648.6 $16,540.1 Advances $4,122.0 $4,122.0 Reserve for Amortization of Intangibles $1,197.5 $1,194.1 Deferred Taxes $14,668.4 $14,721.3 Unamortized Investment Tax Credit $174.7 $174.7 Total Deductions from Rate Base $35,811.2 $36,752.3
Additions to Rate Base:Working Capital:
Materials and Supplies $334.8 $413.4 Tank Painting $1,905.2 $1,811.3 Working Cash - Lead Lag $2,168.8 $2,055.2 Amount Withheld from Employees -$19.6 -$19.6
Total Working Capital $4,389.2 $4,260.4 Taxes on - Advances $19.7 $19.7 Taxes on - CIAC $774.5 $907.8 Total Additions to Rate Base $5,183.4 $5,187.8
Wtd. Avg. Rate Base - District $117,655.0 $97,112.5Wtd. Avg. Rate Base - RWV Allocation $208.3Wtd. Avg. Rate Base - GO Allocation $9,007.2 $5,892.1Total Weighted Average Rate Base $126,662.2 $103,212.9
*ORA did not support consolidation in its report
(In $1,000)
TEST YEAR 2017
Attachment 2 to Settlement Agreement
RATE BASE COMPARISON TABLE
Bay Area Region(Formerly "Bayshore" and "Redwood Valley-Coast Springs, Lucerne, and Unified")
WEIGHTED AVERAGE DEPRECIATED RATE BASE
59

Utility ORAItem Estimate Estimate* Settlement
Wtd.Avg. Construction in Progress $5,830.9 $0.0Wtd.Avg. Plant in Serv. $235,318.3 $220,364.3Wtd. Avg. Depreciation Reserve -$86,557.8 -$83,289.4Net Utility Plant $154,591.4 $137,074.9
Deductions from Rate Base: Contributions In Aid of Construction $15,791.5 $17,954.7 Advances $3,862.2 $3,862.2 Reserve for Amortization of Intangibles $1,271.5 $1,265.0 Deferred Taxes $15,534.7 $15,680.4 Unamortized Investment Tax Credit $163.6 $163.6 Total Deductions from Rate Base $36,623.5 $38,925.8
Additions to Rate Base:Working Capital:
Materials and Supplies $334.8 $413.4 Tank Painting $1,744.1 $1,659.7 Working Cash - Lead Lag $2,240.9 $2,160.6 Amount Withheld from Employees -$19.6 -$19.6
Total Working Capital $4,300.3 $4,214.1 Taxes on - Advances $19.0 $19.0 Taxes on - CIAC $786.7 $915.2 Total Additions to Rate Base $5,106.0 $5,148.2
Wtd. Avg. Rate Base - District $123,073.8 $103,297.3Wtd. Avg. Rate Base - RWV Allocation $379.6Wtd. Avg. Rate Base - GO Allocation $9,386.1 $5,925.8Total Weighted Average Rate Base $132,459.9 $109,602.7
*ORA did not support consolidation in its report
ESCALATION YEAR 2018
(In $1,000)
(Formerly "Bayshore" and "Redwood Valley-Coast Springs, Lucerne, and Unified")
Attachment 2 to Settlement Agreement
RATE BASE COMPARISON TABLE
Bay Area Region
WEIGHTED AVERAGE DEPRECIATED RATE BASE
60

Utility ORAItem Estimate Estimate* Settlement
Wtd.Avg. Construction in Progress $5,159.4 $0.0Wtd.Avg. Plant in Serv. $113,750.5 $91,540.6Wtd. Avg. Depreciation Reserve -$44,255.8 -$43,749.0Net Utility Plant $74,654.1 $47,791.7
Deductions from Rate Base: Contributions In Aid of Construction $2,951.7 $2,952.3 Advances $1,738.7 $1,738.7 Reserve for Amortization of Intangibles $371.7 $356.7 Deferred Taxes $8,165.1 $7,910.2 Unamortized Investment Tax Credit $108.7 $108.7 Total Deductions from Rate Base $13,335.9 $13,066.7
Additions to Rate Base:Working Capital:
Materials and Supplies $550.0 $550.0 Tank Painting $558.0 $558.0 Working Cash - Lead Lag $2.5 -$85.9 Amount Withheld from Employees -$12.4 -$12.4
Total Working Capital $1,098.2 $1,009.7 Taxes on - Advances $58.2 $58.2 Taxes on - CIAC $111.9 $111.9 Total Additions to Rate Base $1,268.3 $1,179.8
Wtd. Avg. Rate Base - District $62,586.5 $35,904.8Wtd. Avg. Rate Base - Rancho Dominguez Allocation $909.7 $445.4Wtd. Avg. Rate Base - GO Allocation $5,709.7 $3,735.1Total Weighted Average Rate Base $69,205.8 $40,085.3
*ORA did not support consolidation in its report
(In $1,000)
TEST YEAR 2017
Attachment 2 to Settlement Agreement
RATE BASE COMPARISON TABLE
Los Angeles County Region(Formerly "Antelope Valley" and "Palos Verdes")
WEIGHTED AVERAGE DEPRECIATED RATE BASE
61

Utility ORAItem Estimate Estimate* Settlement
Wtd.Avg. Construction in Progress $5,159.4 $0.0Wtd.Avg. Plant in Serv. $142,985.0 $98,152.9Wtd. Avg. Depreciation Reserve -$47,195.7 -$46,226.1Net Utility Plant $100,948.7 $51,926.8
Deductions from Rate Base: Contributions In Aid of Construction $3,068.7 $3,069.2 Advances $1,653.3 $1,653.3 Reserve for Amortization of Intangibles $425.8 $401.2 Deferred Taxes $9,389.2 $8,545.6 Unamortized Investment Tax Credit $99.5 $99.5 Total Deductions from Rate Base $14,636.5 $13,768.7
Additions to Rate Base:Working Capital:
Materials and Supplies $550.0 $550.0 Tank Painting $580.3 $755.1 Working Cash - Lead Lag -$80.8 -$68.8 Amount Withheld from Employees -$12.4 -$12.4
Total Working Capital $1,037.1 $1,224.0 Taxes on - Advances $84.8 $84.8 Taxes on - CIAC $109.0 $109.0 Total Additions to Rate Base $1,230.9 $1,417.8
Wtd. Avg. Rate Base - District $87,543.1 $39,575.9Wtd. Avg. Rate Base - Rancho Dominguez Allocation $908.4 $383.6Wtd. Avg. Rate Base - GO Allocation $5,949.9 $3,756.4Total Weighted Average Rate Base $94,401.4 $43,715.9
*ORA did not support consolidation in its report
WEIGHTED AVERAGE DEPRECIATED RATE BASE
ESCALATION YEAR 2018
(In $1,000)
Attachment 2 to Settlement Agreement
RATE BASE COMPARISON TABLE
Los Angeles County Region(Formerly "Antelope Valley" and "Palos Verdes")
62

Utility ORAItem Estimate Estimate* Settlement
Wtd.Avg. Construction in Progress $8,827.4 $0.0Wtd.Avg. Plant in Serv. $202,605.7 $191,214.4Wtd. Avg. Depreciation Reserve -$55,244.8 -$55,135.0Net Utility Plant $156,188.3 $136,079.4
Deductions from Rate Base: Contributions In Aid of Construction $24,682.2 $24,234.0 Advances $12,019.1 $12,019.1 Reserve for Amortization of Intangibles $1,312.8 $1,313.7 Deferred Taxes $14,085.7 $13,872.1 Unamortized Investment Tax Credit $112.4 $112.4 Total Deductions from Rate Base $52,212.2 $51,551.3
Additions to Rate Base:Working Capital:
Materials and Supplies $612.9 $612.9 Tank Painting $556.9 $436.3 Working Cash - Lead Lag $1,943.2 $1,985.6 Amount Withheld from Employees -$12.7 -$12.7
Total Working Capital $3,100.2 $3,022.1 Taxes on - Advances $493.4 $493.4 Taxes on - CIAC $502.1 $462.8 Total Additions to Rate Base $4,095.7 $3,978.3
Wtd. Avg. Rate Base - District $108,071.8 $88,506.4Wtd. Avg. Rate Base - GO Allocation $5,839.9 $3,820.3Total Weighted Average Rate Base $113,911.7 $92,326.7
*ORA did not support consolidation in its report
(In $1,000)
TEST YEAR 2017
Attachment 2 to Settlement Agreement
RATE BASE COMPARISON TABLE
Monterey Region(Formerly "King City" and "Salinas")
WEIGHTED AVERAGE DEPRECIATED RATE BASE
63
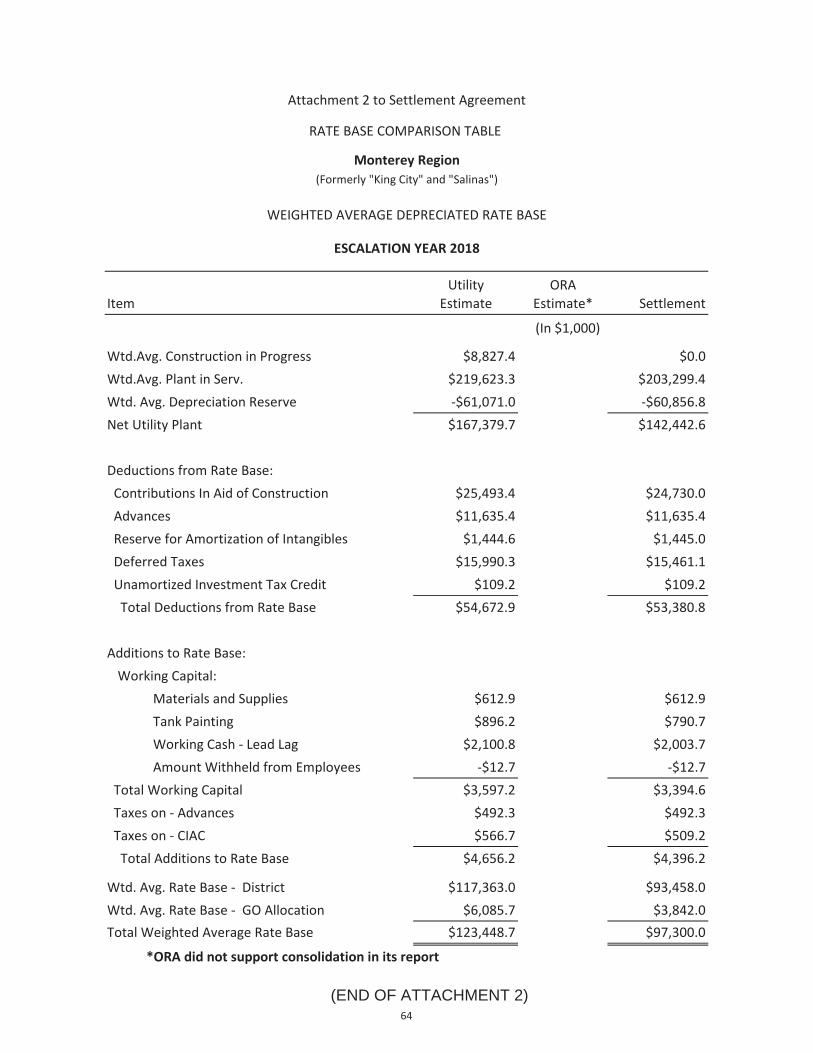
Utility ORAItem Estimate Estimate* Settlement
Wtd.Avg. Construction in Progress $8,827.4 $0.0Wtd.Avg. Plant in Serv. $219,623.3 $203,299.4Wtd. Avg. Depreciation Reserve -$61,071.0 -$60,856.8Net Utility Plant $167,379.7 $142,442.6
Deductions from Rate Base: Contributions In Aid of Construction $25,493.4 $24,730.0 Advances $11,635.4 $11,635.4 Reserve for Amortization of Intangibles $1,444.6 $1,445.0 Deferred Taxes $15,990.3 $15,461.1 Unamortized Investment Tax Credit $109.2 $109.2 Total Deductions from Rate Base $54,672.9 $53,380.8
Additions to Rate Base:Working Capital:
Materials and Supplies $612.9 $612.9 Tank Painting $896.2 $790.7 Working Cash - Lead Lag $2,100.8 $2,003.7 Amount Withheld from Employees -$12.7 -$12.7
Total Working Capital $3,597.2 $3,394.6 Taxes on - Advances $492.3 $492.3 Taxes on - CIAC $566.7 $509.2 Total Additions to Rate Base $4,656.2 $4,396.2
Wtd. Avg. Rate Base - District $117,363.0 $93,458.0Wtd. Avg. Rate Base - GO Allocation $6,085.7 $3,842.0Total Weighted Average Rate Base $123,448.7 $97,300.0
*ORA did not support consolidation in its report
WEIGHTED AVERAGE DEPRECIATED RATE BASE
ESCALATION YEAR 2018
(In $1,000)
Attachment 2 to Settlement Agreement
RATE BASE COMPARISON TABLE
Monterey Region(Formerly "King City" and "Salinas")
64
(END OF ATTACHMENT 2)
Attachment 3
RATE BASE OFFSET ADVICE LETTER PROJECTS

Attachment 3 to Settlement Agreement
District PID Description AmountCompletion
YearExpected
Filing YearAuthority
Expected Revenue
RequirementBakersfield 00098348 New well addition in North Garden
West - Well #1$2,090,099 2018 2019 2015 GRC $315,881
00099166 Replace SCADA software and hardware
$1,590,809 2018 2019 2015 GRC $240,422
00099267 SCADA NW WTP $103,800 2018 2019 2015 GRC $15,68800099821 Water supply South West - New
Well$2,039,120 2018 2019 2015 GRC $308,176
00064433 Treatment for TCE at Station 146 $2,067,148 2016 2017 2012 GRC $312,456
00076395 NW Bakersfield Treatment Plant Enhancements
$2,852,112 2016 2017 2012 GRC $431,045
Bayshore 00099296 Security windows in new building $203,510 2016 2017 2015 GRC $30,522
00099103 Replace SCADA software and hardware
$922,538 2018 2019 2015 GRC $138,361
00060861 Water Storage - Tank (San Carlos) $1,000,000 2017 2018 2012 GRC $149,978
00061318 Water Supply - Well at Station 1-24 $1,189,243 2017 2018 2012 GRC $178,361
00020141 Design & Equip 4MG Storage Tanks -Sta. 27, Beresford - San Mateo
$2,403,200 2016 2017 2009 GRC $360,428
00061336 Drill, Develop and Equip - SM Well $1,348,941 2018 2019 2012 GRC $202,312
00061972 Land - SM Well $921,000 2016 2017 2012 GRC $138,13000063397 Operations/Customer Service
Center$10,200,000 2017 2018 2012 GRC $1,529,778
00063402 Office Furniture - Operations Center
$204,000 2017 2018 2012 GRC $30,596
00063772 Tank Replacement - Sta. 6 - San Mateo
$6,020,000 2017 2018 2012 GRC $902,869
Bear Gulch 00097310 Additional Storage at Station 5 - 3MG
$4,804,569 2017 2018 2015 GRC $717,053
00099104 Replace SCADA software and hardware
$762,610 2018 2019 2015 GRC $113,815
00012922 Diversion Dam Fish Passage IMP $400,000 2017 2018 2005 GRC $59,69800020196 Fish Passage Facility - Upper
Division Dam$1,315,000 2017 2018 2005 GRC $196,256
00065249 Design of Dam Modifications $540,000 2016 2017 2012 GRC $80,592Chico 00098729 SCADA for PRVs $159,891 2016 2017 2015 GRC $23,666
00098722 SCADA RTUs $316,929 2018 2019 2015 GRC $46,91000099106 Replace SCADA software and
hardware$812,950 2018 2019 2015 GRC $120,327
California Water Service Company2015 GRC
Rate Base Offset Advice Letter Projects
1

Attachment 3 to Settlement Agreement
District PID Description AmountCompletion
YearExpected
Filing YearAuthority
Expected Revenue
Requirement
California Water Service Company2015 GRC
Rate Base Offset Advice Letter Projects
00020515 1.5 MG Tank Site - Sta. 79 $2,618,225 2016 2017 2012 GRC $387,531CSS 00099778 WQ Lab Space Improvement $2,299,072 2017 2018 2015 GRC $473,639
00100031 HYPERION UPGRADE $1,615,336 2017 2018 2015 GRC $332,78100099272 Replace SCADA software and
hardware$4,871,962 2018 2019 2015 GRC $1,003,689
00064294 Office - Replace SCADA Hardware and Software
$5,104,536 2017 2018 2012 GRC $1,051,602
Dixon 00099168 Replace SCADA software and hardware
$305,710 2018 2019 2015 GRC $44,383
00019807 New Generator - Sta. 4 $146,667 2018 2019 2012 GRC $22,18300061955 New Well - Sta. 4 $2,602,060 2018 2019 2012 GRC $393,547
Dominguez 00100482 Property for New DOM Well $1,248,379 2017 2018 2015 GRC $179,16200098334 Water Supply - New Well West
Basin$3,891,480 2018 2019 2015 GRC $558,488
00099167 Replace SCADA software and hardware
$675,121 2018 2019 2015 GRC $96,890
00099341 Treatment at Station 297 $5,097,130 2018 2019 2015 GRC $731,51700099522 Treatment at Station 272 $5,739,431 2018 2019 2015 GRC $823,69800076316 Station 232 Upgrade $2,221,934 2017 2018 2012 GRC $318,88200020772 Well Head Treatment - Sta. 294-01 $4,964,000 2016 2017 2009 GRC $712,411
00020775 Drill, Develop, and Equip New Well -Central Basin
$6,617,000 2017 2018 2009 GRC $949,643
00020838 Construct and Equip Well $6,617,000 2017 2018 2009 GRC $949,64300063837 Nitrification Control $200,000 2016 2017 2012 GRC $28,70300076394 BP Carson Refinery Recycled Water
Pipeline$4,000,000 2018 2019 2012 GRC $574,062
East Los Angeles
00098232 SCADA monitors $18,035 2016 2017 2015 GRC $2,692
00016074 Construction of Well 53-02 and Treatment
$8,240,000 2017 2018 2007 GRC $1,229,961
00020583 Drill, Develop, and Equip New Wells (62-01/02)
$1,943,782 2016 2017 2009 GRC $290,143
00020670 Construct Tank $3,777,023 2016 2017 2009 GRC $563,785Hermosa Redondo
00099169 Replace SCADA software and hardware
$558,157 2018 2019 2015 GRC $85,282
00064502 Blending Facility or Nano Filtration Facility - Sta. 8 Well 2
$4,080,000 2017 2018 2012 GRC $623,389
King City 00099170 Replace SCADA software and hardware
$344,460 2018 2019 2015 GRC $52,304
Livermore 00098846 Replace SCADA Modicon RTUs $73,374 2016 2017 2015 GRC $11,08000098854 Replace SCADA Modicon RTUs $75,208 2017 2018 2015 GRC $11,35700098856 Replace SCADA Modicon RTUs $77,088 2018 2019 2015 GRC $11,641
2

Attachment 3 to Settlement Agreement
District PID Description AmountCompletion
YearExpected
Filing YearAuthority
Expected Revenue
Requirement
California Water Service Company2015 GRC
Rate Base Offset Advice Letter Projects
00099171 Replace SCADA software and hardware
$542,232 2018 2019 2015 GRC $81,879
Los Altos 00098508 SCADA tablets $1,442 2016 2017 2015 GRC $24100099172 Replace SCADA software and
hardware$596,548 2018 2019 2015 GRC $99,635
00062077 Replace 100K Gallon Redwood Tank - Sta. 8 Loyola Tank
$312,308 2017 2018 2012 GRC $52,161
Marysville 00099174 Replace SCADA software and hardware
$343,217 2018 2019 2015 GRC $53,313
Oroville 00099175 Replace SCADA software and hardware
$355,987 2018 2019 2015 GRC $54,104
Palos Verdes 00098326 Crenshaw Ridge Supply Project $42,088,316 2018 2019 2015 GRC $6,243,686
00098328 D-500 Pipeline $14,884,852 2018 2019 2015 GRC $2,208,12700099181 Replace SCADA software and
hardware$371,788 2018 2019 2015 GRC $55,154
00017331 Replace Panelboard - Sta. 22 $620,000 2016 2017 2009 GRC $91,97500026747 New Panelboard for Boosters - Sta.
22 A-D (Phase 2)$576,900 2016 2017 2009 GRC $85,582
00076174 Purchase Pump Station Property - PV Pipeline Project
$2,000,000 2017 2018 2012 GRC $296,694
Salinas 00099176 Replace SCADA software and hardware
$816,176 2018 2019 2015 GRC $126,253
00023267 New 150K Gallon Storage Tank - Buena Vista
$1,349,215 2016 2017 2009 GRC $208,709
Selma 00099177 Replace SCADA software and hardware
$386,645 2018 2019 2015 GRC $59,362
Stockton 00099178 Replace SCADA software and hardware
$782,028 2018 2019 2015 GRC $117,895
00020204 Drill, Develop and Equip New Well $2,121,100 2016 2017 2009 GRC $319,767
Visalia 00099369 34 SCADA radios $78,035 2016 2017 2015 GRC $11,62600099179 Replace SCADA software and
hardware$913,127 2018 2019 2015 GRC $136,041
Westlake 00099026 SCADA RTU $51,221 2016 2017 2015 GRC $7,70600099182 Replace SCADA software and
hardware$436,406 2018 2019 2015 GRC $65,656
00064175 Duesenberg Dr. Thousand Oaks Main Replacement
$2,886,247 2017 2018 2012 GRC $434,224
Willows 00099180 Replace SCADA software and hardware
$290,618 2018 2019 2015 GRC $39,894
$197,094,047 $30,007,087
3
(END OF ATTACHMENT 3)

Attachment 4
CARRYOVER PROJECTS

Attachment 4 to Settlement Agrement - Carryover Projects
District PID Description2015
Amount2016
Amount2017
AmountAntelope Valley 00061954 Replace Interior Safety Climb - Sta. 1 Tank 3 -
Lancaster$3,255 $0 $0
Antelope Valley 00063495 Field - Large Power Tools including Jackhammers, Air Tools, & Metal Pipe Locators
$0 $6,637 $0
Antelope Valley 00064110 Seismic Retrofit - Sta. 5 Tank 1 - Leona Valley System
$0 $68,104 $0
Antelope Valley 00075615 Replace Pump & motor. Existing equipment leaks and is not VFD compatible.
$0 $0 $103,800
Antelope Valley 00013185 INSTALL VFD PANELS $79,388 $0 $0Antelope Valley 00020573 2 6" Gate Valves - Fremont $19,373 $0 $0Antelope Valley 00063016 Replace 20 faulty service lines $52,370 $318 $0Antelope Valley 00063494 Field - Large Power Tools including
Jackhammers, Air Tools, & Metal Pipe Locators$0 $6,120 $0
Antelope Valley 00066789 Replace 10 service service lines $29,067 $0 $0Antelope Valley 129-NON-
SP129- Antelope Valley Non-specific $18,377 $0 $0
Antelope Valley AVD0900 Meter Replacement Program $1,656 $0 $0Antelope Valley 00020509 Reconciling Item $27,834 $0 $0Antelope Valley 00010391 AVEK Connection - Lancaster $143,219 $0 $0Antelope Valley 00020700 20 1" Services - Lancaster $325 $0 $0Antelope Valley 00072573 Replace Electrical Equip. - Sta. 1 $460 $0 $0Antelope Valley 00020701 150,000 Gallon Bolted Steel Tank - Sta. 4 - Lake
Hughes - 250' 8" PVC$0 $397,984 $0
Antelope Valley 00021119 1,500' 6" PVC; 10 1" Services; 4 Hydrants - Elizabeth Lake Road
$0 $218,900 $0
Antelope Valley 00066846 1500' 6"PVC; 20 Services; 4 Hydrants - Elizabeth Lake Road
$0 $285,600 $0
Bakersfield 00020096 3,150' 8" PVC; Reconnect 68 1" Services; 1 Reconnect 1 2" Services; Reconnect 7 Hydrants on Belle Terrace - Castro Lane to Caylor St.
$0 $565,145 $0
Bakersfield 00020212 Drake Street - 24th St. to Spruce St. - 2,348' 8" PVC; Reconnect 36 1" Services & 1 2" Service; Reconnect 5 Hydrants
$0 $417,605 $0
Bakersfield 00061317 Purchase field equipment $0 $29,070 $0Bakersfield 00064488 Vehicle - 0.5 Ton Pick Up F-150 with Tool Box
and Light Bar - Meter Reader$0 $42,000 $0
Bakersfield 00051708 Interior Safety Climb - Sta. 148 Tank 2 $2,965 $0 $0Bakersfield 00054208 Replace Interior Safety Climb - Sta. 116 Tank 4
(University)$3,524 $0 $0
Bakersfield 00060252 Replace 10 LMI Chemical Pumps $10,373 $0 $0Bakersfield 00061734 Paint Interior Complete; Replace & Install One
48" DIA. Cupola Vent - Sta. 155 Tank 1$10,400 $0 $0
Bakersfield 00061712 Upgrade CP System - Sta. 155 Tank 1 $16,562 $0 $0
California Water Service Company2015 GRC
Carryover Projects
1

Attachment 4 to Settlement Agrement - Carryover Projects
District PID Description2015
Amount2016
Amount2017
AmountBakersfield 00051808 Paint Interior Complete, Upgrade CP System, &
Replace Cupola Vent - Sta. 45 Tank 2$32,759 $0 $0
Bakersfield 00020171 1,470' 8" PVC; Reconnect 2 Hydrants - South K Street - Wilson to Sidney Drive
$384,070 $0 $0
Bakersfield 00020185 P Street & Dorian Drive - South Chester & Wilson Road - 560' 6" PVC; Reconnect 13 1" Services; 1 Hydrant
$343,377 $0 $0
Bakersfield 00020188 850' 6" PVC; Reconnect 20 1" Services; Reconnect 1 Hydrant - Houchin Road - Belle Terrace to Lester St.
$176,397 $0 $0
Bakersfield 00064483 REPLACE V204042 MEETS 120K MILEAGE CRITERIA. PURCHASE 1.0 TON C&C WITH UTILITY BODY
$0 $52,936 $0
Bakersfield 00061600 Field - Tools for Pump Operators $0 $24,190 $0Bakersfield 00061601 72 New Filter Modules - NE WTP $0 $130,793 $0Bakersfield 00063614 Replace Pump Equipment - Sta. 143-01 $0 $88,399 $0Bakersfield 00064491 Vehicle - 0.5 Ton Pick Up With Accessories -
General Foreman$0 $44,556 $0
Bakersfield 00064493 Vehicle - 0.5 Ton Pick Up With Accessories - Superintendent
$0 $38,772 $0
Bakersfield 00064498 Vehicle - 0.5 Ton Pick Up With Tool Box and Light bar - Serviceperson
$0 $37,643 $0
Bakersfield 00018278 Union Ave. - Belle Terrace to Casa Loma - 2,660' 8" PVC
$0 $442,793 $0
Bakersfield 00020387 Replace Panelboard - Sta. 186-A $0 $102,908 $0Bakersfield 00020811 SCADA Cathodic Monitoring - Monte Vista,
Hillcrest, University - Sta. 147 & 148$0 $37,000 $0
Bakersfield 00020812 5 SCADA Cathodic Monitoring - Sta. 155, 161, 164, 174, & Panorama
$0 $40,000 $0
Bakersfield 00058272 Northwest BK WTP Investigation $0 $97,487 $0Bakersfield 00061213 SCADA Cathodic Monitoring - Sta.147, 148, 155,
& 164$0 $32,910 $0
Bakersfield 00063401 Replace Panelboard - Sta. 100 $0 $303,207 $0Bakersfield 00063612 Replace Pump Equipment - Sta. 184-01 $0 $91,986 $0Bakersfield 00067189 50 Pressure Transducers - Sta. 23 (3), 32, 36, 42,
44, 45(5), 47, 54, 68, 73 (2), 77,81 (2), 82, 85, 86, 87 (3), 88, 89, 91 (2), 96, 97 (3), 100 (3), 102, 105, 108, 116 (5), 123-2, 126, 127, 128, 129
$0 $180,148 $0
Bakersfield 00067909 25 Flow Meters - Sta. 130, 134, 137, 141, 143, 133, 149, 153, 158, 161, 163, 176, 180, 184, 186-1, 188, 189, 190, 191, 193, 194, 198, 199, 206, 208
$0 $155,813 $0
Bakersfield 00076093 2,660' of 16" DI transmission main in Wible Rd. from Panama Lane to Berkshire Rd and 340' of 16" CL&C in 36" steel casing for crossing Panama Lane.
$0 $1,350,000 $0
2

Attachment 4 to Settlement Agrement - Carryover Projects
District PID Description2015
Amount2016
Amount2017
AmountBakersfield 00076073 1,200' of 16" DI transmission main in Akers Rd.
from Bk Sta. 146 to De Ette Ave and 200' of 16" CL&C in 36" steel casing for canal crossing.
$194,293 $535,552 $0
Bakersfield 00033170 Replace Interior Safety Climb - Sta. 45 Tank 1 Mt. Vernon
$3,166 $0 $0
Bakersfield 00061292 Replace Flow Meter - K12 @ King & Jeffery $20,066 $0 $0Bakersfield 00061295 Replace Flow Meter - Sta. 186 $21,797 $0 $0Bakersfield 00061752 Upgrade CP System - Sta. 176 Panorama Tank 1 $22,237 $0 $0
Bakersfield 00062352 Office - 50 Chairs and 5 Tables - Field Conference Room
$2,745 $0 $0
Bakersfield 00019957 Palo Verde & Loma Vista Court - 1,255' 6" PVC; 29 1" Services; 1 Hydrant
$223,721 $0 $0
Bakersfield 00061595 Field - Tools for Pump Operators $14,730 $0 $0Bakersfield 00062892 AC Unit - NE WTP - Sta. 216 $8,904 $0 $0Bakersfield 00021060 5 SCADA Remotes RTUs - Sta. 39, 40, 60, 151, &
177$52,321 $0 $0
Bakersfield 00020243 Steel Storage Building - NE WTP $66,715 $0 $0Bakersfield 00060652 Hach Nitrate Analyzer - Sta. 153 $30,072 $0 $0Bakersfield 00061352 Hoseless Sludge Vac - NE WTP - Sta. 216 $189,016 $0 $0Bakersfield 00020169 Jones Street - Stockdale Hwy. to Quarter -
1,320' 6" PVC; 40 1" Services; 2 Hydrants$368,650 $0 $0
Bakersfield 00020769 Arrow St. & Calaway Canal - PRV $381,842 $0 $0Bakersfield 00020191 988' 6" PVC & Reconnect 23 1" Services; 2
Hydrants - Wood Lane - Real Road East to end$152,811 $17,822 $0
Bakersfield 00100530 Re-route drains - NW WTP $4,281 $0 $0Bakersfield 00100531 Rebuild chemical transfer system $24,657 $0 $0Bakersfield 00096996 BK sta. 107-01 Replace Pump/Motor $51,304 $0 $0Bakersfield 00098981 instl flo moitor @ sta 23 D $4,379 $0 $0Bakersfield 00100284 Brite St. main relocations $102,671 $0 $0Bakersfield 00042288 MICROWAVE / TWO-WAY RADIO SYSTEM $274,971 $0 $0Bakersfield 00099561 repl 8'' fill valve meter at NWTP $8,135 $0 $0Bakersfield 00065547 Convert Flat Rates to Meters (split 98000 &
65547 50/50)$1,530,729 $0 $0
Bakersfield 00020809 SCADA Cathodic Monitoring System $90,337 $0 $0Bakersfield 00020399 Replace Panelboard - Sta. 23/71 $0 $302,194 $0Bakersfield 00063595 Replace Pump Equipment - Sta. 189-01 $0 $97,683 $0Bakersfield 00063633 Replace Pump Equipment - Sta. 151-01 $0 $165,342 $0Bakersfield 00063814 Replace Booster Pump Equipment - Sta. 23-F $0 $108,722 $0Bakersfield 00063815 Replace Split-Case Booster Pumps - Sta. 96 A &
B $0 $72,319 $0
Bakersfield 00098000 Convert Flat Rates to Meters (split 98000 & 65547 50/50)
$1,419,758 $0 $0
Bakersfield 101-NON-SP
101- Bakersfield Non-specific $9,998,826 $0 $0
Bakersfield BKD0900 Meter Replacement Program $425,231 $0 $0Bakersfield 00017532 2575' OF 6'' PVC WESTERN AVE $26 $0 $0
3

Attachment 4 to Settlement Agrement - Carryover Projects
District PID Description2015
Amount2016
Amount2017
AmountBakersfield 00063693 BK 162 C & D: Repalce Booster Pumps -$11,204 $0 $0Bakersfield 00065370 REPLACE ITRON HANDHELDS $138 $0 $0Bakersfield 00065509 Conversions of Flat Rate to Meters -$638 $0 $0Bayshore 00062073 Upgrade CP System - Sta. 119 Tank 1 $13,610 $0 $0Bayshore 00062832 2,350' 8" PVC; 18 1" Services; 1 4" Service; 8
Hydrants - 31st Ave. - San Mateo$877,465 $0 $0
Bayshore 00063047 Cowgill Alley - San Mateo - 1,340' 6" PVC; 32 1" Services; 1 2" Service; 4 4" Fire Services; 1 6" Fire Service; 2 Hydrants
$839,756 $0 $0
Bayshore 00064733 Washington Street between Heather and Sweetwood - 1,500' 8" PVC; 51 1" Services; 3 Hydrants
$826,142 $0 $0
Bayshore 00062056 Upgrade CP System - Sta. 112 Beverly Tank 2 $0 $18,038 $0Bayshore 00065369 1,300' 8" PVC; 1,900' 6" PVC - N. Humboldt,
College, N. Idaho$1,000,201 $7,494 $0
Bayshore 00066249 Field - Light Tower $0 $20,488 $0Bayshore 00066330 Field - Arrow Board $0 $10,396 $0Bayshore 00075073 Parrott Drive, Wildwood, Treetop Lane and
Oakley Rd. - 2,300' 6" DI; 44 1" Services; 6 Hydrants
$436,443 $80,414 $0
Bayshore 00075053 Fay/Willow Glen - 800' 6" PVC; 12 1" Services; 2 Hydrants
$0 $163,704 $0
Bayshore 00060795 Tank Turnover Equipment - Sta. 29 Tank 1 - San Mateo
$0 $79,817 $0
Bayshore 00062797 Panelboard Replacement - Sta. 24 $0 $142,107 $0Bayshore 00063063 Panelboard Replacement - Sta. 115 $0 $142,107 $0Bayshore 00063134 Panelboard Replacement & Genset - Sta. 106 $0 $212,749 $0Bayshore 00063020 Replace Pump & Motor - Sta. 2-A $0 $53,688 $0Bayshore 00064769 Install 4 PRV Bypasses in San Carlos $291,286 $0 $0Bayshore 00066310 Field - Arrow Board $5,050 $0 $0Bayshore 00066332 Field - Telog Hydrant Pressure Recorders $9,545 $0 $0Bayshore 00066334 Field - Locating Equipment $4,569 $0 $0Bayshore 00079576 Purchase new vehicle including outfitting for
additional certified pump operator.$38,566 $0 $0
Bayshore 00020272 Replace Panelboard - Sta. 23 $286,284 $0 $0Bayshore 00020581 Replace 2 Horizontal Pumps, Foundations,
Upgrade Motors- Sta. 23-A & B$87,180 $0 $0
Bayshore 00020738 Sullivan Ave. - 500' 8" PVC; 5 1" Services; 1 Hydrant
$400,396 $0 $0
Bayshore 00020847 Vehicle - Leak Truck - C&C, Utility Body, & Mobile Radio
$57,982 $0 $0
Bayshore 00049429 Annie Street - 500' 6" PVC; 7 1" Services; 1 4" Service; 1 Hydrant
$366,947 $0 $0
Bayshore 00062078 Replace 30 Blow-off's - Various Locations $52,831 $0 $0Bayshore 00062096 Replace 15 Hydrants - Various Locations $75,968 $0 $0Bayshore 00062332 Hydrant Replacement - Various Locations $105,928 $0 $0Bayshore 00062939 Replace Pump and Motor - Sta. 28-A $46,418 $0 $0
4

Attachment 4 to Settlement Agrement - Carryover Projects
District PID Description2015
Amount2016
Amount2017
AmountBayshore 00063192 Hillcrest Road & Valley - 1,900' 6" PVC; 33 1"
Services; 4 Hydrants$732,001 $0 $0
Bayshore 00020613 Replace Splitcase Pump, Upgrade Motor, & Add Energy Efficient Monitoring - Sta. 101-A
$0 $107,384 $0
Bayshore 00060797 Tank Turnover Equipment - Sta. 15 - Tank 1 (Reservoir 12)
$0 $91,692 $0
Bayshore 00079577 Purchase new vehicle including outfitting for additional Inspector position.
$0 $40,549 $0
Bayshore 00064005 Portable Generator $0 $77,218 $0Bayshore 00063213 Mobile Generator - San Mateo $0 $178,212 $0Bayshore 00020616 Replace 2 Wharfhead - Portable Booster
Connections - Sta. 17$0 $22,300 $0
Bayshore 00064153 Control Valve with Vault and SCADA Connection - Sta. 6 - San Mateo
$0 $130,045 $0
Bayshore 00064789 Install 4 PRV Bypasses in San Mateo $0 $207,148 $0Bayshore 00016883 STA. 6 RESERVOIR - STUDY $0 $22,000 $0Bayshore 00065437 Vehicle - 0.5 Ton Pickup and Outfitting $0 $40,700 $0Bayshore 00065438 Vehicle - 0.5 Ton Pickup and Outfitting - Meter
Reader$0 $40,700 $0
Bayshore 00067073 Data Acquisition Radio Replacement $0 $73,716 $0Bayshore 00015999 Bolted Steel Tank - Sta. 122 - San Carlos $0 $619,299 $0Bayshore 00020274 Replace Panelboard - Sta. 25 $0 $166,738 $0Bayshore 00062996 Replace Horz. Splitcase Pump and Motor - Sta.
107-B$0 $57,120 $0
Bayshore 00063019 Replace Pump & Motor - Sta. 112-B $0 $52,638 $0Bayshore 00064173 Repair Pump House Roofs - Sta. 117 and 119 -
San Carlos$0 $44,281 $0
Bayshore 00064273 Automatic Gate - Sta. 116 - San Carlos $0 $24,691 $0Bayshore 00069729 San Mateo Station Security $0 $36,000 $0Bayshore 00069789 Site Security - So. San Francisco $0 $72,000 $0Bayshore 00069951 Replace Broken Valves $0 $60,000 $0Bayshore 00020284 Generator - Sta. 116 $0 $105,717 $0Bayshore 00060673 Tank Turnover Equipment - Sta. 119 Tank 1 -
San Carlos$0 $52,626 $0
Bayshore 00060793 Tank Turnover Equipment - Sta. 120 Tank 1 - San Carlos
$0 $54,116 $0
Bayshore 00063753 Tank Replacement - Design - Sta. 6 Tank - Crystal Springs Reservoir - San Mateo
$0 $0 $681,316
Bayshore 00021064 MTBE/PCE Treatment - Conceptual Design - Sta. 1
$0 $0 $315,560
Bayshore 00059393 SC Sta 120 - Tank 2 $0 $0 $1,895,300Bayshore 00059413 SC Sta 119 - Tank 2 $0 $0 $1,935,100Bayshore 00060796 Sta. 103 Rebuild - Conceptual Design - San
Carlos$0 $0 $83,931
Bayshore 00061596 Fe/Mn Facility Expansion - Sta. 1 $0 $0 $1,402,200Bayshore 00061654 Chloramination Expansion - Sta. 1 $0 $0 $307,861Bayshore 00063556 80K Tank Replacement - Sta. 124 - San Carlos $0 $0 $427,095
5

Attachment 4 to Settlement Agrement - Carryover Projects
District PID Description2015
Amount2016
Amount2017
AmountBayshore 00097639 Replace Well Pump SSF1-15 $37,519 $0 $0Bayshore 00100221 Hach Products $7,014 $0 $0Bayshore 00100439 ReRebuild PRV at Blondin Connection $4,559 $0 $0Bayshore 00100563 Rerouting 6" main due to leak/tree $83,329 $0 $0Bayshore 152-NON-
SP152- Bayshore Non-specific $3,634,833 $0 $0
Bayshore SMD0900 Meter Replacement Program $330,646 $0 $0Bayshore SSF0900 Meter Replacement Program $112,893 $0 $0Bayshore 00020572 MPS 114-A: REPLACE PUMP/CAN B $1,106 $0 $0Bayshore 00044329 San Carlos Bayshore Radio Link $17,843 $0 $0Bayshore 00062097 Replace valves $207 $0 $0Bayshore 00063258 INSTALL 6" PVC AT 42ND AVE $1,062 $0 $0Bear Gulch 00020083 Bay Road SFPUC Connection - PRV $198,144 $0 $0Bear Gulch 00061598 Sand Hill Rd - from Sand Hill Ct. to Portola -
2360' 12" D.I.; 5 Services; 2 Hydrants. Abandon 8" AC in easement from Mountain Home to Sand Hill, 2 hydrants, and 5 services.
$0 $145,858 $0
Bear Gulch 00065371 Ormondale Tank 3 Retrofit - Sta. 29 Tank 3 $151,779 $0 $0Bear Gulch 00066230 Replace Dedicated Sample Stations $38,370 $0 $0Bear Gulch 00070330 Laboratory Remodel $94,370 $0 $0Bear Gulch 00096747 Replace BG Booster 26-B $55,968 $0 $0Bear Gulch 00099822 Install Cla- Valves $208,906 $0 $0Bear Gulch 00100789 BG 046 Emergency Motor Replacement $8,825 $0 $0Bear Gulch 00100917 2965 Woodside Rd 6" F.S. Replace $56,039 $0 $0Bear Gulch 00100937 F.O. Base Radio & Antenna Replace $6,228 $0 $0Bear Gulch 00029009 Paint Interior Underside of Roof + 6' Upper Shell
Paint Exterior Roof and Replace CP Anodes - Sta. 21
$0 $13,422 $0
Bear Gulch 00062938 South Castanya - from easement to end of cul-de-sac - 150’ 6" PVC; 4 2" Services. Abandon 2" CI main and 4 services.
$72,151 $17,046 $0
Bear Gulch 00064507 Vehicle - 0.5 Ton Pick Up with Tool Box and Light Bar
$0 $34,733 $0
Bear Gulch 00067190 15 Pressure Transducers $0 $73,716 $0Bear Gulch 00079555 Purchase new vehicle including outfitting for
additional Inspector position.$0 $67,453 $0
Bear Gulch 00094677 Replace BG 8-D Motor $0 $69,677 $0Bear Gulch 00098434 Company House Improvements $0 $25,936 $0Bear Gulch 00030028 Radio communication $0 $89,745 $0Bear Gulch 00017602 Security Mitigation Improvements -
Intermediate Tanks$0 $9,334 $0
Bear Gulch 00076196 Design Phase of new Operations Center $0 $66,478 $0Bear Gulch 00062104 Replace Horizontal Splitcase Pump and Motor -
Sta. 27-A$0 $37,842 $0
Bear Gulch 00065390 Skyline-Woodside Mut Connect Design $0 $132,711 $0Bear Gulch 00095826 Remaining work for fish passage $0 $47,741 $0
6

Attachment 4 to Settlement Agrement - Carryover Projects
District PID Description2015
Amount2016
Amount2017
AmountBear Gulch 00026009 Los Trancos R&R - 2,500 ft. of 2" PVC; 21 1"
Services$0 $278,788 $0
Bear Gulch 00061115 Hillside - 428 Hillside to Glenwood - 1200’ 6" DI; 12 2" Services; 2 Hydrants.Abandon 1" and 1.5" stl main, and 2" yelowmine main.
$0 $484,645 $0
Bear Gulch 00061892 Olive Hill and Canada Rd. - 8" and 12" DI in (1) Olive Hill from Albion to Canada and (2) Canada from Lanning to Sta 23. 40 ft 12" CLC in Olive Hill under Dry Creek. PRV in Canada from 805 to 640. 10 2" Services 1 PRV. 10 Hydrants w/ LBC. Abandon
$0 $2,179,045 $0
Bear Gulch 00062102 Replace Pump and Motor - Sta. 20-A $0 $57,828 $0Bear Gulch 00064689 Vehicle - 0.75 Ton Pick Up with Utility Body -
Flushing$0 $68,850 $0
Bear Gulch 00064690 Vehicle - 0.5 Ton Pick Up with Tool Box and Light Bar
$0 $42,000 $0
Bear Gulch 00063933 Standby Generator - Sta. 40 $0 $0 $304,136Bear Gulch 00065389 Tank Retrofit - Sta. 33 Los Trancos $0 $0 $18,791Bear Gulch 00076194 Preliminary Design (including hydrogeologic
assessment) for replacement well at Sta. 44.$0 $0 $25,136
Bear Gulch 102-NON-SP
102- Bear Gulch Non-specific $2,655,004 $0 $0
Bear Gulch BGD0900 Meter Replacement Program $241,848 $0 $0Bear Gulch 00020896 Reconciling Item $105,846 $0 $0Bear Gulch 00064059 16" and 20" pipe - Portola Rd. - (1) replacement
of existing 8" STL pipe with 2,400 ft of 16" DI from near Talin Lane to Station 8 and 1,200 ft of 20" DI from Station 8 to capped end and (2) extension of 4,500 ft of 20" DI pipeline from capped end to Sta .13
$0 $3,168,364 $0
Bear Gulch 00064060 Combine Stations 8 and 13 pumping facilities at Station 13 site.
$0 $1,310,000 $0
Chico 00015867 STA 63-01 BLOW OFF/AIR GAP $133,326 $0 $0Chico 00020025 VAC TRAILER $0 $66,940 $0Chico 00060852 Repl. Main-Ivy St/ 9th St.& 10th St $86,926 $0 $0Chico 00060853 Repl. Main- 19th St/Park & Normal $403,500 $0 $0Chico 00061338 Purchase Aldos CL2 Pumps $11,318 $0 $0Chico 00062173 Replace Pump, Motor, Col: CH 20-01 $0 $68,158 $0Chico 00063578 Install New Generator Sta. 38 $0 $145,637 $0Chico 00063672 New Generator Sta. 050 $0 $218,607 $0Chico 00063830 Replace Panelboard Sta. 053 $0 $163,000 $0Chico 00063844 Replace Panelboard Sta. 025 $0 $161,306 $0Chico 00064710 Flat to Meter Conversions in 2015 $180,412 $0 $0
7

Attachment 4 to Settlement Agrement - Carryover Projects
District PID Description2015
Amount2016
Amount2017
AmountChico 00065430 Install 2 hydrant for City of chico $0 $23,431 $0Chico 00020519 Drill, Develop, & Equip New Well $0 $0 $501,082Chico 00020905 Well Modification - Sta. 55-01 $0 $445,440 $0Chico 00020946 WELL MODIFICATION STA 68 $0 $200,900 $0Chico 00021084 GAC Treatment Plant - Sta. 52 $837,461 $0 $0Chico 00062240 Replace Pump, Motor, Col: CH 25-01 $72,026 $0 $0Chico 00063533 Install New Generator Sta. 042 $0 $274,318 $0Chico 00063826 Replace Panelboard Sta. 021 $220,840 $0 $0Chico 00102077 CH 54-01 Pump Replacement $89,167 $0 $0Chico 00102260 Gate Valve Maintenance Ipads $1,771 $0 $0Chico 00102656 CH 76-01 Replace Bushing& Mech Seal $3,246 $0 $0Chico 00102863 BIDWELL JR SVC VALVE $3,192 $0 $0Chico CHD0900 Meter Replacement Program $56,752 $0 $0Chico 104NONSP
16104-Chico Non Specific $2,398,876 $0 $0
Chico 00061332 Reconciling Item $1,738 $0 $0Chico 00097024 Reconciling Item $10,617 $0 $0Chico HAM0600 Reconciling Item $16,295 $0 $0Chico 00016952 CH CENTRAL PLUME REMEDIATION 3 $6,623 $0 $0Chico 00064812 Intermediate Zone Improvements $5,966 $0 $0Chico 00090805 Extension Projects $141,028 $0 $0Chico 00097100 Extension Projects $111,933 $0 $0Chico 00079873 Extension Projects $182,910 $0 $0Chico 00096666 Extension Projects $309,945 $0 $0Chico 00078174 Extension Projects $77,963 $0 $0Chico 00099050 Extension Projects $177,866 $0 $0CSS 00063315 Office - Network Hardware Enhancement $706,232 $291,031 $0CSS 00063316 Office - Data Storage $0 $158,049 $0CSS 00063317 Office - Enterprise End User Software $0 $781,179 $0CSS 00063825 Office - Enterprise Work and Asset
Management$0 $0 $650,000
CSS 00063831 Office - LIMS Upgrade $0 $0 $219,300CSS 00064139 Office - PC Refresh $0 $456,547 $0CSS 00064214 Purchase 4 new portable booster pumps to
provide emergency and shut-down service. $0 $151,341 $0
CSS 00064494 Office - Mobile Workforce $0 $496,800 $0CSS 00064497 Office - Financial Management System Upgrade $0 $1,275,000 $0
CSS 00064511 Office - Enterprise Application Integration 2015 $657,914 $0 $0
CSS 00064948 Vehicle - New Vehicle - CS Process Analyst $0 $30,241 $0CSS 00064949 Vehicle - Hybrid Sedan - No Cal Pool $0 $27,996 $0CSS 00064950 Vehicle - New EMT Vehicle $0 $74,199 $0CSS 00064953 Vehicle - New EMT C&C $0 $91,800 $0CSS 00064955 Vehicle - C&C - EMT $0 $91,800 $0CSS 00065493 Field - EMT Tools $0 $35,700 $0
8

Attachment 4 to Settlement Agrement - Carryover Projects
District PID Description2015
Amount2016
Amount2017
AmountCSS 00065678 Field - 2 Power Quality Analyzer - EMT
Equipment$0 $12,712 $0
CSS 00065681 Field - 2 Infrared Cameras $0 $11,350 $0CSS 00069609 Office - Spatial Portal Enhancement $0 $741,717 $0CSS 00069952 Office - Station Maps in GIS $0 $0 $708,900CSS 00010969 Additional Software Seats $17,003 $0 $0CSS 00017328 Office - Additional Printers & Copiers - Various $134,540 $0 $0CSS 00017901 Office - Geospatial Data Integration $1,485,427 $0 $0CSS 00018119 Office - Operations Data Management $0 $325,000 $0CSS 00020702 Field - EMT Tools $55,556 $0 $0CSS 00020708 Office - Enterprise Asset Management $0 $1,211,250 $0CSS 00021107 Office - SCADA Enhancements $198,337 $0 $0CSS 00021130 Office - Emergency Operations Cente $434,262 $2,571 $0CSS 00021226 Office - SCADA Replacement Specification $0 $278,389 $0CSS 00063312 Office - Enterprise End User Software $678,527 $0 $0CSS 00063314 Office - I.T. Security $0 $313,114 $0CSS 00063411 Office - Enterprise Identity Mgmt - Phase I $0 $518,554 $0CSS 00063472 Office - IT Services Suite - Phase I - Help Desk $0 $456,038 $0CSS 00063654 Office - LIMS Upgrade $0 $0 $424,300CSS 00063813 Office - Enterprise Work and Asset
Management$0 $1,305,103 $0
CSS 00063819 Office - Enterprise Work and Asset Management
$0 $650,000 $0
CSS 00063934 Office - Pipeline Decision Support System $0 $0 $696,000CSS 00064055 Office - I.T. Bill Printer - Data Center $0 $466,517 $0CSS 00064057 Office - Enterprise Reporting & Analysis $827,338 $0 $0CSS 00064072 Office - Enterprise Reporting & Analysis $0 $1,445,000 $0CSS 00064075 Office - Color Copier - I.T. Publishing $0 $39,924 $0CSS 00064094 Office - Copier - Engineering $0 $22,541 $0CSS 00064096 Office - Copier - Rates Department $5,822 $0 $0CSS 00064100 Office - Copier - Human Resources $0 $11,990 $0CSS 00064101 Office - Copier - Customer Service $0 $22,523 $0CSS 00064114 Office - 4 Copiers - I.T. Building $0 $54,808 $0CSS 00064157 Office - Medical Claims Management $0 $1,248,000 $0CSS 00064253 Office - AutoCad Design Suite Software -
Engineering$0 $8,073 $0
CSS 00064374 Office - Mobile Workforce Management $0 $142,040 $0CSS 00064481 Office - Mobile Workforce $612,414 $0 $0CSS 00064504 Office - Enterprise Application Integration 2014 $479,653 $0 $0
CSS 00064611 Office - Customer Care and Billing $0 $5,708,548 $0CSS 00065190 Vehicle - 0.5 Ton Pick Up - So Cal Pool $36,406 $0 $0CSS 00065192 Vehicle - Sedan - Water Quality Project
Manager$0 $36,488 $0
CSS 00065417 Vehicle - 1 Ton C&C and Service Body - EMT $0 $67,665 $0CSS 00065418 Vehicle - Sedan - VP of Rates $0 $48,809 $0CSS 00065419 Vehicle - 1 Ton C&C and Service Body - EMT $92,432 $0 $0
9
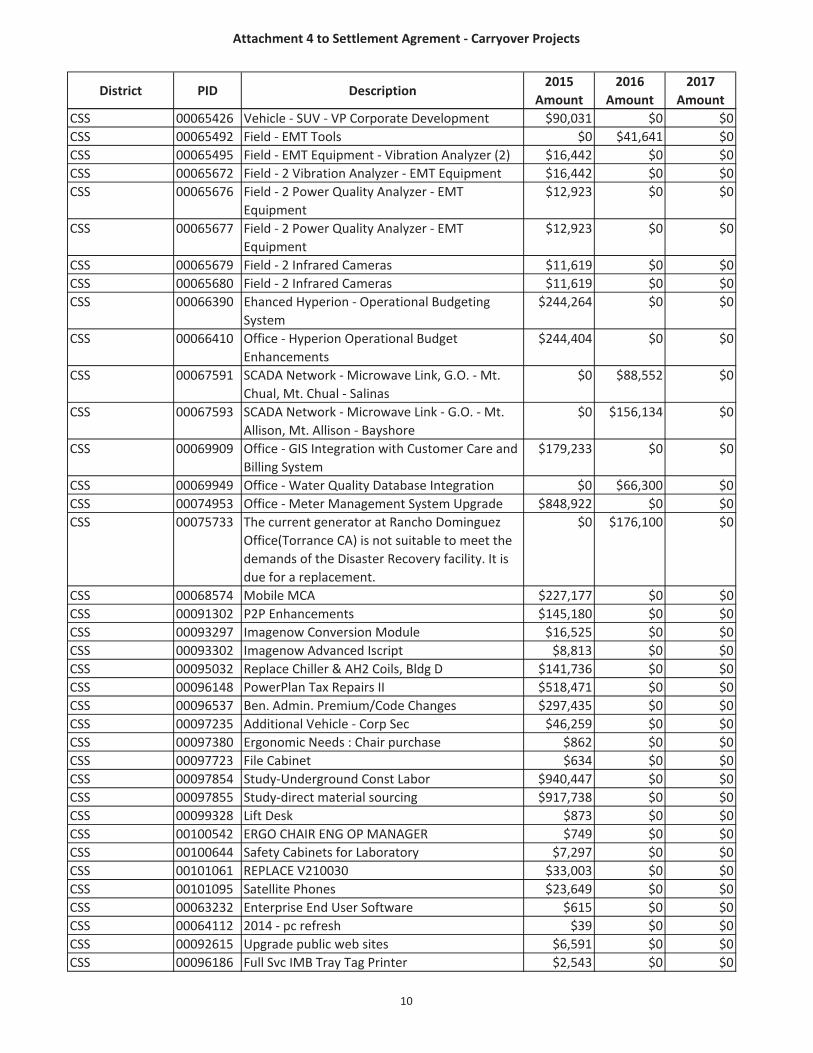
Attachment 4 to Settlement Agrement - Carryover Projects
District PID Description2015
Amount2016
Amount2017
AmountCSS 00065426 Vehicle - SUV - VP Corporate Development $90,031 $0 $0CSS 00065492 Field - EMT Tools $0 $41,641 $0CSS 00065495 Field - EMT Equipment - Vibration Analyzer (2) $16,442 $0 $0CSS 00065672 Field - 2 Vibration Analyzer - EMT Equipment $16,442 $0 $0CSS 00065676 Field - 2 Power Quality Analyzer - EMT
Equipment$12,923 $0 $0
CSS 00065677 Field - 2 Power Quality Analyzer - EMT Equipment
$12,923 $0 $0
CSS 00065679 Field - 2 Infrared Cameras $11,619 $0 $0CSS 00065680 Field - 2 Infrared Cameras $11,619 $0 $0CSS 00066390 Ehanced Hyperion - Operational Budgeting
System$244,264 $0 $0
CSS 00066410 Office - Hyperion Operational Budget Enhancements
$244,404 $0 $0
CSS 00067591 SCADA Network - Microwave Link, G.O. - Mt. Chual, Mt. Chual - Salinas
$0 $88,552 $0
CSS 00067593 SCADA Network - Microwave Link - G.O. - Mt. Allison, Mt. Allison - Bayshore
$0 $156,134 $0
CSS 00069909 Office - GIS Integration with Customer Care and Billing System
$179,233 $0 $0
CSS 00069949 Office - Water Quality Database Integration $0 $66,300 $0CSS 00074953 Office - Meter Management System Upgrade $848,922 $0 $0CSS 00075733 The current generator at Rancho Dominguez
Office(Torrance CA) is not suitable to meet the demands of the Disaster Recovery facility. It is due for a replacement.
$0 $176,100 $0
CSS 00068574 Mobile MCA $227,177 $0 $0CSS 00091302 P2P Enhancements $145,180 $0 $0CSS 00093297 Imagenow Conversion Module $16,525 $0 $0CSS 00093302 Imagenow Advanced Iscript $8,813 $0 $0CSS 00095032 Replace Chiller & AH2 Coils, Bldg D $141,736 $0 $0CSS 00096148 PowerPlan Tax Repairs II $518,471 $0 $0CSS 00096537 Ben. Admin. Premium/Code Changes $297,435 $0 $0CSS 00097235 Additional Vehicle - Corp Sec $46,259 $0 $0CSS 00097380 Ergonomic Needs : Chair purchase $862 $0 $0CSS 00097723 File Cabinet $634 $0 $0CSS 00097854 Study-Underground Const Labor $940,447 $0 $0CSS 00097855 Study-direct material sourcing $917,738 $0 $0CSS 00099328 Lift Desk $873 $0 $0CSS 00100542 ERGO CHAIR ENG OP MANAGER $749 $0 $0CSS 00100644 Safety Cabinets for Laboratory $7,297 $0 $0CSS 00101061 REPLACE V210030 $33,003 $0 $0CSS 00101095 Satellite Phones $23,649 $0 $0CSS 00063232 Enterprise End User Software $615 $0 $0CSS 00064112 2014 - pc refresh $39 $0 $0CSS 00092615 Upgrade public web sites $6,591 $0 $0CSS 00096186 Full Svc IMB Tray Tag Printer $2,543 $0 $0
10

Attachment 4 to Settlement Agrement - Carryover Projects
District PID Description2015
Amount2016
Amount2017
AmountCSS 00096899 SUSPNSION KTS FOR V208004 & V208005 $7,749 $0 $0CSS 00099001 V214045 - new sedan $43,680 $0 $0CSS 00099092 Radio for V209071 $2,078 $0 $0CSS 00099558 REPLACE V2091001 $44,517 $0 $0CSS 00101782 Lift Desk $873 $0 $0CSS 00101967 LATERAL FILES $960 $0 $0CSS 00102737 Lift Desk for Engineering Employee $852 $0 $0CSS 00103201 New AP check folding machine $4,420 $0 $0Dixon 00017348 Flowmeter Replacement Program (3) $67,048 $0 $0Dixon 00061632 Replace Pump & Column - Sta. 8-01 $134,967 $0 $0Dixon 00063972 Field - New Handhelds for Meter Reading $0 $11,094 $0Dixon 00065069 Vehicle - 0.5 Ton Pick Up & Outfitting $0 $41,650 $0
Dixon 105-NON-SP
105- Dixon Non-specific $403,367 $0 $0
Dixon DIX0900 Meter Replacement Program $20,646 $0 $0Dixon 00067045 Data Acquisition Radio Replacement $4,836 $0 $0Dominguez 00061272 RETROFIT BOOSTER STATION $0 $78,864 $0Dominguez 00061293 INSTALL PUMP AND MOTOR $0 $199,704 $0Dominguez 00061773 Install roof vents - DOM Sta.203 T1 $0 $36,426 $0Dominguez 00063656 Repl. Hydrants W/ Valves Various Lo $0 $68,688 $0Dominguez 00063822 Repl. 10 Blowoffs Various $0 $54,950 $0Dominguez 00064631 Repl +/- Val Casing Various Loc. $0 $38,160 $0Dominguez 00064714 BYPASSES & VALVES FOR LARGE METERS $0 $90,000 $0Dominguez 00079661 Advanced Metering Pilot $0 $1,610,000 $0Dominguez 00079667 Inst 683-6" PVC Main Orchard Ave $234,129 $0 $0Dominguez 00079670 Inst 2539'-6" PVC Main Anza Ave $0 $792,340 $0Dominguez 00079672 Inst 6450'-6" PVC Main E 185 TH St $1,885,300 $340,256 $0Dominguez 00017927 SECURITY @ DOMINGUEZ SYSTEM $120,347 $0 $0Dominguez 00019983 INST OUT DOOR LIGHTING $19,772 $0 $0Dominguez 00053608 DOM 277-T1: Replace Cupola $9,300 $0 $0Dominguez 00061153 Structure Improvments Sta 215 $12,610 $0 $0Dominguez 00061154 REPAIR VAULT MET-WEST BASIN $6,256 $0 $0Dominguez 00061155 REPL. 3 SAMPLE SITES $0 $25,980 $0Dominguez 00061156 INST. DATA LOGGER Sta. 215 $0 $44,506 $0Dominguez 00061158 INSTALL WALL FANS VARIOUS SITES $59,423 $0 $0Dominguez 00061172 REPL. 3 SAMPLE SITES $0 $91,330 $0Dominguez 00061193 Install french drains at sta. 203 $0 $341,851 $0Dominguez 00062153 Structure Improvements Sta. 290 $19,094 $0 $0Dominguez 00062174 Structure Improvments Sta. 203 $6,278 $0 $0Dominguez 00062412 Slurry Seal Sta. 203 $0 $32,436 $0Dominguez 00062413 Slurry Seal Sta. 232 $0 $32,436 $0Dominguez 00062712 DOM 298-01: Replace Pump Equipment $0 $215,229 $0Dominguez 00063637 Repl. Hydrants W/Valves Various Lo $123,476 $0 $0Dominguez 00064609 BYPASSES & VALVES FOR LARGE METERS $0 $93,750 $0Dominguez 00065909 Inst. 8" & 6" Mains E. 231St St. $242,404 $0 $0Dominguez 00066837 Install 15 SCADA RTUs $0 $428,029 $0
11

Attachment 4 to Settlement Agrement - Carryover Projects
District PID Description2015
Amount2016
Amount2017
AmountDominguez 00067349 Add Dominguez to SCADA system $0 $14,412 $0Dominguez 00074453 Repair Vault West Basin 14 $12,258 $0 $0Dominguez 00074454 Repair Vault West Basin 19 $5,997 $0 $0Dominguez 00074474 Repair Vault West Basin 21 $9,206 $0 $0Dominguez 00074475 Repair Vault West Basin 35 $10,269 $0 $0Dominguez 00074494 INST. DATA LOGGER Sta. 219 $0 $16,790 $0Dominguez 00074513 INST. DATA LOGGER Sta. 277 $59,726 $0 $0Dominguez 00074514 INST. DATA LOGGER Sta. 272 $0 $16,790 $0Dominguez 00074515 INST. DATA LOGGER Sta. 297 $0 $17,490 $0Dominguez 00074593 Data Loggers - Sta. 203 $0 $38,064 $0Dominguez 00074673 Data Logger - Sta. 294 $0 $38,064 $0Dominguez 00077653 Inst. Flow Meter Sta. 297 $0 $38,064 $0Dominguez 00077654 Install Flow Meter Sta. 279 $0 $76,128 $0Dominguez 00077655 Inst. Flow Meter Sta. 298 $0 $38,064 $0Dominguez 00077656 Inst. Flow Meter Sta. 277 $51,586 $0 $0Dominguez 00079656 Inst 532'-6" PVC Main Meyler St. $116,189 $582 $0Dominguez 00079664 Inst 2688'-6"PVC Main Doble Ave $580,585 $0 $0Dominguez 00079674 Inst. Grating at Sta. 203 $21,894 $0 $0Dominguez 00079733 Inst Eyewash/Showers Various Sta.'s $33,849 $0 $0Dominguez 00010059 INSTALL CHLORINATION EQUIP. $0 $75,399 $0Dominguez 00021235 WELL 275-01 GAC TESTING $0 $29,424 $0Dominguez 00021521 TREAMENT WELL 219-02 $0 $151,200 $0Dominguez 00030287 Enhance Central Basin Water Rights $180,008 $0 $0Dominguez 00082865 Main Replacements 2012 Unsch $45,999 $0 $0Dominguez 00082958 Unsch Valve Casings and Covers 2012 $32,284 $0 $0Dominguez 00092397 Repl. Circuit Breaker at Well 272 $2,968 $0 $0Dominguez 00093557 Develop well & Replace pump 290-01 $207,265 $0 $0Dominguez 00094572 DOM 215-T1: Inlet Piping $24,986 $0 $0Dominguez 00094797 Inst. Circulation Meter Sta-203 $2,741 $0 $0Dominguez 00095298 Inst. cl2 analyzer & line at ST.203 $18,645 $0 $0Dominguez 00095649 Inst. 4" Ser. W/3" Meter $36,813 $0 $0Dominguez 00095652 Replace Damage Fence Dom Yard $3,625 $0 $0Dominguez 00096444 DOM 277-01:Replace Pump & Motor $170,705 $0 $0Dominguez 00096491 Slurry Seal at Station 272 $11,449 $0 $0Dominguez 00096515 Repl. 4-10" Valves 1610 E Sepulveda $30,508 $0 $0Dominguez 00096691 Inst. Flush Line Sta-232 $30,090 $0 $0Dominguez 00097080 Repl. 15 F.H. Without HYD Valves $538,076 $0 $0Dominguez 00100022 Well 272-01 Treatment Study $10,342 $0 $0Dominguez 00100627 Water Quality Analyzer $13,331 $0 $0Dominguez DOM0500 DOM Unsch Main Replacements $204,844 $0 $0Dominguez DOM0520 DOM Unsch Valve Casing & Covers $8,005 $0 $0Dominguez DOM0530 DOM Unsch Hydrant Replacements $150,256 $0 $0Dominguez DOM0540 DOM Unsch Main Valve Replacements $23,231 $0 $0Dominguez 128-NON-
SP128- Dominguez Non-specific $517,310 $0 $0
Dominguez DOM0900 Meter Replacement Program $147,151 $0 $0Dominguez DOM0800 Meter Replacement Program $2,304 $0 $0
12

Attachment 4 to Settlement Agrement - Carryover Projects
District PID Description2015
Amount2016
Amount2017
AmountDominguez 00019971 Chemical Building w/ A.C. - Sta 203 $18,317 $0 $0Dominguez 00063615 Repl. Hydrants W/Valves Various Loc $1,146 $0 $0Dominguez 00079580 Inst 3927'-6" PVC Main Anza Ave $212 $0 $0Dominguez 00079665 Inst 3161'-6" Pvc Main Fiat St $178,142 $0 $0East Los Angeles 00025569 Paint Interior Complete, Exterior Roof (SSPC-
SP6) and Upgrade C.P. System to Auto-Potential - Sta. 42 Res 11B
$29,107 $0 $0
East Los Angeles 00051670 Paint Interior Complete & Upgrade CP System - Sta. 55 T1
$12,912 $0 $0
East Los Angeles 00057889 Ferguson Dr. - Westside to Garfield Ave. - 2,900' 12" DI; New 53 1" Services; 2 Hydrants and 530' of 16" Transmission MainRetire 2400' 6" CI; Retire 53 3/4" Services; Retire 2 Hydrants
$1,247,895 $0 $0
East Los Angeles 00057929 Install 1,600 ft - 16" DI Pickering Way - Olympic Blvd to Vail AveInstall 3 - 6" Fire HydrantsRenew 32 - 1" ServicesRetire 1,600 ft 12" CI Main - Pickering Way - Olympic Blvd to Vail AveRetire 3 - 6" Fire HydrantsRetire 32 - 3/4" Services
$979,602 $0 $0
East Los Angeles 00064063 Seismic retrofit for 6.5-M tank with 24-inch common inlet / outlet and installation of new 24-inch fittings and miscellaneous piping - Sta. 58 Tank 1.
$218,284 $0 $0
East Los Angeles 00074473 Field - Replace Tools and Equipment $9,668 $0 $0East Los Angeles 00053669 Replace Interior Safety Climb - Sta. 23 Tank 1
(Res.3C)$3,385 $0 $0
East Los Angeles 00058010 Install +/-1960ft - 6"PVC Main on Northside Dr- (Garfield Ave to Kensington Way)Install 4 - 6" Fire HydrantsRenew 41 -1" ServicesRetire +/-1960ft of 6" C.I Main on Northside Dr-(Garfield Ave to Kensington Way)Retire 4 - 6" Fire HydrantsRetire 41
$615,231 $0 $0
East Los Angeles 00058016 Install +/- 900ft - 6" PVC Main on Fairfield Ave (Garfield Ave to Concourse Ave)Renew 25 - 1" ServicesRetire +/- 900ft of 6" C.I. Main on Fairfield Ave (Garfield Ave to Concourse Ave)Retire 25 - 3/4" Services
$243,086 $0 $0
13

Attachment 4 to Settlement Agrement - Carryover Projects
District PID Description2015
Amount2016
Amount2017
AmountEast Los Angeles 00059512 Install +/-450ft-6" PVC Main-Alma Ave (Dundas
St to 962 N. Alma Ave)Install +/-480ft-6"PVC Main -Dundas St. (Alma Ave to Hicks Ave)Install +/-190ft-6" PVC Main -Alma Ave (Blanchard St. to Dundas St.)Install 2-6" Fire HydrantsRenew 35 -1" Services
$362,285 $13,911 $0
East Los Angeles 00061833 Paint Interior, Upgrade CP system, Replace Interior Safety Climb, Roof Vents, 30" dia. Manway, & Hatch - Sta. 58 T1 (Res. 15)
$58,066 $0 $0
East Los Angeles 00061854 Upgrade CP System - Sta. 58 Tank 1 (Res. 15) $30,106 $0 $0East Los Angeles 00061875 Replace Interior Safety Notch Carrier Rail - Sta.
42 Tank 1 (Res. 11A)$3,255 $1,921 $0
East Los Angeles 00058592 This project will install Iron and Manganese treatment to mitigate exceeding the Manganese SMCL and reduce interruption of system supply from Well 39-02.
$1,248,104 $68,261 $0
East Los Angeles 00074493 Field - Electric Operated Forklift - Inside Warehouse Use
$0 $33,413 $0
East Los Angeles 00057948 Install 350' - 12" DI Main on Garfield Ave (Allston St to Whittier Blvd)Install 300' - 12" DI Main on Whittier Blvd (Garfield Ave to Via Vista)Install 220' - 12" DI Main on Via Vista (Whittier Blvd to Repetto Ave)
$524,601 $0 $0
East Los Angeles 00059733 4 Units - Various Pump StationsRetire 4 Units - Various Pump Stations
$0 $3,927 $0
East Los Angeles 00059992 1,380 ft - 16" DI Main in Olympic Blvd from Garfield Ave to Pickering Way.
$934,114 $190,054 $0
East Los Angeles 00064373 New 1,600' 16" D.I. Main in Olympic Blvd from Server Ave to Garfield AveAbandon 900' 8" C.I. main; Abandon 600' 8" Steel main
$511,396 $112,408 $0
East Los Angeles 00020466 Site Improvements & Replace Pump - Sta. 40 Pumps A & B
$0 $875,478 $0
East Los Angeles 00020190 Power Generator - Sta. 58 Res. 15 $0 $217,000 $0East Los Angeles 00020488 1.5 MG Reservoir - Sta. 55 $0 $1,561,713 $0East Los Angeles 00064732 Field - Meter Reading Equipment $0 $51,000 $0East Los Angeles 00064734 Field - Meter Reading Equipment $0 $51,000 $0East Los Angeles 00060052 Paving - Sta. 23 $0 $55,611 $0East Los Angeles 00074476 Field - Tools and Equipment - Field Yard $0 $15,300 $0
14

Attachment 4 to Settlement Agrement - Carryover Projects
District PID Description2015
Amount2016
Amount2017
AmountEast Los Angeles 00069329 Install 1,370' - 16" DI Pipe - Tubeway Ave
(Corvette to Ferguson Dr.)Install 350' - 16" CL&C Pipe -Tubeway Ave @ Ferguson Dr (under RR crossing)Install 350' - 36" Steel Casing Tubeway @ Ferguson Dr (under RR crossing)
$0 $801,656 $0
East Los Angeles 00059572 Field - Excavator Loader $0 $61,200 $0East Los Angeles 00062933 Panelboard Replacement - Sta. 32 $0 $280,172 $0East Los Angeles 00062952 Panelboard Replacement including RTU, SCADA,
Control Panel - Sta. 23$0 $188,498 $0
East Los Angeles 00018197 Drill & Develop New Well $0 $1,814,900 $0East Los Angeles 106-NON-
SP106- East Los Angeles Non-specific $5,842,253 $0 $0
East Los Angeles ELA0900 Meter Replacement Program $233,755 $0 $0East Los Angeles 00020722 REPLACE STN 4 PUMP/MOTOR/BLDG -$1,075 $0 $0East Los Angeles 00058009 Install 6" PVC Main-Easton St. $571 $0 $0East Los Angeles 00058775 12" Main - New Well $107,601 $0 $0East Los Angeles 00064754 Install 8" PVC Main-Saybrook Ave. $738 $0 $0East Los Angeles 00064929 REPLACE V206050 $3,082 $0 $0East Los Angeles 00030309 Enhance Central Basin Water Rights $0 $90,660 $0Hermosa Redondo
00100437 Replace CL2-Tank Sta. 5 $10,237 $0 $0
Hermosa Redondo
00100423 Purchase F.H. Hoses & Fittings $4,879 $0 $0
Hermosa Redondo
00078283 Inst 375'-6" PVC 33RD St $120,279 $0 $0
Hermosa Redondo
00082940 Valve Casings & Covers Unsch 2012 $19,694 $0 $0
Hermosa Redondo
00062942 Repl. 2-Flow Meters Sta. 4 $30,690 $0 $0
Hermosa Redondo
00062947 Repl. 2-Flow Meters Sta. 26 $38,430 $0 $0
Hermosa Redondo
00078274 Inst. 546'-6" PVC Sierra Vista Dr $161,707 $2,890 $0
Hermosa Redondo
00097979 Repl. Tank Sta-8-02 $12,082 $0 $0
Hermosa Redondo
00059132 ENHANCE WEST BASIN WATER RIGHTS $55,862 $0 $0
Hermosa Redondo
00067046 Data Acquisition Radio Replacement $0 $119,731 $0
Hermosa Redondo
00062333 Repair Ashphalt Sta-29 Res-3 $0 $65,498 $0
Hermosa Redondo
00078287 Inst. 2263'-8" PVC Johnston Ave $0 $645,228 $0
Hermosa Redondo
00078288 Inst 538'-6" PVC Main Thomas Ave $0 $179,497 $0
15

Attachment 4 to Settlement Agrement - Carryover Projects
District PID Description2015
Amount2016
Amount2017
AmountHermosa Redondo
00019951 REPL. PANEL BOARD STA. 29 $0 $168,601 $0
Hermosa Redondo
00062079 Repl inlet & outlet valves Sta. 4 $0 $45,069 $0
Hermosa Redondo
00062733 Repl. Pumping Equip. Sta. 23D $0 $49,481 $0
Hermosa Redondo
00066931 Inst. 700'-6" PVC Main Hill Ln $0 $261,110 $0
Hermosa Redondo
00078285 Inst 1812'-6" PVC Main 18th St. $0 $600,958 $0
Hermosa Redondo
00100445 HR 30-01 Remediation and Start Up $0 $99,969 $0
Hermosa Redondo
00064869 Repl +/- 20 Val Casing Various Loc. $0 $38,160 $0
Hermosa Redondo
00067231 Install Pressure Transducers $0 $65,660 $0
Hermosa Redondo
00066790 Install 3 SCADA RTUs $0 $88,099 $0
Hermosa Redondo
00078281 Inst. 1388'-6" PVC Main 9TH St $0 $467,861 $0
Hermosa Redondo
108-NON-SP
108- Hermosa Redondo Non-specific $1,207,298 $0 $0
Hermosa Redondo
HRD0900 Meter Replacement Program $161,834 $0 $0
Hermosa Redondo
00020376 REPLACE HIT AND RUN HYDRANTS $31,831 $0 $0
Hermosa Redondo
00066470 Inst. 1560-8" PVC Inglewood Ave $1,267 $0 $0
Hermosa Redondo
00078114 Inst. 2082'-6" PVC Main $2,144 $0 $0
Kern River Valley 00059632 Paint Interior Shell & Floor from 8' below Roof & Interior Lader - Kernville Sta.1 Tank 1 (Treatment Plant Bay Tank)
$6,553 $0 $0
Kern River Valley 00061362 Quail Lane - 1500' 6" PVC; Reconnect 25 1" Services
$233,690 $0 $0
Kern River Valley 00070650 Replace CP System - Sta. 1 Tank 1 - Kernville $12,020 $0 $0Kern River Valley 00071193 Point to Point Radio Controls - Lakeland, KV to
Arden pumps, and Rim Rd.$55,327 $0 $0
Kern River Valley 00071194 Point to Point Radio Controls - Juniper Highlands, Pala, and Nellie Dent
$39,768 $0 $0
Kern River Valley 00076333 Install transfer switch and receptacle to allow for a quick connection for a portable generator in case of power failure. Also, install alarm dialer to notify operations of power outage.
$27,865 $0 $0
Kern River Valley 00076338 Install transfer switch, generator receptacle, and alarm dialer at Southlake booster station.
$13,063 $0 $0
16

Attachment 4 to Settlement Agrement - Carryover Projects
District PID Description2015
Amount2016
Amount2017
AmountKern River Valley 00051988 Paint Interior Complete and Replace CP Anodes -
Bodfish Sta. 11 Tank 1$9,180 $0 $0
Kern River Valley 00061373 Mtn View - 1,500' 6" PVC; Reconnect 25 1" Services
$205,990 $7,662 $0
Kern River Valley 00097558 KVSWTP INTAKE PUMP/MOTOR $24,411 $0 $0Kern River Valley 00099771 SOLA STA. 5-01 REPIPE $29,101 $0 $0Kern River Valley 00099775 KEARNS REGULATOR UPGRADE $18,344 $0 $0Kern River Valley 00064669 22K Gal. Bolted Steel Tank - Sta. 8 Lakeland $0 $220,165 $0Kern River Valley 00071153 Contruct 22K-Gal Bolted Steel Tank $0 $197,588 $0Kern River Valley 00071153 LLAND 008-T3: Contruct 22K Tank $0 $197,588 $0Kern River Valley 00090079 Countrywood Booster Station $0 $200,468 $0Kern River Valley 00097279 Replace SCADA computers KRVTP $0 $242,241 $0Kern River Valley 00066171 Pretreatment - Upper Bodfish Plant $0 $192,458 $0Kern River Valley 00066177 Pretreatment - Lower Bodfish Plant $0 $192,458 $0Kern River Valley 00070333 Dismantle and re-assemble the nuts, bolts and
gaskets on the ground level bolted steel tanks - Sta. 7 Tank 1 - Gautche Tank
$0 $80,340 $0
Kern River Valley 00064477 100K Tank - Sta. 143 - 02 South Lake $0 $385,070 $0Kern River Valley 00076335 Install transfer switch, generator receptacle,
and alarm dialer for Ponderosa Pines booster station.
$0 $21,600 $0
Kern River Valley 00071197 Point to Point Radio Controls - Squirrel Mt., Lake Properties, and Southlake
$0 $20,268 $0
Kern River Valley 00076345 Install manual transfer switch, generator receptacle, and alarm dialer for the Upper Bodfish treatment plant.
$0 $21,600 $0
Kern River Valley 00075853 Install standby generator and ATS. $0 $146,262 $0Kern River Valley 134-NON-
SP134- Kern River Valley Non-specific $129,434 $0 $0
Kern River Valley KRV0900 Meter Replacement Program $4,842 $0 $0Kern River Valley 00066170 New Well - Lakeland $0 $666,202 $0King City 00021303 16" DI - Willow and Mildred Main $376,923 $0 $0King City 00063403 FH replacements w-GV's $76,644 $0 $0King City 00050528 12 inch Main in Willow Street $542,546 $0 $0King City 00063774 Repl 4" Meter 440 Jayne St $0 $26,275 $0King City 00096451 Sta 6 - Air/Vac valve & misc piping $1,332 $0 $0King City 00064484 Refurbish Warehouse $0 $149,625 $0King City 00097081 Sta.13 mechanical seal &Compressor $1,865 $0 $0King City 00099768 Station 4C motor shaft $1,787 $0 $0King City 00099911 Sta 4 Bladder Tnk Conversion $13,801 $0 $0King City 00100338 4" svc w/ 3" meter 48405 Lonoak $36,168 $0 $0King City 00063855 4" Service and Vault 450 Jayne St $36,833 $0 $0King City 109-NON-
SPNon Specific Project $324,193 $0 $0
King City KCD0900 Meter Replacement Program $19,328 $0 $0King City KCD0426 Extension Projects $63,542 $0 $0Livermore 00016949 Replace Booster Pumps - Sta. 13 $0 $822,830 $0
17

Attachment 4 to Settlement Agrement - Carryover Projects
District PID Description2015
Amount2016
Amount2017
AmountLivermore 00063856 Replace Pump Equipment - Sta. 9 B & C $0 $41,261 $0Livermore 00021362 LIV 11 - Replace two booster pumps $0 $756,869 $0Livermore 00050668 Paint Complete Interior, Upgrade CP System,
Overflow Air Gap & 30" Dia. Manyway - Sta. 22 Tank 1 (Granada)
$62,309 $0 $0
Livermore 00096741 Station 26-Check Vals & Gate Vals $39,641 $0 $0Livermore 00050728 Paint interior complete, upgrade CP System,
Install new 30" dia. Manway at Liv Sta.22 Tank 2$50,044 $1,607 $0
Livermore 00096184 REPLACE 50HP PUMP LIV14A $45,533 $0 $0Livermore 00099583 Replace 8" Pipe Los Coalinas Rd $24,806 $0 $0Livermore 00056531 Replace 100K Gallon Redwood Tank with a
Bolted Steel Tank - Sta. 11 Tank 2$0 $295,553 $0
Livermore 00064099 Replace Booster Pumps - Sta. 22 A, B, & C $0 $50,489 $0Livermore 00064313 Emergency Generator - Sta. 18 $0 $144,251 $0Livermore 00061012 Linden Street - from No. P to No. L St. - 1,600'
6" PVC; 30 1" Services; 1 Hydrant$527,215 $79,859 $0
Livermore 00056989 Replace two sample stations $0 $8,744 $0Livermore 00065073 Vehicle - 0.5 Ton Pick Up and Outfitting $0 $41,650 $0Livermore 00064275 Replace Panelboard, Meter upgrade and
Instrumentation - Sta. 16$0 $154,529 $0
Livermore 00056572 Install 12" PRV at the corner of Siena Road and Bresso Drive, and install approximately 600 LF of new 8" PVC main to loop two existing 8" dead ends along Wetmore Road between Lagiss Drive and Talinga Drive.
$178,643 $0 $0
Livermore 00063357 Replace Booster Pack - Sta. 32. $0 $42,634 $0Livermore 00060952 North O Street - Pine St. to Linden St. - 1,100'
6" PVC; 21 1" Services; 3 Hydrants$0 $455,595 $0
Livermore 00056528 Chloramination System - Sta. 18 $0 $358,148 $0Livermore 00064076 4 RTU's - Sta. 12, 17, 26, and 28 $0 $105,600 $0Livermore 00067047 Data Acquisition Radio Replacement $0 $116,375 $0Livermore 00056574 Replace existing 50,000 Gallon Redwood Tank
with a bolted steel tank of same capacity - Sta. 10 Tank 1
$0 $256,564 $0
Livermore 00063953 Replace Booster Station - Sta. 23 $0 $1,221,609 $0Livermore 00056573 Tank Mixing System - Sta. 30 $0 $124,658 $0Livermore 110-NON-
SP110- Livermore Non-specific $935,322 $0 $0
Livermore LIV0900 Meter Replacement Program $83,042 $0 $0Livermore 00056571 Tank Mixing System at LIV 22 $2,486 $0 $0Livermore 00094819 Replace Booster LIV26B $2,977 $0 $0Los Altos 00005189 SUNSHINE MAIN REPLACEMENT $659,920 $0 $0Los Altos 00015631 GRANT ROAD MAIN REPLACEMENT $0 $79,307 $0Los Altos 00016750 Mtn. View, Park & Alley Main $0 $917,960 $0Los Altos 00020071 LAS STA 6 Chloramination $0 $1,344,445 $0Los Altos 00058333 Chloramination at LAS 24 $0 $358,148 $0
18

Attachment 4 to Settlement Agrement - Carryover Projects
District PID Description2015
Amount2016
Amount2017
AmountLos Altos 00058334 Chloramination at LAS 31 $0 $368,005 $0Los Altos 00060492 ITRON FC300 $16,890 $0 $0Los Altos 00060672 Tank retrofit at LAS 9 $55,101 $0 $0Los Altos 00062393 6" PRV INSTALL, JOLLY/FOOTHILL $0 $154,800 $0Los Altos 00062553 Replace Pump and Motor: LAS 27-A $117,960 $0 $0Los Altos 00062672 Replace Pump and Motor: LAS 30-A $0 $61,488 $0Los Altos 00063056 Replace Pump & Motor: LAS 113-A $0 $31,476 $0Los Altos 00066250 Replace Panelboard - LAS 11 $0 $142,107 $0Los Altos 00066809 Install 8 SCADA RTUs $0 $293,664 $0Los Altos 00066829 Install 6 SCADA RTUs $0 $176,198 $0Los Altos 00067049 Data Acquisition Radio Replacement $0 $205,502 $0Los Altos 00073093 Upgrade CP System - LAS 42 T2 $36,978 $32 $0Los Altos 00077616 LOS ALTOS 2013 SECURITY PROJECT $0 $233,208 $0Los Altos 111-NON-
SP111- Los Altos Suburban Non-specific $2,224,715 $0 $0
Los Altos LAS0900 Meter Replacement Program $126,259 $0 $0Los Altos 00057289 Mitigate Tank Settlement at LAS 111 $6,095 $0 $0Los Altos 00066509 Olive Tree Rezoning Phase I $270 $0 $0Los Altos 00060893 Mitigate Tank Settlement at LAS 9 $709,252 $0 $0Los Altos 00062077 Replace LAS 8 Layola Tank #3 $20,597 $0 $0Marysville 00073453 Replace GV,Yuba-E11th/Freeman-E13th $0 $4,800 $0Marysville 00100281 REPL 8" G.V. @ STA 7 $9,043 $0 $0Marysville 00062714 Post Chlorination Sample Station - Sta. 9 $6,688 $0 $0Marysville 00062772 Post Chlorination Sample Station with 1"
Service Line - Sta. 12$6,081 $0 $0
Marysville 00062857 Sample Station with 1" Service Line - Sta. 7 $6,663 $0 $0Marysville 00062859 Sample Station w/ 1-inch Service Line - Sta. 13 $3,137 $0 $0Marysville 00063296 Chlorine Storage Shed - Sta. 8 $6,137 $0 $0Marysville 00063374 Chlorine Storage Shed - Sta. 12 $5,972 $0 $0Marysville 00062860 Sample Station with 1" Service Line - Sta. 8 $7,149 $0 $0Marysville 00065090 Vehicle-New Vehicle District Manager $0 $35,631 $0Marysville 00095780 Flat to Meter Customer Requests $12,181 $0 $0Marysville 00094706 Video Surveillance in MRL Cust Ctr $0 $44,878 $0Marysville 00097452 Sta 16 Additional Lots Tank Sit $0 $52,776 $0Marysville MRL0520 MRL Unsch Valve Casings & Covers $26,539 $0 $0Marysville MRL0800 INSTALL / RETIRE METERS $6,657 $0 $0Marysville 112-NON-
SP112- Marysville Non-specific $115,770 $0 $0
Marysville MRL0900 Meter Replacement Program $2,874 $0 $0Oroville 00063915 Field - Various Tools for Gardening & Canal
Maintenance$0 $5,495 $0
Oroville 00064134 Telog - HPR kit/DTU & Flow Test $0 $5,457 $0Oroville 00067051 Data Acquisition Radio Replacement $0 $36,448 $0Oroville 00079455 Daryl Poerter Main Replacement $223,800 $0 $0Oroville 00100787 Backflow devices - pump stations $5,790 $0 $0Oroville 00100788 Fence & security at treatment plant $16,397 $0 $0Oroville 00100800 Pipe Locater $6,109 $0 $0
19
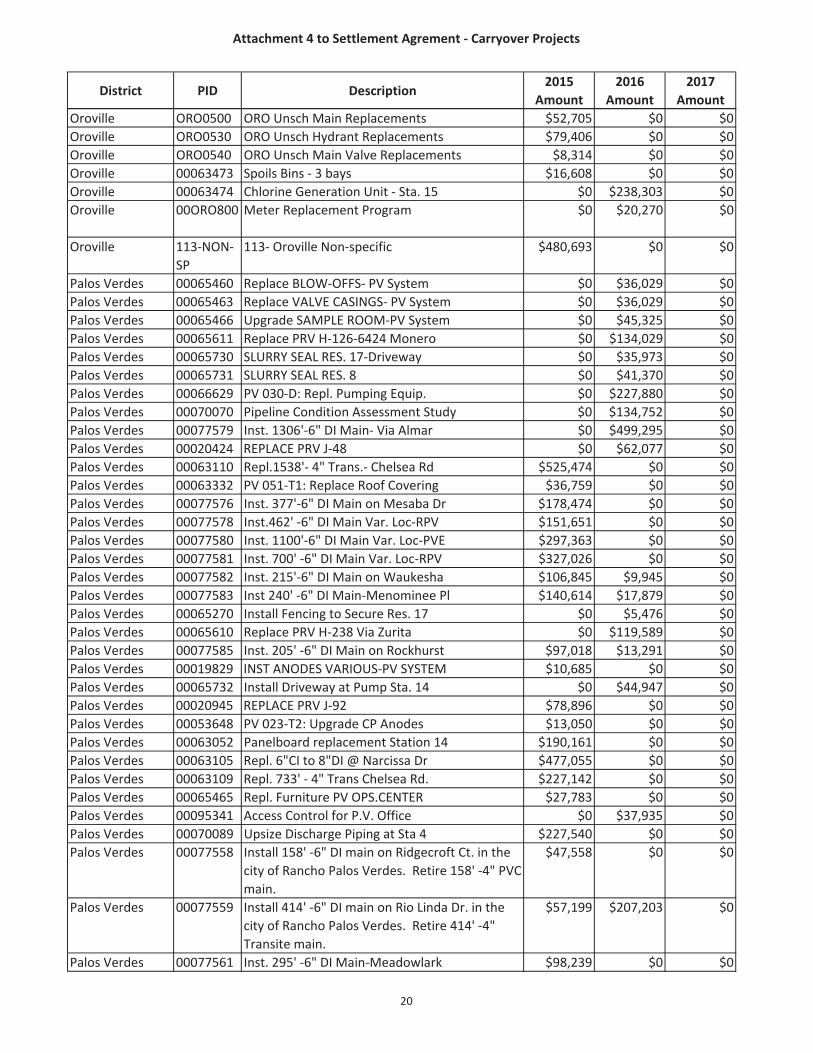
Attachment 4 to Settlement Agrement - Carryover Projects
District PID Description2015
Amount2016
Amount2017
AmountOroville ORO0500 ORO Unsch Main Replacements $52,705 $0 $0Oroville ORO0530 ORO Unsch Hydrant Replacements $79,406 $0 $0Oroville ORO0540 ORO Unsch Main Valve Replacements $8,314 $0 $0Oroville 00063473 Spoils Bins - 3 bays $16,608 $0 $0Oroville 00063474 Chlorine Generation Unit - Sta. 15 $0 $238,303 $0Oroville 00ORO800 Meter Replacement Program $0 $20,270 $0
Oroville 113-NON-SP
113- Oroville Non-specific $480,693 $0 $0
Palos Verdes 00065460 Replace BLOW-OFFS- PV System $0 $36,029 $0Palos Verdes 00065463 Replace VALVE CASINGS- PV System $0 $36,029 $0Palos Verdes 00065466 Upgrade SAMPLE ROOM-PV System $0 $45,325 $0Palos Verdes 00065611 Replace PRV H-126-6424 Monero $0 $134,029 $0Palos Verdes 00065730 SLURRY SEAL RES. 17-Driveway $0 $35,973 $0Palos Verdes 00065731 SLURRY SEAL RES. 8 $0 $41,370 $0Palos Verdes 00066629 PV 030-D: Repl. Pumping Equip. $0 $227,880 $0Palos Verdes 00070070 Pipeline Condition Assessment Study $0 $134,752 $0Palos Verdes 00077579 Inst. 1306'-6" DI Main- Via Almar $0 $499,295 $0Palos Verdes 00020424 REPLACE PRV J-48 $0 $62,077 $0Palos Verdes 00063110 Repl.1538'- 4" Trans.- Chelsea Rd $525,474 $0 $0Palos Verdes 00063332 PV 051-T1: Replace Roof Covering $36,759 $0 $0Palos Verdes 00077576 Inst. 377'-6" DI Main on Mesaba Dr $178,474 $0 $0Palos Verdes 00077578 Inst.462' -6" DI Main Var. Loc-RPV $151,651 $0 $0Palos Verdes 00077580 Inst. 1100'-6" DI Main Var. Loc-PVE $297,363 $0 $0Palos Verdes 00077581 Inst. 700' -6" DI Main Var. Loc-RPV $327,026 $0 $0Palos Verdes 00077582 Inst. 215'-6" DI Main on Waukesha $106,845 $9,945 $0Palos Verdes 00077583 Inst 240' -6" DI Main-Menominee Pl $140,614 $17,879 $0Palos Verdes 00065270 Install Fencing to Secure Res. 17 $0 $5,476 $0Palos Verdes 00065610 Replace PRV H-238 Via Zurita $0 $119,589 $0Palos Verdes 00077585 Inst. 205' -6" DI Main on Rockhurst $97,018 $13,291 $0Palos Verdes 00019829 INST ANODES VARIOUS-PV SYSTEM $10,685 $0 $0Palos Verdes 00065732 Install Driveway at Pump Sta. 14 $0 $44,947 $0Palos Verdes 00020945 REPLACE PRV J-92 $78,896 $0 $0Palos Verdes 00053648 PV 023-T2: Upgrade CP Anodes $13,050 $0 $0Palos Verdes 00063052 Panelboard replacement Station 14 $190,161 $0 $0Palos Verdes 00063105 Repl. 6"CI to 8"DI @ Narcissa Dr $477,055 $0 $0Palos Verdes 00063109 Repl. 733' - 4" Trans Chelsea Rd. $227,142 $0 $0Palos Verdes 00065465 Repl. Furniture PV OPS.CENTER $27,783 $0 $0Palos Verdes 00095341 Access Control for P.V. Office $0 $37,935 $0Palos Verdes 00070089 Upsize Discharge Piping at Sta 4 $227,540 $0 $0Palos Verdes 00077558 Install 158' -6" DI main on Ridgecroft Ct. in the
city of Rancho Palos Verdes. Retire 158' -4" PVC main.
$47,558 $0 $0
Palos Verdes 00077559 Install 414' -6" DI main on Rio Linda Dr. in the city of Rancho Palos Verdes. Retire 414' -4" Transite main.
$57,199 $207,203 $0
Palos Verdes 00077561 Inst. 295' -6" DI Main-Meadowlark $98,239 $0 $0
20

Attachment 4 to Settlement Agrement - Carryover Projects
District PID Description2015
Amount2016
Amount2017
AmountPalos Verdes 00077573 Inst. 1500'-6" DI Main-Var. Loc-PVE $606,156 $2,794 $0Palos Verdes 00077574 Install 230' -6" DI main on Azores Place in the
city of Rancho Palos Verdes. Retire 230' -4" AC main.
$124,161 $0 $0
Palos Verdes 00077575 Install 250' -6" DI main on Circlet Drive in the city of Rancho Palos Verdes. Retire 250' -4" Transite main.
$117,224 $0 $0
Palos Verdes 00092422 R.H. Rd/Palominos Rancho Trl Main $166,701 $0 $0Palos Verdes 00100477 Replace 4" Service & 3" Meter $45,682 $0 $0Palos Verdes 00063068 Generator Station 15 $0 $0 $288,412Palos Verdes 00063358 Genset for Station 22 $0 $0 $936,309Palos Verdes 00077577 Inst. 200' -6" DI Main on Oconto Av $179,514 $0 $0Palos Verdes 00077584 Inst. 280' -6" DI Main-Via Encanto $115,471 $0 $0Palos Verdes 00020064 PAVE BACK PARKING LOT PV YARD $0 $118,466 $0Palos Verdes 122-NON-
SPNon-Specific Projects $761,738 $0 $0
Palos Verdes PVD0900 Meter Replacement Program $60,683 $0 $0Palos Verdes 00020911 UPGRADE FIRE HYDRANTS $125 $0 $0Palos Verdes 00065609 Replace PRV A-69-Crownview Dr $3,117 $0 $0Palos Verdes 00065729 SLURRY SEAL RES. 20 $4,578 $0 $0Rancho Dominguez
00061472 Replace Floor - Locker Room & Bathrooms $0 $26,857 $0
Rancho Dominguez
00061514 Replace Kitchen Floor - Main Office $0 $5,689 $0
Rancho Dominguez
00061960 Office - 8 Additional Lockers - Locker Room $0 $6,812 $0
Rancho Dominguez
00061973 Office - Rotary File Cabinets - Operations $0 $38,923 $0
Rancho Dominguez
00061413 Existing furniture is 15 years old and needs to be replaced.
$3,952 $0 $0
Rancho Dominguez
00066751 Security @ Dominguez Office $0 $75,205 $0
Rancho Dominguez
00094949 Purchase 2-Conductivity Meters $1,479 $0 $0
Rancho Dominguez
00096561 Purchase 4 Hach 900 $5,785 $0 $0
Rancho Dominguez
00096686 Purchase Power Broom-DOM $3,738 $0 $0
Rancho Dominguez
00096735 Upgrade to Phase I EVR gasoline T $9,127 $0 $0
Rancho Dominguez
00099977 Puchase 8 Radios for Vehicles $17,974 $0 $0
Rancho Dominguez
00NON-SP RDOM - Non-specific $34,096 $0 $0
Redwood Valley 00064941 Vehicle - 0.5 Ton Pick Up with Accessories $43,724 $0 $0Redwood Valley RDV0900 Meter Replacement Program -$88 $0 $0
21
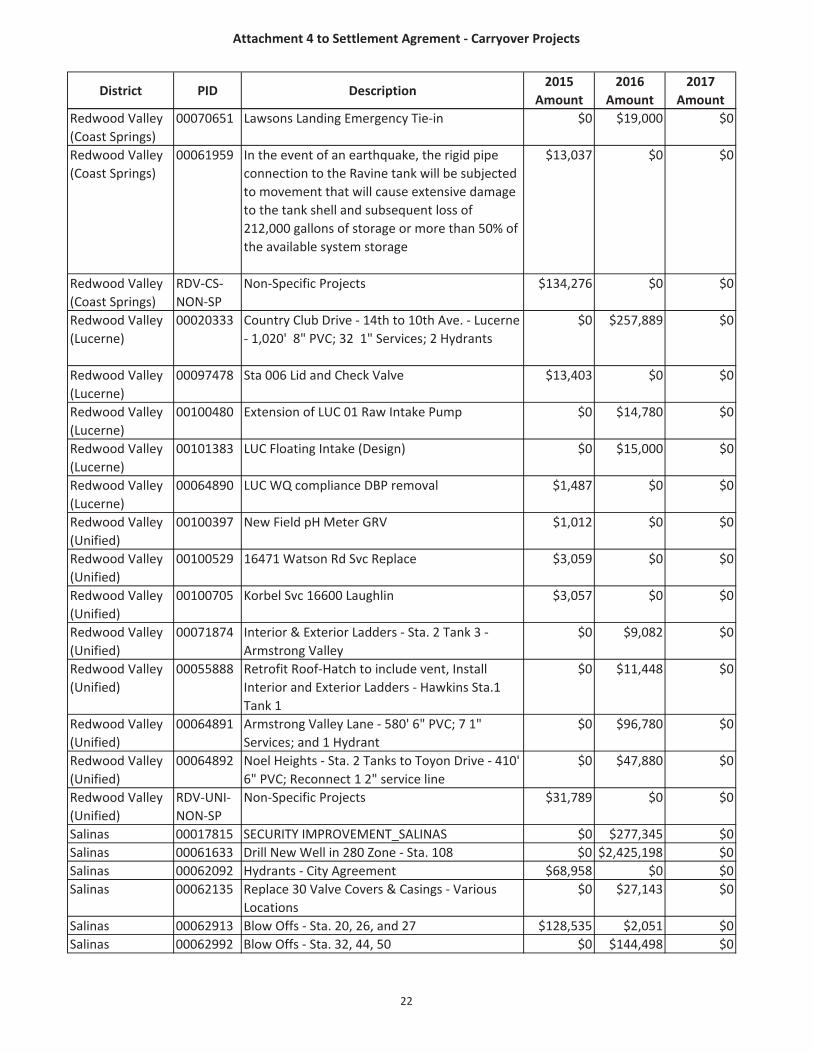
Attachment 4 to Settlement Agrement - Carryover Projects
District PID Description2015
Amount2016
Amount2017
AmountRedwood Valley (Coast Springs)
00070651 Lawsons Landing Emergency Tie-in $0 $19,000 $0
Redwood Valley (Coast Springs)
00061959 In the event of an earthquake, the rigid pipe connection to the Ravine tank will be subjected to movement that will cause extensive damage to the tank shell and subsequent loss of 212,000 gallons of storage or more than 50% of the available system storage
$13,037 $0 $0
Redwood Valley (Coast Springs)
RDV-CS-NON-SP
Non-Specific Projects $134,276 $0 $0
Redwood Valley (Lucerne)
00020333 Country Club Drive - 14th to 10th Ave. - Lucerne - 1,020' 8" PVC; 32 1" Services; 2 Hydrants
$0 $257,889 $0
Redwood Valley (Lucerne)
00097478 Sta 006 Lid and Check Valve $13,403 $0 $0
Redwood Valley (Lucerne)
00100480 Extension of LUC 01 Raw Intake Pump $0 $14,780 $0
Redwood Valley (Lucerne)
00101383 LUC Floating Intake (Design) $0 $15,000 $0
Redwood Valley (Lucerne)
00064890 LUC WQ compliance DBP removal $1,487 $0 $0
Redwood Valley (Unified)
00100397 New Field pH Meter GRV $1,012 $0 $0
Redwood Valley (Unified)
00100529 16471 Watson Rd Svc Replace $3,059 $0 $0
Redwood Valley (Unified)
00100705 Korbel Svc 16600 Laughlin $3,057 $0 $0
Redwood Valley (Unified)
00071874 Interior & Exterior Ladders - Sta. 2 Tank 3 - Armstrong Valley
$0 $9,082 $0
Redwood Valley (Unified)
00055888 Retrofit Roof-Hatch to include vent, Install Interior and Exterior Ladders - Hawkins Sta.1 Tank 1
$0 $11,448 $0
Redwood Valley (Unified)
00064891 Armstrong Valley Lane - 580' 6" PVC; 7 1" Services; and 1 Hydrant
$0 $96,780 $0
Redwood Valley (Unified)
00064892 Noel Heights - Sta. 2 Tanks to Toyon Drive - 410' 6" PVC; Reconnect 1 2" service line
$0 $47,880 $0
Redwood Valley (Unified)
RDV-UNI-NON-SP
Non-Specific Projects $31,789 $0 $0
Salinas 00017815 SECURITY IMPROVEMENT_SALINAS $0 $277,345 $0Salinas 00061633 Drill New Well in 280 Zone - Sta. 108 $0 $2,425,198 $0Salinas 00062092 Hydrants - City Agreement $68,958 $0 $0Salinas 00062135 Replace 30 Valve Covers & Casings - Various
Locations$0 $27,143 $0
Salinas 00062913 Blow Offs - Sta. 20, 26, and 27 $128,535 $2,051 $0Salinas 00062992 Blow Offs - Sta. 32, 44, 50 $0 $144,498 $0
22

Attachment 4 to Settlement Agrement - Carryover Projects
District PID Description2015
Amount2016
Amount2017
AmountSalinas 00063032 Remodel Customer Service Center - including
Ergonomicaly Correct Work Stations$624,960 $0 $0
Salinas 00063092 1546' 8" PVC; 36 1" Services; 2 Hydrants - Riker Street
$551,512 $1,664 $0
Salinas 00063356 Break Room Remodel $0 $205,230 $0Salinas 00063858 2141' 8" PVC; 168 6" PVC; 67 1" Services; 3
Hydrants - Tyler StreetAbandon old 6" AC main.
$0 $677,158 $0
Salinas 00064061 Replace Pump Bowl - Sta. 63-01 $0 $22,834 $0Salinas 00064077 Replace Well Pumping Equipment & Well Level
Transducer - Sta. 26-01$0 $82,509 $0
Salinas 00064095 Pipeline Upgrade - Sta. 47 - Phase 1 $3,568,688 $0 $0Salinas 00064177 Pipeline Upgrade - Sta. 47 - Phase 2 $1,655,625 $0 $0Salinas 00064809 Discharge Treatment - Sta. 11 $0 $115,344 $0Salinas 00064930 Vehicle - 0.75 Ton Pick Up and Service Body -
Pump Operator$37,748 $0 $0
Salinas 00064931 Vehicle - New Vehicle & Accessories $0 $60,734 $0Salinas 00064932 Vehicle - 0.75 Ton Pick Up & Accessories -
Loc/Inspec.$0 $63,864 $0
Salinas 00065033 100K Gallon Storage Tank - Sta. 304 Los Lomas $0 $430,030 $0
Salinas 00065093 Vehicle - 0.75 Ton Pick Up and Outfitting - Service Person
$37,748 $0 $0
Salinas 00066889 25 Well Level Sensors - Sta. 6, 12, 13, 16, 17, 20, 21, 22, 23, 24, 25, 26, 27, 28, 29, 30, 31, 37, 38, 44, 50-1, 50-2, 56, 58, 63
$0 $0 $128,874
Salinas 00066890 7 Well Level Sensors - Sta. 64, 65, 67, 70, 71, 106, 201
$0 $36,084 $0
Salinas 00069429 Sta 70 - Tank 4 $0 $43,933 $0Salinas 00073813 Replace 10 Metering Pumps - Various Stations $0 $27,270 $0Salinas 00095759 Rplc Trimble GPS unit $15,449 $0 $0Salinas 00097342 Install VFD station 203 $0 $56,389 $0Salinas 00099757 Rplc SRVC at 1320 Padre dr $32,839 $0 $0Salinas 00099903 Install 6" D/S Monte Del Lago $55,937 $0 $0Salinas 00099984 Ipad for Distribution Dept. $762 $0 $0Salinas 00100025 Install 3 chemical tanks $1,856 $0 $0Salinas 00100077 Install CL2 analyzers $40,872 $364 $0Salinas 00100546 Replace chemical tanks sta 32 $1,315 $0 $0Salinas 00100567 Replace sample sites BUV $46,914 $0 $0Salinas 00100599 Tool box for storekeeper's tools $570 $0 $0Salinas 00100682 Purchase chemical transfer pump $631 $0 $0Salinas 114-NON-
SP114- Salinas Non-specific $3,140,103 $0 $0
Salinas SLN0900 Meter Replacement Program $240,423 $0 $0Salinas 0075493 Repl 6" Main on Pine Canyon Rd $245,595 $0 $0Salinas 00097581 Extension Projects $123,520 $0 $0Selma 00013822 GENSET @ STATION 20-01 $242,571 $0 $0
23

Attachment 4 to Settlement Agrement - Carryover Projects
District PID Description2015
Amount2016
Amount2017
AmountSelma 00063799 223 Conversions of Flat Rate Services to
Metered Services$239,517 $0 $0
Selma 00095835 UPS-APC SMX3000RMLV2UNC $2,771 $0 $0Selma 00096478 STAT 11 & 12 TRANSDUCER REPLACEMENT $2,540 $0 $0Selma 00099865 SEL 022-01: Replace Bowl Unit $28,700 $343 $0Selma 00064933 Vehicle - 0.5 Ton Pick Up & Accessories $0 $68,395 $0Selma 00096262 RADIO SYSTEM-MOTOROLA MOTO TRB 800- $0 $18,553 $0Selma 00102818 2015-Phase 2 - FTM. Additional 500
conversions to meet state mandated 32% water reduction requirement
$0 $377,647 $0
Selma 00062515 Replace Pump Equipment - Sta. 19-01 $0 $72,186 $0Selma 00090017 STAT 20 & 21 VIDEO SURVEILLANCE $0 $53,022 $0Selma 117-NON-
SP117- Selma Non-specific $629,803 $0 $0
Selma SEL0900 Meter Replacement Program $39,229 $0 $0Stockton 00016817 "B" STREET-DUCK CREEK TO RALPH $314,280 $0 $0Stockton 00019985 2 Sodium Hypo Chlorite Systems - Sta. 75-01 &
Sta. 21-01$23,825 $0 $0
Stockton 00019986 Sodium Hypo Chlorite System - Stations 71-01 & 16-01
$24,989 $0 $0
Stockton 00056708 Replace pump, motor, column:36-01 $93,519 $0 $0Stockton 00060772 Upgrade CP System - Sta. 32 Tank 3 $13,128 $0 $0Stockton 00063074 Convert Chlorination - Sta. 52 $49,107 $0 $0Stockton 00063093 Convert Chlorination - Sta. 62 $34,603 $0 $0Stockton 00063136 Convert Chlorination - Sta. 68-01 $53,883 $0 $0Stockton 00063257 Madison Street - Jefferson Street to Charter
Way - 1,100' 6" PVC. Retire 1,100' of 2" Wrought Iron pipe in same
$348,526 $0 $0
Stockton 00063259 Replace Air Release Valves - Sta. 52-01, 62-01, 67-01, 69-01 and 69-02
$29,054 $0 $0
Stockton 00063326 2,785' 6" PVC 900 - Harding Way, Elm St., Walnut St. and Columbia Ave. from Pershing Ave. to Yale Ave. Retire 1,450' 4" C.I.; 1,030' 6" C.I.; 625' 2" C.I.; 460' 2" Wrought Iron in backyard easements of same.
$1,105,394 $0 $0
Stockton 00063406 American Street - Miner Avenue to Park Street. Install 1,130' of 6" PVC C-900 pipe in American Street from Miner Avenue to Park Street. Retire 830' of 2" Wrought Iron pipe and 300' of 3" Cast Iron pipe in same.
$539,120 $0 $0
Stockton 00063416 Willow Street - San Juan Avenue to Carlton Avenue and Jewell Court. Install 1,050' of 6" PVC C-900 pipe in Willow Street from San Juan Avenue to Carlton Avenue; 60' in San Juan Avenue from Willow Street to Jewell Court and 540' in Jewell Court east from S
$454,881 $0 $0
24

Attachment 4 to Settlement Agrement - Carryover Projects
District PID Description2015
Amount2016
Amount2017
AmountStockton 00063453 Seventh Street - San Joaquin Street to American
Street and American Street from Sixth Street to Eighth Street. Install 1,200' of 8" PVC C-900 pipe in Seventh Street from San Joaquin Street to American Street and 900' in American Street from Sixth Street t
$548,720 $0 $0
Stockton 00063483 Ingram Street - El Dorado Street to Sutter Street - 1,200' 6" PVC; 8 New 1" short-side & 8 New 1" long-side services to eliminate split services. Retire 1,200' 6" Steel pipe in same.
$332,708 $0 $0
Stockton 00063500 Ash Street - Main St. to Alma St. - 680' 6" PVCRetire 680' of 2" Wrought Iron pipe in same.
$176,824 $0 $0
Stockton 00063575 Carpenter Road - Airport Way Frontage Road to Belleview Avenue - 1,150' 8" PVCRetire 1,150' of 6" Steel pipe in same. Phelps St., Volney St. and Belleview Ave. from Ralph Ave. to Carpenter Rd. - 2,850' 6" PVC.Retire 2,850' of 6" Steel pipe in same
$855,153 $164,650 $0
Stockton 00064174 Replace 4 Existing Sample Stations $27,503 $0 $0Stockton 00064295 Replace 4 Sample Stations $46,191 $0 $0Stockton 00064335 Replace 4 Sample Stations $29,181 $0 $0Stockton 00090241 STK 67 ELECTRICAL SVC UPGRADE $87,559 $0 $0Stockton 00096144 Sta. 63 - Chlorination Improvements $38,947 $0 $0Stockton 00096754 4" Dis. G.V. 1550 W. Freemont $2,131 $0 $0Stockton 00096839 Rep 8 TB Cradles in STK Vehicles $6,124 $0 $0Stockton 00096919 Replace STK60-01 150Hp Motor $22,687 $0 $0Stockton 00097693 Sta. 76 Fe/Mn Treatment Improvement $19,340 $0 $0Stockton 00097697 Sta. 18 Fe/Mn Treatment Improvement $16,122 $0 $0Stockton 00097801 2849 E Myrtle- 4" Service $18,003 $0 $0Stockton 00099599 Sta. 85 - Bladder Replacement $6,470 $0 $0Stockton 00099677 Field-Tool replacement $3,571 $0 $0Stockton 00099958 pH Meter - Operator $789 $0 $0Stockton 00100217 Sta. 21-01 Nitrate Analyzer $39,603 $0 $0Stockton 00100277 Op. Center Eyewash Stations $2,598 $0 $0Stockton 00061652 Replace Pump, Motor, & Column - Sta. 7-02 $0 $84,733 $0Stockton 00061772 Replace Pump and Column - Sta. 60-01 $0 $104,849 $0Stockton 00063153 Convert Chlorintation - Sta. 71-01 $0 $55,066 $0Stockton 00063475 Phelps Street, Volney Street & Belleview
Avenue - Michael Avenue to Ralph Avenue and Ralph Avenue from Airport Way frontage road to Belleview Avenue. Install 2,940' of 6" PVC C-900 pipe in Phelps Street, Volney Street and Belleview Avenue from Michael Ave
$865,101 -$183 $0
25
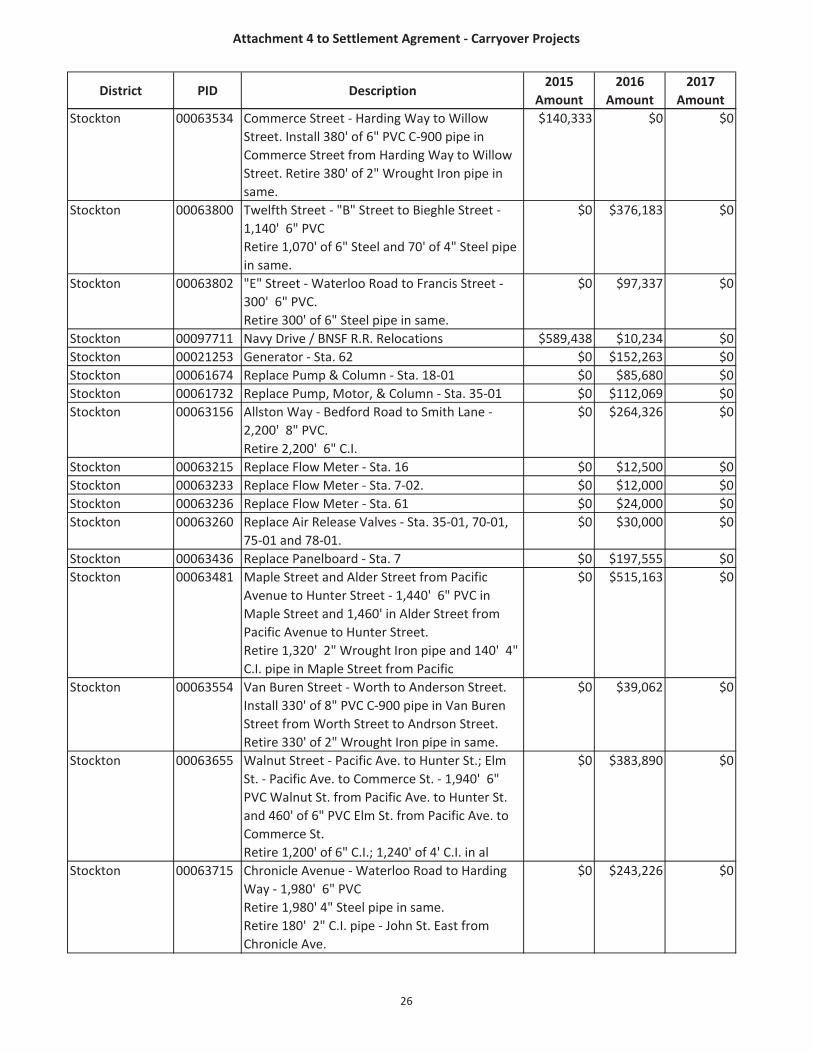
Attachment 4 to Settlement Agrement - Carryover Projects
District PID Description2015
Amount2016
Amount2017
AmountStockton 00063534 Commerce Street - Harding Way to Willow
Street. Install 380' of 6" PVC C-900 pipe in Commerce Street from Harding Way to Willow Street. Retire 380' of 2" Wrought Iron pipe in same.
$140,333 $0 $0
Stockton 00063800 Twelfth Street - "B" Street to Bieghle Street - 1,140' 6" PVCRetire 1,070' of 6" Steel and 70' of 4" Steel pipe in same.
$0 $376,183 $0
Stockton 00063802 "E" Street - Waterloo Road to Francis Street - 300' 6" PVC. Retire 300' of 6" Steel pipe in same.
$0 $97,337 $0
Stockton 00097711 Navy Drive / BNSF R.R. Relocations $589,438 $10,234 $0Stockton 00021253 Generator - Sta. 62 $0 $152,263 $0Stockton 00061674 Replace Pump & Column - Sta. 18-01 $0 $85,680 $0Stockton 00061732 Replace Pump, Motor, & Column - Sta. 35-01 $0 $112,069 $0Stockton 00063156 Allston Way - Bedford Road to Smith Lane -
2,200' 8" PVC. Retire 2,200' 6" C.I.
$0 $264,326 $0
Stockton 00063215 Replace Flow Meter - Sta. 16 $0 $12,500 $0Stockton 00063233 Replace Flow Meter - Sta. 7-02. $0 $12,000 $0Stockton 00063236 Replace Flow Meter - Sta. 61 $0 $24,000 $0Stockton 00063260 Replace Air Release Valves - Sta. 35-01, 70-01,
75-01 and 78-01.$0 $30,000 $0
Stockton 00063436 Replace Panelboard - Sta. 7 $0 $197,555 $0Stockton 00063481 Maple Street and Alder Street from Pacific
Avenue to Hunter Street - 1,440' 6" PVC in Maple Street and 1,460' in Alder Street from Pacific Avenue to Hunter Street. Retire 1,320' 2" Wrought Iron pipe and 140' 4" C.I. pipe in Maple Street from Pacific
$0 $515,163 $0
Stockton 00063554 Van Buren Street - Worth to Anderson Street. Install 330' of 8" PVC C-900 pipe in Van Buren Street from Worth Street to Andrson Street. Retire 330' of 2" Wrought Iron pipe in same.
$0 $39,062 $0
Stockton 00063655 Walnut Street - Pacific Ave. to Hunter St.; Elm St. - Pacific Ave. to Commerce St. - 1,940' 6" PVC Walnut St. from Pacific Ave. to Hunter St. and 460' of 6" PVC Elm St. from Pacific Ave. to Commerce St. Retire 1,200' of 6" C.I.; 1,240' of 4' C.I. in al
$0 $383,890 $0
Stockton 00063715 Chronicle Avenue - Waterloo Road to Harding Way - 1,980' 6" PVCRetire 1,980' 4" Steel pipe in same. Retire 180' 2" C.I. pipe - John St. East from Chronicle Ave.
$0 $243,226 $0
26

Attachment 4 to Settlement Agrement - Carryover Projects
District PID Description2015
Amount2016
Amount2017
AmountStockton 00063752 Bishop Street - Funston Avenue to Sanguinetti
Lane; Hiawatha Avenue - Bishop Street to Bradford Street - 1,700' 8" PVC in Bishop St. from Funston Ave. to Sanguinetti Lane.Retire 940' of 2" C.I. pipe and 760' of 4" Steel pipe in same. Install: 350' 6
$0 $224,872 $0
Stockton 00063795 Woodland Drive - West from Pershing Avenue - 1,800' 8" PVC Retire 1,800' of 8" Steel pipe in same.
$0 $203,992 $0
Stockton 00063873 Replace Panelboard - Sta. 16 $0 $194,794 $0Stockton 00063936 Panelboard Replacement - Sta. 61 $0 $313,308 $0Stockton 00064934 Vehicle - 0.5 Ton Pick Up with Accessories -
LOC/INSPEC$0 $42,000 $0
Stockton 00065094 Vehicle - 0.5 Ton Pick Up and Outfitting - General Superintendent
$0 $39,800 $0
Stockton 00065556 Replace Pumps and Panel Board - Sta. 32 $0 $499,182 $0Stockton 00067089 Replace obsolete data acquisition radio system:
33 remote radios, two-frequency redundant master, tank modification for antennas.
$0 $161,047 $0
Stockton 00093969 Independance Park Discharge Valve $0 $2,489 $0Stockton 00097692 Sta. 61 Fe/Mn Treatment Improvement $0 $8,374 $0Stockton 119-NON-
SP119- Stockton Non-specific $2,236,452 $0 $0
Stockton STK0900 Meter Replacement Program $210,239 $0 $0Stockton 00019799 MN TREATMENT AT STK-36-01 -$1,462 $0 $0Stockton 00063318 Eugenia, Della & Bieghle Alley $1,455 $0 $0Stockton 00064007 Replace Itron Handhelds -$3,586 $0 $0Stockton 00064935 REPLACE V208073 GEN SUPERINTENDENT $869 $0 $0Stockton 00011881 Extension Projects $25,763 $0 $0Visalia 00016782 Drill, Develop, & Equip New Well $2,221,474 $0 $0Visalia 00020998 Robin, Lark, & Orl. - 4,000' 8" PVC; 75 1"
Services; 7 Hydrants$761,867 $139,232 $0
Visalia 00051768 Paint Exterior Complete & Replace CP Anodes - Sta. 59 Tank 3
$14,682 $0 $0
Visalia 00062233 Replace Pump Equipment - Sta. 7-01 $0 $80,106 $0Visalia 00062235 Replace Pump Equipment - Sta. 50-01 $0 $83,480 $0Visalia 00062734 Replace Concrete Driveway - Sta. 16 $0 $12,305 $0Visalia 00062752 New Concrete Driveway - Sta. 23 $20,458 $0 $0Visalia 00062812 Replace Chemical Dosing Pumps $0 $7,454 $0Visalia 00062954 Pump Bowl Replacement - Sta. 94-01 $38,408 $0 $0Visalia 00063319 Giddings and Riggin Ave. - 1450' 12" D.I.; 1060'
8" PVC; 40 1" Services; 3 6" Hydrants $647,937 $0 $0
Visalia 00063407 Parking and Carport - Customer Center -$829 $41,070 $0
27

Attachment 4 to Settlement Agrement - Carryover Projects
District PID Description2015
Amount2016
Amount2017
AmountVisalia 00063613 Panelboard Replacement - Sta. 3 $0 $183,000 $0Visalia 00063635 Panelboard Replacement - Sta. 7 $0 $158,539 $0Visalia 00063639 Panelboard Replacement - Sta. 91 $0 $162,747 $0Visalia 00063653 Flowmeter Replacement - Sta. 37 $0 $24,721 $0Visalia 00063828 Flowmeter Replacement - Sta. 45 $0 $24,721 $0Visalia 00063843 Flowmeter Replacement - Sta. 48 $0 $25,751 $0Visalia 00063892 Flowmeter Replacement - Sta. 49 $0 $28,841 $0Visalia 00063901 Flowmeter Replacement - Sta. 50 $0 $26,781 $0Visalia 00063912 Flowmeter Replacement - Sta. 53 $0 $29,871 $0Visalia 00064937 Vehicle - 0.5 Ton Pick Up with Accessories -
Serviceman$0 $42,000 $0
Visalia 00064938 Vehicle - 0.5 Ton Pick Up with Accessories - Serviceman
$0 $42,000 $0
Visalia 00065095 Replace SUV V206007 $46,693 $0 $0Visalia 00065110 Replace V204091 0.5 ton inspector pu. $0 $41,381 $0Visalia 00100349 Visalia Parking Lot $31,836 $0 $0Visalia 00101037 VIS 56-01: Replace Pump Bowl $28,519 $0 $0Visalia 00101040 VIS 031-01 Pumping Equ Replacement $0 $32,512 $0Visalia 00101565 Mineral King Main Relocation $0 $1,571,313 $0Visalia 00101963 VIS 059-T3; Replace Rectifier $8,269 $0 $0Visalia 00101965 7625 W. Sunnyview $51,239 $0 $0Visalia 00102127 2611 N. Dinuba Bl. $39,314 $0 $0Visalia 120-NON-
SP120- Visalia Non-specific $2,136,591 $0 $0
Visalia VIS0900 Meter Replacement Program $120,097 $0 $0Visalia 00016934 Install Welded Tank at Mullen $9,737 $0 $0Visalia 00016938 Drill and Equip New Well $2,392 $0 $0Visalia 00087397 Extension Projects $165,300 $0 $0Visalia 00096521 Extension Projects $33,126 $0 $0Visalia 00092743 Extension Projects $43,968 $0 $0Westlake 00064053 Emergency Interconnection - Hillcrest and
Duesenberg - City of Thousand Oaks$0 $93,951 $0
Westlake 00064156 Solar Backup Power - Kanan Tank - Sta. 8 $67,115 $0 $0Westlake 00064500 Office Renovation $229,830 $0 $0Westlake 123-NON-
SP123- Westlake Non-specific $479,142 $0 $0
Westlake WLK0900 Meter Replacement Program $56,228 $0 $0Willows 00064711 Flat to Meter Conversion $27,614 $0 $0Willows 00062175 200 and 300 blocks of S Plumas St. - 960' 8"
PVC; 23 1" Services; 2 Hydrants$299,233 $0 $0
Willows 00098424 12" Main Replace - Cty Rd 53/Tehama $444,665 $0 $0Willows 00102120 Replace Sacramento St Main 2015 $294,242 $0 $0Willows 00101314 Willows Office Expansion $13,893 $0 $0Willows 121-NON-
SP121- Willows Non-specific $62,029 $0 $0
Willows WIL0900 Meter Replacement Program $14,996 $0 $0
28(END OF ATTACHMENT 4)

Attachment 5
SUMMARY OF ANNUAL DEPRECIATION RATES

Attachment 5 to Settlement Agreement - Depreciation Rates
ACCOUNTNO. D E S C R I P T I O N PLANT RATE COR RATE SALVAGE RATE TOTALWater Supply
103110 STRUCTURES AND IMPROVEMENTS 0.00% 0.00% 0.00% 0.00%103120 COLLECTING AND IMPOUNDING RESERVOIRS 0.00% 0.00% 0.00% 0.00%103130 LAKE, RIVER AND OTHER INTAKES 0.00% 0.00% 0.00% 0.00%103150 WELLS 2.85% 2.26% 0.00% 5.11%103160 SUPPLY MAINS 13.01% 0.06% -0.31% 12.76%
Pumping103210 STRUCTURES AND IMPROVEMENTS 3.36% 0.15% 0.00% 3.51%103240 PUMPING EQUIPMENT 6.16% 0.58% -0.11% 6.63%103241 SYSTEM CTRL COMPUTER EQUIP 6.16% 0.58% -0.11% 6.63%103250 OTHER PUMPING PLANT 0.00% 0.00% 0.00% 0.00%
Treatment103310 STRUCTURES AND IMPROVEMENTS 0.00% 0.00% 0.00% 0.00%103320 WATER TREATMENT EQUIPMENT 8.81% 1.53% -0.33% 10.01%
Transmission and Distribution103410 STRUCTURES AND IMPROVEMENTS 3.62% 0.17% 0.00% 3.79%103411 PAntelopeEMENT- TRANS & DIST PLANT 7.99% 0.00% 0.00% 7.99%103420 RESERVOIRS AND TANKS 5.26% 1.92% 0.00% 7.18%103421 TANK PAINTING 7.49% 0.00% 0.00% 7.49%103431 TRANSMISSION AND DISTRIBUTION MAINS 1.63% 0.30% 0.00% 1.93%103440 FIRE MAINS 0.00% 0.00% 0.00% 0.00%103450 SERVICES 1.89% 0.45% 0.00% 2.34%103460 METERS 7.34% 0.38% -0.13% 7.59%103480 HYDRANTS 1.70% 0.28% 0.00% 1.98%
General Plant103710 STRUCTURES AND IMPROVEMENTS 3.45% 0.15% 0.00% 3.60%103720 OFFICE FURNITURE AND EQUIPMENT 0.00% 0.00% 0.00% 0.00%103721 OFFICE EQUIPMENT - COMPUTERS 0.00% 0.00% 0.00% 0.00%103730 TRANSPORTATION 0.00% 0.00% 0.00% 0.00%103740 STORES EQUIPMENT 0.00% 0.00% 0.00% 0.00%103750 LABORATORY EQUIPMENT 0.00% 0.00% 0.00% 0.00%103760 COMMUNICATION EQUIPMENT 26.75% 0.00% 0.00% 26.75%103770 POWER OPERATED EQUIPMENT 0.00% 0.00% 0.00% 0.00%103780 TOOLS, SHOP AND GARAGE EQUIPMENT 7.04% 0.00% 0.00% 7.04%103790 OTHER GENERAL PLANT 0.00% 0.00% 0.00% 0.00%103900 OTHER TANGIBLE PLANT 0.00% 0.00% 0.00% 0.00%103910 UTILITY PLANT PURCHASED 0.00% 0.00% 0.00% 0.00%
ANTELOPE VALLEY DISTRICT2015 General Rate Case
WP9B2SUMMARY OF ANNUAL DEPRECIATION RATES, BY ACCOUNT
1

Attachment 5 to Settlement Agreement - Depreciation Rates
ACCOUNTNO. D E S C R I P T I O N PLANT RATE COR RATE SALVAGE RATE TOTALWater Supply
103110 STRUCTURES AND IMPROVEMENTS 2.18% 0.22% 0.00% 2.40%103120 COLLECTING AND IMPOUNDING RESERVOIRS 1.39% 0.28% 0.00% 1.67%103130 LAKE, RIVER AND OTHER INTAKES 0.00% 0.00% 0.00% 0.00%103150 WELLS 1.98% 2.62% 0.00% 4.60%103160 SUPPLY MAINS 1.54% 0.15% 0.00% 1.69%103163 STEEL - SUPPLY MAIN 1.54% 0.15% 0.00% 1.69%103164 All Other -Supply Mains 1.54% 0.15% 0.00% 1.69%
Pumping103210 STRUCTURES AND IMPROVEMENTS 3.36% 1.50% 0.00% 4.86%103211 Pavement - Pumping Plant 10.81% 0.00% 0.00% 10.81%103240 PUMPING EQUIPMENT 2.57% 0.29% 0.00% 2.86%103241 System Ctrl Computer Equipment 2.57% 0.29% 0.00% 2.86%103250 OTHER PUMPING PLANT 9.04% 0.00% 0.00% 9.04%
Treatment103310 STRUCTURES AND IMPROVEMENTS 1.83% 0.40% 0.00% 2.23%103320 WATER TREATMENT EQUIPMENT 2.54% 0.26% 0.00% 2.80%
Transmission and Distribution103410 STRUCTURES AND IMPROVEMENTS 1.93% 0.10% 0.00% 2.03%103411 Pavement - Trans & Dist Plant 2.90% 0.00% 0.00% 2.90%103420 RESERVOIRS AND TANKS 1.66% 0.38% 0.00% 2.04%103421 TANK PAINTING 9.98% 0.00% 0.00% 9.98%103431 TRANSMISSION AND DISTRIBUTION MAINS 1.77% 1.04% 0.00% 2.81%103440 FIRE MAINS 0.00% 0.00% 0.00% 0.00%103450 SERVICES 1.53% 2.61% 0.00% 4.14%103460 METERS 3.45% 0.00% -0.17% 3.28%103480 HYDRANTS 1.28% 0.94% 0.00% 2.22%
General Plant103710 STRUCTURES AND IMPROVEMENTS 3.37% 0.32% 0.00% 3.69%103711 DRIVEWAY PAVEMENT 5.15% 0.00% 0.00% 5.15%103720 OFFICE FURNITURE AND EQUIPMENT 4.42% 0.00% 0.00% 4.42%103721 OFFICE EQUIPMENT - COMPUTERS 5.58% 0.00% 0.00% 5.58%103722 COMPUTER SOFTWARE 9.16% 0.00% 0.00% 9.16%103730 TRANSPORTATION 6.99% 0.00% -1.60% 5.39%103740 STORES EQUIPMENT 4.28% 0.00% 0.00% 4.28%103750 LABORATORY EQUIPMENT 7.21% 0.00% 0.00% 7.21%103760 COMMUNICATION EQUIPMENT 2.39% 0.00% 0.00% 2.39%103770 POWER OPERATED EQUIPMENT 4.96% 0.00% -0.23% 4.73%103780 TOOLS, SHOP AND GARAGE EQUIPMENT 5.87% 0.00% 0.00% 5.87%103790 OTHER GENERAL PLANT 1.06% 0.00% 0.00% 1.06%103900 OTHER TANGIBLE PLANT 0.00% 0.00% 0.00% 0.00%103910 UTILITY PLANT PURCHASED 0.00% 0.00% 0.00% 0.00%
2015 General Rate CaseSUMMARY OF ANNUAL DEPRECIATION RATES, BY ACCOUNT
WP9B2
BAKERSFIELD DISTRICT
2

Attachment 5 to Settlement Agreement - Depreciation Rates
ACCOUNTNO. D E S C R I P T I O N PLANT RATECOR RATESALVAGE RATE TOTALWater Supply
103110 103110-Struct & Improve-Supply Plnt 0.00% 0.00% 0.00% 0.00%103120 103120-Collect & Impound Reservoirs 2.61% 1.44% 0.00% 4.05%103130 LAKE, RIVER AND OTHER INTAKES 0.00% 0.00% 0.00% 0.00%103150 103150-Wells-Supply Plant 2.27% 2.31% 0.00% 4.58%103160 103160-Supply Mains 1.48% 0.42% 0.00% 1.90%103164 103164-All Other -Supply Mains 0.00% 0.00% 0.00% 0.00%
Pumping103210 103210-Struct & Imp- Pumping Plant 4.36% 1.20% 0.00% 5.56%103211 103211-Pavement-Pumping Plant 7.86% 0.00% 0.00% 7.86%103240 103240-Pumping Equipment 2.51% 0.06% 0.00% 2.57%103241 103241-System Ctrl Computer Equip 0.00% 0.00% 0.00% 0.00%103250 103250-Other Pumping Plant 3.13% 0.12% 0.00% 3.25%
Treatment103310 STRUCTURES AND IMPROVEMENTS 2.15% 0.11% 0.00% 2.26%103320 WATER TREATMENT EQUIPMENT 1.74% 0.13% 0.00% 1.87%
Transmission and Distribution103410 STRUCTURES AND IMPROVEMENTS-tranmission and distribution 1.20% -0.04% 0.00% 1.16%103411 103411-Pavement-Trans & Dist Plant -1.77% 0.00% 0.00% -1.77%103420 RESERVOIRS AND TANKS 1.54% 1.47% 0.00% 3.01%103421 103421-Tank Painting 9.97% 0.00% 0.00% 9.97%103431 TRANSMISSION AND DISTRIBUTION MAINS 1.35% 0.90% 0.00% 2.25%103440 FIRE MAINS 0.00% 0.00% 0.00% 0.00%103450 103450-Services-Trans & Distr Mains 1.22% 3.24% 0.00% 4.46%103460 103460-Meters & Meter Boxes 3.40% 0.00% -0.46% 2.94%103480 103480-Hydrants-T & D Mains 1.39% 0.35% 0.00% 1.74%
General Plant103710 STRUCTURES AND IMPROVEMENTS-general plant 1.57% 0.59% 0.00% 2.16%103711 103711-Driveway Pavement-Gen Plant -12.37% 0.00% 0.00% -12.37%103720 OFFICE FURNITURE AND EQUIPMENT 2.26% 0.00% -0.38% 1.88%103721 OFFICE EQUIPMENT - COMPUTERS 9.57% 0.00% 0.00% 9.57%103722 103722-Computer Software 0.00% 0.00% 0.00% 0.00%103730 TRANSPORTATION 7.11% 0.00% -1.21% 5.90%103740 STORES EQUIPMENT 5.37% 0.00% 0.00% 5.37%103750 LABORATORY EQUIPMENT 7.10% 0.00% 0.00% 7.10%103760 COMMUNICATION EQUIPMENT 1.16% 0.00% 0.00% 1.16%103770 POWER OPERATED EQUIPMENT 3.64% 0.00% -1.91% 1.73%103780 TOOLS, SHOP AND GARAGE EQUIPMENT 4.50% 0.00% 0.00% 4.50%103790 OTHER GENERAL PLANT 4.18% 0.00% 0.00% 4.18%103900 OTHER TANGIBLE PLANT 0.00% 0.00% 0.00% 0.00%103910 UTILITY PLANT PURCHASED 0.00% 0.00% 0.00% 0.00%
BAYSHORE DISTRICT2015 General Rate Case
SUMMARY OF ANNUAL DEPRECIATION RATES, BY ACCOUNTWP9B2
3

Attachment 5 to Settlement Agreement - Depreciation Rates
ACCOUNTNO. D E S C R I P T I O N Plant Rate COR Rate Salvage Rate TotalWater Supply
103110 103110-Struct & Improve-Supply Plnt 1.78% 0.18% 0.00% 1.96%103120 103120-Collect & Impound Reservoirs 2.24% 1.69% 0.00% 3.93%103130 103130-Lake River & Other Intakes 0.00% 0.19% 0.00% 0.19%103150 103150-WELLS - Supply plant 2.82% 3.03% 0.00% 5.85%103160 103160-Supply Mains 1.02% 0.37% 0.00% 1.39%103164 103164-All Other -Supply Mains 0.00% 0.00% 0.00% 0.00%
Pumping103210 103210-Struct & Imp- Pumping Plant 2.54% 0.71% 0.00% 3.25%103211 103211-Pavement-Pumping Plant 2.41% 0.00% 0.00% 2.41%103240 103240-Pumping Equipment 2.28% 0.07% 0.00% 2.35%103241 103241-System Ctrl Computer Equip 0.00% 0.00% 0.00% 0.00%103250 103250-Other Pumping Plant 3.00% 0.10% 0.00% 3.10%
Treatment103310 103310-Struct & Improve-Treat Plant 1.41% 0.11% 0.00% 1.52%103320 103320-Water Treatment Equipment 2.30% 0.21% 0.00% 2.51%
Transmission and Distribution103410 103410-Struct & Imp-Trans&Dis Plnt 1.36% -0.05% 0.00% 1.31%103411 103411-Pavement-Trans & Dist Plant 4.83% 0.00% 0.00% 4.83%103420 103420-Reservoirs & Tanks 2.09% 1.28% 0.00% 3.37%103421 103421-Tank Painting 14.45% 0.00% 0.00% 14.45%103431 TRANSMISSION AND DISTRIBUTION MAINS 1.44% 0.67% 0.00% 2.11%103440 103440-FIRE MAINS 0.00% 0.00% 0.00% 0.00%103450 103450-Services-Trans & Distr Mains 1.58% 2.73% 0.00% 4.31%103460 103460-Meters & Meter Boxes 3.25% -0.10% -0.26% 2.89%103480 103480-Hydrants-T & D Mains 1.49% 0.27% 0.00% 1.76%
General Plant103710 103710-Struct & Improve Genl Plnt 1.26% 0.58% 0.00% 1.84%103711 103711-Driveway Pavement-Gen Plant -72.44% 0.00% 0.00% -72.44%103720 103720-Office Furn & Equip-Gen Plnt 4.33% 0.00% -0.12% 4.21%103721 103721-Office-Elec. Equip/Computers 7.32% 0.00% 0.00% 7.32%103722 103722-Computer Software 0.00% 0.00% 0.00% 0.00%103730 103730-Transportn Equip-Gen Plant 6.97% 0.00% -0.31% 6.66%103740 103740-Stores Equipment-Gen Plant 4.76% 0.00% 0.00% 4.76%103750 103750-Laboratory Equip-Gen Plant 2.89% 0.00% 0.00% 2.89%103760 103760-Communication Equip-Gen Plnt 2.22% 0.00% 0.00% 2.22%103770 103770-Pwr Operated Equip-Gen Plant 4.88% 0.00% -0.25% 4.63%103780 103780-Tools, Shop & Garage Equip 3.48% 0.00% 0.00% 3.48%103790 103790-Other General Plant 4.23% 0.00% 0.00% 4.23%103900 103900-Other Tangible Property 0.00% 0.00% 0.00% 0.00%103910 103910-Utility Plant Purchased 0.00% 0.00% 0.00% 0.00%
BEAR GULCH DISTRICT2015 General Rate Case
SUMMARY OF ANNUAL DEPRECIATION RATES, BY ACCOUNTWP9B2
4

Attachment 5 to Settlement Agreement - Depreciation Rates
ACCOUNTNO. D E S C R I P T I O N Plant Rate COR Rate Salvage Rate Total
103010 ORGANIZATION103020 FRANCHISES AND CONSENTS103030 103030-Other Intangible Plant103061 103061-Land103062 103062-Land Rights
Water Supply103110 103110-Struct & Improve-Supply Plnt 0.00% 0.00% 0.00% 0.00%103120 103120-Collect & Impound Reservoirs 1.31% 0.28% 0.00% 1.59%103130 LAKE, RIVER AND OTHER INTAKES 0.00% 0.00% 0.00% 0.00%103150 103150-Wells-Supply Plant 1.92% 2.29% 0.00% 4.21%103160 SUPPLY MAINS 0.00% 0.00% 0.00% 0.00%
Pumping103210 103210-Struct & Imp- Pumping Plant 3.15% 1.35% 0.00% 4.50%103211 103211-Pavement-Pumping Plant 11.97% 0.00% 0.00% 11.97%103240 103240-Pumping Equipment 2.46% 0.29% 0.00% 2.75%103241 103241-System Ctrl Computer Equip 2.46% 0.29% 0.00% 2.75%103250 103250-Other Pumping Plant 0.00% 0.00% 0.00% 0.00%
Treatment103310 103310-Struct & Improve-Treat Plant 2.06% 0.40% 0.00% 2.46%103320 103320-Water Treatment Equipment 2.95% 0.33% 0.00% 3.28%
Transmission and Distribution103410 103410-Struct & Imp-Trans&Dis Plnt 2.00% 0.10% 0.00% 2.10%103420 103420-Reservoirs & Tanks 1.72% 0.36% 0.00% 2.08%103421 103421-Tank Painting 6.32% 0.00% 0.00% 6.32%103431 TRANSMISSION AND DISTRIBUTION MAINS 1.79% 1.03% 0.00% 2.82%103440 FIRE MAINS 0.00% 0.00% 0.00% 0.00%103450 103450-Services-Trans & Distr Mains 1.59% 2.60% 0.00% 4.19%103460 103460-Meters & Meter Boxes 3.25% 0.00% -0.15% 3.10%103480 103480-Hydrants-T & D Mains 1.28% 0.94% 0.00% 2.22%
General Plant103710 103710-Struct & Improve Genl Plnt 3.10% 0.30% 0.00% 3.40%103711 103711-Driveway Pavement-Gen Plant 5.38% 0.00% 0.00% 5.38%103720 103720-Office Furn & Equip-Gen Plnt 5.00% 0.00% 0.00% 5.00%103721 103721-Office-Elec. Equip/Computers 8.58% 0.00% 0.00% 8.58%103722 103722-Computer Software 15.61% 0.00% 0.00% 15.61%103730 103730-Transportn Equip-Gen Plant 6.31% 0.00% -1.71% 4.60%103740 103740-Stores Equipment-Gen Plant 4.72% 0.00% 0.00% 4.72%103750 LABORATORY EQUIPMENT 0.00% 0.00% 0.00% 0.00%103760 103760-Communication Equip-Gen Plnt 2.17% 0.00% 0.00% 2.17%103770 103770-Pwr Operated Equip-Gen Plant 4.73% 0.00% -0.24% 4.49%103780 103780-Tools, Shop & Garage Equip 7.04% 0.00% -0.68% 6.36%103790 103790-Other General Plant 7.28% 0.00% 0.00% 7.28%103900 103900-Other Tangible Property 0.00% 0.00% 0.00% 0.00%103910 UTILITY PLANT PURCHASED 0.00% 0.00% 0.00% 0.00%
CHICO DISTRICT2015 General Rate Case
SUMMARY OF ANNUAL DEPRECIATION RATES, BY ACCOUNTWP9B2
5

Attachment 5 to Settlement Agreement - Depreciation Rates
ACCOUNTNO. D E S C R I P T I O N Plant Rate COR Rate Salvage Rate Total
103010 ORGANIZATION103020 FRANCHISES AND CONSENTS103030 103030-Other Intangible Plant103061 103061-Land103062 103062-Land Rights
Water Supply103110 STRUCTURES AND IMPROVEMENTS - Supply Plant 0.00% 0.00% 0.00% 0.00%103120 COLLECTING AND IMPOUNDING RESERVOIRS 0.00% 0.00% 0.00% 0.00%103130 LAKE, RIVER AND OTHER INTAKES 0.00% 0.00% 0.00% 0.00%103150 103150-Wells-Supply Plant 1.98% 2.11% 0.00% 4.09%103160 SUPPLY MAINS 0.00% 0.00% 0.00% 0.00%
Pumping103210 103210-Struct & Imp- Pumping Plant 2.98% 1.25% 0.00% 4.23%103211 103211-Pavement-Pumping Plant 7.36% 0.00% 0.00% 7.36%103240 103240-Pumping Equipment 2.70% 0.28% 0.00% 2.98%103241 103241-System Ctrl Computer Equip 2.70% 0.28% 0.00% 2.98%103250 OTHER PUMPING PLANT 0.00% 0.00% 0.00% 0.00%
Treatment103310 103310-Struct & Improve-Treat Plant 1.99% 0.40% 0.00% 2.39%103320 103320-Water Treatment Equipment 2.91% 0.33% 0.00% 3.24%
Transmission and Distribution103410 STRUCTURES AND IMPROVEMENTS-tranmission an 0.00% 0.00% 0.00% 0.00%103411 103411-Pavement-Trans & Dist Plant 10.79% 0.00% 0.00% 10.79%103420 103420-Reservoirs & Tanks 1.83% 0.36% 0.00% 2.19%103421 103421-Tank Painting 10.46% 0.00% 0.00% 10.46%103431 TRANSMISSION AND DISTRIBUTION MAINS 1.69% 0.88% 0.00% 2.57%103440 FIRE MAINS 0.00% 0.00% 0.00% 0.00%103450 103450-Services-Trans & Distr Mains 1.85% 2.61% 0.00% 4.46%103460 103460-Meters & Meter Boxes 3.67% 0.00% -0.17% 3.50%103480 103480-Hydrants-T & D Mains 1.27% 0.94% 0.00% 2.21%
General Plant103710 103710-Struct & Improve Genl Plnt 1.48% 0.28% 0.00% 1.76%103720 103720-Office Furn & Equip-Gen Plnt -23.48% 0.00% 0.00% -23.48%103721 103721-Office-Elec. Equip/Computers -53.47% 0.00% 0.00% -53.47%103722 103722-Computer Software 21.86% 0.00% 0.00% 21.86%103730 103730-Transportn Equip-Gen Plant 26.76% 0.00% -1.53% 25.23%103740 103740-Stores Equipment-Gen Plant 1.97% 0.00% 0.00% 1.97%103750 STORES EQUIPMENT 0.00% 0.00% 0.00% 0.00%103760 103760-Communication Equip-Gen Plnt -2.06% 0.00% 0.00% -2.06%103770 103770-Pwr Operated Equip-Gen Plant 3.58% 0.00% -0.23% 3.35%103780 103780-Tools, Shop & Garage Equip 4.49% 0.00% 0.00% 4.49%103790 TOOLS, SHOP AND GARAGE EQUIPMENT 0.00% 0.00% 0.00% 0.00%103900 103900-Other Tangible Property 0.00% 0.00% 0.00% 0.00%103910 OTHER TANGIBLE PLANT 0.00% 0.00% 0.00% 0.00%
DIXON DISTRICT2015 General Rate Case
SUMMARY OF ANNUAL DEPRECIATION RATES, BY ACCOUNTWP9B2
6

Attachment 5 to Settlement Agreement - Depreciation Rates
ACCOUNTNO. D E S C R I P T I O N Plant Rate COR Rate Salvage Rate TotalWater Supply
103110 STRUCTURES AND IMPROVEMENTS 2.10% 0.11% 0.00% 2.21%103120 COLLECTING AND IMPOUNDING RESERVOIR 0.00% 0.00% 0.00% 0.00%103130 LAKE, RIVER AND OTHER INTAKES 0.00% 0.00% 0.00% 0.00%103150 WELLS 2.82% 2.52% 0.00% 5.34%103160 SUPPLY MAINS 2.88% 0.06% -0.40% 2.54%
Pumping103210 STRUCTURES AND IMPROVEMENTS 3.13% 0.15% 0.00% 3.28%103211 PAVEMENT - PUMPING PLANT 7.94% 0.00% 0.00% 7.94%103240 PUMPING EQUIPMENT 3.05% 0.42% -0.14% 3.33%103241 SYSTEM CTRL COMPUTER EQUIP 3.05% 0.42% -0.14% 3.33%103250 OTHER PUMPING PLANT 4.74% -0.03% -0.03% 4.68%
Treatment103310 STRUCTURES AND IMPROVEMENTS 2.85% 0.15% 0.00% 3.00%103320 WATER TREATMENT EQUIPMENT 2.79% 0.53% -0.16% 3.16%
Transmission and Distribution103410 STRUCTURES AND IMPROVEMENTS 3.81% 0.17% 0.00% 3.98%103411 PAVEMENT - TRANS & DIST PLANT 10.33% 0.00% 0.00% 10.33%103420 RESERVOIRS AND TANKS 3.68% 1.52% 0.00% 5.20%103421 TANK PAINTING 9.06% 0.00% 0.00% 9.06%103431 TRANSMISSION AND DISTRIBUTION MAINS 1.44% 0.28% 0.00% 1.72%103440 FIRE MAINS 0.00% 0.00% 0.00% 0.00%103450 SERVICES 1.74% 0.44% 0.00% 2.18%103460 METERS 1.76% 0.07% -0.10% 1.73%103480 HYDRANTS 1.07% 0.31% 0.00% 1.38%
General Plant103710 STRUCTURES AND IMPROVEMENTS 3.39% 0.16% 0.00% 3.55%103720 OFFICE FURNITURE AND EQUIPMENT 8.51% 0.00% 0.00% 8.51%103721 OFFICE EQUIPMENT - COMPUTERS 8.51% 0.00% 0.00% 8.51%103730 TRANSPORTATION 0.00% 0.00% 0.00% 0.00%103740 STORES EQUIPMENT 0.00% 0.00% 0.00% 0.00%103750 LABORATORY EQUIPMENT 0.01% 0.00% 0.00% 0.01%103760 COMMUNICATION EQUIPMENT 5.84% 0.00% 0.00% 5.84%103770 POWER OPERATED EQUIPMENT 0.00% 0.00% 0.00% 0.00%103780 TOOLS, SHOP AND GARAGE EQUIPMENT 4.96% 0.00% 0.00% 4.96%103790 OTHER GENERAL PLANT -4.47% 0.00% 0.00% -4.47%103900 OTHER TANGIBLE PLANT 0.00% 0.00% 0.00% 0.00%103910 UTILITY PLANT PURCHASED 0.00% 0.00% 0.00% 0.00%
DOMINGUEZ SOUTH-BAY DISTRICT2015 General Rate Case
SUMMARY OF ANNUAL DEPRECIATION RATES, BY ACCOUNTWP9B2
7

Attachment 5 to Settlement Agreement - Depreciation Rates
ACCOUNTNO. D E S C R I P T I O N Plant Rate COR Rate Salvage Rate TotalWater Supply
103110 STRUCTURES AND IMPROVEMENTS 0.00% 0.00% 0.00% 0.00%103120 COLLECTING AND IMPOUNDING RESERVOIRS 0.00% 0.00% 0.00% 0.00%103130 LAKE, RIVER AND OTHER INTAKES 0.00% 0.00% 0.00% 0.00%103150 WELLS 3.06% 2.41% 0.00% 5.47%103160 SUPPLY MAINS 0.00% 0.00% 0.00% 0.00%
Pumping103210 STRUCTURES AND IMPROVEMENTS 2.92% 0.71% 0.00% 3.63%103211 PAVEMENT - PUMPING PLANT 8.72% 0.00% 0.00% 8.72%103240 PUMPING EQUIPMENT 2.61% 0.07% 0.00% 2.68%103241 SYSTEM CTRL COMPUTER EQUIP 2.61% 0.07% 0.00% 2.68%103250 OTHER PUMPING PLANT 0.00% 0.00% 0.00% 0.00%
Treatment103310 STRUCTURES AND IMPROVEMENTS 2.25% 0.11% 0.00% 2.36%103320 WATER TREATMENT EQUIPMENT 2.27% 0.15% 0.00% 2.42%
Transmission and Distribution103410 STRUCTURES AND IMPROVEMENTS 1.40% -0.02% 0.00% 1.38%103411 PAVEMENT- TRANS & DIST PLANT 5.98% 0.00% 0.00% 5.98%103420 RESERVOIRS AND TANKS 1.45% 1.13% 0.00% 2.58%103421 TANK PAINTING 7.32% 0.00% 0.00% 7.32%103431 TRANSMISSION AND DISTRIBUTION MAINS 1.58% 0.67% 0.00% 2.25%103440 FIRE MAINS 0.00% 0.00% 0.00% 0.00%103450 SERVICES 1.83% 2.72% 0.00% 4.55%103460 METERS 3.25% -0.09% -0.27% 2.89%103480 HYDRANTS 1.51% 0.25% 0.00% 1.76%
General Plant103710 STRUCTURES AND IMPROVEMENTS 2.09% 0.32% 0.00% 2.41%103711 DRIVEWAY PAVEMENT - general plant 7.48% 0.00% 0.00% 7.48%103720 OFFICE FURNITURE AND EQUIPMENT 4.32% 0.00% -0.12% 4.20%103721 OFFICE EQUIPMENT - COMPUTERS 8.93% 0.00% 0.00% 8.93%103722 COMPUTER SOFTWARE -3.40% 0.00% 0.00% -3.40%103730 TRANSPORTATION 10.30% 0.00% -0.61% 9.69%103731 HEAVY TRUCKS 10.30% 0.00% -0.61% 9.69%103740 STORES EQUIPMENT 5.85% 0.00% 0.00% 5.85%103750 LABORATORY EQUIPMENT 5.21% 0.00% 0.00% 5.21%103760 COMMUNICATION EQUIPMENT 1.89% 0.00% 0.00% 1.89%103770 POWER OPERATED EQUIPMENT 4.45% 0.00% -0.25% 4.20%103780 TOOLS, SHOP AND GARAGE EQUIPMENT 3.77% 0.00% 0.00% 3.77%103790 OTHER GENERAL PLANT 3.50% 0.00% 0.00% 3.50%103900 OTHER TANGIBLE PLANT 0.00% 0.00% 0.00% 0.00%103910 UTILITY PLANT PURCHASED 0.00% 0.00% 0.00% 0.00%
EAST LOS ANGELES DISTRICT2015 General Rate Case
SUMMARY OF ANNUAL DEPRECIATION RATES, BY ACCOUNTWP9B2
8

Attachment 5 to Settlement Agreement - Depreciation Rates
ACCOUNTNO. D E S C R I P T I O N Plant Rate COR Rate Salvage Rate TotalWater Supply
103110 STRUCTURES AND IMPROVEMENTS 0.00% 0.00% 0.00% 0.00%103120 COLLECTING AND IMPOUNDING RESERVOIRS 0.00% 0.00% 0.00% 0.00%103130 LAKE, RIVER AND OTHER INTAKES 0.00% 0.00% 0.00% 0.00%103150 WELLS 2.35% 2.39% 0.00% 4.74%103160 SUPPLY MAINS 0.00% 0.00% 0.00% 0.00%103164 ALL OTHER - SUPPLY MAINS 0.00% 0.00% 0.00% 0.00%
Pumping103210 STRUCTURES AND IMPROVEMENTS 4.91% 1.20% 0.00% 6.11%103211 PAVEMENT - PUMPING PLANT 7.35% 0.00% 0.00% 7.35%103240 PUMPING EQUIPMENT 2.44% 0.07% 0.00% 2.51%103241 SYSTEM CTRL COMPUTER EQUIP 2.44% 0.07% 0.00% 2.51%103250 OTHER PUMPING PLANT 3.10% 0.09% 0.00% 3.19%
Treatment103310 STRUCTURES AND IMPROVEMENTS 1.71% 0.11% 0.00% 1.82%103320 WATER TREATMENT EQUIPMENT 1.58% 0.13% 0.00% 1.71%
Transmission and Distribution103410 STRUCTURES AND IMPROVEMENTS 1.46% -0.04% 0.00% 1.42%103411 PAVEMENT - TRANS & DIST PLANT 6.14% 0.00% 0.00% 6.14%103420 RESERVOIRS AND TANKS 3.66% 1.97% 0.00% 5.63%103421 TANK PAINTING 8.68% 0.00% 0.00% 8.68%103431 TRANSMISSION AND DISTRIBUTION MAINS 1.58% 0.66% 0.00% 2.24%103440 FIRE MAINS 0.00% 0.00% 0.00% 0.00%103450 SERVICES 1.96% 2.73% 0.00% 4.69%103460 METERS 3.38% -0.12% -0.24% 3.02%103480 HYDRANTS 1.51% 0.24% 0.00% 1.75%
General Plant103710 STRUCTURES AND IMPROVEMENTS 3.98% 1.11% 0.00% 5.09%103711 DRIVEWAY PAVEMENT - general plant 11.07% 0.00% 0.00% 11.07%103720 OFFICE FURNITURE AND EQUIPMENT 5.11% 0.00% -0.13% 4.98%103721 OFFICE EQUIPMENT - COMPUTERS 11.75% 0.00% 0.00% 11.75%103730 TRANSPORTATION -81.86% 0.00% 2.40% -79.46%103740 STORES EQUIPMENT 2.82% 0.00% 0.00% 2.82%103750 LABORATORY EQUIPMENT 6.17% 0.00% 0.00% 6.17%103760 COMMUNICATION EQUIPMENT -0.52% 0.00% 0.00% -0.52%103770 POWER OPERATED EQUIPMENT 4.63% 0.00% -0.25% 4.38%103780 TOOLS, SHOP AND GARAGE EQUIPMENT 6.12% 0.00% 0.00% 6.12%103790 OTHER GENERAL PLANT 5.81% 0.00% 0.00% 5.81%103900 OTHER TANGIBLE PLANT 0.00% 0.00% 0.00% 0.00%103910 UTILITY PLANT PURCHASED 0.00% 0.00% 0.00% 0.00%
HERMOSA REDONDO DISTRICT2015 General Rate Case
SUMMARY OF ANNUAL DEPRECIATION RATES, BY ACCOUNTWP9B2
9

Attachment 5 to Settlement Agreement - Depreciation Rates
ACCOUNTNO. D E S C R I P T I O N PLANT RATE COR RATE SALVAGE RATE TOTALWater Supply
103110 STRUCTURES AND IMPROVEMENTS -5.68% 0.11% 0.01% -5.56%103120 COLLECTING AND IMPOUNDING RESERVOIRS 0.00% 0.00% 0.00% 0.00%103130 LAKE, RIVER AND OTHER INTAKES 3.14% 0.25% 0.00% 3.39%103150 WELLS 2.62% 2.45% 0.00% 5.07%103160 SUPPLY MAINS 2.03% 0.08% -0.05% 2.06%103164 ALL OTHER - Supply Mains 2.03% 0.08% -0.05% 2.06%
Pumping103210 STRUCTURES AND IMPROVEMENTS 3.26% 0.15% 0.00% 3.41%103240 PUMPING EQUIPMENT 3.49% 0.39% -0.10% 3.78%103250 OTHER PUMPING PLANT 4.09% -0.02% -0.02% 4.05%
Treatment103310 STRUCTURES AND IMPROVEMENTS 3.95% 0.15% 0.00% 4.10%103320 WATER TREATMENT EQUIPMENT 3.36% 0.51% -0.12% 3.75%
Transmission and Distribution103410 STRUCTURES AND IMPROVEMENTS 3.65% 0.17% 0.22% 4.04%103420 RESERVOIRS AND TANKS 3.22% 1.43% 0.01% 4.66%103421 TANK PAINTING 9.22% 0.00% 0.00% 9.22%103431 TRANSMISSION AND DISTRIBUTION MAINS 1.23% 0.00% 0.00% 1.23%103440 FIRE MAINS 0.00% 0.00% 0.00% 0.00%103450 SERVICES 0.70% 0.00% 0.00% 0.70%103460 METERS -4.40% 0.00% -0.15% -4.55%103480 HYDRANTS 0.57% 0.31% 0.00% 0.88%
General Plant103710 STRUCTURES AND IMPROVEMENTS 3.64% 0.16% 0.00% 3.80%103720 OFFICE FURNITURE AND EQUIPMENT 0.00% 0.00% 0.00% 0.00%103721 OFFICE EQUIPMENT - COMPUTERS 19.43% 0.00% 0.00% 19.43%103730 TRANSPORTATION 0.00% 0.00% 0.00% 0.00%103740 STORES EQUIPMENT 3.23% 0.00% 0.00% 3.23%103750 LABORATORY EQUIPMENT 12.35% 0.00% 0.00% 12.35%103760 COMMUNICATION EQUIPMENT 7.63% 0.00% 0.00% 7.63%103770 POWER OPERATED EQUIPMENT 10.16% 0.18% -0.91% 9.43%103780 TOOLS, SHOP AND GARAGE EQUIPMENT 7.04% 0.00% 0.00% 7.04%103790 OTHER GENERAL PLANT 6.27% 0.00% 0.00% 6.27%103900 OTHER TANGIBLE PLANT 0.00% 0.00% 0.00% 0.00%103910 UTILITY PLANT PURCHASED 0.00% 0.00% 0.00% 0.00%
*) Account Currently Fully Depreciated. Depreciation Rate Set to 0% Until Such Time That Significant Additions Are Recorded and/or Changes Occur to Book Reserve.
KERN RIVER VALLEY DISTRICT2015 General Rate Case
SUMMARY OF ANNUAL DEPRECIATION RATES, BY ACCOUNTWP9B2
10

Attachment 5 to Settlement Agreement - Depreciation Rates
ACCOUNT
NO. D E S C R I P T I O NPlant Rate
COR Rate
Salvage Rate Total
103010 103010-Organization103020 103020-Franchises and Consents103030 103030-Other Intangible Plant103061 103061-Land103062 103062-Land Rights
Water Supply103110 STRUCTURES AND IMPROVEMENTS 0.00% 0.00% 0.00% 0.00%103120 COLLECTING AND IMPOUNDING RESERVOIRS 0.00% 0.00% 0.00% 0.00%103130 LAKE, RIVER AND OTHER INTAKES 0.00% 0.00% 0.00% 0.00%103150 WELLS 2.01% 2.14% 0.00% 4.15%103160 SUPPLY MAINS 0.00% 0.00% 0.00% 0.00%
Pumping103210 STRUCTURES AND IMPROVEMENTS 3.27% 1.30% 0.00% 4.57%103240 PUMPING EQUIPMENT 2.86% 0.28% 0.00% 3.14%103241 SYSTEM CONTROL COMP EQUIPMENT 2.86% 0.28% 0.00% 3.14%103250 OTHER PUMPING PLANT 0.00% 0.00% 0.00% 0.00%
Treatment103310 STRUCTURES AND IMPROVEMENTS 0.00% 0.00% 0.00% 0.00%103320 WATER TREATMENT EQUIPMENT 3.55% 0.36% 0.00% 3.91%
Transmission and Distribution103410 STRUCTURES AND IMPROVEMENTS 0.00% 0.00% 0.00% 0.00%103420 RESERVOIRS AND TANKS 1.77% 0.36% 0.00% 2.13%103421 TANK PAINTING 8.39% 0.00% 0.00% 8.39%103431 TRANSMISSION AND DISTRIBUTION MAINS 1.98% 1.01% 0.00% 2.99%103440 FIRE MAINS 0.00% 0.00% 0.00% 0.00%103450 SERVICES 1.82% 2.60% 0.00% 4.42%103460 METERS 3.65% 0.00% -0.17% 3.48%103480 HYDRANTS 1.32% 0.94% 0.00% 2.26%
General Plant103710 STRUCTURES AND IMPROVEMENTS 1.92% 0.31% 0.00% 2.23%103720 OFFICE FURNITURE AND EQUIPMENT -4.55% 0.00% 0.00% -4.55%103721 OFFICE EQUIPMENT - COMPUTERS -47.35% 0.00% 0.00% -47.35%103730 TRANSPORTATION 8.58% 0.00% -1.74% 6.84%103740 STORES EQUIPMENT 4.10% 0.00% 0.00% 4.10%103750 LABORATORY EQUIPMENT 6.71% 0.00% 0.00% 6.71%103760 COMMUNICATION EQUIPMENT 0.17% 0.00% 0.00% 0.17%103770 POWER OPERATED EQUIPMENT 0.00% 0.00% 0.00% 0.00%103780 TOOLS, SHOP AND GARAGE EQUIPMENT 3.14% 0.00% 0.00% 3.14%103790 OTHER GENERAL PLANT 0.00% 0.00% 0.00% 0.00%103900 OTHER TANGIBLE PLANT 0.00% 0.00% 0.00% 0.00%103910 UTILITY PLANT PURCHASED 0.00% 0.00% 0.00% 0.00%
KING CITY DISTRICT2015 General Rate Case
SUMMARY OF ANNUAL DEPRECIATION RATES, BY ACCOUNTWP9B2
11

Attachment 5 to Settlement Agreement - Depreciation Rates
ACCOUNTNO. D E S C R I P T I O N Plant Rate COR Rate Salvage Rate Total
103010 ORGANIZATION103020 FRANCHISES AND CONSENTS103030 103030-Other Intangible Plant103061 103061-Land103062 103062-Land Rights
Water Supply103110 STRUCTURES AND IMPROVEMENTS - Supply Plant 0.00%103120 103120-Collect & Impound Reservoirs 0.00%103130 LAKE, RIVER AND OTHER INTAKES 0.00%103150 103150-Wells-Supply Plant 2.72% 2.50% 5.22%103160 103160-Supply Mains 0.00%
Pumping103210 103210-Struct & Imp- Pumping Plant 3.36% 0.79% 4.15%103211 103211-Pavement-Pumping Plant 8.17% 8.17%103240 103240-Pumping Equipment 2.55% 0.07% 2.62%103241 103241-System Ctrl Computer Equip 0.00%103250 OTHER PUMPING PLANT 0.00%
Treatment103310 103310-Struct & Improve-Treat Plant 2.25% 0.11% 2.36%103320 103320-Water Treatment Equipment 2.34% 0.12% 2.46%
Transmission and Distribution103410 103410-Struct & Imp-Trans&Dis Plnt 1.44% -0.01% 1.43%103411 103411-Pavement-Trans & Dist Plant 6.94% 6.94%103420 103420-Reservoirs & Tanks 2.63% 1.27% 3.90%103421 103421-Tank Painting 8.86% 8.86%103431 Transmission & Distribution Mains 1.48% 0.66% 2.14%103450 103450-Services-Trans & Distr Mains -9.04% 13.46% 4.42%103460 103460-Meters & Meter Boxes 3.22% -0.07% -0.33% 2.82%103480 103480-Hydrants-T & D Mains 1.57% 0.26% 1.83%
General Plant103710 103710-Struct & Improve Genl Plnt 2.34% 0.48% 2.82%103711 103711-Driveway Pavement-Gen Plant -27.00% -27.00%103720 103720-Office Furn & Equip-Gen Plnt 0.74% -0.12% 0.62%103721 103721-Office-Elec. Equip/Computers -16.13% -16.13%103722 103722-Computer Software 0.00%103730 103730-Transportn Equip-Gen Plant 8.76% -0.45% 8.31%103740 103740-Stores Equipment-Gen Plant 5.61% 5.61%103750 103750-Laboratory Equip-Gen Plant 5.61% 5.61%103760 103760-Communication Equip-Gen Plnt 2.28% 2.28%103770 103770-Pwr Operated Equip-Gen Plant 3.39% -0.25% 3.14%103780 103780-Tools, Shop & Garage Equip 4.43% 4.43%103790 103790-Other General Plant 3.55% 3.55%103900 103900-Other Tangible Property 0.00%
LIVERMORE DISTRICT2015 General Rate Case
SUMMARY OF ANNUAL DEPRECIATION RATES, BY ACCOUNTWP9B2
12

Attachment 5 to Settlement Agreement - Depreciation Rates
ACCOUNTNO. D E S C R I P T I O N Plant Rate COR Rate Salvage Rate Total
103010 103010-Organization103020 103020-Franchises and Consents103030 103030-Other Intangible Plant103061 103061-Land103062 103062-Land Rights
Water Supply103110 103110-Struct & Improve-Supply Plnt 1.77% 0.18% 0.00% 1.95%103120 103120-Collect & Impound Reservoirs 5.12% 2.85% 0.00% 7.97%103130 LAKE, RIVER AND OTHER INTAKES 0.00% 0.00% 0.00% 0.00%103150 103150-Wells-Supply Plant 2.66% 2.49% 0.00% 5.15%103160 103160-Supply Mains 0.01% 0.25% 0.00% 0.26%
Pumping103210 103210-Struct & Imp- Pumping Plant 3.34% 0.83% 0.00% 4.17%103211 103211-Pavement-Pumping Plant 7.44% 0.00% 0.00% 7.44%103240 103240-Pumping Equipment 2.67% 0.07% 0.00% 2.74%103241 103241-System Ctrl Computer Equip 2.67% 0.07% 0.00% 2.74%103250 103250-Other Pumping Plant 3.02% 0.10% 0.00% 3.12%
Treatment103310 103310-Struct & Improve-Treat Plant 2.21% 0.11% 0.00% 2.32%103320 103320-Water Treatment Equipment 2.08% 0.12% 0.00% 2.20%
Transmission and Distribution103410 103410-Struct & Imp-Trans&Dis Plnt 1.37% -0.03% 0.00% 1.34%103411 103411-Pavement-Trans & Dist Plant 5.50% 0.00% 0.00% 5.50%103420 103420-Reservoirs & Tanks 1.78% 1.12% 0.00% 2.90%103421 103421-Tank Painting 9.66% 0.00% 0.00% 9.66%103431 TRANSMISSION AND DISTRIBUTION MAINS 1.56% 0.67% 0.00% 2.23%103440 FIRE MAINS 0.00% 0.00% 0.00% 0.00%103450 103450-Services-Trans & Distr Mains 1.72% 2.74% 0.00% 4.46%103460 103460-Meters & Meter Boxes 3.47% -0.11% -0.28% 3.08%103480 103480-Hydrants-T & D Mains 1.54% 0.26% 0.00% 1.80%
General Plant103710 103710-Struct & Improve Genl Plnt 1.99% 0.41% 0.00% 2.40%103720 103720-Office Furn & Equip-Gen Plnt 6.20% 0.00% -0.14% 6.06%103721 103721-Office-Elec. Equip/Computers 18.69% 0.00% 0.00% 18.69%103722 103722-Computer Software 6.20% 0.00% -0.14% 6.06%103730 103730-Transportn Equip-Gen Plant 10.08% 0.00% -0.12% 9.96%103740 103740-Stores Equipment-Gen Plant 5.51% 0.00% 0.00% 5.51%103750 103750-Laboratory Equip-Gen Plant 5.08% 0.00% 0.00% 5.08%103760 103760-Communication Equip-Gen Plnt 2.67% 0.00% 0.00% 2.67%103770 103770-Pwr Operated Equip-Gen Plant 1.87% 0.00% -0.25% 1.62%103780 103780-Tools, Shop & Garage Equip 4.50% 0.00% 0.00% 4.50%103790 103790-Other General Plant 7.04% 0.00% 0.00% 7.04%103900 103900-Other Tangible Property 0.00% 0.00% 0.00% 0.00%103910 UTILITY PLANT PURCHASED 0.00% 0.00% 0.00% 0.00%103920 103920-Utility Plant Sold 0.00% 0.00% 0.00% 0.00%
LOS ALTOS DISTRICT2015 General Rate Case
SUMMARY OF ANNUAL DEPRECIATION RATES, BY ACCOUNTWP9B2
13

Attachment 5 to Settlement Agreement - Depreciation Rates
ACCOUNTNO. D E S C R I P T I O N Plant Rate MVR Rate Salvage Rate Total
103010 103010-Organization103020 103020-Franchises and MVnsents103030 103030-Other Intangible Plant103061 103061-Land103062 103062-Land Rights
Water Supply103110 103110-Struct & Improve-Supply Plnt 0.00% 0.00% 0.00% 0.00%103120 103120-Collect & Impound Reservoirs 0.00% 0.00% 0.00% 0.00%103130 LAKE, RIVER AND OTHER INTAKES 0.00% 0.00% 0.00% 0.00%103150 103150-Wells-Supply Plant 3.24% 2.94% 0.00% 6.18%103160 103160-Supply Mains 0.00% 0.00% 0.00% 0.00%
Pumping103210 103210-Struct & Imp- Pumping Plant 12.42% 4.48% 0.00% 16.90%103211 103211-Pavement-Pumping Plant 9.48% 0.00% 0.00% 9.48%103240 103240-Pumping Equipment 2.59% 0.28% 0.00% 2.87%103241 103241-System Ctrl Computer Equip 2.59% 0.28% 0.00% 2.87%103250 103250-Other Pumping Plant 0.00% 0.00% 0.00% 0.00%
Treatment103310 103310-Struct & Improve-Treat Plant 1.49% 0.41% 0.00% 1.90%103320 103320-Water Treatment Equipment 2.91% 0.29% 0.00% 3.20%
Transmission and Distribution103410 103410-Struct & Imp-Trans&Dis Plnt 2.18% 0.10% 0.00% 2.28%103420 103420-Reservoirs & Tanks 1.21% 0.42% 0.00% 1.63%103421 103421-Tank Painting 8.59% 0.00% 0.00% 8.59%103431 TRANSMISSION AND DISTRIBUTION MAINS 1.96% 1.09% 0.00% 3.05%103440 FIRE MAINS 0.00% 0.00% 0.00% 0.00%103450 103450-Services-Trans & Distr Mains 1.62% 2.61% 0.00% 4.23%103460 103460-Meters & Meter Boxes 2.71% 0.00% -0.14% 2.57%103480 103480-Hydrants-T & D Mains 1.32% 0.94% 0.00% 2.26%
General Plant103710 103710-Struct & Improve Genl Plnt 3.08% 0.30% 0.00% 3.38%103711 103711-Driveway Pavement-Gen Plant 5.15% 0.00% 0.00% 5.15%103720 103720-Office Furn & Equip-Gen Plnt 5.43% 0.00% 0.00% 5.43%103721 103721-Office-Elec. Equip/Computers 7.46% 0.00% 0.00% 7.46%103722 103722-Computer Software 0.00% 0.00% 0.00% 0.00%103730 103730-Transportn Equip-Gen Plant 8.06% 0.00% -1.60% 6.46%103740 103740-Stores Equipment-Gen Plant 0.00% 0.00% 0.00% 0.00%103750 103750-Laboratory Equip-Gen Plant 6.48% 0.00% 0.00% 6.48%103760 103760-Communication Equip-Gen Plnt 0.59% 0.00% 0.00% 0.59%103770 103770-Pwr Operated Equip-Gen Plant 4.83% 0.00% -0.23% 4.60%103780 103780-Tools, Shop & Garage Equip 5.47% 0.00% 0.00% 5.47%103790 103790-Other General Plant 0.00% 0.00% 0.00% 0.00%103900 103900-Other Tangible Property 0.00% 0.00% 0.00% 0.00%103910 UTILITY PLANT PURCHASED 0.00% 0.00% 0.00% 0.00%
MARYSVILLE DISTRICT2015 General Rate Case
SUMMARY OF ANNUAL DEPRECIATION RATES, BY ACCOUNTWP9B2
14

Attachment 5 to Settlement Agreement - Depreciation Rates
ACCOUNTNO. D E S C R I P T I O N Plant Rate COR Rate Salvage Rate Total
103010 103010-Organization103020 103020-Franchises and Consents103030 103030-Other Intangible Plant103061 103061-Land103062 103062-Land Rights
Water Supply103110 103110-Struct & Improve-Supply Plnt 2.23% 0.22% 0.00% 2.45%103120 103120-Collect & Impound Reservoirs 1.79% 0.39% 0.00% 2.18%103130 LAKE, RIVER AND OTHER INTAKES 1.41% 0.25% 0.00% 1.66%103150 103150-Wells-Supply Plant 2.49% 5.53% 0.00% 8.02%103160 103160-Supply Mains 1.22% 0.15% 0.00% 1.37%103163 103163-Steel- Supply Main 0.00%103164 103164-All Other -Supply Mains 0.00%
Pumping103210 103210-Struct & Imp- Pumping Plant 2.20% 1.17% 0.00% 3.37%103211 103211-Pavement-Pumping Plant 7.10% 0.00% 0.00% 7.10%103240 103240-Pumping Equipment 2.66% 0.28% 0.00% 2.94%103241 103241-System Ctrl Computer Equip 2.66% 0.28% 0.00% 2.94%103250 103250-Other Pumping Plant 0.00% 0.00% 0.00% 0.00%
Treatment103310 103310-Struct & Improve-Treat Plant 1.61% 0.41% 0.00% 2.02%103320 103320-Water Treatment Equipment 3.81% 0.30% 0.00% 4.11%
Transmission and Distribution103410 103410-Struct & Imp-Trans&Dis Plnt 1.18% 0.10% 0.00% 1.28%103411 103411-Pavement-Trans & Dist Plant 6.22% 0.00% 0.00% 6.22%103420 103420-Reservoirs & Tanks 1.99% 0.47% 0.00% 2.46%103421 103421-Tank Painting 8.45% 0.00% 0.00% 8.45%103431 TRANSMISSION AND DISTRIBUTION MAINS 1.95% 1.06% 0.00% 3.01%103440 FIRE MAINS 0.00% 0.00% 0.00% 0.00%103450 103450-Services-Trans & Distr Mains 1.63% 2.61% 0.00% 4.24%103460 103460-Meters & Meter Boxes 3.34% 0.00% -0.16% 3.18%103480 103480-Hydrants-T & D Mains 1.29% 0.94% 0.00% 2.23%
General Plant103710 103710-Struct & Improve Genl Plnt 1.92% 0.31% 0.00% 2.23%103711 103711-Driveway Pavement-Gen Plant 1.13% 0.00% 0.00% 1.13%103720 103720-Office Furn & Equip-Gen Plnt 5.29% 0.00% 0.00% 5.29%103721 103721-Office-Elec. Equip/Computers 8.70% 0.00% 0.00% 8.70%103730 103730-Transportn Equip-Gen Plant 7.42% 0.00% -1.57% 5.85%103740 103740-Stores Equipment-Gen Plant 4.05% 0.00% 0.00% 4.05%103750 103750-Laboratory Equip-Gen Plant 7.00% 0.00% 0.00% 7.00%103760 103760-Communication Equip-Gen Plnt -0.21% 0.00% 0.00% -0.21%103770 103770-Pwr Operated Equip-Gen Plant 4.31% 0.00% -0.23% 4.08%103780 103780-Tools, Shop & Garage Equip 4.70% 0.00% 0.00% 4.70%103790 103790-Other General Plant 4.92% -0.02% 0.00% 4.90%103900 103900-Other Tangible Property 0.00% 0.00% 0.00% 0.00%103910 UTILITY PLANT PURCHASED 0.00% 0.00% 0.00% 0.00%
CIAC 2014 3.38%2015 3.37%
OROVILLE DISTRICT2015 General Rate Case
SUMMARY OF ANNUAL DEPRECIATION RATES, BY ACCOUNTWP9B2
15

Attachment 5 to Settlement Agreement - Depreciation Rates
ACCOUNTNO. D E S C R I P T I O N Plant Rate COR Rate Salvage Rate TotalWater Supply
103110 STRUCTURES AND IMPROVEMENTS 0.00% 0.00% 0.00% 0.00%103120 COLLECTING AND IMPOUNDING RESERVOIRS 0.00% 0.00% 0.00% 0.00%103130 LAKE, RIVER AND OTHER INTAKES 0.00% 0.00% 0.00% 0.00%103150 WELLS 0.00% 0.00% 0.00% 0.00%103160 SUPPLY MAINS 1.77% 0.27% 0.00% 2.04%103164 ALL OTHER - SUPPLY MAINS 1.77% 0.27% 0.00% 2.04%
Pumping103210 STRUCTURES AND IMPROVEMENTS 2.53% 0.75% 0.00% 3.28%103211 PAVEMENT - PUMPING PLANT 6.72% 0.00% 0.00% 6.72%103240 PUMPING EQUIPMENT 2.62% 0.07% 0.00% 2.69%103241 SYSTEM CTRL COMPUTER EQUIP 2.62% 0.07% 0.00% 2.69%103250 OTHER PUMPING PLANT 2.79% 0.05% 0.00% 2.84%
Treatment103310 STRUCTURES AND IMPROVEMENTS 0.85% 0.11% 0.00% 0.96%103320 WATER TREATMENT EQUIPMENT -0.23% 0.12% 0.00% -0.11%
Transmission and Distribution103410 STRUCTURES AND IMPROVEMENTS 0.99% -0.13% 0.00% 0.86%103411 PAVEMENT - TRANS & DIST PLANT -46.41% 0.00% 0.00% -46.41%103420 RESERVOIRS AND TANKS 1.65% 1.04% 0.00% 2.69%103421 TANK PAINTING 21.47% 0.00% 0.00% 21.47%103431 TRANSMISSION AND DISTRIBUTION MAINS 1.57% 0.66% 0.00% 2.23%103440 FIRE MAINS 0.00% 0.00% 0.00% 0.00%103450 SERVICES 1.84% 2.68% 0.00% 4.52%103460 METERS 3.25% -0.12% -0.30% 2.83%103480 HYDRANTS 1.43% 0.24% 0.00% 1.67%
General Plant103710 STRUCTURES AND IMPROVEMENTS 2.82% 0.47% 0.00% 3.29%103711 DRIVEWAY PAVEMENT 7.24% 0.00% 0.00% 7.24%103720 OFFICE FURNITURE AND EQUIPMENT 3.85% 0.00% -0.13% 3.72%103721 OFFICE EQUIPMENT - COMPUTERS 8.51% 0.00% 0.00% 8.51%103730 TRANSPORTATION -108.42% 0.00% 2.11% -106.31%103740 STORES EQUIPMENT 2.50% 0.00% 0.00% 2.50%103750 LABORATORY EQUIPMENT 4.58% 0.00% 0.00% 4.58%103760 COMMUNICATION EQUIPMENT 2.37% 0.00% 0.00% 2.37%103770 POWER OPERATED EQUIPMENT 3.95% 0.00% -0.23% 3.72%103780 TOOLS, SHOP AND GARAGE EQUIPMENT 5.41% 0.00% 0.00% 5.41%103790 OTHER GENERAL PLANT 3.84% 0.00% 0.00% 3.84%103900 OTHER TANGIBLE PLANT 0.00% 0.00% 0.00% 0.00%103910 UTILITY PLANT PURCHASED 0.00% 0.00% 0.00% 0.00%
PALOS VERDES DISTRICT2015 General Rate Case
SUMMARY OF ANNUAL DEPRECIATION RATES, BY ACCOUNTWP9B2
16

Attachment 5 to Settlement Agreement - Depreciation Rates
ACCOUNTNO. D E S C R I P T I O N PLANT COR SALVAGE TotalWater Supply
103110 STRUCTURES AND IMPROVEMENTS 0.00% 0.00% 0.00% 0.00%103120 COLLECTING AND IMPOUNDING RESERVOIRS 0.00% 0.00% 0.00% 0.00%103130 LAKE, RIVER AND OTHER INTAKES 0.00% 0.00% 0.00% 0.00%103150 WELLS 0.00% 0.00% 0.00% 0.00%103160 SUPPLY MAINS 0.00% 0.00% 0.00% 0.00%
Pumping103210 STRUCTURES AND IMPROVEMENTS 0.00% 0.00% 0.00% 0.00%103240 PUMPING EQUIPMENT 2.83% 0.08% -0.02% 2.89%103241 SYSTEM CTRL COMPUTER EQUIP 2.83% 0.08% -0.02% 2.89%103250 OTHER PUMPING PLANT 0.00% 0.00% 0.00% 0.00%
Treatment103310 STRUCTURES AND IMPROVEMENTS 0.00% 0.00% 0.00% 0.00%103320 WATER TREATMENT EQUIPMENT 0.00% 0.00% 0.00% 0.00%
Transmission and Distribution103410 STRUCTURES AND IMPROVEMENTS 0.00% 0.00% 0.00% 0.00%103420 RESERVOIRS AND TANKS 0.00% 0.00% 0.00% 0.00%103431 TRANSMISSION AND DISTRIBUTION MAINS 0.00% 0.00% 0.00% 0.00%103440 FIRE MAINS 0.00% 0.00% 0.00% 0.00%103450 SERVICES 0.00% 0.00% 0.00% 0.00%103460 METERS 0.00% 0.00% 0.00% 0.00%103480 HYDRANTS 0.00% 0.00% 0.00% 0.00%
General Plant103710 STRUCTURES AND IMPROVEMENTS 2.80% 0.42% -0.03% 3.19%103711 DRIVEWAY PAVEMENT 7.00% 0.00% 0.00% 7.00%103720 OFFICE FURNITURE AND EQUIPMENT 5.23% 0.00% -0.15% 5.08%103721 OFFICE EQUIPMENT - COMPUTERS 12.32% 0.00% 0.00% 12.32%103730 TRANSPORTATION 16.15% 0.00% -0.35% 15.80%103740 STORES EQUIPMENT 4.44% 0.00% 0.00% 4.44%103750 LABORATORY EQUIPMENT 0.00% 0.00% 0.00% 0.00%103760 COMMUNICATION EQUIPMENT 4.60% 0.00% 0.00% 4.60%103770 POWER OPERATED EQUIPMENT 5.20% 0.00% -0.25% 4.95%103780 TOOLS, SHOP AND GARAGE EQUIPMENT 4.36% 0.00% 0.00% 4.36%103790 OTHER GENERAL PLANT 5.78% 0.00% 0.00% 5.78%103900 OTHER TANGIBLE PLANT 0.00% 0.00% 0.00% 0.00%103910 UTILITY PLANT PURCHASED 0.00% 0.00% 0.00% 0.00%
RANCHO DOMINGUEZ2015 GENERAL RATE CASE
SUMMARY OF ANNUAL DEPRECIATION RATES, BY ACCOUNT(AT PROPOSED DEPRECIATION RATES)
DEPRECIATION RATES
17

Attachment 5 to Settlement Agreement - Depreciation Rates
ACCOUNTNO. D E S C R I P T I O N PLANT RATE COR RATE SALVAGE RATE TOTALWater Supply
103110 STRUCTURES AND IMPROVEMENTS 1.01% 0.11% 0.00% 1.12%103120 COLLECTING AND IMPOUNDING RESERVOIRS 0.00% 0.00% 0.00% 0.00%103130 LAKE, RIVER AND OTHER INTAKES 0.00% 0.00% 0.00% 0.00%103150 WELLS 2.99% 2.33% 0.00% 5.32%103160 SUPPLY MAINS 0.64% 0.08% -0.06% 0.66%103164 103164-All Other -Supply Mains 0.00% 0.00% 0.00% 0.00%
Pumping103210 STRUCTURES AND IMPROVEMENTS 3.18% 0.15% 0.00% 3.33%103211 103211-Pavement-Pumping Plant 0.00% 0.00% 0.00% 0.00%103240 PUMPING EQUIPMENT 3.08% 0.39% -0.09% 3.38%103241 103241-System Ctrl Computer Equip 0.00% 0.00% 0.00% 0.00%103250 OTHER PUMPING PLANT 0.00% 0.00% 0.00% 0.00%
Treatment103310 STRUCTURES AND IMPROVEMENTS 3.41% 0.15% 0.00% 3.56%103320 WATER TREATMENT EQUIPMENT 2.87% 0.50% -0.08% 3.29%
Transmission and Distribution103410 STRUCTURES AND IMPROVEMENTS 3.39% 0.17% 0.00% 3.56%103411 Pavement-Trans & Dist Plant 0.00% 0.00% 0.00% 0.00%103420 RESERVOIRS AND TANKS 2.74% 1.28% 0.00% 4.02%103421 TANK PAINTING 13.24% 0.00% 0.00% 13.24%103431 TRANSMISSION AND DISTRIBUTION MAINS 1.68% 0.35% 0.00% 2.03%103440 FIRE MAINS 0.00% 0.00% 0.00% 0.00%103450 SERVICES 1.73% 0.45% 0.00% 2.18%103460 METERS 0.96% 0.04% -0.17% 0.83%103480 HYDRANTS 1.19% 0.29% 0.00% 1.48%
General Plant103710 STRUCTURES AND IMPROVEMENTS 0.00% 0.00% 0.00% 0.00%103711 103711-Driveway Pavement-Gen Plant 0.00% 0.00% 0.00% 0.00%103720 OFFICE FURNITURE AND EQUIPMENT 0.00% 0.00% 0.00% 0.00%103722 103722-Computer Software 0.00% 0.00% 0.00% 0.00%103721 OFFICE EQUIPMENT - COMPUTERS 0.00% 0.00% 0.00% 0.00%103730 TRANSPORTATION 0.00% 0.00% 0.00% 0.00%103740 STORES EQUIPMENT 0.00% 0.00% 0.00% 0.00%103750 LABORATORY EQUIPMENT 10.54% 0.00% 0.00% 10.54%103760 COMMUNICATION EQUIPMENT 0.00% 0.00% 0.00% 0.00%103770 POWER OPERATED EQUIPMENT 0.00% 0.00% 0.00% 0.00%103780 TOOLS, SHOP AND GARAGE EQUIPMENT 1.08% 0.00% 0.00% 1.08%103790 OTHER GENERAL PLANT 0.00% 0.00% 0.00% 0.00%103900 OTHER TANGIBLE PLANT 0.00% 0.00% 0.00% 0.00%103910 UTILITY PLANT PURCHASED 0.00% 0.00% 0.00% 0.00%
REDWOOD - COAST SPRINGS2015 GENERAL RATE CASE
SUMMARY OF ANNUAL DEPRECIATION RATES, BY ACCOUNT(AT PROPOSED DEPRECIATION RATES)
18

Attachment 5 to Settlement Agreement - Depreciation Rates
ACCOUNTNO. D E S C R I P T I O N PLANT RATE COR RATE SALVAGE RATE TOTALWater Supply
103110 STRUCTURES AND IMPROVEMENTS 1.79% 0.11% 0.00% 1.90%103120 COLLECTING AND IMPOUNDING RESERVOIRS 0.00% 0.00% 0.00% 0.00%103130 LAKE, RIVER AND OTHER INTAKES 0.00% 0.00% 0.00% 0.00%103150 WELLS 2.82% 2.48% 0.00% 5.30%103160 SUPPLY MAINS 0.00% 0.00% 0.00% 0.00%103164 103164-All Other -Supply Mains 0.00% 0.00% 0.00% 0.00%
Pumping103210 STRUCTURES AND IMPROVEMENTS -5.21% 0.15% 0.00% -5.06%103211 PAVEMENT - PUMPING PLANT 9.67% 0.00% 0.00% 9.67%103240 PUMPING EQUIPMENT 3.43% 0.38% -0.09% 3.72%103241 OTHER PUMPING PLANT 0.00% 0.00% 0.00% 0.00%103250 OTHER PUMPING PLANT 0.00% 0.00% 0.00% 0.00%
Treatment103310 STRUCTURES AND IMPROVEMENTS 2.84% 0.15% 0.00% 2.99%103320 WATER TREATMENT EQUIPMENT 3.66% 0.55% -0.04% 4.17%
Transmission and Distribution103410 STRUCTURES AND IMPROVEMENTS 0.00% 0.00% 0.00% 0.00%103411 103411-Pavement-Trans & Dist Plant 0.00% 0.00% 0.00% 0.00%103420 RESERVOIRS AND TANKS 2.90% 1.30% 0.00% 4.20%103421 TANK PAINTING 9.02% 0.00% 0.00% 9.02%103431 TRANSMISSION AND DISTRIBUTION MAINS 0.00% 0.00% 0.00% 0.00%103440 FIRE MAINS 0.00% 0.00% 0.00% 0.00%103450 SERVICES 1.57% 0.45% 0.00% 2.02%103460 METERS 0.43% 0.04% -0.10% 0.37%103480 HYDRANTS 1.38% 0.29% 0.00% 1.67%
General Plant103710 STRUCTURES AND IMPROVEMENTS 2.32% 0.15% 0.00% 2.47%103711 103711-Driveway Pavement-Gen Plant 0.00% 0.00% 0.00% 0.00%103720 OFFICE FURNITURE AND EQUIPMENT 0.00% 0.00% 0.00% 0.00%103721 OFFICE EQUIPMENT - COMPUTERS 32.17% 0.00% 0.00% 32.17%103722 103722-Computer Software 0.00% 0.00% 0.00% 0.00%103730 TRANSPORTATION 0.00% 0.00% 0.00% 0.00%103740 STORES EQUIPMENT 0.00% 0.00% 0.00% 0.00%103750 LABORATORY EQUIPMENT 9.82% 0.00% 0.00% 9.82%103760 COMMUNICATION EQUIPMENT 0.00% 0.00% 0.00% 0.00%103770 POWER OPERATED EQUIPMENT 0.00% 0.00% 0.00% 0.00%103780 TOOLS, SHOP AND GARAGE EQUIPMENT 5.33% 0.00% 0.00% 5.33%103790 OTHER GENERAL PLANT 0.00% 0.00% 0.00% 0.00%103900 OTHER TANGIBLE PLANT 0.00% 0.00% 0.00% 0.00%103910 UTILITY PLANT PURCHASED 0.00% 0.00% 0.00% 0.00%
REDWOOD - LUCERNE2015 GENERAL RATE CASE
SUMMARY OF ANNUAL DEPRECIATION RATES, BY ACCOUNT(AT PROPOSED DEPRECIATION RATES)
19

Attachment 5 to Settlement Agreement - Depreciation Rates
ACCOUNTNO. D E S C R I P T I O N PLANT RATE COR RATE SALVAGE RATE TOTALWater Supply
103110 STRUCTURES AND IMPROVEMENTS 0.81% 0.10% 0.00% 0.91%103120 COLLECTING AND IMPOUNDING RESERVOIRS 0.00% 0.00% 0.00% 0.00%103130 LAKE, RIVER AND OTHER INTAKES 0.00% 0.00% 0.00% 0.00%103150 WELLS 6.32% 4.61% 0.00% 10.93%103160 SUPPLY MAINS 4.22% 0.12% -0.04% 4.30%103164 ALL OTHER - SUPPLY MAINS 0.00% 0.00% 0.00% 0.00%
Pumping103210 STRUCTURES AND IMPROVEMENTS 3.91% 0.19% 0.00% 4.10%103211 PAVEMENT - PUMPING PLANT 0.00% 0.00% 0.00% 0.00%103240 PUMPING EQUIPMENT 5.36% 0.46% -0.04% 5.78%103241 SYSTEM CTRL COMPUTER EQUIP 0.00% 0.00% 0.00% 0.00%103250 OTHER PUMPING PLANT 0.00% 0.00% 0.00% 0.00%
Treatment103310 STRUCTURES AND IMPROVEMENTS 0.00% 0.00% 0.00% 0.00%103320 WATER TREATMENT EQUIPMENT 4.34% 0.84% -0.11% 5.07%
Transmission and Distribution103410 STRUCTURES AND IMPROVEMENTS 0.00% 0.00% 0.00% 0.00%103411 103411-Pavement-Trans & Dist Plant 0.00% 0.00% 0.00% 0.00%103420 RESERVOIRS AND TANKS 3.65% 1.27% 0.00% 4.92%103421 TANK PAINTING 0.00% 0.00% 0.00% 0.00%103431 TRANSMISSION AND DISTRIBUTION MAINS 1.57% 0.32% 0.00% 1.89%103440 FIRE MAINS 0.00% 0.00% 0.00% 0.00%103450 SERVICES 2.18% 0.00% 0.00% 2.18%103460 METERS 0.29% 0.00% -0.15% 0.14%103480 HYDRANTS 1.38% 0.31% 0.00% 1.69%
General Plant103710 STRUCTURES AND IMPROVEMENTS 0.95% 0.06% 0.00% 1.01%103711 103711-Driveway Pavement-Gen Plant 0.00% 0.00% 0.00% 0.00%103720 OFFICE FURNITURE AND EQUIPMENT 0.00% 0.00% 0.00% 0.00%103721 OFFICE EQUIPMENT - COMPUTERS 20.10% 0.00% 0.00% 20.10%103722 103722-Computer Software 0.00% 0.00% 0.00% 0.00%103730 TRANSPORTATION 0.00% 0.00% 0.00% 0.00%103740 STORES EQUIPMENT 0.00% 0.00% 0.00% 0.00%103750 LABORATORY EQUIPMENT 0.00% 0.00% 0.00% 0.00%103760 COMMUNICATION EQUIPMENT 0.00% 0.00% 0.00% 0.00%103770 POWER OPERATED EQUIPMENT 0.00% 0.00% 0.00% 0.00%103780 TOOLS, SHOP AND GARAGE EQUIPMENT 9.12% 0.00% 0.00% 9.12%103790 OTHER GENERAL PLANT 0.00% 0.00% 0.00% 0.00%103900 OTHER TANGIBLE PLANT 0.00% 0.00% 0.00% 0.00%103910 UTILITY PLANT PURCHASED 0.00% 0.00% 0.00% 0.00%
REDWOOD - UNIFIED DISTRICT2015 General Rate Case
SUMMARY OF ANNUAL DEPRECIATION RATES, BY ACCOUNTWP9B2
20

Attachment 5 to Settlement Agreement - Depreciation Rates
ACCOUNTNO. D E S C R I P T I O N PLANT RATE COR RATE SALVAGE RATE TOTALWater Supply
103110 STRUCTURES AND IMPROVEMENTS 0.00% 0.00% 0.00% 0.00%103120 COLLECTING AND IMPOUNDING RESERVOIRS 0.00% 0.00% 0.00% 0.00%103130 LAKE, RIVER AND OTHER INTAKES 0.00% 0.00% 0.00% 0.00%103150 WELLS 0.00% 0.00% 0.00% 0.00%103160 SUPPLY MAINS 0.00% 0.00% 0.00% 0.00%
Pumping103210 STRUCTURES AND IMPROVEMENTS 0.00% 0.00% 0.00% 0.00%103240 PUMPING EQUIPMENT 4.68% 0.36% -0.04% 5.00%103241 OTHER PUMPING PLANT 0.00% 0.00% 0.00% 0.00%
Treatment103310 STRUCTURES AND IMPROVEMENTS 3.49% 0.15% 0.00% 3.64%103320 WATER TREATMENT EQUIPMENT 3.99% 0.53% -0.12% 4.40%
Transmission and Distribution103410 STRUCTURES AND IMPROVEMENTS 0.00% 0.00% 0.00% 0.00%103420 RESERVOIRS AND TANKS 3.14% 1.31% 0.00% 4.45%103431 TRANSMISSION AND DISTRIBUTION MAINS 0.00% 0.00% 0.00% 0.00%103440 FIRE MAINS 0.00% 0.00% 0.00% 0.00%103450 SERVICES 0.00% 0.00% 0.00% 0.00%103460 METERS 3.31% 0.03% -0.16% 3.18%103480 HYDRANTS 0.00% 0.00% 0.00% 0.00%
General Plant103710 STRUCTURES AND IMPROVEMENTS 24.90% 1.04% 0.00% 25.94%103720 OFFICE FURNITURE AND EQUIPMENT 0.00% 0.00% 0.00% 0.00%103721 OFFICE EQUIPMENT - COMPUTERS 35.19% 0.00% 0.00% 35.19%103730 TRANSPORTATION 0.00% 0.00% 0.00% 0.00%103740 STORES EQUIPMENT 0.00% 0.00% 0.00% 0.00%103750 LABORATORY EQUIPMENT 0.00% 0.00% 0.00% 0.00%103760 COMMUNICATION EQUIPMENT 0.00% 0.00% 0.00% 0.00%103770 POWER OPERATED EQUIPMENT 0.00% 0.00% 0.00% 0.00%103780 TOOLS, SHOP AND GARAGE EQUIPMENT 7.85% 0.00% 0.00% 7.85%103790 OTHER GENERAL PLANT 0.00% 0.00% 0.00% 0.00%103900 OTHER TANGIBLE PLANT 0.00% 0.00% 0.00% 0.00%103910 UTILITY PLANT PURCHASED 0.00% 0.00% 0.00% 0.00%
REDWOOD VALLEY DISTRICT2015 General Rate Case
SUMMARY OF ANNUAL DEPRECIATION RATES, BY ACCOUNTWP9B2
21

Attachment 5 to Settlement Agreement - Depreciation Rates
ACCOUNTNO. D E S C R I P T I O N Plant Rate COR Rate Salvage Rate Total
103010 103010-Organization103020 103020-Franchises and Consents103030 103030-Other Intangible Plant103061 103061-Land103062 103062-Land Rights
Water Supply103110 103110-Struct & Improve-Supply Plnt 0.00% 0.00% 0.00% 0.00%103120 103120-Collect & Impound Reservoirs 0.00% 0.00% 0.00% 0.00%103130 LAKE, RIVER AND OTHER INTAKES 0.00% 0.00% 0.00% 0.00%103150 103150-Wells-Supply Plant 2.14% 2.16% 0.00% 4.30%103160 103160-Supply Mains 0.00% 0.00% 0.00% 0.00%
Pumping103210 103210-Struct & Imp- Pumping Plant 4.12% 1.67% 0.00% 5.79%103211 103211-Pavement-Pumping Plant 9.26% 0.00% 0.00% 9.26%103240 103240-Pumping Equipment 2.89% 0.28% 0.00% 3.17%103241 103241-System Ctrl Computer Equip 2.89% 0.28% 0.00% 3.17%103250 103250-Other Pumping Plant 0.00% 0.00% 0.00% 0.00%
Treatment103310 103310-Struct & Improve-Treat Plant 2.09% 0.40% 0.00% 2.49%103320 103320-Water Treatment Equipment 3.51% 0.31% 0.00% 3.82%
Transmission and Distribution103410 103410-Struct & Imp-Trans&Dis Plnt 1.98% 0.10% 0.00% 2.08%103411 103411-Pavement-Trans & Dist Plant 5.39% 0.00% 0.00% 5.39%103420 103420-Reservoirs & Tanks 1.97% 0.40% 0.00% 2.37%103421 103421-Tank Painting 13.65% 0.00% 0.00% 13.65%103431 TRANSMISSION AND DISTRIBUTION MAINS 1.79% 1.00% 0.00% 2.79%103440 FIRE MAINS 0.00% 0.00% 0.00% 0.00%103450 103450-Services-Trans & Distr Mains 1.60% 2.61% 0.00% 4.21%103460 103460-Meters & Meter Boxes 3.35% 0.00% -0.15% 3.20%103480 103480-Hydrants-T & D Mains 1.28% 0.94% 0.00% 2.22%
General Plant103710 103710-Struct & Improve Genl Plnt 6.14% 0.56% 0.00% 6.70%103711 103711-Driveway Pavement-Gen Plant 6.60% 0.00% 0.00% 6.60%103720 103720-Office Furn & Equip-Gen Plnt 4.26% 0.00% 0.00% 4.26%103721 103721-Office-Elec. Equip/Computers 5.92% 0.00% 0.00% 5.92%103722 103722-Computer Software 0.00% 0.00% 0.00% 0.00%103730 103730-Transportn Equip-Gen Plant 4.78% 0.00% -1.64% 3.14%103731 103731-Heavy Trucks-Gen Plant 4.78% 0.00% -1.64% 3.14%103740 103740-Stores Equipment-Gen Plant 5.77% 0.00% 0.00% 5.77%103750 103750-Laboratory Equip-Gen Plant 7.26% 0.00% 0.00% 7.26%103760 103760-Communication Equip-Gen Plnt 1.71% 0.00% 0.00% 1.71%103770 103770-Pwr Operated Equip-Gen Plant 2.39% 0.00% -0.23% 2.16%103780 103780-Tools, Shop & Garage Equip 5.16% 0.00% 0.00% 5.16%103790 103790-Other General Plant 7.67% 0.00% 0.00% 7.67%103900 OTHER TANGIBLE PLANT 0.00% 0.00% 0.00% 0.00%103910 103910-Utility Plant Purchased 0.00% 0.00% 0.00% 0.00%
SALINAS DISTRICT2015 General Rate Case
SUMMARY OF ANNUAL DEPRECIATION RATES, BY ACCOUNTWP9B2
22

Attachment 5 to Settlement Agreement - Depreciation Rates
ACCOUNTNO. D E S C R I P T I O N PLANT RATE COR RATE SALVAGE RATE TOTALWater Supply
103110 STRUCTURES AND IMPROVEMENTS 0.00% 0.00% 0.00% 0.00%103120 COLLECTING AND IMPOUNDING RESERVOIRS 0.00% 0.00% 0.00% 0.00%103130 LAKE, RIVER AND OTHER INTAKES 0.00% 0.00% 0.00% 0.00%103150 WELLS 1.92% 2.15% 0.00% 4.07%103160 SUPPLY MAINS 0.00% 0.00% 0.00% 0.00%
Pumping103210 STRUCTURES AND IMPROVEMENTS 3.70% 1.50% 0.00% 5.20%103211 Pavement - Pumping Plant 7.23% 0.00% 0.00% 7.23%103240 PUMPING EQUIPMENT 2.63% 0.28% 0.00% 2.91%103241 SCADA 2.63% 0.28% 0.00% 2.91%103250 OTHER PUMPING PLANT 0.00% 0.00% 0.00% 0.00%
Treatment103310 STRUCTURES AND IMPROVEMENTS 0.00% 0.00% 0.00% 0.00%103320 WATER TREATMENT EQUIPMENT 2.00% 0.34% 0.00% 2.34%
Transmission and Distribution103410 STRUCTURES AND IMPROVEMENTS 0.00% 0.00% 0.00% 0.00%103411 Pavement-Trans & Dist Plant 11.77% 0.00% 0.00% 11.77%103420 RESERVOIRS AND TANKS 1.89% 0.39% 0.00% 2.28%103421 TANK PAINTING 0.00% 0.00% 0.00% 0.00%103431 TRANSMISSION AND DISTRIBUTION MAINS 1.83% 0.99% 0.00% 2.82%103440 FIRE MAINS 0.00% 0.00% 0.00% 0.00%103450 SERVICES 1.69% 2.61% 0.00% 4.30%103460 METERS 3.54% 0.00% -0.16% 3.38%103480 HYDRANTS 1.24% 0.94% 0.00% 2.18%
General Plant103710 STRUCTURES AND IMPROVEMENTS 3.54% 0.35% 0.00% 3.89%103711 Driveway Pavement-Gen Plant 5.02% 0.00% 0.00% 5.02%103720 OFFICE FURNITURE AND EQUIPMENT 4.61% 0.00% 0.00% 4.61%103721 OFFICE EQUIPMENT - COMPUTERS 6.81% 0.00% 0.00% 6.81%103722 COMPUTER SOFTWARE 35.76% 0.00% 0.00% 35.76%103730 TRANSPORTATION 5.91% 0.00% -1.55% 4.36%103740 STORES EQUIPMENT 1.88% 0.00% 0.00% 1.88%103750 LABORATORY EQUIPMENT 12.67% 0.00% 0.00% 12.67%103760 COMMUNICATION EQUIPMENT -4.94% 0.00% 0.00% -4.94%103770 POWER OPERATED EQUIPMENT -8.34% 0.00% -0.18% -8.52%103780 TOOLS, SHOP AND GARAGE EQUIPMENT 5.42% 0.00% 0.00% 5.42%103790 OTHER GENERAL PLANT 6.54% 0.00% 0.00% 6.54%103900 OTHER TANGIBLE PLANT 0.00% 0.00% 0.00% 0.00%103910 UTILITY PLANT PURCHASED 0.00% 0.00% 0.00% 0.00%
SELMA DISTRICT2015 General Rate Case
SUMMARY OF ANNUAL DEPRECIATION RATES, BY ACCOUNTWP9B2
23

Attachment 5 to Settlement Agreement - Depreciation Rates
ACCOUNTNO. D E S C R I P T I O N Plant Rate COR Rate Salvage Rate Total
103010 103010-Organization103020 103020-Franchises and Consents103030 103030-Other Intangible Plant103061 103061-Land103062 103062-Land Rights
Water Supply103110 103110-Struct & Improve-Supply Plnt 0.00% 0.00% 0.00% 0.00%103120 103120-Collect & Impound Reservoirs 0.75% 0.36% 0.00% 1.11%103130 103130-Lake River & Other Intake 0.00% 0.00% 0.00% 0.00%103150 103150-Wells-Supply Plant 2.57% 2.30% 0.00% 4.87%103160 103160-Supply Mains 0.78% 0.15% 0.00% 0.93%
Pumping103210 103210-Struct & Imp- Pumping Plant 4.79% 1.68% 0.00% 6.47%103211 103211-Pavement-Pumping Plant 8.09% 0.00% 0.00% 8.09%103240 103240-Pumping Equipment 2.53% 0.29% 0.00% 2.82%103241 103241-System Ctrl Computer Equip 2.53% 0.29% 0.00% 2.82%103250 103250-Other Pumping Plant 0.00% 0.00% 0.00% 0.00%
Treatment103310 103310-Struct & Improve-Treat Plant 2.06% 0.40% 0.00% 2.46%103320 103320-Water Treatment Equipment 2.86% 0.29% 0.00% 3.15%
Transmission and Distribution103410 103410-Struct & Imp-Trans&Dis Plnt 1.00% 0.10% 0.00% 1.10%103411 103411-Pavement-Trans & Dist Plant -13.37% 0.00% 0.00% -13.37%103420 103420-Reservoirs & Tanks 1.60% 0.38% 0.00% 1.98%103421 103421-Tank Painting 11.46% 0.00% 0.00% 11.46%103431 TRANSMISSION AND DISTRIBUTION MAINS 1.73% 0.98% 0.00% 2.71%103440 103440-Fire Mains 0.00% 0.00% 0.00% 0.00%103450 103450-Services-Trans & Distr Mains 1.61% 2.61% 0.00% 4.22%103460 103460-Meters & Meter Boxes 3.49% 0.00% -0.16% 3.33%103480 103480-Hydrants-T & D Mains 1.09% 0.94% 0.00% 2.03%
General Plant103710 103710-Struct & Improve Genl Plnt 3.09% 0.31% 0.00% 3.40%103711 103711-Driveway Pavement-Gen Plant 6.18% 0.00% 0.00% 6.18%103720 103720-Office Furn & Equip-Gen Plnt 5.78% 0.00% 0.00% 5.78%103721 103721-Office-Elec. Equip/Computers 10.36% 0.00% 0.00% 10.36%103722 103722-Computer Software 0.00% 0.00% 0.00% 0.00%103730 103730-Transportn Equip-Gen Plant 8.92% 0.00% -1.61% 7.31%103731 103731-Heavy Trucks-Gen Plant 8.92% 0.00% -1.61% 7.31%103740 103740-Stores Equipment-Gen Plant 3.83% 0.00% 0.00% 3.83%103750 103750-Laboratory Equip-Gen Plant 8.55% 0.00% 0.00% 8.55%103760 103760-Communication Equip-Gen Plnt 1.48% 0.00% 0.00% 1.48%103770 103770-Pwr Operated Equip-Gen Plant 5.26% 0.00% -0.22% 5.04%103780 103780-Tools, Shop & Garage Equip 8.99% 0.00% 0.00% 8.99%103790 103790-Other General Plant 0.22% 0.00% 0.00% 0.22%103900 103900-Other Tangible Property 0.00% 0.00% 0.00% 0.00%103910 103910-Utility Plant Purchased 0.00% 0.00% 0.00% 0.00%
STOCKTON DISTRICT2015 General Rate Case
SUMMARY OF ANNUAL DEPRECIATION RATES, BY ACCOUNTWP9B2
24

Attachment 5 to Settlement Agreement - Depreciation Rates
ACCOUNTNO. D E S C R I P T I O N PLANT RATE COR RATE SALVAGE RATE TOTALWater Supply
103110 STRUCTURES AND IMPROVEMENTS 0.00% 0.00% 0.00% 0.00%103120 COLLECTING AND IMPOUNDING RESERVOIRS 0.00% 0.00% 0.00% 0.00%103130 LAKE, RIVER AND OTHER INTAKES 0.00% 0.00% 0.00% 0.00%103150 WELLS 2.08% 2.21% 0.00% 4.29%103160 SUPPLY MAINS 0.00% 0.00% 0.00% 0.00%103164 ALL OTHER - SUPPLY MAINS 0.00% 0.00% 0.00% 0.00%
Pumping103210 STRUCTURES AND IMPROVEMENTS 3.31% 1.44% 0.00% 4.75%103211 PAVEMENT - PUMPING PLANT 8.62% 0.00% 0.00% 8.62%103240 PUMPING EQUIPMENT 2.57% 0.29% 0.00% 2.86%103241 SYSTEM CTRL COMPUTER EQUIP 2.57% 0.29% 0.00% 2.86%103250 OTHER PUMPING PLANT 0.00% 0.00% 0.00% 0.00%
Treatment103310 STRUCTURES AND IMPROVEMENTS 2.06% 0.40% 0.00% 2.46%103320 WATER TREATMENT EQUIPMENT 2.62% 0.28% 0.00% 2.90%
Transmission and Distribution103410 STRUCTURES AND IMPROVEMENTS -0.72% 0.10% 0.00% -0.62%103420 RESERVOIRS AND TANKS 1.67% 0.36% 0.00% 2.03%103421 TANK PAINTING 6.91% 0.00% 0.00% 6.91%103431 TRANSMISSION AND DISTRIBUTION MAINS 1.74% 1.03% 0.00% 2.77%103440 FIRE MAINS 0.00% 0.00% 0.00% 0.00%103450 SERVICES 1.49% 2.61% 0.00% 4.10%103460 METERS 3.37% 0.00% -0.15% 3.22%103480 HYDRANTS 1.30% 0.94% 0.00% 2.24%
General Plant103710 STRUCTURES AND IMPROVEMENTS 3.51% 0.34% 0.00% 3.85%103711 DRIVEWAY PAVEMENT 5.09% 0.00% 0.00% 5.09%103720 OFFICE FURNITURE AND EQUIPMENT 4.22% 0.00% 0.00% 4.22%103721 OFFICE EQUIPMENT - COMPUTERS 7.69% 0.00% 0.00% 7.69%103722 COMPUTER SOFTWARE 26.37% 0.00% 0.00% 26.37%103730 TRANSPORTATION 9.93% 0.00% -1.63% 8.30%103740 STORES EQUIPMENT 4.31% 0.00% 0.00% 4.31%103750 LABORATORY EQUIPMENT 35.25% 0.00% 0.00% 35.25%103760 COMMUNICATION EQUIPMENT 3.23% 0.00% 0.00% 3.23%103770 POWER OPERATED EQUIPMENT 4.50% 0.00% -0.24% 4.26%103780 TOOLS, SHOP AND GARAGE EQUIPMENT 5.96% 0.00% 0.00% 5.96%103790 OTHER GENERAL PLANT 7.43% 0.00% 0.00% 7.43%
103900 OTHER TANGIBLE PLANT 0.00% 0.00% 0.00% 0.00%103910 UTILITY PLANT PURCHASED 0.00% 0.00% 0.00% 0.00%
VISALIA DISTRICT2015 General Rate Case
SUMMARY OF ANNUAL DEPRECIATION RATES, BY ACCOUNTWP9B2
25

Attachment 5 to Settlement Agreement - Depreciation Rates
ACCOUNTNO. D E S C R I P T I O N Plant Rate COR Rate Salvage Rate TotalWater Supply
103110 STRUCTURES AND IMPROVEMENTS 0.00% 0.00% 0.00% 0.00%103120 COLLECTING AND IMPOUNDING RESERVOIRS 0.00% 0.00% 0.00% 0.00%103130 LAKE, RIVER AND OTHER INTAKES 0.00% 0.00% 0.00% 0.00%103150 WELLS 0.00% 0.00% 0.00% 0.00%103160 SUPPLY MAINS 1.18% 0.26% 0.00% 1.44%
Pumping103210 STRUCTURES AND IMPROVEMENTS 5.95% 1.32% 0.00% 7.27%103211 PAVEMENT - PUMPING PLANT 7.16% 0.00% 0.00% 7.16%103240 PUMPING EQUIPMENT 2.61% 0.07% 0.00% 2.68%103241 SYSTEM CTRL COMPUTER EQUIP 2.61% 0.07% 0.00% 2.68%103250 OTHER PUMPING PLANT 0.00% 0.00% 0.00% 0.00%
Treatment103310 STRUCTURES AND IMPROVEMENTS 0.00% 0.00% 0.00% 0.00%103320 WATER TREATMENT EQUIPMENT 0.00% 0.00% 0.00% 0.00%
Transmission and Distribution103410 STRUCTURES AND IMPROVEMENTS 1.34% -0.02% 0.00% 1.32%103420 RESERVOIRS AND TANKS 2.28% 1.05% 0.00% 3.33%103421 TANK PAINTING 10.19% 0.00% 0.00% 10.19%103431 TRANSMISSION AND DISTRIBUTION MAINS 1.29% 0.66% 0.00% 1.95%103440 FIRE MAINS 1.56% -0.52% 0.00% 1.04%103450 SERVICES 1.92% 2.70% 0.00% 4.62%103460 METERS 3.42% -0.17% -0.31% 2.94%103480 HYDRANTS 1.38% 0.22% 0.00% 1.60%
General Plant103710 STRUCTURES AND IMPROVEMENTS 2.68% 0.49% 0.00% 3.17%103720 OFFICE FURNITURE AND EQUIPMENT 2.89% 0.00% -0.12% 2.77%103721 OFFICE EQUIPMENT - COMPUTERS -11.35% 0.00% 0.00% -11.35%103722 COMPUTER SOFTWARE -14.43% 0.00% 0.00% -14.43%103730 TRANSPORTATION 7.82% 0.00% -0.76% 7.06%103740 STORES EQUIPMENT -5.19% 0.00% 0.00% -5.19%103750 LABORATORY EQUIPMENT 0.24% 0.00% 0.00% 0.24%103760 COMMUNICATION EQUIPMENT -4.72% 0.00% 0.00% -4.72%103770 POWER OPERATED EQUIPMENT 0.00% 0.00% 0.00% 0.00%103780 TOOLS, SHOP AND GARAGE EQUIPMENT 4.04% 0.00% 0.00% 4.04%103790 OTHER GENERAL PLANT -2.77% 0.00% 0.00% -2.77%103900 OTHER TANGIBLE PLANT 0.00% 0.00% 0.00% 0.00%103910 UTILITY PLANT PURCHASED 0.00% 0.00% 0.00% 0.00%
WESTLAKE DISTRICT2015 General Rate Case
SUMMARY OF ANNUAL DEPRECIATION RATES, BY ACCOUNTWP9B2
26
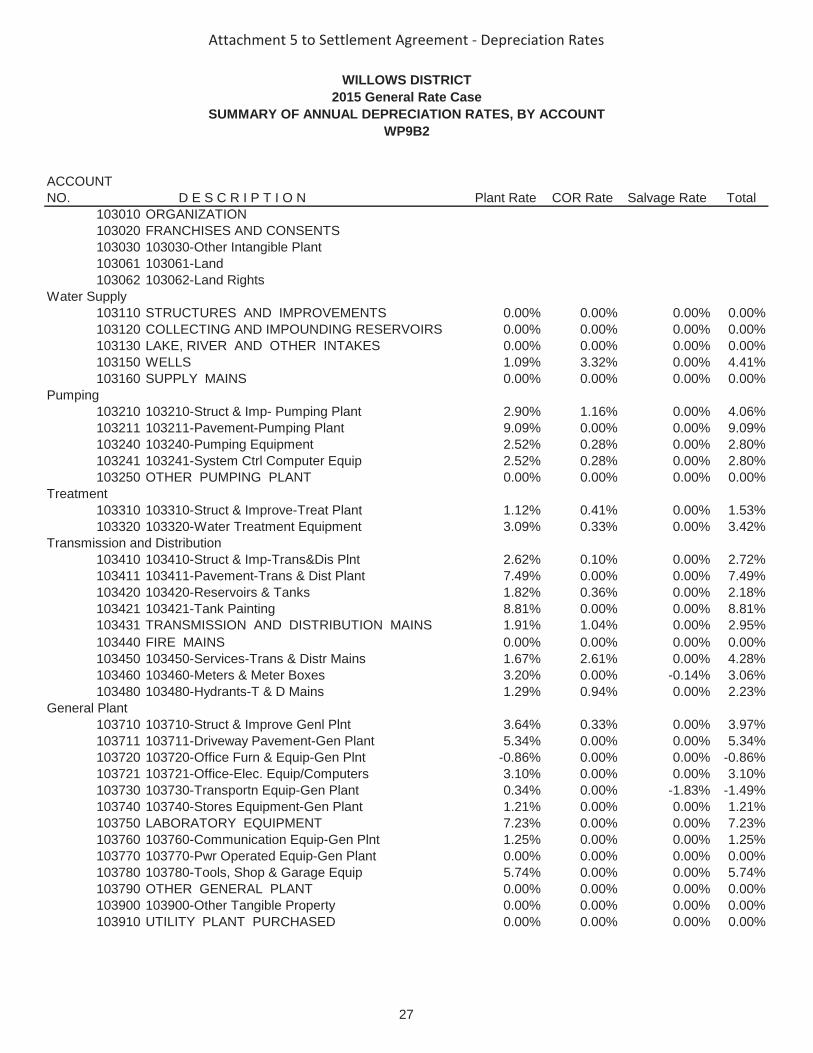
Attachment 5 to Settlement Agreement - Depreciation Rates
ACCOUNTNO. D E S C R I P T I O N Plant Rate COR Rate Salvage Rate Total
103010 ORGANIZATION103020 FRANCHISES AND CONSENTS103030 103030-Other Intangible Plant103061 103061-Land103062 103062-Land Rights
Water Supply103110 STRUCTURES AND IMPROVEMENTS 0.00% 0.00% 0.00% 0.00%103120 COLLECTING AND IMPOUNDING RESERVOIRS 0.00% 0.00% 0.00% 0.00%103130 LAKE, RIVER AND OTHER INTAKES 0.00% 0.00% 0.00% 0.00%103150 WELLS 1.09% 3.32% 0.00% 4.41%103160 SUPPLY MAINS 0.00% 0.00% 0.00% 0.00%
Pumping103210 103210-Struct & Imp- Pumping Plant 2.90% 1.16% 0.00% 4.06%103211 103211-Pavement-Pumping Plant 9.09% 0.00% 0.00% 9.09%103240 103240-Pumping Equipment 2.52% 0.28% 0.00% 2.80%103241 103241-System Ctrl Computer Equip 2.52% 0.28% 0.00% 2.80%103250 OTHER PUMPING PLANT 0.00% 0.00% 0.00% 0.00%
Treatment103310 103310-Struct & Improve-Treat Plant 1.12% 0.41% 0.00% 1.53%103320 103320-Water Treatment Equipment 3.09% 0.33% 0.00% 3.42%
Transmission and Distribution103410 103410-Struct & Imp-Trans&Dis Plnt 2.62% 0.10% 0.00% 2.72%103411 103411-Pavement-Trans & Dist Plant 7.49% 0.00% 0.00% 7.49%103420 103420-Reservoirs & Tanks 1.82% 0.36% 0.00% 2.18%103421 103421-Tank Painting 8.81% 0.00% 0.00% 8.81%103431 TRANSMISSION AND DISTRIBUTION MAINS 1.91% 1.04% 0.00% 2.95%103440 FIRE MAINS 0.00% 0.00% 0.00% 0.00%103450 103450-Services-Trans & Distr Mains 1.67% 2.61% 0.00% 4.28%103460 103460-Meters & Meter Boxes 3.20% 0.00% -0.14% 3.06%103480 103480-Hydrants-T & D Mains 1.29% 0.94% 0.00% 2.23%
General Plant103710 103710-Struct & Improve Genl Plnt 3.64% 0.33% 0.00% 3.97%103711 103711-Driveway Pavement-Gen Plant 5.34% 0.00% 0.00% 5.34%103720 103720-Office Furn & Equip-Gen Plnt -0.86% 0.00% 0.00% -0.86%103721 103721-Office-Elec. Equip/Computers 3.10% 0.00% 0.00% 3.10%103730 103730-Transportn Equip-Gen Plant 0.34% 0.00% -1.83% -1.49%103740 103740-Stores Equipment-Gen Plant 1.21% 0.00% 0.00% 1.21%103750 LABORATORY EQUIPMENT 7.23% 0.00% 0.00% 7.23%103760 103760-Communication Equip-Gen Plnt 1.25% 0.00% 0.00% 1.25%103770 103770-Pwr Operated Equip-Gen Plant 0.00% 0.00% 0.00% 0.00%103780 103780-Tools, Shop & Garage Equip 5.74% 0.00% 0.00% 5.74%103790 OTHER GENERAL PLANT 0.00% 0.00% 0.00% 0.00%103900 103900-Other Tangible Property 0.00% 0.00% 0.00% 0.00%103910 UTILITY PLANT PURCHASED 0.00% 0.00% 0.00% 0.00%
WILLOWS DISTRICT2015 General Rate Case
SUMMARY OF ANNUAL DEPRECIATION RATES, BY ACCOUNTWP9B2
27

Attachment 5 to Settlement Agreement - Depreciation Rates
ACCOUNTNO. D E S C R I P T I O N Plant Rate COR Rate Salvage Rate Total
103010 103010-Organization103020 103020-Franchises and Consents103030 103030-Other Intangible Plant103061 103061-Land103062 103062-Land Rights
Water Supply103110 STRUCTURES AND IMPROVEMENTS 0.00% 0.00% 0.00% 0.00%103120 COLLECTING AND IMPOUNDING RESERVOIRS 0.00% 0.00% 0.00% 0.00%103130 LAKE, RIVER AND OTHER INTAKES 0.00% 0.00% 0.00% 0.00%103150 WELLS 0.00% 0.00% 0.00% 0.00%103160 SUPPLY MAINS 0.00% 0.00% 0.00% 0.00%
Pumping103210 STRUCTURES AND IMPROVEMENTS 0.00% 0.00% 0.00% 0.00%103240 PUMPING EQUIPMENT 3.03% 0.08% 0.00% 3.11%103241 103241-System Ctrl Computer Equip 3.03% 0.08% 0.00% 3.11%103250 OTHER PUMPING PLANT 2.82% 0.09% 0.00% 2.91%
Treatment103310 STRUCTURES AND IMPROVEMENTS 0.00% 0.00% 0.00% 0.00%103320 WATER TREATMENT EQUIPMENT 0.31% 0.12% 0.00% 0.43%
Transmission and Distribution103410 STRUCTURES AND IMPROVEMENTS 0.00% 0.00% 0.00% 0.00%103420 RESERVOIRS AND TANKS 0.00% 0.00% 0.00% 0.00%103436 TRANSMISSION AND DISTRIBUTION MAINS 0.00% 0.00% 0.00% 0.00%103440 FIRE MAINS 0.00% 0.00% 0.00% 0.00%103450 SERVICES 0.00% 0.00% 0.00% 0.00%103460 METERS 0.00% 0.00% 0.00% 0.00%103480 HYDRANTS 0.00% 0.00% 0.00% 0.00%
General Plant103710 STRUCTURES AND IMPROVEMENTS 3.40% 0.54% 0.00% 3.94%103711 103711-Driveway Pavement-Gen Plant 13.97% 0.00% 0.00% 13.97%103720 OFFICE FURNITURE AND EQUIPMENT 5.23% 0.00% -0.01% 5.22%103721 OFFICE EQUIPMENT - COMPUTERS 12.45% 0.00% 0.00% 12.45%103722 COMPUTER SOFTWARE 9.44% 0.00% 0.00% 9.44%103730 TRANSPORTATION 9.97% 0.00% -0.61% 9.36%103740 STORES EQUIPMENT 4.67% 0.00% 0.00% 4.67%103750 LABORATORY EQUIPMENT 6.25% 0.00% 0.00% 6.25%103760 COMMUNICATION EQUIPMENT 1.87% 0.00% 0.00% 1.87%103770 POWER OPERATED EQUIPMENT 4.24% 0.00% -0.25% 3.99%103780 TOOLS, SHOP AND GARAGE EQUIPMENT 4.21% 0.00% 0.00% 4.21%103790 OTHER GENERAL PLANT 3.55% 0.00% 0.00% 3.55%103910 OTHER TANGIBLE PLANT 0.00% 0.00% 0.00% 0.00%
0 UTILITY PLANT PURCHASED 0.00% 0.00% 0.00% 0.00%
2015 General Rate CaseSUMMARY OF ANNUAL DEPRECIATION RATES, BY ACCOUNT
CUSTOMER SUPPORT SERVICES ("CSS")
28

Attachment 5 to Settlement Agreement - Depreciation Rates
DISTRICT 2017 2018
Antelope Valley 3.92% 3.92%Bayshore 2.91% 2.89%Bakersfield 3.16% 3.16%Bear Gulch 2.80% 2.79%Chico 3.15% 3.15%Dixon 3.19% 3.18%Dominguez 2.42% 2.40%East Los Angeles 2.75% 2.73%Hermosa Redondo 3.43% 3.41%Kern River Valley 3.27% 3.26%King City 3.44% 3.43%Livermore 2.94% 2.92%Los Altos 3.01% 2.96%Marysville 3.78% 3.80%Oroville 3.32% 3.31%Palos Verdes 2.74% 2.72%Redwood - Coast Springs 3.30% 3.28%Redwood - Lucerne 2.77% 2.72%Redwood - Unified 3.93% 3.89%Salinas 3.40% 3.38%Selma 3.35% 3.35%Stockton 3.14% 3.11%Visalia 3.19% 3.19%Westlake 2.97% 2.97%Willows 2.13% 2.10%
CALIFORNIA WATER SERVICE COMPANY2015 GENERAL RATE CASE
SUMMARY OF ANNUAL DEPRECIATION RATES, CIACTABLE 9-B2
29
(END OF ATTACHMENT 5)

Attachment 6
SELECTED DRAFT TARIFFS
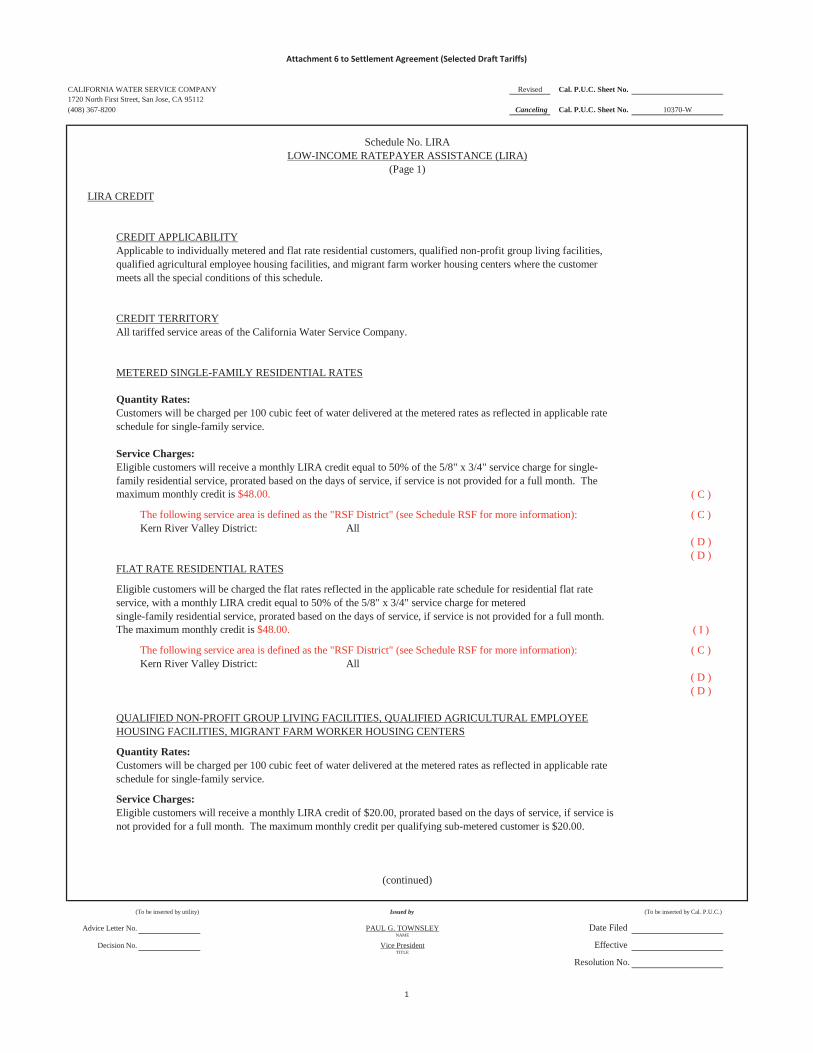
Attachment 6 to Settlement Agreement (Selected Draft Tariffs)
CALIFORNIA WATER SERVICE COMPANY Revised Cal. P.U.C. Sheet No. 1720 North First Street, San Jose, CA 95112(408) 367-8200 Canceling Cal. P.U.C. Sheet No.
LIRA CREDIT
CREDIT APPLICABILITYApplicable to individually metered and flat rate residential customers, qualified non-profit group living facilities,qualified agricultural employee housing facilities, and migrant farm worker housing centers where the customermeets all the special conditions of this schedule.
CREDIT TERRITORYAll tariffed service areas of the California Water Service Company.
METERED SINGLE-FAMILY RESIDENTIAL RATES
Quantity Rates:Customers will be charged per 100 cubic feet of water delivered at the metered rates as reflected in applicable rateschedule for single-family service.
Service Charges:Eligible customers will receive a monthly LIRA credit equal to 50% of the 5/8" x 3/4" service charge for single-family residential service, prorated based on the days of service, if service is not provided for a full month. Themaximum monthly credit is $48.00. ( C )
The following service area is defined as the "RSF District" (see Schedule RSF for more information): ( C )Kern River Valley District: All
( D )( D )
FLAT RATE RESIDENTIAL RATES
Eligible customers will be charged the flat rates reflected in the applicable rate schedule for residential flat rate service, with a monthly LIRA credit equal to 50% of the 5/8" x 3/4" service charge for meteredsingle-family residential service, prorated based on the days of service, if service is not provided for a full month.The maximum monthly credit is $48.00. ( I )
The following service area is defined as the "RSF District" (see Schedule RSF for more information): ( C )Kern River Valley District: All
( D )( D )
QUALIFIED NON-PROFIT GROUP LIVING FACILITIES, QUALIFIED AGRICULTURAL EMPLOYEEHOUSING FACILITIES, MIGRANT FARM WORKER HOUSING CENTERS
Quantity Rates:Customers will be charged per 100 cubic feet of water delivered at the metered rates as reflected in applicable rateschedule for single-family service.
Service Charges:Eligible customers will receive a monthly LIRA credit of $20.00, prorated based on the days of service, if service isnot provided for a full month. The maximum monthly credit per qualifying sub-metered customer is $20.00.
(To be inserted by utility) (To be inserted by Cal. P.U.C.)
Advice Letter No. Date Filed
Decision No. Effective
Resolution No.
10370-W
Schedule No. LIRALOW-INCOME RATEPAYER ASSISTANCE (LIRA)
(Page 1)
Vice PresidentTITLE
(continued)
Issued by
PAUL G. TOWNSLEYNAME
1

Attachment 6 to Settlement Agreement (Selected Draft Tariffs)
CALIFORNIA WATER SERVICE COMPANY Revised Cal. P.U.C. Sheet No. 1720 North First Street, San Jose, CA 95112(408) 367-8200 Canceling Cal. P.U.C. Sheet No.
Schedule No. LIRALOW-INCOME RATEPAYER ASSISTANCE (LIRA)
(Page 3)
LIRA SURCHARGE
SURCHARGE APPLICABILITYApplicable to all water service except that provided for:
(1) public and private fire protection services ( T )(2) under Schedules OR-3M, OR-3M-I, and OR-2UL for raw water delivery along the Powers Canal and ( T )(3) LIRA customers.
SURCHARGE TERRITORY
All territories served.
RATE SURCHARGE
A LIRA surcharge rate of 1.542% will be applied to the basic water charges (identified below) on ( R )a customer's bill.
"Basic water charges" as referenced in this Schedule consist of the service charge and quantity charges for ( T )a metered customer, and the flat charge for flat-rate customers, after RSF credits are applied; they do not include any other fees, surcharges, or credits.
SPECIAL CONDITIONS
[None] ( T )
(To be inserted by utility) (To be inserted by Cal. P.U.C.)
Advice Letter No. Date Filed
Decision No. Effective
Resolution No.
Issued by
10372-W
PAUL G. TOWNSLEY
TITLE
-
NAME
Vice President
2

Attachment 6 to Settlement Agreement (Selected Draft Tariffs)
CALIFORNIA WATER SERVICE COMPANY Revised Cal. P.U.C. Sheet No. 1720 North First Street, San Jose, CA 95112(408) 367-8200 Cancelling Cal. P.U.C. Sheet No.
The Rate Support Fund (RSF) Program provides credits on the bills of customers in the Kern River Valley District. ( C )It also provides a subsidy of $993,015 to reduce the revenue requirements of the service areas in the Redwood ( N )Valley District for each of the three years in this rate case cycle (2017-2019). ( N )
The RSF Program is funded through surcharges on other customers as specified below. (T)
RSF SURCHARGE
APPLICABILITY:
Applicable to all water service except that provided for:(1) public and private fire protection services ( T )(2) under Schedules OR-3M, OR-3M-I, and OR-2UL for raw water delivery along the Powers Canal and ( T )(3) LIRA customers located in an RSF District (see Schedule LIRA).
TERRITORY:
All territories served.
SURCHARGE:
An RSF surcharge rate of .354% will be applied to the basic water charges (identified below) on ( R )a customer's bill.
"Basic water charges" as referenced in this Schedule consist of the service charge and quantity charges for ( T )a metered customer, and the flat charge for flat-rate customers, after RSF credits are applied; they do not include any other fees, surcharges, or credits.
RSF CREDIT
APPLICABILITY:
Applicable to all water service in the Kern River Valley District (the "RSF District"), except ( C )that provided for public and private fire protection services. ( T )
( D )CREDIT AMOUNTS:
A discounted quantity rate on the first units of water consumption per month up to the "RSF Usage Limit."Discounted RSF quantity rate……………………………… $5.27 per 100 cubic feet (CCF) ( I ) ( C )
The Discounted RSF Quantity Rates apply to monthly water consumption up to the following RSF Usage Limits:Kern River Valley District First 10 CCF ( C )
( D )Additional units will be charged at the quantity rates described on the rate schedules for those service areas.
Kern River Valley District Schedule KRV-1 ( C )( D )
SPECIAL CONDITIONS
1. The RSF Credits and Surcharges on this tariff shall be separately identified on customer bills. ( C )
2. Customer bills in the former Redwood Valley District service areas (Coast Springs, Lucerne, and Unified) shall have ( N )a message indicating that their basic water rates (service charge and quantity rates) are lower due to a subsidy from ( N )the RSF program. This bill message will continue as long as the RSF subsidy continues. ( N )
3. In no instance should the total amount of the combined RSF Credit and and LIRA discount received by a ( L )customer in any month exceeds that customer's water bill for service in that month. ( T ) ( L )
(To be inserted by utility) (To be inserted by Cal. P.U.C.)
Advice Letter No. Date Filed
Decision No. Effective
Resolution No.TITLE
Issued by
PAUL G. TOWNSLEYNAME
Vice President
RATE SUPPORT FUND
10369-W
Schedule No. RSFAll Tariff Areas
3

Attachment 6 to Settlement Agreement (Selected Draft Tariffs)
CALIFORNIA WATER SERVICE COMPANY1720 North First Street, San Jose, CA 95112 New CPUC Sheet No. XXXXX-W(408) 367-8200 CPUC Sheet No. -
Schedule No. EL-6 (N)East Los Angeles Tariff Area |
RECLAIMED METERED SERVICE ||
APPLICABILITY |Applicable to all metered reclaimed water service |
|TERRITORY |
East Los Angeles, Commerce and vicinity, Los Angeles County. ||
RATES 1 CCF is 100 cubic feet (748 gallons) |Quantity Rates: |
Per CCF $2.4986 ||
Per Meter |Service Charge: Per Month |
For 5/8 x 3/4 - inch meter $16.19 |For 3/4 - inch meter $23.79 |For 1 - inch meter $40.48 |For 1-1/2 - inch meter $80.96 |For 2 - inch meter $129.54 |For 3 - inch meter $242.89 |For 4 - inch meter $404.81 |For 6 - inch meter $729.90 |For 8 - inch meter $1,102.39 |For 10 - inch meter $1,862.13 |For 12 - inch meter $2,616.56 |For 14 - inch meter $3,568.04 |
|The service charge is a readiness-to-serve charge which is applicable to all metered service and to |which is added the charge for water used computed at the quantity rates. |
|SPECIAL CONDITIONS |
|1. Reclaimed water will be supplied only as available from Central Basin Municipal Water District. |
|2. As a condition of service under this schedule, all customers are required to comply with the |
Company's Rule 16, Section D, Reclaimed Water Service. ||
3. All bills are subject to the following tariff schedules: Schedule UF (CPUC reimbursement fee) and |applicable surcharges and surcredits on Schedule RSF (Rate Support Fund), Schedule LIRA |(Low-Income Ratepayer Assistance), and Schedule AS (Additional Surcharges and Surcredits). (N)
(continued)(To be inserted by utility) Issued by (To be inserted by CPUC)
Advice Letter No. PAUL G. TOWNSLEY Date FiledDecision No. Name Effective
Vice President Resolution No.TITLE
4

Attachment 6 to Settlement Agreement (Selected Draft Tariffs)
CALIFORNIA WATER SERVICE COMPANY1720 North First Street, San Jose, CA 95112 New CPUC Sheet No. XXXXX-W(408) 367-8200 Canceling CPUC Sheet No.
Schedule No. AA-4 ( N )|
Private Fire Protection Service ||
APPLICABILITY |This schedule applies to all fire protection services for governmental and privately-owned properties receiving |service for on-site fire sprinklers, stand pipes, fire hydrants or any other fire protection system not owned and |maintained by Cal Water but connected to the water system for fire protection purposes only. |
|TERRITORY |This schedule is applicable wtihin the entire territory served by the utility. |
|RATES Per Month |For each inch of diameter of service connection $8.50 |
|SPECIAL CONDITIONS |
1 All bills are subject to the reimbursement fee set forth on Schedule UF. |2 The customer will pay, without refund, the entire cost of the private fire service facilities. |3 The private fire service facilities shall be installed by the utility or under the utility’s direction and shall be the sole |
property of the applicant but subject to the control of the utility, with the right to alter, repair, replace and the right |to remove upon discontinuance of service. |
4 The minimum diameter for the private fire service connection will be four inches. The maximum diameter shall not be |larger than the diameter of the water main to which the private fire service facilities are connected. |
5 If a water main of adequate size is not available adjacent to the premises to be served, then a new main from the nearest |existing main of adequate size will be installed by the utility at the cost of the customer. Such cost shall not be subject to |refund. |
6 The private fire service facilities will include a detector check valve or other similar device acceptable to the utility which |will indicate the use of water. The facilities may be located within the customer’s premises or within public rights of way |adjacent thereto. Where located within the premises, the utility and its duly authorized agents shall have the right of ingres |to and egress from the premises for all purposes related to said facilities. In the event the installation is solely for a private |fire hydrant facility, the requirement for a detector check valve or other similar device may be waived. |
7 No structure shall be built over the private fire service facilities and the customer shall maintain and safeguard the area |occupied by the private fire service facilities from traffic and other hazardous conditions. The customer will be responsible |for any damage to the private fire service facilities whether resulting from the use or operation of appliances and facilities |on customer’s premises or otherwise. |
8 Subject to the approval of the utility, any change in the location or construction of the private fire service facilities as may |be requested by public authority or the customer will be made by the utility following payment to the utility of the entire |cost of such change. |
9 The customer’s installation must be such as to separate effectively the private fire service facilities from that of the |customer’s regular domestic water service. Any unauthorized use of water from the private fire service facilities will be |charged for at the applicable tariff rates and may be grounds for the utility’s discontinuing private fire service without |liability to the utility. |
10 There shall be no cross-connection between the systems supplied by water through the utility’s private fire service facilities |and any other source of supply without the specific approval of the utility. The specific approval, if given, will at least |require at the customer’s expense a special double check valve installation or other backflow prevention device acceptable |to the utility. Any cross-connection may be grounds for immediately discontinuing private fire service without liability to |the utility. |
11 The utility will supply only such water at such pressure as may be available from time to time as a result of its normal |operation of the system. The customer shall indemnify the utility and save it harmless against any and all claims arising |against the utility for any loss or damage resulting from service under this schedule. Section 774 of the Public Utilities |Commission Code limits the liability of the utility resulting from a claim regarding adequacy of pressure or supply for fire |protection service. |
12 The customer shall be responsible for the periodic testing of any backflow prevention devices as required by public |authority or the utility. Any repair or replacement of such devices or of any other facilities installed to provide private fire |service shall be done at the customer’s expense. Any refusal to comply with the above requirements may be grounds for |the utility’s discontinuing private fire service without liability to the utility. ( N )
(End)
(To be inserted by utility) Issued by (To be inserted by CPUC)Advice Letter No. PAUL G. TOWNSLEY Date Filed
Decision No. Name EffectiveVice President Resolution No.
TITLE
5

Attachment 6 to Settlement Agreement (Selected Draft Tariffs)
California Water Service Company2015 GRCRule 15
6

Attachment 6 to Settlement Agreement (Selected Draft Tariffs)
California Water Service Company2015 GRCRule 15
7

Attachment 6 to Settlement Agreement (Selected Draft Tariffs)
California Water Service Company2015 GRCRule 15
8

Attachment 6 to Settlement Agreement (Selected Draft Tariffs)
California Water Service Company2015 GRCRule 15
9

Attachment 6 to Settlement Agreement (Selected Draft Tariffs)
California Water Service Company2015 GRCRule 15
10

Attachment 6 to Settlement Agreement (Selected Draft Tariffs)
California Water Service Company2015 GRCRule 15
11

Attachment 6 to Settlement Agreement (Selected Draft Tariffs)
California Water Service Company2015 GRCRule 15
12

Attachment 6 to Settlement Agreement (Selected Draft Tariffs)
California Water Service Company2015 GRCRule 15
13

Attachment 6 to Settlement Agreement (Selected Draft Tariffs)
California Water Service Company2015 GRCRule 15
14

Attachment 6 to Settlement Agreement (Selected Draft Tariffs)
California Water Service Company2015 GRCRule 15
15

Attachment 6 to Settlement Agreement (Selected Draft Tariffs)
California Water Service Company2015 GRCRule 15
16

Attachment 6 to Settlement Agreement (Selected Draft Tariffs)
California Water Service Company2015 GRCRule 15
17

Attachment 6 to Settlement Agreement (Selected Draft Tariffs)
18

Attachment 6 to Settlement Agreement (Selected Draft Tariffs)
19(END OF ATTACHMENT 6)

Attachment 7
DRAFT PRELIMINARY STATEMENTS

Attachment 7 to Settlement (Draft Preliminary Statements)
CALIFORNIA WATER SERVICE COMPANY Revised Cal. P.U.C. Sheet No. 1720 North First Street, San Jose, CA 95112(408) 367-8200 Canceling Cal. P.U.C. Sheet No.
H. Low-Income Ratepayer Assistance Memorandum Account (LIRA MA) (T)
1. PURPOSE: The purpose of this memorandum account is to track the incremental costs of the LIRA program. (C)
2. ACCOUNTING PROCEDURE: The following entries will be made monthly to the LIRAMA:
a) Costs related to the data sharing process adopted in D.11-05-020, with one-time and ongoing separately (D)|b) All other costs related to the LIRA program except those in (a), above, with one-time and ongoing expenses | tracked separately (tracking only); (D)
a) Incremental LIRA program costs of any new Commission requirements that impact the LIRA program not (T) reflected in authorized rates, with one-time and ongoing costs in (a) and (b), above, identified separately (debit);
b) Monthly interest expense calculated at 1/12 of the most recent month’s interest rate on Commercial (T) Paper (prime, 90-day), published in the Federal Reserve Statistical Release (debit or credit).
3. RATE RECOVERY: There is currently no ratemaking component to the LIRAMA. Requests for recovery of any balance will be processed according to General Order 96-B (or its successor) and Standard Practices or requested in a general rate case.
(To be inserted by utility) (To be inserted by Cal. P.U.C.)
Advice Letter No. Date Filed
Decision No. Effective
Resolution No.
9670-W
Preliminary Statement
-
NAME
(continued)
Issued by
PAUL G. TOWNSLEY
Vice PresidentTITLE
1

Attachment 7 to Settlement (Draft Preliminary Statements)
CALIFORNIA WATER SERVICE COMPANY Revised Cal. P.U.C. Sheet No. 1720 North First Street, San Jose, CA 95112(408) 367-8200 Canceling Cal. P.U.C. Sheet No.
W. TCP LITIGATION MEMORANDUM ACCOUNT (TCP MA) ( T )
1. PURPOSE: The purpose of the TCP MA is to track the costs incurred and proceeds received andapplied with respect to litigation against manufacturers and distributors referred to as potentially responsible parties (PRPs) that manufactured and distributed products that contained ( T )1,2,3 trichloropropane (TCP) in California. Cal Water will incur incremental internal and external coststo support its litigation effort. The TCP MA will track actual costs. The TCP MA will also track litigation awards and settlement proceeds. Finally, the TCP MA will track application of funds received towardsremediation costs, including TCP water treatment expenses and the costs of investments in replacement ( C )and treatment property. ( C )
( D )
2. APPLICABILITY: The TCP MA balance will be recovered from all customer classes within eachapplicable district, except those specifically excluded by the CPUC. The TCP MA applies in allCal Water districts which pump groundwater potentially contaminated with TCP. ( D )
( D )
3. TCP MA RATES: The TCP MA does not currently have a rate component.
4. ACCOUNTING PROCEDURE: Cal Water shall maintain the TCP MA until further order of theCommission authorizes it to be closed or modified. Entries will be made into the TCP MA at the endof each month. The purpose of the entries described herein is to preserve the full range of regulatoryoptions for the Commission and to coordinate this memorandum account with adopted revenue requirements.Entries shall be tracked separately, by district, as follows: ( C )
Investment Entriesa. A credit or debit entry equal to the amounts recorded in Cal Water’s Operations and Maintenance,
and Administrative and General Expense Accounts for each district that incurred costs to supportthe TCP litigation action.
b. A debit or credit entry equal to the amounts obtained in judgments or settlements in the subjectlitigation.
c. A debit or credit entry equal to the original cost of capital investments placed in service to replace TCPcontaminated property or to treat water for TCP contamination, including such projects that have beencompleted prior to the adoption of this memorandum account. Cal Water shall record the capital investment by project and by district.
Revenue Requirement Entries (Note: These entries are not necessarily cumulative and are recordedin order to preserve the range of potential regulatory outcomes the Commission may elect.)
d. A debit or credit entry equal to the revenue requirement of each capital investment recorded in (c.) as ifit were shareholder-funded (including return on investment, income taxes, ad valorem tax, depreciation,other taxes and fees). Cal Water shall record the revenue requirement by project and by district.
e. A debit or credit entry equal to the revenue requirement of each capital investment recorded in (c.) as if it were contributed (including only ad valorem tax, other taxes and fees). Cal Water shall record therevenue requirement by project and by district.
f. A debit or credit entry equal to the amount of revenue requirement for TCP-related plant replacement orwater treatment included in Cal Water’s adopted revenue requirement. Cal Water shall record the revenuerequirement by project and by district.
Interestg. A monthly debit or credit entry equal to the average balance in each segment of the account (as described
in paragraphs a through f) multiplied by 1/12th of the most recent month’s interest rate on CommercialPaper (prime, 90-day), published in Federal Reserve Statistical Release H-15.
5. DISPOSITION: ( N )No more than once every 12 months, Cal Water may file a Tier 3 advice letter to recover TCP costs for |projects that become operational and go into service. Such a filing may occur prior to establishment of a |final Maximum Contaminant Level. Upon completion of all TCP litigation and remediation work, Cal |Water will seek a final disposition of all costs and proceeds across all affected districts to ensure a |comprehensive and equitable distribution. ( N )
(To be inserted by utility) (To be inserted by Cal. P.U.C.)
Advice Letter No. Date Filed
Decision No. Effective
Resolution No.
NAME
8156-W
Preliminary Statement(continued)
Issued by
PAUL G. TOWNSLEY
Vice PresidentTITLE
W-4094
2

Attachment 7 to Settlement (Draft Preliminary Statements)
CALIFORNIA WATER SERVICE COMPANY Revised Cal. P.U.C. Sheet No. 1720 North First Street, San Jose, CA 95112(408) 367-8200 Canceled Cal. P.U.C. Sheet No.
Z2. Conservation Expense One-Way Balancing Account 2 (CEBA2)
1. Purpose:
The purpose of the CEBA2 is to ensure ratepayers fund only conservation programs consistent with theadopted settlement approved by the Commission in D.14-08-011. The account will track the difference between recorded expenses and authorized expenses and refund to customers amounts included in rateswhich were not spent during the three-year authorization period.
2. Applicability:The CEBA2 covers years 2014 through 2016 for all ratemaking areas ("districts") included in Application12-07-007.
3. Accounting Procedure:The following entries will be recorded monthly to each district’s CEBA2.
a. The average annual authorized amount shown on page 14 of the 2012 GRC Settlement Agreement (attached to D.14-08-011 as Exhibit A) will be booked on a monthly level based on the spread of revenue adopted in Cal Water's Preliminary Statement M;
b. Reimbursements from grants provided to offset conservation expenses; (N)c. Recorded conservation expenses including properly accounted-for expense accruals; (T)d. The difference between authorized expenses and grants, and recorded expenses ((3.a. plus 3.b.) minus 3.c.); (C) (T)e. Monthly interest expense calculated on the accumulated balance in 3.h. for the prior month (T)
plus 1/2 of the current monthly balance shown in 3.d. calculated at 1/12 of the most recent month’s. (T)interest rate on Commercial Paper, published in the Federal Reserve Statistical Release H.15 or its successor;
f. The sum of the current and all prior monthly entries in 3.e., above; (T)g. The sum of the current and all prior monthly entries in 3.d., above; (T)h. The sum of 3.f. and 3.g. (T)
4. Ratemaking Procedure:a. Each district's authorized conservation expense has three internal spending caps. Before requesting
amortization in rates, Cal Water shall apply these internal spending caps to the totals in 3.c. and (T)adjust from recorded expense any amounts which exceed categorical limits. Cal Water shall reflectthe adjustment in its final calculation of 3.h. for each district. (T)
b. If the total amount recorded in section 3.h. for any district as of December 31, 2016 is a positive (T)number (meaning accumulated expenditures are less than the three-year authorization), Cal Watershall file an advice letter by March 31, 2017 to refund this amount to ratepayers. This refund shouldbe made as a one-time conservation credit unless the average credit per customer exceeds50% of the adopted monthly service charge for a residential 5/8 X 3/4-inch meter, in which case thecredit should be made over a 12- month period.
c. If the total amount recorded in section 3.h. as of December 31, 2016 for any district is a negative (T)number (meaning the accumulated expenditures exceed the three-year authorization), the balanceshall not be collected.
5. Termination of the AccountThe CEBA2 for each applicable district shall terminate on December 31, 2016 or when the credit described in 4.b is completed, whichever is later. (T)
(To be inserted by Cal. P.U.C.)
Advice Letter No. Date Filed
Decision No. Effective
Resolution No. -
NAME
Vice PresidentTITLE
PAUL G TOWNSLEY
10440-W
Preliminary Statement(continued)
(To be inserted by utility) Issued by
3

Attachment 7 to Settlement (Draft Preliminary Statements)
CALIFORNIA WATER SERVICE COMPANY New Cal. P.U.C. Sheet No. 1720 North First Street, San Jose, CA 95112(408) 367-8200 Cal. P.U.C. Sheet No.
Z3. Conservation Expense One-Way Balancing Account 3 (CEBA3) ( N )
1. Purpose:
The purpose of the CEBA3 is to ensure ratepayers fund only conservation programs consistent with theadopted settlement approved by the Commission in D.xx-xx-xxx. The account will track the difference between recorded expenses and authorized expenses and refund to customers amounts included in rateswhich were not spent during the three-year authorization period.
2. Applicability:
The CEBA3 covers years 2017 through 2019 for all ratemaking areas ("districts") included in Application15-07-015.
3. Accounting Procedure:
The following entries will be recorded monthly to each district’s CEBA3.
a. The average annual authorized amount shown on page xx of the 2015 GRC Settlement Agreement (attached to D.xx-xx-xxx as Exhibit x) will be booked on a monthly level based on the spread of revenue adopted in Cal Water's Preliminary Statement M;
b. Reimbursements from grants provided to offset conservation expenses;
c. Recorded conservation expenses including properly accounted-for expense accruals;
d. The difference between authorized expenses and grants, and recorded expenses ((3.a. plus 3.b.) minus 3.c.);
e. Monthly interest expense calculated on the accumulated balance in 3.h. for the prior monthplus 1/2 of the current monthly balance shown in 3.d. calculated at 1/12 of the most recent month’s.interest rate on Commercial Paper, published in the Federal Reserve Statistical Release H.15 or its successor;
f. The sum of the current and all prior monthly entries in 3.e., above;
g. The sum of the current and all prior monthly entries in 3.d., above;
h. The sum of 3.f. and 3.g.
4. Ratemaking Procedure:
a. Each district's authorized conservation expense has three internal spending caps. Before requestingamortization in rates, Cal Water shall apply these internal spending caps to the totals in 3.c. andadjust from recorded expense any amounts which exceed categorical limits. Cal Water shall reflectthe adjustment in its final calculation of 3.h. for each district.
b. If the total amount recorded in section 3.h. for any district as of December 31, 2019 is a positive number (meaning accumulated expenditures are less than the three-year authorization), Cal Watershall file an advice letter by March 31, 2020 to refund this amount to ratepayers. This refund shouldbe made as a one-time conservation credit unless the average credit per customer exceeds50% of the adopted monthly service charge for a residential 5/8 x 3/4-inch meter, in which case thecredit should be made over a 12-month period.
c. If the total amount recorded in section 3.h. as of December 31, 2019 for any district is a negativenumber (meaning the accumulated expenditures exceed the three-year authorization), the balanceshall not be collected.
5. Termination of the Account
The CEBA3 for each applicable district shall terminate on December 31, 2019 or when the credit described in 4.b is completed, whichever is later. ( N )
Issued by (To be inserted by Cal. P.U.C.)
Advice Letter No. PAUL G TOWNSLEY Date Filed NAME
Decision No. Vice President Effective TITLE
Resolution No. -
(continued)
(To be inserted by utility)
Preliminary Statement
4

Attachment 7 to Settlement (Draft Preliminary Statements)
CALIFORNIA WATER SERVICE COMPANY New Cal. P.U.C. Sheet No. 1720 North First Street, San Jose, CA 95112(408) 367-8200 Cal. P.U.C. Sheet No.
AA3. Pension Cost Balancing Account (PCBA3) (N)
1. PURPOSE:
The PCBA3 will track the difference between the adopted pension expense and California-regulated pension expenserecorded in accordance with Generally Accepted Accounting Principles (GAAP). The adopted and tracked expenses include only the expensed portion of benefits and exclude pension costs assigned to capitalized overhead, capitalized projects, out-of-state affiliates, and unregulated entities.
2. APPLICABILITY:
The PCBA3 is effective beginning January 1, 2017, through December 31, 2019, and applies to all ratemaking areas ("districts") and Customer Support Services (General Office). This excludes out-of-state affiliates and unregulated operation expenses.
3. ACCOUNTING PROCEDURE:
The following entries will be recorded annually to the PCBA3:
a. Annual pension expense, excluding the Supplemental Executive Retirement Plan (SERP) expense, determined by Cal Water's actuarial expert according to the method prescribed by the Financial Accounting Standards Board's Codificationpension trust administrative costs such as the ERISA-required Pension Benefit Guaranty Corporation (PBGC) costs.The capitalized portion of pension costs at the adopted capitalization ratio will be excluded.
b. The annual amount of pension expense authorized to be collected in rates. The capitalized portion of pensioncosts at the adopted capitalization ratio will be excluded.
c. The difference between 3.a and 3.b.
d. The sum of entries in item 3.c., all prior year entries in 3.c., and all accumulated interest calculated in 3.e., below.
e. Monthly interest expense calculated on the accumulated balance in 3.d. calculated at 1/12 of the most recent month’s interest rate on Commercial Paper, published in the Federal Reserve Statistical Release H.15 or its successor. Note that interest only accrues on expenses after the annual calculation has been completed.
4. RATEMAKING PROCEDURE:
The PCBA3 is recoverable in a Tier 2 advice letter filing if the accumulated balance exceeds 2% of gross adopted revenues for Cal Water in accordance with General Order 96-B and standard practices or by request in the next general rate case. In any filing, Cal Water shall demonstrate its continued compliance with SFAS 87 and demonstrate that any changes to its expenses were reasonable and prudently incurred.
In any filing, Cal Water will identify any changes in pension accounting that were required by federal or state law or directed by the Financial Accounting Standards Board. Changes in assumptions reflecting current market, interestrate, or demographic conditions should not be considered "changes in accounting" as these are standard practices used to develop SFAS 87 requirements. (N)
(To be inserted by Cal. P.U.C.)
Advice Letter No. Date Filed
Decision No. Effective
Resolution No.
Preliminary Statement(continued)
(To be inserted by utility) Issued by
PAUL G TOWNSLEY
-
NAMEVice President
TITLE
5

Attachment 7 to Settlement (Draft Preliminary Statements)
CALIFORNIA WATER SERVICE COMPANY New Cal. P.U.C. Sheet No. 1720 North First Street, San Jose, CA 95112(408) 367-8200 Cal. P.U.C. Sheet No.
AB3. Health Cost Balancing Account 3 (HCBA3) (N)
1. PURPOSE:
The purpose of the Health Cost Balancing Account (HCBA3) is to track the difference between the adopted health care expenses (including post-retirement benefits other than pension or PBOB) and the total actual cost incurred as health care expenses. Eighty-five percent (85%) of the reasonable cost difference will be flowed through to ratepayers, and fifteen (15%) of the reasonable cost difference will be at the company’s risk. The difference may be either positive or negative depending upon how actual health care expenses compare to those included in rates.
2. APPLICABILITY:
The HCBA3 is effective beginning January 1, 2017, through December 31, 2019, and applies to all ratemaking areas ("districts") and Customer Support Services (General Office). This excludes out-of-state affiliates and unregulated operations expenses.
3. ACCOUNTING PROCEDURE:
There is no rate component to the HCBA3. Cal Water shall record for future disposition the following entries:
a. Eighty-five percent (85%) of the difference between the adopted health care expenses and the actual cost incurred as health care expenses will be included in the balancing account, as either a debit or a credit balance depending upon if the actual costs exceed or are less than the amounts adopted in rates. The capitalized portion of health care expenses at the adopted capitalization ratio will be excluded.
b. A monthly debit or credit entry equal to the average balance in each segment of the account multiplied by 1/12th of the most recent month’s interest rate on Commercial Paper (prime, 90-day) published in the Federal Reserve Statistical Release H-15.
4. DISPOSITION:
The HCBA3 is recoverable or refundable in a Tier 2 advice letter filing if the accumulated balance exceeds 2% of gross adopted annual revenues for Cal Water in accordance with General Order 96-B and standard practices or by request in the next general rate case. (N)
(To be inserted by utility) (To be inserted by Cal. P.U.C.)Advice Letter No. Date Filed
Decision No. Effective
Resolution No. -
NAMEVice President
TITLE
Issued byPAUL G TOWNSLEY
(continued)Preliminary Statement
6

Attachment 7 to Settlement (Draft Preliminary Statements)
CALIFORNIA WATER SERVICE COMPANY Revised Cal. P.U.C. Sheet No. 1720 North First Street, San Jose, CA 95112(408) 367-8200 Canceling Cal. P.U.C. Sheet No.
AI. CHROMIUM-6 MEMORANDUM ACCOUNT (CHROMIUM-6 MA)
1. PURPOSE: The purpose of the Chromium-6 Memorandum Account (Chromium-6 MA) is to track the incremental costs incurred to comply with the Maximum Contaminant Level (MCL) that is adopted by the California Department of Public Health (CDPH) for chromium-6 in order to coordinate recoveryof costs with adopted revenue requirements. Cal Water may begin tracking incremental costs in thisaccount after a final MCL is adopted by the CDPH, and may request recovery of the tracked costs through a one-time Tier 3 advice letter per district, or through its next GRC, according to the procedures ( T )described below.
2. APPLICABILITY: The Chromium-6 MA applies to all regulated operations. This excludes out-of-state affiliates and unregulated operations expenses. The MA is to be closed as part of Cal Water’s 2015 ( D )general rate case application (for Test Year 2017). ( D )
3. RATES: The Chromium-6 MA has no rate component.
4. ACCOUNTING PROCEDURE: After an MCL for chromium-6 is adopted by the CDPH, Cal Water shall make the entries described below. The “incremental costs” that may be tracked in this account are costs (including labor, overhead, operations & maintenance expenses, and capital-related costs including return on investment, income taxes, ad valorem tax, depreciation, and other taxes and fees) that are over and above those that the Commission has approved for recovery through base rates. Cal Water may not ( D )track in this memo account costs that can be reasonably forecasted for inclusion Cal Water’s next ( D )general rate case application, to be filed in July 2015 (i.e., Cal Water may not include in this ( D )memorandum account costs and revenue requirement expected to be incurred starting in January 1, ( D )2017, the beginning of the GRC cycle following A.12-07-007). ( D )
(a) A debit or credit entry equal to incremental expenses for compliance with the MCL, as describedabove;
(b) A debit or credit entry equal to the incremental revenue requirement of each operationally in-service and closed to plant capital investment for compliance with the MCL (including return on investment, income taxes, ad valorem tax,depreciation, and other taxes and fees), as described above.
(c) A monthly debit or credit entry equal to the average balance in each segment of the account multiplied by 1/12th of the most recent month’s interest rate on Commercial Paper (prime, 90-day) published in the Federal Reserve Statistical Release H-15.
5. REGULATORY PROCEDURE:
(a) Required justifications: For each capital project, Cal Water will provide detailed justifications that contain least-cost analyses considering all feasible alternatives, including but not limited to blending, removing the well from active status, and Best Available Technologies (“BATs”) for chromium-6 treatment as specified in Title 22, California Code of Regulations. The need to maintain the affected well’s active status, thus requiring capital investment, must be supported with consideration of the district’s available water supply resources, including new supply projects authorized in the 2012 GRC.
(b) For recovery through an advice letter: Cal Water may only file one Tier 3 advice letter each for ( C )Dixon and Salinas per district. Cal Water may file two Tier 3 advice letters for Willows. ( C )When the last capital project in an advice letter filing a district is nearing completion ( C )(operationally in-service and closed to plant), and ( T )approximately one month before an advice letter seeking recovery is filed, Cal Water will confer with the Office of Ratepayer Advocates to alert it of the advice letter filing, and begin providing the data supporting both the capital projects and expenses in the memo account for which recovery will be requested. The advice letter will request (a) inclusion of the revenue requirements for the authorized projects in rates going forward, and (b) a surcharge to recover the incremental revenuerequirement and expenses tracked in the memo account.
(c) For recovery in a GRC: To the extent that incremental chromium-6 costs are not included in the beginning plant balance for the next GRC, or are not otherwise recovered, Cal Water may request cost recovery in the next GRC. In that event, Cal Water shall note the request in the Chromium-6 MA for tracking purposes.
(To be inserted by utility) (To be inserted by Cal. P.U.C.)
Advice Letter No. Date Filed
Decision No. Effective
Resolution No.
Issued by
Preliminary Statement(continued)
-
PAUL G. TOWNSLEYNAME
- Vice PresidentTITLE
7

Attachment 7 to Settlement (Draft Preliminary Statements)
Revised Cal. P.U.C. Sheet No. 1720 North First Street, San Jose, CA 95112(408) 367-8200 Canceling Cal. P.U.C. Sheet No.
AM. Rate Support Fund Balancing Account (RSF BA) (T)
1. Purpose: The purpose of the Rate Support Fund Balancing Account ("RSFBA") is to track the RSF subsidies (credits) provided to customers in an RSF ratemaking area ("RSF District") defined in Tariff Schedule No. RSF, (C)to track the RSF surcharges collected to fund the Rate Support Fund ("RSF") Program, and to review and adjust the RSF surcharge, if necessary, effective January 1st of each year. (C)
The RSF subsidies tracked in this account provide a discounted quantity rate for the first 10 units of consumption (N) (D)per month on a customer's bill. The quantity rate discount is the difference between the lowest adopted quantity ratein the service area, and an RSF Index Rate (Discounted RSF Quantity Rate). The RSF Index Rate is calculated by by applying 150% to Cal Water's system-wide average rate of total residential usage revenues divided by total residential quantity water sales. The amount of the surcharge will be set sufficient to fund the RSF program.
2. Timing and Frequency: An advice letter to report on the status of the RSF surcharge will be filed by October 31st of each year.
3. Annual Surcharge Adjustment: The surcharge may be adjusted to zero out the forecasted balance anticipated to bein the account at the end of the following year. (N) (D)
4. Rate: The rate components of the RSF BA are identified in Tariff Schedule No. RSF. (T)
5. Accounting Procedure: The following entries will be made monthly to the RSF BA: (T)
a. A debit entry equal to the recorded RSF credits (subsidies) given to customers for service provided under Schedule No. RSF;
b. A debit entry of $993,015 for each of the three years in the 2017-2019 rate case cycle to reflect the subsidies (N)that offset the revenue requirements of the former Redwood Valley District service areas of Coast Springs, (N)Lucerne, and Unified; (N)
c. A credit entry equal to the recorded RSF surcharges collected from all customers (except for LIRA customers (T)in RSF Districts) as provided under Schedule No. RSF;
d. A monthly debit or credit entry equal to the average balance in each segment of the account multiplied by 1/12th (T)of the most recent month’s interest rate on Commercial Paper (prime, 90-day) published in the Federal Reserve Statistical Release H-15.
(To be inserted by utility) (To be inserted by Cal. P.U.C.)
Advice Letter No. Date Filed
Decision No. Effective
Resolution No.TITLE
-
PAUL G. TOWNSLEYNAME
Vice President
10446-W
Preliminary Statement(continued)
Issued by
8(END OF ATTACHMENT 7)

Attachment 8
MAIN REPLACEMENT 2016 SUBPROJECTS

Attachment 8 to Settlement Agreement - Main Replacement Subprojects
DistrictWorkOrder
NumberProject Description
GRC Justification
Drawing Letter
Length(Feet)
Bakersfield 00104059 Install 1268'- 8" PVC W. Union Ave L 1,268Bakersfield 00104219 Install 1076' 6" PVC- Cecil Brunner AW 1,076Bakersfield 00104903 Install 494' 6" PVC on Pentz E 494Bakersfield 00105537 Install 1644 LF 6" PVC Cedar St F 1,644Bakersfield 00105860 Install 1400 LF 6" PVC 1st St V 1,400Bakersfield 00105977 Install 1210 LF 8" PVC on Virgina W 1,210Bakersfield 00105980 Install 740 LF on Augusta St X 740Bakersfield 00106039 Install 675' of 6" PVC-Kentucky St. Z 675Bakersfield 00106268 Install 1240 LF 6" PVC Butte & Chic Y 1,240Bakersfield 00106457 Install 200LF 6"PVC on Easter St AX 200Bakersfield 00106557 Install 468 LF 6" PVC on Truxtun AA 468Bakersfield 00106559 Install 650LF of 8" PVC on Northrup AC 650Bakersfield 00106801 Install 568 LF of 6" Calfornia Ave AE 568Bakersfield 00106802 638' 6" PVC Chester Place AD 638Bakersfield 00106868 1623' 6"PVC Altus & S. O Sts AF 1,623Bakersfield 00106869 3115' 8" PVC Ming Av./Southgate AG 3,115Bakersfield 00106870 800' 8" PVC Fishering & Jones Sts. AH 800Bakersfield 00106871 1461' 8" PVC Terrace Way AI 1,461Bakersfield 00106872 1554' 6" PVC Planz Rd. AJ 1,554Bakersfield 00106873 148' 6" PVC Height St @ River Blvd AL 148Bakersfield 00106874 1976' 8" PVC Castro Ln & Ming Ave AM 1,976Bakersfield 00106875 690 LF 8" PVC Bliss St. D 690Bakersfield 00106876 1436' 6" PVC Hawthorne St. M 1,436Bakersfield 00106877 345' 6" PVC E.19th St. Alley N/A 345Bakersfield 00106878 147' 6" PVC Dolores St. W/O Haley H 147Bakersfield 00107477 1,380LF 8" PVC Spruce St C 1,380Bakersfield Total 26,946Bayshore 00103384 1630' 6" PVC ROLLING HILLS - SM C 1,630Bayshore 00103678 Replace 2435' 6/8" 39th, Lola, Sky C 2,435Bayshore 00103905 RPL 1490' 8" PVC Torino, Caprino F 1,490Bayshore 00104048 2830' 12" DI Brittan Ave (SM) F 2,830Bayshore 00104696 3999' 6"/8" Tramanto/Porto/Hewitt F 3,999Bayshore 00106019 1400' 6" PVC Eucalyptus - SC N/A 1,400Bayshore Total 13,784Bear Gulch 00103739 Install 580 Feet in Tynan Way C 580Bear Gulch 00103942 INSTALL 2412' OF 8" PVC W. SELBY LN F 2,412Bear Gulch 00104040 700' 6" PVC Nimitz Ave F 700Bear Gulch 00104045 4050' 8" PVC Alexander & Rutherford H 4,050Bear Gulch 00104117 INSTALL 350' OF 6" PVC RIDGE CT. M 350Bear Gulch 00104118 905' OF 6" PVC/DI LOUISE & STANFORD Q 905Bear Gulch 00104262 INSTALL 240' OF 6" PVC WILLIAMS CT. P 240Bear Gulch 00104286 300'-6" PVC RANDALL & PEMBROKE PL. O 300Bear Gulch 00104337 INSTALL 500'-6" PVC GREENWOOD PL. K 500Bear Gulch 00104346 INSTALL 4100' OF 8" DI OLHR J 4,100Bear Gulch 00104406 INSTALL 2240'-8" DI OLHR J 2,240Bear Gulch 00107679 SANTA CRUZ AVE. 12" DI N/A 3,875Bear Gulch Total 20,252Chico 00103335 3490' 8" PVC El Varano, El Paso A 3,490Chico 00103339 1650' 6" PVC El Cerrito Dr. A 1,650Chico 00104074 160' 6" PVC PINE ST @ E 9TH ST C 160Chico 00104218 212' 6" PVC CEDAR ST B 212Chico 00104282 2432' -6" DI Salem St/Alley PH1 E 2,432
California Water Service Company2015 GRC
Main Replacement Program 2016 Subprojects
1

Attachment 8 to Settlement Agreement - Main Replacement Subprojects
DistrictWorkOrder
NumberProject Description
GRC Justification
Drawing Letter
Length(Feet)
Chico 00104298 2136' PVC (1796'-6" & 340'-8") PH2 E, G, H, I 2,136Chico 00106042 900' PVC(730'-8"/170'-6") E10th PH1 J 900Chico 00106245 1530' -8" PVC E 10th St PH 2 J 1,530Chico Total 12,510Dixon 00103423 275' 6" PVC in E. WALNUT C 275Dixon 00103583 487' 6" PVC E MAYES/S 5TH ST. D 487Dixon Total 762Dominguez 00103586 500' 6" PVC Mariposa & Kenwood C 500Dominguez 00104624 INSTALL 780' OF 8" PVC MAIN 780Dominguez 00104636 Install 1696'-6" Main W 222ND St D 1,696Dominguez 00104637 Inst. 1507'-6" Main W 226TH St H 1,507Dominguez 00104639 Inst. 1068'-6" Main W 218TH St G 1,068Dominguez 00104647 Inst. 1846'-6" Main W 232ND St E 1,846Dominguez Total 7,397East Los Angeles 00103879 1900' 6" PVC Via Miramonte C 1,900East Los Angeles 00103923 2080' 6" PVC Via Luneto E 2,080East Los Angeles 00103940 1860' 6" PVC Madison & Cleveland Av C & E 1,860East Los Angeles 00106662 2,332' 8" PVC Hazard Ave. A 2,332East Los Angeles Total 8,172Hermosa Redondo 00104477 Repl. 750'-12" AC Main Esplanade F 750Hermosa Redondo 00104517 Inst. 1425'-8" Main N. Pac. Cst. Hw H 1,425Hermosa Redondo 00104521 Repl 1417' of Main Delicias A 1,417Hermosa Redondo 00104577 Inst. 2320'-6" PVC Main Monte Doro D 2,320Hermosa Redondo Total 5,912Kern River Valley 00103703 Install 793 ft 6" PVC in Tobias St C 793Kern River Valley 00104621 600' 6" PVC Tobias & Easement C 600Kern River Valley 00104625 280 6" PVC Monache Dr C 280Kern River Valley Total 1,673King City 00103597 Install 448'-8" PVC Main Lynn St B 448King City Total 448Livermore 00104261 2550' 8" PVC Murrieta Blvd H 2,550Livermore 00105520 1050' 6" PVC Ventura/Lambaren A 1,050Livermore Total 3,600Los Altos 00103480 3000' 24" DI HOMESTEAD RD A 3,000Los Altos 00103482 3900' 8" PVC MORA DR I 3,900Los Altos 00103638 2,000 LF Homestead Rd 24" A 2,000Los Altos 00103841 185' 6" PVC GIFFIN RD B 185Los Altos 00103957 230' 6" PVC DRACENA LN J 230Los Altos 00104017 3320' 6" PVC DISTEL,CASITA,ALICIA D 3,320Los Altos 00105597 2977' 6" PVC Panchita & Los Ninos E 2,977Los Altos 00107339 Mora/Loyola 1,280' of 12" DI Pipe I 1,280Los Altos Total 16,892Marysville 00103643 900' 6" PVC Divver St Ph 1 A 900Marysville 00103760 840' 6" PVC DIVVER ST PH 2 A 840Marysville Total 1,740Oroville 00103381 535' - 6" PVC Acacia Ave. D 535Oroville 00105718 1096' -8" PVC 3rd Ave C,I 1,096Oroville 00106880 700' -12" D.I. Bridge St F 700Oroville Total 2,331Palos Verdes 00105086 Install 390'-8"DI Portuguese Bend E 390Palos Verdes 00105087 Inst. 635'-6" DI Main PV Dr. North C 635Palos Verdes 00105088 Inst. 2123' -8" DI Main Sweetbay Rd D 2,123Palos Verdes 00105089 1064'-6" DI Main-Via De La Guerra N/A 1,064Palos Verdes 00105090 Install 7,894' 6" DI Indian Peak H, I 7,894Palos Verdes Total 12,106
2
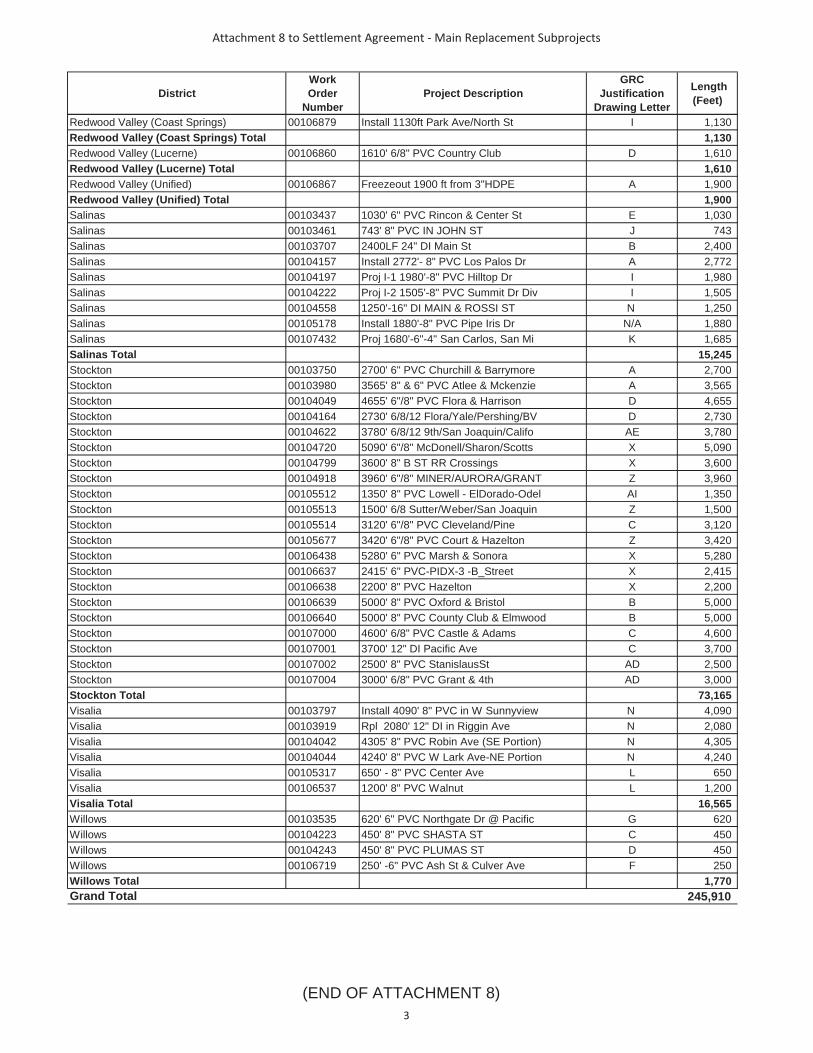
Attachment 8 to Settlement Agreement - Main Replacement Subprojects
DistrictWorkOrder
NumberProject Description
GRC Justification
Drawing Letter
Length(Feet)
Redwood Valley (Coast Springs) 00106879 Install 1130ft Park Ave/North St I 1,130Redwood Valley (Coast Springs) Total 1,130Redwood Valley (Lucerne) 00106860 1610' 6/8" PVC Country Club D 1,610Redwood Valley (Lucerne) Total 1,610Redwood Valley (Unified) 00106867 Freezeout 1900 ft from 3"HDPE A 1,900Redwood Valley (Unified) Total 1,900Salinas 00103437 1030' 6" PVC Rincon & Center St E 1,030Salinas 00103461 743' 8" PVC IN JOHN ST J 743Salinas 00103707 2400LF 24" DI Main St B 2,400Salinas 00104157 Install 2772'- 8" PVC Los Palos Dr A 2,772Salinas 00104197 Proj I-1 1980'-8" PVC Hilltop Dr I 1,980Salinas 00104222 Proj I-2 1505'-8" PVC Summit Dr Div I 1,505Salinas 00104558 1250'-16" DI MAIN & ROSSI ST N 1,250Salinas 00105178 Install 1880'-8" PVC Pipe Iris Dr N/A 1,880Salinas 00107432 Proj 1680'-6"-4" San Carlos, San Mi K 1,685Salinas Total 15,245Stockton 00103750 2700' 6" PVC Churchill & Barrymore A 2,700Stockton 00103980 3565' 8" & 6" PVC Atlee & Mckenzie A 3,565Stockton 00104049 4655' 6"/8" PVC Flora & Harrison D 4,655Stockton 00104164 2730' 6/8/12 Flora/Yale/Pershing/BV D 2,730Stockton 00104622 3780' 6/8/12 9th/San Joaquin/Califo AE 3,780Stockton 00104720 5090' 6"/8" McDonell/Sharon/Scotts X 5,090Stockton 00104799 3600' 8" B ST RR Crossings X 3,600Stockton 00104918 3960' 6"/8" MINER/AURORA/GRANT Z 3,960Stockton 00105512 1350' 8" PVC Lowell - ElDorado-Odel AI 1,350Stockton 00105513 1500' 6/8 Sutter/Weber/San Joaquin Z 1,500Stockton 00105514 3120' 6"/8" PVC Cleveland/Pine C 3,120Stockton 00105677 3420' 6"/8" PVC Court & Hazelton Z 3,420Stockton 00106438 5280' 6" PVC Marsh & Sonora X 5,280Stockton 00106637 2415' 6" PVC-PIDX-3 -B_Street X 2,415Stockton 00106638 2200' 8" PVC Hazelton X 2,200Stockton 00106639 5000' 8" PVC Oxford & Bristol B 5,000Stockton 00106640 5000' 8" PVC County Club & Elmwood B 5,000Stockton 00107000 4600' 6/8" PVC Castle & Adams C 4,600Stockton 00107001 3700' 12" DI Pacific Ave C 3,700Stockton 00107002 2500' 8" PVC StanislausSt AD 2,500Stockton 00107004 3000' 6/8" PVC Grant & 4th AD 3,000Stockton Total 73,165Visalia 00103797 Install 4090' 8" PVC in W Sunnyview N 4,090Visalia 00103919 Rpl 2080' 12" DI in Riggin Ave N 2,080Visalia 00104042 4305' 8" PVC Robin Ave (SE Portion) N 4,305Visalia 00104044 4240' 8" PVC W Lark Ave-NE Portion N 4,240Visalia 00105317 650' - 8" PVC Center Ave L 650Visalia 00106537 1200' 8" PVC Walnut L 1,200Visalia Total 16,565Willows 00103535 620' 6" PVC Northgate Dr @ Pacific G 620Willows 00104223 450' 8" PVC SHASTA ST C 450Willows 00104243 450' 8" PVC PLUMAS ST D 450Willows 00106719 250' -6" PVC Ash St & Culver Ave F 250Willows Total 1,770Grand Total 245,910
3
(END OF ATTACHMENT 8)

Attachment 9
SELECTED TABLES FOR GLOBAL PLANT ISSUES

Attachment 9 – Selected Tables for Global Plant Issues
In Chapter 12, this Settlement Agreement addresses “Global Plant Issues.”. This
attachment provides additional details as specified below. (Projects listed in Chapter 12 and in
this Attachment 9 are also presented in individual district plant chapters.)
See Chapter 12 for tables relating to the following issues:
Non-Specific Capital Budgets Pipeline Replacement Program (also see Attachment 8) Flat-to-Metered Conversions AMI/AMR Projects SCADA Customer Meter Replacement
This Attachment 9 provides project lists corresponding to the settlement agreement on the following:
Electrical Panelboard Flow Meter Replacement Generator Replacement Pump Replacement Tank Painting Hydro-Pneumatic Tank Replacement Control Valve Replacement
See Attachment 11 for vehicle project lists.

Attachment 9 to Settlement Agreement – Selected Global Plant Projects
2
A. ELECTRICAL PANELBOARD PROJECTS
District Year PID Description SettlementBayshore 2016 00097866 Replace panelboard at San Mateo Sta. 27 $317,180Bayshore 2018 00098172 Replace panelboard at SC 119 $256,615Bear Gulch 2017 00098689 Panelboard Replacement at Bear Gulch
Station 14 $236,869
Chico 2017 00098016 Panelboard Replacement at CH Sta. 026 $160,981Chico 2018 00098032 Replace electrical panelboard at CH 35 $156,148Livermore 2016 00098023 Replace panelboard at Livermore Station
9 $268,055
Livermore 2017 00098122 Replace the panelboard at Livermore Station 10
$199,458
Los Altos 2017 00097865 Replace panelboard at Los Altos Station 9 $194,949Los Altos 2018 00098010 Panelboard needs to be replaced at Los
Altos Station 27 $277,563
Marysville 2016 00098713 Panelboard Replacement at Marysville Station 7
$231,091
Marysville 2018 00098693 Panelboard Replacement at Marysville Station 9
$239,830
Oroville 2016 00098715 Replace panelboard and install generator to operate all equipment at Oroville Station 15.
$214,642
Stockton 2018 00098353 Install new Panelboard and retire existing at Stn 35
$256,144
Stockton 2017 00098369 Install new Panelboard and retire existing at Sta. 7
$263,398
Visalia 2017 00098290 Install new Panelboard and retire existing at Stn13
$257,389
Visalia 2017 00098340 Install new Panelboard and retire existing at Stn14
$236,809
Visalia 2017 00098341 Install new Panelboard and retire existing at Stn32
$250,098
Total $4,017,219

Attachment 9 to Settlement Agreement – Selected Global Plant Projects
3
B. FLOW METER REPLACEMENT PROJECTS
District Year PID Description SettlementBakersfield 2017 00098696 Install Flow meters at 4 of the following 9
Stations 87, 45, 73, 100,116, 176, 186, 194, 196
$183,643
Bayshore 2016 00098304 Replace a flow meter and vault at Station 2 or at Station 4
$48,933
Bayshore 2016 00098325 Replace Flow meter and vault at Station 26, San Mateo
$11,628
Bayshore 2018 00098533 Install flow meters at 6 of the following 8 Stations 6, 12, 22, 23, 25, 27, 28, 29 San Mateo
$253,597
Bayshore 2018 00099254 Replace Flow meter and Vault at stations SSF-5,7,and 101
$158,256
Bear Gulch 2018 00098610 Install flow meters at stations 4,20,33,35,36,38
$298,683
Chico 2016 00098734 Replace Flow meter at 3 stations in 2016 $150,774Chico 2017 00098735 Install new or Replace Flow meters at 3
stations in 2017 $154,543
Chico 2018 00098740 Replace Flow meter at 3 stations in 2018 $78,990Livermore 2017 00098868 Install flow meter for Zone 7 Turnout #VI
to CWS system $64,325
Livermore 2018 00098870 Install Flow Meter for Zone 7 Turnout # VII to CWS system
$65,933
Los Altos 2016 00098765 Install flow meter at 3 of the following 5 stations 7,10,19,104,38
$138,105
Marysville 2017 00098906 Replace Flow meter at Station 9 $19,585Oroville 2016 00098902 Replace Flow meter at Sta. 10 to enable
SCADA Monitoring $29,873
Salinas 2016 00098926 Replace flow meters in new vaults at Stations. Location TBD
$135,530
Salinas 2017 00098929 Replace 2 flow meters in new vaults at Stations. Location TBD
$65,282
Salinas 2018 00098930 Replace 2 flow meters in new vaults at Stations. Location TBD
$44,137
Stockton 2018 00098953 Install 3 flow meters. Locations TBD $132,750Stockton 2018 00098954 Install 3 flow meters. Locations TBD $139,470Visalia 2017 00098997 Replace 3 flow meters and install vaults
located at stations to be identfied. Add to SCADA
$139,856
Visalia 2017 00098999 Replace flow meter Sta. 69 $16,088Westlake 2016 00099000 Replace flow meter Sta. 10 $31,391

Attachment 9 to Settlement Agreement – Selected Global Plant Projects
4
C. GENERATOR REPLACEMENT PROJECTS
District Year PID Description SettlementBakersfield 2018 00098047 Replace existing auxiliary engine at Sta.
157 with portable generator and automatic transfer switch
$100,000
Bakersfield 2017 00098847 Replace existing auxiliary engine at BK 150 with new 150 kW generator
$198,948
Bakersfield 2017 00099140 Standby generator for the raw water pumping plant at the NE WTP.
$858,709
Bayshore 2016 00098160 Installa 150 kW generator at MPS Operations Center
$196,492
Bayshore 2018 00098281 Install portable generator quick connect at San Mateo Sta. 26
$59,777
Bear Gulch 2016 00098712 Portable emergency backup generator sized to keep Station 6, 23, 24, and 26 in service in the event of a power outage.
$70,631
Bear Gulch 2016 00099268 Replace existing Generator at Sta. 33 $166,555Bear Gulch 2017 00099291 Replace existing Generator at Station 35 $170,719Bear Gulch 2018 00099295 Replace existing Generator at Station 36 $174,987Chico 2016 00098024 Need to replace portable generator $1,442Chico 2017 00098044 Installa 150 KW generator $201,404Chico 2018 00098041 Install 150 kW generator $206,439Dixon 2016 00097857 Install Standby generator for Customer
center $142,445
East Los Angeles 2016 00098458 Install Standby generator for Operations Center
$91,776
Livermore 2017 00098150 Install a generator at Livermore Station 23
$299,960
Palos Verdes 2016 00099480 Generator Replacement PV Sta 38 $184,889Redwood Valley (Unified)
2016 00102003 Install emergency generator at Station 1 in Hawkins
$25,640
Salinas 2016 00098634 Install Back up Generator sta 25 Salinas $261,370Salinas 2017 00098209 Replace the generator at Salinas Station
29 $198,069
Stockton 2017 00098624 Install Back up Generator sta 79 Stockton $251,628Stockton 2017 00098625 Install Back up Generator sta 66 Stockton $282,906Visalia 2016 00098545 Install Portable Generator at Station 37 $100,000Visalia 2016 00098549 Install Back up Generator sta 7 Visalia $238,901

Attachment 9 to Settlement Agreement – Selected Global Plant Projects
5
D. PUMP REPLACEMENT PROJECTS
District Year PID Description Amount Bakersfield 2016 00097886 Replace existing pumps that have worn out and
are over 3 years old. Repair parts are over half price of a new pump.
$27,226
Bakersfield 2016 00098072 Replacement of pump and motor. $67,092Bakersfield 2016 00098074 Replacement of pump and motor. $52,607Bakersfield 2016 00098079 Replacement of pump and motor. $52,607Bakersfield 2016 00098081 Replacement of pump and motor. $191,174Bakersfield 2016 00098084 Replacement of pump and motor. $94,287Bakersfield 2017 00098093 Replacement of pump and motor. $58,917Bakersfield 2018 00098094 Replacement of pump and motor. $71,896Bakersfield 2018 00098096 Replacement of pump and motor. $60,390Bakersfield 2018 00098269 Replace existing pumps that have worn out and
over 3 years old. Repair parts are over half the price of a new pump.
$18,389
Bakersfield 2017 00099127 Replace capacitors on two raw water pump VFD's at NE WTP raw water pumping plant.
$115,914
Bayshore 2016 00097862 Replacement of 30 Hp Submersible pump and motor.
$61,936
Bayshore 2016 00098261 Replace pump, foundation, and piping. $57,148Bayshore 2016 00099293 Existing well pumps need to be upsized for the
new head requirements including three electrical upgrades. Two boosters need to be replaced.
$406,964
Bayshore 2017 00097876 Replacement of horizontal pump and 100Hp motor (SSF001-D)
$68,824
Bayshore 2017 00097877 Replacement of pump and 15 Hp motor (MPS 120-A)
$53,922
Bayshore 2018 00097880 Replacement of pump and 75 Hp motor (MPS 27-C)
$70,488
Bayshore 2018 00097881 Replacement of pump and 75 Hp motor (MPS 27-D)
$70,488
Bayshore 2018 00097882 Replacement of pump and 15 Hp motor (MPS 119-B)
$55,270
Bayshore 2018 00097884 Replacement of pump and 40 Hp motor (MPS 119-C)
$55,270
Bear Gulch 2016 00097766 Replacement of pump and motor (24-B) $52,607Bear Gulch 2017 00097769 Replacement of pump and motor (25-A) $53,922Bear Gulch 2018 00097773 Replacement of pump and motor (19-A) $55,270Chico 2016 00097444 Station 16 - remove building and go with outside
pump shelter, replace station piping, replace all electrical, remove air stripper, and replace pump. (booster pump may need removal only)
$590,370

Attachment 9 to Settlement Agreement – Selected Global Plant Projects
6
District Year PID Description Amount Chico 2016 00097585 ROUTINE REPLACEMENTS OF 6 ALLDOS CL2
PUMPS AT VARIOUS STATIONS $19,776
Chico 2016 00097961 Replacement of pump and 60 Hp motor. CH 018-01
$63,950
Chico 2017 00097587 ROUTINE REPLACEMENT OF 6 ALLDOS CL2 PUMPS AT VARIOUS LOCATIONS
$20,270
Chico 2017 00097968 Replacement of pump and 75 Hp motor. CH 034-01
$86,188
Chico 2017 00098033 Need 2 new sump pumps to replace old/aging sump pumps.
$2,464
Chico 2017 00098400 Replacement of pump and 100 Hp motor. CH 041-01
$103,641
Chico 2018 00097588 ROUTINE REPLACEMENT OF 6 ALLDOS CL2 PUMPS AT VARIOUS LOCATIONS
$20,777
Chico 2018 00098398 Replacement of pump and 75 Hp motor. CH 063-01
$88,342
CSS 2016 00099030 Replace Portable Booster Pumps ########Dominguez 2017 00098097 DOM 279-01 Replace Pump and Motor $106,684Dominguez 2018 00098099 DOM 275-01 Replace Pump and Motor $88,342East Los Angeles
2016 00097712 Complete pump replacement. $104,082
East Los Angeles
2016 00098145 Replace Backwash Pump - Station 13 $9,520
East Los Angeles
2016 00098177 Replace Reclaim Pump Sta #38 $9,835
East Los Angeles
2018 00097795 Complete pump replacement. $55,270
East Los Angeles
2018 00098115 Complete pump replacement. $65,072
Hermosa Redondo
2016 00098116 Replace Pump and Motor $52,607
Hermosa Redondo
2017 00098118 HR 029-A Replace Pump and Motor $53,922
Hermosa Redondo
2017 00098120 HR 013-E Replace Pump and Motor $58,917
Hermosa Redondo
2018 00098121 HR 013-F Replace Pump and Motor $60,390
Hermosa Redondo
2018 00098128 HR 028-A Replace Pump and Motor $60,390
King City 2016 00097831 KC 004-D Replace Pump and Motor $49,449Livermore 2016 00097889 Replacement of pump and 30 Hp motor. Sta.
010-A $52,607
Livermore 2017 00097951 Replacement of pump and 30Hp motor. Sta. 022-B
$61,562
Livermore 2017 00097952 Replacement of pump and 25Hp motor. Sta. 008- $63,485

Attachment 9 to Settlement Agreement – Selected Global Plant Projects
7
District Year PID Description Amount 01
Livermore 2018 00097954 Replacement of pump and 10HP motor. Sta. 026-A
$55,270
Los Altos 2016 00097788 Replacement of pump and motor. Sta. 010-B $52,607Los Altos 2016 00097789 Replacement of pump and motor. Sta. 114-D $52,607Los Altos 2017 00097790 Replacement of pump and motor. Sta. 007-D $68,769Los Altos 2018 00097813 Replacement of pump and motor. Sta. 017-A $70,488Los Altos 2018 00097814 Replacement of pump and motor. Sta. 033-B $70,488Oroville 2016 00099022 Replacement of pump and 100 Hp motor. $101,113Palos Verdes 2016 00098131 PV 038-A Replace Pump and Motor $52,607Palos Verdes 2016 00099046 PV 023-D Install Pump Shelter $49,096Palos Verdes 2017 00098140 PV 038-B Replace Pump and Motor $53,922Palos Verdes 2017 00098142 PV 015-C Replace Pump and Motor $70,143Palos Verdes 2017 00098149 PV 005-A Replace Pump and Motor $53,922Palos Verdes 2017 00099080 PV 015-C Install Pump Shelter $17,296Palos Verdes 2018 00099078 PV 023-G Install Pump Shelter $51,581Palos Verdes 2018 00099079 PV 022-B Install Pump Shelter $51,581Salinas 2016 00097815 Replacement of pump and motor. $67,092Salinas 2016 00097817 Replacement of pump and motor. $67,092Salinas 2016 00097818 Replacement of pump and motor. $67,092Salinas 2016 00097819 Replacement of pump and motor. $52,607Salinas 2016 00098985 Remove and replace existing booster pumps at
Station 47 $466,452
Salinas 2017 00097820 Replacement of pump and motor. $53,922Salinas 2017 00097821 Replacement of pump and motor. $49,449Salinas 2017 00097823 Replacement of pump and motor. $49,449Salinas 2018 00097826 Replacement of pump and motor. $65,072Visalia 2017 00098051 Replacement of pump and motor due to low
efficiency. $63,485
Visalia 2017 00098054 Replacement of pump and motor. $63,485Visalia 2017 00098064 Replacement of pump and motor. $86,188Westlake 2016 00098163 Replacement of pump and motor. Sta. 010-A $67,092Westlake 2017 00098168 Replacement of pump and motor. Sta. 010-B $68,769Westlake 2017 00098169 Replacement of pump and motor. Sta. 010-C $68,769Westlake 2017 00098202 Replacement of pump and motor. Sta. 010-D $68,769Westlake 2018 00098203 Replacement of pump and motor. Sta. 007-C $55,270

Attachment 9 to Settlement Agreement – Selected Global Plant Projects
8
E. TANK PAINTING PROJECTS
Project Cost
District PID 2015 2016 2017 2018 2019 TOTAL
Antelope Valley 64951 $88,224.0 $88,224.0
97930 $102,400.0 $102,400.0
Total $88,224.0 $0.0 $0.0 $102,400.0 $0.0 $190,624.0
Bayshore 96398 $44,476.9 $44,476.9
94979 $81,415.8 $81,415.8
94986 $58,656.1 $58,656.1
94970 $21,600.7 $21,600.7
98872 $26,413.4 $26,413.4
97997 $124,079.0 $124,079.0
98009 $26,433.0 $26,433.0
98009 $225,253.0 $225,253.0
97883 $148,415.0 $148,415.0
97847 $206,877.0 $206,877.0
97843 $93,073.0 $93,073.0
97840 $720,132.0 $720,132.0
Total $232,562.9 $0.0 $1,544,262.0 $0.0 $0.0 $1,776,824.9
Bakersfield 27051 $103,905.7 $103,905.7
51808 $205,190.8 $205,190.8
61734 $148,486.5 $148,486.5
98208 $232,058.4 $232,058.4
97867 $165,376.0 $165,376.0
97681 $139,669.5 $139,669.5
97913 $298,036.3 $298,036.3
97913 $174,327.3 $174,327.3
97912 $160,847.1 $160,847.1
97913 $93,072.7 $93,072.7
97913 $93,027.7 $93,027.7
97914 $78,123.2 $78,123.2
97917 $218,200.0 $218,200.0
Total $457,583.0 $0.0 $537,103.9 $897,434.2 $218,200.0 $2,110,321.1
Bear Gulch 29009 $162,049.2 $162,049.2
98082 $219,554.9 $219,554.9
98108 $90,684.0 $90,684.0
98098 $114,725.0 $114,725.0
98134 $325,067.0 $325,067.0
98119 $48,454.0 $48,454.0
98141 $20,000.0 $20,000.0
Total $162,049.2 $424,963.9 $373,521.0 $20,000.0 $0.0 $980,534.1

Attachment 9 to Settlement Agreement – Selected Global Plant Projects
9
Project Cost
District PID 2015 2016 2017 2018 2019 TOTAL
Dixon 25570 $130,448.4 $130,448.4
Dominguez 27867 $53,618.4 $53,618.4
53608 $44,794.2 $44,794.2
61773 $509,280.5 $509,280.5
62160 $24,427.2 $24,427.2
97919 $7,380.0 $7,380.0
97919 $7,380.0 $7,380.0
97918 $676,000.0 $676,000.0
97921 $171,247.0 $171,247.0
97921 $171,247.0 $171,247.0
Total $632,120.3 $690,760.0 $342,494.0 $0.0 $0.0 $1,665,374.3
East Los Angeles 25569 $678,727.3 $678,727.3
51670 $108,436.1 $108,436.1
61833 $839,005.9 $839,005.9
61872 $117,552.0 $117,552.0
97923 $8,673.0 $8,673.0
97923 $8,673.0 $8,673.0
97925 $192,347.0 $192,347.0
97925 $80,000.0 $80,000.0
97927 $155,570.0 $155,570.0
TBD $206,124.0 $206,124.0
Total $1,743,721.3 $289,693.0 $361,694.0 $0.0 $0.0 $2,395,108.3
Hermosa Redondo 97797 $598,521.0 $598,521.0
97793 $66,252.0 $66,252.0
97802 $80,028.0 $80,028.0
Total $0.0 $0.0 $664,773.0 $80,028.0 $0.0 $744,801.0
Kern River Valley 97909 $82,720.0 $82,720.0
97910 $42,165.0 $42,165.0
97911 $26,700.0 $26,700.0
97929 $39,133.0 $39,133.0
97931 $180,009.8 $180,009.8
97928 $8,100.0 $8,100.0
98258 $47,184.5 $47,184.5
Total $0.0 $82,720.0 $288,007.8 $55,284.5 $0.0 $426,012.3
King City 98192 $64,000.0 $64,000.0
Livermore 50668 $136,000.9 $136,000.9
50728 $241,379.7 $241,379.7
98226 $146,265.0 $146,265.0
98226 $33,428.0 $33,428.0

Attachment 9 to Settlement Agreement – Selected Global Plant Projects
10
Project Cost
District PID 2015 2016 2017 2018 2019 TOTAL
Total $377,380.6 $179,693.0 $0.0 $0.0 $0.0 $557,073.6
Los Altos 98012 $65,567.5 $65,567.5
98012 $65,567.5 $65,567.5
$40,688.1 $40,688.1
98352 $255,000.0 $255,000.0
98339 $76,146.7 $76,146.7
98352 $440,000.0 $440,000.0
97991 $136,028.2 $136,028.2
98346 $237,200.0 $237,200.0
Total $0.0 $942,969.8 $136,028.2 $237,200.0 $0.0 $1,316,198.0
Palos Verdes 95010 $659,559.6 $659,559.6
95014 $53,792.5 $53,792.5
97933 $90,425.0 $90,425.0
97932 $84,400.0 $84,400.0
Total $713,352.1 $0.0 $0.0 $174,825.0 $0.0 $888,177.1
Redwood - Lucerne 98249 $87,942.0 $87,942.0
98252 $30,688.9 $30,688.9
Total $0.0 $87,942.0 $30,688.9 $0.0 $0.0 $118,630.9
Redwood - Unified 98254 $37,900.0 $37,900.0
Salinas 97905 $300,719.0 $300,719.0
97896 $26,556.2 $26,556.2
97977 $339,300.0 $339,300.0
Total $0.0 $0.0 $327,275.2 $339,300.0 $0.0 $666,575.2
Stockton 100638 $497,484.0 $497,484.0
94998 $290,568.4 $290,568.4
Total $788,052.4 $0.0 $0.0 $0.0 $0.0 $788,052.4
Westlake 27089 $235,886.4 $235,886.4
Grand Total $5,561,381 $2,698,742 $4,605,848 $2,008,372 $218,200 $15,092,542

Attachment 9 to Settlement Agreement – Selected Global Plant Projects
11
F. HYDRO-PNEUMATIC TANK REPLACEMENT PROJECTS
District Year PID Description SettlementBakersfield 2017 00097728 The existing 5,000 gal pressure tank was
installed in 1953 (see Attach 1). The unit will have been in service for 63 years by 2016. In short, the unit has reached the end of its useable useful life and replacement is needed for better station efficiency and improvement in operations.
$150,993
Bakersfield 2016 00097762 Replace the existing 10,000 gal pressure tank,at Sta. 100 which was installed in 1954.
$221,860
Bakersfield 2017 00097899 Replace the existing 10,000 gal pressuretank at Sta. 116, which was installed in 1953.
$127,411
Bakersfield 2018 00098124 Replace ex 9,500 gal pressure tank at Sta. 83
$133,092
Bayshore 2018 00098123 Replace existing 3,000 gal hydropneumatic tank, foundation, and piping at Sta. 25.
$156,492
Bayshore 2017 00098186 Replace existing 3,000 gal hydropneumatic tank, foundation, and piping at Sta. 119.
$160,404
Bear Gulch 2017 00098015 Sta 27 Pressure Tank Replacement $171,609Bear Gulch 2018 00098013 Sta 19 Pressure Tank Replacement $158,985Oroville 2016 00097507 Replace existing 5,000 gal
hydropneumatic tank whose nameplate pressure is 75 psi, with a higher rated pressure vessel for normal operating conditions of 40 to 80 psi.
$152,674
Salinas 2016 00098489 Replace pressure tank at station 58 Country Meadows.
$154,457
Westlake 2016 00098244 Station 011 Smokey Ridge Replace Hydropneumatic Pressure Vessel
$219,364

Attachment 9 to Settlement Agreement – Selected Global Plant Projects
12
G. CONTROL VALVE REPLACEMENT PROJECTS
District Year PID Description Settlement Bakersfield 2016 00098526 Replacement of 4 control valves in
Bakersfield. Location: 101_000_CV004, 101_000_CV016, 101_000_CV003, 101_045_VLV
$117,065
Bakersfield 2017 00098532 Replacement of 1 control valve in Bakersfield. Location: 101_000_CV022
$29,998
Bakersfield 2016 00098619 Overhaul of Control Valves in the Bakersfield District - 2016
$39,070
Bakersfield 2017 00098626 Overhaul of Control Valves in the Bakersfield District - 2017
$40,044
Bakersfield 2016 00098690 update RTU and Install control valve (Cla-Val) to take more water from University Tanks to Skyline Tanks.
$45,568
Bayshore 2016 00098443 Overhaul of Control Valves in the Bayshore District - 2016
$65,000
Bayshore 2016 00098449 Overhaul of Control Valves in the South San Francisco District - 2016
$13,657
Bayshore 2016 00098506 Replacement of 4 of the following 5 control valves in Mid Peninsula MPS (SC) 117, MPS (SC) 118, MPS 0-CV12, MPS 0-CV17, MPS 0-CV26
$117,065
Bayshore 2017 00098445 Overhaul of Control Valves in the Bayshore District - 2017
$65,781
Bayshore 2017 00098451 Overhaul of Control Valves in the South San Francisco District - 2017
$13,995
Bayshore 2018 00098510 Replacement of 4 of the following 5 control valves in Mid Peninsula MPS (SM) 002, MPS (SM) 003, MPS (SM) 006, MPS (SC) 118, MPS 0-CV44
$119,991
Bayshore 2018 00098448 Overhaul of Control Valves in the Bayshore District - 2018
$66,927
Bayshore 2018 00098454 Overhaul of Control Valves in the South San Francisco District - 2018
$23,495
Bayshore 2018 00098514 Replacement of 2 of the following 5 control valves in Mid Peninsula MPS (SM) 025, MPS 0-CV45, MPS 0-CV47, MPS 0-CV63, MPS 0-CV65
$76,869
Bayshore 2018 00098516 Replacement of 1 of the following 2 control valves in South San Francisco. Location: SSF 0-CV3, SSF 0-CV4
$30,748
Bear Gulch 2016 00098426 Overhaul of Control Valves in the Bear Gulch District - 2016
$46,259
Bear Gulch 2016 00098521 Replacement of 2 of the following 3 $58,533

Attachment 9 to Settlement Agreement – Selected Global Plant Projects
13
District Year PID Description Settlement control valves in Bear Gulch.Location: 102_000_CV003, 102_000_CV016, 102_000_CV017
Bear Gulch 2017 00098435 Overhaul of Control Valves in the Bear Gulch District - 2017
$48,216
Bear Gulch 2017 00098522 Replacement of 3 control valves in Bear Gulch. Location: 102_000_CV018, 102_000_CV021, 102_000_CV033
$89,994
Bear Gulch 2018 00098442 Overhaul of Control Valves in the Bear Gulch District - 2018
$49,374
Bear Gulch 2018 00098524 Replacement of 4 control valves in Bear Gulch. Location: 102_000_CV033, 102_018_CV001, 102_019_CV001, 102_019_CV002
$122,991
Dominguez 2016 00098630 2016 Control Valve Overhaul - 128 $40,645Dominguez 2017 00098632 2017 Control Valve Overhaul - 128 $41,645Dominguez 2018 00098633 2018 Control Valve Overhaul - 128 $44,662East Los Angeles 2016 00098537 Replacement of 2 control valves in East
Los Angeles. Location: Sta. 023, Hazard and Folsom.
$58,532
Hermosa Redondo
2016 00098540 2016 HR Control Valve Rplcmnt. $29,266
Hermosa Redondo
2017 00098615 2017 HR Control Valve Rplcmnt. $29,998
Hermosa Redondo
2018 00098539 2018 HR Control Valve Rplcmnt. $30,748
Livermore 2016 00098523 Overhaul of Control Valves in the Livermore District - 2016
$39,378
Livermore 2017 00098525 Overhaul of Control Valves in the Livermore District - 2017
$40,359
Livermore 2018 00098527 Overhaul of Control Valves in the Livermore District - 2018
$41,364
Livermore 2016 00098599 Replacement of 3 control valves in Livermore.
$87,799
Livermore 2017 00098600 Replacement of 3 control valves in Livermore.
$89,994
Livermore 2018 00098601 Replacement of 3 control valves in Livermore.
$92,243
Los Altos 2016 00098469 Overhaul of Control Valves in the Los Altos District - 2016
$26,835
Los Altos 2017 00098515 Overhaul of Control Valves in the Los Altos District - 2017
$27,506
Los Altos 2018 00098519 Overhaul of Control Valves in the LosAltos District - 2018
$28,194
Palos Verdes 2016 00098616 2016 PV Control Valve Rplcmnt. $204,863

Attachment 9 to Settlement Agreement – Selected Global Plant Projects
14
District Year PID Description Settlement Palos Verdes 2017 00098618 2017 PV Control Valve Rplcmnt. $209,985Palos Verdes 2018 00098620 2018 PV Control Valve Rplcmnt. $184,487Salinas 2016 00098602 Replacement of 2 control valves in
Salinas. Location: 114_000_CV002. 114_000_CV002
$58,532
Salinas 2016 00098673 Replacement of 6 control valves in Salinas. Location: 114_000_CV010. 114_303_CV001, 114_203_CV001, 114_047_CV002, 114_203_CV002, 114_063_CV001
$175,597
Salinas 2017 00098603 Replacement of 2 of the following 3 control valves in Salinas. Location: 114_106_CV001, 114_305_CV001, 114_202_CV001
$59,996
Salinas 2018 00098604 Replacement of 3 of the following 4 control valves in Salinas. Location: 114_016_CV001, 114_016_CV002, 114_017_CV001, 114_017_CV002
$92,244
Visalia 2016 00098048 Replacement of 2 control valves in Visalia. 120_012_CV001 120_059_CV001
$58,532
Westlake 2016 00098605 Replacement of 1 control valve in Westlake. Location: 123_000_CV001
$29,266
Westlake 2017 00098606 Replacement of 1 control valve in Westlake. Location: 123_000_CV002
$29,998
(END OF ATTACHMENT 9)

Attachment 10
LIST OF SUBSEQUENT OFFSETS

Attachment 10 to Settlement Agreement – List of Subsequent Offsets
1
Applicable AL # Description Date Filed
% ChangeTypical Res. Bill
Revenue Change %
Antelope Valley District
2198-A SRM Filing only – No Revenue change November 25, 2015
LAN- 8%, LEO-8.2%, FMT-6.8%
$0 0.0%
Bakersfield District 2197 Steps & SRM Filing November 25, 2015 11.6% $542,120 0.8%
2216 Correction on BKD 2197 RD May 27, 2016 -5.2% $0 0.0%
Bayshore District 2192 Rate Base Offset August 18, 2015 0.09% $66,738 0.1%
2197-B Steps & SRM Filing December 15, 2015 0.27% $190,734 0.3%2217 Purchased Water Offset June 20, 2016 6.1% $4,171,400 5.4%
Bear Gulch District 2197-B Steps & SRM Filing December 15, 2015 2.5% $400,068 0.8%2218 Purchased Water Offset June 20, 2016 5.9% $2,294,033 4.8%
Chico District 2197-A Steps & SRM Filing November 25, 2015 5.1% $229,687 1.1%
Dixon District 2197-A Steps & SRM Filing November 25, 2015 9.2% $16,306 0.5%
Dominguez District 2200 Purchased Water Offset December 22, 2015 0.5% $402,400 0.7%
2221 Purchased Water & Pump Tax Offset June 28, 2016 1.4% $1,040,787 1.7%
East Los Angeles District 2197-C Steps & SRM Filing December 21, 2015 5.5% $1,282,788 3.9%2206 Purchased Water Offset December 22, 2015 0.9% $309,147 0.9%
Hermosa/Redondo District 2197-B Steps & SRM Filing December 15, 2015 2.2% $225,976 0.8%2201-A Purchased Water Offset December 28, 2015 1.0% $243,900 0.8%
2222 Purchased Water & Pump Tax Offset June 29, 2016 1.4% $333,020 1.1%

Attachment 10 to Settlement Agreement – List of Subsequent Offsets
2
Applicable AL # Description Date Filed
% ChangeTypical Res. Bill
Revenue Change %
Kern River Valley District
2198-C SRM Filing only – No Revenue change December 21, 2015 4.8% $0 0.0%
King City District 2197-B SRM Filing December 15, 2015 7.1% $117,952 3.6%
Livermore District 2198-C Steps & SRM Filing December 29, 2015 3.9% $169,285 0.8%2204 Purchased Water Offset December 22, 2015 5.4% $930,600 4.6%
2205 Temp. Drought Surcharge Offset December 22, 2015 8.9% $1,886,000 8.9%
Los Altos District 2193 Ratebase Offset August 18, 2015 0.34% $98,185 0.3%
2224-A Purchased Water Offset July 20, 2016 9.3% $2,441,208 8.3%
Marysville District 2197-D Steps & SRM Filing December 21, 2015 6.6% $97,287 2.7%
Oroville District 2197-A Steps & SRM Filing November 25, 2015 3.9% $15,310 0.3%
Palos Verdes District 2198-B Steps & SRM Filing December 29, 2015 2.1% $110,731 0.3%2202 Purchased Water Offset December 22, 2015 1.3% $494,200 1.1%2220 Ratebase Offset June 20, 2016 0.4% $164,173 0.4%2223 Purchased Water Offset June 29, 2016 1.5% $597,000 1.3%
Redwood Valley – Coast Springs None
Redwood Valley - Lucerne
2198-A SRM Filing only – No Revenue change November 25, 2015 5.0% $0 0.0%

Attachment 10 to Settlement Agreement – List of Subsequent Offsets
3
Applicable AL # Description Date Filed
% ChangeTypical Res. Bill
Revenue Change %
Redwood Valley - Unified
2198-A SRM Filing only – No Revenue change November 25, 2015 5.8% $0 0.0%
Salinas District 2196-B Steps Filing December 15, 2015 4.9% $724,579 2.6%
Selma District 2197-A Steps Filing November 25, 2015 6.4% $49,711 1.0%
Stockton District
2194-A STK Purchased Water Offset September 23, 2015 4.2% $1,645,345 4.5%
2197-A Steps Filing November 25, 2015 4.5% $618,291 1.6%
2219-A STK Purchased Water Offset July 15, 2016 7.5% $2,978,084 7.7%
Visalia District
2198-C SRM Filing – No Revenue Change December 21, 2015 6.5% $0 0.0%
Westlake District 2197-C Steps Filing December 21, 2015 2.8% $156,516 0.9%2203 Purchased Water Offset December 28, 2015 3.1% $491,900 2.8%
Willows District 2197-A Steps Filing November 25, 2015 6.9% $34,174 1.5%
(END OF ATTACHMENT 10)

Attachment 11
VEHICLE DETAILS

Attachment 11
District Year PIDPID
AmountVehicle Description
Vehicle Amount
CSS 2015 00065190 $36,406 Vehicle - 0.5 Ton Pick Up - So Cal Pool $36,406CSS 2015 00065419 $92,432 Vehicle - 1 Ton C&C and Service Body - EMT $92,432CSS 2015 00065426 $90,031 Vehicle - SUV - VP Corporate Development $90,031CSS 2015 00097235 $46,259 Additional Vehicle - Corp Sec $46,259CSS 2016 00064948 $30,241 Vehicle - New Vehicle - CS Process Analyst $30,241CSS 2016 00064949 $27,996 Vehicle - Hybrid Sedan - No Cal Pool $27,996CSS 2016 00064950 $74,199 Vehicle - New EMT Vehicle $74,199CSS 2016 00064953 $91,800 Vehicle - New EMT C&C $91,800CSS 2016 00064955 $91,800 Vehicle - C&C - EMT $91,800CSS 2016 00065192 $36,488 Vehicle - Sedan - Water Quality Project Manager $36,488CSS 2016 00065417 $67,665 Vehicle - 1 Ton C&C and Service Body - EMT $67,665CSS 2016 00065418 $48,809 Vehicle - Sedan - VP of Rates $48,809CSS 2016 00099136 $608,041 Replace V205074 $41,521CSS 2016 00099136 $608,041 Replace V208140 $41,521CSS 2016 00099136 $608,041 Replace V208163 $41,521CSS 2016 00099136 $608,041 Replace V209077 $41,521CSS 2016 00099136 $608,041 Replace V207097 $38,243CSS 2016 00099136 $608,041 Replace V207098 $38,243CSS 2016 00099136 $608,041 Replace V209075 $38,243CSS 2016 00099136 $608,041 Replace V209079 $38,243CSS 2016 00099136 $608,041 Replace V209089 $38,243CSS 2016 00099136 $608,041 Replace V210004 $38,243CSS 2016 00099136 $608,041 Replace V208147 $38,243CSS 2016 00099136 $608,041 Replace V209001 $38,243CSS 2016 00099136 $608,041 Replace V209084 $38,243CSS 2016 00099136 $608,041 Replace V210033 $38,243CSS 2016 00099136 $608,041 Replace V210026 $59,527CSS 2016 00099418 $38,243 Pool Car for Corporate Communications Department $38,243CSS 2016 00099961 $38,243 Pool Car for So Cal Engineering Group $38,243CSS 2017 00099137 $711,180 Replace V213064 $42,559CSS 2017 00099137 $711,180 Replace V213060 $48,159CSS 2017 00099137 $711,180 Replace V208014 $96,317CSS 2017 00099137 $711,180 Replace V209071 $96,317CSS 2017 00099137 $711,180 Replace V210028 $96,317CSS 2017 00099137 $711,180 Replace V211022 $96,317CSS 2017 00099137 $711,180 Replace V205064 $39,199CSS 2017 00099137 $711,180 Replace V209095 $39,199CSS 2017 00099137 $711,180 Replace V205006 $39,199CSS 2017 00099137 $711,180 Replace V212027 $39,199CSS 2017 00099137 $711,180 Replace V212036 $39,199CSS 2017 00099137 $711,180 Replace V213055 $39,199CSS 2018 00099138 $611,812 Replace V212030 $43,623CSS 2018 00099138 $611,812 Replace V211028 $97,521CSS 2018 00099138 $611,812 Replace V208155 $40,179CSS 2018 00099138 $611,812 Replace V209080 $40,179
California Water Service Company2015 GRC
Vehicle Details
1

Attachment 11
District Year PIDPID
AmountVehicle Description
Vehicle Amount
California Water Service Company2015 GRC
Vehicle Details
CSS 2018 00099138 $611,812 Replace V213049 $40,179CSS 2018 00099138 $611,812 Replace V213063 $40,179CSS 2018 00099138 $611,812 Replace V211031 $40,179CSS 2018 00099138 $611,812 Replace V212035 $40,179CSS 2018 00099138 $611,812 Replace V213053 $40,179CSS 2018 00099138 $611,812 Replace V213061 $40,179CSS 2018 00099138 $611,812 Replace V213065 $40,179CSS 2018 00099138 $611,812 Replace V213067 $40,179CSS 2018 00099138 $611,812 Replace V213075 $68,878Antelope Valley
2016 00099100 $112,543 Replace V211018 $41,521
Antelope Vall 2016 00099100 $112,543 Replace V209053 $71,022Antelope Vall 2018 00099108 $149,236 Replace V213037 $74,618Antelope Vall 2018 00099108 $149,236 Replace V213038 $74,618Bakersfield 2016 00064483 $52,936 Replace V204042 $52,936Bakersfield 2016 00064488 $42,000 Replace V205005 $42,000Bakersfield 2016 00064491 $44,556 Replace V207002 $44,556Bakersfield 2016 00064493 $38,772 Replace V207005 $38,772Bakersfield 2016 00064498 $37,643 Replace V208010 $37,643Bakersfield 2016 00099110 $339,816 Replace V204021 $41,521Bakersfield 2016 00099110 $339,816 Replace V204074 $41,521Bakersfield 2016 00099110 $339,816 Replace V207008 $41,521Bakersfield 2016 00099110 $339,816 Replace V207113 $41,521Bakersfield 2016 00099110 $339,816 Replace V208104 $41,521Bakersfield 2016 00099110 $339,816 Replace V206034 $46,984Bakersfield 2016 00099110 $339,816 Replace V208011 $46,984Bakersfield 2016 00099110 $339,816 Replace V207021 $38,243Bakersfield 2017 00099111 $353,801 Replace V208062 $41,521Bakersfield 2017 00099111 $353,801 Replace V204043 $71,022Bakersfield 2017 00099111 $353,801 Replace V204076 $71,022Bakersfield 2017 00099111 $353,801 Replace V205006 $42,559Bakersfield 2017 00099111 $353,801 Replace V207014 $42,559Bakersfield 2017 00099111 $353,801 Replace V207017 $42,559Bakersfield 2017 00099111 $353,801 Replace V214054 $42,559Bakersfield 2018 00099112 $261,142 Replace V200039 $77,578Bakersfield 2018 00099112 $261,142 Replace V209006 $48,159Bakersfield 2018 00099112 $261,142 Replace V210005 $48,159Bakersfield 2018 00099112 $261,142 Replace V206037 $43,623Bakersfield 2018 00099112 $261,142 Replace V208103 $43,623Bayshore 2015 00020847 $57,982 Vehicle - Leak Truck - C&C, Utility Body, & Mobile
Radio$57,982
Bayshore 2015 00079576 $38,566 Purchase new vehicle $38,566Bayshore 2015 00079577 $40,549 Purchase new vehicle $40,549Bayshore 2016 00065437 $40,700 Vehicle - 0.5 Ton Pickup and Ou i ng $40,700Bayshore 2016 00065438 $40,700 Vehicle - 0.5 Ton Pickup and Ou i ng - Meter Reader $40,700
2
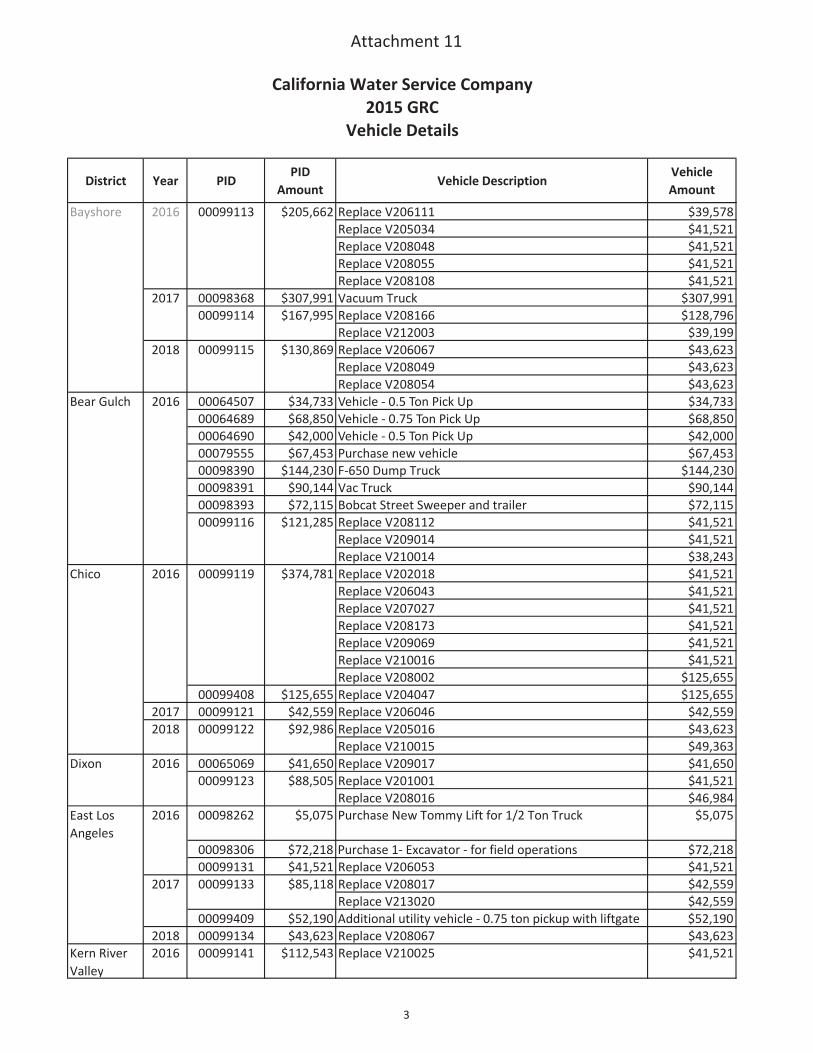
Attachment 11
District Year PIDPID
AmountVehicle Description
Vehicle Amount
California Water Service Company2015 GRC
Vehicle Details
Bayshore 2016 00099113 $205,662 Replace V206111 $39,578Bayshore 2016 00099113 $205,662 Replace V205034 $41,521Bayshore 2016 00099113 $205,662 Replace V208048 $41,521Bayshore 2016 00099113 $205,662 Replace V208055 $41,521Bayshore 2016 00099113 $205,662 Replace V208108 $41,521Bayshore 2017 00098368 $307,991 Vacuum Truck $307,991Bayshore 2017 00099114 $167,995 Replace V208166 $128,796Bayshore 2017 00099114 $167,995 Replace V212003 $39,199Bayshore 2018 00099115 $130,869 Replace V206067 $43,623Bayshore 2018 00099115 $130,869 Replace V208049 $43,623Bayshore 2018 00099115 $130,869 Replace V208054 $43,623Bear Gulch 2016 00064507 $34,733 Vehicle - 0.5 Ton Pick Up $34,733Bear Gulch 2016 00064689 $68,850 Vehicle - 0.75 Ton Pick Up $68,850Bear Gulch 2016 00064690 $42,000 Vehicle - 0.5 Ton Pick Up $42,000Bear Gulch 2016 00079555 $67,453 Purchase new vehicle $67,453Bear Gulch 2016 00098390 $144,230 F-650 Dump Truck $144,230Bear Gulch 2016 00098391 $90,144 Vac Truck $90,144Bear Gulch 2016 00098393 $72,115 Bobcat Street Sweeper and trailer $72,115Bear Gulch 2016 00099116 $121,285 Replace V208112 $41,521Bear Gulch 2016 00099116 $121,285 Replace V209014 $41,521Bear Gulch 2016 00099116 $121,285 Replace V210014 $38,243Chico 2016 00099119 $374,781 Replace V202018 $41,521Chico 2016 00099119 $374,781 Replace V206043 $41,521Chico 2016 00099119 $374,781 Replace V207027 $41,521Chico 2016 00099119 $374,781 Replace V208173 $41,521Chico 2016 00099119 $374,781 Replace V209069 $41,521Chico 2016 00099119 $374,781 Replace V210016 $41,521Chico 2016 00099119 $374,781 Replace V208002 $125,655Chico 2016 00099408 $125,655 Replace V204047 $125,655Chico 2017 00099121 $42,559 Replace V206046 $42,559Chico 2018 00099122 $92,986 Replace V205016 $43,623Chico 2018 00099122 $92,986 Replace V210015 $49,363Dixon 2016 00065069 $41,650 Replace V209017 $41,650Dixon 2016 00099123 $88,505 Replace V201001 $41,521Dixon 2016 00099123 $88,505 Replace V208016 $46,984East Los Angeles
2016 00098262 $5,075 Purchase New Tommy Lift for 1/2 Ton Truck $5,075
East Los Ange 2016 00098306 $72,218 Purchase 1- Excavator - for field operations $72,218East Los Ange 2016 00099131 $41,521 Replace V206053 $41,521East Los Ange 2017 00099133 $85,118 Replace V208017 $42,559East Los Ange 2017 00099133 $85,118 Replace V213020 $42,559East Los Ange 2017 00099409 $52,190 Additional utility vehicle - 0.75 ton pickup with liftgate $52,190East Los Ange 2018 00099134 $43,623 Replace V208067 $43,623Kern River Valley
2016 00099141 $112,543 Replace V210025 $41,521
3
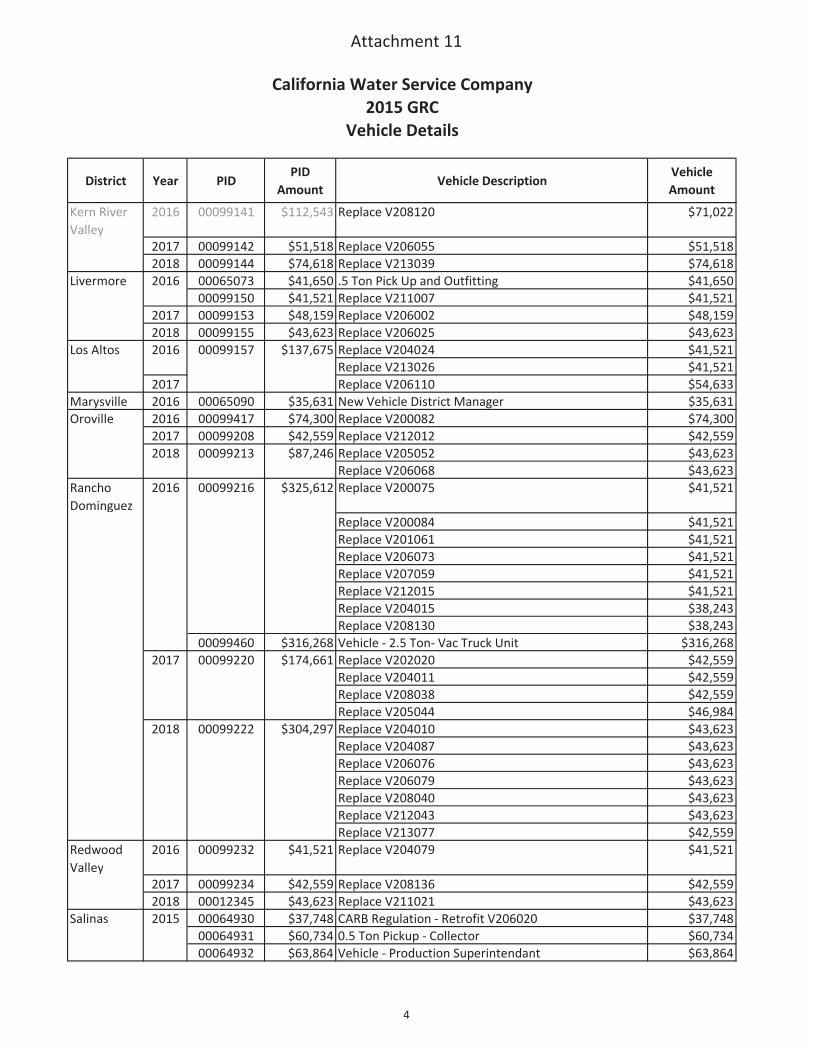
Attachment 11
District Year PIDPID
AmountVehicle Description
Vehicle Amount
California Water Service Company2015 GRC
Vehicle Details
Kern River Valley
2016 00099141 $112,543 Replace V208120 $71,022
Kern River Va 2017 00099142 $51,518 Replace V206055 $51,518Kern River Va 2018 00099144 $74,618 Replace V213039 $74,618Livermore 2016 00065073 $41,650 .5 Ton Pick Up and Outfitting $41,650Livermore 2016 00099150 $41,521 Replace V211007 $41,521Livermore 2017 00099153 $48,159 Replace V206002 $48,159Livermore 2018 00099155 $43,623 Replace V206025 $43,623Los Altos 2016 00099157 $137,675 Replace V204024 $41,521Los Altos 2016 00099157 $137,675 Replace V213026 $41,521Los Altos 2017 00099157 $137,675 Replace V206110 $54,633Marysville 2016 00065090 $35,631 New Vehicle District Manager $35,631Oroville 2016 00099417 $74,300 Replace V200082 $74,300Oroville 2017 00099208 $42,559 Replace V212012 $42,559Oroville 2018 00099213 $87,246 Replace V205052 $43,623Oroville 2018 00099213 $87,246 Replace V206068 $43,623Rancho Dominguez
2016 00099216 $325,612 Replace V200075 $41,521
Rancho Domi 2016 00099216 $325,612 Replace V200084 $41,521Rancho Domi 2016 00099216 $325,612 Replace V201061 $41,521Rancho Domi 2016 00099216 $325,612 Replace V206073 $41,521Rancho Domi 2016 00099216 $325,612 Replace V207059 $41,521Rancho Domi 2016 00099216 $325,612 Replace V212015 $41,521Rancho Domi 2016 00099216 $325,612 Replace V204015 $38,243Rancho Domi 2016 00099216 $325,612 Replace V208130 $38,243Rancho Domi 2016 00099460 $316,268 Vehicle - 2.5 Ton- Vac Truck Unit $316,268Rancho Domi 2017 00099220 $174,661 Replace V202020 $42,559Rancho Domi 2017 00099220 $174,661 Replace V204011 $42,559Rancho Domi 2017 00099220 $174,661 Replace V208038 $42,559Rancho Domi 2017 00099220 $174,661 Replace V205044 $46,984Rancho Domi 2018 00099222 $304,297 Replace V204010 $43,623Rancho Domi 2018 00099222 $304,297 Replace V204087 $43,623Rancho Domi 2018 00099222 $304,297 Replace V206076 $43,623Rancho Domi 2018 00099222 $304,297 Replace V206079 $43,623Rancho Domi 2018 00099222 $304,297 Replace V208040 $43,623Rancho Domi 2018 00099222 $304,297 Replace V212043 $43,623Rancho Domi 2018 00099222 $304,297 Replace V213077 $42,559Redwood Valley
2016 00099232 $41,521 Replace V204079 $41,521
Redwood Val 2017 00099234 $42,559 Replace V208136 $42,559Redwood Val 2018 00012345 $43,623 Replace V211021 $43,623Salinas 2015 00064930 $37,748 CARB Regulation - Retrofit V206020 $37,748Salinas 2015 00064931 $60,734 0.5 Ton Pickup - Collector $60,734Salinas 2015 00064932 $63,864 Vehicle - Production Superintendant $63,864
4
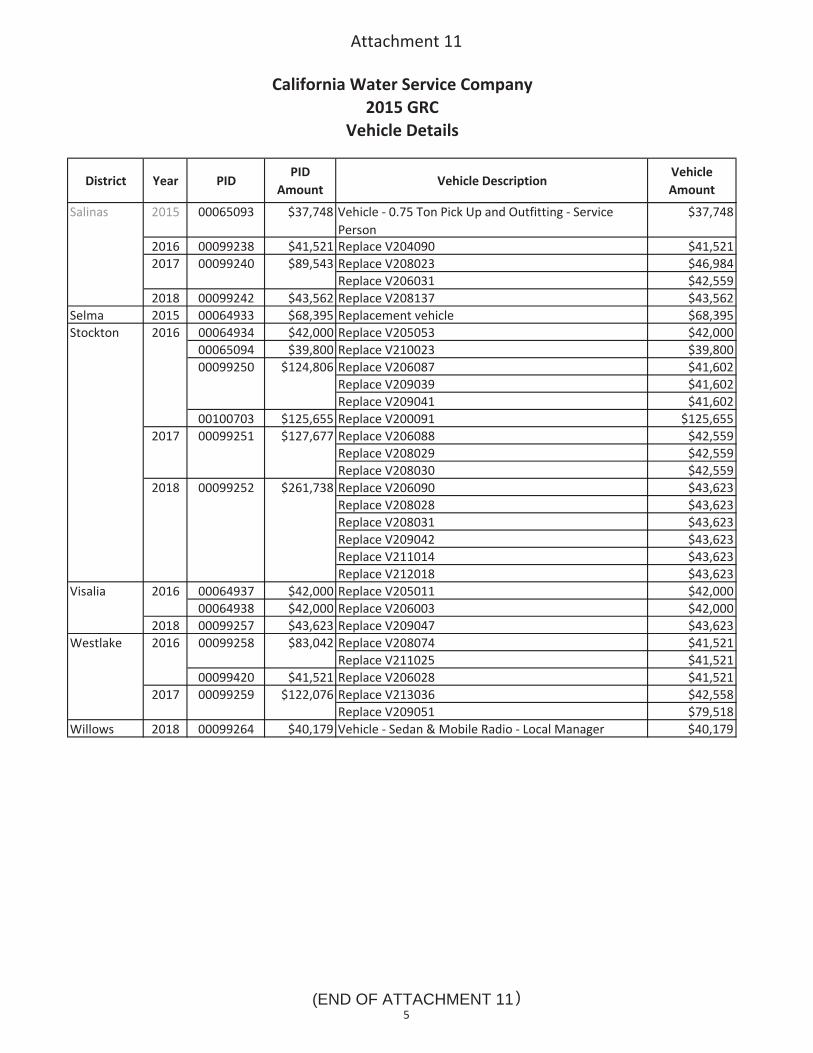
Attachment 11
District Year PIDPID
AmountVehicle Description
Vehicle Amount
California Water Service Company2015 GRC
Vehicle Details
Salinas 2015 00065093 $37,748 Vehicle - 0.75 Ton Pick Up and Outfitting - Service Person
$37,748
Salinas 2016 00099238 $41,521 Replace V204090 $41,521Salinas 2017 00099240 $89,543 Replace V208023 $46,984Salinas 2017 00099240 $89,543 Replace V206031 $42,559Salinas 2018 00099242 $43,562 Replace V208137 $43,562Selma 2015 00064933 $68,395 Replacement vehicle $68,395Stockton 2016 00064934 $42,000 Replace V205053 $42,000Stockton 2016 00065094 $39,800 Replace V210023 $39,800Stockton 2016 00099250 $124,806 Replace V206087 $41,602Stockton 2016 00099250 $124,806 Replace V209039 $41,602Stockton 2016 00099250 $124,806 Replace V209041 $41,602Stockton 2016 00100703 $125,655 Replace V200091 $125,655Stockton 2017 00099251 $127,677 Replace V206088 $42,559Stockton 2017 00099251 $127,677 Replace V208029 $42,559Stockton 2017 00099251 $127,677 Replace V208030 $42,559Stockton 2018 00099252 $261,738 Replace V206090 $43,623Stockton 2018 00099252 $261,738 Replace V208028 $43,623Stockton 2018 00099252 $261,738 Replace V208031 $43,623Stockton 2018 00099252 $261,738 Replace V209042 $43,623Stockton 2018 00099252 $261,738 Replace V211014 $43,623Stockton 2018 00099252 $261,738 Replace V212018 $43,623Visalia 2016 00064937 $42,000 Replace V205011 $42,000Visalia 2016 00064938 $42,000 Replace V206003 $42,000Visalia 2018 00099257 $43,623 Replace V209047 $43,623Westlake 2016 00099258 $83,042 Replace V208074 $41,521Westlake 2016 00099258 $83,042 Replace V211025 $41,521Westlake 2016 00099420 $41,521 Replace V206028 $41,521Westlake 2017 00099259 $122,076 Replace V213036 $42,558Westlake 2017 00099259 $122,076 Replace V209051 $79,518Willows 2018 00099264 $40,179 Vehicle - Sedan & Mobile Radio - Local Manager $40,179
5(END OF ATTACHMENT 11)
sbf
Typewritten Text
(END OF EXHIBIT C)