ATOMIZATION AND SPRAYS - Begell House
102
Volume 24, Issue 1 2014 ATOMIZATION AND SPRAYS Journal of the International Institutes for Liquid Atomization and Spray Systems EDITORS-IN-CHIEF Marco Marengo – Europe University of Bergamo Engineering Faculty Viale Marconi 5, Dalmine, Italy 24044 [email protected] Soo-young No – Asia Chungbuk National University Department of Biosystems Engineering 12 Gaeshin-dong Cheongju 361-763, Korea [email protected] Corinne Lengsfeld – Americas University of Denver Department of Mechanical and Materials Engineering 2390 S. York Street Denver, Colorado 80203-2102 [email protected]
-
Upload
khangminh22 -
Category
Documents
-
view
0 -
download
0
Transcript of ATOMIZATION AND SPRAYS - Begell House

Volume 24, Issue 1 2014
A T O M I Z A T I O N A N D S P R A Y S Journal of the International Institutes for Liquid Atomization and Spray Systems
EDITORS-IN-CHIEF Marco Marengo – Europe
University of Bergamo
Engineering Faculty
Viale Marconi 5, Dalmine, Italy 24044
Soo-young No – Asia Chungbuk National University
Department of Biosystems Engineering
12 Gaeshin-dong
Cheongju 361-763, Korea
Corinne Lengsfeld – Americas University of Denver
Department of Mechanical and Materials Engineering
2390 S. York Street
Denver, Colorado 80203-2102

AIMS AND SCOPE
The application and utilization of sprays is not new, and in modern society, it is
extensive enough that almost every industry and household uses some form of
sprays. What is new is an increasing scientific interest in atomization - the need
to understand the physical structure of liquids under conditions of higher shear
rates and interaction with gaseous flow. This need is being met with the
publication of Atomization and Sprays, an authoritative, international journal
presenting high quality research, applications, and review papers
Atomization and Sprays (ISSN 1044-5110) is published 12 times per year and owned by Begell
House, Inc., 50 Cross Highway, Redding, Connecticut 06896. US subscription rate for 2013 is $1652.00.
Add $10.00 per issue for foreign airmail shipping and handling fees for all orders shipped outside
the United States or Canada. All subscriptions are payable in advance. Subscriptions are entered on
an annual basis, i.e., January to December. For immediate service, charge card sales and subscrip-
tions for online access, call (203) 938-1300 Monday through Friday 9AM-5 PM EST. Fax orders to
(203-938-1304. Send written orders to Subscriptions Department, Begell House, Inc., 50 Cross
Highway, Redding, Connecticut 06896. You can also visit our website at www.begellhouse.com or
http://dl.begellhouse.com/.
This journal contains information from authentic and highly regarded sources. Reprinted material is
quoted with permission, and sources are indicated. A wide variety of references is listed. Reasona-
ble efforts have been made to publish reliable data and information, but the editor and the publisher
assume no responsibility for any statements of fact or opinion expressed in the published papers or
in the advertisements.
Copyright © 2013 by Begell House, Inc. All rights reserved. Printed in the United States of Ameri-
ca. Authorization to photocopy items for internal or personal use or the internal or personal use of
specific clients is granted by Begell House, Inc. for libraries and other users registered with the
Copyright Clearance Center (CCC) Transactional Reporting Service provided that the base fee of
$35.00 per copy plus .00 per page is paid directly to CCC, 222 Rosewood Drive, Danvers, MA
01923, USA. For those organizations that have been granted a photocopy license by CCC a sepa-
rate system of payment has been arranged. The fee code for users of the Transactional Reporting
Service is: [1044-5110/13/$35.00 + $0.00]. The fee is subject to change without notice. Begell
House, Inc.’s, consent does not extend to copying for general distributions, for promotion, for cre-
ating new works, or for resale. Specific permission must be obtained from Begell House, Inc., for
such copying.
Covered in: Science Citation Index (SCI), Current Contents®/Engineering, Computing & Technology, Aero-
space Database. Abstracted in: Chemical Abstracts Service. Indexed in: SciSearch and Research Alert.
Printed January 18, 2014

A T O M I Z A T I O N A N D S P R A Y S Journal of the International Institutes for Liquid Atomization and Spray Systems
EDITORS-IN-CHIEF
MARCO MARENGO Europe University of Bergamo
Deptartment of Engineering
Viale Marconi 5
Dalmine, Italy 24044
E-mail: [email protected]
SOO-YOUNG NO Asia Department of Biosystems Engineering
Chungbuk National University
12 Gaeshin-dong
Cheongju 361-763, Korea
E-mail: [email protected]
CORINNE LENGSFELD Americas University of Denver
Department of Engineering
2390 S. York St.,
Denver, Colorado 80203-2102
E-mail: [email protected]
FOUNDING EDITOR
NORMAN CHIGIER Department of Mechanical Engineering
Carnegie-Mellon University, Pittsburgh, PA 15213-3890
EDITORIAL BOARD
GUILLERMO AGUILAR
University of California, USA
FUMITERU AKAMATSU
Osaka University, Japan
WILLIAM BACHALO
Artium Technologies Inc.
Sunnyvale, CA, USA
JOSETTE BELLAN
Jet Propulsion Lab, NASA, USA
VOLFANGO BERTOLA
University of Liverpool
United Kingdom
GÜNTER BRENN
Graz University of Technology
Austria
JOACHIM DOMNICK
Hochschule Esslingen, Germany
JAMES DRALLMEIER
University of Missouri, USA
CHRISTOPHE DUMOUCHEL
Université et INSA de Rouen
France
DEREK DUNN-RANKIN
University of California
Irvine, USA
UDO FRITSCHING
University Bremen, Germany
MANOLIS GAVAISES
City University London
United Kingdom
MIKHAEL GOROKHOVSKI
École Centrale de Lyon France
MARCUS HERRMANN
Arizona State University, USA
NORIHIKO IKI
AIST, Japan
NOBUYUKI KAWAHARA
Okayama University, Japan
SANGHOON KOOK
The University of New South Wales
Australia
WEI-HSIANG LAI
National Cheng Kung University
China
MALISSA LIGHTFOOT
Edwards Air Force Base, CA, USA
LIGNANG LI
Tongi University
China
TA-HUI LIN
National Cheng Kung University
China
CHARLES W. LIPP
Lake Innovation LLC, USA
ANTONIO LOZANO
LITEC/CSIC, Spain
VINCENT MCDONNELL
University of California,
Irvine, USA
MASATO MIKAMI
Yamaguchi University
Japan
SEOKSU MOON
AIST, Japan
TERRY PARKER
Colorado School of Mines, CO,USA
RAUL PAYRI
Universitat Politècnica de València,
Spain
RAFFAELE RAGUCCI
Istituto di Ricerche sulla
Combustione, Italy
ROLF REITZ
University of Wisconsin
Madison, WI, USA
ILIA ROISMAN
Technische Universitat Darmstädt,
Germany
DAVID SCHMIDT
University of Massachusetts
Amherst, MA, USA
ERAN SHER
Ben-Gurion University of Negev
Israel
AKIRA SOU
Kobe University, Japan
DOUGLAS TALLEY
USAF Research Lab, CA, USA
MARIO TRUJILLO
University of Wisconsin
Madison, WI, USA
MIN XU
Shanghai Jiao Tong University
China
YOUNGBIN YOON
Seoul National University, Korea

ATOMIZATION AND SPRAYS
VOLUME 24, NUMBER 1 2014
CONTENTS
Macroscopic Spray Characteristics of a Porous Injector 1 D. Kim, I. Lee, & J. Koo
Theoretical Analysis of Surface Waves on a Round Liquid Jet in a Gaseous Crossflow 23 S. L. Wang, Y. Huang, & Z. L. Liu
Development of a New Spray/Wall Interaction Model for Diesel Spray under PCCI-Engine Relevant Conditions 41
Y. Zhang , M. Jia, H. Liu, M. Xie, T. Wang, & L. Zhou
Effect of the Liquid Injection Angle on the Atomization of Liquid Jets in Subsonic Crossflows 81 H. Almeida, J. M. M. Sousa, & M. Costa

Atomization and Sprays, 24 (1): 1–22 (2014)
MACROSCOPIC SPRAY CHARACTERISTICSOF A POROUS INJECTOR
Dohun Kim,1 Inchul Lee,1 & Jaye Koo2,∗
1 Department of Aerospace and Mechanical Engineering, Graduate Schoolof Korea Aerospace University, Korea
2 School of Aerospace and Mechanical Engineering, Korea AerospaceUniversity, Goyang 412-491, Korea
∗Address all correspondence to Jaye Koo E-mail: [email protected]
Original Manuscript Submitted: 10/9/2012; Final Draft Received: 10/25/2013
The concept of coaxial porous injector design for gas-liquid mixing involves improved momentumtransfer between the gas and liquid jets by changing the gas injecting direction of a conventionalliquid-centered shear coaxial injector from parallel to perpendicular using porous material. Cold-flowtests of the coaxial porous injector and the shear coaxial injector in two-dimensional configurationswere carried out to compare the macroscopic characteristics of sprays from each injector and to under-stand the effects of spraying conditions on the breakup length and the spray angle. The spray patternswere visualized using the shadowgraphy technique. The shadowgraph images recorded in high speedwere post-processed to detect the breakup length and the spray angle. The post-processing code fil-ters the dynamic pixels, and leaves the stationary pixels, which corresponds to the liquid core andthe background. The most significant differences between the porous injector and the shear injectorin the two-dimensional configurations were the spray angle and the uniformity of the disintegratedliquid jet. The liquid column from the shear injector was not split off entirely, and only the portion atthe interface between the gas and liquid jet was atomized by the shear force. On the other hand, theliquid jet from the porous injector dispersed more widely, and was disintegrated into droplets morecompletely in most experimental cases of similar axial momentum flux ratio conditions at the injectortip, and it was thought that an optimal porous element length for the best mixing performance existsat certain injection conditions.
KEY WORDS: porous injector, two-dimensional injector, breakup length, sprayboundary detection, momentum flux ratio
1. INTRODUCTION
Coaxial injectors have long seen widespread use for industrial purposes. For instance,most liquid rocket engines employ a coaxial swirl injector. Since a liquid rocket enginegenerates a large amount of thrust in a short amount of time and the flow rate of the pro-pellant is very large, atomization and mixing performance is very important (Huzel and
1044–5110/14/$35.00 c⃝ 2014 by Begell House, Inc. 1

2 Kim, Lee, & Koo
Huang, 1971). The design of a coaxial swirl injector overcomes certain disadvantagesinherent in a conventional impinging or a coaxial shear injector. These disadvantagesinclude combustion instability and an imbalance in terms of the mixture ratio at the cen-ter of the spray (Rahman et al., 1995; Rahman, 1997). However, with respect to thecoaxial swirl injector, shortcomings still exist with respect to the difficulty of design,the high manufacturing costs, the strict tolerance requirements, and the heavy weight.This paper introduces the novel concept of a coaxial porous injector. The porous ma-terial has many advantages in terms of thermodynamics and fluid mechanics, includinguniform flow distribution, filtration, flow isolation, and transpiration cooling, so it hasbeen widely used in surface burners, industrial filters, flame arresters, sound dampers,and flow straighteners.
Polyaev and his co-workers (2000) carried out droplet measurements for spray froma gas-liquid injector, which mixed the two-phase propellant in the porous material, andthey suggested a semiempirical equation, which denoted the relationship between thespray conditions and the maximum droplet diameter. Researchers in Germany (Lux etal., 2008a,b; Deeken et al., 2010) investigated the combustion characteristics of theshower-head-type porous injector. Bazarov (1993) suggested many types of novel porousatomizer concepts, and these atomizers have shown an extremely fine breakup of liquiddroplets.
In this study, a coaxial porous injector was conceived to improve the atomizing andmixing performance, and to reduce the manufacturing cost and tolerance limit by ap-plying the porous material to the two-phase flow injector. The schematic of the coaxialporous injector suggested in this study is shown in Fig. 1. The outline of the design issimilar to that of the conventional liquid-centered coaxial shear injector, except that aporous cylinder, which discharges gas, encloses the center liquid jet. The key feature of
FIG. 1: Schematic of a coaxial porous injector
Atomization and Sprays

Macroscopic Spray Characteristics of a Porous Injector 3
a coaxial porous injector is the radial injection of the gas jet from the internal surfaceof the porous cylinder. The radial gas jet develops in the axial direction at the recessedregion, where the gas and liquid jet make contact with each other as shown in Fig. 2.During this process, the gas jet transfers the radial momentum to the center liquid jet,and this helps the liquid jet to disintegrate more effectively compared to the coaxial shearinjector, which atomizes the liquid jet only with the axially injected gas. The efferves-cent injector has a geometry very similar to the coaxial porous injector, except that theliquid is injected through the porous cylinder, and the gas is discharged from the centerpost. The studies about droplet size prediction and the effect of injection condition onatomization were performed by Qian and his co-workers (2009).
To investigate the effect of the radial momentum gas jet on the spray characteristics,a comparative study between the proposed coaxial porous injector and a coaxial shearinjector was carried out. Both injectors in the twodimensional (2D) configurations weremanufactured to observe the interaction of the gas and liquid jet at the recessed regionand the macroscopic characteristics of sprays at the near-injector field excluding the cu-mulative effect of the shadowgraph image taken from the side of the three-dimensional(3D) injector spray. For clarity, the simple expressions “shear injector” and “porous in-jector” were used instead of the quasi 2D configuration of “coaxial porous injector” and“coaxial shear injector”. Also, the terms “radial gas jet”, “annular gap” and “diameter”were replaced by “lateral gas jet”, “gas injection gap” and “width” respectively.
(a) (b)
FIG. 2: Comparison of the gas flow regimes between (a) a coaxial shear injector and(b) a coaxial porous injector
Volume 24, Number 1, 2014

4 Kim, Lee, & Koo
2. EXPERIMENTAL SETUP AND METHODS
2.1 Quasi-2D Injector
Figure 2 shows the side and front view of the injectors used in the cold-flow experiments.Although the sprays from the quasi-2D injectors are spread in a three-dimensional space,the interaction of the liquid and gas jet at the near-injector region could be visualizedmore clearly than with the 3D injector. The shear injector and the porous injector couldbe transformed by changing some components. The upper side of Fig. 3(a) describesthe shear injector, and the lower side shows the configuration of the porous injector. Thetransverse width of the quasi-2D injector is 9 mm. The porous element was manufacturedprecisely to simulate the wall injection of the gas-phase propellant, and the dimensionsare represented in Fig. 4. A total of 189 holes with a diameter of 0.5 mm, a longitudinalpitch of 0.75 mm, and a transversal pitch of 0.65 mm were drilled, and the blockage ratiois about 40.3%. The side panel of the quasi-2D injector was made with high purity acrylicplates. The numerical control-engineered PTFE gasket was inserted into the contacts ofthe acrylic side windows to prevent leakage and the abnormal mixing of propellant onthe inside of the injector.
Four types of quasi-2D injectors were used in the cold-flow test, and the represen-tative dimensions are described in Table 1. There are two experimental factors: (i) Thetype of quasi-2D injector (a shear injector or a porous injector), and (ii) the length of theporous element,Lpr. The length of the porous element is defined as the distance betweenthe liquid center post tip and the injector tip and is equal to the recess depth in the shearinjector.
(a) (b)
FIG. 3: Schematics of the shear injector and the porous injector: (a) side view, (b) frontview
Atomization and Sprays

Macroscopic Spray Characteristics of a Porous Injector 5
FIG. 4: Dimensions with a detailed view of the porous element, units: mm
TABLE 1: Geometrical dimensions of quasi-2D injectors, units: mm
Shear injector
Injector no.Inner width of Outer width of Gas injection Recesscenter post,DL center post,Dp gap,tG depth,R
INJ-1-1 4.5 6.5 1.0 4.5Porous injector
Injector no.Inner width of Width of porous Length of Recesscenter post,DL element,Dpr porous element,Lpr depth,R
INJ-2-1 4.5 8.5 1.5 1.5INJ-2-2 4.5 8.5 3.0 3.0INJ-2-3 4.5 8.5 4.5 4.5
2.2 Cold-Flow Test Facility
A cold-flow test facility was constructed to supply the high pressure inert propellants:water for liquid and gaseous nitrogen for gas. The piping diagram of the facility isshown in Fig. 5. The flow rates of the water and gaseous nitrogen were measured witha Macnaught M series positive displacement flowmeter and a differential pressure ori-fice flowmeter, respectively. The flow rates of the water and air were controlled by theregulators attached to the high pressure air tank outlet. Pressure transducers were set tomeasure pressure drops at the gas and liquid injectors. All of the physical properties weremeasured by a LabVIEW PCI-6221 data acquisition device with the sampling speed of10 kHz. The bias errors of physical measurements, such as pressure transducer and ther-mocouple, were based on the manufacturer’s specification sheets, and the standard errorswere computed from the statistics of 10,000 samples at the steady state. The combinedstandard uncertainties of measurements were calculated by root sum square of the biaserror and the standard error. The coverage factor was 2 for a 95% confidence level. Theuncertainties of flow conditions, which were calculated from diverse parameters, wereestimated with considering the propagation of uncertainty (Abernethy et al., 1985; Kline,1985).
Volume 24, Number 1, 2014

6 Kim, Lee, & Koo
FIG. 5: Schematic of the cold-flow test system
The spray images were taken using backlit photography. Temporary spray jet imageswere captured by a SVSi GIGAVIEW high frame rate CCD camera, which acquired1036 frames per second with an image resolution of 640×480 pixels. Given this fastrecording speed and exposure time, a high-intensity light source at the visualized regionwas critical to ensure final image quality. An SST-90 LED was used as a light source,and it provided exposure times down to 2µs.
2.3 Breakup Length and Spray Boundary Detecting Technique
The spray images, acquired at 1036 samples per second, were post-processed to get theaveraged image and to estimate the breakup length and the spray angle with an in-houseMatlab code. In the shadowgraph images, the liquid spray is presented in black color(shadow), and the background is in white (backlight). When part of the liquid spraypasses the background, the pixel color frequently alternates between white and black.The pixels, which consist of the dark liquid core and the background, have solid colorand appear stationary (black and white respectively) during the injection. Accordingly,the liquid core and the spraying path, which represents the spray angle, can be detectedby dividing the pixels into the stationary pixels (liquid core and background) and thedynamic pixels (path of disintegrated spray) according to the degree of pixel changingrate.
Atomization and Sprays

Macroscopic Spray Characteristics of a Porous Injector 7
The raw images are stored in an 8-bit grayscale format, and each pixel is a shade ofgray, from 0 (black) to 255 (white). The pixelated digital images can be manipulated asa matrix, and each pixel represents the element of a matrix. Figure 6 shows the imageprocessing procedure using Matlab to detect the breakup length and the spray angle. Toclassify the pixel as dynamic or stationary, a criterion named the “deviation factor” isestablished for this study. The averaged image can be obtained by calculating the arith-metic mean value of each pixel. The liquid core and the background are almost stationaryduring the discharging of spray, and the other pixels, which vary from white (backgroundlight) to black (shadow of ligament and droplet), can be considered as a region where thespray passes. The criterion to distinguish the pixels as either stationary or dynamic wasdetermined by the deviation factor. As shown in Fig. 6, the deviation factor of each pixelwas defined by the percentage of the excess of inverse normal cumulative distributionfunction. Assuming that the grayscale data of a pixel have a normal distribution, if thepoints of±1.645σ are inside the range of±β% from the average, the pixel is classifiedas a stationary pixel; otherwise it is classified as a dynamic pixel as shown in Fig. 7.The threshold of deviation factor,β, was determined by comparing the image processresults with a number of the still images, because the true value of the breakup lengthwas unknown, and was estimated by a statistical method.
The uncertainties of the image processing were determined by changing the devi-ation factor threshold from 4% to 14% which shows acceptable results. The breakuplength of INJ 2-3 spray, for example, was varied from 23.8 mm to 25.3 mm as plottedin Fig. 8. As the threshold increased, the breakup length was changed step by step. Thethreshold of deviation factor was selected as 7% which represents the most accurate re-sults for entire cases, and the uncertainty of the breakup estimation in the case of Fig. 8
FIG. 6: The flow chart of image processing using Matlab
Volume 24, Number 1, 2014

8 Kim, Lee, & Koo
FIG. 7: Exclusion criterion for nonstationary pixels
FIG. 8: Results of breakup length estimation with varying threshold
could be expressed in 25.1 + 0.2, –1.3 mm. The difference of upper and lower uncertaintywas caused by the high sensitivity of the detecting algorithm at the low deviation factorthreshold, and this tendency was represented in the whole case. Also, the uncertaintiesof the radial position of spray boundaries were calculated in the same manner.
Atomization and Sprays
Macroscopic Spray Characteristics of a Porous Injector 9
2.4 Cold-Flow Test Conditions
The cold-flow experiment was carried out with the water-gaseous nitrogen simulant pro-pellant, and the experimental conditions are summarized in Table 2. The mass flow rateof nitrogen was calculated by multiplying the volume flow rate and the density. Thevolume flow rate of gas was measured with the orifice flowmeter, and the density wasestimated from the pressure and the temperature at the metering section. The mass flowrate range of gaseous nitrogen was between 20 and 40 g/s, and was controlled by ad-justing the pressure regulator. The mass flow rate of water was constant at 217 g/s, andwas validated by the bucket method. In this injection condition, the Reynolds number ofthe liquid jet was 28-166. In the cases of a porous injector configuration, the mass flowof water varied with the pressure at the recessed region, and it was compensated for byadjusting the pressure upstream of the liquid injector.
3. RESULTS AND ANALYSIS
3.1 Injection Parameters
In this study, the injection parametersJrcs andJtip define the degree of liquid-gas inter-action at the recessed region and the injector tip respectively. The interaction betweenthe gas and liquid jets from a porous injector can be classified into two types; (i) im-pinging of axial liquid jet and lateral gas jet at the recessed region, and (ii) shearingbetween axial liquid jet and axially developed gas jet downstream from the injector tip.So, the momentum flux ratio [Eq. (1)], which is usually employed as an index of thegas-liquid spray condition, could be divided into two types; the momentum flux ratio atthe recessed region,Jrcs, and downstream of the injector tip,Jtip.
The static pressure at the recessed region of a porous injector was higher than theshear injector due to the stagnation of the lateral gas jet, and it consequently affectedthe density of the gas jet at the recess. The gas velocities at the recessed region, whichwere calculated from the continuity equation [Eq. (2)], varied depending on the gasdensity and the wall injection area (Aprs), which is determined by the length of theporous element. As a result,Jrcs could be different in the equal mass flow rate condition[Eq. (3)]. On the other hand, since the gas and liquid injection areas at the injector tipswere the same for every injector used in this experiment, the magnitudes ofJtip weredependent on the mass flow rate ratio only [Eq. (4)].
Figure 9 shows the hydraulic parameters of a porous injector, which are dividedinto two calculating points: the recessed region and the injector tip. The Weber number
TABLE 2: Experimental conditions of the cold-flow tests
Liquid (water) mass flow rate,mliq (g/s) 217 g/sGas (gaseous nitrogen) mass flow rate,mgas (g/s) 20–40 g/s
Volume 24, Number 1, 2014

10 Kim, Lee, & Koo
FIG. 9: Hydraulic parameters at the recessed region and injector tip
[Eq. (5)] represents the interaction between the gas and liquid jets, and is an index thatdemonstrates the relationship between the spray’s inertia force and the surface tensionof the liquid jet. In this study, the characteristic length is defined as the width of the two-dimensional injectors, and the surface tension of the liquid is based on the properties ofwater at room temperature and atmospheric pressure.
For each experiment, the mean values of spray conditions, momentum flux ratio, andWeber numbers were calculated, and listed in Table 3. Figure 10 shows the ratio of theradial gas momentum flux and the axial liquid momentum flux at the recessed regionalong with the axial momentum flux ratio at the injector tip. Since it is assumed that thegas jet at the recessed region of the shear injector has an axial vector only, the radial mo-mentum flux ratio of the shear injector (INJ 1-1) is zero over the whole range. In the caseof the porous injector (INJ 2-1–2-3), the radial momentum flux at the recessed region isproportional to the square of the mass flow rate of the gas, and inversely proportional tothe square of the injection area, and to the pressure at the recessed region as described inEq. (4). This is derived by substituting the density and velocity of gas in Eq. (2) by theideal gas equation and Eq. (1), respectively. SincePrcs increases along with the gas massflow rate as shown in Fig. 11,Jrcs increases proportionally with the gas mass flow ratedue to the effect of the increasing density of gas at the recess. At the same mass flow rateconditions, as defined by dashed boxes in Fig. 9,Jrcs of the porous injectors grows ina geometrical progression by proportionally increasing the injection area of the porouselement.
The major difference in hydraulic characteristics between the shear injector and theporous injector is that the pressure at the recessed region of the porous injector is severaltimes higher than the recess pressure of a shear injector. This causes the difference of
Atomization and Sprays

Macroscopic Spray Characteristics of a Porous Injector 11
TABLE 3: Measured hydraulic parameters and calculated spray characterizingparameters
Inj. Expt. mgas (g/s) Prcs,gas Pdiff,gas Jrcs JtipWe
setup no. Set/actual (bar) (bar) (×105)SHR INJ 1-1 20/20.74 0.087 1.03 21.155±0.91 22.28±0.81 0.998
1-1 1-2 25/24.77 0.055 1.46 31.090±1.11 31.78±0.99 1.423Shear 1-3 30/29.67 0.040 2.00 45.246±1.67 45.60±1.21 2.041
injector 1-4 35/35.04 0.057 2.65 62.102±2.20 63.60±1.74 2.8471-5 40/39.8 0.094 3.26 77.396±2.94 82.05±2.14 3.673
PRS INJ 2-1 20/20.06 0.472 2.57 6.495±0.33 20.84±0.72 0.9332-1 2-2 25/25.22 0.588 3.61 9.515±0.49 32.95±1.01 1.475
Porous 2-3 30/29.67 0.843 4.58 11.346±0.58 45.60±1.23 2.041injector 2-4 35/35.01 0.934 5.73 15.047±0.75 63.49±1.71 2.842
Lpr = 1.5 mm 2-5 40/40.02 1.092 6.54 18.150±0.89 82.88±2.22 3.710PRS INJ 3-1 20/20.0 0.381 1.20 1.72±0.09 20.72±0.77 0.927
2-2 3-2 25/24.97 0.522 1.44 2.435±0.12 32.30±1.10 1.446Porous 3-3 30/29.77 0.757 1.97 2.999±0.15 45.91±1.30 2.055injector 3-4 35/35.64 0.944 2.10 3.883±0.20 65.79±1.70 2.945
Lpr = 3.0 mm 3-5 40/39.72 1.204 3.22 4.254±0.22 81.72±2.39 3.658PRS INJ 4-1 20/20.22 0.233 0.55 0.88±0.05 21.18±0.80 0.948
2-3 4-2 25/24.84 0.396 0.80 1.169±0.06 31.96±1.07 1.431Porous 4-3 30/29.88 0.544 1.14 1.531±0.08 46.25±1.33 2.070injector 4-4 35/34.73 0.699 1.51 1.878±0.10 62.48±1.62 2.797
Lpr = 4.5 mm 4-5 40/39.40 0.857 1.89 2.210±0.11 80.41±2.35 3.600
the momentum flux ratios at each case as explained above. The plot in Fig. 11 demon-strates the diminishing ofPrcs of INJ 2-1, which has the shortest porous element length,at the gas mass flow rate condition of 35 g/s. This occurs because the radial gas jet,which injects from the opposite side, is released outside of the injector before forming astagnation region.
3.2 Macroscopic Spray Patterns
The instant images of a spray from each injector exhibit the differences in the macro-scopic spray patterns quite well in Fig. 12. The three pictures in each row are sequentialimages with an elapsed time of 0.88 ms, and the mass flow rates of simulant propellantare the same in all cases as described in the caption. These pictures show the differencesin the gas-liquid interaction at the outside of the injectors. In the case of the shear in-jector [Fig. 12(a)], the gas jet, which is injected parallel to the liquid core, contacts theunstable surface of the liquid jet. The arrows in Fig. 12 point to the location of the actingshear force, which induces the disintegration of the liquid jet. The axial positions of the
Volume 24, Number 1, 2014

12 Kim, Lee, & Koo
FIG. 10: Radial momentum flux ratio at the recessed region versus axial momentumflux ratio at the injector tip
FIG. 11: Mean static pressures at the recessed region for varying mass flow rate ofgaseous nitrogen
Atomization and Sprays

Macroscopic Spray Characteristics of a Porous Injector 13
FIG. 12: Representative sequential images of gas-liquid spray from each configurationof injectors
shearing point at the upper and lower sides of the liquid core appear alternatively in theaxial direction due to the sinusoidal shape of the liquid core. The spray images of theporous injector shown in Figs. 12(b)–12(d) demonstrate the rapid and uniform breakupof the liquid core. The differences between the injectors used in Figs. 12(b)–12(d) arethe porous element lengths (Lpr): 1.5, 3.0 and 4.5 mm, respectively. The length of theporous element determines the magnitude of the radial momentum flux of the gas jet andthe residence time of the liquid jet in the recessed region. Comparing the pictures, theyshow that the porous element length affects the uniformity of the spread of the liquid.The liquid jet from the injector was rarely disintegrated at the center line while using thelongest porous element length (4.5 mm), as shown in Fig. 12(d). AsLpr increases, theatomization of the liquid jet is better, and the spray pattern shows a widely dispersingliquid jet in a V shape. On the other hand, the spray angle was observed to remain almostunchanged.
The major difference between the shear injector and the porous injector is the sprayangle. The spray angle of the shear injector is narrower than that of the porous injector.
Volume 24, Number 1, 2014

14 Kim, Lee, & Koo
The liquid core of the shear injector is scattered further downstream from the injectorface, and it is determined that the axial velocity component of the droplet is dominant.In contrast, the disintegration of the liquid core from the porous injector occurs at therecessed region (inside the injector), and the fine droplets dispersed into a wide area.
J =ρgasU
2gas
ρliqU2liq
(1)
Ugas =m
ρgasA(2)
Jrcs =m2
gasRT
PrcsA2prsρliqU
2liq,axial
= J(m2gas, P
−1rcs , A
2prs) (3)
Jtip =m2
gasRT
PatmA2tip,gasρliqU
2liq,axial
= J(m2gas, A
−2tip,gas) (4)
We=ρgas,amb(Ugas,tip − Uliq)
2w
σ(5)
3.3 Breakup Length Analysis
The spray angle and the breakup length were analyzed using the image processing tech-nique described above. Figure 13 shows the results of the spray angle and the liquid coredetecting process, and these pictures are arranged by gas flow rate and injector type. Thepost-processed images in each row were captured at similar mass flow rate ratio (Jtip)conditions, and the injector type and geometry were divided into separate columns. TheJrcs magnitudes of each case were represented on each image in Fig. 13. Though themass flow rate ratios were similar,Jrcs were calculated differently according to the in-jector type. The first column from the left side shows the spray images of the shearinjector. The spray images of the porous injectors, with cylinder lengths of 1.5, 3.0, and4.5 mm, are on the second, third, and fourth columns respectively.
Both the breakup lengths and the degree of spray dispersions were definitely differ-ent depending on the type of injector, especially in the highJtip conditions. Figures 14and 15 show the effects of the injection conditions on the breakup length and the de-gree of dispersion quantitatively. The breakup lengths were measured from Fig. 13, anddetermined by the distance from the injector face plate to a discrete point in the centerliquid core.
In the shear injector experiment, the liquid disintegration at the center region wasnot improved significantly though the gas injection flow rate increased, and the breakuplength rather became longer as shown in Fig. 13. These results contradict previous find-ings about the behavior of general coaxial shear injectors (Davis and Chehroudi, 2005). It
Atomization and Sprays

Macroscopic Spray Characteristics of a Porous Injector 15
FIG. 13: Effects ofJtip andJrcs on the breakup length and the dispersion angle of spray
FIG. 14: The effect ofJrcs and Jtip on the corrected breakup length of the porousinjectors
Volume 24, Number 1, 2014

16 Kim, Lee, & Koo
was thought that the breakup lengths at the lowJtip conditions were underestimated dueto the wavy breakup patterns. At the low momentum flux ratio condition, the liquid jetdisintegrated in the fiber-type breakup mode, which showed a nonsymmetric, sinusoidal,wavy liquid column downstream of the spray (Farago and Chigier, 1992). Therefore, thepost-processing code predicted the breakup length to be shorter. In contrast, the breakuplength of the porous injectors was shortened with the increasing gas flow rate (increasingJtip).
In the cases of the short porous element length (1.5 mm) and high mass flow rate ofthe gas jet (higher than 35 g/s), the wide spread of the liquid core was observed at thenearinjector field, and the detected liquid core seemed like a flipper. Possible reasons forthe change in the shape of the liquid core are that the radial gas jet did not develop to theaxial flow completely at the short recessed region, and a larger radial momentum actedon the liquid jet at the outside of the injector tip.
In order to analyze the effect of the radial momentum of the gas jet on the liq-uid breakup, the breakup length variation according to theJrcs andJtip was plotted inFig. 14. The symbols that are linked by a solid line indicate the equal mass flow rate ratioandJtip. The increasingJtip (increasing gas mass flow rate) reduced the breakup lengthof three porous injector configurations, and the breakup lengths of the porous injectorsgot much shorter than that of the shear injector.
As described in Eq. (4),Jrcs is a function of the gas mass flow rate, the recess pres-sure and the gas injection area of the porous element. The change of theJrcs of each plotin Fig. 14 is due to the varying gas injection area. (i.e. the length of the porous element).Therefore, the effect of the length of the porous element (Jrcs) on the disintegration ofthe liquid jet could be observed. In the case ofJtip with values from 20.91 to 45.92, thebreakup lengths showed a decreasing-increasing tendency according to the increasingJrcs. It was thought that an optimal porous element length exists that would create theshortest breakup length. This optimal length is thought to be between the values of 1.5and 4.5 mm. In the higherJtip conditions, however, the increasingJrcs induced a longerbreakup length. The higherJrcs and shorter recessed depth made the liquid core spreadwider at the near-injector field, and much of the gas jet momentum was consumed inthis process. In conclusion, it could be deduced that increasing theJrcs by shorteningthe porous element is not a good way to improve the liquid disintegration, and there areoptimal porous element lengths at each givenJtip magnitude.
3.4 Spray Dispersion Analysis
Figure 14 shows the radial distribution of the spray according to the axial position foreach test condition, and the boundary positions were measured from Fig. 13. Figure 15(a)represents the spatial distribution of the shear injector spray at each gas flow rate (Jtip)condition. As the magnitude ofJtip increased, a wider spray angle was demonstrated.Figures 15(b)–15(f) show the change of the spray distribution according to the length of
Atomization and Sprays

Macroscopic Spray Characteristics of a Porous Injector 17
(a)
(b)
FIG. 15
Volume 24, Number 1, 2014

18 Kim, Lee, & Koo
(c)
(d)
FIG. 15
Atomization and Sprays

Macroscopic Spray Characteristics of a Porous Injector 19
(e)
(f)
FIG. 15: Radial distribution of the spray border line at each experimental case
Volume 24, Number 1, 2014

20 Kim, Lee, & Koo
the porous element in eachJtip condition. In the same manner as the breakup length, thespray distribution was varied byJrcs more significantly in the higherJtip conditions.
For the injector with the shortest length of the porous element (PRS INJ 2-1), thespray at the injector face plate was spread wider proportional toJtip for the same reasonmentioned in Section 3.1 [Fig. 15(d)]. As theJtip magnitude further increased to 63.92[Fig. 15(e)], the spray of PRS INJ 2-3, which had the longest porous element, spread aswidely as the spray of PRS INJ 2-1, except at the nearinjector field. However, the spray ofPRS INJ 2-2 had little change between Figs. 15(d) and 15(e) in the lateral distribution atthe entire axial position. At the highestJtip condition [Fig. 15(f)], the spray of PRS INJ2-1 was dispersed dramatically wider than the other injector configurations, and it couldbe deduced that the cause of this phenomenon was correlated with the lateral scatteringof the liquid core as shown in Fig. 13. The notable point was that the dispersion degreeof the PRS INJ 2-2, which had a medium porous element length among the experimentalgroup, was rarely varied despite the increasedJtip magnitude.
4. CONCLUSION
The macroscopic pattern, the breakup length and the spatial distribution of spray fromthe porous injector were studied using an atmospheric pressure cold-flow test using wa-ter and gaseous nitrogen as simulants for liquid and gaseous propellants, respectively.The spray visualization results of quasi-2D injectors clearly represented the effects oflateral gas injection on the spray dispersion in a lateral direction and the disintegrationof the center liquid jet. Also, the results were compared with those of the shear injectorconfiguration. The following conclusions were elicited:
(i) The lateral gas injection of the porous injector induces a pressure buildup at therecessed region. In the condition of a short porous element length and high massflow rate of the gas jet, the diminishing of the recess pressure occurred due tothe lack of the space to stagnate, and the gas jet discharged to the outside of theinjector with relatively higher radial momentum. As a result, the liquid core spreadwidely at the exit plane of the injector.
(ii) The spray from the porous injector shows higher breakup performance, widerspray angle, and a more uniform distribution of the two-phase spray than the shearinjector. The differences were caused by the lateral momentum of the gas jet.
(iii) The breakup length of a porous injector is shortened with the increasingJtip. Inthe cases of the equalJtip magnitude, the shortest breakup lengths were observedin the middle range ofJrcs, which was varied by changing the length of the porouselement. At the highJtip condition, the breakup lengths were lengthened withincreasingJrcs.
Atomization and Sprays

Macroscopic Spray Characteristics of a Porous Injector 21
(iv) Jrcs affected the spray dispersion of a porous injector less in the lowJtip con-ditions. The lateral gas jet momentum intensifies the spreading of spray at thenear-injector field. Further increases inJtip andJrcs by increasing gas flow rateinduced the lateral spread of the entire spray (both of the near-injector field anddownstream of the spray).
(v) From the breakup length and dispersion degree analysis results, it was thought thatan optimal porous element length for the best mixing performance exists at certaininjection conditions. These optimal lengths can be defined through further studiesof the correlation between the lateral momentum transfer and the behavior of theliquid core at the near-injector field.
(vi) The future study will involve a quantitative comparison of the droplet size and themass distribution between the porous and the shear injector. The results from thequantitative measurements are expected to verify the improved atomization andmixing of the porous injector.
ACKNOWLEDGMENTS
This work was supported by the National Research Foundation of Korea (NRF) grantfunded by the Korean Government (MEST) (NRF-2011-0015435 and NRF-2012M1A3A3A02033 146).
REFERENCES
Abernethy, R. B., Benedict, R. P., and Dowdell, R. B., ASME measurement uncertainty,J. FluidsEng., vol. 107, pp. 161–163, 1985.
Bazarov, V. G., A New class of porous injectors for combustion chambers and gas generators, InProc. of AIAA/SAE/ASME/ASEE 29th Joint Propulsion Conference and Exhibit, 1993.
Davis, D. W. and Chehroudi, B., Shear-coaxial jets from a rocket-like injector in a transverseacoustic field at high pressures, InProc. of 44th AIAA Aerospace Sciences Meeting and Ex-hibit, 2005.
Deeken, J., Suslov, D., Haidn, O., and Schlechtriem, O., Design and testing of a porous injectorhead for transpiration cooled combustion chambers, InProc. of 48th AIAA Aerospace SciencesMeeting Including the New Horizons Forum and Aerospace Exposition, 2010.
Farago, Z. and Chigier, N., Morphological classification of disintegration of round liquid jets ina coaxial air stream,J. Atomization Sprays, vol. 2, pp. 137–153, 1992.
Huzel, D. K. and Huang, D. H.,The Design of Liquid Propellant Rockets, 2nd ed., WashingtonDC: National Aeronautics and Space Administration, 1971.
Kline, S. J., The purposes of uncertainty analysis,J. Fluids Eng., vol. 107, pp. 153–160, 1985.
Lux, J., Suslov, D., and Haidn, O., Experimental Investigation of porous injectors for liquid pro-pellant rocket engines, InProc. of 44th AIAA/ASME/SAE/ASEE Joint Propulsion Conferenceand Exhibit, 2008a.
Volume 24, Number 1, 2014

22 Kim, Lee, & Koo
Lux, J., Suslov, D., and Haidn, O., Porous injectors in cryogenic liquid propellant rocket enginesat sub- and supercritical pressures, InProc. of 46th AIAA Aerospace Sciences Meeting andExhibit, 2008b.
Polyaev, V. M., Zhdanov, V. M., and Kichatov, B. V., Study of the operation of a gasliquidatomizer with a porous mixing element,J. Eng. Phys. Thermophys., vol. 73, no. 3, pp. 465–469, 2000.
Qian, L., Lin, J., and Xiong, H., A Fitting formula for predicting droplet mean diameter forvarious liquid in effervescent atomization spray,J. Thermal Spray Technol., vol. 19, no. 3, pp.586–607, 2009.
Qian, L., Lin, J., and Xiong, H., Effects of operating conditions on droplet deposition onto surfaceof atomization impinging spray,J. Surface Coating Technol., vol. 203, pp. 1733–1740, 2009.
Rahman, S. A.,Primary Atomization Study of a Swirl Coaxial Liquid Propellant Rocket Injector,Ph.D. Thesis, The Pennsylvania State University, 1997.
Rahman, S. A., Pal, S., and Santoro, R. J., Swirl coaxial atomization—Cold-flow and hot-fireexperiments, InProc. of 33rd Aerospace Sciences Meeting and Exhibit, 1995.
Atomization and Sprays

Atomization and Sprays, 24 (1): 23–40 (2014)
THEORETICAL ANALYSIS OF SURFACEWAVES ON A ROUND LIQUID JET IN AGASEOUS CROSSFLOW
S. L. Wang, Y. Huang,∗ & Z. L. Liu
National Key Laboratory on Aero-Engines, School of Energy and PowerEngineering, Beihang University, Beijing, 100191, China∗Address all correspondence to Y. Huang E-mail: [email protected]
Original Manuscript Submitted: 7/12/2013; Final Draft Received: 9/30/2013
A theoretical investigation is described to study the surface waves on a round liquid jet in a gaseouscrossflow, especially Rayleigh-Taylor waves. The linear stability analysis was used to derive the dis-persion relation. The acceleration on the liquid jet due to the transverse aerodynamic force was con-sidered in the relation. Results indicate that the hydrodynamic instability is dominated by three termswhich are caused by jet velocity, surface tension, and aerodynamic force, respectively. The surface ten-sion contributes to the instability when the wave number is less than unity. Both gas and jet velocitiescan affect the optimum wavelength and the surface wave growth rate. The critical momentum ratio, atwhich the contribution of the liquid jet Weber number to the maximum growth rate is as large as thatof the cross air Weber number to the maximum growth rate, decreases with the gas Weber numberexponentially. If the momentum ratio is less than the critical value, the axial optimum wavelengthcan be expressed as a power function of gas Weber number. Otherwise, free jet instability theory canbe used to study the surface waves on the liquid jet in cross air flow.
KEY WORDS: linear stability analysis, round liquid jet, crossflow, Rayleigh-Taylor waves, momentum ratio
1. INTRODUCTION
Liquid fuel sprays in crossflows have a wide application in a number of aerospace sys-tems, such as afterburners (Lovett et al., 2004), gas turbine combustors, liquid rocketengines, ramjet engines, and scramjet engines (Ali and Islam, 2006; Pandey et al.,2010). The atomization is achieved through two stages: primary breakup and secondarybreakup. The present study is to investigate the characteristics of the primary breakup ofa liquid jet in a gaseous crossflow.
Numbers of earlier studies revealed the characteristics of the primary breakup ofa liquid jet in supersonic crossflow. Kolpin and Horn (1968), Reichenbach and Horn(1971), and Nejad et al. (1980) investigated the jet penetration and mean droplet diam-eter by experiments in supersonic air streams. Heister et al. (1988) presented a model
1044–5110/14/$35.00 c⃝ 2014 by Begell House, Inc. 23

24 Wang, Huang, & Liu
of a single liquid jet in compressible supersonic crossflow. Kush and Schetz (1972) ex-perimentally studied a liquid jet in a supersonic flow. High frequency, large amplitude,aerodynamically induced, axially propagating waves were observed in their experiments.Such waves were considered to be intrinsic for liquid jet breakup behavior and to be thedominant mechanism of jet decomposition. Similarly, Schetz et al. (1980) conducted theexperiments of liquid jets in supersonic gas streams to investigate the characteristics ofsurface waves and their influence on the jet breakup process. Their results pointed outthat the transverse liquid jet breakup was caused by the acceleration waves rather thansurface tension waves or Kelvin-Helmholtz (K-H) waves.
Since the 1990s, much attention was paid to transverse jets in subsonic gaseouscrossflows due to the development of low emission combustors, such as LPP (lean pre-mixed prevaporized) (Becker and Hassa, 2002). Zhu et al. (2010), Inamura (1999), andWu et al. (1997) investigated the trajectory of liquid jets in cross airstreams. Stenzleret al. (2006), Wang et al. (2011), and Mashayek et al. (2008) studied the jet penetrationin crossflows. Aalburg et al. (2004) experimentally investigated the ligament and dropproperties along the liquid surface in crossflow. Wu et al. (1997, 1998) experimentallystudied the breakup process of liquid jets in subsonic crossflow, and presented the col-umn trajectories, column fracture locations, spray structure, and column surface wavecharacteristics. Their results showed that (a) the liquid column breakup processes in acrossflow are similar to those of aerodynamic secondary breakup of a spherical droplet;(b) surface waves which generated the ligaments and droplets initiate from the columnperiphery and extend to the leeward side. They also found that the wavelength of sur-face waves and the size of ligaments and droplets decreased with the increase of thegas velocity. Fuller et al. (1997) investigated the effect of injection angle on the breakupprocess of liquid jets in subsonic crossflows by experiments. They divided the columnbreakup into aerodynamic and nonaerodynamic regimes. For aerodynamic breakup, theaerodynamic forces associated with gas crossflow accelerated the column in jet streamdirection and induced surface waves which ultimately led to column fracture. Whilefor nonaerodynamic breakup, liquid turbulence and inertial forces generated instabilitywithin the liquid itself and caused large scale column deformations which ultimately ledto column fracture. Mazallon et al. (1999) carried out numerous experiments to observethe jet deformation and breakup. Their observations also suggested qualitative similari-ties between breakup of nonturbulent liquid jets in crossflows and the secondary breakupof droplets. The jet breakup in subsonic crossflow is typically classified into four primaryregimes: column breakup, bag breakup, multimode breakup, and shear breakup. Theirresults also indicated that the wavelengths of surface waves and column waves decreasedwith the increase of gas Weber number. Sallam et al. (2004) pointed out that the ratio ofwavelength to jet diameter is greater than unity for column breakup, approximately equalto unity for bag breakup, and less than unity for shear breakup mode. Meanwhile theyproved the similarities by experiments and concluded that the transitions to bag, multi-mode, and shear breakup occurred at Weg = 4, 30, and 110, respectively. But Zheng and
Atomization and Sprays

Theoretical Analysis of Surface Waves 25
Marshall (2011) found that breakup mode transition from column to bag breakup wasat Weg = 8. Sedarsky et al. (2010) conducted numerous experiments and found classicalRayleigh-Taylor (R-T) wave structures which grow and pinch off the liquid jet. Wanget al. (2012) and Ng et al. (2008) studied the properties of bag breakup of liquid jet incrossflow and analyzed waves induced by R-T instability. Their results suggested thatthe wavelength directly decreased with the increase of gas Weber number.
The objective of the present investigation was to study the instability of a roundliquid jet in gaseous crossflow using linear stability theory. This method was adopted bySterling and Sleicher (1975), Reitz and Bracco (1982), Lin and Lian (1988), Yang et al.(2012), and Boronin et al. (2013) to describe the instability of a round liquid jet injectinginto quiescent air. Panchagnula et al. (1996) studied the instability of a swirling annularliquid jet into coaxial gas streams with unequal gas velocities by this theory. The columnsurface waves, especially induced by R-T instability, on the liquid jet in crossflow willbe studied, and the effects of dominating parameters will be discussed.
2. INSTABILITY ANALYSIS
Considering a round liquid jet with radiusa, constant densityρl penetrates at speedUl
into the gaseous crossflow. The transverse gas velocity isUg. The gas and the liquidflows are assumed to be incompressible and inviscid.
The governing equations consist of continuity equations and momentum equationsin r, θ andz directions. The coordinate origin is fixed at the center of nozzle exit andzaxis coincides with the axis of the column of jet as shown in the Fig. 1(a). Figure 1(b)shows the jet cross section around which the gas flow passes.
(a) (b)
FIG. 1: Model of a round liquid jet in crossflow: (a) longitudinal-section, (b) cross-section
Volume 24, Number 1, 2014

26 Wang, Huang, & Liu
Here, the initial section at the nozzle exit where the surface waves have been formedis the most concerned, because the disturbance convects along the liquid jet and the sur-face wavelength does not change significantly (Karagozian, 2010; Sedarsky et al., 2010).Thus, the deflection of the liquid column in the streamwise direction of the gaseouscrossflow and the cross-section deformation of the liquid jet in the initial section areneglected.
∇ · Vj = 0,∂
∂tVj + (Vj · ∇)Vj = − 1
ρj∇pj , j = l, g (1)
where the subscriptj = l denotes the liquid andj = g denotes the gas,∇ is the gradientoperator. Initial velocities of the fluids in cylindrical coordinate areVl = (0, 0, Ul),Vg = (vg, wg, 0). Therefore in the initial section of the jet, the crossflow passing a liquidjet can be analogized as a gas stream passing a cylinder. The velocity componentsvg andwg can be expressed as
vg = Ug
(1− a2
r2
)cosα (2)
wg = −Ug
(1 +
a2
r2
)sinα (3)
whereα is the circumferential angle as shown in Fig. 1(b).The flows are perturbed by an infinitesimal perturbation written as a normal mode
form, and the interface of the liquid jet has the shape (Shen and Li, 1996)
r = a+ η(θ, z, t) = a+ η0ei(kz+mθ)+ωt (4)
whereη is the displacement of interface andη0 is initial displacement of the interface.t istime.k andn are the wave number of the perturbation inz andθ directions, respectively.ω is a complex frequency,ω = ωR + iωI , where the real partωR denotes the growthrate, and the imaginary partωI denotes the disturbance wave frequency. As there is novorticity initially in the flow, the flow is expected to be irrotational, i.e.,
∇2Φj = 0, j = l, g (5)
Then the velocity potentials can be written as
Φl = Ulz +Φ′l (6)
Φg = Ug
(r +
a2
r
)cosα+Φ′
g (7)
andu′j = ∇Φ′
j , j = l, g (8)
Atomization and Sprays

Theoretical Analysis of Surface Waves 27
∇2Φ′j = 0, j = l, g (9)
where the superscript′ represents the disturbance quantities which are written as
Φ′l = ϕl(r)e
i(kz+mθ)+ωt (10)
Φ′g = ϕg(r)e
i(kz+mθ)+ωt (11)
The solutionsϕj(r) (j = l, g) must satisfy the Ordinary Differential Equationboundary conditions,ϕl(r) → 0, asr → 0, ϕg(r) → 0, asr → ∞. Then Eqs. (10) and(11) are equal to
Φ′l = AIm(kr)ei(kz+mθ)+ωt (12)
Φ′g = BKm(kr)ei(kz+mθ)+ωt (13)
whereIm(kr) andKm(kr) aremth-order modified Bessel function of the first kind andsecond kind, respectively.A andB are constants depending on the boundary conditions.On the interface between the liquid column and the gas,Φ′
l andΦ′g must satisfy the
kinematic and dynamic boundary conditions.The kinematic boundary condition is that there is no net flux of mass across the
liquid column surface, i.e.,
∂Φ′l
∂r=
∂η
∂t+ Ul
∂η
∂z, at r ≈ a (14)
∂Φ′g
∂r=
∂η
∂t− Ug
r
(1 +
a2
r2
)sinα
∂η
∂θ, at r ≈ a (15)
For the dynamic boundary condition, the gas static pressurepg on the interface be-tween the liquid column and the gas is expressed as (Young et al., 2001)
pg = p∞ +1
2ρgU
2g (1− 4 sin2 α) (16)
wherep∞ is the gas static pressure far away from the liquid jet without disturbances. Thedynamic boundary condition requires that the stress tensor must be continuous across theinterface,
pl − pg = ∆p (17)
where∆p is the pressure jump due to the surface tension of the liquid jet. Thus thedynamic boundary condition can be written by combining Eqs. (16) and (17) as
pl − p∞ = ∆p− 1
2ρgU
2g (1− 4 sin2 α) (18)
Here the cross section of liquid column is assumed to be not deformed in the ini-tial section of the liquid jet flow, because the aerodynamic force just initially acts on
Volume 24, Number 1, 2014

28 Wang, Huang, & Liu
the column and needs time to deform the column against the viscous force and surfacetension. Actually in the experiments (Wu et al., 1997, 1998), it can also be seen that thecross section did not deform obviously at the near field of the nozzle exit. The resultantforce of the pressure difference and surface tension generates the acceleration on thecolumn. Mazallon et al. (1999) pointed out that the surface waves which associated withR-T instability involved a local phenomenon that was not affected by the dimensions ofthe liquid column itself. So we defined an effective thickness,h, which is the responsethickness for the aerodynamic acceleration and could be less than the jet radius, i.e.,
1
2ρgU
2g (1− 4 sin2 α) = ρlg(α)h (19)
whereg(α) is the acceleration induced by the aerodynamic force, and should be a func-tion of circumferential angle. The same phenomenon happens when wind blows ver-tically on an open air swimming pool and then an acceleration and surface wave willpresent. This acceleration is affected by a certain depth rather than the whole pool water.It is also similar to when a helicopter is flying above the lake or ocean. If the aerody-namic force induced by the propeller acts on the whole depth, there is nearly no acceler-ation and no surface waves, which is not consistent with the reality. So the assumptionthat aerodynamic acceleration acts on a certain thickness for the initial part of the jet isreasonable.
By substituting the instantaneous quantities into the dynamic boundary condition,one obtains the boundary condition of the disturbance in the form
(p′l − p′g)−∆p′ = ρlg(α)η (20)
Instantaneous surface tension induced by the disturbance on the interfacer = a +η(θ, z, t) is expressed as (Yang, 1992)
△p′ = −σ
{1
a2[1−m2 − (ka)2
]η
}(21)
whereσ is the liquid surface tension. Through the boundary conditions (14), (15), (20)and the time-dependent Bernoulli condition, the constantsη0, A, and B can be eliminatedand the dispersion equation is obtained,
kρgU2g (1− 4 sin2 α)
2h− σk
{1
a2[1−m2 − (ka)2
]}−[ρl(Ulk)
2 Im(ka)
I ′m(ka)
− ρg
(4mUg
asinα
)2Km(ka)
K ′m(ka)
]+2i
[ρlUlk
Im(ka)
I ′m(ka)+ρg
2mUg
asinα
Km(ka)
K ′m(ka)
]ω
+
[ρlIm(ka)
I ′m(ka)− ρg
Km(ka)
K ′m(ka)
]ω2 = 0
(22)
Atomization and Sprays

Theoretical Analysis of Surface Waves 29
where I ′m(ka) and K ′m(ka) are the derivative ofIm(ka) and Km(ka), respec-
tively.
Letting Ug = 0, the dispersion equation can be reduced to the form derived byYang (1992). If gas densityρg and velocityUg are set to zero, it reduces to the equationof Rayleigh (1878). By ensuring that Eq. (22) can be reduced to the typical dispersionequations of a round liquid jet into a quiescent gas, the current dispersion equation isverified.
3. RESULTS AND DISCUSSION
The dispersion Eq. (22) has a pair of conjugate roots for the complex frequencyω. Aspecial interest is taken in the real partωR which represents the growth rate of distur-bances.
ω2R =
[(kUl)
2Im+ρg
ρl
(4mUg
asinα
)2Km
][Im − ρg
ρlKm
] −
[kUlIm+
2mρgUg
ρlsinαKm
]2[Im − ρg
ρlKm
]2︸ ︷︷ ︸
A1
+
σk
ρla2[1−m2 − (ka)2
][Im − ρg
ρlKm
]︸ ︷︷ ︸
A2
+
kρgU
2g
ρl
|1− 4 sin2 α|2h[
Im − ρg
ρlKm
]︸ ︷︷ ︸
A3
(23)
whereIm = Im(ka)/I ′m(ka), Km(ka)/K ′m(ka).
It can be seen from Eq. (23) that the disturbance growth rate is influenced by theparameters involved, wave numberka, gas velocityUg, liquid jet velocityUl, effectivethickness h, and circumferential angleα, circumferential wave numberm. Asmarked in the equation, the growth rate consists of three terms,A1, A2, andA3, which are induced by jet velocities, liquid surface tension, and aerodynamicacceleration respectively. Especially,A3 is the growth rate of the R-T waveon the liquid column. The aerodynamic acceleration is an absolute value, because theterm (1 − 4 sin2 α) is negative when R-T instability is induced by a heavy fluid pen-etrating through a light fluid. Equation (23) can be written in terms of dimensionlessvariables as
Volume 24, Number 1, 2014

30 Wang, Huang, & Liu
ω2R
U2l /a
2=
[(ka)2Im +Q(4mΓ sinα)2Km]
[Im −QKm]− kaIm + 2QmΓ sinαKm
[Im −QKm]2︸ ︷︷ ︸A1
+
ka
Wel[1−m2 − (ka)2]
[Im −QKm]︸ ︷︷ ︸A2
+
WegWel
ka|1− 4 sin2 α|2h/a
[Im −QKm]︸ ︷︷ ︸A3
(24)
where the dimensionless parameters are defined asQ = ρg/ρl, Γ = Ug/Ul, Weg =ρgU
2g a/σ, Wel = ρlU
2l a/σ.
When Weg = 0, Eq. (24) is the same as the solution of dispersion equation derivedby Yang (1992). The upwind axial surface waves(α = 0,m = 0) are most evident inthe experiments by Wu et al. (1997, 1998).
Equation (24) is a monotonic increasing function of Weg whenα = 0 andm = 0.If the contribution of jet velocity toω2
R is neglected, the disturbance growth rate is onlyrelated to the gas Weber number. Equation (24) reduces to
ω2R =
kσ
ρla2[1− (ka)2] +
ρgU2g
ρl
k
2h
[I0 −QK0](25)
Actually, due to the properties of the Bessel function, whenka → ∞, Im → 1, andA1will equal zero. In general, for a liquid jet in gaseous crossflow,ρl ≫ ρg. Then,
ω2R =
ρgU2g
ρl
k
2h− k3σ
ρl(26)
This equation is a little different from the result of Ng et al. (2008), because ofdifferent analysis of aerodynamic acceleration. The optimum wavelength, correspondingto the maximum growth rate, is calculated through Eq. (26) as
λopt
a= 2
√6π
(h
a
)0.5
We−0.5g (27)
It should be noted that the characteristic length in Weber number is the jet radiusinstead of diameter. This optimum wavelength forh = a/8 is plotted in Fig. 2 with sev-eral available correlations which are experimentally studied by Mazallon et al. (1999)and Sallam et al. (2004). It can be seen that the present prediction withh = a/8 is wellconsistent with Sallam’s correlation. All those correlations refer to the upwind surfacewaves, corresponding to the circumferential angleα = 0. The aerodynamic force isconsidered to be converted into aerodynamic acceleration completely. However, actu-ally, the viscous force of the liquid and the gas compression would dissipate a part of
Atomization and Sprays

Theoretical Analysis of Surface Waves 31
FIG. 2: Comparison of the optimum wave length among predictions of the presentmodel and some available experimental results
aerodynamic force. Thus the effective thickness should be smaller thana/8. This willcontribute to generate and propagate waves with smaller wavelength along the jet, andthen enhance the performance of the jet breakup.
In the next section, effects of gas Weber number, and liquid Weber number on theupwind side will be discussed, respectively. Here, the liquid and gas are taken as waterand air. The relevant parameters are listed in Table 1.
3.1 The Effect of We g
Equation (24) shows that gas Weber number has influence only on termA3, and forthe surface wave, the effective thicknessh is set to bea/8 as mentioned above. Plottedin Fig. 3 is the dimensionless growth rate versus wave number at different gas Webernumbers. The triangle symbols represent the maximum growth rate. It can be seen thatfor Weg = 0, the most unstable wave number is approximately 0.76, which is larger thanthe Rayleigh analysis, 0.697. That is because the gas phase is taken into consideration
TABLE 1: Summary of relevant parameters
Gas density (air) (kg· m−3) 1.18
Liquid density (water) (kg· m−3) 995
Jet diameter (mm) 0.5
Surface tension (water) (N· m−1) 0.0708
Jet velocity (m· s−1) 5
Volume 24, Number 1, 2014

32 Wang, Huang, & Liu
(a)
(b)
FIG. 3: Variation of growth rate with wave number, Wel = 176; (a) Weg ≤ 8,(b) Weg ≥ 15
in the present analysis while it is not included in Rayleigh theory. Obviously, as thegas velocity increases, the range of unstable axial wave number and the correspondinggrowth rate increase significantly. It can also be observed in Fig. 4 for higher gas Webernumber. As Weg varies from 0 to 110, the upper limit of unstable axial wave numberincreases from 1.3 to 21.1. This denotes that aerodynamic force can increase the jetinstability and accelerate the growth of disturbance.
The flow at the wave number with maximum growth rate is most unstable and thiswave number is referred to as the optimum wave number. The optimum wavelength is
Atomization and Sprays

Theoretical Analysis of Surface Waves 33
FIG. 4: Variation of optimum wave number and corresponding maximum growth ratewith gas Weber number, Wel = 176
the dominant role of the corresponding surface waves and has an important effect onthe jet breakup process (Panchagnula et al., 1996; Sallam et al., 2004). The optimumwave number and the corresponding dimensionless maximum growth rate plotted inFig. 4 progressively increase with increasing the gas Weber number at Wel = 176. It isimplied that the larger the air crossflow velocity, the smaller is the wavelength of thedominant surface wave on the liquid column. This result is consistent with experimentalobservations by Wu et al. (1997), Mazallon et al. (1999), and Sallam et al. (2004). Inthe range of 0–30 for gas Weber number, the optimum wavelength decreases quicklycompared with the rise of the maximum growth rate. Instead, the maximum growth rateincreases dramatically for large Weg. Here, the characteristic length in Weber number isthe jet radius instead of diameter.
Obviously, the optimum wave number and the maximum growth rate are approxi-mate as power functions of gas Weber number. The best correlations are
(ka)opt = 1.38We0.46g (28)
[ω2R/(Ul/a
2)]max = 1.56× 10⁻²We1.52g (29)
The correlation coefficients of the fits are both 0.99.
3.2 The Effect of We l
The liquid Weber number, i.e., liquid jet velocity seen in Eq. (23) also has an impor-tant influence on the wave growth rate. Figure 5 plots the variation of growth rate with
Volume 24, Number 1, 2014

34 Wang, Huang, & Liu
FIG. 5: Variation of growth rate with wave number, Weg = 8
wave number at different liquid Weber numbers. The gas Weber number is set to 8 andthe effective thickness ish/8 according to the above section. The other parameters arethe same as in Table 1 except the jet velocity. Similar to the effect of Weg, the rangesof unstable axial wave number and the growth rate increase as liquid Weber numberincreases. The optimum wavelength which decreases with the increase of liquid Webernumber is plotted in Fig. 6, and it decreases slowly at large Wel. It means the wavelengthwill reach the minimum value rather than decrease monotonically as the liquid Webernumber increases.
FIG. 6: Variation of the optimum wavelength with liquid Weber number, Weg = 8
Atomization and Sprays

Theoretical Analysis of Surface Waves 35
To quantify the growth rate separately caused by Wel and Weg, namely by jet veloc-ity and gas velocity, respectively, termA1 and termA3 in Eq. (23) versus wave numberfor different gas and liquid Weber numbers are plotted in Fig. 7. The vertical coordinateω2
R represents the quantity ofA1 andA3. Figure 7 shows thatA3 is the primary contri-bution to the growth rate of small wave number(ka < 3) andA1 principally contributesto the growth rate at large wave number. So the surface wave with large wavelength isunder the control of transverse aerodynamic force and liquid surface tension. The op-timum wave number characterizes the fastest growing (or most probable) waves on theliquid surface which are thought to be eventually responsible for the breakup as can beseen. When the line ofA1 intersects the line ofA3 (A1 is equal toA3) just at the opti-mum wavenumber, this is the critical value and can be represented by the ratio Wel/Wegwhich is as same as the momentum ratioq = ρlU
2l /ρgU
2g . When Wel < 2811, A1
corresponding to the optimum wave numbers are far less thanA3. This implies that thedominant waves are mainly affected by the aerodynamic force and surface tension inthis condition. As the jet velocity increases, the effect of liquid Weber number graduallyincreases. As can be seen in Fig. 8, when Wel = 4932 and Weg = 6, A1 approximatelyequalsA3. The largest critical momentum ratio isqcr = 732 at which the contributionof liquid jet velocity to the wave growth rate is the same as the aerodynamic force andthe dominant wave is affected by all three terms in Eq. (23). Whenq > qcr, the ef-fect of liquid Weber number is more significant than that of gas Weber number. Onlywhenq < qcr, the optimum surface waves can be approximately calculated by Eq. (30).Similar to the critical momentum ratio which divides the regime of column waves andbreakup processes in crossflow (Wu et al., 1997),qcr is not a fixed value and it varieswith Weg. Figure 9, which displays the variation of critical momentum ratio with the gasWeber number, indicates that theqcr decreases as Weg increases. The best fit correlationof the critical momentum ratio is given by
FIG. 7: Comparison of termA1 and termA3 in Eq. (23) with different Weg and Wel
Volume 24, Number 1, 2014

36 Wang, Huang, & Liu
FIG. 8: The largest critical momentum ratio for termA1 and termA3 in Eq. (23)
FIG. 9: Variation of critical momentum ratio with the gas Weber number
qcr = 1821We−0.52g (30)
The correlation coefficient of the fit is 0.99. Actually,q is less thanqcr in most of theexperiments (Aalburg et al., 2004; Fuller et al., 1997; Mazallon et al., 1999; Sedarskyet al., 2010; Wu et al., 1997), because for high momentum ratio, the penetration of thejet is too large for the experimental test section. So the images of surface waves on theliquid column show R-T waves induced by aerodynamic force.
Atomization and Sprays

Theoretical Analysis of Surface Waves 37
3.3 The Breakup Length Prediction
The breakup of a liquid jet in crossflow occurs when the dominant wave amplitudeis equal to the jet radius at lower jet velocity (low liquid Weber number). This is thebreakup length in the liquid flow direction. So the breakup length can be predicted by
L = Ul ln(a/η0)/ωR (31)
Combining Eqs. (28) and (29), and setting effective thickness toa/8,
L
a= ln(a/η0)
(4√27
4
)(ρlU
2l
ρgU2g
)0.5(σ
ρgU2g a
)0.25
= ln(a/η0)
(4√27
4
)(q0.5
We0.25g
) (32)
For low-speed jets, the parameterln(a/η0) has been determined roughly to be 12 fromexperiments (Lin and Reitz, 1998). Thus,
L
a= 6.84
(q0.5
We0.25g
)(33)
Wu et al. (1997) gave the transverse height of the column fracture point as
L
a= 6.88q0.5 (34)
It can be seen that the effect of gas Weber number is taken into consideration inEq. (33). With lower gas and liquid Weber numbers, Eq. (33) agrees with the correlation(34) well. However, for higher gas and liquid velocities, the prediction (33) may not beaccurate because the parameterln(a/η0) = 12 is only corresponding to the low-speedjets (Fu et al., 2010; Lin and Reitz, 1998). This discrepancy may also be attributed to thebreakup regime for high-speed crossflow, like bag and shear breakup. Thus the breakuplength does not only depend on the surface waves.
4. CONCLUSION
The linear instability (especially R-T instability) model of a round inviscid liquid jet ina gaseous crossflow was presented. The fluids were assumed to be incompressible andinviscid. The deflection of the liquid column in the streamwise direction of the gaseouscrossflow and the cross-section deformation of liquid jet were neglected. The dispersionequation has been derived with the instability analysis and verified. It was found that theinstability of a liquid jet in a gaseous crossflow is dominated by three terms which are
Volume 24, Number 1, 2014

38 Wang, Huang, & Liu
separately caused by jet velocity, surface tension, and aerodynamic force. Neglecting theeffect of the jet velocity, the axial optimum wavelength on the upwind side is a powerfunction of gas Weber number with the parameter effective thickness and coincides withthe experimental results. The effect of liquid Weber number is similar to the gas Webernumber. Increasing liquid Weber number will increase the instability and decrease theoptimum wavelength. The model predictions also show that the aerodynamic force isthe primary contribution to the growth rate of small wave number (ka < 3) and jetvelocity principally contributes to the growth rate at large wave number. The criticalmomentum ratio at which the contribution of liquid jet velocity to the maximum growthrate is as large as that of the aerodynamic force decreases with the increase of gas Webernumber. The largest critical momentum ratio isqcr = 732. The jet breakup length in thelongitudinal direction can be predicted as a function of momentum ratio and gas Webernumber, and it agrees well with experimental correlation for lower gas and liquid Webernumbers. Finally, more experiments are needed to verify the model predictions.
REFERENCES
Aalburg, C., Sallam, K. A., and Faeth, G. M., Properties of nonturbulent round liquid jets inuniform crossflows,AIAA Aerospace Sciences Meeting and Exhibit, Nevada, 2004.
Ali, M. and Islam, A. K. M. S., Study on main flow and fuel injector configurations for scramjetapplications,Int. J. Heat Mass Transfer, vol. 49, pp. 3634–3644, 2006.
Becker, J. and Hassa, C., Breakup and atomization of a kerosene jet in crossflow at elevatedpressure,Atomization Sprays, vol. 11, pp. 49–67, 2002.
Boronin, S. A., Healey, J. J., and Sazhin, S. S., Non-modal stability of round viscous jets,J. FluidMech., vol. 716, pp. 96–119, 2013.
Fu, Q. F., Yang, L. J., Qu, Y. Y., and Gu, B., Linear stability analysis of a conical liquid sheet,J.Propuls. Power, vol. 26, pp. 955–968, 2010.
Fuller, R. P., Wu, P. K., Kirkendall, K. A., and Nejad, A. S., Effects of injection angle on columnbreakup processes of liquid fuel jets in subsonic crossflows,AIAA Paper 1997-2966, 1997.
Heister, S. D., Nguyen, T. T., and Karagozian, A. R., Modeling of liquid jets injected transverselyinto a supersonic crossflow,AIAA J., vol. 27, pp. 1727–1734, 1988.
Inamura, T., Trajectory of a liquid jet traversing subsonic airstreams,J. Propuls. Power, vol. 16,pp. 155–157, 1999.
Karagozian, A. R., Transverse jets and their control,Prog. Energy Combust. Sci., vol. 36, pp.531–553, 2010.
Kolpin, M. A. and Horn, K. P., Study of penetration of a liquid injectant into a supersonic flow,AIAA J., vol. 6, pp. 853–858, 1968.
Kush, E. A. J. and Schetz, J. A., Liquid jet injection into a supersonic flow,AIAA Paper 1972-1180, 1972.
Lin, S. P. and Lian, Z. W., Mechanisms of the breakup of liquid jets,AIAA J., vol. 50, pp. 120–126, 1988.
Atomization and Sprays

Theoretical Analysis of Surface Waves 39
Lin, S. P. and Reitz, R. D., Drop and spray formation from a liquid jet,Annu. Rev. Fluid Mech.,vol. 30, pp. 85–105, 1998.
Lovett, J. A., Brogan, T. P., Philippona, D. S., Keil, B. V., and Thompson, T. V., Developmentneeds for advanced afterburner designs,40th AIAA/ASME/SAE/ASEE Joint Propulsion Con-ference and Exhibit, Florida, 2004.
Mashayek, A., Jafari, A., and Ashgriz, N., Improved model for the penetration of liquid jets insubsonic crossflows,AIAA J., vol. 46, pp. 2674–2685, 2008.
Mazallon, J., Dai, Z., and Faeth, G. M., Aerodynamic primary breakup at the surface of non-turbulent round liquid jets in crossflow,Atomization Sprays, vol. 9, pp. 291–311, 1999.
Nejad, A. S., Schetz, J. A., and Jakubowski, A. K., Mean droplet diameter resulting from atom-ization of a transverse liquid jet in a supersonic airstream,AIAA Paper 1980-0899, 1980.
Ng, C. L., Sankarakrishinan, R., and Sallam, K. A., Bag breakup of nonturbulent liquid jets incrossflow,Int. J. Multiphase Flow, vol. 34, pp. 241–259, 2008.
Panchagnula, M. V., Sojka, P. E., and Santanglo, P. J., On the three-dimensional instability of aswirling, annular, inviscid liquid sheet subject to unequal gas velocities,Phys. Fluids, vol. 8,pp. 3300–3312, 1996.
Pandey, K. M. and Sivasakthivel, T., Recent advances in scramjet fuel injection c A review,Int.J. Chem. Eng. Appl., vol. 1, pp. 294–301, 2010.
Rayleigh, L., On the instability of jets,Proc. of the London Math. Soc., vol. 10, pp. 4–13, 1878.
Reichenbach, R. E. and Horn, K. A., Investigation of injectant properties on jet penetration in asupersonic stream,AIAA J., vol. 9, pp. 469–472, 1971.
Reitz, R. D. and Bracco, F. V., Mechanism of atomization of a liquid jet,Phys. Fluids, vol. 25,pp. 1730–1742, 1982.
Sallam, K. A., Aalburg, C., and Faeth, G. M., Breakup of round nonturbulent liquid jets ingaseous crossflow,AIAA J., vol. 42, pp. 2529–2540, 2004.
Schetz, J. A., Kush, E. A., and Joshi, P. B., Wave phenomena in liquid jet breakup in a supersoniccrossflow,AIAA J., vol. 18, pp. 774–778, 1980.
Sedarsky, D., Paciaroni, M., Berrocal, E., Petterson, P., Zelina, J., Gord, J., and Linne, M., Modelvalidation image data for breakup of a liquid jet in crossflow: Part I,Exp. Fluids, vol. 49, pp.391–408, 2010.
Shen, J. and Li, X., Instability of an annular viscous liquid jet,Acta Mechanica, vol. 114, pp.167–183, 1996.
Stenzler, J. N., Lee, J. G., and Santavicca, D. A., Penetration of liquid jets in a cross-flow,Atom-ization Sprays, vol. 11, pp. 887–906, 2006.
Sterling, A. M. and Sleicher, C. A., The instability of capillary jets,J. Fluid Mech., vol. 68, pp.477–495, 1975.
Wang, Q., Mondragon, U. M., Browm, C. T., and McDonell, V. G., Characterization of trajectory,break point, and break point dynamics of a plain liquid jet in a crossflow,Atomization Sprays,vol. 21, pp. 203–219, 2011.
Wang, X. H., Huang, Y., Wang, S. L., and Liu, Z. L., Bag breakup of turbulent liquid jets incrossflow,AIAA J., vol. 50, pp. 1360–1366, 2012.
Volume 24, Number 1, 2014

40 Wang, Huang, & Liu
Wu, P. K., Kirkendall, K. A., Fuller, R. P., Gruber, M. R., and Nejad, A. S., Spray trajectories ofliquid fuel jets in subsonic crossflows,Int. J. Fluid Mech. Res., vol. 24, pp. 128–137, 1997.
Wu, P. K., Kirkendall, K. A., Fuller, R. P., and Nejad, A. S., Spray structures of liquid jetsatomization subsonic crossflows,J. Propuls. Power, vol. 14, pp. 173–182, 1998.
Yang, H. Q., Asymmetric instability of a liquid jet,Phys. Fluids, vol. 4, pp. 681–689, 1992.
Yang, L. J., Liu, Y. X., and Fu, Q. F., Linear stability analysis of an electrified viscoelastic liquidjet, J. Fluids Eng., vol. 134, paper 071303, 2012.
Young, D. F., Munson, B. R., and Okiishi, T. H.,A Brief Introduction to Fluid Mechanics, NewYork: John Wiley Sons, 2001.
Zheng, Y. H. and Marshall, A. W., Characterization of the initial spray from low-weber-numberjets in crossflow,Atomization Sprays, vol. 21, pp. 575–589, 2011.
Zhu, Y., Huang, Y., Wang, F., and Wang, X. H., Experiment on breakup processes and surfacewaves of round liquid jets in crossflows, InProc. of ASME Turbo Expo, Glasgow, 2010.
Atomization and Sprays

Atomization and Sprays, 24 (1): 41–80 (2014)
DEVELOPMENT OF A NEW SPRAY/WALLINTERACTION MODEL FOR DIESEL SPRAYUNDER PCCI-ENGINE RELEVANTCONDITIONS
Yanzhi Zhang,1 Ming Jia,1,∗ Hong Liu,1 Maozhao Xie,1
Tianyou Wang,2 & Lei Zhou3
1School of Energy and Power Engineering, Dalian University ofTechnology, P. R. China
2State Key Laboratory of Engines, Tianjin University, P. R. China3Center for Combustion Energy, Tsinghua University, P. R. China
∗Address all correspondence to Ming Jia E-mail: [email protected]
Original Manuscript Submitted: 07/24/2013; Final Draft Received: 09/30/2013
A new spray/wall interaction model was developed with special emphasis on the premixed charge com-pression ignition (PCCI) engine-relevant conditions, i.e., high injection pressure and intermediate-to-high backpressure. The new model distinguishes between dry wall and wetted wall for a descrip-tion of the complicated spray/wall interaction process. The dry wall impingement regimes includedeposition and splash, whereas the wetted wall regimes consist of stick, rebound, spread, and splash.The regime transition thresholds of splash are determined based on recent experimental observations,which can account for the wide ranges of conditions related to engines. By using an updated log-normal distribution function, the sizes of the secondary droplets are determined in the improvedmodel, which is more suitable to describe the atomization process of the secondary droplets formed bysplash. Moreover, the velocities of the secondary droplets are determined by a Nukiyama-Tanasawadistribution function derived from the experimental measurements, and the ejection angle of the sec-ondary droplet is assumed to be in the interval (2◦, 30◦) uniformly, which is reasonable for highinjection pressure. In order to validate the new spray/wall interaction model, comparisons of the pre-dictions from the present model with the experimental measurements and predictions from a previ-ous spray/wall interaction model were conducted. The results indicate that the numerical predictionsfrom the new model illustrate better agreements with the experimental data than those of the previousmodel, especially in the case with high injection pressure under PCCI-engine relevant conditions.
KEY WORDS: spray/wall interaction model, diesel spray, injection timing, PCCIengines
1044–5110/14/$35.00 c© 2014 by Begell House, Inc. 41

42 Zhang et al.
1. INTRODUCTION
Diesel engines have been widely used in commercial vehicles all around the world due totheir low fuel consumption, high efficiency, and good reliability. However, as more andmore stringent regulations are being put forward, the conventional diesel engines sufferfrom high nitrogen oxides (NOx) and particulate matter (PM) emissions. The combus-tion mode of premixed charge compression ignition (PCCI) engines has been focused onconsiderably with regard to diesel engines in recent years due to its capability of keepingrelatively high efficiency and low emissions of NOx and PM (Kokjohn et al., 2011; Yaoet al., 2009).
In diesel PCCI engines, the fuel/air charge is well mixed prior to combustion. Earlyfuel injection is commonly used for achieving the premixed fuel/air mixture in the com-bustion chamber (Fang et al., 2007; Lee and Reitz, 2006; Okude et al., 2004). However,significant spray/wall impingement was produced in PCCI engines when an injectorwith a narrow spray cone and early-injection timing were employed (Kong et al., 2005)Diwakar and Singh (2009) investigated the importance of spray/bowl interaction in adirect-injection diesel engine with early-injection PCCI combustion mode. It was in-dicated that spray/bowl interaction in PCCI engines with early injection is extremelyimportant, and start of injection (SOI) timing, spray cone angle, and piston bowl shapehave significant influences on the emissions of PCCI engines. The spray/wall impinge-ment promotes the mixture of fuel and air, but also leads to the formation of a wall fuelfilm on the piston. This results in a region where the fuel/air mixture is too rich for com-plete combustion, and consequently produces high levels of unburned hydrocarbons andPM emissions (Drake et al., 2003; Stevens and Steeper, 2001; Sandquist et al., 2000).The experiments from Siewert (2007) demonstrated that the fuel spray that misses thepiston bowl surface has a close connection with the increases in smoke, HC and COemissions, and a reduction of the engine’s thermal efficiency. Therefore, a better under-standing of the spray/wall interaction process, which includes the characteristics of thesecondary droplets formed by splash and the wall film resulting from the spray/wall im-pingement, will be helpful in the design of injection and combustion systems to improveengine performance and reduce engine emissions.
The phenomena of spray/wall interaction under conditions of real engines are dif-ficult to describe due to the complicated in-cylinder flow, injection, and combustionprocesses. Thus fundamental studies were usually performed at simplified flow con-figurations to qualitatively investigate the spray/wall interaction process. For example,Katsura et al. (1989) experimentally observed the influences of the injection pressure, thedistance between the injector and wall, the ambient gas pressure, and temperature on thecharacteristics of the impinged spray in a constant volume combustion chamber. In gen-eral, it is difficult to measure the characteristics of the secondary droplets near the wallregion, such as the sizes and velocities of the secondary droplets resulting from splash.Alternatively, computational modeling offers a promising approach to obtain detailed
Atomization and Sprays

Development of a New Spray/Wall Interaction Model 43
information about the spray/wall interaction, especially under the complicated engine-relevant conditions.
A few spray/wall interaction models have been developed in the last 30 years, whichmostly used the impingement of individual droplets to describe the behavior of the im-pinged spray, despite the fact that a summation of individual droplets could not representa spray exactly (Roisman et al., 2002; Roisman et al., 2006). Moreira et al. (2010) offeredan important review of the experimental and numerical investigations of the spray/wallinteraction under engine-relevant conditions recently, giving a systematic summarizationof the current investigation of the impingement of a single droplet and spray. They in-dicated that the reason why the impingement of an individual droplet cannot accuratelydescribe the behavior of the impinged spray is mostly due to the complex drop/dropinteractions in sprays being neglected. Several issues still need to be solved in furtherinvestigations, which include the transition criterion between deposition and splash, themultiple drop interactions, and the effects of the film on the mechanisms and character-istics of secondary droplets resulting from splash, etc. Naber and Reitz (1988) made thefirst efforts to model the spray/wall interaction by identifying three different regimes,i.e., stick, reflect, and jet. In the stick regime, the impinged droplets stick on the wall; inthe rebound regime, the impinged droplets are reflected elastically; and in the jet regime,it is assumed that the impinged droplets move tangentially along the wall surface andthe velocity magnitudes are unchanged compared to the impinging droplets. There areseveral drawbacks existing in the model developed by Naber and Reitz (1988). The firstone is the splash regime is ignored, which plays an important role in the atomization andvaporization of the impinged spray. The second one is that the model does not considerthe loss of energy and momentum of the impinged droplets. Moreover, the threshold ofdifferent regimes in the model is based on observations of the experiment by Wachtersand Westerling (1966), by impinging a liquid drop on a hot wall whose temperature ishigher than the Leidenfrost temperature of the fuel. Thus the criteria may not be suitablefor engine-relevant conditions, with the surface temperature of the bowl being below theboiling temperature of the fuel.
Senda et al. (1994) developed a spray/wall interaction model based on experimen-tal results. The model distinguished between cold wall and hot wall with the consid-eration of liquid saturation temperature. Furthermore, Senda et al. (1997, 2000) im-proved the spray/wall interaction model by taking account of the effect of a preformedwall film on the film formation process. The improved model divided the impingementinto low-energy impingement and high-energy impingement, and the criterion of thetwo kinds of impingement is Weber number of the incident droplet. For the case oflow-energy impingement (i.e., We< 300), the expression describing the characteris-tics of the secondary droplets formed by splash are based on the dimensionless filmthickness and the constraint of the energy conservation. For the case of high-energyimpingement (i.e., We> 300), the model includes both the regimes of deposition andsplash.
Volume 24, Number 1, 2014

44 Zhang et al.
O’Rourke and Amsden (2000) proposed a spray/wall interaction model (subsequentlyreferred to as the OA model) based on two experimental studies from Yarin and Weiss(1995) and Mundo et al. (1995) with consideration of energy conservation. Two regimesof deposition and splash are considered in the model, and the threshold of the tworegimes accounts for the effect of the film thickness. The direction of the tangential ve-locities of the secondary droplets is statistically chosen from the distribution accordingto the work of Naber and Reitz (1988).
Bai et al. (2002) developed another spray/wall interaction model (referred to as theBG model) on the basis of the experimental results and conservation laws for determi-nation of the impingement regimes, transition criteria, and droplet characteristics afterimpingement. The model considers the wall conditions of dry wall and wetted wall, anduses the Weber number as the transition criterion among the different regimes. In thecase of dry wall, there are three regimes including stick, spread, and splash, whereas theregimes of rebound, spread, and splash are considered in the wetted wall case. Basedon the experimental observations, the ejection angle of the secondary droplets uniformlydistributes in the range of 5∼ 50◦. Nevertheless, Allocca et al. (2006) indicated thatthe OA model produced an unrealistic spray shape, and the BG model overestimated theheight of the impinged spray for the cases of high injection pressures, which are typicaloperating conditions for diesel engines.
The aim of this paper is to develop a new spray/wall interaction model for impingedspray on a wall whose temperature is below the boiling temperature of the fuel underPCCI-engine relevant conditions, characterizing high injection pressure and intermediate-to-high backpressure. First, numerical simulations were performed to validate the newmodel, and the predictions simulated with the new model are compared with the ex-perimental measurements and the calculated results using the OA model. Then multi-dimensional simulation coupled with the new spray/wall interaction model was appliedto predict the combustion and emissions characteristics of PCCI engines with variousinjection timings. The influence of injection timing on the mixture preparation processfor the diesel PCCI engine was also investigated.
2. MODEL FORMULATION
Spray impingement is an extremely complicated process which is influenced by manyfactors, such as the velocity, size, and temperature of the incident droplet; the viscosityand surface tension of the fluid; the temperature and roughness of the impinged wall;as well as the wall film thickness and gas boundary conditions (if present). In order tofully describe the process of spray/wall interaction, some important issues are refined inthis study, including the types of impingement regimes, the transition criterion from oneregime to another, and the postimpingement characteristics.
Atomization and Sprays

Development of a New Spray/Wall Interaction Model 45
2.1 Impingement Regimes and Transition Criteria
The impingement regimes are generally affected by the properties of incident dropletsand the impinged wall conditions (wall roughness, temperature, and film thickness). Ageneral description of the impingement regimes for the conditions of a dry heated wallis proposed by Bai and Gosman (1995), which is identified by the Weber number of theimpinged droplet and wall temperature as shown in Fig. 1.
In Fig. 1,TB is the liquid boiling temperature,TPA is the liquid pure adhesion tem-perature below which adhesion occurs at low impact energy,TN is the liquid Nakayamatemperature at which a droplet reaches its maximum evaporation rate,TPR is the liq-uid pure rebound temperature above which bounce occurs at low impact energy,TLeid
is the Leidenfrost temperature, andTw is the wall temperature. It can be seen that theWeber number of the droplet and the wall temperature shows the major influences on theoutcomes of droplet/wall interaction. Several characteristic temperatures are applied toidentify the different regimes with the following relations:
TB < TPA < TN < TPR < TLeid
According to Kong (2007), under diesel-engine conditions, where the in-cylinder pres-sure already exceeds the critical pressure of the fuel droplet, it is unlikely that the surfacetemperature will exceed either the Leidenfrost temperature or the critical temperature. In
FIG. 1: Overall droplet impingement regimes and transition conditions for a dry heatedwall from Bai and Gosman (1995).
Volume 24, Number 1, 2014

46 Zhang et al.
other words, the wall surface temperature is less than the liquid boiling temperature anda wall film will be formed on the piston surface under diesel-engine relevant conditions.Thus the corresponding regimes of the impinged droplets are stick, rebound, spread, andsplash. In consideration of dry wall and wetted wall, the following impingement regimesare used for the new spray/wall interaction model: deposition and splash for dry wall;stick, rebound, spread, and splash for wetted wall.
In order to determine which regime will occur in a certain condition, it is necessaryto establish the transition criterion from one regime to another. The transition criteriaare determined by several nondimensional numbers which include Weber number (We),Reynolds number (Re), Laplace number (La), Ohnesorge number (Oh), and capillarynumber (Ca), characterizing the relative magnitude of the forces acting to the impingingdroplet.
2.1.1 Dry Wall
The transition criteria between the deposition and splash for the dry wall (Kdry,splash)used in this study is taken from the work of Cossali et al. (1997) for investigation of theimpingement of a single droplet on a solid surface. This criterion is based on the curve-fitresults which combine several previously published experimental data, which is definedas
Kdry,splash = 649 + 3.76R−0.63nd (1)
whereRnd is the dimensionless surface roughness, which is defined as the ratio betweenthe surface mean roughness (R) and the incident droplet diameter (db). Thus the criterioncan account for the effect of surface roughness on the critical value between depositionand splash. The parameterKdry is a nondimensional number, which is generally definedas the following form:
Kdry = A OhaWeb (2)
whereA, a, andb are empirical constants. Stow and Hadfield (1981) first introducedthe parameterKdry, which has been widely used in literature as the critical value forthe onset of the splash regime. In the present study,A = 1, a = −0.4, andb = 1.Considering thatKdry,splash = Oh−0.4We, Eq. (1) can be rewritten as
Wedry,splash = Oh0.4(649 + 3.76R−0.63nd ) (3)
2.1.2 Wetted Wall
The transition criteria between stick to rebound and rebound to spread are taken fromthe work of Stanton and Rutland (1996), which is proposed based on the experimentalinvestigations of Jayaratne and Mason (1964) and Rodriguez and Mesler (1985):
Wewet,stick = 5Wewet,rebound = 10
(4)
Atomization and Sprays

Development of a New Spray/Wall Interaction Model 47
When the Weber number of an incident droplet exceeds the transition value betweenstick and rebound (i.e., Wen > Wewet,stick), the incident droplet will bounce off the filmwhich was formed due to pre-existing impingement. Otherwise, the impinged dropletwill stick on the wall in nearly a spherical form. When the Weber number of an in-cident droplet exceeds the transition value between rebound and spread (i.e., Wen >Wewet,rebound), the impinged droplet will merge with the liquid film upon impact; oth-erwise the incident droplet will rebound from the wall.
This criterion for spread to splash is proposed by Wang et al. (2002), who conductedsystematic experiments using a single droplet to impact upon the wetted wall surfacecovering with different film thickness. The criterion is
Wewet,splash =
450 δ ≤ 0.1
1375.7δ + 340 0.1 < δ < 1.0
1043.8 + 232.6δ−1 − 1094.4δ−2 + 1576.4δ−3 δ > 1.0
(5)
whereδ is the dimensionless film thickness, which is defined as the ratio between themean film thickness (h) and the incident droplet diameter (db). It is assumed that whenthe droplets impact on the wetted wall, only film thickness affects the transition criteriaand the effects of surface roughness are neglected.
2.2 Postimpingement Characteristics
After identifying the regimes of impingement, it is necessary to determine the postimpin-gement characteristics for the regimes. The following assumptions are employed in thisstudy:
1. For stick regime, the impinged droplets adhere to the surface of the film in nearlya spherical form.
2. For deposition/spread, the impinged droplets are assumed to merge with the liquidfilm upon impact.
3. For rebound regime, the impinged droplets bounce off the film when the energyof incident droplet is low. The magnitude and direction of the rebound dropletvelocity need to be determined in the rebound regime. The velocity of the dropletwhich bounces off the film is determined using Eq. (6) , which was obtained fromthe work of Bai and Gosman (1995) as
Vat =57Vbt
Van = −eVbn
(6)
Volume 24, Number 1, 2014

48 Zhang et al.
whereVtb andVbn are the tangential velocity and normal velocity of the incidentdroplet, respectively, andVat andVan are the tangential velocity and normal ve-locity of the rebounded droplet, respectively. The quantitye is the coefficient ofrestitution, which is described by the following equation:
e = 0.993− 1.76α + 1.56α2 − 0.490α3 (7)
whereα is the incident angle of the impinged droplet and is measured from thewall surface.
4. For the splash regime, several important quantities need to be determined, includ-ing the mass ratio, which is defined as the ratio between the total ejected massand the total injected mass (i.e.,ma/mb), the diameter, ejection angle, and ve-locity of the secondary droplets. The secondary droplets are small droplets fromthe impingement site produced by splash. These quantities determined in the newspray/wall interaction model are given in the following sections in detail.
2.2.1 Mass Ratio for Splash Regime
Theoretical analysis and experimental results show that when splash occurs, a fractionof the impinged droplets will be ejected as secondary droplets and others will remain onthe surface. When the incident droplet impacts on a wetted wall, it has been proved thatthe splashing droplets may entrain the liquid film, so the mass ratio will be larger than 1.However, detailed experimental information about the mass ratio is insufficient, despitethat the mass ratio is believed to be affected by many factors, such as wall roughnessand film thickness. Bai and Gosman (1995) proposed a correlation for the mass ratiounder dry wall and wetted wall conditions in which the mass ratio distributes uniformlyin its range according to the observations of the related experiments. Experimental datawere also reported by Yarin and Weiss (1995), who studied the impingement of a trainof droplets upon a solid surface. The experimental results from Yarin and Weiss (1995)are shown in Fig. 2.
According to the experimental observations from Yarin and Weiss (1995), the splashcriterion is determined byu = 18, whereu is the nondimensional impact velocity,which is expressed byu = Vbn (σ/ρ)−1/4 (µ/ρ)−1/8 f−3/8, andf is the impingementfrequency. By substituting the impingement frequencyf = Vbn/dd intoK = Oh−0.4We,the relation betweenKcr andu could be obtained asKcr = u3.2. So the splash criterionof Yarin and Weiss can be converted toKcr = 10, 396. By fitting the experimental datafrom Yarin and Weiss (1995), a new correlation used to determine the mass ratio whenthe incident droplets impact upon a dry wall is constructed in the present study as
γm =ma
mb= 0.80
{1− exp
[−3.17× 10⁻⁴(K −Kcr)]}
, (8)
Atomization and Sprays

Development of a New Spray/Wall Interaction Model 49
K-Kcr
MassRatio
0 20000 40000 60000 800000
0.2
0.4
0.6
0.8
1
1.2
Yarin and Weiss (1995)
0.80*(1-exp(-3.17*10-4*(K-K
cr)))
FIG. 2: Mass ratio of the secondary droplet.
whereγm is the mass ratio;ma andmb are the mass of the incident droplet and thesecondary droplet, respectively; andK is the criterion defined in Eq. (2). It can be seenfrom Fig. 2 that with the increase ofK−Kcr, the mass ratio between the total secondarydroplets and the incident droplets increases from zero to a value of about 0.80 rapidlyand remains nearly constant from then on.
When the incident droplets impact upon a wetted wall, the mass ratio may be largerthan 1, as mentioned previously. The mass ratio for a wetted wall used in this study canbe determined by the work from Bai and Gosman (1995) as
γm =ma
mb= 0.2 + 0.9ε, (9)
whereε is a random number distributed uniformly in the interval (0, 1). Thus, consider-ing the wall conditions, the mass ratio can be summarized as
γm =ma
mb=
{0.80
{1− exp
[−3.17× 10⁻⁴(K −Kcr)]}
for dry wall
0.2 + 0.9ε for wetted wall(10)
2.2.2 Secondary Droplet Diameter for Splash Regime
The experimental observations (Cossali et al., 1997; Mundo et al., 1995; Stow and Had-field, 1981; Yarin and Weiss, 1995) indicated that when the wall is rough or wet, crown
Volume 24, Number 1, 2014

50 Zhang et al.
splashing happens, with a crownlike sheet forming and propagating out of the impinge-ment site. The droplet is transformed to a crown first and then the sheet disintegratesto form jets at the top of the crown, which further breaks up to produce much smallersecondary droplets. Experiments have found that the crown splashing produces the sec-ondary droplets with various sizes, which can be well described by the log-normal dis-tribution function (Levin and Hobbs, 1971; Samenfink et al., 1999; Stow and Stainer,1977). This is because of the multiplicative nature of the log-normal distribution func-tion, which may be similar to the characteristics of the atomization of the secondarydroplets formed by splash. The general expression of the log-normal distribution func-tion is
f(da) =1
daσ√
2πexp
(− [ln(da)− ln(dm)]2
2σ2
)(11)
whereσ anddm are the geometric standard deviation and the geometric mean diameter,respectively, which need to be determined. Wu (2003) determined the geometric meandiameter of the secondary droplets through a simplified physical analysis by relating tothe dimensionless parameterK ′ as
dm
db= 19.86K ′−0.5 (12)
whereK ′ = WeRe0.5. The geometric standard deviationσ is determined by Wu (2003)using the principle of maximum rate of entropy production, which yields the geomet-ric standard deviation with a constant with a value of
√6/6. According to the work
from Moreira et al. (2010), if there is only one mechanism of atomization of secondarydroplets in the computation model, it is more likely that the variations of the geometricstandard deviation become negligible. So it is believed that the constant geometric stan-dard deviation used in this study is reliable. The log-normal distribution function of thesecondary droplets according to Wu (2003) can be written as
f(da/db) =√
3√π (da/db)
exp{−3
[ln
(da
db
)− 1
6− ln
(dm
db
)]}(13)
By comparing the predictions from Eq. (13) with the existed experimental results (Mundoet al., 1995; Samenfink et al., 1999; Stow and Stainer, 1977), Wu (2003) found Eq. (13)predicts the sizes of secondary droplets quite well. However, when Eq. (12) is appliedto the cases with high-energy impingement (i.e., diesel spray), which largely exceed therange of validity of Eq. (12), very small sizes of the secondary droplets are produced.Thus Eq. (12) is updated in this study as
dm
db= max
(19.86K ′−0.5, 0.05
)(14)
Atomization and Sprays

Development of a New Spray/Wall Interaction Model 51
The second argument in Eq. (14) is referenced from the experimental work of Yarinand Weiss (1995) and Mundo et al. (1995), who observed that the maximumda/db isnot likely less than 0.06. In this study, it is reasonable to slightly lower this value to0.05, which could better reproduce the sizes of the secondary droplets for the cases ofhigh-energy impingement.
2.2.3 Secondary Droplet Velocities for Splash Regime
The information about the velocities of the secondary droplets is very limited. Mundoet al. (1995) reported a distribution for the secondary droplet velocities, which has beenadopted in many models (O’Rourke and Amsden, 2000; Han et al., 2000; Stanton andRutland, 1996). In order to develop a practical velocity model for the secondary dropletsafter splashing, several simplified assumptions are introduced in this study. Accordingto Bai et al. (2002), a fundamental assumption is that the velocity fields of the secondarydroplets, as the results of the oblique impingement, can be described as a superpositionof those arising from a tangential splashing and a normal splashing. Tangential splashingonly originates a tangential splashed velocity~Vat, which is related to the incident tan-gential velocity~Vbt, whereas normal splashing produces a splashed velocity~Van, whichis neither normal nor tangential. The total splashed velocity can be obtained by addingthe two parts, yielding
~Va = ~Vat + ~Van. (15)
Figure 3 gives a schematic diagram of the simplification of the velocity of the splasheddroplet.
Wall
Vat
Vat
Van
Vbt
Vbn
Vbt
Vb
α
β
θVa
ϕ
Front View
Top View
FIG. 3: Schematic diagram of the velocity of the splashed droplet.
Volume 24, Number 1, 2014

52 Zhang et al.
After a normal splash, the magnitude of the vector~Van can be determined by aNukiyama-Tanasawa distribution function as
f(Van) =4√π
V 2an
V 3a,max
exp
[−
(Van
Va,max
)2]
(16)
whereVbn is the normal velocity of the incident droplet andVa,max = 0.3Vbn. Equa-tion (16) is derived from the experiment of Mundo et al. (1995), which provides detailedinformation on the velocity distribution of the secondary droplets.
The next quantity that needs to be determined is the orientation of the vector~Van,including the ejection angleθ and the azimuth angleβ of the secondary droplet. Theejection angle of the secondary dropletθ is measured from the wall, which is affectedby many factors, such as wall conditions (surface roughness and film thickness) Allen(1988) indicated that when droplets impact upon a deep water, the ejection angle ofthe secondary droplet lies at 30∼ 70◦ with a larger possibility, while Gahdiri (1978)found that the ejection angle of the secondary droplet is more likely in the range of 20∼ 60◦ when droplets impact on a rough soil surface. Bai et al. (2002) assumed that theejection angle of the secondary droplet is in the interval (5◦, 50◦) uniformly. In this study,the ejection angle of the secondary droplet is taken in the interval (2◦, 30◦) uniformly,according to the suggestion from Allocca et al. (2006), and the reason will be explainedlater.
The azimuth angleβ of the secondary droplet is defined as the angle that the tangen-tial velocity makes with the vector~et in the plane of the wall (see Fig. 3), which is in theinterval (0,π). The azimuth angle is statistically calculated by the distribution suggestedby Naber and Reitz (1988) in this study as
β = −π
χln
[1− k(1− e−χ)
](17)
wherek is another random number distributed uniformly in the interval (0, 1), andχ isa quantity related to the incident droplet angleφ, which is measured from the normaldirection.
sinϕ =eχ + 1eχ − 1
χ2
χ2 + π2(18)
In this study, it is assumed that tangential splashing has no influence on the normal ve-locity of the splashed droplet and only transfers a portion of its tangential momentumto the secondary droplet. The tangential velocity of the secondary droplet resulting fromthe tangential splashing is
~Vat = ξ~Vbt, (19)
Atomization and Sprays
Development of a New Spray/Wall Interaction Model 53
whereξ is the friction coefficient. In this study, the friction coefficient is 0.95. Bai etal. (2002) adoptsξ in the range of 0.6∼ 0.8. However, Allocca et al. (2006) indicatedthat BG model underestimated the wall spray radius and overestimated the splash height,especially under the conditions of high injection pressure. It was suggested that the ejec-tion angle should be in the interval (2◦, 30◦) and the friction coefficient should be set at0.95 (Allocca et al., 2006). It is well known that the injection pressure under the condi-tions of modern direct-injection diesel engines is very high, so it is reasonable to adoptthe suggestions from Allocca et al. (2006).
Overall, the new spray/wall interaction model proposed in this study considers botha dry wall and wetted wall from the view that the spray will impinge onto the dry pis-ton surface at the first stage of cold starting, and then impinge onto the film producedby the preimpingement. The impingement regimes for the dry wall are deposition andsplash, and the regimes in the conditions of wetted wall consist of stick, rebound, spread,and splash. The regime transition threshold between the deposition and splash for thedry wall case is based on the experimental results of Cossali et al. (1997), which ac-counts for a wide range of surface roughness of the typical piston surface of engines.And for the case of a wetted wall, the transition threshold between spread and splashis determined by the experimental studies of Wang et al. (2002), who conducted sys-tematic experiments by causing a single droplet to impact upon the wetted wall sur-face covering with different film thickness, and could fully explain the effects of filmthickness on the transition threshold when the surface is wet. The mass ratio betweenthe secondary droplets and the incident droplets is determined by a formula based oncurve-fitting experimental results according to Yarin and Weiss (1995) for a dry wall.For wetted wall, the mass ratio can be determined by the work of Bai and Gosman(1995) from the viewpoint that the mass ratio may be larger than 1 because splashingdroplets may entrain liquid film from the surface film. The size distribution of the sec-ondary droplets is adopted by an updated log-normal distribution function from the workof Wu (2003), which may be more suitable to describe the process of the atomizationof the secondary droplets formed by splash. The velocities of secondary droplets aredetermined by a Nukiyama-Tanasawa distribution function, which is derived from theexperimental measurements of Mundo et al. (1995), and the ejection angle of the sec-ondary droplets of the new model is taken in the range of 2∼ 30◦ uniformly, which issuitable for the case of high injection pressure according to the work from Allocca et al.(2006).
The necessity of improvements of the spray/wall interaction model in this study canbe summarized in two aspects. First, a few spray/wall interaction models have been val-idated against experimental results under the PCCI-engine relevant conditions, i.e., highinjection pressure and intermediate-to-high backpressure. Second, many well-developedspray/wall interaction models could not accurately predict the penetrations of the im-pinged spray and the characteristics of the secondary droplets produced by splash underthe conditions of high-injection-pressure practical diesel engines.
Volume 24, Number 1, 2014

54 Zhang et al.
3. NUMERICAL METHOD
The computational fluid dynamics (CFD) code used in this study is KIVA-3V (Amsden,1997), which solves the three-dimensional equations of reactive flows with sprays usinga structured grid. The particle method is employed in KIVA-3V to represent the spray,in which each computational particle represents a parcel of real droplets with similarthermodynamic and kinematic properties. Several enhanced submodels are introduced inthe code to accurately account for spray breakup, collision, atomization, and evaporationprocesses, which are listed in Table 1.
The fuel model used in this study is the diesel fuel model DF2. The standard k-ε
turbulence model was employed for the simulation of diesel injection in the constantvolume combustion chamber with quiescent ambient gas. The droplet breakup processwas described by the Kelvin-Helmholtz Rayleigh-Taylor (KH-RT) breakup model (Ri-cart et al., 2000), which is based on a linear stability analysis of liquid jets (Reitz andBracco, 1986; Reitz, 1987). Our previous study (Jia et al., 2008a) indicated that the KH-RT model predicted the atomization and evaporation characteristics well under PCCI-engine relevant conditions, including the spray penetration, vapor distribution, and thediameter and velocity of the droplets. The constants of the KH-RT breakup model usedin this study are summarized in Table 2. Furthermore, the collision model developedby Nordin (2001) with the improvement of grid independence was employed to theKIVA-3V code. The dynamics of the wall film was simulated by the model developedby O’Rourke and Amsden (1996), which considers the effects of the motion due to filminertia, splash of impinging spray, and film spreading resulting from the impingementforces on liquid film evolution. The droplet drag force and single-component evapora-tion model provided by KIVA-3V were also adopted in the simulations. For simplicity,
TABLE 1: Improved models
Turbulent modelBreakup modelCollision modelWall film model
Standard k-ε model (Amsden, 1997)KH-RT model (Ricart et al., 2000)Nordin model (Nordin, 2001)O’Rourke and Amsden model (O’Rourke and Amsden, 1996)
TABLE 2: Constants used in the KH-RT breakupmodel
Constant Explanation ValueCb
B1
B0
Ct
C3rt
Jet breakup lengthTime scale for KHProduct droplet radius for KHTime scale for RTProduct droplet radius for RT
30180.611.02.5
Atomization and Sprays

Development of a New Spray/Wall Interaction Model 55
the present paper did not consider the cavitation and turbulence effect inside the nozzle,and all the initial diameters are assumed to be the same as the nozzle orifice diameter.
4. RESULTS AND DISCUSSION
In an attempt to validate the new spray/wall interaction model, the model was integratedinto the KIVA-3V code to compare with both the experimental results and the predic-tions of the OA model in this section. The main reason for using the OA splash model(O’Rourke and Amsden, 2000) for comparison is that the OA splash model and the OAparticle wall film model were integrated into KIVA model as the default models, andhave been widely applied in engine simulations. According to the investigation of Kong(2007), the OA splash model and the OA particle wall film model can be treated as thebaseline to develop another more accurate droplet/wall interaction model. The valida-tions presented in this study primarily focus on the penetrations of the impinged spray,including the spray radius, spray height, and the local parameters of the impinged spray,including the velocities and sizes of the secondary droplets at a given position.
All the simulations in constant volume combustion chambers were calculated in acylindrical domain where grid size varies from 0.6 to 3 mm, as shown in Fig. 4. Thesensitivity of the time step, the grid size, and the number of liquid parcels on the pre-dictions were performed and evaluated for each case tested in this study in order to getconverged and reliable solutions. The mesh was refined using a geometric distributionin both radial and azimuthal directions near the nozzle with a minimum grid size of 0.6mm. It was found that the spray penetration and the spray/wall interaction behavior werenot significantly affected by the grid size with further grid refinement. Throughout theduration time of injection, a total of 30,000 droplet parcels were introduced to representthe spray for most cases according to the injected fuel mass, and it was found that fur-ther increasing the droplet parcels did not obviously affect the spray penetration and the
FIG. 4: Grid used in the present study.
Volume 24, Number 1, 2014

56 Zhang et al.
behavior of the impinged spray. The time step used in this study is in the range of 0.1–1µs with the variation of injection pressure, which is capable of achieving satisfactoryconvergence for the numerical solutions. Moreover, the injection velocity is determinedusing the square wave injection pulse according to the injected fuel mass, injection dura-tion, injection pressure, and the parameters of the nozzle. The nozzle center was placed1 mm below the center of the top edge.
In predicting the spray/wall interaction process, the characteristics of the spray be-fore impingement dramatically affect the behavior of the impinged spray. Therefore, itis necessary to validate the spray behavior before impinging on the wall. Figure 5 showscomparisons of spray penetration between the predictions using the KH-RT breakupmodel and the experimental measurements of Hiroyasu and Kadota (1974). In the pre-dictions, the ambient pressure is 3 and 5 MPa, and more detailed experimental conditionscan be found in Hiroyasu and Kadota (1974). It can be seen from Fig. 5 that the KH-RTbreakup model reproduces the spray penetration quite well at both ambient pressures.More about the validations of the spray and atomization characteristics of the spray be-fore impingement can be found in our previous work (Jia et al., 2008a).
4.1 Validations for the Experiments of Fujimoto et al. (1990)
Fujimoto et al. (1990) experimentally investigated the phenomenon of spray/wall in-teraction by injecting diesel to a flat wall at high ambient pressure and room temper-ature with various inclination angles. The laser light extinction method was used tomeasure the spatial and temporal distributions of the droplet density. Some sets of the
Injection Time (ms)
Spraypenetration(mm)
0 0.5 1 1.5 2 2.50
20
40
60
80
100
Pamb=3 Mpa, Experiment
Pamb=5 Mpa, Experiment
Pamb=3 Mpa, Simulation
Pamb=5 Mpa, Simulation
FIG. 5: Comparisons of the spray penetrations between the results predicted by the KH-RT breakup model and the experimental measurements of Hiroyasu and Kadota (1974).
Atomization and Sprays

Development of a New Spray/Wall Interaction Model 57
experimental data which measured the radius and the height of the impinged spray un-der conditions of normal impingement and inclined impingement are used to test thenew model in this section. The test conditions of the experiment are listed in Table 3.
As shown in Fig. 6(a), the radius of the impinged spray (Rw) is defined as the dis-tance from the axis to a domain in which 99% mass of the total secondary droplets iscontained. The height of the impinged spray (Hw) is defined as the distance between thewall and the domain above which less than 1% mass of the secondary droplets lies.
The radius and the height of the impinged spray using the new model and the OAmodel versus time are compared with the experimental data under conditions of normalimpingement, as shown in Figs. 7(a) and 7(b). It can be seen from Fig. 7(a) that both thenew model and the OA model predict the radius of the impinged spray well. However,the OA model slightly overestimates the radius at the late stage of the injection, while thenew model predicts the radius very well. Concerning the height of the impinged sprayshown in Fig. 7(b), both the new model and the OA model underestimate the height ofthe impinged spray at the start of the impingement and overestimate the height at the endof the injection. The OA model reproduces the height better than the new model, which
TABLE 3: Specifications of the experi-ments from Fujimoto et al. (1990)
Wall distance (mm) 24Gas pressure (MPa) 1.5Gas temperature (K) 293Nozzle diameter (mm) 0.2
Injection angle (◦) 90
Fuel injected (mm3) 8.3Injection duration (ms) 1.3Injection pressure (MPa) 13.8Fuel Diesel
Injector
H
R
Rw
Hw
Wall
Zw
Zw
αw
Hd
Rd
Injector
Wall
(a) (b)
FIG. 6: Structure of the impinged spray.
Volume 24, Number 1, 2014

58 Zhang et al.
Injection Time (ms)
ImpingedSprayRadiusRw(mm)
0 0.5 1 1.5 2 2.5 30
5
10
15
20
25
30
35
Experiment
New model
OA model
Injection Time (ms)
ImpingedSprayHeightHw(mm)
0 0.5 1 1.5 2 2.5 30
5
10
15
Experiment
New model
OA model
Injection Time (ms)
ImpingedSprayRadiusRd(mm)
0 0.5 1 1.5 2 2.5 3 3.50
10
20
30
40
50
60
Experiment
New model
OA model
Injection Time (ms)
ImpingedSprayRadiusRd(mm)
0 0.5 1 1.5 20
10
20
30
40
50
Experiment
New model
OA model
(a) (b)
(c) (d)
FIG. 7: Comparisons of the predictions and measurements Fujimoto et al. 1990) for(a,c,d) impinged spray radius and (b) impinged spray height. (a)αw = 0◦, (b) αw = 0◦,(c) αw = 15◦, and (d)αw = 30◦.
slightly underpredicts the height compared to the OA model. This may be explained bythe ejection angle of the new model, which lies at 2∼ 30◦ uniformly. As a matter offact, the ejection angle could be affected by many factors, such as the energy of the im-pinged droplet and the wall conditions. Andreassi et al. (2007) concluded that the rangeof ejection angle is a function of the normal Weber number of the impinged droplet interms of injection pressure and backpressure, whereas, more experimental data for theejection angle of the secondary droplet are required in order to better describe its char-acteristics. Figures 7(c) and 7(d) show comparisons of the radius of the impinged spray(Rd) [defined in Fig. 6(b)] in the downstream area of the impingement site for the casesof inclined impingement. It can be clearly seen that the new model gives better agree-ment with the experimental data. Nevertheless, the OA model slightly underestimatesthe radius of the impinged spray, especially under the conditions of the inclined angle(αw) of 30◦ [see Fig. 7(d)].
Figure 8 shows the images of the spray and gas velocity fields predicted by thenew model at three different times after the start of injection. It can be seen that there
Atomization and Sprays
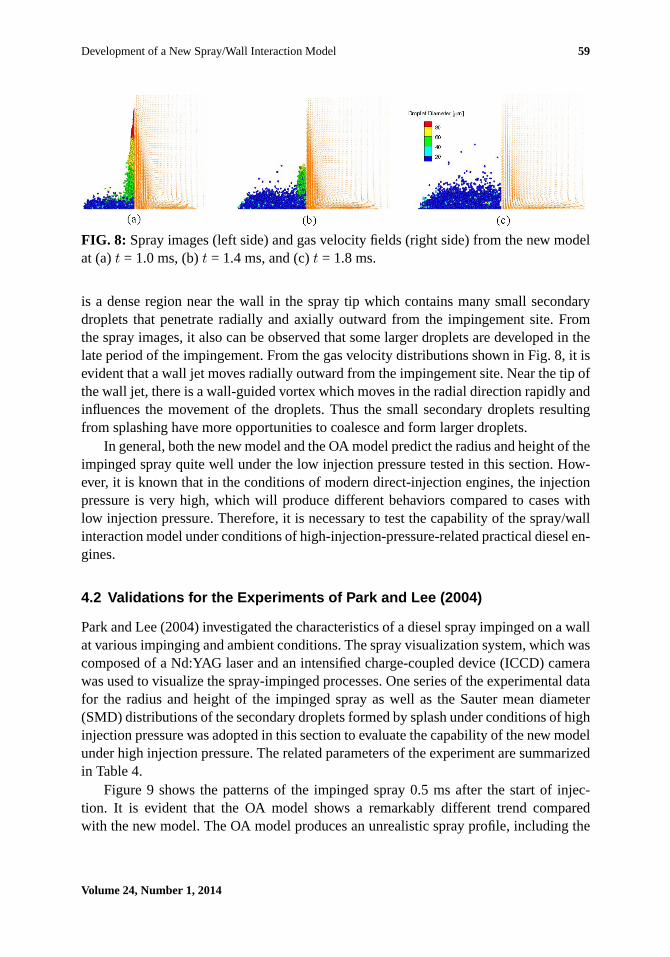
Development of a New Spray/Wall Interaction Model 59
FIG. 8: Spray images (left side) and gas velocity fields (right side) from the new modelat (a)t = 1.0 ms, (b)t = 1.4 ms, and (c)t = 1.8 ms.
is a dense region near the wall in the spray tip which contains many small secondarydroplets that penetrate radially and axially outward from the impingement site. Fromthe spray images, it also can be observed that some larger droplets are developed in thelate period of the impingement. From the gas velocity distributions shown in Fig. 8, it isevident that a wall jet moves radially outward from the impingement site. Near the tip ofthe wall jet, there is a wall-guided vortex which moves in the radial direction rapidly andinfluences the movement of the droplets. Thus the small secondary droplets resultingfrom splashing have more opportunities to coalesce and form larger droplets.
In general, both the new model and the OA model predict the radius and height of theimpinged spray quite well under the low injection pressure tested in this section. How-ever, it is known that in the conditions of modern direct-injection engines, the injectionpressure is very high, which will produce different behaviors compared to cases withlow injection pressure. Therefore, it is necessary to test the capability of the spray/wallinteraction model under conditions of high-injection-pressure-related practical diesel en-gines.
4.2 Validations for the Experiments of Park and Lee (2004)
Park and Lee (2004) investigated the characteristics of a diesel spray impinged on a wallat various impinging and ambient conditions. The spray visualization system, which wascomposed of a Nd:YAG laser and an intensified charge-coupled device (ICCD) camerawas used to visualize the spray-impinged processes. One series of the experimental datafor the radius and height of the impinged spray as well as the Sauter mean diameter(SMD) distributions of the secondary droplets formed by splash under conditions of highinjection pressure was adopted in this section to evaluate the capability of the new modelunder high injection pressure. The related parameters of the experiment are summarizedin Table 4.
Figure 9 shows the patterns of the impinged spray 0.5 ms after the start of injec-tion. It is evident that the OA model shows a remarkably different trend comparedwith the new model. The OA model produces an unrealistic spray profile, including the
Volume 24, Number 1, 2014

60 Zhang et al.
TABLE 4: Specifications of the ex-periments of Park and Lee (2004)
Wall distance (mm) 50Wall temperature (K) 293Gas pressure (MPa) 0.1Gas temperature (K) 293Nozzle diameter (mm) 0.3Injection angle (◦) 90Fuel injected (mg) 16.8Injection duration (ms) 1.0Injection pressure (MPa) 80Fuel Diesel
FIG. 9: Spray profiles at 0.5 ms for (a) the new model and (b) the OA model.
underestimation of the radius of the impinged spray and overestimation of the height ofthe impinged spray. In an attempt to show a quantitative comparison of the two modelswith the experimental data, the time evolution of the radius and height of the impingedspray from the computed results and experimental data are shown in Fig. 10. It is con-firmed that the new model simulates the radius and height of the impinged spray ratherwell, while the OA model dramatically underestimates the radius and overestimates theheight of the impinged spray. The discrepancy between the predictions from the OAmodel and the measurement may be explained by the fact that the velocity distributionof the secondary droplet produced by splash in the OA model yields a much larger nor-mal component and lower tangential component of the secondary droplet velocity thanthe measurement for the case of high injection pressure. Therefore, the secondary dropletpredicted by the OA model penetrates longer distances in the normal direction comparedto the measurement, at the same time leading to shorter radial penetration.
Figure 11 gives comparisons of the SMD between the predictions and the corre-sponding measurements, including the overall SMD evolution and the radial distribu-tion of the local SMD atHw = 10 mm, after the start of injection at 3.0 ms for the
Atomization and Sprays

Development of a New Spray/Wall Interaction Model 61
Injection Time (ms)
ImpingedSprayRadius(mm)
0 0.2 0.4 0.6 0.8 1 1.2 1.4 1.60
20
40
60
80
Experiment
New model
OA model
Injection Time (ms)
ImpingedSprayHeight(mm)
0 0.5 1 1.5 2 2.50
10
20
30
40
50
60
Experiment
New model
OA model
(a) (b)
FIG. 10: Comparison between the computed results and experimental data (Park andLee, 2004) for (a) the radius of the impinged spray and (b) the height of the impingedspray.
(a) (b)Injection Time (ms)
OverallSMD( µm)
0 0.5 1 1.5 2 2.5 3 3.50
20
40
60
80
Experiment
New model
OA model
Radical Distance (mm)
LocalSMD(µm)
5 10 15 20 25 30 35 40 450
10
20
30
40
50
Experiment
New model
OA model
FIG. 11: Comparison between the calculated SMD results and the experimental resultsof Park and Lee (2004) for (a) the overall SMD of the impinged spray and (b) the localSMD of the impinged spray atHw = 10 mm after the start of injection at 3.0 ms.
impinged spray. It can be seen from Fig. 11(a) that both the new model and the OAmodel reproduce the evolution of the overall SMD reasonably well, in which the SMDdecreases before 1.0 ms and then remains nearly constant. From Fig. 11(b) it is evi-dent that the new model predicts the local SMD more accurately than the OA model,which significantly overestimates the local SMD, especially at locations with longer ra-dial distance. This could be explained by the following two aspects. One reason is thatthe new model uses a log-normal distribution function to describe the variations of thesizes of the secondary droplets, which may be more suitable for the atomization processof the secondary droplets formed by splash. And the other reason is that the new modeladoptsdm/db = max(19.86K ′−0.5, 0.05) to determine the mean sizes of the secondary
Volume 24, Number 1, 2014

62 Zhang et al.
droplets, while the OA model usesdm/db = max(K ′crit/K ′, 6.4/We, 0.06). Thus the
SMD predicted by the new model is lower than that of the OA model for the case ofhigh-energy impingement and agrees better with the experimental data.
For diesel PCCI engines, the fuel vapor distribution during and the period of thespray/wall interaction are very important, because it significantly influences the com-bustion and emission characteristics. Mohammadi et al. (2002) investigated the effectof spray/wall interaction on the gas entrainment process in diesel sprays and indictedthat the gas entrained into the spray area, typically at the impinging area due to the gasvortex around the spray. Figure 12 shows the predicted equivalence ratio distributionsand gas velocity fields by the new model at three different times. It can be clearly seenthat the ambient air entrains into the region between the spray axis and the wall-jet vor-tex, so that richer fuel/air mixtures primarily exist in the vortex front and the spray coneregions. Thus it can be said that the structure of the vortex has an important role in thefuel/air mixing processes. Since the vortex structure is significantly affected by the im-pinged droplets (see Fig. 8), it confirms the importance of the spray/wall interaction inenhancing the equivalence ratio distributions, which is consistent with the experimentalresults of Mohammadi et al. (2002).
4.3 Validations for the Experiments of Allocca et al. (2006) and Andreassiet al. (2007)
Allocca et al. (2006) and Andreassi et al. (2007) studied the characteristics of the nor-mal impingement of a diesel spray under the conditions of high injection pressures (upto 120 MPa) and various backpressures both numerically and experimentally. In the ex-periments, a common rail injection system was employed to inject diesel fuel into a flatstainless steel wall. A pulsed laser sheet was used to light the impinged spray, and theimages of the impinged spray were photographed by a CCD camera at different timesafter the start of injection. The specifications of the experiments are listed in Table 5.
FIG. 12: Predicted equivalence ratio distribution and gas velocity field from the newmodel at (a)t = 0.8 ms, (b)t = 1.0 ms, and (c)t = 1.2 ms.
Atomization and Sprays

Development of a New Spray/Wall Interaction Model 63
TABLE 5: Specification of experiments from Allocca et al.(2006) and Andreassi et al. (2007)
Wall distance (mm) 22Wall temperature (K) 298Gas pressure (MPa) 0.1, 3.0Gas temperature (K) 293Nozzle diameter (mm) 0.18Injection angle (◦) 90Fuel injected (mg) 8.44 (80 MPa), 9.67 (120 MPa)Injection duration (ms) 1.0Injection pressure (MPa) 80, 120Fuel Diesel
The images of the impinged spray simulated by the new and the OA model arecompared with the experimental measurements att = 300µs in Figs. 13 and 14. As canbe seen, the increase of injection pressure from 80 to 120 MPa leads to the increasedheight and radius of the impinged spray, which are accurately reproduced by the newmodel. Similar to the results shown in Section 4.2, it is also found that the new modelreproduces the shapes of the impinged spray much better than the OA model. Thereforeit can be concluded that the OA model may be inadequate to represent the physicalphenomenon of splash, which is consistent with the numerical results from Allocca etal. (2006).
The quantitative comparison of the radius and the height of the impinged sprayamong the predictions and the measurement at the injection pressure of 80 MPa andthe backpressure of 0.1 MPa is shown in Fig. 15. It is obvious that the new spray/wall
FIG. 13: Comparisons of the images of the spray between the numerical results (right)and the measurements (left) (Allocca et al., 2006) att = 300µs for (a) the new modeland (b) the OA model (Pinj = 80 MPa,Pamb = 0.1 MPa).
Volume 24, Number 1, 2014

64 Zhang et al.
FIG. 14: Comparisons of the images of the spray between the numerical results (right)and the measurements (left) Allocca et al., 2006) att = 300µs for (a) the new model and(b) the OA model (Pinj = 120 MPa,Pamb = 0.1 MPa).
(a) (b)Injection Time (µs)
ImpingedSprayRadius(mm)
0 500 10000
10
20
30
40
50
60
Experiment
New model
OA model
Injection Time (µs)
ImpingedSprayHeight(mm)
0 500 10000
5
10
15
20
25
30
Experiment
New model
OA model
FIG. 15: Comparisons of the predicted results and experimental data (Andreassi et al.,2007) versus time (Pinj = 80 MPa,Pamb = 0.1 MPa). (a) The radius and (b) the heightof the impinged spray.
interaction model predicts the radius and the height of the impinged spray quite well,while the OA model underestimates the radius and overestimates the height with largediscrepancy relative to the measurement, which is consistent with the results shown inFig. 10. The profiles of the impinged spray at injection pressures of 80 and 120 MPaare shown in Figs. 16 and 17, respectively. In general, the new model is capable of ac-curately reproducing the evolution of the impinged spray at both injection pressures. Inthe case of 80 MPa injection pressure, the predicted radius of the impinged spray fromthe new model is in good agreement with the measured data, whereas the height of theimpinged spray is slightly overpredicted by the new model. Meanwhile, for the case of120 MPa injection pressure, the new model reproduces both the radius and the height ofthe impinged spray reasonably well.
Atomization and Sprays

Development of a New Spray/Wall Interaction Model 65
(a) (b)Distance from the axis (mm)
Distancefromthewall(mm)
0 5 10 15 20 250
5
10
15
20
25
Experiment
New model
Distance from the axis (mm)
Distancefromthewall(mm)
0 10 20 300
5
10
15
20
25
Experiment
New model
FIG. 16: Comparisons of the profiles of the spray between the new model and the ex-periments (Allocca et al., 2006) at (a)t = 400µs and (b)t = 700µs (Pinj = 80 MPa,Pamb = 0.1 MPa).
(a) (b)Distance from the axis (mm)
Distancefromthewall(mm)
0 5 10 15 20 250
5
10
15
20
25
Experiment
New model
Distance from the axis (mm)
Distancefromthewall(mm)
0 10 20 300
5
10
15
20
25
Experiment
New model
FIG. 17: Comparisons of the profiles of the spray between the new model and the ex-periments (Allocca et al., 2006) at (a)t = 400µs and (b)t = 700µs (Pinj = 120 MPa,Pamb = 0.1 MPa).
Furthermore, Fig. 18 shows comparisons of the profiles of the impinged spray be-tween the new model and the experimental measurements at a backpressure of 3 MPaand injection pressure of 80 and 120 MPa. As can be seen, good agreements betweenthe numerical and the experimental results are obtained. It is found that the new modelsatisfactorily reproduces the experimental observation that the radius and height of theimpinged spray decrease with the increase of backpressure. This can be explained by thefact that as the surrounding pressure increases, the spray penetration decreases due to theincreased density of the surrounding air. With the spray penetration decreasing, the gasvelocity setup over the wall decreases due to the low spray inertia. Thus the tangential
Volume 24, Number 1, 2014

66 Zhang et al.
(a) (b)Distance from the axis (mm)
Distancefromthewall(mm)
0 5 10 15 200
5
10
15
20
25
Experiment
New model
Distance from the axis (mm)
Distancefromthewall(mm)
0 5 10 15 200
5
10
15
20
25
Experiment
New model
FIG. 18: Comparisons of the profiles of the spray between the new model and the ex-periments (Andreassi et al., 2007) withPamb = 3 MPa att = 1000µs for (a)Pinj = 80MPa and (b)Pinj = 120 MPa.
velocities of the secondary droplets also decrease, which results in the low penetrationof the impinged spray.
4.4 Validations for the Experiments of Arcoumanis and Chang (1994)
Arcoumanis and Chang (1994) conducted the experiments under atmospheric conditionsto investigate the spatial and temporal characteristics of the transient diesel spray imping-ing normally onto unheated walls. Phase Doppler anemometry was employed to measurethe sizes and tangential velocities of the secondary droplets produced by splashing. Asummary of the related parameters used in the investigation is given in Table 6.
In the experiments, the measurement points were located at radial distances ofR =6 mm, 10 mm, and 15 mm from the spray axis, and at vertical distances ofH = 0.5 mm,
TABLE 6: Specifications of the experimentfrom Arcoumanis and Chang (1994)
Wall distance (mm) 30Gas pressure (MPa) 1Gas temperature (K) 293Nozzle diameter (mm) 0.22Injection angle (degree) 90
Fuel injected (mm3) 4.0Injection duration (ms) 1.0Injection pressure (MPa) 26Fuel Diesel
Atomization and Sprays

Development of a New Spray/Wall Interaction Model 67
1.5 mm, 3 mm, and 5 mm away from the wall. Only the experimental results at heightsof 0.5 mm and 5 mm away from the wall are discussed in this section, which are relatedto the representative regions of the two-phase wall jet—the main wall-jet region, thestagnation region, and the downstream region (Arcoumanis and Chang, 1994), as shownin Fig. 19.
Figure 20 shows comparisons of the computed droplet tangential velocities and thecorresponding experimental measurements in the main wall-jet region (H = 0.5 mm,R = 6 mm) and in the stagnation region (H = 5 mm,R = 6 mm). It is depicted that at theposition ofH = 0.5 mm andR = 6 mm, both the new model and the OA model underpre-dict the tangential velocities of the secondary droplets. However, the results predicted by
Nozzle
R=15mmR=6mm R=10mm
H=0.5mm
H=5mm
Wall
(1) (3)
(4)(2)
FIG. 19: Measurement locations and the representative regions of the two-phase walljet: (1) main wall-jet region, (2) stagnation region, (3) wall-jet vortex, and (4) leadingedge from the experiment of Arcoumanis and Chang (1994).
(a) (b)Injection Time (ms)
TangentialVelocity(m/s)
0 0.5 1 1.5 2 2.5 3-20
0
20
40
60
Experiment
New model
OA model
Injection Time (ms)
TangentialVelocity(m/s)
0 0.5 1 1.5 2 2.5 3-20
-10
0
10
20
30
Experiment
New model
OA model
FIG. 20: Comparison of the computed tangential velocity of the secondary droplet withthe experimental data from Arcoumanis and Chang (1994) at (a)H = 0.5 mm,R = 6mm and (b)H = 5 mm,R = 6 mm.
Volume 24, Number 1, 2014

68 Zhang et al.
the new model show better agreement with the experimental data than those of the OAmodel, especially near 1.5 ms after the start of injection. AtH = 5 mm andR = 6 mm,the new model predicts the tangential velocities quite well and shows almost the sametrend with the experimental measurement, while the OA model significantly overesti-mates the measured data. It also can be observed from Fig. 20 that with the increaseddistance from the wall, the mean tangential velocity decreases in general, indicating thetangential momentum of the impinged droplets is relatively large in the near-wall re-gion. This trend is captured by both the new model and the OA model, although somediscrepancies exist between these two models.
Comparisons of the computed tangential velocities and the experimental data in themain wall-jet region and near the stagnation region atH = 0.5 mm,R = 10 mm andH = 5 mm,R = 10 mm are shown in Fig. 21. The results simulated by the new model arebetter than those from the OA model, especially near the stagnation region atH = 5 mm,R = 10 mm. Figure 22 further depicts comparisons of the tangential velocities of the sec-ondary droplets near the downstream region atH = 0.5 mm,R = 15 mm andH = 5 mm,R = 15 mm. It is evident that both the new model and the OA model underestimatethe experimental data in the wall-jet region (H = 0.5 mm andR = 15 mm), which issimilar to the conditions atH = 0.5 mm,R = 6 mm (see Fig. 20). At the position ofH = 5 mm andR = 15 mm corresponding to the region of the wall-jet vortex, the newmodel gives better agreement with the experimental results than the OA model, whichobviously overpredicts the experimental data. In particular, the new spray/wall interac-tion model accurately predicts the negative tangential velocities of secondary dropletsafter 2.0 ms, despite that the magnitudes of the negative tangential velocities are verysmall and close to zero. This indicates that there is a wall vortex existing in this re-gion (Lee and Ryou 2000). However, the simulation with the OA model cannot effi-ciently reproduce the vortex in this region. This is primarily because the OA model
(a) (b)Injection Time (ms)
TangentialVelocity(m/s)
0 0.5 1 1.5 2 2.5 3-20
0
20
40
60
Experiment
New model
OA model
Injection Time (m/s)
TangentialVelocity(m/s)
0 0.5 1 1.5 2 2.5 3-20
-10
0
10
20
30
40
Experiment
New model
OA model
FIG. 21: Comparison of the computed tangential velocity of the secondary droplet withthe experimental data from Arcoumanis and Chang (1994) at (a)H = 0.5 mm,R = 10mm and (b)H = 5 mm,R = 10 mm.
Atomization and Sprays

Development of a New Spray/Wall Interaction Model 69
(a) (b)Injection Time (ms)
TangentialVelocity(m/s)
0 0.5 1 1.5 2 2.5 3-20
0
20
40
60
Experiment
New model
OA model
Injection Time (ms)
TangentialVelocity(m/s)
0.5 1 1.5 2 2.5 3-20
-10
0
10
20
30
40
Experiment
New model
OA model
FIG. 22: Comparison of the computed tangential velocity of secondary droplet with theexperimental data from Arcoumanis and Chang (1994) at (a)H = 0.5 mm,R = 15 mmand (b)H = 5 mm,R = 15 mm.
underpredicts the radial penetration of the impinged spray. Therefore, the radial distancebetween the vortex and the impingement site predicted by the OA model is less thanthat of the measurement, which means that the OA model cannot efficiently predict thevortex in the region of the wall-jet vortex.
Figures 23–25 give comparisons of the predicted SMD with the measurements atdifferent locations. It is clearly observed that predictions from the new model agreewith the experimental results much better than those from the OA model. The OA modeloverpredicts the SMD in most of the locations, which is consistent with the investigationsof Jia et al. (2008b) and Lindgren and Denbratt (2004). Note that the new model usesa log-normal distribution function, which is updated from the work of Wu (2003), to
(a) (b)Injection Time (ms)
SMD(µm)
0 0.5 1 1.5 2 2.50
5
10
15
20
25
30
35
40
Experiment
New model
OA model
Injection Time (ms)
SMD(µs)
0 0.5 1 1.5 2 2.5 30
10
20
30
40
50
60
Experiment
New model
OA model
FIG. 23: Comparison of the predicted SMD with the experimental data from Arcouma-nis and Chang (1994) at (a)H = 0.5 mm,R = 6 mm and (b)H = 5 mm,R = 6 mm.
Volume 24, Number 1, 2014
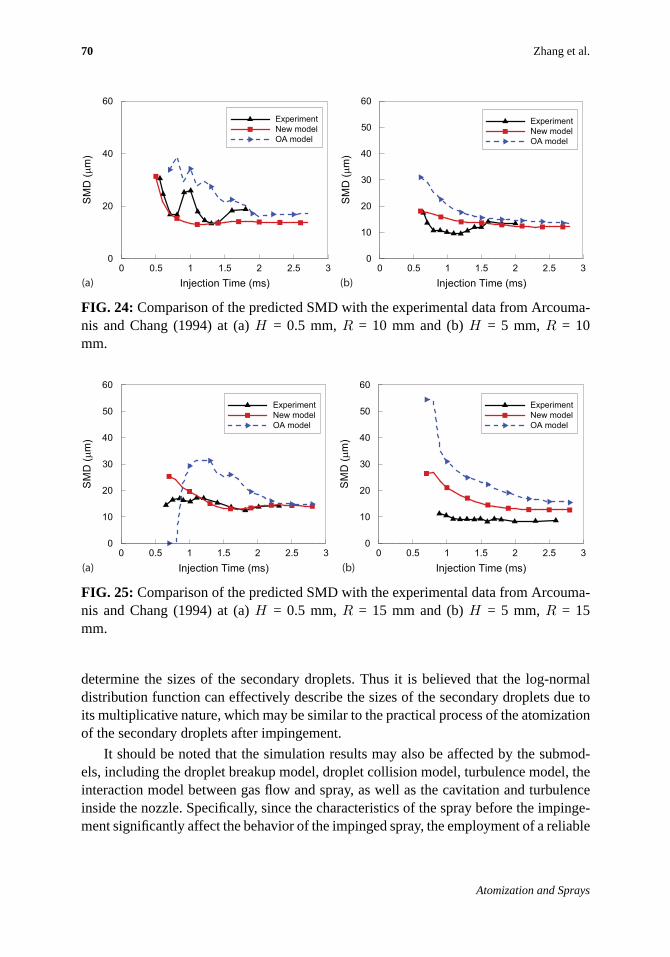
70 Zhang et al.
(a) (b)Injection Time (ms)
SMD(µm)
0 0.5 1 1.5 2 2.5 30
20
40
60
Experiment
New model
OA model
Injection Time (ms)
SMD(µm)
0 0.5 1 1.5 2 2.5 30
10
20
30
40
50
60
Experiment
New model
OA model
FIG. 24: Comparison of the predicted SMD with the experimental data from Arcouma-nis and Chang (1994) at (a)H = 0.5 mm,R = 10 mm and (b)H = 5 mm, R = 10mm.
(a) (b)Injection Time (ms)
SMD(µm)
0 0.5 1 1.5 2 2.5 30
10
20
30
40
50
60
Experiment
New model
OA model
Injection Time (ms)
SMD(µm)
0 0.5 1 1.5 2 2.5 30
10
20
30
40
50
60
Experiment
New model
OA model
FIG. 25: Comparison of the predicted SMD with the experimental data from Arcouma-nis and Chang (1994) at (a)H = 0.5 mm,R = 15 mm and (b)H = 5 mm, R = 15mm.
determine the sizes of the secondary droplets. Thus it is believed that the log-normaldistribution function can effectively describe the sizes of the secondary droplets due toits multiplicative nature, which may be similar to the practical process of the atomizationof the secondary droplets after impingement.
It should be noted that the simulation results may also be affected by the submod-els, including the droplet breakup model, droplet collision model, turbulence model, theinteraction model between gas flow and spray, as well as the cavitation and turbulenceinside the nozzle. Specifically, since the characteristics of the spray before the impinge-ment significantly affect the behavior of the impinged spray, the employment of a reliable
Atomization and Sprays

Development of a New Spray/Wall Interaction Model 71
spray breakup model and collision model is important for the simulation. Moreover, theturbulence model also strongly affects the motions of the secondary droplets formed bysplash; thus accurate descriptions of the turbulent flow and the interaction between thegas flow and droplet is crucial for prediction of the penetration of the impinged spray.Additionally, the assumption of neglecting the nozzle cavitation and turbulence effectinside the nozzle may impact the outcomes of the impinged spray. Therefore furtherimprovement of the related submodels and validation of the new spray/wall interactionmodel under wide operating conditions still needs to be performed in future work. How-ever, it is found that the results predicted by the OA model in this study are consistentwith the investigations of Jia et al. (2008b) and Allocca et al. (2006) with the KIVA-3Vcode. Therefore it is believed that the predictions presented in this study are reliable, andthe overall trends of the impinged spray can be more accurately captured by the newmodel.
4.5 Validations for the PCCI Engine
Finally, the simulations in a diesel PCCI engine were conducted in order to demonstratethe capabilities of the new model to predict the effects of injection timings on the com-bustion and emission characteristics, and to investigate the effect of the injection timingon the mixture preparation process in practical PCCI engines. In this section the newspray/wall interaction model was integrated into the KIVA-3V code, which was thenapplied for the simulations of PCCI engine. For the engine simulations, the turbulentmodel is the renormalization (RNG) k-ε turbulent model (Han and Reitz, 1995), whichcan deal well with the variable-density engine flow within the combustion chamber. Thewall heat-transfer model of Han and Reitz (1997) was also adopted, which considers theturbulent Prandtl number and the variations in the gas density in the boundary layer. Askeletaln-heptane mechanism using a decoupling methodology (Liu et al., 2012) wasemployed to predict the chemical reaction processes of the diesel fuel due to the similarignition and heat release characteristics betweenn-heptane and diesel fuel. The skele-tal n-heptane mechanism was extensively validated against corresponding experimentalresults under wide operating conditions and shows good agreement with the measure-ments. Therefore, then-heptane mechanism is suitable for simulating the combustionprocess of PCCI engines in this section. In addition, the extended Zeldovich mechanismwas used to simulate the formulation of NOx and the complex processes of the formationand oxidation of soot were modeled by an improved phenomenological soot model (Jiaet al., 2009).
The experimental data from Lee (2007) in a diesel PCCI engine were employed tovalidate the predicted combustion and emissions characteristics. A 45◦ (1/8 of cylinder)mesh with 18,706 cells at the top dead center (TDC), which is shown in Fig. 26, wasadopted in the simulations. Detailed engine specifications and operating conditions aresummarized in Table 7.
Volume 24, Number 1, 2014

72 Zhang et al.
FIG. 26: Computational grids for the simulation of the PCCI engine.
TABLE 7: Engine specifications and operating conditionsfrom the experiment of Lee (2007)
Displacement 0.477 LBore×stroke (mm×mm) 82× 90.4Compression ratio 16.0:1Piston geometry Open-crater-type bowlNozzle hole number 8Nozzle hole diameter (mm) 0.133Start of injection (◦ CA BTDC) 22.5∼40Spray include angle (◦) 130Engine speed (rpm) 2000Injection pressure (MPa) 150Injection quantity (mg/cyc) 15.0Fuel Diesel
As shown in Fig. 27, the calculated in-cylinder pressure and heat release rate profilesshow good agreement with the experimental measurements for the cases with variousinjection times. The simulated CO, HC, NOx, and soot emissions are compared with theexperimental results in Fig. 28. It also can be found that the predictions agree reason-ably well with the measurements, although NOx emission is underpredicted for all theinjection times. It should be noted that the input parameters and the submodels still showsome uncertainties for the multidimensional simulation. Specifically, a relatively simpleNOx emission model was employed in this study for the reduction of the computationaltime, which could also significantly affect the final predicted NOx emissions. Overall,the computational model with the new spray/wall interaction submodel is capable of wellreproducing the experimental data of the in-cylinder pressure, heat release, and emissioncharacteristics for diesel PCCI combustion.
Jia et al. (2011) investigated the effects of injection timing and intake valve clos-ing timing on the performance and emission characteristics of a diesel PCCI engine by
Atomization and Sprays

Development of a New Spray/Wall Interaction Model 73
(a) (b)Crank Angle (°CA)
In-cylinderPressure(MPa)
HeatReleaseRate(J/°CA)
-30 -20 -10 0 10 20 30
0
2
4
6
8
10
12
14
0
100
200
300
400
500
600
700
800
Experiment
Simulation
Crank Angle (°CA)
In-cylinderPressure(MPa)
HeatReleaseRate(J/°CA)
-30 -20 -10 0 10 20 30
0
2
4
6
8
10
12
14
0
100
200
300
400
500
600
700
800
Experiment
Simulation
FIG. 27: Comparison of the predicted in-cylinder pressure and heat release rate with theexperimental results (Lee, 2007) at (a) SOI = –35◦ CA ATDC and (b) SOI = –22.5◦ CAATDC.
(a) (b)Injection Time (CA)
HC(g/Kg-fuel)
CO(g/Kg-fuel)
-40.0 -35.0 -30.0 -25.0 -20.0
0
50
100
150
200
250
300
0
50
100
150
200
250
300
Simulation
Experiment
CO
HC
Injection Time (CA)
NOx(g/Kg-fuel)
soot(g/Kg-fuel)
-40.0 -35.0 -30.0 -25.0 -20.0
0
1
2
3
4
5
6
0
1
2
3
4
5
6
Simulation
Experiment
soot
NOx
FIG. 28: Comparisons of emission characteristics between simulations and measure-ments (Lee, 2007) for (a) CO, HC and (b) NOx, soot (injection timing,◦CA ATDC).
conducting a full-engine-cycle CFD simulation, and found the injection timing has animportant influence on the emissions of the engine. In order to reduce the emissions,the injection timing should be controlled within a limited range. Thus the effects ofinjection timing on the mixture preparation process for the diesel PCCI engine usingthe KIVA-3V with the new spray/wall interaction model are further discussed in thisstudy.
Figure 29 shows the equivalence ratio, diesel vapor, and liquid distributions at thetime of 5◦ CA after different injection timings from –60 to –30◦ CA ATDC. It can beseen from Fig. 29 that the fuel unavoidably impinges the wall for all the injection tim-ings. For different injection timings, the impingement distance between the nozzle andthe impingement site is obviously different. A large amount of fuel impinges on thecylinder wall for the case with the injection timing of –60◦ CA ATDC, which will leadto the problem of lubricating oil dilution. For the case with –50◦ CA ATDC injectiontiming, much fuel impinges on the piston surface. With further retarding the injection
Volume 24, Number 1, 2014

74 Zhang et al.
FIG. 29: Equivalence ratio, diesel vapor, and liquid distributions at the time of 5◦ CAafter start of injection timing for (a) SOI = –60◦ CA ATDC, (b) SOI = –50◦ CA ATDC,(c) SOI = –40◦ CA ATDC, and (d) SOI = –30◦ CA ATD.
timing closing to TDC, the fuel impinges on the inner part of the bowl surface, leadingto a tumble motion of the gas in the piston bowl. The equivalence ratio, diesel vapor,and liquid distributions at –20◦ CA ATDC for different injection timings are illustratedin Fig. 30. It can be clearly observed that the mixture of the fuel/air becomes leanercompared to those shown in Fig. 29 due to the motion of the in-cylinder air/fuel mix-ture. And there is a region where the fuel/air mixture is rich near the impingement sitefor all the cases, which can be partially explained by the evaporation of the secondarydroplets with small sizes produced by the spray/wall interaction. It has been widelyrecognized that the wall film formed by the impinged droplets with relatively largesizes is the major source of unburned hydrocarbon, carbon monoxide, and particulatematter emissions (Koci et al., 2009; Dec, 2009). This further confirms the importanceof the spray/wall interaction for the diesel PCCI combustion with early-injection tim-ing.
Atomization and Sprays

Development of a New Spray/Wall Interaction Model 75
FIG. 30: Fuel equivalence ratio, diesel vapor, and liquid distributions at –20◦CA ATDCfor (a) SOI = –60◦ CA ATDC, (b) SOI = –50◦ CA ATDC, (c) SOI = –40◦ CA ATDC,and (d) SOI = –30◦ CA ATDC.
5. CONCLUSIONS
A new spray/wall interaction model was developed in this study based on the experi-mental results in the literature with special emphasis on the PCCI-engine relevant con-ditions, i.e., high injection pressure and intermediate-to-high backpressure. Extensivevalidations of the new spray/wall interaction model were performed by comparing withthe experimental data found in the literature and the results predicted by the OA model.The validation data cover the penetrations of the impinged spray, including the radiusand height of the impinged spray, and the local parameters of the impinged spray, in-cluding the velocity and size distributions of the secondary droplets. The results indicatethat the new model shows better agreement with the experimental results than the OAmodel, especially for cases with high injection pressure, which is the typical engine-relevant condition. Thus the new spray/wall interaction model is more suitable than theOA model for predicting the outcomes of the impinged spray under PCCI engines withearly in-cylinder injection.
Furthermore, the KIVA-3V code using the new spray/wall interaction model wasapplied to investigate the effects of injection timing on the combustion and emissioncharacteristics of a diesel PCCI engine. It is found that the combustion and emissions
Volume 24, Number 1, 2014
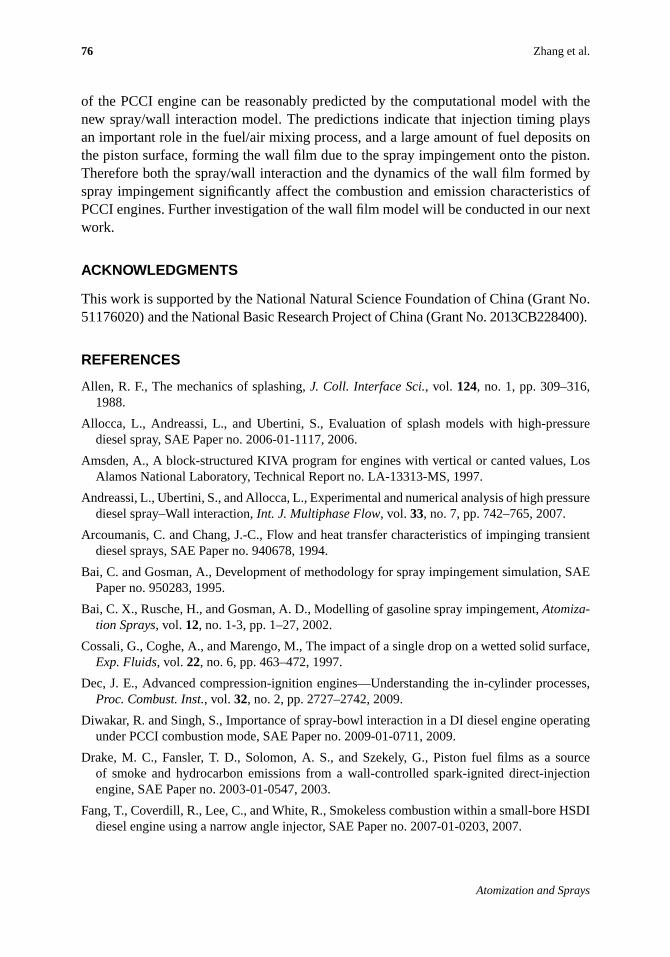
76 Zhang et al.
of the PCCI engine can be reasonably predicted by the computational model with thenew spray/wall interaction model. The predictions indicate that injection timing playsan important role in the fuel/air mixing process, and a large amount of fuel deposits onthe piston surface, forming the wall film due to the spray impingement onto the piston.Therefore both the spray/wall interaction and the dynamics of the wall film formed byspray impingement significantly affect the combustion and emission characteristics ofPCCI engines. Further investigation of the wall film model will be conducted in our nextwork.
ACKNOWLEDGMENTS
This work is supported by the National Natural Science Foundation of China (Grant No.51176020) and the National Basic Research Project of China (Grant No. 2013CB228400).
REFERENCES
Allen, R. F., The mechanics of splashing,J. Coll. Interface Sci., vol. 124, no. 1, pp. 309–316,1988.
Allocca, L., Andreassi, L., and Ubertini, S., Evaluation of splash models with high-pressurediesel spray, SAE Paper no. 2006-01-1117, 2006.
Amsden, A., A block-structured KIVA program for engines with vertical or canted values, LosAlamos National Laboratory, Technical Report no. LA-13313-MS, 1997.
Andreassi, L., Ubertini, S., and Allocca, L., Experimental and numerical analysis of high pressurediesel spray–Wall interaction,Int. J. Multiphase Flow, vol. 33, no. 7, pp. 742–765, 2007.
Arcoumanis, C. and Chang, J.-C., Flow and heat transfer characteristics of impinging transientdiesel sprays, SAE Paper no. 940678, 1994.
Bai, C. and Gosman, A., Development of methodology for spray impingement simulation, SAEPaper no. 950283, 1995.
Bai, C. X., Rusche, H., and Gosman, A. D., Modelling of gasoline spray impingement,Atomiza-tion Sprays, vol. 12, no. 1-3, pp. 1–27, 2002.
Cossali, G., Coghe, A., and Marengo, M., The impact of a single drop on a wetted solid surface,Exp. Fluids, vol. 22, no. 6, pp. 463–472, 1997.
Dec, J. E., Advanced compression-ignition engines—Understanding the in-cylinder processes,Proc. Combust. Inst., vol. 32, no. 2, pp. 2727–2742, 2009.
Diwakar, R. and Singh, S., Importance of spray-bowl interaction in a DI diesel engine operatingunder PCCI combustion mode, SAE Paper no. 2009-01-0711, 2009.
Drake, M. C., Fansler, T. D., Solomon, A. S., and Szekely, G., Piston fuel films as a sourceof smoke and hydrocarbon emissions from a wall-controlled spark-ignited direct-injectionengine, SAE Paper no. 2003-01-0547, 2003.
Fang, T., Coverdill, R., Lee, C., and White, R., Smokeless combustion within a small-bore HSDIdiesel engine using a narrow angle injector, SAE Paper no. 2007-01-0203, 2007.
Atomization and Sprays

Development of a New Spray/Wall Interaction Model 77
Fujimoto, H., Senda, J., Nagae, M., Hashimoto, A., Saito, M., and Katsura, N., Characteristics ofa diesel spray impinging on a flat wall, Symp. on Diagnostics and Modeling of Combustion,in I.C. Engines, Kyoto, Japan, in Proc. COMODIA 90 Int., pp. 193–198, 1990.
Gahdiri, H.,Raindrop Impact, Soil Splashing and Catering, PhD Thesis, University of Reading,England, UK, 1978.
Han, Z. and Reitz, R. D., Turbulence modeling of internal combustion engines using RNGκ− ε
models,Combust. Sci. Technol.,vol. 106, no. 4-6, pp. 267–295, 1995.
Han, Z. and Reitz, R. D., A temperature wall function formulation for variable-density turbulentflows with application to engine convective heat transfer modeling,Int. J. Heat Mass Transfer,vol. 40, no. 3, pp. 613–625, 1997.
Han, Z., Xu, Z., and Trigui, N., Spray/wall interaction models for multidimensional engine sim-ulation,Int. J. Engine Res., vol. 1, no. 1, pp. 127–146, 2000.
Hiroyasu, H. and Kadota, T., Fuel droplet size distribution in diesel combustion chamber, SAEPaper no. 740715, 1974.
Jayaratne, O. and Mason, B., The coalescence and bouncing of water drops at an air/water inter-face,Proc. R. Soc. London, Ser. A, vol. 280, no. 1383, pp. 545–565, 1964.
Jia, M., Peng, Z., and Xie, M., Evaluation of breakup models and application to the mixturepreparation process for diesel HCCI engines, SAE Paper no. 2008-01-0023, 2008a.
Jia, M., Peng, Z., Xie, M., and Stobart, R., Evaluation of spray/wall interaction models under theconditions related to diesel HCCI engines, SAE Paper no. 2008-01-1632, 2008b.
Jia, M., Peng, Z., and Xie, M., Numerical investigation of soot reduction potentials with dieselhomogeneous charge compression ignition combustion by an improved phenomenologicalsoot model,Proc. Inst. Mech. Eng., Part D (J. Automob. Eng.), vol. 223, no. 3, pp. 395–412,2009.
Jia, M., Xie, M., Wang, T., and Peng, Z., The effect of injection timing and intake valve closetiming on performance and emissions of diesel PCCI engine with a full engine cycle CFDsimulation,Appl. Energy, vol. 88, no. 9, pp. 2967–2975, 2011.
Katsura, N., Saito, M., Senda, J., and Fujimoto, H., Characteristics of a diesel spray impingingon a flat wall, SAE Paper no. 890264, 1989.
Koci, C., Ra, Y., Krieger, R., and Andrie, M., Detailed unburned hydrocarbon investigationsin a highly-dilute diesel low temperature combustion regime, SAE Paper no. 2009-01-0928,2009.
Kokjohn, S., Hanson, R., Splitter, D., and Reitz, R., Fuel reactivity controlled compression igni-tion (RCCI): A pathway to controlled high-efficiency clean combustion,Int. J. Engine Res.,vol. 12, no. 3, pp. 209–226, 2011.
Kong, S.-C., Drop/wall interaction criteria and their applications in diesel spray modeling,At-omization Sprays, vol. 17, no. 6, pp. 473–499, 2007.
Kong, S., Ra, Y., and Reitz, R., Performance of multi-dimensional models for simulating dieselpremixed charge compression ignition engine combustion using low- and high-pressure injec-tors,Int. J. Eng. Res., vol. 6, no. 5, pp. 475–486, 2005.
Lee, S.-S., Investigation of two low emissions strategies for diesel engines: Premixed charge
Volume 24, Number 1, 2014

78 Zhang et al.
compression ignition (PCCI) and stoichiometric combustion, PhD Thesis, University ofWisconsin-Madison, 2007.
Lee, S. H. and Ryou, H. S., Development of a new spray/wall interaction model,Int. J. Multi-phase Flow, vol. 26, no. 7, pp. 1209–1234, 2000.
Lee, S. and Reitz, R., Spray targeting to minimize soot and CO formation in premixed chargecompression ignition (PCCI) combustion with a HSDI diesel engine, SAE Paper no. 2006-01-0918, 2006.
Levin, Z. and Hobbs, P. V., Splashing of water drops on solid and wetted surfaces: Hydrody-namics and charge separation,Philos. Trans. R. Soc. London, Ser. A,vol. 269, no. 1200, pp.555–585, 1971.
Lindgren, R. and Denbratt, I., Influence of wall properties on the characteristics of a gasolinespray after wall impingement, SAE Paper no. 2004-01-1951, 2004.
Liu, Y.-D., Jia, M., Xie, M.-Z., and Pang, B., Enhancement on a skeletal kinetic model for pri-mary reference fuel oxidation by using a semidecoupling methodology,Energy Fuels, vol. 26,no. 12, pp. 7069–7083, 2012.
Mohammadi, A., Kidoguchi, Y., and Miwa, K., Effect of injection parameters and wall-impingement on atomization and gas entrainment processes in diesel sprays, SAE Paper no.2002-01-0497, 2002.
Moreira, A. L. N., Moita, A. S., and Panao, M. R., Advances and challenges in explaining fuelspray impingement: How much of single droplet impact research is useful?,Prog. EnergyCombust. Sci., vol. 36, no. 5, pp. 554–580, 2010.
Mundo, C., Sommerfeld, M., and Tropea, C., Droplet-wall collisions: Experimental studies ofthe deformation and breakup process,Int. J. Multiphase Flow, vol. 21, no. 2, pp. 151–173,1995.
Naber, J. and Reitz, R., Modeling engine spray/wall impingement, SAE Paper no. 880107, 1988.
Nordin, N., Complex Chemistry Modeling of Diesel Spray Combustion, PhD Thesis, ChalmersUniversity of Technology, Gothenburg, Sweden, 2001.
O’Rourke, P. and Amsden, A., A particle numerical model for wall film dynamics in port-injectedengines, SAE Paper no. 961961, 1996.
O’Rourke, P. and Amsden, A., A spray/wall interaction submodel for the KIVA-3 wall filmmodel, SAE Paper no. 2000-01-0271, 2000.
Okude, K., Mori, K., Shiino, S., and Moriya, T., Premixed compression ignition (PCI) combus-tion for simultaneous reduction of NOx and soot in diesel engine, SAE Paper no. 2004-01-1907, 2004.
Park, S. W. and Lee, C. S., Macroscopic and microscopic characteristics of a fuel spray impingedon the wall,Exp. Fluids, vol. 37, no. 5, pp. 745–762, 2004.
Reitz, R. D., Modeling atomization processes in high-pressure vaporizing sprays,Atomizationand Spray Technology, vol. 3, pp. 309–337, 1987.
Reitz, R. and Bracco, F., Mechanisms of breakup of round liquid jets,Encycl. Fluid Mech., vol.3, pp. 233–249, 1986.
Atomization and Sprays

Development of a New Spray/Wall Interaction Model 79
Ricart, L. M., Reltz, R. D., and Dec, J. E., Comparisons of diesel spray liquid penetration andvapor fuel distributions with in-cylinder optical measurements,J. Eng. Gas Turbines Power,vol. 122, no. 4, pp. 588–595, 2000.
Rodriguez, F. and Mesler, R., Some drops don’t splash,J. Coll. Interface Sci., vol. 106, no. 2, pp.347–352, 1985.
Roisman, I., Prunet-Foch, B. Tropea, C., and Vignes-Adler, M., Multiple drop impact onto a drysolid substrate,J. Coll. Interface Sci., vol. 256, no. 2, pp. 396–410, 2002.
Roisman, I. V., Horvat, K., and Tropea, C., Spray impact: Rim transverse instability initiatingfingering and splash, and description of a secondary spray,Phys. Fluids, vol. 18, p. 102104,2006.
Samenfink, W., Elsaßer, A., Dullenkopf, K., and Wittig, S., Droplet interaction with shear-drivenliquid films: Analysis of deposition and secondary droplet characteristics,Int. J. Heat FluidFlow, vol. 20, no. 5, pp. 462–469, 1999.
Sandquist, H., Lindgren, R., and Denbratt, I., Sources of hydrocarbon emissions from a directinjection stratified charge spark ignition engine, SAE Paper no. 2000-01-1906, 2000.
Senda, D. J., Iwashita, S., and Fujimoto, H., Modeling of diesel spray impingement on a flat wall,SAE Paper no. 941894, 1994.
Senda, J., Kanda, T., Al-Roub, M., Farrell, P. V., Fukami, T., and Fujimoto, H., Modeling sprayimpingement considering fuel film formation on the wall, SAE Paper no. 970047, 1997.
Senda, D. J., Higaki, T., Sagane, Y., and Fujimoto, H., Modeling and measurement on evaporationprocess of multicomponent fuels, SAE Paper no. 2000-01-0280, 2000.
Siewert, R., Spray angle and rail pressure study for low NOx diesel combustion, SAE Paper no.2007-01-0122, 2007.
Stanton, D. and Rutland, C., Modeling fuel film formation and wall interaction in diesel engines,SAE Paper no. 960628, 1996.
Stevens, E. and Steeper, R., Piston wetting in an optical DISI engine: Fuel films, pool fires, andsoot generation, SAE Paper no. 2001-01-1203, 2001.
Stow, C. and Stainer, R., The physical products of a splashing water drop,J. Meteorol. Soc. Jpn.,vol. 55, pp. 518–532, 1977.
Stow, C. and Hadfield, M., An experimental investigation of fluid flow resulting from the impactof a water drop with an unyielding dry surface,Proc. R. Soc. London, Ser. A,vol. 373, no.1755, pp. 419–441, 1981.
Wachters, L. and Westerling, N., The heat transfer from a hot wall to impinging water drops inthe spheroidal state,Chem. Eng. Sci., vol. 21, no. 11, pp. 1047–1056, 1966.
Wang, A.-B., Chen, C.-C., and Hwang, W.-C., On some new aspects of splashing impact of drop-liquid surface interactions, in Rein, M., Ed.,Drop-Surface Interactions, Heidelberg: Springer,pp. 303–306, 2002.
Wu, Z.-N., Prediction of the size distribution of secondary ejected droplets by crown splashingof droplets impinging on a solid wall,Probab. Eng. Mech., vol. 18, no. 3, pp. 241–249, 2003.
Yao, M., Zheng, Z., and Liu, H., Progress and recent trends in homogeneous charge compression
Volume 24, Number 1, 2014

80 Zhang et al.
ignition (HCCI) engines,Prog. Energy Combust. Sci., vol. 35, no. 5, pp. 398–437, 2009.
Yarin, A. and Weiss, D., Impact of drops on solid surfaces: Self-similar capillary waves, andsplashing as a new type of kinematic discontinuity,J. Fluid Mech., vol. 283, no. 1, pp. 141–173, 1995.
Atomization and Sprays

Atomization and Sprays, 24 (1): 81–96 (2014)
EFFECT OF THE LIQUID INJECTION ANGLEON THE ATOMIZATION OF LIQUID JETS INSUBSONIC CROSSFLOWS
H. Almeida, J. M. M. Sousa, & M. Costa∗
Mechanical Engineering Department, Instituto Superior Tecnico,University of Lisbon, Avenida Rovisco Pais, 1049-001 Lisbon, Portugal∗Address all correspondence to M. Costa E-mail: [email protected]
Original Manuscript Submitted: 7/27/2013; Final Draft Received: 10/28/2013
This work is focused on the study of sprays produced by pressure atomizers of single-hole type whensubjected to air crossflows at atmospheric pressure. The study was carried out in a wind tunnel.Prior to spray characterization, the air flow inside the wind tunnel was evaluated with the aid of laserDoppler anemometry. The sprays were first characterized using a shadowgraphy technique, whichallowed for a qualitative evaluation of the overall quality of the atomization. Subsequently, the use ofphase Doppler anemometry allowed performing detailed measurements of the spray droplet diametersand velocities, as a function of the injection angle, for various nondimensional atomizer distances.The main findings of this study are as follows: (i) The liquid column disintegration process is signif-icantly affected by the liquid injection angle and, less considerably, by the liquid-to-air momentumflux ratio; (ii) the Sauter mean diameter decreases noticeably as the injection angle of the liquid in-creases; and (iii) the characteristics of droplet diameter and velocity distributions vary significantlyas the distance to the injector increases.
KEY WORDS: pressure atomizer, liquid spray, angled injection, air crossflow
1. INTRODUCTION
The atomization of liquids in air crossflows is an important topic in the areas of com-bustion, agriculture, and the pharmaceutical industry. For example, in the case of com-bustion, some combustors for gas turbines use the fuel injection (gas or liquid) in arecirculation region of combustion products (e.g., Roquemore et al., 2001; Melo et al.,2009, 2011). In practical terms, this requires the fuel to be injected by pressure atomizers(in the case of liquid fuels) from the combustion chamber walls, thus forming an anglewith the main flow inside. It is therefore important to study the spray characteristics pro-duced by this type of atomizer in air crossflows. There are, however, very few studiesavailable in the literature concerning this area of atomization, and the vast majority onlyconsiders cases where the liquid is injected at an angle of 90◦ with respect to the cross-flow. Furthermore, the use of liquid angled injection (i.e., where the liquid is injected
1044–5110/14/$35.00 c⃝ 2014 by Begell House, Inc. 81

82 Almeida, Sousa, & Costa
NOMENCLATURE
d nozzle diameter Vliq liquid injection velocityH wind tunnel height W wind tunnel widthk air turbulent kinetic energy Werel−air relative air Weber number,L breakup length ρaird (Uair − uliq)
2 /σOh Ohnesorge number, Weliq liquid Weber number,
µliq/(ρliqdσliq)1/2 ρliqdV
2liq/σliq
q liquid-to-air momentum flux x, y, z coordinatesratio,ρliqV 2
liq/(ρairU
2air
)Reair freestream Reynolds number,Greek Symbols
ρairUaird/µair α liquid injection angleReliq liquid jet Reynolds number, µ dynamic viscosity
ρliqVliqd/µliq ρ densitySMD Sauter mean diameter σ liquid surface tensionu velocity inx-directionurel relative air velocity, Subscripts
(Uair − uliq) /Uair air air propertyUair air velocity of the crossflow liq jet exit liquid propertyv velocity iny-direction p particle/droplet
at angles smaller than 90◦ with respect to the gas phase crossflow) is very common incombustion, agriculture, and pharmaceutical application areas. Hence, this paper aimsat extending the present knowledge in this area of liquid jets atomization.
Relevant previous related studies of round liquid jets in gaseous subsonic cross-flows include those of Inamura and Nagai (1997), Wu et al. (1997, 1998), Fuller et al.(2000), Becker and Hassa (2002), Cavaliere et al. (2003), Sallam et al. (2004), Costa etal. (2006), Bellofiore et al. (2007), and Kim et al. (2010), among others. These authorshave determined liquid column trajectories, column fracture locations, and near-fieldspray characteristics as a function of the liquid injection angle. An important conclusionwas that the liquid column trajectories correlate well with the liquid injection angle,α,and liquid-to-air momentum flux ratio,q.
With the exception of Fuller et al. (2000), Costa et al. (2006), Bellofiore et al. (2007),and Kim et al. (2010), the available studies in the literature only consider the case wherethe liquid is injected at an angle of 90◦ with respect to the air crossflow. Additionally,only Costa et al. (2006) have made use of phase Doppler anemometry to carry out a
Atomization and Sprays

Effect of the Liquid Injection Angle 83
detailed characterization of the sprays as a function of the injection angle, althoughthis study has been conducted for relatively low crossflow velocities. In this context, itis important to enhance the knowledge regarding angled injection of liquid sprays incrossflows at higher velocities.
The main objective of this work consists of the characterization of sprays producedby single-hole pressure atomizers, when subjected to subsonic air crossflows at atmo-spheric pressure conditions. The study was conducted in a wind tunnel, where the airflow was previously characterized with the aid of laser Doppler anemometry (LDA).Subsequently, the spray characterization was carried out using shadowgraphy and phaseDoppler anemometry (PDA). Special emphasis was given to the effect of the liquid flowinjection angle on the atomization characteristics.
2. EXPERIMENTAL APPARATUS AND PROCEDURE
Figure 1 shows schematically the test section, including details of the atomizer geome-try, and of the diagnostics. The wind tunnel used was built in glass with the following
Receiving optics
Pressurized air
Water
Air Laser
Pressurized air
Seeding
Water
Air d
Photomultipliers
Fiberoptics
Atomizer
Honeycomb
Transmitting
optics
3-D transverse
system
PDA Analiser4xOscilloscope
Slave BSA
Master BSA
FIG. 1: Schematics of the test section, including details of the atomizer geometry, andof the diagnostics.
Volume 24, Number 1, 2014

84 Almeida, Sousa, & Costa
dimensions: lengthL = 0.5 m, heightH = 0.075 m, and widthW = 0.05 m. A honey-comb was installed in the plenum, upstream of a 24:1 contraction, in order to eliminatelarge-scale vortices. The contraction was designed according to the methodology pro-posed by Tulapurkara and Bhalla (1988) aiming to minimize both nonuniformities in themean flow and turbulence intensity in the test section.
In this study, four single-hole pressure atomizers were used, corresponding to injec-tion anglesα of 30◦, 45◦, 60◦, and 90◦. The atomizer internal diameter,d, was constantand equal to 0.15 mm. The ratio between the length of the discharge hole and the innerdiameter of the atomizer was, in all cases, larger than 100, which ensures that the liq-uid flow is fully developed at the discharge. For security reasons, the liquid used in thetests was distilled water, which was fed from a pressurized tank at 15 bar using nitro-gen bottles. The setup allowed characterizing the sprays produced by the four atomizersas a function of the injection angle (α), the liquid injection velocity (Vliq), and the aircrossflow velocity (Uair). Figure 2 shows the coordinate system used in the present study.
A commercial LDA system (Dantec, Denmark) was used to characterize the air flowin the wind tunnel, measuring the two velocity components simultaneously in dual-beambackward scattering operation mode. To generate the seeding particles, four medicalnebulizers (Inspiron 002305) were used, employing a mixture of water (20%) and ethy-lene glycol (80%). The analog signal from the photomultipliers was band-pass filteredand processed by two burst spectrum analyzers (model Dantec 57N20/57N35), using anIEEE interface with a computer. With this configuration it was possible to collect datasamples at an average acquisition rate of about 0.5 kHz. Mean velocities and their vari-ances were computed by ensemble averaging from 10,000 samples, using the DantecBSA Flow Software.
Initially, the characterization of the sprays involved the use of an interferometrictechnique called shadowgraphy. To that end, an argon-ion laser emitting at a wavelengthof 515 nm with a maximum power of 500 mW was employed. The spray zone imageswere recorded by a high-speed digital camera, model Phantom v4.2 (Vision Research,USA), with a resolution of 512×512 pixels (monochrome sensor with sensitivity 4800
Uair
up
vp
y
xz⊗
d
α
FIG. 2: Coordinate system.
Atomization and Sprays

Effect of the Liquid Injection Angle 85
ISO/ASA), using exposure times of 10µs and average acquisition periods of about 66µs.The lens used was a model AF Micro-Nikkor 60 mm f/2.8D (NIKON, Japan). As a resultof the optical arrangement used during the experiments, the spatial resolution was lim-ited to∼125µm/pixel. For the management of final digital images, built-in MATLABroutines were employed.
After the visualization, droplet diameters and velocities in the sprays were quanti-fied by the use of PDA. Similarly to the LDA, a commercial two-component Dantecsystem was employed (see Fig. 1). In this case, the receiving probe was positioned at anangle with the transmitting optics not very far from Brewster’s refraction angle, whichcorresponded to 73.7◦. This allowed taking advantage of the dominance of the first or-der of refraction of light in the droplets and, at the same time, reducing the influenceof higher-order refractions. The optical arrangement produced a measuring volume ofapproximately 4 mm in length and 2 mm in diameter. The optical receiver was adjustedfor “medium-sized particles” (mask B) and positioned at an angle of 59◦, allowing tomeasure droplet diameters up to nearly 400µm. The analog signals from the photomul-tipliers produced by the scattered light were processed by a module interface, modelDantec P80.
The determination of the statistical distribution of the droplet diameters and veloci-ties was made using, again, the Dantec BSA Flow Software. In the process of validatingthe signal, the signal-to-noise ratio and deviations from sphericity were taken into ac-count. The sphericity criterion was always set to 15%. The number of samples in themeasurements was generally larger than 5000, though in areas characterized by high ac-quisition rates this number has reached 10,000. Based on the analysis of these sources oferror it is estimated that the overall uncertainty in the measurement of mean velocitiesis below 2%. In the case of droplet diameters, the overall uncertainty is estimated to beapproximately 5%.
3. RESULTS AND DISCUSSION
Table 1 summarizes the operating conditions employed in the present study.Figure 3 shows the mean velocity and turbulent kinetic energy profiles in the wind
tunnel, measured at the section where the discharge hole of the atomizer was located.The profiles were normalized using the potential flow velocity,Uair, as a velocity scale,and using the height,H, and the width,W , of the tunnel as length scales. Since mea-surements of the third velocity component were not performed, the turbulent kineticenergy was calculated via estimation of the third velocity variance as the semi-sum of itscounterparts, which is a good approximation in boundary layer flows (Spalart, 1988).
Figure 3(a) shows a typical behavior of a boundary layer flow, displaying high ve-locity gradients in the near-wall region. It was found that the boundary layer thicknessvaried little with the operating conditions of the wind tunnel, remaining always close
Volume 24, Number 1, 2014

86 Almeida, Sousa, & Costa
TABLE 1: Operating conditions. For all test condi-tions: d = 0.15 mm, Oh = 0.0084,Vliq = 8.2 m/s, Reliq= 1424, Weliq = 144,Uair = 116.7 m/s, Reair = 1064.
Test condition α (deg) Werel−air urel q1 30 29 0.94 4.372 45 30 0.95 4.373 60 31 0.96 4.374 90 33 1.00 4.37
0.0 0.1 0.2 0.3 0.4 0.5 0.6 0.7 0.8 0.9 1.0 1.1
-0.5
-0.4
-0.3
-0.2
-0.1
0.0
0.1
0.2
0.3
0.4
0.5
0.0
0.1
0.2
0.3
0.4
0.5
0.6
0.7
0.8
0.9
1.0
a)
b)
0.0 0.1 0.2 0.3 0.4 0.5 0.6 0.7 0.8 0.9 1.0 1.1
Uair = 78.8 m/s,
,
,
,
,
,
k/Uair x 1002
u/Uair
k/Uair x 1002
u/Uair
y/H
z/W
Uair = 103.3 m/s
Uair = 116.7 m/s
y = H/15
y = H/3
y = 2H/3
Uair = 103.3 m/s
FIG. 3: Mean velocity (filled symbols) and turbulent kinetic energy (open symbols)profiles in the wind tunnel: (a) vertical profiles; (b) transverse profiles.
Atomization and Sprays

Effect of the Liquid Injection Angle 87
to 4 mm. The same can be said about the displacement thickness (approximately be-tween 0.36 and 0.40 mm) and momentum thickness (approximately between 0.29 and0.33 mm), resulting in a nearly constant value of the shape factor, close to 1.2.
The homogeneity of the velocity profiles outside the boundary layer can also be ob-served, showing that the purpose for which the contraction was projected was achieved.Also, the turbulent kinetic energy exhibit a maximum near the wall, which is associ-ated to the high gradients of the mean velocity, but declined significantly to approxi-mately constant values outside the boundary layer. The turbulence intensity exhibiteda nearly negligible dependence of the operating conditions, settling at around 2%. Thethree-dimensional character of the air flow in the wind tunnel can be judged from themeasured transverse profiles, shown in Fig. 3(b) for different distances to the wall (windtunnel floor). Although the flow in a tunnel of rectangular section will inevitably showsome three-dimensional characteristics, these effects are mainly noted at the corners,presumably due to the establishment of Prandtl’s secondary flow of the second kind.It appears that the observed gradients of mean velocity and turbulent kinetic energythat occur in the central plane of the tunnel (where the liquid is injected) are verysmall and, therefore, its influence in the process of atomization is expected to be negli-gible.
Figure 4 shows instantaneous spray images that reveal the effect of the liquid in-jection angle on the atomization process. It can be seen that the spray angle increaseswith the liquid injection angle,α: the larger the injection angle, the greater the droplets’dispersion. This is a consequence of the fact that as the injection angle decreases, the rel-ative velocity,urel, also decreases; specifically, whenα decreases from 90◦ to 30◦, ureldecreases from 1 to 0.94, as shown in Table 1. Consequently, by decreasing the angleα,but maintaining constant the value ofq, a reduction of the aerodynamic forces acting onthe exposed area of the liquid column is achieved. As shown in Fig. 4, the disintegra-tion process becomes less effective asα decreases. These spray images show a behaviorsomewhat similar to that described by Fuller et al. (2000), concerning the variation inthe quality of the sprays as a function of the liquid injection angle.
Figures 5–8 show normalized velocities and droplet size along they-direction for testconditions 1, 2, 3, and 4 atx/d = 50, 100, 200, 400, and 800, respectively. The dropletsize is here represented by the Sauter mean diameter (SMD), which is the diameter ofa droplet whose surface-to-volume ratio is equal to that of the entire spray. A compari-son between the evolutions presented in these figures allows assessing the influence ofthe liquid injection angle in velocities and droplet size. It appears that asα increases,the values of SMD decrease significantly. Again, this behavior may be attributed to thehigherurel values associated to the larger liquid injection angles, hence to the growingaerodynamic forces acting on the liquid surface.
An important observation that emerges from the comparison of these experimentalresults with those obtained by Costa et al. (2006) is that the experimental conditions usedhere originated sprays with SMD always below 150µm (the size of the injector hole),
Volume 24, Number 1, 2014

88 Almeida, Sousa, & Costa
a)
b)
c)
d)
FIG. 4: Instantaneous spray images showing the effect of the liquid injection angle onthe atomization process: (a) test condition 1; (b) test condition 2; (c) test condition 3;(d) test condition 4.
while in Costa et al. (2006), the SMD fluctuated between 150 and 350µm, as a result ofthe lower crossflow velocities used by these authors.
Figure 9 shows normalized velocities and SMD along the spray centerline (locationdetected by the maximum mass flux indicated by the PDA) for test conditions 1, 2, 3,and 4. It is observed that the atomization process ends approximately atx/d = 1000 for
Atomization and Sprays

Effect of the Liquid Injection Angle 89
No
rma
lize
d v
elo
citie
s
SM
D (µ
m)
SMD
up/Vliq
vp/Vliq
0
5
10
15
20
0
5
10
15
20
0
5
10
15
20
0
5
10
15
20
0
5
10
0.00 0.10 0.20 0.30 0.40
15
20
0
50
100
150
200
50
100
150
200
0
50
100
150
200
0
50
100
150
200
0
50
100
150
200
0
y/H
x/d = 50
x/d = 100
x/d = 400
x/d = 800
x/d = 200
FIG. 5: Normalized velocities and droplet size along they-direction for test condition 1(α = 30◦) atx/d = 50, 100, 200, 400, and 800.
Volume 24, Number 1, 2014

90 Almeida, Sousa, & Costa
No
rma
lize
d v
elo
citie
s
SM
D (µ
m)
SMD
up/Vliq
vp/Vliq
0.00 0.10 0.20 0.30 0.40
0
5
10
15
20
0
5
10
15
20
0
5
10
15
20
0
5
10
15
20
0
5
10
15
20
0
50
100
150
200
0
50
100
150
200
0
50
100
150
200
0
50
100
150
200
0
50
100
150
200
y/H
x/d = 100
x/d = 50
x/d = 400
x/d = 800
x/d = 200
FIG. 6: Normalized velocities and droplet size along they-direction for test condition 2(α = 45◦) atx/d = 50, 100, 200, 400, and 800.
Atomization and Sprays

Effect of the Liquid Injection Angle 91
y/H
No
rma
lize
d v
elo
citie
s
SM
D (µ
m)
0
5
10
15
20
0
5
10
15
20
0
5
10
15
20
0
5
10
15
20
0
5
10
15
20
0.00 0.10 0.20 0.30 0.40
0
50
100
150
200
0
50
100
150
200
0
50
100
150
200
0
50
100
150
200
0
50
100
150
200
SMD
x/d = 800
x/d = 400
x/d = 50
x/d = 200
x/d = 100
up/Vliq
vp/Vliq
FIG. 7: Normalized velocities and droplet size along they-direction for test condition 3(α = 60◦) atx/d = 50, 100, 200, 400, and 800.
Volume 24, Number 1, 2014

92 Almeida, Sousa, & Costa
y/H
No
rma
lize
d v
elo
citie
s
SM
D (µ
m)
0.00 0.10 0.20 0.30 0.40
0
50
100
150
200
0
50
100
150
200
0
50
100
150
200
0
50
100
150
200
0
50
100
150
200
0
5
10
15
20
0
5
10
15
20
0
5
10
15
20
0
5
10
15
20
0
5
10
15
20
SMD
x/d = 800
x/d = 50
x/d = 400
x/d = 200
x/d = 100
up/Vliq
vp/Vliq
FIG. 8: Normalized velocities and droplet size along they-direction for test condition 4(α = 90◦) atx/d = 50, 100, 200, 400, and 800.
Atomization and Sprays
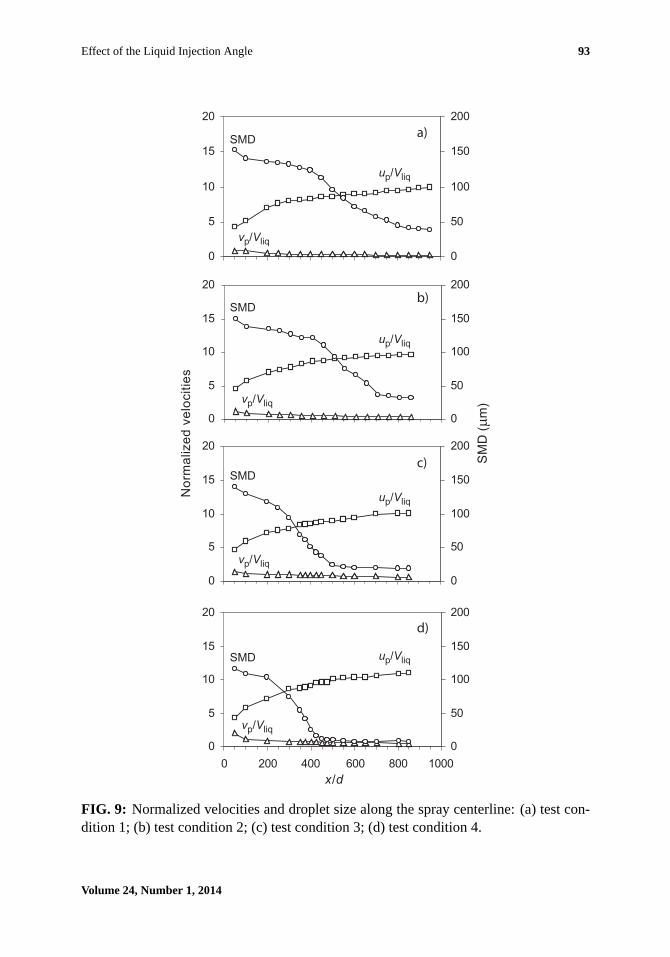
Effect of the Liquid Injection Angle 93
SMD
SMD
SMD
SMD
0
50
100
150
200
0
50
100
150
200
0
50
100
150
200
0
50
100
150
200
0
5
10
15
20
0
5
10
15
20
0
5
10
15
20
0
5
10
15
20
2000 400 600 800 1000
x/d
No
rma
lize
d v
elo
citie
s
SM
D (µ
m)
vp/Vliq
vp/Vliq
vp/Vliq
vp/Vliq
up/Vliq
up/Vliq
up/Vliq
up/Vliq
a)
b)
c)
d)
FIG. 9: Normalized velocities and droplet size along the spray centerline: (a) test con-dition 1; (b) test condition 2; (c) test condition 3; (d) test condition 4.
Volume 24, Number 1, 2014
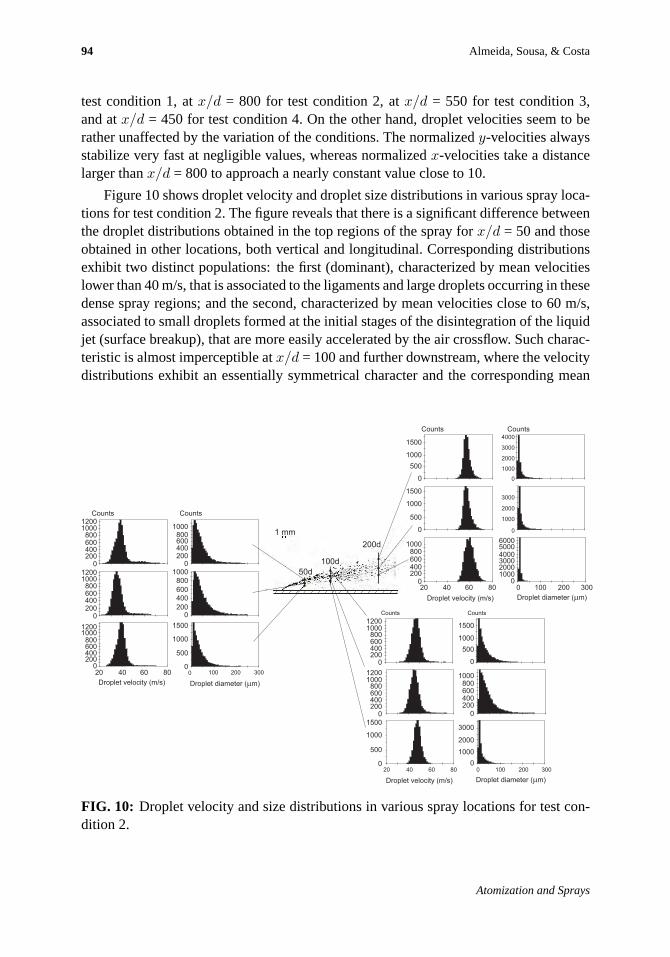
94 Almeida, Sousa, & Costa
test condition 1, atx/d = 800 for test condition 2, atx/d = 550 for test condition 3,and atx/d = 450 for test condition 4. On the other hand, droplet velocities seem to berather unaffected by the variation of the conditions. The normalizedy-velocities alwaysstabilize very fast at negligible values, whereas normalizedx-velocities take a distancelarger thanx/d = 800 to approach a nearly constant value close to 10.
Figure 10 shows droplet velocity and droplet size distributions in various spray loca-tions for test condition 2. The figure reveals that there is a significant difference betweenthe droplet distributions obtained in the top regions of the spray forx/d = 50 and thoseobtained in other locations, both vertical and longitudinal. Corresponding distributionsexhibit two distinct populations: the first (dominant), characterized by mean velocitieslower than 40 m/s, that is associated to the ligaments and large droplets occurring in thesedense spray regions; and the second, characterized by mean velocities close to 60 m/s,associated to small droplets formed at the initial stages of the disintegration of the liquidjet (surface breakup), that are more easily accelerated by the air crossflow. Such charac-teristic is almost imperceptible atx/d = 100 and further downstream, where the velocitydistributions exhibit an essentially symmetrical character and the corresponding mean
020
12001000
800600400200
0
12001000
800600400200
0
12001000
800600400200
0
1000
Counts Counts
Counts
Counts Counts
Counts
800600400200
0
1000
1500
1000
500
0
15004000
3000
3000
600050004000300020001000
0
2000
2000
1000
1000
0
0
1000
500
0
1500
100012001000
800600400200
0
12001000
800600400200
0
3000
2000
1000
0
800600400200
0
1000
500
0
1500
1000
500
0
1500
1000800600400200
0
1000
500
0
800
600
400
200
1 mm
50d
100d
200d
0
40 60 80 100 200 300
020 40 60 80 100 200 300
Droplet velocity (m/s) Droplet diameter (µm)
Droplet velocity (m/s) Droplet diameter (µm)
Droplet velocity (m/s) Droplet diameter (µm)
020 40 60 80 100 200 300
FIG. 10: Droplet velocity and size distributions in various spray locations for test con-dition 2.
Atomization and Sprays

Effect of the Liquid Injection Angle 95
velocities approach the air flow velocity. In regard to the droplet diameters, a significantchange in the character of these distributions occurs atx/d = 100. At this station, moreuniform droplet size distributions begin to emerge (at the bottom of the spray), showinga significant reduction in the amount of large droplets, which dominated the spray atupstream locations. However, it must be noted that although the counting of the latterdroplets may not be very high, their contribution by mass or volume is probably dom-inant, as a result of the cubic dependence with the droplet diameter, which translatesinto the large values of SMD already presented in Figs. 5–8. As expected, the abovedescribed characteristic becomes stronger with increasing distance from the injector, asa result of the natural evolution of the atomization process.
4. SUMMARY AND CONCLUSIONS
The main findings of this study are as follows:
(1) The disintegration process of the liquid columns is significantly affected by the liq-uid injection angle and, to a lesser extent, by the liquid-to-air momentum flux ratio.As the liquid injection angle was decreased, the atomization process degraded asa result of a reduction in the aerodynamic forces acting on the exposed surfaceof the liquid column. A similar effect was obtained by increasing the liquid-to-airmomentum flux ratio.
(2) The values of the SMD decreased significantly with the increase of the liquidinjection angle as a consequence of the resulting higher values of the relative ve-locity of the air and, therefore, due to the fact that the aerodynamic forces actingon the liquid surface of the jet increase with the injection angle.
(3) There is a significant difference between the droplet velocity distributions ob-served in the top regions of the spray forx/d = 50 and those obtained in otherlocations, both vertical and longitudinal. In the former, the corresponding distri-butions exhibit two distinct populations: the first, characterized by mean velocitieslower than 40 m/s, that is associated to the ligaments and large droplets occurringin these dense spray regions; and the second, characterized by mean velocitiesclose to 60 m/s, associated to small droplets formed at the initial stages of the dis-integration of the liquid jet, that are more easily accelerated by the air crossflow.
(4) A significant change in the character of the droplet diameter distributions was ob-served atx/d = 100. At this station, more uniform droplet size distributions beginto emerge, showing a significant reduction in the amount of large droplets, whichdominated the spray at upstream locations. This characteristic becomes strongerwith increasing distance from the injector, as a result of the natural evolution ofthe atomization process.
Volume 24, Number 1, 2014

96 Almeida, Sousa, & Costa
REFERENCES
Becker, J. and Hassa, C., Breakup and atomization of a kerosene jet in crossflow at elevatedpressure,Atomization Sprays, vol. 11, pp. 49–67, 2002.
Bellofiore, A., Cavaliere, A., and Ragucci, R., Air density effect on the atomization of liquid jetsin crossflow,Combust. Sci. Technol., vol. 179, pp. 319–342, 2007.
Cavaliere, A., Ragucci, R., and Noviello, C., Bending and break-up of a liquid jet in a highpressure airflow,Exp. Therm. Fluid Sci., vol. 27, pp. 449–454, 2003.
Costa, M., Melo, M. J., Sousa, J. M. M., and Levy, Y., Spray characteristics of angled liquidinjection into subsonic crossflows,AIAA J., vol. 44, pp. 646–653, 2006.
Fuller, R. P., Wu, P. K., Kirkendall, K. A., and Nejad, A. S., Effects of injection angle on atom-ization of liquids jets in transverse airflow,AIAA J., vol. 38, pp. 64–72, 2000.
Inamura, T. and Nagai, N., Spray characteristics of liquid jet traversing subsonic airstreams,J.Propul. Power, vol. 13, pp. 250–256, 1997.
Kim, M., Song, J., Hwang, J., and Yoon, Y., Effects of canted injection angles on the spraycharacteristics of liquid jets in subsonic crossflows,Atomization Sprays, vol. 20, pp. 749–762,2010.
Melo, M. J., Sousa, J. M. M., Costa, M., and Levy, Y., Experimental investigation of a novelcombustor model for gas turbines,J. Propul. Power, vol. 25, pp. 609–617, 2009.
Melo, M. J., Sousa, J. M. M., Costa, M., and Levy, Y., Flow and combustion characteristics of alow NOx combustor model for gas turbines,J. Propul. Power, vol. 27, pp. 1212–1217, 2011.
Roquemore, W. M., Shouse, D., Burrus, D., Johnson, A., Cooper, C., Duncan, B., Hsu, K. Y.,Katta, V. R., Sturgess, G. J., and Vihinen, I., Trapped vortex combustor concept for gas turbineengines,AIAA Paper2001-0483, 2001.
Sallam, K. A., Aalburg, C., and Faeth, G. M., Breakup of round nonturbulent liquid jets ingaseous crossflow,AIAA J., vol. 42, pp. 2529–2540, 2004.
Spalart, P. R., Direct simulation of a turbulent boundary layer up toRθ = 1410,J. Fluid Mech.,vol. 187, pp. 61–98, 1988.
Tulapurkara, E. G. and Bhalla, V. V. K., Experimental investigation of Morel’s method for windtunnel contractions,ASME J. Fluids Eng., vol. 110, pp. 45–47, 1988.
Wu, P. K., Kirkendall, K. A., Fuller, R. P., and Nejad, A. S., Breakup processes of liquid jets insubsonic crossflows,J. Propul. Power, vol. 13, pp. 64–73, 1997.
Wu, P. K., Kirkendall, K. A., Fuller, R. P., and Nejad, A. S., Spray structures of liquid jetsatomized in subsonic crossflows,J. Propul. Power, vol. 14, pp. 173–181, 1998.
Atomization and Sprays

Begell Engineering Research CollectionOver 20 journals, 10 reference works and a new Begell eBook collection provide the latest
research, solutions and archives for many engineering disciplines
The Begell Engineering Research Collection is part of the Begell Digital Library (BDL), a growing collection of online content that provides the latest advancements in engineering and biomedical sciences. Distinguished international editorial boards and translated content for many titles provide a global perception of subjects. With its deep roots in thermal and fluid sciences, Begell House offers one of the most innovative, specialized engineering collections available today.
LIBRARY BENEFITS
AFFORDABLE OPTIONS
ENGINEERING RESEARCH COLLECTION HIGHLIGHTS
— Complimentary access to available journal backfiles while subscribing
— Perpetual access and archiving through PORTICO
— COUNTER compliant usage statistics
— Links to full text through CrossRef
— Easy access via Google Scholar
— SERU participant
— Significant discounts are available to the full Engineering Collection.
— Smaller, specialized engineering collections are also available in:
• Aerospace
• Chemistry&ChemicalEngineering
• Energy&Environment
• IndustryResearch
• MechanicalEngineering
• Nuclear&PowerEngineering
— Special rates are available to buy the complete journal archives with one-time, discretionary budget money.
— Over 20 peer-reviewed journals — cover atomization and sprays, multiscale computations, uncertainty quantification, composites, energetic materials and chemical propulsions, en-ergy efficiency, clean environment, porous media, radio physics and telecommunications, aero and hydrodynamics, aerospace and other topics covering both theoretical research and applications.
— The Heat Exchanger Design Handbook — is the only and most complete source for the design of heat exchangers, exceeding 6,000 pages of peer-reviewed information that is updated regularly.
— Thermopedia™ — evolving from the International Encyclopedia for Heat and Mass Trans-fer, this multimedia reference tool enhances teaching and independent learning. Its core content is available open access.
— ICHMT Digital Library — International Center for Heat and Mass Transfer: Online Confer-ences Proceedings
— IHTC Digital Library — Assembly for Heat Transfer Conference: Online Conferences Pro-ceedings
— Begell eBook Collection — eBooks comprise three collections: Thermal & Fluid Physics and Engineering Collection; Begell eBooks Collection and Begell eBooks Classical Archive Collection
ONLY RESOURCE OF ITS KIND!
ISSN Print: XXXX-XXXXISSN Online: XXXX-XXXX
begell house, inc.50 Cross Highway, Redding, Connecticut 06896
Volum
eÊ1.ÊIssueÊ1,Ê2010ÊÊÊÊÊÊÊSp
ecial T
op
ics & R
eview
in P
oro
us M
edia
begellÊhouse
STRPM_cover_2010.pdf 1 2/13/10 1:46 PM
JohnÊR.ÊLloydEditor-in-Chief
VolumeÊ11,ÊIssueÊ1,Ê2010 ISSNÊ1561-4417
Volume 19 Number 2
ISSN 1044-5110ATSPE2 19 (12) 1105-1207
(2009)
Volume 40, Issue 1, 2009
TsAGI_cover.indd 1 12/21/09 9:37 PM
Call today for pricing or to set up a 30-day free trial.
Tel: +1 (203) 938-1300 Fax: +1 (203) 938-1304
50 Cross Highway Redding, CT 06896
[email protected] www.dl.begellhouse.combegell
Eng_flyer2013_7x10_1.indd 1 06.02.2013 15:31:02

Begell Engineering Research Collection
Atomization and Sprays™ 1045-5110, 1936-2684 1991 (Volume 1)
Composites: Mechanics, Computation, Applications 2152-2057, 2152-2073 2010 (Volume 1)
Computational Thermal Sciences: An International 1940-2503, 1940-2554 2009 (Volume 1) Journal
Heat Pipe Science and Technology 2151-7975, 2151-7991 2010 (Volume 1)
Heat Transfer Research 1064-2285, 2162-6561 1997 (Volume 28)
High Temperature Material Processes: An International 1940-4360 1997 (Volume 1) Journal
Interfacial Phenomena and Heat Transfer 2169-2785, 2167-857X 2013 (Volume 1)
International Journal for Multiscale Computational 1543-1649, 1940-4352 2003 (Volume 1) Engineering
International Journal for Uncertainty Quantification 2152-5080, 2152-5099 2011 (Volume 1)
International Journal of Energetic Materials and 2150-766X, 2150-7678 1991 (Volume 1) Chemical
International Journal of Energy for a Clean Environment 2150-3621, 2150-363X 2003 (Volume 4)
International Journal of Fluid Mechanics Research 1064-2277 1995 (Volume 25)
Journal of Automation and Information Sciences 1064-2315, 2163-9337 1996 (Volume 28)
Journal of Enhanced Heat Transfer 1065-5131 1994 (Volume 1)
Journal of Flow Visualization and Image Processing 1065-3090, 1940-4336 1993 (Volume 1)
Journal of Porous Media 1091-028X, 1934-0508 1998 (Volume 1)
Journal of Radio Electronics 2165-8439 2012 (Volume 1)
Journal of Women and Minorities in Science and 1072-8325, 1940-431X 1994 (Volume 1) Engineering
Multiphase Science and Technology 0276-1459, 1943-6181 1982 (Volume 1)
Nanomechanics Science and Technology: 1947-5748, 1947-5756 2010 (Volume 1) An International Journal
Special Topics and Reviews in Porous Media 2151-4798, 2151-562X 2010 (Volume 1)
Telecommunications and Radio Engineering 0040-2508, 1943-6009 1997 (Volume 51)
TsAGI Science Journal 1948-2590, 1948-2604 2009 (Volume 40)
Visualization of Mechanical Processes 2152-209X 2011 (Volume 1)
Journal Title ISSN Print, Online Archive in BDL
Tel: +1 (203) 938-1300 Fax: +1 (203) 938-1304
50 Cross Highway Redding, CT 06896
[email protected] www.dl.begellhouse.combegell
Over 20 journals provide the latest research & solutions for many engineering disciplines
DATABASES
W
Directory of Specialists
Heat Exchanger Design Handbook ONLINE — The web version of the Begell House highly regarded reference work on heat transfer and heat exchangers
The Catalog of Worldwide Nuclear Testing
THERMOPEDIA™ — Interactive gateway to resources on heat & mass transfer, fluid flow and thermodynamics
REFERENCES & PROCEEDINGS
IHTC
Annual Review of Heat Transfer Online (16 Volumes)
Electrospinning of Micro- and Nano-Fibers: Fundamentals in Separations and Filtration Processes
International Centre for Heat & Mass Transfer, ICHMT Digital Library — Online Conferences Proceedings
International Heat Transfer Conference Digital Library, IHTC Digital Library
eBOOKS— Series in Thermal & Fluid Physics & Engineering
Begell Digital Library on iPad, iPhone & Android DevicesAvailable for FREE with Institutional Subscription
Eng_flyer2013_7x10_1.indd 2 06.02.2013 15:31:10


![Effect of nutrient sprays on granulation and fruit quality of [] Dancy tangerine'mandarin](https://static.fdokumen.com/doc/165x107/63286a59f406ae55d2051207/effect-of-nutrient-sprays-on-granulation-and-fruit-quality-of-dancy-tangerinemandarin.jpg)