Color Atlas & Synopsis of Clinical Ophthalmology - Wills Eye ...
Upload
khangminh22Category
view
2download
0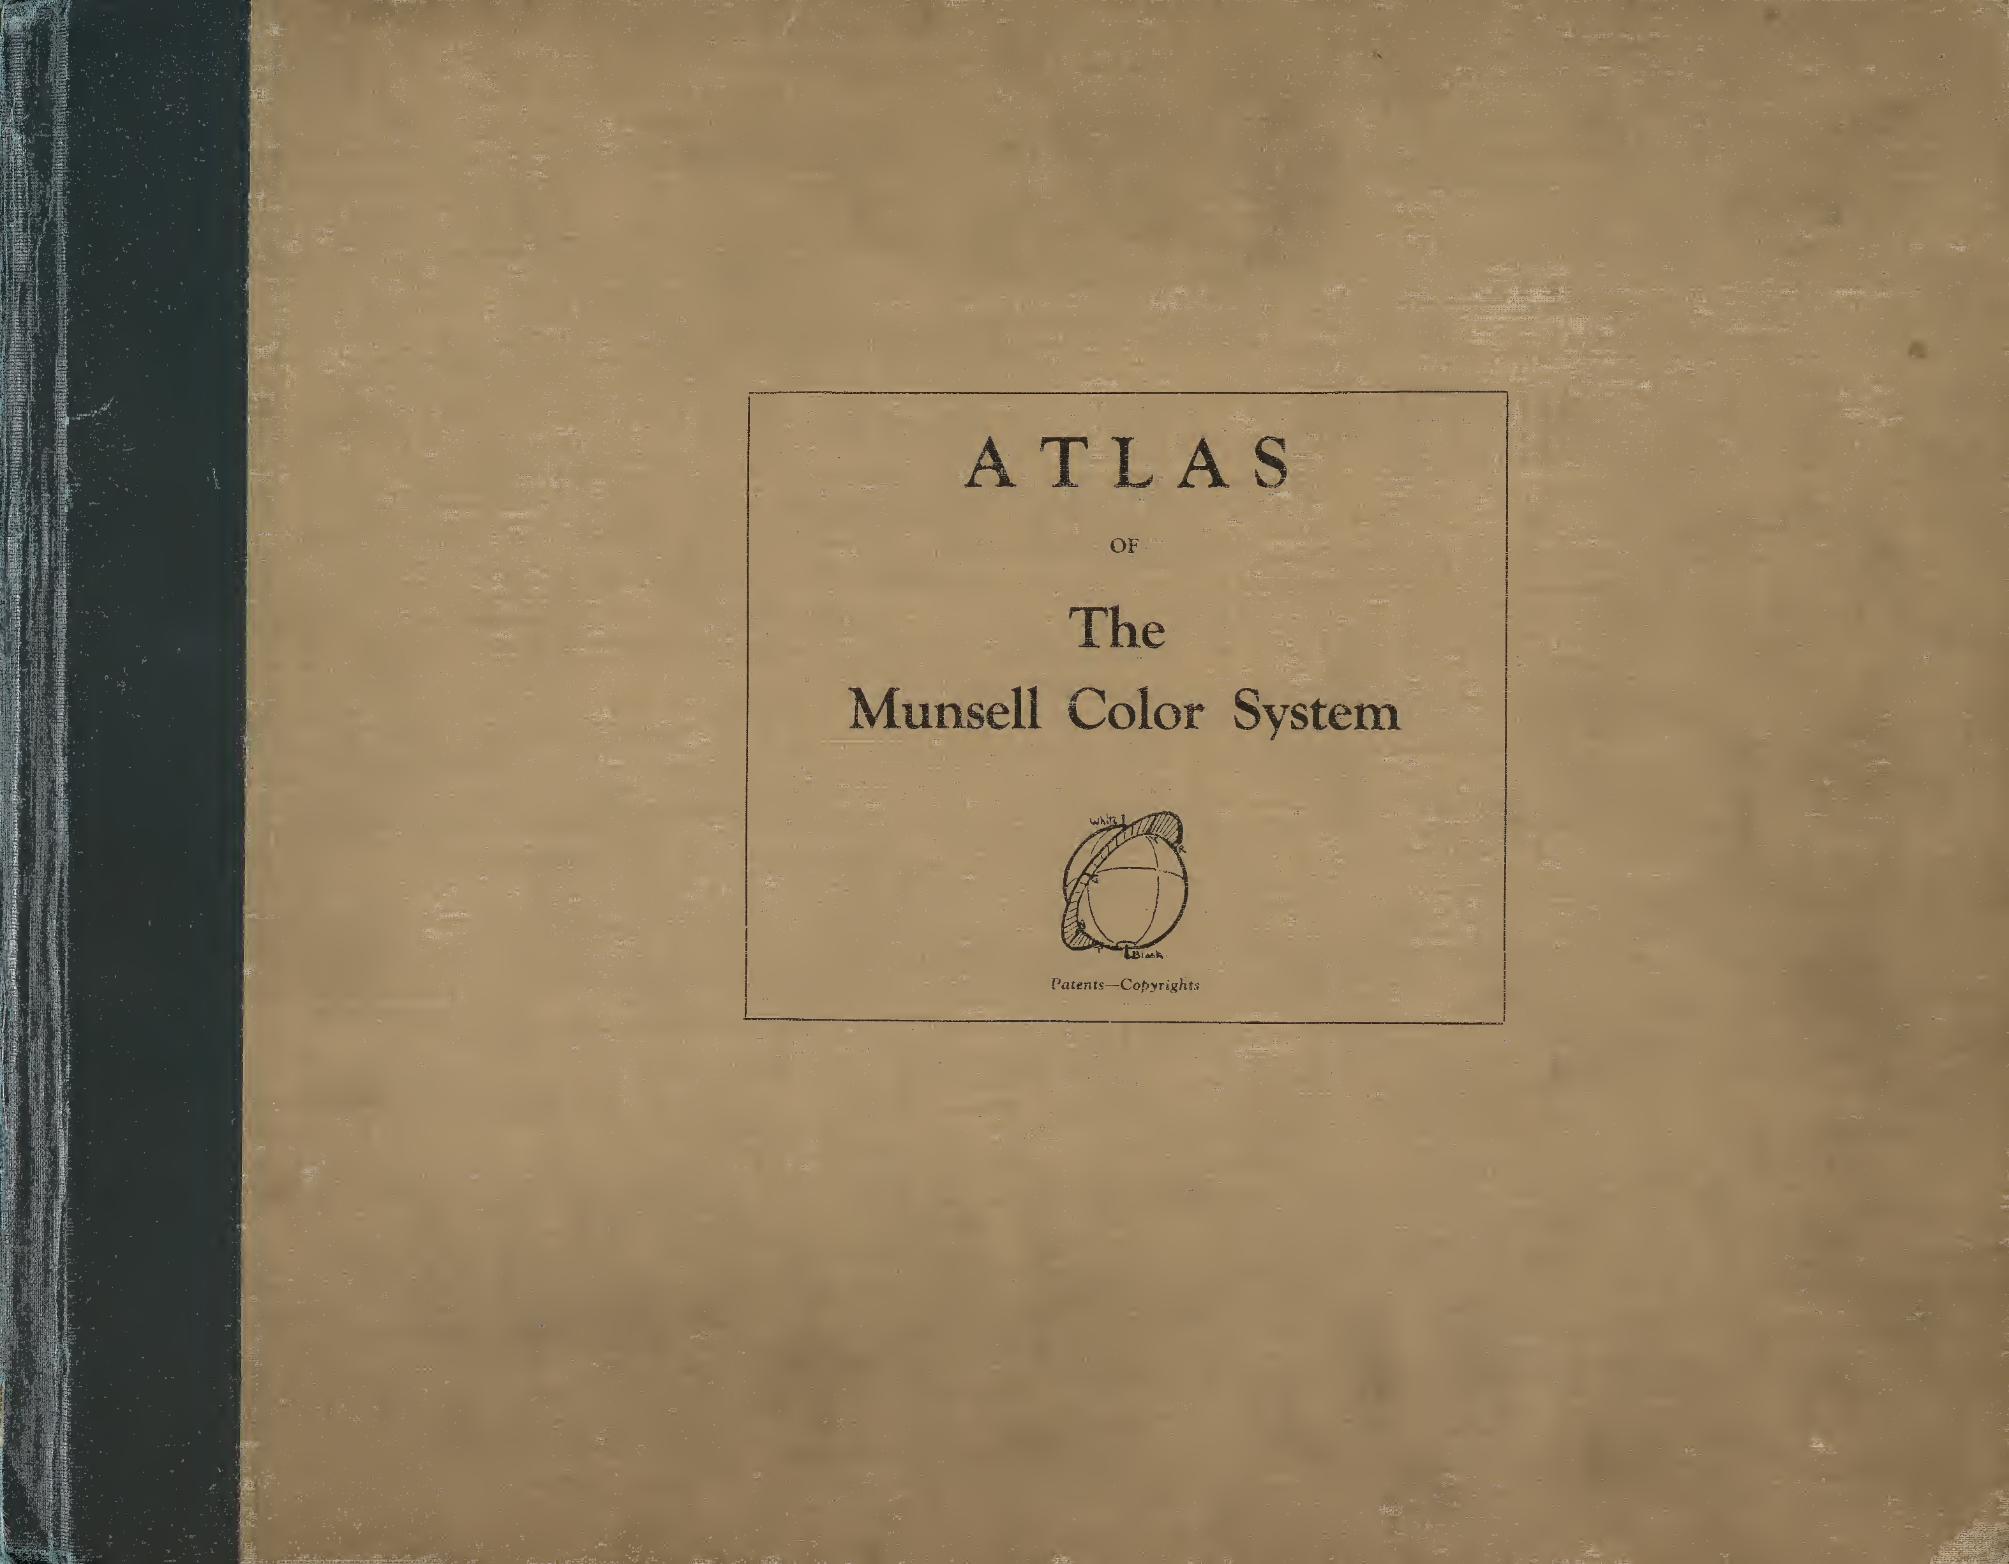
ATLASOF
The
Munsell Color System
Patents—-Copyrights

i
ssrriWJ!!!
5 S;t*3IE9MM><>
•’»«!•*! ;s**f3«'«»!2 *•;fgSsggs
lS&fgViivfi
.
aamilUIHla
*S«5!fsl»*8ilis**l*'
- .
'
lajjjfSSrfllfis'.
;.J* ** «»»« •
v”' iif!*!*!>>
i
is!!!!!!!;;;if::!!:!? <
5»»!«8Sl«Si2!!8* , f85m!*! ?'
:
j bh**=«» *»5 1st'?'>5»ir 1? in*-
;s!!Hi5«£2£i
nnjtr.T
II!.HJS|
jisswssifcta5^u! !*t*» tf<,****n;
i**S *2? SI* ““ * ^
npHRnTihulh!:”:: :!!«
n**e5CJ«»J5sJ55**f;i?:i5'*-
XlaitSs!** !
5 2222! 9wfflfiii i.bir
” 55 ?!! ' !* S S« • S s SJ SSUSSHi s-MsSs
I jSSMMM55kS25;s®*?s**»*


NOV 2 8 1980

imfvy
j
fM$C
Altujsell, $~lberj- 1{eiorYj / $t~ks of M U k/sc S(
Co/or -C ^ fr-f*e rn* /
THE COLOR ATLAS.THIS ATLAS CONSISTS OF TWO SETS OF CHARTS, ILLUSTRATING A SYSTEM OF COLOR MEASUREMENT OF WHICH THE FOLLOWING PARAGRAPHS GIVE A DESCRIPTION *
1. THREE COLOR SCALES UNITE IN A SPHERE.Imagine a colored sphere with white as its north pole,
black as its south pole, and its equator ringed about by a
circuit of red, yellow, green, blue and purple hues—each
of which melts imperceptibly into its neighbors, Fig, 1
,
Thus the equator traces the horizontal scale of hues: H.
Imagine each equatorial hue as graded upward to white
and downward to black in regular measured steps. Eachhue then presents a scale of values over the surface, while
the axis traces the vertical scale of gray values: V.
Imagine surface colors weakened by additions of neutral
gray as they pass inward to disappear in the vertical axis.
The sphere is thus filled with gradations of color,—lighter
degrees above the equator, darker degrees below; stronger
degrees outward, and weaker degrees inward to the axis,
where all color is balanced in neutrality. Th'e degree of color
strength at any point is known as chroma and is traced byradii at right angles to the axis. It represents the gradual
emergence of each hue from grayness. Each radius serves as
a scale of chromas: C.
Every color sensation may be measured and defined bythese three scales of hue, Value, and chroma. Neglect of
either scale—that is, failure to state either the hue, the value,
or the chroma of a color—creates doubt and confusion.
2. A COLOR TREE SURROUNDS THE COLOR SPHERE.Were all pigment colors of equal chroma then a sphere
would present an ideal of their relations. But pigments are
very unequal in strength, Vermilion red,t for example, being
twice as strong as its opposite complement, blue-green
Viridian. This is shown in chart 40. The unequal scales
of pigment chroma may be treated as branches of a Color Tree whose trunk is the neutral axis,
while its branches of various lengths and at various levels blossom out with the strongest colors.
This tree is imagined as compact of colored leaves—darker leaves below, lighter leaves above;
most chromatic leaves on the surface and grayer leaves inward to the trunk, which is colorless.
The tree also encloses the Color Sphere, which would appear were the longer branches lopped
off to equal the length of the shortest branch. Fig. 2.
3. NOTATION OF COLORS BY SYEVEBOLS.
The place of each leaf of the Color Tree is determined by the measured scales of hue, value
and chroma. These scales also furnish an expressive notation, made by the five color initials
with their combinations and ten arabic numbers.
The scale of hue is a sequence of red (R), yellow-red (YR), yellow (Y), green-yellow (GY),
green (G), blue-green (BG), blue (B), purple-blue (PB), purple (P), and red-purple (RP).
The five principal hues melt perceptibly into intermediates by ten steps, of which the middle
or fifth step is typical of that hue. The scale of values is also decimal from 0 (black) to 1 0
(white), and the scale of chromas likewise from 0 (neutral gray) to 1 0 (the strongest perma-
nent pigment so far obtained).
A symbol completely describing the character of any color sensation is composed of its de-
grees of hue, value, and chroma. The symbol for what is commonly known as Vermilion is
5Rt\ (“five red, four over ten”):—the numeral before R showing that it is the fifth or typical step
of red in the hue scale, without tendency either to yellow-red or purple-red; the upper numeral
showing that its luminosity equals the fourth step in the
value scale, and the chroma numeral ten showing that it
is of maximum strength. Chart H.
Should the Vermilion be changed by fading or admixture
with another pigment, this would appear in the symbol:
—
thus a tinge of yellow in the red is written 6R while 4R in-
dicates a tinge of purple; a slight addition of gray reduces
the chroma to Rg, while the addition of white changes the
value toR-. Grouping all these changes in the symbol,
6R g , shows that the original Vermilion 5Ri\ is no longer
pure, but tinged with yellow, lightened with white, andweakened with gray.
4. CHARTS OF THE COLOR SYSTEM.The measured scales of hue, value, and chroma fire pre-
sented in two sets of charts, one made by vertical sections
of the Color Tree, and the other by horizontal sections.
Figs. 3 and 4.
There are eight vertical charts. Chart H is the hue scale
arranged as an index for recording colors singly or in groups.!
Vermilion appears in the column R at the level four andwith the chroma symbol ten. Chart V is the value scale upona hinged and perforated card, behind which to test the value
of a color sample. Thus Vermilion seen through the per-
forations is darker than value five and lighter than value
three. It matches value step four. Chart C hears the chroma
scales of red, yellow, green, blue and purple as tree brancheswhose levels and lengths describe the relation of these max-ima to the extremes of white and black. Vermilion ap-
pears as the strongest red chroma, and the color is written
5Ri4o.
The five remaining vertical charts are planes passedthrough the axis, on opposite sides of which appear the com-plementary fields of color. Chart R shows the red field with
its complementary field of blue-green. By noting the sym-bol 5 Ri
4o Vermilion may be balanced with any degree of its
opposite blue-green. Chart Y shows yellow with its oppo-site purple-blue. Charts G, B, and P show green, blue, andpurple with their appropriate complements, red-purple, yel-
low-red (orange), and green-yellow.
There are seven horizontal charts. The axis appears on each as the neutral gray centre ofa star or radial pattern, the lengths of whose radii indicate the chroma of their hues. Thesesections present colors at a single uniform level of value:—thus. Chart 50 at the middle of theColor Tree bears only colors which reflect 50 per cent, of the luminosity of white, while Charts40, 30, and 20 show darker levels, and Charts 60, 70, and 80 show the lighter levels of color.5. BALANCE OF COLOR BY A SPHERE.The sphere typifies balance of color.§ White and black balance at the centre on middle
gray, Na. Balanced colors appear at the ends of any diameter passing through the centre of
the sphere. Also, a lighter color balances a darker, but when unequal values or chromas areemployed the color of weaker chroma must be given the larger area. The symbols on eachstep of these color charts indicate the proportions needed to produce balance, as suggested inthe text to be found on each chart.
AND
COLOR TREE
VERTSCAL
AND
HORIZONTAL CHARTS.
*For fuller information the reader is referred to the author’s ‘A Color Notation,” 3d edition, Boston, 1913. fVermilion red, the sulphuret of mercury, is the most chromatic of permanent colors.
§Models of A Color Tree and A Color Sphere have been designed to demonstrate the balance of color.
+ See Chapter VI. of “A Color Notation.”
Copyright, 1915, by A. H. Munsell.
. -

MUNSELL COLOR SYSTEM
s ATLAS—OF-
COLOR CHART8.
ACopyright by A. H, MUNSELL. 1907-1915.
Patented June 26, 1906.
j 4*>y\ \o c\
:
RP 9 8 7
' a k6 P 4 3 2 PB 9 8 7 6 B
' b4 3 2 1
CHART
H
SCALE OF HUESfO lo fo to io987 6© 4321 GY 987 6 Y 4 3 2 1 YR 9876R4321 RP
CHART H.INDEX FOR COLOR NOTATION.
This chart suggests all col<jr paths and records each step by a simple NOTATION. The ten steps of hue are written
RP (red-purple), P (purple), PB (purple-blue), B (blue), BG (blue-green), G (green), GY (gr'een-yellow), Y (yellow), YR (yellow-
red or orange), and R (red). v
Initials at the top of the chart trace the Sequence of Hues; numerals at the side trace the Sequence of Values and the small
numeral printed on each color step is an index of its Chroma i,e. strength or saturation. The color step made of vermilion bears
the chroma numeral 10;- it is at the value level 4:- and in the red column R. This step is written 5Rx40- as explained in a previous
introduction and in chapter VI of “A Color Notation.
If this chart were bent around the equator of the color sphere forming a cylindrical envelope, it would imitate a mercator
chart of the globe, each hue taking the place of a meridian and each value level representing a parallel of latitude, while the chroma
numerals would correspond to altitudes.
Were this cylinder cut open on the red-purple meridian (RP) it would spread out to form this Hue Chart;- green being at
its center with yellow and red (warm hues) to the right, and the cool hues blue and purple to the left.
Colors shown on this chart form the irregular outside of the color tree, between which and the neutral gray trunk are
the intermediate degrees of weaker chroma, which appear on the succeeding charts R. Y. G. B. P and 20. 30. 40. 50. 60. 70. 80.
of the system.
AVOID DUST, HANDLING AND EXPOSURE TO STRONG LIGHT.
SCALE
OF
VALUES
-v ;• * -75 ? *;**- * venaSSSSSSSJl! § 5 »’
2?s *« 22 S 22?sv^»»*«S2SssSX2Ss"R»S«»5;sjj»
5SsdHSa*f»»ss»s®sSis"-‘»iK!«ls?sl®* J sShhmm
j ? ?, ? I s 1 1 s?§ § S ? J?B 2 2 2 »5 a S2 S 2IS 225f'i
- -•„ ! . .
'
'» “*»*> <-->;. »!»»« j,4 5 JJ[J,S'!fcll*|j*B
!;j!s:!;::n!;-'*;:;Ens;;t:K;S::!t:;!
ailililli.
iifl °« *s>.- « n« 4 2 K2*» *•' f * * ••"''•i •••••• • -.S2 ;
:
: - »;i««
!
:
« I :!v
•
'; j l:v,i
“filliss-sij"".-:? a=?«?2 ::; liSKiisi
i:sis5 8SS5 » 2JssSssSS55KBssssSS i &
sss*^BKs!*e#»» tti;g «*S*S»« »*!!? ea!!»£ 2 *Mg*M**®s$j
m»SS SiSS* 6 •*»»*# lit** ! IS I *S
,
:* *»< <i v . ;..
: ;;;; «••» r
.
".
••'•:
; .iJrcaSsHliiii
-slier -I!5*£S»"**i5Ss!S 5
1
'-•
:
^iSsiSaSSglgSSS*? *;oS|IoilS2-gs;a?2e.li§£S2*»»2g
until
!:*2”«! 5S2!S! 2 i:s
L.iisisSs***
R»m>mS2! 2R!:!S
a 5 *J522^5fs??S*W^^S« 2 *S:2**?is;**S0 «>SsaejEsSj§ 5 **«t 5ao; 5ai3!;;®J®iHBS 5^5SWss5”mS!!:!5SEs!!8555 S!:
ssis::
.
•«tS3!&
i*®»S*8 S»»S;
2"HI »»»*!
»2 £**** * •«*»«««
«
8 *ss(«»£{S
J
i****Ba
~:s:> = «*“; jS5! JJSSJJg?®** »•«*«&« 5«s»
525?;*. Jsi !2;S®*|; *»a
isi.-.n!v«e«*»»f|ase»a,f0 t
'i
® 8"!n»»eMHU.. jc'tS
<
n tin sill |||pssst5ss§3ssgs
4UUs I;!Ss:?‘SUsilsg^Is^SlsIlllfasssssIs
i nwntnisggBJ !5|::si5 Sa*
1 Ii ; v : r. ’i"
£' * - - 0 “ « i o s a a «.;,s 5 -
** s!£***«« 6««*2®
-Jlillllililil»;;;?** 8 o **i“0 t<8es»isoiMesl
-*S 5SS2 SS 6SS*“*-SSS2S2SS52M 22;»*
*55S25g§lslHiil2S5S?S55252sls2 !
si
iilll ssisll
/
MUNSELL COLOR SYSTEM
ATLAS—OF—
COLOR CHARTS.
COPYRIGHT BY A. H, MUNSELL. 1907-1915.
Patented June 26, 1906.
CHART
V
Purple %o
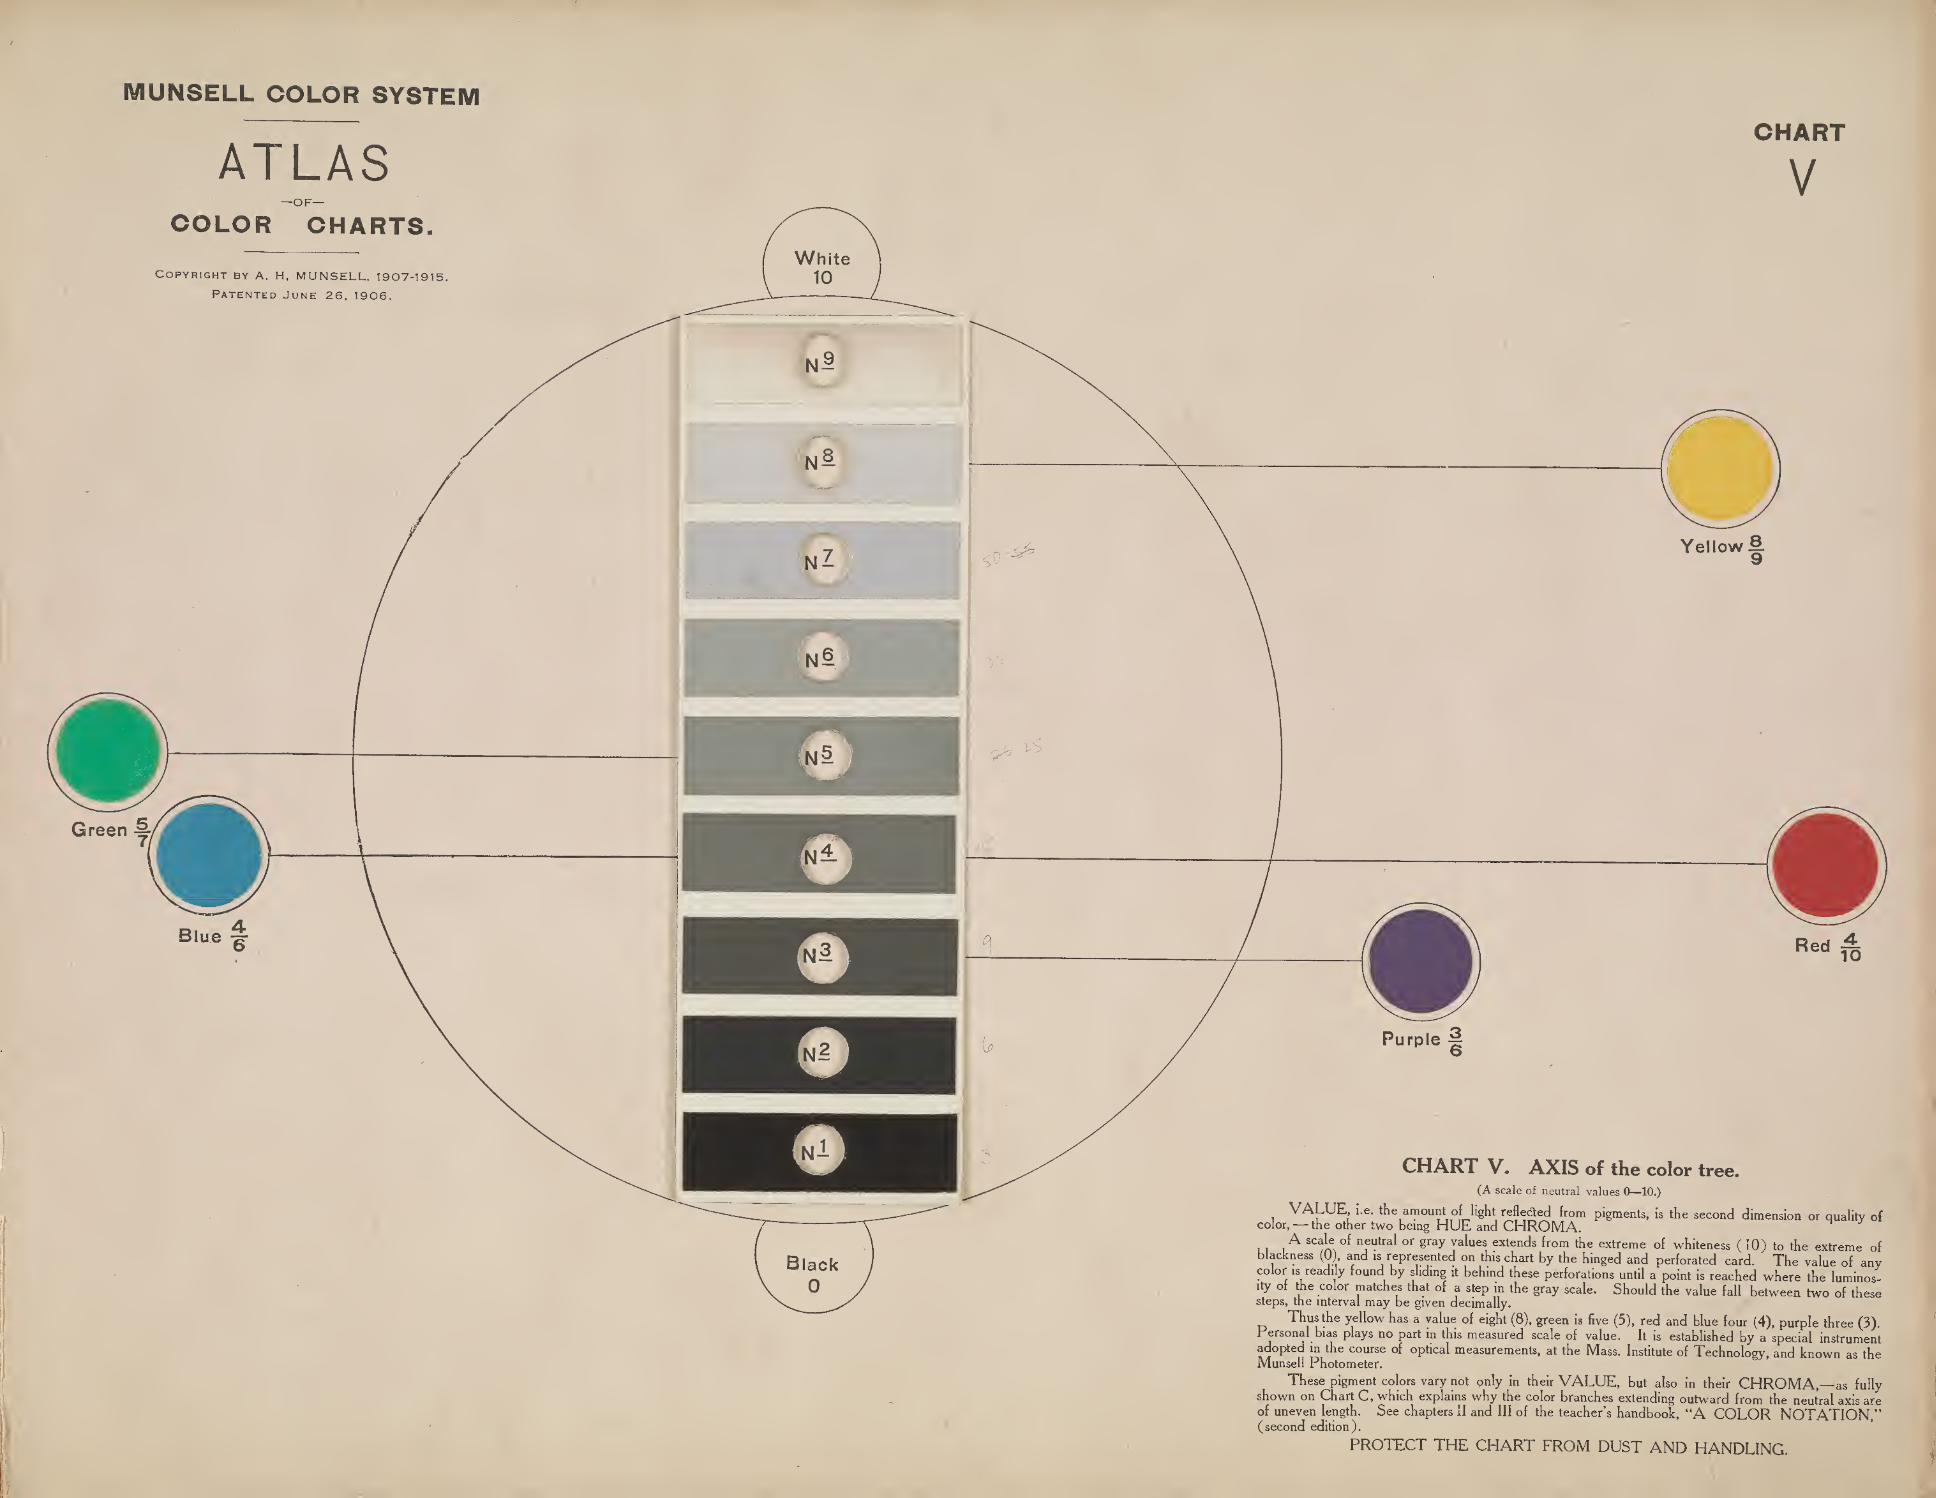
CHART V. AXIS of the color tree.(A scale of neutral values 0—10.)
VALUE, i.e. the amount of light reflected from pigments, is the second dimension or quality ofcolor,— the other two being HUE and CHROMA.li ,
A SCaLe ° f n
futral or §ray Yalues ^tends from the extreme of whiteness ( 10) to the extreme of
blackness (0), and is represented on this chart by the hinged and perforated card. The value of anycolor rs readily found by sliding it behind these perforations until a point is reached where the luminos-ity of the color matches that of a step in the gray scale. Should the value fall between two of thesesteps, the interval may be given decimally.
Thus the yellow has a value of eight (8), green is five (5), red and blue four (4), purple three (3).Personal bias plays no part in this measured scale of value. It is established by a special instrumentadopted in the course of optical measurements, at the Mass. Institute of Technology, and known as theMunsell Photometer.
These pigment colors vary not only in their VALUE, but also in their CHROMA,—as fullyshown on Chart C, which explains why the color branches extending outward from the neutral axis areof uneven length. See chapters II and III of the teacher’s handbook, “A COLOR NOTATION,”(second edition).
PROTECT THE CHART FROM DUST AND HANDLING.

;Us4:i

MUNSELL COLOR SYSTEM
ATLAS—OF—
COLOR CHARTS.
CHART
C
Copyright by A. H, MUNSELL. 1907-1915
Patented June 26, 1906.
CHART CCHROMATIC BRANCHES OF THE COLOR TREE
(Scales of pigment chroma 0—10.)
the other twoCHROMA, i.e. the strength of pigment colors, is the third dimension of color, -
being HUE and VALUE.Chroma is represented by the branches of the color tree, which extend outward from its neutral
axis and bear the Strongest colors at their extremities. These branches are of uneven length becausepigments vary in strength or saturation.
The chroma scale of red projects ten ( 10) steps outward from a neutral gray of the same value(4), while green shows seven(7)and purple six (6) steps of chroma. The chroma scale of yellow projectsnine (9) steps outward from a gray of the same value (8), while that of blue shows but six (6)steps of chroma.
These scales are not due to personal bias or guess work, but have been scientifically established.They explain the unequal power of pigments, showing how far the “ warm hues ” red and yellow,outbalance the “ cool hues ” blue and green. The circle struck from N 5
is the contour of the colorsphere, within which all colors are balanced.
Measured scales of VALUE and CHROMA make it possible to define a color with exadtness.See chapter VI of the teacher’s handbook, “A COLOR NOTATION,” (second edition).
PROTECT THE CHART FROM DUST AND HANDLING.
.

MUNSELL COLOR SYSTEM
ATLAS—OF—
COLOR CHARTS.
CHART
RCopyright by A. H, MUNSELL. 1907-1915.
Patented June 26, 1906.
f
RED AND BLUE-GREEN CHART.This chart presents a vertical plane passed through the axis of the color solid and bearing the complementary hues, red and
blue-green. This pair of opposite hues is shown in regular measured scales from black to white, and from greyness to the strong-
est color made in stable pigment.
VALUES of red and blue-green range vertically from black (0) to white (10). CHROMAS or strengths of color range
horizontally from neutral gray to the maximum (10).
Each step in these color scales bears an appropriate symbol describing its light and its strength. Thus R is vermilion, the
standard red of the system, which exhibits 1 00% of chromatic strength and reflects 40% of the incident light. Its opposite BGf reflects the
same percentage of light but only 50% of chroma. To balance this pair the areas must be inversely as the chroma, i. e., since
blue-green is but half as strong as vermilion red, twice as much is required for a balance. Attention to these measures leads to
pleasing combinations.
Any chosen steps of red and blue-green upon this chart may be balanced by noting their symbols:- thus light blue-green (BGv)balances dark red (Rf) when the areas are inversely as the product of the symbols viz:-six parts of light blue-green and twenty-four parts of dark red.
Chapters III and IV of the handbook, “A Color notation,” describe these balances and their combinations with other hues.The symbol on each color step is its NAME, a measure of its light and strength by which it is to be memorized, written andreproduced.
AVOID DUST, HANDLING AND EXPOSURE TO STRONG LIGHT.
SCALE
OF
VALUES

SCALE
OF
VALUES
MUNSELL COLOR SYSTEM
ATLAS—OF—
COLOR CHARTS.
OHART
YCopyright by A. H, MUNSELL. 1907-1915.
Patented June 26, 1906.
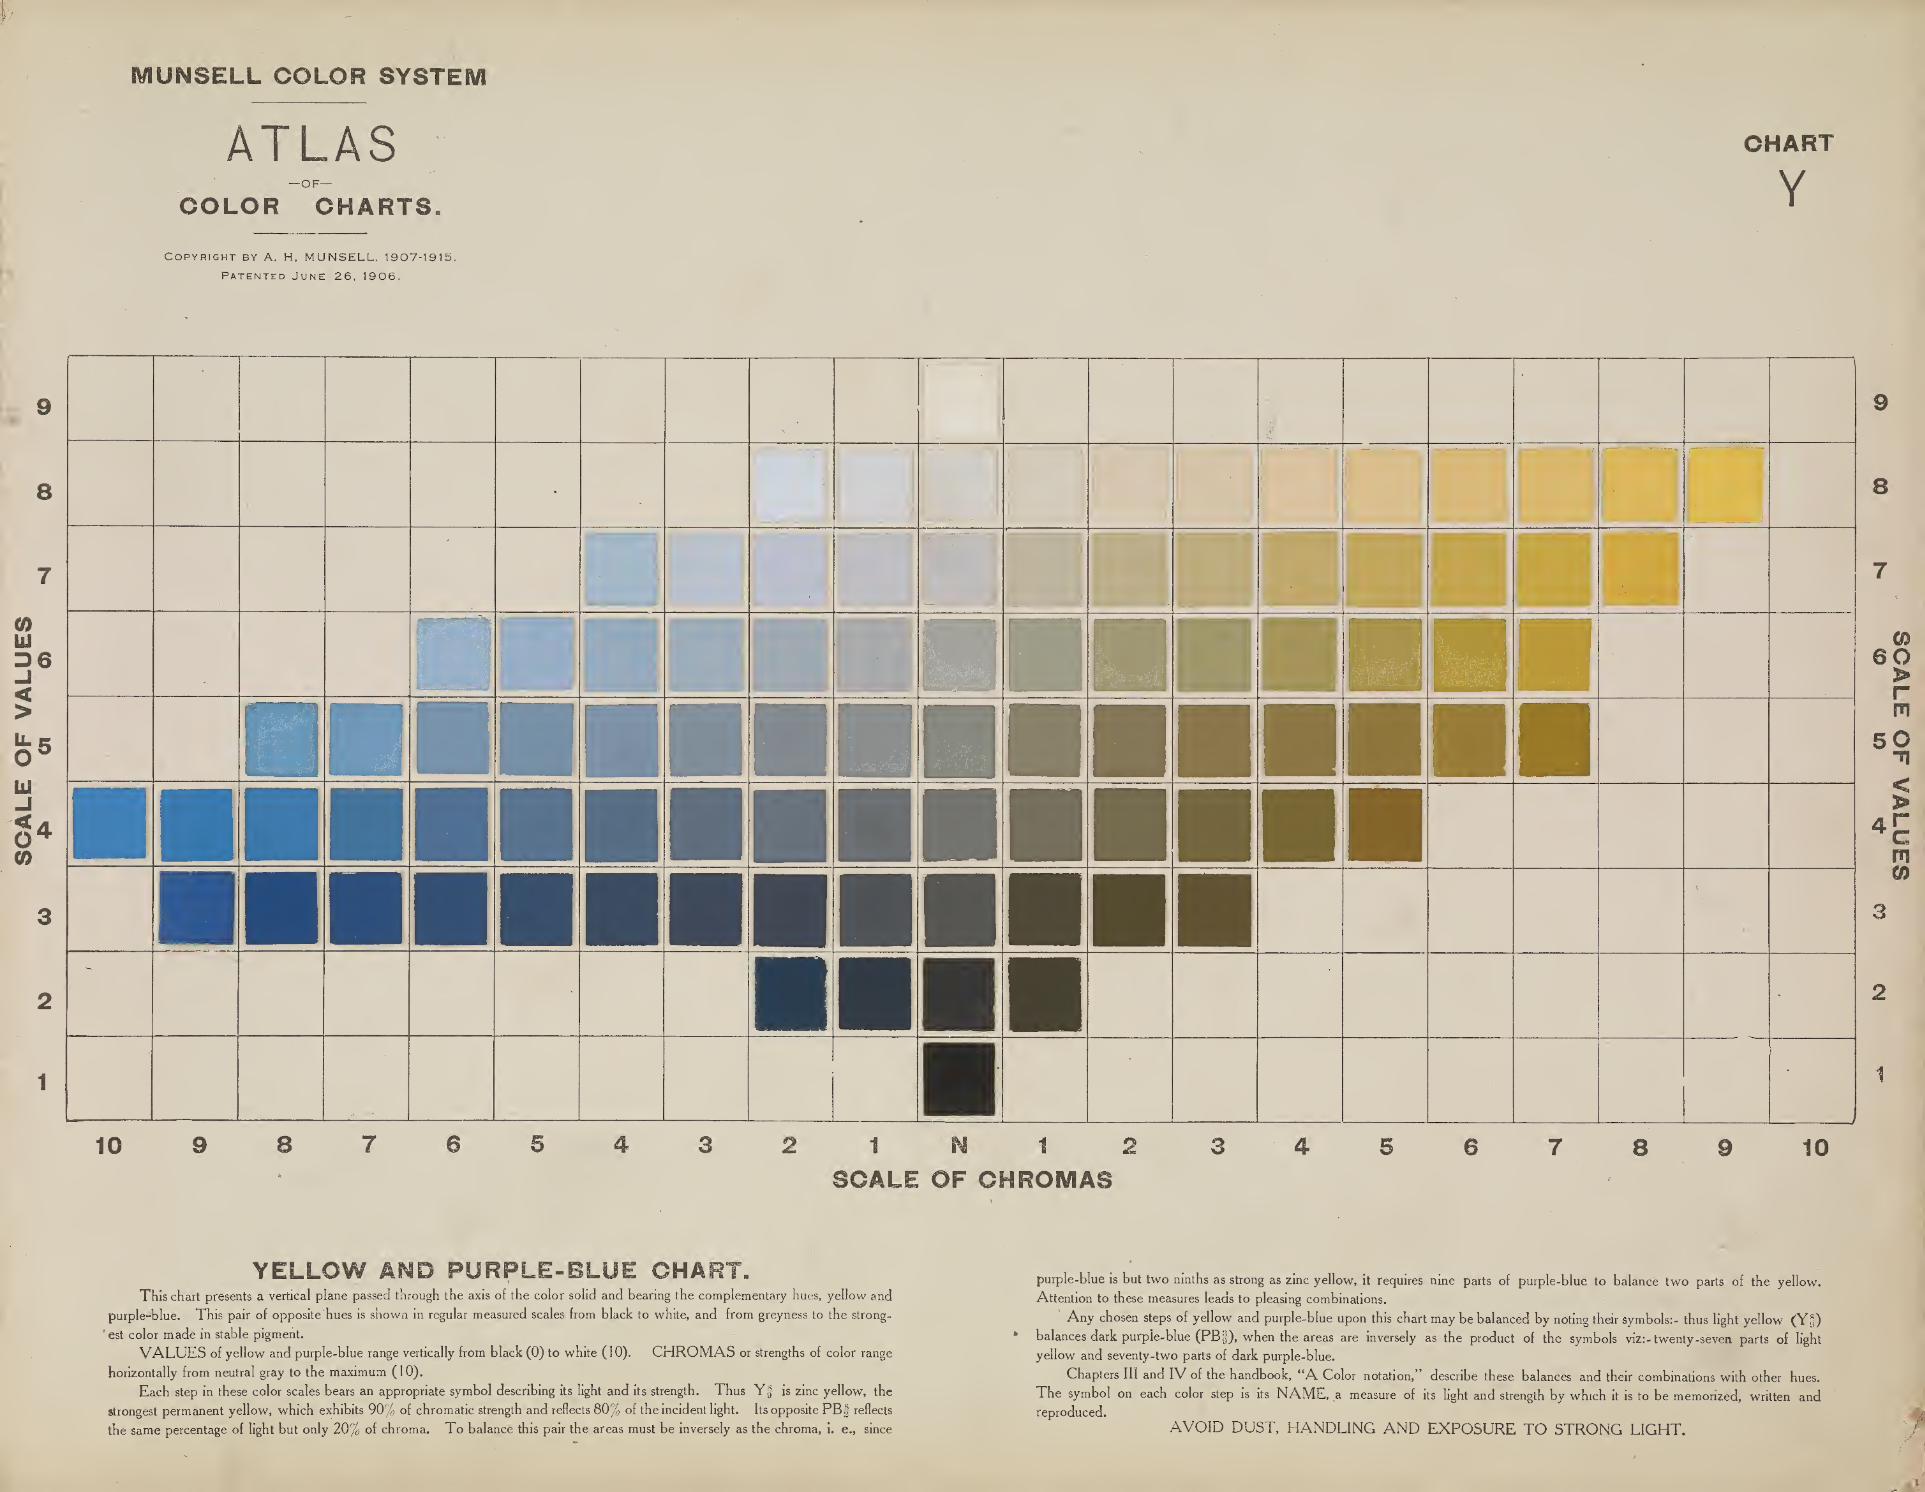
YELLOW AMD PURPLE-BLUE CHART,\
This chart presents a vertical plane passed through the axis of the color solid and bearing the complementary hues, yellow and
purple-blue. This pair of opposite hues is shown in regular measured scales from black to white, and from greyness to the strong-
est color made in stable pigment.
VALUES of yellow and purple-blue range vertically from black (0) to white (10). CHROMAS or strengths of color range
horizontally from neutral gray to the maximum (10).
Each step in these color scales bears an appropriate symbol describing its light and its strength. Thus Y| is zinc yellow, the
strongest permanent yellow, which exhibits 90% of chromatic strength and reflects 80% of the incident light. Its opposite PBf reflects
the same percentage of light but only 20% of chroma. To balance this pair the areas must be inversely as the chroma, i. e., since
purple-blue is but two ninths as strong as zinc yellow, it requires nine parts of purple-blue to balance two parts of the yellow.
Attention to these measures leads to pleasing combinations.
Any chosen steps of yellow and purple-blue upon this chart may be balanced by noting their symbols:- thus light yellow (Y§)balances dark purple-blue (PBjj), when the areas are inversely as the product of the symbols viz:- twenty-seven parts of light
yellow and seventy-two parts of dark purple-blue.
Chapters III and IV of the handbook, “A Color notation,” describe these balances and their combinations with other hues.
The symbol on each color step is its NAME, a measure of its light and strength by which it is to be memorized, written andreproduced.
AVOID DUST, HANDLING AND EXPOSURE TO STRONG LIGHT.
SCALE
OF
VALUES

"V.
>
'
> V
! 1 : : >
9
a
coiii
36<>It- eO 5
LUJ<oCO
t
MUNSELL COLOR SYSTEM
ATLAS-OF-
COLOR CHARTS
CHART
GCopyright by A. H, MUNSELL. 1907-1915.
Patented June 26, 1906.
10 9 8 2 1 N 1 2
SCALE OF CHROMAS6 8 9 10
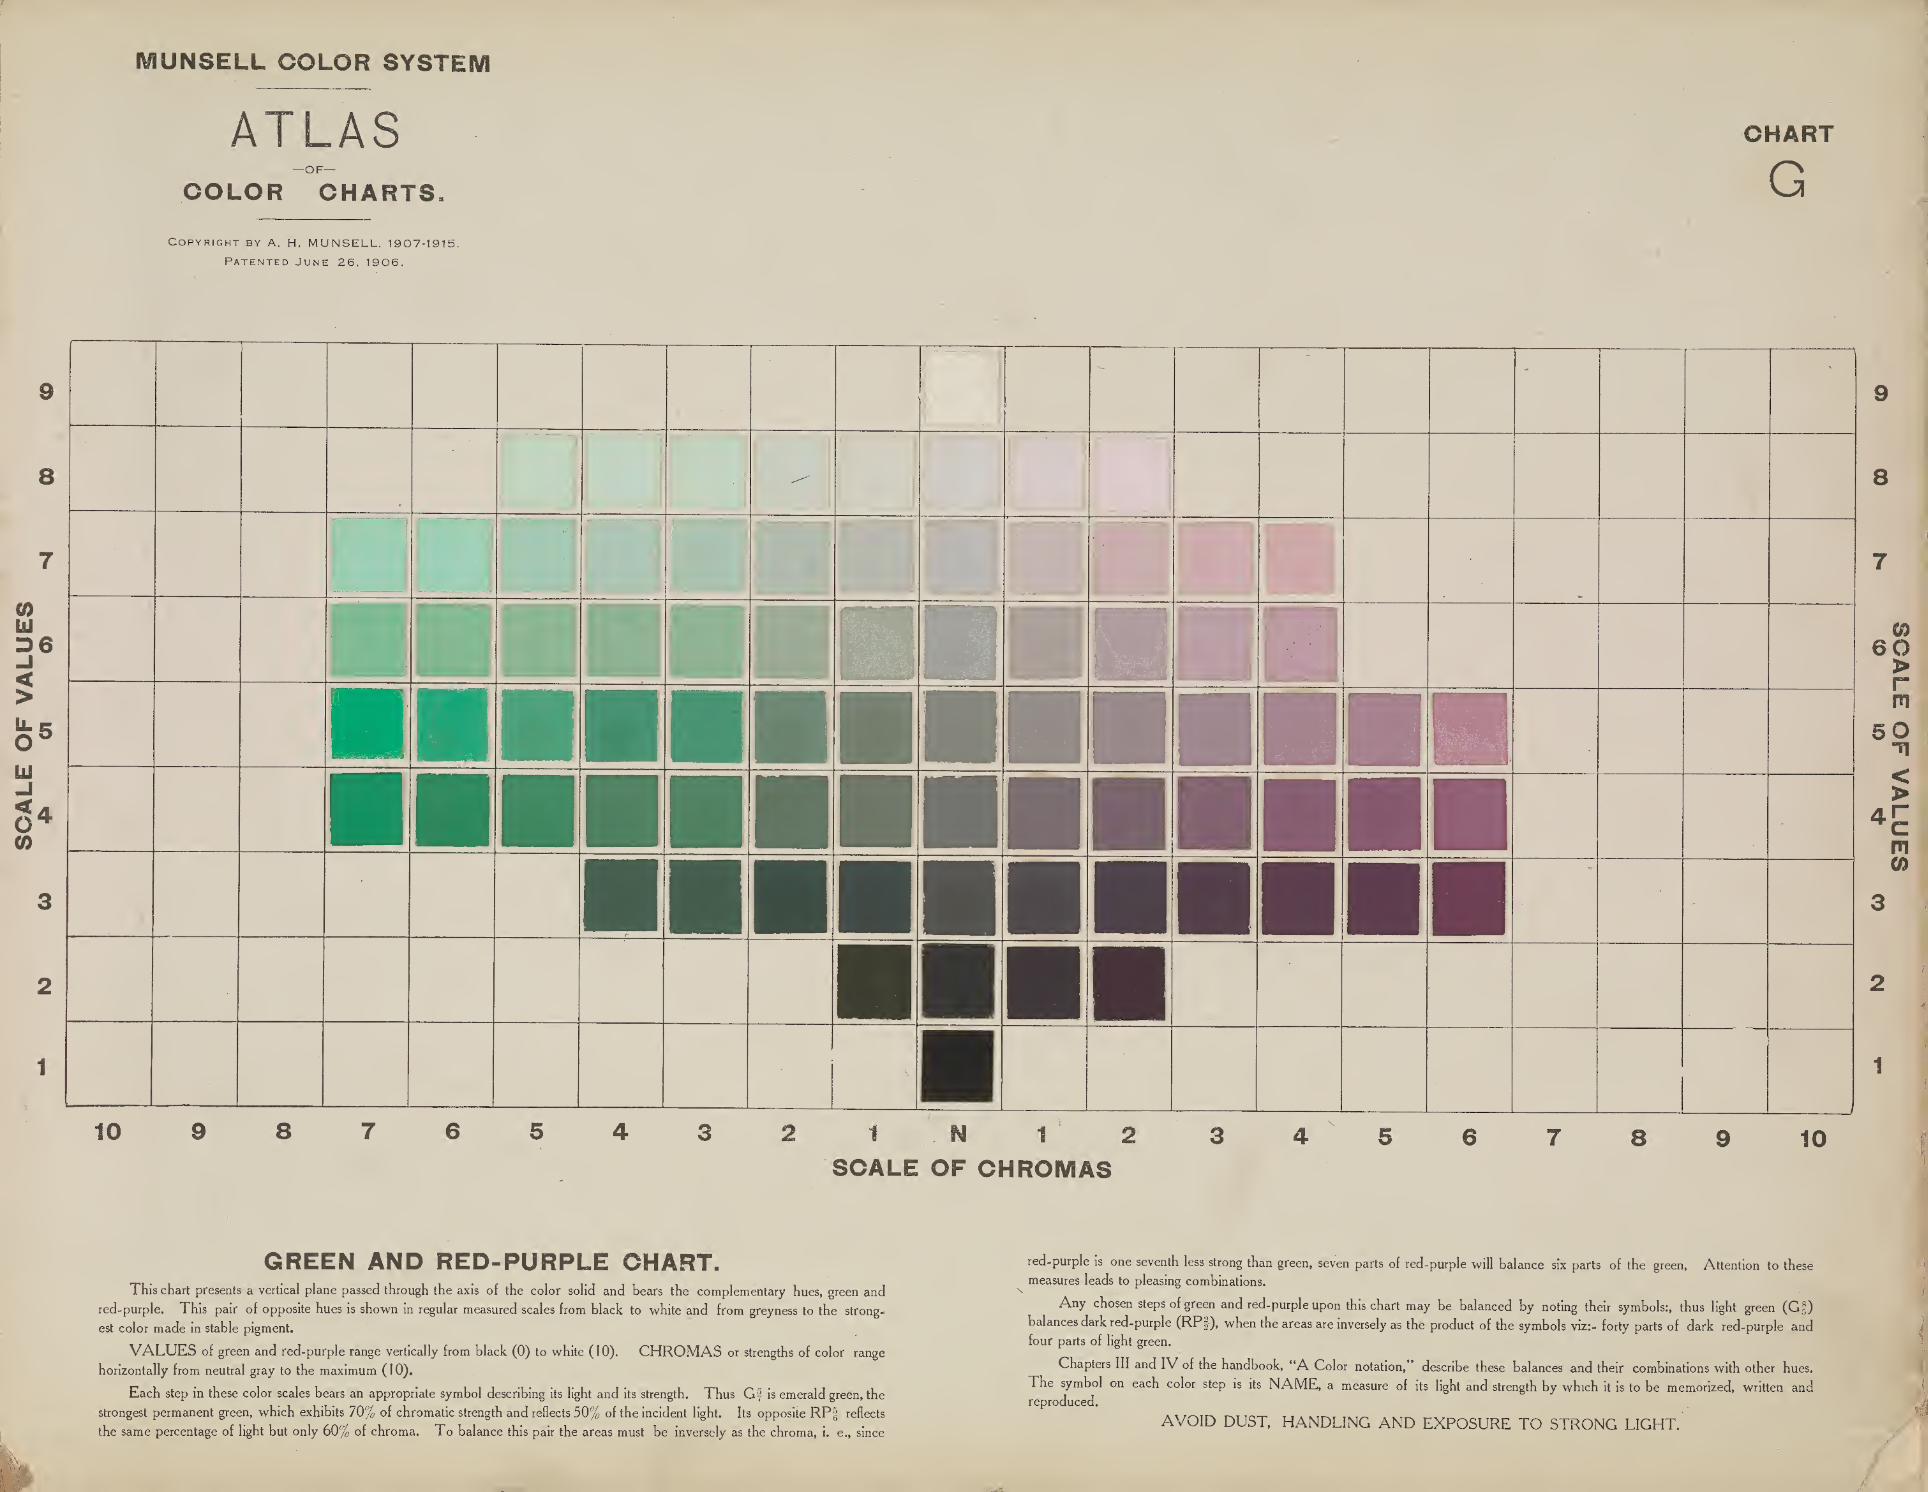
GREEN AND RED-PURPLE CHART.This chart presents a vertical plane passed through the axis of the color solid and bears the complementary hues, green and
red-purple. This pair of opposite hues is shown in regular measured scales from black to white and from greyness to the strong-
est color made in stable pigment.
VALUES of green and red-purple range vertically from black (0) to white (10). CHROMAS or strengths of color range
horizontally from neutral gray to the maximum ( 1 0).
Each step in these color scales bears an appropriate symbol describing its light and its strength. Thus Gf is emerald green, the
strongest permanent green, which exhibits 70% of chromatic strength and reflects 50% of the incident light. Its opposite RPf reflects
the same percentage of light but only 60% of chroma. To balance this pair the areas must be inversely as the chroma, i. e., since
red-purple is one seventh less strong than green, seven parts of red-purple will balance six parts of the green, Attention to these
measures leads to pleasing combinations.
Any chosen steps of green and red-purple upon this chart may be balanced by noting their symbols:, thus light green (G§)balances dark red-purple (RP|), when the areas are inversely as the product of the symbols viz:- forty parts of dark red-purple andfour parts of light green.
Chapters III and IV of the handbook, “A Color notation, describe these balances and their combinations with other hues.
The symbol on each color step is its NAME, a measure of its light and strength by which it is to be memorized, written andreproduced.
AVOID DUST, HANDLING AND EXPOSURE TO STRONG LIGHT.
'
- *
-—
j
r. 1
;j
flj t
I
I Tj
r mill
-
|
j
rrnrr i1
1|
i
-
.
_jr .-JL _.. J
r gjA
—i
9
8
CO
60>rrs?
50T|
<>
4Hmco
4

MUNSELL COLOR SYSTEM
. 9
8
F?LU
D6•J
<>
fc5
yj-J
< A
m
1
ATLAS—OF—
COLOR CHARTS
OHART
BCopyright by A. H, MUNSELL. 1907-1915.
Patented June 26, 1906.
10 9 8 6 4
*
;
~T|
|
|
i
1 0-
i . .
ILp
-
I IIM|H_
1 N 1 2
SCALE OF OHROMAS4 8 9 10
9
8
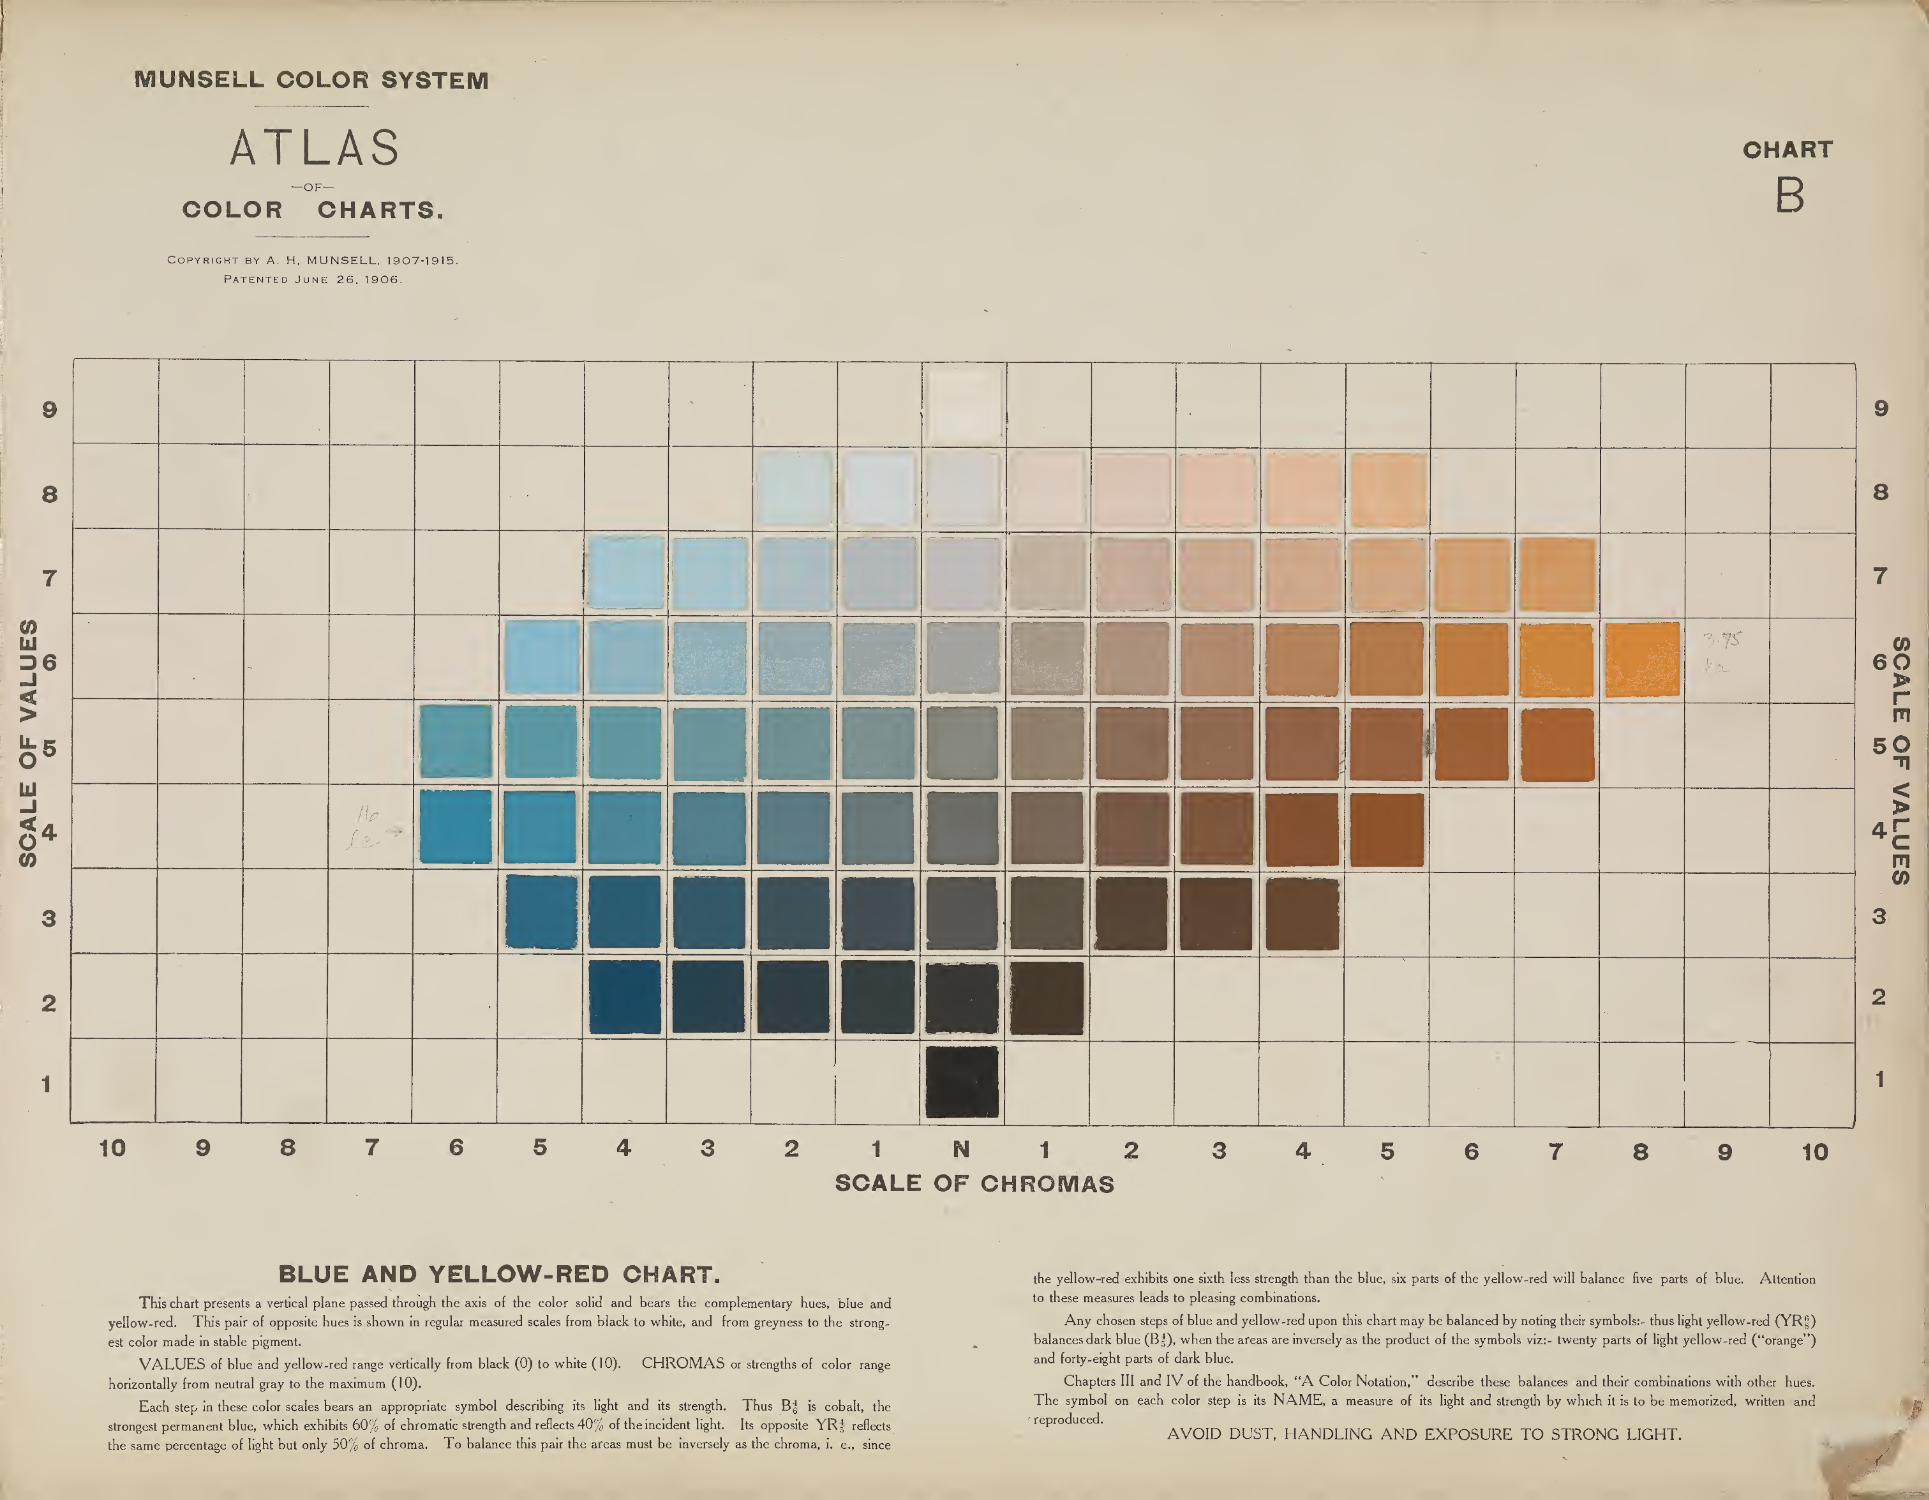
BLUE AND YELLOW-RED OHART.This chart presents a vertical plane passed through the axis of the color solid and bears the complementary hues, blue and
yellow-red. This pair of opposite hues is shown in regular measured scales from black to white, and from greyness to the strong-
est color made in stable pigment.
VALUES of blue and yellow-red range vertically from black (0) to white (10). CHROMAS or strengths of color range
horizontally from neutral gray to the maximum ( 1 0).
Each step in these color scales bears an appropriate symbol describing its light and its strength. Thus B| is cobalt, the
strongest permanent blue, which exhibits 60% of chromatic strength and reflects 40% of the incident light. Its opposite YRf reflects
the same percentage of light but only 50% of chroma. To balance this pair the areas must be inversely as the chroma, i. e., since
the yellow-red exhibits one sixth less strength than the blue, six parts of the yellow-red will balance five parts of blue. Attention
to these measures leads to pleasing combinations.
Any chosen steps of blue and yellow-red upon this chart may be balanced by noting their symbols:- thus light yellow-red (YRf)balances dark blue (Bf), when the areas are inversely as the product of the symbols viz:- twenty parts of light yellow-red (“orange”)
and forty-eight parts of dark blue.
Chapters III and IV of the handbook, “A Color Notation,” describe these balances and their combinations with other hues.
The symbol on each color step is its NAME, a measure of its light and strength by which it is to be memorized, written and
reproduced.
AVOID DUST, HANDLING AND EXPOSURE TO STRONG LIGHT.
SCALE
OF
VALUES
ill;

SCALE
OF
VALUES
MUNSELL COLOR SYSTEM
ATLAS—OF—
COLOR CHARTS.
CHART
P
10 8 2 1 N 1 2SCALE OF CHROMAS
8 lO
PURPLE AND GREEN-YELLOW CHART.This chart presents a vertical plane passed through the axis of the color solid and bears the complementary hues,
purple and green-yellow. This pair of opposite hues is shown in regular measured scales from black to white and from
grayness to the strongest color made in stable pigment.
VALUES of purple and green-yellow range vertically from black (0) to white (10). CHROMAS or strengths ol
color range horizontally from neutral gray to the maximum (10).
Each step in these color scales bears an appropriate symbol describing its light and its strength. Thus P% is a com-
pound purple, the strongest permanent color, which exhibits 60 °/o of chromatic strength and reflects the same amount of
light as N 4/ of the value scale. Its opposite GY% reflects the same amount of light but only 50% of chroma. To balance
this pair the areas must be inversely as the chroma, i. e., since green-yellow is one-sixth less strong than the purple, six parts
of green-yellow will balance five parts of the purple. Attention to these measures leads to pleasing combinations.
Any chosen steps of purple and green-yellow upon this chart may be balanced by noting their symbols, thus light
green-yellow (GY%) balances dark purple (P%), when the areas are inversely as the product of the symbols, viz:~six partsof light green-yellow and forty-eight parts of dark purple.
Chapters III and IV of the handbook, “A Color Notation,” describe these balances and their combinations with otherhues. The symbol on each color step is its NAME, a measure of its light and strength by which it is to be memorized,written and reproduced.
AVOID DUST, HANDLING AND EXPOSURE TO STRONG LIGHT.

/;
/
I
/
T

MUNSELL COLOR SYSTEM
ATLASCOLOR
Copyright by A. H,
Patented Ji
CHART 20.DARK SCALES OF HUE AND CHROMA, REFLECTING 20% OF THE INCIDENT LIGHT.
This chart is a horizontal section through the color solid, similar to chart 50 except that the shorter radii describe a loss of
chroma as colors darken.
Each radius from the neutral centre, N 2, is a scale of chroma for its hue and displays the strength obtainable in stable pigment
at this level. Each step in the scale bears its appropriate symbol by which the color is known and written. For simplicity the
scale is given ten equal and measured steps, so that the symbol Bf indicates that this particular dark blue reflects 20% of standard
white and 40% of the strength of the maximum standard vermilion.
To balance any pair of opposite colors on this chart, such asB| and YR 2 (dark orange) the area of each color should be in-
versely as its chroma, i. e., four parts of YR 2 with one part of Bf.
To balance this dark Bf with its corresponding light YRf (orange), on chart 80 the area of each should be inversely as the
product of its symbol, thus eight parts of the light orange balance forty parts of dark blue.
The suggestions for selecting sequences and groups of color which appear on chart 50, are also applicable here, as indicated in
Chapters III and IV of the hand book, “A Color Notation’
AVOID DUST, HANDLING AND EXPOSURE TO STRONG LIGHT.
CHART

MUNSELL COLOR SYSTEM
ATLAS—OF—
COLOR CHARTS.
Copyright by A. H, MUNSELL. 1907-1915.
Patented June 26. 1906.
CHART 30.DARK VALUE SCALES OF HUE AND CHROMA.
This chart is a horizontal section through the color solid, similar to that of chart 50 except that all its colorsreflect but 30% of the incident light.
Each radius is a scale of chroma, whose steps appear written beneath the line. Thus R-- is the seventh stepof red and reflects 70% of the strength of standard vermilion. Ijts opposite hue,—blue-green, has but four steps of
chroma at this level, and to balance these uneven chromas, the area of the weaker must be seven fourths as great
as that of the stronger color.
Each concentric circle traces hues of equal chroma. A sequence of regularly decreasing chroma may betraced thus:— PB S , RP§, YR4 , GY 2 , N 3
-. The suggestions on chart 50 may be applied to this chart as indicated
in chapters III and IV of a “Color Notation.”
AVOID HANDLING AND EXPOSURE TO DUST.
CHART

a- I;:il5Hul?sUl
jWiaif a ,.r .
HtUfUi.
o « i'5 [*,®
: ;i» & { • a I
1
* 1II* aa Bi »m I
wsasasassj
sn ^1
JHlilSISR » ~ J 11
1
“« a » » aa b * »
«
.
52E2
1.1 1 , ;n 2 a
.
~
5S»p
, !*tti«nnsS*‘-55::?^isSS
iHiMSsj
'
i ,’i!* t•* ZKf 1
;
sgsiffiro SS
:! 3 ;!::!! iisgs iis3
f;;j;:«ss:Sgh f~s:
l| PSii
H|il|m &;«; |pp!
HftS&iiSSSsBsS:!^«K25J£S5S*S"**.5§Si
If 535»;i*.r»#S«»f*?p»su6S£SJmm
MUNSELL COLOR SYSTEMX
ATLAS—OF—
COLOR CHARTS.
Copyright by A. H, MUNSELL. 1907-1915.
Patented June 26. 1906.
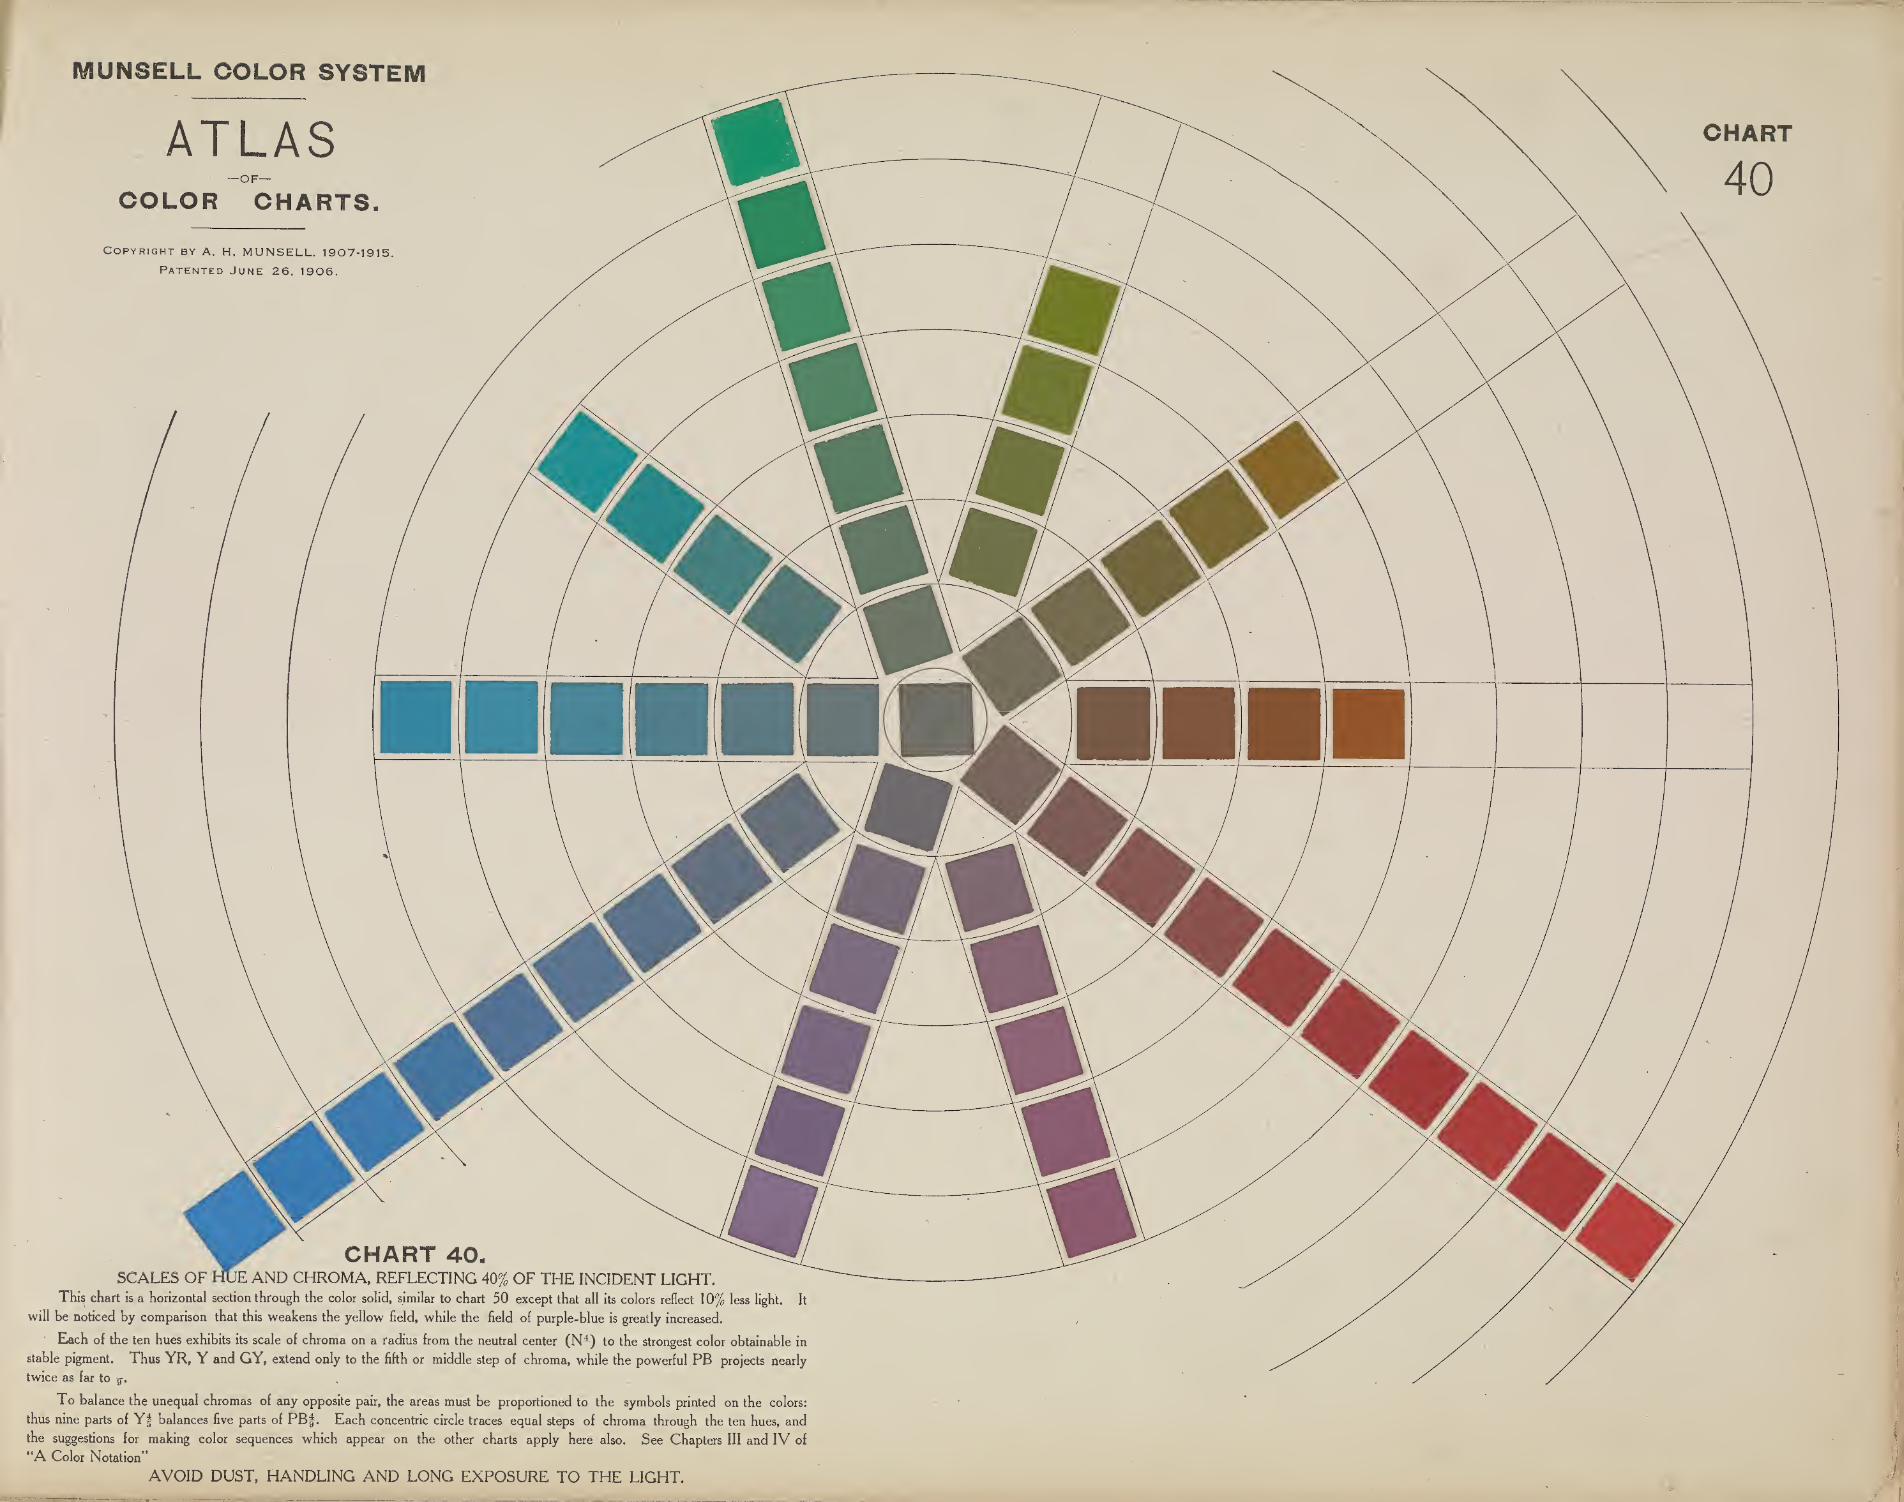
CHART 40.SCALES OF HUE AND CHROMA, REFLECTING 40% OF THE INCIDENT LIGHT.
This chart is a horizontal section through the color solid, similar to chart 50 except that all its colors reflect 1 0% less light. It
will be noticed by comparison that this weakens the yellow field, while the field of purple-blue is greatly increased.
Each of the ten hues exhibits its scale of chroma on a radius from the neutral center (N-) to the strongest color obtainable in
stable pigment. Thus YR, Y and GY, extend only to the fifth or middle step of chroma, while the powerful PB projects nearly
twice as far to q.
To balance the unequal chromas of any opposite pair, the areas must be proportioned to the symbols printed on the colors:
thus nine parts of Yf balances five parts of PBf. Each concentric circle traces equal steps of chroma through the ten hues, and
the suggestions for making color sequences which appear on the other charts apply here also. See Chapters 111 and IV of
“A Color Notation”
AVOID DUST, HANDLING AND LONG EXPOSURE TO THE LIGHT.
CHART

MUNSELL COLOR SYSTEM
ATLAS—OF—
COLOR CHARTS.
Copyright by A. H, MUNSELL. 1907-1915.
Patented June 26. 1906.
CHART SOMIDDLE VALUE SCALES OF HUE AND CHROMA
This Chart is a horizontal section through the center of the Color Solid, classifying all colors
of MIDDLE VALUE by measured scales, of HUE and CHROMA.Each radius is a SCALE OF CHROMA starting from the neutral center -N5 . It traces a'
regular increase in the chroma of its pigment hue, and bears appropriate symbols. Thus Rf.
indicates that the red upon which it is placed reflects 50% of standard white and 90% of the strength
of standard vermilion.
Each circle struck from the neutral center is a SCALE OF HUE. It is a circuit of ten
measured hues, equal in value and chroma. This equality appears in their symbols, — Rf. YRf
.
Yf. GYf. G|. BGf. Bf. PBf. Pf and RPf. which is a balanced circle of hues reflecting 50%of standard white and 50% of the chroma of standard vermilion.
A BALANCE of opposite hues which complement and enhance one another, is obtained byequal areas of equal chroma : such as BGf. and Rf—or by compensating areas of unequal chroma,
such as nine parts of BGf. with five parts of Rf.A SEQUENCE of successive hues combined with increasing chroma in equal additions is
traced thus: By G4 . R 8 . or the differences may be doubled thus: Py. Gy. Rg. In short,
the qualitative and quantitative construction of this chart by measured intervals, insures an orderly
succession of colors, and any selection,—regular or irregular,—is at once evident in the written
symbols. See Chapters III and VI of “A COLOR NOTATION,” by the author, whichdescribes the nature and use of these charts.
AVOID HANDLING and EXPOSURE TO LIGHT or DUST.
CHART
50
MUNSELL COLOR SYSTEM
V V
ATLASCOLOR CHARTS
CHART
60Copyright by a. H, MUNSELL. 1907-1915
Patented June 26, 1906.
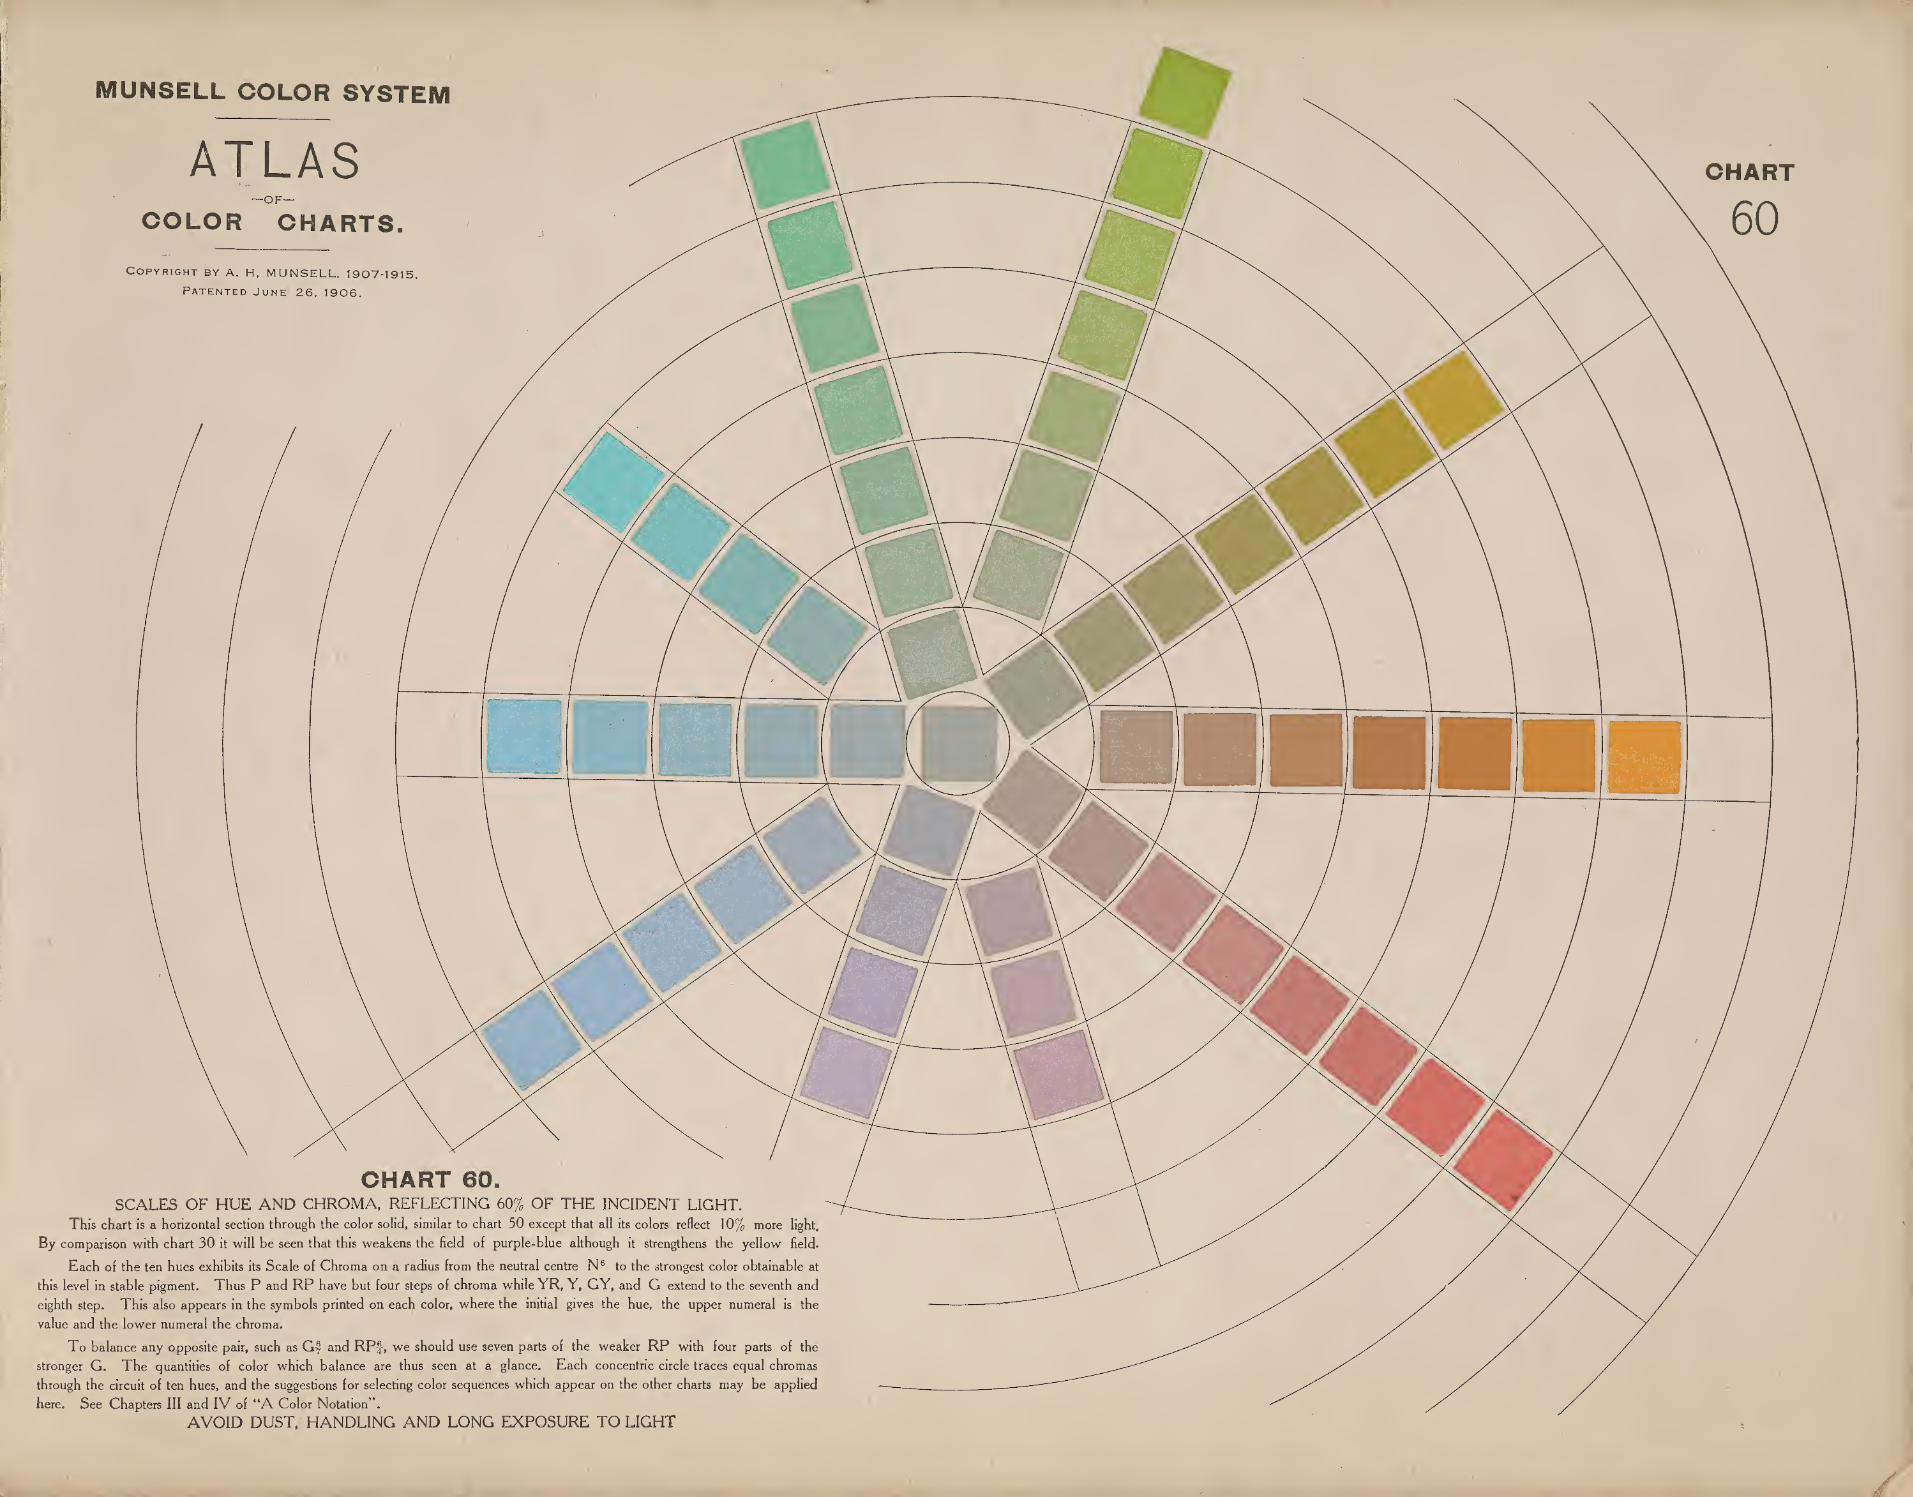
CHART 60.SCALES OF HUE AND CHROMA, REFLECTING 60% OF THE INCIDENT LIGHT.
This chart is a horizontal section through the color solid, similar to chart 50 except that all its colors reflect 1 0% more light.
By comparison with chart 30 it will be seen that this weakens the field of purple-blue although it strengthens the yellow field.
Each of the ten hues exhibits its Scale of Chroma on a radius from the neutral centre N 6 to the strongest color obtainable at
this level in stable pigment. Thus P and RP have but four steps of chroma while YR, Y, GY, and G extend to the seventh and
eighth step. This also appears in the symbols printed on each color, where the initial gives the hue, the upper numeral is the
value and the lower numeral the chroma.
To balance any opposite pair, such as Gf and RPf, we should use seven parts of the weaker RP with four parts of the
stronger G. The quantities of color which balance are thus seen at a glance. Each concentric circle traces equal chromas
through the circuit of ten hues, and the suggestions for selecting color sequences which appear on the other charts may be applied
here. See Chapters III and IV of “A Color Notation”.
AVOID DUST, HANDLING AND LONG EXPOSURE TO LIGHT
/

MUNSELL COLOR SYSTEM
ATLAS-OF-
COLOR CHARTS
Copyright by A. H, MUNSELL. 1907-1915
Patented June 26. 1906.
1 / / / \
\ /
\ /
CHART 70LIGHT VALUE SCALES OF HUE AND CHROMA.
This chart is a horizontal section through the color solid, similar to that of chart 50
of its colors reflect 70% of the incident light.
Each radius is A SCALE OF CHROMA starting from the neutral center N-. It traces a regular increase
of strength in its pigment hue, and each step bears an appropriate symbol. Thus Ry indicates that the
red upon which it is placed reflects seven-tenths of standard white and six-tenths of standard vermilion.
Its opposite or complement, blue-green (BGf) is slightly weaker at this level, as appears in the numeral 5
written below the line, and to balance this pair, six parts of blue green should be used with five parts of the red.
Each concentric circle traces hues of uniform chroma, the two inner circles being complete with ten
STEPS OF HUE, which are written RJ, YRJ, Y|, GYf, G|, BG% B% PBJ, Pf, RP|, showing that
both value and chroma are equal.
The third circle is incomplete for want of a purple-blue. In the fourth circle its neighbor purple is
also missing. The fifth circle has no representatives from blue-green to red : in the sixth blue-green dis-
appears : the seventh only presents green, yellow-green, yellow and yellow-red, while the eighth circle is
represented by yellow alone.
These radii describe the unequal strength of pigments at this level of the color solid and should be
contrasted with chart 30 where the relations of strength and weakness are reversed.
For a study of balances and sequences on this chart see Chapters III and IV of “A Color Nota-
tion” by the author.
AVOID HANDLING AND EXPOSURE TO DUST.


MUNSELL COLOR SYSTEM
ATLASCOLOR CHARTS.
Copyright by A. H, MUNSELL. 1907-1915
Patented June 26, 1906.
CHART 80.LIGHT SCALES OF HUE AND CHROMA, REFLECTING 80% OF THE INCIDENT LIGHT.
This chart is a horizontal section through the color solid, similar to chart 50 except that the relative chromas change as their
hues approximate to white.
Each radius from the neutral center, N-, is a scale of chroma for its hue and displays the strength obtainable in stable pig-
ment at this level. Each step in the scale bears its appropriate symbol by which the color is known and written. For simplicity
the chroma scale is given ten equal and measured steps, so that the symbol Yf shows that this strong yellow reflects 80% of the
incident light and 90% of the strength of the maximum standard vermilion.
To balance any pair of opposite colors on this chart, such as Bf and YRf (light orange), the area of each color should be
inversely as its chroma, i. e., two parts of YRf with five parts of B
To balance Yf which is very light and chromatic, with its dark complement PBf on chart 20 which is of weak chroma, re-
quires that the area of each be inversely as the product of its symbol, thus four parts of the powerful yellow balance seventy-two
parts of the dark blue.
The suggestions for selecting sequences and groups of color which appear on chart 50, are also applicable here, as indicated ir,«
Chapters III and IV of the handbook “A Color Notation.”
AVOID DUST. HANDLING AND EXPOSURE TO STRONG LIGHT.

A

iiisiiKss.
'
:a ! 8t:SiS
jjfejK
j
IS "E; ;
’s!
fee .«
I:"’:. >
mp.
;1
&)«!«»
• t >•1 1 »
i
ipj
r'
: -v % ’
itmatnaiiaii
fi < •»** iin,
as


fNDl492.M96a c.2 MSC
Munsell, Albert HenryAtlas of the Munsell ColorSystem.
DATE OUt ISSUED TO

Copyright © 2022 FDOKUMEN