Athermal concentration by osmotic evaporation of roselle extract, apple and grape juices and impact...
10
This article appeared in a journal published by Elsevier. The attached copy is furnished to the author for internal non-commercial research and education use, including for instruction at the authors institution and sharing with colleagues. Other uses, including reproduction and distribution, or selling or licensing copies, or posting to personal, institutional or third party websites are prohibited. In most cases authors are permitted to post their version of the article (e.g. in Word or Tex form) to their personal website or institutional repository. Authors requiring further information regarding Elsevier’s archiving and manuscript policies are encouraged to visit: http://www.elsevier.com/copyright
Transcript of Athermal concentration by osmotic evaporation of roselle extract, apple and grape juices and impact...

This article appeared in a journal published by Elsevier. The attachedcopy is furnished to the author for internal non-commercial researchand education use, including for instruction at the authors institution
and sharing with colleagues.
Other uses, including reproduction and distribution, or selling orlicensing copies, or posting to personal, institutional or third party
websites are prohibited.
In most cases authors are permitted to post their version of thearticle (e.g. in Word or Tex form) to their personal website orinstitutional repository. Authors requiring further information
regarding Elsevier’s archiving and manuscript policies areencouraged to visit:
http://www.elsevier.com/copyright

Author's personal copy
Athermal concentration by osmotic evaporation of roselle extract, apple and grapejuices and impact on quality
Mady Cissé a, Fabrice Vaillant b,c, Sonia Bouquet c, Dominique Pallet c, Florence Lutin d,Max Reynes c, Manuel Dornier c,⁎a Ecole Supérieure Polytechnique, Université Cheikh Anta Diop, B.P. 5085, Dakar Fann, Sénégalb Centro de Investigación de Tecnología de Alimentos, Universidad de Costa Rica, Codigo Postal 2060, San José, Costa Ricac CIRAD, Montpellier SupAgro, UMR Qualisud, 73 rue J.F. Breton, TA B-95/16, F-34398 Montpellier cedex 5, Franced EURODIA Industries S.A., 7 rue du Jura, BP. 30527 Wissous, F-94633 Rungis cedex, France
a b s t r a c ta r t i c l e i n f o
Article history:Received 21 January 2011Accepted 21 February 2011
Keywords:Osmotic evaporationConcentrationMembrane contactorHibiscus sabdariffaGrape juiceApple juiceProduct quality
Osmotic evaporation (or osmotic distillation) was carried out on roselle extract, apple and grape juices. Theindustrial pilot plant used had a hydrophobic, polypropylene, hollow-fiber membrane with an area of 10.2 m2
and an average pore diameter of 0.2 μm. It was suitable for concentrating vegetable extracts and fruit juices,and controlled various parameters such as temperature, flow velocity, and brine concentration. The final totalsoluble solids (TSS) contents achieved were 660, 570, and 610 g kg−1 for grape juice, apple juice, and roselleextract, respectively. Temperature and concentration of solutions significantly influenced evaporation flux,which, for roselle extract, was 1.5 kg h−1 m−2 at 610 g TSS kg−1 and 45 °C. The physico-chemical,biochemical, and aromatic qualities of concentrates obtained by osmotic evaporation were much higherthan those of thermal concentrates, and close to those of the initial products.Industrial relevance: Membrane processes are increasingly used to concentrate thermo-sensitive fruit juicesand plant extracts. Their capacity to operate at moderate temperatures and pressures means that their energyconsumption is low, while they produce good quality concentrates. Nonetheless, the main disadvantage ofbaromembrane processes is their inability to reach the concentration levels standard for products of thermalevaporation because of limitations resulting from high osmotic pressure. Actually, reverse osmosismembranes and equipment limit the final concentration of fruit juices to about 25–35°Brix. Osmoticevaporation has attracted considerable interest, as it can concentrate juices to as much as 65°Brix. Thisprocess, when applied to various juices, better preserves the quality of rawmaterials. However, because of thegeometrical limitations of commercially available membranes and modules, juices must first be clarified. Toour knowledge, only a few studies on osmotic evaporation have so far been conducted at a semi-industrialscale and never with roselle extracts.
© 2011 Elsevier Ltd. All rights reserved.
1. Introduction
The preservation, during stabilization, of nutritional, sensorial,antioxidant, and pharmaceutical properties of fruit juices and plantextracts has become a major challenge in food science. Classicalprocesses, such as thermal pasteurization and concentration byvacuum evaporation, significantly change the quality of fresh fruitjuices and plant extracts. Temperatures higher than 50 °C degradesensorial properties and nutritional compounds such as vitamins, andinduce a loss of aroma compounds, leading to a partial loss of the freshjuice flavor (Cisse, Vaillant, Perez, Dornier, & Reynes, 2005; Shawet al., 2001; Vaillant et al., 2001).
Research on technological alternatives to thermal processing hasbecome an important issue. Membrane processes such as ultrafiltra-tion, nanofiltration, reverse osmosis, and osmotic evaporation aretoday increasingly used to concentrate fruit juices and plant extracts.Their capacity to operate at moderate temperatures and pressuresmeans that their energy consumption is low, while they produce goodquality concentrates (Banvolgyi, Horvath, Stefanovits-Banyai,Bekassy-Molnar, & Vatai, 2009; Cassano, Jiao, & Drioli, 2004; Ding,Liu, Yu, Ma, & Yang, 2008; Hongvaleerat, Cabral, Dornier, Reynes, &Ningsanond, 2008). Nonetheless, the main disadvantage of baromem-brane processes is their inability to reach the concentration levelsstandard for products of thermal evaporation because of limitationsresulting from high osmotic pressure. Actually, reverse osmosismembranes and equipment limit the final concentration of fruit juicesto about 25–35°Brix (Banvolgyi et al., 2009; Rodrigues et al., 2004).
Osmotic evaporation (OE), also called osmotic distillation, hasattracted considerable interest (Girard & Fukumoto, 2000; Hogan,
Innovative Food Science and Emerging Technologies 12 (2011) 352–360
⁎ Corresponding author. Tel.: +33 467617186; fax: +33 467614449.E-mail address: [email protected] (M. Dornier).
1466-8564/$ – see front matter © 2011 Elsevier Ltd. All rights reserved.doi:10.1016/j.ifset.2011.02.009
Contents lists available at ScienceDirect
Innovative Food Science and Emerging Technologies
j ourna l homepage: www.e lsev ie r.com/ locate / i fset
Author's personal copy
Canning, Peterson, Johnson, & Michaels, 1998; Jiao, Cassano, & Drioli,2004), as it can concentrate juices to as much as 650 g total solublesolids (TSS) per kilogram (Cisse et al., 2005; Rodrigues et al., 2004;Vaillant et al., 2001). This process, when applied to various juices,better preserves the quality of raw materials (Cisse et al., 2005;Hongvaleerat et al., 2008; Vaillant et al., 2005). However, because ofthe geometrical limitations of commercially available membranes andmodules, juices must first be clarified. To our knowledge, only a fewstudies on osmotic evaporation have so far been conducted at a semi-industrial scale (Cisse et al., 2005; Vaillant et al., 2001; Vaillant et al.,2005) and never with roselle extracts.
Roselle (Hibiscus sabdariffa L.) is a herbaceous plant cultivatedlargely in the tropics and subtropics of both hemispheres (Cisse,Dornier, Sakho, Ndiaye, Reynes & Sock, 2009). Belonging to theMalvaceae family, H. sabdariffa is known under different names, suchas bissap in Senegal, karkade in North Africa, roselle or sorrel in English,and flor de Jamaica in Central and SouthAmerica. Aqueous extract fromcalyces of H. sabdariffa presents several interesting features. It is usedworldwide to produce drinks and is a source of natural food coloringbecause of its high anthocyanin content (Cisse, Dornier, et al., 2009;Juliani et al., 2009). Hibiscus extracts are reported as having medicalproperties such as decreasing serum cholesterol in humans andanimals (Hirunpanich et al., 2006; Lin et al., 2007), protecting the liveragainst oxidation stress (Liu et al., 2006), having antihypertensive andcardioprotective effects (Odigie, Ettarh, & Adigun, 2003), andattenuating nephropathy in diabetes (Lee et al., 2009). Mostnutritional and functional properties of Roselle extracts can beattributed to its very high content of anthocyanin acting probably insynergy with other compounds. The main problem, during thermalprocessing of Roselle, is that high temperatures drastically degradeanthocyanins and also reduce their stability during storage (Cisse,Vaillant, et al., 2009).
This paper evaluates the potential of using osmotic evaporation toconcentrate roselle extract, apple and grape juices. The process isevaluated in terms of performance and impact on product quality andcompared with vacuum evaporation.
2. Materials and methods
2.1. Raw materials
To prepare roselle extract, dried calyces of Senegalese-grown Thaivariety were mixed with cooled demineralized water at a mass ratioof calyces to water at 1:5. After soaking for 3 h, the extract wasfiltered, first through a stainless steel sieve (1 mm) and then through
a polyester bag-filter system with a micron rating of 5 μm (GAF,Belgium). The extract was then stored at 4 °C until used. Industrialpasteurized apple and grape juices were purchased. Both juices werecompletely clear and were probably clarified. In accordance with theEuropean legislation, these juices only contained the aroma com-pounds of the fruits.
2.2. Concentration
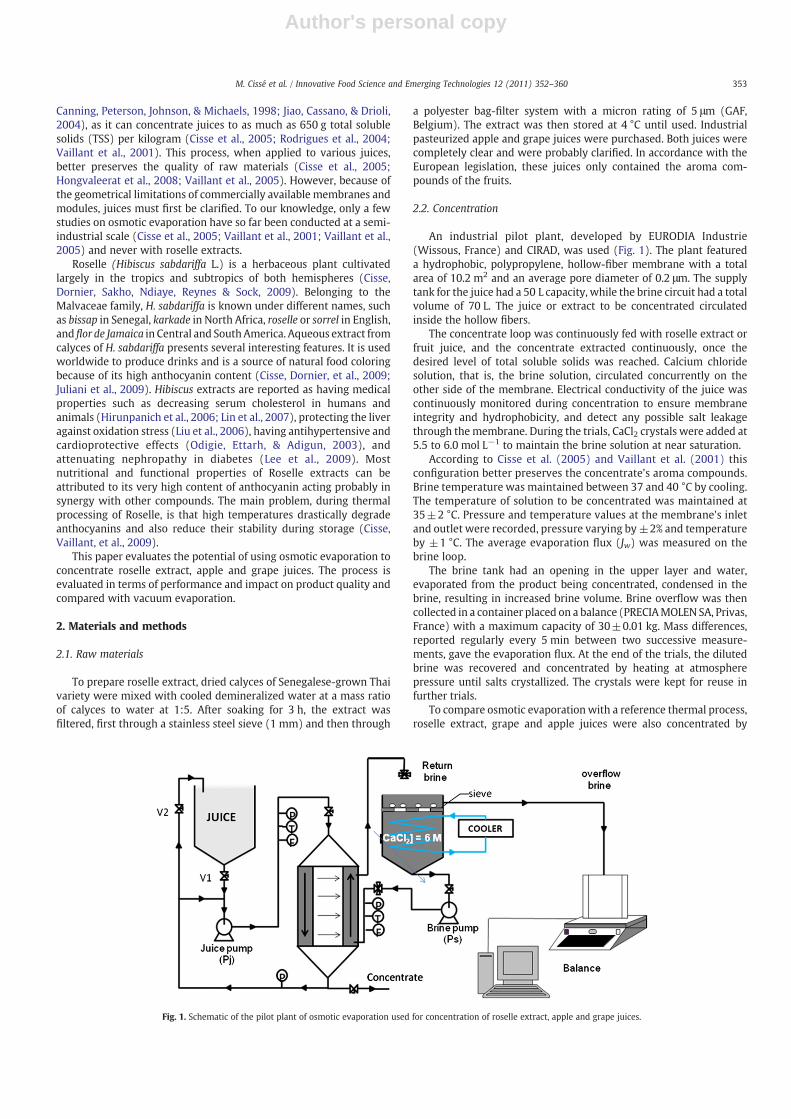
An industrial pilot plant, developed by EURODIA Industrie(Wissous, France) and CIRAD, was used (Fig. 1). The plant featureda hydrophobic, polypropylene, hollow-fiber membrane with a totalarea of 10.2 m2 and an average pore diameter of 0.2 μm. The supplytank for the juice had a 50 L capacity, while the brine circuit had a totalvolume of 70 L. The juice or extract to be concentrated circulatedinside the hollow fibers.
The concentrate loop was continuously fed with roselle extract orfruit juice, and the concentrate extracted continuously, once thedesired level of total soluble solids was reached. Calcium chloridesolution, that is, the brine solution, circulated concurrently on theother side of the membrane. Electrical conductivity of the juice wascontinuously monitored during concentration to ensure membraneintegrity and hydrophobicity, and detect any possible salt leakagethrough the membrane. During the trials, CaCl2 crystals were added at5.5 to 6.0 mol L−1 to maintain the brine solution at near saturation.
According to Cisse et al. (2005) and Vaillant et al. (2001) thisconfiguration better preserves the concentrate's aroma compounds.Brine temperature was maintained between 37 and 40 °C by cooling.The temperature of solution to be concentrated was maintained at35±2 °C. Pressure and temperature values at the membrane's inletand outlet were recorded, pressure varying by±2% and temperatureby ±1 °C. The average evaporation flux (Jw) was measured on thebrine loop.
The brine tank had an opening in the upper layer and water,evaporated from the product being concentrated, condensed in thebrine, resulting in increased brine volume. Brine overflow was thencollected in a container placed on a balance (PRECIAMOLEN SA, Privas,France) with a maximum capacity of 30±0.01 kg. Mass differences,reported regularly every 5 min between two successive measure-ments, gave the evaporation flux. At the end of the trials, the dilutedbrine was recovered and concentrated by heating at atmospherepressure until salts crystallized. The crystals were kept for reuse infurther trials.
To compare osmotic evaporationwith a reference thermal process,roselle extract, grape and apple juices were also concentrated by
Fig. 1. Schematic of the pilot plant of osmotic evaporation used for concentration of roselle extract, apple and grape juices.
353M. Cissé et al. / Innovative Food Science and Emerging Technologies 12 (2011) 352–360

Author's personal copy
evaporation at 80 °C under a 50-kPa vacuum, using a vacuumevaporator with a 10-L capacity and equipped with a stirrer (H.P.Auriol, Marmande, France). This apparatus allows to simulate theoperating conditions in the first effect of a classical industrial vacuum-evaporator without aroma recovery system.
2.3. Analyses
All extracts and juiceswere analyzed for pH, density, and drymatter,using standard methods (AOAC. 1990). Total soluble solid (TSS)contents were measured, using a digital PAL-3 refractometer (AtagoCo., Japan) with automatic temperature compensation. Total titratableacidity was determined with a TitroLine easy tritator (SCHOTTInstruments, Mainz, Germany), using 0.1 N NaOH. Vitamin C (ascorbicacid and dehydroascorbic acid) was assessed by a high-performanceliquid chromatography, as according to Dhuique-Mayer et al. (2007)and using a 1100 HPLC System (Agilent Technologies, Massy, France).
Sucrose, fructose, and glucose were determined, using Dionex DX-600 high-performance liquid chromatography, fitted with a Carbo-Pac® MA1 column. The eluant was sodium hydroxide solution at aconcentration of 0.6 mol L−1 and flow rate of 0.4 mL min−1. Afterseparation, sugars were detected, using a Dionex ED50 pulsedamperometric detector. The total sugar content corresponded to thesum of the contents of the different carbohydrate compoundsdetected in the kernel. Before analysis, fruit juices and roselle extractswere diluted and filtered through 0.45-μm filters.
Total anthocyanin content was assessed with the pH differentialmethod (Lee, Durst, & Wrolstad, 2005). All absorbance readings weremade against distilled water, which acted as control. Spectrophoto-metric measurements were carried out, using UV-1605 spectro-photometers (Shimadzu, Kyoto, Japan). Concentrations wereexpressed as delphinidin 3-xylosylglucoside equivalents for roselle(MW=577 g mol−1). The molar extinction coefficient at pH 1 and510 nm, used for calculation, was 26,000 L mol−1 cm−1 (Cisse,Vaillant, et al., 2009). All the reagents used were of analytical gradeand were purchased from Sigma (l'Isle d'Abeau, France). The totalphenolic content was determined with Folin–Ciocalteu reagent,according to the method optimized by George, Brat, Alter, & Amiot(2005).
Viscosity was measured at 35 °C, using a HAAKE VT550 viscometer(Thermo, Berlin, Germany), fitted with a coaxial cylinder sensor(sensor system NV). Water activity was measured with an AquaLab4TEwater activitymeter (Decagon Devices, Inc., Pullman,WA, USA) at35 °C. Alcohol insoluble solids (AIS) such as pectins were determinedby dispersing a previously weighed homogenous aliquot of retentateinto boiling ethanol (80 vol.%) (Vaillant et al., 1999).
Oxygen radical absorbance capacity (ORAC) assay was performed inaccordance with Ou, Hampsch-Woodill, & Prior (2001), using amicroplate spectrofluorimeter with 96-well plates made in blackpolypropylene (Gancel, Alter, Dhuique-Mayer, Ruales, & Vaillant,2008). The ORAC value was expressed as Trolox equivalents (μmol g−1
FW).
2.4. Headspace solid-phase microextraction (HS-SPME) of free volatiles
Juice and extract samples were analyzed with an Agilent 6890Ngas chromatograph, which was equipped with a mass spectrometerAgilent MSD 5973N as detector. Free volatiles were adsorbed on SPMEfiber (polydimethylsiloxane-divinylbenzene, i.e., PDMS-DVB; 65 μm)and desorbed in splitless mode for 3 min in the GC injector at 250 °C.Separation was achieved in a J&W DB-WAX 122-7032 column (30 m,0.25 mm inner diameter, 0.25-μm film thickness, fused-silica liner;Agilent Technologies, Palo Alto, CA, USA). The GC oven temperatureprogram consisted of 40 °C for 3 min, 40 to 170 °C at 3 °C min−1, 170to 240 °C for 10 °C min−1, and 240 °C for 10 min. Heliumwas used as a
carrier gas, with a constant column flow rate of 1 mL min−1. Thetransfer line temperature was kept at 280 °C.
The mass spectrometer used to identify headspace compoundsoperated in electron ionization mode (internal ionization at 70 eV)with a scan range fromm/z 40 to 400. Compound identifications wereperformed, using either NIST (2002 version) or theWiley 275 spectrallibrary. The spectra data from authentic compounds plus the linearretention index were compared with those found in the literature.Linear retention indices (type Kovats) were calculated after analysis,under the same chromatographic conditions, of the C8-C20 n-alkaneseries (Supelco, Inc., Bellefonte, PA, USA) according to (Drosos, Viola-Rhenals, & Vivas-Reyes, 2010). Another internal standard forquantification was 4-methyl-1-pentanol from Sigma (Steinheim,Germany).
The quantitative assay was performed by comparing the area ofanalyte peaks with that of the internal standard. Losses of aromacompounds and aromatic distance (AD), expressed in arbitrary units,were evaluated, using Eqs. 1 and 2.
% losses =Af−Ai
� �Ai
� 100 ð1Þ
AD =
ffiffiffiffiffiffiffiffiffiffiffiffiffiffiffiffiffiffiffiffiffiffiffiffiffiffiffiffiffiffiffiffi∑ Ai−Af
� �2r
ð2Þ
Where, Ai and Af are, respectively, the area of aroma compoundsbefore and after osmotic evaporation (or vacuum evaporation), andAD is the distance from the initial product in an aromatic space of ndimensions.
2.5. Statistical analyses
All statistical analyses were performed using XLSTAT software(Microsoft Corp.).
3. Results and discussion
3.1. Evaporation fluxes
Table 1 lists the average operating conditions during the osmoticevaporation, on a semi-industrial scale, of water, sucrose solutions at100 g TSS kg−1, roselle extracts, apple juice, and grape extract. Alsoshown are the resulting final concentrations achieved (TSSf) and theaverage evaporation fluxes. The equipment developed enabledaccurate control of all operating conditions and, consequently, whenreplicates of the trial were done, a very high reproducibility of finalresults was achieved, even for different products.
Because of pilot configuration, brine temperature was maintainedat least 2 °C above the temperature of the solution being concentrated.For all trials, the average evaporation flux ranged between 1.13 and1.48 kg h−1 m−2 and appeared to depend only on the juice concen-tration and temperature of the solution to be concentrated.
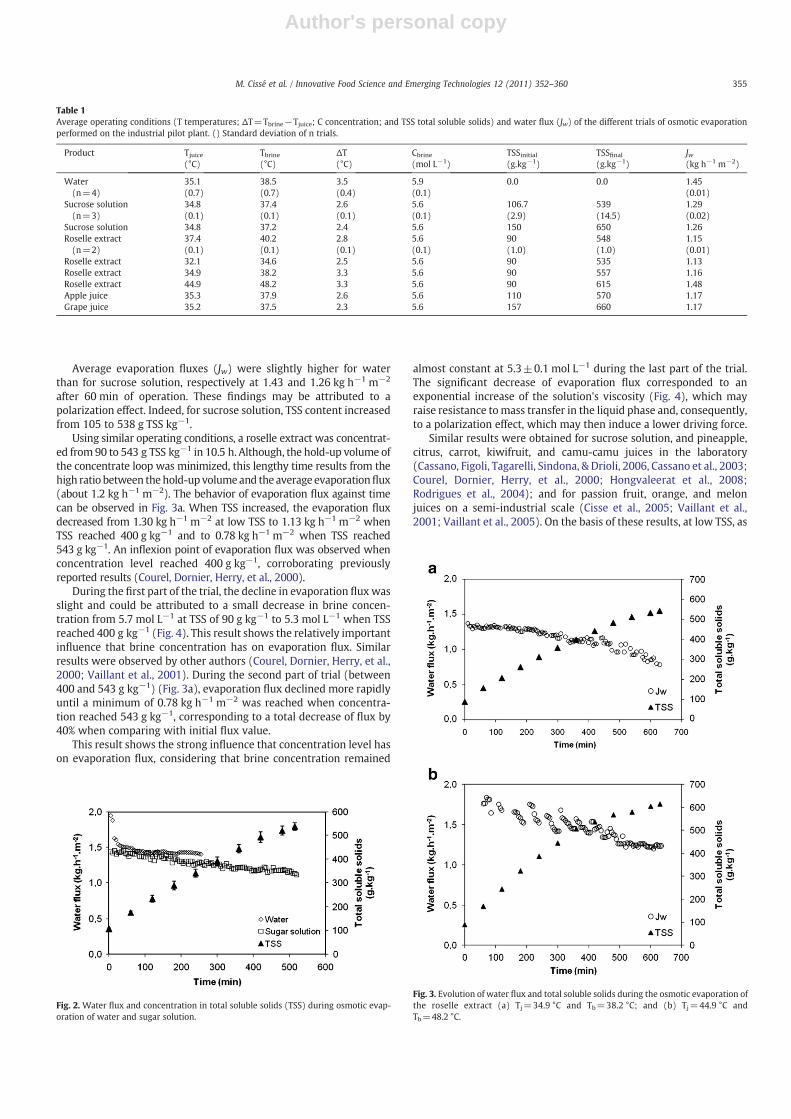
The first set of experiments was carried at 35±2 °C with demin-eralized water and sucrose solution at 100 g TSS kg−1 to assess theevaporation performance of the pilot plant. Fig. 2 presents theevaporation fluxes obtained for both water (fluctuating between1.40 and 1.50 kg h−1 m−2) and sugar solution (between 1.11 and1.41 kg h−1 m−2), as measured against time. These evaporationfluxes are, on average, seven times smaller than those obtained byCourel, Dornier, Herry, Rios, and Reynes (2000), who studied osmoticevaporation in the laboratory, using flat, thin, porous membranes ofpolytetrafluoroethylene. However, they were 50 to 100% higher thanthe results of other trials, where the same module and membraneswere used (Ali, Dornier, Duquenoy, & Reynes 2003; Cisse et al.,2005).
354 M. Cissé et al. / Innovative Food Science and Emerging Technologies 12 (2011) 352–360
Author's personal copy
Average evaporation fluxes (Jw) were slightly higher for waterthan for sucrose solution, respectively at 1.43 and 1.26 kg h−1 m−2
after 60 min of operation. These findings may be attributed to apolarization effect. Indeed, for sucrose solution, TSS content increasedfrom 105 to 538 g TSS kg−1.
Using similar operating conditions, a roselle extract was concentrat-ed from 90 to 543 g TSS kg−1 in 10.5 h. Although, the hold-up volume ofthe concentrate loop was minimized, this lengthy time results from thehigh ratio between thehold-up volumeand the average evaporationflux(about 1.2 kg h−1 m−2). The behavior of evaporation flux against timecan be observed in Fig. 3a. When TSS increased, the evaporation fluxdecreased from 1.30 kg h−1 m−2 at low TSS to 1.13 kg h−1 m−2 whenTSS reached 400 g kg−1 and to 0.78 kg h−1 m−2 when TSS reached543 g kg−1. An inflexion point of evaporation flux was observed whenconcentration level reached 400 g kg−1, corroborating previouslyreported results (Courel, Dornier, Herry, et al., 2000).
During the first part of the trial, the decline in evaporation fluxwasslight and could be attributed to a small decrease in brine concen-tration from 5.7 mol L−1 at TSS of 90 g kg−1 to 5.3 mol L−1 when TSSreached 400 g kg−1 (Fig. 4). This result shows the relatively importantinfluence that brine concentration has on evaporation flux. Similarresults were observed by other authors (Courel, Dornier, Herry, et al.,2000; Vaillant et al., 2001). During the second part of trial (between400 and 543 g kg−1) (Fig. 3a), evaporation flux declined more rapidlyuntil a minimum of 0.78 kg h−1 m−2 was reached when concentra-tion reached 543 g kg−1, corresponding to a total decrease of flux by40% when comparing with initial flux value.
This result shows the strong influence that concentration level hason evaporation flux, considering that brine concentration remained
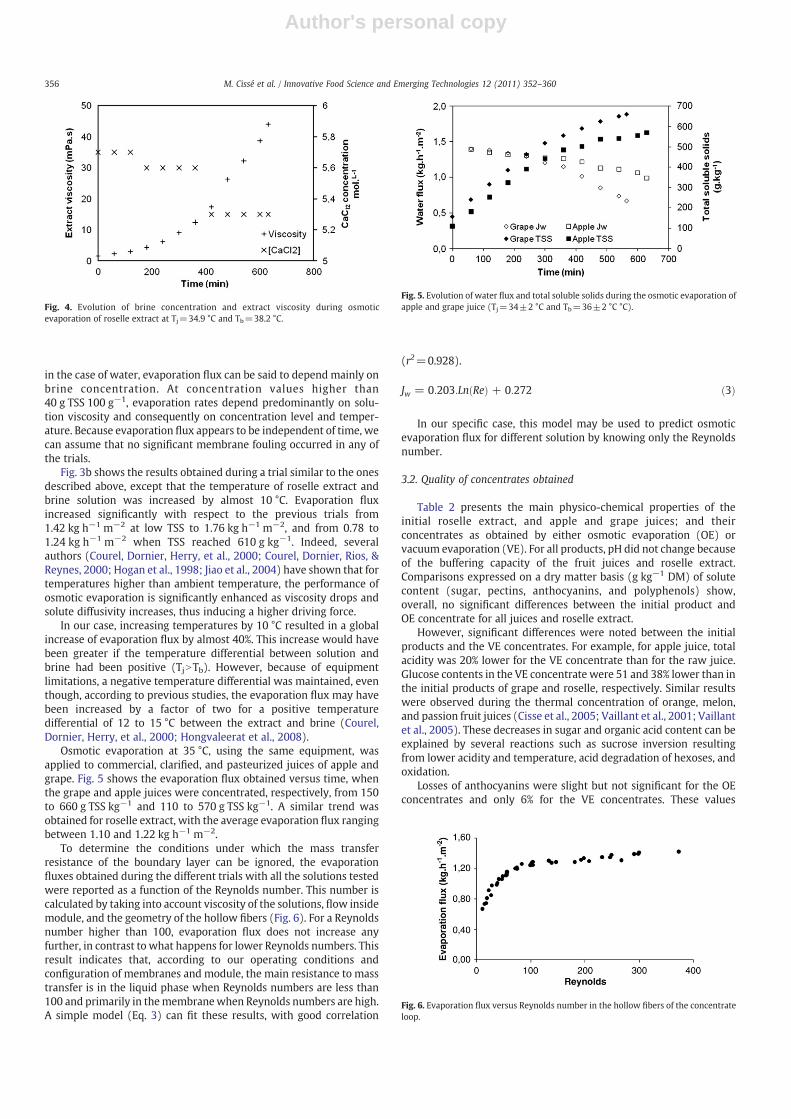
almost constant at 5.3±0.1 mol L−1 during the last part of the trial.The significant decrease of evaporation flux corresponded to anexponential increase of the solution's viscosity (Fig. 4), which mayraise resistance tomass transfer in the liquid phase and, consequently,to a polarization effect, which may then induce a lower driving force.
Similar results were obtained for sucrose solution, and pineapple,citrus, carrot, kiwifruit, and camu-camu juices in the laboratory(Cassano, Figoli, Tagarelli, Sindona, & Drioli, 2006, Cassano et al., 2003;Courel, Dornier, Herry, et al., 2000; Hongvaleerat et al., 2008;Rodrigues et al., 2004); and for passion fruit, orange, and melonjuices on a semi-industrial scale (Cisse et al., 2005; Vaillant et al.,2001; Vaillant et al., 2005). On the basis of these results, at low TSS, as
Table 1Average operating conditions (T temperatures; ΔT=Tbrine−Tjuice; C concentration; and TSS total soluble solids) and water flux (Jw) of the different trials of osmotic evaporationperformed on the industrial pilot plant. () Standard deviation of n trials.
Product Tjuice(°C)
Tbrine(°C)
ΔT(°C)
Cbrine
(mol L−1)TSSinitial(g.kg−1)
TSSfinal(g.kg−1)
Jw(kg h−1 m−2)
Water(n=4)
35.1(0.7)
38.5(0.7)
3.5(0.4)
5.9(0.1)
0.0 0.0 1.45(0.01)
Sucrose solution(n=3)
34.8(0.1)
37.4(0.1)
2.6(0.1)
5.6(0.1)
106.7(2.9)
539(14.5)
1.29(0.02)
Sucrose solution 34.8 37.2 2.4 5.6 150 650 1.26Roselle extract(n=2)
37.4(0.1)
40.2(0.1)
2.8(0.1)
5.6(0.1)
90(1.0)
548(1.0)
1.15(0.01)
Roselle extract 32.1 34.6 2.5 5.6 90 535 1.13Roselle extract 34.9 38.2 3.3 5.6 90 557 1.16Roselle extract 44.9 48.2 3.3 5.6 90 615 1.48Apple juice 35.3 37.9 2.6 5.6 110 570 1.17Grape juice 35.2 37.5 2.3 5.6 157 660 1.17
Fig. 2. Water flux and concentration in total soluble solids (TSS) during osmotic evap-oration of water and sugar solution.
Fig. 3. Evolution of water flux and total soluble solids during the osmotic evaporation ofthe roselle extract (a) Tj=34.9 °C and Tb=38.2 °C; and (b) Tj=44.9 °C andTb=48.2 °C.
355M. Cissé et al. / Innovative Food Science and Emerging Technologies 12 (2011) 352–360
Author's personal copy
in the case of water, evaporation flux can be said to depend mainly onbrine concentration. At concentration values higher than40 g TSS 100 g−1, evaporation rates depend predominantly on solu-tion viscosity and consequently on concentration level and temper-ature. Because evaporation flux appears to be independent of time, wecan assume that no significant membrane fouling occurred in any ofthe trials.
Fig. 3b shows the results obtained during a trial similar to the onesdescribed above, except that the temperature of roselle extract andbrine solution was increased by almost 10 °C. Evaporation fluxincreased significantly with respect to the previous trials from1.42 kg h−1 m−2 at low TSS to 1.76 kg h−1 m−2, and from 0.78 to1.24 kg h−1 m−2 when TSS reached 610 g kg−1. Indeed, severalauthors (Courel, Dornier, Herry, et al., 2000; Courel, Dornier, Rios, &Reynes, 2000; Hogan et al., 1998; Jiao et al., 2004) have shown that fortemperatures higher than ambient temperature, the performance ofosmotic evaporation is significantly enhanced as viscosity drops andsolute diffusivity increases, thus inducing a higher driving force.
In our case, increasing temperatures by 10 °C resulted in a globalincrease of evaporation flux by almost 40%. This increase would havebeen greater if the temperature differential between solution andbrine had been positive (TjNTb). However, because of equipmentlimitations, a negative temperature differential was maintained, eventhough, according to previous studies, the evaporation flux may havebeen increased by a factor of two for a positive temperaturedifferential of 12 to 15 °C between the extract and brine (Courel,Dornier, Herry, et al., 2000; Hongvaleerat et al., 2008).
Osmotic evaporation at 35 °C, using the same equipment, wasapplied to commercial, clarified, and pasteurized juices of apple andgrape. Fig. 5 shows the evaporation flux obtained versus time, whenthe grape and apple juices were concentrated, respectively, from 150to 660 g TSS kg−1 and 110 to 570 g TSS kg−1. A similar trend wasobtained for roselle extract, with the average evaporation flux rangingbetween 1.10 and 1.22 kg h−1 m−2.
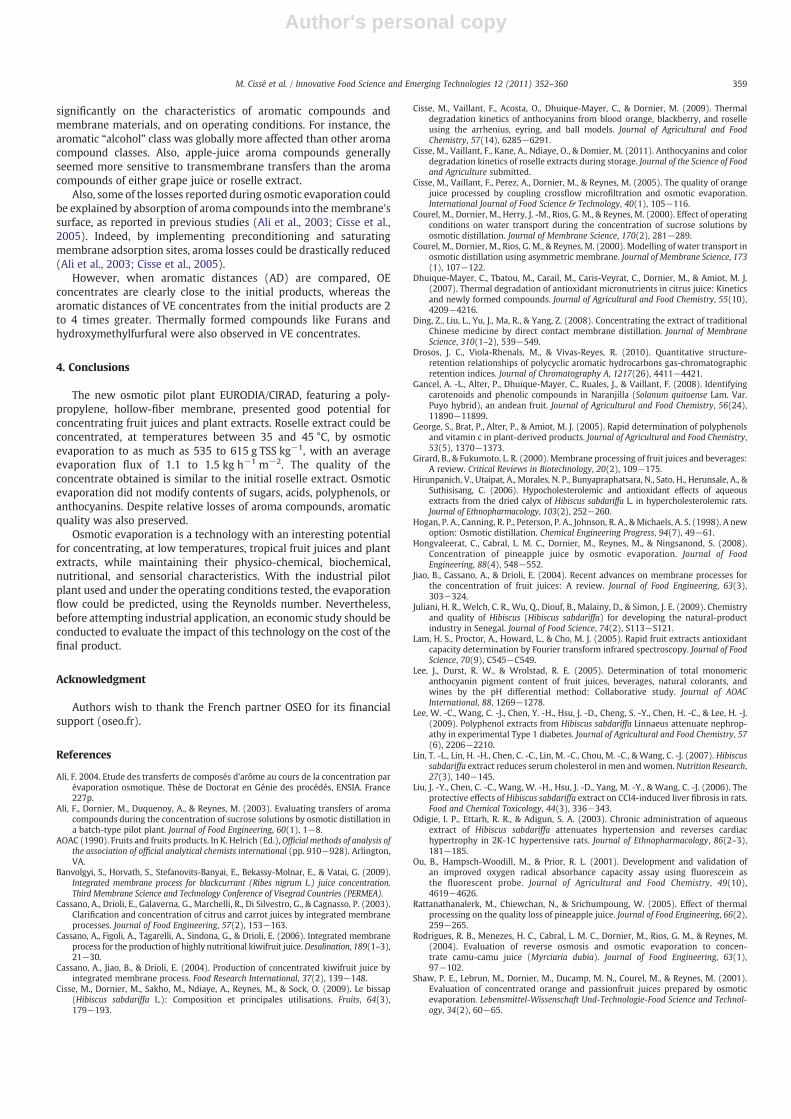
To determine the conditions under which the mass transferresistance of the boundary layer can be ignored, the evaporationfluxes obtained during the different trials with all the solutions testedwere reported as a function of the Reynolds number. This number iscalculated by taking into account viscosity of the solutions, flow insidemodule, and the geometry of the hollow fibers (Fig. 6). For a Reynoldsnumber higher than 100, evaporation flux does not increase anyfurther, in contrast to what happens for lower Reynolds numbers. Thisresult indicates that, according to our operating conditions andconfiguration of membranes and module, the main resistance to masstransfer is in the liquid phase when Reynolds numbers are less than100 and primarily in themembranewhen Reynolds numbers are high.A simple model (Eq. 3) can fit these results, with good correlation
(r2=0.928).
Jw = 0:203:Ln Reð Þ + 0:272 ð3Þ
In our specific case, this model may be used to predict osmoticevaporation flux for different solution by knowing only the Reynoldsnumber.
3.2. Quality of concentrates obtained
Table 2 presents the main physico-chemical properties of theinitial roselle extract, and apple and grape juices; and theirconcentrates as obtained by either osmotic evaporation (OE) orvacuum evaporation (VE). For all products, pH did not change becauseof the buffering capacity of the fruit juices and roselle extract.Comparisons expressed on a dry matter basis (g kg−1 DM) of solutecontent (sugar, pectins, anthocyanins, and polyphenols) show,overall, no significant differences between the initial product andOE concentrate for all juices and roselle extract.
However, significant differences were noted between the initialproducts and the VE concentrates. For example, for apple juice, totalacidity was 20% lower for the VE concentrate than for the raw juice.Glucose contents in the VE concentrate were 51 and 38% lower than inthe initial products of grape and roselle, respectively. Similar resultswere observed during the thermal concentration of orange, melon,and passion fruit juices (Cisse et al., 2005; Vaillant et al., 2001; Vaillantet al., 2005). These decreases in sugar and organic acid content can beexplained by several reactions such as sucrose inversion resultingfrom lower acidity and temperature, acid degradation of hexoses, andoxidation.
Losses of anthocyanins were slight but not significant for the OEconcentrates and only 6% for the VE concentrates. These values
Fig. 4. Evolution of brine concentration and extract viscosity during osmoticevaporation of roselle extract at Tj=34.9 °C and Tb=38.2 °C.
Fig. 5. Evolution of water flux and total soluble solids during the osmotic evaporation ofapple and grape juice (Tj=34±2 °C and Tb=36±2 °C °C).
Fig. 6. Evaporation flux versus Reynolds number in the hollow fibers of the concentrateloop.
356 M. Cissé et al. / Innovative Food Science and Emerging Technologies 12 (2011) 352–360

Author's personal copy
corroborate previous findings by Cisse, Vaillant, et al. (2009) on thethermal degradation of anthocyanins from roselle extract (Cisse,Vaillant, et al., 2009). However, it must be taken into account that hightemperature treatments tend to lead to significantly decreasedstability of anthocyanins during storage (Cisse, Vaillant, Kane, Ndiaye,& Domier 2011).
For total phenolic content, losses during thermal concentrationwere inconsistent. In roselle extract, polyphenols were even higher inthe VE concentrate than in the initial roselle extract. This surprisingresult was probably due to the formation, during thermal concentra-
tion, of colored compounds that interfere by increasing absorbanceduring the spectrophotometric determination of phenolics, as thermaltreatments often strongly affect juice color (Ding et al., 2008;Rattanathanalerk, Chiewchan, & Srichumpoung, 2005).
This hypothesis tends to be confirmed by the antioxidant valuesassessed in the ORAC assay. The VE concentrate presented lowerORAC values (Pb 0.05) than either the initial juice or OE concentrate. Areal increase in phenolic compounds would also have increased theantioxidant potential. The OE concentrates and initial productsshowed no significant differences in their ORAC values. For initial
Table 2Comparison of the main characteristics of the initial product and the concentrates obtained by osmotic evaporation (OE) and vacuum evaporation (VE); for a product value with thesame letter is not significantly different.
Apple juice Grape juice Roselle extract
Initial OE VE Initial OE VE Initial OE VE
pH 3.3a 3.4a 3.5a 3.0 3.0 3.4 2.3 2.4 2.4Density at 35 °C(kg m−3)
1099a 1266b 1263b 1058 1316 1303 1033 1283 1290
Total soluble solids(g kg−1)
112a 570b 565c 159 668 682 91 549 560
Dry matter(g kg−1)
111a 572b 566c 161 669 683 92 551 561
Titratable acidity(mEq kg−1) 63 320 260 74 301 257 505 3000 2274(mEq kg−1 DM) 568a 560b 459c 460a 450b 387c 5489a 5446a 4053b
Glucose(g kg−1) 22 112 85 79 327 163 21 123 81(g kg−1 DM) 201a 196a 151b 491a 489a 239b 232a 223a 144b
Fructose(g kg−1) 68 334 230 83 330 255 16 78 55(g kg−1 DM) 613a 583b 406a 516a 493b 373b 174a 142b 98c
Sucrose(g kg−1) 19 96 54 Traces Traces Traces 46 248 4(g kg−1 DM) 171a 168a 95b 500a 450b 7c
Pectin (g kg−1 DM) 0 0 0 0 0 0 473a 466a 464a
Viscosity at 35 °C(mPa s)
1.3a 18.7b 13.7c 1.6a 40.6b 39.9b 1.6a 44.0b 88.8c
Aw at 35 °C 0.988a 0.864b 0.865b 0.982a 0.780b 0.812c 0.990a 0.902b 0.912c
Polyphenols(mg kg−1) 368 1647 1617 1061 4322 3940 2644 15756 25320(g kg−1DM) 3.3a 2.9ab 2.9b 6.6a 6.5a 5.8b 28.7a 28.6a 45.1b
Anthocyanins(mg L−1) nd nd nd nd nd nd 240 1400 1380(g kg−1 DM) nd nd nd nd nd nd 2.61a 2.54a 2.46b
ORAC(μmolTrolox g−1) 5 25 20 14 55 41 39 230 192(μmolTrolox g1 DM) 44a 43a 35b 85a 82a 60b 424a 417a 346b
nd : not determined.
Table 3Comparison of different aroma compounds between the initial roselle extract, the concentrate obtained by osmotic evaporation (OE) and concentrate under vacuum (VE). Rt:retention time; and IKC, IKL: calculated and literature Kovats indices.
Linear retention Peak areai /Peak areais Losses (%)
Aroma compounds Rt (min) IKC IKL Initial OE VE OE VE
Aldehyde Hexanal 6.18 1076 1084 8.2 (0.24) 7.0 (0.49) 2.3 (0.05) 15 72Heptanal 9.25 1179 1174 2.4 (0.10) 2.3 (0.08) 0.9 (0.05) 4 63Octanal 13.04 1283 1280 4.0 (0.08) 4.0 (0.20) 2.4 (0.40) 1 40Nonanal 17.16 1387 1385 13.0 (0.29) 12.4 (0.20) 6.3 (0.04) 4 52Furfural 19.72 1451 1455 39.7 (1.49) 32.5 (0.64) 12.6 (0.38) 18 68Decanal 21.35 1491 1484 4.4 (0.10) 4.3 (0.54) 2.7 (0.24) 2 39Benzaldehyde 21.92 1505 1495 4.1 (0.15) 3.8 (0.18) 3.2 (0.25) 7 212,4 dimethyl benzaldehyde 32.56 1788 – 18.7 (0.72) 17.5 (0.79) 7.5 (0.93) 7 60
Alcohols Octanol 23.95 1557 1553 9.1 (0.20) 6.6 (0.31) 1.9 (0.16) 27 79Nonanol 27.84 1659 – 2.0 (0.20) 1.5 (0.07) 0.5 (0.06) 26 76Eugenol 44.27 – 6.8 (0.14) 6.4 (0.83) 1.6 (0.54) 6 77
Others 2 Pentyl Furan 10.89 1226 1240 2.5 (0.05) 2.0 (0.12) 1.4 (0.03) 19 45Methyl 6 heptadienon 3.5 24.85 1580 – 3.2 (0.07) 2.9 (0.09) 0.9 (0.14) 7 69Trans decene 2 al 26.11 1613 1611 4.7 (0.45) 4.3 (0.27) 2.9 (0.05) 9 39Linalyl propionate 29.00 1691 1698 6.6 (0.23) 5.3 (0.53) 2.0 (0.21) 20 63
Aromatic distance 8.1 32.5
357M. Cissé et al. / Innovative Food Science and Emerging Technologies 12 (2011) 352–360
Author's personal copy
products, the ORAC values obtained for grape juice and roselle extractagreed with those of previous studies (Juliani et al., 2009; Lam,Proctor, Howard, & Cho, 2005; Xu, Yuan, & Chang, 2007).
Another difference between OE and VE concentrates refers toviscosity. For roselle extract, the viscosity of its VE concentrate wastwo times higher than that of the OE concentrate. This could beexplained by the gelatinization of pectin in a more acidic medium (pH2.3). It also shows that polymerization reactions may have beenenhanced by a higher temperature (80 °C).
Consequently, the physico-chemical properties of apple juice, grapejuice, and roselle extract were not significantly modified by osmoticevaporation, whereas this was not the case for vacuum evaporation.
3.3. Aromatic quality of concentrates
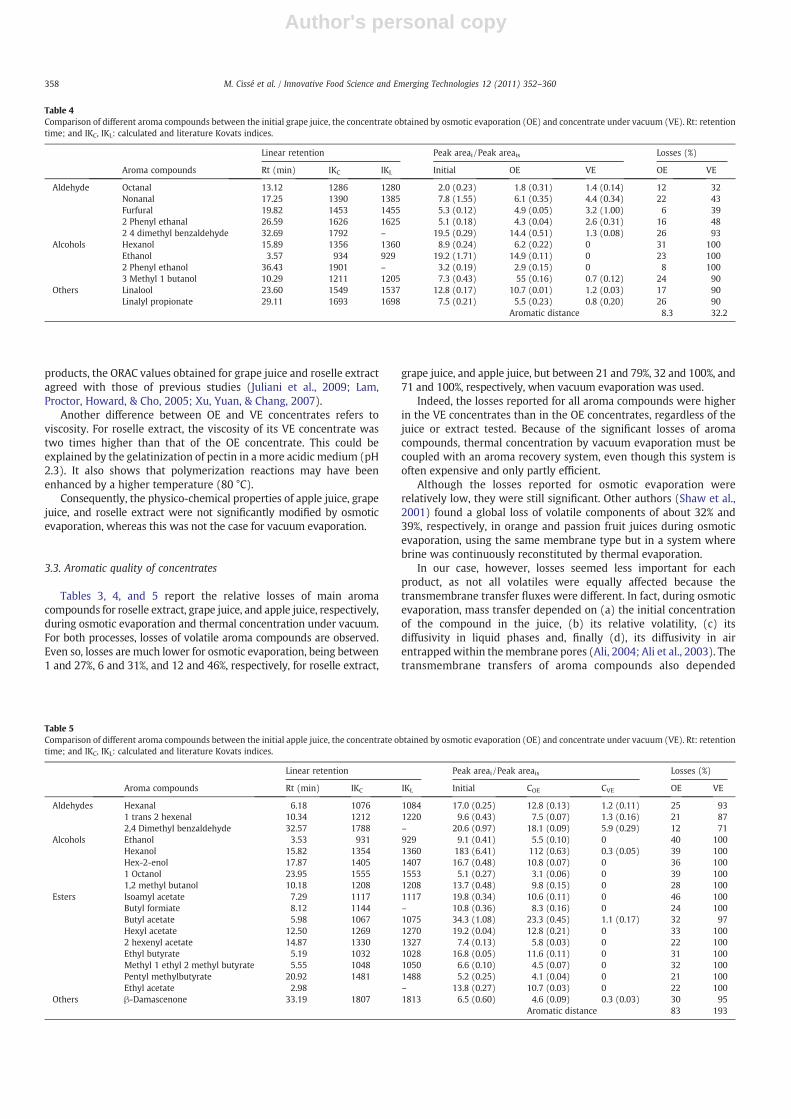
Tables 3, 4, and 5 report the relative losses of main aromacompounds for roselle extract, grape juice, and apple juice, respectively,during osmotic evaporation and thermal concentration under vacuum.For both processes, losses of volatile aroma compounds are observed.Even so, losses are much lower for osmotic evaporation, being between1 and 27%, 6 and 31%, and 12 and 46%, respectively, for roselle extract,
grape juice, and apple juice, but between 21 and 79%, 32 and 100%, and71 and 100%, respectively, when vacuum evaporation was used.
Indeed, the losses reported for all aroma compounds were higherin the VE concentrates than in the OE concentrates, regardless of thejuice or extract tested. Because of the significant losses of aromacompounds, thermal concentration by vacuum evaporation must becoupled with an aroma recovery system, even though this system isoften expensive and only partly efficient.
Although the losses reported for osmotic evaporation wererelatively low, they were still significant. Other authors (Shaw et al.,2001) found a global loss of volatile components of about 32% and39%, respectively, in orange and passion fruit juices during osmoticevaporation, using the same membrane type but in a system wherebrine was continuously reconstituted by thermal evaporation.
In our case, however, losses seemed less important for eachproduct, as not all volatiles were equally affected because thetransmembrane transfer fluxes were different. In fact, during osmoticevaporation, mass transfer depended on (a) the initial concentrationof the compound in the juice, (b) its relative volatility, (c) itsdiffusivity in liquid phases and, finally (d), its diffusivity in airentrappedwithin themembrane pores (Ali, 2004; Ali et al., 2003). Thetransmembrane transfers of aroma compounds also depended
Table 4Comparison of different aroma compounds between the initial grape juice, the concentrate obtained by osmotic evaporation (OE) and concentrate under vacuum (VE). Rt: retentiontime; and IKC, IKL: calculated and literature Kovats indices.
Linear retention Peak areai /Peak areais Losses (%)
Aroma compounds Rt (min) IKC IKL Initial OE VE OE VE
Aldehyde Octanal 13.12 1286 1280 2.0 (0.23) 1.8 (0.31) 1.4 (0.14) 12 32Nonanal 17.25 1390 1385 7.8 (1.55) 6.1 (0.35) 4.4 (0.34) 22 43Furfural 19.82 1453 1455 5.3 (0.12) 4.9 (0.05) 3.2 (1.00) 6 392 Phenyl ethanal 26.59 1626 1625 5.1 (0.18) 4.3 (0.04) 2.6 (0.31) 16 482 4 dimethyl benzaldehyde 32.69 1792 – 19.5 (0.29) 14.4 (0.51) 1.3 (0.08) 26 93
Alcohols Hexanol 15.89 1356 1360 8.9 (0.24) 6.2 (0.22) 0 31 100Ethanol 3.57 934 929 19.2 (1.71) 14.9 (0.11) 0 23 1002 Phenyl ethanol 36.43 1901 – 3.2 (0.19) 2.9 (0.15) 0 8 1003 Methyl 1 butanol 10.29 1211 1205 7.3 (0.43) 55 (0.16) 0.7 (0.12) 24 90
Others Linalool 23.60 1549 1537 12.8 (0.17) 10.7 (0.01) 1.2 (0.03) 17 90Linalyl propionate 29.11 1693 1698 7.5 (0.21) 5.5 (0.23) 0.8 (0.20) 26 90
Aromatic distance 8.3 32.2
Table 5Comparison of different aroma compounds between the initial apple juice, the concentrate obtained by osmotic evaporation (OE) and concentrate under vacuum (VE). Rt: retentiontime; and IKC, IKL: calculated and literature Kovats indices.
Linear retention Peak areai /Peak areais Losses (%)
Aroma compounds Rt (min) IKC IKL Initial COE CVE OE VE
Aldehydes Hexanal 6.18 1076 1084 17.0 (0.25) 12.8 (0.13) 1.2 (0.11) 25 931 trans 2 hexenal 10.34 1212 1220 9.6 (0.43) 7.5 (0.07) 1.3 (0.16) 21 872,4 Dimethyl benzaldehyde 32.57 1788 – 20.6 (0.97) 18.1 (0.09) 5.9 (0.29) 12 71
Alcohols Ethanol 3.53 931 929 9.1 (0.41) 5.5 (0.10) 0 40 100Hexanol 15.82 1354 1360 183 (6.41) 112 (0.63) 0.3 (0.05) 39 100Hex-2-enol 17.87 1405 1407 16.7 (0.48) 10.8 (0.07) 0 36 1001 Octanol 23.95 1555 1553 5.1 (0.27) 3.1 (0.06) 0 39 1001,2 methyl butanol 10.18 1208 1208 13.7 (0.48) 9.8 (0.15) 0 28 100
Esters Isoamyl acetate 7.29 1117 1117 19.8 (0.34) 10.6 (0.11) 0 46 100Butyl formiate 8.12 1144 – 10.8 (0.36) 8.3 (0.16) 0 24 100Butyl acetate 5.98 1067 1075 34.3 (1.08) 23.3 (0.45) 1.1 (0.17) 32 97Hexyl acetate 12.50 1269 1270 19.2 (0.04) 12.8 (0.21) 0 33 1002 hexenyl acetate 14.87 1330 1327 7.4 (0.13) 5.8 (0.03) 0 22 100Ethyl butyrate 5.19 1032 1028 16.8 (0.05) 11.6 (0.11) 0 31 100Methyl 1 ethyl 2 methyl butyrate 5.55 1048 1050 6.6 (0.10) 4.5 (0.07) 0 32 100Pentyl methylbutyrate 20.92 1481 1488 5.2 (0.25) 4.1 (0.04) 0 21 100Ethyl acetate 2.98 – 13.8 (0.27) 10.7 (0.03) 0 22 100
Others β-Damascenone 33.19 1807 1813 6.5 (0.60) 4.6 (0.09) 0.3 (0.03) 30 95Aromatic distance 83 193
358 M. Cissé et al. / Innovative Food Science and Emerging Technologies 12 (2011) 352–360
Author's personal copy
significantly on the characteristics of aromatic compounds andmembrane materials, and on operating conditions. For instance, thearomatic “alcohol” class was globally more affected than other aromacompound classes. Also, apple-juice aroma compounds generallyseemed more sensitive to transmembrane transfers than the aromacompounds of either grape juice or roselle extract.
Also, some of the losses reported during osmotic evaporation couldbe explained by absorption of aroma compounds into themembrane'ssurface, as reported in previous studies (Ali et al., 2003; Cisse et al.,2005). Indeed, by implementing preconditioning and saturatingmembrane adsorption sites, aroma losses could be drastically reduced(Ali et al., 2003; Cisse et al., 2005).
However, when aromatic distances (AD) are compared, OEconcentrates are clearly close to the initial products, whereas thearomatic distances of VE concentrates from the initial products are 2to 4 times greater. Thermally formed compounds like Furans andhydroxymethylfurfural were also observed in VE concentrates.
4. Conclusions
The new osmotic pilot plant EURODIA/CIRAD, featuring a poly-propylene, hollow-fiber membrane, presented good potential forconcentrating fruit juices and plant extracts. Roselle extract could beconcentrated, at temperatures between 35 and 45 °C, by osmoticevaporation to as much as 535 to 615 g TSS kg−1, with an averageevaporation flux of 1.1 to 1.5 kg h−1 m−2. The quality of theconcentrate obtained is similar to the initial roselle extract. Osmoticevaporation did not modify contents of sugars, acids, polyphenols, oranthocyanins. Despite relative losses of aroma compounds, aromaticquality was also preserved.
Osmotic evaporation is a technology with an interesting potentialfor concentrating, at low temperatures, tropical fruit juices and plantextracts, while maintaining their physico-chemical, biochemical,nutritional, and sensorial characteristics. With the industrial pilotplant used and under the operating conditions tested, the evaporationflow could be predicted, using the Reynolds number. Nevertheless,before attempting industrial application, an economic study should beconducted to evaluate the impact of this technology on the cost of thefinal product.
Acknowledgment
Authors wish to thank the French partner OSEO for its financialsupport (oseo.fr).
References
Ali, F. 2004. Etude des transferts de composés d'arôme au cours de la concentration parévaporation osmotique. Thèse de Doctorat en Génie des procédés, ENSIA. France227p.
Ali, F., Dornier, M., Duquenoy, A., & Reynes, M. (2003). Evaluating transfers of aromacompounds during the concentration of sucrose solutions by osmotic distillation ina batch-type pilot plant. Journal of Food Engineering, 60(1), 1−8.
AOAC (1990). Fruits and fruits products. In K. Helrich (Ed.), Official methods of analysis ofthe association of official analytical chemists international (pp. 910−928). Arlington,VA.
Banvolgyi, S., Horvath, S., Stefanovits-Banyai, E., Bekassy-Molnar, E., & Vatai, G. (2009).Integrated membrane process for blackcurrant (Ribes nigrum L.) juice concentration.Third Membrane Science and Technology Conference of Visegrad Countries (PERMEA).
Cassano, A., Drioli, E., Galaverna, G., Marchelli, R., Di Silvestro, G., & Cagnasso, P. (2003).Clarification and concentration of citrus and carrot juices by integrated membraneprocesses. Journal of Food Engineering, 57(2), 153−163.
Cassano, A., Figoli, A., Tagarelli, A., Sindona, G., & Drioli, E. (2006). Integrated membraneprocess for the production of highly nutritional kiwifruit juice.Desalination, 189(1–3),21−30.
Cassano, A., Jiao, B., & Drioli, E. (2004). Production of concentrated kiwifruit juice byintegrated membrane process. Food Research International, 37(2), 139−148.
Cisse, M., Dornier, M., Sakho, M., Ndiaye, A., Reynes, M., & Sock, O. (2009). Le bissap(Hibiscus sabdariffa L.): Composition et principales utilisations. Fruits, 64(3),179−193.
Cisse, M., Vaillant, F., Acosta, O., Dhuique-Mayer, C., & Dornier, M. (2009). Thermaldegradation kinetics of anthocyanins from blood orange, blackberry, and roselleusing the arrhenius, eyring, and ball models. Journal of Agricultural and FoodChemistry, 57(14), 6285−6291.
Cisse, M., Vaillant, F., Kane, A., Ndiaye, O., & Domier, M. (2011). Anthocyanins and colordegradation kinetics of roselle extracts during storage. Journal of the Science of Foodand Agriculture submitted.
Cisse, M., Vaillant, F., Perez, A., Dornier, M., & Reynes, M. (2005). The quality of orangejuice processed by coupling crossflow microfiltration and osmotic evaporation.International Journal of Food Science & Technology, 40(1), 105−116.
Courel, M., Dornier, M., Herry, J. -M., Rios, G. M., & Reynes, M. (2000). Effect of operatingconditions on water transport during the concentration of sucrose solutions byosmotic distillation. Journal of Membrane Science, 170(2), 281−289.
Courel, M., Dornier, M., Rios, G. M., & Reynes, M. (2000). Modelling of water transport inosmotic distillation using asymmetric membrane. Journal of Membrane Science, 173(1), 107−122.
Dhuique-Mayer, C., Tbatou, M., Carail, M., Caris-Veyrat, C., Dornier, M., & Amiot, M. J.(2007). Thermal degradation of antioxidant micronutrients in citrus juice: Kineticsand newly formed compounds. Journal of Agricultural and Food Chemistry, 55(10),4209−4216.
Ding, Z., Liu, L., Yu, J., Ma, R., & Yang, Z. (2008). Concentrating the extract of traditionalChinese medicine by direct contact membrane distillation. Journal of MembraneScience, 310(1–2), 539−549.
Drosos, J. C., Viola-Rhenals, M., & Vivas-Reyes, R. (2010). Quantitative structure-retention relationships of polycyclic aromatic hydrocarbons gas-chromatographicretention indices. Journal of Chromatography A, 1217(26), 4411−4421.
Gancel, A. -L., Alter, P., Dhuique-Mayer, C., Ruales, J., & Vaillant, F. (2008). Identifyingcarotenoids and phenolic compounds in Naranjilla (Solanum quitoense Lam. Var.Puyo hybrid), an andean fruit. Journal of Agricultural and Food Chemistry, 56(24),11890−11899.
George, S., Brat, P., Alter, P., & Amiot, M. J. (2005). Rapid determination of polyphenolsand vitamin c in plant-derived products. Journal of Agricultural and Food Chemistry,53(5), 1370−1373.
Girard, B., & Fukumoto, L. R. (2000). Membrane processing of fruit juices and beverages:A review. Critical Reviews in Biotechnology, 20(2), 109−175.
Hirunpanich, V., Utaipat, A., Morales, N. P., Bunyapraphatsara, N., Sato, H., Herunsale, A., &Suthisisang, C. (2006). Hypocholesterolemic and antioxidant effects of aqueousextracts from the dried calyx of Hibiscus sabdariffa L. in hypercholesterolemic rats.Journal of Ethnopharmacology, 103(2), 252−260.
Hogan, P. A., Canning, R. P., Peterson, P. A., Johnson, R. A., &Michaels, A. S. (1998). A newoption: Osmotic distillation. Chemical Engineering Progress, 94(7), 49−61.
Hongvaleerat, C., Cabral, L. M. C., Dornier, M., Reynes, M., & Ningsanond, S. (2008).Concentration of pineapple juice by osmotic evaporation. Journal of FoodEngineering, 88(4), 548−552.
Jiao, B., Cassano, A., & Drioli, E. (2004). Recent advances on membrane processes forthe concentration of fruit juices: A review. Journal of Food Engineering, 63(3),303−324.
Juliani, H. R., Welch, C. R., Wu, Q., Diouf, B., Malainy, D., & Simon, J. E. (2009). Chemistryand quality of Hibiscus (Hibiscus sabdariffa) for developing the natural-productindustry in Senegal. Journal of Food Science, 74(2), S113−S121.
Lam, H. S., Proctor, A., Howard, L., & Cho, M. J. (2005). Rapid fruit extracts antioxidantcapacity determination by Fourier transform infrared spectroscopy. Journal of FoodScience, 70(9), C545−C549.
Lee, J., Durst, R. W., & Wrolstad, R. E. (2005). Determination of total monomericanthocyanin pigment content of fruit juices, beverages, natural colorants, andwines by the pH differential method: Collaborative study. Journal of AOACInternational, 88, 1269−1278.
Lee, W. -C., Wang, C. -J., Chen, Y. -H., Hsu, J. -D., Cheng, S. -Y., Chen, H. -C., & Lee, H. -J.(2009). Polyphenol extracts from Hibiscus sabdariffa Linnaeus attenuate nephrop-athy in experimental Type 1 diabetes. Journal of Agricultural and Food Chemistry, 57(6), 2206−2210.
Lin, T. -L., Lin, H. -H., Chen, C. -C., Lin, M. -C., Chou, M. -C., & Wang, C. -J. (2007). Hibiscussabdariffa extract reduces serum cholesterol inmen andwomen.Nutrition Research,27(3), 140−145.
Liu, J. -Y., Chen, C. -C., Wang, W. -H., Hsu, J. -D., Yang, M. -Y., & Wang, C. -J. (2006). Theprotective effects of Hibiscus sabdariffa extract on CCl4-induced liver fibrosis in rats.Food and Chemical Toxicology, 44(3), 336−343.
Odigie, I. P., Ettarh, R. R., & Adigun, S. A. (2003). Chronic administration of aqueousextract of Hibiscus sabdariffa attenuates hypertension and reverses cardiachypertrophy in 2K-1C hypertensive rats. Journal of Ethnopharmacology, 86(2–3),181−185.
Ou, B., Hampsch-Woodill, M., & Prior, R. L. (2001). Development and validation ofan improved oxygen radical absorbance capacity assay using fluorescein asthe fluorescent probe. Journal of Agricultural and Food Chemistry, 49(10),4619−4626.
Rattanathanalerk, M., Chiewchan, N., & Srichumpoung, W. (2005). Effect of thermalprocessing on the quality loss of pineapple juice. Journal of Food Engineering, 66(2),259−265.
Rodrigues, R. B., Menezes, H. C., Cabral, L. M. C., Dornier, M., Rios, G. M., & Reynes, M.(2004). Evaluation of reverse osmosis and osmotic evaporation to concen-trate camu-camu juice (Myrciaria dubia). Journal of Food Engineering, 63(1),97−102.
Shaw, P. E., Lebrun, M., Dornier, M., Ducamp, M. N., Courel, M., & Reynes, M. (2001).Evaluation of concentrated orange and passionfruit juices prepared by osmoticevaporation. Lebensmittel-Wissenschaft Und-Technologie-Food Science and Technol-ogy, 34(2), 60−65.
359M. Cissé et al. / Innovative Food Science and Emerging Technologies 12 (2011) 352–360

Author's personal copy
Vaillant, F., Cisse, M., Chaverri, M., Perez, A., Dornier, M., Viquez, F., & Dhuique-Mayer, C.(2005). Clarification and concentration of melon juice using membrane processes.Innovative Food Science & Emerging Technologies, 6(2), 213−220.
Vaillant, F., Jeanton, E., Dornier, M., O'Brien, G. M., Reynes, M., & Decloux, M. (2001).Concentration of passion fruit juice on an industrial pilot scale using osmoticevaporation. Journal of Food Engineering, 47(3), 195−202.
Vaillant, F., Millan, P., O'Brien, G., Dornier, M., Decloux, M., & Reynes, M. (1999).Crossflow microfiltration of passion fruit juice after partial enzymatic liquefaction.Journal of Food Engineering, 42(4), 215−224.
Xu, B., Yuan, S., & Chang, S. (2007). Comparative analyses of phenolic composition,antioxidant capacity, and color of cool season legumes and other selected foodlegumes. Journal of Food Science, 72(2), S167−S177.
360 M. Cissé et al. / Innovative Food Science and Emerging Technologies 12 (2011) 352–360