Association of Transforming Growth Factor Beta-1 (TGF-β1) Genetic Variation with Type 2 Diabetes...
12
Original Article Association of Transforming Growth Factor Beta-1 (TGF-b1) Genetic Variation with Type 2 Diabetes and End Stage Renal Disease in Two Large Population Samples from North India Priyanka Raina, 1 Ruhi Sikka, 1 * Ramandeep Kaur, 1 * Jasmine Sokhi, 1 Kawaljit Matharoo, 1 Virinder Singh, 2 and AJS Bhanwer 1 Abstract Geographic and ethnic differences impart an immense influence on the genetic susceptibility to Type 2 diabetes (T2D) and diabetic nephropathy (DN). Transforming growth factor-beta1 (TGF-b1), a ubiquitously expressed pro-fibrotic cytokine plays a pivotal role in mediating the hypertrophic and fibrotic manifestations of DN. The present study is aimed to study the association of TGF-b1 g.869T > C (rs1800470) and g.-509C > T (rs1800469) polymorphism in T2D and end stage renal disease (ESRD) cases from the two geographically and ethnically different populations from North India. A total of 1313 samples comprising 776 samples from Punjab (204 with ESRD, 257 without ESRD, and 315 healthy controls) and 537 samples from Jammu and Kashmir (150 with ESRD, 187 without ESRD, and 200 controls) were genotyped for TGF-b1 (rs1800470 and rs1800469) using ARMS-PCR. The CC genotype of rs1800470 increased ESRD risk by 3.1–4.5-fold in both populations. However, for rs1800469, the TT genotype provided 5.5-fold risk towards ESRD cases from Jammu and Kashmir and no risk for the cases from Punjab. The haplotype C-T conferred nearly a 2–3-fold risk towards T2D and ESRD and diplotype CC-CT conferred a 4-fold risk towards ESRD. Our results conclude that TGF-b1 (rs1800470) may increase the risk of both ESRD and T2D in both populations, but TGF-b1 (rs1800469) provided risk for only ESRD in the population of Jammu and Kashmir. The present study is one of the large sample sized genetic association studies of T2D and ESRD from Indian population and adds to the scholarship on global health omics. Introduction T ype 2 diabetes (T2D) is a common, chronic, and complex disorder that is rapidly growing globally (Stumvoll et al., 2005). Diabetic nephropathy (DN) is the leading cause of end stage renal disease (ESRD) and one of the main mechanisms by which diabetes results in increased mortality (Lui et al., 1999; Paniagua et al., 2007). T2D and its related complications are more common among Indians, and it tends to impose a significant health care burden and reduces the overall quality of life (Unnikrishnan et al., 2007). Moreover, because of the high cost of both dialysis and transplantation, only countries with robust economies can meet the challenges of treating ESRD patients (Coresh et al., 2007). There is a steep rise in the prevalence of T2D and DN in the population of Punjab, and Jammu and Kashmir attributed to the changing lifestyle and consumption of high fat diet (Bhatti et al., 2007, Mahajan et al., 2013). The two popula- tions have widely different geographical distribution and environmental conditions that influence the genetic suscep- tibility to lifestyle diseases such as T2D and DN. There is strong evidence that genetic susceptibility factors are asso- ciated with T2D and DN, and several single nucleotide polymorphisms (SNPs) have also been linked with its in- creased likelihood (McDonough et al., 2011, Wheeler and Barroso, 2011). Transforming growth factor-beta1 (TGF-b1), a widely expressed pro-fibrotic cytokine, plays a pivotal role in me- diating the hypertrophic and fibrotic manifestations of DN 1 Department of Human Genetics, Guru Nanak Dev University, Amritsar, Punjab, India. 2 Dr Virinder Singh Kidney Clinic and Dialysis Centre, Amritsar, Punjab, India. *These two authors contributed equally to this manuscript. OMICS A Journal of Integrative Biology Volume 19, Number 5, 2015 ª Mary Ann Liebert, Inc. DOI: 10.1089/omi.2015.0005 1
Transcript of Association of Transforming Growth Factor Beta-1 (TGF-β1) Genetic Variation with Type 2 Diabetes...
Original Article
Association of Transforming Growth Factor Beta-1(TGF-b1) Genetic Variation with Type 2 Diabetes
and End Stage Renal Disease in Two LargePopulation Samples from North India
Priyanka Raina,1 Ruhi Sikka,1* Ramandeep Kaur,1* Jasmine Sokhi,1 Kawaljit Matharoo,1
Virinder Singh,2 and AJS Bhanwer1
Abstract
Geographic and ethnic differences impart an immense influence on the genetic susceptibility to Type 2 diabetes(T2D) and diabetic nephropathy (DN). Transforming growth factor-beta1 (TGF-b1), a ubiquitously expressedpro-fibrotic cytokine plays a pivotal role in mediating the hypertrophic and fibrotic manifestations of DN. Thepresent study is aimed to study the association of TGF-b1 g.869T > C (rs1800470) and g.-509C > T (rs1800469)polymorphism in T2D and end stage renal disease (ESRD) cases from the two geographically and ethnicallydifferent populations from North India. A total of 1313 samples comprising 776 samples from Punjab (204 withESRD, 257 without ESRD, and 315 healthy controls) and 537 samples from Jammu and Kashmir (150 withESRD, 187 without ESRD, and 200 controls) were genotyped for TGF-b1 (rs1800470 and rs1800469) usingARMS-PCR. The CC genotype of rs1800470 increased ESRD risk by 3.1–4.5-fold in both populations.However, for rs1800469, the TT genotype provided 5.5-fold risk towards ESRD cases from Jammu andKashmir and no risk for the cases from Punjab. The haplotype C-T conferred nearly a 2–3-fold risk towardsT2D and ESRD and diplotype CC-CT conferred a 4-fold risk towards ESRD. Our results conclude that TGF-b1(rs1800470) may increase the risk of both ESRD and T2D in both populations, but TGF-b1 (rs1800469)provided risk for only ESRD in the population of Jammu and Kashmir. The present study is one of the largesample sized genetic association studies of T2D and ESRD from Indian population and adds to the scholarshipon global health omics.
Introduction
Type 2 diabetes (T2D) is a common, chronic, andcomplex disorder that is rapidly growing globally
(Stumvoll et al., 2005). Diabetic nephropathy (DN) is theleading cause of end stage renal disease (ESRD) and one ofthe main mechanisms by which diabetes results in increasedmortality (Lui et al., 1999; Paniagua et al., 2007). T2D andits related complications are more common among Indians,and it tends to impose a significant health care burden andreduces the overall quality of life (Unnikrishnan et al., 2007).Moreover, because of the high cost of both dialysis andtransplantation, only countries with robust economies canmeet the challenges of treating ESRD patients (Coresh et al.,2007).
There is a steep rise in the prevalence of T2D and DN in thepopulation of Punjab, and Jammu and Kashmir attributed tothe changing lifestyle and consumption of high fat diet(Bhatti et al., 2007, Mahajan et al., 2013). The two popula-tions have widely different geographical distribution andenvironmental conditions that influence the genetic suscep-tibility to lifestyle diseases such as T2D and DN. There isstrong evidence that genetic susceptibility factors are asso-ciated with T2D and DN, and several single nucleotidepolymorphisms (SNPs) have also been linked with its in-creased likelihood (McDonough et al., 2011, Wheeler andBarroso, 2011).
Transforming growth factor-beta1 (TGF-b1), a widelyexpressed pro-fibrotic cytokine, plays a pivotal role in me-diating the hypertrophic and fibrotic manifestations of DN
1Department of Human Genetics, Guru Nanak Dev University, Amritsar, Punjab, India.2Dr Virinder Singh Kidney Clinic and Dialysis Centre, Amritsar, Punjab, India.*These two authors contributed equally to this manuscript.
OMICS A Journal of Integrative BiologyVolume 19, Number 5, 2015ª Mary Ann Liebert, Inc.DOI: 10.1089/omi.2015.0005
1
(Sharma and Ziyadeh, 1995). The multiple mediators in thediabetic milieu upregulate TGF-b1-induced glomerular fi-brogenesis, which accompanies disease progression fromincipient to overt nephropathy and finally results in renalfunction decline among diabetic cases (Katz et al., 2002). Thepresence of SNPs in certain loci of the TGF-b1 gene affect itsregulation and expression levels, among these, g.-509C > T,g.915G > C (Arg25 Pro, codon 25), and g.869T > C (Leuci-ne10Proline, codon 10) are the most frequently studiedpolymorphisms (Dixon et al., 2003; Park et al., 2005; Shahet al., 2006).
Numerous studies have examined the association of theseSNPs with diabetes, obesity, and inflammatory diseases(Ahluwalia et al., 2009; Dixon et al., 2003; Kumar et al.,2007; Park et al., 2005; Vettor et al., 2005). The exonic(g.869T > C) and promoter (g.-509C > T) polymorphismshave been associated with DN traits (Coll et al., 2004; Khalilet al., 2005; Prasad et al., 2007). As the public health impactof DN is expected to grow in the years to come due to theincreasing prevalence of diabetes (Vinod, 2012) and more-over keeping in view the role of genetic predisposition forthe development of these diseases, the present study aimedto determine the association of TGF-b1 g.869T > C andg.-509C > T polymorphisms in T2D and ESRD cases derivedfrom T2D in the two geographically and ethnically differentpopulations of North India.
Material and Methodology
Study design and sampling
The present case-control association study has been ap-proved by the Ethics Committee of Guru Nanak Dev Uni-versity, Amritsar. The power of the study is more than 80%,and to accomplish the proposed objectives a total of 1313blood samples were collected, comprising of 776 samplesfrom Punjab and 537 samples from Jammu and Kashmir.Samples from Punjab comprised of 461 T2D cases (204 withESRD and 257 without ESRD) and 315 healthy controls.Samples from Jammu and Kashmir constituted 337 T2Dcases (150 with ESRD and 187 without ESRD) and 200controls. A written informed consent was obtained from allindividuals. T2D without ESRD cases were diagnosed ac-cording to the criteria given by American Diabetes Asso-ciation, 2011; these cases were without any microvascularand macrovascular complication. Diagnosis for T2D withESRD cases was made as per Levey et al., (2011). ESRDcases with T2D as a primary disease were only included toanalyze the effect of T2D on renal complications. ESRDcases with other microvascular and macrovascular compli-cations such as diabetic retinopathy, neuropathy, and car-diovascular diseases were excluded from the study. Thehealthy controls selected were gender matched and above theage of 40 years with no family history of T2D. The techniquesused for anthropometric measurements and biochemicalanalysis has been defined earlier by Raina et al., (2014).
SNP selection and genetic analysis
TGF-b1 gene SNPs rs1800469 (g.-509C > T) andrs1800470 (g.869T > C) selected for the present study arerecorded in the public dbSNP database and have been re-ported to influence the etiology of T2D and ESRD. Peripheral
blood samples obtained from the study participants werecollected in tubes containing EDTA. Total genomic DNAwas isolated from the venous blood using inorganic method(Miller et al., 1988). Genotyping of TGF-b1 g.869T > C andg.-509C > T polymorphisms was based on amplification re-fractory mutation detection system-polymerase chain reac-tion (ARMS-PCR). Primer sequences for TGF-b1 g.869T > Cpolymorphism were as described in Perrey et al., (1999), andprimers for TGF-b1 g.-509C > T polymorphism were de-signed by web-based allele specific primer (WASP) software(Wangkumhang et al., 2007). 10% of the samples were ran-domly chosen and re-analyzed to assess reliability of thegenotyping.
Statistical analysis
Statistical analyses were performed using statisticalpackage for social science program (version 16.0; SPSS Inc.,Chicago, IL). The power of the study was calculated using theCaTS power calculator (Skol et al., 2006). The continuousvariables are represented as mean – standard deviation (SD).Genotypes and allele frequencies (represented as percent-ages) were calculated by gene counting method. Genotypeswere tested for the Hardy Weinberg Equilibrium (HWE)using chi square analysis. The distribution of genotype andallele frequencies in cases and controls were compared byusing 3 · 2 and 2 · 2 chi-square contingency tables and theextent of association was determined by Odd’s ratio (OR) at95% confidence interval (CI). Binary logistic regressionanalysis was used for correction of confounding variablessuch as age, sex, BMI, and WHR. The continuous data werecompared using Student’s t-test. Levene’s test for measuringequality of variances was used to obtain the significancevalues for corresponding difference in means. Haplotypefrequencies and pairwise linkage disequilibrium (LD) for thetwo TGF-b1 (869 and -509) polymorphisms among bothstudied populations were estimated using Haploview soft-ware. All results were considered significant at p < 0.05. Thep-value given in t-test (Bonferroni correction) and in modelanalysis (confounding factors) is corrected.
Results
Comparison of clinical characteristicsof studied populations
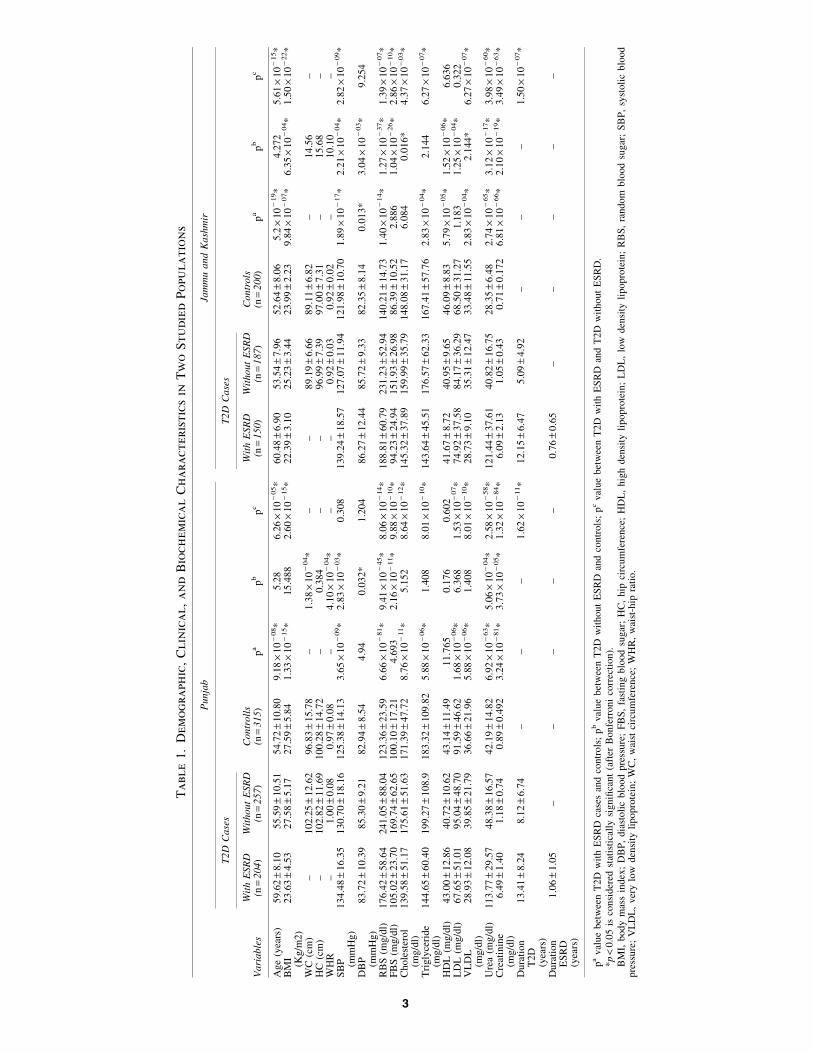
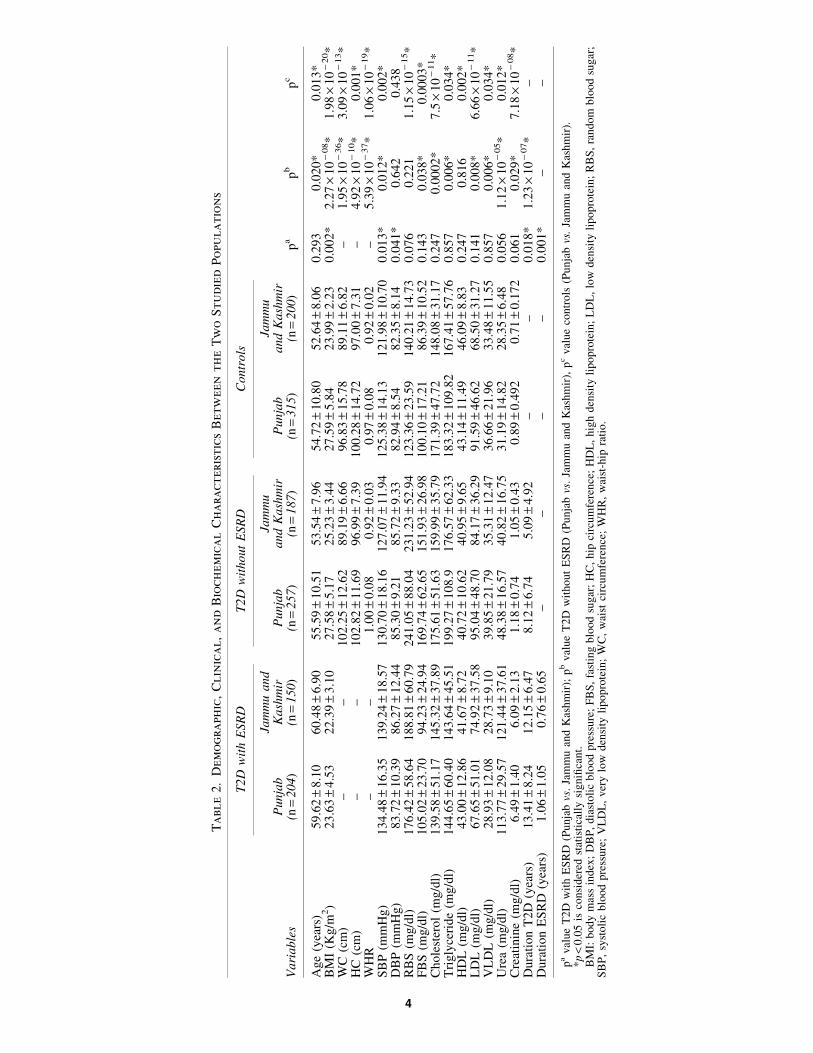
The comparison of various demographic, clinical, andbiochemical parameters between the studied disease groupsand controls among the populations of Punjab and Jammuand Kashmir is given in Table 1, while comparison of variousparameters of cases and controls between the two studiedpopulation groups is shown in Table 2.
Frequency distribution of TGF-b1 g.869T > Cand g.-509C > T polymorphisms
The comparison of genotype and allele frequencies ofTGF-b g.869T > C polymorphism between the different dis-ease groups and controls among the two studied populationsis reported in Figure 1. The samples were categorized intototal T2D cases, T2D cases with ESRD, T2D cases withoutESRD, and controls. The genotypes in all the study groupswere observed to be in HWE. The minor allele frequency(MAF) was significantly higher in cases than controls in both
2 RAINA ET AL.,
Ta
ble
1.
Dem
og
ra
ph
ic,
Clin
ica
l,
an
dB
io
ch
em
ica
lC
ha
ra
cteristics
in
Tw
oS
tu
died
Po
pu
la
tio
ns
Pu
nja
bJa
mm
ua
nd
Ka
shm
ir
T2
DC
ase
sT
2D
Ca
ses
Va
ria
ble
sW
ith
ES
RD
(n=
20
4)
Wit
ho
ut
ES
RD
(n=
25
7)
Co
ntr
oll
s(n
=3
15
)p
ap
bp
cW
ith
ES
RD
(n=
15
0)
Wit
ho
ut
ES
RD
(n=
18
7)
Co
ntr
ols
(n=
20
0)
pa
pb
pc
Age
(yea
rs)
59.6
2–
8.1
05
5.5
9–
10
.51
54
.72
–1
0.8
09
.18
·1
0-
08*
5.2
86
.26
·1
0-
05*
60
.48
–6
.90
53
.54
–7
.96
52
.64
–8
.06
5.2
·1
0-
19*
4.2
72
5.6
1·
10
-15*
BM
I(K
g/m
2)
23
.63
–4
.53
27
.58
–5
.17
27
.59
–5
.84
1.3
3·
10
-15*
15
.48
82
.60
·1
0-
15*
22
.39
–3
.10
25
.23
–3
.44
23
.99
–2
.23
9.8
4·
10
-07*
6.3
5·
10
-04*
1.5
0·
10
-22*
WC
(cm
)–
10
2.2
5–
12
.62
96
.83
–1
5.7
8–
1.3
8·
10
-04*
––
89
.19
–6
.66
89
.11
–6
.82
–1
4.5
6–
HC
(cm
)–
10
2.8
2–
11
.69
10
0.2
8–
14
.72
–0
.38
4–
–9
6.9
9–
7.3
99
7.0
0–
7.3
1–
15
.68
–W
HR
–1
.00
–0
.08
0.9
7–
0.0
8–
4.1
0·
10
-04*
––
0.9
2–
0.0
30
.92
–0
.02
–1
0.1
0–
SB
P (mm
Hg
)1
34
.48
–1
6.3
51
30
.70
–1
8.1
61
25
.38
–1
4.1
33
.65
·1
0-
09*
2.8
3·
10
-03*
0.3
08
13
9.2
4–
18
.57
12
7.0
7–
11
.94
12
1.9
8–
10
.70
1.8
9·
10
-17*
2.2
1·
10
-04*
2.8
2·
10
-09*
DB
P (mm
Hg
)8
3.7
2–
10
.39
85
.30
–9
.21
82
.94
–8
.54
4.9
40
.03
2*
1.2
04
86
.27
–1
2.4
48
5.7
2–
9.3
38
2.3
5–
8.1
40
.01
3*
3.0
4·
10
-03*
9.2
54
RB
S(m
g/d
l)1
76
.42
–5
8.6
42
41
.05
–8
8.0
41
23
.36
–2
3.5
96
.66
·1
0-
81*
9.4
1·
10
-45*
8.0
6·
10
-14*
18
8.8
1–
60
.79
23
1.2
3–
52
.94
14
0.2
1–
14
.73
1.4
0·
10
-14*
1.2
7·
10
-37*
1.3
9·
10
-07*
FB
S(m
g/d
l)1
05
.02
–2
3.7
01
69
.74
–6
2.6
51
00
.10
–1
7.2
14
.69
32
.16
·1
0-
11*
9.8
8·
10
-10*
94
.23
–2
4.9
41
51
.93
–2
6.9
88
6.3
9–
10
.52
2.8
86
1.0
4·
10
-26*
2.8
6·
10
-10*
Ch
ole
ster
ol
(mg
/dl)
13
9.5
8–
51
.17
17
5.6
1–
51
.63
17
1.3
9–
47
.72
8.7
6·
10
-11*
5.1
52
8.6
4·
10
-12*
14
5.3
2–
37
.89
15
9.9
9–
35
.79
14
8.0
8–
31
.17
6.0
84
0.0
16
*4
.37
·1
0-
03*
Tri
gly
ceri
de
(mg
/dl)
14
4.6
5–
60
.40
19
9.2
7–
10
8.9
18
3.3
2–
10
9.8
25
.88
·1
0-
06*
1.4
08
8.0
1·
10
-10*
14
3.6
4–
45
.51
17
6.5
7–
62
.33
16
7.4
1–
57
.76
2.8
3·
10
-04*
2.1
44
6.2
7·
10
-07*
HD
L(m
g/d
l)4
3.0
0–
12
.86
40
.72
–1
0.6
24
3.1
4–
11
.49
11
.76
50
.17
60
.60
24
1.6
7–
8.7
24
0.9
5–
9.6
54
6.0
9–
8.8
35
.79
·1
0-
05*
1.5
2·
10
-06*
6.6
36
LD
L(m
g/d
l)6
7.6
5–
51
.01
95
.04
–4
8.7
09
1.5
9–
46
.62
1.6
8·
10
-06*
6.3
68
1.5
3·
10
-07*
74
.92
–3
7.5
88
4.1
7–
36
.29
68
.50
–3
1.2
71
.18
31
.25
·1
0-
04*
0.3
22
VL
DL
(mg
/dl)
28
.93
–1
2.0
83
9.8
5–
21
.79
36
.66
–2
1.9
65
.88
·1
0-
06*
1.4
08
8.0
1·
10
-10*
28
.73
–9
.10
35
.31
–1
2.4
73
3.4
8–
11
.55
2.8
3·
10
-04*
2.1
44
*6
.27
·1
0-
07*
Ure
a(m
g/d
l)1
13
.77
–2
9.5
74
8.3
8–
16
.57
42
.19
–1
4.8
26
.92
·1
0-
63*
5.0
6·
10
-04*
2.5
8·
10
-58*
12
1.4
4–
37
.61
40
.82
–1
6.7
52
8.3
5–
6.4
82
.74
·1
0-
65*
3.1
2·
10
-17*
3.9
8·
10
-60*
Cre
atin
ine
(mg
/dl)
6.4
9–
1.4
01
.18
–0
.74
0.8
9–
0.4
92
3.2
4·
10
-81*
3.7
3·
10
-05*
1.3
2·
10
-84*
6.0
9–
2.1
31
.05
–0
.43
0.7
1–
0.1
72
6.8
1·
10
-66*
2.1
0·
10
-19*
3.4
9·
10
-63*
Du
rati
on
T2
D(y
ears
)
13
.41
–8
.24
8.1
2–
6.7
4–
––
1.6
2·
10
-11*
12
.15
–6
.47
5.0
9–
4.9
2–
––
1.5
0·
10
-07*
Du
rati
on
ES
RD
(yea
rs)
1.0
6–
1.0
5–
––
––
0.7
6–
0.6
5–
––
––
pa
val
ue
bet
wee
nT
2D
wit
hE
SR
Dca
ses
and
contr
ols
;p
bval
ue
bet
wee
nT
2D
wit
hout
ES
RD
and
contr
ols
;p
cval
ue
bet
wee
nT
2D
wit
hE
SR
Dan
dT
2D
wit
hout
ES
RD
.*p
<0.0
5is
consi
der
edst
atis
tica
lly
signifi
cant
(aft
erB
onfe
rroni
corr
ecti
on).
BM
I,body
mas
sin
dex
;D
BP
,dia
stoli
cblo
od
pre
ssure
;F
BS
,fa
stin
gblo
od
sugar
;H
C,
hip
circ
um
fere
nce
;H
DL
,hig
hden
sity
lipopro
tein
;L
DL
,lo
wden
sity
lipopro
tein
;R
BS
,ra
ndom
blo
od
sugar
;S
BP
,sy
stoli
cblo
od
pre
ssure
;V
LD
L,
ver
ylo
wden
sity
lipopro
tein
;W
C,
wai
stci
rcum
fere
nce
;W
HR
,w
aist
-hip
rati
o.
3
Ta
ble
2.
Dem
og
ra
ph
ic,
Clin
ica
l,
an
dB
io
ch
em
ica
lC
ha
ra
cteristics
Betw
een
th
eT
wo
Stu
died
Po
pu
la
tio
ns
T2D
wit
hE
SR
DT
2D
wit
hout
ESR
DC
ontr
ols
Vari
able
sP
unja
b(n
=204)
Jam
mu
and
Kash
mir
(n=
150)
Punja
b(n
=257
)
Jam
mu
and
Kash
mir
(n=
187
)P
unja
b(n
=315
)
Jam
mu
and
Kash
mir
(n=
200)
pa
pb
pc
Age
(yea
rs)
59.6
2–
8.1
060.4
8–
6.9
055.5
9–
10.5
153.5
4–
7.9
654.7
2–
10.8
052.6
4–
8.0
60.2
93
0.0
20*
0.0
13*
BM
I(K
g/m
2)
23.6
3–
4.5
322.3
9–
3.1
027.5
8–
5.1
725.2
3–
3.4
427.5
9–
5.8
423.9
9–
2.2
30.0
02*
2.2
7·
10
-08*
1.9
8·
10
-20*
WC
(cm
)–
–102.2
5–
12.6
289.1
9–
6.6
696.8
3–
15.7
889.1
1–
6.8
2–
1.9
5·
10
-36*
3.0
9·
10
-13*
HC
(cm
)–
–102.8
2–
11.6
996.9
9–
7.3
9100.2
8–
14.7
297.0
0–
7.3
1–
4.9
2·
10
-10*
0.0
01*
WH
R–
–1.0
0–
0.0
80.9
2–
0.0
30.9
7–
0.0
80.9
2–
0.0
2–
5.3
9·
10
-37*
1.0
6·
10
-19*
SB
P(m
mH
g)
134.4
8–
16.3
5139.2
4–
18.5
7130.7
0–
18.1
6127.0
7–
11.9
4125.3
8–
14.1
3121.9
8–
10.7
00.0
13*
0.0
12*
0.0
02*
DB
P(m
mH
g)
83.7
2–
10.3
986.2
7–
12.4
485.3
0–
9.2
185.7
2–
9.3
382.9
4–
8.5
482.3
5–
8.1
40.0
41*
0.6
42
0.4
38
RB
S(m
g/d
l)176.4
2–
58.6
4188.8
1–
60.7
9241.0
5–
88.0
4231.2
3–
52.9
4123.3
6–
23.5
9140.2
1–
14.7
30.0
76
0.2
21
1.1
5·
10
-15*
FB
S(m
g/d
l)105.0
2–
23.7
094.2
3–
24.9
4169.7
4–
62.6
5151.9
3–
26.9
8100.1
0–
17.2
186.3
9–
10.5
20.1
43
0.0
38*
0.0
003*
Chole
ster
ol
(mg/d
l)139.5
8–
51.1
7145.3
2–
37.8
9175.6
1–
51.6
3159.9
9–
35.7
9171.3
9–
47.7
2148.0
8–
31.1
70.2
47
0.0
002*
7.5
·10
-11*
Tri
gly
ceri
de
(mg/d
l)144.6
5–
60.4
0143.6
4–
45.5
1199.2
7–
108.9
176.5
7–
62.3
3183.3
2–
109.8
2167.4
1–
57.7
60.8
57
0.0
06*
0.0
34*
HD
L(m
g/d
l)43.0
0–
12.8
641.6
7–
8.7
240.7
2–
10.6
240.9
5–
9.6
543.1
4–
11.4
946.0
9–
8.8
30.2
47
0.8
16
0.0
02*
LD
L(m
g/d
l)67.6
5–
51.0
174.9
2–
37.5
895.0
4–
48.7
084.1
7–
36.2
991.5
9–
46.6
268.5
0–
31.2
70.1
41
0.0
08*
6.6
6·
10
-11*
VL
DL
(mg/d
l)28.9
3–
12.0
828.7
3–
9.1
039.8
5–
21.7
935.3
1–
12.4
736.6
6–
21.9
633.4
8–
11.5
50.8
57
0.0
06*
0.0
34*
Ure
a(m
g/d
l)113.7
7–
29.5
7121.4
4–
37.6
148.3
8–
16.5
740.8
2–
16.7
531.1
9–
14.8
228.3
5–
6.4
80.0
56
1.1
2·
10
-05*
0.0
12*
Cre
atin
ine
(mg/d
l)6.4
9–
1.4
06.0
9–
2.1
31.1
8–
0.7
41.0
5–
0.4
30.8
9–
0.4
92
0.7
1–
0.1
72
0.0
61
0.0
29*
7.1
8·
10
-08*
Dura
tion
T2D
(yea
rs)
13.4
1–
8.2
412.1
5–
6.4
78.1
2–
6.7
45.0
9–
4.9
2–
–0.0
18*
1.2
3·
10
-07*
–D
ura
tion
ES
RD
(yea
rs)
1.0
6–
1.0
50.7
6–
0.6
5–
––
–0.0
01*
––
pa
val
ue
T2D
wit
hE
SR
D(P
unja
bvs
.Ja
mm
uan
dK
ashm
ir);
pb
val
ue
T2D
wit
hout
ES
RD
(Punja
bvs
.Ja
mm
uan
dK
ashm
ir),
pc
val
ue
contr
ols
(Punja
bvs
.Ja
mm
uan
dK
ashm
ir).
*p
<0.0
5is
consi
der
edst
atis
tica
lly
signifi
cant.
BM
I:body
mas
sin
dex
;D
BP
,dia
stoli
cblo
od
pre
ssure
;F
BS
,fa
stin
gblo
od
sugar
;H
C,
hip
circ
um
fere
nce
;H
DL
,hig
hden
sity
lipopro
tein
;L
DL
,lo
wden
sity
lipopro
tein
;R
BS
,ra
ndom
blo
od
sugar
;S
BP
,sy
stoli
cblo
od
pre
ssure
;V
LD
L,
ver
ylo
wden
sity
lipopro
tein
;W
C,
wai
stci
rcum
fere
nce
;W
HR
,w
aist
-hip
rati
o.
4
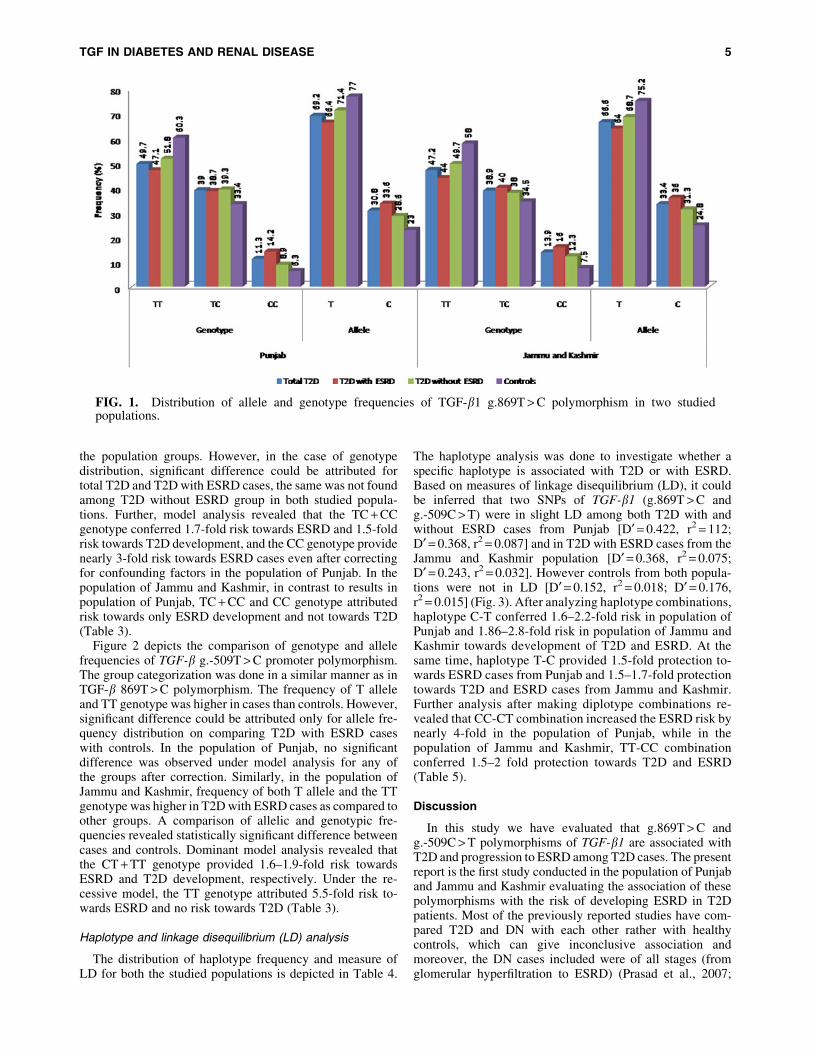
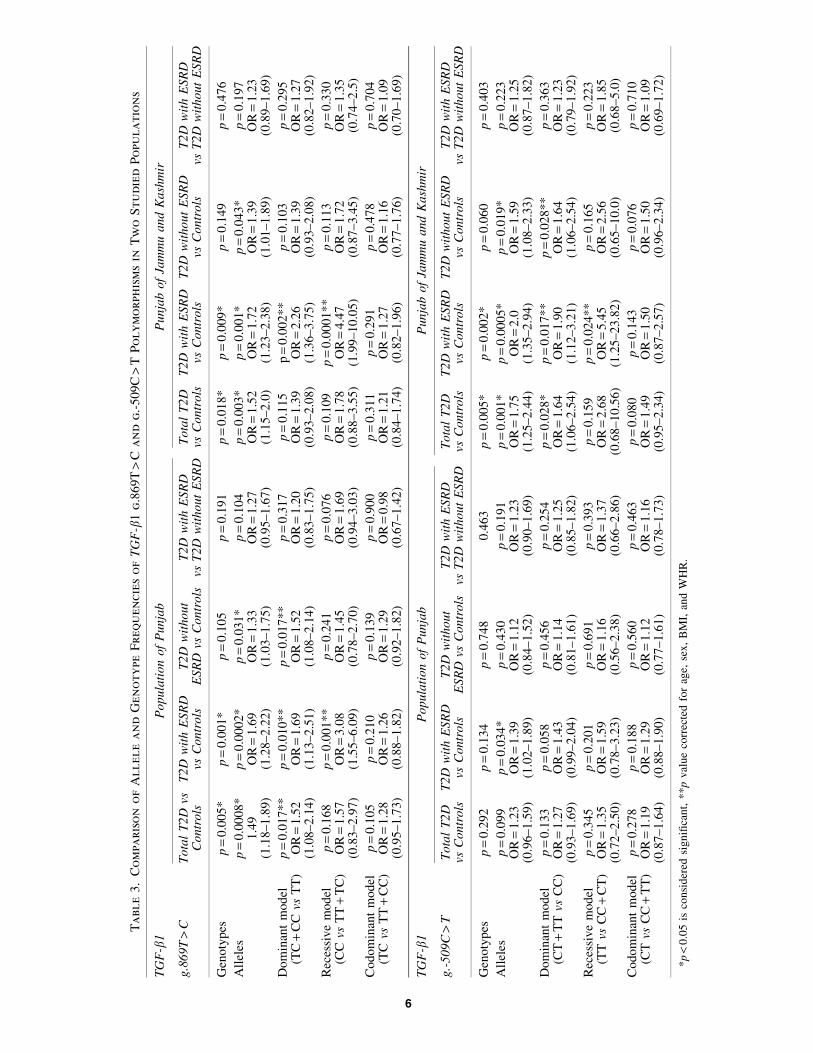
the population groups. However, in the case of genotypedistribution, significant difference could be attributed fortotal T2D and T2D with ESRD cases, the same was not foundamong T2D without ESRD group in both studied popula-tions. Further, model analysis revealed that the TC + CCgenotype conferred 1.7-fold risk towards ESRD and 1.5-foldrisk towards T2D development, and the CC genotype providenearly 3-fold risk towards ESRD cases even after correctingfor confounding factors in the population of Punjab. In thepopulation of Jammu and Kashmir, in contrast to results inpopulation of Punjab, TC + CC and CC genotype attributedrisk towards only ESRD development and not towards T2D(Table 3).
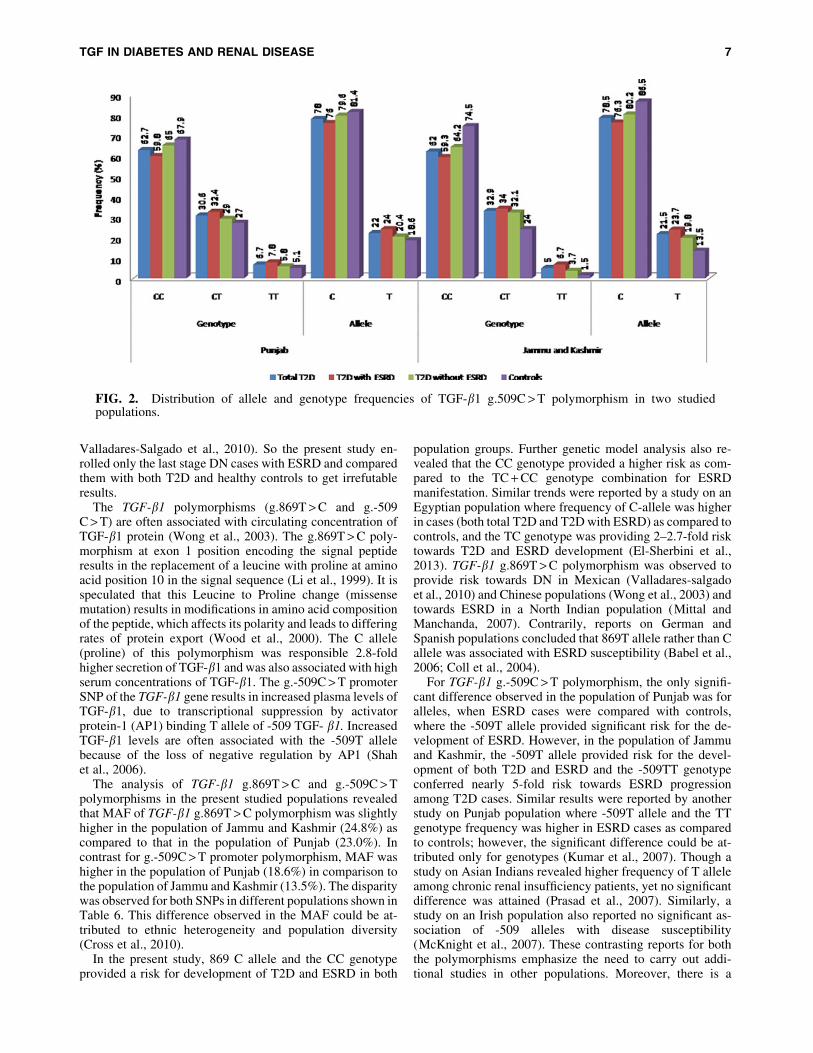
Figure 2 depicts the comparison of genotype and allelefrequencies of TGF-b g.-509T > C promoter polymorphism.The group categorization was done in a similar manner as inTGF-b 869T > C polymorphism. The frequency of T alleleand TT genotype was higher in cases than controls. However,significant difference could be attributed only for allele fre-quency distribution on comparing T2D with ESRD caseswith controls. In the population of Punjab, no significantdifference was observed under model analysis for any ofthe groups after correction. Similarly, in the population ofJammu and Kashmir, frequency of both T allele and the TTgenotype was higher in T2D with ESRD cases as compared toother groups. A comparison of allelic and genotypic fre-quencies revealed statistically significant difference betweencases and controls. Dominant model analysis revealed thatthe CT + TT genotype provided 1.6–1.9-fold risk towardsESRD and T2D development, respectively. Under the re-cessive model, the TT genotype attributed 5.5-fold risk to-wards ESRD and no risk towards T2D (Table 3).
Haplotype and linkage disequilibrium (LD) analysis
The distribution of haplotype frequency and measure ofLD for both the studied populations is depicted in Table 4.
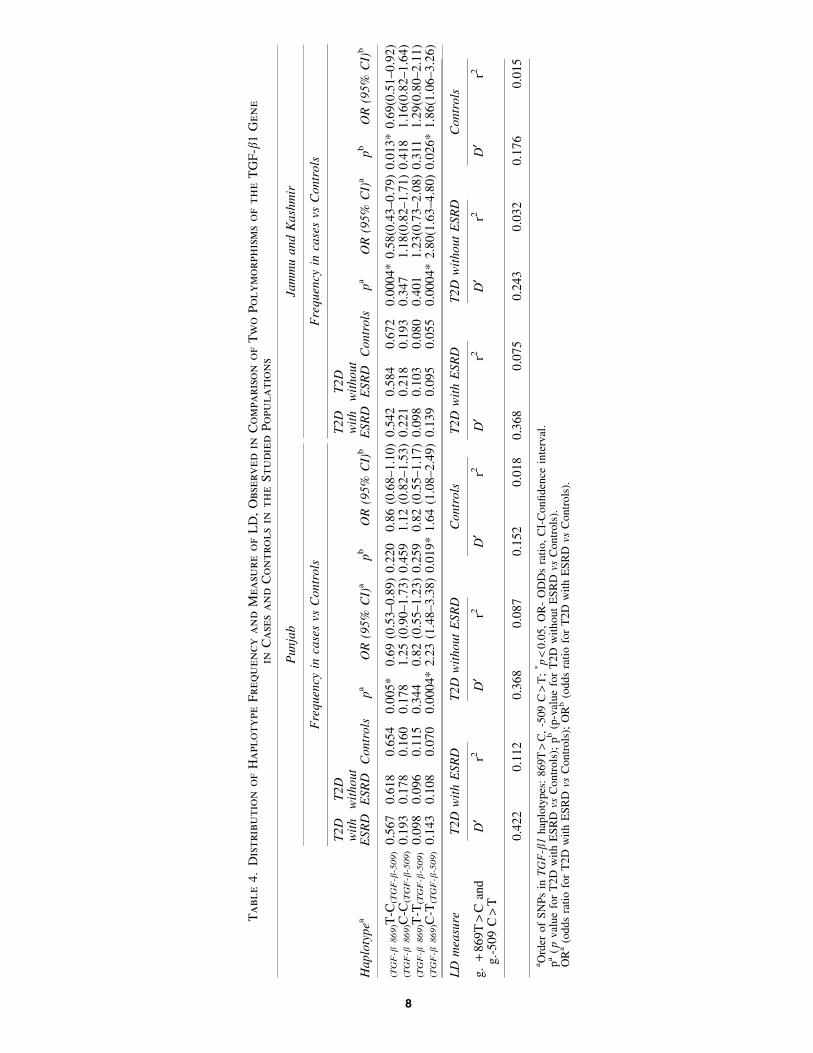
The haplotype analysis was done to investigate whether aspecific haplotype is associated with T2D or with ESRD.Based on measures of linkage disequilibrium (LD), it couldbe inferred that two SNPs of TGF-b1 (g.869T > C andg.-509C > T) were in slight LD among both T2D with andwithout ESRD cases from Punjab [D¢ = 0.422, r2 = 112;D¢ = 0.368, r2 = 0.087] and in T2D with ESRD cases from theJammu and Kashmir population [D¢ = 0.368, r2 = 0.075;D¢ = 0.243, r2 = 0.032]. However controls from both popula-tions were not in LD [D¢ = 0.152, r2 = 0.018; D¢ = 0.176,r2 = 0.015] (Fig. 3). After analyzing haplotype combinations,haplotype C-T conferred 1.6–2.2-fold risk in population ofPunjab and 1.86–2.8-fold risk in population of Jammu andKashmir towards development of T2D and ESRD. At thesame time, haplotype T-C provided 1.5-fold protection to-wards ESRD cases from Punjab and 1.5–1.7-fold protectiontowards T2D and ESRD cases from Jammu and Kashmir.Further analysis after making diplotype combinations re-vealed that CC-CT combination increased the ESRD risk bynearly 4-fold in the population of Punjab, while in thepopulation of Jammu and Kashmir, TT-CC combinationconferred 1.5–2 fold protection towards T2D and ESRD(Table 5).
Discussion
In this study we have evaluated that g.869T > C andg.-509C > T polymorphisms of TGF-b1 are associated withT2D and progression to ESRD among T2D cases. The presentreport is the first study conducted in the population of Punjaband Jammu and Kashmir evaluating the association of thesepolymorphisms with the risk of developing ESRD in T2Dpatients. Most of the previously reported studies have com-pared T2D and DN with each other rather with healthycontrols, which can give inconclusive association andmoreover, the DN cases included were of all stages (fromglomerular hyperfiltration to ESRD) (Prasad et al., 2007;
FIG. 1. Distribution of allele and genotype frequencies of TGF-b1 g.869T > C polymorphism in two studiedpopulations.
TGF IN DIABETES AND RENAL DISEASE 5
Ta
ble
3.
Co
mpa
riso
no
fA
llele
an
dG
en
oty
pe
Freq
uen
cies
of
TG
F-b
1g
.869T
>C
an
dg
.-509C
>T
Po
ly
mo
rph
ism
sin
Tw
oS
tu
died
Po
pu
la
tio
ns
TG
F-b
1P
opula
tion
of
Punja
bP
unja
bof
Jam
mu
and
Kash
mir
g.8
69T
>C
Tota
lT
2D
vsC
ontr
ols
T2D
wit
hE
SR
Dvs
Contr
ols
T2D
wit
hout
ESR
Dvs
Contr
ols
T2D
wit
hE
SR
Dvs
T2D
wit
hout
ESR
DT
ota
lT
2D
vsC
ontr
ols
T2D
wit
hE
SR
Dvs
Contr
ols
T2D
wit
hout
ESR
Dvs
Contr
ols
T2D
wit
hE
SR
Dvs
T2D
wit
hout
ESR
D
Gen
oty
pes
p=
0.0
05*
p=
0.0
01*
p=
0.1
05
p=
0.1
91
p=
0.0
18*
p=
0.0
09*
p=
0.1
49
p=
0.4
76
All
eles
p=
0.0
008*
p=
0.0
002*
p=
0.0
31*
p=
0.1
04
p=
0.0
03*
p=
0.0
01*
p=
0.0
43*
p=
0.1
97
1.4
9(1
.18–1.8
9)
OR
=1.6
9(1
.28–2.2
2)
OR
=1.3
3(1
.03–1.7
5)
OR
=1.2
7(0
.95–1.6
7)
OR
=1.5
2(1
.15–2.0
)O
R=
1.7
2(1
.23–2.3
8)
OR
=1.3
9(1
.01–1.8
9)
OR
=1.2
3(0
.89–1.6
9)
Dom
inan
tm
odel
(TC
+C
Cvs
TT
)p
=0.0
17**
p=
0.0
10**
p=
0.0
17**
p=
0.3
17
p=
0.1
15
p=
0.0
02**
p=
0.1
03
p=
0.2
95
OR
=1.5
2(1
.08–2.1
4)
OR
=1.6
9(1
.13–2.5
1)
OR
=1.5
2(1
.08–2.1
4)
OR
=1.2
0(0
.83–1.7
5)
OR
=1.3
9(0
.93–2.0
8)
OR
=2.2
6(1
.36–3.7
5)
OR
=1.3
9(0
.93–2.0
8)
OR
=1.2
7(0
.82–1.9
2)
Rec
essi
ve
model
(CC
vsT
T+
TC
)p
=0.1
68
p=
0.0
01**
p=
0.2
41
p=
0.0
76
p=
0.1
09
p=
0.0
001**
p=
0.1
13
p=
0.3
30
OR
=1.5
7(0
.83–2.9
7)
OR
=3.0
8(1
.55–6.0
9)
OR
=1.4
5(0
.78–2.7
0)
OR
=1.6
9(0
.94–3.0
3)
OR
=1.7
8(0
.88–3.5
5)
OR
=4.4
7(1
.99–10.0
5)
OR
=1.7
2(0
.87–3.4
5)
OR
=1.3
5(0
.74–2.5
)
Codom
inan
tm
odel
(TC
vsT
T+
CC
)p
=0.1
05
p=
0.2
10
p=
0.1
39
p=
0.9
00
p=
0.3
11
p=
0.2
91
p=
0.4
78
p=
0.7
04
OR
=1.2
8(0
.95–1.7
3)
OR
=1.2
6(0
.88–1.8
2)
OR
=1.2
9(0
.92–1.8
2)
OR
=0.9
8(0
.67–1.4
2)
OR
=1.2
1(0
.84–1.7
4)
OR
=1.2
7(0
.82–1.9
6)
OR
=1.1
6(0
.77–1.7
6)
OR
=1.0
9(0
.70–1.6
9)
TG
F-b
1P
opula
tion
of
Punja
bP
unja
bof
Jam
mu
and
Kash
mir
g.-
509C
>T
Tota
lT
2D
vsC
ontr
ols
T2D
wit
hE
SR
Dvs
Contr
ols
T2D
wit
hout
ESR
Dvs
Contr
ols
T2D
wit
hE
SR
Dvs
T2D
wit
hout
ESR
DT
ota
lT
2D
vsC
ontr
ols
T2D
wit
hE
SR
Dvs
Contr
ols
T2D
wit
hout
ESR
Dvs
Contr
ols
T2D
wit
hE
SR
Dvs
T2D
wit
hout
ESR
D
Gen
oty
pes
p=
0.2
92
p=
0.1
34
p=
0.7
48
0.4
63
p=
0.0
05*
p=
0.0
02*
p=
0.0
60
p=
0.4
03
All
eles
p=
0.0
99
p=
0.0
34*
p=
0.4
30
p=
0.1
91
p=
0.0
01*
p=
0.0
005*
p=
0.0
19*
p=
0.2
23
OR
=1.2
3(0
.96–1.5
9)
OR
=1.3
9(1
.02–1.8
9)
OR
=1.1
2(0
.84–1.5
2)
OR
=1.2
3(0
.90–1.6
9)
OR
=1.7
5(1
.25–2.4
4)
OR
=2.0
(1.3
5–2.9
4)
OR
=1.5
9(1
.08–2.3
3)
OR
=1.2
5(0
.87–1.8
2)
Dom
inan
tm
odel
(CT
+T
Tvs
CC
)p
=0.1
33
p=
0.0
58
p=
0.4
56
p=
0.2
54
p=
0.0
28*
p=
0.0
17**
p=
0.0
28**
p=
0.3
63
OR
=1.2
7(0
.93–1.6
9)
OR
=1.4
3(0
.99–2.0
4)
OR
=1.1
4(0
.81–1.6
1)
OR
=1.2
5(0
.85–1.8
2)
OR
=1.6
4(1
.06–2.5
4)
OR
=1.9
0(1
.12–3.2
1)
OR
=1.6
4(1
.06–2.5
4)
OR
=1.2
3(0
.79–1.9
2)
Rec
essi
ve
model
(TT
vsC
C+
CT
)p
=0.3
45
p=
0.2
01
p=
0.6
91
p=
0.3
93
p=
0.1
59
p=
0.0
24**
p=
0.1
65
p=
0.2
23
OR
=1.3
5(0
.72–2.5
0)
OR
=1.5
9(0
.78–3.2
3)
OR
=1.1
6(0
.56–2.3
8)
OR
=1.3
7(0
.66–2.8
6)
OR
=2.6
8(0
.68–10.5
6)
OR
=5.4
5(1
.25–23.8
2)
OR
=2.5
6(0
.65–10.0
)O
R=
1.8
5(0
.68–5.0
)
Codom
inan
tm
odel
(CT
vsC
C+
TT
)p
=0.2
78
p=
0.1
88
p=
0.5
60
p=
0.4
63
p=
0.0
80
p=
0.1
43
p=
0.0
76
p=
0.7
10
OR
=1.1
9(0
.87–1.6
4)
OR
=1.2
9(0
.88–1.9
0)
OR
=1.1
2(0
.77–1.6
1)
OR
=1.1
6(0
.78–1.7
3)
OR
=1.4
9(0
.95–2.3
4)
OR
=1.5
0(0
.87–2.5
7)
OR
=1.5
0(0
.96–2.3
4)
OR
=1.0
9(0
.69–1.7
2)
*p
<0.0
5is
consi
der
edsi
gnifi
cant,
**p
val
ue
corr
ecte
dfo
rag
e,se
x,
BM
I,an
dW
HR
.
6
Valladares-Salgado et al., 2010). So the present study en-rolled only the last stage DN cases with ESRD and comparedthem with both T2D and healthy controls to get irrefutableresults.
The TGF-b1 polymorphisms (g.869T > C and g.-509C > T) are often associated with circulating concentration ofTGF-b1 protein (Wong et al., 2003). The g.869T > C poly-morphism at exon 1 position encoding the signal peptideresults in the replacement of a leucine with proline at aminoacid position 10 in the signal sequence (Li et al., 1999). It isspeculated that this Leucine to Proline change (missensemutation) results in modifications in amino acid compositionof the peptide, which affects its polarity and leads to differingrates of protein export (Wood et al., 2000). The C allele(proline) of this polymorphism was responsible 2.8-foldhigher secretion of TGF-b1 and was also associated with highserum concentrations of TGF-b1. The g.-509C > T promoterSNP of the TGF-b1 gene results in increased plasma levels ofTGF-b1, due to transcriptional suppression by activatorprotein-1 (AP1) binding T allele of -509 TGF- b1. IncreasedTGF-b1 levels are often associated with the -509T allelebecause of the loss of negative regulation by AP1 (Shahet al., 2006).
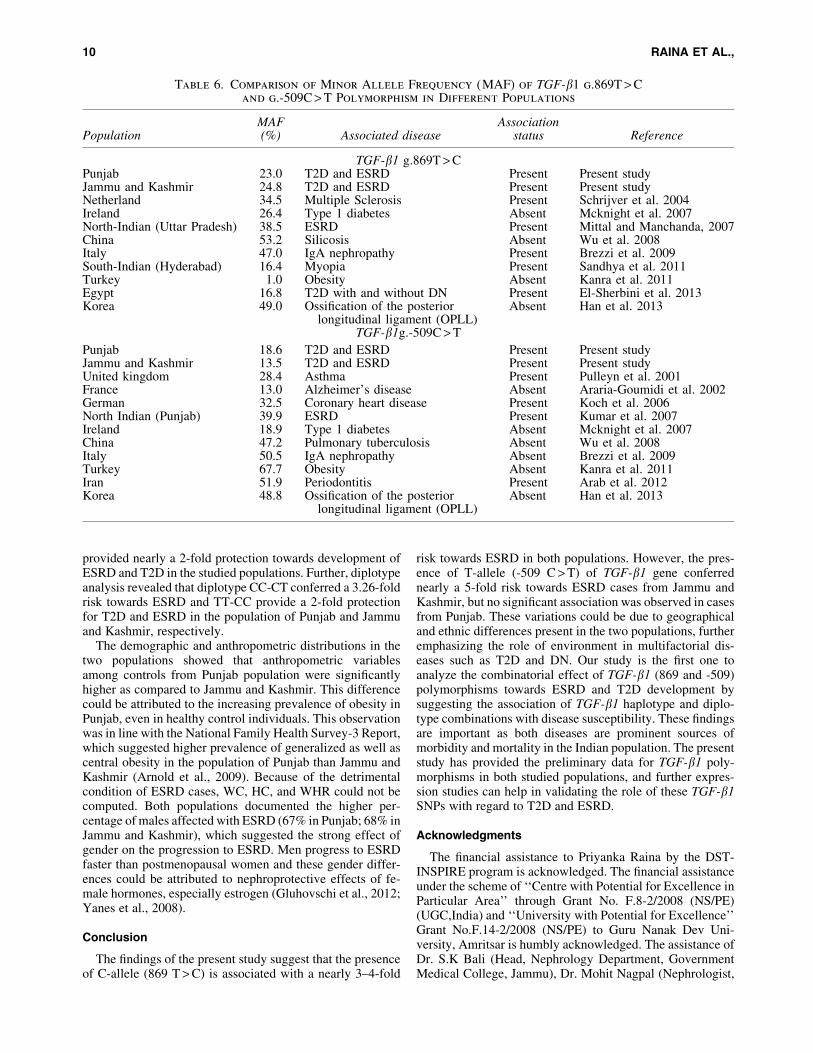
The analysis of TGF-b1 g.869T > C and g.-509C > Tpolymorphisms in the present studied populations revealedthat MAF of TGF-b1 g.869T > C polymorphism was slightlyhigher in the population of Jammu and Kashmir (24.8%) ascompared to that in the population of Punjab (23.0%). Incontrast for g.-509C > T promoter polymorphism, MAF washigher in the population of Punjab (18.6%) in comparison tothe population of Jammu and Kashmir (13.5%). The disparitywas observed for both SNPs in different populations shown inTable 6. This difference observed in the MAF could be at-tributed to ethnic heterogeneity and population diversity(Cross et al., 2010).
In the present study, 869 C allele and the CC genotypeprovided a risk for development of T2D and ESRD in both
population groups. Further genetic model analysis also re-vealed that the CC genotype provided a higher risk as com-pared to the TC + CC genotype combination for ESRDmanifestation. Similar trends were reported by a study on anEgyptian population where frequency of C-allele was higherin cases (both total T2D and T2D with ESRD) as compared tocontrols, and the TC genotype was providing 2–2.7-fold risktowards T2D and ESRD development (El-Sherbini et al.,2013). TGF-b1 g.869T > C polymorphism was observed toprovide risk towards DN in Mexican (Valladares-salgadoet al., 2010) and Chinese populations (Wong et al., 2003) andtowards ESRD in a North Indian population (Mittal andManchanda, 2007). Contrarily, reports on German andSpanish populations concluded that 869T allele rather than Callele was associated with ESRD susceptibility (Babel et al.,2006; Coll et al., 2004).
For TGF-b1 g.-509C > T polymorphism, the only signifi-cant difference observed in the population of Punjab was foralleles, when ESRD cases were compared with controls,where the -509T allele provided significant risk for the de-velopment of ESRD. However, in the population of Jammuand Kashmir, the -509T allele provided risk for the devel-opment of both T2D and ESRD and the -509TT genotypeconferred nearly 5-fold risk towards ESRD progressionamong T2D cases. Similar results were reported by anotherstudy on Punjab population where -509T allele and the TTgenotype frequency was higher in ESRD cases as comparedto controls; however, the significant difference could be at-tributed only for genotypes (Kumar et al., 2007). Though astudy on Asian Indians revealed higher frequency of T alleleamong chronic renal insufficiency patients, yet no significantdifference was attained (Prasad et al., 2007). Similarly, astudy on an Irish population also reported no significant as-sociation of -509 alleles with disease susceptibility(McKnight et al., 2007). These contrasting reports for boththe polymorphisms emphasize the need to carry out addi-tional studies in other populations. Moreover, there is a
FIG. 2. Distribution of allele and genotype frequencies of TGF-b1 g.509C > T polymorphism in two studiedpopulations.
TGF IN DIABETES AND RENAL DISEASE 7
Ta
ble
4.
Distribu
tio
no
fH
aplo
ty
pe
Freq
uen
cy
an
dM
ea
su
re
of
LD
,O
bserv
ed
in
Co
mpa
riso
no
fT
wo
Po
ly
mo
rph
ism
so
fth
eT
GF
-b1
Gen
e
in
Ca
ses
an
dC
on
tro
ls
in
th
eS
tu
died
Po
pu
la
tio
ns
Punja
bJa
mm
uand
Kash
mir
Fre
quen
cyin
case
svs
Contr
ols
Fre
quen
cyin
case
svs
Contr
ols
Haplo
typea
T2D
wit
hE
SR
D
T2D
wit
hout
ESR
DC
ontr
ols
pa
OR
(95%
CI)
ap
bO
R(9
5%
CI)
b
T2D
wit
hE
SR
D
T2D
wit
hout
ESR
DC
ontr
ols
pa
OR
(95%
CI)
ap
bO
R(9
5%
CI)
b
(TG
F-b
869
)T-C
(TG
F-b
-509
)0.5
67
0.6
18
0.6
54
0.0
05*
0.6
9(0
.53–0.8
9)
0.2
20
0.8
6(0
.68–1.1
0)
0.5
42
0.5
84
0.6
72
0.0
004*
0.5
8(0
.43–0.7
9)
0.0
13*
0.6
9(0
.51–0.9
2)
(TG
F-b
869
)C-C
(TG
F-b
-509
)0.1
93
0.1
78
0.1
60
0.1
78
1.2
5(0
.90–1.7
3)
0.4
59
1.1
2(0
.82–1.5
3)
0.2
21
0.2
18
0.1
93
0.3
47
1.1
8(0
.82–1.7
1)
0.4
18
1.1
6(0
.82–1.6
4)
(TG
F-b
869
)T-T
(TG
F-b
-509
)0.0
98
0.0
96
0.1
15
0.3
44
0.8
2(0
.55–1.2
3)
0.2
59
0.8
2(0
.55–1.1
7)
0.0
98
0.1
03
0.0
80
0.4
01
1.2
3(0
.73–2.0
8)
0.3
11
1.2
9(0
.80–2.1
1)
(TG
F-b
869
)C-T
(TG
F-b
-509
)0.1
43
0.1
08
0.0
70
0.0
004*
2.2
3(1
.48–3.3
8)
0.0
19*
1.6
4(1
.08–2.4
9)
0.1
39
0.0
95
0.0
55
0.0
004*
2.8
0(1
.63–4.8
0)
0.0
26*
1.8
6(1
.06–3.2
6)
LD
mea
sure
T2D
wit
hE
SR
DT
2D
wit
hout
ESR
DC
ontr
ols
T2D
wit
hE
SR
DT
2D
wit
hout
ESR
DC
ontr
ols
g.
+869T
>C
and
g.-
509
C>
TD
¢r2
D¢
r2D
¢r2
D¢
r2D
¢r2
D¢
r2
0.4
22
0.1
12
0.3
68
0.0
87
0.1
52
0.0
18
0.3
68
0.0
75
0.2
43
0.0
32
0.1
76
0.0
15
aO
rder
of
SN
Ps
inT
GF
-b1
hap
loty
pes
:869T
>C
,-5
09
C>
T;
*p
<0.0
5,
OR
-O
DD
sra
tio,
CI-
Confi
den
cein
terv
al.
pa
(p
val
ue
for
T2D
wit
hE
SR
Dvs
Contr
ols
);p
b(p
-val
ue
for
T2D
wit
hout
ES
RD
vsC
ontr
ols
).O
Ra
(odds
rati
ofo
rT
2D
wit
hE
SR
Dvs
Contr
ols
);O
Rb
(odds
rati
ofo
rT
2D
wit
hE
SR
Dvs
Contr
ols
).
8
paucity of studies that have compared the role of thesepolymorphisms in T2D and DN.
Most recent studies have investigated the effect of haplo-types and diplotypes in order to obtain a more comprehensiveanalysis of the role of polymorphisms in the susceptibility to
T2D and DN (El-Sherbini et al., 2013; Valladares-Salgadoet al., 2010). The joint effect of TGF-b1 (869 and -509)polymorphisms towards T2D and DN has also not yet beenstudied. The haplotype C-T was observed to confer nearly a2–3-fold risk towards T2D and ESRD whereas haplotype T-C
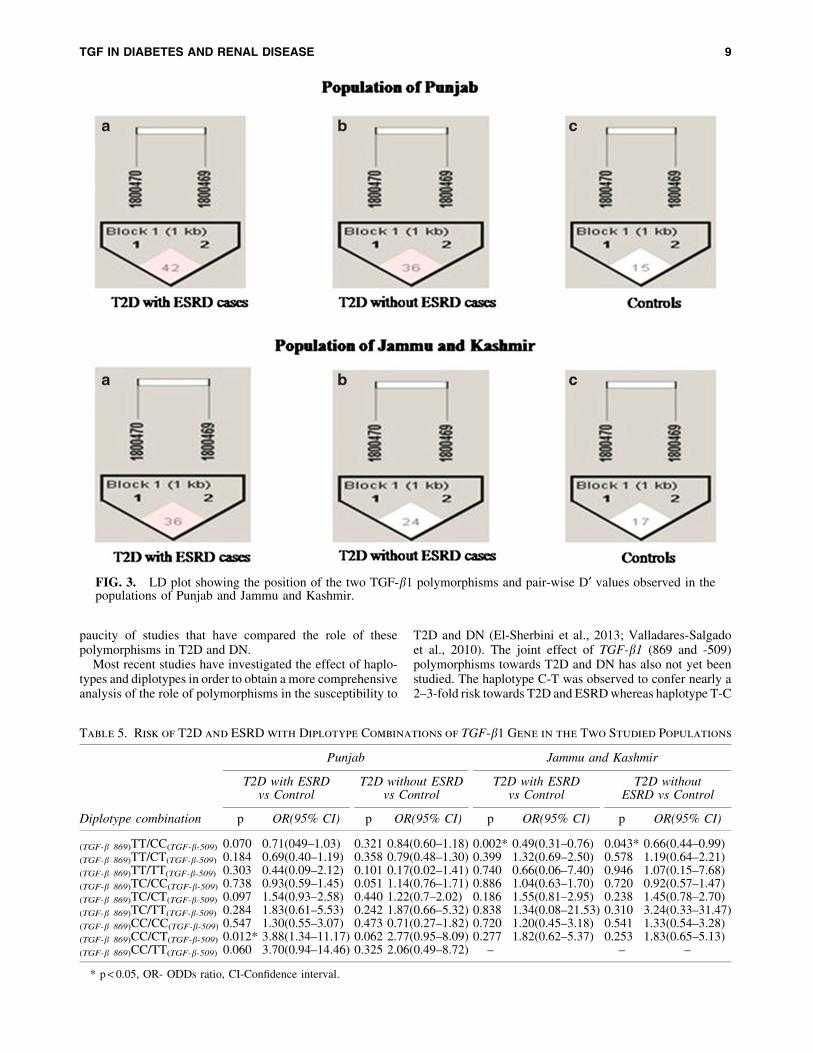
FIG. 3. LD plot showing the position of the two TGF-b1 polymorphisms and pair-wise D¢ values observed in thepopulations of Punjab and Jammu and Kashmir.
Table 5. Risk of T2D and ESRD with Diplotype Combinations of TGF-b1 Gene in the Two Studied Populations
Punjab Jammu and Kashmir
T2D with ESRDvs Control
T2D without ESRDvs Control
T2D with ESRDvs Control
T2D withoutESRD vs Control
Diplotype combination p OR(95% CI) p OR(95% CI) p OR(95% CI) p OR(95% CI)
(TGF-b 869)TT/CC(TGF-b-509) 0.070 0.71(049–1.03) 0.321 0.84(0.60–1.18) 0.002* 0.49(0.31–0.76) 0.043* 0.66(0.44–0.99)
(TGF-b 869)TT/CT(TGF-b-509) 0.184 0.69(0.40–1.19) 0.358 0.79(0.48–1.30) 0.399 1.32(0.69–2.50) 0.578 1.19(0.64–2.21)
(TGF-b 869)TT/TT(TGF-b-509) 0.303 0.44(0.09–2.12) 0.101 0.17(0.02–1.41) 0.740 0.66(0.06–7.40) 0.946 1.07(0.15–7.68)
(TGF-b 869)TC/CC(TGF-b-509) 0.738 0.93(0.59–1.45) 0.051 1.14(0.76–1.71) 0.886 1.04(0.63–1.70) 0.720 0.92(0.57–1.47)
(TGF-b 869)TC/CT(TGF-b-509) 0.097 1.54(0.93–2.58) 0.440 1.22(0.7–2.02) 0.186 1.55(0.81–2.95) 0.238 1.45(0.78–2.70)
(TGF-b 869)TC/TT(TGF-b-509) 0.284 1.83(0.61–5.53) 0.242 1.87(0.66–5.32) 0.838 1.34(0.08–21.53) 0.310 3.24(0.33–31.47)
(TGF-b 869)CC/CC(TGF-b-509) 0.547 1.30(0.55–3.07) 0.473 0.71(0.27–1.82) 0.720 1.20(0.45–3.18) 0.541 1.33(0.54–3.28)
(TGF-b 869)CC/CT(TGF-b-509) 0.012* 3.88(1.34–11.17) 0.062 2.77(0.95–8.09) 0.277 1.82(0.62–5.37) 0.253 1.83(0.65–5.13)
(TGF-b 869)CC/TT(TGF-b-509) 0.060 3.70(0.94–14.46) 0.325 2.06(0.49–8.72) – – –
* p < 0.05, OR- ODDs ratio, CI-Confidence interval.
TGF IN DIABETES AND RENAL DISEASE 9
provided nearly a 2-fold protection towards development ofESRD and T2D in the studied populations. Further, diplotypeanalysis revealed that diplotype CC-CT conferred a 3.26-foldrisk towards ESRD and TT-CC provide a 2-fold protectionfor T2D and ESRD in the population of Punjab and Jammuand Kashmir, respectively.
The demographic and anthropometric distributions in thetwo populations showed that anthropometric variablesamong controls from Punjab population were significantlyhigher as compared to Jammu and Kashmir. This differencecould be attributed to the increasing prevalence of obesity inPunjab, even in healthy control individuals. This observationwas in line with the National Family Health Survey-3 Report,which suggested higher prevalence of generalized as well ascentral obesity in the population of Punjab than Jammu andKashmir (Arnold et al., 2009). Because of the detrimentalcondition of ESRD cases, WC, HC, and WHR could not becomputed. Both populations documented the higher per-centage of males affected with ESRD (67% in Punjab; 68% inJammu and Kashmir), which suggested the strong effect ofgender on the progression to ESRD. Men progress to ESRDfaster than postmenopausal women and these gender differ-ences could be attributed to nephroprotective effects of fe-male hormones, especially estrogen (Gluhovschi et al., 2012;Yanes et al., 2008).
Conclusion
The findings of the present study suggest that the presenceof C-allele (869 T > C) is associated with a nearly 3–4-fold
risk towards ESRD in both populations. However, the pres-ence of T-allele (-509 C > T) of TGF-b1 gene conferrednearly a 5-fold risk towards ESRD cases from Jammu andKashmir, but no significant association was observed in casesfrom Punjab. These variations could be due to geographicaland ethnic differences present in the two populations, furtheremphasizing the role of environment in multifactorial dis-eases such as T2D and DN. Our study is the first one toanalyze the combinatorial effect of TGF-b1 (869 and -509)polymorphisms towards ESRD and T2D development bysuggesting the association of TGF-b1 haplotype and diplo-type combinations with disease susceptibility. These findingsare important as both diseases are prominent sources ofmorbidity and mortality in the Indian population. The presentstudy has provided the preliminary data for TGF-b1 poly-morphisms in both studied populations, and further expres-sion studies can help in validating the role of these TGF-b1SNPs with regard to T2D and ESRD.
Acknowledgments
The financial assistance to Priyanka Raina by the DST-INSPIRE program is acknowledged. The financial assistanceunder the scheme of ‘‘Centre with Potential for Excellence inParticular Area’’ through Grant No. F.8-2/2008 (NS/PE)(UGC,India) and ‘‘University with Potential for Excellence’’Grant No.F.14-2/2008 (NS/PE) to Guru Nanak Dev Uni-versity, Amritsar is humbly acknowledged. The assistance ofDr. S.K Bali (Head, Nephrology Department, GovernmentMedical College, Jammu), Dr. Mohit Nagpal (Nephrologist,
Table 6. Comparison of Minor Allele Frequency (MAF) of TGF-b1 g.869T > Cand g.-509C > T Polymorphism in Different Populations
PopulationMAF(%) Associated disease
Associationstatus Reference
TGF-b1 g.869T > CPunjab 23.0 T2D and ESRD Present Present studyJammu and Kashmir 24.8 T2D and ESRD Present Present studyNetherland 34.5 Multiple Sclerosis Present Schrijver et al. 2004Ireland 26.4 Type 1 diabetes Absent Mcknight et al. 2007North-Indian (Uttar Pradesh) 38.5 ESRD Present Mittal and Manchanda, 2007China 53.2 Silicosis Absent Wu et al. 2008Italy 47.0 IgA nephropathy Present Brezzi et al. 2009South-Indian (Hyderabad) 16.4 Myopia Present Sandhya et al. 2011Turkey 1.0 Obesity Absent Kanra et al. 2011Egypt 16.8 T2D with and without DN Present El-Sherbini et al. 2013Korea 49.0 Ossification of the posterior
longitudinal ligament (OPLL)Absent Han et al. 2013
TGF-b1g.-509C > T
Punjab 18.6 T2D and ESRD Present Present studyJammu and Kashmir 13.5 T2D and ESRD Present Present studyUnited kingdom 28.4 Asthma Present Pulleyn et al. 2001France 13.0 Alzheimer’s disease Absent Araria-Goumidi et al. 2002German 32.5 Coronary heart disease Present Koch et al. 2006North Indian (Punjab) 39.9 ESRD Present Kumar et al. 2007Ireland 18.9 Type 1 diabetes Absent Mcknight et al. 2007China 47.2 Pulmonary tuberculosis Absent Wu et al. 2008Italy 50.5 IgA nephropathy Absent Brezzi et al. 2009Turkey 67.7 Obesity Absent Kanra et al. 2011Iran 51.9 Periodontitis Present Arab et al. 2012Korea 48.8 Ossification of the posterior
longitudinal ligament (OPLL)Absent Han et al. 2013
10 RAINA ET AL.,
Fortis Escorts Hospital, Amritsar), and Dr. P.S Mokha (Head,Mokha Hospital, Amritsar) in sample collection is alsohumbly acknowledged.
Author Disclosure Statement
The authors declare they have no competing financialinterests.
References
Ahluwalia TS, Khullar M, Ahuja M, et al. (2009). Commonvariants of inflammatory cytokine genes are associated withrisk of nephropathy in type 2 diabetes among Asian Indians.PLoS One 4, e5168.
American Diabetes Association. (ADA) (2011). Diagnosis andclassification of diabetes mellitus. Diabetes Care 34, s62–69.
Arnold F, Parasuraman S, Arokiasamy P, and Kothari M.(2009). Nutrition in India, National family health survey-3.Retrieved on July 12, 2013. http://www.nfhsindia.org/nfhs3.pdf.
Babel N, Gabdrakhmanova L, Hammer MH, SchoenemannC, Skrypnikov V, Poliak N, Volk HD, and Reinke P. (2006).Predictive value of cytokine gene polymorphisms for the de-velopment of end-stage renal disease. J Nephrol 19, 802–807.
Bhatti JS, Bhatti GK, Joshi A, et al. (2007). Identification of therisk factors for the high prevalence of type 2 diabetes and itscomplications in a Punjabi population: North Indian DiabetesStudy: A case-control study. Intl J Diabetes Devel Countries27, 108–115.
Coll E, Cormand B, Campos B, Gonzalez-Nunez D, InigoP, Botey A, and Poch E. (2004). Association of TGF-beta1polymorphisms with chronic renal disease. J Nephrol 17,794–799.
Coresh J, Selvin E, Stevens LA, et al. (2007). Prevalenceof chronic kidney disease in the United States. JAMA 298,2038–2047.
Cross DS, Ivacic LC, Stefanski EL, and McCarty CA. (2010).Population based allele frequencies of disease associatedpolymorphisms in the Personalized Medicine Research Pro-ject. BMC Genetics 11, 51–65.
Dixon JB, Bhathal PS, Jonsson JR, Dixon AF, Powell EE, andO’Brien PE. (2003). Pro-fibrotic polymorphisms predictive ofadvanced liver fibrosis in the severely obese. J Hepatol 39,967–971.
El-Sherbini SM, Shahen SM, Mosaad YM, Abdelgawad MS,and Talaat RM. (2013). Gene polymorphism of transforminggrowth factor-b1 in Egyptian patients with type 2 diabetesand diabetic nephropathy. Acta Biochim Biophys Sinica 45,330–338.
Gluhovschi GH, Gluhovschi A, Anastasiu D, Petrica L, Glu-hovschi C, and Velciov S. (2012). Chronic kidney disease andthe involvement of estrogen hormones in its pathogenesis andprogression. Roman J Int Med 50, 135–144.
Katz A, Caramori ML, Sisson-Ross S, Groppoli T, Basgen JM,and Mauer M. (2002). An increase in the cell component ofthe cortical interstitium antedates interstitial fibrosis in type 1diabetic patients. Kidney Intl 61, 2058–2066.
Khalil MS, El Nahas AM, and Blakemore AI. (2005). Trans-forming growth factor-beta1 SNPs: Genetic and phenotypiccorrelations in progressive kidney insufficiency. NephronExper Nephrol 101, e31–41.
Kumar K, Gupta V, Singh A, Mohindru K, Choudhary M, andSehajpal PK. (2007). Transforming growth factor-b1 C-509T
promoter polymorphism in end stage renal disease. J Bio-technol 1, 29–36.
Levey AS, De Jong PE, Coresh J, et al. (2011). The definition,classification, and prognosis of chronic kidney disease:A KDIGO Controversies Conference report. Kidney Intl 80,17–28.
Lui SF, Ho YW, Chau KF, Leung CB, and Choy BY. (1999).Renal Registry 1995–1999 Hong Kong. J Nephrol 1, 53–60.
Mahajan A, Sharma S, Dhar MK, and Bamezai RNK. (2013).Risk factors of type 2 diabetes in population of Jammu andKashmir, India. J Biomed Res 27, 372–379.
McDonough CW, Palmer ND, Hicks PJ, et al. (2011). A ge-nome-wide association study for diabetic nephropathy genesin African Americans. Kidney Intl 79, 563–572.
McKnight AJ, Savage DA, Patterson CC, Sadlier D, andMaxwell AP. (2007). Resequencing of genes for transforminggrowth factor beta1 (TGFB1) type 1 and 2 receptors(TGFBR1, TGFBR2), and association analysis of variantswith diabetic nephropathy. BMC Med Genetics 23, 8–5.
Miller SA, Dykes DD, and Polesky HF. (1988). A simplesalting out procedure for extracting DNA from human nu-cleated cells. Nucleic Acids Res 16, 1215.
Mittal RD, and Manchanda PK. (2007). Is low-frequency dis-tribution of TGF-beta genotype associated with increased riskfor end-stage renal disease? DNA Cell Biol 26, 172–177.
Paniagua R, Ramos A, Fabian R, Lagunas J, and Amato D.(2007). Chronic kidney disease and dialysis in Mexico. PeritDialysis Intl 27, 405–409.
Park KS, Shin HD, Park BL, et al. (2005). Genetic polymor-phisms in the transforming growth factor beta-induced geneassociated with BMI. Human Mutat 25, 322.
Perrey C, Turner SJ, Pravica V, Howell WM, and HutchinsonIV. (1999). ARMS-PCR methodologies to determine IL-10,TNF-a, TNF-b and TGFb1 gene polymorphisms. TransplantImmunol 7, 127–128.
Prasad P, Tiwari AK, Kumar KM, Ammini AC, Gupta A, GuptaR, and Thelma BK. (2007). Association of TGF beta1, TNFalpha, CCR2 and CCR5 gene polymorphisms in type-2 dia-betes and renal insufficiency among Asian Indians. BMCMed Genetics 8, 20.
Raina P, Matharoo K, and Bhanwer AJS. (2014). Monocytechemoattractant protein-1 (MCP-1) g.-2518A > G poly-morphism and susceptibility to type 2 diabetes (T2D) andend stage renal disease (ESRD) in the North-West In-dian population of Punjab. Ann Human Biol doi:10.3109/03014460.2014.94193.
Shah R, Hurley CK, and Posch PE. (2006). A molecularmechanism for the differential regulation of TGF-beta1 ex-pression due to the common SNP -509C-T (c. - 1347C > T).Human Genetics 120, 461–469.
Shah R, Rahaman B, Hurley CK, and Posch PE. (2006). Allelicdiversity in the TGFB1 regulatory region: Characterization ofnovel functional single nucleotide polymorphisms. HumanGenetics 119, 61–74.
Sharma K, and Ziyadeh FN. (1995) Hyperglycemia and diabetickidney disease: The case for transforming growth factor-betaas a key mediator. Diabetes 44, 1139–1146.
Skol AD, Scott LJ, Abecasis GR, and Boehnke M. (2006). Jointanalysis is more efficient than replication-based analysis fortwo-stage genome-wide association studies. Nature Genetics38, 209–213.
Stumvoll M, Goldstein BJ, and van Haeften TW. (2005). Type 2diabetes: Principles of pathogenesis and therapy. Lancet 365,1333–1346.
TGF IN DIABETES AND RENAL DISEASE 11
Unnikrishnan RI, Rema M, Pradeepa R, Deepa M, ShanthiraniCS, Deepa R, and Mohan V. (2007) Prevalence and riskfactors of diabetic nephropathy in an urban South Indianpopulation the Chennai Urban Rural Epidemiology Study(CURES 45). Diabetes Care 30, 2019–2024.
Valladares-Salgado A, Angeles-Martınez J, Rosas M, et al. (2010).Association of polymorphisms within the transforming growthfactor-b1 gene with diabetic nephropathy and serum cholesteroland triglyceride concentrations. Nephrology 15, 644–648.
Vettor R, Milan G, Rossato M, and Federspil G. (2005). Adi-pocytokines and insulin resistance. Aliment PharmacolTherapeut 22, 3–10.
Vinod PB. (2012). Pathophysiology of diabetic nephropathy.Clinical Queries: Nephrology 102, 121–126.
Wangkumhang P, Chaichoompu K, Ngamphiw C, et al. (2007).WASP: A Web-based allele-specific PCR assay designing toolfor detecting SNPs and mutations. BMC Genomics 8, 275.
Wheeler E, and Barroso I. (2011). Genome-wide associationstudies and type 2 diabetes. Brief Funct Genomics 10, 52–60.
Wong TYH, Poon P, Chow KM, Szeto CC, Cheung MK, and LiPKY. (2003). Association of transforming growth factor-beta(TGF-bold beta) T869C (Leu 10Pro) gene polymorphisms
with type 2 diabetic nephropathy in Chinese. Kidney Intl 63,1831–1835.
Wood NA, Thomson SC, Smith RM, and Bidwell JL. (2000).Identification of human TGF-beta1 signal (leader) sequencepolymorphisms by PCR-RFLP. J Immunol Methods 234,117–122.
Yanes LL, Sartori-Valinotti JC, and Reckelhoff JF. (2008). Sexsteroids and renal disease lessons from animal studies. Hy-pertension 51, 976–981.
Address correspondence to:Professor AJS Bhanwer
E-mail: [email protected]
Dr. Kawaljit MatharooE-mail: [email protected]
Department of Human GeneticsGuru Nanak Dev University
Amritsar 143 005Punjab
India
12 RAINA ET AL.,