TRANSFORMING TRIATOMIC MOLECULES INTO COMPLEX ...
209
TRANSFORMING TRIATOMIC MOLECULES INTO COMPLEX FUNCTIONAL MATERIALS A Dissertation submitted to the Faculty of the Graduate School of Arts and Sciences of Georgetown University in partial fulfillment of the requirements for the degree of Doctor of Philosophy in Chemistry By Tao Yu, M. S. Washington, DC July 27, 2011
-
Upload
khangminh22 -
Category
Documents
-
view
0 -
download
0
Transcript of TRANSFORMING TRIATOMIC MOLECULES INTO COMPLEX ...
TRANSFORMING TRIATOMIC MOLECULES INTO COMPLEX
FUNCTIONAL MATERIALS
A Dissertation submitted to the Faculty of the
Graduate School of Arts and Sciences of Georgetown University
in partial fulfillment of the requirements for the degree of
Doctor of Philosophy in Chemistry
By
Tao Yu, M. S.
Washington, DC July 27, 2011

ii
Copyright 2011 by Tao Yu All Rights Reserved

iii
TRANSFORMING TRIATOMIC MOLECULES INTO COMPLEX
FUNCTIONAL MATERIALS
Tao Yu, M. S.
Thesis Advisor: Richard G. Weiss, Ph.D.
ABSTRACT
Perhaps because the dipole moment of CO2 is equal to zero, a widely held misperception is
that this triatomic gas is kinetically and thermodynamically stable under most reaction conditions.
As a result, only recently has CO2 been exploited as a useful and versatile reagent. Reactions
involving it and other neutral triatomic molecules (most notably, CS2) with substrates containing
nucleophilic functional groups are based on Lewis acid-base equilibria. This simple chemistry
can be used to form a variety of interesting new materials which are metastable or reversible in
some cases, and able to be transformed into other materials, in other cases. In this way,
molecules with controllable properties can be generated. Such molecules have been employed as
cross-linkers, to initiate self-assembly1 and to allow reversibility in functional soft materials (e.g.,
gel,2 ionic liquids,3 supramolecular structures,4 catalysts, 5 etc.) that are potentially useful in a
wide variety of applications ranging from sensing and sequestration of environmentally
deleterious molecules to the development of better materials for art conservation.6 In our work,
greater emphasis will be placed on the chemistries of CO2 and CS2 (X=C=X type molecules in
which the electronegativities of the X atoms are significantly larger than that of carbon); both
molecules are linear and have large quadrupolar moments. The electrophilic nature of the carbon

iv
atoms in molecules such as CO2 and CS2 makes them attractive reagents in organic syntheses as
well.
In this dissertation, we investigate how and why these triatomic molecules react with other
species and exploit the chemistries to synthesize complex molecules and aggregates, to change
drastically the properties of materials, and to devise new processes.
First, the syntheses and properties of a new class of chiral, reversible, room-temperature, ionic
liquids (RTILs) are investigated. They are made from easily synthesized, readily available
materials and can be transformed reversibly to their nonionic liquid states. The nonionic liquids
consist of equimolar mixtures of a N’-alkyl-N,N-dimethylacetamidine (L) and an alkyl ester (N)
of a naturally occurring amino acid. When exposed to 1 atm of CO2 gas, 1/1 (mole/mole) L/N
solutions become cationic-anionic pairs, amidinium carbamates. Of the 50 L/N combinations
examined, all except those involving the methyl ester of tyrosine (which was immiscible with the
amidines) form RTIL states under a CO2 atmosphere, and several remain liquids to at least -
18 °C. Heating the ionic liquids in air to ca. 50 °C or bubbling N2 gas through them at ambient
temperatures for protracted periods displaces the CO2 and re-establishes the nonionic L/N states.
Thermal and spectroscopic properties of both the nonionic and ionic phases are reported and
compared. Unlike many other ionic liquids, these need not be prepared and handled under
scrupulously dry conditions and they can be cycled repeatedly between their high- and low-
polarity states.
In addition, the properties of another class of reversible, room-temperature, chiral, ionic
liquids (L-A-C) are studied. The L-A-C are prepared by passing CO2 gas through equimolar
mixtures of a simple amidine (L) and a chiral amino alcohol (A), L/A, derived from a naturally-

v
occurring amino acid, and they can be returned to their L/A states by passing a displacing gas,
N2, through the ionic liquid; the process of passing from uncharged to charged states can be
repeated several times without discernible degradation of each phase. All of the 40 L/A
combinations examined form room-temperature ionic liquids (most stable to ca. 50 oC under one
atmosphere of CO2) and they remain liquids to at least -20 oC. The L-A-C phases are more
viscous than their corresponding L/A phases, the conductivities are much higher in the L-A-C
phases than in the L/A phases, and the solubility characteristics of the liquids can be modulated
significantly by exposing them to either CO2 or N2 gas. The spectroscopic characteristics of the
L/A and L-A-C phases have been compared as well. Their reversibility, chirality, broad
temperature ranges, tolerance to water, and, ease of preparation should make the L/A and L-A-C
phases useful as solvents for several ‘green’ applications.
Also, by adding one equivalent of another triatomic molecule, CS2 to an equimolar mixture
of two non-ionic molecules, an amidine and an amine with diverse structures, amidinium
dithiocarbamates salts are easily prepared. Many of the salts made in this way are RTILs and are
thermally stable to ~80 oC, a temperature significantly higher than the decomposition
temperatures of analogous amidinium carbamate RTILs. However, unlike the amidinium
carbamates, the amidinium dithiocarbamates do not revert to their amidine/amine mixtures when
they are heated. The thermal, rheological, conductance and spectroscopic properties of these
RTILs are reported, comparisons between them and their non-ionic phases (as well as with their
amidinium carbamates analogues) are made, and the thermolysis pathways of the ammonium
dithiocarbamates are investigated. In addition, the above-mentioned in situ-prepared, reversible
vi
RTILs have been used as media for the syntheses of cyclic carbonates by addition of CO2 to
epoxides.
The similar approach has been explored to develop functional polymers. The physical
properties of five siloxane polymers with different types and frequencies of amino functional
groups along the polymer side-chains have been changed from flowing liquids to gels and to
rubber-like materials by the simple addition or subtraction of CO2 or CS2 at room temperature.
The chemical changes, formation of ammonium carbamates and ammonium dithiocarbamates,
create materials whose properties are completely different from the parent polymers as a result of
the introduction of ionic crosslinks. These materials can be returned to their original forms by
heating (in the case of the CO2 adducts) or to their protonated original forms by treatment with
an acid (in the case of the CO2 and CS2 adducts). Heating the ammonium dithiocarbamates leads
to loss of H2S and permanent (covalent) thiourea crosslinks between the polymer chains. The
new materials adhere strongly to other surfaces and can be swelled to several times of their
original volumes by different liquids. The rheological, swelling, and physical properties of the
new materials have been correlated with the structures of the original polymers to provide a
comprehensive picture of how changes at the nanometric length scale are translated to
macroscopic changes. At least for the polysiloxanes examined here, the properties of the adducts
do not correlate with the molecular weights of the original polymers, but do with the frequency
of amino groups. The results demonstrate a simple, new method to crosslink polysiloxanes (and,
in principle, a wide range of other polymers), transforming them into materials with totally
different and potentially commercially useful properties. Research on swelling-deswelling

vii
behavior of crosslinked amino-polysiloxanes and possible applications for chemical spill
containment and remediation were carried out as well.

viii
ACKNOWLEDGEMENTS
The Ph.D. degree is awarded to an individual, but any individual cannot make it without the
help of others. I would like to thank all the people who have supported and helped me during my
Ph.D. study at Georgetown University.
Foremost, I would especially like to express my deepest gratitude to my mentor, Professor
Richard G. Weiss, for his guidance. I truly and deeply respect him as a mentor, a scientist, and a
friend. To me, his expertise, passion and dedication towards science is the best source to
encourage myself to move forward in the research every day. I have been fortunate to learn and
work in Weiss’ lab where I have been encouraged to ask “why” and give my opinions. Two most
important things I have learned in Weiss’ lab, how to conduct research and how to ask questions
will be beneficial to me throughout my science career. Also, I would like to thank past and
present Weiss’ group members that I have had pleasure to work with: Prof. Oh-Kil Kim, Dr.
Taisuke Yamada, Dr. Scilla Grassi, Dr. Rodrigo Cristiano, Dr. Shibu Abraham, Dr. Kefeng Ma,
Dr. Wenzhuo Li, Dr. V. Ajay Mallia, Dr. Alcindo Dos Santos, Gabriel Gaviola, Lora Angelova,
Ni Yan, Anna Ivanova, Mohan Zhang, Tyler Farnsworth, and Koji Wakuda. Special thanks go to
Mrs. Jeanne Weiss for her kindness and hospitality.
I am thankful to my graduate committee members, Dr. YuYe Tong, Dr. Steven Metallo, Dr.
Jong-in Hahm, Dr. Bahram Moasser, and Dr. Travis Holman for their supervision and comments
on my graduate studies.
I would like to thank other department staff members, Mr. William Craig, Mr. Mo Itani, Mr.
Earl Morris, Mrs. Yen Miller, Mrs. Kay Bayne Mr. Travis Hall and Mrs. Inez Traylor for their
assistance, and Mr. Leon Der from Physics Department, Dr. Pedro F. Aramendía and coworkers

ix
from Argentina for constructing a supercritical reaction setup. I am deeply grateful to Dr.
Ercheng Li for his assistance in NMR experiments and Dr. Christian Wolf for allowing me using
his chiral HPLC. I thank Prof. Judith (Faye) Rubinson for helpful discussions about conductivity
measurements, Prof. Daniel L. Blair of the Department of Physics, Georgetown University, and
Prof. Srinivasa Raghavan of the Department of Chemical & Biomolecular Engineering,
University of Maryland, for help in rheological studies. I also gratefully acknowledge Dr. Dimitri
Katsoulis and Mr. Kenneth E. Zimmerman of Dow-Corning Corporation for synthesizing and
providing two of the polysiloxanes used in my research, and Prof. Robert de Levie for
constructing the cell for my conductivity measurements.
Financial support by the Department of Chemistry and the Graduate School of Georgetown
University, and funding from the National Science Foundation (NSF) are greatly appreciated.
Special thanks go to the Chinese Students and Scholars Association in Georgetown University
(CSSA-GU), and the Chinese Scholarship Council (CSC) for an Outstanding Scholarship for
Chinese Students Studying Abroad.
At last, I want to express my deepest gratitude to Ms. Donna Tung and my family for their
unlimited support and love. Without them, I could not have accomplished this work.
x
TABLE OF CONTENTS
CHAPTER 1. INTRODUCTION ................................................................................................... 1
1.1 Soft matter ............................................................................................................................. 1
1.2 Ionic liquids .......................................................................................................................... 3
1.3 Triatomic molecules.............................................................................................................. 3
CHAPTER 2: REVERSIBLE, ROOM-TEMPERATURE (CHIRAL) IONIC LIQUIDS ............. 9
2.2 Reversible, room-temperature chiral ionic liquids. Amidinium carbamates derived from
amidines and amino-acid esters with carbon dioxide ............................................................... 13
2.2.1 Introduction .................................................................................................................. 13
2.2.2 Syntheses of amino esters and amidines ...................................................................... 14
2.2.3 Preparation of ionic liquids and their reconversion to amidine/amine mixtures ......... 19
2.2.4 Measurements of CO2 uptake ...................................................................................... 19
2.2.5 Results and discussion ................................................................................................. 20
2.3 Carbon dioxide and molecular nitrogen as switches between ionic and uncharged room-
temperature liquids comprised of amidines and chiral amino alcohols .................................... 34
2.3.1 Introduction .................................................................................................................. 34
2.3.2 Syntheses of amino alcohols ........................................................................................ 35
2.3.3 Conductivity measurements ......................................................................................... 37
2.3.4 Results and Discussion ................................................................................................ 38
2.3.5 Conclusions .................................................................................................................. 56
xi
2.4 In situ formation of thermally stable, room-temperature ionic liquids from CS2 and
amidine/amine mixtures. ........................................................................................................... 58
2.4.1 Introduction .................................................................................................................. 58
2.4.2 Amidinium dithiocarbamate sample preparation ......................................................... 60
2.4.3 Thermolyses. ................................................................................................................ 60
2.4.4 Density measurements ................................................................................................. 62
2.4.5 Transformation from ammonium dithiocarbamates to amidinium dithiocarbamates .. 62
2.4.6 Results and Discussion ................................................................................................ 63
2.4.7 Conclusions .................................................................................................................. 81
3. PREPARATION AND CHARACTERIZATIONS OF CROSSLINKED AMINO-
SUBSTITUTED POLYSILOXANES AND THEIR APPLICATIONS ...................................... 86
3.1 Reversibly crosslinking amino-substituted polysiloxanes by simple triatomic molecules.
Facile methods for tuning thermal, rheological, and adhesive properties ................................ 86
3.1.1 Introduction .................................................................................................................. 86
3.1.2 Instrumentation. ........................................................................................................... 89
3.1.3 Materials ...................................................................................................................... 90
3.1.4 Preparation of cross-linking polysiloxanes .................................................................. 91
3.1.5 Results and Discussion ................................................................................................ 93
3.1.6 Conclusions ................................................................................................................ 113
xii
3.2 Swelling-deswelling behavior of crosslinked amino-substituted polysiloxanes. Possible
applications for chemical spill containment and remediation ................................................. 115
3.2.1 Introduction ................................................................................................................ 115
3.2.2 Materials .................................................................................................................... 116
3.2.3 Procedure for swelling/deswelling ............................................................................. 116
3.2.4 Results and discussion ............................................................................................... 118
3.2.5 Swelling kinetic model and diffusion ........................................................................ 121
3.2.6 Second-order swelling kinetics .................................................................................. 122
3.2.7 Binary system, ........................................................................................................... 124
3.2.8 Influence of temperatures .......................................................................................... 126
3.2.9 Chemical spill containment and remediation ............................................................. 127
3.2.10 Conclusions .............................................................................................................. 129
4. SYNTHESES OF CYCLIC CARBONATES IN REUSABLE, REVERSIBLE ROOM-
TEMPERATURE IONIC LIQUIDS .......................................................................................... 130
4.1 Introduction ....................................................................................................................... 130
4.2 Materials. .......................................................................................................................... 132
4.3 Instrumentation. ................................................................................................................ 133
4.4 General experimental procedure ....................................................................................... 134
4.5 Results and discussion ...................................................................................................... 140

xiii
4.6 Conclusions ....................................................................................................................... 154
5. SUMMARY AND CONCLUSIONS ..................................................................................... 155
REFERENCES ........................................................................................................................... 158
List of Figures
Figure 2-1. Photograph of the Au electrode placed in a 1 cm glass cuvette and used in
conductivity measurements…………………………………………………………………..…..13
Figure 2-2. Percentage uptake of CO2 (%CO2) by C8/IleC1 (), C8/IleC8 (), and C8/ProC1 ()
as a function of time upon exposure to 1 atm pressure of
CO2……………………………………………………………………………………………….23
Figure 2-3. TGA curves for neat (a) C8/LeuC1 and (b) C8-LeuC1-CO2 heated from room
temperature. Curve (c) is curve (a) minus curve (b). ……………………………….…………...24
Figure 2-4. Optical micrograph of solidified C6-LeuC18-CO2 (left) and C6-IleC18-CO2 (right)
at 8 °C. Scale bar is 400 μm..…………………………………………………………………….25
Figure 2-5. DSC thermograms of C6-LeuC18-CO2 and C6-IleC18-CO2 from first cooling and
heating protocols. The heats of each subsequent cooling/heating cycle were lower than the last,
indicating progressively greater loss of CO2...…………………………………….…….……….26
Figure 2-6. IR spectra of neat C8/IleC1 (a) before and (b) after exposure to CO2....…………...26
Figure 2-7. Photographs of a 1/1 (v/v) n-decane/(C8/LeuC1) solution containing 0.3 μM Eosin
Y before (left) and after (right) CO2 bubbling for 1 min and centrifugation. The two-phase
mixture at right was reconverted to one phase at 40 ˚C by N2 bubbling (left). The chemical
structure of Eosin Y is shown at the far right. …………………………………………...……...31

xiv
Figure 2-8. Concentration dependence of chemical shifts of key protons for C8/IleC1 (open
symbols) and C8-IleC1-CO2 (closed symbols) in CDCl3: CH2N=C-N (, : 3.15- 3.35 ppm),
N=C-N(CH3)2 (, : 2.85–3.15 ppm), N=C(CH3)-N (∆, : 1.85–2.1 ppm)...………….……..32
Figure 2-9. Chemical shifts in CDCl3 solution of the protons and 13C nuclei of 350 mM
C8/IleC1 which are most sensitive to the addition and removal (by N2 bubbling) of CO2. -
CH2N=C-N ( , 3.15 – 3.35 ppm), N=C-N(CH3)2 (, 2.85 – 3.15 ppm), N=C(CH3)-N (, 1.85 –
2.1 ppm), and N=13C-N (, 158.7 – 161.2 ppm). The scale at left is for the filled data symbols;
the scale at right is for the open circles..………………………………………...……………….33
Figure 2-10. Percentage uptake of CO2 (%CO2; based upon a presumed 1/1 stoichiometry for
CO2 and amino alcohol) by 1/1(mol/mol) C8/ProOH (), C8/LeuOH ( ), and C8/ValOH ()
as a function of time upon their exposure to one atmosphere pressure of dry CO2 gas at room
temperature. Samples were stirred to increase the rate of molecular exchange at the gas-liquid
interfaces. ………………………………………………………………………………………..40
Figure 2-11. FT-IR spectra of C8/ValOH (a) and C8-ValOH-CO2 (b)………………….…….41
Figure 2-12. Chemical shifts of protons in equimolar mixtures of C6 and IleOH (open symbols)
and the corresponding amidinium carbamate (closed symbols) that are most sensitive to
concentration in CDCl3 solutions: CH2N=C-N (, : 3.20- 3.35 ppm), N=C-N(CH3)2 (, :
2.89–3.18 ppm), N=C(CH3)-N (∆, : 1.89–2.12 ppm)...……………………………………….44
Figure 2-13. Chemical shifts of the protons and carbon atoms of 350mM C6/ProOH in CDCl3
by alternating the bubbling of CO2 and N2 over three cycles. (a) -CH2N=C-N (), (b) N=C-
N(CH3)2 (), (c): N=C(CH3)-N (), and N=13C-N (). The scale at left is for the filled symbols;
the scale at right is for the open circles..….………………………………………………….….45

xv
Figure 2-14. Vertically offset IR spectra recorded sequentially for neat C6/ProOH (a), after
bubbling CO2 (i.e., C6-ProOH-CO2) (b), the compound in (b) after bubbling with N2 (c) at 50
oC, and the compound in (c) after bubbling with CO2 (d).….……………………………....…...46
Figure 2-15. Viscosities (Pa·s) at 25 oC of C8-IleOH-CO2, C8-LeuOH-CO2, C4-IleOH-CO2,
C4-LeuOH-CO2, C8/IleOH and C8/LeuOH (from top to bottom) as a function of shear stress
(Pa)..….…………………………………………………………………………………...……...46
Figure 2-16. Shear stress (Pa) versus shear rate (s-1) plots of C4-LeuOH-CO2 (green), C4-
IleOH-CO2 (black), C8-IleOH-CO2 (blue), C8-LeuOH-CO2 (red) at room
temperature..…………………………………….…………………………………………….....47
Figure 2-17. Conductivity at 25 oC of 50 wt % C8/IleOH in CHCl3 as a function of time of
bubbling CO2. The inset shows maximum conductivities at 25 oC when CO2 (at 25 oC) and N2 (at
50 oC) were bubbled through sequentially. The N2 bubbling was conducted at 50 oC to accelerate
the loss of CO2………………………………………………………………………….………..49
Figure 2-18. Conductivity of C8/IleOH as a function of CHCl3 (a) and H2O (b) concentrations
before () and after () bubbling CO2 through their solutions at room temperature..……….….51
Figure 2-19. Photographs of a 1/1 (v/v) n-decane/(C6/ProOH) solution containing 0.3 μM Eosin
Y (left) and after CO2 bubbling for 1 min and centrifugation for 3 min (right). The two-phase
system became one phase again by bubbling through N2 for 5 min at 50 oC. …………………..56
Figure 2-20. FT-IR spectra of C6/cyclohexylamine (a) and C6-cyclohexylamine-CS2 (b). ….67
Figure 2-21. NMR spectra: (a) 1H spectra of C6/cyclohexylamine (black), C6-
cyclohexylamine-CS2 (red) and C6-cyclohexylamine-CS2-N2 (blue) in CDCl3 with peak
assignments in the inset; (b) 13C spectrum of C6-cyclohexylamine-CS2 in CDCl3. ……………68

xvi
Figure 2-22. (a) 1H NMR spectra in CDCl3 of n-hexylamine-CS2 before (red) and after (black)
adding 1.0 equivalent C6 and 0.5 equivalent CS2. The blue spectrum was obtained by adding one
drop of D2O to the n-hexylamine-CS2 in CDCl3 sample as a means to verify the locations of the
N—H peaks in the red spectrum. (b) 13C NMR spectra in CDCl3 of n-hexylamine-CS2 before
(red) and after (black) adding 1.0 equivalent C6 and 0.5 equivalent CS2. The concentrations are
lower than described above. ……………………………………………………….………….…70
Figure 2-23. (a) TGA curves of C8/IleC8 (grey) and C8-IleC8-CS2 (black). (b) Isothermal TGA
curve of C8-IleC8-CS2 at 25 oC for 60 min..…………………………………………………….71
Figure 2-24. 13C NMR of tC4-t-butylamine-CS2 in D2O (black) and tC4-t-butylamine-CS2 after
treatment with acetic acid (red) in D2O……………………………………………………...…..74
Figure 2-25. (a) Conductivities of C8/hexylamine mixtures at room temperature as a function of
mol % substrate before (), after adding one equiv of CO2 () and CS2 (). (b) Conductivities of
neat C8-hexylamine-CS2 () and DBU-LeuOH-CS2 () at various
temperatures...………………………………………………………………………….…….…..76
Figure 2-26. (a) Conductivities of neat C4-hexylamine-CS2 at various temperatures. (b) Density
of C4-hexylamine-CS2 at various temperatures..…………………………………………..…….77
Figure 2-27. Log-log plot of equivalent conductivity (Λ) versus fluidity (η-1) for C4-hexylamine-
CS2. The straight line is determined by data for 1 M aqueous KCl….………………..…………78
Figure 2-28. (a) Viscosities (Pa·s) at 25 oC of neat Cn/cyclohexylamine before (white) and after
addition of CO2 (grey) or CS2 (black). (b) Viscosities (Pa·s) of C8-cyclohexylamine-CS2 (white)
and C8-IleC8-CS2 (black) at different temperatures…………………………………..…….…..80
Figure 2-29. Viscosities of neat C4-hexylamine-CS2 at various temperatures..…………….…..81

xvii
Figure 2-30. Viscosities (Pa·s) at 25 oC of C8-LeuOH-CS2, C8-LeuOH-CO2 and C8/LeuOH
(from top to bottom) as a function of shear stress (Pa)..…………………………………………86
Figure 3-1. Before (left) and after (right) bubbling CO2 through neat (6-7)PSil at 25 oC............94
Figure 3-2. Vertically offset FT-IR spectra recorded sequentially for 15PSil (a), after bubbling
CO2 (i.e., 15PSil-CO2) (b), the compound in (b) after bubbling with N2 (c) at 80 °C, and the
compound in (c) after bubbling with CO2 (d).....………………………………………….……..95
Figure 3-3. Vertically offset IR spectra of 3PSil (a), 3PSil-CO2 (b), 3PSil-CS2 (c) and 3PSil-
CS2-H (d).………………………………………………………………………………………..96
Figure 3-4. Weight percentage uptake of CO2 (%CO2) by neat (6-7)PSil as a function of time
upon exposure to 1 atm pressure of CO2. Two separate runs and their average are shown.........97
Figure 3-5. TGA curves of 3PSil-CS2-H (a) heated from room temperature, neat 3PSil (b),
3PSil-CO2 (c) and 3PSil-CS2 (d). Difference curves between 3PSil and 3PSil-CO2 curves (e) and
between 3PSil and 3PSil-CS2 curves (f) are shown as well...…………………………………...98
Figure 3-6. DSC thermograms of 15PSil-CO2. The arrows indicate starting point of the
experiment and the direction of initial temperature change..………………………………...…..99
Figure 3-7. DSC thermograms of 15PSil-CS2. The arrows indicate the starting point of the
experiment and the direction of initial temperature change. The black curve is the first heating-
cooling cycle and the red curve is the second cycle....…………………………………..………99
Figure 3-8. (a) Isothermal TGA weight loss curves of 15PSil-CO2 at various temperatures under
a nitrogen flow of 60 cc/min. From top to bottom: 25, 50, 75 and 100 oC. (b) TGA weight loss
curve of 15PSil-CO2 at 25 °C without nitrogen flow……………………………….……….…100
xviii
Figure 3-9. Photographs of (6-7)PSil-CS2 before (left) and after (right) swelling with hexane at
room temperature…. ………………………………………………………………….……..…100
Figure 3-10. Viscosities (Pa·s) of samples before and after bubbling CO2 as a function of shear
stress (Pa) at 25 oC. From top to bottom: 15PSil-CO2 (), 10PSil-CO2 (), (6-7)PSil-CO2 (),
(2-4)PSil-CO2 (), 3PSil-CO2 (♦), 15PSil (), 10PSil ( ), (2-4)PSil (), (6-7)PSil ( ) and
3PSil ( )....………………………………………………………………………………..……101
Figure 3-11. Viscosities of PSil (, right Y-axis) and PSil-CO2 (, left Y-axis) versus % amine
functionality at room temperature.……………………………………………………….….…103
Figure 3-12. Steady-shear rheology of polysiloxane samples at room temperature (25oC): the
apparent viscosities (Pa·S) of 3PSil-CS2-H (), 3PSil-CS2 (), 3PSil-CO2 () and 3PSil
()....……………………………………………………………………………………….…...104
Figure 3-13. Dynamic rheology of polysiloxane samples at room temperature (25 oC): storage
modulus (G´, solid) and loss modulus (G´´, open) of 3PSil-CS2 (, ), 3PSil-CO2 (, ) and
3PSil-CS2-H (,).....……………………………………………………………………….…..105
Figure 3-14. Storage modulus (G´, solid symbols) and loss modulus (G´´, open symbols) of
15PSil-CO2 (, ), 10PSil-CO2 (, ), (6-7)PSil-CO2 (,), and (2-4)PSil-CO2 (♦, ) at 25
oC.………………………………………………………………………………………..……..105
Figure 3-15. Storage (G´, ) and loss moduli (G´´, ) of (2-4)PSil-CS2 at 25 oC..………..…..106
Figure 3-16. Steady-shear rheology of (2-4)PSil-CS2 at 25 oC as apparent viscosities
(Pa·s)...………………………………………………………………………………………….107
Figure 3-17. Storage modulus (G´, ) and loss modulus (G´´O) at 25 oC of 15PSil with 0.2
equivalents of CS2. This amount of CS2 corresponds approximately to the same concentration of
xix
ammonium dithiocarbamate units as in fully reacted 3PSil (i.e., when it is treated with 0.5
equivalent of CS2)......………………………………………...……………………………..….108
Figure 3-18. Storage (G´, ) and loss (G´´, ) moduli of (6-7)PSil-CS2 at 25 oC......…………108
Figure 3-19. Storage (G´, ) and loss (G´´, ) moduli of (6-7)PSil-CS2 at 25 oC... .……….…109
Figure 3-20. Storage (G´, ,) and loss (G´´, O, ) moduli at 25 oC of (6-7)PSil-CS2 swelled
with CHCl3 (,O) and with ethyl acetate (, )....……………….………………………….…110
Figure 3-21. Storage (G´, ,) and loss (G´´, O, ) moduli at 25 oC of 15PSil-CS2-H (,O) and
10PSil-CS2-H (, ) after swelling with hexane.....……………………………….…………111
Figure 3-22. Maximum value of normal force of different % amine functionality polysiloxanes
before (, right Y-axis) and after (, left Y-axis) CO2 bubbling at 25 oC while lifting one plate
from the other plate starting at 0.15 mm separation and moving to a final separation of 0.5
mm.…………………………………………………………………………………………..…112
Figure 3-23. Swelling ratios of (6-7)PSIL-CS2 (red), 10PSIL-CS2 (blue), 15PSIL-CS2 (yellow)
and their PSIL-CS2-H (stripe) in 4 liquids at room temperature....……………………...….…118
Figure 3-24. Time-dependent swelling (blue) and deswelling (red) behaviors of 15PSil-CS2
(filled circles) and 15PSil-CS2-H (open circles) in THF at room temperature....………….…...121
Figure 3-25. Time-dependent swelling of (6-7)PSil-CS2 (), 10PSil-CS2 () and 15PSil-CS2 ()
in hexane at room temperature.…………………………………………………..………….….121
Figure 3-26. Best linear fits of data in Figs 3-25 according to plots of t/S versus t for swelling
15PSil-CS2 (black) and 15PSil-CS2-H (blue) by THF at room temperature.....…………….…123
Figure 3-27. Rate analysis of the swelling properties of (6-7)PSil-CS2 in THF at room
temperature………………… .…………………………………………………..………….….124

xx
Figure 3-28. Swelling ratios of 10PSil-CS2 in CH2Cl2 and ethanol solvent mixtures at room
temperature. …...…………………………………………………………………………….…125
Figure 3-29. Swelling ratio changes of 10PSil-CS2 in hexane () and THF () at various
temperatures.… ……………………………………………………………………………...…126
Figure 3-30. Photographs of water (1.05g) and 87 octane gasoline (0.2g) mixture (left), and after
adding 10PSil-CS2 (60 mg) into the mixture for 30 min (middle). The gasoline layer color is
indicated by dye (perylene). The swelling ratio before and after swelling is around 208 wt%. The
length ratio is ca. 1.40 times. Swelled PSil was removed from the mixture and only little amount
of gasoline can be observed in the vial (right). The appearances of 10PSil-CS2 before (left) and
after (right) swelling are shown in the photographs above the arrows.….…………………..…128
Figure 3-31. Three successive swelling/deswelling cycles of 38 mg 10PSil-CS2 by 0.75 g
naphtha (II) in a layer over 1.5 g water….……………………………………………………..129
Figure 4-1. High pressure CO2 generator and reaction cell (left) and temperature control setup
(right)….…………………………………………………………………………………….….133
Figure 4-2. Linear fit of weight and GC peak ratios for biphenyl/2b (a) and biphenyl/2a (b). The
respective formulas are: Y = -0.02 + 1.18X for (2a) and Y = 0.01 + 1.20X for (2b)…………..138
Figure 4-3. Influence of time on the yield of cyclic carbonate 3b from 1.40 mol/L 3a in C6-
hexylamine-CO2. at 50 oC, 25 atm of CO2 using 2mol% of LiBr () or C6-HBr () as catalyst.
Yields were calculated by 1H NMR..……………………………………………………...……147
Figure 4-4. Influence of temperature on the yield of cyclic carbonate 3b from 1.40 mol/L 3a
after 8 h, 25 atm of CO2 in C6-hexylamine-CO2 using 2 mol% of LiBr () or C6-HBr () as
catalyst. Yields were calculated by 1H NMR..…………………………………………….........147
xxi
List of Tables
Table 1-1. Physical properties of some uncharged triatomic molecules…………………..……...5
Table 2-1. Phases of neat 1/1 (mol/mol) L/N mixtures at room temperature and –18 °C (in
parentheses) before (B) and after (A) CO2 bubbling. L, S, W, and M indicate (respectively) liquid,
solid, wax, and a turbid liquid mixture which eventually separated into solid and liquid
components……………………………………………………………………………………....22
Table 2-2. Specific rotations of alkyl amines and amino acid ester, and their amidine mixtures
before and after exposure to 1 atm CO2 …………………………………………………………27
Table 2-3. Absorption maxima (λmax) of DAPNE in various solvents and RTILs. ………….....29
Table 2-4. Appearances of 1/1 (mol/mol) amidine/amino alcohol mixtures at room temperature
and at -20 oC (in parentheses) before (B) and after (A) exposure to CO2..………………...….…39
Table 2-5. Specific rotationsa of amino alcohols, and of amino alcohol/amidine mixtures before
and after exposure to 1 atm CO2 gas at 25 oC..………………………………………………..…43
Table 2-6. Conductivities of three C8 and amino alcohol combinations before and after exposing
them to CO2 for 30 min at room temperature. ………………………………………………..…49
Table 2-7. Miscibility behavior of various 1/1 (vol/vol) L-A-C/organic solvent mixtures at room
temperature.a……………………………………………………………….………………….…53
Table 2-8. Absorption maxima (λmax) of 2.4 mM DAPNE in various solvents and
RTILs………………………………………………………………….……………….……..….54
Table 2-9. Phasesa of neat 1/1 (mol/mol) L/A mixtures before (b) and after (a) adding CS2 at
room temperature and phase appearances at -20 oC in parentheses; melting points (oC) of

xxii
ammonium dithiocarbamates which are solids at room temperature are presented
numerically…………………………………………………………………………………...….63
Table 2-10. Conductivities before (b) and after (a) adding CS2 to neat and 50 wt% CHCl3
solutions of neat L/A combinations at room temperature………………………………….……75
Table 2-11. Miscibility behaviora of various mixtures of 50 vol % L-A-S ionic liquids and
organic solvents at room temperature. ……………………………………………….……….....79
Table 2-12. Absorption maxima (λmax, nm) of 2.4 mM DAPNE in various solvents and
RTILs………………………………………………………………............................................79
Table 2-13. Phasesa of neat 1/1 (mol/mol) L/A mixtures at room temperature after treating with
CO2 or CS2……………………………………………………………………………………….83
Table 2-14. Absorption maxima (λmax) of 2.4 mM DAPNE in various solvents and RTILs. .....85
Table 3-1. The viscosities (Pa·s) of samples before (B) and after (A) bubbling CO2 at 25
oC…………………………………………………………………………………………..…...103
Table 3-2. Selectivity tests: sorption of 1:1 (mol:mol) CH2Cl2:CH3CH2OH into 10PSil-CS2 at
room temperature. …………………………………………………………………………..….125
Table 4-1. Syntheses of cyclic carbonate (2b) from CO2 and 1.40 mol/L 1,2-epoxy-3-
phenoxypropane (2a) in C6-hexylamine-CO2 with various 2 mol% of metal halide
catalysts....…………………………………………………………………………………....…140
Table 4-2. Substrate (1.40 mol/L) reactivity under the same reaction conditions in C6-
hexylamine-CO2 as solventCO2 cycloaddition reaction…………………………………….….141
Table 4-3. Syntheses of cyclic carbonates with C6-HBr as catalyst in RTILs…………………142
Table 4-4. Syntheses of cyclic carbonate 2b from 2a with different amidinium halides

xxiii
catalystsa……………………………………………………………………………..……….....143
Table 4-5. Influence of CO2 pressure on the yields of cyclic carbonate 2b in C6-hexylamine-
CO2..……………………………………………………………………………………..….….146
Table 4-6. Comparison of carbamate and dithiocarbamates as RTILs on the yield of cyclic
carbonate catalyzed by C6-HBr………………………………………………………………...148
Table 4-7. Recycling tests using C6-hexylamine-CO2 and 2 mol% of LiBr or C6-HBr as catalyst
to convert 2a and CO2 to 2b………………………………………………..…………………..151
List of Schemes
Scheme 1-1. Use of primary amine-triatomic molecule adducts as gelators…………..…………2
Scheme 2-1 Reaction scheme of amidines (L) and amino acid esters (N) with CO2 (C)…….....14
Scheme 2-2 Reaction scheme of amidines (L) and amino alcohols (A) with CO2 (C)...………..35
Scheme 2-3 Reaction scheme of amidines (L) and amines with CS2 (S)..……………………....59
Scheme 2-4. Thermolysis of tC4-t-butylamine-CS2. ……………………………………..…….72
Scheme 3-1. Structures of polysiloxane samples and a general scheme for their reactions with
CO2 and CS2...……………………………………………………………………………….…...93
Scheme 4-1. Syntheses of various cyclic carbonates from cycloaddition of CO2 to epoxides.
Scheme 4-2. Diagram of the recycling procedure employed in reuse of RTIL/catalyst mixtures in
the syntheses of cyclic carbonates from CO2 and an epoxide………………………..………..140
Scheme 4-3. Reaction mechanism of carbonate syntheses from epoxide and CO2………...….149
List of abbreviations and acronyms
Instrumentation
CD…………………………..circular dichroism

xxiv
DSC………………………....differential scanning calorimetry
FT-IR………………………..Fourier transformed infrared spectroscopy
GC…………………………..gas chromatography
GC-MS…………………… ..gas chromatography-mass spectrometry
NMR………………….……..nuclear magnetic resonance
POM……………………… ..polarized optical microscopy
TGA………………………...thermogravimetric analysis
UV-Vis……………………...ultraviolet–visible spectroscopy
Amino acids, amino esters and amidines
A…………………………….amino alcohol
Cn…………………………...aliphatic amidine, n represents the length of the chain
DBU……………………........1,8-diazabicyclo[5.4.0]undec-7-ene
GlyOH………………………glycinol
Ile…………………………....isoleucine
IleOH………………………..isoleucinol
IleC1………………………....isoleucine methyl ester
L…………………………......N’-alkyl-N,N-dimethylacetamidine
Leu…………………………..leucine
LeuOH……………………....leucinol
LeuC1………………………...leucine methyl ester
LeuC8………………………...leucine octyl ester
LeuC18………………………..leucine octadecyl ester

xxv
Met…………………………....methionine
MetOH………………………..methioninol
N………………………….…...amino acid ester
Phe…………………………....phenylalanine
PheC1…………………………phenylalanine methyl ester
Pro…………………………….proline
Pro…………………………….prolinol
tC4……………………………..tetra-butyl amidine
Tyr…………………………......tyrosine
TMG…………………..…........1,1,3,3-tetramethylguanidine
Val………………………...…...valine
ValOH…………………...….....valinol
Dye
DAPNE…………………..........1-(p-dimethylaminophenyl)-2-nitroethylene
Eosin Y………………….......…2′,4′,5′,7′-tetrabromofluorescein
Other chemicals
TMS…………………................tetramethylsilane
Polysiloxanes
PDMS..........................................poly(dimethylsiloxane)
nPSil………………………......3-aminopropylmethylsiloxane-dimethylsiloxane copolymer with
n monomer % of amine functionality
nPSil-CO2…………………….polysiloxanes cross-linked by CO2

xxvi
nPSil-CS2…………………......polysiloxanes cross-linked by CS2
nPSil-CS2-H………………......polysiloxanes cross-linked by CS2, and heated to form the
thiourea covalent crosslinks
Other acronyms and symbols
CCS………………………. .…carbon capture and storage
RTIL……………………...…...room-temperature ionic liquid
L-N-C ……………………..….ionic liquid prepared by passing CO2 through an equimolar
mixture of an amidine (L) and a chiral amino acid ester (N)
L-A-C ……………………..….ionic liquid prepared by passing CO2 through an equimolar
mixture of an amidine (L) and a chiral amino alcohol (A)
L-amine-C ……………………ionic liquid prepared by passing CO2 through an equimolar
mixture of an amidine (L) and an aliphatic amine
C6-cyclohexylamine-CS2-N2…………exposing the C6-cyclohexylamine-CS2 amidinium
dithiocarbamate to N2 and gently heating at 50 oC
bp……………………………………....boiling point
mp……………………………………...melting point
pKa……………………………………..acid dissociation constant at logarithmic scale
pKb……………………………………..base dissociation constant at logarithmic scale
ΔHf……………………………...enthalpy of formation
ΔS………………………………..entropy
G´……………………………......storage modulus
xxvii
G´´………………………………loss modulus
η…………………………………viscosity
σ…………………………….…...conductivity
α…………………………………optical rotation
λmax………………………….…...absorption maximum
Λ…………………………..…......equivalent conductivity (the conductivity per mole of charge)
l ………………………………….distance between the two electrodes in the impedance cell and
A……………………………..…...area of the electrodes
The goal of this thesis research
To the best of our knowledge, changing drastically the properties of materials by mild
external perturbations is not easy. A potential method to do so is transformation of the materials
between ionic and nonionic states. Following this concept, a goal of this thesis is to determine
how selected simple reactions involving addition of neutral triatomic molecules can be utilized to
create complex molecules and functional materials through self-assembly. This thesis will also
explore in what ways the resulting materials have different physical and chemical properties, and
will address the question of how to tune the physico-chemical properties by changing the various
experimental parameters. A final goal is to develop structure-reactivity (or property)
relationships among the materials.
In that regard, major accomplishments of this thesis include:
(1) Development of two classes of reversible, room-temperature, chiral ionic liquids
(2) Optimization of room-temperature ionic liquids to increase their thermostability

xxviii
(3) Investigation of potential applications for these ionic liquids, such as for CO2 sequestration
and as reaction media
(4) Development of a facile and effective approach to changing the bulk properties of amino-
substituted polysiloxanes by introducing reversible or irreversible cross-links
(5) Exploration of a method employing amino-polysiloxanes for chemical spill containment and
remediation applications
Dissertation Overview
This dissertation summarizes the author’s five years investigation in transforming
triatomic molecules (CO2 and CS2) into functional, soft materials through self-assembly. In this
work, classic chemical reactions, employing two triatomic molecules—CO2, a “greenhouse gas”,
and CS2, a deleterious volatile liquid—as the key elements, transform charge-neutral molecules
and polymers into self-assembled materials with interesting properties for a variety of
applications. The basic reactions involved in the transformations have been integrated into
approaches (1) to make new materials that can be reconverted into their original forms at will by
benign physical methods and (2) that utilize environmentally controversial triatomic molecules.
In Chapter 1, background knowledge regarding soft materials, ionic liquids and triatomic
molecules will be introduced. The goal and potential impact of this research will be explained as
well.
Chapter 2 describes the syntheses and properties of reversible, room-temperature, chiral ionic
liquids derived from carbon dioxide with amidines and amino-acid esters or amino alcohols.
Also, thermally-stable, room-temperature ionic liquids from amidines and amines by adding CS2,
and comparison with CO2 adducts will be discussed.

xxix
In Chapter 3, studies of reversibly crosslinking amino-polysiloxanes by simple triatomic
molecules are reported. They describe facile methods for tuning thermal, rheological, and
adhesive properties of polysiloxanes. In addition, swelling-deswelling behavior of crosslinked
amino-polysiloxanes and possible applications will be illustrated.
Chapter 4 provides an application of the ionic liquids as a reaction media for cycloaddition
reactions between epoxides and CO2 to make cyclic carbonates.
A summary and conclusions will be addressed in Chapter 5.
Publications and patents resulting from this thesis research
(1) Yu, T.; Weiss, R. G. Systems and Methods Employing Polysiloxanes with Amino
Functionalities for Crude Oil, Petroleum Product or Chemical Spill Contaminant and
Remediation. U.S. Non-Provisional Patent, No. 61/376,964, 2010.
(2) Yu, T.; Yamada, T.; Weiss, R. G. In situ Formation of Thermally-Stable, Room-Temperature
Ionic Liquids from CS2 and Amidine/Amine Mixtures Chem. Mater. 2010, 22, 5492–5499.
(3) Yu, T.; Cristiano, R.; Weiss, R. G., From Simple, Neutral Triatomic Molecules to Complex
Chemistry. Chem. Soc. Rev. 2010, 39, 1435–1447.
(4) Yu, T.; Wakuda, K.; Weiss, R. G. Reversible Thickening and Adhesion Properties of
Polysiloxanes with Amino Functionalities. U.S. Provisional Patent, No. 61/316, 089, 2010.
(5) Yu, T.; Wakuda, K.; Blair, D. L.; Weiss, R. G. Reversibly Cross-Linking Amino-
Polysiloxanes by Simple Triatomic Molecules. Facile Methods for Tuning Thermal,
Rheological, and Adhesive Properties. J. Phys. Chem. C, 2009, 113, 11546–11553.
(6) Yu, T.; Weiss, R. G.; Yamada, T.; George, M. Reversible Room-Temperature Ionic Liquids for
Gas Sequestration. PCT Int. Appl. US 2007-899116P, 2008.
xxx
(7) Yu, T.; Yamada, T.; Gaviola, G. C.; Weiss, R. G. Carbon Dioxide and Molecular Nitrogen as
Switches between Ionic and Uncharged Room-Temperature Liquids Comprised of Amidines
and Chiral Amino Alcohols. Chem. Mater. 2008, 20, 5337–5344.
(8) Yamada, T.; Lukac, P. J.; Yu, T.; Weiss, R. G. Reversible, Room-Temperature, Chiral Ionic
Liquids. Amidinium carbamates Derived from Amidines and Amino-Acid Esters with Carbon
Dioxide. Chem. Mater. 2007, 19, 4761–4768.
1
CHAPTER 1. INTRODUCTION
Currently, our lives and activities are highly dependent on fossil fuels. As a result,
extremely large amounts of neutral triatomic gases are released to the atmosphere as
byproducts. Among those gases, carbon dioxide is considered to be a primary cause of the
greenhouse effect.7 Whereas bulk absorption of CO2 molecules into a bulk material involves
its dissolution, CO2 involves either chemisorption (covalent bonding) or physisorption (van
der Waals interactions) between the gas molecules and the surface of a material. Carbon
capture and storage (CCS)8, 9 is a means of mitigating fossil fuel emissions. The process is
based on capturing CO2 from large point sources, such as fossil fuel power plants, and storing
it in such a way that it does not enter the atmosphere again.10 Besides CO2, other simple
triatomic molecules also play a crucial role in the current climatic problems by contributing
to environmental pollution. For example, sulfur dioxide (SO2) is a major cause of acid rain
and smog,11 oxides of nitrogen, especially nitrous oxide (N2O), are an important contributor
to the destruction of the ozone layer (as well as the aforementioned greenhouse effect),12 and
carbon disulfide (CS2) is a poisonous liquid that has been identified as a water contaminant
from the viscose rayon industry.13 These and other neutral triatomic molecules have been
produced by volcanic eruptions and the decay of plants and animals for more than a billion
years on our planet. During that time, Nature has established an equilibrium in which such
gases are captured by bodies of water, rocks, and plants (via photosynthesis14) and are then
slowly expelled back into the environment.
1.1 Soft matter
Soft matter, as the name suggests, is a subfield of condensed materials that are usually
easily deformed by thermal stresses or thermal fluctuations.15 This field continues to attract
more and more interest in systems, such as polymers, colloids, surfactants, gels, certain
biomaterials, ionic liquids and liquid crystals.16 Many soft materials can be induced to flow

2
under certain conditions and exist in metastable states. This weak ordering results from the
lack of three-dimensional atomic long-range order found in a crystalline solid. Nevertheless,
there is always a degree of local order at least as great as that of a liquid.17a,b These unique
properties result in soft matter being important for a wide variety of applications. In order to
perform different functions, it is necessary to change the materials’ property by moderate
changes. However, there are no general procedures of which we are aware that allow a
common soft matter to change its properties by external changes. A potential solution to this
problem that others18 and we3 are exploring is the development of soft matter that can be
transformed easily, rapidly, and reversibly into uncharged, low-polarity analogs by the
selective addition of gases. The selection of CO2 and N2 here is related to the fact that they
are inexpensive, plentiful, nonflammable, nontoxic, environmentally benign, and easily
removable.
Our group has explored reactions of primary and secondary alkylamines with CO2 to
obtain alkylammonium alkyl carbamates, which are gelators of a variety of organic liquids
(Scheme 1-1).19 In those studies, the objective was to make solid ammonium carbamates
which self-assemble into solid fibrillar networks and trap microscopically very large volumes
of the organic liquids. In this thesis research, we have developed reversible, chiral room
temperature ionic liquids and adhesive polymers by this method.
Scheme 1-1. Use of primary amine-triatomic molecule adducts as gelators (Reproduced with
permission from ref 90; copyright 2010, the Royal Society of Chemistry). 90

3
1.2 Ionic liquids
While ordinary liquids such as water and molecular organic solvents are predominantly
made of uncharged molecules, ionic liquids (ILs) are salts composed of ions and short-lived
ion pairs. Ideally, ionic liquids have broad liquid and thermal stability ranges, spanning
perhaps 300 oC (-100 oC ~ +200 oC). Most ILs are non-flammable or show very low
flammability. 20 During last decade, ionic liquids 21 have become increasingly popular as
solvents in academic and industrial applications because of their environmentally friendly
characteristics, such as low vapor pressures and less toxic than molecular solvents,20 and
ability to enhance the efficiencies of a large variety of solute reactions. In addition, different
combinations of cations and anions of ILs result in different physical, chemical, and
biological properties which can be tailored to specific purposes. Room-temperature ionic
liquids (RTILs) are especially interesting in this regard.22 In addition, ionic liquids present a
promising new technology for energy and cost efficient separation of CO2 from post-
combustion flue gas.23, 24 In order to improve the selectivity of permeation of CO2 separations
of gas mixtures, Gin and coworkers25 developed an approach using imidazolium-based RTILs
containing oligo(ethylene oxide), alkylnitrile, fluoroalkyl, polyalcohol, and oligo(siloxane)
substituents on the cation.
1.3 Triatomic molecules
The triatomic molecules of interest here are uncharged and with a less electronegative
atom flanked by one two more electronegative atoms. As such, the central atoms behave as
electrophiles or Lewis acids. However, the simple structures of such neutral triatomic
molecules mask the complexity of their many reactions. Several of them are involved with
our life cycle, and an example of their importance is witnessed by the now recognized effect
of the most common of these triatomic molecules, CO2, on our climate. The attractiveness of
CO2 as a potential reagent in our research is enhanced by its abundance from renewable

4
carbon sources and lack of toxicity under most conditions. 26 However, its high
thermodynamic stability and low reactivity under many conditions have limited its industrial
uses thus far. Also, because carbon of CO2 is in the highest oxidation state, +4, of any neutral
species (although other neutral molecules contain carbon atoms with equally high oxidation
states), its reactions proceed more readily with mild reagents when the products are relatively
stable and contain the carbon atom in a high oxidation state. Examples of such products are
organic carbonates27 and carbamates.28 Catalysts are needed to allow reactions of CO2 to
proceed with other ‘stable’ species (such as molecular hydrogen) under mild conditions.
Alternatively, CO2 can be reacted with highly-energetic, very reactive reagents.
Some important physical properties of selected triatomic molecules are presented in Table
1-1. Triatomic molecules with the structure, X=Y=X or X=Y=Z may be linear or bent
depending on the electronic distribution on the central atom. The nature of the three atoms
and their spatial distribution determine the magnitude of the molecular dipole. CO2 and CS2
are linear molecules whose dipole moments are zero. The dipole moment of carbon
oxysulfide (O=C=S) is directed toward the more electronegative oxygen atom and the C O
and C S group dipoles of CO2 and CS2, being diametrically opposed, are responsible for the
zero molecular dipoles and non-zero quadrupoles. However, both molecules possess a large,
non-zero quadrupole moment (3.00 × 10⁻²⁶ esu·cm2 (CO2) and 1.84 ×10⁻²⁶ esu·cm2 (CS2)).29
The reactivities of these molecules have a lot in common with those of some more complex
molecules. An example is dicyclohexylcarbodiimide (DCC) which is commonly utilized to
couple amino acids during peptide syntheses, and phenylthiocyanate, a reagent for making
phenylthiohydantoins from peptides.

5
Table 1-1. Physical properties of some uncharged triatomic molecules30
Triatomic
molecule
Bond
length
(Å)
Shape Kinetic
diameter31
(Å)
boiling
point (K)
ΔH°f a
(kJ·mol-1)
ΔG°f b
(kJ·mol-1)
Dipole
moment
(D)
Quadrupole
moment
(esu·cm2)
Polarizability
× 1025 (cm3)
CO2 (g) 1.1600 linear 3.3 216.55 -393.5 -394.4 0 3.00 x 10⁻²⁶ 29.11
CS2 (l) 1.5526 Linear 4.483 319.37 89.0
CS2(g) 115.7
64.6 0 1.84 x 10⁻²⁶ 87.4 – 88.6
OCS(g) C-O
1.1578
C-S
1.5601
Linear 4.130 222.7 -142.0 -169.2 0.715 - 52 – 57.1
SO2 (g) 1.4308 angular,
C2v
(119.3°)
4.112 263.13 -296.8 -300.1 1.633 - 37.2 – 42.8
N2O (g) N-N
1.1284
N-O
1.1841
Linear 3.828 184.67 81.6 103.7 0.161 - 30.3

6
NO2 (g) 1.193 angular,
C2v
(134.1°)
- 302.22 33.2 51.3 0.316
±0.010
- 30.2
a Standard molar enthalpy (heat) of formation at 298.15 K; b Standard molar Gibbs energy of formation at 298.15 K.

7
All of the molecules in Table 1 have at least one terminal atom that is more
electronegative than the central one; the central atom has a partial positive charge. Some
reactions of these molecules with nucleophilic species are important to maintaining life
on our planet. For example, CO2, despite its high thermodynamic stability, is in
equilibrium with bicarbonate and carbonate in the oceans via reactions with water or
hydroxide (Eq. 1-1). The process of solvation of CO2 molecules in water, followed by
reaction generating carbonic acid (H2CO3), is slightly exothermic (-19.7 kJ·mol-1).28 The
equilibrium between H2CO3 and bicarbonate (HCO3-) in water has a dissociation constant
of (1.72 ± 0.05) ×10-4 mol·kg-1 at 25 °C, and more carbon atoms in our biosphere are in
the form of HCO3- than in any other molecule.32
CO
OOH
H OC
O
O
H
H OC
OH
O
H+ OC
O
O
HH2O
+ H3O (1-1)
The positions of the equilibria shown above are determined by (1) the nature of the
nucleophile, (2) the reaction medium, (3) the temperature, and (4) the base strength.
Although the oxygen atoms of alcohols react with CO2 to give alkylcarbonic acids (R-O-
CO2H), they are less basic and nucleophilic than the analogous amines. To attain a
significant amount of reaction like that shown in eq. 4, a strong base, such as an amidine
(e.g., 1,8-diazabicyclo[5.4.0]undec-7-ene (DBU)), must be added. Thus, Hori and
coworkers33 demonstrated that the uptake of CO2 by alcohol/DBU mixtures in toluene
solutions is not quantitative at 1 atm of pressure, although reaction of CO2 with alcohols
and another base type, guanidines, is. 34 Primary aliphatic amine groups can react
quantitatively with one atmosphere of CO2 to generate alkylammonium alkylcarbamate
salts (Eqs. 1-2 and 1-3, where Nu-H is a primary amine and XY2 is CO2) and amidinium
carbamates in the presence of an amidine, guanidine, or other strong base of low
nucleophilicity (Eq. 1-4, where Nu-H is a primary amine and XY2 is CO2).

8
Alkylammonium carbamates and amidinium carbamates are thermally stable at room
temperature under one atmosphere of CO2, but lose CO2 at higher temperatures; a flow of
an inert gas is able to displace CO2 at room temperature (Eq. 1-5).
XY2 + NuH Nu XY
YH
Nu XY
YH
+ NuH Nu XY
YNuH2
Base (B) Nu XY
YB-H
Nu-H = H2O, NH3, R-OH, NH2R, NHRR' ( R=alkyl)
Base (B) = RN N
R'''
R''
R'
N
N
DBU
,
amidine
Nu XY
YH
+
X = C, S, N Y = O, S,
NH
NNR''
R'guanidine
R''
R',
(1-2)
(1-3)
(1-4)
For steric and other reasons, the usual order of reactivity of amines as nucleophiles
with triatomic molecules is primary > secondary >> tertiary. Note that whereas primary
and secondary amines can lose a proton from nitrogen after reacting with a molecule of
CO2 (thus generating carbamates), tertiary amines cannot and must remain as very
unstable species that cannot be isolated at room temperature and under one atmosphere of
CO2.
CS2 + 2RNH2HN
S
SR H3N R
HN
S
NHRR + H2S
CO2 + 2RNH2HN
O
OR H3N R
N2
(1-5)
(1-6)
Similar chemistry occurs with CS2 as the triatomic molecule (Eq. 1-6). However,

9
heating ammonium dithiocarbamates from primary amines leads to thioureas and
expulsion of H2S.35 In a similar way, other electrophilic triatomic molecules such as SO2,
NO2 and N2O can react with nucleophilic species (Scheme 1-1). For example, SO2 can
form stable charge-transfer complexes with tertiary amines, and also reacts with primary
amines to generate sulfamides. 36 In the latter reaction, SO2 (a strong Lewis acid) is
activated first via formation of a donor-acceptor, non-covalent complex with an amine
(base). It is noteworthy that both SO2 and CS2 have been shown to possess great
versatility in interacting with metal complexes because of their sulfur atoms.35
Recently, a new series of easily prepared, room-temperature ionic liquids (RTILs)—
amidinium carbamates—has been developed by our group. They are made by bubbling
CO2 gas through a mixture of two non-ionic components, an aliphatic amidine and an
aliphatic amine.3a The resulting RTILs can be reconverted to their non-ionic forms by
displacing the covalently bound CO2 using N2, and this process can occur repeatedly
without detectable degradation. A very important attribute of these RTILs is their ability
to be easily transformed between high-polarity, ionic states and low-polarity, uncharged
states.
CHAPTER 2: REVERSIBLE, ROOM-TEMPERATURE (CHIRAL) IONIC LIQUIDS
2.1 .1 Introduction
Their unique physical and chemical properties37 make room-temperature ionic liquids
(RTILs)21, 38 attractive solvents for a wide variety of applications.39 Chiral ionic liquids40
present additional opportunities as media for enantioselective reactions of solutes, 41
stereoselective polymerizations, 42 and enantiomeric separations. 43 However, there are no
general procedures of which we are aware that separate products (or catalysts) from their host
ionic liquids in a manner that allow the liquids (and catalysts) to be reused.44 Finding such
procedures poses a serious challenge to expanded exploitation of these materials. A potential

10
solution to this problem that others18,45 and we3 are exploring is the development of ionic
liquids that can be transformed easily, rapidly, and reversibly into uncharged, low-polarity
analogs by the selective addition of gases. Another desirable attribute would be the ability to
cycle easily and reversibly between an RTIL and a corresponding nonionic form because
such materials allow easier separation of solvent mixtures, catalysts, etc. This goal has been
achieved by alternating the bubbling of CO2 and a displacing gas (N.B., argon or nitrogen)
through mixtures of an amidine, 1,8-Diazabicyclo[5.4.0]undec-7-ene (DBU), and 1-
hexanol18a, 46 or an amidine and an alkyl amine.3a
In addition, although the benign nature of this switching process opens several potential
applications for ionic liquids, such as reversible catalyst formation5, 47 and CO2 gas
sequestration,25 the thermal instability of these ionic liquids above ca. 50 °C, even under one
atmosphere pressure of CO2, imposes some limitations on their applicability. Thus, RTILs of
similar structure, but with greater thermal stability, would expand greatly their potential uses.
2.1.2 Materials
Unless stated otherwise, all reagents were used as received. L-Proline (Pro; 99%), L-
leucine (Leu; 99%), L-isoleucine (Ile; 99 %), L-phenylalanine (Phe; 98.5 %), L-tyrosine
(Tyr; 99 %), and thionyl chloride (99.5 %) were from Acros; triethylamine (99.9 %) was
from Alfa Aesor; 1-octanol (99 %), 1-octadecanol (95 %), L-valine (Val; 98 %), and p-
toluenesulfonic acid monohydride (98.5 %) were from Aldrich. Triethylamine (99.9%),
methyl amine (40% aqueous solution) were from Alfa Aesor; (1R, 2S)-(-)-norephedrine (Nor;
99%), ethanolamine (GlyOH; 99%), n-decane (99%) and lithium aluminium hydride (LiAlH4,
95%) were from Aldrich; nitromethane (analytical grade) was from Fisher. Eosin Y (99%)
was from Allied Chemical Co. Methanol (Aldrich, 99.8 %) was dried by Vogel’s method48.
Toluene (Aldrich, 99.9 %) was dried by refluxing over sodium metal for 5 h, followed by
distillation. Carbon dioxide gas, generated by warming dry-ice, was dried by passing it

11
through a tube filled with indicating Drierite. Carbon disulfide (anhydrous, 99.9%) was
purchased from Aldrich. t-Butyl amine (99.5%), n-hexylamine (99%), n-octylamine (99%),
n-decylamine (99%), cyclohexylamine (99%), dibutylamine (99.5%), and 1,1,3,3-
tetramethylguanidine (TMG) (99%) (all from Aldrich) were used as received. DBU (98 %
from Aldrich) was refluxed over CaH2 (Acros) for 5 h and distilled at 67–68 °C/0.2 Torr onto
activated 5Å molecular sieves (> 99.5% by GC). Chloroform-D (99.8% D) and deuterated
water (99.9% D) were purchased from Cambridge Isotope Laboratory, Inc.
2.1.3 Instrumentation
IR spectra were obtained on a Perkin-Elmer Spectrum One FTIR spectrometer
interfaced to a PC, using an attenuated total reflection accessory or NaCl plates. NMR spectra
were recorded on an Inova 400 MHz Spectrometer operating at 400 MHz (1H), or 100.5 MHz
(13C), respectively. 1H and 13C spectra were indirectly referenced to TMS using residual
solvent signals as internal standards and CDCl3 as the solvent. Gas chromatographic (GC)
analyses were performed Hewlett-Packard 5890A gas chromatograph equipped with flame
ionization detectors and a DB-5 (15 m × 0.25 mm) column (J & W Scientific, Inc.). GC-MS
was performed on a Varian Saturn 2100 instrument in the electron ionization (EI) mode using
a DB-5 (15 m × 0.25 mm) column. UV-Vis spectra were recorded on a Varian CARY 300
Bio UV-Visible spectrophotometer in Hellma suprasil quartz cells with 0.1 or 0.2 mm
pathlengths. Thermal gravimetric analysis (TGA) measurements were performed under a
nitrogen atmosphere at a 5 ºC/min heating rate on a TGA Q50 thermo-gravimetric analyzer
(TA Instruments) interfaced to a computer. Some of the TGA tests were repeated and the
deviation between measurements was ca. ±2%. Differential scanning calorimetry (DSC)
measurements were recorded on a DSC Q200 calorimeter (TA Instruments, New Castle, DE)
interfaced to a TA Thermal Analyst 3100 controller, and equipped with a refrigerated cooling
system (RCS90) to control the cooling rates. Polarizing optical micrographs (POMs) of ionic

12
liquids sandwiched between thin cover slides were recorded on a Leitz 585 SM-LUX-POL
microscope equipped with crossed polars, a Leitz 350 heating stage, a Photometrics CCD
camera interfaced to a computer, and an Omega HH503 microprocessor thermometer
connected to a J-K-T thermocouple. The samples were cooled by flushing cold nitrogen gas
passing through a coil in liquid nitrogen. GC-MS measurements were recorded on a
SHIMADZU GC-17A gas chromatograph connected SHIMADZU QP-5000 mass
spectrometer instrument using an SGE BPX5 (15 m × 0.25 mm, 0.25 µm) column and a
flame ionization detector. Viscosity experiments were performed on an Anton Paar Physica
MCR 301 rheometer (Anton Paar GmbH, Graz, Austria) using a parallel plate (radius 25 mm,
gap 0.5 mm). Samples were equilibrated at 25 oC for about 5 min before starting
measurements (at 25 oC). Some of the tests were repeated twice and the error between each
experiment is ±5%.
Optical rotations were recorded on a Rudolph Instruments DigiPal 781 automatic
polarimeter at 589 nm in Hellma quartz cells with 0.1 or 0.2 mm pathlengths (l). Observed
rotations, α (± 0.0005°), were averaged from 5 determinations, each along 3 different axes of
the cylindrical cells, and are corrected for residual rotations by the empty cells. Specific
rotations of neat amino acid esters or amino acid ester/amidine mixtures, [αtotal], are from eq
2-1 and of the optically active component in the mixtures, [αopt], are from eq. 2-2. Densities, ρ
(g·cm-3), were estimated from the slopes of graphs of sample weights versus volumes at ca.
25 ˚C and were used to calculate c (g·dL-1).
[αtotal] = α / (lρ) (2-1)
[αopt] = 100 α / (lc) (2-2)
Conductivities were measured with a Yellow Spring Instrument Co. Model 31
conductivity meter using Au electrodes, supported by Teflon material (Figure 2-1). The
distance between two electrodes is 8 mm. The cell was constructed by Prof. Robert de Levie.

13
The conductivity values were calibrated using various concentrations of standard KCl
solutions in water purified with a Millipore Co. Milli-Q system (resistance 18.3 mΩ·cm;
conductivity 50 μS/cm).49 The water was sealed in a flask until use to prevent adventitious
absorption of CO2 from the atmosphere. Some of the conductivity tests were repeated, and
the reproducibility of the measurements was ± 3%.
Figure 2-1. Photograph of the Au electrode placed in a 1 cm glass cuvette and used in
conductivity measurements.
2.2 Reversible, room-temperature chiral ionic liquids. Amidinium carbamates derived
from amidines and amino-acid esters with carbon dioxide
2.2.1 Introduction
Here, we describe a diverse class RTILs which combine reversibility, chirality, and ease
of formation. They are made by exposing a 1/1 mixture of an easily synthesized amidine (L)
and an alkyl ester of a naturally occurring amino acid (N) to CO2 gas (Scheme 2-1). When
nitrogen gas is passed through these RTILs, they are reconverted to their nonionic forms. All
of the 50 amidine/amino acid ester (L/N) combinations examined here form an RTIL (L-N-C)
upon exposure to CO2 and they can be reconverted isothermally to their non-ionic L/N states
by bubbling with a displacing gas, such as N2. In addition, many of these RTILs persist as
liquids to far below 0 °C. Although we have examined esters of only 6 amino acids here (Pro,
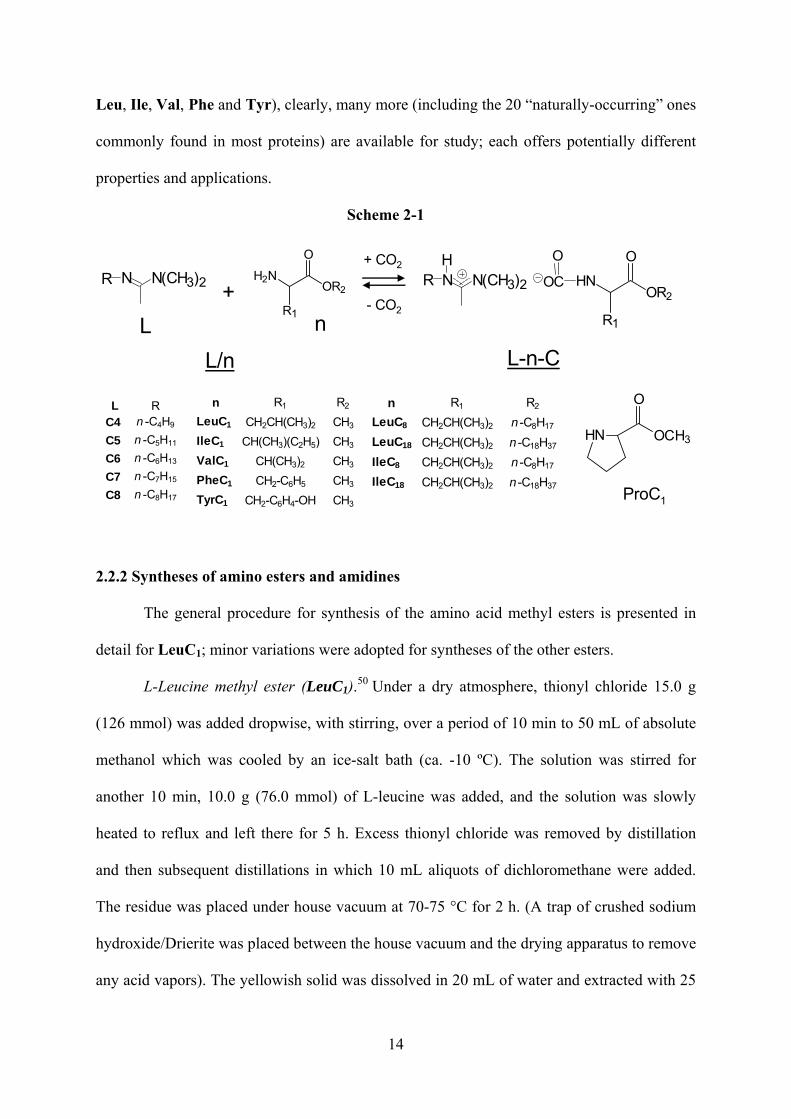
14
Leu, Ile, Val, Phe and Tyr), clearly, many more (including the 20 “naturally-occurring” ones
commonly found in most proteins) are available for study; each offers potentially different
properties and applications.
Scheme 2-1
NRH
N(CH3)2 HNOR2
R1
O
OC
OH2N
OR2
R1
O
L RC4 n -C4H9
C5 n -C5H11
C6 n -C6H13
C7 n -C7H15
C8 n -C8H17
n R1 R2
LeuC1 CH2CH(CH3)2 CH3
IleC1 CH(CH3)(C2H5) CH3
ValC1 CH(CH3)2 CH3
PheC1 CH2-C6H5 CH3
TyrC1 CH2-C6H4-OH CH3
R N N(CH3)2
L n+
+ CO2
- CO2
L-n-CL/n
HN OCH3
On R1 R2
LeuC8 CH2CH(CH3)2 n -C8H17
LeuC18 CH2CH(CH3)2 n -C18H37
IleC8 CH2CH(CH3)2 n -C8H17
IleC18 CH2CH(CH3)2 n -C18H37 ProC1
2.2.2 Syntheses of amino esters and amidines
The general procedure for synthesis of the amino acid methyl esters is presented in
detail for LeuC1; minor variations were adopted for syntheses of the other esters.
L-Leucine methyl ester (LeuC1).50 Under a dry atmosphere, thionyl chloride 15.0 g
(126 mmol) was added dropwise, with stirring, over a period of 10 min to 50 mL of absolute
methanol which was cooled by an ice-salt bath (ca. -10 ºC). The solution was stirred for
another 10 min, 10.0 g (76.0 mmol) of L-leucine was added, and the solution was slowly
heated to reflux and left there for 5 h. Excess thionyl chloride was removed by distillation
and then subsequent distillations in which 10 mL aliquots of dichloromethane were added.
The residue was placed under house vacuum at 70-75 °C for 2 h. (A trap of crushed sodium
hydroxide/Drierite was placed between the house vacuum and the drying apparatus to remove
any acid vapors). The yellowish solid was dissolved in 20 mL of water and extracted with 25
15
mL of diethyl ether. The aqueous phase was placed under 50 mL of diethyl ether and 30 %
aqueous sodium hydroxide was added until pH 8 was reached. Most of the liquid was
removed on a rotary evaporator. The remaining material was distilled to yield 7.44 g (41.0 %)
of L-leucine methyl ester bp 32-33 ºC/0.35 Torr, as a clear liquid of 99 % purity (GC). IR
3381, 3313, 2956, 2871, 1736, 1679, 1619, 1468, 1437 cm-1. 1H NMR 3.71 (s, 3H,
C(=O)OCH3), 3.48 (t, 1H, C*H), 1.77-1.36 (m, 5H, NH2, CH2CH(CH)3), 0.93 (m, 6H, (CH3)2)
(lit.51 3.72 (3H), 3.48 (1H), 1.78 (1H), 1.56 (1H), 1.43 (1H), 0.94 (3H), 0.92 (3H)). 13C NMR
177.24, 52.92, 51.95, 44.23, 24.84, 23.01, 21.90.
L-Isoleucine methyl ester (IleC1).50 Yield 37 % of a clear liquid of 99 % purity (GC),
GC-MS: 146 ([M]+); bp 34-35 ºC/0.5 Torr. IR 3386, 3313, 2963, 2935, 2877, 1735, 1619,
1459, 1436 cm-1. 1H NMR 3.72 (s, 3H, C(=O)OCH3), 3.35 (d, 1H, C*H); 1.74 (m, 1H, C*H-
CH); 1.45 (m, 2H, NH2); 0.88-1.2 (m, 8H, CH(CH3)CH2CH3). 13C NMR 176.13, 51.63, 39.20,
39.20, 24.67, 15.73, 11.63.
L-Proline methyl ester (ProC1).52 Yield 36 % of a clear liquid, purity 99 % (GC). bp 30
ºC/0.15 Torr. IR 3351; 2955; 2876; 1733; 1436 cm-1. 1H NMR 3.73 (s, 3H, C(=O)OCH3),
3.77-3.75 and 3.57-3.52 (m, 1H, C*H-); 2.87-2.95 and 3.04-3.12 (m, 2H, -CH2-NH-); 2.61 (br,
1H, NH);1.34-2.36 (m, 4H, CH2CH2-C*H) (lit.51 3.77 (3H), 3.74 (3H), 3.03 (1H), 2.91 (1H),
2.13 (1H), 1.85 (1H), 1.76 (2H)). 13C NMR 175.76, 59.50, 51.93, 46.89, 45.07, 30.10, 25.40.
L-Valine methyl ester (ValC1).53 Yield 25 % of a clear liquid of 99 % purity (GC), bp
< 21 ºC/0.1 Torr. IR 3387, 3319, 2960, 2848, 1732, 1606, 1467, 1436 cm-1. 1H NMR 3.72 (s,
3H, C(=O)OCH3), 3.29 (d, 1H, C*H); 2.01 (m, 1H, C*H-CH); 1.42 (m, 2H, NH2); 0.89-0.98
(d-d, 6H, CH(CH3)2) (lit.51 3.72 (3H), 3.30 (1H), 2.02 (1H), 0.97 (3H), 0.91 (3H)). 13C NMR
176.06, 59.98, 51.73, 32.19, 19.30, 17.23.
L-Phenylalanine methyl ester (PheC1).54 Yield 45 % of a clear liquid of 99 % purity
(GC), bp 84 ºC/0.25 Torr. IR 3381, 3313, 3029, 2951, 2852, 1734, 1603, 1496, 1455, 1437

16
cm-1. 1H NMR 7.16-7.32 (m, 5H, phenyl), 3.71 (m, 1H, C*H), 3.6 (s, 3H, C(=O)OCH3), 3.07
(d-d, 1H, CH2-Phenyl), 2.84 (d-d, 1H, CH2-Phenyl), 1.43 (br, 2H, NH2). (lit.51 7.31 (2H),7.24
(1H), 7.19 (2H), 3.74 (1H), 3.72 (3H), 3.08 (1H), 2.87 (1H)). 13C NMR 175.34, 137.21,
129.19, 128.47, 126.72, 55.78, 51.86, 41.05.
L-Tyrosine methyl ester (TyrC1).54 Yield 56.5 % of a white solid of 99 % purity (GC),
mp 135 - 136 ºC (lit54 134 -135 ºC). IR 3355, 3297, 1743, 1597, 1514, 1480, 1443 cm-1. 1H
NMR 7.04 (d, 2H, phenyl), 6.74 (d-d, 2H, phenyl), 3.68 - 3.73 (m, 4H, C*HC(=O)OCH3),
3.03 (d-d, 1H, CH2-Phenyl), 2.89 (d-d, 1H, CH2-Phenyl). (lit.51 6.87, 6.65 (4H), 3.59 - 3.53
(4H), 2.87 (1H), 2.67 (1H), 2.62 (3H), 3.08 (1H), 2.87 (1H)).
L-Leucine octyl ester (LeuC8). Yield 52 % of 99 % purity (GC). GC-MS: 244
([M+H]+), bp 74 oC/ 0.5 Torr. IR 3379; 3313; 2955; 2926; 2857; 1733; 1606; 1468 cm-1. 1H-
NMR 4.10 (t, 2H, C(=O)OCH2); 3.11 (d-d, 1H, C*H); 1.28-1.80 (m, 17 H, NH2, (CH2)6CH3,
CHCH2-C*H); 0.86-0.96 (m, 9H, CH3, CH(CH3)2). 13C-NMR 176.95; 65.08; 53.07; 44.35;
31.91; 29.31; 28.74; 26.03; 24.94; 23.09; 22.78; 22.05; 14.23.
L-Isoleucine octyl ester (IleC8). Yield 6.6 g (48 %) of a colorless liquid of purity 99 %
(GC), bp 72 °C/0.5 Torr. GC-MS: 244 ([M+H]+) IR 3385; 2929; 2858; 1733; 1599; 1465 cm-
1. 1H-NMR 4.11 (m, 2H, C(=O)OCH2); 3.34 (d, 1H, C*H); 1.13-1.79 (m, 17 H, NH2,
(CH2)6CH3, C*HCHCH2); 0.86-0.96 (m, 9H, CH3, CH(CH2CH3)CH3). 13C-NMR 175.94,
64.95, 59.31, 39.34, 31.92, 29.32, 28.79, 26.10, 24.81, 22.78, 15.92, 14.23, 11.84.
L-Leucine octadecyl ester (LeuC18). A colorless liquid, purity 99 % (GC), was obtained
in 45 % yield. GC-MS: 384 ([M+H]+) IR 3390; 3324; 2955; 2915; 2849; 1718; 1606; 1472
cm-1. 1H NMR 4.10 (t, 2H, C(=O)OCH2), 3.45 (m, 1H, C*H); 1.79-1.25 (m, 39H, NH2,
C*HCH2CH, (CH2)17CH3); 0.85-0.96 (m, 9H, CH3, CH(CH3)2).
L-Isoleucine octadecyl ester (IleC18). A colorless liquid, purity 99 %, was obtained in
54 % yield. GC-MS: 384 ([M+H]+) IR 3385, 2924, 2854, 1735, 1621, 1645. 1H NMR 4.10 (t,

17
2H, C(=O)OCH2), 3.45 (d, 1H, C*H); 1.78-1.21 (m, 39H, NH2, C*HCH2CH, (CH2)17CH3);
0.86-0.96 (m, 9H, CH3, CH(CH2CH3)CH3).
Synthesis of N,N-Dimethyl-N’-hexyl ethanimidamide (C6): 20.0 g (197 mmol) n-
hexylamine and 19.9 g (197 mmol) of triethylamine were added to 30 mL of dichloromethane,
then 15.5 g (197 mmol) of acetyl chloride was slowly added into the solution. The mixture
was stirred for 24 h under a nitrogen atmosphere. The reaction mixture was added to 25 mL
of water containing hydrochloric acid (pH < 2). The organic layer was separated from
aqueous phase. The aqueous phase was extracted with dichloromethane (25 mL × 3). The
organic phases were combined, and then dried with anhydrous sodium sulfate. The volatile
materials were removed by rotary evaporator. The N-hexyl acetylamide was isolated by
distillation of the residue bp 83-84 °C/0.15 Torr (Lit.55 125 ºC/30 Torr) Yield was 23.8 g
(70.9 %). GC-MS: 144 ([M+H]+) Purity was 99 % (GC). IR (neat) 3286; 3089; 2957; 2930;
2859; 1651; 1555; 1460; 1438; 725; 602 cm-1. 1H NMR 5.97 (br, 1H, CH2-NH); 3.22 (q, 2H,
CH2-NH-); 1.98 (s, 3H, -C(=O)CH3); 1.44-1.50 (m, 2H, CH2-CH2-NH); 1.2-1.4 (m, 4H,CH3-
(CH2)2); 0.88 (t, 3H, CH3-CH2). ). 13C NMR: 170.31; 39.82; 31.59; 29.63; 26.71; 23.34;
22.66; 14.10.
15.0 g (105 mmol) of N-hexyl acetamide was added to 15 mL of dry toluene, then
11.2 g (105 mmol) of dimethylcarbamyl chloride were slowly added and then the mixture
was refluxed under a nitrogen atmosphere for 24 h. The volatile materials were removed by
rotary evaporator and in vacuo. After the residue was dissolved in chloroform (30 mL),
aqueous solution of 4.2 g of NaOH in 40 mL water was added and the mixture was
vigorously stirred for 30 min. Calcium carbonate (2.8 g) was added to the mixture and
stirring was continued for another 30 min. The organic phase was separated and the aqueous
phase was extracted with dichloromethane (25 mL × 3). The organic phases were combined
and dried with anhydrous calcium carbonate. The volatile materials were removed by rotary

18
evaporator. The product was isolated by distillation of the residue bp 52-54 ºC/0.25 Torr
(lit.55 125 ºC/30 Torr). GC-MS: 171 ([M+H]+); Purity 99 % (GC). IR 2955.4; 2926.0; 2855.5;
1626.0; 1342.6; 1007.3; 726.0 cm-1. 1H NMR 3.18 (t, 2H, -CH2-N=), 2.87 (s, 6H, -N-(CH3)2);
1.87 (s, 3H, -N=C(CH3)-N); 1.49 (m, 2H, -CH2-CH2-N=); 1.25-1.4 (m, 6H,CH3-(CH2)3-);
0.88 (t, 3H, CH3). 13C NMR: 158.79; 50.32; 38.07; 32.49; 32.00; 27.38; 22.80; 14.17; 12.45.
N,N-Dimethyl-N’-butyl ethanimidamide (C4). A colorless liquid, bp 28-30 ºC/0.25
Torr (lit.56 bp 69-71 ºC/13 Torr). GC-MS: 143 ([M+H]+); Purity 98 % (GC). IR (neat) 2956,
2929, 286 (C-H), 1629 (N=C) cm-1. 1H NMR 3.17 (t, 2H, JHH 7.2 Hz, -CH2-N=), 2.86 (s, 6H,
-N-(CH3)2); 1.87 (s, 3H, -N=C(CH3)-N); 1.5 (m, 2H, -CH2-CH2-N=); 1.25-1.4 (m, 6H,CH3-
(CH2)3-); 0.88 (t, 3H, JHH 7.2 Hz, CH3). 13C NMR: 158.73; 49.92; 38.02; 34.68; 20.74; 14.20;
12.40.
N,N-Dimethyl-N’-amyl ethanimidamide (C5). A colorless liquid, bp 40-41 ºC/0.25
Torr. Purity 98.5 % (GC). GC-MS: 157 ([M+H]+); IR (neat) 2956, 2927, 2857 (C-H), 1626
(N=C) cm-1. 1H NMR 3.18 (t, 2H, JHH 7.5 Hz, -CH2-N=), 2.87 (s, 6H, -N-(CH3)2); 1.88 (s, 3H,
-N=C(CH3)-N); 1.51 (m, 2H, -CH2-CH2-N=); 1.25-1.4 (m, 4H,CH3-(CH2)2-); 0.90 (t, 3H, JHH
6.9 Hz, CH3). 13C NMR: 158.90; 50.35; 38.15; 32.27; 29.98; 22.87; 14.31; 12.53.
N,N-Dimethyl-N’-heptyl ethanimidamide (C7). A colorless liquid, bp 63-64 ºC/ 0.25
Torr. Purity 99 % (GC). GC-MS: 185([M+H]+);IR (neat) 2956, 2925, 2854 (C-H), 1626
(N=C) cm-1. 1H NMR 3.17 (t, 2H, JHH 7.5 Hz, -CH2-N=), 2.86 (s, 6H, -N-(CH3)2); 1.87 (s, 3H,
-N=C(CH3)-N); 1.5 (m, 2H, -CH2-CH2-N=); 1.25-1.4 (m, 10H,CH3-(CH2)5-); 0.88 (t, 3H, JHH
7.2 Hz, CH3). 13C NMR: 158.89; 50.40; 38.14; 29.69; 32.08; 32.00; 27.71; 22.81; 14.26;
12.53.
N,N-Dimethyl-N’-octyl ethanimidamide (C8). A ccolorless liquid, bp 72-77 ºC/0.25
Torr. Purity 99 % (GC). GC-MS: 199 ([M+H]+); IR (neat) 2955, 2924, 2853 (C-H), 1627
(N=C) cm-1. 1H NMR 3.17 (t, 2H, JHH 6.9 Hz, -CH2-N=), 2.86 (s, 6H, -N-(CH3)2); 1.87 (s, 3H,

19
-N=C(CH3)-N); 1.5 (m, 2H, -CH2-CH2-N=); 1.25-1.4 (m, 10H,CH3-(CH2)5-); 0.88 (t, 3H, JHH
6.1 Hz, CH3). 13C NMR: 158.68; 50.26; 38.00; 32.49; 32.00; 29.69; 27.70; 27.64; 22.73;
14.14; 12.38.
1-(p-Dimethylaminophenyl)-2-nitroethylene (DAPNE). 57 Red crystals, mp 180.6–
180.9 °C (lit57 mp 181 °C). 1H NMR 3.08 (s, 6H, Ar-N(CH3)2); 6.68 (2H, d, JHH 8.7 Hz, Ar-
H); 7.43 (2H, d, JHH 9.0 Hz, Ar-H); 7.50 (1H, d, JHH 13.2 Hz, Ar-CH); 7.97 (1H, d, JHH 13.5
Hz, CH-NO2).
2.2.3 Preparation of ionic liquids and their reconversion to amidine/amine mixtures
Neat bulk samples. Dry CO2 gas was bubbled for 30 min through neat (1/1, mol/mol)
amidine/amino acid ester samples in a glass vessel immersed in a room-temperature water
bath; the uptake of CO2 is slightly exothermic.
NMR samples. Measured quantities of an amidine and an amine were dissolved in a
known volume of CDCl3. In an alternating fashion, CO2 and N2 gases were bubbled through
the solutions for 30 min at room temperature. At the end of each bubbling period, an NMR
spectrum was recorded.
2.2.4 Measurements of CO2 uptake
A mercury burette3a was filled with CO2 gas and the apparatus was purged by flushing
CO2 through it for > 30 min. Then, a flask with a weighed amount of neat amidine/amine
ester mixture was attached to the burette, and the number of ccs of CO2 gas taken up by the
amidine/amine ester mixture was recorded as a function of time and converted to molar
equivalents assuming that the ideal gas law applies approximately. Readings on the burette
N+O
O-
N
DAPNE

20
were recorded when two burettes’ mercury levels maintained the same height after moving
the mercury container. The liquid was stirred with a Teflon-coated spin bar while the volume
of CO2 adsorbed was recorded as a function of time until no volume change was discernible.
This procedure was repeated 3 times for each mixture using different aliquots of a sample and
the average is reported here.
The percentage of the theoretical amount of CO2 taken up (%CO2) was calculated as
follows. The volume of CO2 taken up by the amine/amidine solution (V) was calculated from
eq. 2-3, where Vblank is the volume decrease in the burette when the flask contained only CO2
and Vobs is the total volume decrease measured by the burette.
V = (Vobs – Vblank) (2-3)
The theoretical volume of CO2 (VP,T) taken up by M moles of amidine/amine at a known
temperature (T, K) and pressure (P, Torr), assuming complete conversion to amidinium
carbamate, was calculated using eq. 2-4, and assuming that CO2 exhibits nearly ideal gas
behavior at room temperature and one atmosphere of pressure.
VP, T = [22.4 × (760 / P) × (T / 273.15)] × M (2-4)
Then, %CO2 = [V / VP, T] × 100 (2-5)
2.2.5 Results and discussion
The various L/N combinations examined are shown in Table 2-1. All 50 yield ionic
liquids at room temperature after exposure to CO2 gas despite the fact that some of the
original mixtures are not liquids and all but those containing the amino acids with octadecyl
esters remain liquids to -18 °C (vide infra). The maximum temperatures at which the L-N-C
persist without losing CO2 is ca. 50 °C according to thermal gravimetric analyses (vide infra).
By contrast, all but one of the amino acid esters investigated solidified when they were
exposed as neat liquids to CO2. This solidification behavior has been observed during the
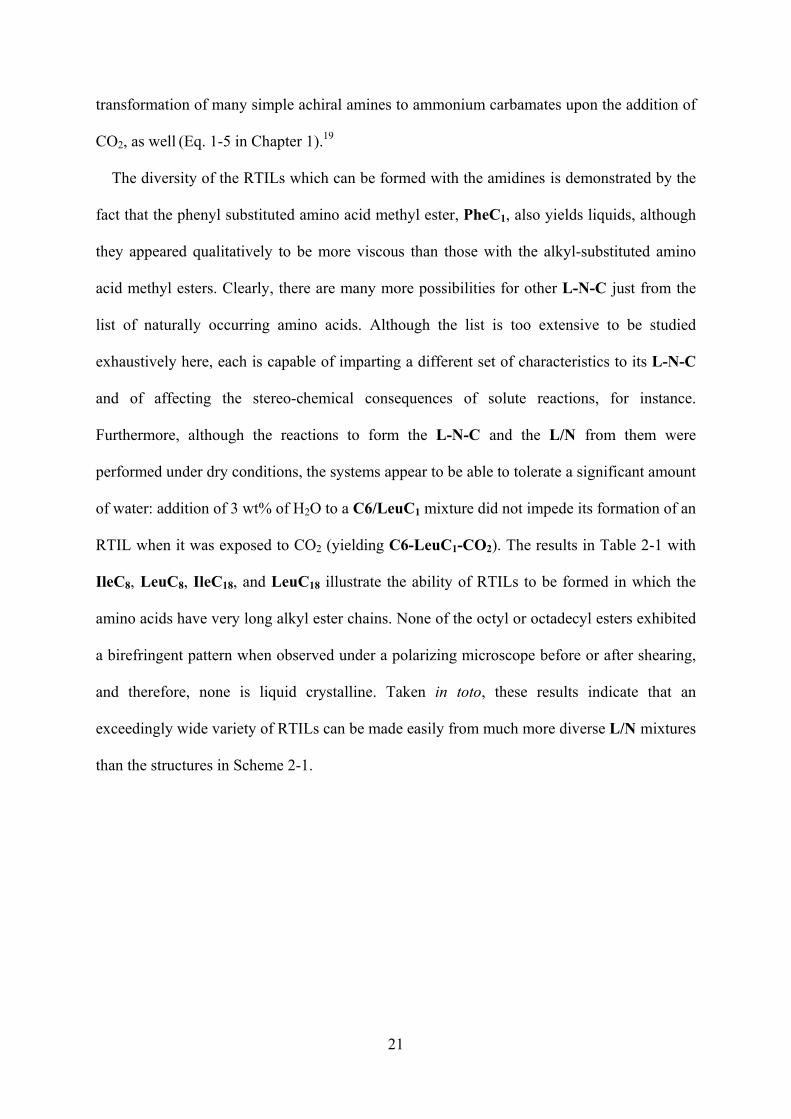
21
transformation of many simple achiral amines to ammonium carbamates upon the addition of
CO2, as well (Eq. 1-5 in Chapter 1).19
The diversity of the RTILs which can be formed with the amidines is demonstrated by the
fact that the phenyl substituted amino acid methyl ester, PheC1, also yields liquids, although
they appeared qualitatively to be more viscous than those with the alkyl-substituted amino
acid methyl esters. Clearly, there are many more possibilities for other L-N-C just from the
list of naturally occurring amino acids. Although the list is too extensive to be studied
exhaustively here, each is capable of imparting a different set of characteristics to its L-N-C
and of affecting the stereo-chemical consequences of solute reactions, for instance.
Furthermore, although the reactions to form the L-N-C and the L/N from them were
performed under dry conditions, the systems appear to be able to tolerate a significant amount
of water: addition of 3 wt% of H2O to a C6/LeuC1 mixture did not impede its formation of an
RTIL when it was exposed to CO2 (yielding C6-LeuC1-CO2). The results in Table 2-1 with
IleC8, LeuC8, IleC18, and LeuC18 illustrate the ability of RTILs to be formed in which the
amino acids have very long alkyl ester chains. None of the octyl or octadecyl esters exhibited
a birefringent pattern when observed under a polarizing microscope before or after shearing,
and therefore, none is liquid crystalline. Taken in toto, these results indicate that an
exceedingly wide variety of RTILs can be made easily from much more diverse L/N mixtures
than the structures in Scheme 2-1.

22
Table 2-1. Phases of neat 1/1 (mol/mol) L/N mixtures at room temperature and –18 °C (in parentheses) before (B) and after (A) CO2 bubbling. L,
S, W, and M indicate (respectively) liquid, solid, wax, and a turbid liquid mixture which eventually separated into solid and liquid components.
Amidine B A B A B A B A B A B A B A B A B AC4 L L L L (L) L L (L) L L (L) L L (L) L L (L) L L L L (S) M L (S)C5 L L L L (L) L L (L) L L (L) L L (L) L L (L) L L L L (S) M L (S)C6 L L L L (L) L L (L) L L (L) L L (L) L L (L) L L L L (S) M L (S)C7 L L L L (L) L L (L) L L (L) L L (L) L L (L) L L L L (S) M L (S)C8 L L L L (L) L L (L) L L (L) L L (L) L L (L) L L L L (S) M L (S)
none L L L S L S L S L S L S L S L S S S
PheC1ProC1
Amino acid octadecyl esterAmino acid octyl esterLeuC18 IleC18LeuC8LeuC1 IleC1 IleC8
Amino acid methyl esterValC1

23
The time dependence of CO2 uptake by some of the amidine/primary acid ester
mixtures was followed using a gas burette containing one atmosphere pressure of CO2.
As was observed for the uptake of CO2 by amidine/alkyl amine mixtures,3 C8/IleC1
added CO2 rapidly,58 reaching a constant value near 100 % (Figure 2-2), as expected
if the reaction in Scheme 2-1 (leading to RTIL formation) goes to completion. In
addition, C8/IleC8 system showed similar CO2 uptake plots as C8/IleC1 system,
which indicates CO2 uptake by the L/N system was not disturbed by much longer
alkyl chain length of amino acid ester. Uptake of CO2 by the C8/ProC1 system,
containing a secondary amino acid methyl ester, stopped after ca. 90 % of the amount
calculated for one equivalence. Regardless, 90% uptake indicates that the C8/ProC1
system produces a useful RTIL. A lower affinity for CO2 by the L/ProC1 systems was
expected because primary amines are known to react more readily with CO2 than
secondary (or tertiary) amines.59 For that reason, we anticipated a much lower uptake
of CO2.
0 10 20 30 40 50 60
0
20
40
60
80
100
120
% C
O2
Time (min)
Figure 2-2. Percentage uptake of CO2 (%CO2) by C8/IleC1 (), C8/IleC8 (), and
C8/ProC1 () as a function of time upon exposure to 1 atm pressure of CO2.

24
40 60 80 100 120 140 160 180 200
0
20
40
60
80
100
(b)W
eigh
t %
Temperature (oC)
(a)
(c)
Figure 2-3. TGA curves for neat (a) C8/LeuC1 and (b) C8-LeuC1-CO2 heated from
room temperature. Curve (c) is curve (a) minus curve (b).
TGA measurements of weight loss from heating C8/LeuC1 and C8-LeuC1-CO2
are shown in Figure 2-3. They indicate that some of the amidine and amino acid ester
evaporated in the stream of nitrogen gas which passed over the sample at elevated
temperatures. The subtracted curve, Figure 2-3(c), has a plateau-like region above ca.
50 °C, corresponding to loss of 10.9 % sample weight. This amount is in excellent
agreement with the calculated weight for loss of one molar equivalent of CO2, 11.5 %.
These results demonstrate that loss of CO2 gas from the L-N-C becomes important in
air atmospheres well above room temperature. The RTILs are more stable to heating
when placed under CO2 atmospheres.
We have also explored the temperatures at which some of the L-N-C RTILs
crystallize. Except for those from amidine/octadecyl esters, all of the L-N-C remained
liquids at -18 °C. Solidification of C6-LeuC18-CO2 and C6-IleC18-CO2 was observed

25
by polarizing optical microscopy (Figure 2-4) as samples were cooled from room
temperature and then heated subsequently from below their melting temperatures. For
C6-LeuC18-CO2, solidification and melting occurred at 14.3–12.6 °C and 11.8–
12.5 °C, respectively; for C6-IleC18-CO2, the corresponding temperatures were 9.2–
11.6 °C and 9.5–11.0 °C. The freezing and melting temperatures for C6-LeuC18-CO2
are in reasonably good agreement with the values determined by DSC (Figure 2-5)
where the onsets of the cooling exotherm (-24.0 J/g) and heating endotherm (19.2 J/g)
were at 7.6 and -3.1 °C, respectively; for C6-IleC18-CO2, the corresponding
temperatures were 9.0 °C (22.0 J/g) and -5.5 °C (24.9 J/g). In subsequent cooling and
heating cycles, the heats of transitions became progressively lower. We ascribe this
behavior to loss of some CO2 while the sample was heated to 30 °C. Furthermore, C6-
LeuC1-CO2 to which had been added 3 wt% of water also remained a liquid at -18 °C,
after remaining in a freezer for 1 h, the sample was turned upside down and it flowed
(rather than remaining at the top or falling as a solid would) due to gravity.
Figure 2-4. Optical micrograph of solidified C6-LeuC18-CO2 (left) and C6-IleC18-
CO2 (right) at 8 °C. Scale bar is 400 μm.
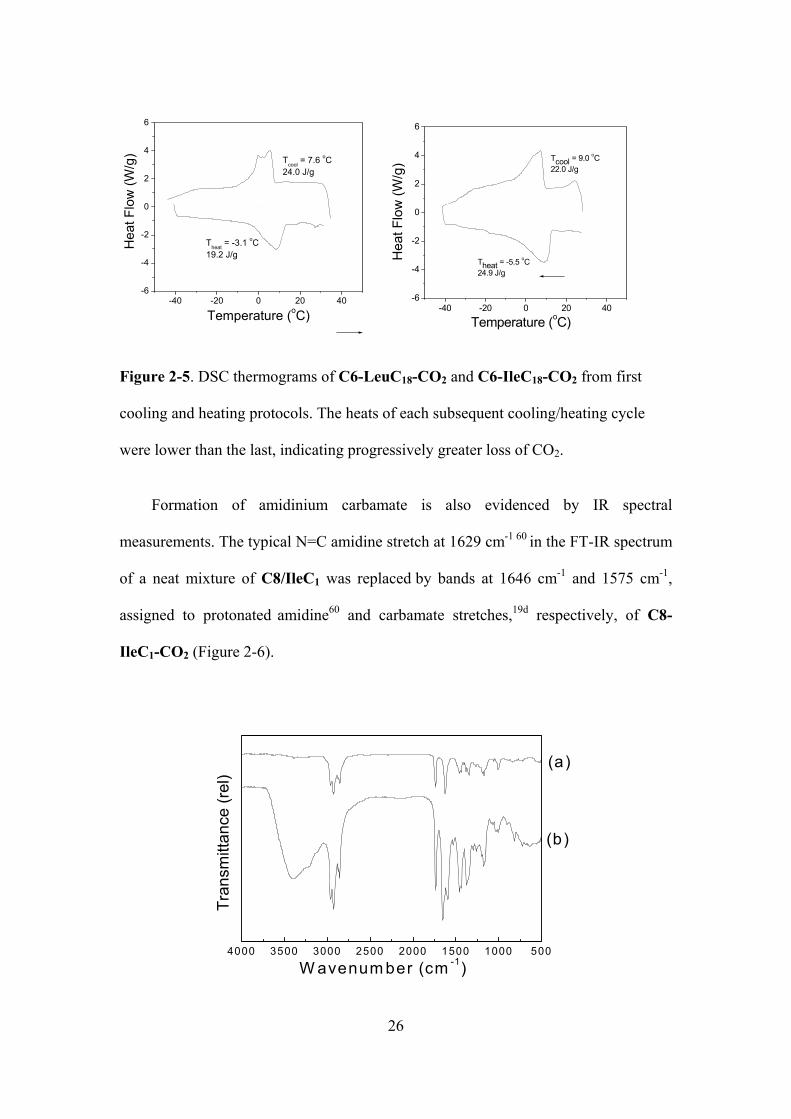
26
-40 -20 0 20 40-6
-4
-2
0
2
4
6
Theat = -3.1 oC19.2 J/g
Hea
t Flo
w (W
/g)
Temperature (oC)
Tcool = 7.6 oC24.0 J/g
-40 -20 0 20 40-6
-4
-2
0
2
4
6
Theat = -5.5 oC24.9 J/g
Hea
t Flo
w (W
/g)
Temperature (oC)
Tcool = 9.0 oC22.0 J/g
Figure 2-5. DSC thermograms of C6-LeuC18-CO2 and C6-IleC18-CO2 from first
cooling and heating protocols. The heats of each subsequent cooling/heating cycle
were lower than the last, indicating progressively greater loss of CO2.
Formation of amidinium carbamate is also evidenced by IR spectral
measurements. The typical N=C amidine stretch at 1629 cm-1 60 in the FT-IR spectrum
of a neat mixture of C8/IleC1 was replaced by bands at 1646 cm-1 and 1575 cm-1,
assigned to protonated amidine60 and carbamate stretches,19d respectively, of C8-
IleC1-CO2 (Figure 2-6).
4000 3500 3000 2500 2000 1500 1000 500
(b)
Tran
smitt
ance
(rel
)
W avenum ber (cm -1)
(a)

27
Figure 2-6. IR spectra of neat C8/IleC1 (a) before and (b) after exposure to CO2.
Because the amino acid esters are optical active, we have investigated the
changes that occur in their specific optical rotations at 589 nm before and after
addition of CO2 (Table 2-2). As expected, the [α]total of achiral amidine/amine
mixtures remain within experimental error of 0 before and after addition of CO2.
However, [α]total of the mixtures with an amino acid ester, especially those with
leucine, changed significantly in magnitude and changed sign upon addition of CO2.
Although this behavior can be attributed to the interactions between amino esters and
amidines after adding CO2 to form the ionic liquids, the nature of those specific
interactions is not known at this time. Somewhat surprisingly, the [α]opt values of
C6/LeuC1 and C6/IleC1 are lower than the[α]total values of their neat optically active
components, LeuC1 and IleC1, respectively. This result suggests that even before the
addition of CO2 to the L/N mixtures, amidine and amino acid ester molecules interact
strongly. The specific nature of that interaction is not obvious from any of the other
measurements we have made. However, we suspect that there is a strong interaction
between the relatively acidic amino protons and the basic amidine functionality. An
H-bonding interaction of his sort could alter the conformation at the chiral center of
the amino acid esters and lead to the changes observed.61
Table 2-2. Specific rotations of alkyl amines and amino acid ester, and their amidine
mixtures before and after exposure to 1 atm CO2.
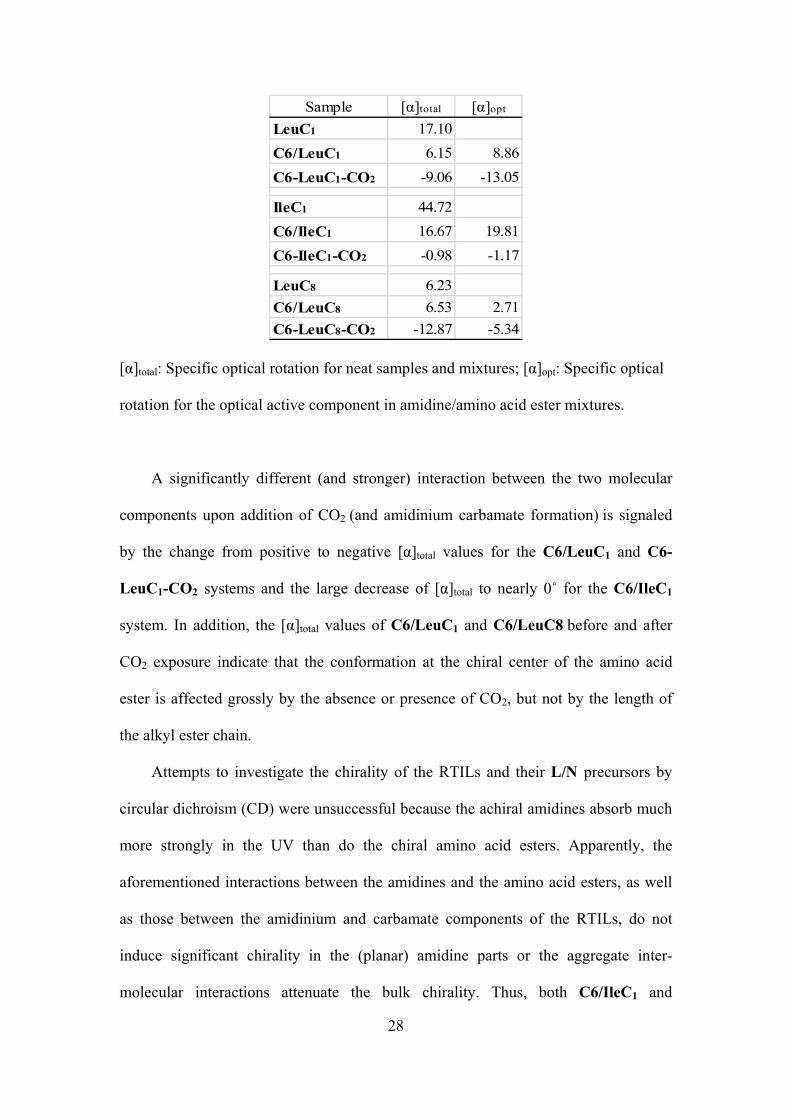
28
Sample [α]total [α]opt
LeuC1 17.10C6/LeuC1 6.15 8.86C6-LeuC1-CO2 -9.06 -13.05
IleC1 44.72C6/IleC1 16.67 19.81C6-IleC1-CO2 -0.98 -1.17
LeuC8 6.23C6/LeuC8 6.53 2.71C6-LeuC8-CO2 -12.87 -5.34
[α]total: Specific optical rotation for neat samples and mixtures; [α]opt: Specific optical
rotation for the optical active component in amidine/amino acid ester mixtures.
A significantly different (and stronger) interaction between the two molecular
components upon addition of CO2 (and amidinium carbamate formation) is signaled
by the change from positive to negative [α]total values for the C6/LeuC1 and C6-
LeuC1-CO2 systems and the large decrease of [α]total to nearly 0˚ for the C6/IleC1
system. In addition, the [α]total values of C6/LeuC1 and C6/LeuC8 before and after
CO2 exposure indicate that the conformation at the chiral center of the amino acid
ester is affected grossly by the absence or presence of CO2, but not by the length of
the alkyl ester chain.
Attempts to investigate the chirality of the RTILs and their L/N precursors by
circular dichroism (CD) were unsuccessful because the achiral amidines absorb much
more strongly in the UV than do the chiral amino acid esters. Apparently, the
aforementioned interactions between the amidines and the amino acid esters, as well
as those between the amidinium and carbamate components of the RTILs, do not
induce significant chirality in the (planar) amidine parts or the aggregate inter-
molecular interactions attenuate the bulk chirality. Thus, both C6/IleC1 and

29
C6/LeuC1 showed no clear CD bands at wavelengths corresponding to their
absorption bands at wavelengths where the optical densities were <1. Attempts to
detect induced chirality61 in the uncharged (achiral) dye, 1-(p-dimethylaminophenyl)-
2-methylene (DAPNE), and the anionic dye, Eosin Y, by adding them as solutes to
C6/IleC1 and C6/LeuC1 and their RTILs, were unsuccessful; there were no
discernible induced CD bands. Both dyes absorb above 290 nm, where absorption by
the L/N and L-N-C are minimal,.
A major attribute of these systems is their large polarity changes when
exposed to CO2 and N2 gases.3 As an example, the polarity of one of our reversible
amidine/amino acid ester systems was estimated using the solvatochromic dye,62
DAPNE, as a probe. Its 425 nm absorbance maximum in C8/IleC1 indicates an
environment like that afforded by toluene (λmax = 425 nm).57 After CO2 exposure, the
λmax is shifted to 443 nm, indicating a medium slightly less polar than N,N-
dimethylformamide (DMF; λmax = 446 nm).57 Consistent with the presence of the ester
functionality in the C8/IleC1 system, it is slightly more polar than the C8/1-
hexylamine system in which DAPNE exhibited λmax = 423 nm before and 438 nm
after addition of CO2 (Table 2-3).3
Table 2-3. Absorption maxima (λmax) of DAPNE57 in various solvents and RTILs.3a
solvent λmax (nm)
n-heptane 393
n-decane 396
C8/hexylamine 423
C8/IleC1 425

30
Toluene 425
THF 427
acetone 433
C8-hexylamine-CO2 438
C8-IleC1-CO2 443
DMF 446
DMSO 456
Water 496
As such, it is possible to dissolve, reversibility, a low polar material into the L/N
and separate them from the L-N-C phase or, by bubbling through N2 gas, redissolve
them into the L/N phase. An example of this strategy is shown in Figure 2-7. A
solution of C8/LeuC1 and n-decane containing Eosin Y became opaque after bubbling
CO2 through it for < 1 min. When centrifuged for ca. 10 min, the liquid separated into
two phases, with the anionic dye isolated in the ionic liquid layer (as indicated by the
color in it and the lack of discernible UV-vis absorption from Eosin Y in the n-decane
layer). The two layers were reconverted to a single liquid phase by bubbling N2 gas
through and warming to ca. 40 ˚C to accelerate the displacement of CO2. This RTIL
appears to be very stable in n-decane at room temperature; it did not reconvert to a
single layer after N2 bubbling for 60 min at room temperature.

31
+CO2
Δ, N2
O
O Na
OBr
BrBr
Br
ONa O
Figure 2-7. Photographs of a 1/1 (v/v) n-decane/(C8/LeuC1) solution containing 0.3
μM Eosin Y before (left) and after (right) CO2 bubbling for 1 min and centrifugation.
The two-phase mixture at right was reconverted to one phase at 40 ˚C by N2 bubbling
(left). The chemical structure of Eosin Y is shown at the far right.
As found in the amidine/alkyl amine systems,3 the chemical shifts of selected
1H and 13C resonances in NMR spectra of L-N-C, but not of the corresponding nuclei
in the L/N mixtures, were sensitive to concentration in the range, 10–1500 mM
(Figure 2-8). This dependence has been attributed to aggregation of the amidinium
carbamates and must play a significant role in the optical rotation measurements noted
above. A detailed study of the concentration dependence of CDCl3 solutions of
C8/IleC1 and C8-IleC1-CO2 was performed. The nuclei of IleC1 most affected, the
protons of the geminal N-dimethyl groups (N=C-N(CH3)2), the C-methyl protons
(N=C(CH3)-N), the α-methylene protons (-CH2N=C-N), and the amidine carbon atom
(N=C(CH3)-N), exhibited only small peak shifts upon addition of CO2. The
resonances were shifted downfield when the concentration was increased up to 750
mM. By bubbling N2 gas through the solutions with higher concentrations of C8-
IleC1-CO2 (350 mM; Figure 2-9), the proton and carbon signals could be returned to
their C8/IleC1 values. The system was cycled 3 times between C8/IleC1 and C8-

32
IleC1-CO2, with no or little discernible degradation of the sample. These results and
the aforementioned partitioning of added n-decane provide strong evidence that the
L/N ⇔L-N-C conversions are reversible and can be used to effect separations of
solvents and solutes.
0 200 400 600 800 1000 1200 1400 1600
1.8
2.0
2.2
2.4
2.6
2.8
3.0
3.2
3.4
Che
mic
al S
hift
(ppm
)
Concentration (mM)
Figure 2-8. Concentration dependence of chemical shifts of key protons for C8/IleC1
(open symbols) and C8-IleC1-CO2 (closed symbols) in CDCl3: CH2N=C-N (, :
3.15- 3.35 ppm), N=C-N(CH3)2 (, : 2.85–3.15 ppm), N=C(CH3)-N (∆, : 1.85–
2.1 ppm).
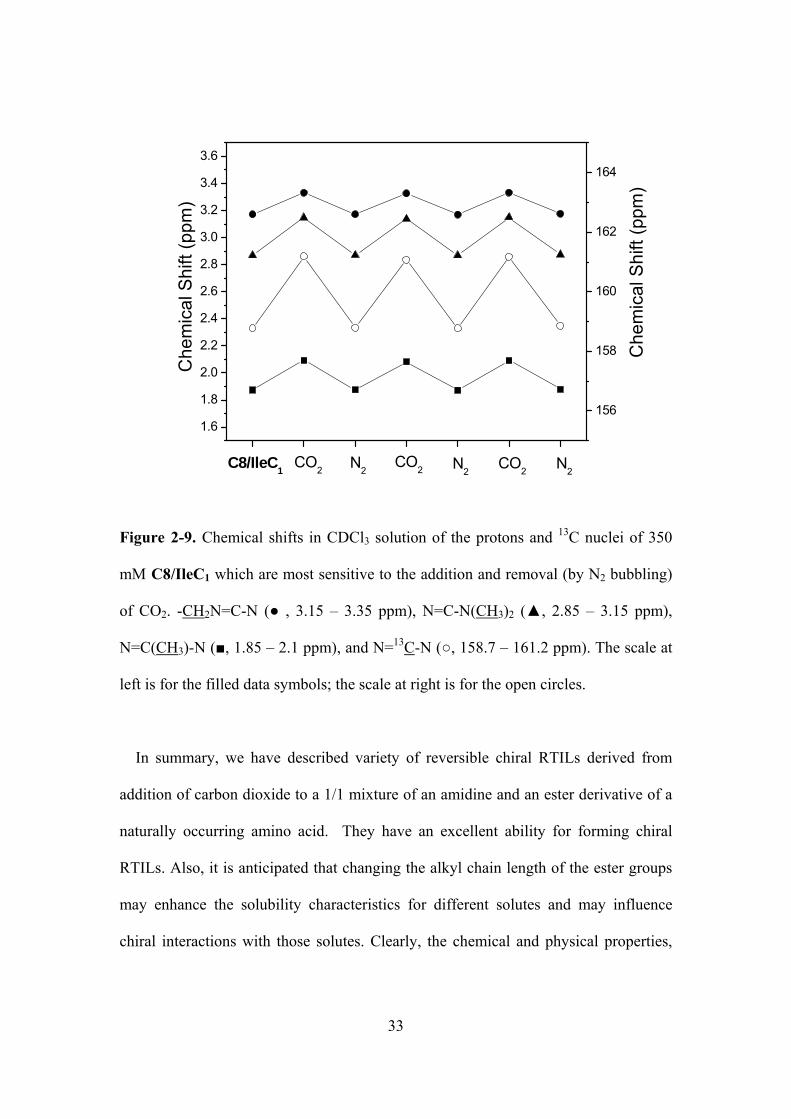
33
156
158
160
162
164
1.6
1.8
2.0
2.2
2.4
2.6
2.8
3.0
3.2
3.4
3.6
CO2 N2
Che
mic
al S
hift
(ppm
)
CO2 N2
Che
mic
al S
hift
(ppm
)
C8/IleC1CO2 N2
Figure 2-9. Chemical shifts in CDCl3 solution of the protons and 13C nuclei of 350
mM C8/IleC1 which are most sensitive to the addition and removal (by N2 bubbling)
of CO2. -CH2N=C-N ( , 3.15 – 3.35 ppm), N=C-N(CH3)2 (, 2.85 – 3.15 ppm),
N=C(CH3)-N (, 1.85 – 2.1 ppm), and N=13C-N (, 158.7 – 161.2 ppm). The scale at
left is for the filled data symbols; the scale at right is for the open circles.
In summary, we have described variety of reversible chiral RTILs derived from
addition of carbon dioxide to a 1/1 mixture of an amidine and an ester derivative of a
naturally occurring amino acid. They have an excellent ability for forming chiral
RTILs. Also, it is anticipated that changing the alkyl chain length of the ester groups
may enhance the solubility characteristics for different solutes and may influence
chiral interactions with those solutes. Clearly, the chemical and physical properties,

34
such as density, and viscosity, of the RTILs can be adjusted with the choice of
functional groups near the amine.
2.3 Carbon dioxide and molecular nitrogen as switches between ionic and
uncharged room-temperature liquids comprised of amidines and chiral amino
alcohols
2.3.1 Introduction
In this part, we report the properties of amidinium carbamates—reversible,
room-temperature, chiral ionic liquids that are easily made from readily available
amidines and chiral amino alcohols. Results from this work are compared with those
from mixtures of amidines and alcohols and of amidines and achiral amines or chiral
amino acid esters. Among their other attributes, the ionic liquids reported here persist
over very wide temperature ranges, are much more tolerant to added water than an
analogous reversible ionic liquid made from amidine and hexanol (that must be kept
dry to avoid the formation of solids),45 and lack chromophores absorbing in the visible
and the near UV region. Although several ILs 63 and RTILs64 employing amino acids
and their derivatives are known, none of which we are aware (except our own
involving amino acid esters3a), including one which employs CO2,65 has been reported
to have switchable capability between non-ionic and ionic states.
The ionic liquid phases are prepared by exposing a 1/1 (mol/mol) mixture of an
easily synthesized amidine (N’-alkyl-N,N-dimethylacetamidine; L) and an amino
alcohol (A), obtained in one step by reduction of a naturally-occurring amino acid, to
CO2 gas (C) (Scheme 2-2); one commercially available amino alcohol with two chiral
centers, (1R, 2S)-(-)-norephedrine, and one achiral amino alcohol, glycinol (i.e., 2-
aminoethanol; GlyOH), have been employed as well. All of the possible 40
combinations from the L/A mixtures in Scheme 2-2 form room-temperature ionic

35
liquids (L-A-C) in this way. They are stable indefinitely at room temperature under an
atmosphere of CO2 and all of them remain liquids to -20 oC. The L-A-C can be
reconverted to their non-ionic (L/A) states after an inert gas (such as N2) is bubbled
through them at room temperature or, more rapidly, at slightly elevated temperatures.
NHOH
ProOH
OH
NH2
NorOH
R1 N N(CH3)2
L
+A
H2NOH
R2
* R1 N N(CH3)2
H
O CO
NH
L-A-C R2
OH*
R1
C4 n-C4H9
C5C6C7C8
n-C5H11
n-C6H13n-C7H15n-C8H17
Scheme 2-2
R2
ValOHLeuOHIleOHMetOHPheOH
CH(CH3)2
CH2CH(CH3)2CH(CH3)C2H5
CH2C6H5
C2H4SCH3
CO2
heat, N2
GlyOH H
2.3.2 Syntheses of amino alcohols
The general procedure for synthesis of the amino alcohols is presented in detail for
L-leucinol (LeuOH); minor variations were adopted for the other amino alcohols.
Over a 30 min period, lithium aluminum hydride 4.0 g (0.10 mol) was added to a
cooled (ice-bath) suspension of L-leucine 10 g (0.076 mol) in 100 mL of THF under a
nitrogen atmosphere. The ice bath was removed and the reaction mixture was warmed
to room temperature, then refluxed for 24 h under a nitrogen atmosphere, and
quenched by slowly adding sequentially water (4.0 mL), aqueous 15% of sodium
hydroxide (4.0 mL), and water (12 mL). The mixture was stirred for 30 min and a
white precipitate was separated by filtration. The filter cake was extracted with
dichloromethane and the combined organic layers were dried with sodium sulfate,
concentrated under reduced pressure, and distilled at bp 90 ºC /0.9 Torr (lit66 bp 64-65

36
ºC /1.5 Torr) to yield 5.3 g (60%) of a colorless liquid. Purity 98% (GC). 1H NMR: δ
3.56 (d-d, 1H, JHH 10.5 Hz, 3.9 Hz, CH2-OH); 3.23 (d-d,1H, JHH 10.5 Hz, 5.1 Hz,
CH2-OH); 2.87 (m, 1H, H2N-C*H); 1.8-2.4 (br, 3H, NH2 and OH); 1.68 (m, 1H, CH2-
CH(CH3)2); 1.21 (t, 2H, JHH 10.5 Hz, C*H-CH2-CH); 0.89-0.94 (m, 6H, CH(CH3)2).
13C NMR: δ 67.12, 50.83, 43.68, 24.89, 23.58, 22.38.
L-Prolinol (ProOH). Yield: 48% of a yellowish clear liquid; Purity 99% (GC);
bp 46-47 ºC/0.2 Torr (lit67 89 ºC/6 Torr); 1H NMR: δ 3.22-3.58 (m, 5H, -NH-C*H-
CH2-OH); 2.90 (t, 2H, JHH 6.8 Hz, -CH2-CH2-NH-); 1.65-1.88 and 1.34-1.46 (m, 4H,
CH2-CH2-C*H). 13C NMR: δ 64.90, 59.92, 46.50, 27.65, 26.01.
L-Valinol (ValOH). Yield: 50.2% of a colorless solid. Purity 98% (GC); mp
31.3-33.6 ºC (lit12 mp 32 ºC); bp 38-39 ºC /0.15 Torr (lit12 55-57 ºC /2 Torr); 1H NMR:
δ 3.64 (d-d, 1H, JHH 13.5 Hz, 3.9 Hz, CH2-OH); 3.28 (d-d, 1H, JHH 13.5 Hz, 8.7 Hz,
CH2-OH); 2.56 (m, 1H, H2N-C*H); 1.7-2.2 (br, 3H, NH2 and OH); 1.57 (m, 1H, C*H-
CH(CH3)2); 0.92 (m, 6H, CH(CH3)2). 13C NMR: δ 64.89, 58.64, 31.71, 19.48, 18.56.
L-Isoleucinol (IleOH). Yield: 54% of a colorless solid. Purity 98% (GC). mp
32.5-37.3 ºC (lit68 mp 38-40 ºC); bp 61 ºC /0.5 Torr (lit68 100-101 ºC /5 Torr); 1H
NMR: δ 3.64 (d-d, 1H, JHH 10.5 Hz, 3.9 Hz, CH2-OH); 3.28 (d-d, 1H, JHH 10.5 Hz,
9.0 Hz, CH2-OH); 2.64 (m, 1H, H2N-C*H); 1.48-1.57 (m, 1H, C*H-CH-); 1.12-1.39
(m, 2H, CH-CH2-CH3); 1.87 (br, 3H, NH2 and OH), 0.87-1.12 (m, 6H, CH(CH3)-
CH2CH3). 13C NMR: δ 64.52, 57.19, 38.79, 25.50, 15.29, 11.48.
L-Methioninol (MetOH). Yield: 83.5% of a yellowish solid. Purity 98% (GC).
mp 33.1-34.6 oC. (lit67 mp 34-35 oC). 1H NMR: δ 3.60 (d-d, 1H, JHH 10.5 Hz, 3.9 Hz,
CH2-OH); 3.34 (d-d, 1H, JHH 10.5 Hz, 7.5 Hz, CH2-OH); 2.95 (m, 1H, H2N-C*H);
2.62 (m, 2H, CH2-S-CH3); 2.11(s, 3H, CH2-S-CH3); 2.0-2.3 (br, 3H, NH2 and OH)

37
1.73 and 1.54 (m, 2H, CH2- CH2-S-CH3). 13C NMR: δ 66.92, 52.16, 33.83, 31.26,
15.83.
L-Phenylalaninol (PheOH). Yield: 62% of a colorless solid. Purity 99% (GC).
mp 92.5-94.4 oC (lit69 mp 91-93 oC) . 1H NMR: δ 7.18-7.34 (m, 5H, Ph-H); 3.64 (d-d,
1H, JHH 13.5 Hz, 3.9 Hz, CH2-OH); 3.36 (d-d, 1H, JHH 13.5 Hz, 7.5 Hz, CH2-OH);
3.12, (m, 1H, H2N-C*H); 2.80 (d-d, 1H, JHH 10.5 Hz, 5.1 Hz, CH2-Ph); 2.53 (d-d, 1H,
JHH 10.5 Hz, 8.5 Hz, CH2-Ph); 1.64 (br, 3H, NH2 and OH). 13C NMR: δ138.95,
129.47, 128.85, 126.69, 66.64, 54.43, 41.22.
The acyclic amidines and DAPNE were available from previous studies. Their
preparation methods and purities are mentioned in Section 2.1. Methods for the
preparation of the ionic liquids, their reversion to their non-ionic states, the
preparation of samples for NMR investigations, the measurement and calculation of
optical rotations, and the measurement of CO2 uptake as a function of time have been
reported in Section 2.1 as well.
2.3.3 Conductivity measurements
The conductivity (σ) of the ionic liquids are obtained from the measured
resistance (R) by the following eq. 2-6:
σ = l/AR (2-6)
Where l is the distance between the two electrodes in the impedance cell and A is
the area of the electrodes. The term l/A is referred to as the cell constant and the
conductivity values were calibrated using various concentrations of standard KCl
solutions in water purified with a Millipore Co. Milli-Q system (resistance 18.3
mΩ·cm; conductivity 50 μS/cm).49The water was sealed in a flask until use to prevent
adventitious absorption of CO2 from the atmosphere. The conductivity tests were
repeated, and the absolute values differed by ca. ±3%.

38
2.3.4 Results and Discussion
The appearances of the phases of the L/A combinations at room temperature
and at -20 oC, both before and after bubbling CO2, are collected in Table 2-4. All the
L/A combinations formed clear, nearly colorless ionic liquids after exposure to CO2 at
room temperature and remained so to -20 oC. By comparison, exposure of mixtures of
the same amidines and either a simple amine3a or simple esters of the amino acids3b
from which the amino alcohols were derived led to liquids in many cases, but to solids
in others, even at room temperature. As expected, the L/A mixtures were qualitatively
less viscous than the corresponding L-A-C ionic liquids (with their added electrostatic
interactions), and those with the phenyl-substituted amino alcohols, PheOH and
NorOH, were more viscous than the ionic liquids with alkyl-substituted amino
alcohols. The ionic liquids are stable indefinitely at room temperature under one
atmosphere of CO2 pressure at room temperature and some are stable for very long
periods in the air. However, TGA measurements indicate that the loss of CO2 occurs
very rapidly at ca. 50 oC in air.
Consistent with our observations on analogous systems employing an amidine and
either a simple amine or an amino acid ester, the L/A and L-A-C retain their general
phase characteristics when as much as 10% of water is added; the addition of water to
an L/A mixtures did not impede the formation of L-A-C upon bubbling CO2 and no
precipitate or cloudiness was observed. To assure quantitative reproducibility, all
experiments reported here were conducted under dry conditions unless stated
otherwise.

39
Table 2-4. Appearances of 1/1 (mol/mol) amidine/amino alcohol mixtures at room temperature and at -20 oC (in parentheses) before (B) and
after (A) exposure to CO2.
L and S indicate liquid and solid, respectively, at room temperature. a Samples were heated slightly above 50 °C until amino alcohols were
dissolved before CO2 bubbling. b Samples were initially a milky-white mixture that became a totally clear liquid upon further exposure to CO2.
Amino alcohol
Glycinol Prolinol Leucinol Isoleucinola Valinola Methioninola Phenylalaninola Norephedrine
Amidine B A B A B A B A B A B A B A B A
C4 L(L) L(L) L(L) L(L) L(L) Lb (L) L(L) L(L) L(L) L(L) L(L) L(L) L(L) L(L) L(L) L(L)
C5 L(L) L(L) L(L) L(L) L(L) Lb(L) L(L) L(L) L(L) L(L) L(L) L(L) L(L) L(L) L(L) L(L)
C6 L(L) L(L) L(L) L(L) L(L) Lb(L) L(L) L(L) L(L) L(L) L(L) L(L) L(L) L(L) L(L) L(L)
C7 L(L) L(L) L(L) L(L) L(L) Lb(L) L(L) L(L) L(L) L(L) L(L) L(L) L(L) L(L) L(L) L(L)
C8 L(L) L(L) L(L) L(L) L(L) Lb(L) L(L) L(L) L(L) L(L) L(L) L(L) L(L) L(L) L(L) L(L)
none L L L L L S S S S S S S S S S S

40
0 10 20 30 40 50 60 70
0
20
40
60
80
100
120
%C
O2
Time (min)
Figure 2-10. Percentage uptake of CO2 (%CO2; based upon a presumed 1/1
stoichiometry for CO2 and amino alcohol) by 1/1(mol/mol) C8/ProOH (),
C8/LeuOH ( ), and C8/ValOH () as a function of time upon their exposure to one
atmosphere pressure of dry CO2 gas at room temperature. Samples were stirred to
increase the rate of molecular exchange at the gas-liquid interfaces.
The existence of amidinium carbamates was confirmed by the quantitative
determination of %CO2 uptake by the L/A systems as a function of time using the
mercury burette apparatus described above70 and, independently, by FT-IR, TGA, and
1H and 13C NMR measurements before and after samples were exposed to CO2. The
examples in Figure 2-10 show that the rates of CO2 uptake during the first 10 min are
fast, and reached plateau values after approximately 50 min. For C8/LeuOH and
C8/ValOH mixtures, the theoretical amount is absorbed after ca. 30 min and another
ca. 10% was absorbed thereafter. These results indicate that both chemically-fixed and
physically adsorbed CO2 are present.71 The initial absorption is probably the result of
the conversion of L/A to L-A-C phases, and the ca. 10% excess is the physically

41
adsorbed part. Only 87% uptake of CO2 was observed in the C8/ProOH system; the
fractions that are chemically and physically absorbed are not known. It is known that
the efficiency of CO2 uptake by secondary amines, such as ProOH, is much less than
that of primary amines. Because hydroxyl groups are also capable of reacting with
CO2 and then with an amidine,33, 72 the %CO2 uptake by 2/1 C8/LeuOH and
C8/ValOH systems was examined to determine whether 2 molecules of gas can react
per molecule of amino alcohol when 2 equivalents of amidine is present. In both cases,
ca. 1.5 equivalents of CO2 were absorbed, indicating that conversion of the hydroxyl
groups to carbonates was not complete.
4000 3500 3000 2500 2000 1500 1000 500
(b)
(a)
Tra
nsm
ittan
ce (r
el)
Wavenumber (cm-1)
Figure 2-11. FT-IR spectra of C8/ValOH (a) and C8-ValOH-CO2 (b).
Figure 2-11 shows the spectra of a C8/ValOH sample before and after bubbling
CO2 through it. After bubbling, the typical N=C stretching band of the C8 component
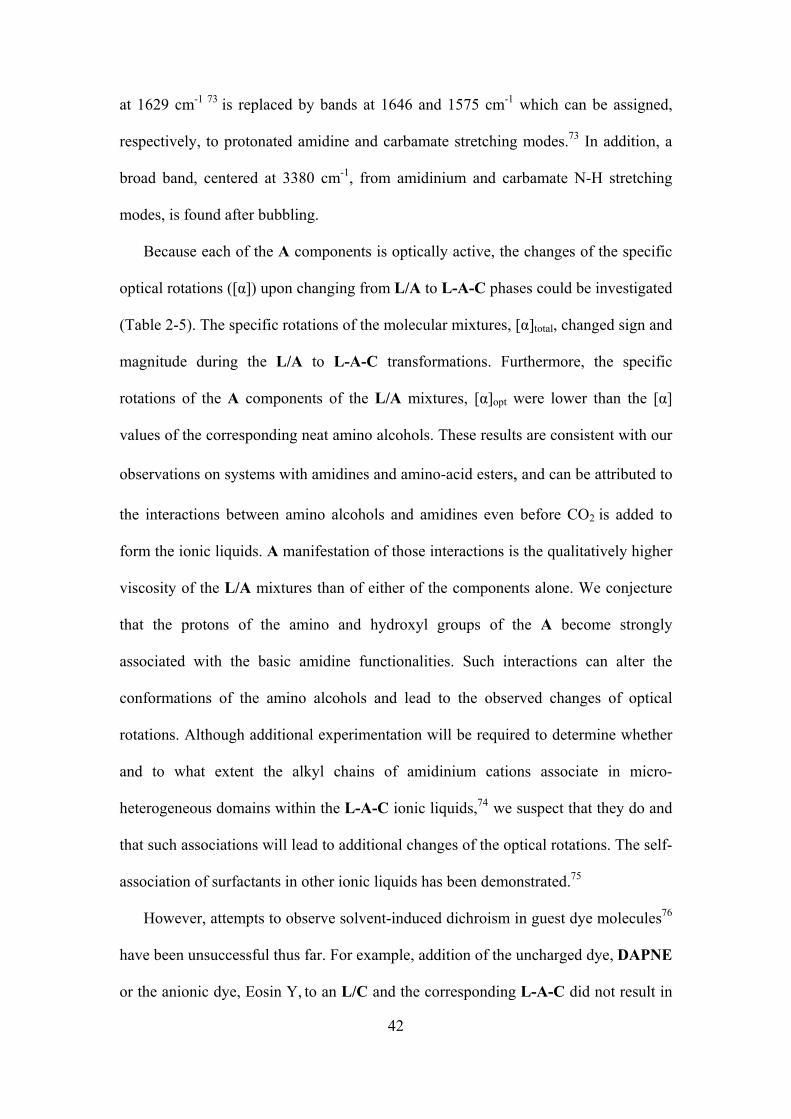
42
at 1629 cm-1 73 is replaced by bands at 1646 and 1575 cm-1 which can be assigned,
respectively, to protonated amidine and carbamate stretching modes.73 In addition, a
broad band, centered at 3380 cm-1, from amidinium and carbamate N-H stretching
modes, is found after bubbling.
Because each of the A components is optically active, the changes of the specific
optical rotations ([α]) upon changing from L/A to L-A-C phases could be investigated
(Table 2-5). The specific rotations of the molecular mixtures, [α]total, changed sign and
magnitude during the L/A to L-A-C transformations. Furthermore, the specific
rotations of the A components of the L/A mixtures, [α]opt were lower than the [α]
values of the corresponding neat amino alcohols. These results are consistent with our
observations on systems with amidines and amino-acid esters, and can be attributed to
the interactions between amino alcohols and amidines even before CO2 is added to
form the ionic liquids. A manifestation of those interactions is the qualitatively higher
viscosity of the L/A mixtures than of either of the components alone. We conjecture
that the protons of the amino and hydroxyl groups of the A become strongly
associated with the basic amidine functionalities. Such interactions can alter the
conformations of the amino alcohols and lead to the observed changes of optical
rotations. Although additional experimentation will be required to determine whether
and to what extent the alkyl chains of amidinium cations associate in micro-
heterogeneous domains within the L-A-C ionic liquids,74 we suspect that they do and
that such associations will lead to additional changes of the optical rotations. The self-
association of surfactants in other ionic liquids has been demonstrated.75
However, attempts to observe solvent-induced dichroism in guest dye molecules76
have been unsuccessful thus far. For example, addition of the uncharged dye, DAPNE
or the anionic dye, Eosin Y, to an L/C and the corresponding L-A-C did not result in

43
discernible CD signals in the region where the dyes absorb. These results indicate that
it will be necessary to increase the specificity of the interactions between a guest and
one of the host molecules if induced CD signals are to be observed.
Table 2-5. Specific rotationsa of amino alcohols, and of amino alcohol/amidine
mixtures before and after exposure to 1 atm CO2 gas at 25 oC
Sample [α]total [α]opt Sample [α]total [α]opt
ProOH 36.7 LeuOH 4.8
C6/ProOH 10.9 27.4 C6/LeuOH 2.7 3.8
C6-ProOH-
CO2 -20.1 -20.5
C6-LeuOH-
CO2 -21.5 -23.7
a [α]total = specific optical rotation of neat samples and mixtures; [α]opt = specific
optical rotation of the amino alcohol component in mixtures. [α] values are ± 0.1°.
The concentration dependence of the NMR chemical shifts of selected 1H and 13C
resonances in chloroform-d solutions of the L-A-C (but not the L/A mixtures)
provides evidence that is consistent with the aggregation of amidinium-carbamate
ionic pairs and microdomains of amidinium alkyl chains. As an example, the
concentration dependence of the resonances from C6/IleOH and C6-IleOH-CO2 in
CDCl3 at room temperature is shown in Figure 2-12. The L-A-C protons that are
closest to ionic centers (N.B., the N-dimethyl groups (N=C-N (CH3)2), the C-methyl
protons (N=C (CH3)-N), and the α-methylene protons (-CH2N=C-N)) exhibited slight,
but reproducible, downfield shifts as concentration was increased to 350 mM.
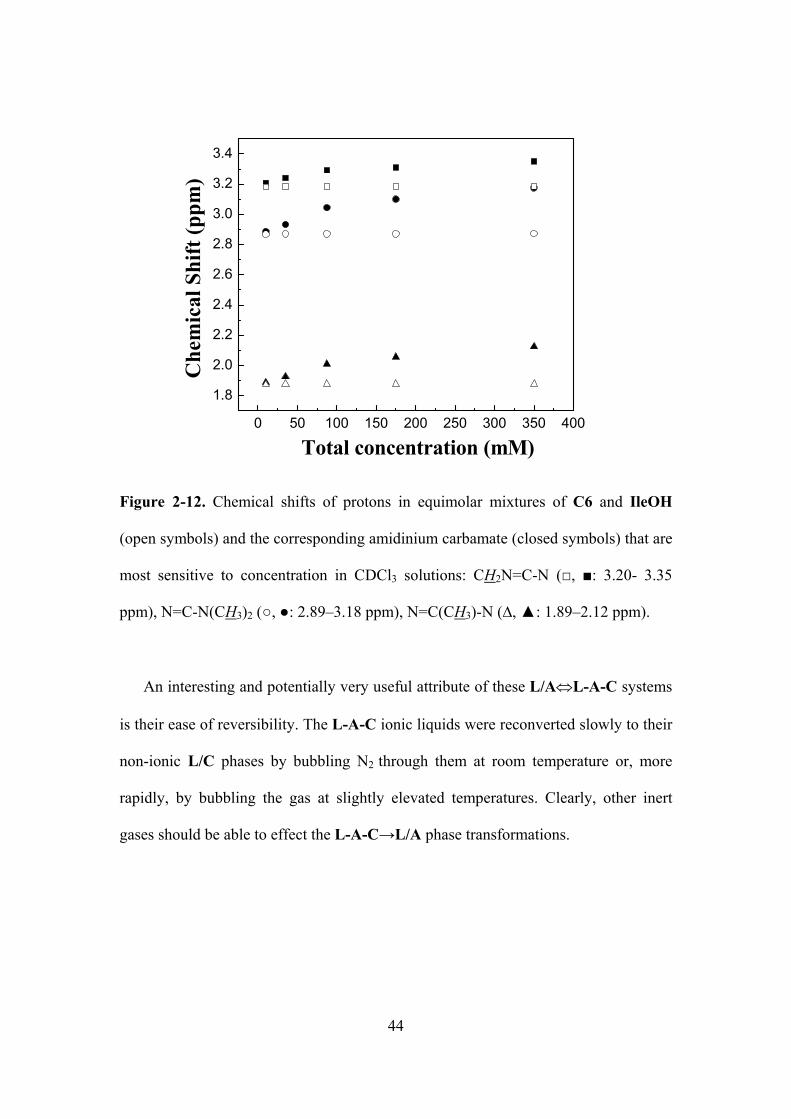
44
0 50 100 150 200 250 300 350 400
1.8
2.0
2.2
2.4
2.6
2.8
3.0
3.2
3.4
Che
mic
al S
hift
(ppm
)
Total concentration (mM)
Figure 2-12. Chemical shifts of protons in equimolar mixtures of C6 and IleOH
(open symbols) and the corresponding amidinium carbamate (closed symbols) that are
most sensitive to concentration in CDCl3 solutions: CH2N=C-N (, : 3.20- 3.35
ppm), N=C-N(CH3)2 (, : 2.89–3.18 ppm), N=C(CH3)-N (∆, : 1.89–2.12 ppm).
An interesting and potentially very useful attribute of these L/A⇔L-A-C systems
is their ease of reversibility. The L-A-C ionic liquids were reconverted slowly to their
non-ionic L/C phases by bubbling N2 through them at room temperature or, more
rapidly, by bubbling the gas at slightly elevated temperatures. Clearly, other inert
gases should be able to effect the L-A-C→L/A phase transformations.

45
156
158
160
162
164
2.0
2.5
3.0
3.5
13C
Che
mic
al S
hift
(ppm
)
N2CO2
1 H C
hem
ical
Shi
ft (p
pm)
N2CO2
N2CO2
Figure 2-13. Chemical shifts of the protons and a carbon atom of 350mM C6/ProOH
in CDCl3 by alternating the bubbling of CO2 and N2 over three cycles. (a) -CH2N=C-
N (), (b) N=C-N(CH3)2 (), (c): N=C(CH3)-N (), and N=13C-N (). The scale at
left is for the filled symbols; the scale at right is for the open circles.
A demonstration of this reversibility for the C6/ProOH system is shown by the
NMR data in Figure 2-13. The amidinium carbamate was formed as a chloroform
solution upon exposure to CO2 and the non-ionic components, C6 and ProOH, were
reformed by bubbling N2 through the chloroform solution at 50 oC for 3 min. The
chemical shift data indicate little or no discernible changes to the amidinium
carbamate or the uncharged precursors upon repeated cycling. The FT-IR spectra in
Figure 2-14, recorded during 2 bubbling cycles, provide additional evidence for the
reversibility of the C6/ProOH system in the absence of chloroform as a diluent. The
N=C stretch at 1629 cm-1 was replaced by peaks attributable to amidinium and
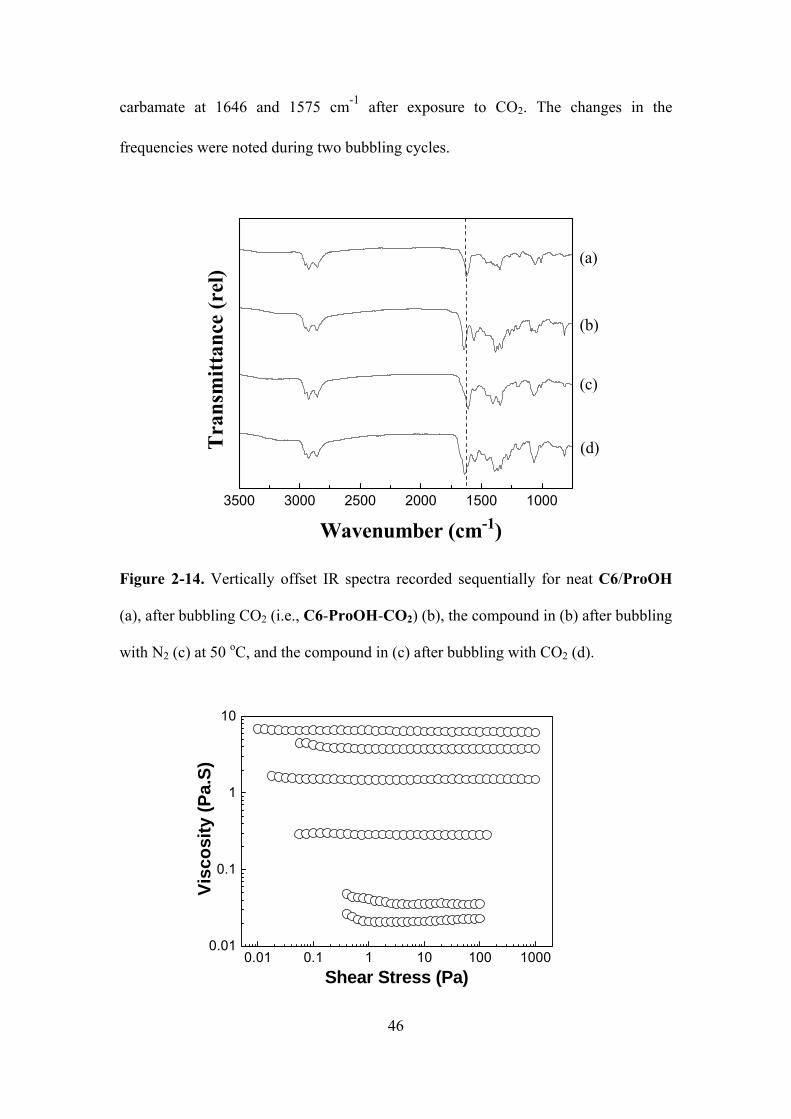
46
carbamate at 1646 and 1575 cm-1 after exposure to CO2. The changes in the
frequencies were noted during two bubbling cycles.
3500 3000 2500 2000 1500 1000
(d)
(c)
(b)
(a)
T
rans
mitt
ance
(rel
)
Wavenumber (cm-1)
Figure 2-14. Vertically offset IR spectra recorded sequentially for neat C6/ProOH
(a), after bubbling CO2 (i.e., C6-ProOH-CO2) (b), the compound in (b) after bubbling
with N2 (c) at 50 oC, and the compound in (c) after bubbling with CO2 (d).
0.01 0.1 1 10 100 10000.01
0.1
1
10
Visc
osity
(Pa.
S)
Shear Stress (Pa)
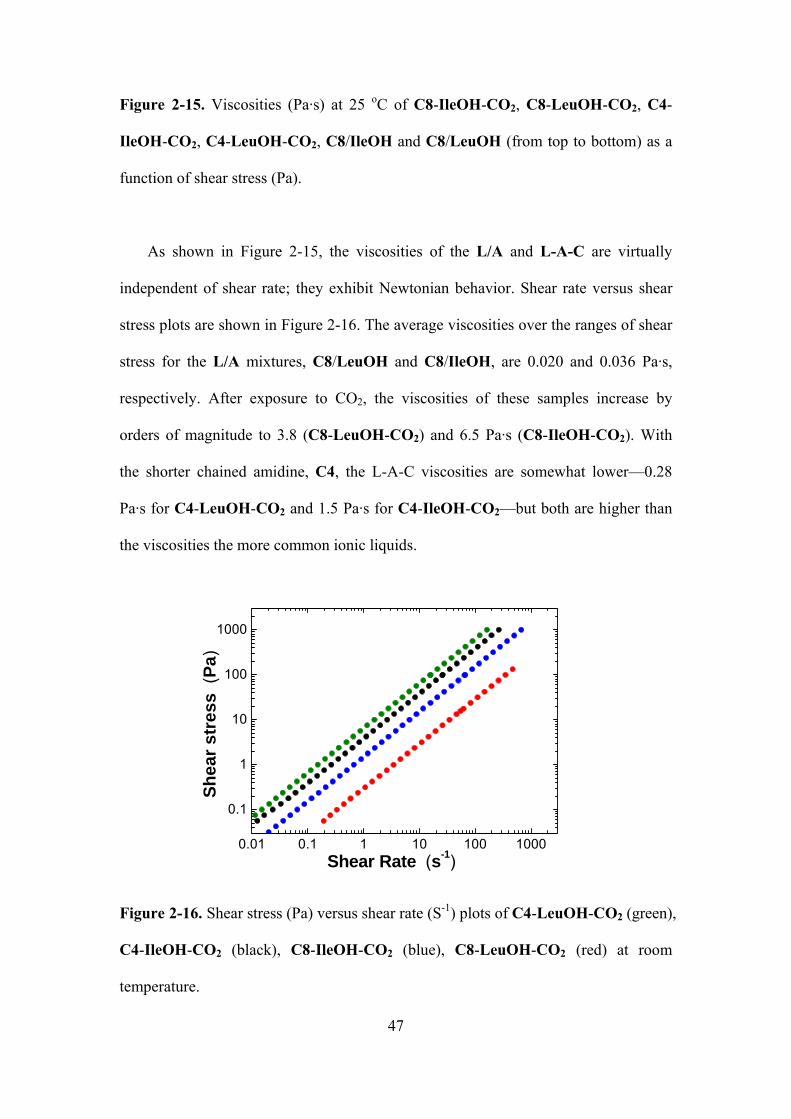
47
Figure 2-15. Viscosities (Pa·s) at 25 oC of C8-IleOH-CO2, C8-LeuOH-CO2, C4-
IleOH-CO2, C4-LeuOH-CO2, C8/IleOH and C8/LeuOH (from top to bottom) as a
function of shear stress (Pa).
As shown in Figure 2-15, the viscosities of the L/A and L-A-C are virtually
independent of shear rate; they exhibit Newtonian behavior. Shear rate versus shear
stress plots are shown in Figure 2-16. The average viscosities over the ranges of shear
stress for the L/A mixtures, C8/LeuOH and C8/IleOH, are 0.020 and 0.036 Pa·s,
respectively. After exposure to CO2, the viscosities of these samples increase by
orders of magnitude to 3.8 (C8-LeuOH-CO2) and 6.5 Pa·s (C8-IleOH-CO2). With
the shorter chained amidine, C4, the L-A-C viscosities are somewhat lower—0.28
Pa·s for C4-LeuOH-CO2 and 1.5 Pa·s for C4-IleOH-CO2—but both are higher than
the viscosities the more common ionic liquids.
0.01 0.1 1 10 100 1000
0.1
1
10
100
1000
Shea
r str
ess
(Pa)
Shear Rate (s-1)
Figure 2-16. Shear stress (Pa) versus shear rate (S-1) plots of C4-LeuOH-CO2 (green),
C4-IleOH-CO2 (black), C8-IleOH-CO2 (blue), C8-LeuOH-CO2 (red) at room
temperature.
48
We have also measured the electronic conductivity (σ) of chloroform solutions of
some mixtures that were cycled between their L/A and L-A-C forms by bubbling with
CO2 and N2. Chloroform was added to reduce the viscosity, thereby allowing more
rapid flow of ions, and decreasing the amount of aggregation among the ions.77
The conductivity of the neat chloroform employed remained < 0.1 µS/cm after
bubbling CO2 through it for 30 min. As expected, addition of an uncharged L/A
mixture, C8/IleOH (Figure 2-17), did not increase the conductivity to a much higher
level. However, the conductivity increased rapidly as CO2 was bubbled through the
solution and the ionic C8-IleOH-CO2 formed; at the C8/IleOH concentration
employed, the conductivity reached a plateau value of 268 µS/cm. When N2 was
passed subsequently through the solution, the conductivity decreased to 25 µS/cm, a
value nearly identical to the conductivity of the original C8/IleOH solution. The inset
in Figure 2-17 shows the conductivity changes during two bubbling cycles. Combined
with the results shown in Figure 2-18, we attribute the small decrease after the second
CO2 bubbling to evaporation of some of the chloroform (and resultant increase in
viscosity and ion aggregation) that occurs during the bubbling procedures.

49
0 2 4 6 8 10
0
50
100
150
200
250
300
0
50
100
150
200
250
300
CO2 N2N2
CO2
Con
duct
ivity
(10-6
S/cm
)
Con
duct
ivity
(10-6
S/cm
)
Time (min)
Figure 2-17. Conductivity at 25 oC of 50 wt % C8/IleOH in CHCl3 as a function of
time of bubbling CO2. The inset shows maximum conductivities at 25 oC when CO2
(at 25 oC) and N2 (at 50 oC) were bubbled through sequentially. The N2 bubbling was
conducted at 50 oC to accelerate the loss of CO2.
The conductivity values at room temperature of three neat C8 amidine and amino
alcohol combinations, before and after exposing them to CO2 for 30 min, are shown in
Table 2-6. The conductivity values of the L-A-C phases are similar to those of related
ionic liquids,34 but are less than those of imidazolium-based ionic liquids.13 The
mobilities of the ions in the L-A-C phases are attenuated by the relatively high
viscosities as well as the aforementioned ion aggregation.22
Table 2-6. Conductivities of three neat equimolar C8/amino alcohol combinations
before (L/A) and after (L-A-C) exposing them to CO2 for 30 min at room temperature.

50
amino alcohol (A) conductivity (µS/cm)
L/A L-A-C
ProOH 22 85
MetOH 15 66
IleOH 14 58
To explore further the influences of viscosity and ion-pairing on conductivity of
the L-A-C, various concentrations of C8/IleOH and C8-IleOH-CO2 were prepared in
chloroform and water and their conductivities were measured at room temperature
(Figure 2-18). As expected, the conductivities of the C8/IleOH remained low at all
concentrations in chloroform but increased significantly with increasing water content,
to a plateau value of ca. 2.1 mS/cm.
In contrast, the conductivity of C8-IleOH-CO2 increased dramatically when
small amounts of either chloroform or water were added; a maximum of 319 µS/cm,
about 5.5 times higher than the conductivity of neat C8-IleOH-CO2, was reached at
80 wt% of CHCl3, and the maximum conductivity, at 70 wt % water, was 7.1 mS/cm.
Clearly, the net effect of adding chloroform or water is a convolution of two factors
that increase conductivity—higher ion mobilities and less ion pairing—and one that
decreases it—lower ion concentrations. Separation of these factors and quantification
of each are not trivial.78 Furthermore, the very large conductivities when water is
added to C8-IleOH-CO2 must be due, in part, to reaction of water and CO2 to form
carbonates.33

51
0 20 40 60 80 1000
50
100
150
200
250
300
350
Con
duct
ivity
(10-6
S/cm
)
Concentration (CHCl3 wt%)
a
0 20 40 60 80 1000
2000
4000
6000
8000
Con
duct
ivity
(10-6
S/cm
)
Concentration (H2O wt%)
b
Figure 2-18. Conductivity of C8/IleOH as a function of CHCl3 (a) and H2O (b)
concentrations before () and after () bubbling CO2 through their solutions at room
temperature.
Knowledge of the degree of miscibility of ionic liquids with other solvents is
important for several applications, including their use in liquid-liquid extraction
processes.79 As with many other types of RTILs, our L-A-C phases are miscible with
highly polar solvents, such as water, DMSO and ethanol (Table 2-7). Although the
polarity of most ionic liquids depends on the length of the alkyl chains on (what is

52
usually) the cationic portion,80 the length of the amidine alkyl chain does not appear to
influence strongly the miscibility of the L-A-C phases we have investigated. Instead,
the structural differences among the carbamates derived from the amino alcohols
seem to be the most important determinant of L-A-C polarity. When the L-A-C are
mixed with lower polarity solvents, such as hexane, toluene and diethyl ether, two
phases, whose volumes were similar to the amounts of each added, were observed.
The L-A-C RTILs prepared from the phenyl-substituted amino alcohols, NorOH and
PheOH, were immiscible or only partially miscible with dichloromethane and ethyl
acetate, and C6-NorOH-CO2 was also only partially miscible with chloroform. The
other L-A-C RTILs investigated here were completely miscible with dichloromethane,
ethyl acetate and chloroform.

53
Table 2-7. Miscibility behavior of various 1/1 (vol/vol) L-A-C/organic solvent mixtures at room temperature.a
ionic liquid
solvent
C4-IleOH
-CO2
C5-IleOH
-CO2
C6-ProOH
-CO2
C6-NorOH
-CO2
C8-PheOH
-CO2
C8-ProOH
-CO2
C8-ValOH
-CO2
hexane I I I I I I I
toluene I I I I I I I
diethyl ether I I I I I I I
dichloromethane M M M I I M M
ethyl acetate M M M I P M M
chloroform M M M P M M M
ethanol M M M M M M M
DMSO M M M M M M M
water M M M M M M M
a I=immiscible, M=miscible, P=partially miscible (i.e., only part of this solid amino alcohol was dissolved; most of the amino alcohols are
liquids at room temperature.).

54
The L/A and L-A-C are potentially interesting hosts for optical spectroscopic
studies. Neat 1.0 mm pathlength samples of both with A molecules containing acyclic,
saturated side groups are almost completely transparent above 300 nm, and others are
transparent at > 400 nm. As a demonstration of this utility, the changes in solvent
polarity induced by bubbling CO2 through an L/A sample or N2 through an L-A-C
sample were investigated using the uncharged solvatochromic dye,62 DAPNE.57
The λmax of this dye in C8/ValOH, 424 nm, indicates a polarity like that of toluene
(425 nm) (Table 2-8). Upon exposure to CO2, the λmax value was shifted
bathochromically to 443 nm, indicating an environment whose polarity is between
that of acetone (λmax = 433 nm) and DMF (λmax = 446 nm). In general, the L/A and L-
A-C polarities reported by DAPNE are somewhat higher than and similar to,
respectively, those found for mixtures of L-A-C in which the A component is an
amino acid ester. The difference between the polarities of the two sets of L/A can be
attributed to the polar hydroxyl groups in the amino alcohols. Regardless, the L-A-C
appear to be less polar than imidazolium-based RTILs; for example, the
spectroscopically determined polarities of 1-butyl-3-methyl imidazolium ionic liquids
are like those of methanol and ethanol.81
Table 2-8. Absorption maxima (λmax) of 2.4 mM DAPNE57 in various solvents and
RTILs.3
solvent λmax (nm)
n-heptane 393
n-decane 396
C6/ProOH 424
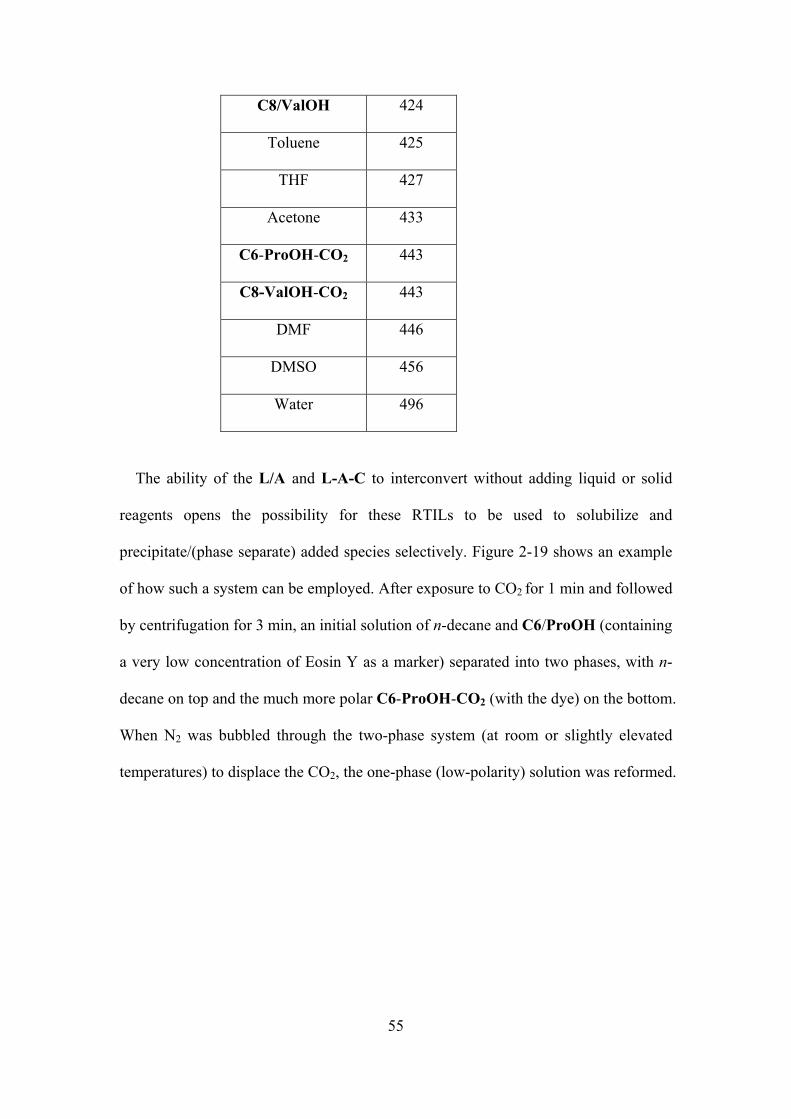
55
C8/ValOH 424
Toluene 425
THF 427
Acetone 433
C6-ProOH-CO2 443
C8-ValOH-CO2 443
DMF 446
DMSO 456
Water 496
The ability of the L/A and L-A-C to interconvert without adding liquid or solid
reagents opens the possibility for these RTILs to be used to solubilize and
precipitate/(phase separate) added species selectively. Figure 2-19 shows an example
of how such a system can be employed. After exposure to CO2 for 1 min and followed
by centrifugation for 3 min, an initial solution of n-decane and C6/ProOH (containing
a very low concentration of Eosin Y as a marker) separated into two phases, with n-
decane on top and the much more polar C6-ProOH-CO2 (with the dye) on the bottom.
When N2 was bubbled through the two-phase system (at room or slightly elevated
temperatures) to displace the CO2, the one-phase (low-polarity) solution was reformed.

56
Figure 2-19. Photographs of a 1/1 (v/v) n-decane/(C6/ProOH) solution containing
0.3 μM Eosin Y (left) and after CO2 bubbling for 1 min and centrifugation for 3 min
(right). The two-phase system became one phase again by bubbling through N2 for 5
min at 50 oC.
2.3.5 Conclusions
A series of easily-prepared, chiral, room-temperature ionic liquids has been made
and characterized. A very important attribute of these liquids is their ability to be
transformed from high-polarity, ionic states to low-polarity, uncharged phases by
exposure to an inert gas such as N2 and to reconvert the low-polarity phases to their
high-polarity phases by adding CO2 gas. It was somewhat surprising, but gratifying,
that all of the combinations of amidines and amino alcohols examined form room-
temperature ionic liquids when exposed to CO2. They appear to remain liquids with
larger structural variations and over wider temperature ranges—generally from below
-20 ºC to ca. 50 ºC under one atmosphere of CO2—than the amidine-alkylamine3a and
amidine-amino acid ester3b systems examined. The L-A-C phases are more viscous
than their corresponding L/A phases, the conductivities increase dramatically between

57
the L/A and L-A-C phases, and the solubility characteristics of the liquids can be
modulated significantly by the gas to which they are exposed.
Also, the amino alcohols provide a chiral center and a potentially useful hydroxyl
functionality for future applications (i.e., as task-specific RTILs). In addition, L-A-C
system is much less sensitive to water than other reversible RTILs that have been
reported. Thus, experiments need not be performed under scrupulously dry conditions.
Additionally, the components of these RTILs are biodegradable 82 and have low
toxicity.83 Their reversibility, chirality, broad temperature ranges, tolerance to water,
and, ease of preparation should make the combination of L/A and L-A-C phases
useful as solvents for several ‘green’ applications.
In that regard, the addition of a second chiral center, as in (1R, 2S)-(-)-
norephedrine, may improve the affinity of an amino alcohol for CO2 and the ability of
its L-A-C phases to act as chiral inductors for guest reactions, separations, etc.43 The
reversibility of these liquids is especially promising for the easy separation of
components of reactions in which the products are soluble in low-polarity media and
their formation depends on contact with a metal catalyst soluble only in high-polarity
media; the catalyst should be easily recoverable if it precipitates when N2 is bubbled
through the L-A-C phase in which the reaction was conducted. Future work will
focus on such applications, on their use as hosts for optical spectroscopic studies
(because they lack chromophores absorbing in the visible and into the near UV
region), and on increasing their upper temperature limits. Possible strategies for
accomplishing the latter are to place the ionic liquids under several atmospheres of
CO2 pressure 84 or to use CS2 in place of CO2 (yielding more thermally stable
dithiocarbamates19e) as a means to convert the L/A into ionic liquids.

58
2.4 In situ formation of thermally stable, room-temperature ionic liquids from
CS2 and amidine/amine mixtures.
2.4.1 Introduction
Research from this laboratory has demonstrated that the gel networks6 made
when a triatomic molecule is added to a ‘latent’ alkylamine gelator and the ionic
crosslinks formed similarly within amino-polysiloxanes (vide infra)85 are thermally
more stable with CS2 (an environmentally harmful liquid86) than with CO2. In addition,
others have investigated the properties of functional materials made by adding CS2 to
liquid-like mixtures. 87 , 88 , 89 , 90 It is reasonable to assume that formation of an
isothiocyanate (R-NCS) is involved in the first step leading to the thiourea.91 The
difference in reactivity of carbamates and dithiocarbamate is a consequence of the
lower bond strength of N-CO2 than in N-CS2 and the greater thermodynamic stability
of CO2. In both the carbamate and dithiocarbamate anions, the oxygen-carbon or
sulphur-carbon and carbon-nitrogen bonds have some double bond character.
Although reactions of amines with either CO2 or CS2 are exothermic, the enthalpy of
formation of dithiocarbamates is more favored. In a simple example, thiourea
formation from ammonia and CS2 is more energetically favorable than is the
formation of urea from ammonia and CO2,90 see data in Section 2.5.

59
R N
R'
N(CH3)2 + NH2 R N
R'
N(CH3)2
H
X CX
NH
CX2
heat, N2
R'' R''(1)
R R' R R'tC4 t-C4H9 H C4 n-C4H9 CH3 C6 n-C6H13 CH3 C8 n-C8H17 CH3C16 n-C16H33 H
N
N
DBU
NH
NN,
n-C6H13NH2
L A
L-A-S
(C4H9)2NH
Scheme 2-3
(X=O,S)
(X=O)
NH2
NH
HONH2
HO
NH2
OOC8H17
n-C8H17NH2
L A
TMGProOH LeuOH IleC8
(CH3)3CNH2
Here, we describe the properties of the RTILs obtained when CS2 is added to L/A
mixtures (Scheme 2-3). As expected, the amidinium dithiocarbamates (L-A-S) are
more thermally stable (to ~80 oC under air atmospheres) than the corresponding
ammonium carbamates (to ~50 °C under CO2 atmospheres) and have other attractive
features, but they are not thermally reversible. However, loss of CS2 can be
accomplished at room temperature by adding a small amount of a solution of dilute
aqueous carboxylic acid.
Here, the pathways for reaction of the neat L-A-S above 80 °C are inferred from
their thermolysis products. The thermal, conductive, and spectroscopic properties of
these RTILs are presented and compared with those of their non-ionic phases and of
the corresponding amidinium carbamates. The latter comparison addresses the extent
to which changing the triatomic molecular adduct influences the properties of the
RTILs and demonstrates further that environmentally deleterious triatomic molecules
can have beneficial purposes in materials science.

60
2.4.2 Amidinium dithiocarbamate sample preparation
CS2 liquid (1 mole equivalent) was added slowly to a stirred amidine and amine
sample in a glass vial in the air. The vial was placed in an ice-water bath during the
CS2 addition to dissipate the heat from the exothermic reaction. (Warning: CS2 is a
toxic liquid and H2S is a very toxic gas that should be handled carefully.) The vials
were closed once addition of the CS2 was completed.
2.4.3 Thermolyses
General procedure for synthesis of tC4-t-butylamine-CS2 and separation of its
thermolysis products. CS2 liquid 0.76 g (10 mmol) was added slowly to a stirred
solution of 1.3 g (10 mmol) tC4 and 0.73 g (10 mmol) tert-butylamine in 4.0 mL
chloroform in a round bottom flask. The flask was placed in an ice-water bath during
the CS2 addition to dissipate the heat from the exothermic reaction. The mixture was
stirred for 1 h at room temperature in a closed vessel. Then, the temperature was
raised to 120 oC for 2 h. The products were separated by column chromatography
(silica gel; 3:1 and 2:1 hexanes: ethyl acetate as eluants) and were identified
spectroscopically, using literature assignments for comparison; the literature citations
are noted after the name of each compound; the spectroscopic data below are for the
isolated products. Before separation by column, the data from the 1H NMR spectra of
the thermolysis mixture indicated a molar ratio of 58:42 N-tert-butyl-N’,N’-
dimethylthiourea (D):N,N’-di-tert-butylthiourea (E).
Tert-butyl isothiocyanate 92 (ΑA): a liquid, C5H9NS. 1H NMR (400MHz,
CDCl3) δ = 1.37 (9H, s, C(CH3)3); 13C NMR (100MHz, CDCl3) δ = 131 (C=S), 57
(C(CH3)3), 30. 7 (C(CH3)3); IR (thin film) ν = 2981, 2081, 1975, 1368, 1207 cm-1; MS
(EI) m/z (M+) 115.

61
Tert-butyl thioformamide93 (B): a liquid, C5H11NS. 1H NMR (400MHz, CDCl3)
δ = 1.36 (9H, s, C(CH3)3), 7.6-8.0 (1H,=br, s, NH), 9.25-9.28 (1H, d, J=7.8Hz, CH);
13C NMR (100MHz, CDCl3) δ = 187.7 (C=S), 55.8 (C(CH3)3), 29.8 (C(CH3)3); IR
(thin film) ν = 1567, 1369, 1041 cm-1; MS m/z (M+) 117.
N,N-Dimethyl thioformamide94 (C): a liquid, C3H7NS. 1H NMR (400MHz,
CDCl3) δ = 3.27-3.29 (6H, d, J=4.6 Hz, N(CH3)2), 9.2 (1H, s, CH); 13C NMR
(100MHz, CDCl3) δ = 188.2 (C=S), 45.3 (N(CH3)2), 37.2 N(CH3)2); IR (thin film) ν =
1540, 1397, 1130, 1040 cm-1; MS m/z (M+) 89.
N-Tert-butyl-N’,N’-dimethylthiourea95 (D): a white solid, mp 85-88 °C (no
reported lit value); C7H16N2S. 1H NMR (400MHz, CDCl3) δ = 1.54 (9H, s, C(CH3)3),
3.21 (6H, s, N(CH3)2) 5.1-5.3 (1H, br, s, NH); 13C NMR (100MHz, CDCl3) δ =
181.2 (C=S), 56.0 (C(CH3)3), 29.7 (C(CH3)3); IR (ATR) ν = 1548, 1393, 1346, 1131,
1050 cm-1; MS m/z (M+) 160.
N,N’-Di-tert-butylthiourea96 (E): a white solid, mp 128–130 °C (lit.96 mp 131–
132 °C); C9H20N2S. 1H NMR (400 MHz, CDCl3) δ = 1.48 (18H, s, C(CH3)3), 5.7-5.8
(2H, br, NH); 13C NMR (100MHz, CDCl3) δ = 180.2 (C=S), 54.0 (N(CH3)2); IR
(ATR) ν= 3300, 1540, 1320, 1210 cm-1. MS m/z (M+) 188.
Procedures for identification of dimethylamine and t-butylamine upon
thermolyses of tC4-t-butylamine-CS2. A HCl/D2O solution was prepared by bubbling
HCl gas (generated by dropping sulfuric acid into hydrochloric acid and passing the
vapors through a Drierite tube) into D2O in a round-bottom flask (to which a Drierite
drying tube was attached at the exit side). Then, the vapor from thermolysis of 1.0 g
(3.6 mmol) tC4-t-butylamine-CS2 was introduced into the HCl/D2O solution that had
been cooled in an ice-water bath. The peaks characteristic of the hydrochloride salts

62
of dimethylamine and t-butylamine were found in the 1H NMR and 13C NMR spectra
(reported below) and are consistent with values reported in the literature.
Dimethylammonium chloride.97 1H NMR (400 MHz, CDCl3): δ = 2.88 (6H, s,
N(CH3)2); 13C NMR (100 MHz, CDCl3): δ = 32.6 (N(CH3)2).
Tert-butylammonium chloride.98 1H NMR (400 MHz, CDCl3): δ = 1.10 (9H, s,
C(CH3)3); 13C NMR (100 MHz, CDCl3): δ = 26.5 (C(CH3)3), 48.8 (C(CH3)3).
2.4.4 Density measurements
Densities were measured by a method that yields only approximate values.99
For the purpose that they were used, to construct Walden plots,111 the values obtained
are adequate. An aliquot of C4-hexylamine-CS2 was weighed in a 1.00 mL
volumetric flask that was filled to the mark initially at room temperature. The flask
was heated in stages to progressively higher temperatures in a GC oven and
equilibrated at each temperature for 15 min before the excess volume from thermal
expansion was removed rapidly by syringe and the flask was reweighed. Because the
density changes are small over the temperature range investigated, the probable
experimental errors have little effect on the overall conclusions derived from them.
2.4.5 Transformation from ammonium dithiocarbamates to amidinium
dithiocarbamates
CS2 liquid 0.16 g (21 mmol) was added slowly to a round-bottom flask
containing a stirred solution of 0.43 g (42 mmol) n-hexylamine in 2.0 mL chloroform-
d. The solution was stirred for 30 min at room temperature in a dry atmosphere. 1H
and 13C NMR spectra of an aliquot were recorded and shown to be consistent with the
ammonium dithiocarbamate (Figure 2-21a). Then, 0.71 g (42 mmol) C6 amidine and
0.16 g (21 mmol) CS2 were added. After another 30 min of stirring, 1H and 13C NMR
(Figure 2-21b) of an aliquot were recorded. They demonstrated that the product was
63
the amidinium dithiocarbamate without any detectable amount of ammonium
dithiocarbamate.
2.4.6 Results and Discussion
Table 2-9. Phasesa of neat 1/1 (mol/mol) L/A mixtures before (b) and after (a) adding
CS2 at room temperature and phase appearances at -20 oC in parentheses; melting
points (oC) of ammonium dithiocarbamates which are solids at room temperature are
presented numerically.

64
Amidine
(L)
Amine (A)
Prolinol
(ProOH)
Leucinol
(LeuOH)
Isoleucine octyl
ester (IleC8)
Hexylamine Octylamine Cyclohexyl-
amine
Dibutylamine
b a b a b a b a b a b a b a
tC4 L L(L) L L(L) L L(L) L L(L) L L(L) L L(L) L L(L)
C4 L L(L) L L(L) L L(L) L L(L) L L(L) L L(L) L L(L)
C6 L L(L) L L(L) L L(L) L L(S) L L(S) L L(S) L L(S)
C8 L L(L) L L(L) L L(L) L L(S) L S
39.7-
41.3
L
S
34.5-
36.1
L S
38.6-
40.1
C16 S S
48.0-
50.2
S
S
49.1-
51.7
S
S
55.8-
58.0
L S
47.5-
49.9
L S
55.8-
57.1
L S
54.0-
55.9
L S
52.8-
55.5
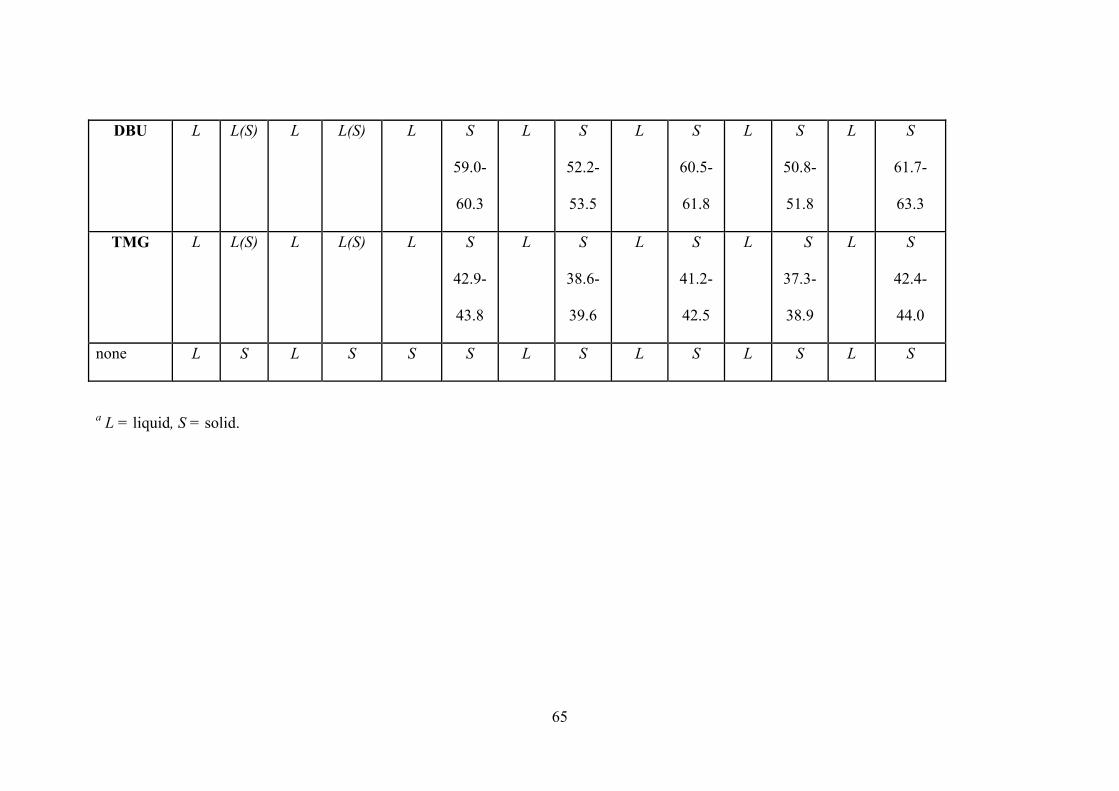
65
a L = liquid, S = solid.
DBU L L(S) L L(S) L S
59.0-
60.3
L S
52.2-
53.5
L S
60.5-
61.8
L S
50.8-
51.8
L S
61.7-
63.3
TMG L L(S) L L(S) L S
42.9-
43.8
L S
38.6-
39.6
L S
41.2-
42.5
L S
37.3-
38.9
L S
42.4-
44.0
none L S L S S S L S L S L S L S

66
The appearances of the phase of the L/A combinations at room temperature, both
before and after adding CS2, are collected in Table 2-9. Primary amines, secondary
amines, amino esters and amino alcohols were tested as A components. Aliphatic
amidines, DBU and 1,1,3,3-tetramethylguanidine (TMG) were employed as the L
components. A large number of the combinations remain liquids at room temperature
after adding CS2. However, none of the combinations with the longest-chained linear
amidine, C16, produced a liquid dithiocarbamate at room temperature; in general, the
shorter chained L appear to favor the formation of liquid L-A-S, probably as a result
of less ordering by London dispersion forces. All of the amidinium dithiocarbamates
which are solids at room temperature have melting points < 65 oC, well below 80 oC,
the approximate temperature at which the amidinium dithiocarbamates decompose
according to TGA measurements (Figure 2-22). Furthermore, many of the RTILs
remain non-crystalline and flowing (albeit very viscous fluids) to at least -20 oC; they
have a broad and synthetically useful liquid range.
As expected, the L/A mixtures were qualitatively less viscous than the
corresponding L-A-S ionic liquids due to the introduction of strong electrostatic
interactions in the latter. The additional hydrogen bonding and dipolar interactions
available to the RTILs with an amino alcohol or an amino ester component made
them more viscous than the ionic liquids with aliphatic amines. In addition, there was
no evidence by polarized optical microscopy for liquid crystallinity in any of the
amidinium dithiocarbamates made from hexadecyl amidine (C16) and several
different aliphatic amines, amino esters and amino alcohols. Unlike the amidinium
carbamates (i.e., the RTILs made by adding CO2 to L/A mixtures) which remain clear
and uncolored, the amidinium dithiocarbamates are a yellow or orange color that can
be attributed to n-π* electronic transitions of the dithiocarbamate group.100

67
Figure 2-20. FT-IR spectra of C6/cyclohexylamine (a) and C6-cyclohexylamine-
CS2 (b).
The structures of the amidinium dithiocarbamates were confirmed by
comparisons of thermal gravimetric analyses (TGA) and FT-IR and 1H and 13C NMR
spectral data of samples before and after the addition of CS2. Figure 2-20 shows the
FT-IR spectra of a representative sample, C6/cyclohexylamine, before and after
adding CS2. After addition of CS2, the typical N=C stretching band of the amidine at
1629 cm-1 is replaced by a band at 1645 cm-1 which can be assigned to protonated
amidine. In addition, the bands at 1088 and 977 cm-1 are assigned to C=S and C–S
stretchings, respectively.101
The 1H NMR spectrum of C6/cyclohexylamine changes markedly upon
addition of CS2 (Figure 2-21a). Exposing the C6-cyclohexylamine-CS2 (amidinium
dithiocarbamate) to N2 and gently heating at 50 oC for 30 min (C6-cyclohexylamine-
CS2-N2), conditions which reconvert the analogous amidinium carbamate to its
uncharged amidine/amine mixture, results in no discernible changes. Upon addition of
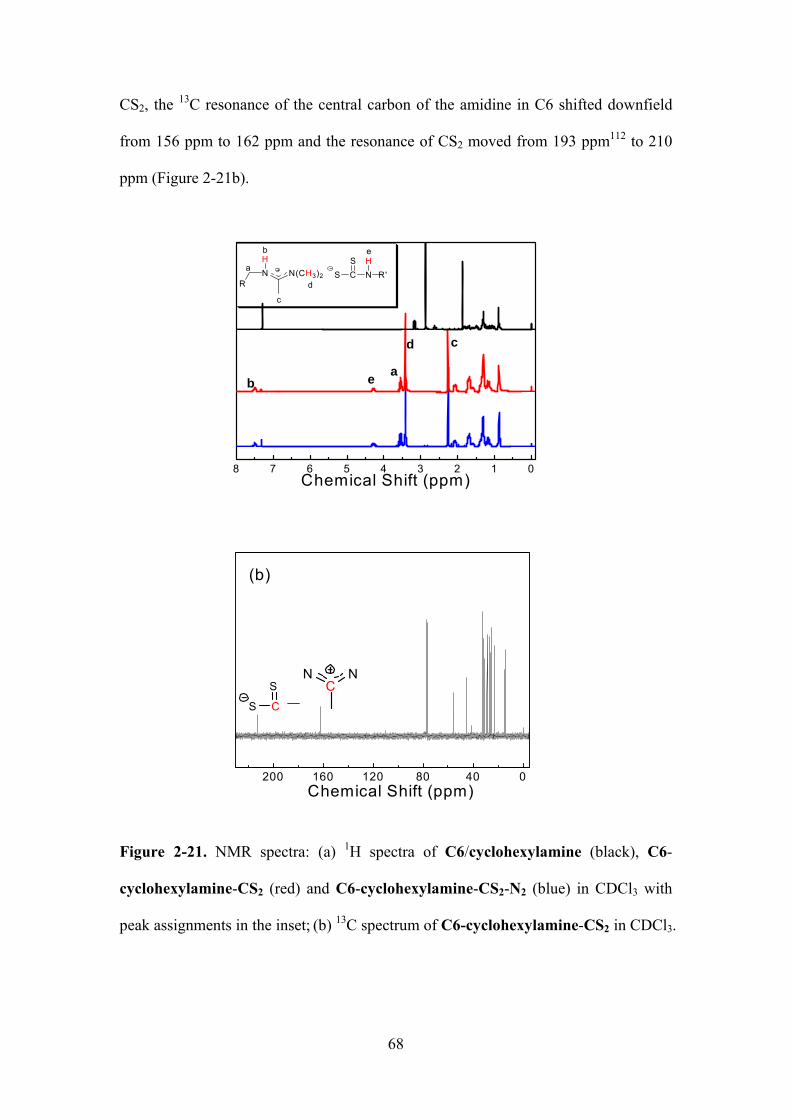
68
CS2, the 13C resonance of the central carbon of the amidine in C6 shifted downfield
from 156 ppm to 162 ppm and the resonance of CS2 moved from 193 ppm112 to 210
ppm (Figure 2-21b).
8 7 6 5 4 3 2 1 0
N N(CH3)2
H
S CS
NH
R'R
a
b
c
d
e
cd
b e a
Chemical Shift (ppm)
200 160 120 80 40 0
(b)
S C
S N
CN
Chemical Shift (ppm)
Figure 2-21. NMR spectra: (a) 1H spectra of C6/cyclohexylamine (black), C6-
cyclohexylamine-CS2 (red) and C6-cyclohexylamine-CS2-N2 (blue) in CDCl3 with
peak assignments in the inset; (b) 13C spectrum of C6-cyclohexylamine-CS2 in CDCl3.

69
Adding CS2 to the amine itself is known to form ammonium dithiocarbamate salts
(RNHCS2- H3N+R’)2 To demonstrate the absence of ammonium dithiocarbamates in
L-A-S, one equivalent of amidine and CS2 were added to RNHCS2- H3N+R’ solution,
and NMR spectra (Figure 2-22) were collected. They are nearly identical to the
spectra obtained from directly prepared L-A-S, showing that amidinium
dithiocarbamates is the thermally favorable product.102

70
10 8 6 4 2 0
S CS
N R''R-NH3H
D2O
N
R'
N(CH3)2
H
R
(a)
Chemical Shift (ppm)
200 150 100 50 0
(b)
S CS
S CS N N
H
Chemical Shift (ppm)
Figure 2-22. (a) 1H NMR spectra in CDCl3 of n-hexylamine-CS2 before (red) and
after (black) adding 1.0 equivalent C6 and 0.5 equivalent CS2. The blue spectrum was
obtained by adding one drop of D2O to the n-hexylamine-CS2 in CDCl3 sample as a
means to verify the locations of the N—H peaks in the red spectrum. (b) 13C NMR

71
spectra in CDCl3 of n-hexylamine-CS2 before (red) and after (black) adding 1.0
equivalent C6 and 0.5 equivalent CS2. The concentrations are lower than described
above.
0 10 20 30 40 50 6098.5
99.0
99.5
100.0
(b)
Wei
ght%
Time (min)
Figure 2-23. (a) TGA curves of C8/IleC8 (grey) and C8-IleC8-CS2 (black). (b)
Isothermal TGA curve of C8-IleC8-CS2 at 25 oC for 60 min.
A higher boiling amine, IleC8, was selected for TGA studies. Based on the data in
Figure 2-23a, the L-A-S are stable to at least 80 oC under a nitrogen atmosphere and
weight losses indicate that decomposition above 150 oC does not involve either CS2 or
H2S as the exclusive species expelled. The theoretical weight loss from C8-IleC8-CS2
if one molecule of CS2 or H2S (the molecule lost when ammonium dithiocarbamates
are heated to their decomposition temperatures19e) is 14.7 % or 6.6 %, respectively.
Furthermore, only 0.18 % weight was lost from C8-IleC8-CS2 when it was kept at 25
oC under a dry nitrogen gas flow of 60 cc/min during a 60 min period (Figure 2-23b),
and only 1.7 % of the initial weight was lost after heating the sample to ca. 100 oC at a
rate of 5 oC/min; nearly 16% more weight was lost when C8/IleC8 was heated under
the same conditions. As mentioned, the thermal behaviors of this and other L-A-S are
in contrast with those of the corresponding ammonium carbamates and amidinium

72
carbamates (which are thermally reversible, losing a molecule of CO2 when heated to
ca. 50 oC).19 Also, when heated, an amidinium dithiocarbonate (Eq. 2-7) has been
found to lose a molecule of CS2,87 and we established that ammonium
dithiocarbamates lose one molecule of H2S and become thioureas when heated to ca.
100 oC. 19c
(2-7)R N N(CH3)2
+ R N N(CH3)2
H
S C
S
OR1OHCS2 R1
Scheme 2-4. Thermolysis of tC4-t-butylamine-CS2.
HN
NH2N NCS2 H
N NHN
S
S
HN
NS
SH
NH
N C SN C S
HN S
NH H
H2N S
NH
NHS
H
NS
H
NH2
N C S
NH
S
N NH
S
NH
AA AA
AA
NN
S
SH
NHH
or
B C
D E
I II
III IV
H H
58%42%
N C S
AA
To the best of our knowledge, the mechanism of thermolysis of amidinium
dithiocarbamates has not been investigated.103 To gain insights into the process, we

73
have isolated and identified the thermolysis products from one amidinium
dithiocarbamate, tC4-t-butylamine-CS2. From them, it is possible to infer a plausible
mechanistic pathway for the thermally induced reactions (Scheme 2-4).104 Reaction
commences with formation of a covalent bond between the amidinium carbon atom
and a sulfur from the dithiocarbamate followed by (or synchronous with) addition of a
proton from the amine moiety of the dithiocarbamate (blue) to one of the nitrogen
atoms of the amidine. Note that two parallel pathways ensue based upon which of the
amidine nitrogen atoms is the proton acceptor. Some of these steps are reminiscent of
the reactions between carbodiimides and carboxylates in Merrifield peptide
syntheses.105 Cleavage of the original C–S bond of the CS2 molecule results in an
isothiocyanate (AA) and a zwitterionic species (III or IV) which cleaves into a
thioformamide (B or C) and an amine. Cleavage of the original C–S bond of the CS2
molecule results in an isothiocyanate (AA) and a zwitterionic species (III or IV)
which cleaves into a thioformamide (B or C) and an amine. The resulting amines can
then react with the t-butyl isothiocyanate (AA), generating N-tert-butyl-N’,N’-
dimethylthiourea (D) or N,N’-di-tert-butylthiourea (E).106 The proposed pathways are
consistent with the presence of dimethylamine and t-butylamine which were captured
as their hydrochloride salts. Furthermore, the relative yields of D and E suggest that
the thermolysis prefers slightly the pathway through intermediate I.
Acid treatment of dithiocarbamates is known to result in formation of ammonium
ions and CS2.85 Depending on the pKB of the parent amine, acid-derived
decomposition of alkyl dithiocarbamates can occur by two different mechanisms.107
For parent amines with pKB > 10.5, the decompositions occur by a concerted
intramolecular S-to-N hydrogen transfer with C–N bond cleavage. When pKB < 10.5,
alkyl dithiocarbamates decompose via zwitterionic intermediates whose N-

74
protonation is slower than the C-N bond breaking (Eq. 2-8). The same mechanism
should obtain when an L-A-S is treated with an acid (such as dilute aqueous acetic
acid). Evidence for that chemistry, shown in eq. 2-9, comes from 13C NMR
spectroscopy (Figure 2-24).
R N
R'
N(CH3)2
HS C
SNH
R''CF3COOH
R N
R'
N(CH3)2
HO C
OCF3 NH3R'' O C
OCF3 CS2
HNR C
SS
k1
k-1NR C
SS
H
H
k2 NH2RH CS2 (2-8)
(2-9)
220 200 180 160 140 120 100 80 60 40 20 0
S CS
O CO N N
H
N N
H
Chemical Shift (ppm)
Figure 2-24. 13C NMR of tC4-t-butylamine-CS2 in D2O (black) and tC4-t-
butylamine-CS2 after treatment with acetic acid (red) in D2O.
The conductivity (σ) of some of the L-A-S and their mixtures with CHCl3 was
investigated at room temperature. The effect on conductivity of the high ion
concentrations upon adding CS2 to L/A combinations were offset to a large extent in

75
the neat RTILs by large viscosity increases (Table 2-10). However, conductivities
increased significantly when CS2 was added to L/A mixtures in 50 wt % CHCl3
solutions. The increases were slightly smaller than observed when CO2 was added to
either neat or chloroform solutions of an L/A.3 These observations can be attributed to
the higher viscosities of the dithiocarbamates (vide infra), and less ion pairing78, 108 in
the carbamates.
Table 2-10. Conductivities before (b) and after (a) adding CS2 to neat and 50 wt%
CHCl3 solutions of neat L/A combinations at room temperature.
L/A Triatomic
molecule
Conductivity (µs/cm) mol% of
L-A-S b a (neat) a (50 wt%
CHCl3 )
C8/hexylamine CS2 22 39 265 24.1
C8/hexylamine CO2 22 58 276 25.8
DBU/LeuOH CS2 31 46 198 25.7
DBU/LeuOH CO2 31 54 214 27.7
As shown in Figure 2-25, for example, the conductivity of neat C8/hexylamine
changed very little as it was diluted with CHCl3. After adding CS2, the conductivity of
the C8-hexylamine-CS2 only doubled, but it increased further as small increments of
CHCl3 were added, reached a maximum at ca. 10 mol%109 (ca. 20-30 wt% of C8-
hexylamine-CS2) and decreased at still lower concentrations (higher dilutions) in
CHCl3 (Figure 2-25a). As mentioned, the rise in conductivity upon initial addition of
CHCl3 is attributed to a convolution of decreasing viscosity (i.e., higher ion mobility)
and less ion pairing (i.e., leading to an increase in the concentration of free ions).77, 110

76
Eventually, the decreased viscosity and ion pairing that accompany the addition of
more CHCl3 are offset by the lower concentration of mobile ions, and the conductivity
decreases. Increased conductivity with decreasing viscosity is also seen in neat L-A-S
as temperature is raised (Figure 2-25b).99
20 25 30 35 40 45 50 55
50
100
150
200
250 (b)
Con
duct
ivity
(10-6
S/cm
)
Temperature (oC)
Figure 2-25. (a) Conductivities of C8/hexylamine mixtures at room temperature as a
function of mol % substrate before () and after saturating the mixture with CO2 ()
or adding one equiv of CS2 (). (b) Conductivities of neat C8-hexylamine-CS2 ()
and DBU-LeuOH-CS2 () as a function of temperature.

77
20 25 30 35 40 45 50 550
200
400
600
800
1000
1200
Con
duct
ivity
(10-6
S/cm
)
Temperature (oC)20 25 30 35 40 45 50 55
0.90
0.92
0.94
0.96
0.98
Den
sity
(kg/
L)
Temperature (oC)
Figure 2-26. (a) Conductivities of neat C4-hexylamine-CS2 as a function of
temperature. (b) Density of C4-hexylamine-CS2 as a function of temperature.
A Walden plot111 has been used to evaluate further the ion mobilities of the ionic
liquids. It is based on Walden’s observation for aqueous solutions of strong
electrolytes that the equivalent conductivity (i.e., the conductivity per mole of charge),
Λ = σ VE (where VE is the volume containing one Faraday of positive charge), of
electrolytes is large, depends inversely on viscosity, and changes with temperature in
parallel with the inverse of viscosity. According to Walden’s Rule, Λ η = k, where η is
the viscosity and k is a temperature dependent constant. From the Walden plot in
Figure 2-27, C4-hexylamine-CS2 can be classified as a ‘good ionic liquid’ because it
lies very close to the ideal line described by aqueous KCl.112 However, because of
their relatively high viscosities, the ammonium dithiocarbamates exhibit lower
conductivities than many other classes of ionic liquids.112

78
Figure 2-27. Log-log plot of equivalent conductivity (Λ) versus fluidity (η-1) for C4-
hexylamine-CS2. The straight line is determined by data for 1 M aqueous KCl.113
Initially, the miscibility of the samples in their L/A and L-A-S states were
determined empirically as a measure of their polarity.114 Before adding CS2, L/A
mixtures with all solvents examined were solutions (Table 2-11). Similar to many
other types of classical RTILs, including amidinium carbamates, our L-A-S phases
are miscible with very polar solvents, such as DMSO and ethanol, but not with lower
polarity solvents, such as hexane, toluene, and diethyl ether. Furthermore, the length
of the Cn amidine alkyl chain appears to influence somewhat the miscibility behavior:
C8-hexylamine-CS2 is partially miscible with diethyl ether and C6-hexylamine-CS2
or C4-hexylamine-CS2 is immiscible with it.
The solvatochromic dye, DAPNE57, 62 was utilized to estimate the polarity of the
L/A and L-A-S. For example, λmax = 423 nm for C8-hexylamine and 438 and 440 nm
for C8-hexylamine-CO2 and C8-hexylamine-CS2, respectively (Table 2-12); the λmax
of toluene and N,N-dimethylformamide are 425 and 446 nm, respectively. According

79
to this probe, the L/A are much less polar than their RTILs, whether they be generated
by addition of CS2 or CO2, but are less polar than many imidazolium-based ILs.115
Table 2-11. Miscibility behaviora of various mixtures of 50 vol % L-A-S ionic liquids
and organic solvents at room temperature.
Solvent
L-A-S
hexane toluene diethyl
ether
CH2Cl2 ethyl
acetate
ethanol DMSO
C4-hexylamine-CS2 I I I M M M M
C6-hexylamine-CS2 I I I M M M M
C8-hexylamine-CS2 I I P M M M M
C4-IleC8-CS2 I I I M M M M
C6-IleC8-CS2 I I P M M M M
C8-IleC8-CS2 I I P M M M M
a I = immiscible, M = miscible, P = partially miscible.
Table 2-12. Absorption maxima (λmax, nm) of 2.4 mM DAPNE57 in various solvents
and RTILs.3
solvent λmax (nm)
n-heptane 393
n-decane 396
C8/Hexylamine 423
C8/LeuOH 424
Toluene 425
THF 427
Acetone 433
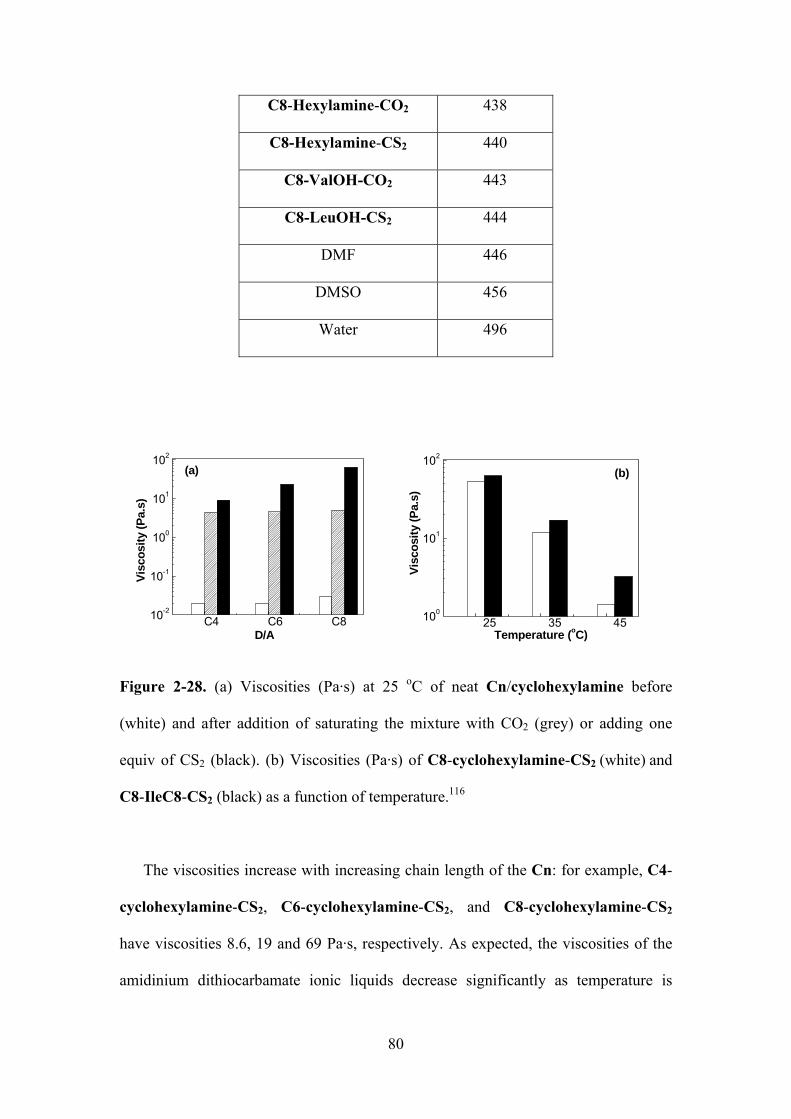
80
C8-Hexylamine-CO2 438
C8-Hexylamine-CS2 440
C8-ValOH-CO2 443
C8-LeuOH-CS2 444
DMF 446
DMSO 456
Water 496
C4 C6 C810-2
10-1
100
101
102
(a)
Visc
osity
(Pa.
s)
D/A25 35 45100
101
102
(b)
Visc
osity
(Pa.
s)
Temperature (oC)
Figure 2-28. (a) Viscosities (Pa·s) at 25 oC of neat Cn/cyclohexylamine before
(white) and after addition of saturating the mixture with CO2 (grey) or adding one
equiv of CS2 (black). (b) Viscosities (Pa·s) of C8-cyclohexylamine-CS2 (white) and
C8-IleC8-CS2 (black) as a function of temperature.116
The viscosities increase with increasing chain length of the Cn: for example, C4-
cyclohexylamine-CS2, C6-cyclohexylamine-CS2, and C8-cyclohexylamine-CS2
have viscosities 8.6, 19 and 69 Pa·s, respectively. As expected, the viscosities of the
amidinium dithiocarbamate ionic liquids decrease significantly as temperature is

81
increased within the range below their decomposition temperatures (Figure 2-28b and
Figure 2-28): the viscosity of C8-IleC8-CS2 at 45 oC is 1.6 Pa·s, almost 25 times
lower than that at 25 oC (43 Pa·s), which is also lower than the viscosity of C8-IleC8-
CO2 (7.1 Pa·s) at 25 oC.
20 25 30 35 40 45 50 55 60
0.1
1
10
Visc
osity
(Pa.
S)
Temperature (oC)
Figure 2-29. Viscosities of neat C4-hexylamine-CS2 as a function of temperature.
2.4.7 Conclusions
Equimolar mixtures of an amidine and an amine can be transformed easily into a
new class of room-temperature ionic liquids, amidinium dithiocarbamates, upon
addition of one molar equivalent of CS2. The amidinium dithiocarbamates are more
stable thermally than their amidinium carbamate analogues, made by adding another
triatomic molecule, CO2, to amidine/amine mixtures. In general, the dithiocarbamates
remain stable to higher temperatures than their amidine-amine mixtures, even in air.
Unlike their amidinium carbamate analogues (which lose a molecule of CO2 near their
decomposition temperatures, ca. 50 oC under one atmosphere pressure of CO2), the
amidinium dithiocarbamates do not lose a molecule of CS2 when heated above their
decomposition temperatures, ca. 80 oC. Instead, they undergo a series of structural

82
changes that lead to several products, including thioureas and thioformamides, which
provide insights into the thermolysis mechanism. However, CS2 can be expelled from
the amidinium dithiocarbamates in the presence of a weak acid.
The thermal, polar, viscous and conductance properties of the liquid amidinium
dithiocarbamates have been characterized and compared with both their amidine-
amine precursor mixtures and with the analogous amidinium carbamates. The results
show that these physical and chemical properties can be tuned by changing the L/A
combinations and the nature of the triatomic molecule added. Viscosities of the Cn-
amine-CS2 systems increase as the amidine chain length n increases and are more
viscous than the corresponding Cn-amine-CO2 RTILs. Although the C4 amidine
provided RTILs when combined with CS2 and all of the amines examined in this work,
only the amidinium dithiocarbamates composed of an amino alcohol were liquids at
room temperature when the amidine was the bulky and short-chained guanidine TMG.
According to the spectroscopic probe DAPNE, the dithiocarbamates and
carbamates have similar polarities and are much more polar than their corresponding
non-ionic L/A mixtures. However, as noted by miscibility studies, the polarities of the
dithiocarbamates do change subtly when the chain length of the Cn amidine or the
amine structure is changed. As expected, the conductivities of the structurally
analogous neat dithiocarbamates and carbamates are very similar, they remain similar
at the same dilution factors in chloroform, and they are significantly higher than the
conductivities of their L/A component mixtures.
Attractive attributes of the amidinium dithiocarbamate RTILs (when compared to
many other types of ionic liquids) include their ease of preparation from commercially
available or easily synthesized precursors, their diversity of structures, and their broad
temperature ranges (commencing at subambient temperatures). This work provides a

83
facile, one-step approach to utilize CS2, an environmentally unattractive liquid, to
prepare useful and very attractive chemical materials by very simple manipulations
and reactions. These RTILs are expected to find extensive use as media for a broad
range of guest molecule reactions, including some that involve the creation of chiral
centers or the recuperation of expensive metal catalysts.117 Future research will focus
on such applications.
2.5 Comparisons of the RTILs
Comparisons of the structural differences between amidinium dithiocarbamates
and amidinium carbamates offer a means to gain insights about how they support
formation of RTILs. The data in Table 2-13 demonstrate that the appearances of some
of the L/A ionic liquids depend upon whether CO2 or CS2 is added. For example,
DBU-hexylamine-CO23a is a liquid while DBU-hexylamine-CS2 is a solid.
Obviously, these differences are a manifestation of the properties of the carbamate
and dithiocarbamate anions. To some extent, those properties can be related to the
physical properties of the triatomic molecules from which the anions derive, CO2 and
CS2. Both are linear molecules and have zero dipoles.30 However, they possess large
quadrupole moments (Table 1-1).118 In addition, both the bond lengths and kinetic
diameter of CS2 are larger than those of CO2.90
Table 2-13. Phasesa of neat 1/1 (mol/mol) L/A mixtures at room temperature after
treating them with saturating the mixture with CO2 or adding one equiv of CS2.
Amidine (L)
Amine (A)
Leucinol
(LeuOH)
Isoleucine
octyl ester
(IleC8)
Hexylamine Cyclohexylamine

84
a L = liquid, S = solid
As mentioned above, whereas the amidinium dithiocarbamates cannot be heated
to expel CS2 and regenerate the non-ionic L/A states, gentle heating or passing
nitrogen gas through an amidinium carbamate does result in the loss of CO2. This
grossly different chemical behavior can be understood from the enthalpies of
formation of dithiocarbamates and carbamates. The heats of formation ΔHf are -393.5
kJ·mol-1 30 for CO2 and 115.7 kJ·mol-1 for CS2119 in the gas phase. Thus, it is expected
from the Hammond Postulate120 that the enthalpy of formation of a dithiocarbamate
will be more favored energetically, although reactions of amines with both CO2 and
CS2 are exothermic. These results indicate that the addition of CO2 and CS2 can tune
the physicochemical properties of the RTILs, although they may do so in different
ways.
In this work, DAPNE,62 a solvatochromic dye was utilized to estimate the polarity
of ionic liquids. For example, λmax = 424 nm for C8-LeuOH and 443 and 444 nm for
C8-LeuOH-CO2 and C8-LeuOH-CS2, respectively (Table 2-14).3 According to this
probe, in any cases, nonionic mixtures are much less polar than their RTILs, whether
they will be generated by addition of CS2 or CO2, but are less polar than many
imidazolium-based ILs.115 However, L/N and L/A have similar polarities before and
after saturating the mixture with CO2 or adding one equiv of CS2.
CO2 CS2 CO2 CS2 CO2 CS2 CO2 CS2
C6 L L L L L L S L
C8 L L L L L L S L
DBU L L L S L S L S

85
Table 2-14. Absorption maxima (λmax) of 2.4 mM DAPNE57 in various solvents and
RTILs.3
solvent λmax (nm)
n-decane 396
C6/Hexylamine 423
C6/IleC1 425
C8/LeuOH 424
Toluene 425
Acetone 433
C6-Hexylamine-CO2 438
C8-Hexylamine-CS2 440
C6-IleC1-CO2 443
C6-IleC1-CS2 444
C8-LeuOH-CO2 443
C8-LeuOH-CS2 444
DMF 446
DMSO 456
Water 496
Consistent with their CO2 analogues, the L/A and L-A-S exhibit viscosities which
are virtually independent of shear rate; they behave like Newtonian liquids (Figure 2-
30).121 As shown in Figure 2-28a, the average viscosity over the range of shear stress
values for C6/cyclohexylamine is 0.010 Pa·s at room temperature. After exposure to
CO2, the viscosities of these samples increase by orders of magnitude to 3.8 Pa·s (C6-
cyclohexylamine-CO2), but the viscosity of the corresponding C6-cyclohexylamine-
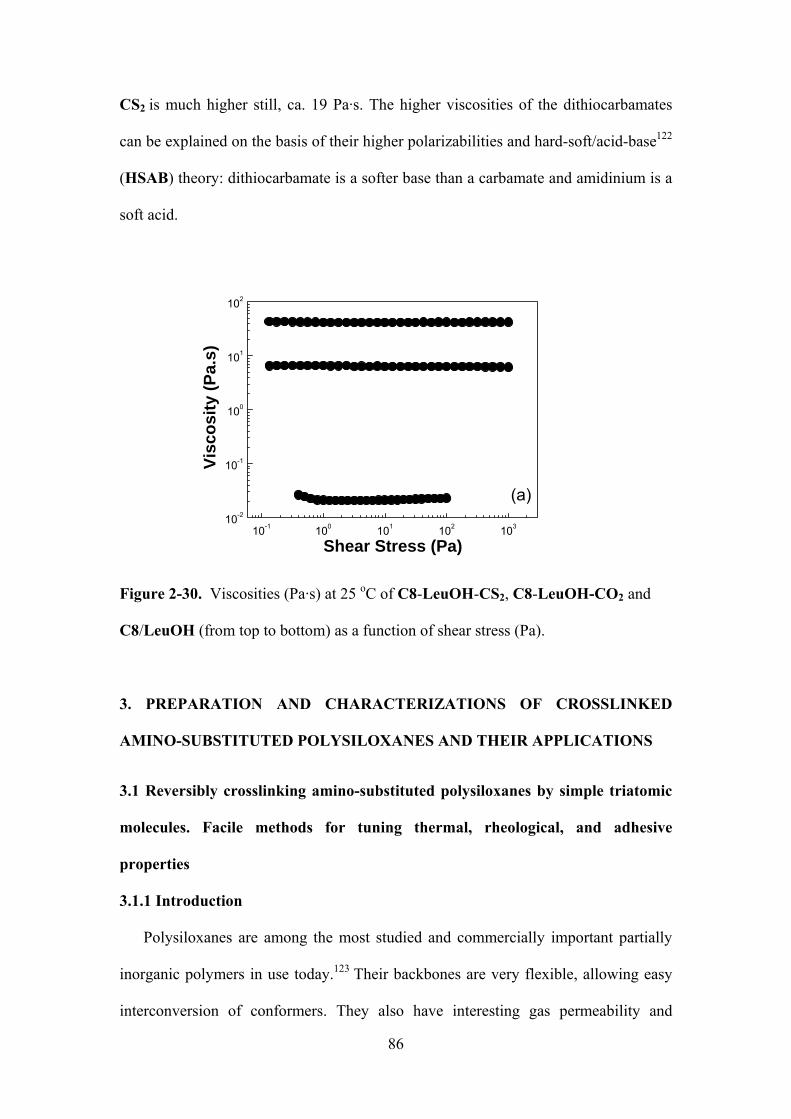
86
CS2 is much higher still, ca. 19 Pa·s. The higher viscosities of the dithiocarbamates
can be explained on the basis of their higher polarizabilities and hard-soft/acid-base122
(HSAB) theory: dithiocarbamate is a softer base than a carbamate and amidinium is a
soft acid.
Figure 2-30. Viscosities (Pa·s) at 25 oC of C8-LeuOH-CS2, C8-LeuOH-CO2 and
C8/LeuOH (from top to bottom) as a function of shear stress (Pa).
3. PREPARATION AND CHARACTERIZATIONS OF CROSSLINKED
AMINO-SUBSTITUTED POLYSILOXANES AND THEIR APPLICATIONS
3.1 Reversibly crosslinking amino-substituted polysiloxanes by simple triatomic
molecules. Facile methods for tuning thermal, rheological, and adhesive
properties
3.1.1 Introduction
Polysiloxanes are among the most studied and commercially important partially
inorganic polymers in use today.123 Their backbones are very flexible, allowing easy
interconversion of conformers. They also have interesting gas permeability and
10-1 100 101 102 10310-2
10-1
100
101
102
(a)
Visc
osity
(Pa.
s)
Shear Stress (Pa)

87
unusual surface properties.124 As a result, they are used in a myriad of applications,
such as drug-delivery systems, 125 high performance elastomers, 126 membranes, 127
adhesives,128 coatings,129 soft lithography stamps,130 and self-healing materials.131 The
low energy of interaction among polysiloxane chains is responsible for two of their
interesting attributes, high malleability and relatively low viscosity. These can also be
disadvantageous because polysiloxanes cannot be made into fibers and immobilized
films without significant structural modifications (N. B., crosslinks between chains).
It would be advantageous to be able to interconvert polysiloxanes between low and
high interaction energy states so that they can be processed for different purposes
without expending a large effort or expense.
Many modifications of the parent polysiloxane structure are known. Usually, a
fraction of the methyl groups of the most common polysiloxane,
poly(dimethylsiloxane) (PDMS) are substituted by a group containing a different
length or functionality (i.e., a one-dimensional structural change). 132 Ladder
polysiloxanes possess two-dimensional structural features, 133 while crosslinked
polysiloxanes,134 including tubular and pseudo-sieve plate polysiloxanes are three-
dimensional structures.135 The nature and extent of the chain crosslinks can be varied
and each change leads to materials with different chemical and physical properties.
The crosslinks can be covalent or non-covalent (e.g., hydrogen bonding,136 metal
coordination,137 etc.). Although the crosslinking can be reversed in some cases, it does
not yield the original materials without performing significant physical or chemical
manipulations. Clearly, a reversible crosslinking strategy that requires benign changes
to the material mild conditions, and allows the non-crosslinked and crosslinked forms
to be recovered intact without significant effort would be desirable. Such strategies

88
are described here and differences between the properties of the non-crosslinked and
crosslinked states are explored.
The basis for our approaches is grounded in simple organic chemical
transformations that have led to the development of reversible organogels,2, 138 ionic
liquids,3 and reversible solvents18,45 CO2 fixation-release systems 139 , 140 and
supermolecular polymers.1 It is known that simple, neutral X=Y=X triatomic
molecules, in which the X atoms are much more electronegative than the Y atom (e.g.
CO2 and CS2), can become “bridge-linkers” for amino groups.28, 33 It should be
possible to exploit the general chemistry shown in eqs. 3-1 and 3-2 to transform
weakly interacting chains of uncharged polysiloxanes with substituent amino groups
into strongly interacting chains via attractive electrostatic attractions between positive
and negative charged centers that lead to crosslinks. In a medium of low polarity,
such electrostatic forces can be very strong because they vary with the inverse of
dielectric constant,141 and the dielectric constant of silicone polymer is only 3.0-3.5.142
CS2 + 2RNH2HN
S
SR H3N R
HN
S
NHRR + H2S
CO2 + 2RNH2HN
O
OR H3N R
N2
(3-1)
(3-2)
Reversal of the CO2-generated ammonium carbamate crosslinks can be effected
by warming the material under air or, more rapidly, by bubbling an inert (displacing)
gas, such as molecular nitrogen, through the sample (Eq. 3-1). Our experience is that
the analogous ionic crosslinks achieved with CS2, ammonium dithiocarbamates, are
not amenable to reversal, but heating produces (permanent) covalent thiourea
crosslinks instead (Eq. 3-2).35 Clearly, the degree of crosslinking can be controlled by
the amount of amine functionality of polysiloxanes (as well as by the amount of the

89
triatomic molecule added to the polymer; vide infra). In this way, the thermal and
rheological properties of the polysiloxanes can be tuned easily. Compared with
conventional crosslinking methods, this strategy has the advantages of being rapid,
isothermal, inexpensive, and (with CO2) reversible.
Here, we describe how these simple crosslinking methods change the thermal,
rheological, and adhesive properties of polysiloxanes with up to 15% (by monomer
content) of amino-functional groups (PSil). The resulting polymers after addition of a
triatomic, PSil-CO2 or PSil-CS2, possess viscosities and adhesive properties that are
several orders of magnitude higher than those of the PSil. As expected, the PSil-CO2
can be reconverted to their PSil forms by warming and bubbling N2 through them
(Scheme 3-1); this cycle has been repeated three times without detectable degradation.
Also, as expected, warming the PSil-CS2 results in permanent thiourea crosslinks and
loss of H2S. However, the triatomic adduct can be removed from both the PSil-CS2
and the PSil-CO2 by treatment with an acid such as acetic acid or trifluoroacetic acid,
to produce protonated PSil that are flowing liquids. The results demonstrate that the
simple chemical changes effected by addition or removal of a triatomic molecule to
one of the PSil as a bulk polymer can change its properties in extraordinary fashions
of both fundamental an applied interest. Furthermore, the magnitude of those changes
can be tuned by the amount of amino functionalities in the PSil.
3.1.2 Instrumentation.
Unless stated otherwise, all instruments are the same with the instruments described
in Section 2.1.3. Rheological experiments were performed on an Anton Paar Physica
MCR 301 rheometer (Anton Paar GmbH, Graz, Austria) using a parallel plate (radius
25 mm, gap 0.5 mm) or cone-and-plate (radius 25 mm, gap 0.5 mm, cone angle 1o,
truncation 49 μm) geometry. Samples were equilibrated at 25 oC for about 5 min

90
before starting measurements (at 25 oC) in order to eliminate any mechanical
hysteresis. Dynamic frequency-sweep spectra were conducted in the linear
viscoelastic regime of each sample as determined by dynamic stress-sweep tests. All
measurements were carried out within one week of sample preparation. The
percentage of CO2 uptake (%CO2, based upon the stoichiometric amount calculated
from the amino content of a PSil) was measured with a mercury burette apparatus that
is based on a design described in ref.70 Samples were weighed on an OHaus E01140
balance (precision 0.1 mg). Some of the rheological studies were repeated two or
three times; the differences among the measurements were <5%.
3.1.3 Materials
(6-7% Aminopropylmethylsiloxane)-dimethylsiloxane copolymer ((6-7)PSil;
structure below) (Gelest, Inc; boiling point >205 oC, melting point: <-60 oC, molecular
weight 3000~6000, viscosity 80~120 cST, clear to pale yellow liquid with a mild
ammonia odor) was used as received.
Si
CH3
CH3
OSi
O
H2C
CH3
CH2
H2C
NH2
YX
(2-4% Aminoethylaminopropylmethoxysiloxane)-dimethylsiloxane copolymer ((2-
4)PSil; structure below) (Gelest, Inc; boiling point >205 oC, melting point <-60 oC,
molecular weight not reported by manufacturer, viscosity 200-300 cST, clear liquid)
was used as received.

91
Aminofunctional siloxane 20869-146 (10PSil) (Synthesized and characterized by Dr.
Dimitri Katsoulis and Mr. Kenneth E. Zimmerman from Dow-Corning. According to
Dow-Corning: molecular weight ca. 9950, PDI (polydispersity): 1.71, viscosity 100
mPa·s, 1.33 milli-equivalents of amine per gram. The polymer was clear white to
yellow liquid with amine-like odor; it was used as received.
Si
CH3
CH3
OSi
O
H2C
CH3
CH2
H2C
NH2
YX
Aminofunctional Siloxane 20869-145 (15PSil) (Synthesized and characterized by Dr.
Dimitri Katsoulis and Mr. Kenneth E. Zimmerman from Dow-Corning. According to
Dow-Corning: molecular weight ca. 9650, PDI (polydispersity) 1.71, viscosity 100
mPa·s, 2.33 milli-equivalents of amine per gram. The polymer was clear white to
yellow liquid with amine-like odor; it was used as received.
Si
CH3
CH3
OSi
O
H2C
CH3
CH2
H2C
NH2
YX
Other organic solvents are the same as described in Section 2.1.2.
3.1.4 Preparation of cross-linking polysiloxanes
Sample preparations. Syntheses of Ammonium Carbamate Polysiloxanes (PSil-CO2).
Dry CO2 gas (prepared as described in Section 2.1.2) was bubbled gently through a
stirred PSil sample in a glass vial for 1 h. The vial was placed in a water bath at room
temperature during the CO2 addition to dissipate the heat from the exothermic
reaction.
92
Syntheses of Ammonium Dithiocarbamate Polysiloxanes (PSil-CS2). Two molar
equivalents of carbon disulfide were slowly added to a PSil in a closed glass vial. The
vial was sonicated in a Bransonic 1210 ultrasonic cleaner with water in the bath for 1
h, allowed to stand for 2 days, and the contents were placed under a house vacuum for
24 h to remove excess CS2.
Syntheses of Thiourea Crosslinked Polysiloxanes (PSil-CS2-H). After the procedure
above (minus the removal of excess CS2 under house vacuum), the sample was heated
to 120 oC for 1 h and cooled to room temperature. The heating and cooling were
repeated twice more. The resulting material was kept in a vacuum oven with house
vacuum 250 Torr at 40 oC for 24 h to remove any dissolved H2S and residual CS2.
The thiourea-containing samples were slightly yellow. (WARNING: H2S is a highly
toxic gas.)
Acidification experiments. Either acetic acid or trifluoroacetic acid (1.0 mL) was
added to 1.0 g of PSil-CO2 or PSil-CS2 in a closed glass vial and the mixture was
stirred for 1 h before removing a weighed aliquot for NMR studies.
Procedure for swelling. A weighed aliquot (ca. 50 mg) of polymer and 3.0 mL of a
liquid were placed in a closed screw-cap glass vial for 24 h. The polymer was
removed, its surface was dried quickly on a piece of filter paper, and it was reweighed.
The swelling ratio (S%) was calculated by eq 3-3, where Wg and Wp are the weights
of swelled and dry polymer, respectively. The temporal uptake of liquid was
determined by removing the polymer at different times from the liquid, weighing it,
and placing it anew into the liquid until no weight increase could be detected.
S% = [(Wg-Wp)/Wp] ×100% (3-3)
Adhesion test procedures. An aliquot of polymer was placed on the steel base plate of
the rheometer, and the upper parallel (flat) steel plate was moved into contact with the

93
upper surface of the polymer. The initial gap was set at 0.15 mm. The system was left
undisturbed for 10 min to form an equilibrated interfacial contact. Then, the top plate
was lifted vertically to a plate gap of 0.50 mm at a velocity of 0.01 mm/s. The normal
force response in this process was recorded by the rheometer. All measurements were
performed at 25 oC.
3.1.5 Results and Discussion
Scheme 3-1. Structures of polysiloxane samples and a general scheme for their
reactions with CO2 and CS2.

94
Figure 3-1. Before (left) and after (right) bubbling CO2 through neat (6-7)PSil at 25
oC.
Bubbling CO2 through the stirred polysiloxanes for a few minutes resulted in a
noticeable and significant increase in viscosity (Figure 3-1). The crosslinking from
formation of ionic pairs, as ammonium and carbamate centers are created (Scheme 3-
1), can be monitored conveniently by FT-IR spectroscopy (Figure 3-2 with 15PSil as
an example). After CO2 bubbling, a C=O stretching band at 1640 cm-1, typical of a
carbamate,73 was observed as a shoulder. In addition, a medium strong band centered
at 1586 cm-1 can be assigned to the N-H bending;143 the corresponding peak was
located at 1598 cm-1 in 15PSil before CO2 bubbling and after passing N2 through
15PSil-CO2. Also, a band ascribed to the asymmetric vibration of C-Si-C shifted to
1472 cm-1 upon bubbling CO2 through the 15PSil. The changes in the IR frequencies,
in combination with the qualitative evidence from the Hg burette measurements (as
shown on page 101), demonstrate that a chemical change occurred, and it is
reasonable to ascribe it to the uptake of CO2.

95
4000 3000 2000 1000
(d)
(c)
(b)
Tran
smitt
ance
(rel
)
Wavenumber (cm-1)
(a)
Figure 3-2. Vertically offset FT-IR spectra recorded sequentially for 15PSil (a), after
bubbling CO2 (i.e., 15PSil-CO2) (b), the compound in (b) after bubbling with N2 (c) at
80 °C, and the compound in (c) after bubbling with CO2 (d).
Similarly, exposure of the amino-terminated polysiloxane 3PSil to CO2 led to a
rapid increase in its viscosity. The infrared spectrum in Figure 3-3 for the product of
the reaction is consistent with the 3PSil-CO2 structure; its new absorption bands are
almost the same as those found in the spectrum of 15PSil-CO2. The formation of
ammonium dithiocarbamates in polysiloxanes upon addition of CS2 is also indicated
by FT-IR spectra. An N-H bending band was found at 1552 cm-1, and the bands at
1370 and 945 cm-1 can be assigned to C=S and C-S stretchings, respectively.144 Upon
heating a 3PSil-CS2 sample to 120 ºC (to form 3PSil-CS2-H), the N-H stretching band
shifts from 3190 cm-1 to 3068 cm-1
as a result of H-bonding interactions (Figure 3-3).
The C-S stretching band at 945 cm-1 is no longer present and the C=S stretching band
shifts to 1348 cm-1.145 The IR frequencies for the thiourea groups in 3PSil-CS2-H are
very similar to those found in the spectrum of N, N’-dialkylthioureas obtained by
heating alkylammonium alkyldithiocarbamates.19e

96
3500 3000 2500 2000 1500 1000
(b)
(d)
(c)
(a)
Tran
smitt
ance
(rel
)
Wavenumber (cm-1)
Figure 3-3. Vertically offset IR spectra of 3PSil (a), 3PSil-CO2 (b), 3PSil-CS2 (c) and
3PSil-CS2-H (d).
The temporal course of uptake of (1 atm) CO2 by the polysiloxanes has been
followed. Because the uptake rate is dependent on the surface area of the
polysiloxanes exposed to the CO2 gas and the rate of stirring, neither of which can be
reproduced exactly, no attempt has been made to compare quantitatively rates of
uptake by the different PSil polymers. However, the surface area and stirring rate in
each run were nearly the same, so that the order of rates among the PSil can be
approximated. The plateau (saturation) values for uptake are independent of both
variables and, therefore, are reproducible quantitatively.
A typical plot for (6-7)PSil is shown in Figure 3-4. The other polysiloxanes
behaved in an analogous fashion. The uptake was rapid during the first 5 min and
reached its maximum, ~130% of the expected amount for complete reaction, after ca.
60 min. The 30% excess is ascribed to physically adsorbed CO2.146

97
Figure 3-4. Weight percentage uptake of CO2 (%CO2) by neat (6-7)PSil as a function
of time upon exposure to 1 atm pressure of CO2. Data from two separate runs and
their average are shown.
Examples of the weight losses from heating 3PSil, 3PSil-CO2, 3PSil-CS2 and
3PSil-CS2-H by TGA are collected in Figure 3-5. The difference curve between
3PSil-CO2 and 3PSil shows a 4.0% higher loss at 80 oC from 3PSil-CO2 than from
3PSil; the calculated weight of CO2 in 3PSil-CO2, assuming complete conversion, is
ca. 4.0%. We assume that the excess (i.e., physically adsorbed) CO2 is lost over time
as the 3PSil-CO2 samples equilibrate with air.
Heating 3PSil-CS2 according to the same protocol resulted in a 2.8% weight loss at
120 oC. This value is close to the 3.1% loss predicted if each of the ammonium
dithiocarbamate ion pairs loses one molecule of H2S. As expected, the thiourea-
containing polysiloxane, 3PSil-CS2-H, is more stable thermally than its
electrostatically crosslinked analogue, 3PSil-CS2.

98
50 100 150 200
0
2
4
6
80
100
(d)
(e)
(f)
(c)(b)
Wei
ght %
(a)
Temperature (oC)
Figure 3-5. TGA curves of 3PSil-CS2-H (a) heated from room temperature, neat
3PSil (b), 3PSil-CO2 (c) and 3PSil-CS2 (d). Difference curves between 3PSil and
3PSil-CO2 curves (e) and between 3PSil and 3PSil-CS2 curves (f) are shown as well.
Representative DSC thermograms of polysiloxanes are collected in Figures 3-6
and 3-7. The first-heating thermogram of 15PSil-CO2 includes a broad endotherm that
extends from 60 to 120 oC which is attributed to loss of CO2. The first-heating
thermogram of 15PSil-CS2 has a broad endotherm from 75 to 150 oC that is in good
agreement with the expectation from the TGA results that H2S is being lost. No
subsequent exotherms or endotherms were detected during the first cooling or second
heating of the sample; conversion of ammonium dithiocarbamate to thiourea is
complete after the initial heating to 350 °C.

99
0 40 80 120 160 200
-0.8
-0.4
0.0
0.4
Hea
t Flo
w (W
/g)
Temperature (oC)
Heating direction
Starting point
Figure 3-6. DSC thermograms of 15PSil-CO2. The arrows indicate starting point of
the experiment and the direction of initial temperature change.
0 50 100 150 200 250 300 350 400
-4
-3
-2
-1
0
1
2
3
Starting Point
Heating direction
Hea
t Flo
w (W
/g)
Temperature (oC)
Figure 3-7. DSC thermograms of 15PSil-CS2. The arrows indicate the starting point
of the experiment and the direction of initial temperature change. The black curve is
the first heating-cooling cycle and the red curve is the second cycle.
The isothermal stability of 15PSil-CO2 was monitored by TGA. The reversion of
the ionic-to-uncharged forms of the polysiloxanes is very slow at 25 oC in the
presence of a dry nitrogen gas flow of 60 cc/min (0.70% weight, corresponding to
~0.16 equivalents of CO2, was lost during 60 min) and is even slower in the absence

100
of a wind (0.08% or ~2×10⁻² equivalents of CO2 was lost during 60 min) (Figure 3-8b).
At 75 or 100 oC, 96% of the weight loss calculated for total removal of the CO2 is
achieved after less than 5 min with N2 flow. (Figure 3-8a).
0 20 40 60
95
100
Wei
ght %
Time (min)
a0 20 40 60
98
100
Wei
ght %
Time (min)
b
Figure 3-8. (a) Isothermal TGA weight loss curves of 15PSil-CO2 at various
temperatures under a nitrogen flow of 60 ml/min. From top to bottom: 25, 50, 75 and
100 oC. (b) TGA weight loss curve of 15PSil-CO2 at 25 °C without nitrogen flow.
Taken together, these results clearly demonstrate that the PSil-CO2 have good
thermal stability at room temperature without nitrogen flow, and good reversibility at
elevated temperatures with nitrogen flow. The ionic cross-links allow the PSil-CO2
and PSil-CO2 to retain three-dimensional networks even as they imbibe large amounts
of liquid. Therefore, the PSils can be swelled by a variety of organic liquids to create
gel states. An example, a photo of the increase in size of 10PSil-CS2 swelled by
hexane, is displayed in Figure 3-9. The details of the swelling studies will be
discussed in Section 3.2.

101
Figure 3-9. Photographs of (6-7)PSil-CS2 before (left) and after (right) swelling with
hexane at room temperature.
Figure 3-10. Viscosities (Pa·s) of samples before and after bubbling CO2 as a function
of shear rate (S-1) at 25 oC. From top to bottom: 15PSil-CO2 (), 10PSil-CO2 (), (6-
7)PSil-CO2 (), (2-4)PSil-CO2 (), 3PSil-CO2 (♦), 15PSil (), 10PSil ( ), (2-4)PSil
(), (6-7)PSil ( ) and 3PSil ( ).
Rheological properties. In order to determine the relationships among amine content,
polymer structure, and viscoelastic properties, both static and dynamic rheological
studies have been conducted on the polysiloxanes before and after exposing them to
one of the triatomic molecules. At low molecular weights, linear
polydimethylsiloxane (PDMS) polymers behave essentially as Newtonian liquids—
their viscosity is not influenced by shear rate. At molecular weights above 10,000,
PDMS polymer chains become entangled and exhibit a viscoelastic response and
shear-thinning behavior at modest shear rates.123 Esmail and coworkers147 found that
the Newtonian viscosity of poly(dimethylsiloxane) solutions generally decreases with

102
temperature from 10 °C to 50 °C. The viscosity of their PDMS was ca. 1.0 Pa·s at 20
oC, which is 10 fold higher than the viscosity of 15PSil. However, the viscosity of
15PSil-CO2, ca. 300 Pa·s, is significantly higher than that of the PDMS. Figure 3-10
displays steady-shear rheological data for the polysiloxanes before and after
crosslinking by CO2. The viscosities η (Pa·s) are independent of shear rate, as
expected of Newtonian liquids. 148 However, the η increase by ca. 3 orders of
magnitude after each PSil is exposed to CO2. The increase in viscosity is especially
noticeable in the two polysiloxanes with the highest amino group contents, 10PSil-
CO2 and 15PSil-CO2.
The viscosities of the PSil-CO2 increase in a regular fashion with increasing
amino group content (Figure 3-11). Although there is no apparent relationship
between amino group content and the ratio of the PSil-CO2 and PSil viscosities
(Table 3-1), the viscosities of the neat PSil polymers are known to be proportional to
their molecular weights.149 We emphasize here that crosslinks within the 3PSil-CO2
network do not result in a true 3-dimensional network—the amino end-groups can
extend the lengths of the chains only and, thus, produce 1-dimensional topological
networks that can appear to be pseudo 3-dimensional networks if the chains intertwine
or their cation-anion pairs aggregate in pairs, providing quadrupolar interactions.
The PSils, became highly viscous liquids upon adding CS2, and eventually
transformed into elastic materials after 48 h, as a result of the slow diffusion of CS2 in
the resulting, highly viscous environment. This result can be attributed to the stronger
electrostatic interaction of ammonium dithiocarbamate than ammonium carbamate87
and the higher polarizability of the dithiocarbamate. Their gel-like rheological
behavior is shown in Figure 3-18 and Figure 3-19 and discussed on page 108.

103
Table 3-1. Viscosities (Pa·s) of PSils before (B) and after (A) bubbling CO2 at 25 oC.
Samples Viscosity (Pa·s) A/B viscosity ratio
B A
3PSil 0.020 18 900
(2-4)PSil 0.030 48 1600
(6-7)PSil 0.024 95 4000
10PSil 0.067 168 2500
15PSil 0.098 290 3000
0 2 4 6 8 10 12 14 16
0
50
100
150
200
250
300
Visc
osity
of P
Sil (
Pa.s
)
Visc
osity
of P
Sil-C
O2 (P
a.s)
% amine0.00
0.01
0.02
Figure 3-11. Viscosities of PSil (, right Y-axis) and PSil-CO2 (, left Y-axis)
versus % amine functionality at room temperature.
The rheological properties of two polysiloxanes containing comparable
frequencies of amino groups but one, (2-4)PSil, capable of making 3-D crosslinked
networks and the other, 3PSil, capable of making only extended 1-D structures with
increased molecular weights, have been compared. Addition of CO2 or CS2 increased

104
the viscosities of both (Figure 3-12). Also, the stronger attachment of CS2 than CO2
to the amine groups and the greater polarizability of the dithiocarbamate make the
viscosity of 3PSil-CS2 higher than that of 3PSil-CO2, but both are less viscous than
their (2-4)PSil analogues which can form 3-dimensional crosslinked networks in the
presence of one of the triatomic molecules.
10-1 100 101
10-2
10-1
100
101
102
103
Visc
osity
(Pa.
s)
Shear Stress (Pa)
Figure 3-12. Steady-shear rheology of polysiloxane samples at room temperature (25
oC): the apparent viscosities (Pa·s) of 3PSil-CS2-H (), 3PSil-CS2 (), 3PSil-CO2
() and 3PSil ().
The viscosity of the (thiourea-containing) 3PSil-CS2-H, made by heating 3PSil-
CS2 to ca. 120 oC, is ca. 20X that of its immediate precursor. The large increase can
be attributed to the covalent nature of the thiourea links between 3PSil chains and the
ability of the thiourea groups to establish strong H-bonding networks. 150 , 151 The
viscous modulus G´´ of 3PSil-CS2 exceeds the elastic modulus G´ over the entire
range of frequencies examined and is strong function of frequency (Figure 3-13),
whereas G´ is nearly independent of frequency, which indicate that this material is
like both a viscous liquid and a gel. 152

105
10-1 100 101 10210-2
10-1
100
101
102
103
104
G' a
nd G
'' (P
a)
Angular Frequency (rad/s)
Figure 3-13. Dynamic rheology of polysiloxane samples at room temperature (25 oC):
storage modulus (G´, solid) and loss modulus (G´´, open) of 3PSil-CS2 (, ), 3PSil-
CO2 (, ) and 3PSil-CS2-H (, ).
10-1 10010-3
10-2
10-1
100
101
102
103
G' a
nd G
'' (P
a)
Angular Frequency (rad/s)
Figure 3-14. Storage modulus (G´, solid symbols) and loss modulus (G´´, open
symbols) of 15PSil-CO2 (, ), 10PSil-CO2 (, ), (6-7)PSil-CO2 (,), and (2-
4)PSil-CO2 (♦, ) at 25 oC.
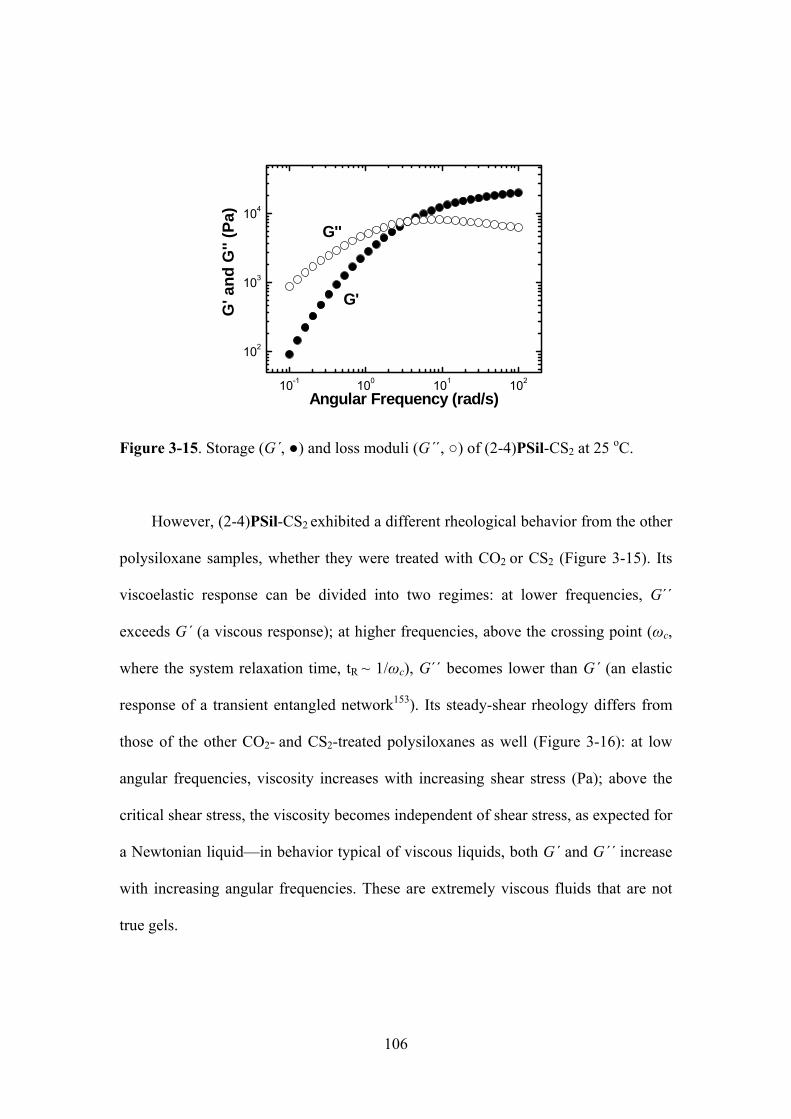
106
10-1 100 101 102
102
103
104
G'
G''
G' a
nd G
'' (P
a)
Angular Frequency (rad/s)
Figure 3-15. Storage (G´, ) and loss moduli (G´´, ) of (2-4)PSil-CS2 at 25 oC.
However, (2-4)PSil-CS2 exhibited a different rheological behavior from the other
polysiloxane samples, whether they were treated with CO2 or CS2 (Figure 3-15). Its
viscoelastic response can be divided into two regimes: at lower frequencies, G´´
exceeds G´ (a viscous response); at higher frequencies, above the crossing point (ωc,
where the system relaxation time, tR ~ 1/ωc), G´´ becomes lower than G´ (an elastic
response of a transient entangled network153). Its steady-shear rheology differs from
those of the other CO2- and CS2-treated polysiloxanes as well (Figure 3-16): at low
angular frequencies, viscosity increases with increasing shear stress (Pa); above the
critical shear stress, the viscosity becomes independent of shear stress, as expected for
a Newtonian liquid—in behavior typical of viscous liquids, both G´ and G´´ increase
with increasing angular frequencies. These are extremely viscous fluids that are not
true gels.
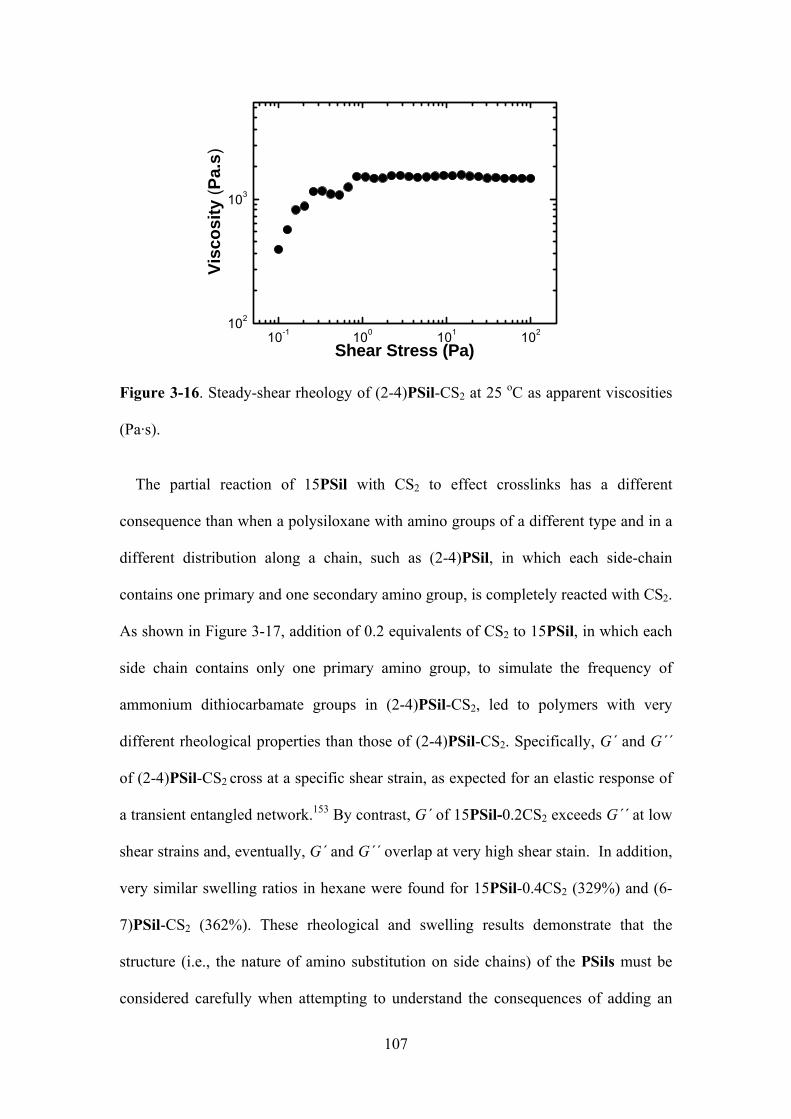
107
10-1 100 101 102102
103
Visc
osity
(Pa.
s)
Shear Stress (Pa)
Figure 3-16. Steady-shear rheology of (2-4)PSil-CS2 at 25 oC as apparent viscosities
(Pa·s).
The partial reaction of 15PSil with CS2 to effect crosslinks has a different
consequence than when a polysiloxane with amino groups of a different type and in a
different distribution along a chain, such as (2-4)PSil, in which each side-chain
contains one primary and one secondary amino group, is completely reacted with CS2.
As shown in Figure 3-17, addition of 0.2 equivalents of CS2 to 15PSil, in which each
side chain contains only one primary amino group, to simulate the frequency of
ammonium dithiocarbamate groups in (2-4)PSil-CS2, led to polymers with very
different rheological properties than those of (2-4)PSil-CS2. Specifically, G´ and G´´
of (2-4)PSil-CS2 cross at a specific shear strain, as expected for an elastic response of
a transient entangled network.153 By contrast, G´ of 15PSil-0.2CS2 exceeds G´´ at low
shear strains and, eventually, G´ and G´´ overlap at very high shear stain. In addition,
very similar swelling ratios in hexane were found for 15PSil-0.4CS2 (329%) and (6-
7)PSil-CS2 (362%). These rheological and swelling results demonstrate that the
structure (i.e., the nature of amino substitution on side chains) of the PSils must be
considered carefully when attempting to understand the consequences of adding an

108
X=Y=X crosslinker to the PSils. The details of the swelling studies will be presented
in section 3.2.
10-1 100 101 102
102
103
104
G''
G' a
nd G
'' (P
a)
Shear Strain (%)
G'
Figure 3-17. Storage modulus (G´, ) and loss modulus (G´´, O) at 25 oC of 15PSil
with 0.2 equivalents of CS2. This amount of CS2 corresponds approximately to the
same concentration of ammonium dithiocarbamate units as in fully reacted 3PSil (i.e.,
when it is treated with 0.5 equivalent of CS2).
10-1 100 101 102 103
102
103G'
G''
G' a
nd G
'' (P
a)
Shear Strain (%)
Figure 3-18. Storage (G´, ) and loss (G´´, ) moduli of (6-7)PSil-CS2 at 25 oC.

109
According to the dynamic strain sweep measurements in Figure 3-18, (6-7)PSil-
CS2 is a soft elastic material (a gel; vide infra); G´ decreases as shear strain increases.
However, G´´ increases and then decreases in the high-strain region. This behavior, a
“weak strain overshoot,” arises from the strain-induced imbalance between the
formation and destruction of network junctions.154 If the polysiloxane backbones with
ammonium dithiocarbamate groups (as well as those with ammonium carbamate
groups) are highly extended as a result of the electrostatic repulsion from the charged
centers, the resultant microstructure networks can resist deformation while a weak
strain is imposed and G´´ increases. However, the microstructures are destroyed by
large strains, decreasing G´´.
Figure 3-19. Storage (G´, ) and loss (G´´, ) moduli of (6-7)PSil-CS2 at 25 oC (left
Y axis). The loss tangent, tan δ (G″/G′) as a function of angular frequency of the same
data (, right Y axis).
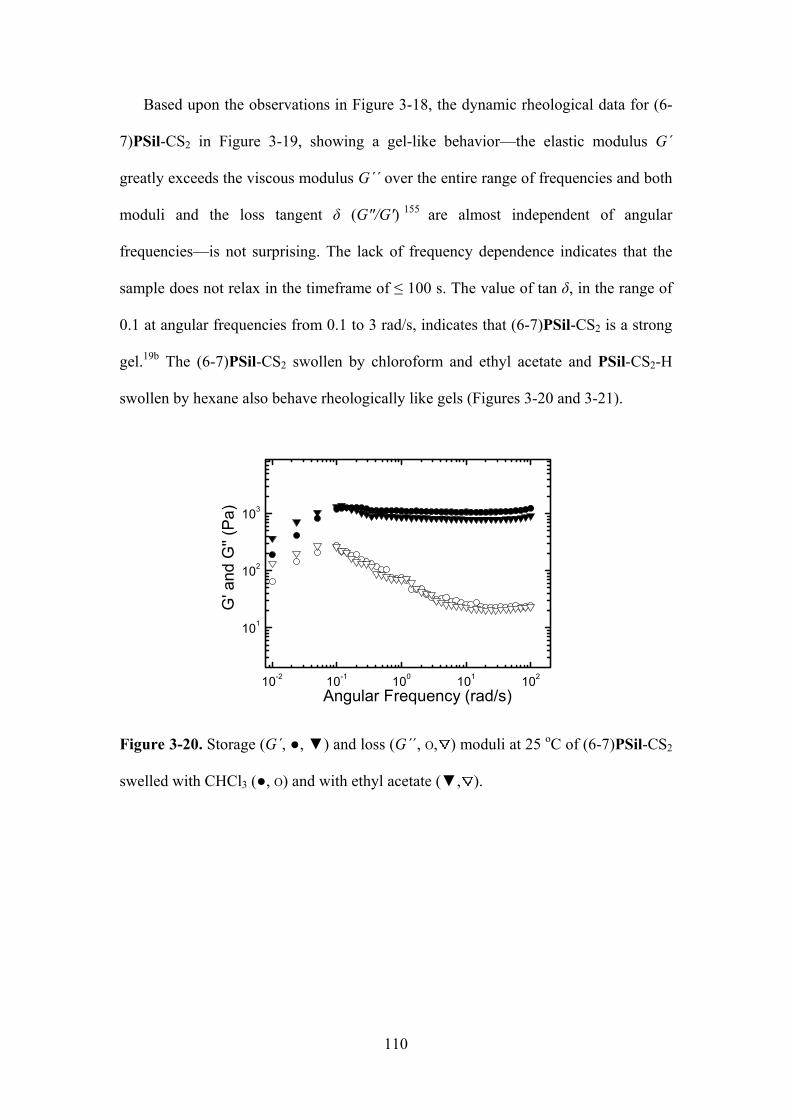
110
Based upon the observations in Figure 3-18, the dynamic rheological data for (6-
7)PSil-CS2 in Figure 3-19, showing a gel-like behavior—the elastic modulus G´
greatly exceeds the viscous modulus G´´ over the entire range of frequencies and both
moduli and the loss tangent δ (G″/G′) 155 are almost independent of angular
frequencies—is not surprising. The lack of frequency dependence indicates that the
sample does not relax in the timeframe of ≤ 100 s. The value of tan δ, in the range of
0.1 at angular frequencies from 0.1 to 3 rad/s, indicates that (6-7)PSil-CS2 is a strong
gel.19b The (6-7)PSil-CS2 swollen by chloroform and ethyl acetate and PSil-CS2-H
swollen by hexane also behave rheologically like gels (Figures 3-20 and 3-21).
10-2 10-1 100 101 102
101
102
103
G' a
nd G
'' (P
a)
Angular Frequency (rad/s)
Figure 3-20. Storage (G´, , ) and loss (G´´, O, ) moduli at 25 oC of (6-7)PSil-CS2
swelled with CHCl3 (, O) and with ethyl acetate (, ).
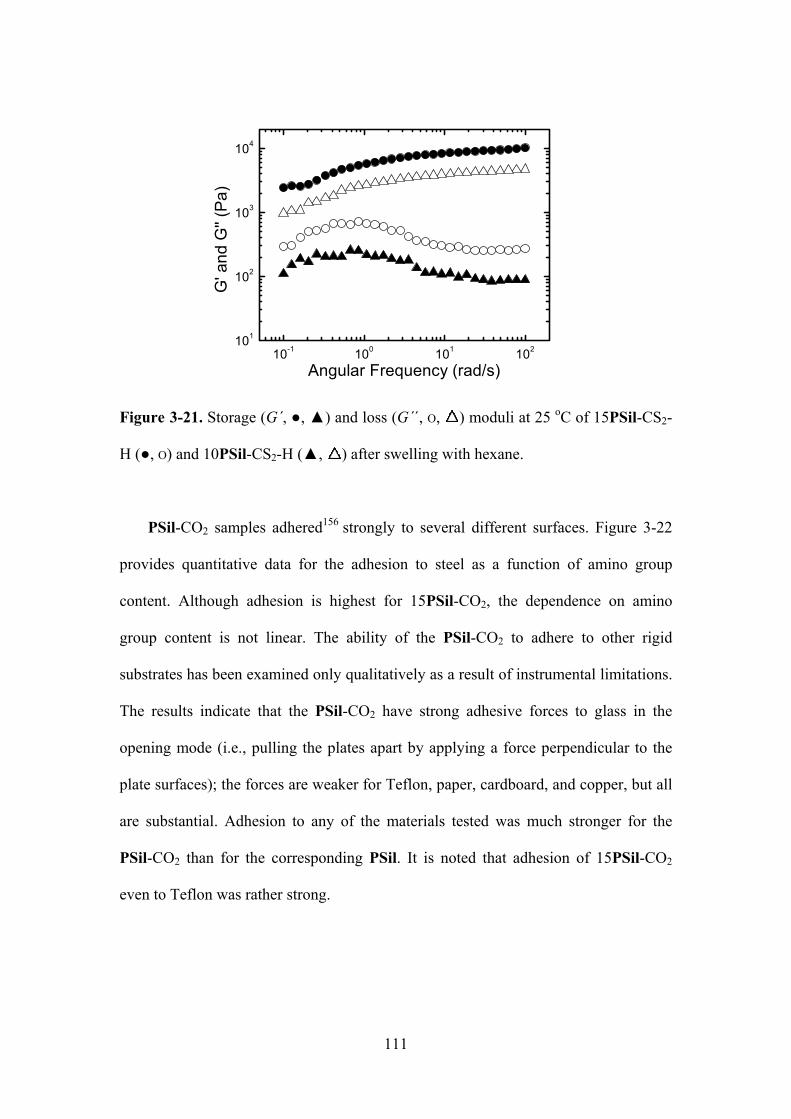
111
10-1 100 101 102101
102
103
104
G' a
nd G
'' (P
a)
Angular Frequency (rad/s)
Figure 3-21. Storage (G´, , ) and loss (G´´, O, ) moduli at 25 oC of 15PSil-CS2-
H (, O) and 10PSil-CS2-H (, ) after swelling with hexane.
PSil-CO2 samples adhered156 strongly to several different surfaces. Figure 3-22
provides quantitative data for the adhesion to steel as a function of amino group
content. Although adhesion is highest for 15PSil-CO2, the dependence on amino
group content is not linear. The ability of the PSil-CO2 to adhere to other rigid
substrates has been examined only qualitatively as a result of instrumental limitations.
The results indicate that the PSil-CO2 have strong adhesive forces to glass in the
opening mode (i.e., pulling the plates apart by applying a force perpendicular to the
plate surfaces); the forces are weaker for Teflon, paper, cardboard, and copper, but all
are substantial. Adhesion to any of the materials tested was much stronger for the
PSil-CO2 than for the corresponding PSil. It is noted that adhesion of 15PSil-CO2
even to Teflon was rather strong.

112
0 2 4 6 8 10 12 14 16
0
10
20
30
40
Nor
mal
For
ce (N
)
Nor
mal
For
ce (N
)
% amine
0.0
0.1
0.2
Figure 3-22. Maximum value of normal force of different % amine functionality
polysiloxanes before (, right Y-axis) and after (, left Y-axis) CO2 bubbling at 25 oC
while lifting one plate from the other plate starting at 0.15 mm separation and moving
to a final separation of 0.5 mm.
We also evaluated the qualitative adhesiveness of the PSil-CO2 under different
environmental conditions. There was no discernible difference in the adhesion of
15PSil-CO2 to copper plates during 24 h when the sandwiched samples were left in
air or submerged under tap water. In both cases, the contact surface area of the
polymer to the outside environment was very small, conditions that disfavor loss of
CO2 via out-diffusion and entry of water via in-diffusion. However, the substrates
could be separated much more easily when a sandwich was warmed for several
minutes to 40 oC (i.e., below the CO2 loss temperature according to DSC and TGA
measurements); recooling the same sandwich to room temperature increased again the
adhesive strength. However, both the aged PSil-CS2 and (heated) PSil-CS2-H are gel-
like materials and exhibit very little adhesion to the same substrates. Very recently,
113
Zhang and coworkers157 reported the use of PDMS as a substrate combined with 3-
aminopropyl-triethoxysilane as a bonding agent for the separation of semiconducting
(s) and metallic (m) single-walled carbon nanotubes. In essence, the polymer is acting
like a selective adhesive. Although the essential character of these interactions is still
unclear, the lone pair of electrons on the amino nitrogen is implicated as an important
contributor to the adhesion.158
It is known that protonation of carbamate of dithiocarbamate group results in a
rapid loss of their triatomic moieties and formation of ammonium groups.19 When the
ammonium carbamate being treated is part of a polymeric material, addition of acid
causes a precipitous decrease in viscosity, analogous to that experienced by
ammonium carbamates when they are heated to remove CO2.159 Thus, the viscosities
of the PSil-CO2 were reduced and small bubbles (presumably CO2) were formed in
them when glacial acetic acid (pKa 4.8) was added. However, the PSil-CS2 was
converted to flowing liquids only after addition of the stronger trifluoroacetic acid
(pKa 0.5) in its neat form.
3.1.6 Conclusions
A facile method has been developed for crosslinking polysiloxanes with amino
functionalities via addition of an uncharged triatomic molecule, CO2 or CS2. The
crosslinking with CO2 can be reversed easily by mild heating while that with CS2
cannot be—warming the ammonium dithiocarbamates that are formed upon exposure
of the PSil to CS2 results in covalent thiourea crosslinks and expulsion of H2S. The
physical, rheological and adhesive properties of the polysiloxanes before and after
ionic and covalent crosslinking can be ‘tuned’ by varying the amino substitution along
the polymer chains. A remarkable aspect of this work is the extremely large increases
in the viscosity and adhesiveness that can be attained simply by bubbling CO2 through

114
the polymers. Although there is a direct relationship between the absolute viscosity
and the amount of amine functionality in the polymers after addition of a triatomic, no
correlation was obvious in the PSils, themselves. There, molecular weight of the
polymer chains appears to be the most important factor in determining the viscosities.
The strong adhesion of the PSil-CO2 polymers to various substrates, combined with
their reversibility to the original PSils (and loss of adhesive strength), opens prospects
for creating reversible, stimuli-responsive adhesives160 or sealants in which adhesion
can be controlled by environmental conditions.161,162
The PSil-CS2 and the PSil-CS2-H materials (that the PSil-CS2 yield upon heat
treatments) are able to be swelled to several fold their original volumes by some
organic solvents. Again, this ability to be swelled and deswelled may lead to
interesting new applications for polysiloxanes. Although heating the PSil-CS2 cannot
reconvert them to their PSil forms (as it can the PSil-CO2), exposing them to a strong
acid produces ammonium groups along the chains (i.e., a protonated PSil) that allow
the PSils to flow again like low viscosity liquids. These materials do not possess the
gel-like or the strong adhesive properties of the PSil-CS2.
In summary, simple organic chemistry can be applied to a set of complex
polymers to change enormously their macroscopic properties. The natures of those
changes have been documented step-by-step through a combination of spectroscopic
and rheological measurements. This facile strategy provides not only an effective
alternate to the more classical method to crosslink polymers, but it also affords an
easily accessed route to two classes of novel materials with interesting physical and
chemical properties.
Potential new applications include the use of polysiloxanes as cleaning agents in
art conservation, where rheoreversibility and swelling by organic liquids are highly
115
desirable attributes.6 In addition, our swollen polysiloxanes may be useful packing
materials for chromatography163 and as aligning media for NMR measurements.164
This approach may also be useful in the syntheses of new polymers from monomers
pre-treated with CO2 or CS2. 165 Experiments to exploit some of these uses are
underway.
3.2 Swelling-deswelling behavior of crosslinked amino-substituted polysiloxanes.
Possible applications for chemical spill containment and remediation
3.2.1 Introduction
Swelling of cross-linked polymer networks166,167 is an important topic, given the
wide variety of applications of such materials, including stimuli-responsive
materials, 168 membranes, 169 templates for inorganic morphologies 170 , and drug
delivery systems.171 Polymeric materials such as poly(dimethylsiloxane) (PDMS) are
known to swell in various organic solvents, and their swelling properties have been
extensively investigated. 172 Several types of ionically and covalently crosslinked
amino-functionalized polysiloxanes (PSils), prepared by simple addition of CS2 (PSil-
CS2) and heating (PSil-CS2-H) have been prepared by our group (Scheme 3-1)85.
These PSils were shown to imbibe large volumes of several organic liquids, especially
those of low polarity, without dissolving.
Here, we report a detailed investigation of the swelling and deswelling kinetics of
PSil-CS2 and PSil-CS2-H at different temperatures using neat and mixed solvents as
the swelling agents. (Although the corresponding PSil-CO2 materials must swell
organic liquids in a similar fashion, we have not examined their swelling ability
because the experiments must be conducted under industrially unrealistic
conditions—one atmosphere of CO2—in order to maintain the integrity of the
crosslinks over long times and ensure reproducibility.) The swelling ability can be

116
tuned by varying the degree of crosslinking (i.e., the frequency of amino
functionalities along a polymer chain). These investigations allow the rate-limiting
step for entry into or exit from PSils to be identified. Furthermore, the
swelling/deswelling cycle could be repeated several times without significant loss of
swelling capacity. Based upon these observations and the density of the polymers (<1
g/cm3), a procedure for recovery of oils or chemicals from spills (that includes reuse
of the PSils) has been developed.
3.2.2 Materials
87-octane gasoline was obtained from a commercial gas station; VM-46 Naphtha
was from VM&P; Xylol was from Xylol Parts, Inc. Other chemicals used in this study
are described in Section 3.1.3.
3.2.3 Procedure for swelling/deswelling
Procedure for swelling. A weighed aliquot (ca. 30 mg) of cross-linked PSil and 3.0
mL of a liquid were for 24 h. During this time, the PSil and the solvents were kept in
closed, screw-capped glass vials with Teflon inserts in the caps to ensure no loss of
solvent. Then, the polymer was removed, its surface was dried quickly on a piece of
filter paper, and it was reweighed on a precision balance. The swelling ratio (S%) was
calculated by eq. 3-3 in section 3.1.4. The swelling and deswelling cycle was repeated
at least three times and the average data are reported. The reproducibility of the
swelling kinetics was ± 5%.
Procedure for swelling kinetics. For swelling, a polymer was removed from the
organic solvent at pre-determined time intervals, weighed after drying it with a piece
of filter paper rapidly, and placed anew into the liquid until no weight increase could
be detected between successive determinations. For deswelling, a known amount fully
swollen polymer was placed on a precision balance, and the loss of weight was

117
recorded at pre-determined time intervals. The swelling and deswelling cycle was
conducted at least three times, and the reproducibility of the kinetics of deswelling
was ± 3%.
Selective swelling capacity. 33 mg of 10PSil-CS2 and an equimolar mixture (0.62
mmol) of 0.52 g dichloromethane and 0.29 g ethanol were placed into a closed screw-
capped glass vial at room temperature. After 2 h, the swelled polymer was removed
with a spatula and its surface was dried quickly on filter paper and weighed
immediately. Integration of selective protons of the two organic liquids in 1H NMR
spectra of the solvent mixture remaining in the vial (Table 3-2) was used to calculate
the molar ratio of the remaining solvents in the vial and, thereby, knowing the weight
of the solvent imbibed into the 10PSil-CS2, the molar ratio of solvents taken into the
10PSil-CS2. The estimated error in the measurements is ± 5%.
Procedure for determining total swelling capacity and selectivity of swelling in
ethanol-dichloromethane mixtures. In closed screw-capped glass vials, ca. 30 mg of
10PSil-CS2 were added to ca 1.0g mixtures of dichloromethane and ethanol. The
mol % of ethanol was 0% (1.0 g CH2Cl2), 20% (0.88g CH2Cl2 and 0.12g ethanol),
40% (0.74g CH2Cl2 and 0.26g ethanol), 50% (0.65g CH2Cl2 and 0.35g ethanol), 60%
(0.55g CH2Cl2 and 0.45g ethanol), 80% (0.32g CH2Cl2 and 0.68g ethanol) and 100%
(1.1g ethanol). The swelled polymers were removed after 2 h by spatula, their
surfaces were dried quickly on filter paper, and they were reweighed immediately.
The swelling ratios (S %) were calculated eq. 3-3 in section 3.1.4. The estimated error
in the measurements is ± 5%.
Also, a weighed amount (ca. 40 mg) of 10PSil-CS2 was placed in a water and
gasoline mixture in a closed screw-cap glass vial. The polymer was removed was and
reweighed as described above. Deswelling of the gasoline from the polymer was
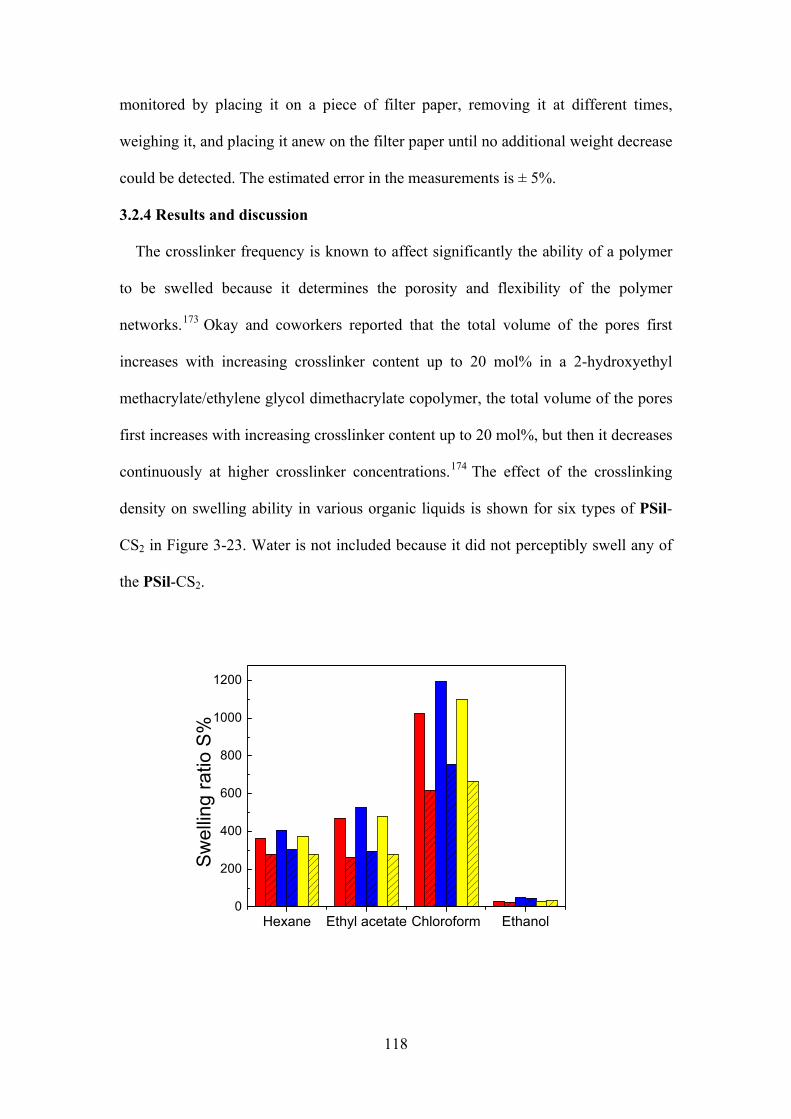
118
monitored by placing it on a piece of filter paper, removing it at different times,
weighing it, and placing it anew on the filter paper until no additional weight decrease
could be detected. The estimated error in the measurements is ± 5%.
3.2.4 Results and discussion
The crosslinker frequency is known to affect significantly the ability of a polymer
to be swelled because it determines the porosity and flexibility of the polymer
networks.173 Okay and coworkers reported that the total volume of the pores first
increases with increasing crosslinker content up to 20 mol% in a 2-hydroxyethyl
methacrylate/ethylene glycol dimethacrylate copolymer, the total volume of the pores
first increases with increasing crosslinker content up to 20 mol%, but then it decreases
continuously at higher crosslinker concentrations.174 The effect of the crosslinking
density on swelling ability in various organic liquids is shown for six types of PSil-
CS2 in Figure 3-23. Water is not included because it did not perceptibly swell any of
the PSil-CS2.
Hexane Ethyl acetate Chloroform Ethanol0
200
400
600
800
1000
1200
Sw
ellin
g ra
tio S
%
119
Figure 3-23. Swelling ratios of (6-7)PSil-CS2 (red), 10PSil-CS2 (blue), 15PSil-CS2
(yellow) and their PSil-CS2-H (stripe) in 4 liquids at room temperature.
The swelling ratios of PSil-CS2 gels show no discernible relationship with
increasing frequency of amine functionality; 10PSil-CS2 is clearly the most efficient.
We hypothesize that the three-dimensional networks of 10PSil-CS2 offer the best
balance between crosslinking density and network flexibility. Osmotic pressure
balance between solvent molecules and a polymer surface is critical to the equilibrium
swelling capacity.175 Physically, the liquid molecules must enter initially near the
surface of a polymer and then move into the interior regions as other molecules of
liquid occupy sites near the surface. Therefore, it is understandable that the degree of
rubbery elasticity of the cross-linked network will affect the osmotic pressure
balance.175 This theory is consistent with the results shown in Figure 3-23, where an
even higher (15%) crosslinking percentage leads to a decrease in the swelling
capability. The more highly crosslinked polymeric network is more rigid and has
more interactions between polymer chains.176 At lower crosslinking densities, the
network is looser with larger spaces between chains, allowing more solvent to be
incorporated. However, the relative stabilities of three-dimensional networks need to
be taken into account, as well. Too few crosslinks do not lead to stable gel networks
after swelling. These results indicate that the swelling process is a convolution of
network stability and space between chains.177
Note also in Figure 3-23 that each of the PSil-CS2 is able to imbibe more of a
liquid than its corresponding (covalently) thiourea crosslinked analogue PSil-CS2-H.
This observation is attributed to the ability of the ionic crosslinks to ‘float’ from one
position to another in a manner that maximizes the network stability in the presence of
a liquid; covalent crosslinks are ‘fixed’ and, therefore, unable to readjust to the

120
presence of a swelling liquid. Even before swelling, the PSil-CS2-H are a much stiffer
materials than the PSil-CS2. As a result of the longer side chains in the PSil-CS2 than
PDMS and the triatomic crosslinkers, which leave the 3-D networks more flexible
(i.e., the cationic and anionic centers remain paired, but the specific groups
constituting the pairs can change with time and degree of swelling), the swelling ratios
reported here are larger than those from other crosslinked PDMS gels in the same
liquid.166, 178
As mentioned above, the degree of crosslinking can be controlled also by the
amount of the triatomic molecule added to the polymer. Thus, 0.4 equivalents of CS2
were added to 15PSil in order to simulate the degree of crosslinking in fully reacted
(6-7)PSil. Under these conditions, swelling ratios in hexane were 329% for 15PSil-
0.4CS2 and 252% for 15PSil-0.4CS2-H (i.e., the sample of 15PSil-0.4CS2 that was
heated and then swelled). The corresponding (6-7)PSil samples have swelling ratios
in hexane, 362% and 278 %, that are very near these values. From this observation,
we conclude that the ammonium dithiocarbamate crosslinks are not affected in an
important fashion by the presence of free amino groups on the polymer chains.
However, when the nature of the amino groups differ, as they do between (2-4)PSil,
in which each side-chain contains one primary and one secondary amino group, and
15PSil, in which each side chain contains only one primary amino group, the
properties of the partially reacted 15PSil do not match those in which all of the amino
groups of (2-4)PSil are thought to be reacted.

121
3.2.5 Swelling kinetic model and diffusion
Figure 3-24. Time-dependent swelling (blue) and deswelling (red) behaviors of
15PSil-CS2 (filled circles) and 15PSil-CS2-H (open circles) in THF at room
temperature.
Figure 3-25. Time-dependent swelling of (6-7)PSil-CS2 (), 10PSil-CS2 () and
15PSil-CS2 () in hexane at room temperature.

122
To understand the swelling process, the kinetics of swelling and deswelling
behavior of PSil-CS2 has been systematically investigated. 179 , 180 In general, the
swelling process of polymers involves three steps: (1) diffusion of the solvent
molecules into polymer networks; (2) relaxation of the polymer chains due to
salvation by solvent molecules; (3) diffusion of the polymer chains into the solvent.181
Time-dependent swelling and deswelling behaviors of (6-7)PSil-CS2, 10PSil-CS2 and
15PSil-CS2 in CHCl3 are shown in Figure 3-24. Swelling of (6-7)PSil-CS2 is rapid
during the first several minutes and reaches an equilibrium after ca. 2 h; its rate is
faster and, as mentioned above, its equilibrium value is higher than those of (6-7)PSil-
CS2-H. The lower flexibility and mobility of the polymer chains and the smaller
spaces available to liquid molecules between 3-D networks in the permanently
(covalently) crosslinked (6-7)PSil-CS2-H explain both results. It is noted that there is
no rate difference among the three investigated PSil-CS2 in the first several minutes
(Figure 3-26), showing cross-linker densities have no or little impact on the swelling
rate.
3.2.6 Swelling kinetics
dS/dt = ks(Se-S)2 (3-4)
t/S = A+Bt (3-5)
In eq. 3-4, ks is the rate constant and Se and S are the equilibrium swelling ratio and
the swelling ratio at time = t, respectively. Eq. 3-4 can be presented in its integrated
form as eq. 3-5 where A=1/ks ·Se2 is reciprocal of the initial swelling rate and B = 1/Se
is the inverse of the equilibrium swelling ratio.

123
0 50 100 150 200
0.0
0.1
0.2
0.3
0.4
0.5
t/S
t (min)
Figure 3-26. Best linear fits of data in Figure 3-25 according to plots of t/S versus t
for swelling 15PSil-CS2 (black) and 15PSil-CS2-H (blue) by THF at room
temperature.
Schott 182 has proposed a theoretical model for the polymer swelling system,
considering that the swelling follows second-order swelling kinetics. Figure 3-26
displays plots of the reciprocal of the average swelling rate (t/S) versus swelling time
(t), showing a straight linear relation which indicates 15PSil-CS2 and 15PSil-CS2-H
swelling processes follow a second-order swelling model. 183 This result indicates that
there are many types of polymer-solvent interactions occurring in this system.
Therefore the swelling process failed to follow first-order swelling kinetics.173a In eq.
2, the swelling rate depends on the two constants of A and B—the initial rate of
swelling and the equilibrium swelling ratio, respectively. As discussed in section 3.2.4,
the initial swelling rate is related to the relaxation rate of the chain segments in the
polymer networks.
- dS/dt = ks (Se - S) (3-6)

124
ln (1- S/Se) = - Kst (3-7)
Figure 3-27. Rate analysis of the swelling properties of (6-7)PSil-CS2 in THF at room
temperature.
Also, we investigated whether the swelling follow the first-order kinetics as
illustrated by eqs 3-6 and 3-7. The semi-log graph as a fist-order rate analysis swelling
behavior of (6-7)PSil-CS2 was plotted and showed in Figure 3-27. The swelling rate
constants of the gels can be obtained from the slopes of these fitting lines. The linear
correlation of the data was poor especially in the first five minutes, showing that the
swelling process does not follow the first-order kinetics.
3.2.7 Binary system184, 185
Most of the current research concerning swelling and diffusion in cross-linked
polymers has focused on single component solvent systems. From the standpoint of
applications, such as a binary liquid mixture separation by polymer membranes,
swelling investigations in the presence of a binary or multi-component solvent is
important as well. Two theoretical models to describe the swelling of polymer
networks in binary solvents have been developed by Okeowo and coworkers.186 Also,
the Flory-Rehner theory187 has been modified to describe multi-component sorption in
cross-linked polymer films. Here, we report a simple experiment to investigate the

125
selectivity of solvent uptake from dichloromethane and ethanol solvent mixtures in
10PSil-CS2 at room temperature.
0 20 40 60 80 100
0
200
400
600
800
S
wel
ling
Rat
io%
mol % ethanol
Figure 3-28. Swelling ratios of 10PSil-CS2 in CH2Cl2 and ethanol solvent mixtures at
room temperature.
As shown in Figure 3-28, in the 4:6 (mol:mol) CH2Cl2:ethanol mixture, 10PSil-
CS2 was swelled to 310 % its original weight. However, the swelling ratio of 10PSil-
CS2 in solvent mixtures is ca. 200 wt% lower than in a pure CH2Cl2 solvent under
identical condition. Table 3-2 illustrates that 10PSil-CS2 takes up 4.2 times as many
moles of CH2Cl2 as ethanol from an equimolar mixture of CH2Cl2 and ethanol.
The data show that the equilibrium swelling ratio is decreased by the presence of
a ‘bad’ solvent and that 10PSil-CS2 is selective in its uptake of solvents in mixtures.
These results indicate that ability of CH2Cl2 to diffuse into a PSil-CS2 (or other PSil
material) is affected considerably by the presence of ethanol. The most probable cause
for this effect is a decrease in the concentration of the ‘good’ solvent at the surface of
the 10PSil-CS2 rather than a change in the partition coefficient.188

126
Table 3-2. Selectivity tests of sorption of 1:1 (mol:mol) CH2Cl2:CH3CH2OH into
10PSil-CS2 at room temperature.a
Sample status Solvent composition Solvent in polymer
g (mmols)
CH2Cl2
g (mmoles)
CH3CH2OH
g (mmoles)
Molar ratio
CH2Cl2 :
CH3CH2OH
Before adding 10PSil-
CS2 (33.3 mg) 0.52 (6.2) 0.29 (6.2) 1 : 1a
After 10PSil-CS2
swelling: S% = 575%
(225 mg)
0.35 (4.1) 0.26 (5.7) 1 : 1.4a
CH2Cl2 0.17 (2.1)
CH3CH2OH
0.03 (0.5)
a. Calculated from integration of 1H NMR peak areas of protons (indicated in italics)
of CH2Cl2 and CH3CH2OH and adjusted for the different populations per molecule.
3.2.8 Influence of temperatures189
A systematic study of the influence of temperature on the swelling extent of
PDMS networks was reported by Favre,166 in which data were interpreted according
to Arrhenius and Flory-Huggins theories. 190 Here, different swelling ratios were
measured for experiments conducted from 0 oC to 45 oC.
Different swelling ratios of 10PSil-CS2 were obtained from 0 oC to 45 oC, as shown
in Figure 3-29. The swelling ratios increase with increasing temperature. For example,
10PSil-CS2 can take up 320 wt% and 405 wt% of hexane, at 0 oC and 45 oC,
respectively. The 85 wt% uptake indicates that the polysiloxane networks become
more extendable at elevated temperatures, thereby, allowing the uptake of more
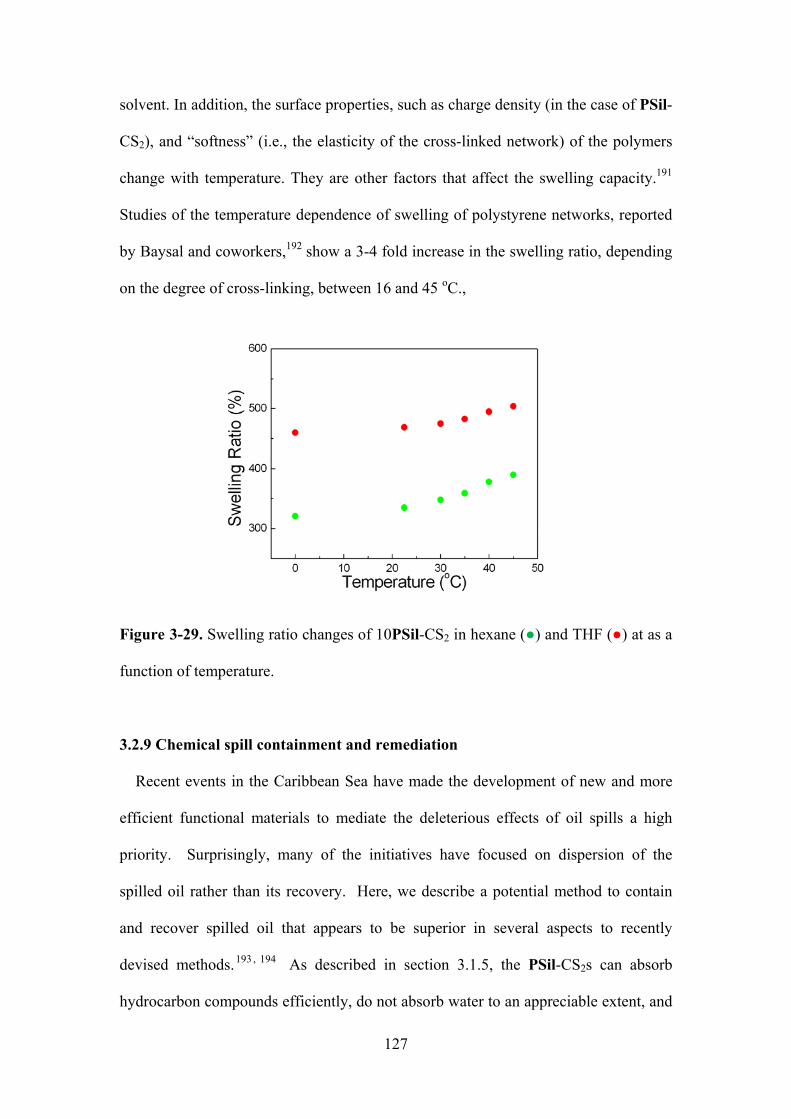
127
solvent. In addition, the surface properties, such as charge density (in the case of PSil-
CS2), and “softness” (i.e., the elasticity of the cross-linked network) of the polymers
change with temperature. They are other factors that affect the swelling capacity.191
Studies of the temperature dependence of swelling of polystyrene networks, reported
by Baysal and coworkers,192 show a 3-4 fold increase in the swelling ratio, depending
on the degree of cross-linking, between 16 and 45 oC.,
Figure 3-29. Swelling ratio changes of 10PSil-CS2 in hexane () and THF () at as a
function of temperature.
3.2.9 Chemical spill containment and remediation
Recent events in the Caribbean Sea have made the development of new and more
efficient functional materials to mediate the deleterious effects of oil spills a high
priority. Surprisingly, many of the initiatives have focused on dispersion of the
spilled oil rather than its recovery. Here, we describe a potential method to contain
and recover spilled oil that appears to be superior in several aspects to recently
devised methods.193 , 194 As described in section 3.1.5, the PSil-CS2s can absorb
hydrocarbon compounds efficiently, do not absorb water to an appreciable extent, and

128
are less dense than water. Therefore, a potential application of the PSil-CS2 systems is
the recovery of chemicals and/or crude oil spilled in bodies of water. 195 Here, the
swelling capabilities of 10PSil-CS2 with gasoline (I), naphtha (II), and xylol (III)
have been investigated. The S (wt%) values are ca. 205% (I), 240% (II), and 235%
(III), respectively. Under ambient conditions (room temperature in the air), a naphtha-
swelled 10PSil-CS2 polymer was able to be scooped out with a spatula, and placed on
a piece of filter paper. It lost solvent gradually and returned to its original weight in ca.
3h. Elevating the temperature to 50 oC or placing the naphtha-swelled 10PSil-CS2
polymer under reduced pressure (250 Torr) at ambient temperature, the 10PSil-CS2
returned to its unswelled weight in ca. 15 min or 45 min, respectively. To mimic the
real scenario of a chemical spill in water, a demonstration of how such a system can
be employed is shown in Figure 3-30. Furthermore, this swelling/deswelling cycle has
been repeated three times without significant loss of swelling capacity (Figure 3-31).
Figure 3-30. Photographs of water (1.05g) and 87 octane gasoline (0.2g) mixture
(left), and after adding 10PSil-CS2 (60 mg) into the mixture for 30 min (middle). The
top gasoline layer is indicated by an added dye, perylene. The swelling ratio is ca. 208
wt %. As indicated by the photographs above the arrow, the width of the 10PSil-CS2
sample before and after swelling is ca. 0.50 and 0.75 cm, respectively. Swelled PSil

129
was removed from the mixture and only a small amount of gasoline could be observed
in the vial (right). The appearances of 10PSil-CS2 before (left) and after (right)
swelling are shown in the photographs above the arrows.
0
50
100
150
200
250
321
sw
ellin
g ra
tio (w
t%)
Cycles
Figure 3-31. Three swelling/deswelling cycles of 38 mg 10PSil-CS2 by 0.75 g
naphtha (II) in a layer over 1.5 g water.
3.2.10 Conclusions
We present a detailed study of PSil-CS2 and PSil-CS2-H swelling properties and
their swelling/deswelling kinetic behavior. The polymer swelling is dependent on
polymer chain relaxation and solvent molecule diffusion. The swelling processes of
PSil-CS2 and PSil-CS2-H followed Schott’s second-order diffusion kinetics which is
based on the stress-relaxation model for polymer chains. Swelling investigations in a
binary solvent system show that the equilibrium swelling ratio of a ‘good’ is
decreased by the presence of a second ‘poor’ solvent and that the PSil-CS2 display
selective uptake from the mixture. In addition, we demonstrate how a potential
application for recovery by PSil-CS2 polymers of chemicals and crude oil on water
surfaces might function. These polymers are easily prepared and exhibit the ability to

130
uptake selectively chemicals from water. Also, the PSil-CS2 can be recovered and
used multiple times for this purpose. We believe this is a promising method for the
containment and remediation of oil or chemical spills from aqueous layers.
Future work will focus on determining the nature of the diffusion process by
using the Fickian diffusion model.196 To do so will require in situ monitoring of the
uptake by the polymer gels.
4. SYNTHESES OF CYCLIC CARBONATES IN REUSABLE, REVERSIBLE
ROOM-TEMPERATURE IONIC LIQUIDS
4.1 Introduction
Due to the growing concern about the deleterious effects of greenhouse gases on
our environment, chemical fixation of CO2 and its use as an inexpensive, single
carbon atom building block have gained considerable attention during last two
decades. 197 From the standpoint of resource utilization, the syntheses of five-
membered cyclic carbonates from CO2 and epoxides (Eqs. 4-3~4-6) is a promising
methodology because cyclic carbonates are widely used for a variety of applications,
such as polar aprotic solvents, precursors of polymeric materials, and intermediates in
the syntheses of pharmaceuticals. 198 , 199 , 200 Numerous catalysts, including metal
halides, metal oxides, and metal complexes have been developed and investigated to
facilitate the reactions. 201 However, the problem of how to separate easily the
products from the solvents and catalysts after reaction still needs to be solved. Also,
the nature of the solvent can be a critical element in the ease of reaction.202
Although ionic liquids, by themselves, are not necessarily ‘greener’ than other
solvents, they can offer intrinsic advantages in catalytic reactions over many other
organic solvents in reactions involving CO2,203 especially in the steps leading to

131
isolation of the products and to minimize byproducts such as polycarbonates204 or
polyesters.205 In addition, high temperatures (>100 oC) and high pressures of CO2 are
generally required to obtain high yields of cyclic carbonates from epoxides.206, 207
The reversibility of the RTILs described in sections 2.2, 2.3 and 2.4 offer
significant potential benefits as solvents in the syntheses and separations of products
which are soluble in low-polarity media and whose mechanisms of formation depend
on catalysts soluble only in high-polarity media.
Here a prototype reaction, the synthesis of cyclic carbonates by addition of CO2
to epoxides, utilizing the in situ-reversibility of the RTILs, is described. Amidinium
carbamate RTILs (L-amine-C) were prepared as described previously.3a For
comparison purposes, amidinium dithiocarbamates were employed as the RTILs208 in
some experiments. Reaction between CO2, present at 25-50 atmospheres of pressure,
and a number of epoxides in the RTILs, occurs in good yields (> 90% in many cases)
at ambient or slightly elevated temperatures in the presence of an amidinium halide
catalyst. The cyclic carbonate products and any remaining epoxide could be extracted
easily upon addition of an immiscible, lower density liquid (an alkane or ether) to an
RTIL reaction mixture. Protracted bubbling of CO2 through the L-amine-C was
sufficient to remove any dissolved extracting liquid so that the RTIL could be reused.
Thereafter, another substrate was added and its reaction was conducted as before. The
influence of the type of catalyst, CO2 pressure, reaction time and temperature on the
reaction yields will be reported.

132
ROR
OO
OR1 X
RO
X
RO
X
CO2
R
X
O
O
O
A
Catalyst
Scheme 4-1. Reaction mechanism for carbonate syntheses from epoxides and CO2.
Importantly, these reversible RTILs can be used repeatedly with little or no
decrease of product yield, and no metal catalyst need be employed. The relatively
mild reaction conditions, ease of separation of products from the L-amine-Cs, and the
ability to use the L-amine-Cs repeatedly make this an attractive alternative to other
procedures for the syntheses of cyclic carbonates. In addition, this reaction
demonstrates a beneficial use of CO2, a greenhouse gas.
4.2 Materials.
Epichlorohydrin (99%), 1,2-epoxy-3-phenoxypropane (99%), styrene oxide (97%),
cyclohexene oxide (98%), tetraethylammonium bromide (98%) and lithium bromide
(>99%) were purchased from Sigma-Aldrich and used as received. Carbon dioxide
(CO2) was supplied by GT & S with a purity > 99.9%. Sodium bromide (99.9%), zinc
chloride (99.2%) and Zinc iodide (99.9%) were from Fisher. Zinc Bromide (99.9%)
was from Baker. Hydrochloric acid (HCl, 99%, 37 wt% in water), hydroiodic acid (HI,
99.95%, 57 wt% in water), hydrobromic acid (HBr, 99.9%, 48 wt% in water) are from
Baker. CH3CN was dried by 4A molecular sieve before using. All organic solvents

133
were HPLC grade (Fisher or Aldrich). Other chemicals have been reported in section
2.1.2.3a, b
4.3 Instrumentation.
Unless stated otherwise, all instruments are the same as described in section 2.1.3.
High pressure generators (Model: 50-6-15; Pressure rating: 15,000 psi; Capacity per
stroke: 20 mL), valves and tubings were purchased from High Pressure Equipment
Company (HIP), Pennsylvania. The pressure gauge was purchased from McDaniel
Controls, Inc. (Ni Span C Tube 316SS Socket, 0-25000 psi). A stainless steel reaction
cell with three quartz windows was manufactured at the University of Buenos Aires
under the supervision of Prof. Pedro F. Aramendía and Prof. Laura Japas. The
apparatus was assembled with the help of Dr. Rodrigo Cristiano and is shown in
Figure 4-1. The highest pressure achieved using a gas cylinder was 80.2 atm
Super-ambient temperatures are achieved with four cartridge electric heating
elements and a rheostat in a system designed by Mr. William Craig (shown in Figure
4-1 upper right). Temperature is monitored by an Omega HH503 microprocessor
thermometer connected to a J-K-T thermocouple. The temperature variation
throughout the cell is estimated to be ca. 1.5 oC based upon measurements of the
internal and external temperatures of the cell at various points.

134
Figure 4-1. High pressure CO2 generator and reaction cell (upper left) and
temperature control setup (upper right). The reaction cell is indicated by the arrow in
both figures. The layout of the components of the high pressure instrument is shown
in the diagram at the bottom.
4.4 General experimental procedure
Procedure for the syntheses of cyclic carbonates:
A typical reaction procedure is described for the synthesis of 4-phenoxymethyl-
1,3-dioxolan-2-one (2b) from CO2 and 1,2-epoxy-3-phenoxy propane (2a) using

135
LiBr as a catalyst in C6-hexylamine-CO2 ionic liquid, as shown in eq 4-4. Cn-HX
catalyst was used in an analogous fashion for this reaction. In all cases, 1H, 13C NMR
and MS spectra of the products were consistent with those in the literature.
In an open glass vial with a 1 cm teflon stir bar, LiBr (1.2 mg, 1.4×10⁻² mmol) was
added to a solution of 1,2-epoxy-3-phenoxypropane (2a) (0.10 g, 0.70 mmol) in 0.50
mL of C6-hexylamine-CO2 ionic liquid, prepared by bubbling CO2 through a
C6/hexylamine mixture for 10 min. The glass vial was placed into the stainless steel
high pressure cell. Then, CO2 gas was introduced to a suitable pressure and
temperature. After stirring the reaction mixture for several hours, the pressure was
brought slowly back to one atmosphere and diethyl ether (3.0 mL×3) was used to
extract the products and any unreacted epoxide from the reaction mixture. To purify
the product, in some cases, the residues after removal of the combined etherates under
vacuum were analyzed and separated by column chromatography using 2:3
hexane:EtOAc as the eluent. Product yields were calculated from the weight of the
residues (which were a combination of product and starting material whose proportion
was calculated by integration of characteristic peaks in 1H NMR spectra Some of the
reactions were repeated and the reproducibility of the yields was ± 3%. In a few runs,
the yield was calculated by the weight of isolated product after column
chromatography.
4-Phenoxymethyl-1,3-dioxolan-2-one (2b): 1H NMR: 4.15 (dd, J = 3.6, 3.6 Hz 1H,
OCH2), 4.24 (dd, J = 4.4, 4.4 Hz 1H, OCH2), 4.55 (dd, 1H, PhOCH2), 4.62 (t, J = 8.4
Hz, 1H,PhOCH2), 5.03 (m, 1H,OCH), 6.91 (d, J = 8.8Hz, 2H, Ph), 7.02 (t, J = 8.0
Hz,1H, Ph), 7.31 (t, J = 8.0 Hz, 2H, Ph); 13C NMR: δ 66.25, 66.88, 74.03, 114.55,
122.03, 129.70, 154.57, 157.73 ppm; IR:1786 cm-1 (C=O); MS (m/z 194, M+).

136
4-Chloromethyl-1,3-dioxolan-2-one (1b): 1H NMR: d = 3.75 - 3.81 (m, 2 H, ClCH2),
4.41 (dd, J = 6.0, 9.0 Hz, 1 H, OCH2), 4.59 (dd, J = 8.4, 9.0 Hz, 1H, OCH2), 4.93 –
4.96 (m, 1 H, CHO); 13C NMR: δ 43.71, 66.90, 74.35, 154.30 ppm; IR: 1786 cm-1
(C=O); MS (m/z 137 M+).
4-Phenyl-1,3-dioxolan-2-one (3b): 1H NMR: d = 4.36 (t, J = 8.4 Hz, 1 H, OCH2), 4.82
(t, J = 8.4 Hz, 1 H, OCH2), 5.72 (t, J = 8.4 Hz, 1 H, OCH), 7.36 (m, 2 H, Ph), 7.44 (m,
3 H, Ph); 13C NMR: δ 71.15, 77.97, 125.85, 129.25, 129.75, 135.80, 154.76 ppm; IR:
1780 cm-1 (C=O); MS (m/z 164 M+).
4,5-Tetramethylene-1,3-dioxolan-2-one (4b): 1H NMR: d = 4.65 – 4.70 (m, 2 H,
CHO), 1.86 – 1.90 (m, 4 H, CH2CHO), 1.58–1.64 (m, 2 H, CH2CH2), 1.38–1.44 (m, 2
H, CH2CH2); 13C NMR: δ 19.13, 26.75, 75.67, 155.27 ppm; IR: 1790 cm-1; MS (m/z
142 M+).
Procedure for the synthesis of C6-HX
R N N(CH3)2
HR N N(CH3)2
HX
X=Cl, Br or IR= C6H13
(4-1)
X
The reaction scheme for C6-HX preparation is shown in eq. 4-1. A detailed
example is presented for the synthesis of dried C6-HBr. C6-HCl and C6-HI were
prepared in analogous fashions using 37% aqueous HCl and 57% aqueous HI. To a
solution of C6 amidine (0.34 g, 2.0 mmol) in a stirred round bottom flask, 48%
aqueous HBr (0.69 g, 4.0 mmol HBr) was added dropwise. After stirring the reaction
mixture for 2 h at room temperature, the water component was removed on a rotary
evaporator. The residue was placed in a vacuum oven at 250 Torr and 50 oC for 48 h.

137
In some reactions, the ‘wet’ (undried) catalysts were employed as well (see below).
Yield 0.79 g (95%) of a yellowish liquid; 1H NMR (CDCl3): 3.56 (t, 2H, -CH2-N=);
3.50 (s, 3H, -N-(CH3)2); 3.30 (s, 3H, -N-(CH3)2); 2.15 (s, 3H, -N=C(CH3)-N); 1.43 (m,
2H, -CH2-CH2-N=); 1.15-1.2 (m, 6H,CH3-(CH2)3-); 0.72 (t, 3H, CH3). 13C NMR
(D2O): 164.56; 44.31; 40.57; 37.95; 30.57; 29.09; 25.26; 21.78; 13.92 ppm; MS(m/z
172 M–Cl+); IR: 1646 cm-1 (C=N+).
C6-HCl: Yield: 88% of a yellowish liquid; 1H NMR (CDCl3): 3.52 (t, 2H, -CH2-N=);
3.50 (s, 3H, -N-(CH3)2); 3.22 (s, 3H, -N-(CH3)2); 2.16(s, 3H, -N=C(CH3)-N); 1.45 (m,
2H, -CH2-CH2-N=); 1.15-1.23 (m, 6H, CH3-(CH2)3-); 0.73 (t, 3H, CH3). 13C NMR
(CDCl3): 164.73; 44.48; 40.67; 37.88; 30.68; 29.21; 25.32; 21.86; 13.99 ppm;
MS(m/z 172 M–Br+); IR: 1646 cm-1 (C=N+).
C6-HI: Yield: 85% of a dark orange color solid, mp 33.5-34.8 ºC; 1H NMR (CDCl3):
3.54 (t, 2H, -CH2-N=); 3.52 (s, 3H, -N-(CH3)2); 3.30 (s, 3H, -N-(CH3)2); 2.17 (s, 3H, -
N=C(CH3)-N); 1.46 (m, 2H, -CH2-CH2-N=); 1.18-1.23 (m, 6H,CH3-(CH2)3-); 0.74 (t,
3H, CH3). 13C NMR (CDCl3): 164.66; 44.49; 40.63; 37.82; 30.78; 29.28; 25.38; 21.88;
14.05 ppm; MS(m/z 172 M–I+); IR: 1646 cm-1 (C=N+).
Procedure for recycling test
The recycling procedure is illustrated in Scheme 4-3. LiBr 1.2 mg (1.4×10⁻²
mmol) was added to a solution of 1,2-epoxy-3-phenoxypropane (2a) 0.10g (0.70
mmol) in 0.50 mL of C6-hexylamine-CO2 ionic liquid in a glass vial,. The glass vial
was placed into the stainless steel high pressure cell. Then CO2 (25 atm) was
introduced to a suitable pressure and temperature was maintained at room temperature
or 50 oC. After 8 h, diethyl ether (3.0 mL×3) was used to extract products from the
reaction mixture. CO2 at 1 atm was bubbled into the solvent for 10 min to regenerate
the RTIL and to remove any residual ether; according to 1H NMR spectra, no ether
138
remained after this procedure. Then, same amount of 1,2-epoxy-3-phenoxypropane
(2a) was added to the reaction mixture again to start the next cycle.
Procedures for attempted polymerization of cyclohexene oxide
Attempted polymerization in CH3CN: In an open glass vial with a 1 cm teflon stir bar,
C6-HBr (10 mg, 4.0×10⁻⁵ mol) was added to a solution of cyclohexene oxide (3a)
(0.20 g, 2.0×10⁻³ mol) in 0.25 mL of CH3CN. The glass vial was placed into the
stainless steel high pressure cell under 25 atm CO2 gas and the temperature was
increased to 50 oC. After stirring the reaction mixture for 24 h, and returning the
vessel to room temperature, the pressure was brought slowly back to one atmosphere.
The reaction mixture was added to 5.0 mL of water and the aqueous phase was
extracted with diethyl ether (5.0 mL × 3). The organic phases were combined, and
dried with anhydrous sodium sulfate. The volatile materials were removed on a rotary
evaporator and the residue was placed under a house vacuum (250 Torr) at 50 oC for
24 h to remove any remaining solvent before characterization by FTIR and NMR (see
below).
Attempted polymerization in solvent-free conditions. In an open glass vial with a 1 cm
teflon stir bar, C6-HBr (10 mg, 4.0×10⁻⁵ mol) as a solute, was added to a solution of
cyclohexene oxide (3a) (0.20 g, 2.0×10⁻³ mol). The glass vial was placed into the
stainless steel high pressure cell under 25 atm CO2 gas and the temperature was
increased to 50 oC. After stirring the reaction mixture for 24 h and returning the vessel
to room temperature, the pressure was brought slowly back to one atmosphere. The
reaction mixture was added to 5.0 mL of water and the aqueous phase was extracted
with diethyl ether (5.0 mL × 3). The organic phases were combined, and dried with
anhydrous sodium sulfate. The volatile materials were removed on a rotary evaporator
and the residue was placed under a house vacuum (250 Torr) at 50 oC for 24 h to

139
remove any remaining solvent before characterization by NMR and FTIR (see below).
GC response factor calculations
Fi(R-molar) = (arearefer/molrefer)/(areacomp/molcomp) (4-2)
The response factor was calculated according to eq 4-2. 209 Here, arearefer and
areacomp are the areas of the peaks of a reference compound (biphenyl) and 2a or 2b,
respectively. Molrefer and molcomp represent the known (by preparation) concentrations
of the biphenyl and 2a or 2b, respectively. From a plot of area ratios versus
composition ratios in samples with known amounts of each (Figure 4-2), Fi
(biphenyl/2b) = 1.18 (R2 = 0.998) and Fi (biphenyl/2a) = 1.20 (R2 = 0.999) were
calculated.
0.0 0.2 0.4 0.6 0.8 1.0 1.2 1.40.0
0.2
0.4
0.6
0.8
1.0
1.2
1.4
1.6(a)
Rat
io fr
om G
C
Weighted ratio

140
0.0 0.5 1.0 1.5 2.0 2.5 3.00.0
0.5
1.0
1.5
2.0
2.5
3.0
3.5
4.0
(b)
Rat
io fr
om G
C
Weighted ratio
Figure 4-2. Linear fit of weight and GC peak ratios for biphenyl/2b (a) and
biphenyl/2a (b). The respective formulas are: Y = -0.02 + 1.18X for (2a) and Y = 0.01
+ 1.20X for (2b).
4.5 Results and discussion
In this study, three mono-substituted epoxides—epichlorohydrin (1a), 1,2-epoxy-
3-phenoxypropane (2a), styrene oxide (3a)—and one sterically hindered disubstituted
epoxide, cyclohexene oxide (4a), have been used as substrates, and the reactions are
shown in Scheme 4-3. The miscibility tests described in section 2.3 show that both
hexane and diethyl ether are almost completely immiscibille with our RTILs.
Therefore, these two solvents were selected to extract products from the RTILs in our
experiments. These reactions were carried out from room temperature to 50 oC, which
are much lower than the temperatures reported for the syntheses of cyclic carbonates
from epoxides and CO2 in almost all literature examples.197 However, very recently,
Endo and coworkers reported that an amidine-mediated system, MTHP-CO2 is
capable of catalyzing cyclic carbonate syntheses.210 In their case, the amidine was a
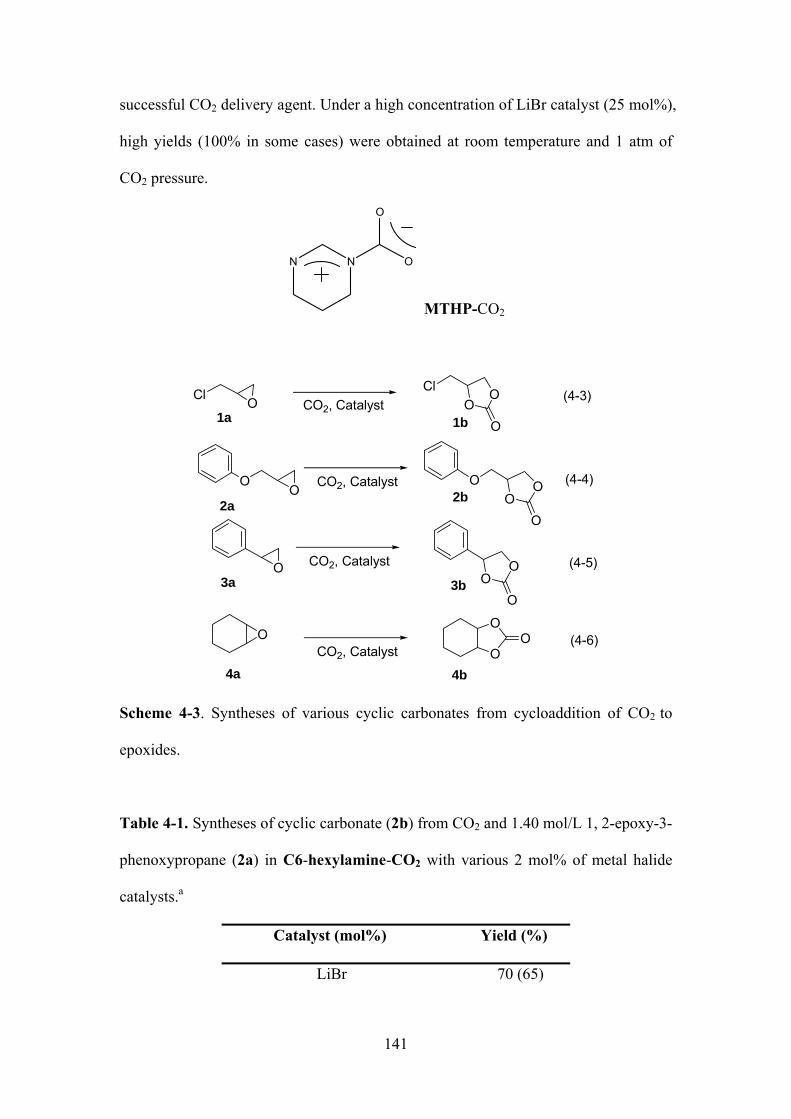
141
successful CO2 delivery agent. Under a high concentration of LiBr catalyst (25 mol%),
high yields (100% in some cases) were obtained at room temperature and 1 atm of
CO2 pressure.
N N O
O
MTHP-CO2
Cl O CO2, CatalystCl
OO
O
OO
OO
O
O
OO
OO
OO
O
O
CO2, Catalyst
CO2, Catalyst
CO2, Catalyst
1a 1b
4a 4b
3a
2a 2b
3b
(4-3)
(4-4)
(4-5)
(4-6)
Scheme 4-3. Syntheses of various cyclic carbonates from cycloaddition of CO2 to
epoxides.
Table 4-1. Syntheses of cyclic carbonate (2b) from CO2 and 1.40 mol/L 1, 2-epoxy-3-
phenoxypropane (2a) in C6-hexylamine-CO2 with various 2 mol% of metal halide
catalysts.a
Catalyst (mol%) Yield (%)
LiBr 70 (65)

142
Et4NBr 62
NaBr 24
ZnBr2 67 (64)
ZnCl2 45
ZnI2 38
No catalyst 0
a Time = 12 h; T = 50 oC; Pco2 = 40 atm. Yields by 1H NMR spectroscopy or
isolated by column chromatography (in parentheses).
The catalytic activities of various salt catalysts in our RTILs were evaluated and
results are listed in Table 4-1. When the anion is the same (Br-), Li+ is the most
efficient of the cations examined. Although Zn2+ is a stronger Lewis acid than Li+,211
its catalytic activity is lower here. The type of anion is important to the yield as well.
Of the catalysts with Zn2+ as the cation, the one with Br- shows the highest catalytic
activity. Polarity of the salts and their solubility in RTILs may also affect the reaction
yields. These results are consistent with literature results that indicate the lithium salt
has higher catalytic activity under these conditiions.212 Note that no reaction occurs in
the absence of a catalyst. Also, no byproducts, such as polycarbonates or polyesters,
were detected by GC-MS in the isolated products by column chromatography.213 The
limit of detectability of the GC-MS is ≤ 0.1%.
Table 4-2. Substrate (1.40 mol/L) reactivity under the same reaction conditions in C6-
hexylamine-CO2 as solvent in cycloaddition reactiona
Catalyst (mol%) Epoxides Products Yield (%)
LiBr (2 %) 1a 1b 75
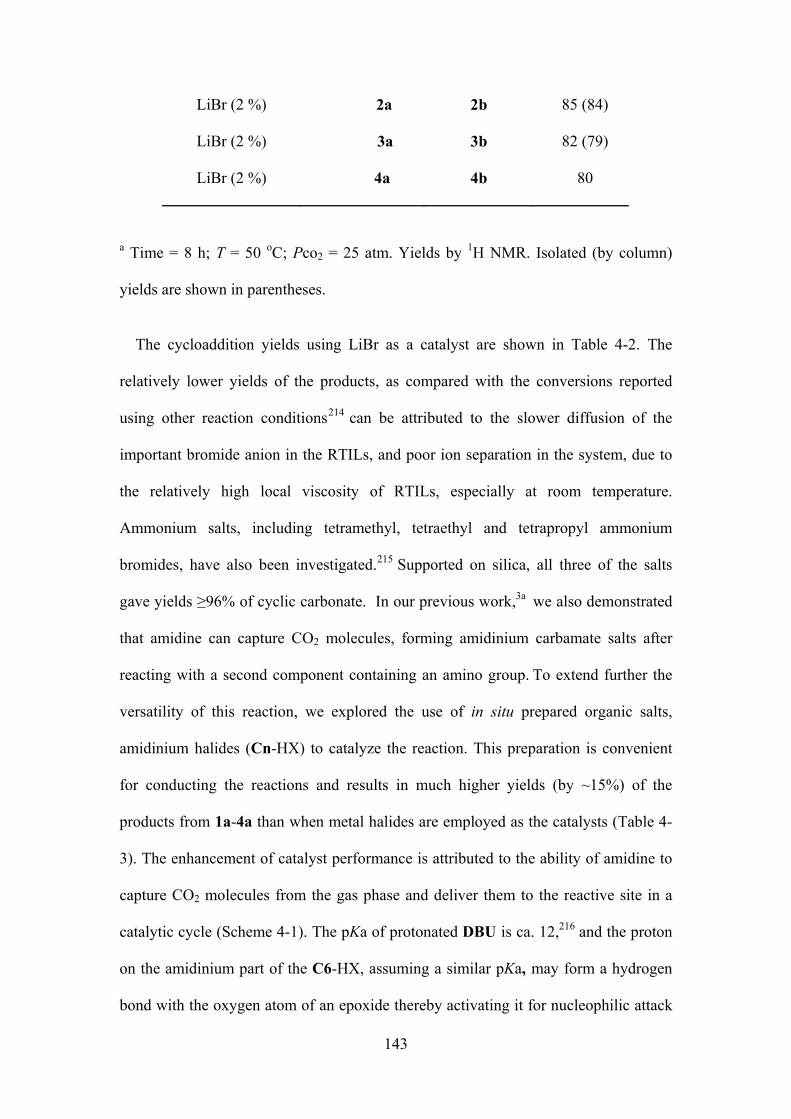
143
LiBr (2 %) 2a 2b 85 (84)
LiBr (2 %) 3a 3b 82 (79)
LiBr (2 %) 4a 4b 80
a Time = 8 h; T = 50 oC; Pco2 = 25 atm. Yields by 1H NMR. Isolated (by column)
yields are shown in parentheses.
The cycloaddition yields using LiBr as a catalyst are shown in Table 4-2. The
relatively lower yields of the products, as compared with the conversions reported
using other reaction conditions214 can be attributed to the slower diffusion of the
important bromide anion in the RTILs, and poor ion separation in the system, due to
the relatively high local viscosity of RTILs, especially at room temperature.
Ammonium salts, including tetramethyl, tetraethyl and tetrapropyl ammonium
bromides, have also been investigated.215 Supported on silica, all three of the salts
gave yields ≥96% of cyclic carbonate. In our previous work,3a we also demonstrated
that amidine can capture CO2 molecules, forming amidinium carbamate salts after
reacting with a second component containing an amino group. To extend further the
versatility of this reaction, we explored the use of in situ prepared organic salts,
amidinium halides (Cn-HX) to catalyze the reaction. This preparation is convenient
for conducting the reactions and results in much higher yields (by ~15%) of the
products from 1a-4a than when metal halides are employed as the catalysts (Table 4-
3). The enhancement of catalyst performance is attributed to the ability of amidine to
capture CO2 molecules from the gas phase and deliver them to the reactive site in a
catalytic cycle (Scheme 4-1). The pKa of protonated DBU is ca. 12,216 and the proton
on the amidinium part of the C6-HX, assuming a similar pKa, may form a hydrogen
bond with the oxygen atom of an epoxide thereby activating it for nucleophilic attack

144
during the reaction. Note also that commercially available amidines, such as DBU,
can be used as amidinium catalysts. As shown in Table 4-4, C6-HBr and C6-HI are
better catalysts than C6-HCl in this system, indicating the substitution in the
amidinium salt of a Cl ion by a more nucleophilic Br or I ion would yield better
results such as an increase of reaction rate.217 Given the experimental error of the
operation, it is difficult to compare the catalytic activity of C6-HBr and C6-HI.
Table 4-3. Syntheses of cyclic carbonates with C6-HBr (2 mol%) as catalyst in
RTILsa and CH3CN.b
Epoxide Product Yield (%)
in RTILc
Yield (%)
in CH3CNc
1a 1b 94 91
2a 2b 98 96
3a 3b 99 96
4a 4b 91 90
a Time = 8 h; T = 50 oC; Pco2 = 25 atm; C6-hexylamine -CO2: 0.5 mL; concentration
of 1a-4a: 1.40 mol/L .
b Time = 8 h; T = 50 oC; Pco2 = 25 atm; CH3CN: 0.5 mL; concentration of 1a-4a:
1.40 mol/L.
c Yields determined by GC-MS a using biphenyl as an internal standard.
Table 4-4. Syntheses of cyclic carbonate 2b from 1.40 mol/L 2a with 2 mol% dry and
‘wet’ amidinium halide (C6-HX) catalysts.a,b
Catalyst Yield (%) Yield (%)

145
from dry catalyst from wet catalyst
C6-HCl 90 82
C6-HBr 98 87
C6-HI 99 90
a Time = 8 h; T = 50 oC; Pco2 = 25 atm; 0.5 mL C6-hexylamine-CO2. Yields
determined by GC-MS using biphenyl as an internal standard.
b See Experimental section 4.4 on page 135 for a description of the dry and wet
catalysts.
In addition, the amidinium halide, prepared by the addition of C6 to an equimolar
amount of an HX (X = Cl, Br, and I) as a concentrated aqueous solution, was used as
the catalyst for the conversion of 2a to 2b. Other procedures were the same as those
described on page 134. As shown in Table 4-4, the yields of 2b with ‘wet’ C6-HX
were ca. 8-11 % lower than when 2 mol% of dry C6-HX were employed. Specifically,
the yield difference under dry and ‘wet’ C6-HCl conditions is ca. 8% while the
differences under C6-HBr and C6-HI are 11% and 9%, respectively. Because the
experimental error of the yields in these experiments was ± 3%, water has about the
same impact on the catalytic activities of each of the C6-HX and does not affect
significantly the yield of cyclo adduct. Also, the trend of the ‘wet’ Cn-HX catalytic
activities are the same as those of the dry catalysts: in both sets, C6-HI or C6-HBr is a
better catalyst than C6-HCl. These results demonstrate that the L-amine-C medium
remains effective even in the presence of water. As mentioned on page 21, the
presence of 3 wt% H2O in a C6/LeuC1 mixture did not impede formation of the L-N-
C upon exposure to CO2. It is known from reaction between wet DBU and CO2 that

146
[DBUH]+HCO3- (shown below) is formed. 218 Analogous reactions, resulting in
amidinium bicarbonate salts from a Cn amidine and water, must occur and
bicarbonate rather than CO2 may be involved in the formation of the cyclic carbonates;
it has been reported that 0.3 equivalents of water promoted the syntheses of cyclic
carbonates from CO2 and epoxides.219 As shown in ref 错误!未定义书签。, a water
molecule and the anion of a Lewis base (PPh3BuI) can play a synergistic role in
opening an epoxy ring and in stabilizing the carbonate intermediates. Thus, a 95%
yield of the cyclic carbonate from reaction of styrene oxide under 20 atm of CO2 at
125 oC for 1 h in the presence of water and only 25 % in its the absence.
N
N
DBUH + HCO3-
H
HCO3
The influence of CO2 pressure on reaction yields were compared using LiBr and
C6-HBr as the catalyst. As shown in Table 4-5, the carbonate yield increased with
increasing pressure from 0 atm to 20 atm CO2. However, the yields decreased as
pressure was increased further to 60 atm. Similar trends have been reported and
explained in other media used to effect CO2 cycloadditions.220 The initial increase of
yield as pressure is increased between 0 and 20 atm can be attributed to the increase in
CO2 concentration within the RTIL; the decreases in yield experienced at yet higher
pressures is presumably a consequence of dilution of the substrate and catalyst as they
are partitioned between the RTIL and a pre-supercritical phase of CO2221 that
dissolves some of the reactant throughout the total volume of the stainless steel cell.222

147
In other words, excessive CO2 pressure causes a low concentration of epoxide in the
vicinity of the catalyst and hinders their interaction, resulting in a lower yield. In the
experiments conducted here, a small amount of liquid was observed outside the glass
vial after the reactions, especially in the cases with higher pressures of CO2; CO2 can
extract reaction liquids out of the vial under high pressures. 223 Although the
reproducibility of the yields in these experiments was ± 3%, the trend of the yields
changed at different CO2 pressures (Table 4-5) is still obvious: the highest yields were
obtained at 25 atm of CO2,
Table 4-5. Influence of CO2 pressure on the yields of cyclic carbonate 2b in C6-
hexylamine-CO2.
Entry Pressure (atm) Yield (%)a Yield (%)b
1 1 0 0
2 10 78 81
3 20 80 87
4 25 85 98
5 40 80 93
6 50 76 90
7 60 69 86
a Time = 8 h; T = 50 oC; LiBr (2 mol%), 2a (1.40 mol/L), and yields were determined
by 1H NMR.
b Time = 8 h; T = 50 oC; C6-HBr (2 mol%), 2a (1.40 mol/L), and yields were
determined by 1H NMR.

148
The yield of carbonate product 3b in the cycloaddition reaction was investigated as
a function of reaction time. As expected, longer reaction times resulted in increased
yields of cyclic carbonate. For example, the yield reached 92 % when the reaction
time was extended to10 h. Particularly, during the first 5 h, the yield increased rapidly
and gradually reached a plateau value after 12 h (Figure 4-3).
0 5 10 15 20 25
20
40
60
80
100
Yie
ld (%
)
Reaction time (h)
Figure 4-3. Influence of time on the yield of cyclic carbonate 3b from 1.40 mol/L 3a
in C6-hexylamine-CO2 at 50 oC, 25 atm of CO2 using 2mol% of LiBr () or C6-HBr
() as catalyst. Yields were calculated by 1H NMR.
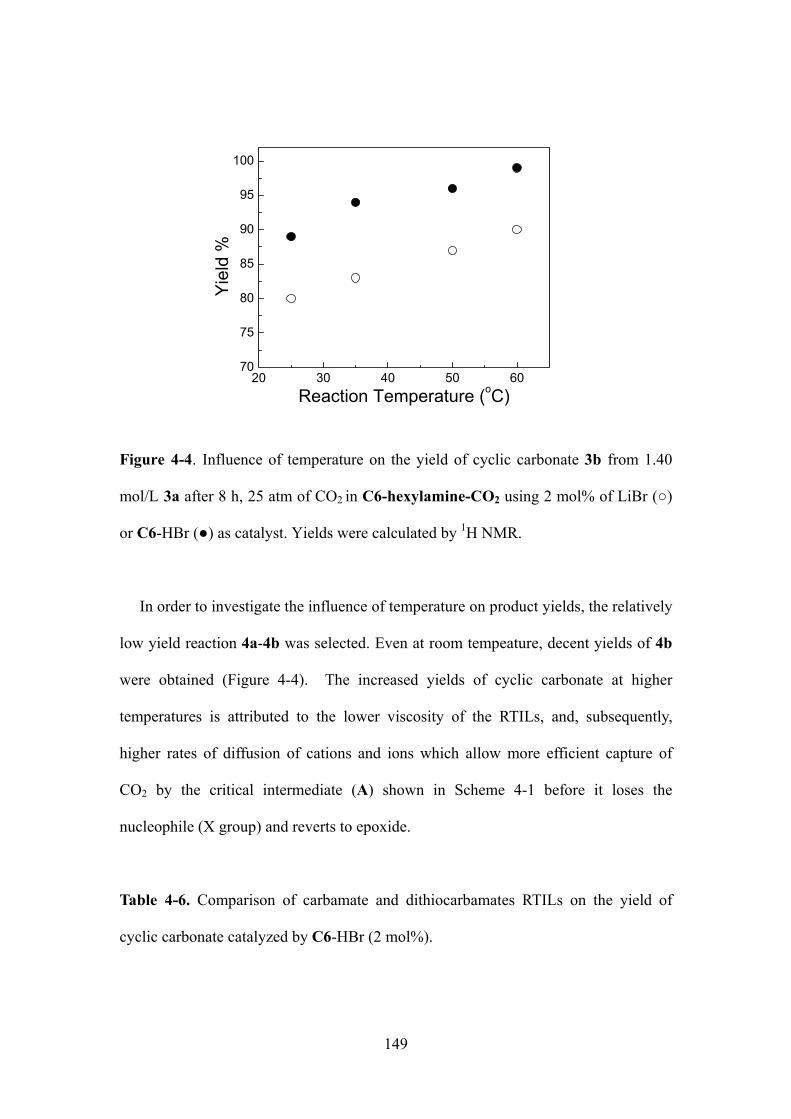
149
20 30 40 50 6070
75
80
85
90
95
100
Yie
ld %
Reaction Temperature (oC)
Figure 4-4. Influence of temperature on the yield of cyclic carbonate 3b from 1.40
mol/L 3a after 8 h, 25 atm of CO2 in C6-hexylamine-CO2 using 2 mol% of LiBr ()
or C6-HBr () as catalyst. Yields were calculated by 1H NMR.
In order to investigate the influence of temperature on product yields, the relatively
low yield reaction 4a-4b was selected. Even at room tempeature, decent yields of 4b
were obtained (Figure 4-4). The increased yields of cyclic carbonate at higher
temperatures is attributed to the lower viscosity of the RTILs, and, subsequently,
higher rates of diffusion of cations and ions which allow more efficient capture of
CO2 by the critical intermediate (A) shown in Scheme 4-1 before it loses the
nucleophile (X group) and reverts to epoxide.
Table 4-6. Comparison of carbamate and dithiocarbamates RTILs on the yield of
cyclic carbonate catalyzed by C6-HBr (2 mol%).

150
C6H13 N N(CH3)2
H
O CO
NH
C6H13(a)
C6H13 N N(CH3)2
H
S CS
NH
C6H13(b)
Epoxide Product Yield (%)
(carbamate) a
Yield (%)
(dithiocarbamate)b
1a 1b 95 75
2a 2b 97 82
3a 3b 97 77
4a 4b 93 72
a Time = 8 h; T = 50 oC; Pco2 = 25 atm; RTIL (a) C6-hexylamine-CO2; 1a-4a (1.40
mol/L), and yields were determined by 1H NMR.
b Time = 8 h; T = 50 oC; Pco2 = 25 atm; RTIL (b) C6-hexylamine-CS2; 1a-4a (1.40
mol/L), and yields were determined by 1H NMR.
According to our previous studies,208 RTILs prepared by adding CS2 (L-amine-S)
to amidine/amine mixtures usually have higher viscosities and better thermal
stabilities than their CO2 analogues (L-amine-C). However, as a result of their lower
viscosities, the amidinium carbamate results in higher product yields (Table 4-6). The
differences between the polarities of amidinium carbamate and dithiocarbamate
RTILs (Table 2-14) are very small, and apparently do not play an important role here.
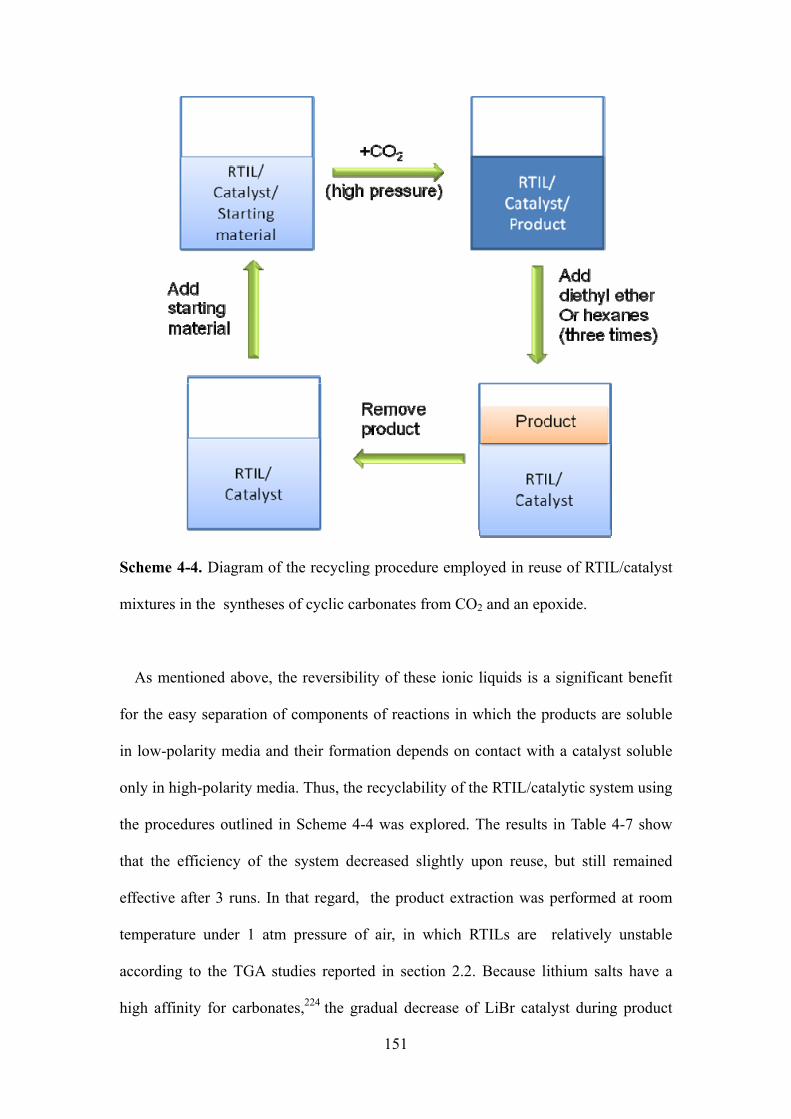
151
Scheme 4-4. Diagram of the recycling procedure employed in reuse of RTIL/catalyst
mixtures in the syntheses of cyclic carbonates from CO2 and an epoxide.
As mentioned above, the reversibility of these ionic liquids is a significant benefit
for the easy separation of components of reactions in which the products are soluble
in low-polarity media and their formation depends on contact with a catalyst soluble
only in high-polarity media. Thus, the recyclability of the RTIL/catalytic system using
the procedures outlined in Scheme 4-4 was explored. The results in Table 4-7 show
that the efficiency of the system decreased slightly upon reuse, but still remained
effective after 3 runs. In that regard, the product extraction was performed at room
temperature under 1 atm pressure of air, in which RTILs are relatively unstable
according to the TGA studies reported in section 2.2. Because lithium salts have a
high affinity for carbonates,224 the gradual decrease of LiBr catalyst during product
152
separation by repeated extracting with diethyl ether may be responsible for the
decrease of the reaction efficiency upon recycling the ionic liquid. Jessop and
coworkers45 reported a switchable ionic liquid that could be used and reused as a
reaction and separation medium for the copolymerization of cyclohexene oxide (2a)
and CO2, but that the yield of polycarbonate was reduced by ca. 20% during the
second run and the polydispersity increased from 1.06 to 1.10. Our attempts to
copolymerize 2a and CO2 using C6-HBr as a catalyst (Eq. 4-7) in acetonitrile and
solvent-free condition were unsuccessful. Analysis of the reaction mixture revealed
2b (55 % yield in acetonitrile and 42 % yield under neat conditions) as the only
product formed. The FT-IR and 1H NMR spectra showed no peaks attributable to a
polycarbonate.204a Therefore, different conditions will have to be explored in the
future to effect polymerizations of this type using our catalysts.
O
CO2
C6-HBr
50 oC, 24 h
O O
O n(4-7)
Despite the unsuccessful co-polymerizations, it is interesting and synthetically
useful that a good yield of 2b was obtained under the solvent-free conditions; the Cn-
HX catalyzes the cycloaddition reaction even in neat epoxide to the exclusion of side
reactions! Also, increasing the reaction time or temperature should increase the
reaction yield even further. In this case, the epoxide, as well as the resulting cyclic
carbonate, act as the solvent.26
Previously, a Zeolite-based organic–inorganic hybrid catalyst has been reported to
give 86-100 % yields of cyclic carbonate for the same reaction under ‘mild’
conditions—6.8 atm of CO2 and 120 oC for 8 h without organic solvents.225 Also,
bis(triphenylphosphine)immium (PPN) salts, [PPN]+Cl-, and PPN-manganese

153
carbonylates, [PPN]+[Mn(CO)4L]- (L = CO, PPh3), were found to be good catalysts
for cyclic carbonate syntheses under solvent-free conditions. The reactions had no
polycarbonate contamination when conducted under 5 atm of CO2 and at 100 oC.226
The relatively low solubility of CO2 in conventional solvents26 is a primary reason to
search for alternatives to the reaction between CO2 and epoxides.227 Supercritical CO2
has also been found to be an effective solvent, although very high pressures are
necessary.228 For example, in the presence of a Re(CO)5Br catalyst, the reaction of
epoxides with supercritical CO2 without an organic solvent at 110 °C has afforded
good yields.229 Thus, our catalyst appears to be competitive with all of the others
reported to date for the cycloadditions, and it is superior to most in terms of cost and
required temperature.
Table 4-7. Recycling tests using C6-hexylamine-CO2 and 2 mol% of LiBr or C6-
HBr as catalyst to convert 2a and CO2 to 2b.a
Cycle Yield (%) with
LiBr as catalyst
Yield (%) with
C6-HBr as catalyst
1 85 98
2 82 95
3 78 94
a Time = 8 h; T = 50 oC; Pco2 = 25 atm; 2a (1.40 mol/L). Yields were determined 1H
NMR.
Also, it is necessary to consider the mechanism230 of the cyclic addition reaction in
our RTIL and amidinium halide system (Scheme 4-1). A plausible mechanism
involves the ring opening of the epoxide by means of a nucleophilic attack to the less

154
hindered carbon atom by the bromide ion, which leads to an oxy anion intermediate.
Then, CO2 reacts with the oxy anion and subsequently forms the carbonate products
upon ring closure.231 An experiment, in which the product (2b) was placed into C6-
hexylamine-CO2 at 1 atm CO2 pressure and room temperature for 24 h, and showed
no epoxide (2a) was obtained due to the loss of CO2 from 2b, based on the GC result.
This experiment demonstrates the conversion from epoxide to cyclic carbonates is
kinetically favorable in RTIL system.
4.6 Conclusions
In summary, an approach has been reported for utilizing reversible room-
temperature ionic liquids (RTILs) to synthesize five-membered cyclic carbonates by
the addition of CO2 to epoxides. Four epoxide substrates were used, and the product
mixtures indicate that the reactions proceed under the experimental conditions
employed to give only the desired cyclic carbonates. Also, the effects of RTIL
compositions, CO2 pressure, reaction time, and temperature on the reaction yields
were investigated and compared in a systematical manner. High yields (> 90%) were
achieved in most cases. Notably, no metal catalyst is required in our RTIL systems to
effect reaction.
Amidinium halide salts have been found to be efficient catalysts for preparing
cyclic carbonates in our RTILs. This system broadens the scope of such reactions by
providing an interesting approach to overcome the high activation barrier. More
significantly, the ionic liquid/catalyst systems can be reused several times without
significant decrease in product yields. Because the RTILs and catalysts can be reused
and the temperatures needed are much lower than in most other solvent/catalyst
systems reported in the literature, this approach is an effective method for preparing
cyclic carbonates.

155
There are several other reactions in which these RTILs may be advantageous to
effect additions of CO2, such as synthesis of oxazolidinones from aziridines and
CO2,232 and the preparation of polycarbonates from epoxide and CO2.204 Lewis base
ionic liquids have been developed as recyclable and efficient catalysts for selective
syntheses of oxazolidinones from aziridines and CO2 without utilization of any
organic solvent or additive. 233 Others of our group will explore some of these
reactions in the future.
5. SUMMARY AND CONCLUSIONS
Methodologies to convert reversibly a variety of non-ionic molecules and
polymers with amino groups into gels, room-temperature ionic liquids, and rubbery
polymers have been reported. Throughout this thesis, classic, simple chemistry,
involving triatomic molecules as chemical reagents, has been used to convert simple
molecules into complex materials. In our approaches, CO2 and CS2 are stoichiometric
reagents that stimulate specific conversions and assemblies of otherwise disorganized
aggregates or solutions of molecules; the increased value by adding CO2 (or CS2) to
simple molecules is potentially enormous. For example, two classes of ‘green’
solvents, chiral, reversible room-temperature ionic liquids (RTILs), have been made
by simple addition of CO2 or CS2 to mixtures of two non-ionic molecules, an aliphatic
amidine and an amino acid ester or an amino alcohol. The resulting chemical
transformation leads to ion pairs, amidinium carbamates or amidinium
dithiocarbamates. The reactions with CO2 can be reversed at will by heating or
passing N2 through the amidinium carbamates.
This strategy has also allowed us to make reversibly crosslinked polysiloxanes
with amino functional groups. Crosslinking occurs when the amino groups on
different polymer chains react with one molecule of CO2 or CS2. The changes to the

156
bulk properties of the polysiloxanes by these simple reactions are enormous. The
flowing polymers become rubbery, adhere strongly to many surfaces, and can be
swelled to several times their original volumes by a variety of organic liquids.
In addition, the non-ionic/ionic reversibility, chirality, broad temperature ranges
over which they are stable, tolerance to water, and ease of preparation should make
several of these materials very useful for applications as ‘green’ solvents, adhesives,
and (as has been demonstrated with similar materials), cleaning agents for works of
art.234 These systems may be useful as sensors and switches as well.235 The low cost
and easy access of the constituent, non-ionic molecules and polymers and the
abundance of CO2 add to the attractive features of these systems. There are many
opportunities for discovering additional methods to ‘fix’ CO2 and other triatomic
molecules and to use them to create other sophisticated materials. Here, in situ-
prepared, reversible, RTILs have been used as media for the syntheses of cyclic
carbonates by addition of CO2 to epoxides.
Overall, the simple chemistry of these reactions offers an effective approach to
construct a diverse range of materials. The basic chemical theory behind these
reactions and applications has been summarized, so that the link between the basic
chemistry and the materials obtained should stimulate others to envision new
strategies. Most neutral triatomic molecules are considered environmentally harmful.
Because their transformation into new materials under very mild reaction conditions
has been demonstrated, and there are numerous combinations of cations and anions
that yield RTILs, this flexibility can be used to tune chemical and physical properties
for RTILs. We consider this chemistry a scientific example of the adage, “changing a
pig’s ear into a silk purse”.236

157
Appendix: Copyright Permissions
AUTOBIOGRAPHY C
Tao Yu was born in 1981 in Hangzhou, Zhejiang Province, China. He received a
B.S. degree in Chemistry from Fudan University (Shanghai, China) in 2004. Then, he
joined Professor Wei Huang’s group for graduate study, at the Institute of Advanced
Materials, Fudan University. He began his Ph.D. studies with Professor Richard G.
Weiss at Georgetown University (Washington, DC) in the summer of 2006. His
research interests include the syntheses and properties of reversible room-temperature
ionic liquids and functional polymers. His Ph.D. degree is being awarded in Organic
Chemistry under the mentorship of Prof. Richard G. Weiss in 2011.

158
REFERENCE
(1) (a) Xu, H.; Hampe, E. M.; Rudkevich, D. M. Chem. Commum. 2003, 2828–2829. (b) Xu, H.;
Rudkevich, D. M. Chem. Eur. J. 2004, 10, 5432–5442.
(2) George, M.; Weiss, R. G. J. Am. Chem. Soc., 2001, 123, 10393-10394.
(3) (a) Yamada, T.; Lukac, P. J.; George, M.; Weiss, R. G. Chem. Mater., 2007, 19, 967-969. (b)
Yamada, T.; Lukac, P. J.; Yu, T.; Weiss, R. G. Chem. Mater., 2007, 19, 4761-4768. (c) Yu, T.;
Yamada, T.; Gaviola, G. C.; Weiss, R. G. Chem. Mater., 2008, 20, 5337-5344. (d) Yu, T.; Weiss, R.
G.; Yamada, T.; George, M. PCT Int. Appl. US 2007-899116P, 2008.
(4) For an important article on this theme, see: Rudkevich, D. M.; Xu, H. Chem. Commun. 2005,
2651-2659.
(5) Desset, S. L.; Cole-Hamilton, D. J. Angew. Chem. Int. Ed. 2009, 48, 1472-1474.
(6) Carretti, E.; Dei, L.; Weiss, R. G. Soft Matter, 2005, 1, 17-22.
(7) Schimel, D. S.; House, J. I.; Hibbard, K. A.; Bousquet, P.; Ciais, P.; Peylin, P.; Braswell, B.
H.; Apps M. J.; Baker, D.; Bondeau, A.; Canadell, J.; Churkina, G.; Cramer, W.; Denning, A. S.;
Field, C. B.; Friedlingstein, P.; Goodale, C.; Heimann, M.; Houghton, R. A.; Melillo, J. M.;
Moore, B. III; Murdiyarso, D.; Noble, I.; Pacala, S. W.; Prentice, I. C.; Raupach, M. R.; Rayner,
P. J.; Scholes, R. J.; Steffen, W. L.; Wirth, C. Nature, 2001, 414, 169-172.
(8) Rackley, S. Carbon capture and storage, Elsevier: Oxford, UK, 2009.
(9) Brennecke, J. F.; Gurkan, B. E. J. Phys. Chem. Lett. 2010, 1, 3459–3464
(10) (a) Du, N.; Park, H. B.; Bum, H.; Robertson1, G. P.; Dal-Cin, M. M.; Visser, T.; Scoles,
L.; Guiver, M. D. Nat. Mater. 2011, 10, 372 -375. (b) Lin, H.; Freeman, B. D. J. Mol. Struct.
2005, 739, 57-74.
159
(11) Gaffney, J. S.; Streit, G. E.; Spall, W. D.; Hall, J. H. Environ. Sci. Technol. 1987, 21, 519-
524.
(12) Trogler, W. C. Coord. Chem. Rev. 1999, 187, 303-327.
( 13 ) Price, B.; Bergman, T. S.; Rodríguez, M.; Henrich, R. T.; Moran, E. J. Regulatory
Toxicology and Pharmacology, 1997, 26, 119–128.
(14) Morton, O. Eating the Sun: How Plants Power the Planet, Harper Collins: New York, 2008.
(15) Jones, R. A. L. Soft Condensed Matter, Oxford University Press: Oxford, 2002.
(16) Hamley, I. W. Introduction to soft matter: synthetic and biological self-assembling materials;
John Wiley & Sons: New York, 2007.
( 17 ) (a) Gerhard, G.; Michael, S. Soft matter: polymer melts and mixtures; Wiley-VCH:
Weinheim, Germany 2006. (b) Gerhard, G.; Michael, S. Soft matter: complex colloidal
suspensions; Wiley-VCH: Weinheim, Germany 2006.
(18) (a) Jessop, P. G.; Heldebrant, D. J.; Li, X.; Eckert, C. A.; Liotta, C. L. Nature 2005, 436,
1102. (b) Liu, Y.; Jessop, P. G.; Cunningham, M.; Eckert, C. A.; Liotta, C. L. Science 2006, 313,
958-960.
(19) (a) Terech, P.; Weiss, R. G. Chem. Rev. 1997, 97, 3133-3159. (b) Weiss, R. G.; Terech, P.,
Eds. Molecular Gels. Materials with Self-Assembled Fibrillar Networks; Springer: Dordrecht,
the Netherlands, 2006. (c) George, M.; Weiss, R. G. Acc. Chem Res. 2006, 39, 489-497. (d)
George, M.; Weiss, R. G. Langmuir 2002, 18, 7124-7135. (e) George, M.; Weiss, R. G. Langmuir
2003, 19, 1017-1025.
(20) Welton, T. Chem. Rev. 1999, 99, 2071–2083.
(21) (a) Rogers, R. D.; Seddon, K. R., Eds. Ionic Liquids: Industrial Applications to Green

160
Chemistry (ACS Symposium Series 818), American Chemical Society: Washington, DC, 2002. (b)
Rogers, R. D.; Seddon, K. R., Eds. Ionic Liquids IIIA: Fundamentals, Progress, Challenges, and
Opportunitities, ACS Symposium Series 901, American Chemical Society: Washington, DC, 2005.
(22) (a) Chowdhury, S.; Mohan, R. S.; Scott, J. L. Tetrahedron, 2007, 2363–2389. (b) Zhao, H.
Chem. Eng. Comm., 2006, 193, 1660–1677. (c) Chiappe, C.; Pieraccini, D. J. Phys. Org. Chem.,
2005, 18, 275–297.
(23) Gurkan, B. E.; de la Fuente, J. C.; Mindrup, E. M.; Ficke, L. E.; Goodrich, B. F.; Price, E.
A.; Schneider, W. F.; Brennecke, J. F. J. Am. Chem. Soc. 2010, 132, 2116–2117.
(24) Wang, G.; Hou, W.; Xiao, F.; Geng, Jiao.; Wu, Y.; Zhang, Z. J. Chem. Eng. Data, 2011, 56,
1125–1133.
(25) (a) Bara, J. E.; Camper, D. E.; Gin, D. L.; Noble , R. D. Acc. Chem. Res. 2010, 43, 152–159.
(b) Camper, D.; Bara, J. E.; Gin, D. L.; Noble, R. D. Ind. Eng. Chem. Res. 2008, 47, 8496–8498.
(c) Bara, J. E.; Carlisle, T. K.; Gabriel, C. J.; Camper, D.; Finotello, A.; Gin, D. L.; Noble, R. D.
Ind. Eng. Chem. Res. 2009, 48, 2739–2751.
(26) Sakakura, T.; Choi, J.-C.; Yasuda, H. Chem. Rev., 2007, 107, 2365-2387.
(27) Sakakura, T.; Kohno, K. Chem. Commun., 2009, 1312-1330.
(28) Dell’Amico, D. B.; Calderazzo, F.; Labella, L.; Marchetti, F.; Pampaloni, G. Chem. Rev.,
2003, 103, 3857-3897.
(29) Das Gupta, A.; Singh, Y.; Singh, S. J. Chem. Phys. 1973, 59, 1999-2006 and references cited
therein.
(30) CRC Handbook of Chemistry and Physics, Lide, D. R. Ed., 88th ed.; CRC Press: Boca
Raton, FL, 2007.

161
(31) Li, J.-R.; Kuppler, R. J.; Zhou, H.-C. Chem. Soc. Rev., 2009, 38, 1477-1504.
(32) (a) Volk, T. CO2 rising: the world’s greatest environmental challenge, The MIT Press,
Cambridge, Massachussets, 2008. (b) CO2 Emissions from Fuel Combustion Highlights;
International Energy Agency: Paris, 2010. (c) Peltier, R. Power 2008, 152, 38–41. (d) Perry, R. J.;
Grocela-Rocha, T. A.; O'Brien, M. J.; Genovese, S.; Wood, B. R.; Lewis, L.N.; Lam, H.;
Soloveichik, G.; Rubinsztajn, M.; Kniajanski, S.; Draper, S.; Enick, R. M.; Johnson, J. K.; Xie, H.
B.; Tapriyal, D. ChemSusChem 2010, 3, 919–930.
(33) Hori, Y.; Nagano, Y.; Miyake, S.; Teramoto, S.; Taniguchi, T. Chem. Express, 1986, 1, 173-
176.
(34) Phan, L.; Chiu, D.; Heldebrant, D. J.; Huttenhower, H.; John, E.; Li, X.; Pollet, P.; Wang, R.;
Eckert, C. A.; Liotta, C. L.; Jessop, P. G. Ind. Eng. Chem. Res. 2008, 47, 539-545.
(35) Schroeder, D. C. Chem. Rev., 1955, 55, 181-228.
(36) Leontiev, A. V.; Dias, H. V. R.; Rudkevich, D. M. Chem. Commun., 2006, 2887-2889.
(37) (a) Weingärtner, H. Angew. Chem. Int. Ed. 2008, 47, 654-670. (b) Aki, S. N. V. K.;
Brennecke, J. F.; Samanta, A. Chem. Commum. 2001, 5, 413-414. (c) Earle, M. J.; Esperança, J.
M. S. S.; Manuela, A. G.; Lopes, J. N. C.; Rebelo, L. P. N.; Magee, J. W.; Seddon, K. R.;
Widegren, J. A. Nature 2006, 439, 381-384.
( 38 ) (a) Wasserscheid, P.; Kein, W. Angew. Chem. Int. Ed. 2000, 39, 3773-3789. (b)
Wasserscheid, P.; Welton, T. Ionic Liquids in Synthesis; Wiley-VCH: Weinheim, Germany 2003.
(39) (a) Anderson, J. L.; Armstrong, D.W.; Wei, G. Anal. Chem. 2006, 78, 2892-2902. (b) Earle,
M. J.; Seddon, K.R. Pure Appl.Chem., 2000, 72, 1391-1398. (c) Sheldon, R. Chem. Commun.
2001, 23, 2399-2407. (d) Rogers, R. D.; Seddon, K. R. Science 2003, 302, 792-793. (e)

162
Plechkova, N.V.; Seddon, K.R. Chem. Soc. Rev. 2008, 37, 123-150.
(40) (a) Baudequin, C.; Brégeon, D.; Levillain, J. L.; Guillen, F.; Plaquevent, J.-C.; Gaumont, A.-
C. Tetrahedron Asymmetry, 2005, 16, 3921–3945. (b) Ding, J.; Armstrong, D. W.; Chirality, 2005,
17, 281–292.
(41) (a) Pegot, B.; Vo-Thanh, G.; Gori, D.; Loupy, A. Tetrahedrom Lett. 2004, 45, 6425–6428. (b)
Doherty, S.; Goodrich, P.; Hardacre, C.; Luo, H.-K.; Roony, D. W.; Seddon, K. R.; Styring, P.
Green Chem. 2004, 6, 63–67. (c) Luo, S.; Mi, X.; Zhang, L.; Liu, S.; Hu, H.; Cheng, J.-P. Angew.
Chem. Int. Ed. 2006, 45, 3093–3097.
(42) Ma, H.-Y.; Wan, X.-H, Chen, X.-F.; Zhou, Q.-F. Chin. J. Polym. Sci., 2003, 21, 265–270.
(43) Ding, J.; Welton, T.; Armstrong, D. W. Anal. Chem., 2004, 76, 7819–7822.
(44) (a) Welton, T. Coord. Chem. Rev. 2004, 248, 2459-2477. (b) Baudequin, C.; Bregeon, D.;
Levillain, J.; Guillen, F.; Plaquevent, J. C.; Gaumont, A. C. Tetrahedron Asymm. 2005, 16, 3921-
3945. (c) Dupont, J.; de Souza, R. F.; Suarez, P. A. Z. Chem. Rev. 2002, 102, 3667-3692. (d)
Parvulescu, V. I.; Hardacre, C. Chem. Rev. 2007, 107, 2615-2665.
(45) Phan, L.; Andreatta, J. R.; Horvey, L. K.; Edie, C. F.; Luco, A.-L.; Mirchandani, A.;
Darensbourg, D. J.; Jessop, P. G. J. Org. Chem. 2008, 73, 127-132.
(46 ) Unfortunately, the uptake of CO2 in DBU/alcohol systems is not quantitative at one
atmosphere of pressure, at least in toluene solutions.
(47) Andreetta, A; Barberis, G.; Gregorio, G. Chim. Ind. 1978, 60, 887–891.
(48) Vogel, A. I. Textbook of practical organic chemistry, 5th ed.; Longman Scientific &
Technical, New York, 1989, pp. 401-402.
(49) Ohno, H. Electrochemical Aspects of Ionic Liquids, Wiley-Interscience: New York, 2005.

163
(50) (a) Webb, R. G.; Haskell, M. W.; Stammer, C. H. J. Org. Chem, 1969, 34, 576-580. (b)
Smith, C. S.; Brown, A. E. J. Am. Chem. Soc., 1941, 63, 2605-2606.
(51) Omata, K.; Aoyagi, S.; Kabuto, K. Tetrahedron Asymmetry, 2004, 15, 2351 – 2356.
(52) Szöllösi, G.; Kun, I.; Bartok, M. Chirality, 2001, 13, 619-624.
(53) Boissonnas, R. A.; Guttmann, S.; Huguenin, R. L.; Jaquenoud, P. A.; Sandrin, E. Helv.
Chimica Acta, 1958, 41, 1867 - 1882.
(54) Aime S.; Gianolio, E.; Corpillo, D.; Cavalloti, C.; Palmisano, G.; Sisti, M.; Giovenzana, G.
B.; Pagliarin, R. Helvetica Chimica Acta, 2003, 86, 615–632.
(55) Oszczapowicz, J.; Raczynska, E. J. Chem. Soc. Perkin Trans. 2, 1984, 1643-1666.
(56) Haug, E.; Kantlehner, W.; Speh, P.; Braeuner, H.-J. Synthesis, 1983, 35-37.
(57) Richter-Egger, D. L.; Tesfal, A.; Flamm, S. J.; Tucker, S. A. J. Chem. Educ. 2001, 78, 1375–
1378.
(58) The slope difference between C8/IleC1 and C8/ProC1 samples is dependent on the surface
area of the liquid samples (which depends, in part, on stirring speed of the sample and size of the
vessel). In fact, C8/IleC1 showed more rapid CO2 uptake, but the same %CO2 plateau when a
smaller vessel was applied.
(59) (a) Hoerr, C. W.; Harwood, H. J. Ralston, A. W. J. Org. Chem. 1944, 9, 201–210. (b) Lallau,
J.-P.; Masson, J.; Guerin, H. Bull. Soc. Chim. Fr. 1972, 3111–3112. (c) Nakamura, N.; Okada, M.;
Okada, Y.; Sugita, K.; Mol. Cryst. Liq. Cryst. 1985, 116, 181–186.
(60) The wavenumber assignment of the protonated amidine was confirmed by the IR spectrum
of a 1/1 C8/trifluoroacetic acid mixture which showed a C=N stretch at 1648 cm-1. IR spectra of
protonated amidines have been reported: Corset, C.; Froment, F. J. Phys. Chem. 1990, 94, 6908–

164
6911.
(61) (a) Circular Dichroism; Berova, N.; Nakanishi, K.; Woody, R. W. Eds.; Wiley-VCH: New
York, 2000. (b) Lambert, J. B.; Shurvell, H. F.; Verbit, L.; Cooks, R. G.; Stout, G. H. Organic
Structural Analysis; Macmillan: New York, 1976; Part 3, Chapter 3.
(62) (a) Reichardt, C. Chem. Rev. 1994, 94, 2319–2358. (b) Reichardt, C. Chem. Soc. Rev. 1992,
21, 147–153.
(63) Wang, J.; Greaves, T. L.; Kennedy, D. F.; Weerawardena, A.; Song, G.; Drummond, C. J.
Aust. J. Chem. 2011, 64, 180–189.
(64) (a) Tao, G.; He, L.; Liu, W.; Xu, L.; Xiong, W.; Wang, T.; Kou, Y. Green Chem. 2006, 8,
639-646. (b) Fukumoto, K.; Ohno, H. Chem. Commun. 2006, 29, 3081-3083.
(65) Zhang, J.; Zhang, S.; Dong, K.; Zhang, Y.; Shen, Y.; Lv, X. Chem. Eur. J. 2006, 12, 4021-
4026.
(66) Itsuno, S.; Hirao, A.; Nakahara, S.; Yamazaki, N. J. Chem. Soc. Perkin Trans. 1 1983, 1673-
1676.
(67) Doyle, F. P.; Mehta, M. D.; Sach, G. S.; Pearson, J. L. J. Chem. Soc. 1958, 4458-4466.
(68) McKennon, M. J.; Meyeres, A. J. Org. Chem. 1993, 58, 3568-3571.
(69) Atwood, D. A.; Gabbai, F. P.; Lu, J.; Remington, M. P.; Rutherford, D.; Sibi, M. P.
Organometallics 1996, 15, 2308-2313.
(70) House, H. O. Modern Synthetic Reaction, 2nd ed.; W. A. Benjamin; Menlo Park, CA, 1972;
pp 2.
(71) Previously, we have found that 1:1 amidine:alkylamine and 1:1 amidine:amino acid esters
take up more than one equivalent of CO2, as well. Both of those amines lack a hydroxyl group
165
(capable for forming a carbonate upon reaction with a second molecule of CO2). Also, simple
electrostatic arguments disfavor the production of proximal carbamate and carbonate groups on
one amino alcohol. If the ionic state is a mixture of two different compounds, the second (an
amidinium carbonate) must be a very small amount with respect to the first (an amidinium
carbamate).
(72) Hori, Y.; Nagano, Y.; Nakao, J.; Fukuhara, T.; Taniguchi, T. Chem. Express 1986, 1, 224-
227.
(73) Corset, C.; Froment, F. J. Phys. Chem. 1990, 94, 6908-6911.
(74) (a) Lambert, J. B.; Shurvell, H. F.; Verbit, L.; Cooks, R. G.; Stout, G. H. Organic Structural
Analysis, Macmillan: New York, 1976, Part 3, Chapter 3. (b) Wang, Y.; Jiang, W.; Yan, T.; Voth,
G. A. Acc. Chem. Res. 2007, 40, 1193-1199. (c) Wang, Y.; Voth, G. A. J. Phys. Chem. B 2006, 110,
18601-18608.
(75) Anderson, J. L.; Pino, V.; Hagberg, E. C.; Sheares, V. V.; Armstrong, D. W. Chem.
Commun. 2003, 19, 2444-2445.
(76) (a) Franke, D.; Vos, M.; Antonietti, M.; Sommerdijk, N. A. J. M.; Faul, C. F. J. Chem.
Mater. 2006, 18, 1839-1847. (b) Kodaka, M. J. Phys. Chem. 1991, 95, 2110-2112.
(77) Salanne, M.; Simon, C.; Turq, P.; Madden, P. A. J. Phys. Chem. B. 2007, 111, 4678-4684.
(78) (a) Jarosik, A.; Krajewski, S.; Lewandowski, A.; Radzimski, P. J. Molecular Liquids 2006,
123, 43-50. (b) Vila, J.; Gines, P.; Rilo, E.; Cabeza, O.; Varela, L.M. Fluid Phase Equilibria 2006,
247, 32-39.
(79) (a) Crosthwaite, J. M.; Aki, S. N. V. K.; Maginn, E. J.; Brennecke, J. F. J. Phys. Chem. B
2004, 108, 5113-5119. (b) Domanska, U.; Casas, L. M. J. Phys. Chem. B 2007, 111, 4109-4115.

166
(80) (a) Huddleston, J. G.; Visser, A. E.; Reichert, W. M.; Willauer, H. D.; Broker, G. A.; Rogers,
R. D. Green Chem. 2001, 3, 156-164. (b) Wakai, C.; Oleinikova, A.; Ott, M.; Weingärtner, H. J.
Phys. Chem. B 2005, 109, 17028-17030.
( 81 ) It should be recognized, however, that the heterogeneous nature of ILs makes
determinations of their polarity by solvatochromic probes less reliable than in ‘normal’ liquids.
Jin, H.; Baker, G. A.; Arzhantsev, S.; Dong, J.; Maroncelli, M. J. Phys. Chem. B 2007, 111,
7291-7302.
(82) (a) Fukumoto, K.; Yoshizawa, M.; Ohno, H. J. Am. Chem. Soc. 2005, 127, 2398–2399. (b)
Ohno, H.; Fukumoto, K. Acc. Chem. Res. 2007, 40, 1122-1129. (c) Bao, W.; Wang, Z.; Li, Y.; J.
Org. Chem. 2003, 68, 591-593.
(83) (a) Gathergood, N.; Garcia, M. T.; Scammells, P. J. Green Chem. 2004, 6, 166-175; (b)
Garcia, M. T.; Gathergood, N.; Scammells, P. J. Green Chem. 2005, 7, 9-14. (c) Docherty, K. M.;
Kulpa, C. F., Jr. Green Chem. 2005, 7, 185-189.
(84) Rayner, C. M. Org. Proc. Res. Dev. 2007, 11, 121-132.
(85) Yu, T.; Wakuda, K.; Blair, D. L.; Weiss, R. G. J. Phys. Chem. C 2009, 113, 11546–11553.
(86) Beauchamp, R. O., Jr.; Bus, J. S.; Popp, J. A.; Boreiko, C. J.; Goldberg, L. CRC Crit. Rev.
Toxicol. 1983, 11, 169–278.
(87) Heldebrant, D. J.; Yonker, C. R.; Jessop, P. G.; Phan, L. Eur. J. Chem. 2009, 15, 7619–7627.
(88) Ochiai, B.; Endo, T. Prog. Polym. Sci. 2005, 30, 183–215.
(89) Valentine, W. M.; Amamath, V.; Graham, D. G.; Anthony, D. C. Chem. Res. Toxicol. 1992,
5, 254–262.
(90) Yu, T.; Cristiano, R.; Weiss, R. G. Chem. Soc. Rev. 2010, 39, 1435–1447.

167
(91) Mozolis, V. V.; Iokubaitite, S. P. Russ. Chem. Rev. 1973, 42, 587–595.
(92) Bassas, Ο. Huuskonen, J.; Rissanen, K.; Koskinen, A. M. P. Eur. J. Org. Chem. 2009,
1340–1351.
(93) Stockdill, J. L.; Wu, X.; Danishefsky, S. J. Tetrahedron Lett. 2009, 50, 5152–5155.
(94) Shibahara, F.; Sugiura, R.; Murai, T. Org. Lett. 2009, 11, 3064–3067.
(95) Custelcean, R.; Gorbunova, M. G.; Bonnesen, P. V. Chem. Eur. J. 2005, 11, 1459–1466.
(96) Ballabeni, M.; Ballini, R.; Bigi, F.; Maggi, R.; Parrini, M.; Predieri, G.; Sartori, G. J. Org.
Chem. 1999, 64, 1029–1032.
(97) Cheng, C.; Sun, J.; Xing, L.; Xu, J.; Wang, X.; Hu, Y. J. Org. Chem. 2009, 74, 5671–5674.
(98) Engle, P. S.; Bishop, D. J. J. Am. Chem. Soc. 1975, 97, 6754–6762.
(99) Xu, W.; Cooper, E. I.; Angell, C. A. J. Phys. Chem. B 2003, 107, 6170–6178.
(100) Takahashi, K. J. Am. Chem. Soc. 1976, 98, 7488–7498.
(101) (a) Nakamoto, K.; Fujita, J.; Condrate, R. A.; Morimoto, Y. J. Chem. Phys. 1963, 39, 423–
427. (b) Gosavi, R. K.; Agarwala, U.; Rao, C. N. R. J. Am. Chem. Soc. 1967, 89, 235–239.
(102) As shown in Figure 2-20, three protons from C6H13NH3 of ammonium the dithiocarbamate
at 7.9 ppm, proved (by adding a drop of D2O to an ammonium dithiocarbamate sample in
chloroform-d), disappear after adding amidine and CS2, and peaks corresponding to protons on
protonated amidinium moiety appear.
(103) The closest study we have found is between hindered isonitriles and thioacids: Stockdill, J.
L.; Wu, X.; Danishefsky, S. J. Tetrahedron Lett 2009, 50, 5152–5155.
(104) To simplify our study, tC4 (which lacks a methyl group at the amidine carbon) and t–
butylamine were selected as substrates. These molecules simplify the spectral identification of

168
the thermolysis products. As indicated by the proposed mechanism in Scheme 2-4, these
substrates should react like the others in Scheme 2-3.
(105) (a) Merrifield, R. B. J. Am. Chem. Soc. 1963, 85, 2149–2154. (b) Atherton, E.; Sheppard,
R. C. Solid Phase peptide synthesis: a practical approach. Oxford University Press: Oxford,
England, 1989.
(106) Custelcean, R.; Gorbunova, M. G.; Bonnesen, P. V. Chem. Eur. J. 2005, 11, 1459–1466.
(107) (a) Humeres, E.; Debacher, N. A.; Sierra, M.; Franco, J. D.; Schutz, A. J. Org. Chem. 1998,
63, 1598–1603. (b) Humeres, E.; Debacher, N.; Sierra, M. M. S. J. Org. Chem. 1999, 64, 1807–
1813. (c) Humeres, E.; Debacher, N.; Franco, J. D.; Lee, B. S.; Martendal, A. J. Org. Chem.
2002, 67, 3662–3667
(108) Vila, J.; Gines, P.; Rilo, E.; Cabeza, O.; Varela, L. M. Fluid Phase Equilibria 2006, 247,
32–39.
(109) The concentrations are expressed in mol % in order to normalize the concentrations of
ionic liquids and amidine/amine.
(110) Fraser, K. J.; Izgorodina, E. I.; Forsyth, M.; Scott, J. L.; MacFarlane, D. R. Chem Commun
2007, 37, 3817–3819.
(111) (a) Walden, P. Z. Phys. Chem. 1906, 55, 207. (b) MacFarlane, D. R.; Forsyth, M.;
Izgorodina, E. I.; Abbott, A. P.; Annata, G.; Frasera, K. Phys. Chem. Chem. Phys. 2009, 11,
4962–4967.
(112) Greaves, T. L.; Weerawardena, A.; Fong, C.; Krodkiewska, I.; Drummond, C. J. J. Phys.
Chem. B 2006, 110, 22479–22487.
(113) Angell, C. A.; Byrne, N.; Belieres, J.–P. Acc. Chem. Res. 2007, 40, 1228–1236.

169
(114) (a) Crosthwaite, J. M.; Aki, S. N. V. K.; Maginn, E. J.; Brennecke, J. F. J. Phys. Chem. B
2004, 108, 5113–5119. (b) Domanska, U.; Casas, L. M. J. Phys. Chem. B 2007, 111, 4109–4115.
(115) Carmichael, A. J.; Seddon, K. R. J. Phys. Org. Chem. 2000, 13, 591-595.
(116) Some of the viscosity tests were repeated twice, and the differences of the absolute value
are ca. 5%.
(117) (a) Muldoon, M. J. Dalton Trans. 2010, 39, 337–348. (b) Cole-Hamilton, D. J.; Tooze, R.
P., Eds. Catalyst Separation, Recovery and Recycling, Chemistry and Process Design, Springer:
Dordrecht, 2006. (c) Cornils, B.; Herrmann, W. A.; Horvath, I. T.; Leitner, W.; Mecking, S.;
Olivier-Bourbigou, H.; Vogt, D., Eds. Multiphase Homogeneous Catalysis; Wiley–VCH:
Stuttgart, 2005. (d) Benaglia, M., Eds. Recoverable and Recyclable Catalysts; Wiley: Germany,
2009.
(118) Gupta, A. D.; Singh Y.; Singh, S. J. Chem. Phys. 1973, 59, 1999–2006.
(119) ΔHfo (gas) = ΔHfo (liquid) + Δvap Hfo (tb) = 89.0 + 26.7 = 115.7 kJ·mol–1. Ref 30, pp 5–20
and 6–117.
(120) Hammond, G. S. J. Am. Chem. Soc. 1955, 77, 334–338
(121) Khan, S. A.; Royer, J. R.; Raghavan, S. R. Aviation Fuels with Improved Fire Safety: A
Proceeding; National Academy Press: Washington, DC, 1997; p 31–46.
(122) (a) Pearson, R. G., J. Am. Chem. Soc. 1963, 85, 3533–3543. (b) Chattaraj, P. K.; Lee, H.;
Parr, R. G. J. Am. Chem. Soc. 1991, 113, 1855–1856.
(123) (a) Silicon–Based Polymer Science: A comprehensive resource; Advances in Chemistry
Series 224; Zeigler, J. M., Fearon, F. W. G., Eds.; American Chemical Society: Washington, DC,
1990. (b) Clarson, S. J.; Smith, S. D.; Owen, M. J. Silicones and Silicone–Modified Materials;

170
American Chemical Society: Washington, DC, 2000. (c) Manners, I. Angew. Chem., Int. Ed.
1996, 35, 1602–1621. (d) Mark, J. E. Acc. Chem. Res. 2004, 37, 946–953.
(124) (a) Physical Properties of Polymers Handbook, 2nd ed.; Mark, J. E., Ed.; Springer: Berlin,
2007. (b) Mark, J. E.; Allcock, H. R.; West, R. Inorganic Polymers, 2nd ed.; Oxford University
Press: New York, 2005, p 154–199. (c) Erman, B.; Mark, J. E. Structures and Properties of
Rubberlike Networks; Oxford University Press: New York, 1997.
(125) Gao, Z.; Nahrup, J. S.; Mark, J. E.; Sakr, A. J. Appl. Polym. Sci. 2003, 90, 658–666.
(126) Batra, A.; Cohen, C.; Archer, L. A. Macromolecules, 2005, 38, 7174–7180.
(127) (a) Kato, D.; Masaike, M.; Majima, T.; Hirata, Y.; Mizutani, F.; Sakata, M.; Hirayama, C.;
Kunitake, M.; Chem. Commum. 2002, 2616–2617. (b) Park, H. B.; Kim, J. K.; Nam, S. Y.; Lee,
Y. M. J. Membr. Sci. 2003, 220, 59–73. (c) Miller, A. L., II; Bowden, N. B. Chem. Commum.
2007, 20, 2051–2053.
(128) Verma, M. K. S.; Majumder, A.; Ghatak, A. Langmuir 2006, 22, 10291–10295.
(129) Oomen, A. G.; Mayer, P.; Tolls, J. Anal. Chem. 2000, 72, 2802–2808.
(130) (a) Paul, K.E.; Prentiss, M.; Whitesides, G. M. Adv. Functional. Mater. 2003, 13, 259–263.
(b) Mcdonald, J. C.; Whitesides, G. M. Acc. Chem. Res. 2002, 35, 491–499.
(131) (a) Cho, S. H.; Andersson, H. M.; White, S. R.; Sottos, N. R.; Braun, P. V. Adv. Mater.
2006, 18, 997–1000. (b) Wu, D. Y.; Meure, S.; Solomon, D. Prog. Polym. Sci. 2008, 33, 479–522.
(132) (a) Abe, Y.; Gunji, T. Prog. Polym. Sci. 2004, 29, 149–182. (b) Abbasi, F.; Mirzadeh, H.;
Katbab, A. A. Polym. Int. 2001, 50, 1279–1287.
(133) (a) Zhang, X.; Xie, P.; Shen, Z.; Jiang, J.; Zhu, C.; Li, H.; Zhang, T.; Han, C. C.; Wan, L.;
Yan, S.; Zhang, R. B. Angew. Chem., Int. Ed. 2006, 45, 3112–3116. (b) Zhou, Q. L.; Yan, S. K.;
171
Han, C. C.; Xie, P.; Zhang, R. B. Adv. Mater. 2008, 20, 2970–2976.
( 134 ) (a) Zhang, Z. C.; Sherlock, D.; West, R.; West, R.; Amine, K.; Lyons, L. J.
Macromolecules 2003, 36, 9176–9180. (b) Ngoumeni–Yappi, R.; Fasel, C.; Riedel, R.; Ischenko,
V.; Pippel, E.; Woltersdorf, J.; Clade, J. Chem. Mater. 2008, 20, 3601–3608.
(135) (a) Zhang, Y.; Cao, M.; Guo, G. Q.; Sun, J.; Li, Z.; Xie, P.; Zhang, R. B.; Fu, P. F. J. Mater.
Chem. 2002, 12, 2325–2330.
(136) Nair, K. P.; Breedveld, V.; Weck, M. Macromolecules 2008, 41, 3429–3438.
(137) Serpe, M. J.; Craig, S. L. Langmuir 2007, 23, 1626–1634.
(138) Carretti, E.; Dei, L.; Baglioni, P.; Weiss, R. G. J. Am. Chem. Soc. 2003, 125, 5121–5129.
(139) (a) Endo, T.; Nagai, D.; Monma, T.; Yamaguchi, H.; Ochiai, B. Macromolecules 2004, 37,
2007–2009. (b) Ochiai, B.; Yokota, K.; Fujii, A.; Nagai, D.; Endo, T. Macromolecules, 2008, 41,
1229–1236.
(140) Nagai, D.; Suzuki, A.; Kuribayashi, T. Macromol. Rapid. Commun. 2011, 32, 404–410.
(141) Laidler, K. J.; Meiser, J. H. Physical Chemistry; 3rd ed; Houghton Mufflin: Boston, 1999,
pp 267.
(142) DeLassus, P. T.; Whiteman, N. F. in Polymer Handbook; Brandrup, J.; Immergut, E. H.;
Grulke, E. A. Eds.; Wiley: New York, 1999, p V/168.
(143) Lobo, H.; Bonilla, J. V. Handbook of Plastics Analysis; Routledge: USA 2003
(144) (a) Nakamoto, K.; Fujita, J.; Condrate, R. A.; Morimoto,Y. J. Chem. Phys. 1963, 39, 423–
427. (b) Gosavi, R. K.; Agarwala, U.; Rao, C. N. R. J. Am. Chem. Soc. 1967, 89, 235–239.
(145) Boas, U.; Karlsson, A. J.; de Waal, B. F. M.; Meijer, E. W. J. Org. Chem. 2001, 66, 2136–
2145.
172
(146) Guadagno, T.; Kazarian, S. G. J. Phys. Chem. B 2004, 108, 13995–13999.
(147) Ghannam, M. T.; Esmail, M. N. Ind. Eng. Chem. Res. 1998, 37, 1335-1340.
(148) Khan, S. A.; Royer, J. R.; Raghavan, S. R. Aviation Fuels with Improved Fire Safety: A
Proceeding; National Academy Press: Washington, DC, 1997; pp 31–46.
(149) Carraher, C. E. Seymour/Carraher's polymer chemistry, 7th ed; CRC Press: Boca Raton,
2008; pp 49–82.
(150) Custelcean, R. Chem. Commum. 2008, 295–307.
(151) (a) Menger, F. M.; Caran, K. L. J. Am. Chem. Soc. 2000, 122, 11679 –11691. (b) Yabuuchi,
K.; Marfo–Owusu, E.; Kato, T. Org. Biomol. Chem. 2003, 1, 3464 –3469. (c) Pérez–Folch, J.;
Subirana, J. A.; Aymami, J. J. Chem. Crystallogr. 1997, 27, 367 –369. (d) Ramanathan, A.;
Siakumar, K.; Subramanian, K.; Janarthanan, N.; Ramadas, K.; Fun, H. –K. Acta Cryatallogr.
Sect. C 1995, 51, 2446 –2450.
(152) (a) Ketner, A. M.; Kumar, R.; Davies, T. S.; Elder, P. W.; Raghavan, S. R. J. Am. Chem.
Soc. 2007, 129, 1553–1559. (b) Tung, S. H.; Huang, Y. E.; Raghavan, S. R. Langmuir 2007, 23,
372–376. (c) Tung, S. H.; Huang, Y. E.; Raghavan, S. R. Soft Matter, 2008, 4, 1086–1093.
( 153 ) (a) Macosko, C. W. Rheology: Principles, Measurements and Applications; VCH
Publishers: New York, 1994. (b) Winter, H. H.; Chambon, F. J. Rheol. 1986, 30, 367–382.
(154) (a) Hyun, K.; Kim, S. H.; Ahn, K. H.; Lee, S. J. J. Non–Newtonian Fluid Mech. 2002, 107,
51–65. (b) Sim, H. G.; Ahn, K. H.; Lee, S. J. J. Non–Newtonian Fluid Mech. 2003, 112, 237–250.
(155) (a) Winter, H. H.; Chambon, F. J. Rheol. 1986, 30, 367-382. (b) Chambon, F.; Winter, H.
H. J. Rheol. 1987, 31, 683-697.
(156) Veselovskii, R. A. Adhesion of polymers, McGraw–Hill: New York, 2002.
(157) Hong, G.; Zhou, M.; Zhang, R. X.; Hou, S. M.; Choi, W. M.; Woo, Y. S.; Choi, J. Y.; Liu,
173
Z. F.; Zhang, J. Angew. Chem. Int. Ed. DOI: 10.1002/anie.201101700
(158) Kong, J.; Dai, H. J. J. Phys. Chem. B 2001, 105, 2890 – 2893.
(159) Carretti, E; Dei, L; Macherelli, A; Weiss, R. G. Langmuir 2004, 20, 8414–8418.
(160) Khongtong, S.; Ferguson, G. S. J. Am. Chem. Soc. 2002, 124, 7254–7255.
(161) Yu, T.; Wakuda, K.; Weiss, R. G. U.S. Provisional Patent, No. 61/316, 089, 2010.
( 162 ) We envision that these polysiloxanes can be employed as reversible, temperature–
dependent adhesives. Specifically, substrates strongly adhere at room temperature to the
polysiloxanes exposed to CO2, and their adhesive strength can be tuned by changing the
temperature.
(163) Chang–Chien, G. P.; Lee, W. S.; Tsai, J. L.; Jeng, S. H. J. Chromatogr. A 2001, 932, 97–
105.
(164) Freudenberger, J. V.; Spiteller, P.; Bauer, R.; Kessler, H.; Luy, B. J. Am. Chem. Soc. 2004,
126, 14690–14691.
(165) (a) Alauzun, J.; Besson, E.; Mehdi, A.; Reyé, C.; Corriu, R. J. P. Chem. Mater. 2008, 20,
503–513. (b) Soutullo, M. D.; Odom, C. I.; Wicker, B. F.; Henderson, C. N.; Stenson, A. C.;
Davis, J. H. Chem. Mater. 2007, 19, 3581–3583.
(166) Favre, E. Eur. Polym. J. 1996, 32, 1183-1188.
(167) Kopecek, J. Nature 2002, 417, 388-391.
(168) Nakamura, S.; Maeda, S.; Hara, Y.; Hashimoto, S. J. Phys. Chem. B 2009, 113, 4609–4613.
(169 ) McCurley, M. F.; Seitz, W. R. Biosensors and Chemical Sensors, Chapter 24, ACS
Symposium Series, Volume 487, Washington DC, USA, 1992.
(170) Brennan, D. P.; Dobley, A.; Sideris, P. J.; Oliver, S. R. Langmuir 2005, 21, 11994-11998.
(171) Langer, R. Acc. Chem. Res., 1993, 26, 537–542.

174
(172) Yoo, S. H.; Cohen, C.; Hui, C-Y., Polymer 2006, 47, 6226-6235.
(173) (a) Zhao, Y.; Tan, T.; Kinoshita, T. J. Poly. Sci. Part B: Poly Phys. 2010, 48, 666-671. (b)
Okay, K. Prog. Polym. Sci. 2000, 25, 711-779.
(174) Okay, O.; Gurun C. J Appl Polym Sci 1992, 46, 401-409.
(175) Matsumoto, A.; Kurata, T.; Shiino, D.; Kataoka, K. Macromolecules 2004, 37, 1502-1510.
(176) (a) Eichenbaum, G. M.; Kiser, P. F.; Dobrynin, A. V.; Simon, S. A. Needham, D.
Macromolecules 1999, 32, 4867-4878. (b) Errede, L. A. Macromolecules 1986, 19, 654-658.
(177) Comyn, J. Polymer permeability; Elsevier: London, U.K., 1985.
(178) Brennan, D. P.; Dobley, A.; Sideris, P. J.; Oliver, S. R. Langmuir 2005, 21, 11994–11998..
(179) Rossi, G.; Mazich, K. A., Phys. Rev. A 1993, 48, 1182-1191.
(180) Crank, J. The Mathematics of Diffusion; Oxford University Press: Oxford, U.K., 1975.
(181) Zeng, k.; Wang, L.; Zhang, S. J. Phys. Chem. B 2009, 113, 11831–11840.
(182) Schott, H. J. Macromol. Sci. Phys. 1992, 31, 1–9.
(183) Yin, Y.; Yang, Y.; Xu, H. J Polym Sci Part B: Polym Phys 2001, 39, 3128–3137.
(184) O'Kane, J. M.; Sherrington, D. C. Macromolecules 1990, 23, 5286-5291.
(185) Errede, A.; Hanson, S. C. J. Appl. Poly. Sci. 1994, 54, 619-647.
(186) Okeowo, O.; Dorgan, J. R. Macromolecules 2006, 39, 8193-8202.
(187) (a) Shultz, A. R.; Flory, P. J. J. Polym. Sci. 1955, 15, 231-234. (b) Neuburger, N. A.;
Eichinger, B. E. Macromolecules 1988, 21, 3060-3070.
(188) Schlick, S.; Gao, Z.; Matsukawa, S.; Ando, I.; Fead, E.; Rossi, G. Macromolecules 1998,
31, 8124-8133
(189)Shin, M-S.; Kim, S. J.; Kim, I. Y.; Kim, N. G.; Song, C. G.; Kim, S. I. J. Appl. Poly. Sci.
2002, 85, 957-964.
(190) Flory, P. J. Principles of Polymer Chemistry. Cornell University Press: New York 1953.
175
( 191 ) Makino, K.; Yamamoto, S.; Fujimoto, K.; Kawaguchi, H.; Ohshima, H. J. Colloid
Interface Sci. 1994, 166, 251.-258.
(192) Erman, B.; Baysal, B. Macromolecules, 1985, 18, 1696–1700.
( 193 ) (a) Understanding Oil Spill Dispersants: Efficacy and Effects; Committee on
Understanding Oil Spill Dispersants: Efficacy and Effects, National Research Council; National
Academies Press, Washington, 2005. (b) ExxonMobil Oil Spill Dispersant Guidelines,
ExxonMobil Research and Engineering Company, 2008. (c) “Deepwater horizaon MC 252
response. Strategic plan for sub-sea and sub-surface oil and dispersant detection, sampling, and
monitoring.” Unified Area Command, November 13, 2010.
(194) (a) Bhattacharya, S.; Krishnan-Ghosh, Y. Chem. Commun. 2001, 185–186. (b) Jadhav, S.
R.; Vemula, P. K.; Kumar, R.; Raghavan, S. R.; John, G. Angew. Chem. Int. Ed. 2010, 49, 7695-
7698.
(195) Yu, T.; Weiss, R. G. U.S. Non-Provisional Patent, No. 61/376,964, 2010.
(196) Tang, Q. W.; Wu, J. H.; Lin, J. M.; Li, Q. H.; Fan, S. J. J. Mater Sci., 2008, 43, 5884–5890.
(197) (a) Lu, J.; Lazzaroni, M. J.; Hallett, J. P.; Bommarius, A. S.; Liotta, C. L.; Eckert, C. A.
Ind. Eng. Chem. Res., 2004, 43, 1586-1590. (b) Eckert, C. A.;. Liotta, C. L.; Bush, D.; Brown, J.
S.; Hallett, J. P. J. Phys. Chem. B, 2004, 108, 18108-18118. (c) Wei, M.; Musie, G. T.; Busch, D.
H.; Subramaniam, B. J. Am. Chem. Soc., 2002, 124, 2513-2517. (d) Jutz, F.; Andanson, J.-M.;
Baiker, A. Chem. Rev., 2011, 111, 322–353.(e) Riduan, S. N.; Zhang, Y. Dalton Trans., 2010, 39,
3347-3357.
(198) (a) Baba, A.; Kashiwagi, H.; Matsuda, H. Organometallics 1987, 6, 137-140. (b) Baba, A.;
Kashiwagi, H.; Matsuda, H. Tetrahedron Lett. 1985, 26, 1323-1324.

176
(199) Sakakura, T.; Choi, J-C.; Yasuda, H., Chem. Rev. 2007, 107, 2365-2387.
(200) Darensbourg, D. J.; Lewis, S. J.; Rodgers, J. L.; Yarbrough, J. C. Inorg. Chem., 2003, 42,
581-589.
(201) (a) Paddock, R. L.; Nguyen, S. T. J. Am. Chem. Soc., 2001, 123, 11498-11499. (b)
Darensbourg, D. J.; Fang, C. C.; Rodgers, J. L. Organometallics 2004, 23, 924-927. (c) Shen, Y.
M.; Duan, W. L.; Shi, M. J. Org. Chem., 2003, 68, 1559-1562. (d) Jing, H. W.; Edulji, S. K.;
Gibbs, J. M.; Stern, C. L.; Zhou, H. Y.; Nguyen, S. T. Inorg. Chem. 2004, 43, 4315-4325. (e)
Liang, S.; Liu, H.; Jiang, T.; Song, J.; Yang, G.; Han, B. Chem. Commun., 2011, 47, 2131–2133.
(f) Clegg, W.; Harrington, R. W.; North, M.; Pasquale, R. Chem. Eur. J. 2010, 16, 6828 – 6843.
(g) Xie, Y.; Zhang, Z.; Jiang, T.; He, J.; Han, B.; Wu, T.; Ding, K. Angew. Chem., Int. Ed. 2007,
46, 7255–7258.
(202) (a) Aresta, M.; Dibenedetto, A.; Gianfrate, L.; Pastore, C. Journal of Molecular Catalysis
A: Chemical 2003, 204, 245–252. (b) Srivastava, R.; Srinivas, D.; Ratnasamy, P. Journal of
Catalysis, 2005, 233, 1-15.
(203) (a) Kawanami, H.; Sasaki, A.; Matsui, K.; Ikushima, Y. Chem. Commun., 2003, 896–897.
(b) Zhu, A. L.; Jiang, T.; Han, B. X.; Zhang, J. C.; Xie, Y.; Ma, X. M. Green Chem. 2007, 9,
169-172. (c) Zhou, H.; Zhang, W.-Z.; Liu, C.-H.; Qu, J.-P.; Lu, X.-B. J. Org. Chem. 2008, 73,
8039–8044. (d) Jiang, J.-L.; Gao, F.; Hua, R.; Qiu, X. J. Org. Chem. 2005, 40, 381–383. (e) Yin,
S.-F.; Shimada, S. Chem. Commun. 2009, 1136–1138. (f) Kruper, W. J.; Dellar, D. V. J. Org.
Chem. 1995, 60, 725–727. (g) Yang, Z.; He, L. –N.; Miao, C.; Chanfreaua, S. Adv. Synth. Catal.
2010, 352, 2233 – 2240.
(204) (a) Darensbourg, D. J.; Mackiewicz, R. M..; Phelps, A. L.; Billodeaux, D. R. Acc. Chem.
Res. 2004, 37, 836-844. (b) Darensbourg, D. J.; Holtcamp, M. W.; Struck, G. E.; Zimmer, M. S.;

177
Niezgoda, S. A.; Rainey, P.; Robertson, J. B.; Draper, J. D.; Reibenspies, J. H. J. Am. Chem. Soc.
1999, 121, 107-116. (c) Moore, D. R.; Cheng, M.; Lobkovsky, E. B.; Coates, G. W. J. Am. Chem.
Soc. 2003, 125, 11911-11924. (d) Lu, X.-B.; Wang, Y. Angew. Chem., Int. Ed. 2004, 43, 3574-
3577. (e) Thorat, S. D.; Phillips, P. J.; Semenov, V.; Gakh, A. J. Appl. Polym. Sci., 2003, 89,
1163–1176.
(205) Jutz, F.; Andanson, J-M.; Baiker, A. Chem. Rev. 2011, 111, 322–353.
(206) Yamaguchi, K.; Ebitani, K.; Yoshida, T.; Yoshida, H.; Kaneda, K., J. Am. Chem. Soc.,
1999, 121, 4526-4527.
(207) Zhang, S.; Chen, Y.; Li, F.; Lu, X.; Dai, W.; Mori, R. Catalysis Today 2006, 115, 61–69.
(208) Yu, T.; Yamada, T.; Weiss, R. G. Chem. Mater. 2010, 22, 5492-5499.
(209) Slemr, J.; Slemr, F.; D’Souzac, H.; Partridge, R. Journal of Chromatography A, 2004,
1061, 75–84.
(210) Barkakaty, B.; Morino, K.; Sudo, A.; Endo, T. Green Chem., 2010, 12, 42–44.
(211) March, J. Advanced Organic Chemistry 4th Ed. J. Wiley and Sons: New York, 1992.
(212) Fujita, S-I.; Nishiura, M.; Arai, M. Catal Lett 2010, 135, 263–268.
(213) Lu, X-B.; Zhang, Y-J.; Liang, B.; Li, X.; Wang, H. Journal of Molecular Catalysis A:
Chemical 2004, 210, 31–34.
(214) (a) Yoshida, M.; Fujita, M.; Ishii, T.; Ihara, M. J. Am. Chem. Soc. 2003, 125, 4874-4881.
(b) Yoshida, M.; Ihara, M. Chem.-Eur. J. 2004, 10, 2886-2893. (c) Fukuoka, S.; Kawamura, M.;
Komiya, K.; Tojo, M.; Hachiya, H.; Hasegawa, K.; Aminaka, M.; Okamoto, H.; Fukawa, I.;
Konno, S. Green Chem., 2003, 5, 497–507.
(215) Wang, J.-Q.; Kong, D.-L.; Chen, J.-Y.; Cai, F.; He, L.-N. J. Mol. Catal. A: Chem., 2006,
249, 143–148.
(216) Evans, D. A. pKa’s of inorganic and oxoacids. http://evans.harvard.edu/pdf/

178
evans_pKa_table.pdf.
(217) (a) Calo, V.; Nacci, A.; Lopez, L.; Napola, A. Tetrahedron Lett. 2001, 42, 4701-4703. (b)
Calo, V.; Nacci, A.;. Monopoli, A.; Lopez, L.; Di Cosmo, A. Tetrahedron 2001, 57, 6071-6077.
(218) Heldebrant, D. J.; Jessop, P. G.; Thomas, C. A.; Eckert, C. A.; Liotta, C. L. J. Org. Chem.
2005, 70, 5335-5338.
(219) Sun, J.; Ren, J.; Zhang, S.; Cheng, W. Tetrahedron Lett. 2009, 50, 423–426.
(220) (a) North, M.; Pasquale, R.; Young, C. Green Chem., 2010, 12, 1514–1539. (b) Song, J.;
Zhang, Z.; Hu, S.; Wu, T.; Jiang, T.; Han, B. Green Chem. 2009, 11, 1031- 1036.
(221) Beckman, E.J. J. Supercritical Fluids, 2004, 28, 121-191.
(222) Sun, J.; Fujita, S-I.; Zhao, F.; Arai, M. Green Chem., 2004, 6, 613-616.
(223) Zhang, H. F.; Han, B. X.; Hou, Z. S.; Liu, Z. M. Fluid Phase Equilibr., 2001, 179, 131-
138.
(224) Belostotskii, A. M.; Markevich, E.; Aurbach, D. J. Coord. Chem., 2004, 57, 1047-1056.
(225) Srivastava, R.; Srinivas, D.; Ratnasamy, P. Applied Catalysis A: General 2005, 289, 128–
134.
(226) Sit, W.; Ng, S.; Kwong, K.; Lau, C. J. Org. Chem. 2005, 70, 8583-8586.
(227) Sakai, T.; Tsutsumi, Y.; Ema, T. Green Chem., 2008, 10, 337–341.
(228) Coates, G. W.; Moore, D. R. Angew. Chem. Int. Ed., 2004, 43, 6618–6639.
(229) Jiang, J. –Li.; Gao, F.; Hua, R.; Qiu, X. J. Org. Chem. 2005, 70, 381-383.
(230) (a) Darensbourg, D. J.; Holtcamp, M. W. Coord. Chem. Rev. 1996, 153, 155-174. (b) Sun,
J.; Zhang, S.; Cheng, W.; Ren, J. Tetrahedron Letters 2008, 49, 3588–3591.
(231 ) Calo, V.; Nacci, A.; Monopoli, A.; Fanizzi, A. Orgo lett 2002, 4, 2561-2563.
(232) (a) Miller, A. W.; Nguyen, S. T. Org. Lett. 2004, 6, 2301-2304. (b) Shen, Y.-M.; Duan,
W.-L.; Shi, M. Eur. J. Org. Chem, 2004, 14, 3080-3089.
(233) Yang, Z.-Z.; He, L. –N.; Peng, S. -Y.; Liu, A.-H. Green Chem, 2010, 12, 1850-1855.

179
(234) Carretti, E.; Dei, L.; Weiss, R. G.; Baglioni, P. J. Cultural Heritage, 2008, 9, 386–393.
(235) Wencel, D.; Moore, J. P.; Stevenson, N.; Mcdonagh, C. Anal. Bioanal. Chem. 2010, 398,
1899-1907.
(236) Rogers, J. The Dictionary of Cliches Wings Books: New York, 1985.