Association of NTRK3 and its interaction with NGF suggest an altered cross-regulation of the...
12
Human Molecular Genetics doi:10.1093/hmg/ddn013 17:1234-1244, 2008. First published 18 Jan 2008; Hum. Mol. Genet. Sorbi, Audrey Versini, Mònica Gratacòs and Xavier Estivill Gorwood, Johannes Hebebrand, Anke Hinney, Benedetta Nacmias, Anna Puig, Marta Ribasés, Valdo Ricca, Lucia Romo, Sandro Mara Dierssen, Geòrgia Escaramís, Fernando Fernández-Aranda, Laura Forcano, Xavier Gallego, Juan Ramón González, Philip Josep Maria Mercader, Ester Saus, Zaida Agüera, Mònica Bayés, Claudette Boni, Anna Carreras, Elena Cellini, Rafael de Cid, pathway in eating disorders suggest an altered cross-regulation of the neurotrophin signaling NGF and its interaction with NTRK3 Association of Supplement/Special Issue http://hmg.oxfordjournals.org/cgi/content/full/ddn013/DC1 "Supplementary Data" This article is part of the following issue: http://hmg.oxfordjournals.org/cgi/content/full/17/9/1234 The full text of this article, along with updated information and services is available online at References http://hmg.oxfordjournals.org/cgi/content/full/17/9/1234#BIBL This article cites 82 references, 25 of which can be accessed free at Supplementary material http://hmg.oxfordjournals.org/cgi/content/full/ddn013/DC1 Data supplements for this article are available at Reprints http://www.oxfordjournals.org/corporate_services/reprints.html Reprints of this article can be ordered at Email and RSS alerting Sign up for email alerts, and subscribe to this journal’s RSS feeds at http://hmg.oxfordjournals.org image downloads PowerPoint® Images from this journal can be downloaded with one click as a PowerPoint slide. Journal information at http://hmg.oxfordjournals.org Additional information about Human Molecular Genetics, including how to subscribe can be found Published on behalf of http://www.oxfordjournals.org Oxford University Press at PCH AGAM on 30 June 2008 http://hmg.oxfordjournals.org Downloaded from
-
Upload
independent -
Category
Documents
-
view
0 -
download
0
Transcript of Association of NTRK3 and its interaction with NGF suggest an altered cross-regulation of the...
Human Molecular Genetics
doi:10.1093/hmg/ddn013 17:1234-1244, 2008. First published 18 Jan 2008; Hum. Mol. Genet.
Sorbi, Audrey Versini, Mònica Gratacòs and Xavier Estivill Gorwood, Johannes Hebebrand, Anke Hinney, Benedetta Nacmias, Anna Puig, Marta Ribasés, Valdo Ricca, Lucia Romo, SandroMara Dierssen, Geòrgia Escaramís, Fernando Fernández-Aranda, Laura Forcano, Xavier Gallego, Juan Ramón González, Philip Josep Maria Mercader, Ester Saus, Zaida Agüera, Mònica Bayés, Claudette Boni, Anna Carreras, Elena Cellini, Rafael de Cid,pathway in eating disorders
suggest an altered cross-regulation of the neurotrophin signalingNGF and its interaction with NTRK3Association of
Supplement/Special Issue http://hmg.oxfordjournals.org/cgi/content/full/ddn013/DC1
"Supplementary Data"This article is part of the following issue:
http://hmg.oxfordjournals.org/cgi/content/full/17/9/1234The full text of this article, along with updated information and services is available online at
References http://hmg.oxfordjournals.org/cgi/content/full/17/9/1234#BIBL
This article cites 82 references, 25 of which can be accessed free at
Supplementary material http://hmg.oxfordjournals.org/cgi/content/full/ddn013/DC1
Data supplements for this article are available at
Reprints http://www.oxfordjournals.org/corporate_services/reprints.html
Reprints of this article can be ordered at
Email and RSS alerting Sign up for email alerts, and subscribe to this journal’s RSS feeds at http://hmg.oxfordjournals.org
image downloadsPowerPoint® Images from this journal can be downloaded with one click as a PowerPoint slide.
Journal informationat http://hmg.oxfordjournals.org Additional information about Human Molecular Genetics, including how to subscribe can be found
Published on behalf ofhttp://www.oxfordjournals.org Oxford University Press
at PCH AGAM on 30 June 2008 http://hmg.oxfordjournals.orgDownloaded from

Association of NTRK3 and its interaction with NGFsuggest an altered cross-regulation of theneurotrophin signaling pathway in eating disorders
Josep Maria Mercader1,2, Ester Saus1,2, Zaida Aguera3, Monica Bayes1,2,4, Claudette Boni5,
Anna Carreras1,2,4, Elena Cellini6, Rafael de Cid1,2,4, Mara Dierssen1,7, Georgia Escaramıs2,1,
Fernando Fernandez-Aranda8,3, Laura Forcano3, Xavier Gallego1, Juan Ramon Gonzalez9,4,
Philip Gorwood5, Johannes Hebebrand10, Anke Hinney10, Benedetta Nacmias6, Anna Puig1,2,4,
Marta Ribases11, Valdo Ricca6, Lucia Romo12, Sandro Sorbi6, Audrey Versini13,
Monica Gratacos2,1,4,� and Xavier Estivill1,2,4,14
1Genes and Disease Program, Center for Genomic Regulation (CRG), 08003 Barcelona, Catalonia, Spain, 2CIBER en
Epidemiologıa y Salud Publica (CIBERESP), Instituto de Salud Carlos III 08003 Barcelona, Catalonia, Spain, 3CIBER
Fisiopatologia Obesidad y Nutricion (CIBEROBN), Instituto de Salud Carlos III 08003 Barcelona, Catalonia, Spain,4National Center of Genotyping (CEGEN), Barcelona Node, 08003 Barcelona, Catalonia, Spain, 5Hospital Louis
Mourier, Pr Ades Department, 75014 Paris, France, 6Department of Neurological and Psychiatric Sciences, University
of Florence, 50121 Florence, Italy, 7CIBER Enfermedades Raras (CIBERER), Instituto de Salud Carlos III 08003
Barcelona, Catalonia, Spain, 8Department of Psychiatry, University Hospital of Bellvitge, L’Hospitalet de Llobregat,
08907 Barcelona, Catalonia, Spain, 9Center for Research in Environmental Epidemiology (CREAL), 08003 Barcelona,
Catalonia, Spain, 10Rheinische Kliniken Essen, Department of Child and Adolescent Psychiatry, University of
Duisburg-Essen, 45147 Essen, Germany, 11Department of Psychiatry, Hospital Universitari Vall d’Hebron, Universitat
Autonoma de Barcelona, 08035 Barcelona, Catalonia, Spain, 12CMME Sainte Anne, 100 rue de la Sante, 75014 Paris,
France, 13INSERM U675, University Xavir Bichat (IFR02), 75018 Paris, France and 14Experimental and Health
Sciences Department, Pompeu Fabra University, 08003 Barcelona, Catalonia, Spain
Received October 26, 2007; Revised January 8, 2008; Accepted January 16, 2008
Eating disorders (EDs) are complex psychiatric diseases that include anorexia nervosa and bulimia nervosa, andhave higher than 50% heritability. Previous studies have found association of BDNF and NTRK2 to ED, whileanimal models suggest that other neurotrophin genes might also be involved in eating behavior. We have per-formed a family-based association study with 151 TagSNPs covering 10 neurotrophin signaling genes: NGFB,BDNF, NTRK1, NGFR/p75, NTF4/5, NTRK2, NTF3, NTRK3, CNTF and CNTFR in 371 ED trios of Spanish, Frenchand German origin. Besides several nominal associations, we found a strong significant association after correct-ing for multiple testing (P 5 1.04 3 1024) between ED and rs7180942, located in the NTRK3 gene, which followedan overdominant model of inheritance. Interestingly, HapMap unrelated individuals carrying the rs7180942 riskgenotypes for ED showed higher levels of expression of NTRK3 in lymphoblastoid cell lines. Furthermore,higher expression of the orthologous murine Ntrk3 gene was also detected in the hypothalamus of the anx/anxmouse model of anorexia. Finally, variants in NGFB gene appear to modify the risk conferred by the NTRK3rs7180942 risk genotypes (P 5 4.0 3 1025) showing a synergistic epistatic interaction. The reported data,in addition to the previous reported findings for BDNF and NTRK2, point neurotrophin signaling genes as keyregulators of eating behavior and their altered cross-regulation as susceptibility factors for EDs.
�To whom correspondence should be addressed at: Monica Gratacos CIBER en Epidemiologıa y Salud Publica (CIBERESP), Genes & DiseaseProgram Center for Genomic Regulation (CRG), Placa Charles Darwin s/n (Dr. Aiguader 88), PRBB Building, Room 521, 08003 Barcelona, Catalonia,Spain. Tel: þ34 933160138; Fax: þ34 933160099; Email: [email protected]
# 2008 The Author(s).This is an Open Access article distributed under the terms of the Creative Commons Attribution Non-Commercial License(http://creativecommons.org/licenses/by-nc/2.0/uk/) which permits unrestricted non-commercial use, distribution, and reproductionin any medium, provided the original work is properly cited.
Human Molecular Genetics, 2008, Vol. 17, No. 9 1234–1244doi:10.1093/hmg/ddn013Advance Access published on January 18 2008
INTRODUCTION
Eating disorders (EDs) are multifactorial psychiatric diseasesthat include anorexia nervosa (AN), bulimia nervosa (BN)and other intermediate or atypical conditions (1). During thelast years, the incidence of these disorders has increased inindustrialized countries and have become a growingproblem, especially among adolescents (2). In the etiologyof these disorders, genetic, psychological, socio-cultural,nutritional, neurochemical and hormonal factors seem to pre-dispose, unleash or maintain the condition (3,4).
Family and twin studies have estimated that 33–84% of thevariance in the predisposition to AN (5,6) and 58–83% to BN(7–9) may be genetic in nature. Furthermore, there is evidencethat common etiologic features contribute to both AN and BN,and a shared familial component between the two disordershas been described (10–12).
The family of neurotrophins comprises four related proteins,namely nerve growth factor (NGFB), brain-derived neuro-trophic factor (BDNF) and neurotrophins 3 and 4/5 (NTF3and NTF4/5). The effects of neurotrophins are mediated byhigh affinity tyrosine kinase receptors, each preferentially acti-vated by one or more neurotrophins: NTRK1 by NGFB,NTRK2 by BDNF and NTF4/5, and NTRK3 by NTF3.Besides them, a low-affinity pan-neurotrophin receptor (p75),a member of the tumor necrosis factor family, forms acomplex with other neurotrophin receptors and modulates itssignal transduction (reviewed in 13,14). During development,neurotrophins play important roles in proliferation, differen-tiation and survival of neurons in both the central and peripheralnervous system. In adults, they control neural plasticity andregulate synaptic activity and neurotransmitter synthesis(reviewed in 15). There is an increasing recognition that thepathophysiology of several mental disorders, includingdepression, anxiety, schizophrenia and drug addiction, couldbe the result of a local deregulation of synaptic plasticity. Apossible neurobiological explanation for this theory would bean altered synthesis and/or release of neurotrophins (16–19).
Since BDNF and its receptor NTRK2 have been shown tobe involved in the regulation of eating behavior and energybalance (16,20), we and others have studied the role of vari-ation in these genes in ED and determined that both BDNFand NTRK2 play a role in the disease susceptibility (21–25).Furthermore, animal models suggest that other neurotrophinsmight also be involved in the regulation of food intake. Forexample, intracerebroventricular infusion of NGF causes acentrally mediated, dose-dependent hypophagia and weightloss in non-obese mice (26). Dietary restriction can enhancehippocampal neurogenesis in a mouse model, resulting in anincreased production of BDNF and NTF3 (27). In addition,NTF4 knockout mice exhibit deficits in feeding behavior,suggesting reduced food satiation (28,29). Indeed, the infusionof NTF4/5 into the third ventricle of BDNF heterozygousmutant mice can transiently reverse its hyperphagic andobese phenotype (16). Finally, ciliary neurotrophic factor(CNTF) and it’s receptor (CNTFR) have been shown toexert a neuroprotective effect in a non-human primate model(30), and CNTF has been described as a leptin-like moleculewith a profound effect on appetite and energy expenditure
(31,32). This effect is thought to be the result of the activationof signaling cascades in hypothalamic nuclei involved infeeding control (33–35).
We hypothesized that genetic variation in one or moregenes from the neurotrophic system, above and beyondBDNF and NTRK2, may lead to an abnormal modulation offeeding behavior and hence to EDs in humans. To test thishypothesis, we selected informative polymorphisms spanningthe entire loci of p75 (NGFR), NGFB, NTRK1, BDNF,NTRK2, NTF3, NTRK3, NTF4, CNTF and CNTFR, and vari-ations within each gene were analyzed in a set of 371 EDtrios of Spanish, French and German origin.
RESULTS
Data set consisted of 386 ED female trios from Barcelona,Paris and Marburg/Essen. Fifteen families were excludedfrom the analysis because they had more than three SNPswith Mendelian errors, and were thus considered false pater-nity. Thus, the final data set available for the analyses wascomposed of 371 trios (286 AN, 59 BN and 26 EDNOS).The demographic and clinical characteristics of the samplesare summarized in Table 1. A total of 183 TagSNPs wereselected for extensive coverage of the genomic regions corre-sponding to 10 neurotrophic factor and receptor genes: p75,NGFB, BDNF, NTF3, NTF4, CNTF, NTRK1, NTRK2,NTRK3 and CNTFR, which range in size from 6 to 409 kb.Each gene was tagged with a minimum of three and amaximum of 58 TagSNPs. The complete list of the genes,their chromosomal locations, the characteristics of theTagSNPs, as well as the linkage disequilibrium (LD) structureof each gene are shown in Supplementary Material, Table S1and Supplementary Material, Figures 2–10. For the analysis,we removed those SNPs, which showed ,80% genotypingsuccess rate (n ¼ 31) and one variant that deviated fromHardy–Weinberg equilibrium (alpha ¼ 0.01), ending up witha total of 151 SNPs. Genotype concordance with respect tothe HapMap reference trios was of 100%.
We found no evidence of genetic heterogeneity between thethree available groups of samples except for one variant inCNTFR, which was not included in the analysis. For the restof SNPs, there were no significant differences in their allelefrequencies among populations after correcting for multipletesting (Supplementary Material, Fig. S1). Thus, further ana-lyses were performed using the combined data set.
Single marker analysis
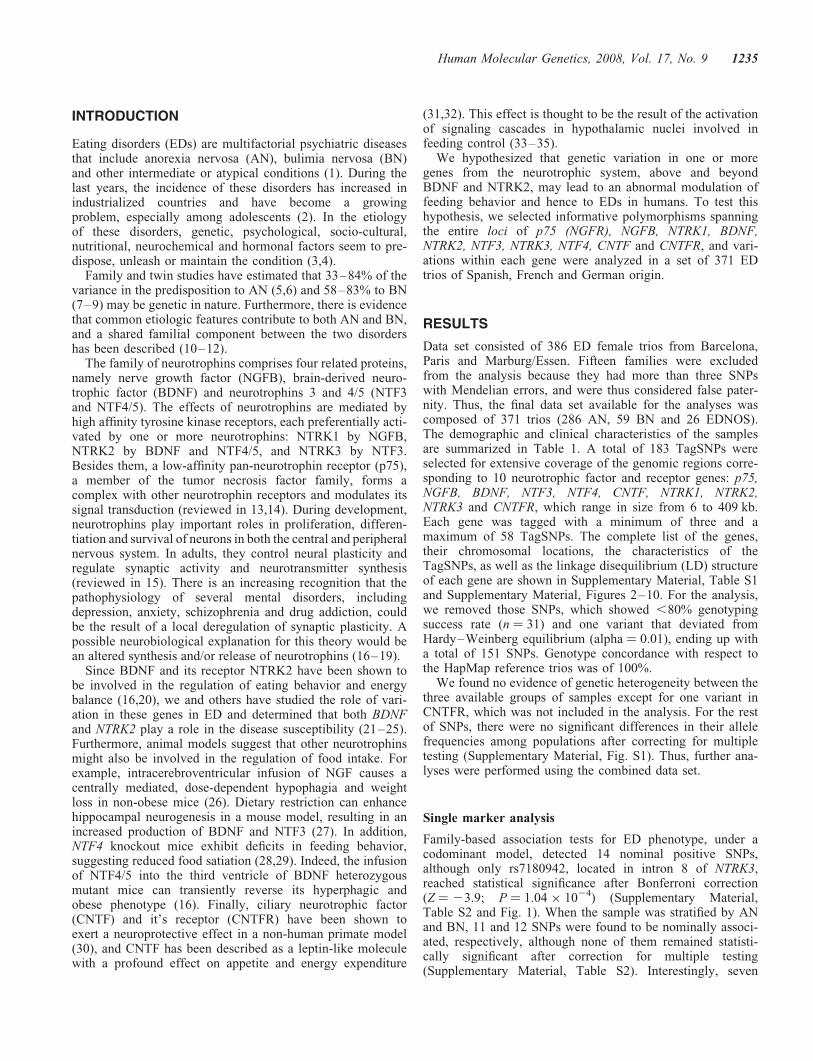
Family-based association tests for ED phenotype, under acodominant model, detected 14 nominal positive SNPs,although only rs7180942, located in intron 8 of NTRK3,reached statistical significance after Bonferroni correction(Z ¼ 23.9; P ¼ 1.04 � 1024) (Supplementary Material,Table S2 and Fig. 1). When the sample was stratified by ANand BN, 11 and 12 SNPs were found to be nominally associ-ated, respectively, although none of them remained statisti-cally significant after correction for multiple testing(Supplementary Material, Table S2). Interestingly, seven
Human Molecular Genetics, 2008, Vol. 17, No. 9 1235
SNPs in NTRK3 were associated with at least one of the clini-cal groups tested (Fig. 1).
Next, we focused on NTRK3 rs7180942 and performed astratified analysis subdividing AN between purging and non-purging subtype (ANP or ANR), and analyzed solelyBN-purging subtypes (BNP). In all disease phenotypes, theCT genotype was undertransmitted to probands, althoughonly in the case of ED it remained statistically significantwith Bonferroni correction (P ¼ 0.0001; excess of risk forhomozygous carriers¼1.85; 95%CI ¼ 1.25–2.85; Table 2).This model suggests an advantage for the heterozygous sub-jects over the homozygous for either allele.
Haplotype analysis
We determined the LD structure of the genomic region ofNTRK3 (Fig. 1) within our sample and identified a 47-kbblock (block 11 in Fig. 1) including the location ofrs7180942 and three additional SNPs. We further performedassociation tests with the HBAT algorithm from the P2BATsoftware (36), using all possible marker haplotypes containedin that block using heterozygous advantage as inheritancemodel for the ED phenotype. The stronger associationinvolved a common three-marker haplotype for rs7180942,rs10520676 and rs2162266, respectively (P ¼ 7.86 � 10205
in 143 informative families) (Table 3).
Bioinformatics search of functional consequences ofrs7180942
Through the interactive web-based SNP analysis tool Pupasuite(http://pupasuite.bioinfo.cipf.es/) (37), we found that none ofthe involved SNPs cause non-synonymous substitutions, nordisrupt putative transcription binding sites, putative exonic spli-cing enhancers or intron exon boundaries. When the most recentHapMap data (phase II release 22; April 2007) were considered,we estimated that rs7180942 is also capturing the variability offive highly correlated SNPs, namely rs8035239, rs1426300,
rs1110306, rs2059588 and rs3825882 (mean R2 ¼ 0.95). Weneither found any putative functional consequences of theseSNPs using the Pupa Suite website.
Interaction analysis
We further looked for a gene–gene effect and performed aninteraction analysis to find other variants over or undertrans-mitted in patients dependent on the rs7180942 genotype. Forthat purpose, we distinguished between families with a hetero-zygous descendant for rs7180942 (the undertransmitted geno-type in ED patients) and families with a homozygous affectedoffspring for either allele. Following an additive model,families with homozygous offspring for rs7180942 werefound strongly associated with rs17033706, located in NGFBgene, which remained significant after Bonferroni correction.Thus, we observed overtransmission of the A allele inrs17033706 in families with homozygous offspring forrs7180942 [Transmission odds ratio for rs7180942 Homozy-gous: 13.69 (3.43–54.60), Transmission odds ratio forrs7180942 Heterozygous 3.45 (1.03–11.11), InteractionP-value (5.64 � 1025)] (Table 4).
Effect of rs7180942 genotype in NTRK3 expression
To assess a possible functional role of this SNP on theexpression of NTRK3, we extracted the normalized expressiondata from HapMap lymphoblastoid cell lines (38) correspondingto Illumina probe GI_4505474.S, located in the 30coding-UTRboundaries of the full length NTRK3 isoform. When wetested its correlation with the three different genotypes ofrs7180942, we found that the heterozygous samples presentedsignificantly lower expression levels (P ¼ 0.017), which isin agreement with the heterozygous advantage/overdominantmodel of inheritance found to be associated to ED. The othervariants within the same 47-kb block (block 11 in Fig. 1),rs10520676, rs2162266 and rs3784406, were not associatedwith the levels of expression of NTRK3.
Table 1. Distribution of clinical subtypes of patients with EDs in the different populations and demographical information
Phenotype Spain trios France trios German trios Total
Eating disorders 121 168 82 371Anorexia nervosa 54 168 64 286Restrictive AN 23 82 37 142Purging AN 31 83 13 127Bulimia nervosa 53 0 6 59Purgative BN 51 0 4 55Non-purging BN 2 0 0 2EDNOS 14 0 12 26AN MinBMI (95%CI) 15.4 (15–15.9) 13.7 (13.4–13.9) 13.8 (13.2–14.4) 14 (13.7–14.2)AN age at onset (95%CI) 18 (17–19.0) 16.1 (15.5–16.7) 15.4 (14.7–16.1)a 16.5 (15.9–16.9)BN MinBMI (95%CI) 19.1(18.3–19.9) NA NA 19 (18.2–19.8)BN age at onset (95%CI) 18.5(17–19.99) NA NA 18.5(17–19.99)
NA, non-available information; ED, eating disorders; AN, anorexia nervosa; BN, bulimia nervosa; EDNOS, ED not otherwise specified; MinBMI,minimum body mass index.aIn the case of the Marburg/Essen sample, age at onset of weight loss was assessed instead of age at onset.
1236 Human Molecular Genetics, 2008, Vol. 17, No. 9
Ntrk3 expression in the anx/anx anorexia mouse model
The anx anorexia murine model (39) is caused by anautosomal recessive mutation located �20 cM proximal to
the agouti locus on mouse chromosome 2. The mutationentails decreased food intake, growth retardation andemaciated appearance. Because the anx/anx mouse is anattractive genetic model of feeding behavior, we used a
Figure 1. FBAT results and P-values for the NTRK3 SNPs analyzed in the present study with ED, AN and BN phenotypes. Bars are only represented when P ,
0.05. The bottom line represents the threshold for nominal P-values (0.05), the upper line represents the threshold for Bonferroni correction. NTRK3 isoforms arerepresented as well as the location of the Illumina probe GI_4505474-S probe used in the analysis of the effect of the rs7180942 genotype in NTRK3 expression.Below, LD plot of the region. Colors represent D’ values and numbers the corresponding R2 values.
Table 2. Association of NTRK3 rs7180942 in eating disorder phenotypes
Genotype Frequency Fam# S E(S) Var(S) Z P
Eating disordersC/C 0.231 110 57 43 24.5 2.828 0.005�
C/T 0.472 166 58 83 41.5 23.881 1.0 � 1024��
T/T 0.296 108 53 42 24 2.245 0.025�
Anorexia nervosaC/C 0.231 77 40 29.5 17 2.547 0.011�
C/T 0.472 119 42 59.5 29.75 23.208 0.001�
T/T 0.296 78 37 30 17.25 1.685 0.092Anorexia nervosa purging
C/C 0.231 32 19 12.75 7.188 2.331 0.02�
C/T 0.472 42 12 21 10.5 22.777 0.005�
T/T 0.296 23 11 8.25 4.938 1.238 0.216Anorexia nervosa restrictive
C/C 0.231 40 21 15.25 8.812 1.937 0.053C/T 0.472 67 25 33.5 16.75 22.077 0.038�
T/T 0.296 46 21 18.25 10.312 0.856 0.392Bulimia nervosa purging
C/C 0.231 23 12 9 5.125 1.325 0.185C/T 0.472 35 12 17.5 8.75 21.859 0.063T/T 0.296 24 12 9.5 5.375 1.078 0.281
Fam#, number of informative families; S, observed transmission of genotype to affected offspring; E, expected transmission under Mendelianinheritance; Var, variance S-E. P, two-tailed P-value.�Significant P-value , 0.05.��Significant P-value after Bonferroni correction (P , 1.11�1024).
Human Molecular Genetics, 2008, Vol. 17, No. 9 1237
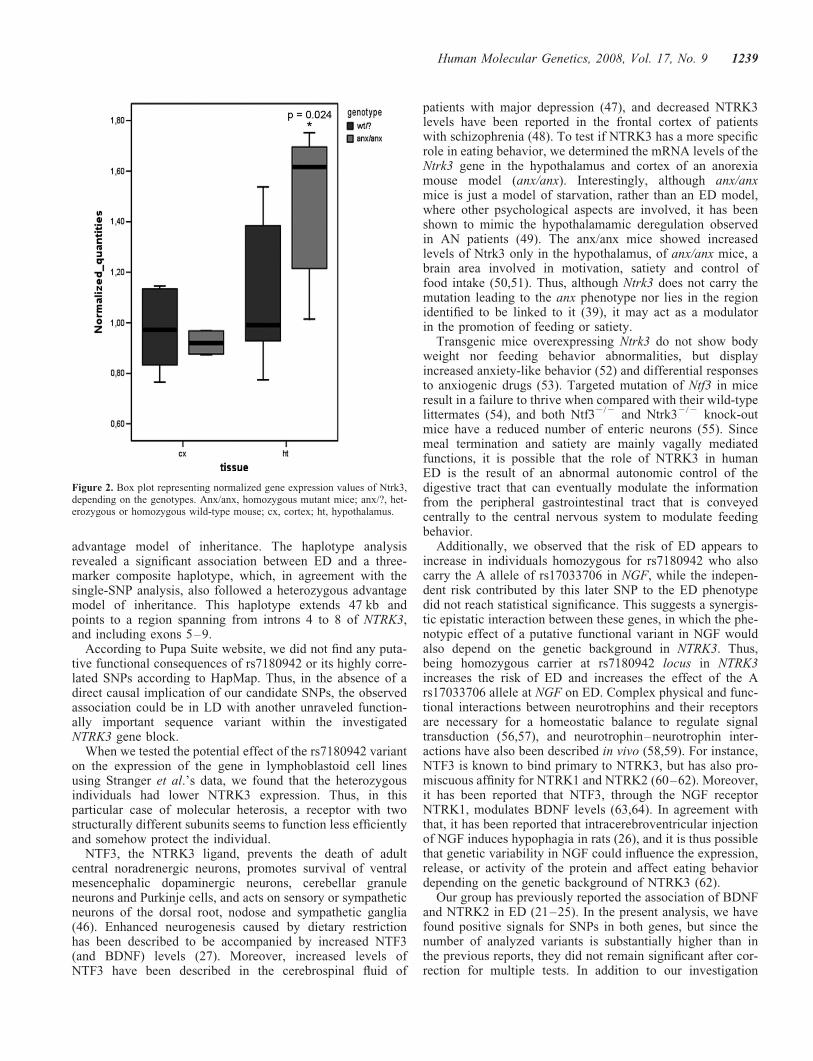
comparative functional genomics approach to determine theputative involvement of NTRK3 in the regulation of energymetabolism and feeding. Hence, we determined inter-individual expression differences for Ntrk3 gene in thecortex and hypothalamus of three anx/anx mice and threecontrol littermates by quantitative PCR (TaqMan). We foundthat the Ntrk3 mRNA levels were increased in the hypothalamusof anx/anx mice, whereas no differences were found in thelevels of expression when comparing the cortex [P¼0.024,ratio¼1.36; 95% CI¼(1.002–1.848); and P¼0.464, foldchange¼0.98; 95% CI¼(0.73–1.34), respectively] (Fig. 2).
DISCUSSION
We have carried out a pathway-based candidate gene approachto perform a family-based analysis and tested for associationbetween neurotrophic factors and their receptors and the sus-ceptibility to EDs. Both single and multiple-marker analysisshowed a strong association between NTRK3 and ED with aheterozygous advantage model of inheritance, which remainedsignificant after correcting for multiple testing. These resultsare in agreement with the reduced NTRK3 expression levelsobserved in lymphoblastoid cell lines of heterozygous individ-uals for rs7180942 (38) and suggest that increased NTRK3function may contribute to the predisposition to ED.
The heterozygous advantage mode of inheritance, alsoknown as molecular heterosis, has received little attention,although it has been postulated as occurring in up to 50% ofall gene associations in psychiatric disorders or personalitytraits (40,41).
Several genes, many of them involved in cognitive and psy-chiatric problems, such as ADRA2C, DRD1, DRD2, DRD3,
DRD4, HTR2A, SLC6A4 have been reported to follow a het-erozygous advantage model of inheritance (reviewed in 40).Examples include the T102C polymorphism of the serotonin2A receptor gene and neuroticism scores, the dopamine D2receptor TaqI A1/A2 polimorphism and symptoms of ADHD(42) and pathological gambling (43), or a negative heterosiseffect of the DdeI polymorphism in the dopamine D1 receptorgene and the scores for the quantitative traits of alcohol abuse,compulsive eating, gambling and tics (44).
At the biological level, it is well established that all neuro-trophin receptors dimerize in response to ligand, leading toactivation of the tyrosine kinase domain (reviewed in 45).At the molecular level, perhaps the function of the NTF3receptor differs depending on the interaction of the subunitpolypeptides and, thus, in the particular case of molecular het-erosis, homodimers might be more efficient than receptorswith two structurally different subunits and, somehow, mayparticipate in the biological susceptibility to AN and BN.Nevertheless, how the particular variants that we have ident-ified, or other functional variants in LD with them, can poten-tially affect the protein and result in an allosteric effectremains to be clarified.
In fact, we observed nominal associations at all genes for atleast one SNP and one ED subtype. Of those, NTRK3 (thehigh affinity receptor for NTF3) appears to be the gene withmore association signals, since eight SNPs were associatedto either ED, AN or BN. The strongest association, whichwas still significant after correcting for multiple testing, wasfound with the ED phenotype and rs7180942, located inintron 8 of NTRK3. We specifically observed an undertrans-mission of the heterozygous genotype to the affected off-spring, together with an overtransmission of bothhomozygous genotypes, which is known as heterozygous
Table 4. Results of the TDT analyses for rs17033706 in NGF interaction with rs7180942 in NTRK3 in only families with rs7180942 heterozygous (protectivegenotypes) patients and in only families with rs7180942 homozygous (risk genotypes) patients
rs17033706 allele Allele frequency Overtransmitted T:U Transmission odds ratio (95% CI) Interaction P-value
Only homozygous (rs7180942) 5.64 � 1025��
A 0.79 A 37:10 13.69 (3.43–54.60)G 0.21
Only heterozygous (rs7180942)A 0.35 G 28:15 3.45 (1.03–11.11)G 0.65
Interaction P-value has been calculated using a conditional logistic regression model. T:U, transmitted versus non-transmitted ratio.��P-value significant after Bonferroni correction P , 4.85 � 1024.
Table 3. Associated haplotype compositions within NTRK3 in eating disorders
SNPs Haplotype� Haplotype frequency Fam# P-value (FBAT) Power (FBAT)
rs7180942–rs10520676–rs2162266 T_G_G 0.488 143 7.86 � 10205�� 0.17rs7180942–rs3784406–rs2162266 T_G_G 0.480 127 0.0005�� 0.57rs7180942–rs3784406–rs10520676 T_G_G 0.473 127 0.0007�� 0.68rs3784406–rs10520676–rs2162266 G_G_G 0.535 134 0.0011�� 0.22
Fam#, number of informative families.�For the heterozygous advantage model of inheritance, this column represents the haplotype that is carried in heterozygosis.��Significant after Bonferroni correction, 29 tests performed (P , 0.0017).
1238 Human Molecular Genetics, 2008, Vol. 17, No. 9
advantage model of inheritance. The haplotype analysisrevealed a significant association between ED and a three-marker composite haplotype, which, in agreement with thesingle-SNP analysis, also followed a heterozygous advantagemodel of inheritance. This haplotype extends 47 kb andpoints to a region spanning from introns 4 to 8 of NTRK3,and including exons 5–9.
According to Pupa Suite website, we did not find any puta-tive functional consequences of rs7180942 or its highly corre-lated SNPs according to HapMap. Thus, in the absence of adirect causal implication of our candidate SNPs, the observedassociation could be in LD with another unraveled function-ally important sequence variant within the investigatedNTRK3 gene block.
When we tested the potential effect of the rs7180942 varianton the expression of the gene in lymphoblastoid cell linesusing Stranger et al.’s data, we found that the heterozygousindividuals had lower NTRK3 expression. Thus, in thisparticular case of molecular heterosis, a receptor with twostructurally different subunits seems to function less efficientlyand somehow protect the individual.
NTF3, the NTRK3 ligand, prevents the death of adultcentral noradrenergic neurons, promotes survival of ventralmesencephalic dopaminergic neurons, cerebellar granuleneurons and Purkinje cells, and acts on sensory or sympatheticneurons of the dorsal root, nodose and sympathetic ganglia(46). Enhanced neurogenesis caused by dietary restrictionhas been described to be accompanied by increased NTF3(and BDNF) levels (27). Moreover, increased levels ofNTF3 have been described in the cerebrospinal fluid of
patients with major depression (47), and decreased NTRK3levels have been reported in the frontal cortex of patientswith schizophrenia (48). To test if NTRK3 has a more specificrole in eating behavior, we determined the mRNA levels of theNtrk3 gene in the hypothalamus and cortex of an anorexiamouse model (anx/anx). Interestingly, although anx/anxmice is just a model of starvation, rather than an ED model,where other psychological aspects are involved, it has beenshown to mimic the hypothalamamic deregulation observedin AN patients (49). The anx/anx mice showed increasedlevels of Ntrk3 only in the hypothalamus, of anx/anx mice, abrain area involved in motivation, satiety and control offood intake (50,51). Thus, although Ntrk3 does not carry themutation leading to the anx phenotype nor lies in the regionidentified to be linked to it (39), it may act as a modulatorin the promotion of feeding or satiety.
Transgenic mice overexpressing Ntrk3 do not show bodyweight nor feeding behavior abnormalities, but displayincreased anxiety-like behavior (52) and differential responsesto anxiogenic drugs (53). Targeted mutation of Ntf3 in miceresult in a failure to thrive when compared with their wild-typelittermates (54), and both Ntf32/2 and Ntrk32/2 knock-outmice have a reduced number of enteric neurons (55). Sincemeal termination and satiety are mainly vagally mediatedfunctions, it is possible that the role of NTRK3 in humanED is the result of an abnormal autonomic control of thedigestive tract that can eventually modulate the informationfrom the peripheral gastrointestinal tract that is conveyedcentrally to the central nervous system to modulate feedingbehavior.
Additionally, we observed that the risk of ED appears toincrease in individuals homozygous for rs7180942 who alsocarry the A allele of rs17033706 in NGF, while the indepen-dent risk contributed by this later SNP to the ED phenotypedid not reach statistical significance. This suggests a synergis-tic epistatic interaction between these genes, in which the phe-notypic effect of a putative functional variant in NGF wouldalso depend on the genetic background in NTRK3. Thus,being homozygous carrier at rs7180942 locus in NTRK3increases the risk of ED and increases the effect of the Ars17033706 allele at NGF on ED. Complex physical and func-tional interactions between neurotrophins and their receptorsare necessary for a homeostatic balance to regulate signaltransduction (56,57), and neurotrophin–neurotrophin inter-actions have also been described in vivo (58,59). For instance,NTF3 is known to bind primary to NTRK3, but has also pro-miscuous affinity for NTRK1 and NTRK2 (60–62). Moreover,it has been reported that NTF3, through the NGF receptorNTRK1, modulates BDNF levels (63,64). In agreement withthat, it has been reported that intracerebroventricular injectionof NGF induces hypophagia in rats (26), and it is thus possiblethat genetic variability in NGF could influence the expression,release, or activity of the protein and affect eating behaviordepending on the genetic background of NTRK3 (62).
Our group has previously reported the association of BDNFand NTRK2 in ED (21–25). In the present analysis, we havefound positive signals for SNPs in both genes, but since thenumber of analyzed variants is substantially higher than inthe previous reports, they did not remain significant after cor-rection for multiple tests. In addition to our investigation
Figure 2. Box plot representing normalized gene expression values of Ntrk3,depending on the genotypes. Anx/anx, homozygous mutant mice; anx/?, het-erozygous or homozygous wild-type mouse; cx, cortex; ht, hypothalamus.
Human Molecular Genetics, 2008, Vol. 17, No. 9 1239

(22,24,25,65), the present study also suggests the involvementof NTRK3 and NGF, and put forward the possibility that EDcould be the result of an altered cross-regulation of the differ-ent members of the neurotrophin signaling pathway. Thiswould entail an unbalanced biochemical interaction betweenligands, their receptors and their intracellular target proteinsthat could eventually affect functions related to both specificcentral and peripheral neuronal populations. This hypothesisis in agreement with eating behavior being a complexphenomenon which results from the interaction of differentbrain regions and many factors, including olfactory, visual,emotional and higher cognitive inputs, as well as several nutri-tional signals coming from the periphery.
Although family-based association studies circumvent thepossible false positives due to population admixture and stra-tification and avoid spurious associations due to differences inallele frequencies among various populations (66), furtherstudies including a larger number of probands are needed inorder to conclude which of the nominal associations are truepositives and to confirm the interaction between the differentmolecules. Neurotrophins have been shown to be involvedin different mental diseases like major depression, bipolar dis-order, schizophrenia or substance abuse (24,67), but to ourknowledge, no interaction between them has been described.
There is substantial comorbidity between ED and psychiatricdisorders, and comorbid Axis I and II psychopathology is associ-ated with higher levels of severity in ED symptoms (68–74). It isprobable that several factors account for this associations and,although not controlled in our analyses, may represent a mani-festation of a shared transmission (42). Thus, we propose thatthis study presents an interesting unexplored genomic pathwayto screen that could validate the neurotrophin hypothesis roleon the development of psychiatric disorders (19,67).
MATERIALS AND METHODS
Subjects and phenotype
All subjects fulfilled DSM-IV (Diagnostic and StatisticalManual of Mental Disorders, 4th edition) criteria for ED. Allthe participants were diagnosed as having ED as the main dis-order with the Structured Clinical Interview for Mental Dis-orders, research version 2.0 (SCID-I) for the Spanishpatients, the Diagnostic Interview for Genetic Studies(DIGS) for the French patients, and the Composite Inter-national Diagnostic Interview (CIDI) for the German partici-pants. All the patients were women and most of them havebeen studied in previous reports (21,75,76). Diagnosis wasblind to genotype. The study had ethics approval from eachcenter Ethics Committee and written informed consent wasobtained from all participants.
After excluding 15 cases due to false paternity, the data setconsisted of 371 ED patients: 121 from Spain, 168 fromFrance and 82 from Germany. Clinical subtypes of each popu-lation are summarized in Table 1. Briefly, we obtained 286 ANtrios: 142 restricting subtype (ANR), 127 purging subtype(ANP) and 17 not yet classified as restricting orbinge-eating/purging subtype due to insufficient time elapsed(3 years) of restricting illness. Finally, we also obtained 59BN trios: 55 binge-eating/purging (BNP), 2 non-purging
subtype (BNNP) and 2 cases not classified as binge-eating/purging or non-purging subtype, and 26 ED not otherwisespecified (EDNOS). The lifetime minimum body mass index(minBMI) was 14.0 kg/m2 (13.7–14.24) for AN patients and19.0 kg/m2 (18.2–19.85) for BN patients. The lifetimemaximum body mass index (maxBMI) was 21.2 kg/m2
(20.7–21.7) for AN patients and 25.9 kg/m2 (24.4–27.3) forBN patients. The average age at onset was 16.5 (15.9–16.99) for AN patients and 18.5 (17–19.99) for BN patients.
SNPs and genotyping
From the HapMap project data set, we utilized genotypes fromthe public release 16 (phase I data freeze; dbSNP b124) corre-sponding to the 90 individuals from the CEPH 30 trios ofEuropean descent (http://www.hapmap.org). Only SNPshaving a unique mapping location on the NCBI B34 assemblyand a minor allele frequency (MAF) higher than 10% wereconsidered for further analysis. Bins of common SNPs instrong LD, as defined by R2 higher than 0.85, were identifiedwithin this data set by using HapMap-LDSelect-Processor,which uses the ‘LD Select’ method to process HapMap geno-type dump format data corresponding to the locus region foreach gene, covering the entire gene and 10 kb upstream anddownstream the gene. One hundred and eighty threeTagSNPs were selected for coverage of all bins for a total of10 genes (Supplementary Material, Table S1). Block structureaccording to our data was evaluated by Haploview softwareversion 3.2 (77), using the Solid Spine of LD method.
TagSNPs were genotyped using the SNPlex GenotypingSystem. SNPs that passed the design rules for the developmentof good assays were selected. For the genotyping process, wefollowed the manufacturer’s protocol for the SNPlex Multi-plex Genotyping Systems (Applied Biosystems, Foster City,CA, USA): 12 ml of each DNA sample at 75 ng/ml were frag-mented by boiling at 998C for 10 min and 2 ml (150 ng) wereallowed to dehydrate in a 384-well plate. Four custom multi-plex pools (currently up to 48-plex) were designed, syn-thesized and formulated by the manufacturer. Themanufacturer’s specifications were followed through phos-phorylation, oligonucleotide ligation, exonuclease clean-up,PCR and hybridization steps (Applied Biosystems, FosterCity, CA, USA). All reactions were set up in a 384-wellformat using various robotic systems. The high-throughputgenotyping assays were performed at the genotyping facilitiesof CeGen, in the Barcelona Node (Centro Nacional de Geno-tipado, Genoma Espana).
Researchers performing the genotypes were blinded respectto phenotype. In addition to internal positive and negativecontrols provided by ABI for the SNPlex procedure, we ana-lyzed the genotype concordance and the Mendelian inheritancein six samples corresponding to two HapMap reference trios:samples NA10860, NA10861, NA11992, NA11993, NA11994and NA11995 (family numbers CEPH131 and CEPH132).Genotype concordance was tested using SNPator (http://www.CEGEN.org) and Mendelian inheritance was tested usingFBAT software. Families with more than three SNPs that pre-sented Mendelian errors were excluded from the analysis.Hardy–Weinberg equilibrium and LD of SNPs were assessedby the Haploview v2.03 software.
1240 Human Molecular Genetics, 2008, Vol. 17, No. 9

Sample power calculation
The power of our sample was calculated with the HelixTreesoftware (Golden Helix, Bozeman, MT, USA), assuming apopulation prevalence of 2%, an allele frequency of 0.1 andOdds Ratio of 1.5. The minimum power of the wholesample was 77%. For the haplotype analysis, the power wascalculated post-hoc with HelixTree software. Finally, thepower to detect an interaction effect of 1.8 in a sample of350 trios was 98% and was calculated post hoc with theQuanto software (78,79).
Heterogeneity analysis
We excluded genetic heterogeneity among centers comparingallelic frequencies of the patients’ parents from the differentcenters with the SNPassoc software (80), that carries out like-lihood ratio statistic tests, for all SNPs.
Family-based association study
For the family-based association study we used FBAT (81),and P2BAT (36), which is implemented in HelixTreeversion 5.2.0 (Golden Helix, Inc, Bozeman, MT). Using theFBAT software, the codominant model that computes Zscores for the three possible genotypes was used as a firstscreening for the single-marker analysis. Bonferroni correctionfor 150 SNPs that passed genotyping quality controls and EDsubtypes (total ED, AN and BN), was used for multiple com-parisons. Thus, significant P-values were lowered to P ¼1.11 � 1024.
Haplotype analysis was performed with the HBAT algor-ithm from the P2BAT software (36) implemented in HelixTree(Golden Helix, Bozeman, MT, USA), which computes haplo-types before executing FBAT using bi-allelic and multi-allelicmodes, and which permits the use of the heterozygous advan-tage/overdominant model. The Jiang et al. (82) approach wasused for the Family-Based Association analysis. Bonferronicorrection was applied taking into account the number oftests calculated by the P2BAT software.
Interaction analysis
We performed conditional logistic regressions to find outinteractions with rs7180942 and all the other SNPs, exceptthose ones in NTRK3. For this purpose we identified thefamilies with homozygous offspring for both rs7180942alleles and with offspring heterozygous for rs7180942. Theconditional logistic regression models will take into accountthe matched pair of observations generated by each parent-proband. For each analysis we calculated the odds oftransmission for the over transmitted allele (Ai) of the SNPof interest versus its non-transmission for both homozygousand heterozygous offspring’s for rs7180942. The logisticregression model is:
logPðtransmissionÞ
1� PðtransmissionÞ
� �¼ b0 þ b1Ai þ b2rs7180942
þ gAi�rs7180942
where testing the hypothesis that g ¼ 0 becomes the test ofgene–gene interaction. We calculated the log likelihoodratio statistic for hypothesis testing. Furthermore, eb1 rep-resents the odds ratio for transmission of Ai to the heterozy-gous for rs7180942 and eb1þ g is the odds ratio fortransmission of Ai to the homozygous offsprings for rs718042.
To ensure a global type I error of at most 0.05, we used thefull interaction strategy for Bonferroni correction (83) and setthe significance level of the test to 4.85 � 1024.
Association of NTRK3 SNPs with expression levels
Whole genome Illumina lymphoblastoid cell line geneexpression data from 210 unrelated HapMap individuals wasextracted from the GSE6536 series data set in GeneExpression Omnibus (GEO) site (http://www.ncbi.nlm.nih.gov/geo) (38). The probe of interest, in that case probeGI_4505474.S, located in the 30coding/30-UTR boundaries ofNTRK3 gene, was selected for the analysis. Genotype dataof rs7180942 from 210 unrelated individuals from CEPH(from European, African and Asian ancestry) was downloadedfrom HapMap browser (http://www.hapmap.org/cgi-perl/gbrowse/hapmap_B35/). The association analysis betweenthis SNP and the levels of expression for probeGI_4505474.S was tested using SNP assoc software for thedifferent genetic models, as described above.
Quantification of the levels of expression of Ntrk3 in theanx/anx murine model
Briefly, three anx/anx (B6C3Fe a/a- anx/J) and three wild-type(heterozygous or homozygous wild-type) littermates wereanesthetized with isofluoran and sacrificed at postnatal day14. Hypothalamus and cortex were dissected and frozen onliquid nitrogen. RNA was extracted through standardmethods using TrizolTM. cDNA was obtained from totalRNA using the High Capacity Archive Kit from Applied Bio-systems (Applied Biosystems, Foster City, CA, USA). Pre-designed Taqman assays (Applied Biosystems, Foster City,CA, USA) were used to analyze the relative quantitativeexpression of Ntrk3 and three endogenous controls wereused to normalize the expression levels. The probes usedwere Mm00456222_m1 for Ntrk3, and endogenous controlswere Mm00495501_m1 for Xpr1, Mm00446973_m1 for Tbpand Mm01158417_g1 for Ywhaz. Two replicates were per-formed for each real-time PCR experiments. Relative quan-tities were calculated using qbase software (84) and thegeometric mean of the three endogenous controls was usedto normalize the expression. Relative quantities were calcu-lated using qbase software (78) and the geometric mean ofthe three endogenous controls was used to normalize theexpression. A linear mixed model (LMM) (85) was used tocompare the wild-type versus anx/anx expression. The LMMincluded the genotype (wild-type and anx/anx), the tissue(hypothalamus and cortex) and their interaction as fixedeffects. The littermates were included in the model asrandom effects in order to control the dependency of thefour measures taken from each littermate.
Human Molecular Genetics, 2008, Vol. 17, No. 9 1241

ACKNOWLEDGEMENTS
We thank Anna Wald for critically reading the manuscript.
Conflict of Interest statement. None declared.
FUNDING
Financial support was received from the Ministry of Educationand Science (SAF2005-01005), the ‘Fondo de InvestigacionesSanitarias de la Seguridad Social, FIS (PI040632; PI040619),the Department of Health (Generalitat de Catalunya) and theDepartment of Universities, Research and InformationSociety (2005SGR00008; 2005SGR 00322) (Generalitat deCatalunya), ‘EC Framework V ‘Factors in Healthy Eating’consortium (QLK1–1999-916) and Bundesministerium furBildung und Forschung (NGFN2 01GS0482, 01GS0483) andthe European Union (FP6 LSHMCT-2003-503041). J.M.M.was supported by the CRG under project SAF2002-00799(Spanish Ministry of Science and Education), and by fellow-ship of the Danone Institute. We thank also the support fromGenome Spain to the National Genotyping Center (CeGen).
REFERENCES
1. American Psychiatric Association (1994) DSM-IV: Diagnostic andStatistical Manual of Mental Disorders. The American PsychiatricAssociation, Washington, DC.
2. Keski-Rahkonen, A., Hoek, H.W., Susser, E.S., Linna, M.S., Sihvola, E.,Raevuori, A., Bulik, C.M., Kaprio, J. and Rissanen, A. (2007)Epidemiology and course of anorexia nervosa in the community.Am. J. Psychiatry, 164, 1259–1265.
3. Garner, D.M. (1993) Pathogenesis of anorexia nervosa. Lancet, 341,1631–1635.
4. Treasure, J. and Campbell, I. (1994) The case for biology in the aetiologyof anorexia nervosa. Psychol. Med., 24, 3–8.
5. Klump, K.L., Miller, K.B., Keel, P.K., McGue, M. and Iacono, W.G.(2001) Genetic and environmental influences on anorexia nervosasyndromes in a population-based twin sample. Psychol. Med., 31,737–740.
6. Wade, T.D., Bulik, C.M., Neale, M. and Kendler, K.S. (2000) Anorexianervosa and major depression: shared genetic and environmental riskfactors. Am. J. Psychiatry, 157, 469–471.
7. Kendler, K.S., MacLean, C., Neale, M., Kessler, R., Heath, A. andEaves, L. (1991) The genetic epidemiology of bulimia nervosa.Am. J. Psychiatry, 148, 1627–1637.
8. Sullivan, P.F., Bulik, C.M. and Kendler, K.S. (1998) Geneticepidemiology of binging and vomiting. Br. J. Psychiatry, 173, 75–79.
9. Bulik, C.M., Sullivan, P.F. and Kendler, K.S. (1998) Heritability ofbinge-eating and broadly defined bulimia nervosa. Biol. Psychiatry, 44,1210–1218.
10. Walters, E.E. and Kendler, K.S. (1995) Anorexia nervosa andanorexic-like syndromes in a population-based female twin sample.Am. J. Psychiatry, 152, 64–71.
11. Lilenfeld, L.R., Kaye, W.H., Greeno, C.G., Merikangas, K.R., Plotnicov, K.,Pollice, C., Rao, R., Strober, M., Bulik, C.M. and Nagy, L. (1998) Acontrolled family study of anorexia nervosa and bulimia nervosa: psychiatricdisorders in first-degree relatives and effects of proband comorbidity. Arch.Gen. Psychiatry, 55, 603–610.
12. Strober, M., Freeman, R., Lampert, C., Diamond, J. and Kaye, W. (2000)Controlled family study of anorexia nervosa and bulimia nervosa:evidence of shared liability and transmission of partial syndromes.Am. J. Psychiatry, 157, 393–401.
13. Schor, N.F. (2005) The p75 neurotrophin receptor in human developmentand disease. Prog. Neurobiol., 77, 201–214.
14. Lu, B., Pang, P.T. and Woo, N.H. (2005) The yin and yang ofneurotrophin action. Nat. Rev. Neurosci., 6, 603–614.
15. Schinder, A.F. and Poo, M. (2000) The neurotrophin hypothesis forsynaptic plasticity. Trends Neurosci., 23, 639–645.
16. Kernie, S.G., Liebl, D.J. and Parada, L.F. (2000) BDNF regulates eatingbehavior and locomotor activity in mice. EMBO J., 19, 1290–1300.
17. Bersani, G., Iannitelli, A., Fiore, M., Angelucci, F. and Aloe, L. (2000)Data and hypotheses on the role of nerve growth factor and otherneurotrophins in psychiatric disorders. Med. Hypotheses, 55, 199–207.
18. Duman, R.S., Heninger, G.R. and Nestler, E.J. (1997) A molecular andcellular theory of depression. Arch. Gen. Psychiatry, 54, 597–606.
19. Lang, U.E., Jockers-Scherubl, M.C. and Hellweg, R. (2004) State of theart of the neurotrophin hypothesis in psychiatric disorders: implicationsand limitations. J. Neural. Transm., 111, 387–411.
20. Xu, B., Goulding, E.H., Zang, K., Cepoi, D., Cone, R.D., Jones, R.K.,Tecott, L.H. and Reichardt, L.F. (2003) Brain-derived neurotrophic factorregulates energy balance downstream of melanocortin-4 receptor. Nature
Neurosci., 6, 736–742.21. Ribases, M., Gratacos, M., Fernandez-Aranda, F., Bellodi, L., Boni, C.,
Anderluh, M., Cristina Cavallini, M., Cellini, E., Di Bella, D., Erzegovesi,S. et al. (2005) Association of BDNF with restricting anorexia nervosaand minimum body mass index: a family-based association study of eightEuropean populations. Eur. J. Hum. Genet., 13, 428–434.
22. Ribases, M., Gratacos, M., Badia, A., Jimenez, L., Solano, R., Vallejo, J.,Fernandez-Aranda, F. and Estivill, X. (2005) Contribution of NTRK2 tothe genetic susceptibility to anorexia nervosa, harm avoidance andminimum body mass index. Mol. Psychiatry, 10, 851–860.
23. Ribases, M., Gratacos, M., Armengol, L., de Cid, R., Badia, A.,Jimenez, L., Solano, R., Vallejo, J., Fernandez, F. and Estivill, X. (2003)Met66 in the brain-derived neurotrophic factor (BDNF) precursor isassociated with anorexia nervosa restrictive type. Mol. Psychiatry, 8,745–751.
24. Gratacos, M., Gonzalez, J.R., Mercader, J.M., de Cid, R.,Urretavizcaya, M. and Estivill, X. (2007) Brain-derived neurotrophicfactor Val66Met and psychiatric disorders: meta-analysis of case-controlstudies confirm association to substance-related disorders, eatingdisorders, and schizophrenia. Biol. Psychiatry, 61, 911–922.
25. Mercader, J.M., Ribases, M., Gratacos, M., Gonzalez, J.R., Bayes, M.,de Cid, R., Badia, A., Fernandez-Aranda, F. and Estivill, X. (2007)Altered brain-derived neurotrophic factor blood levels and genevariability are associated with anorexia and bulimia. Genes Brain Behav.,6, 706–716.
26. Williams, L.R. (1991) Hypophagia is induced by intracerebroventricularadministration of nerve growth factor. Exp. Neurol., 113, 31–37.
27. Lee, J., Seroogy, K.B. and Mattson, M.P. (2002) Dietary restrictionenhances neurotrophin expression and neurogenesis in the hippocampusof adult mice. J. Neurochem., 80, 539–547.
28. Chi, M.M., Fan, G. and Fox, E.A. (2004) Increased short-term foodsatiation and sensitivity to cholecystokinin in neurotrophin-4 knock-inmice. Am. J. Physiol. Regul. Integr. Comp. Physiol., 287, R1044–R1053.
29. Byerly, M.S. and Fox, E.A. (2006) High-fat hyperphagia inneurotrophin-4 deficient mice reveals potential role of vagal intestinalsensory innervation in long-term controls of food intake. Neurosci. Lett.,400, 240–245.
30. Emerich, D.F., Winn, S.R., Hantraye, P.M., Peschanski, M., Chen, E.Y.,Chu, Y., McDermott, P., Baetge, E.E. and Kordower, J.H. (1997)Protective effect of encapsulated cells producing neurotrophic factorCNTF in a monkey model of Huntington’s disease. Nature, 386,395–399.
31. Sleeman, M.W., Garcia, K., Liu, R., Murray, J.D., Malinova, L.,Moncrieffe, M., Yancopoulos, G.D. and Wiegand, S.J. (2003) Ciliaryneurotrophic factor improves diabetic parameters and hepatic steatosisand increases basal metabolic rate in db/db mice. Proc. Natl Acad. Sci.USA, 100, 14297–14302.
32. Kokoeva, M.V., Yin, H. and Flier, J.S. (2005) Neurogenesis in thehypothalamus of adult mice: potential role in energy balance. Science,310, 679–683.
33. Xu, B., Dube, M.G., Kalra, P.S., Farmerie, W.G., Kaibara, A.,Moldawer, L.L., Martin, D. and Kalra, S.P. (1998) Anorectic effects of thecytokine, ciliary neurotropic factor, are mediated by hypothalamicneuropeptide Y: comparison with leptin. Endocrinology, 139, 466–473.
34. Lambert, P.D., Anderson, K.D., Sleeman, M.W., Wong, V., Tan, J.,Hijarunguru, A., Corcoran, T.L., Murray, J.D., Thabet, K.E.,Yancopoulos, G.D. et al. (2001) Ciliary neurotrophic factor activatesleptin-like pathways and reduces body fat, without cachexia or rebound
1242 Human Molecular Genetics, 2008, Vol. 17, No. 9
weight gain, even in leptin-resistant obesity. Proc. Natl Acad. Sci. USA,98, 4652–4657.
35. Martin, D., Merkel, E., Tucker, K.K., McManaman, J.L., Albert, D.,Relton, J. and Russell, D.A. (1996) Cachectic effect of ciliaryneurotrophic factor on innervated skeletal muscle. Am. J. Physiol., 271,R1422–R1428.
36. Hoffmann, T. and Lange, C. (2006) P2BAT: a massive parallelimplementation of PBAT for genome-wide association studies in R.Bioinformatics, 22, 3103–3105.
37. Conde, L., Vaquerizas, J.M., Dopazo, H., Arbiza, L., Reumers, J.,Rousseau, F., Schymkowitz, J. and Dopazo, J. (2006) PupaSuite: findingfunctional single nucleotide polymorphisms for large-scale genotypingpurposes. Nucleic Acids Res., 34, W621–W625.
38. Stranger, B.E., Forrest, M.S., Dunning, M., Ingle, C.E., Beazley, C.,Thorne, N., Redon, R., Bird, C.P., de Grassi, A., Lee, C. et al. (2007)Relative impact of nucleotide and copy number variation on geneexpression phenotypes. Science, 315, 848–853.
39. Maltais, L.J., Lane, P.W. and Beamer, W.G. (1984) Anorexia, a recessivemutation causing starvation in preweanling mice. J. Hered., 75, 468–472.
40. Comings, D.E. and MacMurray, J.P. (2000) Molecular heterosis: a review.Mol. Genet. Metab., 71, 19–31.
41. Comings, D.E. (1999) Molecular heterosis as the explanation for thecontroversy about the effect of the DRD2 gene on dopamine D2 receptordensity. Mol. Psychiatry, 4, 213–215.
42. Keel, P.K., Klump, K.L., Miller, K.B., McGue, M. and Iacono, W.G.(2005) Shared transmission of eating disorders and anxiety disorders.Int. J. Eat. Disord., 38, 99–105.
43. Comings, D.E., Rosenthal, R.J., Lesieur, H.R., Rugle, L.J., Muhleman, D.,Chiu, C., Dietz, G. and Gade, R. (1996) A study of the dopamine D2receptor gene in pathological gambling. Pharmacogenetics, 6, 223–234.
44. Comings, D.E., Gade, R., Wu, S., Chiu, C., Dietz, G., Muhleman, D.,Saucier, G., Ferry, L., Rosenthal, R.J., Lesieur, H.R. et al. (1997) Studiesof the potential role of the dopamine D1 receptor gene in addictivebehaviors. Mol. Psychiatry, 2, 44–56.
45. Schramm, A., Schulte, J.H., Astrahantseff, K., Apostolov, O., Limpt, V.,Sieverts, H., Kuhfittig-Kulle, S., Pfeiffer, P., Versteeg, R. and Eggert, A.(2005) Biological effects of TrkA and TrkB receptor signaling inneuroblastoma. Cancer Lett., 228, 143–153.
46. Ernfors, P. (2001) Local and target-derived actions of neurotrophinsduring peripheral nervous system development. Cell. Mol. Life Sci., 58,1036–1044.
47. Hock, C., Heese, K., Muller-Spahn, F., Huber, P., Riesen, W.,Nitsch, R.M. and Otten, U. (2000) Increased cerebrospinal fluid levelsof neurotrophin 3 (NT-3) in elderly patients with major depression.Mol. Psychiatry, 5, 510–513.
48. Schramm, M., Falkai, P., Feldmann, N., Knable, M.B. and Bayer, T.A.(1998) Reduced tyrosine kinase receptor C mRNA levels in the frontalcortex of patients with schizophrenia. Neurosci. Lett., 257, 65–68.
49. Johansen, J.E., Fetissov, S.O., Bergstrom, U., Nilsson, I., Fay, C.,Ranscht, B., Hokfelt, T. and Schalling, M. (2007) Evidence forhypothalamic dysregulation in mouse models of anorexia as well as inhumans. Physiol. Behav., 92, 278–282.
50. Coll, A.P., Farooqi, I.S. and O’Rahilly, S. (2007) The hormonal controlof food intake. Cell, 129, 251–262.
51. Stellar, E. (1994) The physiology of motivation. 1954. Psychol. Rev.,101, 301–311.
52. Dierssen, M., Gratacos, M., Sahun, I., Martin, M., Gallego, X.,Amador-Arjona, A., Martinez de Lagran, M., Murtra, P., Marti, E.,Pujana, M.A. et al. (2006) Transgenic mice overexpressing the full-lengthneurotrophin receptor TrkC exhibit increased catecholaminergic neurondensity in specific brain areas and increased anxiety-like behavior andpanic reaction. Neurobiol. Dis., 24, 403–418.
53. Sahun, I., Delgado-Garcia, J.M., Amador-Arjona, A., Giralt, A.,Alberch, J., Dierssen, M. and Gruart, A. (2007) Dissociation betweenCA3-CA1 synaptic plasticity and associative learning in TgNTRK3transgenic mice. J. Neurosci., 27, 2253–2260.
54. Tessarollo, L., Vogel, K.S., Palko, M.E., Reid, S.W. and Parada, L.F.(1994) Targeted mutation in the neurotrophin-3 gene results in loss ofmuscle sensory neurons. Proc. Natl Acad. Sci. USA, 91, 11844–11848.
55. Chalazonitis, A., Pham, T.D., Rothman, T.P., DiStefano, P.S.,Bothwell, M., Blair-Flynn, J., Tessarollo, L. and Gershon, M.D. (2001)Neurotrophin-3 is required for the survival-differentiation of subsets ofdeveloping enteric neurons. J. Neurosci., 21, 5620–5636.
56. Ivanisevic, L., Banerjee, K. and Saragovi, H.U. (2003) Differentialcross-regulation of TrkA and TrkC tyrosine kinase receptors with p75.Oncogene, 22, 5677–5685.
57. Ivanisevic, L., Zheng, W., Woo, S.B., Neet, K.E. and Saragovi, H.U.(2007) TrkA receptor ‘hot spots’ for binding of NT-3 as a heterologousligand. J. Biol. Chem., 282, 16754–16763.
58. Lindholm, D., da Penha Berzaghi, M., Cooper, J., Thoenen, H. andCastren, E. (1994) Brain-derived neurotrophic factor and neurotrophin-4increase neurotrophin-3 expression in the rat hippocampus. Int. J. Dev.
Neurosci., 12, 745–751.59. Karchewski, L.A., Gratto, K.A., Wetmore, C. and Verge, V.M. (2002)
Dynamic patterns of BDNF expression in injured sensory neurons:differential modulation by NGF and NT-3. Eur J Neurosci, 16,1449–1462.
60. Cordon-Cardo, C., Tapley, P., Jing, S.Q., Nanduri, V., O’Rourke, E.,Lamballe, F., Kovary, K., Klein, R., Jones, K.R., Reichardt, L.F. et al.(1991) The trk tyrosine protein kinase mediates the mitogenic propertiesof nerve growth factor and neurotrophin-3. Cell, 66, 173–183.
61. Squinto, S.P., Stitt, T.N., Aldrich, T.H., Davis, S., Bianco, S.M.,Radziejewski, C., Glass, D.J., Masiakowski, P., Furth, M.E.,Valenzuela, D.M. et al. (1991) trkB encodes a functional receptor forbrain-derived neurotrophic factor and neurotrophin-3 but not nervegrowth factor. Cell, 65, 885–893.
62. Huang, E.J. and Reichardt, L.F. (2001) Neurotrophins: roles in neuronaldevelopment and function. Annu. Rev. Neurosci., 24, 677–736.
63. Xu, B., Michalski, B., Racine, R.J. and Fahnestock, M. (2002) Continuousinfusion of neurotrophin-3 triggers sprouting, decreases the levels of TrkAand TrkC, and inhibits epileptogenesis and activity-dependent axonalgrowth in adult rats. Neuroscience, 115, 1295–1308.
64. Ullal, G.R., Michalski, B., Xu, B., Racine, R.J. and Fahnestock, M. (2007)NT-3 modulates BDNF and proBDNF levels in naive and kindled rathippocampus. Neurochem. Int., 50, 866–871.
65. Ribases, M., Gratacos, M., Fernandez-Aranda, F., Bellodi, L., Boni, C.,Anderluh, M., Cavallini, M.C., Cellini, E., Di Bella, D., Erzegovesi, S.et al. (2004) Association of BDNF with anorexia, bulimia and age of
onset of weight loss in six European populations. Hum. Mol. Genet., 13,1205–1212.
66. Laird, N.M. and Lange, C. (2006) Family-based designs in the age oflarge-scale gene-association studies. Nat. Rev. Genet., 7, 385–394.
67. Chao, M.V., Rajagopal, R. and Lee, F.S. (2006) Neurotrophin signallingin health and disease. Clin. Sci. (Lond), 110, 167–173.
68. Fernandez-Aranda, F., Jimenez-Murcia, S., Alvarez-Moya, E.M.,Granero, R., Vallejo, J. and Bulik, C.M. (2006) Impulse control disordersin eating disorders: clinical and therapeutic implications. Compr.
Psychiatry, 47, 482–488.69. Fernandez-Aranda, F., Pinheiro, A.P., Tozzi, F., Thornton, L.M.,
Fichter, M.M., Halmi, K.A., Kaplan, A.S., Klump, K.L., Strober, M.,Woodside, D.B. et al. (2007) Symptom profile of major depressive disorderin women with eating disorders. Aust. NZJ Psychiatry, 41, 24–31.
70. Godart, N.T., Flament, M.F., Lecrubier, Y. and Jeammet, P. (2000)Anxiety disorders in anorexia nervosa and bulimia nervosa: co-morbidityand chronology of appearance. Eur. Psychiatry, 15, 38–45.
71. Grilo, C.M., Sanislow, C.A., Skodol, A.E., Gunderson, J.G., Stout, R.L.,Shea, M.T., Zanarini, M.C., Bender, D.S., Morey, L.C., Dyck, I.R. et al.(2003) Do eating disorders co-occur with personality disorders?Comparison groups matter. Int. J. Eat. Disord., 33, 155–164.
72. Kaye, W.H., Bulik, C.M., Thornton, L., Barbarich, N. and Masters, K.(2004) Comorbidity of anxiety disorders with anorexia and bulimianervosa. Am. J. Psychiatry, 161, 2215–2221.
73. Milos, G., Spindler, A. and Schnyder, U. (2004) Psychiatric comorbidityand Eating Disorder Inventory (EDI) profiles in eating disorder patients.Can. J. Psychiatry, 49, 179–184.
74. Steiger, H., Gauvin, L., Engelberg, M.J., Ying Kin, N.M., Israel, M.,Wonderlich, S.A. and Richardson, J. (2005) Mood- and restraint-basedantecedents to binge episodes in bulimia nervosa: possible influences ofthe serotonin system. Psychol. Med., 35, 1553–1562.
75. Gorwood, P., Ades, J., Bellodi, L., Cellini, E., Collier, D.A., Di Bella, D.,Di Bernardo, M., Estivill, X., Fernandez-Aranda, F., Gratacos, M. et al.(2002) The 5-HT(2A) -1438G/A polymorphism in anorexia nervosa: acombined analysis of 316 trios from six European centres. Mol.Psychiatry, 7, 90–94.
76. Gabrovsek, M., Brecelj-Anderluh, M., Bellodi, L., Cellini, E.,Di Bella, D., Estivill, X., Fernandez-Aranda, F., Freeman, B., Geller, F.,
Human Molecular Genetics, 2008, Vol. 17, No. 9 1243
Gratacos, M. et al. (2004) Combined family trio and case-control analysisof the COMT Val158Met polymorphism in European patients withanorexia nervosa. Am. J. Med. Genet., 124B, 68–72.
77. Barrett, J.C., Fry, B., Maller, J. and Daly, M.J. (2005) Haploview: analysisand visualization of LD and haplotype maps. Bioinformatics, 21, 263–265.
78. Gauderman, W.J. (2002) Sample size requirements for association studiesof gene-gene interaction. Am. J. Epidemiol., 155, 478–484.
79. Gauderman, W.J. and Morrison, J.M. (2006) QUANTO 1.1: A computerprogram for power and sample size calculations for genetic-epidemiologystudies. http://hydra.usc.edu/gxe://hydra.usc.edu/gxe.
80. Gonzalez, J.R., Armengol, L., Sole, X., Guino, E., Mercader, J.M.,Estivill, X. and Moreno, V. (2007) SNPassoc: an R package to performwhole genome association studies. Bioinformatics, 23, 644–645.
81. Horvath, S., Laird, N.M. and Knapp, M. (2000) The transmission/disequilibrium test and parental-genotype reconstruction forX-chromosomal markers. Am. J. Hum. Genet., 66, 1161–1167.
82. Jiang, H., Harrington, D., Raby, B.A., Bertram, L., Blacker, D.,
Weiss, S.T. and Lange, C. (2006) Family-based association test for
time-to-onset data with time-dependent differences between the hazard
functions. Genet. Epidemiol., 30, 124–132.
83. Marchini, J., Donnelly, P. and Cardon, L.R. (2005) Genome-wide
strategies for detecting multiple loci that influence complex diseases. Nat.
Genet., 37, 413–417.
84. Hellemans, J., Mortier, G., De Paepe, A., Speleman, F. and
Vandesompele, J. (2007) qBase relative quantification framework and
software for management and automated analysis of real-time quantitative
PCR data. Genome Biol., 8, R19.
85. McCulloch, C.E. and Searle, S.R. (2001) Generalized, Linear,
and Mixed Models. Wiley Series in Probability and Statistics,
Canada.
1244 Human Molecular Genetics, 2008, Vol. 17, No. 9