Asset-Centred Redistributive Policies for Sustainable Development
54
1 Asset-Centred Redistributive Policies for Sustainable Development Pierre Kohler* UNDESA August 2014 Abstract Analyses of redistributive policies generally focus on income flows while subordinating most concerns to the overarching objective of promoting economic growth. This paper follows an alternative approach with the objective of proposing an asset-centred analytical framework, which encompasses income flows, but is centred on the stock of income-generating assets in the private and public sectors. Such a stock-flow approach reveals an artificial blind spot common to many analyses of redistributive policies: wealth redistribution. The proposed framework further allows better outlining key linkages between redistributive policies and sustainable development, including issues arising from the private ownership, marketization and overexploitation of finite natural resources. Contrasting the potential scope of asset-centred redistributive policies with the more narrow set of income-based redistributive policies that have been implemented in most countries/regions over the last 30 years, the paper derives 14 recommendations for redistributive policies in support of greater equity, economic democracy and sustainable development. JEL Classification: D31, H2, H3, H4, H41, H71, H82, H87 Keywords: Income, wealth, inequality, fiscal policy, redistributive policy, public social spending, revenue mobilization, progressive tax system, net wealth tax, carbon tax, international tax cooperation, unitary taxation, formulary apportionment, post-2015 * I would like to thank Matthias Bruckner, Sarah Cook, Andrea Cornia, Danny Dorling, Pingfan Hong, Nazrul Islam, Alex Izurieta, Alex Julca, Massoud Karshenas, Gregory Mikkelson, Sol Picciotto, Thomas Piketty, Samson Moyo, Sanjay Reddy, Marco Sanchez-Cantillo, Erika Siu, Rehman Sobhan, Frederick Solt, Frances Julia Stewart, Sergio Vieira, David Woodward, Willem Van Der Geest, John Winkel, Eduardo Zepeda and anonymous referees for invaluable comments and discussions. Address for correspondence: [email protected] or [email protected]
Transcript of Asset-Centred Redistributive Policies for Sustainable Development

1
Asset-Centred Redistributive Policies for Sustainable Development
Pierre Kohler*
UNDESA
August 2014
Abstract
Analyses of redistributive policies generally focus on income flows while subordinating most concerns to the overarching objective of promoting economic growth. This paper follows an alternative approach with the objective of proposing an asset-centred analytical framework, which encompasses income flows, but is centred on the stock of income-generating assets in the private and public sectors. Such a stock-flow approach reveals an artificial blind spot common to many analyses of redistributive policies: wealth redistribution. The proposed framework further allows better outlining key linkages between redistributive policies and sustainable development, including issues arising from the private ownership, marketization and overexploitation of finite natural resources. Contrasting the potential scope of asset-centred redistributive policies with the more narrow set of income-based redistributive policies that have been implemented in most countries/regions over the last 30 years, the paper derives 14 recommendations for redistributive policies in support of greater equity, economic democracy and sustainable development.
JEL Classification: D31, H2, H3, H4, H41, H71, H82, H87
Keywords: Income, wealth, inequality, fiscal policy, redistributive policy, public social spending, revenue mobilization, progressive tax system, net wealth tax, carbon tax, international tax cooperation, unitary taxation, formulary apportionment, post-2015
* I would like to thank Matthias Bruckner, Sarah Cook, Andrea Cornia, Danny Dorling, Pingfan Hong, Nazrul Islam, Alex Izurieta, Alex Julca, Massoud Karshenas, Gregory Mikkelson, Sol Picciotto, Thomas Piketty, Samson Moyo, Sanjay Reddy, Marco Sanchez-Cantillo, Erika Siu, Rehman Sobhan, Frederick Solt, Frances Julia Stewart, Sergio Vieira, David Woodward, Willem Van Der Geest, John Winkel, Eduardo Zepeda and anonymous referees for invaluable comments and discussions.
Address for correspondence: [email protected] or [email protected]
2
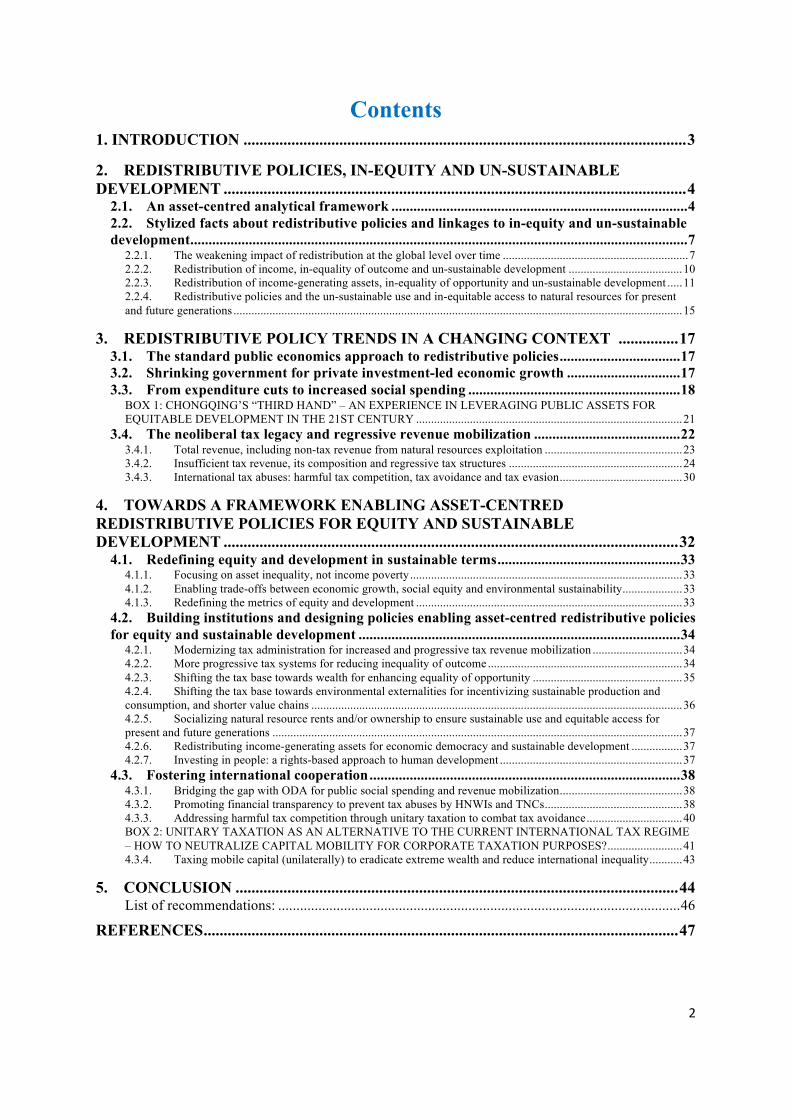
Contents
1. INTRODUCTION ............................................................................................................... 3 2. REDISTRIBUTIVE POLICIES, IN-EQUITY AND UN-SUSTAINABLE DEVELOPMENT .................................................................................................................... 4
2.1. An asset-centred analytical framework ................................................................................. 4 2.2. Stylized facts about redistributive policies and linkages to in-equity and un-sustainable development ........................................................................................................................................ 7
2.2.1. The weakening impact of redistribution at the global level over time .............................................................. 7 2.2.2. Redistribution of income, in-equality of outcome and un-sustainable development ...................................... 10 2.2.3. Redistribution of income-generating assets, in-equality of opportunity and un-sustainable development ..... 11 2.2.4. Redistributive policies and the un-sustainable use and in-equitable access to natural resources for present and future generations ...................................................................................................................................................... 15
3. REDISTRIBUTIVE POLICY TRENDS IN A CHANGING CONTEXT ............... 17
3.1. The standard public economics approach to redistributive policies ................................. 17 3.2. Shrinking government for private investment-led economic growth ............................... 17 3.3. From expenditure cuts to increased social spending .......................................................... 18
BOX 1: CHONGQING’S “THIRD HAND” – AN EXPERIENCE IN LEVERAGING PUBLIC ASSETS FOR EQUITABLE DEVELOPMENT IN THE 21ST CENTURY ......................................................................................... 21
3.4. The neoliberal tax legacy and regressive revenue mobilization ........................................ 22 3.4.1. Total revenue, including non-tax revenue from natural resources exploitation .............................................. 23 3.4.2. Insufficient tax revenue, its composition and regressive tax structures .......................................................... 24 3.4.3. International tax abuses: harmful tax competition, tax avoidance and tax evasion ......................................... 30
4. TOWARDS A FRAMEWORK ENABLING ASSET-CENTRED REDISTRIBUTIVE POLICIES FOR EQUITY AND SUSTAINABLE DEVELOPMENT .................................................................................................................. 32
4.1. Redefining equity and development in sustainable terms .................................................. 33 4.1.1. Focusing on asset inequality, not income poverty ........................................................................................... 33 4.1.2. Enabling trade-offs between economic growth, social equity and environmental sustainability .................... 33 4.1.3. Redefining the metrics of equity and development ......................................................................................... 33
4.2. Building institutions and designing policies enabling asset-centred redistributive policies for equity and sustainable development ........................................................................................ 34
4.2.1. Modernizing tax administration for increased and progressive tax revenue mobilization .............................. 34 4.2.2. More progressive tax systems for reducing inequality of outcome ................................................................. 34 4.2.3. Shifting the tax base towards wealth for enhancing equality of opportunity .................................................. 35 4.2.4. Shifting the tax base towards environmental externalities for incentivizing sustainable production and consumption, and shorter value chains ............................................................................................................................ 36 4.2.5. Socializing natural resource rents and/or ownership to ensure sustainable use and equitable access for present and future generations ......................................................................................................................................... 37 4.2.6. Redistributing income-generating assets for economic democracy and sustainable development ................. 37 4.2.7. Investing in people: a rights-based approach to human development ............................................................. 37
4.3. Fostering international cooperation ..................................................................................... 38 4.3.1. Bridging the gap with ODA for public social spending and revenue mobilization ......................................... 38 4.3.2. Promoting financial transparency to prevent tax abuses by HNWIs and TNCs .............................................. 38 4.3.3. Addressing harmful tax competition through unitary taxation to combat tax avoidance ................................ 40 BOX 2: UNITARY TAXATION AS AN ALTERNATIVE TO THE CURRENT INTERNATIONAL TAX REGIME – HOW TO NEUTRALIZE CAPITAL MOBILITY FOR CORPORATE TAXATION PURPOSES? ......................... 41 4.3.4. Taxing mobile capital (unilaterally) to eradicate extreme wealth and reduce international inequality ........... 43
5. CONCLUSION ............................................................................................................... 44
List of recommendations: .............................................................................................................. 46
REFERENCES ....................................................................................................................... 47

3
1. INTRODUCTION The growing concentration of wealth and income, which may represent an inherent feature of capitalism (Piketty 2013), stands in sharp contrast with the increasingly cooperative nature of wealth production and creation processes. It further prevents eradicating poverty without breaching planetary boundaries (Rockström et al. 2009, Gerst et al. 2013). An approach for simultaneously addressing issues of resource allocation, income distribution and the scale of the economy is therefore required (Costanza et al. 2012, Farley et al. 2013).
Redistributive policies are an essential component of strategies for reducing inequality and promoting sustainable development in its three dimensions: economic, social and environmental. They represent a powerful policy instrument for improving equality of outcome through the redistribution of income and, more importantly, for enhancing equality of opportunity by improving the distribution of income-generating assets, such as human capital and wealth (including land and industrial and financial capital) across individuals as well as between the private and the public sector. Beyond their strong potential for reducing inequality, redistributive policies are also key for promoting values that are consistent with sustainable development and for shaping a socio-economic context and incentives that are conducive to financial stability and economic development, political inclusion, gender equality and social mobility, as well as environmental sustainability.
Yet, partly as a result of inadequate redistributive policies, inequality is rising in many countries, the underprovisioning and underfunding of public goods is widespread and externalities harmful to global commons, which are generated by the unsustainable exploitation of natural assets, are universally underpriced. Against this inconvenient backdrop, recurring projections (Piketty 2013, Stern report 2006, OECD 2012) highlighting the costs and consequences of inertia in economic, social and environmental terms resonate as a continuous invitation for renewed thinking and urgent action.
This paper calls into question the premises of the prevailing approach to redistribution in two different ways. Analyses of redistributive policies generally focus on income flows while subordinating most concerns to the overarching objective of promoting economic growth. This paper proposes an alternative stock-flow approach that encompasses income flows, but which is centred on the stock of income-generating assets. It further argues that in a context characterised by growing sustainability challenges, such as rising wealth inequality and carbon emissions, and the upcoming transition from the MDGs to SDGs, redistributive policies can no longer be assessed exclusively in light of their impact on economic growth and must be shaped in pursuit of more important social and environmental objectives. Indeed, as wealth concentration reinforces inequality, and as the privatization and marketization of the stock of finite natural resources exacerbate their depletion, innovative approaches must stress the importance of stock variables to overcome the blindness to distributional and environmental issues that plagues most analyses of redistribution that narrowly focus on income flows in order to enable discussions about how to design redistributive policies in pursuit of sustainable development objectives.
The objective of this paper is to propose an asset-centred1 analytical framework for (i) mapping the most important redistributive policy tools that shape the distribution of income 1 There is an interesting literature on “asset-based” social policies that is divided in two main strands (see Prabhakar 2009 for a brief overview). One strand supports wealth redistribution on the grounds that citizenship bestows a set of rights upon all members of a political community. Another strand supports access to assets,
4
and income-generating assets across individuals as well as between the private and the public sector and (ii) outlining key linkages between redistributive policies, in-equity and un-sustainable development. The paper further aims at (iii) contrasting the potential scope of redistributive policies with the more narrow set of policies that have been implemented in most countries/regions over the last 30 years in order to (iv) derive recommendations for redistributive policies in support of greater equity and sustainable development in the post-2015 context.
Section 2 proposes an asset-centred analytical framework to clarify the role redistributive policies play in reducing (or increasing) inequality by redistributing income and income-generating assets in a progressive (or regressive) manner. It further presents stylized facts and suggestive evidence illustrating some key linkages to in-equity and un-sustainable development. Section 3 discusses trends in redistributive policies in an evolving intellectual, political and institutional context that is currently deeply influenced by the prevailing political consensus and commitment to private investment-led economic growth.2 It discusses the MDG inflexion and its positive impact on public social spending, including education, health and social protection, but also stresses insufficient progress with regard to ensuring adequate and stable funding and addressing environmental sustainability issues. The section examines changes in the collection of non-tax revenue deriving from the accelerated exploitation of natural resources. The prominence of increasingly regressive tax structures leads to a discussion of factors subverting progressive revenue mobilization, such as slashes in wealth, top personal and corporate income tax rates, the increased use of regressive indirect taxes (unfortunately not targeting environmental externalities), and growing tax abuses, including harmful tax competition, tax avoidance and evasion by high net worth individuals (HNWIs) and transnational corporations (TNCs). The section also highlights redistributive policies that positively contributed to equity and sustainable development, especially in Latin America. Section 4 proposes recommendations for moving towards a framework enabling asset-centred redistributive policies promoting equity and sustainable development. It also emphasizes the limits of domestic policy initiatives and the need for increased international cooperation, notably regarding the taxation of mobile capital income and financial wealth of HNWIs and TNCs. Section 5 concludes.
2. REDISTRIBUTIVE POLICIES, IN-EQUITY AND UN-SUSTAINABLE DEVELOPMENT
2.1. An asset-centred analytical framework Figures 1 and 2 propose an asset-centred analytical framework for mapping most of the redistributive policy tools that are discussed in this paper as well as for highlighting some key linkages to in-equity and un-sustainable development. Figure 1 is centred on the stock of private income-generating assets that (along with transfers and taxes) play a key role in shaping the private income cycle. Figure 2 is centred on the stock of public income-generating assets to represent the cycle of public revenue and expenditure.
because owning assets may change individual behaviour in ways that bring economic and social benefits. While this paper acknowledges the importance of “asset-based” policies, it also discusses the necessity of “income-based” policies. The term “asset-centred” is therefore preferred. 2 The commitment to private investment-led economic growth is reflected in the preambles of leaders’declarations published after meetings of global governance bodies. The Lough Erne leaders’ declaration (G8 2013), for instance, begins by stating that « private enterprise drives growth, reduces poverty, and creates jobs and prosperity for people around the world. Governments have a special responsibility to make proper rules

5
Figure 1: Asset-centred analytical framework (1): Private income-generating assets, redistributive policy instruments and the income cycle
Source: Author. Note: VAT stands for value-added tax, FTT stands for financial transaction tax.
Governments dispose over a large number of redistributive policy tools in pursuit of their policy objectives. In figure 1, policy instruments that determine the structural distribution of income-generating assets and income across individuals have been regrouped in three broad categories, including wealth redistribution, income redistribution and the provision of public goods. While income redistribution is most important for in-equality of outcome, the provision of public goods and wealth redistribution both directly influence the distribution of private income-generating assets, which is a major determinant of in-equality of opportunity.
Private income-generating assets (1) are defined as encompassing human capital embodied in people, such as education and knowledge (1-i), as well as property rights protecting accumulated wealth ensuring rents to owners of land and industrial and financial capital (1-ii). While many countries succeeded in fostering human capital and improving its distribution across social groups (UNDP 2012), wealth remains highly concentrated. At the global level, the top 1 per cent own 40 per cent of global wealth (UNDP 2013) and the 85 richest individuals have an estimated net worth equivalent to that of the poorest half of the planet (Oxfam 2014). At the domestic level, wealth is similarly concentrated, with the top decile controlling between 70 per cent to 90 per cent of total national wealth in many countries

6
(Davies et al. 2011, Piketty 2013). As will appear in section 3, despite increasing wealth concentration and its negative effects on sustainable development,3 existing redistributive policy frameworks often fully ignore wealth redistribution among private actors. The focus on fiscal policies, rather than redistributive policies more generally, implicitly restricts the scope of redistributive policies to income redistribution and the provision of public goods.
In this context, the asymmetric distribution of income-generating assets across individuals keeps generating asymmetric labour and capital income flows resulting in market income inequality (4-i-ii). In most countries, market inequality is carried on along the income cycle, resulting in final income inequality and a reinforcing feedback loop. Progressive direct taxes revenue (5) and direct transfers (6) have the potential to stabilize disposable income (7) and to protect vulnerable individuals against market fluctuations, but they are generally insufficient to eradicating poverty, especially in developing countries. As a corollary, the increased reliance of developing countries on regressive indirect tax revenue (9) makes progressive transfers even more important for reducing inequality.
Since the start of the MDGs era, most redistributive policy frameworks strongly emphasized the need for increasing public social spending on education and health (11-i) in particular in order to foster human capital, without outlining a consistent approach for mobilizing the required public revenue. Yet, narrow and weakly representative political coalitions as well as insufficient economic development prevent many countries from raising the tax revenue required to expand government services beyond basic security services (11-ii) protecting existing ownership and debt structures (Nitzan and Bichler 2009, Winters 2011, Graeber 2012). The allocation of resources to the public provision of law and order through courts, police/armed forces and prisons is acknowledged to be economically unproductive. Recent evidence further shows that countries spending more on security services also experience higher income inequality (Bowles and Jayadev, 2006, 2014). Indeed, the increased allocation of resources to maintain the monopoly of (legitimate) violence required for operationalizing the public provision of law and order tends to reduce resources available for the provision of other public goods. It is further intended to suppress (non-legitimate) challenges to the existing ownership and debt structures and income distribution.4
Policy instruments mapped in figure 1 all contribute to the cycle of public revenue and expenditure represented in figure 2: taxes (including corporate taxes, which did not appear in figure 1) raise public revenues and transfers generate public expenditure.
Government intervention for wealth redistribution between the public and private sector is more common than interventions for wealth redistribution among private actors. Over the last decades, many governments adopted market-friendly policies privatizing a number of public income-generating assets (a). Natural resources along with public utilities, infrastructures and industries of various kinds (oil and gas resources, communication and transport, security 3 For instance, concentrated land ownership often leads to inefficient land use and the adoption of environmentally less sustainable agricultural production methods (Sobhan 2010, Moyo 2013). Similarly, concentrated financial wealth and higher returns for richer investors strengthen rent income and discourage labour, leading to economic inefficiency (Stiglitz and Dasgupta 1971, Piketty 2013). 4 The provision of public goods that tend to increase or maintain inequality is often overlooked along with the repressive dimension of government. This is partly due to ideological blindness and empirical hurdles. Several researchers have documented the relation between the rise in security services and inequality across a number of countries (see Bowles and Jayadev,2006, 2014). However, data is too scarce for this aspect to be covered in the survey of redistributive policies presented in section 3.

7
services, etc.) have been privatized and managed as if they were mere commodities, i.e. a means for maximizing corporate profits. This trend weakened the capacity of governments to conduct asset-based public policies and to intervene in the economy, society and the environment. For instance, with natural resources being transferred to the private sector and considered as mere commodities, policy options for governments to ensure universal and equitable access, or to restrict their unsustainable exploitation, marketization and consumption became more limited. The associated privatization of large economic rents further came at the cost of revenue raised from public assets (b). Consequently, governments increasingly rely on income-based public policies to fund their current and capital expenditures (f and g) through borrowing (c) or, as wealth taxes and environmental taxes are inexistent or insignificant in all countries, by levying taxes on private income and consumption (d).
Figure 2: Asset-centred analytical framework (2): Public income-generating assets and the revenue-expenditure cycle
Source: Author.
The analytical framework sketched using figures 1 and 2 will help articulate linkages between redistributive policies, in-equity and un-sustainable development in the rest of this section. It will further contribute structuring the survey of existing redistributive policy frameworks in section 3 and deriving recommendations in section 4.
2.2. Stylized facts about redistributive policies and linkages to in-equity and un-sustainable development
2.2.1. The weakening impact of redistribution at the global level over time The impact of redistributive policies on income inequality and sustainable development can be significant, but it varies across countries and over time as redistributive policies are shaped

8
by domestic factors, such as demography, economic and political conditions, and further influenced by the international strategic and ideological context. At the global level, the impact of redistributive policies was strongly influenced by major wars, strategic shifts and ideological inflexions. Following a period of stronger economic growth and redistribution that reduced income inequality in many countries after the Second World War and during the first decades of the Cold War, the neoliberal policies initiated in Anglo-Saxon countries, Chinese market reforms and the fall of the Iron Curtain all weakened redistributive policies.
Figure 3 reflects the evolution of the population-weighted global averages of domestic market Gini (before direct taxes/transfers) and net Gini (after direct taxes/transfers) coefficients between 1970 and 2012. Both indices increased in tandem over that period as they were influenced by various factors, including redistributive policies. As market-friendly policies gained steam and institutionalized, market income inequality increased rapidly starting in the mid-1980s, with slashes in top marginal income and corporate tax rates encouraging rising executive pay and shareholder dividends mostly accruing to the wealthiest (Piketty et al., 2014). As direct transfers were not stepped up to compensate for rising market income inequality, at least 75 per cent of the world population experienced higher net/disposable income inequality at the domestic level. On average, market and net Gini coefficients have increased by almost 7 points since the mid-1980s, reaching 47.7 points and 43.3 points in 2012, respectively.
Figure 3: The weakening impact of redistribution and higher within-country income inequality at the global level (1970-2012)
Source: Author. Note: Based on SWIID (version 4.1) and UNPOP data. Dotted lines indicate 95 per cent confidence intervals for market and net Gini coefficients. Global market and net/disposable inequality indices are computed as population-weighted averages of within-country Gini indices as defined in the SWIID database. See figure 1 for an illustration of the difference between market and disposable/net income.
On average, the reduction in income inequality that is observed when comparing market and net/disposable income distributions is mostly explained by direct transfers, which account for about 80 per cent of the reduction (IMF 2013a, Cornia 2012). This observation may at first be interpreted as a sign that direct transfers are much more efficient than direct taxes for reducing disposable/net income inequality, but such an interpretation overlooks several important points. First, taxes and transfers are not substitutes, and it is important that they complement each other in order to consistently reinforce the overall impact of redistributive
02
46
8In
crea
se in
Gin
i net
sin
ce 1
970
(in p
oint
s)
3035
4045
5055
Gin
i ind
ex (i
n po
ints
)
1970 1980 1990 2000 2010year
Gini net (LHS) Gini market (LHS) Increase in Gini net since 1970 (RHS)

9
policies. Secondly, direct transfers can be funded by direct and indirect tax revenue. The inequality-reducing effect of direct transfers should therefore be larger than the effect of direct taxes, especially in developing countries where indirect taxes generate a larger share of government revenue. Thirdly, the observation that direct taxes only account for about 20 per cent of the net/disposable income inequality reduction highlights how poorly progressive direct tax collection is in many countries. Finally, in addition to their impact on disposable/net income inequality, progressive direct taxes have the additional role of deterring excessive compensation, which has become a key driver of rising market income inequality in many countries (Piketty, Saez and Stancheva 2014, Alvaredo et al. 2013). Countries that have most extensively implemented neoliberal prescriptions to slash wealth, top personal and corporate income tax rates also experienced the most significant rise in top income shares since the early 1980s, without registering the promised higher economic growth (figure 3).
Figure 4: Changes in top marginal tax rates, top 1 per cent income shares and real annual per capital GDP growth (1960-4 and 2005-9)
Source: Piketty, Saez and Stancheva (2014). Note: the same pattern is observed over the 1975-2008 period (Piketty, Saez and Stancheva 2011). See also the World Top Incomes Database project: http://topincomes.g-mond.parisschoolofeconomics.eu. R2 is 0.56 in the left panel and =0.00 in the right panel.
Figures 3 and 4 both highlight a significant rise in income inequality over the decades, but both underestimate it for different reasons and may potentially downplay the efforts required for reducing inequality. Survey-based income inequality measures, such as Gini estimates in figure 3, often rely on data samples that truncate the top of the income distribution, because top incomes are under-represented in surveys or due to top-coding method shortcomings (Alvaredo 2010). Top income shares in figure 4 are estimated using non-truncated fiscal data, but under-reporting of income to tax authorities is common and tax evasion has grown exponentially over the last decade (Palan et al. 2010, Zucman 2013). Furthermore, top fiscal incomes generally only represents a tiny fraction of top effective economic incomes, which go largely untaxed, because tax avoidance schemes de facto exclude many capital income flows from the tax base. Consequently, measures imposing higher top marginal tax rates on
Australia
Canada
Denmark
FinlandFrance Germany
Ireland
Italy
Japan
NZ
Netherlands
NorwayPortugal
Spain
Sweden
Switzerland
UK
US
Elasticity= .47 (.11)
02
46
810
Cha
nge
in to
p 1%
inco
me
shar
e (p
oint
s)
-40 -30 -20 -10 0 10Change in top marginal tax rate (points)
and top 1% income shareChanges in top marginal tax rate
AustraliaCanada
Denmark
Finland
FranceGermany
Ireland
Italy
Japan
NZ
Netherlands
Norway
Portugal
Spain
Sweden
Switzerland
UKUS
12
34
GD
P pe
r cap
ita re
al a
nnua
l gro
wth
(%)
-40 -30 -20 -10 0 10Change in top marginal tax rate (points)
and growth of GDP per capitaChange in top marginal tax rate

10
fiscal income without strengthening its tax base, such as the Buffett rule,5 are of limited significance (Piketty 2013).
2.2.2. Redistribution of income, in-equality of outcome and un-sustainable development The redistributive impact of taxes and transfers is most significant in developed countries, in accordance with the Wagner Law, which observes that government revenue/spending increases steadily with GDP, because of the gradual formalization of the economy and the related greater ease to tax. Significant differences among countries with similar income levels, however, highlight the role of institutions, governance and political inclusion.
In developed countries, weaker taxes on top incomes reduce the ability of redistributive policies to contain excessive compensation, but social protection measures6 stabilize the income of most vulnerable individuals and social groups, shielding them from extreme poverty and reducing income inequality to a limited extent. In Western and Northern Europe, for instance, government (tax and non-tax) revenue and expenditure amount to around 45 per cent of subregional GDP. Direct taxes and transfers alone reduce income inequality by around 15 Gini percentage points, about four times the global average (figure 5).
Figure 5: Redistributive policies and income inequality reduction across subregions (2006)
Source: Author. Note: Based on data from SWIID (version 4.1), UNPOP and Torres (2013). Subregions are defined according to the UN definition (see http://unstats.un.org/unsd/methods/m49/m49regin.htm). The year
5 The Buffett Rule is part of a tax plan proposed by President Barack Obama in 2011 that would apply a minimum tax rate of 30 percent on individuals making more than a million dollars a year. This tax rate, however, only applies to a restricted tax base including fiscal income, not economic income. 6 Social protection encompasses direct income transfers funded through contributory (social insurance) or non-contributory (social assistance) programmes. While social insurance generally only covers individuals active in the formal employment sector, social assistance potentially covers the entire population and is fundamental for reducing extreme poverty. Social protection includes transfers such as pensions, work injury and invalidity benefits, sick pay, maternity leave, unemployment benefits, child and family allowances, (non-) conditional cash transfers (CCT), food/cash for work, but also subsidized goods, such as food or housing.
Northern America
Eastern Africa
Middle Africa
Northern Africa
Southern Africa
Western Africa
Caribbean
Central America
South America
Central Asia
Eastern Asia
Southern Asia
South-Eastern Asia
Western Asia
Eastern Europe
Northern Europe
Southern Europe
Western Europe
Australia and New Zealand
Melanesia
2025
3035
4045
Tota
l rev
enue
(as
a sh
are
of G
DP)
0 5 10 15
Decrease in Gini index after direct taxes/transfers (points)
Northern America
Eastern AfricaMiddle Africa
Northern Africa
Southern Africa
Western Africa
Caribbean
Central America
South America
Central Asia
Eastern Asia
Southern Asia
South-Eastern Asia
Western Asia
Eastern Europe
Northern Europe
Southern Europe
Western Europe
Australia and New Zealand
Melanesia
2530
3540
4550
Tota
l exp
endi
ture
s (a
s a
shar
e of
GD
P)
0 5 10 15
Decrease in Gini index after direct taxes/transfers (points)

11
2006 was chosen, because Torres (2013) gathered accurate revenue and expenditure data for a large number of countries for the year 2006. All variables are population-weighted. Tax revenues include income taxes, payroll taxes, taxes on goods and services, trade taxes and other taxes, but exclude revenue from grants and non-tax revenue (e.g., revenue from oil, etc.). Current expenditures cover compensation of employees and social benefits, but exclude capital expenditures and interest payments. R2 is 0.52 in the left panel and 0.60 in the right panel.
By contrast, in developing countries the predominantly rural and informal economic structures, weak tax administrations as well as the weaker and more narrow political coalitions often prevent the development of strong progressive redistributive institutions (Joshi et al. 2012, Moore 2013), thus generating more unequal societies, where extreme poverty stands in sharper contrast with extreme wealth. Government (tax and non-tax) revenue and expenditure amount to between 20 to 35 per cent of GDP in most developing subregions, a larger share of it being spent on basic security and other core functions of government, inducing only a weak reduction in income inequality.
Countries with less developed redistributive policies consistently experience higher levels of income inequality, but outcomes further depend on the pattern of redistribution. Southern Africa and Southern Europe, for instance, have comparable levels of total revenue and expenditures amounting to around 40 per cent of subregional GDP, but their composition are much less progressive in the former. On the revenue side, Southern Africa is strongly reliant on regressive indirect taxes, such as value-added taxes, that penalize the poor. On the expenditure side, capital expenditures absorb a larger share of public spending, resulting in higher potential economic growth and, more tangibly, in weaker redistribution and extreme inequality of outcome.
Direct monetary transfers through social protection programmes are the most direct way to alleviate poverty, but insufficient transfers and coverage as well as discriminatory practices often leave large segments of the population in developing countries vulnerable to temporary economic risks and enduring extreme poverty. Furthermore, gender-blind approaches to social protection often directly discriminate against women in developed and developing countries. In addition to employment and wage discrimination experienced in the labour market, most women standing at the crossroad of paid work and unpaid care work suffer the injustice of social insurance schemes that assume full-time, formal and life-long employment as the norm (Razavi et al. 2012). As women represent a majority of the poor, increased gender awareness in the design of more ambitious social protection programmes is key for poverty reduction, gender equality and sustainable development.
2.2.3. Redistribution of income-generating assets, in-equality of opportunity and un-sustainable development Human capital
Redistributive policies can also foster equality of opportunity by shaping the distribution of income-generating assets, including human capital. Public spending on education and health, which are key for building up a strong and productive labour force, has gained prominence in the development debate in the wake of the Millennium declaration that enshrined education and health objectives at the heart of the international development agenda (e.g., ensure universal access to primary education and gender equality in secondary education, reduce child and maternal mortality). Yet, with a few exceptions, public social spending increased only modestly in most developing countries. In 2010, public spending on education ranged
12
between 3 and 6 per cent of GDP in most developing subregions, while public spending on health was still inferior to 2 per cent of GDP in some developing subregions.
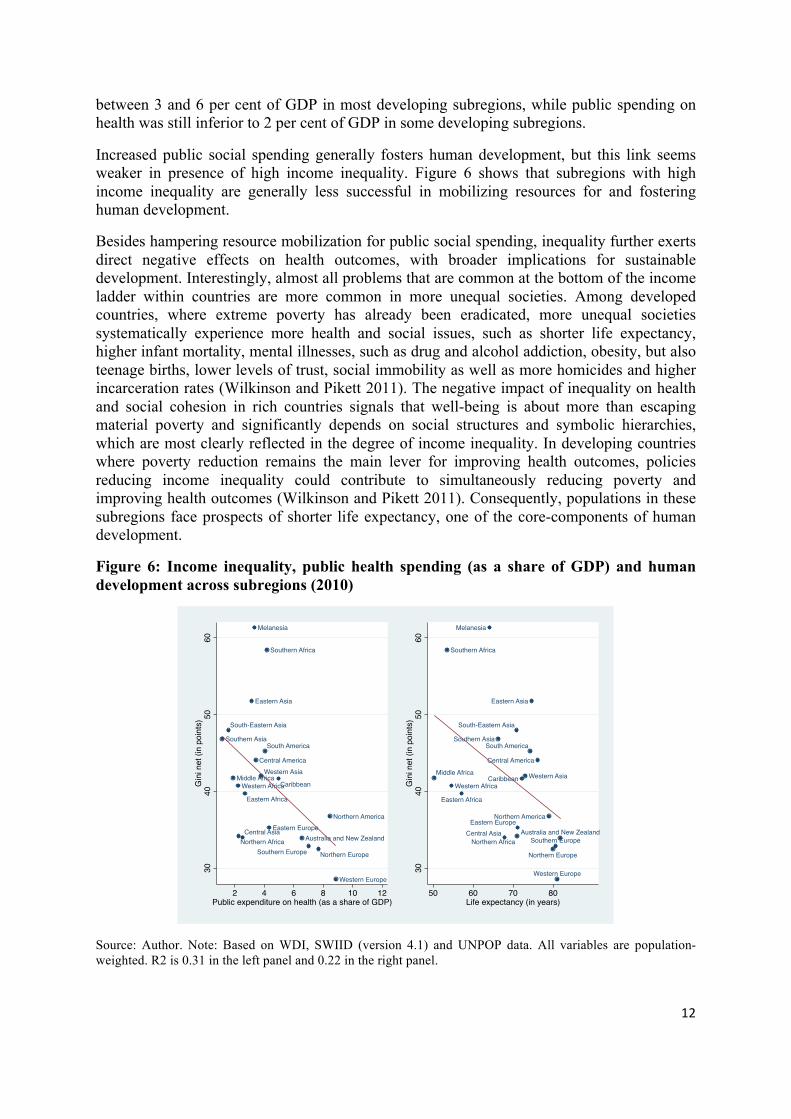
Increased public social spending generally fosters human development, but this link seems weaker in presence of high income inequality. Figure 6 shows that subregions with high income inequality are generally less successful in mobilizing resources for and fostering human development.
Besides hampering resource mobilization for public social spending, inequality further exerts direct negative effects on health outcomes, with broader implications for sustainable development. Interestingly, almost all problems that are common at the bottom of the income ladder within countries are more common in more unequal societies. Among developed countries, where extreme poverty has already been eradicated, more unequal societies systematically experience more health and social issues, such as shorter life expectancy, higher infant mortality, mental illnesses, such as drug and alcohol addiction, obesity, but also teenage births, lower levels of trust, social immobility as well as more homicides and higher incarceration rates (Wilkinson and Pikett 2011). The negative impact of inequality on health and social cohesion in rich countries signals that well-being is about more than escaping material poverty and significantly depends on social structures and symbolic hierarchies, which are most clearly reflected in the degree of income inequality. In developing countries where poverty reduction remains the main lever for improving health outcomes, policies reducing income inequality could contribute to simultaneously reducing poverty and improving health outcomes (Wilkinson and Pikett 2011). Consequently, populations in these subregions face prospects of shorter life expectancy, one of the core-components of human development.
Figure 6: Income inequality, public health spending (as a share of GDP) and human development across subregions (2010)
Source: Author. Note: Based on WDI, SWIID (version 4.1) and UNPOP data. All variables are population-weighted. R2 is 0.31 in the left panel and 0.22 in the right panel.
Northern America
Eastern Africa
Middle Africa
Northern Africa
Southern Africa
Western AfricaCaribbean
Central America
South America
Central Asia
Eastern Asia
Southern Asia
South-Eastern Asia
Western Asia
Eastern Europe
Northern EuropeSouthern Europe
Western Europe
Australia and New Zealand
Melanesia
3040
5060
Gin
i net
(in
poin
ts)
2 4 6 8 10 12Public expenditure on health (as a share of GDP)
Northern America
Eastern Africa
Middle Africa
Northern Africa
Southern Africa
Western AfricaCaribbean
Central America
South America
Central Asia
Eastern Asia
Southern Asia
South-Eastern Asia
Western Asia
Eastern Europe
Northern Europe
Southern Europe
Western Europe
Australia and New Zealand
Melanesia
3040
5060
Gin
i net
(in
poin
ts)
50 60 70 80Life expectancy (in years)
13
Similar direct linkages exist between equity, education and sustainable development. A comparison of 13 developed countries highlighted that higher income inequality is consistently associated with lower inter-generational earnings mobility and social mobility (Corak 2013). Additionally, spending on higher education in developed countries may be rising, but it is often biased towards elite universities that strengthen social stratification, social immobility and self-reproduction of the elite (Brezis and Hellier 2013). These findings all point at the limits of redistributive policies that aim at fostering sustainable development exclusively through human development, disregarding the role of income and wealth inequality as structural determinants of health and education outcomes across individuals and generations.
Wealth, including land and industrial and financial capital
Redistribution of other income-generating assets protected by property rights, such as wealth ensuring rents to owners of land and industrial and financial capital remains less prominent in domestic and international discussions. The absence of public debate on this issue is related to several factors, including poor political and media governance tempering the demand for information about the extent of wealth inequality, as well as insufficient awareness about the role of wealth inequality in perpetuating income poverty. It is also partly due to the widely held view that markets work efficiently and result in fair outcomes provided equality of opportunity, i.e. equal access to education, is upheld. Beyond the problem that equality in access to education remains incomplete in many countries and is often limited to primary or secondary education, this approach is based on an overly narrow definition of equality of opportunity, which unreasonably puts exclusive emphasis on human capital and ignores all other forms of capital that shape the opportunities that are available to individuals.
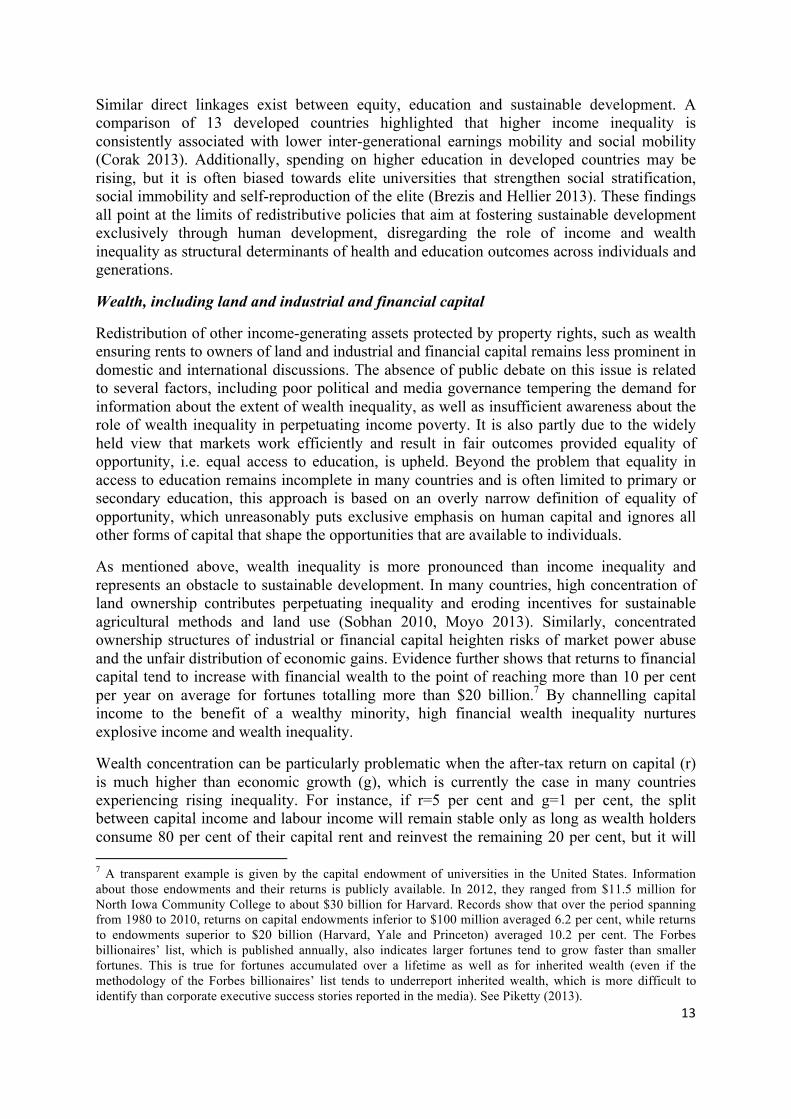
As mentioned above, wealth inequality is more pronounced than income inequality and represents an obstacle to sustainable development. In many countries, high concentration of land ownership contributes perpetuating inequality and eroding incentives for sustainable agricultural methods and land use (Sobhan 2010, Moyo 2013). Similarly, concentrated ownership structures of industrial or financial capital heighten risks of market power abuse and the unfair distribution of economic gains. Evidence further shows that returns to financial capital tend to increase with financial wealth to the point of reaching more than 10 per cent per year on average for fortunes totalling more than $20 billion.7 By channelling capital income to the benefit of a wealthy minority, high financial wealth inequality nurtures explosive income and wealth inequality.
Wealth concentration can be particularly problematic when the after-tax return on capital (r) is much higher than economic growth (g), which is currently the case in many countries experiencing rising inequality. For instance, if r=5 per cent and g=1 per cent, the split between capital income and labour income will remain stable only as long as wealth holders consume 80 per cent of their capital rent and reinvest the remaining 20 per cent, but it will 7 A transparent example is given by the capital endowment of universities in the United States. Information about those endowments and their returns is publicly available. In 2012, they ranged from $11.5 million for North Iowa Community College to about $30 billion for Harvard. Records show that over the period spanning from 1980 to 2010, returns on capital endowments inferior to $100 million averaged 6.2 per cent, while returns to endowments superior to $20 billion (Harvard, Yale and Princeton) averaged 10.2 per cent. The Forbes billionaires’ list, which is published annually, also indicates larger fortunes tend to grow faster than smaller fortunes. This is true for fortunes accumulated over a lifetime as well as for inherited wealth (even if the methodology of the Forbes billionaires’ list tends to underreport inherited wealth, which is more difficult to identify than corporate executive success stories reported in the media). See Piketty (2013).

14
start growing if wealth-holders reinvest more than 20 per cent of capital income. Furthermore, if returns to financial capital consistently increase with financial wealth, wealth concentration may increase steadily even if the split between capital income and labour income remains stable at the aggregate level (Piketty 2013). While the capacity of governments to boost technological innovation and economic growth in the long run may be limited (and lower economic growth, especially in developed countries, may be required for the sake of climate stabilization), many governments have implemented policies boosting the after-tax return on capital over the last three decades, with little regard for equity and sustainable development, and mitigated or negative effects on long-term economic growth (Ostry and Berg 2011, Ostry et al. 2014).
Figure 7: Capital stock accumulation, and the mutually reinforcing dynamic between wealth and income inequality in Europe and the United States (1900-2010)
Source: Author based on Piketty (2013). Note: The EU regroups France, Germany, Sweden and the United Kingdom. Income shares are pre-tax estimates. Capital stock and the derived wealth shares include land and industrial and financial capital.
The reinforcing interaction between capital accumulation, income and wealth concentration is best documented in countries where inequality can be assessed based on long-term fiscal data capturing information about the top of the income and wealth distribution. Figure 7 illustrates how the Great Depression and wars depleted the aggregate capital stock in the first half of the twentieth century in the United States and especially in Europe as well as the resuming process of capital accumulation after the Second World War, which tends to increase the role of wealth as a determinant of income. Capital destruction unwounded wealth concentration in the United States, but wealth concentration declined further in Europe during the thirty glorious years (1945-1975). This period characterized by intense reconstruction efforts in combination with progressive taxation keeping after-tax returns on capital inferior to economic growth (r<g), however, may be an exception rather the historical norm. With weaker economic growth in the wake of the oil shocks and conservative reforms that boosted the after-tax return on capital (r>g), rising income inequality first resumed in the United States around 1980, nurturing wealth concentration more intensively than in Europe, where conflicting national policy priorities and unravelling socio-democratic traditions slowed down the institutionalization of neoliberal ideas. Figure 7 represents the wealth and income
2040
6080
100
Shar
e (in
per
cen
t)
23
45
67
Rat
io o
f cap
ital s
tock
/GD
P
1900 1980 2000 20101914-18 1929 1939-45
EU capital stock/GDP (LHS) US capital stock/GDP (LHS)EU top 10 per cent wealth share (RHS) US top 10 per cent wealth share (RHS)EU top 10 per cent income share (RHS) US top 10 per cent income share (RHS)

15
share of the top decile in the United States and Europe, but recent changes are largely driven by changes in the top 1 per cent, which controls about half of the top decile’s income and wealth share, including the vast majority of financial wealth and financial capital income. Consequently, absent a rehabilitation of progressive taxation robust enough to unwind concentrated ownership structures, income and wealth inequality may be bound to increase to the point of reviving patrimonial capitalism that predominated in many European countries in the 19th century (Piketty 2013), with a more globalized and financialized flavour, harming equality of opportunity and sustainable development.
2.2.4. Redistributive policies and the un-sustainable use and in-equitable access to natural resources for present and future generations The potential for redistributive policies to promote environmental sustainability remains underexploited. In most countries, environmental taxes are closely tied to carbon sources, such as energy and vehicles, but they remain almost insignificant, especially in developed countries with the highest carbon emissions. At the same time, energy subsidies significantly stimulate the production and consumption of fossil fuels in many countries,8 amounting to global expenses of $1.9 trillion in 2011, the equivalent of 2.5 per cent of global GDP, or 8 per cent of government revenue (IMF 2013b). Higher environmental tax revenue is consistently associated with lower carbon emissions across all country income groups (figure 8). Hence, a rise in environmental taxes, including the creation of carbon border tax,9 and a decline in fossil fuel subsidies would certainly foster more sustainable use of natural resources and help curbing negative externalities.
If left unchecked, however, the regressive impact of higher flat indirect environmental taxes targeting consumption at the end of unsustainable global value chains could potentially lock the poorest out of markets and deprive them from access to energy and other goods likely subject to elevated environmental taxes. Most countries could implement progressive taxes tied to individual consumption of some goods and services that are particularly harmful to the environment, such as flights (e.g., exponential tax on plane tickets instead of frequent flyers reward programmes) or secondary residences (Casal 2012). Equitable access to natural resources could be fostered by the progressive redistribution of environmental tax revenue as well as of proceeds of socialized natural resource rents, such as in Norway, where corporate profits in the oil sector are taxed at a rate of 78 per cent,10 despite the relative difficult conditions for oil extraction, which are often invoked to justify the extensive privatization of natural resource rents in countries lacking good governance.
8 According to the International Energy Agency (IEA), several G20 countries significantly subsidize fossil-fuel consumption. In 2011, subsidy rates were estimated at 25.4 per cent in Argentina, 18.6 per cent in India, 18.4 per cent in the Russian Federation, 16.6 per cent in Mexico, 4.7 per cent in South Africa, 4.6 per cent in China, 0.3 per cent in Korea, and nil in other G20 countries. Furthermore, subsidization rates were above 50 per cent in Ecuador, Venezuela, Algeria, Libya, Egypt, Gulf Cooperation Council countries, Iraq, Iran, Turkmenistan and Uzbekistan. See http://www.iea.org/subsidy/index.html 9 Trade liberalization and the expansion of increasingly segmented global value chains stimulated international merchandise trade and transportation services, which on average increase carbon emissions of goods that are traded internationally by 50 per cent compared to locally traded goods (Cristea et al. 2013). As internationally traded goods embody about 21 per cent of global carbon emissions (Peters and Hertwich 2008), international transportation of traded goods alone may contribute to more than 7 per cent of global carbon emissions (WESP 2013, Box II.1). 10 See Norwegian Ministry of Finance: http://www.regjeringen.no/en/dep/fin/Selected-topics/taxes-and-duties/bedriftsbeskatning/taxation-of-petroleum-activities.html?id=417318

16
Alternative mechanisms, which may involve the more direct ownership and management of natural resources by public institutions driven by other motives than profit maximization alone may also be required to avoid the breach of planetary boundaries and preserve the rights of future generations. The Yasuní initiative proposed by Ecuador in 2007, for instance, highlights how public ownership of natural resources could contribute reining in the excessive exploitation of natural resources, provided international cooperation can be stepped up to address international and inter-generational equity concerns. This initiative proposed that Ecuador refrains indefinitely from exploiting the oil reserves from three oil fields within the Yasuní National Park, in exchange for 50 per cent of the value of the income it would be forgoing (an estimated $3.6 billion) from the world community. The Yasuní initiative offered the advantage of integrating many elements required for sustainable development, including ecosystem protection, climate change mitigation, and support for the rights of indigenous peoples, but it was finally abandoned in 2013 due to lack of funds raised (The Guardian, 19 September 2013). More recently, Norway’s $840 billion public Oil Fund, which owns on average 1.3 per cent of all listed companies, appointed a group of experts to examine whether the best strategy to address climate change is to divest from fossil fuel extraction or to define responsible criteria for exclusions (Financial Times, 28 February 2014). As technological progress is unlikely to deliver rapidly enough all the efficiency gains required for the world to adopt a sustainable development path, higher environmental taxes and new ways to offset their regressive impact through redistribution and prevent excessive fossil fuel extraction will probably become prominent policy concerns in developed and developing countries in the years ahead.
Figure 8: Environmental tax revenue and carbon emissions in G20 countries (2010)
Source: Author. Note: Based on data from WDI and OECD. Environmental tax revenue data is missing for Indonesia, the Russian Federation and Saudi Arabia. Environmental tax revenue mainly arises from energy and vehicle taxes, which are closely related to carbon emissions. The negative tax revenue in Mexico is due to the system stabilizing end-user prices of motor fuels, which is costly in years with high world-market fuel prices. R2 for high income countries is 0.42 and 0.23 for upper middle income countries; India is the only lower middle income country.
ItalyUnited Kingdom
Korea
Germany
France
Australia
Spain
Japan
Canada
United States
TurkeyBrazil
South AfricaChina
ArgentinaMexico
India
05
1015
20CO
2 em
issio
ns p
er c
apita
(m
etric
tons
)
-1 0 1 2 3 4Environmental tax revenue (as a share of GDP)
Note: High income=blue; upper middle income=maroon; lower middle income=green.

17
3. REDISTRIBUTIVE POLICY TRENDS IN A CHANGING CONTEXT 11
3.1. The standard public economics approach to redistributive policies The standard public economics approach suggests that governments should intervene, including through redistributive policies, whenever markets fail, i.e., when markets undersupply or oversupply in relation to what is considered desirable (e.g., the development of strategic sectors, economic efficiency, social fairness, environmental sustainability). Market failures are very common and occur in case of imperfect competition, natural monopolies, asymmetric information, merit goods, pure public goods as well as positive/negative externalities.
In the wake of the Second World War, many governments pursued this approach to guide their redistributive policies and were strongly involved in managing the economy. Although most concerns were subordinated to the overarching objective of pursuing economic growth, redistributive policies were explicitly used to support industrial policies, ensure the provision of public goods and correct socially unacceptable outcomes through income redistribution and, to a lesser extent, wealth redistribution.12 In developing countries, import-substitution and export-promotion strategies adopted after decolonization also required decisive policy interventions, legitimizing the active role of government in the economic sphere. The predominantly rural and informal nature of their economy and political economy factors partly inherited from the colonial era (Alvaredo and Atkinson, 2010), however, prevented the development of redistributive policies and institutions.
3.2. Shrinking government for private investment-led economic growth Starting in the late 1970s, the rise of trickle-down supply-side economic ideas strongly influenced the conceptualization of economic policy-making in general and redistributive policies in particular. As the clout of business interests and pro-market ideas became increasingly dominant in many media, policy and academic circles, government interventions were increasingly framed in the public discourse as inefficient market distortions preventing the optimal allocation of factors and income within domestic markets and across the global factory. By contrast and as a corollary, markets were portrayed as neutral and perfectly efficient, as if they could be disembedded from the broader social and political context. This shift in public discourse consecrated the role of private investment as the main driver of economic growth, technological progress and human development and further encouraged a minimalistic vision of government. The alleged inferior efficiency of government justified the near liquidation of asset-based public policy through extensive privatization of public income-generating assets (e.g., water supply, railroads, telecom, etc.) and the overall downsizing of income-based public policy induced by declining tax revenue. Lower total government revenue went hand in hand with lower expenditure and/or higher public debt
11 This section summarizes the review of redistributive policies presented in an earlier version of this paper, Kohler (2014) Available from: http://mpra.ub.uni-muenchen.de/55620/2/MPRA_paper_55620.pdf 12 For instance, in the United States, the top marginal income tax rate was raised from below 30 per cent in 1920s to more than 90 per cent in 1945 before declining gradually from 1964 onwards. Similarly, estate/inheritance taxes were raised from about 20 per cent in the 1920s to more than 70 per cent in the aftermath of the Great Depression before declining gradually from the 1970s onwards. Top income and inheritance tax rates display similar patterns in the UK and many other developed countries.
18
(figure 2). These policies13 resulted in the growing concentration of income-generating assets in private hands,14 weaker redistribution, rising income inequality and unsustainable development.
Emphasis on private investment further promoted a model of economic growth inducing larger cyclical swings and a more unequal income distribution, because of its bias favouring profit-making and higher income groups with the largest propensity to save and invest. According to proponents of private investment-led economic growth, enhanced economic efficiency and incentives for profit-seeking would necessarily generate additional economic gains, which would trickle-down through market interactions and benefit the broader population, making inefficient government-intermediated redistribution of income and wealth superfluous.
The success of the neoliberal approach among policy-makers is related to political economy factors as well as to its internal consistency and formal simplicity rooted in highly reductionist micro-founded economic models. It also stems from the widespread use by policy-makers of purely economic measures (e.g., corporate profits, GDP) as the ultimate but ill-conceived benchmark of progress (Stiglitz, Sen and Fitoussi, 2009, Costanza et al. 2012). Indeed, theoretical economic models underpinning this approach largely ignore the broader macroeconomic, social and environmental context. They do not take into account the role of income distribution in determining the level of domestic demand and economic stability. They also fail to acknowledge the existence of unequal initial endowments as well as environmental and other market failures that perpetuate unsustainable development, and which discriminatory taxation could seek to correct. The shortcomings of this approach, however, did not prevent it from gaining influence in many domestic and international institutions.
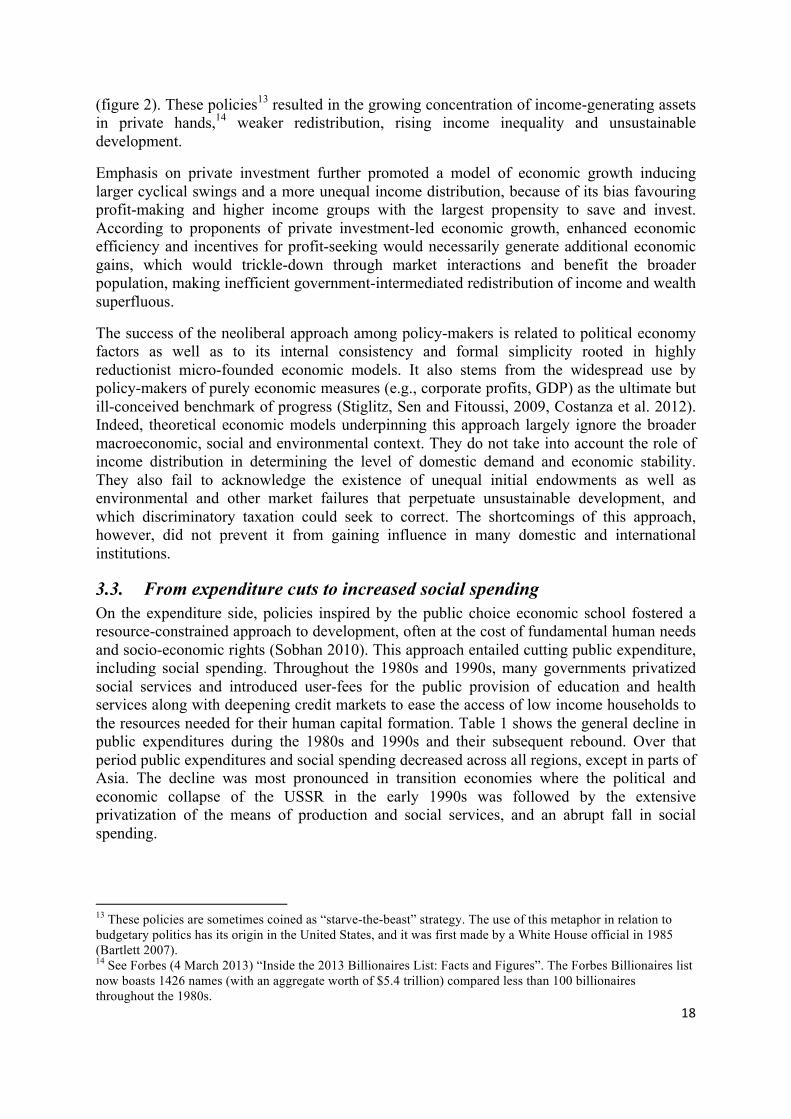
3.3. From expenditure cuts to increased social spending On the expenditure side, policies inspired by the public choice economic school fostered a resource-constrained approach to development, often at the cost of fundamental human needs and socio-economic rights (Sobhan 2010). This approach entailed cutting public expenditure, including social spending. Throughout the 1980s and 1990s, many governments privatized social services and introduced user-fees for the public provision of education and health services along with deepening credit markets to ease the access of low income households to the resources needed for their human capital formation. Table 1 shows the general decline in public expenditures during the 1980s and 1990s and their subsequent rebound. Over that period public expenditures and social spending decreased across all regions, except in parts of Asia. The decline was most pronounced in transition economies where the political and economic collapse of the USSR in the early 1990s was followed by the extensive privatization of the means of production and social services, and an abrupt fall in social spending.
13 These policies are sometimes coined as “starve-the-beast” strategy. The use of this metaphor in relation to budgetary politics has its origin in the United States, and it was first made by a White House official in 1985 (Bartlett 2007). 14 See Forbes (4 March 2013) “Inside the 2013 Billionaires List: Facts and Figures”. The Forbes Billionaires list now boasts 1426 names (with an aggregate worth of $5.4 trillion) compared less than 100 billionaires throughout the 1980s.

19
Table 1: Public expenditure by region, 1980-2011 (as a share of GDP)
Developed countries Sub-Saharan Africa Latin America and
Caribbean 1980s 1990s 2000s 1980s 1990s 2000s 1980s 1990s 2000s Total expenditure 43.3 40.3 40.2 27.8 25.5 25.6 22 18.7 21.2 Social sector 23 22.7 24.6 7.2 7.2 8 9.1 8.2 9.1 Education 3.7 4.4 4.9 4.3 4.1 4.2 3.3 2.7 3.4 Health 4.2 4.4 5.4 1.8 1.8 2.2 2.4 1.5 1.8 Social protection 15.1 13.9 14.3 1.1 1.3 1.6 3.4 3 3.9
East, South, and South East Asia
Middle East and North Africa
Transition economies
1980s 1990s 2000s 1980s 1990s 2000s 1980s 1990s 2000s Total expenditure 24.9 23 24 34.2 29 28.7 31.9 27.8 25 Social sector 5.7 5.9 6.9 9.1 7.9 9.1 9.7 6.5 6.3 Education 3 3.1 3.3 4.1 4.4 4.1 1.3 2.3 1.9 Health 1.2 1.3 1.4 1.6 1.6 1.7 1 1.6 1.3 Social protection 1.3 1.5 2.2 3.4 1.9 3.3 7.4 2.6 3.1
Source: Cornia (2013) WESS background paper. Note: Based on IFPRI SPEED database, which draws mainly on the IMF-GFS data. Data generally refers to the expenditure of the central government and only seldom those of general government. Social spending data does not include outlays on housing, nutrition, food subsidies and other less important items.
Yet, those attempts at financing human capital formation through out-of-pocket household expenditure adversely affected human capital investments by low-income households (Birdsall et al. 2011). Instead of enabling the economic gains created through a supposedly more efficient economic organisation to trickle-down to poorer and excluded social groups, these policies readily undermined the capacity of governments to redistribute those gains and further degraded the ideal of social solidarity between individuals and generations. The negative effects of this approach are most obvious in poorer countries experiencing developmental difficulties, but they are increasingly visible in many richer countries, including vulnerable democracies (Solt 2008; Bonica et al. 2013) where poverty and inequality are on the rise. Over the years, popular discontent and criticism in certain mainstream academic and policy circles have become more vocal (e.g., Stiglitz 2003 and 2013).
The failures and the adverse social impact of those policies prepared the way for a different approach at the turn of the Millennium, giving stronger priority to extreme poverty reduction and public social spending as a means to foster human and economic development. This inflexion in the prevailing approach to development also promoted the introduction of social protection, especially in the form of highly targeted conditional and non-conditional cash transfers, which currently benefit around 850 million people and positively contribute to reduce income poverty and inequality (Cornia 2012).
The inflexion in public social spending observed since 2000 has its limitation, however. In many developing regions, public expenditure as a share of GDP is still inferior to its level in the 1980s. The scope for budget reallocation is thus strictly constrained. Furthermore, public social spending in developing countries has not increased faster than in developed countries,

20
where public social spending represents about 25 per cent of GDP, 3 to 4 times more than in developing countries, where it hovered between 6.3 per cent of GDP in transition economies and 9.1 per cent of GDP in Latin America (table 1).The very slight increase of public expenditures on education and health in some regions since 2000, has led to an incremental convergence between developed and developing countries, which is well documented (Kohler 2014).
Figure 9: Regional net Gini coefficients (1970-2010)
Source: Author. Note: Data from SWIID (version 4.1) and UNPOP. Regions are defined according to the UN definition (see http://unstats.un.org/unsd/methods/m49/m49regin.htm). Regional trends represent population-weighted within-country Gini coefficients averaged at the regional level, based on data that is interpolated and extrapolated in order to keep the pool of countries identical over time. The assumption that income inequality remained constant prior to the first observation/after the last observation tends to flatten regional trends, especially in the 1970s. As data is generally available very early on for the most populous countries and all variables are population-weighted, this pitfall has only limited consequences. Dotted lines indicate 95 per cent confidence intervals for net Gini coefficients.
Social protection expenditures, however, have not converged. Despite some progress in the deployment of social protection in developing countries over the last decade, weaker public revenue mobilization put a strain on the range of social protection programmes that can be funded, as well as on their quality and coverage, including through discriminatory conditionalities imposed on potential social protection recipients, especially elderly people and women (Razavi et al. 2012).
In most developing regions, the approach to social protection remains resource-constrained and pro-cyclical, but there are exceptions (see ILO 2010, ADB 2012a and 2012b, UNCTAD 2012, UNRISD 2010). In Latin America, for instance, the rise of left-leaning governments since 2000 facilitated the progressive move towards a more rights-based approach to social
2040
5060
30G
ini n
et (i
n po
ints
)
1970 1980 1990 2000 2010
Global average AfricaLatin America and the Caribbean Northern America
Asia Europe Oceania

21
spending, including social protection. Consequently, Latin America has become the developing region that spends most on social protection and, incidentally, it is also the only region that registered a steady and significant decline in poverty and income inequality since 2000 (figure 9). Over the same period, income inequality kept rising in Asia, which now appears as the most unequal region in the world. This trend was largely driven by China, even though some regional governments, such as in Chongqing, successfully managed to leverage public asset ownership to foster social protection and (more) equitable development (box 1).
___________________________________________________________________________
BOX 1: CHONGQING’S “THIRD HAND” – AN EXPERIENCE IN LEVERAGING PUBLIC ASSETS FOR EQUITABLE DEVELOPMENT IN THE 21ST CENTURY15 China has been one of the main drivers of rising inequality in Asia over the last decades, as its net Gini almost doubled in less than 20 years, rising from 31 points in the early 1980s to 55 points in the mid-2000s, before stabilizing at around 53 points in more recent years.16 This rise in inequality occurred in a context of rapid structural transformation attributing a growing role to the invisible hand of the private sector. At the same time, major income-generating assets managed by state-owned enterprises (SOEs) converted into profit-making state-firms partly remain in the public domain. The continued major role of a public hand in gearing economic growth in China, however, was not sufficient to prevent the overall rise in inequality, which has been officially acknowledged to represent a major issue,17 hinting at the limits of developing the economy by “letting some people get rich first.” However, in a context where divulgating official inequality estimates has become a political embarrassment, the Chongqing province, emboldened by the success of its policies to reduce inequality, which some authors have coined as the “third hand”, became the country’s first province to publish its Gini coefficient in 2010. Its vow to reduce its Gini coefficient from 42 points to 35 points during the 12th Five-Year Plan (2011-2015) period is a testimony to the possibility of structuring policies around the objective of reducing income inequality.
The approach of Chongqing to reduce inequality is anchored in factors specific to the Chinese context as well as in determinate policy action. Like many other Chinese local governments, Chongqing articulated its development strategy around efforts to draw in outside investment and land financing. In the 2000s, it pursued a strategic development plan to attract “dragon head enterprises” expected to spearhead growth in strategic sectors, such as information technology, car production or pharmaceuticals. Simultaneously, it extensively used the anticipated appreciation of land earmarked for development to fund urban development. While such strategies have been implemented extensively across China, the effective socialization of derived economic gains has not always materialized as successfully as in Chongqing.
The originality of the Chongqing equitable development strategy lies in its use of a third hand, whose main instruments are restructured state-owned enterprises (SOEs) that are enabled to evolve in a competitive market environment, but which strive for social equity and public benefit rather than corporate profits alone. The origin of Chongqing’s approach to SOEs lays in the way the Chongqing government dealt with bad debts crippling banks and SOEs in the late 1990s to restructure them into marketized firms. Instead of letting SOEs go bankrupt or injecting massive amounts of government
15 This box draws heavily on two articles by Huang (2011, 2012), which provide an in-depth analysis of the specificity of the Chongqing equitable development strategy. 16 Standardized disposable/net income gini estimates are from SWIID (version 4.1) database. 17 In the 17th Party Congress report of 2008, the original phrase of “efficiency first, equity second” was discarded in favor of “greater emphasis on equity in redistribution” signaling a definite leftward correction. Chongqing has in fact been the main test-point designated by the Party central for that reorientation. See Salidjanova 2013.

22
money into those firms (as most developed countries did during the global financial crisis), Chongqing seized this opportunity to take over unprofitable banks and enterprises at a discounted price, pooling those assets in a newly created government-owned asset management company (Chongqing Wealth). It then reorganized those assets and introduced eight restructured SOEs in the market environment. However, those marketized SOEs remained officially dedicated to public benefit in the areas of urban development, express highway development, high-level highways, real estate, city transport development, energy resources, water affairs (including water resources development, water supply, sewage treatment, and hydroelectric projects), and water conservancy (including irrigation).
Between 2002 and 2009, Chongqing’s SOEs assets appreciated by a record 620 per cent. Conserving those restructured SOEs fully in the public domain fostered equitable development in various ways. First, it avoided privatizing those rents, in accordance with Sun Yat-sen’s idea that the appreciation in the value of land should belong to the public, especially when the value of such assets increases faster than wages. Secondly, revenues generated by land value appreciation and profitable SOEs enabled the government to increase social spending, including social protection, education and health and improve public services. Finally, by waving the necessity for SOEs to maximize dividends for shareholders, it enabled marketized SOEs to pursue strategies fostering the broader public good instead of profit alone. For instance, as inequality reached record levels across China in the early 2000s, the Chongqing SOEs undertook the construction of inexpensive public rental housing for 3 million people, especially for peasant migrant workers, whose rights are severely constrained by the hukou system and who suffer most from rising inequality.18
The Chongqing experience illustrates the potential for policy interventions to reduce inequality and may inspire policy-makers in countries disposing of similar ownership structures (Klimina 2011). It also highlights the potential for asset-based public policy to reduce income inequality and share the benefits of economic development in a more equitable way than markets, while fostering efficient management (Shi and Liu 2012). By maintaining public ownership of the land in the primary market as well as in the secondary market through public ownership of marketized SOEs, the Chongqing government effectively socialized economic gains that could have been easily privatized. Public ownership of the SOEs further illustrate the potential of multi-level firm governance structures involving a plurality of stakeholders to reflect not only the interests of capital holders, but also the interest of workers (Dugger 1987, 1998) as well as broader social and environmental concerns.
*****END OF BOX *****
In summary, the inflexion discussed above represented a positive step towards rehabilitating progressive redistribution. Yet, the lack of sufficient resources for social spending across most developing regions, its pro-cyclicality and vulnerability to exogenous factors in combination with enduring poverty and rising inequality also clearly highlight a major limitation of the current approach. By focusing on raising public social spending, but neglecting to raise sufficient revenues in an equitable manner through progressive income and wealth taxation, most countries failed to provide redistributive policies with a solid backbone.
3.4. The neoliberal tax legacy and regressive revenue mobilization As noted above, the standard public economics approach to redistributive policies envisioned a role for discriminatory taxation in order to achieve certain industrial, distributional or environmental objectives. Neoliberal ideas profoundly altered this approach to taxation by framing government economic interventions and progressive taxation in particular as 18 There were about 150 million migrant peasant workers in China in 2009. Chongqing had a population of 33 million in 2009, including 23 million of registered peasants, a fraction of which are peasant migrant workers.

23
inefficient distortions discouraging economic activity. Consequently, the overall objective assigned to tax reform was to shrink government and remove so-called distortions.
In developed countries, tax reforms led to a substantial decline in tax revenue and to more regressive tax structures, shifting the tax base away from progressive wealth and income taxes, especially capital income taxes, towards regressive consumption taxes penalizing lower income households. Such reforms also found an echo in developing countries, where international donors and institutions, such as the IMF and the World Bank, encouraged many governments through repeated recommendations and conditional loans to embrace the same approach.19 In the wake of trade liberalization, tax reform in developing countries often emphasized regressive consumption taxes as a means to replace falling trade tax revenue, with mitigated results, especially in low-income countries (Baunsgaard and Keen 2010). Quick fixes, such as the creation of semi-autonomous revenue agencies (SARAs) focusing on value-added taxes, for instance, allowed to rapidly raise revenue in some developing countries, but they failed to do so in a progressive manner and further locked-in administrative structures that were not conducive to adequate and progressive revenue mobilization and the development of modern integrated public administrations, which are required for state-building and sustainable development (Prichard 2010).
As this tax legacy hampers resource mobilization, the international community emphasized the need for increasing ODA and finding elusive innovative financing sources (United Nations 2003, 2008). In the meanwhile, the enduring weakness of tax administrations is reflected in the continuous need for ODA, especially in LDCs, and resource-constrained approaches to public social spending as well as in the current debate on tax avoidance and evasion by TNCs and HNWIs exploiting tax havens and offshore financial centers to accumulate extreme wealth. This sheds crude light on the inability of tax authorities of least developed, developing and developed countries to tax the richest elements of their societies according to their ability to pay and raise sufficient revenue for sustainable development objectives.
3.4.1. Total revenue, including non-tax revenue from natural resources exploitation Throughout the 1980s and 1990s, total government revenue (as a share of GDP) declined hand in hand with cuts in public expenditures. Comparable revenue data for developing countries is hardly available prior to 1990, but table 2 captures the final years of a declining trend in total revenue, which bottomed at the end of the 1990s across most regions before picking up in the early 2000s. However, in developed countries and many parts of Asia, total revenue at the end of the 2000s remained inferior to its level 20 years earlier. Despite this decline, total revenue in developed countries amounted to 41.3 per cent of GDP on average in 2010, up to twice as much as in some other regions.
In developing regions such as Africa, Latin America, Western Asia and in transition economies, rising total revenue over the last decade partly resulted from growing other (non-tax) revenue derived from higher commodity prices, improved terms of trade, increased exploitation of natural resources, as well as from deliberate policies aiming at appropriating a
19 About 50 per cent of all adjustment loans provided by the IMF and the World Bank between 1979 and 1989 included conditions relating to fiscal reforms, and more than 50 per cent included conditions relating to both trade reforms and the rationalization of government finances, which had tax reform elements (Webb and Shariff, 1992).

24
larger share of the commodity bonanza for government. Western Asia has long been deriving a majority of its revenue from oil exports, but Africa registered the largest increase in other (non-tax) revenue over the last decade, which rose on average by 2.6 GDP points to 9.1 per cent of GDP around 2010, representing almost a third of total revenue.
The exploitation of natural resources generates revenues accruing to governments in the form of either profit of (partly) state-owned enterprises or royalties and taxes paid by private companies. Rapidly growing demand from Asian markets and rising commodity prices over the last decade accelerated the exploitation of natural resources, especially in sub-Saharan Africa, where the share of the mining and oil sector now weighs more than a quarter of GDP in 9 countries, and about half of GDP in Angola, the Republic of Congo, Equatorial Guinea, Gabon and Mauritania (Cornia 2013). Although the most common range for royalty rates is around 5 per cent to 10 per cent, royalty rates were often well below that common range in a number of African countries in previous decades (Baunsgaard, 2001), highlighting the extreme extent to which natural resource rents are privatized.
The most controversial attempt to socialize rents from natural resource exploitation probably comes from Latin America, where the Venezuelan Government nearly doubled royalty payment in the oil sector from 16 per cent to 30 per cent in 2001. Strong international reactions and criticism followed, but did not fully prevent further countries from exploring new paths challenging dominant economic wisdom about the best way to exploit natural resources and attract foreign direct investment. Since 2006, a number of countries in Latin America, Africa as well as Australia have revised their fiscal regimes and attempted to renegotiate contracts with TNCs in the extractive industries with the objective of striking a better balance between generating income from the exploitation of natural resources with the help of FDI, and appropriating a larger share of the derived rents for the government.20
3.4.2. Insufficient tax revenue, its composition and regressive tax structures
Insufficient tax revenue
Tax revenue followed a trend similar to total revenue, except in developed countries, where tax revenue declined steadily and only stabilized at an average level amounting to 36 per cent of GDP in 2010. Despite this decline, tax revenue as a share of GDP in developed countries still represented almost twice the average prevailing in most developing regions. As noted by the G20, about half of sub-Saharan African countries still mobilise less than 17 per cent of their GDP in tax revenue, below the minimum level of 20 per cent considered by the UN as necessary to achieve the MDGs (G20 2011). Yet, as reported in table 2, tax revenue as a share of GDP remains below 20 per cent in many Asian and Latin American countries, partly because of widespread subsistence production, limited income, large informal sectors, weak
20 Abundant anecdotal evidence of contract renegotiations that started after 2006 is reported in UNCTAD TDR 2010 (Chapter V). Many of these renegotiations resulted in positive, but rather minor revisions of contract terms to the benefit of governments. In unstable countries, such as Madagascar or the DRC, implementation was delayed. Overall, governments in poor countries have very low discount rates, which lead them to value highly an immediate increase in revenue, even if the increase is minor and jeopardizes the possibility of increasing revenue in the future. This economic issue is further often compounded by poor governance and lack of transparency (Africa Progress Report 2013) that facilitate the privatization of natural resource rents. By contrast, richer countries with higher discount rates and more transparent governance mechanisms are often in a position to socialize a larger share of natural resource rents. Norway, for instance, appropriates about 78 per cent of natural resource (oil) rents to the public.
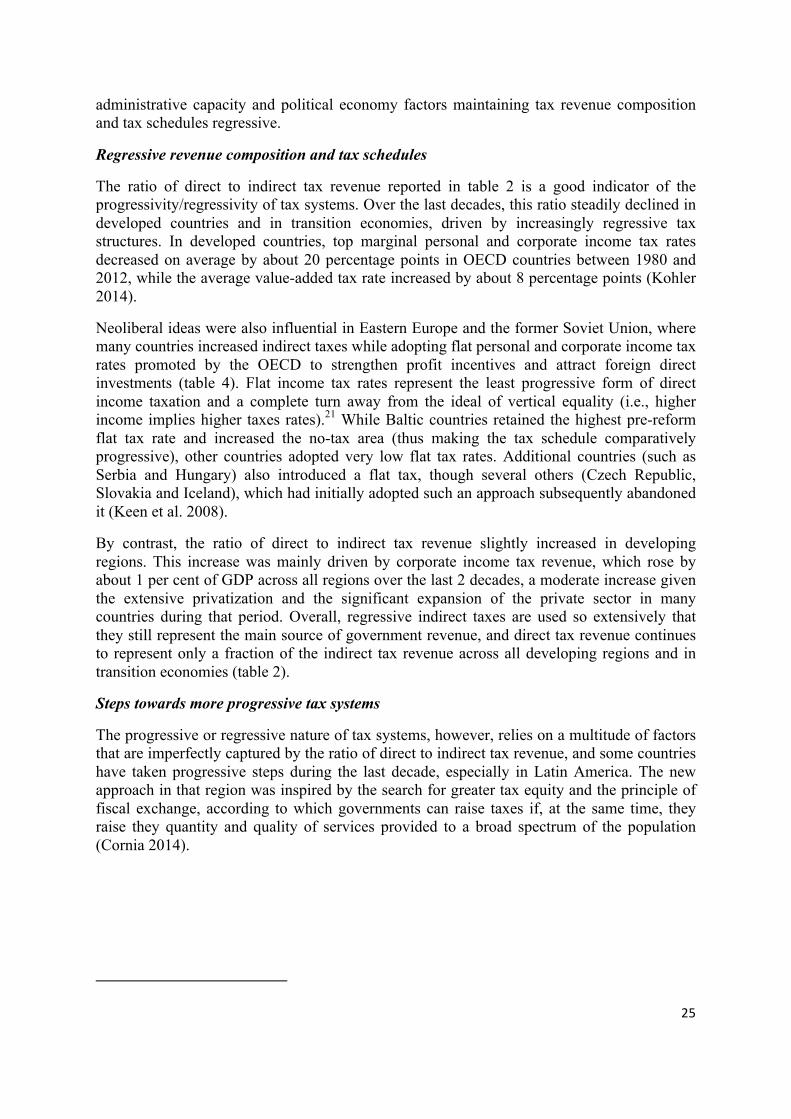
25
administrative capacity and political economy factors maintaining tax revenue composition and tax schedules regressive.
Regressive revenue composition and tax schedules
The ratio of direct to indirect tax revenue reported in table 2 is a good indicator of the progressivity/regressivity of tax systems. Over the last decades, this ratio steadily declined in developed countries and in transition economies, driven by increasingly regressive tax structures. In developed countries, top marginal personal and corporate income tax rates decreased on average by about 20 percentage points in OECD countries between 1980 and 2012, while the average value-added tax rate increased by about 8 percentage points (Kohler 2014).
Neoliberal ideas were also influential in Eastern Europe and the former Soviet Union, where many countries increased indirect taxes while adopting flat personal and corporate income tax rates promoted by the OECD to strengthen profit incentives and attract foreign direct investments (table 4). Flat income tax rates represent the least progressive form of direct income taxation and a complete turn away from the ideal of vertical equality (i.e., higher income implies higher taxes rates).21 While Baltic countries retained the highest pre-reform flat tax rate and increased the no-tax area (thus making the tax schedule comparatively progressive), other countries adopted very low flat tax rates. Additional countries (such as Serbia and Hungary) also introduced a flat tax, though several others (Czech Republic, Slovakia and Iceland), which had initially adopted such an approach subsequently abandoned it (Keen et al. 2008).
By contrast, the ratio of direct to indirect tax revenue slightly increased in developing regions. This increase was mainly driven by corporate income tax revenue, which rose by about 1 per cent of GDP across all regions over the last 2 decades, a moderate increase given the extensive privatization and the significant expansion of the private sector in many countries during that period. Overall, regressive indirect taxes are used so extensively that they still represent the main source of government revenue, and direct tax revenue continues to represent only a fraction of the indirect tax revenue across all developing regions and in transition economies (table 2).
Steps towards more progressive tax systems
The progressive or regressive nature of tax systems, however, relies on a multitude of factors that are imperfectly captured by the ratio of direct to indirect tax revenue, and some countries have taken progressive steps during the last decade, especially in Latin America. The new approach in that region was inspired by the search for greater tax equity and the principle of fiscal exchange, according to which governments can raise taxes if, at the same time, they raise they quantity and quality of services provided to a broad spectrum of the population (Cornia 2014).
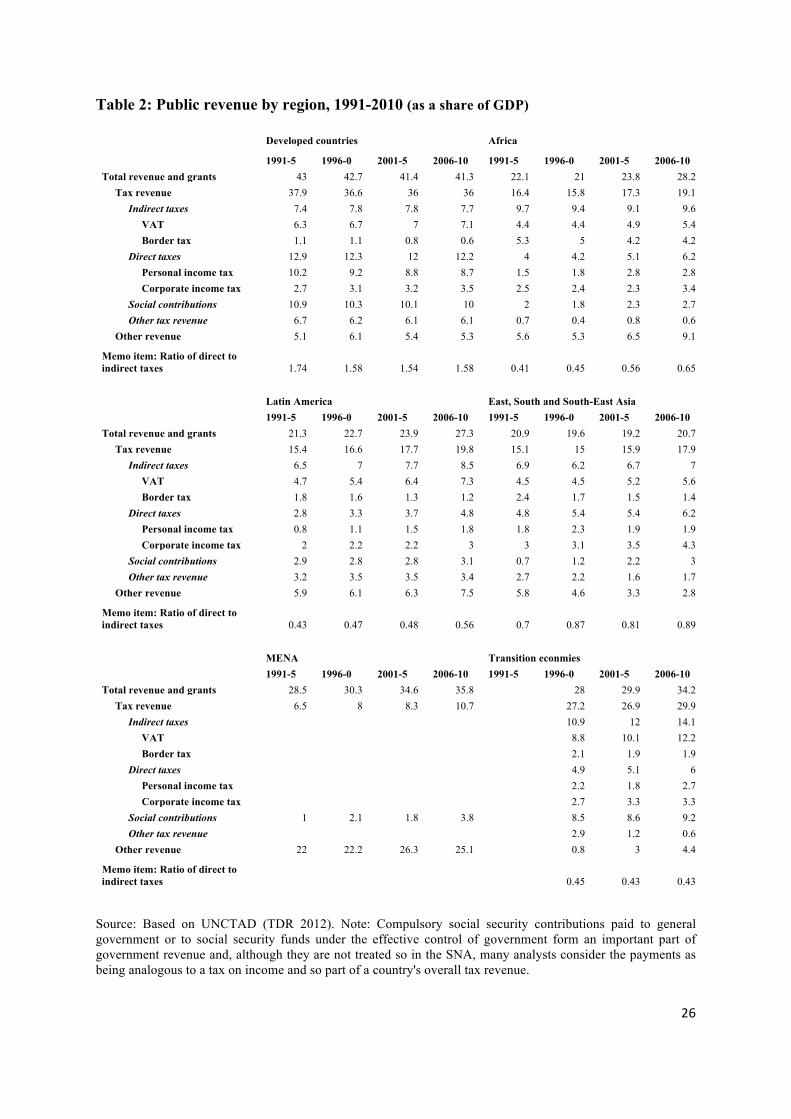
26
Table 2: Public revenue by region, 1991-2010 (as a share of GDP)
Developed countries Africa
1991-5 1996-0 2001-5 2006-10 1991-5 1996-0 2001-5 2006-10 Total revenue and grants 43 42.7 41.4 41.3 22.1 21 23.8 28.2 Tax revenue 37.9 36.6 36 36 16.4 15.8 17.3 19.1 Indirect taxes 7.4 7.8 7.8 7.7 9.7 9.4 9.1 9.6 VAT 6.3 6.7 7 7.1 4.4 4.4 4.9 5.4 Border tax 1.1 1.1 0.8 0.6 5.3 5 4.2 4.2 Direct taxes 12.9 12.3 12 12.2 4 4.2 5.1 6.2 Personal income tax 10.2 9.2 8.8 8.7 1.5 1.8 2.8 2.8 Corporate income tax 2.7 3.1 3.2 3.5 2.5 2.4 2.3 3.4 Social contributions 10.9 10.3 10.1 10 2 1.8 2.3 2.7 Other tax revenue 6.7 6.2 6.1 6.1 0.7 0.4 0.8 0.6 Other revenue 5.1 6.1 5.4 5.3 5.6 5.3 6.5 9.1
Memo item: Ratio of direct to indirect taxes 1.74 1.58 1.54 1.58 0.41 0.45 0.56 0.65
Latin America East, South and South-East Asia 1991-5 1996-0 2001-5 2006-10 1991-5 1996-0 2001-5 2006-10 Total revenue and grants 21.3 22.7 23.9 27.3 20.9 19.6 19.2 20.7 Tax revenue 15.4 16.6 17.7 19.8 15.1 15 15.9 17.9 Indirect taxes 6.5 7 7.7 8.5 6.9 6.2 6.7 7 VAT 4.7 5.4 6.4 7.3 4.5 4.5 5.2 5.6 Border tax 1.8 1.6 1.3 1.2 2.4 1.7 1.5 1.4 Direct taxes 2.8 3.3 3.7 4.8 4.8 5.4 5.4 6.2 Personal income tax 0.8 1.1 1.5 1.8 1.8 2.3 1.9 1.9 Corporate income tax 2 2.2 2.2 3 3 3.1 3.5 4.3 Social contributions 2.9 2.8 2.8 3.1 0.7 1.2 2.2 3 Other tax revenue 3.2 3.5 3.5 3.4 2.7 2.2 1.6 1.7 Other revenue 5.9 6.1 6.3 7.5 5.8 4.6 3.3 2.8
Memo item: Ratio of direct to indirect taxes 0.43 0.47 0.48 0.56 0.7 0.87 0.81 0.89
MENA Transition econmies 1991-5 1996-0 2001-5 2006-10 1991-5 1996-0 2001-5 2006-10 Total revenue and grants 28.5 30.3 34.6 35.8 28 29.9 34.2 Tax revenue 6.5 8 8.3 10.7 27.2 26.9 29.9 Indirect taxes 10.9 12 14.1 VAT 8.8 10.1 12.2 Border tax 2.1 1.9 1.9 Direct taxes 4.9 5.1 6 Personal income tax 2.2 1.8 2.7 Corporate income tax 2.7 3.3 3.3 Social contributions 1 2.1 1.8 3.8 8.5 8.6 9.2 Other tax revenue 2.9 1.2 0.6 Other revenue 22 22.2 26.3 25.1 0.8 3 4.4
Memo item: Ratio of direct to indirect taxes 0.45 0.43 0.43
Source: Based on UNCTAD (TDR 2012). Note: Compulsory social security contributions paid to general government or to social security funds under the effective control of government form an important part of government revenue and, although they are not treated so in the SNA, many analysts consider the payments as being analogous to a tax on income and so part of a country's overall tax revenue.

27
In Latin America, for instance, value-added tax rates were mostly left unchanged, but excises on luxury goods were increased in some countries. Many countries placed more emphasis on progressive income taxation. For instance, the 2007 Uruguayan tax reform introduced ex-novo a progressive personal income tax, but only a flat corporate income tax. Other countries introduced a minimum tax on firms to strengthen the collection of corporate income tax (e.g. Mexico) or lowered the income per capita at which the highest direct marginal tax rate is applied. Most governments eliminated a long list of exemptions, deductions and tax holidays benefiting TNCs, which had been introduced in the 1980s and 1990s to attract foreign investments without yielding the desired effects. Presumptive taxation was also strengthened due to the inability of the tax administration to ascertain the assets and income of potential taxpayers, and was levied on an estimate of the person/firm’s income made by the tax authorities on the basis of objective indicators of gross turnover (e.g. assets, number of employees, electricity consumption). The strengthening of presumptive taxation was accompanied by a simplification of taxation of self-employed taxpayers. For instance, in 1998 Argentina tax authorities integrated social security payments, income tax, minimum tax on assets and value-added tax. Several Latin American countries further introduced a surrogate tax on financial transactions yielding 0.3 to 1.9 per cent of GDP. Standard theory suggests that this tax is distorting and leads to financial disintermediation. Yet, it can also be seen as a second best policy instrument to tax wealth and capital income, which otherwise would escape taxation (Cornia 2014).
Declining environmental tax revenue in developed countries
Several Latin American countries, such as Brazil, Costa Rica and the Dominican Republic significantly increased environmental tax revenue between 2000 and 2011, collecting revenue in excess of 1.6 per cent of GDP, the OECD average in 2011 (figure 10). Other developing countries, including China, also made progress during the last decade, but still collect little revenue. More worryingly, environmental tax revenue declined in most OECD countries, including those with highest carbon emissions, such as the United States, Canada, New Zealand or Australia, mainly due to the failure of policy-makers to index tax rates and keep up with inflation. Several European countries22 have created carbon taxes and the United Kingdom even labelled it a “climate change levy”. These taxes, however, have yielded very little revenue, not so much because of their deterring effect on carbon emitters, but because of the extremely low tax rates imposed on carbon externalities.
Many countries refrain from levying more significant environmental taxes to avoid dealing with their redistributive implications. Furthermore, exemptions are often granted to energy-intensive industrial sectors to foster their international competitiveness (OECD 2006, 2010). Instead of being submitted to taxes redistributing revenue from the private to the public sector, corporations have increasingly been submitted to market-based solutions, such as cap-and-trade or emissions trading systems (ETS) and offsetting mechanisms, which redistribute revenue among corporations only. The Kyoto Protocol laid the foundation for implementing these flawed solutions globally (Spash 2010), but only a minority of countries have committed to binding carbon emissions reduction targets.23 Furthermore, the overly generous allowance of free emission permits to corporations has kept carbon pricing well below $50 per ton, is considered by many climate experts as a minimum for enabling structural 22 Denmark, Finland, Germany, Ireland, Italy, the Netherlands, Norway, Slovenia, Sweden, Switzerland and the United Kingdom. 23 Developing countries and major developed countries, such as Canada, Japan, New Zealand, the Russian Federation and the United States are not bound by any reduction targets
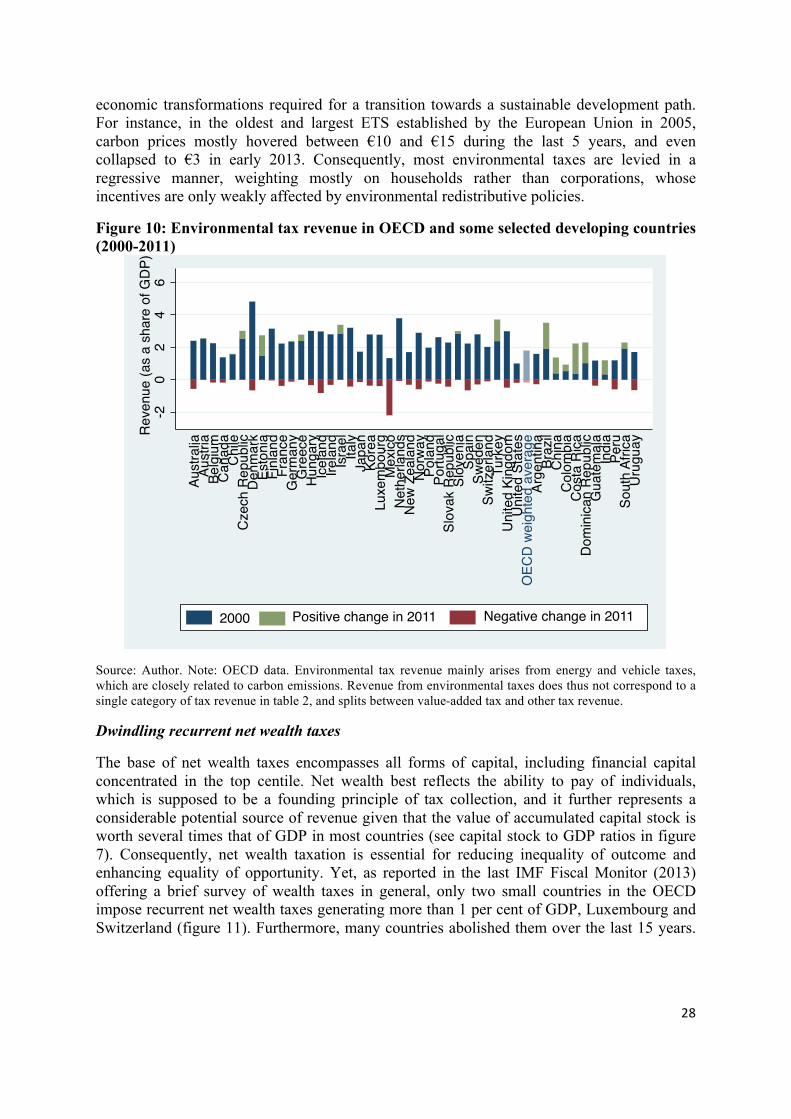
28
economic transformations required for a transition towards a sustainable development path. For instance, in the oldest and largest ETS established by the European Union in 2005, carbon prices mostly hovered between €10 and €15 during the last 5 years, and even collapsed to €3 in early 2013. Consequently, most environmental taxes are levied in a regressive manner, weighting mostly on households rather than corporations, whose incentives are only weakly affected by environmental redistributive policies.
Figure 10: Environmental tax revenue in OECD and some selected developing countries (2000-2011)
Source: Author. Note: OECD data. Environmental tax revenue mainly arises from energy and vehicle taxes, which are closely related to carbon emissions. Revenue from environmental taxes does thus not correspond to a single category of tax revenue in table 2, and splits between value-added tax and other tax revenue.
Dwindling recurrent net wealth taxes
The base of net wealth taxes encompasses all forms of capital, including financial capital concentrated in the top centile. Net wealth best reflects the ability to pay of individuals, which is supposed to be a founding principle of tax collection, and it further represents a considerable potential source of revenue given that the value of accumulated capital stock is worth several times that of GDP in most countries (see capital stock to GDP ratios in figure 7). Consequently, net wealth taxation is essential for reducing inequality of outcome and enhancing equality of opportunity. Yet, as reported in the last IMF Fiscal Monitor (2013) offering a brief survey of wealth taxes in general, only two small countries in the OECD impose recurrent net wealth taxes generating more than 1 per cent of GDP, Luxembourg and Switzerland (figure 11). Furthermore, many countries abolished them over the last 15 years.
-20
24
6Re
venu
e (a
s a
shar
e of
GDP
)
Aust
ralia
Aust
riaBe
lgiu
mCa
nada
Chile
Czec
h Re
publ
icDe
nmar
kEs
toni
aFi
nlan
dFr
ance
Ger
man
yG
reec
eHu
ngar
yIc
elan
dIre
land
Isra
elIta
lyJa
pan
Kore
aLu
xem
bour
gM
exico
Neth
erla
nds
New
Zeal
and
Norw
ayPo
land
Portu
gal
Slov
ak R
epub
licSl
oven
iaSp
ain
Swed
enSw
itzer
land
Turk
eyUn
ited
King
dom
Unite
d St
ates
OEC
D we
ight
ed a
vera
geAr
gent
ina
Braz
ilCh
ina
Colo
mbi
aCo
sta
Rica
Dom
inica
n Re
publ
icG
uate
mal
aIn
dia
Peru
Sout
h Af
rica
Urug
uay
2000 Positive change in 2011 Negative change in 2011
29
Iceland and Spain reintroduced them in the wake of the financial crisis, but recurrent net wealth taxes are generally inexistent or very low.24
Figure 11: Wealth tax revenue composition in OECD countries (2011)
Source: Author. Note: Based on OECD data. Wealth tax revenue enters the category of other tax revenue in table 2.
Meanwhile, immovable property has become the main base for wealth taxation in developed as well as in some developing countries (Norregaard 2013) and recurrent property taxes account for the bulk of wealth tax revenue (figure 12). Revenue generated by taxes on land and residential property is most significant in Anglo-Saxon countries, where it almost accounts for the totality of wealth tax revenue. Property tax revenue generally accrues to local authorities using it to fund local public goods, which is often viewed as improving governance and accountability (IMF 2013a). However, with the growing spatial segregation and gerrymandering reinforcing the clustering of communities according to their income level, the use of property tax revenue to fund local public goods also limits their progressivity, which could be enhanced by central wealth redistribution. Indeed, in presence of spatial segregation along income lines, the fine line between local public goods available to all social groups and club goods available only to the most affluent is becoming blurred. Furthermore, the extent to which property taxes weigh on renters and owners remains debated, casting further uncertainties concerning their progressivity (Norregaard 2013).
Other wealth taxes arise from various sources, including inheritance, gift and estate taxes, but the bulk of other wealth tax revenue arises from taxes on financial and capital transactions, including various taxes on immovable and other property sales, including the well-known financial transaction tax (FTT). Proponents of the FTT view it as a kind of value-added tax
24 For an illustration of the near non-existence of wealth taxes, see for instance the table in annex D4 of OECD (2009) “Engaging with High Net Worth Individuals on Tax Compliance”, pages 103-6. This table lists the main top personal income and wealth tax rates in selected OECD countries. It illustrates the variety of situations, but also highlights the extent to which capital income can benefit from exemptions as well as the near disappearance of wealth taxes. It should be noted that personal taxation does not apply to economic income, but only to fiscal income, which sometimes only represents a fraction of economic income, due to tax evasion or tax avoidance schemes involving, for instance, trusts and foundations hiding the identity of the beneficial owner. Available from: http://www.oecd-ilibrary.org/docserver/download/2309081e.pdf?expires=1408041876&id=id&accname=ocid195767&checksum=E20DC530A6D3E2FD54C5FA70926E97C0
01
23
4W
ealth
tax
reve
nue
(as
a sh
are
of G
DP)
Aust
ralia
Aust
riaBe
lgiu
mCa
nada
Chile
Czec
h Re
publ
icDe
nmar
kEs
toni
aFi
nlan
dFr
ance
Ger
man
yG
reec
eHu
ngar
yIc
elan
dIre
land
Isra
elIta
lyJa
pan
Kore
aLu
xem
bour
gM
exico
Neth
erla
nds
New
Zeal
and
Norw
ayPo
land
Portu
gal
Slov
ak R
epub
licSl
oven
iaSp
ain
Swed
enSw
itzer
land
Turk
eyUn
ited
King
dom
Unite
d St
ates
OEC
D
Recurrent net wealth tax Other wealth taxes Recurrent property tax
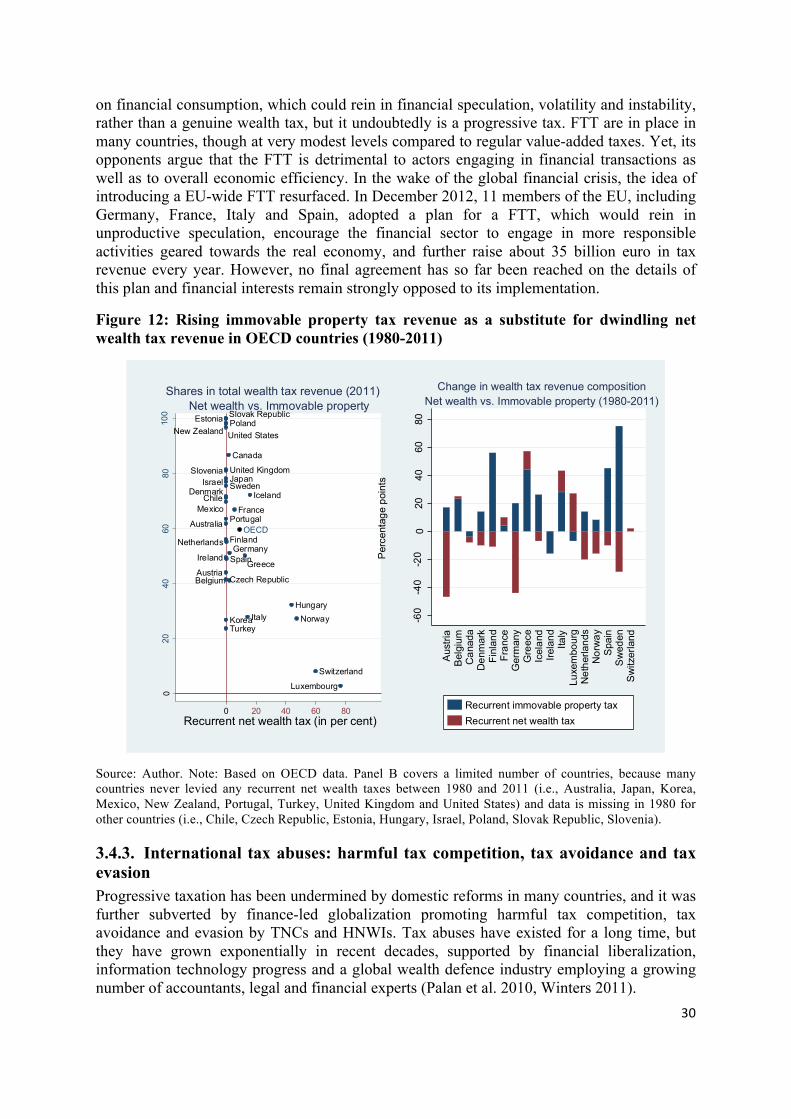
30
on financial consumption, which could rein in financial speculation, volatility and instability, rather than a genuine wealth tax, but it undoubtedly is a progressive tax. FTT are in place in many countries, though at very modest levels compared to regular value-added taxes. Yet, its opponents argue that the FTT is detrimental to actors engaging in financial transactions as well as to overall economic efficiency. In the wake of the global financial crisis, the idea of introducing a EU-wide FTT resurfaced. In December 2012, 11 members of the EU, including Germany, France, Italy and Spain, adopted a plan for a FTT, which would rein in unproductive speculation, encourage the financial sector to engage in more responsible activities geared towards the real economy, and further raise about 35 billion euro in tax revenue every year. However, no final agreement has so far been reached on the details of this plan and financial interests remain strongly opposed to its implementation.
Figure 12: Rising immovable property tax revenue as a substitute for dwindling net wealth tax revenue in OECD countries (1980-2011)
Source: Author. Note: Based on OECD data. Panel B covers a limited number of countries, because many countries never levied any recurrent net wealth taxes between 1980 and 2011 (i.e., Australia, Japan, Korea, Mexico, New Zealand, Portugal, Turkey, United Kingdom and United States) and data is missing in 1980 for other countries (i.e., Chile, Czech Republic, Estonia, Hungary, Israel, Poland, Slovak Republic, Slovenia).
3.4.3. International tax abuses: harmful tax competition, tax avoidance and tax evasion Progressive taxation has been undermined by domestic reforms in many countries, and it was further subverted by finance-led globalization promoting harmful tax competition, tax avoidance and evasion by TNCs and HNWIs. Tax abuses have existed for a long time, but they have grown exponentially in recent decades, supported by financial liberalization, information technology progress and a global wealth defence industry employing a growing number of accountants, legal and financial experts (Palan et al. 2010, Winters 2011).
Australia
AustriaBelgium
Canada
Chile
Czech Republic
Denmark
Estonia
Finland
France
Germany
Greece
Hungary
Iceland
Ireland
Israel
Italy
Japan
Korea
Luxembourg
Mexico
Netherlands
New Zealand
Norway
Poland
Portugal
Slovak Republic
Slovenia
Spain
Sweden
Switzerland
Turkey
United Kingdom
United States
OECD
010
080
6040
20
Rec
urre
nt im
mov
able
pro
perty
tax
(in p
er c
ent)
0 20 40 60 80Recurrent net wealth tax (in per cent)
Net wealth vs. Immovable propertyShares in total wealth tax revenue (2011)
-60
-40
-20
020
4060
80
Per
cent
age
poin
ts
Aus
tria
Bel
gium
Can
ada
Den
mar
kFi
nlan
dFr
ance
Ger
man
yG
reec
eIc
elan
dIre
land
Italy
Luxe
mbo
urg
Net
herla
nds
Nor
way
Spa
inS
wed
enS
witz
erla
nd
Net wealth vs. Immovable property (1980-2011)Change in wealth tax revenue composition
Recurrent immovable property taxRecurrent net wealth tax
31
Following a request by G7 leaders in 1996, developed countries acknowledged for the first time that tax competition could be harmful, pointing fingers at tax havens leading the tax rate race-to-the-bottom (OECD 1998). Tax havens are commonly understood to be financial conduits that, in exchange for a fee, use their one principal asset, their sovereignty, to serve a non-resident constituency by offering low or nil taxation and secrecy provisions. Tax havens may appear small and insignificant, but they play an important role in the world economy, by undermining regulatory and taxation processes and skewing the distribution of costs and benefits of globalization in favour of the wealthy few (Palan et al. 2010).
In the wake of the 1998 OECD report, tax havens coordinated their reaction in an environment providing them more leverage, shifting the focus from tax havens to offshore financial centers (IMF 2000), arguing that many offshore financial centers (OFCs) located in developed countries, such as Switzerland, the United Kingdom or the United States, also offered low taxes and secrecy to an even bigger constituency, including residents and non-residents, and that offering a preferential tax regime for financial activities was neither illegal nor different from any other legitimate development strategy. As the United States accepted the latter argument as valid after 2001, and after several reports announcing the alleged rapid decline of the number of tax havens (IMF 2006, 2008), the IMF stopped monitoring this emerging issue at the dawn of the financial crisis.
Yet, the issue of tax abuses facilitated by tax havens and OFCs has never been so prominent. Tax havens alone account for around 50 per cent of all international banking lending and 30 per cent of the world’s stock of foreign direct investment (Palan 2010). Private and corporate wealth stashed in tax free zones may have reached between $20 trillion and $32 trillion according to some estimates (The Economist 16 February 2013, Tax Justice Network 2012)25 and may continue expanding continuously as long as tax abuses remain profitable.26
Unrecorded wealth of such magnitude represents a major revenue loss for tax administration and further biases the debate about income inequality. If this unreported wealth earned a very modest rate of return of just 3 per cent, and a modest tax of 30 per cent imposed on this income would generate yearly tax revenues of $190-280 billion – roughly twice the amount OECD countries spend on all overseas development assistance around the world.27 The imposition, a capital gains tax, an inheritance tax or a recurrent net wealth tax would further boost this figure considerably (Tax Justice Network 2012). It would also contribute reducing income inequality and possibly extreme wealth in the longer run. In the meanwhile, the growing magnitude of unrecorded wealth and income flows further introduces a downward bias in all widely used inequality measures. Claims of declining inequality should therefore be taken with caution.
25 The financial wealth of HNWIs (households) illegally escaping taxation amounts to $5.9 trillion according to Zucman (2013), but this estimate excludes non-financial wealth, such as real estate, yachts or art collections that remain non-declared to fiscal authorities in the residence country. It further excludes corporate financial and non-financial wealth accumulated in shell companies through practices flirting with illegality. In 2012, the amount of indefinitely reinvested foreign earnings of American transnational corporations alone waiting for a tax holiday to repatriate profits was estimated at more than $1.95 trillion (USPIRG 2013). 26 According to Global Financial Integrity (2012), illegal capital outflows linked to crime, corruption, and tax evasion cost the developing world $858.8 billion in 2010. 27 In 2012, members of the Development Assistance Committee (DAC) of the OECD provided $125.6 billion in net official development assistance (ODA), representing 0.29 per cent of their combined gross national income (GNI), a -4.0 per cent drop in real terms compared to 2011.

32
The financial crisis revealed that tax havens and OFCs thriving on complexity, opaque networks and arbitrage are inextricable from the shadow banking nexus lying at the heart of the crisis (Palan and Nesvetailova 2013). Facing fiscal difficulties and popular discontent, G20 leaders announced in April 2009 a crackdown on harmful tax competition and financial secrecy in order to protect their public finances and curb tax abuses.
Since then, different actors subsequently launched several initiatives to tackle tax abuses. The Financial Stability Board, for instance, initiated work on a global Legal Entity Identifier (LEI), a reference code to uniquely identify a legally distinct entity that engages in a financial transaction. This could help track all financial flows, even in secrecy jurisdictions. In 2013, the G20 pledged to establish a system for the automatic exchange of tax information.28 In February 2014, it adopted a standard (OECD 2014) to be implemented by G20 countries and possibly other countries by the end of 2015.29 The OECD further developed an action plan to tackle base erosion and profit shifting (BEPS) by TNCs, which aims to make major reforms to international corporate taxation. However, these initiatives are still under development and even once proposals are put forward, implementation will be challenging. In particular, the capacity constraints of poorer countries will have to be addressed in order to ensure that they are able to participate, and ensure that they can contribute effectively to reining in tax abuses and reducing inequality (Moore 2014).
4. TOWARDS A FRAMEWORK ENABLING ASSET-CENTRED REDISTRIBUTIVE POLICIES FOR EQUITY AND SUSTAINABLE DEVELOPMENT Redistributive policies and trends described in the previous section are characterised by features that partly derive from a neoliberal policy framework, including a move away from asset-based public policies associated with a lack of concern for distribution and environmental issues. Overall, this framework resulted in weaker redistribution, mild poverty alleviation, rising income inequality, extreme wealth concentration, widespread tax abuses and environmental degradation. In this context, renewed thinking about opportunities to foster redistributive institutions and policies through domestic reforms and international cooperation is required in order to advance towards an alternative framework enabling redistributive policies for equity and sustainable development.
Operationalizing redistributive policies in pursuit of economic, social and environmental sustainability represents a major intellectual and political challenge, because it requires shifting away from the prevailing development paradigm using private investment-led economic growth as its ultimate but ill-conceived benchmark of progress (Stiglitz, Sen and Fitoussi 2009, Costanza et al. 2012) towards a sustainable development paradigm that better acknowledges the importance of non-market interactions for collective well-being and planet-sensitive development. Consequently, such a shift requires actively challenging discourses that deny the central role of equity for sustainable development as well as reforming unfair or dysfunctional economic and political governance processes at the domestic and international level.
28 Tax annex to the Saint Petersburg G20 leaders’ declaration (September 2013). 29 Communiqué of the Meeting of the G20 Finance Ministers and Central Bank Governors Sydney, Australia, February 23, 2014. Available at: http://www.g20.utoronto.ca/2014/2014-0223-finance.html
33
4.1. Redefining equity and development in sustainable terms
4.1.1. Focusing on asset inequality, not income poverty Equity is generally defined in terms of equality of opportunity, rather than equality of outcome, but both are interdependent in practice. Redistributive policies for reducing inequality generally combine in-kind transfers with direct and indirect transfers. The deliberate omission of wealth redistribution as a means for equalizing opportunities, however, signals the priority most countries give to alleviating income poverty over addressing underlying asset inequality. Absent governance reforms enabling a broader use of wealth redistribution to correct unequal asset endowments, income poverty is likely to endure, and asset inequality to the benefit of a wealthy few is bound to continue rising.
4.1.2. Enabling trade-offs between economic growth, social equity and environmental sustainability Recent experiences of simultaneous rapid economic growth and declining inequality, especially in Latin America, and abundant older examples among Asian Tigers and developed countries, are a testimony to the fallacy of the trade-off between economic efficiency and equity assumed by many economists, who uncritically extrapolate a micro-economic theoretical construct onto entire societies and countries (Stiglitz 2013, Ostry et al. 2014). Yet, planetary boundaries and the need to bring down the level of physical throughput of the economy to a sustainable steady-state level may imply negative economic growth, especially in developed countries (Costanza et al. 2012, Farley et al. 2013). A shift away from the development paradigm subordinating social and environmental concerns to the overarching objective of (private investment-led or demand-led) economic growth is imperative to enable sustainable development. Indeed, while the individual or collective pursuit of economic gains may generate public benefits, they also nurture economic, social and environmental instability at the cost of vulnerable social groups and future generations. Moving towards a sustainable development paradigm enabling trade-offs between economic growth, social equity and environmental sustainability therefore represents an urgent necessity, especially in developed countries with the highest carbon footprint.
4.1.3. Redefining the metrics of equity and development New metrics for equity and development are required for operationalizing such a paradigm shift based on informed policy decisions. GDP growth per capita is frequently viewed as evidence of declining inequality and sustainable development, even though it provides information neither about equity nor about sustainable development. GDP per capita doesn’t contain any information about income distribution and thus requires making the implicit value judgment that the marginal social utility of income is constant (e.g., an extra $1 of income to an rich heir is worth as much as an extra $1 of income to hard-working parents at the poverty line). Synthetic measures of income inequality, such as the Gini, are suited for descriptive purposes, but their abstract nature fails providing insight about the sources of rising income inequality (labour or capital income), which is important for devising policy solutions. Therefore, efforts should be undertaken to produce new metrics able to highlight parameters that matter for the understanding of the dynamics of inequality (e.g., top income shares by source of income, wealth shares, Palma income and wealth ratios) as well as for economic justice and good governance. Similarly, promoting sustainable development would be facilitated by the use of more relevant welfare metrics, such as environmental-economic

34
accounting, provided enough care is given to address valuation issues, including the impossibility of properly valuing certain environmental resources (Spash 2007).
4.2. Building institutions and designing policies enabling asset-centred redistributive policies for equity and sustainable development As acknowledged by the G20, revenue mobilization was already insufficient in many developing countries to fund progress towards MDGs (G20 2011), and significant additional efforts are likely to be required for the post-2015 sustainable development agenda if it is to aim at fully eradicating extreme poverty and at addressing salient social and environmental challenges, such as high income inequality and the breach of planetary boundaries. Progress towards equity and sustainable development is therefore conditional on building institutions and designing policies that enable stepping up revenue mobilization along with progressive redistribution of income and income-generating assets among individuals and, under specific conditions, also between the private and public sector. Absent such progress, development efforts will remain dependent on elusive international development aid and/or regressive debt-financing (Hager 2013).
4.2.1. Modernizing tax administration for increased and progressive tax revenue mobilization Increased and progressive mobilization of tax revenue is essential, but some developing and least developed countries with large rural and informal sectors still lack the administrative capacity to levy progressive taxes. It first requires building more developed redistributive institutions, including competent tax administrations able to handle complex information and create domestic wealth registers, which is key for progressive tax collection as well as economic analysis and planning (Chaudhry 1997). Such efforts can further act as a catalyst for demands for greater accountability, transparency and better governance, which would strengthen the role of civil society and state-building (Prichard 2009, Moore 2013). Development assistance and capacity development in this area is therefore key for remediating the need for ODA in the longer term.
4.2.2. More progressive tax systems for reducing inequality of outcome In addition to addressing medium-term institutional and administrative capacity constraints hampering revenue mobilization, tax reform should make tax systems more progressive while simultaneously strengthening incentives for sustainable production and consumption. This requires shifting the tax base from consumption and low incomes towards higher incomes, which largely derive from capital income, and especially towards wealth and environmental externalities.
Flat indirect taxes are acknowledged to be regressive, but they nevertheless represent a major source of revenue in most developing countries (table 2) struggling with high inequalities. Taxes on labour income are often described as discouraging work, but high marginal tax rates fulfil the essential role of deterring excessive compensation that has contributed to the great escape of the top 1 per cent (figure 4). To resorb rising income inequality, it may be required to bring top marginal tax rates to their optimal level, which some economists estimate at around 70 per cent (Piketty et al. 2014). It is also urgent to close deliberate loopholes and exemptions that significantly depress the effective tax rate imposed on capital income and to combat tax avoidance and evasion in ways that effectively suppress opportunities for HNWIs

35
and TNCs to declare fiscal incomes and profits representing only a fraction their economic income.
4.2.3. Shifting the tax base towards wealth for enhancing equality of opportunity Wealth best reflects the ability to pay of individuals, which is a founding principle of taxation. In most countries, capital stock often represents a multiple of annual income flows, which further keeps rising along the capital accumulation process, representing a significant untapped tax base. As wealth is highly concentrated in all countries, including developed countries with more egalitarian wealth distribution (figure 7), capital income flows only accrue to a wealthy few. Wealth concentration is thus not only a major driver of rising income inequality, but also a foundational socio-economic structure sustaining the reproduction of inequality over time. The negative structural weight of wealth concentration on inequality across individuals and generations is all the more determinant when the rate of economic growth remains inferior to the after-tax return on capital (r>g).30
Higher wealth taxes (especially recurrent net wealth taxes and inheritance taxes) therefore represent the tool of choice for redistributive policies aiming at improving equality through increased and progressive tax revenue mobilization. In addition, wealth taxes have the virtue of encouraging work income over rent income and to incentivize capital owners to make productive investments, which will need to be stepped up significantly for achieving structural economic transformations that are required for bringing the global economy on a more sustainable development path.
Wealth taxes currently only target immobile capital in most countries, mainly through residential property taxes. Yet, extreme wealth is mainly accumulated in financial assets, which are often wrapped in opaque ownership structures hidden in tax havens and OFCs, out of reach of domestic tax administrations. While domestic regulators could increase wealth taxes, including on mobile capital, part of the targeted tax base will escape their authority in absence of an internationally coordinated and comprehensive crackdown on financial secrecy and harmful tax competition. As opportunities for tax evasion and tax avoidance remain abundant, some economists have stressed the advantages of imposing a one-off wealth levy, whose costs to some wealth owners may be inferior to the cost of relocating (Bach et al. 2011, Bach 2012, Eichengreen 1991). However, given the technical feasibility of implementing capital income and wealth taxes at the domestic and/or global level in presence of financial transparency, priority should be given to overcoming existing political obstacles in the medium term. Ongoing initiatives for the automatic exchange of information (AEoI) and creating registries disclosing beneficial ownership of trusts and other shell structures are thus of fundamental importance for enabling governments to tap the huge potential of wealth as a tax base.
According to some estimates, imposing a 1 per cent tax on the net wealth of the richest decile could raise tax revenue amounting to one per cent of GDP in many countries. Given the very high concentration of wealth, simply raising this rate to 2 per cent on the richest centile would already double the revenue raised (IMF 2013a). However, in order to contain extreme wealth (which mostly consists of mobile financial capital) and reduce inequality, tax rates
30 Piketty (2013) proposes an exhaustive discussion of this issue. See the brief and simplified discussion on this topic around figure 7. For interesting critiques and views on why the neoclassical approach is flawed and the rate of return on capital (and capital itself) cannot be measured in real terms, see for instance Ackerman (2014), Galbraith (2014), Harvey (2014), Palley (2014) Vernengo (2014) or Nitzan and Bichler (2009).

36
would have to keep pace with the growing returns to wealth. As the greatest fortunes expand at an average rate of around 10 per cent or more, a global annual tax on financial capital would have to follow a progressive schedule taxing net wealth at a rate of at least 10 per cent above a certain threshold.31 High wealth taxes are probably the only means for gradually reducing extreme inequality that has developed over the last decades of financial globalization.
4.2.4. Shifting the tax base towards environmental externalities for incentivizing sustainable production and consumption, and shorter value chains The tax base should also decisively shift towards environmental externalities, especially carbon emissions strengthening global warming, without depriving the poor from access to energy and other markets. Yet, flat regressive environmental taxes on energy and vehicles currently mostly weight on poorer households. By contrast, corporations in developing and developed countries are often submitted to special regimes, such as fossil fuel subsidies, exemption from energy taxes or participation in market-based solutions (ETS and offsetting mechanisms), which have so far kept the price of carbon emissions too low for incentivizing transformations in unsustainable production structures.
Unsustainable production and consumption has increased in recent decades with the rapid expansion of global but segmented value chains fostering polluting merchandise transport. On average, international merchandise transport increases the carbon emissions that are embedded in produced goods by 50 per cent (Cristea et al. 2013), so that the transport of internationally traded merchandise may already account for more than 7 per cent of global carbon emissions (United Nations 2013b). As long as the cost of transport will not outweigh be profits arising from the exploitation of cross-country labour cost differential, global value chains will pursue their expansion and contribute to rising carbon emissions in the transport sector.
In order to promote more sustainable production and consumption patterns32 without burdening poorer households, efforts should be made to levy progressive environmental taxes tied to individual consumption of some luxury goods and services that are particularly harmful to the environment. Some of them would be easy to implement, such as taxes on flights (e.g., exponential tax on plane tickets instead of frequent flyer reward programmes) or on secondary residences. Gasoline consumption could also be taxed in a progressive manner tied to individual consumption through the use of credit cards tracking purchased quantities (Casal 2012).
Furthemore, ways to implement border carbon taxes should be investigated so as to prevent the further development of unsustainable global value chains thriving on labour cost-saving but environmentally harmful trade in intermediate and final goods. With the growing necessity to significantly reshape unsustainable production and consumption behaviours and patterns, the ability of higher taxes to send clearer and steadier signals across the economy and to generate revenue that can be recycled to achieve distributional objectives may become more important than market-based solutions, such as emissions trading systems (ETS) and
31 See also section 2.2.3, footnote 5. 32 Moving the global economy towards an environmentally less unsustainable development path that contains global warming within a range of 2 degree Celsius requires that developed economies reduce their carbon emissions by 80 per cent by 2050. Such a reduction is impossible without significant transformations in production structures and consumption behaviours, including in developing countries.

37
offsetting mechanisms, that redistribute gains within the corporate sector, but which have so far failed to generate price signals inducing structural transformation (Spash 2010).
4.2.5. Socializing natural resource rents and/or ownership to ensure sustainable use and equitable access for present and future generations Equitable access to natural resources could be fostered by the progressive redistribution of environmental tax revenue as well as of proceeds of socialized natural resource rents, such as in Norway, where corporate profits in the oil sector are taxed at a rate of 78 per cent and transferred to an intergenerational solidarity fund. The timid push back against the privatization of natural resources in Africa and Latin America illustrates the untapped potential for boosting government non-tax revenue by appropriating a larger share of natural resource rents to the public sector through nationalization or renegotiation of contract terms. The Ecuadorian Yasuni proposal also highlights the particular role public ownership of hydrocarbon resources could play in limiting their growing exploitation harming climate stability and sustainable development, hinting at the need for perpetually stranding vast hydrocarbon resources to prevent their marketization, possibly through expropriations (Carbon Tracker 2012, Hayes 2014). The failure of the Yasuni initiative further highlights the need for increased international cooperation, especially with regard to climate financing, and the challenges facing governments in bringing down the physical throughput of the economy to a steady-state level compatible with environmental sustainability (Costanza et al. 2012, Farley et al. 2013).
4.2.6. Redistributing income-generating assets for economic democracy and sustainable development Conditions for implementing wealth transfers between social groups or between the private and public sectors are always country-specific, but such transfers may be necessary in some countries for promoting equity and sustainable development. Redistributing land property rights to small farmers, for instance, can reduce income poverty and inequality in a sustained manner and is further conducive to the use of more sustainable agricultural methods. Corporate ownership and governance structures involving a diversity of stakeholders (e.g., cooperatives, firms with multi-level ownership) can also foster economic democracy (Sobhan 2010, Wilkinson and Pickett 2014) and strategies pursuing collective interests instead of private profits alone.33 In addition to the simple transfer of property rights across private actors or towards the public sector, the unbundling of property rights also opens avenues for improving economic governance (Dugger 1987, Shi and Liu 2012). The successful socialization of land valuation gains and the use of marketized SOEs for pursuing public policy objectives in Chongqing (box 1) illustrates how government can leverage publicly owned assets for economic growth and social equity in an efficient but more sustainable way than private actors.
4.2.7. Investing in people: a rights-based approach to human development A more equal distribution of income-generating assets together with increased and progressive revenue mobilization is essential for enabling a rights-based approach considering human development as a fundamental right. The MDGs contributed to draw attention on the central role of asset inequality in the restricted sense of human capital as a 33 Sobhan 2010, Klimina 2011. See also the UNRISD project on Potential and Limits of Social and Solidarity Economy: http://www.unrisd.org/sseconf
38
determinant of income poverty and slow economic development. Increased public social spending improved access to education and health services, and social protection programmes further shielded some of the most vulnerable social groups from extreme poverty, but the prevailing approach to human development in many countries remains resource-constrained. This particularly affects the coverage and quality of social protection programmes, which still partly exclude or discriminate against vulnerable social groups least integrated in formal employment structures, such as elderly people or women. Increased and progressive revenue mobilization may facilitate a gradual political transition towards a rights-based approach and contribute progressing towards development objectives.
4.3. Fostering international cooperation
4.3.1. Bridging the gap with ODA for public social spending and revenue mobilization The transition towards more asset-centred redistributive policies can be done by individual countries, but enhanced international cooperation is desirable on several fronts. ODA commitments should be met to accelerate progress towards the MDGs, and development assistance for developing countries should aim at empowering local actors. In countries most reliant on foreign aid, development assistance should contribute improving revenue mobilization capacity. Such assistance is required for boosting the capacity of weakly developed tax administration to handle complex information and cross-check data from different sources in order to diversify the tax base away from regressive consumption taxes towards more progressive taxes (Prichard et al. 2012).
Development aid could also assist tax administration in auditing TNCs, whose transfer mispricing schemes may cost developing countries up to $160 billion per year in foregone tax revenue, almost the amount of annual ODA (Christian Aid 2009). Capacity building efforts for setting up the administrative structures and procedures will also be required for enabling developing countries to participate in the automatic exchange of information (AEoI) that is progressively being established at the international level and to track costly tax abuses.34
4.3.2. Promoting financial transparency to prevent tax abuses by HNWIs and TNCs A key ingredient to all tax abuses by HNWIs and TNCs is financial secrecy, which has become increasingly indefensible, based on moral as well as legal, political and economic arguments. Facing the magnitude of wealth that remains out of reach of tax authorities35 and the impact of tax abuses on the capacity of governments to uphold their human rights obligations, the distinction between legal tax avoidance and illegal tax evasion that is blurred by secrecy and conflicting rules across jurisdictions appears futile and indefensible (IBAHRI Task Force 2013). Financial opacity also played a key role in the run up to the global financial crisis. Indeed, many special purpose vehicles amassing bad debt were often registered in secrecy havens, out of sight of tax administration and of regulators (Palan et al. 2010, Palan and Nesvetailova 2013).
34 Revenue losses arising from illicit capital flows are estimated by the UN to amount to $50 billion per year for Africa (United Nations Economic Commission for Africa 2013), and may thus cost several hundred billion per year to the developing world. 35 See discussion under point 3.4.3.

39
Consequently, global governance bodies initiated work for improving financial transparency, which requires the possibility for authorities to identify (i) financial flows as well as (ii) related parties. Recently, the Financial Stability Board established a Global Legal Entity Identifier Foundation (GLEIF) and is working on the introduction of a legal entity identifier (LEI). Confidentiality of the reference data, particularly ownership information, may represent a hurdle in some countries.
The adoption of FATCA by the United States and the concessions obtained from champions of financial secrecy, such as Luxembourg or Switzerland, concerning the AEoI illustrated that legal domestic confidentiality provisions can be overcome under certain political circumstances.36 This example encouraged similar EU-wide efforts and led world leaders to formally pledge to establish a new global standard of multilateral and automatic exchange of information, as well as transparency of beneficial ownership (G8 2013, G20 2013).37 Taken together, the LEI and the creation of a global register of beneficial ownership of trusts and other shell companies would enable a useful AEoI between multilateral parties, and could open up the possibility for a recurrent domestic or global capital tax.
Currently, exchange of information still occurs mostly on a bilateral basis and on request. The multilateral Convention on Mutual Administrative Assistance in Tax Matters (developed jointly by the Council of Europe and the OECD) provides a basis for exchange of information on request without the need for a bilateral double tax treaty, but AEoI requires a supplementary agreement to establish procedures. To remediate this shortcoming, the G20 asked for a common reporting model, including a Model Competent Authority Agreement, and endorsed a new Standard for Automatic Exchange of Financial Account Information (OECD 2014) at the G20 Finance Ministers and Central Bank Governors’ meeting in February 2014.
The potential non-universality of this initiative and possible exemptions could drastically limit its impact, however. Indeed, as has already been observed in the past the non-universal automatic exchange of banking information may result in the mere shifting of funds towards jurisdictions not committed to transparency (Johannesen and Zucman 2012) while the non-exhaustive AEoI may foster the development of para-financial businesses performing similar types of functions.38
36 FATCA provisions would impose sanctions on banks unwilling to automatically exchange information about their US clients with their domestic regulator and the US Internal Revenue Service, amounting to 30 per cent of the profit made on their business in the United States. 37 The G8 Lough Lerne Declaration mentions 10 points, including the following: 1. Tax authorities across the world should automatically share information to fight the scourge of tax evasion. 2. Countries should change rules that let companies shift their profits across borders to avoid taxes, and multinationals should report to tax authorities what tax they pay where. 3. Companies should know who really owns them and tax collectors and law enforcers should be able to obtain this information easily. 4. Developing countries should have the information and capacity to collect the taxes owed them – and other countries have a duty to help them. 5. Extractive companies should report payments to all governments - and governments should publish income from such companies. 6. Minerals should be sourced legitimately, not plundered from conflict zones. 7. Land transactions should be transparent, respecting the property rights of local communities. 38 The Economist recently reported on the rapid development of an international network of Über-warehouses allowing individuals to stock their wealth formerly stored in banks in storage facilities located in tax-free airport zones. While those zones are intended for temporary transit of merchandise, they are being expanded and transformed in luxury warehouses in a growing number of countries, including Switzerland, Luxembourg, Singapore and many other OFCs (The Economist, 23 November 2013, “Über-warehouses for the ultra-rich”).

40
The interests of developing countries and financial TNCs, however, could converge to facilitate the emergence of a uniform multilateral automatic information exchange system. Indeed, such a system would positively affect the ability of the former to address offshore tax evasion (Global Financial Integrity 2012) and also avoid a situation in which the latter are required to implement multiple different systems in order to satisfy different sovereigns’ demands (Grinberg 2013).
4.3.3. Addressing harmful tax competition through unitary taxation to combat tax avoidance While financial transparency may curtail widespread tax evasion among HNWIs,39 financial transparency is not enough to address tax avoidance by TNCs and HNWIs. TNCs represent the biggest demand for tax avoidance, just before HNWIs (OECD 2009), who incidentally also benefit most from corporate tax avoidance resulting in higher shareholder payouts. As acknowledged by the IMF (2013), “recognition that the international tax framework is broken is long overdue. Though the amount is hard to quantify, significant revenue can also be gained from reforming it. This is particularly important for developing countries, given their greater reliance on corporate taxation, with revenue from this taxation often coming from a handful of multinationals”.
Tax abuses by TNCs have long perverted efforts of sovereigns to avoid double taxation of TNCs profits in different jurisdictions, resulting instead in widespread double non-taxation. This has been an issue for developing countries in the extractive sector, but also in other sectors.40 Transfer mispricing and profit shifting more generally has also become a major issue in developed countries, where profitable TNCs paying little or no taxes in times of austerity caused popular discontent followed by several parliamentary inquiries.41 Consequently, G20 leaders acknowledged that passive tolerance of massive corporate tax dodging undermines public trust in the tax and political system and initiated work on Base Erosion and Profit Shifting (BEPS) through the OECD Committee on Fiscal Affairs (CFA) towards reform of the current international tax system.42 Non-OECD G20 member countries were accepted as full members of OECD working parties on BEPS, and the OECD pledged to consult with developing countries, but it is unlikely to prioritize them. In October 2013, the UN Tax Committee decided to set up a subcommittee on BEPS, which will provide feedback to the OECD project from a developing country perspective, as well as consider possible remedies for BEPS that go beyond the remit of the OECD project (Picciotto 2014).
In July 2013, the OECD presented an Action Plan for addressing BEPS over the next 2 years. While the OECD plan represents a step forward, its approach is fundamentally flawed and doomed to fail, because it aims at fixing the current system without moving away from the separate entity approach that lies at the heart of harmful tax competition and aggressive
39 See the research project on “Secrecy for sale: inside the global offshore money maze” done by the International Consortium of Investigative Journalism that revealed the so-called “Offshore Leaks”. Available: http:// http://www.icij.org/offshore 40 Transfer mispricing in the extractive sector causes a significant income loss for developing countries, because of the importance of the oil and mining sector in some developing economies, but mispricing is often most blatant in other sectors, where there are no reference market prices, unlike for most commodities. 41 Parliamentary inquiries, e.g., “Offshore Profit Shifting and the U.S. Tax Code -- Part 1 (Microsoft & Hewlett-Packard)” or “Offshore Profit Shifting and the U.S. Tax Code -- Part 2 (Apple Inc.)”, US Senate Permanent Subcommittee on Investigations, 2012; UK Parliament (2013). Tax Avoidance - Google. London, House of Commons, Committee of Public Accounts 9th Report 2013-14. 42 Tax annex to the Saint Petersburg G20 leaders’ declaration (September 2013).

41
corporate tax avoidance. In the 1960s the OECD already attempted to tighten rules to prevent base erosion and profit shifting, based on the separate entity approach. This attempt failed subsequently, as illustrated by the double non-taxation of TNCs exploiting the structural weakness of the separate entity approach.
Continued reliance on the separate entity approach is rooted in a willful ignorance of economic realities and its willingness to treat TNCs as a multitude of separate entities, despite their integrated governance structure and strategy defined by a single CEO. This approach finds its origin in the first model tax treaties formulated by the League of Nations in 1928, at a time when TNCs were a nascent phenomenon. Today, TNCs intermediate about half of international trade and a significant share of foreign direct investment and financial transactions. By granting TNCs the privilege to have their entities taxed separately, based on how the TNCs decide to allocate its profits across entities, the separate entity approach creates incentives for countries to engage in harmful tax competition, which stimulates aggressive tax avoidance limited only by rules that can quickly be circumvented. By contrast, alternatives based on a single entity approach such as unitary taxation (box 2), could tackle harmful tax competition and tax avoidance at their core by acknowledging that TNCs are single entities and anchoring taxation in observable assets and variables, such as physical capital, labour and sales, instead of legal fictions and artificially priced intra-group transactions of goods, services and property rights for which there is often no reference market.
_________________________________________________________________________
BOX 2: UNITARY TAXATION AS AN ALTERNATIVE TO THE CURRENT INTERNATIONAL TAX REGIME – HOW TO NEUTRALIZE CAPITAL MOBILITY FOR CORPORATE TAXATION PURPOSES? Unitary taxation represents an approach for taxing TNCs that differs from the approach that is predominantly used under the current regime in at least two significant ways. First, acknowledging the integrated nature of value creation within TNCs whose global strategies are defined by CEOs, unitary taxation proposes to treat every TNC as a single entity instead of considering its related entities in different jurisdictions as separate entities, which are trading among themselves based on the arm’s length principle (ALP).43 Secondly, recognizing the mobile nature of capital, unitary taxation proposes to share the tax base generated by a TNC across jurisdictions according to a negotiated apportionment formula taking into account the geographical distribution of relatively immobile factors (such as a TNC’s physical assets, number of employed workers, payroll expenditures and final sales) instead of taxing TNCs according to where their profits are registered (Picciotto 2013). This box briefly explains how unitary taxation has been implemented in various contexts and then summarizes some of the main arguments opposing proponents and critics of unitary taxation.
Unitary taxation has long been used in several federal states, including Argentina, Canada, Switzerland and the United States (Siu, Nalukwago et al. (forthcoming). Apportionment formulae adopted to distribute the corporate tax base among sub-national jurisdictions take different forms in each of those countries. In Canada, for instance, the corporate tax base is entirely attributed to source provinces, because sales are omitted from the apportionment formula, which is not the case in other countries. Formulae can further vary across economic sectors. Switzerland, for instance, has special apportionment formulae for eight economic sectors, such as transport services or retail commerce that 43 The ALP is an international standard that compares the transfer prices charged between related entities with the price of similar transactions carried out between independent entities at arm’s length. An adjustment may be made to the extent that profits of a related party differ from those that would be agreed between independent entities in similar circumstances (definition taken from United Nations (2013)

42
may require a formula adapted to the specific nature of their economic activity. Finally, sub-national jurisdictions can even use different formulas within a federal state. In the United States, for instance, 36 out of 50 states have used their autonomy in matters of taxation to deviate from the agreed on “Massachussets formula”,44 including 18 states that have adopted a formula weighting sales only45 in an attempt to attract investments or to exploit the leverage deriving from their large consumer base. Deviations from the “Massachussets formula” create some scope for corporate tax avoidance (Spencer 2014b), but states that shifted towards sales only formula also tend to impose relatively higher corporate tax rates.46
National UT systems are generally applied to companies’ profits within the country on a water’s edge basis, but they can be applied – even by a single territory within a country – to worldwide profits. This is done in Alaska, in the oil, gas and pipeline sector, where unilateral implementation of unitary taxation on a worldwide basis has recently been reaffirmed in the face of a corporate legal challenge by the Alaskan Supreme Court47 (Siu, Mintz et al, forthcoming). Political obstacles may be greater: in California, for example, the mandatory implementation of UT to worldwide profits was made optional in the mid-1990s48 due to corporate and political pressures (Zain1994).
Unitary taxation is also appealing for deepening economic integration at the regional level. After initial resistance from some EU member States, a proposal for a Common Consolidated Corporate Tax Base (CCCTB) was adopted by the EU Commission in March 2011, and approved (with some amendments) by the European Parliament. The Economic and Social Committee has given its opinion, and the proposal is under technical examination by the European Council. Following compromise proposals produced by the three subsequent EU Presidencies, technical work is proceeding on the basis of an allocation profits among EU countries according to their physical assets (1/3), payroll expenses (1/6), number of employees (1/6), and sales (1/3). This is similar to formulae in federal countries, except for the combination of payroll expenses with the number of employees, reflecting wider disparities in wage levels within the EU. However, regional adoption only covers transactions occurring within each region: transactions between related entities located outside the region would still be based on ALP.
A UT system at the global level would require TNCs to submit combined and country-by-country reporting (CCBCR) to tax authorities in the countries where they own related entities. The taxable base would then be allocated among countries according to a negotiated apportionment formula. Each government would then apply its own corporate tax rate to its share of each TNC’s profits (allowing sectoral variations), TNCs having the right of appeal to a public dispute resolution mechanism. Applying the UT system globally would thus require knowledge only of total profits and the geographical distribution of the variables included in the apportionment formula, none of which can be affected by the manipulation of notional prices for intra-firm transactions.
In recent years, a debate has developed about the strengths and weaknesses of unitary taxation. This debate was primarily nurtured by the failure of the current regime to prevent the growing shift of TNC profits to low-tax jurisdictions, which caused growing government revenue loss as well as a loss of public respect for the fairness of tax systems. In this context, unitary taxation appears as an attractive alternative to the current regime.
44 The “Massachussets formula” places an equal weight on three factors: group sales, payroll, and property within each jurisdiction. 45 California, Colorado, Georgia, Illinois, Indiana, Iowa, Maine, Michigan, Minnesota, Nebraska, New Jersey, New York, Oregon, Pennsylvania, South Carolina, Texas, Utah and Wisconsin. 46 See the range of state corporate income tax rate in the United States : http://www.taxadmin.org/fta/rate/corp_inc.pdf 47 Tesoro Corp v. Alaska, Case No. 6838, Alaska Supreme Court (October 25, 2013). 48 Worldwide combined reporting is permitted or required in certain circumstances in fourteen US states (Alaska, California, Colorado, Idaho, Illinois, Massachusetts, Montana, Nebraska, New Hampshire, North Dakota, Utah, Vermont, West Virginia and Wisconsin) and in the District of Columbia.

43
By making profit shifting irrelevant for tax purposes, unitary taxation would weaken the bargaining position of mobile capital and neutralize incentives for Governments to engage in harmful tax competition. Tax competition may still exist at the margin and lead to the implementation of non-harmonized apportionment formulae, like in the United States. Problematic situations that have become increasingly common over recent decades, where a low-tax jurisdiction with no productive activity and no consumer base is entitled to tax a disproportionate share of corporate profits generated in other countries, however, would not occur anymore. Furthermore, as shifting physical assets, workers and consumers is much more costly or impossible, unitary taxation would markedly reduce the scope for corporate tax avoidance according to some of its proponents (Stiglitz 2014, Tax Justice Network 2013).
Critics sometimes argue that political and technical challenges in the implementation of unitary taxation can result in under/over taxation of TNCs. Those same critics, however, also acknowledge that many tax disputes are solved using formulary methods considering observable factors and therefore recommend to combine certain elements of the ALP and more extensive use of formulary apportionment concepts, possibly including overlaying both to verify the appropriateness of the ALP standard (Spencer 2014a).
Several academics propose to view ALP and unitary taxation as a continuum, where the continuous variable would be the percentage to total profit that is allocated through a comparables analysis versus the percentage of total profit that is treated as a residual and allocated by a non-comparables based formulary approach (Avi-Yonah and Benshalom 2010, Kane 2014). This debate has so far strengthened legitimacy to transfer pricing methods, such as profit splits, which are inspired by the spirit of unitary taxation and tend to better suit developing countries, but are implemented in the current regime, with unitary taxation being an exception to the general the arm’s length principle.
To summarize, a transition towards unitary taxation or the adoption of transfer pricing methods inspired by the spirit of unitary taxation are likely have the potential to improve the collection corporate tax revenue. This additional revenue is bound to improve the position of certain governments. In theory, it could even be Pareto-improving and leave all countries better off. For developed as well as developing countries, the outcome would depend on how the adopted formula weights factors located in source and destination countries. Poor data on the taxation of TNCs currently prevents empirical research to determine with reasonable certainty whether apportionment formulae, such as the formula adopted in the EU project, would benefit most developing countries or only developed countries. As reported in a recent IMF study (2014) on “Spillovers in International Corporate Taxation,” business argue that competition using the weight attributed to immobile factors in the apportionment formula may bear significant risks and may not benefit developing countries. Civil society calls for a more detailed examination of these alleged risks followed by rapid action to move towards unitary taxation.49
*****END OF BOX *****
___________________________________________________________________________
4.3.4. Taxing mobile capital (unilaterally) to eradicate extreme wealth and reduce international inequality Ending financial opacity and harmful tax competition is essential for enabling progressive taxation of mobile capital and hidden wealth and contributing to eradicate extreme wealth and reduce international inequality. To a large extent, progress towards these objectives is dependent on international cooperation. There are long-standing proposals for the 49 The research project on the Unitary Taxation of Transnational Corporations with Special Reference to Developing Countries proposes many interesting studies about this issue, which are available from: http://www.ictd.ac/en/unitary-taxation-transnational-corporations-special-reference-developing-countries

44
establishment of an international tax organization, most notably from the UN High-level Panel on Financing for Development (the Zedillo Commission) in 2001. The Panel proposed the creation of such an organization, with a mandate, not only to compile and share tax information and monitor tax developments, but also restrain tax competition among countries and arbitrate country tax disputes (United Nations, General Assembly, 2001). However, this was not included in the Monterrey Consensus, reflecting resistance by the developed countries. Equally, many countries would like the UN Tax Committee to be enhanced to an inter-governmental political body, but OECD countries persist in blocking efforts to achieve this upgrade. Consequently, most reform efforts are undertaken on an ad hoc basis by G20 countries with the assistance of the OECD. The dominant role of the developed countries in international tax governance has resulted in a primacy of their interests over developing countries.
Absent a proper institutional context for an inclusive dialogue on international tax coordination, unilateral initiatives are essential for shaking inertia and attempting to initiate system-wide change. Unilateral initiatives can have significant impact, as illustrated by the US FATCA legislation, which inspired willingness to cooperate at the international level in order to crack down on financial secrecy enabling tax evasion by HNWIs. As explained in box 2, developed and developing countries have the possibility to uproot harmful tax competition by abandoning the prevailing separate entity approach to taxing TNCs and unilaterally adopting a single entity approach to implement unitary taxation. Experiences in several US States, including California until 1996 and Alaska today, show that mandatory unitary taxation on a worldwide basis can be implemented unilaterally to efficiently neutralize harmful tax competition that otherwise enables mobile corporate capital to avoid taxation.
5. CONCLUSION This paper discussed challenges and opportunities facing redistributive policies in support of sustainable development based on an asset-centred analytical framework. It first attempted to define the potential scope of redistributive policies, highlighting the importance of asset distribution across private actors as well as between the private and public sectors for equity and sustainable development. It then surveyed major trends in redistributive policies during the last three decades, before suggesting steps that may be implemented at the domestic level in order to move towards a framework enabling asset-centred redistributive policies for equity and sustainable development. It further discussed ongoing coordination efforts at the international level to promote financial transparency, which could facilitate tackling harmful tax competition and taxing mobile capital and financial wealth (see the list of recommendations below).
Section 2 showed that the impact of redistributive policies declined over the last 3 decades, contributing to a significant increase in average within-country income inequality at the global level. It outlined an asset-centred analytical framework for conceptualizing redistribution from a stock-flow perspective (figure 1 and 2), stressing the importance of income-generating assets as a determinant of income inequality. It further highlighted the positive association of large public sectors and income inequality reduction, as well as the key role of public social spending on human development. It also pointed at the shortcomings of approaching equality of opportunity exclusively in terms of human capital without acknowledging the fundamental role of income-generating assets, such as land and industrial and financial capital in shaping opportunities available to individuals. It briefly discussed the

45
possible role of environmental taxes in containing unsustainable production and consumption and the necessity to foster sustainable use and equitable access to natural resources for present and future generations, possibly by placing privatized natural resources back under public ownership and out of the market.
Section 3 briefly reviewed major trends in redistributive policies over the last 3 decades, stressing the modest pick up in public social spending at the turn of the Millenium as well as the neoliberal tax legacy holding back governments from using taxes in a more discretionary manner to reduce inequality and promote sustainable development. More specifically, it pointed at the extensive privatization of natural resource rents; the poorly progressive tax revenue composition prevailing in many developing countries compared to developed countries; the generalized decline in environmental tax revenue arising mostly from indirect energy taxes burdening households, while the corporate sector often benefits from subsidies, exemptions or is submitted market solutions (emissions trading systems and offsetting mechanisms) that significantly underprice production carbon emissions. It also illustrated the widespread flattening of personal and corporate income schedules and the near abandoning of net wealth taxes in developed countries, along with the rising magnitude of tax abuses, including harmful tax competition, tax avoidance and tax evasion. Beyond those general trends, this section also highlighted positive developments, particularly in Latin America, where progress towards a rights-based approach to human development and the search for greater tax equity based on the principle of fiscal exchange led to significant inequality reduction during the last decade.
Section 4 proposed several steps formulated in general terms for moving towards a framework enabling asset-centred redistributive policies for sustainable development. It stressed the conceptual weakness of income poverty reduction approaches ignoring the structural role of asset inequality, especially wealth, as well as the need to collect more relevant data on income and wealth inequality and to move away from purely economic metrics as a benchmark of progress in order to reduce inequality and operationalize policies in support of sustainable development. It then outlined some key elements for building institutions and designing policies enabling asset-centred redistributive policies and further stressed the need for governments to move from a resource-constrained approach to human development towards a rights-based approach acknowledging the most fundamental socio-economic rights of their population. On the taxation side, it recommended shifting the tax base towards environmental externalities arising from production and consumption, including through a border carbon tax (instead of ineffectual emissions trading systems and offsetting mechanisms), to alter the unsustainable expansion of global value chain, which thrive on international labour cost differential and tax avoidance opportunities, while stimulating international trade and polluting merchandise transport. Shifting the tax base towards net wealth, especially financial capital, which best reflects the ability to pay, further represents the only means to eradicate extreme wealth and reduce asset inequality underpinning enduring mass income poverty. Wealth redistribution could further be fostered by the transfer of income-generating assets, such as land and industrial and financial capital and the unbundling of property rights. Land reform and policies supporting cooperatives and other types of institutional arrangements enabling economic democracy therefore represent an important pillar of wealth redistribution, along with the socialization of natural resource rents and/or public ownership to ensure a more equitable access to natural resources for present and future generations.
46
Finally, the section also stressed the necessity of stepping up ODA, while empowering local actors, including in their effort to bolster weak tax administrations so as to become less dependent on external funding and more accountable to citizens. It noted that international cooperation is essential for combatting financial secrecy and implementing reform towards financial transparency (e.g., LEI, AEoI, disclosure of beneficial owners) enabling taxation of mobile capital, which is key to tax justice and inequality reduction. Political obstacles to the implementation of such steps were not discussed, but would of course need to be taken into consideration in their specific national context. While progress under the umbrella of global governance bodies regarding the reform of the international financial and tax system is slow and far from warranted, the converging interests of many developed and developing countries as well as financial TNCs could open the way to positive changes. Additionally, efficient solutions to taxing mobile corporate capital, such as unitary taxation (box 2), should be implemented, unilaterally if necessary, by developed and developing countries.
As mentioned in the introduction and stressed in the preceding sections, redistributive policies are an essential policy tool for promoting equity and environmental sustainability, but promoting sustainable development requires much more encompassing reforms. The redistributive and other policy reforms required for reducing inequality and bringing down the physical throughput of the economy to a sustainable steady-state level, however, cannot be achieved under the prevailing paradigm that uses private investment-led economic growth as its ultimate but ill-conceived benchmark of progress. The reforms that are needed require a radically different paradigm and political economy that acknowledges the embeddedness of the economy in society and in the environment, and which aims at maximizing human well-being within planetary boundaries (Costanza et al. 2012, Farley et al. 2013).
List of recommendations: Redefining equity and development in sustainable terms 1. Focusing on asset inequality, not income poverty 2. Enabling trade-offs between economic growth, social equity and environmental sustainability 3. Redefining the metrics of equity and development
Building institutions and designing policies enabling asset-centred redistributive policies for equity and sustainable development 4. Modernizing tax administration for increased and progressive tax revenue mobilization 5. More progressive tax systems for reducing inequality of outcome 6. Shifting the tax base towards wealth for enhancing equality of opportunity 7. Shifting the tax base towards environmental externalities for incentivizing sustainable production and consumption, and shorter value chains 8. Socializing natural resource rents and/or ownership to ensure sustainable use and equitable access for present and future generations 9. Redistributing income-generating assets for economic democracy and sustainable development 10. Investing in people: a rights-based approach to human development 11. Bridging the gap with ODA for public social spending and revenue mobilization
Fostering international cooperation 12. Promoting financial transparency to prevent tax abuses by HNWIs and TNCs 13. Addressing harmful tax competition through unitary taxation to combat tax avoidance 14. Taxing mobile capital (unilaterally) to eradicate extreme wealth and international inequality
47
REFERENCES
ADB (2012a) Asian Development Outlook 2012: Confronting Rising Inequality in Asia. Mandaluyong City, the Philippines.
——— (2012b) Social Protection Index for Committed Poverty Reduction. Mandaluyong City, the Philippines.
Ackerman, Seth (2014) “Piketty’s Fair-Weather Friends.” Jacobin Magazine, 29 May. Available from: https://www.jacobinmag.com/2014/05/pikettys-fair-weather-friends/.
Africa Progress Panel (2013) “Africa Progress Report 2013 - Equity in Extractives: Stewarding Africa’s Natural Resources for All.” Available at: http://www.africaprogresspanel.org/publications/policy-papers/africa-progress-report-2013-2/.
Alvaredo, Facundo (2010) “A Note on the Relationship between Top Income Shares and the Gini Coefficient”. CEPR Discussion Paper 8071.
Alvaredo, Facundo, and Anthony B. Atkinson. (2010) “Colonial Rule, Apartheid and Natural Resources: Top Incomes in South Africa, 1903-2007”. CEPR Discussion Paper No. DP8155. Available from: http://papers.ssrn.com/abstract=1729573.
Alvaredo, Facundo, Anthony B Atkinson, Thomas Piketty, and Emmanuel Saez (2013) “The Top 1 Percent in International and Historical Perspective.” Journal of Economic Perspectives 27 (3): 3–20.
Bach, Stefan (2012) “Capital Levies: A Step Towards Improving Public Finances in Europe.” DIW Economic Bulletin 2 (8): 3–11.
Bach, Stefan, Martin Beznoska, and Viktor Steiner (2011) “A Wealth Tax on the Rich to Bring Down Public Debt? Revenue and Distributional Effects of a Capital Levy”. SSRN Scholarly Paper ID 1898550.
Bakija, Jon, Adam Cole, and Bradley Heim (2008) “Jobs and Income Growth of Top Earners and the Causes of Changing Income Inequality: Evidence from U.S. Tax Return Data”. Department of Economics Working Paper 2010-22. Department of Economics, Williams College.
Barrientos, Armando, Miguel Niño-Zarazúa, and Mathilde Maitrot (2010) “Social Assistance in Developing Countries Database Version 5.0”. SSRN Scholarly Paper ID 1672090.
Bartlett, Bruce (2007) “‘Starve the Beast’: Origins and Development of a Budgetary Metaphor”. The Independent Review v. XII, n. 1, Summer 2007.
Baunsgaard, Thomas (2001) “A Primer on Mineral Taxation”. IMF Working Paper 01/139.
Baunsgaard, Thomas, and Michael Keen (2010) “Tax Revenue and (or?) Trade Liberalization.” Journal of Public Economics 94, no. 9–10: 563–77.
Birdsall, Nancy, Nora Lustig, and Darryl McLeod (2011) “Declining Inequality in Latin America: Some Economics, Some Politics”. Working Paper 1120. Tulane University, Department of Economics.
Bonica, Adam, Nolan McCarty, Keith T Poole, and Howard Rosenthal (2013) “Why Hasn’t Democracy Slowed Rising Inequality?” Journal of Economic Perspectives 27 (3): 103–24.
Bowles, Samuel and Arjun Jayadev (2006) “Guard Labor.” Journal of Development Economics, 79, no. 2 (April 2006): 328–48.
——— (2014) “One Nation Under Guard”, New York Times, 15 February. Available at: http://opinionator.blogs.nytimes.com/2014/02/15/one-nation-under-guard/?_php=true&_type=blogs&_php=true&_type=blogs&_r=1.
Brezis, Elise S., and Joël Hellier (2013) “Social Mobility at the Top: Why Are Elites Self-Reproducing?” Working Paper 2013-12. Department of Economics, Bar-Ilan University.
Carbon Tracker (2012) “Unburnable carbon: Are the world’s financial markets carrying a carbon bubble?” Available from: http://www.carbontracker.org/site/wp-content/uploads/2014/05/Unburnable-Carbon-Full-rev2-1.pdf.
Casal, Paula (2011) “Global Taxes on Natural Resources.” Journal of Moral Philosophy 8 (3): 307–27.

48
——— (2012) “Progressive Environmental Taxation: A Defence.” Political Studies 60 (2): 419–33.
Chaudhry, Kiren Aziz (1997) The Price of Wealth: Economies and Institutions in the Middle East. Ithaca: Cornell University Press.
Christian Aid (2009) “False Profits: Robbing the Poor to Keep the Rich Tax-Free.” Available: https://www.christianaid.org.uk/Images/false-profits.pdf.
Corak, Miles (2013) “Income Inequality, Equality of Opportunity, and Intergenerational Mobility.” Journal of Economic Perspectives 27 (3): 79–102.
Cornia, Giovanni Andrea (2012) “Inequality Trends and Their Determinants: Latin America over 1990-2011”. Working Paper Series UNU-WIDER Research Paper WP2012/09.
——— (2013) “The Role of Selected Policy Instruments in Reducing Income Inequality.” Background paper for WESS 2014.
——— (2014) Falling Inequality in Latin America: Policy Changes and Lessons. [S.l.]: Oxford University Press.
Costanza, Robert, Gar Alperowitz, Herman Daly, Joshua Farley, Carol Franco, Tim Jackson, Ida Kubiszewski, Juliet Shor, and Peter Victor (2012) Building a Sustainable and Desirable Economy-in-Society-in-Nature. New York: United Nations Division for Sustainable Development. Available from: http://sustainabledevelopment.un.org/index.php?page=view&nr=627&type=400&menu=35.
Cristea, Anca, David Hummels, Laura Puzzello, and Misak Avetisyan (2013) “Trade and the Greenhouse Gas Emissions from International Freight Transport.” Journal of Environmental Economics and Management 65 (1): 153–73.
Darby, Sefton (2013) “Natural Resource Governance: New Frontiers in Transparency and Accountability.” Available: http://www.transparency-initiative.org/reports/natural-resource-governance-new-frontiers-in-transparency-and-accountability.
Davies, James B., Susanna Sandström, Anthony Shorrocks, and Edward N. Wolff (2011) “The Level and Distribution of Global Household Wealth.” The Economic Journal 121 (551): 223–54.
Dugger, William M. (1987) “Democratic Economic Planning and Worker Ownership.” Journal of Economic Issues XXI (1): 87–99.
——— (1998) “Against Inequality.” Journal of Economic Issues 32 (2): 286–303.
Eichengreen, Barry (1991) “The Capital Levy in Theory and Practice”. Working Paper 3096. National Bureau of Economic Research.
Farley, Joshua, Matthew Burke, Gary Flomenhoft, Brian Kelly, D. Forrest Murray, Stephen Posner, Matthew Putnam, Adam Scanlan, and Aaron Witham (2013) “Monetary and Fiscal Policies for a Finite Planet.” Sustainability 5, no. 6: 2802–26.
Fitoussi, Jean Paul, and Joseph Stiglitz (2011) “On the Measurement of Social Progress and Well Being: Some Further Thoughts”. Documents de Travail de l’OFCE 2011-19. Observatoire Français des Conjonctures Economiques (OFCE).
FitzGerald, Valpy (2012) “International Tax Cooperation and Innovative Development Finance.” DESA Background Paper World Economic and Social Survey. Available: http://www.un.org/en/development/desa/policy/wess/wess_bg_papers/bp_wess2012_fitzgerald.pdf.
Fjeldstad, Odd-Helge, and Mick Moore (2009) “Revenue Authorities and Public Authority in Sub-Saharan Africa.” The Journal of Modern African Studies 47 (01): 1–18.
Frank, Robert (2008) Richistan: A Journey Through the American Wealth Boom and the Lives of the New Rich. Crown Business.
Fukuda-Parr, Sakiko, Joshua Greenstein, and David Stewart (2013) “How Should MDG Success and Failure Be Judged: Faster Progress or Achieving the Targets?” World Development 41 (C): 19–30.
G20 (2011) “Supporting the Development of More Effective Tax Systems.” Available: http://www.oecd.org/g20/topics/development/48993634.pdf.
——— (2013a) “St. Petersburg Leaders’ Declaration.” St-Petersburg, September 2013.
49
——— (2013b) “Tax Annex to the St. Petersburg G20 Leaders’ Declaration.” St-Petersburg, September 2013.
G8 (2013) “Lough Erne Declaration.” Lough Erne, 18 July 2013. Available: http://www.g8.utoronto.ca/summit/2013lougherne/lough-erne-declaration.html.
Galbraith, James K. (2014) “Kapital for the Twenty-First Century?”. Available from: http://www.dissentmagazine.org/article/kapital-for-the-twenty-first-century.
Gerst, Michael D., Paul D. Raskin, and Johan Rockström (2013) “Contours of a Resilient Global Future.” Sustainability 6, no. 1: 123–35.
Giraud, Gaël (2014) “Quelle Intelligence Du Capital Pour Demain ? Une Lecture Du Capital Au XXIème Siècle de Thomas Piketty”. Documents de travail du Centre d’Economie de la Sorbonne 14007.
Global Financial Integrity (2012) “Illicit Financial Flows from Developing Countries: 2001-2010.” Available: http://iff.gfintegrity.org/iff2012/2012report.html.
Graeber, David (2012) Debt: The First 5,000 Years. Brooklyn (N.Y.); London: Melville House.
Great Britain, Parliament, House of Commons, Committee of Public Accounts (2013) Tax Avoidance - Google: Ninth Report of Session 2013-14. London: Stationery Office.
Great Britain, Parliament, House of Lords (2013) Tackling Corporate Tax Avoidance in a Global Economy Is a New Approach Needed? House of Lords Paper 48 Session 2013-14. London: Stationery Office.
Griggs, David, Mark Stafford-Smith, Owen Gaffney, Johan Rockström, Marcus C. Öhman, Priya Shyamsundar, Will Steffen, Gisbert Glaser, Norichika Kanie, and Ian Noble (2013) “Policy: Sustainable Development Goals for People and Planet.” Nature 495, no. 7441: 305–7.
Grinberg, Itai (2013) “Taxing Capital Income in Emerging Countries: Will FATCA Open the Door?” Georgetown Law Faculty Publications. Public Law Research Paper No. 13-031 2013.
Hager, Sandy Brian (2013) Public Debt, Ownership and Power: The Political Economy of Distribution and Redistribution. PhD Thesis, York University, Toronto, Ontario.
Harvey, David (2014) “David Harvey reviews Thomas Piketty”. Available from: http://socialistworker.org/blog/critical-reading/2014/05/18/david-harvey-reviews-thomas-pi.
Hayes, Christopher (2014) “The New Abolitionism.” The Nation, April 22, 2014. Available from: http://www.thenation.com/article/179461/new-abolitionism#.
Herman, Edward S, and Noam Chomsky (2002) Manufacturing Consent: The Political Economy of the Mass Media. New York: Pantheon Books.
Huang, Philip C. C. (2011) “Chongqing: Equitable Development Driven by a Third Hand’’?” Modern China 37 (6): 569-622.
——— (2012) “Profit-Making State Firms and China’s Development Experience ‘State Capitalism’ or ‘Socialist Market Economy’?” Modern China 38 (6): 591–629.
IBAHRI Task Force (2013) Tax Abuses, Poverty and Human Rights. London: International Bar Association.
ILO (2010) Extending Social Security to All: A Guide through Challenges and Options. Geneva: ILO, Social Security Department.
——— (2011). Social Protection Floor for a Fair and Inclusive Globalization. Report of the Social Protection Advisory Group. Geneva: International Labour Office.
IMF (2001) Government Finance Statistics Manual 2001. Washington, D.C.: International Monetary Fund.
——— (2006) “Offshore Financial Centers: The Assessment Program – A Progress Report.” Available: http://www.imf.org/external/np/pp/eng/2006/020806.pdf.
——— (2008) “Offshore Financial Centers: A Report on the Assessment Program and Proposal for Integration with the Financial Sector Assessment Program.” Available: https://www.imf.org/external/np/pp/eng/2008/050808.pdf.
——— (2011) “Revenue Mobilization in Developing Countries.” Available: http://www.imf.org/external/np/pp/eng/2011/030811.pdf.

50
——— (2013a) Fiscal Monitor 2013 - Taxing Times. Washington, D.C.: International Monetary Fund.
——— (2013b) Energy Subsidy Reform: Lessons and Implications. Washington, D.C.: International Monetary Fund.
——— (2014) “Spillovers in International Corporate Taxation.” IMF Policy Paper. Available from: http://www.imf.org/external/np/pp/eng/2014/050914.pdf.
Irwin, Timothy (2012) Accounting Devices and Fiscal Illusions. Washington, D.C.: International Monetary Fund.
Johannesen, Niels, and Gabriel Zucman (2012) “The End of Bank Secrecy? An Evaluation of the G20 Tax Haven Crackdown”. PSE Working Paper 2012-04.
Joshi, Anuradha, W. Prichard, and C. Heady (2012) “Taxing the Informal Economy: Challenges, Possibilities and Remaining Questions”, ICTD Working Paper 4.
Kane, Mitchell (2014) “Transfer Pricing, Integration and Novel Intangibles: A Consensus Approach to the Arm’s Length Standard”. New York University School of Law paper from the Colloquium on Tax Policy and Public Finance. Available from: http://www.law.nyu.edu/sites/default/files/upload_documents/Mitchell%20KaneSp2014(2).pdf.
Keen, Michael, Yitae Kim, and Ricardo Varsano (2008) “The ‘flat Tax(es)’: Principles and Experience.” International Tax and Public Finance 15 (6): 712–51.
Khoo, Boo Teik (2012) Policy Regimes and the Political Economy of Poverty Reduction in Malaysia. Basingstoke: Palgrave Macmillan.
Klimina, Anna (2011) “The Futility of the Neoliberal Policy of Deliberate Market Construction and the Promise of an Institutionalist Alternative: The Case of Russia’s Authoritarian Transition.” Journal of Economic Issues 45 (2): 411–20.
Kohler, Pierre (2014) “Asset-Centred Redistributive Policies for Sustainable Development.” MPRA Working Paper. Available from: http://mpra.ub.uni-muenchen.de/55620/2/MPRA_paper_55620.pdf.
Matheson, Thornton (2011) “Taxing Financial Transactions: Issues and Evidence”. IMF Working Paper 11/54.
Milanovic, Branko (2013) “The Return of ‘patrimonial Capitalism’: Review of Thomas Piketty’s Capital in the 21st Century”. MPRA Paper No. 52384.
Milne, Richard (2014) “Norway’s Oil Fund to Debate Fossil Fuel Investments.” Financial Times, February 28.
Moore, Mick (2013) “Obstacles to Increasing Tax Revenues in Low Income Countries”, ICTD Working Paper 15.
——— (2014) “Will Changes to the International Tax System Benefit Low-Income Countries?” IDS, Rapid Response Briefing, Issue 6, January 2014.
Moyo, Sam (2013). Land ownership patterns and income inequality in Southern Africa. Background paper prepared for World Economic and Social Survey 2014.
Niño-Zarazúa, Miguel, Armando Barrientos, Samuel Hickey, and David Hulme (2012) “Social Protection in Sub-Saharan Africa: Getting the Politics Right.” World Development 40 (1): 163–76.
Nitzan, Jonathan, and Shimshon Bichler (2009) Capital as Power. A Study of Order and Creorder, 2009. 1 edition. Milton Park, Abingdon, Oxon ; New York, NY: Routledge. Also available from: http://bnarchives.yorku.ca/259/.
Norregaard, John (2013) “Taxing Immovable Property Revenue Potential and Implementation Challenges”. SSRN Scholarly Paper ID 2280635.
OECD (2006) The Political Economy of Environmentally Related Taxes. Paris: OECD.
——— (2009) Engaging with High Net Worth Individuals on Tax Compliance. Paris: OECD.
——— (2010) Taxation, Innovation and the Environment. Paris: OECD.
——— (2011) “Environmental Taxation: A Guide to Policy Makers.” Available: http://www.oecd.org/env/tools-evaluation/48164926.pdf.

51
——— (2012) OECD Environmental Outlook to 2050: The Consequences of Inaction. Paris: OECD.
——— (2013) Action Plan on Base Erosion and Profit Shifting. Paris: OECD.
——— (2014) Standard for Automatic Exchange of Financial Account Information. Paris: OECD.
Ostry, Jonathan David, and Andrew Berg (2011) “Inequality and Unsustainable Growth: Two Sides of the Same Coin?” IMF Staff Discussion Notes 11/08.
Ostry, Jonathan David, Andrew Berg, and Charalambos G. Tsangarides (2014) “Redistribution, Inequality, and Growth”. IMF Staff Discussion Notes 14/02.
Oxfam (2014) “Working for the Few: Political Capture and Economic Inequality.” Available: http://www.oxfam.org/sites/www.oxfam.org/files/bp-working-for-few-political-capture-economic-inequality-200114-en.pdf.
Palacios, Robert, Robert Palacios, and Montserrat Pallarès-Miralles (2000) “International Patterns of Pension Provision.” World Bank, Social Protection Discussion Paper Series.
Palan, R., and A. Nesvetailova (2013) “The Governance of the Black Holes of the World Economy: Shadow Banking and Offshore Finance”. CITYPERC Working Paper Series 2013-03. Department of International Politics, City University London.
Palan, Ronen P, Murphy, and Christian Chavagneux (2010) Tax Havens: How Globalization Really Works. Ithaca: Cornell University Press.
Palley, Thomas (2014) “The accidental controversialist: deeper reflections on Thomas Piketty’s ‘Capital’”. Available from: http://www.thomaspalley.com/?p=422.
Palma, J. G. (2011) “Homogeneous Middles vs. Heterogeneous Tails, and the End of the ‘Inverted-U’: The Share of the Rich Is What It’s All about”. Cambridge Working Papers in Economics 1111.
Peters, Glen P., and Edgar G. Hertwich (2008) “CO2 Embodied in International Trade with Implications for Global Climate Policy.” Environmental Science & Technology 42 (5): 1401–7.
Picciotto, Sol (2012) “Towards Unitary Taxation of Transnational Corporations”. Tax Justice Network. Available: http://www.taxjustice.net/cms/upload/pdf/Towards_Unitary_Taxation_1-1.pdf.
——— (2013) “Is the International Tax System Fit for Purpose, Especially for Developing Countries?” ICTD Working Paper 13.
——— (2014) “BEPS Implications for Developing Countries”. Tax Justice Network. Available: http://www.taxjustice.net/wp-content/uploads/2013/04/TJN-Briefing-BEPS-for-Developing-Countries-Feb-2014-v2.pdf.
Piketty, Thomas (2013) Le capital au XXIe siècle. Paris: Éditions du Seuil.
Piketty, Thomas, Emmanuel Saez, and Stefanie Stantcheva (2014) “Optimal Taxation of Top Labor Incomes: A Tale of Three Elasticities.” American Economic Journal: Economic Policy 6 (1): 230–71.
Piketty, Thomas, and Gabriel Zucman (2013) “Capital Is Back: Wealth-Income Ratios in Rich Countries, 1700-2010”. CEPR Discussion Paper 9588.
Powell, Linda, F. (2011) “Legal Entity Identifier: What Else Do You Need to Know?” Available: http://www.federalreserve.gov/pubs/feds/2011/201131/201131pap.pdf.
Prabhakar, Rajiv (2009) “The Assets Agenda and Social Policy.” Social Policy & Administration 43, no. 1: 54–69.
Prichard, W., J. F. Brun, and O. Morrissey (2012) “Donors, Aid and Taxation in Developing Countries: An Overview”, ICTD Working Paper 6.
Prichard, Wilson (2009) The Politics of Taxation and Implications for Accountability in Ghana, 1981-2008. Brighton: University of Sussex. Institute of development studies (IDS).
Prichard, Wilson, and David K. Leonard (2010) “Does Reliance on Tax Revenue Build State Capacity in Sub-Saharan Africa?” International Review of Administrative Sciences 76 (4): 653–75.
Prichard, Wilson (2010) “Taxation and State Building towards a Governance Focused Tax Reform Agenda”. IDS Working Paper 341.

52
Puig, Juan Falconi (2013) “The World Failed Ecuador on Its Yasuní Initiative.” The Guardian, September 19.
Razavi, Shahra (2011) “Engendering Social Security and Protection: Challenges for Making Social Security and Protection Gender Equitable”. Friedrich Ebert Stiftung. Available: http://www.fesghana.org/uploads/PDF/FE_EngenderingSocialProtection.pdf.
Razavi, Shahra, Camilla Arza, Elissa Braunstein, Sarah Cook, and Kristine Goulding (2012) “Gendered Impacts of Globalization: Employment and Social Protection”. UNRISD Research Paper 2012–3.
Razavi, Shahra, and Sarah Cook (2012) “Work and Welfare: Revisiting the Linkages from a Gender Perspective”. UNRISD Research Paper 2012–7.
Reuven S. Avi-Yonah Ilan Benshalom (2011) “Formulary Apportionment: Myths and Prospects - Promoting Better International Tax Policy and Utilizing the Misunderstood and Under-Theorized Formulary Alternative”. U of Michigan Public Law Working Paper No. 221.
Rockström, Johan, Will Steffen, Kevin Noone, Åsa Persson, F. Stuart Chapin, Eric F. Lambin, Timothy M. Lenton, et al. (2009) “A Safe Operating Space for Humanity.” Nature 461, no. 7263: 472–75.
Shi, Zhengfu, and Chang Liu (2012) “Socialization of Property Rights: A Strategy for SOE Reform in China.” Modern China 38 (6): 677-693.
Siu, Erika, Milly Nalukwago, Rachmanto Surahmat, and Marcos Aurelio Pereira Valadão (2014) “Unitary Taxation in Federal and Regional Integrated Markets.” ICTD Working Paper (forthcoming).
Siu, Erika, Jack Mintz, Sol Picciotto, and Akilagpa Sawyerr (2014) “Unitary Taxation of Transnational Companies in the Extractives Sector”. ICTD Working Paper (forthcoming).
Sobhan, Rehman (2010) Challenging the Injustice of Poverty Agendas for Inclusive Development in South Asia. New Delhi; Thousand Oaks: SAGE.
Solt, Frederick (2008) “Economic Inequality and Democratic Political Engagement.” American Journal of Political Science 52 (1): 48–60.
——— (2009) “Standardizing the World Income Inequality Database.” Social Science Quarterly 90 (2): 231–42.
Son, Hyun H (2011) “Evaluating Social Protection Programs in Tajikistan”. SSRN Scholarly Paper ID 1943271.
Spash, Clive L. (2007) “Deliberative Monetary Valuation (DMV): Issues in Combining Economic and Political Processes to Value Environmental Change.” Ecological Economics, 63, no. 4: 690–99.
——— (2010) “The Brave New World of Carbon Trading”, New Political Economy, Vol. 15, No. 2.
Spencer, David (2014a) "Transfer Pricing: Formulary Apportionment is not a panacea, Part 1", Journal of International Taxation, April 2014.
——— (2014b) "Transfer Pricing: Formulary Apportionment is not a panacea, Part 2", Journal of International Taxation, May 2014.
Stern, Nicholas (2006) The Stern Review on the Economics of Climate Change. Cambridge, UK: Cambridge University Press.
Stiglitz, Joseph E (2003) Globalization and Its Discontents. New York: W.W. Norton.
——— (2013) The Price of Inequality. New York: W.W. Norton & Co.
——— (2014) “Reforming Taxation to Promote Growth and Equity”, Roosevelt Institute, White Paper. Available from: http://rooseveltinstitute.org/sites/all/files/Stiglitz_Reforming_Taxation_White_Paper_Roosevelt_Institute.pdf.
Stiglitz, Joseph E., and P. Dasgupta (1971) “Differential Taxation, Public Goods and Economic Efficiency.” Review of Economic Studies 38 (114): 151–74.
Stiglitz, Joseph, Amartya Sen, and Jean-Paul Fitoussi (2009) “Report by the Commission on the Measurement of Economic Performance and Social Progress.” Available: http://www.stiglitz-sen-fitoussi.fr/en/index.htm.
Tax Justice Network (2013) “Unitary Taxation: Our Responses to the Critics”. Available from: http://www.taxjustice.net/cms/upload/pdf/Unitary_Taxation_Responses-1.pdf.
53
——— (2014) “TJN responds to new OECD report on automatic information exchange,” February 2014. Available: http://www.taxjustice.net/2014/02/13/press-release-tjn-responds-new-oecd-report-automatic-information-exchange/.
The Economist (2013a) “The Missing $20 Trillion.” February. Available: http://www.economist.com/news/leaders/21571873-how-stop-companies-and-people-dodging-tax-delaware-well-grand-cayman-missing-20.
———(2013b) “Über-Warehouses for the Ultra-Rich.” The Economist, November. Available: http://www.economist.com/news/briefing/21590353-ever-more-wealth-being-parked-fancy-storage-facilities-some-customers-they-are.
Torres, Jose Luis (2013) “Revenue and Expenditure Gaps and Fiscal: Consolidation: A Cross-Country Analysis”. IMF WP/05/xx. Available: http://www.banrep.gov.co/sites/default/files/publicaciones/archivos/sem_309.pdf.
UN High Level Panel on Illicit Financial Flows from Africa (2013) “Concept Note”. United Nations Economic Commission for Africa. Available: http://www.uneca.org/sites/default/files/uploaded-documents/IFF/Accra/englishconceptnote-iff-accra.pdf.
UNCTAD (2010) Trade and Development Report 2012: Employment, Globalization and Development. Geneva: UNCTAD.
——— (2012) Trade and Development Report 2012: Policies for Inclusive and Balanced Growth. Geneva: UNCTAD.
UNDP (2012) Human Development Report 2013: The Rise of the South. New York: UNDP.
——— (2013) Humanity Divided: Confronting Inequality in Developing Countries. New York: UNDP.
United Nations (2003) Monterrey Consensus on Financing for Development. New York: United Nations.
——— (2008) Doha Declaration on Financing for Development. New York: United Nations.
——— (2012) World Economic and Social Survey 2012: In Search of New Development Finance. New York: United Nations.
——— (2013a) Synthesis Report on the Global Thematic Consultation on Addressing Inequalities. New York: United Nations.
——— (2013b) World Economic Situation and Prospects 2013: Sustainable Development Challenges3. New York: United Nations.
——— (2013c) “United Nations Practical Manual on Transfer Pricing for Developing Countries”. New York: United Nations. Available from: http://www.un.org/esa/ffd/documents/UN_Manual_TransferPricing.pdf.
——— (2014) World Economic Situation and Prospects 2014: Reducing Inequality for Sustainable Development. New York: United Nations.
UNRISD (2010) Combating Poverty and Inequality: Structural Change, Social Policy and Politics. Geneva: UNRISD.
US Senate Permanent Subcommittee on Investigations (2012a) “Offshore Profit Shifting and the U.S. Tax Code - Part 1 (Microsoft & Hewlett-Packard)”. US Senate Permanent Subcommittee on Investigations. Available: http://www.hsgac.senate.gov/subcommittees/investigations/hearings/offshore-profit-shifting-and-the-us-tax-code.
——— (2012b) “Offshore Profit Shifting and the U.S. Tax Code - Part 2 (Apple Inc.)”. US Senate Permanent Subcommittee on Investigations. Available: http://www.hsgac.senate.gov/subcommittees/investigations/hearings/offshore-profit-shifting-and-the-us-tax-code-part-2.
Vernengo, Matias (2014) “A Taxonomy of Piketty’s reviews”. Available from: http://nakedkeynesianism.blogspot.com/2014/05/a-taxonomy-of-pikettys-reviews.html.
Webb, S., and K. Shariff (1992) “Designing and Implementing Adjustment Programs”. In: Corbo V, Fischer S and Webb S, eds. Adjustment Lending Revisited: Policies to Restore Growth. Washington, D.C., World Bank: 69–92.

54
Wilkinson, Richard G, and Kate Pickett (2011) The Spirit Level: Why Greater Equality Makes Societies Stronger. New York; London: Bloomsbury.
Wilkinson, Richard G, and Kate Pickett (2014) “Reducing inequality through economic democracy “, Journal for a progressive economy (2): 10-23.
Winters, Jeffrey A. (2011) Oligarchy. Cambridge; New York: Cambridge University Press.
Wöhlbier, Florian, Caterina Astarita, and Gilles Mourre (2014) “Consolidation on the Revenue Side and Growth-Friendly Tax Structures: An Indicator Based Approach”. European Economy. Economic Papers 513.
Wolff, Edward, and Ajit Zacharias (2009) “Household Wealth and the Measurement of Economic Well-Being in the United States.” Journal of Economic Inequality 7 (2): 83–115.
Zain E. Husain (1994) "Barclays Bank PLC v. Franchise Tax Board of California: Does the Application of Worldwide Unitary Taxation to Non-U.S. Parent Corporate Groups Violate the Commerce Clause? " Fordham International Law Journal, vol. 18 (4), pp. 1475-1525. Available from: http://ir.lawnet.fordham.edu/cgi/viewcontent.cgi?article=1442&context=ilj.
Zucman, Gabriel (2013) “The Missing Wealth of Nations: Are Europe and the U.S. Net Debtors or Net Creditors?” The Quarterly Journal of Economics, April, qjt012.