Redistributive Land Reform in Rwanda: The impact on ...
29
Rwanda Journal Volume 22, Series B, 2011: Social Sciences 129 Redistributive Land Reform in Rwanda: The impact on Household Food Security Mrs. Aline Mutabazi National University of Rwanda, Faculty of Economics and Management Abstract In 2007 the country of Rwanda started land reform in Eastern and Northern Provinces with the objective of providing access to land as a means of livelihood to the landless and reducing inequality in landholdings in those regions. Based on theory and empirics, this redistribution is expected to have a positive impact on its beneficiaries particularly on household welfare. To contribute on this important debate, this study investigates the impact of land redistribution on households’ food security. With data collected using household survey in July 2009 in Kayonza District, the study assessed the impact by using Dietary Diversity and Children’s Nutritional Status (Stunting, Underweight and Wasted) as proxies of Food Security. The results suggested that access to land has increased the number of people with adequate food quantity compared to the period before they received land. In addition, the results revealed the improvement in nutrition status of children as the impact of access to land; the number of children underweight decreased even if many of them are still stunted. This situation is not surprising, because within 18 months a child can improve in weight but not really in height. However, among the new landholders there were still a number of individuals whose food intake fell below their minimum dietary energy requirements. Hence, this study focuses on the complementary policies to make land redistribution an efficient tool for food security. Key words: Redistributive Land Reform, Household Food Security, Food Consumption Score, Dietary Diversity, Children’s Nutrition Status, Stunting, Underweight, Rwanda. 1. Introduction It is argued that improved access to land is good for the poor, particular in terms of food security and poverty alleviation (World Bank, 2005; FAO, 2005). Over time researchers have established links between access to land and improvement in welfare of the population. Prosterman and Hanstad (2006), for example, have argued that for poor rural families, land plays a dominant role in their economic and social lives, and their relationship to the land largely defines their access to opportunity, income, economic and nutrition security, and status within the community.
-
Upload
khangminh22 -
Category
Documents
-
view
4 -
download
0
Transcript of Redistributive Land Reform in Rwanda: The impact on ...

Rwanda Journal Volume 22, Series B, 2011: Social Sciences 129
Redistributive Land Reform in Rwanda: The impact on Household Food Security
Mrs. Aline Mutabazi National University of Rwanda, Faculty of Economics and Management
Abstract
In 2007 the country of Rwanda started land reform in Eastern and Northern Provinces with the objective of providing access to land as a means of livelihood to the landless and reducing inequality in landholdings in those regions. Based on theory and empirics, this redistribution is expected to have a positive impact on its beneficiaries particularly on household welfare. To contribute on this important debate, this study investigates the impact of land redistribution on households’ food security. With data collected using household survey in July 2009 in Kayonza District, the study assessed the impact by using Dietary Diversity and Children’s Nutritional Status (Stunting, Underweight and Wasted) as proxies of Food Security. The results suggested that access to land has increased the number of people with adequate food quantity compared to the period before they received land. In addition, the results revealed the improvement in nutrition status of children as the impact of access to land; the number of children underweight decreased even if many of them are still stunted. This situation is not surprising, because within 18 months a child can improve in weight but not really in height. However, among the new landholders there were still a number of individuals whose food intake fell below their minimum dietary energy requirements. Hence, this study focuses on the complementary policies to make land redistribution an efficient tool for food security.
Key words: Redistributive Land Reform, Household Food Security, Food Consumption Score, Dietary Diversity, Children’s Nutrition Status, Stunting, Underweight, Rwanda.
1. Introduction
It is argued that improved access to land is good for the poor, particular in terms of food security and poverty alleviation (World Bank, 2005; FAO, 2005). Over time researchers have established links between access to land and improvement in welfare of the population. Prosterman and Hanstad (2006), for example, have argued that for poor rural families, land plays a dominant role in their economic and social lives, and their relationship to the land largely defines their access to opportunity, income, economic and nutrition security, and status within the community.

Rwanda Journal Volume 22, Series B, 2011 : Social Sciences 130
To improve and secure land for poor families, authors point out that land reform is an option. For example, Lipton (2009) noted that land reform ‘matters’ mainly for its effect on poor people. He emphasised that the main goal of land reform is to reduce gross inequality of rural land rights; thus to decrease poverty. The author indicated that land reforms have happened and achieved the goal in developing countries. Along the same lines, the committee of 180 members and partners of the International Land Coalition during the conference of April 2009 about “Securing Rights to Land for Peace and Food Security” suggested that providing secure access to land and natural resources for the poor producers is a vital step to finding lasting peaceful solutions to addressing rural poverty, persistent hunger, and resource conflicts. Gaining secure access to land is central to their enjoyment of full citizenship and wider human rights, especially the right to food.
A large number of African countries are at various stages of reviewing or reforming their land policies and laws (Adams and Palmer, 2007) including Rwanda. In February 2004, Rwanda officially adopted a national land policy and in September 2005 a national land law came into effect. Tenure reform is part of strategy that is intended to promote more effective utilization of Rwanda’s limited land resources. Before the 2004 Land policy and 2005 Land law, Rwanda had never had a proper land policy nor had it ever had a land law, apart from a few scattered land regulations, most of which date back to the colonial period (National Land Policy, 2004). This situation enhances the existing duality between the written law and the widely practised customary law, giving rise to insecurity, instability and precariousness of land tenure (National Land Policy, 2004). Therefore, it was necessary to establish a national land policy that would guarantee a safe and stable form of land tenure, and bring about a rational and planned use of land. On the same line of land reform, in 2007 the government of Rwanda started redistributive land reform in Eastern and Northern Provinces with the objective of providing access to land as a means of livelihood to the landless and reducing inequality in landholdings in those regions.
The issue of land rights and land reform in Rwanda was given considerable attention this last decade. But much of this debate is

Rwanda Journal Volume 22, Series B, 2011: Social Sciences 131
specifically around the possibility of reducing social conflicts, gender promotion1 as well as achieving agricultural efficiency in generally (Pottier, 2006; Musahara and Huggins, 2005; Bigagaza et al, 2002), while household’s welfare side has not been widely explored.
This study attempts to make a contribution by investigating land redistribution and the impact on households’ food security, an important dimension of well-being. The food and nutrition security of the population remains a key building block in accelerating the rate of growth towards the realization of the Millennium Development Goals (MDGs). Consequently, during recent decades increased international attention has been given to food security. Donors have invested in food insecure countries to improve food security. Foreign involvement often focuses on the distribution and the access to farmland in order to increase agricultural productivity, to increase food security, to improve the quality of rural life, and to reduce rural unrest (Henri, 2001).
For Rwanda, food security is expected to alleviate extreme poverty as mentioned in the document of vision, titled “vision 2020 of Rwanda” (Ministry of Finance, 2007). Rwanda a low-income, food-deficit and least-developed country is ranked 158th out of 177 countries in the 2006 Human Development Report (HDR). In addition, the country ranks 97th out of 118 developing and transition countries on the Global Hunger Index (Wiesmann et al., 2007)2. Researches about Food Security in Rwanda indicate that the population of Rwanda remains highly vulnerable to food insecurity and malnutrition. For example, the Demographic and Health Survey (DHS) (2005) indicated that over 70 percent of the rural population is considered to be food insecure and 45 percent of the children under 5 are stunted. Additionally, the 2006 report of National Institute of Statistics of Rwanda (NLSR) and WFP joint Comprehensive Food
1 In Rwanda, before the land reform, women accessed land through marriage, and would only ever fully exercise their usufruct rights when widowed with male children (Pottier, 2006). 2 The index is an aggregate of the Food and Agriculture Organisation of the United Nations’ estimates of the proportion of people who cannot meet their minimum dietary energy requirements, the prevalence of underweight in children, and the underfive mortality rate( Wiesmann, 2006).
Rwanda Journal Volume 22, Series B, 2011 : Social Sciences 132
Security Vulnerability Assessment (CFSVA) indicated that 28 percent of households in Rwanda- 2.1 million people - are food-insecure; 24 percent of households are highly vulnerable to food insecurity, 26 percent of households are moderately vulnerable to food insecurity and only 22 percent of households are food-secure.
On the basis of the previous statements above, the objective of this study is to investigate whether the redistributive land reform in Rwanda has been effective in ensuring a better welfare for its beneficiaries particularly in terms of food security. The analysis focused on the group that received land in Eastern and Northern Provinces of Rwanda. These regions were included on the highest proportion of food-insecurity based on a research conducted by the Office of Statistics of Rwanda in 2006.
The main question the study seeks to answer is: How has land redistribution impacted on household food security in Rwanda?
The hypothesis of this research has been formed with reference to the following. Land is the main productive asset for poor people (Lipton, 2009). While poverty is about much more than income or consumption, a narrow definition of extreme ‘income poverty’ is: having income normally not sufficient to meet basic calorie and other needs (Lipton, 2009). Based on this definition and empirics about the positive impact of access to land on the welfare of its benefi-ciaries, and in view of Rwanda, I hypothesize that the households who received land through redistributive land reform meet their minimum dietary energy requirements after owning land.
2. Land Reform and Land Redistribution in Rwanda
The vast majority of Rwandans own small and fragmented pieces of land that they inherited from family or that the state allocated to them for use. During the 1994 Rwanda genocide, many civilians partici-pated in the killings and different authors have written about the factors which could have contributed to the participation of particular groups of people. Some argue that increasing population and land scarcity coupled with low agricultural productivity actually drove people to murder (Diamond, 2005). He asserts that if you ran off, or killed, a Tutsi (or a Hutu for that matter) you might just get the

Rwanda Journal Volume 22, Series B, 2011: Social Sciences 133
missing or dead person’s land. This would help you feed your family. Similarly, Pottier (2006) writes that “ordinary people also killed for economic gain, often for access to a victim’s land”.
While the above assertion could be applicable in some cases, it was not the case everywhere. Political propaganda against Tutsi and Hutu moderates mainly fuelled the genocide. As a witness to what happened in Rwanda, large groups of people would attack and kill selected families and in some cases would destroy all the valuable property leaving nothing to share amongst themselves. In addition, it would be difficult for a big group of people to share just one piece of land, some of which they were even not interested in. This is also the point of Boudreaux (2009). He argued that “while land conflict was an important feature of pre-genocide Rwanda it was not the primary impetus for violence and genocide”.
But in 1994, the war and genocide worsened the already precarious access to land in Rwanda. By July 1994, an estimated 1 million people, or more than 10 percent of the population, had been massacred. About 30 percent temporarily fled the country and returned between 1996 and 1997. In addition, up to 1 million of people who had fled the country in 1959, returned to Rwanda after more than 30 years in Diaspora (National Land Policy, 2004). By 1997, there were complex and multiple claims on scarce land. As an immediate solution, some of the former 1959 refugees occupied land temporarily that had been abandoned3. Others were given plots on public land and vacant land on which they could resettle and produce. But, because there were no formal rules about the distri-bution of that public land, at the end of the day the situation was that much of the land remained in the hands of the privileged few, leaving hundreds of poor villagers landless. This situation also created conflicts among people who were living in those areas. Thus, this land situation (from the period of independence) resulted in the need for land reform. The government of Rwanda reviewed the land law and the enactment of the 2004 Land Policy and 2005 Land Law constituted a reform in Rwanda. The government claimed that the
3 The land belonged to people who temporarily fled the country and return between 1996 and 1997.

Rwanda Journal Volume 22, Series B, 2011 : Social Sciences 134
new tenure system would contribute to enhancing food production, social equity and the prevention of conflict. In addition, the government started land redistribution in Eastern and Northern Provinces with the objective of reducing inequality in landholdings in those regions and profitably maximize the allocated land through agricultural transformation and diversification.
2.1 Land Redistribution in Rwanda
After the 2004 land policy and 2005 land law, the government of Rwanda started the redistributive land reform in Eastern Province in the Districts of Nyagatare, Gatsibo, Kirehe, Kayonza and in Northern Province in the Districts of Rutsiro, Rubavu, Nyabihu and Ngororero where there was a serious problem of inequality in landholdings. The inequality arose from the fact that the distribution of public land given to returnees4 from neighbouring countries as a temporary solution had been done without any formal rules. The top government officials, senior army officers and other people took big chunks of land, leaving hundreds of poor villagers landless.
In the first stage of land redistribution, there was a committee in charge of redistribution. This committee tried to start the redistribution process but failed to perform because it was a very complicated and sensitive situation that involved varied interests across different categories of people for example the big land owners versus the small owners. After the failure of the initial programme of redistribution, the President of Rwanda directed the redistribution and went to the field to supervise the exercise. The exercise started at the end of 2007 by redistributing land that was initially held by the top government and army officers. Starting land redistribution from high ranking officers was to set example to the small land holders. This was to avoid conflicts between those who had it and to those it was given. The policy of redistribution is not applied to top government officials and senior officers only; it applies to
4 Returnees refers to people who came back to after the Rwandese genocide in 1994
Rwanda Journal Volume 22, Series B, 2011: Social Sciences 135
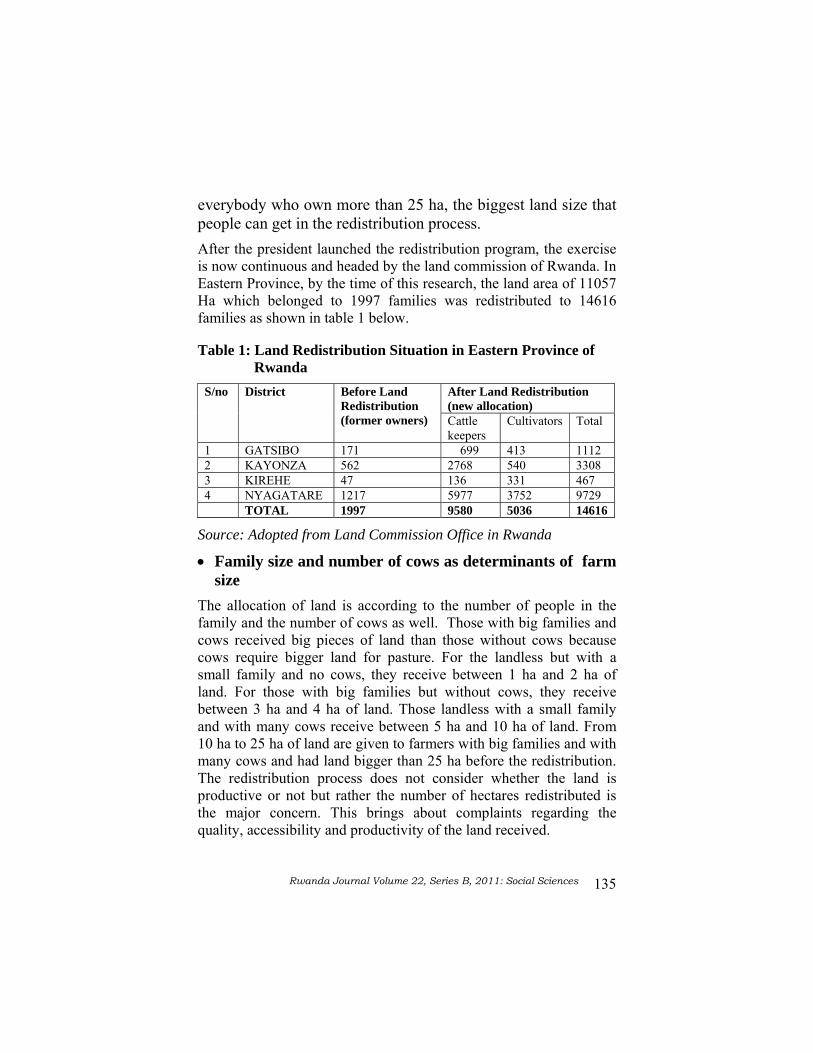
everybody who own more than 25 ha, the biggest land size that people can get in the redistribution process. After the president launched the redistribution program, the exercise is now continuous and headed by the land commission of Rwanda. In Eastern Province, by the time of this research, the land area of 11057 Ha which belonged to 1997 families was redistributed to 14616 families as shown in table 1 below.
Table 1: Land Redistribution Situation in Eastern Province of Rwanda
Source: Adopted from Land Commission Office in Rwanda
• Family size and number of cows as determinants of farm size
The allocation of land is according to the number of people in the family and the number of cows as well. Those with big families and cows received big pieces of land than those without cows because cows require bigger land for pasture. For the landless but with a small family and no cows, they receive between 1 ha and 2 ha of land. For those with big families but without cows, they receive between 3 ha and 4 ha of land. Those landless with a small family and with many cows receive between 5 ha and 10 ha of land. From 10 ha to 25 ha of land are given to farmers with big families and with many cows and had land bigger than 25 ha before the redistribution. The redistribution process does not consider whether the land is productive or not but rather the number of hectares redistributed is the major concern. This brings about complaints regarding the quality, accessibility and productivity of the land received.
S/no District Before Land Redistribution (former owners)
After Land Redistribution (new allocation) Cattle keepers
Cultivators Total
1 GATSIBO 171 699 413 1112 2 KAYONZA 562 2768 540 3308 3 KIREHE 47 136 331 467 4 NYAGATARE 1217 5977 3752 9729 TOTAL 1997 9580 5036 14616

Rwanda Journal Volume 22, Series B, 2011 : Social Sciences 136
After receiving the land, the new landholder receives a temporary land certificate and after completing the requirements of the Ministry in charge of Land matters, the new landholder receives a land lease title for 99 years. Those requirements are regarding the mode of organizing the land received. This rule is applied both to people who receive the land and those who lost the land in the redistribution process. However, the issue of conditional land titles has been raised by Prosterman and Hanstad (2006). They suggest that land reform beneficiaries should not be forced or pressured to adopt a particular mode of organizing their farms; farmers are best suited to make organizational decisions regarding their farms.
The issue about “inequality” resulting from the redistributive land reform can be discussed at this stage. While the objective of land redistribution was to address inequalities, the process itself resulted in different categories of people accessing different sizes of land, a situation that also entails creation of inequality itself. There are different arguments to this case. First, it is understandable that people with big families and many cattle should own biggest land for the reasons explained previously. In addition, because some people had big pieces of land before the redistribution and that they may have undertaken some investments on that land, it seems fair that they would still be granted more land than those who did not. Similarly, the Bible in Matthew 13:12 said “For whoever has, to him will be given, and he will have abundance, but whoever doesn't have, from him will be taken away even that which he has not”. Second, some researches pointed out that land scarcity does not matter, rather the productivity (Udry et al., 1995; Barham et al., 1995; and Griffin et al., 2002). All this work shown that it is not asset inequality per se that creates low agricultural returns, rather the combination of asset inequality with market failures leads to differential efficiency or productivity between asset poor and asset rich. Taiwan and South Korea are the example of successful cases of land reform that have been implemented in agrarian societies with extreme scarcity (Griffin et al., 2002).

Rwanda Journal Volume 22, Series B, 2011: Social Sciences 137
3. Methodology
3.1 Data In order to analyse the impact of land redistribution on household’s food security in Rwanda, I used data collected using household surveys which was distributed in July 2009 in Kayonza District. While the process of land redistribution in Rwanda had been done in four district of Northern Province (Rutsiro, Rubavu, Nyabihu and Ngororero) and in four districts of Eastern Province (Nyagatare, Kirehe, Gatsibo and Kayonza), only Kayonza had been selected to be the sample of this study. The reason was that the cost and time limitations could not allow coverage of a scientifically selected sample size both in number and geographical dispersion. As mentioned previously, by the time of this research, the total of new landholders was 14,616 in Eastern Province.
In order to test hypothesize of this study, I selected among new landholders, those who were qualified as poor for the time of the redistribution process. I considered poor people those landless without cows and whom have received between 1ha and 2ha piece of land because of the reasons explained above. The majority of these poor people relied on the agricultural wage labour before they received land, the wage which is lower compared to purchasing power in Rwanda (Ministry of Finance, 2007).
In the District of Kayonza, there were a good number of poor people without cows and therefore received small land (between 1 ha and 2 ha) compared to those with many cows. Nyagatare and Gatsibo Districts were not selected because there were a lot of farmers with many cows, thus, they were not considered as poor. Kirehe district was not selected because the nature of arable land in that region is unproductive compared to Kayonza. This could create the problem of endogeneity in the case the results shows a negative impact of access to land on food security because it could not be easy to specify the reason.
The whole district of Kayonza was not included in the sample. Only the sectors of Murundi and Ndego were selected due to the fact that the redistribution had started earlier in January 2008 and since they had experienced 3 harvesting seasons, it was feasible to carry out

Rwanda Journal Volume 22, Series B, 2011 : Social Sciences 138
impact assessment. With the collaboration of Kayonza District office, the Office of Murundi and Ndego Sectors, the lists of these people were available. A total of 72 people received land that time in those two sectors. The target was to interview all of them, but only 50 families were available and interviewed. Additionally, data on child anthropometry for children young than 12 years was taken; 94 children from these families were measured for weight and for height. Children were weighted on electronic scale with a weighing capacity of 0 to 100kg. Their height was measured to the nearest 1mm with locally made portable devices equipped with height gauges (SECA 206 Bodymeter).
• Limitations of the Study This study was subject to limitations and threats to the reliability and validity of the results. While rigorous standard were applied, the following must be acknowledged:
- The survey took place in July 2009, after the 2009 season B (May and June) harvest5, resulting in good food availability. The results represent a snapshot of the food security for that period and therefore may have led to more households reporting high levels of food security than normal. In addition, questions about food consumption before the redistribution, that is two years ago, have been asked. This situation might bias the recall and consequently the results, if there are some items of food omitted or included.
- Comparing the number of new landholders (11000 house-holds by the time of this research) and the sample of 50 households, the results of this analysis may not be a comprehensive representative of the all who received land in Eastern and Northern Provinces of Rwanda. Hence, the findings should not be generalised to the entire country, but rather should be taken as indicative of this aspect.
5 In Rwanda, the agricultural calendar is the following: January is considered the starting month for the harvest of season A, May for Season B, and September for season C.

Rwanda Journal Volume 22, Series B, 2011: Social Sciences 139
- Inaccurate recall and quantitative estimates may affect the validity of the findings particularly about child anthropo-metric measurements.
3.2 Methods
3.2.1 Methods for Impact Evaluation
In order to identify the causal relation between access to land and food security, I exploited and analysed the variation in food consumption for people who received land applying reflexive comparisons, that is, the participants who receive the intervention are compared to themselves before and after receiving the intervention (Kene, 1999). To do so, the same questions about food consumption were asked for before and after receiving the land.
It is important to note that the methods commonly used for impact analysis are randomized controls which allow individuals to be placed randomly into two groups—those that receive the intervention and those that do not. This allows determining program impact by comparing means of the outcome variable between the treatment and the control group. While randomized controls are seen as the most valid and reliable, however, they used when feasible (Gunhild et al., 2009).
For this research, randomized controls were not easy to use because it is not possible to randomly select a control group for the following reasons. First, it was not feasible to identify a group that was not receiving the land in the same region, because in the redistribution process poor people without land were targeted and expected to be all satisfied. By the time of this research, the process of redistribution was continuous. Second, one might think to compare people who received land with other landless from another region, but the limited resources and time constraints could not allow me to use this process. Finally, the use of reflexive controls in this study could not bias the results, because the information about possible factors that could affect the outcomes had been included in questionnaire and asked to the interviewed during the process of data collection. An example of one of those factors is “food assistance”. In fact, in Rwanda, WFP assist the education sector by providing nutritious food for primary

Rwanda Journal Volume 22, Series B, 2011 : Social Sciences 140
schoolchildren in the post food insecure areas. Nutritious food is provided as a daily cooked meal in primary schools, and a monthly take home ration for their families. If this could be the case and as the sample was formed by children with the age of primary school, consequently, the cause of household food security could not be clear between land reform and food assistance. To get information on this problem, during the interview, additional questions about external assistance were asked.
3.2.2 Methods of measuring Food Security
Food security is a complex notion that it is virtually impossible to measure directly and a variety of proxy measures have been suggested. Some of the most commonly used types of indicators in the assessment of food security include those related to: food production, Income, total expenditure, food expenditure, share of expenditure on food, calories consumption (or diet diversity) and nutritional status (Frank et al., 1999). But because of lack of reliable data on some of those indicators, this analysis only focused on Dietary Diversity and Nutrition Status of children as proxy measures of food security. The latter indicators are more reliable and efficient to reflect the food security dimension in the context of Rwanda.
Many researchers have found a consistent positive correlation between dietary diversity and other measures of household food security such as per capita consumption (a proxy for income) and energy availability. This evidence suggests that such household dietary diversity could be a useful indicator of used household food security (Ruel, 2002; Hatloy et al., 1998; Rose et al., 2002).
Hoddinott and Yohannes (2002) have also raised this issue by indicating four reasons which make Dietary Diversity an attractive indicator of household food security. First, a more varied diet is a valid outcome in its own right. Second, a more varied diet is associated with improved child anthropometric status, birthweight, etc. Third, questions on dietary diversity can be asked and making it possible to examine food security at household level. Fourth, obtaining data on dietary diversity is relatively straightforward.

Rwanda Journal Volume 22, Series B, 2011: Social Sciences 141
Furthermore, Dietary Diversity has been consistently associated with child nutritional status and growth in a variety studies in developing countries (Ferguson et al., 1993; Onyango et al., 1998; Tarini et al., 1999; Arimond and Ruel, 2002). For example, Ruel (2002) has analysed data from the Ethiopia 2000 Demographic and Health Survey (DHS) and has found a strong and statistically significant association between food-group diversity measures and children’s height-for-age Z-scores. Others studies in Mali and Kenya have found a strong association between, dietary diversity and children’s nutrition. In urban areas of Mali, (Hatloy et al., 1998) have found that lower food variety or dietary diversity scores were associated with twice the risk of being stunted or underweight. In Kenya, (Onyango et al., 1998) have measured dietary diversity by the number of individual food consumed in 24h and have found that it was significantly associated with children nutrition status like height-for-age Z-scores, weight-for-age Z score and weight-for height Z- scores.
3.2.2.1 Measuring Dietary Diversity
Dietary Diversity (DD) is usually measured by summing the number of different foods or food groups consumed over a given reference period (Ruel, 2002). Although many studies tried to measure dietary diversity, there is still a lack of uniformity in methods used for measuring DD and in approaches to develop and validate indicators. Experience from developed countries and developing countries in the context of assessing overall dietary quality abound, but differences in methods and analytical approaches affect the comparability of findings (see Ruel, 2002).
Alternatively, Hoddinott (2002) proposed a weighting system as an approach to measure DD. For example, a weighted sum of the number of individual foods consumed can be computed. In this case, the weights reflect the numbers of days the foods were consumed over a reference period. Based on these findings, the World Food Program (WFP, 2007) has developed a proxy measure of food security. Data was collected on a seven-day recall of frequency of consumption of several food groups at household level. These data

Rwanda Journal Volume 22, Series B, 2011 : Social Sciences 142
were used to construct a Food Consumption Score (FCS) and classify households according to their food consumption.
The FCS6 was calculated using the frequency of consumption of eight food groups consumed by a household during the seven days before the survey. Table 2 shows the weights proposed by WFP for the calculation of the FCS which have been adopted in the context of Rwanda for this study. After the calculations of food consumption score, the WFP proposes the thresholds for creating food consumption groups (see Table3).
Table2. Food Items, Food Groups, Weights for Calculation of the FCS and Justifications
The highest weight was attached to foods with relatively high energy, good quality protein, and a wide range of micronutrients that can be easily absorbed (World Food Programme 2007)
Food Items Food Group
Weight Justification
Cereals: Corn, Wheat, Sorghum, Rice, Bread Roots and Tubers: Manioc, Sweet Potatoes, Banana
Staples 2 Energy dense, protein content lower and poorer quality than legumes, micronutrients (bound by phytates)
Peanuts, Beans Pulses 3 Energy dense, high amounts of protein but of lower quality than meats, micronutrients (inhibited by phytates), low fat
6 For the calculations of FCS, the procedure proposed by WFP 2007, is the following:
1. Using standard seven-day food frequency data, group all the food items into specific food groups.
2. Sum the consumption frequencies of food items within the same group, yielding a food group score for each food group.
3. Any food group score greater than seven is recoded as seven. 4. Multiply the value obtained for each food group by its weight, thus
creating weighted food group scores. 5. Sum the weighed food group scores, thus creating the FCS. 6. Using the appropriate threshold, recode the variable FCS from a
continuous variable to a categorical variable for the Food Consumption Groups.

Rwanda Journal Volume 22, Series B, 2011: Social Sciences 143
Vegetables vegetables 1 Low energy, low protein, no fat, micronutrients
Fruits Fruits 1 Low energy, low protein, no fat, micronutrients
Animal Proteins: Fish, Meat, Eggs
Meat & Fish
4 Highest quality protein, easily absorbable micronutrients (no phytates), energy dense, fat. Even when consumed in small quantities, improvements to the quality of diet are large
Milk / milk products
Milk 4 Highest quality protein, micronutrients, vitamin A, and energy. However milk could be consumed only in very small amounts and should then be treated as condiment, and therefore reclassification in such cases is needed
Sugar Sugar 0.5 Empty calories. Usually consumed in small quantities
Oils and Fats Oil 0.5 Energy dense but usually no other micronutrients. Usually consumed in small quantities
Source: World Food Program (2007).
Table 3. Thresholds for creating food consumption groups Food consumption Score Profile 0-21 Poor 21.5-35 Bordeline 35 Acceptable
Source : World Food Program(2007)
In this study, I used the above method suggested by WFP. The terms about food consumption that are used in this analysis are listed in Box 1 Box 1. Definitions
1. Food frequency, in this context, is defined as the frequency (in terms of days of consumption over a reference period) that a specific food item or food group is eaten at the household level.
2. Food group is defined as a grouping of food items that have similar caloric and nutrient qualities.
3. Food item cannot be further split into separate foods. However, generic terms such as fish or poultry are generally considered to be food items for the purpose of this analysis
Source: World Food Program (2007).

Rwanda Journal Volume 22, Series B, 2011 : Social Sciences 144
During the survey, food consumption data was collected at the household level and used to obtain a “snap-shot” of households’ access to food. During the analysis, this information was transformed into a Food Consumption Score (FCS) and households were categorized as those with poor (food insecure), borderline (moderately food insecure) or acceptable consumption (food secure).
I used the following process: - Households involved in the study were asked how many days
a week they consumed a series of 21 food items during the week prior to data collection and what the source for those items was (self-production, purchase or other).
- The consumption of 21 food items which are common in Rwanda was assessed: Maize, Rice, Other Cereals, Cassava, Sweet Potato, Other Roots/ Tubers, Bread, Cooking Banana, Beans and Peas, Other vegetables, Cassava leaves, Groundnuts, Sunflowers, Fresh Fruits, Fish, Meat, Poultry, Eggs, Oil, Sugar, Milk.
- To facilitate analysis, the food items were grouped into main staples such as: Pulses, Vegetables, Fruits, Meats and Fish, Milk, Sugar and Oil.
- Food Consumption Scores (FCS) were computed by grouping together food items for which consumption was assessed in order to reflect the diversity and frequency (number of days per week) of the food items consumed by a household. For each food group the frequency represent the number of days an item from the food group was consumed, with a range from 0 (never) to 7 (every day).
- A weight was assigned to each food group (according to the WFP standards), representing the nutritional importance of the food group.
In line of the explanations above, the most basic estimation equation about Food Consumption Score used for this study is: Υ = β 0 + β 1 X Tubers + β 2 X Cereals β 3X Pulse + β 4X Vegetables +
β 5X Fruits + β 6X FishMeats / + β 7X Milk + β 8X Sugar + β 9X Oil

Rwanda Journal Volume 22, Series B, 2011: Social Sciences 145
Y is the dependent variable representing FCS which reflects the diversity and frequency (number of days per week) of the food items consumed by a household.
The quantities consumed were not assessed for the FCS. Only food items consumed as a substantial meal during the 7-day recall period were to be recorded. However, it is possible that some food items consumed in small quantity, especially milk, meat and fish, were recorded. This may lead to an over-estimation of the FCS. β n represents the weight attached to food group and Xn represents different food groups. The FCS is the sum across food groups of the product of the frequency by the weight. 3.2.2.2 Children’s Nutrition Status
In this study, Children’s Nutrition Status was analysed using two commonly used undernutritional indicators, i.e., stunting (height-for-age) and underweight (weight-for-age). The following picture reflects these categories:
Source: Waterlow, 1992

Rwanda Journal Volume 22, Series B, 2011 : Social Sciences 146
To capture the impact of access to land on children’s nutrition status, I assumed that:
1. Poor families which received land were food insecure before. 2. If the results show that many children were stunted and had
wasted away, it points towards the fact that those children were stunted even before their family got land and consequently no impact of access to land on household food security.
3. If the results show that many children were stunted but not wasted then it means that there is a positive impact on food security considering that after only two years of improved nutrition, a child can only gain weight but not height.
4. Results
4.1 Effect of owning land on Food Sources and Diet Diversity
4.1.1 Food Sources
In order to get information about sources of food, for each of the food items consumed, households were asked to provide the main sources of that food items. They reported that food items were obtained through a variety of means, especially after harvesting their own crops and purchasing. Borrowing, domestic livestock and food exchange played a secondary role.
After receiving land, results showed that “own production” became the main source of staples, pulses, vegetables. Households mainly produced and consumed tubers (manioc, sweet potatoes and banana). Also, bananas, used for cooking and for beer were frequently produced by households. Cereals (sorghum), pulses (kidney beans and groundnuts), and vegetables (green, leafy vegetables, shoots) are also common. Milk was obtained through domestic livestock. Other items like Meats, Sugar and Oil were purchased.
Before the households owned land, the results showed that people surveyed mainly purchased their food. The following is a common statement coming from the majority of households:
“Before we received the land, we used to go and cultivate for people who had big land and they paid us either money or food. Thanks to

Rwanda Journal Volume 22, Series B, 2011: Social Sciences 147
the government that gave us the land, because, this time, even if we continue to cultivate for other people, but at least we have our own land which helps us to get more and better food.”
Figure1 and 2 below gives an idea about the importance of owning land on the overall diet of households.
Figure 1: Household Food Source after owning land
Figure 2: Household Food source before owning land
Figure 1 and 2 show changes in food sources as explained above. The results demonstrated the expectations obtained from various previous studies. For example, Hanstad et al., (2002) found that in

Rwanda Journal Volume 22, Series B, 2011 : Social Sciences 148
Karnataka in India, agricultural labourer families who received government-granted house-and-garden plots of .016 hectares were able to satisfy most of the family’s nutritional needs for vegetable, fruits, and dairy products. Similarly results were also found by Kumar (1978) in Kerala in India. The results also showed increased consumption and production of milk by livestock. This situation occurred in the sample that was composed of poor people without cows. The question to raise here is: where is the origin of that milk? The answer lies in the fact that after owning land some households got cows from the neighbours or friends. As explained by one of the interviewees “this time, we have land and we can negotiate a cow from the neighbours, because we have a space where we can put it. We have a system of giving each other a cow, you take care of it and when it produces, you give back the calf to the owner. This helps us to get milk for our children, increase our income by selling milk and also it increases our agriculture production because its gives fertilizer for our land from the manure”. This is an interesting impact on beneficiaries who access land. In addition to the subsistence, Lipton (2009), Deininger, Jin and Nagarajan (2007) stated that land reform tend to raise the poor’s non-farm income. Additionally, it confirms the idea that access to land can creates opportunities of investment (Thiesenhusen (1995). 4.1.2 Diet Diversity and Food Consumption Groups Table 3: Food items consumption by food consumption groups before owning
land Food Consumption Groups
Pop. (%)
Food Groups (Weekly Consumption) FCS Score Average Tubers Cereals Pulses Vegs Fruits Anim.
Prot. Oil Sugar Milk
Poor 53.4 3.9 3.7 2.4 2.0 0.2 0.0 0.9 0.5 0.6 20.3 Borderline 46.6 5.6 4.2 3.6 3.1 0.4 0.5 1.6 0.9 1.2 31.55 Total 100
Table 4: Food items consumption by food consumption groups after owning land
Food Consumption Groups
Pop. (%)
Food Groups (Weekly Consumption)FCS Score Average Tubers Cereals Pulses Vegs Fruits Anim.
Prot. Oil Sugar Milk
Poor 12.5 3.9 3.8 2.5 2.2 0.2 0.0 0.9 0.5 0.6 20.8 Borderline 33.4 5.6 4.3 3.8 3.4 0.3 0.0 1.7 0.9 1.4 33.2 Acceptable 54.1 6.3 6.2 6.7 4.3 1.1 0.7 2.5 1.8 2.0 51.05 Total 100
Rwanda Journal Volume 22, Series B, 2011: Social Sciences 149
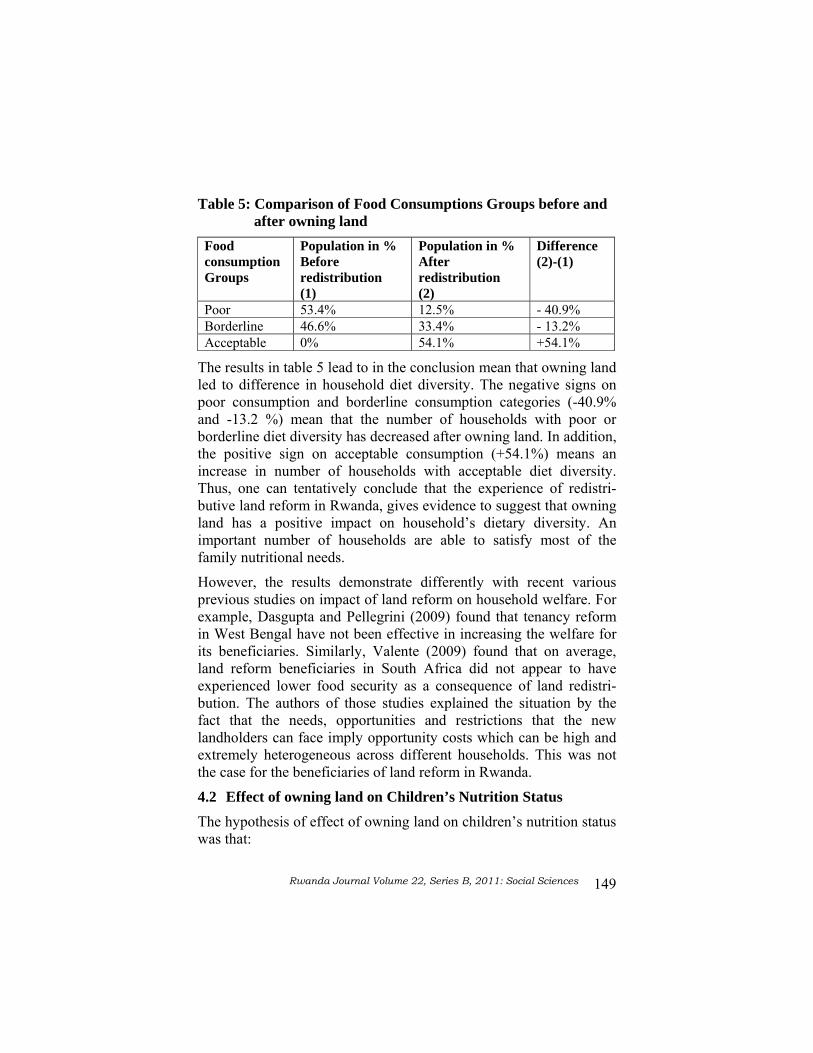
Table 5: Comparison of Food Consumptions Groups before and after owning land
Food consumption Groups
Population in % Before redistribution (1)
Population in % After redistribution (2)
Difference (2)-(1)
Poor 53.4% 12.5% - 40.9% Borderline 46.6% 33.4% - 13.2% Acceptable 0% 54.1% +54.1%
The results in table 5 lead to in the conclusion mean that owning land led to difference in household diet diversity. The negative signs on poor consumption and borderline consumption categories (-40.9% and -13.2 %) mean that the number of households with poor or borderline diet diversity has decreased after owning land. In addition, the positive sign on acceptable consumption (+54.1%) means an increase in number of households with acceptable diet diversity. Thus, one can tentatively conclude that the experience of redistri-butive land reform in Rwanda, gives evidence to suggest that owning land has a positive impact on household’s dietary diversity. An important number of households are able to satisfy most of the family nutritional needs.
However, the results demonstrate differently with recent various previous studies on impact of land reform on household welfare. For example, Dasgupta and Pellegrini (2009) found that tenancy reform in West Bengal have not been effective in increasing the welfare for its beneficiaries. Similarly, Valente (2009) found that on average, land reform beneficiaries in South Africa did not appear to have experienced lower food security as a consequence of land redistri-bution. The authors of those studies explained the situation by the fact that the needs, opportunities and restrictions that the new landholders can face imply opportunity costs which can be high and extremely heterogeneous across different households. This was not the case for the beneficiaries of land reform in Rwanda.
4.2 Effect of owning land on Children’s Nutrition Status
The hypothesis of effect of owning land on children’s nutrition status was that:

Rwanda Journal Volume 22, Series B, 2011 : Social Sciences 150
If the results show that many children were stunted but not wasted then it means a positive impact on food security; because of the fact that after only two years of improved nutrition, a child can only gain weight but not height. Otherwise, there is no impact.
Table 6: Frequency (%) of Stunting and Underweight by age and sex
Undernutrition prevalence (%)
Age (years) Sex n Stunting Underweight
Frequency
1 Boys 2 0 0
2 Boys 2 0 0
Girls 1 0 0
3 Boys 2 1 (50) 0
Girls 2 1 (50) 0
4 Boys 2 1 (50) 0
Girls 3 2 (66,6) 1 (33,3)
5 Boys 5 3 (60) 1 (20)
Girls 7 4 (57,14) 2 (28,57)
6 Boys 6 3 (50) 2 (33,3)
Girls 4 2 (50) 1 (25)
7 Boys 5 2 (40) 1 (20)
Girls 4 2 (50) 0
8 Boys 4 2 (50) 1 (25)
Girls 6 4 (66,6) 1 (16)
9 Boys 6 3 (50) 1 (16)
Girls 5 3 (60) 2 (40)
10 Boys 5 3 (60) 1 (20)
Girls 5 3 (60) 1 (20)
11 Boys 7 5 (71,42) 2 (28,57)
12 Boys 7 4 (57,1) 2 (28,57)
Girls 4 3 (75) 1 (25)
1-12 years Boys 50 27 (54) 11 (22)
Girls 44 24 (54,5) 9 (20,45)
1-12 years Boys + Girls 94 51 (54,25) 20 (21,27)

Rwanda Journal Volume 22, Series B, 2011: Social Sciences 151
The results (table6) showed that the level of chronic malnutrition (stunting) was significantly higher (54.25%) as compared to acute malnutrition (underweight, 21.27%). This indicates that the nutri-tional intake currently consumed by the children in the sample has improved after having obtained land compared to the period of landlessness. In addition, the results showed that the variations between sexes are negligible; stunting (boys=54%, girls=54.5%) and underweight (boys=22%, girls =20.45%). This situation gives evi-dence to suggest that owning land has positive impacts on children’s nutritional status. It also confirms the previous positive impact of owning land on dietary diversity as many authors argued that house-hold’s dietary diversity is correlated to children’s nutritional status and growing (Ferguson et al., 1993; Onyango et al., 1998; Tarini et al., 1999; Arimond and Ruel, 2002).
5. Discussions and Conclusion
The present study gives evidence to suggest that owning land has positive impacts on household’s dietary diversity and children’s nutrition status as proxies of household’s food security. Comparing the dietary diversity before and after redistribution process, the results show that 54.1 % among of new landholders have acceptable diet diversity while none was in that category during their period of landlessness. However, there are still an important number of house-holds with severe poor diet diversity and moderate diet diversity even if this number has decreased after owning land. Furthermore, children have improved in weight but many of them are still stunted. This situation is not surprising because those families received land two years ago which is an insufficient period for them to improve in height.
To make land redistribution an efficient tool for food security, complementary policies may be needed. These interventions should be responsive to different clusters of the poor across the population. This issue has been raised by authors like Pellegrini and Dasgupta, 2009; Valente, 2009; Finan et al., 2005; Deininger, 2003; Thiesenhusen, 1995 by pointing out that if land reform is to be successful in ensuring a better standards of living for the recipients of land, government policies should be directed specifically to the small

Rwanda Journal Volume 22, Series B, 2011 : Social Sciences 152
farmers and at the barriers they have to overcome to increase the productivity of their lands. Those complementary policies should be:
• Agricultural extension Agricultural extension is one of the most necessary policies for beneficiaries’ ability to make productive use of the land acquired during land reform. Griffin et al., (2002), for example, has argued that in China redistributive land reform was complemented by policies such as improvement in agriculture‘s terms of trade, liberalization of output markets and improved access to inputs.
• Facilitation of access to credit for poorer beneficiaries Many studies argue that land reform should be complemented with access to market and credit, allowing for beneficiaries to be able to make productive use of land. Acknowledgements I am grateful to my supervisor Dr. Lorenzo Pellegrini for his guidance and support throughout the research process. I am deeply indebted to him. I also thank my reader Dr. Jan Van Heemst for stimulating comments of this paper.
References 1. Adams, M., & Palmer, R.( 2007). Independent review of land
issues (Vol.III). 2006-07: Eastern and Southern Africa, Oxfam (mimeo).
2. Bandeira, P.,& Sumpsi, J.M. ( 2009). Access to land and rural poverty in developing countries: theory and evidence from Guatemala. Universidad Politecnica de Madrid.
3. Barrett, C. B. (2002). Food security and food assistance programs. In Handbook of agricultural economics, ed. B. L. Gardner and G. C. Rausser, 2103-2190. Amsterdam: Elsevier.
4. Besley, T., Burgess, R. (2000). Land Reform, Poverty Reduction, and Growth: Evidence from India. The Quarterly Journal of Economics 115(2): 389-430.
5. Bigagaza, J.C.A., & Cecile Mukarubuga. 2002. “Land Scarcity, Distribution and Conflict in Rwanda,” in Scarcity and Surfeit: The Ecology of Africa’s Conflicts, edited by Jeremy Lind and

Rwanda Journal Volume 22, Series B, 2011: Social Sciences 153
Kathryn Sturman Pretoria, South Africa: Institute for Security Studies.
6. Boudreaux, K. (2009). Land Conflict and Genocide in Rwanda. The Electronic Journal of Sustainable Development (2009) I (3).
7. Christine, V. (2009). The food (In) Security Impact of Land Redistribution in South Africa: Microeconometric Evidence from National Data. The University of Nottingham, UK
8. Dasgupta, A. & Pellegrini, L. (2009). The impact of Tenancy Reform in West Bengal: Evidence the National Sample Survey. “The European Journal of Development Research 21(2): 231-249.
9. Deininger, K.,S. Jin & H.-K. Nagarajan (2007). Land reforms, Poverty and Economic growth: evidence from India: The World Bank, Policy Research. Working Paper Series. Washington, D.C.
10. Diamond, Jared. 2005. Collapse: How Societies Choose to Fail or Succeed New York: Penguin.
11. FAO (2005). The state of food insecurity in the World 2005: Eradicating World hunger, key to achieving the Millennium Development Goals. Rome: Food Agriculture Organization of the United Nations.
12. Ferguson, E., Gibson, R., Opare-Obisaw, C., Osei-Opare, C., Lamba, C. & Ounpuu, S. (1993) Seasonal food consumption patterns and dietary diversity of rural preschool Ghanaian and Malawian children. Ecol. Food Nutr. 29: 219– 234.
13. Gunhild, B., Tobias, L., Johannes, R. (2009). Far from Perfect? Impact Evaluation of Non- Experimental Donors Programs in Water Supply and Sanitation. Working Paper.
14. Hanstad, T., Brown, J., & Prosterman, R. (2002). Larger Homestead Plots as Land Reform? International Experience and Analysis from Karnataka, 37 ECON. & POL. Wkly. 3053.
15. Hatløy, A., Torheim, L. E. & Oshaug, A. (1998) Food variety—a good indicator of nutritional adequacy of the diet? A case study from an urban area in Mali, West Africa. Eur. J. Clin. Nutr. 52: 891–898.
16. Henri A.L. Dekker (2001). Property Regime in Kyrgyzstan; An investigation into the links between Land Reform, Food Security, and Economic Development. A Model to Assess the Effectiveness of Land Tenure Change.

Rwanda Journal Volume 22, Series B, 2011 : Social Sciences 154
17. Holden, S., & Yohannes, H. (2002). Land redistribution, tenure insecurity, and intensity of production: A study of farm households in southern Ethiopia. Land Economics, 78(4). 573-590.
18. Hoddinott, J. (2002) Measuring Dietary Diversity: A Guide. Food and Technical Assistance Project (FANTA), Washington, DC.
19. Hoddinott, J.& Yohannes, Y. (2002). Dietary Diversity as a Food Security Indicator. Food Consumption and Nutrition Division Discussion Paper, No. 136. International Food Policy Research Institute, Washington, DC.
20. Kumar, S. (1978): Role of Household Economy in Child Nutrition at low incomes: A case study in KERALA.
21. Lipton, M (2009): Land Reform in Development Countries: Property Rights and Property Wrongs. London and New York, Routledge.
22. Musahara, H. (2006). Improving land tenure security for the poor in Rwanda.
23. Musahara, H. & Huggins C., 2005. ‘Land Reform, Land Scarcity, and Post-Conflict Reconstruction: A Case Study of Rwanda’. In From The Ground Up: Land Rights, Conflict and Peace in Sub-Saharan Africa, eds C. Huggins and J. Clover, 269–77. Pretoria and Cape Town: Institute of Security Studies.
24. Ministry of Finance (2007). “2007 Government of Rwanda and Development Partners Retreat. Draft Report”. Kigali, Ministry of Finance and Economic Planning.
25. National Institute of Statistics of Rwanda (2006). Comprehensive Food Security and Vulnerability Analysis (CFSVA). Strengthening Emergency Needs Assessment Capacity.
26. National Institute of Statistics of Rwanda (2009). Comprehensive Food Security and Vulnerability Analysis (CFSVA). Strengthening Emergency Needs Assessment Capacity.
27. Onyango, A., Koski, K. G. & Tucker, K. L. (1998) Food diversity versus breastfeeding choice in determining anthropo-metric status in rural Kenyan toddlers. Int. J. Epidermal. 27: 484–489.
28. Pellegrini, L. (2009). Forest management in Bolivia, Honduras and Nicaragua: reform failures? Institute for Social Studies. The Hague.

Rwanda Journal Volume 22, Series B, 2011: Social Sciences 155
29. Pellegrini, L. & Dasgupta, A. (2009). Land Reform in Bolivia: The Forestry Question. International Institute of Social Studies of Erasmus University Rotterdam. The Hague.
30. Pottier, J. (2006). Land Reform for Peace? Rwanda’s 2005 Land Law in context. Journal of Agrarian Change, Vol. 6 No.4, October 2006, pp.509-537.
31. Prosterman, R., L. & Hanstad, T. (2006). Land Reform in the Twenty-First Century: New Challenges, New Responses. 4 Seattle J. Soc. Just. 763
32. Ruel, M. 2002. Is dietary diversity an indicator of food security or dietary quality? A review of measurement issues and research needs. Food Consumption and Nutrition Division Discussion Paper 140. Washington, D.C.: International Food Policy Research Institute.
33. Ruel, M. T. & Menon, P. (2002) Child feeding practices are associated with child nutritional status in Latin America: innovative uses of the Demographic and Health Surveys. J. Nutr. 132: 1180–1187.
34. Satish, C., & Charles, Y.(2002). Land tenure and productivity: Farm level evidence from Papua New Guinea.
35. Shipton, P. (1990). “African Famines and Food Security: Anthropological Perspectives”. In annual Review of Anthropology, 1990, pp.353-394.
36. Sikor, T. and D. Muller (2009). “The limits of State-led and Reform: An Introduction”. World Development, 37(8), 1307-1316.
37. Thiesenhusen, W(1995): Broket Promises: Agrarian Reform and the Latin American Campesino. Westview Press, Co.
38. Tarini, A., Bakari, S. & Delisle, H. (1999). The overall nutritional quality of the diet is reflected in the growth of Nigerian children. Sante 9: 23–31.
39. Udry, C., Hoddinott, J., Alderman, H. & Haddad, L.(1995). Gender differentials in farm productivity: Implications for household efficiency and agricultural policy. Food Policy, 20(5), 407-423.
40. Wiesmann, D. 2006. A global hunger index: Measurement concept, ranking of countries and trends. Food Consumption and

Rwanda Journal Volume 22, Series B, 2011 : Social Sciences 156
Nutrition Division Discussion Paper 212. Washington, D.C.: International Food Policy Research Institute.
41. Wiesmann, D., I. Schöninger, A. K. Sost, H. Dalzell, S. Collins, L. Kiess, and T. Arnold. 2007. The challenge of hunger 2007. Bonn, Germany; Washington, DC; and Dublin, Ireland: Deutsche Welthungerhilfe, International Food Policy Research Institute, and Concern.
42. World Health Organization (1995) Physical Status: The Use and Interpretation of Anthropometry. WHO Technical Report Series. WHO, Geneva, Switzerland.
43. WHO, Child Growth Standards (2006): Length/ Height-for-Age, Weight-for-Age, Weight-for-Length, Weight-for- Height and Body Mass Index-for-age: Methods and Development. Geneva, Switzerland: World Health Organization.
44. World Bank. (2005). "World Development Report 2006: Equity and Development." Washington, DC: The World Bank and Oxford University Press.
Rwanda Journal Volume 22, Series B, 2011: Social Sciences 157
‘Rwanda Journal’ publishes the following four series:
Series A: Arts and Humanities 1. Fine and performing arts 2. Mass communication &Media
studies 3. Language and Linguistics 4. Information Studies (Library,
archives, …) 5. History 6. Religion 7. Psychology
etc
Series B: Social Sciences 1. Political Sciences 2. Sociology, Social Work 3. Education 4. Human resources, Administration 5. Management & Business studies 6. Economics 7. Gender Studies 8. Peace and Conflict Studies 9. Psychology
etc Series C: Mathematical Sciences
Engineering and Technology
1. Mathematics 2. Statistics 3. Computer Science 4. All branches of Engineering 5. Applied Physics 6. Technology, ICT, Geographic
information Sciences (GIS) 7. Theoretical Physics 8. Electronic Sciences 9. Biotechnology, Bioinformatics, Biometrics, Biostatistics, etc
Series D: Life Sciences and Natural Sciences
1. Biological Sciences 2. Chemistry 3. Physical Sciences 4. Geography 5. Earth Sciences, Forestry, GIS 6. Biotechnology, Bioinformatics, Biometrics, Biostatistics, etc
Series E: Agricultural Sciences, Environment and Veterinary Medicine
Series F: Medical Sciences, Pharmacy, Mental Health and Public Health
Series G: Law
Authors have the right to specify in which series they think their articles fit best.