ASSESSMENT OF TRADE FAIR PERFORMANCE - Aaltodoc
84
ASSESSMENT OF TRADE FAIR PERFORMANCE An application of fuzzy-set/ qualitative comparative analysis Master’s Thesis Ha Trinh Aalto University School of Business Marketing Program Fall 2019
-
Upload
khangminh22 -
Category
Documents
-
view
3 -
download
0
Transcript of ASSESSMENT OF TRADE FAIR PERFORMANCE - Aaltodoc

ASSESSMENT OF TRADE FAIR PERFORMANCE An application of fuzzy-set/ qualitative comparative analysis
Master’s Thesis
Ha Trinh
Aalto University School of Business
Marketing Program Fall 2019

Aalto University, P.O. BOX 11000, 00076 AALTO
www.aalto.fi
Abstract of master’s thesis
Author Ha Trinh
Title of thesis Assessment of Trade Fair Performance – An application of fuzzy-set/ qualitative
comparative analysis
Degree Master of Science in Economics and Business Administration
Degree programme Marketing
Thesis advisor(s) Elina Koivisto, Tomas Falk
Year of approval 2019 Number of pages 80 Language English
Abstract
This thesis is an extension in the literature stream of trade fair performance assessment in which
the relationship between marketing efforts and performance outcomes is studied. The study starts
with literature review on trade fair’s performance measurement and then it presents the conceptual
framework grounded in Resource-Based View. This is an application of an alternative research
methodology, Fuzzy-Set/ Qualitative Comparative Analysis to study performance assessment of
Business-to-Consumer trade fairs. An extensive online questionnaire was sent to trade fair
exhibitors’ contacts provided by Finnish Trade-fair Association (Messukeskus), to collect the data
of trade fair’s marketing inputs and outcome measures. During the data processing phase, outcome
and conditions were justified and calibrated then analyzed in R studio. As results, the thesis delivers
two causality model solutions of High-performance outcome and Low-performance outcome at
trade fairs. The discussion deliberates the insights from the solutions to document best practices in
coordinating trade fair’s resources. In addition, the study emphasizes the importance of objective
settings to achieve expected performance and promotes the application of FS/QCA in marketing
performance studies.
Keywords trade fair, trade fair performance, fuzzy set, qualitative comparative analysis

i
TABLE OF CONTENTS
1. INTRODUCTION............................................................................................................ 1
2. RESEARCH BACKGROUND ....................................................................................... 4
2.1. Tradeshow Exhibition as a Marketing Phenomenon ................................................. 4
2.1.1. Tradeshow Objectives ............................................................................................ 5
2.1.2. Tradeshow performance measuring ....................................................................... 9
2.2. Resource-Based View Theory ................................................................................. 10
2.3. Conceptual Framework ............................................................................................ 18
3. EMPIRICAL RESEARCH ........................................................................................... 20
3.1. Methodology ............................................................................................................ 20
3.2. Data Collection ........................................................................................................ 25
3.3. Data Analysis ........................................................................................................... 42
3.4. Results ...................................................................................................................... 43
4. DISCUSSION ................................................................................................................. 52
5. MANAGERIAL IMPLICATION ................................................................................ 57
6. LIMITATION ................................................................................................................ 58
REFERENCES ....................................................................................................................... 59
APPENDIX ............................................................................................................................. 64

ii
LIST OF FIGURES
Figure 1. Stages of Marketing Performance Process ............................................................... 12
Figure 2. Conceptual Framework ............................................................................................ 19
Figure 3. Outcome Calibration ................................................................................................ 32
Figure 4. Fair Engagement Calibration .................................................................................... 37
Figure 5. Staffing Calibration .................................................................................................. 38
Figure 6. Booth staff's capability calibration ........................................................................... 40
LIST OF TABLES
Table 1. Comparison between Conventional Research and Comparative Research ............... 21
Table 2. Different Types of fuzzy sets ..................................................................................... 24
Table 3. Sample Description .................................................................................................... 26
Table 4. Initial Conditions ....................................................................................................... 29
Table 5. Outcome Calibration .................................................................................................. 31
Table 6. Preparation Time Calibration ..................................................................................... 33
Table 7. Booth Theme Complexity Calibration ....................................................................... 34
Table 8. Booth Design Competitiveness Calibration ............................................................... 35
Table 9. Fair Engagement Calibration ..................................................................................... 36
Table 10. Staffing Calibration.................................................................................................. 38
Table 11. Booth Staff's Capability calibration ......................................................................... 39
Table 12. Staff training calibration .......................................................................................... 41
Table 13. Information Gathering Focus calibration ................................................................. 41
Table 14. Configurations of High-Performance Outcome ....................................................... 44
Table 15. Configurations of Low Performance Outcome ........................................................ 48
1
1. INTRODUCTION
The purpose of this chapter is to provide the audience a summary of topic’s background,
main objectives of the research and its contribution to the research stream of trade-fair
marketing. For several years, companies have known that trade-fair exhibition is a
powerful marketing instrument to promote company’s offerings to potential customers
visiting the fair (Kerin & Cron, 1987). According to recently published data from UFI (The
Global Association of the Exhibition Industry) on global economic impact of exhibitions,
in 2018, global exhibitions generate total direct spending, including all direct spending by
exhibitors and visitors, of about €116 billion and total direct GDP of €69 billion, making
exhibitions 72th largest sector in the world. In terms of participants, the activity involve
about 4.5 million exhibitors and 303 million visitors across more than 180 countries (The
Global Association of the Exhibition Industry, 2019). The statistics in 2018 from the same
report also indicates that North American ranks first in direct spending (44% of global
market) and number of exhibitors (35% of global market) while Europe ranks first for
number of visitors (37% of global market). Perhaps, among the business sectors who
attend trade fairs as exhibitors, the activity has become the most popular and also most
important for industrial companies those who has the tendency to rely more heavily on
personal selling than other forms of promotion. In fact, trade fair is only behind personal
selling in its impact on buying decisions in industrial context (O’Hara, 1993). In addition,
recent data shows that industrial firms could allocate up to 20% of their total marketing
budget for trade-fairs, making fair exhibition the most important element in their marketing
plan followed by digital advertising and content marketing (Tafesse & Skallerud, 2017).
Due to this reason, literatures in past years have mostly studied industrial firms in the
context, leaving a shortage on B2C tradeshow studies. In fact, in 91 tradeshow articles
from 1980 to 2014 which were reviewed by Tafesse & Skallerud (2017), 30% were
published by Industrial Marketing Management and Journal of Business & Industrial
Marketing. Previous researches also highlight fair marketing as a tool for personal selling
because it sets up the shared environment for sellers and buyers meet and discuss what
seller have to offer and what buyers are willing to buy. Furthermore, trade-fair is believed
to be efficient for lead management since it allows company to approach qualified sales
leads with clear interests in the category that companies operate within. However, the
result from fair exhibition still greatly depends on how exhibitors leverage their resources

2
to optimize the performance of tradeshow and to generate qualified leads to follow-up
afterwards (Rosson & Fairs, 2001).
With the changing environment of technology and fierce competition landscape,
companies are now required to focus on and justify marketing ROI (Return-on-Investment)
in their actions to optimize their investment for achievable and measurable returns. This
shift in marketing makes it substantially dissimilar from the situation in the past when
marketing is mainly about companies betting on their creative ideas, coming up with their
“best-guess” campaigns and they only could evaluate the effectiveness of the past
campaigns based on ambiguous relationship between investment and business results. At
the same time, marketing witnesses the change in the importance weight of digital
marketing due to not only the penetration of internet and social media but also because
both investment and return could be quantified and recorded to help companies plan, learn
and improve their investments. On the other hand, there remains a big part of marketing
activities that is not that straight forward to be quantified and analyzed such as brand
building activities but managers are still requested to justify the investments. This research
on trade fair performance does not aim to quantify the investment and return on the
activities as for many companies, this activity has shifted focus to long-term objectives
such as image building rather than pure business transactional driven. However, this thesis
is an effort to use quantitative method to identify the best practice in terms of resource
allocation to deliver good performance outcome from their exhibition.
The research is an extension in the stream of trade fair performance assessment where the
relationship between marketing efforts and performance outcome are studied with the use
of quantitative methodology (Gopalakrishna & Williams, 1992; Hansen, 2004; Ling‐yee,
2007; Seringhaus & Rosson, 1999). First contribution of this thesis to the literature stream
on trade fair performance is its application of an alternative research methodology, Fuzzy
Set / Qualitative Comparative Analysis, to study trade fair marketing best practice. This
method is not unknown in social studies but has not yet been applied in studying trade fair
marketing performance and it offers the allowance of combining qualitative case study
with quantitative method. As a result, the study creates an applicable model of trade-fair
marketing performance from the resource-based perspective and marketing engineering
approach to help businesses achieve positive performance outcome for their trade-fair
marketing investment. In addition, this thesis marks an attempt to take closer look in B2C

3
(business-to-consumers) trade fairs, which receives questions regarding their effectiveness
as a marketing activity compared to others favorable touch-point to reach consumers such
as digital marketing, traditional media and retail.
The thesis starts with Literature review section, which discusses trade-fair marketing and
related marketing themes that altogether shape the direction for the research. Since this is
an exploratory research, no hypotheses are presented or to be confirmed; in contrasts, the
author explores the previous works in searching for possible marketing inputs, as known as
conditions in FS/QCA method to develop the questionnaires. Also, as FS/QCA still lacks
popularity compared to conventional quantitative method in marketing research, the
following methodology section provides an overview of the method in details, in
comparison with the more popular quantitative methods. Later, the data collection chapter
documents the research process to finalize in the model results for Good Performance
outcome as well as for its Negation. The discussion chapter is a summary of best practice
that is suggested by finding results, followed by managerial implication and limitation of
the study.

4
2. RESEARCH BACKGROUND
2.1. Tradeshow Exhibition as a Marketing Phenomenon
Trade fair, also known as trade show, exposition or convention, is a type of marketing
event where a group of businesses including manufacturers, distributors, service providers,
in one location and during a short time period, gather to set up physical exhibitions to
present their company and offerings to public (Herbig, O’Hara, & Palumbo, 1997). Since
this type of marketing event is originally formed to serve the purpose of creating a market
place and stimulating business transactions (Tafesse & Skallerud, 2017), trade fair in
academic studies has been often reviewed through personal-selling framework. According
to Gopalakrishna and Lilien (1995), trade fair is conceptualized into three stages based on
the flow of visitor traffic to reflect the industrial multi-stage selling process: Booth
Attraction, Salesperson Interaction and Lead Generation. Each step is consisted of certain
activities serving separate purposes but, at the same time, they are combined together to
optimize outcome performance. According to this model, the intention of pre-show
activities is catching visitor attention, driving visiting traffic to the fair and to the
company’s specific booth. Next, At-show activities develop visitors’ interest in the
exhibitor and their offerings via numerous communications and interactions between the
company and potential customers. At last, the loop is completed with Post-show activities
to advance customer interests into purchasing intention. Although it offers a generic
picture of trade fair that applies to several exhibitors, this model only captures the process
of generating qualified leads as final outcome and neglect other dimensions of tradeshow
performance (Tafesse & Skallerud, 2017). However, there have been studies trying to
generalize Tradeshow Performance as a construction from different marketing areas; as an
example, Hansen (2004) used structural equation modeling to explain Tradeshow
performance as a construct of sales-related activities, information gathering activities,
relationship-building activities, image building activities and employee motivation
activities. This framework is also cited by other literatures to explore the importance of
tradeshow in aspects other than sales generation such as information gatherings at and
post-show or data analysis after show (Bettis-Outland et al., 2010; Ling-Yee, 2007).
Generally, Trade fair’s benefits for exhibiting participants include sales promotion,
relationship building, company image enhancement and knowledge exchange (Blythe,

5
2002; Ling-Yee, 2006). To exhibitors, the benefits, or objectives can certainly be broken
down into sub-categories as the guidance for deploying marketing resources effectively
and efficiently to achieve the expected returns. Previous literatures investigate several
categories of trade fair’s benefits for exhibitors in order to answer the question that
companies are all interested in: “Why exhibit?”; but again the academy is still searching
for an comprehensive answer instead of fragmented themes (Tafesse & Skallerud, 2017).
To arrive at the answer, many researchers reshape the questions into “What objectives”
and the measurement of objective achievement answers if investments on exhibition are
worth it.
2.1.1. Tradeshow Objectives
Before making the decision to implement any marketing activities, including the
participation as exhibitors in any trade fairs, companies need to clearly define the
objectives they aim to achieve as the outcome of the activities. Setting good objectives in
business class is equivalent to using S.M.A.R.T method, which stands for Specific,
Measurable, Attainable, Realistic objectives within defined Timeline. However, in
practice, several companies fail to set the objectives that match those criteria or neglect in
measuring the objectives after the show (Blythe, 2000; Gopalakrishna & Lilien, 1995).
Similar to company strategic objectives, tradeshow objectives differ among companies due
to various factors such as the brand visibility on the market, the nature of marketplace or
the penetration level of product category (Gopalakrishna & Lilien, 1995). This is also
mentioned by Cavanaugh (1976) that companies need to consider several areas when
setting the objectives for tradeshow: the purpose for exhibition, the target prospects, the
show typologies, target effectiveness, marketplace competition and project budget.
As previous literature attempts to categorize trade fair’s objectives, it is suggested that
objectives differ among typologies of trade fairs. The fairs can be classified by
participants’ industrial profiles such as vertical and horizontal shows, or by visitor profiles,
B2B or B2C shows (Tafesse & Skallerud, 2017). In vertical trade fairs, where the product
range is relatively narrow and specific so as visitor profiles, it might be more relevant for
attending companies to set sales-related objectives since the lead efficiency is expected to
be higher than in horizontal shows where visitors have diversified interests. While any
marketers would need to tailor the marketing efforts and allocation of resources to target
6
different customer groups and to achieve dissimilar objectives, trade-fair managers would
face the same challenges to allocate marketing resources differently when the company
attend different fair typologies. In addition, trade fair objectives of specific exhibitor vary
according to the company’s directional strategy and their focus at certain timings. For
instance, when a company has recently launched a new product or service, most of
marketing campaigns and trade fair’s efforts are likely to centralize to promoting new
products. In the other phases of main product’s life cycle, exhibitors could possibly attend
the fair to maintain visibility and competitiveness against competitors. Overall, setting
well-defined objectives is fundamental for companies’ performance at trade fairs since the
objectives are the starting point and the driver of how companies invest their efforts,
implement activities and measure the performance of the exhibition. The following section
provides a review of popular trade fair activities that are witnessed in exhibitions and the
activities are group in the themes which are strongly driven by the objectives.
Several studies have attempted to construct the framework for trade-fairs; among them,
Hansen (2004) introduces moderately comprehensive picture of trade fair based on five
key aspects of the marketing event: sales-related activity, image-building activity,
relationship-building activity and motivation-building activity. This model links closely to
the objectives of trade fair and also represents how the objectives could be categorized;
therefore, it seems to be more comprehensive than the renowned three-stage model
(O’Hara, 1993) which is mostly relevant for personal-selling-focused fairs. While three-
stage model divides the event horizontally by its timeline and reviews the activities in each
phase: pre-show, at-show and after-show following the pipeline of lead conversion funnel,
Hansen’s (2004) model ignored the timeline and divided the show based on its marketing
objectives that could be seen throughout the process. To review the main objectives and
also main activities of trade fairs, this thesis uses Hansen’s (2004) model but leaves out
employee motivation and customer relationship building from its scope, as B2C trade-fairs
in the context place less emphasis on these two objectives in their fair participation.
Sales-related objectives
One type of exhibitors’ main activities in trade-fairs, sales-related activities involve selling
during and after the fair. Therefore, besides sales transactions happening at the fair, this
dimension also includes activities that are related to the sales process such as lead
generation, new product and demand evaluation. Previous literatures often measure sales-

7
related outcomes using “hard measures”, or numerical measures, such as number of leads,
exhibit attraction efficiency (Gopalakrishna & Williams, 1992), number of contacts,
number of sales transactions, time to secure sales, cost per lead (Seringhaus & Rosson,
2004). The usage of hard measures is supported also in practice where managements often
use quantified index to keep track of their sales teams’ performance. On the other hand, the
application of “soft measures” enables researchers to evaluate the outcome from the
perspective that cannot be precisely quantified for example educating customers or testing
customer reaction to new products. Overall, the sales-related objectives could be grouped
into four categories: new customer prospecting, realizing business transaction, product or
service promotion and customer retaining. As the names explain, these objectives are all
sources of growth that sales and profit-driven companies would aim at, either inside or
outside of the scope of trade fair marketing. Even though trade fair has been evolved from
the early stage and it is not mainly about personal selling and business transaction driven,
the phenomenon is undeniably the medium with high lead conversion rate as the visitors
attending the shows have certain level of interests in exhibitors’ offerings. When
companies are targeting the customers at this interest-level of purchasing funnel, sales-
related objectives are highly relevant and should be considered as the driver for exhibition
activities.
Brand-building objectives
Certainly, enhancing or defending company image is one of the key objectives for
participating in tradeshow exhibition. Key motives for this activity include competitive
pressure, customer expectation and image establishment (Hansen, 1999). Many companies
have reported to attend tradeshows because the key competitors in the industry participate
and visibility absence from such show might lead to losing brand image competitiveness
and disappointing customer expectation, especially in the case of bigger companies.
However, for smaller companies, tradeshow is effective in promoting brand images and
companies who set image promotion as an objective have better tradeshow performance
than companies with only sales and leads generation objectives (Tanner, 2002). To succeed
in building company image at tradeshow, besides sustaining a competitive display with
competitors that reflects the brand image and positioning (Gilliam, 2015), exhibitors need
to focus on market communication in general and leverage press publicity (Hansen, 2004).

8
Building a brand image cannot be accomplished by any single marketing activity; instead,
it requires a long-term coordination of several, integrated marketing communication
efforts, in which tradeshow participation is one of the blocks. This is aligned with
integrated marketing communication (IMC) literatures that image building is always a
critical objective for IMC strategy. Any communications within IMC deployment should
aim at simultaneously developing or establishing an image (Phelps & Johnson, 1996).
Without the memorable image, companies are unable to be remembered by the customers,
thus it makes the image one of the most important metrics for marketing performance.
Information Gathering Objectives
Information Intelligence is the topic that receives tremendous attention in recent years
regarding how companies gather and get use of collected information to support decision
making. As a channel to get interaction with several contacts in the industries, tradeshow
provides various ways an exhibitor can gather information about new products, industry
trends, competitors, and customers (Hansen, 2004). Tradeshow is a place where
professional and experts in the industry gather, thus companies can learn a lot from
industry’s opinion leaders and through peer discussions between employees. Furthermore,
when we look at all visitor traffic as a mini simulation of the marketplace, it is one of the
most effective ways to talk to customers, discover what they think and react to a new
product offering. In order to conceptualize the return on tradeshow information, Betis-
Outland (2010) categorized tradeshow information by the timing the information is
acquired and the dissemination of information to be used in the organization. This study
suggests that there is a direct relationship between the use of information by members of
organization and the return on tradeshow information, and that the usage of information
depends the significance of information’s perceived quality.
In a study of relationship between integrated marketing communication, market orientation
and brand orientation, Reid et al. (2005) proposed the inter-functional coordination which
creates the link between IMC and Market orientation. The term provides a description of
the information dissemination among internal functions in order to prepare business
strategies as well as to coordinate and integrate activities across departments. In the other
words, information gathering is a shared activity between cross functions, and information
collected during tradeshow should be and need to be shared and used in coordination with
information gathered from other sources. As information gathering and analysis at trade

9
fair and in general of marketing function is substantially important pillar of marketing
process, especially at this time era of data-driven business, companies should have a
clearly defined framework to collect and make use of data to transform information into
organizational knowledge (Reid, Luxton, & Mavondo, 2005).
2.1.2. Tradeshow performance measuring
Even without a clear answer regarding return on investment of tradeshow, many marketing
managers are willing to invest a portion of their limited budget in tradeshow exhibition,
making tradeshow performance an attractive topic for marketing scholars who seek to
measure and optimize exhibition’s performance. Several efforts are dedicated to this topic;
of all 91 tradeshow literatures during the period 1980 – 2014 reviewed by Tafesse (2017),
there are 40 studies concentrating on tradeshow performance. The review also observes
that Resource-Based View (RBV) has become increasingly popular in recent years for
tradeshow performance studies; between 2005 and 2014, there are four studies using RBV
as conceptual framework, bringing RBV to the top three theories most influencing
tradeshow studies.
Measuring tradeshow performance is the topic that has received tremendous attention of
researchers over the years due to its pragmatism in business. Even though there have been
many works in this study stream, researchers still cannot arrive at a synthesized conclusion
measuring tradeshow effectiveness (Tafesse & Kitchen, 2017). To summarize researches
in measuring tradeshow outcome, previous literatures can be divided in two tracks of
measuring sales-related outcomes and behavioral-related outcomes (Hansen, 2004).
Traditionally in the past, when direct selling was one of the main objectives for many
tradeshow exhibitions, selling outcomes received huge interests from researchers. Selling
outcomes are measured via metrics such as booth attraction efficiency, booth conversion
rate, lead efficiency and actual sales (Tafesse & Korneliussen, 2013). However, in the
recent years, the focus has been shifted to behavioral-related outcome, as to marketing
managers, tradeshow is more of a long-term investment rather than yielding immediate
returns. Hansen (2004) suggested that sales-related outcome is not an appropriate measure
for the tradeshow exhibitors who takes non-selling activities more important than selling
activities.

10
Another way to summarize trade fair’s performance studies is distinguishing studies using
soft measures vs. hard measures. While hard measures are objective, it cannot capture a
number of outcomes that cannot be quantified, many researchers decided to adopt both
measures. Seeking the most generalization method to measure the tradeshow, we see that
there are not many studies that evaluate the performance fully. Instead, several studies
focus on the sales-related measures while others might only address the measures for a
specific perspective such as relationship-building (Ling‐yee, 2006). However, as
tradeshow performance is multidimensional, the model proposed by Hansen (2004)
appears to be the fullest solution to measure this variable.
Hansen’s (2004) study adopted marketing control system theory to develop construct of
tradeshow performance that reflects both outcome-based and behavior-based control
system taxonomy. Using soft measures, Hansen (2004) proposed a Trade Show (TS)
Performance model of five dimensions: Sales-related, information-gathering, image-
building, relationship-building and motivation activities. Selected five dimensions have
been supported theoretically in other tradeshow literatures and model construction
reliability is tested through empirical research.
2.2. Resource-Based View Theory
Simply defined, firm’s resources are what the firms possess and rely on to achieve the
objectives of the business. The RBV Theory (Resource-Based View) is grounded from the
business approach that firms utilize the Resources under their controls including all assets,
capabilities, processes, knowledge, information, etc. to develop and implement business to
improve business performances (Barney, 1991). Even though some RBV literatures refer
to Resources as Assets and thus provide the understandings of resources as exclusive from
capabilities, this study uses the general term “Resources” to cover all the possessions listed
in the above definition, including capabilities. According to several researchers, Resource-
Based Theory has received attentions and applications in different aspects of business
management literatures such as finance, supply chain management, marketing. Even
though Resource-Based Theory has reached maturity as a theory, its framework is still
applicable in many contemporary researches (Barney, Ketchen, & Wright, 2011).

11
A number of previous performance studies are centered by RBV theory, guiding the
businesses to take full control of their resources by having a thorough understanding of
internal strengths and weaknesses as well as analyzing market’s intelligence to develop the
strategy for the achievement of performance objectives (Morgan, Clark, & Gooner, 2002).
However, another question besides achieving the objectives is how the firm can sustain the
competitiveness and even get ahead of competitors when the same resources could be
acquired by other players in the market. To answer this question, RBV suggests the
importance of resources in creating and sustaining Competitive Advantages (Barney et al.,
2011). The theory proposes that some resources are more important in generating
competitive advantages for the firm than others, depending on their potentials to facilitate
superior value offering to customers, whether they could be imitated by competitors
(Hooley et al., 2005). If we take a look at each type of resources, we see that while Assets,
or physical asset can be traded, transferred and financially quantified, thus could be
imitated by competitors; capabilities, on the other hand, are intangible and difficult to be
imitated (Day, 1994), hence they are more sustainable resources for the firm. The below
quoted a good declaration of what capability means for businesses.
“Assets are the resource endowments the business has accumulated (e.g.,
investments in the scale, scope, and efficiency of facilities and systems, brand equity, and
the consequences of the location of activities for factor costs and government support); and
capabilities are the glue that brings these assets together and enables them to be deployed
advantageously” (Day, 1994, p.38)
Simply explained, capability tells how a company, at different levels, coordinate different
resources, including assets, information, and knowledge to gain the advantages over
competitors and achieve performance objectives. Firm’s capabilities are developed through
employee’s experience in integrating their skills and knowledge to convert input into
outputs or resources to outcomes. As they are constructed by several factors of time,
humans and contexts, capabilities are unique and is difficult to transfer or imitate (Vorhies,
1998). The linear process of marketing performance stages below by Morgan, Clark and
Gooner (2002) described the coordinating role of Capabilities for performance
achievement. Also, in this model, different levels of capabilities are listed, in ascending
order of generalization, such as individual employee’s capability, single-tasks related
capability achieved through routine, specialized capabilities in certain areas, function’s or

12
department’s capabilities and finally the capability shared throughout the organizations. It
is observable that in this era that we are living in, where the capitals, knowledge and skills
are fixed, transferable or obtainable, Capabilities are among of the best sources for
competitive advantages due to its complexity and the involvement of human factors.
Figure 1. Stages of Marketing Performance Process
(Morgan et al., 2002, p.367)
Marketing capabilities as firm’s strategic resource
Hooley et al. (2005) used the term “Marketing Resources” to capture the resources that
create value in the market place in which the firms offer their products or services. Similar
to the definition of firm resources, marketing resources can be assets, processes,
capabilities, attributes, knowledge and information that enables the generation of
competitive advantage in the market. Aligned with this definition, Ngo and O’Cass (2012)
used marketing resources referring to the resource that a firm owns related to marketing
mix activities: product, distribution, promotion, and price. On the other hand, Marketing
Capability is understood as the ability to execute marketing activities, as the companies’
medium to convert marketing resources into expected marketing outcomes (Ngo &
O’Cass, 2012). This definition of Marketing Capability is similar to the Marketing
Response model in the definition of marketing engineering approach (Lilien &
Rangaswamy, 1998). The Marketing Engineering approach highlights the importance of

13
the mean to convert marketing inputs to marketing outcomes; and this mean is a model
simulating how inputs are combined and interact with each other to produce the outcome.
Explaining the approach backward, if we want to understand how to achieve an outcome,
we need to understand how marketing response model work, to select and coordinate the
needed inputs for that.
If Capability should be viewed in different level of the firms, and Marketing Capability is
seen as specialized capability, then a firm’s Marketing Capability could be broken down
into different types of capability such as Pricing, Product Management, Distribution
Management, Marketing Communication, Selling, corresponding to the pillars of
Marketing Mix. On the other hand, if we view marketing capability at the task-level, there
are two generalizations of tasks that are credential in bringing all specialized tasks
together, coordinating them effectively and efficiently: Planning and Implementation.
Marketing Planning and Marketing Implementation capabilities are said to be the more
valuable and imperfectly imitable capabilities as they are knowledge-based and process-
based growing and changing together with “know-how” expansion (Morgan, Vorhies, &
Mason, 2009).
Furthermore, while marketing planning and marketing implementation are two crucial
tasks for marketers, the two themselves cannot complete a circle of marketing process.
Indeed, after planning and implementation, marketers always need to measure the
performance of certain activities, to evaluate if everything was done right, effectively and
efficiently as the plan. Because it is a circle, the capability to measure marketing
performance definitely affect the capability of planning and thus of marketing
implementation. Apparently, companies have their own ideas of which capabilities are
their key concentration that enables their competitive advantages vs. competitors. At the
same time, it is a challenge for companies to coordinate and arrange their firm’s resources
and capabilities to optimize sub-level resources and capabilities needed for different levels
of the business, such as different functions, different campaigns, and different product
lines. (Morgan et al., 2002)

14
Marketing Planning Capability
By definition, Marketing Planning capability enables the firms to coordinate resources and
capabilities to deliver optimize business objectives (Morgan, Zou, Vohries, & Katsikeas,
2003). And marketing planning capability is directly driven by the firm’s knowledge base
of internal experiential knowledge and external informational knowledge. Any firm would
aim to acquire both experiential knowledge of individual employees and the firm’s
accumulated experiences; and these are used altogether in the marketing planning process
to design the blueprint for activities. Depending on organizational arrangement, some
companies have central Marketing Planning team who works on the high-level strategic
planning to connect the marketing specialists in different areas together and to the other
functions of the company. However, marketing planning is also embedded in any
marketing functions as the day-to-day job for marketers before they implement the
activities to make sure the activities supports business objectives and are executed
efficiently in comparison with the past experiences, existed resource and competitive
landscape. Planning and execution are not separate steps on a linear process but instead it’s
a cycle of marketing where the output of planning is input for implementation and vice
versa. The output of implementation transforms into the firm’s knowledge bank as a part of
planning capability to continuously revise and improve firm’s strategies and
implementations.
Marketing Execution Capability
Marketing Implementation capability concerns the ability of the firm to perform marketing
routines to translate marketing strategies into actions (Morgan et al., 2003). In addition, it
should be noted that marketing capability directly has impacts on campaign effectiveness
(Ngo & O’Cass, 2012). Even though in this 2012 study, the authors only looked into media
campaign, it’s expected that the implication is valid for other types of marketing
campaigns.
Marketing resources can be categorized into Market-based resources and Marketing
Support Resources. Market-based resources is used immediately to generate or maintain
competitive advantage in the market (Hooley et al., 2005); its typologies often discussed in
marketing literatures are Customer-liking capability, Market Innovative capability, Human
resources asset, Reputational asset. On the other hand, Marketing support resources
support the acquisition and deployment of market-based resources. It is consisted of the

15
firm’s marketing culture and capability of management to deliver marketing operation
excellence (Hooley, Greenley, Cadogan, & Fahy, 2005)
Hooley et al. (2005) also proposed the relationship between managerial capability and the
competitiveness level of a firm’s Market-based Asset. A firm with highly capable
management certainly has advantage in the development of not only human resource asset,
company reputation but also customer-liking capability and firm innovativeness. While
market-based resources are most relevant at the firm’s strategic level, at the campaign
level, it is also likely to be channeled direct resources and supporting resources. Similar to
market-based resource, campaign level direct resources are used to directly generate an
edge over competitors. Supporting resource are the underlining and supporting force to
enable enhance the acquisition or deployment of direct resource (Hooley et al., 2005).
Grounded in Resource based view, in recent years, many researchers have been interested
in marketing-related capabilities as an integrative process to convert marketing resources
input to market-related outcomes (Day 1994). For instance, the study of Ngo and O’Cass
(2012) supported that marketing capabilities create the positive impact on the firm
performances. It has also been discussed in other literatures that the capability to deploy
firm resource to maintain market competitiveness explain the variance in firm’s
performance over time (Ngo & O’Cass, 2012).
Integration of Marketing Planning and Implementation
As marketing planning and marketing implementation are both part of marketing cycle,
this cycle requires the integration of these two phases as well as the integration among the
smaller constructs within each phase. Integration ensures the synchronization of individual
activities, smoothly transform the output of one activity into resources for other activity
and hence to optimize the operational results of marketing function. In a broad concept, it
is referred to as Integrated Marketing Communication (IMC), the marketing restructures
that key marketing or marketing communication disciplines merge together, requiring
synchronization of individual activities (Schultz, Don E. ; Tannenbaum, Stanley I. ;
Lauterborn, 1993).

16
Despite the difficulties to quantify the impact of IMC on firm’s performance outcome,
marketing literatures have supported the positive relationship between the two variables.
Reid et al.’s (2005) study showed that IMC performance is directly and positively related
to market performance of the firms in terms of Brand advantage, Customer Satisfaction
and Sales Performance. It also suggested that Integrated Marketing could be categorized
into Strategic and Tactical processes: strategic dimension focusing on long term objectives
and tactical level referring to the campaign level communication to achieve short-termed
goals. This framework also responses to the two marketing functions that are discussed:
Marketing Planning outlining strategy direction and Marketing Implementation aiming for
specific short-termed objectives.
A firm’s capability to perform marketing planning and implementation activities as well as
the capability to integrate and synchronizes those individual activities within the big
picture is key driver for outstanding performance outcome. Luxton et al. (2015) mentioned
that marketing manager needed to be able to evaluate their integrated marketing capability
and ensure the company’s IMC competitiveness in the market since this capability had
positive impact on the campaign effectiveness, market performance of the brand and
indirect influence on the financial performance. This evaluation should take into
consideration of performance in each individual activity and the performance of
information synchronization within the parts.
Tradeshow Resources and Capabilities
Marketing execution is enabled by different types of resources including firm’s strategic
resources and campaign resources. Business performance at trade fairs are also affected by
strategic resource level as Ling-Yee et al. (2007) suggested the firm’s strategic resources
such as customer-liking capability, partnering capability, managerial capability impacted
tradeshow performance through the stages of the fair. Positively affecting both pre-show
promotion and at-show selling process, Customer-liking capability refers to the firm’s
capability to understand customers’ needs and wants as well as to develop customer
relationship (Hooley et al., 2005). Partnering capability, on the other hand, refers to the
firm being able to develop and maintain good relationship with strategic partners and
industrial networks (Srivastava et al., 1998), thus more likely to involve preshow
promotion. At last, managerial capability enables cross-functions to coordinate effectively,
hence enables post-show follow-up which often requires coordinated efforts from different

17
departments. Extending this direction to study firm’s strategic resources, there is an open
question regarding the impact of firm’s IMC capability on tradeshow performance.
At campaign level, the resources enabling tradeshow execution are also contributed by
different functions. Ling-Yee et al. (2007) adopted three-stage model and defined the
major resources allocated for three stages of tradeshow process. To a firm, booth-attraction
stage requires the employment of several attention-getting techniques, pre-show
promotions together and in addition good location and size of booth display. While
tradeshow manager’s responsibility is to acquire the resources for remarkable booth
display, preshow promotion could be substantially enabled by marketing communication
capability. At the first stage, firms often use Direct mail, print ad and email to support
preshow promotion and this usage correlate positively with performance of tradeshow. At
the second stage, the most important resource is booth staff capability to create a good
interaction with customers and to identify and generate leads for further process. The aided
communication tools to support personal selling in this stage are often brochure, interactive
presentation or a product demonstration kit (Tafesse, 2013). Lastly, the last stage requires
firms to follow-up with the customers; this makes great use of the firm’s capability to
analyze the data gathered after the show for diverse business purposes such as demand
studies, lead management or competitor information. The tools that are often used in this
stage, according to Tafesse (2013), include personal selling, telemarketing and emails.
Adopting from media multiplicity premise of IMC, Tafesse (2013) is the only study
addressing the use of IMC in tradeshow. The study adopted IMC theory into multi-stage
process of trade show and suggested positive relationship between each media usage stage
and tradeshow performance in terms of selling, customer relationship, product promotion
and media publicity. However, it did not address the interaction or coordination between
marketing communication and tradeshow efforts, hence neglecting the variances of
performance outcomes under different conditions of tradeshow resources.

18
2.3. Conceptual Framework
This study aims to contribute to trade fair’s performance literature streams in two aspects.
First, it opens a framework of tradeshow resources built upon marketing capability in the
phases of planning, execution and performance measurement. Secondly, the study employs
Fuzzy Set / Qualitative Comparative method which has not been used previously in
tradeshow performance studies and would offer an alternative perspective to solve
performance optimization problem.
From the practical perspective, finding the mechanism of transforming marketing inputs
into desired performance outcomes has been both a challenge and an interest for marketing
managers. For theoretical framework to be useful for practice, it needs to be a robust but
simple enough to be explained, disseminated to different stakeholders and hence easily
applied in their day to day work. Marketing engineering approach provides such a
framework of finding marketing response model that convert marketing inputs,
competitive actions and environmental variables into outputs (Lilien and Rangaswamy,
1998). This study, in a simple description, used marketing resources of planning and
implementation capability in the context of trade fair exhibition to achieve optimal
performance outcome. As firms have different outcome definitions that might be expected
from trade fair activities, it’s beneficial for them to be able to manipulate the allocation of
resources to achieve the preferred variance in outcomes. The figure below summarizes the
framework of this thesis with main two drivers of performance outcome: Planning and
Implementing Capability in the context of fair marketing.

19
Figure 2. Conceptual Framework
Marketing
Inputs
Tradeshow
Marketing
Outcomes
Marketing Planning Capability
Booth
Planning
Trade fair
Planning
Staffing and
Training
Staff
Capability
Tradeshow
Engagement
Routine
Information
Gathering
Marketing Implementation Capability

20
3. EMPIRICAL RESEARCH
3.1. Methodology
Previous studies in tradeshow performance topic often employ regression analysis to
explore the relationship between independent variables and tradeshow performance
outcome (Ling‐yee, 2007; Sarmento, Farhangmehr, & Simões, 2015) or Structure Equation
Modeling Technique to formulate the latent constructs of tradeshow performance (Hansen,
2004; Ling‐yee, 2010). However, the conventional statistical approaches only seek out for
symmetrical relations between the dependent and independent variables and hence
assumes that positive and negative outcomes are led by opposite path of dependent
variables (Miranda, Tavares, & Queiró, 2017). However, this assumption might not hold
true and there stands the need for an alternative method to handle asymmetrical
relationship between the objective outcome and its negation. Fuzzy-Set/Qualitative
Comparative Analysis is such solution to handle the asymmetrical relationship that
common quantitative modeling techniques would fail to capture as the complete solutions
include separate configurations for the positive and negated outcome. In addition, FS/QCA
method is known for its application in the case of small sample size by examining each
cases with researcher’s qualitative insights. Since FS/QCA methodology remains a less
popular method in social research, this section provides an overview of key concepts and
measures of this method, in comparison with conventional quantitative methodology to
defend the method choice for this study.
Qualitative Comparative Analysis
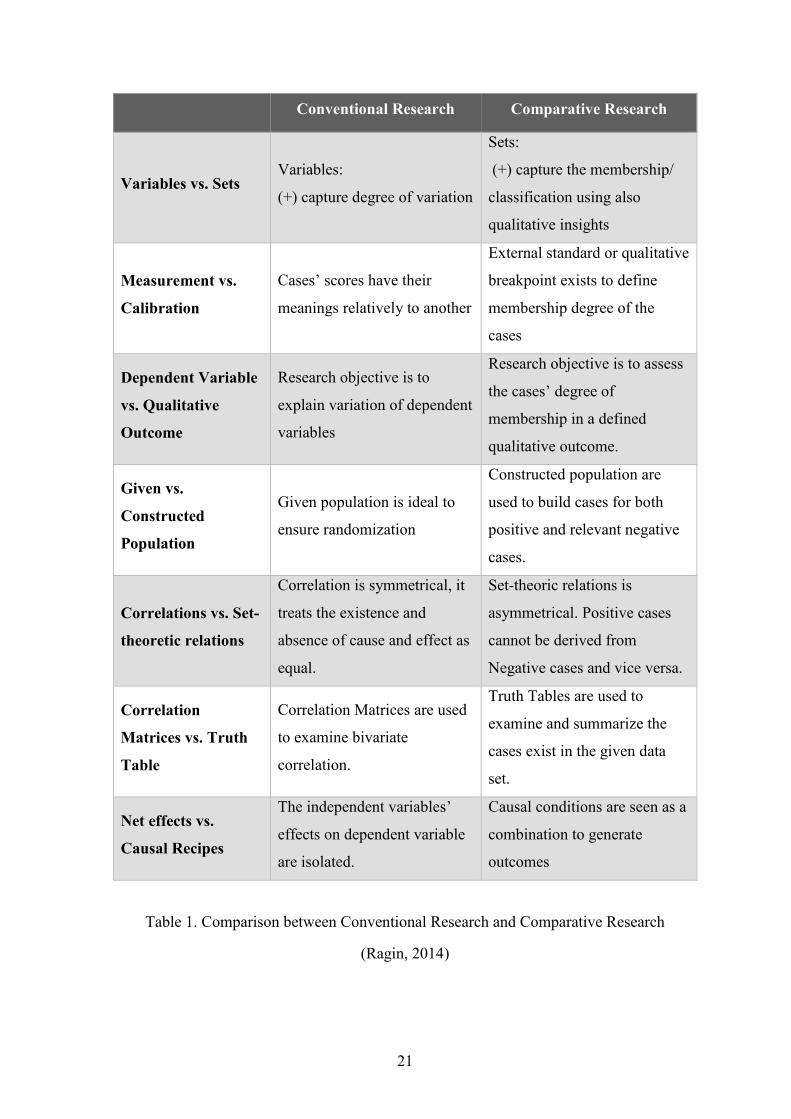
Ragin (2014) discussed key differences between the conventional quantitative methods and
Qualitative Comparative Analysis and also highlighted the contribution of FS/QCA
method to social researches. The below table summarizes Ragin’s (2014) discussion on the
differences between the two methods; this summary also defends the methodology choice
of the thesis to offer an alternative perspective on trade show performance literature
stream.
21
Conventional Research Comparative Research
Variables vs. Sets Variables:
(+) capture degree of variation
Sets:
(+) capture the membership/
classification using also
qualitative insights
Measurement vs.
Calibration
Cases’ scores have their
meanings relatively to another
External standard or qualitative
breakpoint exists to define
membership degree of the
cases
Dependent Variable
vs. Qualitative
Outcome
Research objective is to
explain variation of dependent
variables
Research objective is to assess
the cases’ degree of
membership in a defined
qualitative outcome.
Given vs.
Constructed
Population
Given population is ideal to
ensure randomization
Constructed population are
used to build cases for both
positive and relevant negative
cases.
Correlations vs. Set-
theoretic relations
Correlation is symmetrical, it
treats the existence and
absence of cause and effect as
equal.
Set-theoric relations is
asymmetrical. Positive cases
cannot be derived from
Negative cases and vice versa.
Correlation
Matrices vs. Truth
Table
Correlation Matrices are used
to examine bivariate
correlation.
Truth Tables are used to
examine and summarize the
cases exist in the given data
set.
Net effects vs.
Causal Recipes
The independent variables’
effects on dependent variable
are isolated.
Causal conditions are seen as a
combination to generate
outcomes
Table 1. Comparison between Conventional Research and Comparative Research
(Ragin, 2014)

22
Many studies have attempted to use Qualitative Comparative Analysis method as
alternative solution to study research problems as it emphasizes the causal relationship
between resources and marketing outcomes (Vassinen, 2012). This method is aligned with
marketing engineering approach (Lilien and Rangaswamy, 1998) which aims to discover
the marketing response model converting marketing inputs into marketing outcomes.
Marketing Engineering Approach does not only deliberate quantitative marketing response
model but also guides qualitative model, which enables the researchers to represent
qualitative insights to explain marketing outcomes (Lilien and Rangaswamy, 1998). The
approach broadly describes the process of using and integrating marketing assumptions,
data, knowledge, software and techniques to improve decision making process. FS/QCA
method aligns with this approach, adding values to the decision-making process by
addressing demand for knowledge on complex configurational causation.
As previously mentioned as one of the advantages of this method, QCA allows the small-N
nature of data in searching for causal regularities. This is beneficial for the research
settings with several aspects to be materialized in questionnaires and required selective
respondence. In addition, in contrast with the regular statistical modeling methods, QCA
research strategy is distinguished by its holistic approach that allows the cases to be
interrelated to the others, the configurational causality of combination of variables, and the
continual dialog between researchers and data in calibrating process and causal narrative
during research findings (Ragin, 2014)
Configurational Causality
In Qualitative Comparative Analysis, the main subjects under studies are configurations.
By definition, a configuration is a combination of conditions or input measures that lead to
the existence of outcome. Configurational approach is an important concept for business
research, especially in organizational theory and strategy research, since the approach
offers holistic and multidimensional view of the organization, enabling the studies of
performance and other business outcomes based on interconnected patterns and profiles
instead of isolated independent variables (Fiss, 2007).
In FS/QCA, causality is not assumed to be symmetrical, and the presence and absence of
the outcome cannot be interpreted through one explanation to another. In the other words,
Set Theory suggests that the membership in one set does not equal to non-membership in

23
the other set. FS/QCA looks into both conditions of positive and negative outcomes
separately, offering more robust explanation of asymmetrical relation than common
statistical techniques such as regression modeling. Each case in QCA is represented by
fuzzy values or the degrees of memberships in different studied conditions. The fuzzy
values, different from independent variables in conventional statistical approach, does not
tell how the cases are different from each other, but only to indicate the degree of
belongingness to certain set of conditions. The expected result from this process is to
reveal the pattern of combinations of membership degrees in the involved conditions;
hence, suggestions on the causality of the outcome are made and explained according to
the discovered patterns (Fiss, 2007; Ragin, 2014).
Truth Table Construction
Fuzzy-set method provides an approach to find the alternative configurations to achieve a
single marketing outcome via a truth table, representing all the possible configurational
paths leading from the condition inputs to the same outcome. According to Ragin (2014),
the truth table serves the purpose of organizing the data by different combinations of
values on the conditions on the table columns. Each row is assigned with an output value,
which is calculated from the output of each cases sharing the same combination of
conditions. From the truth tables, researcher then identifies the combinations that share the
similar output scores. After that, the summary of configurational paths is made so that the
most popular configurations found among the cases presents the model that researcher
looks for.
Necessity and Sufficiency of Causality
Fuzzy set Method allows necessity and sufficiency to be studied as set-theoretic
relationships. Set X is a subset of Y if the membership scores of cases in X are less than or
equal to the membership scores in Y. There are 2 types of fuzzy subset relationship that
exists between condition inputs and outcomes: sufficient and necessity. While sufficient
configurations are one or more conditions that lead to the outcome, necessary
configurations appear in all path leading to the outcome. From the truth table, necessary
configurations are detected by high coverage among the cases, while sufficient
configurations are defined by the consistency, assuring the configurations lead to the
outcome systematically (Korhonen, 2016). These two figures of solution coverage and
consistency represents the model-fit of the solution.

24
Fuzzy Membership and Data Calibration
In Fuzzy-Set, the cases are presented as degrees of membership varying from 0 (full non-
membership) to 1 (full membership). The original crisp-set is based on Boolean approach
with sets in logical values 1 (TRUE) or 0 (FALSE) (Ragin, 2014). However Fuzzy Set is a
broadened method to include membership scores between 0 and 1, defined by property
spaces between the scores and there exists a threshold to define full membership and full
non-membership. The below table taken from Ragin’s work (2014) summarizes the types
of fuzzy sets and the interpretation of membership degree values.
Crisp Set Three-value
fuzzy set
Four-value
fuzzy set
Six-value
fuzzy set
Continuous
fuzzy set
1 = fully in 1 = fully in 1 = fully in 1 = fully in 1 = fully in
0 = fully out
0.5 = neither
fully in or fully
out
0.67 = more in
than out
0.9 = mostly
but not fully in
0.5 < x < 1
Degree of more
in than out
0 = fully out 0.4 = more out
than in
0.6 = more or
less in
0.5 = crossover:
neither in or out
0 = fully out 0.4 = more or
less out
0 < x < 0.5
Degree of more
out than in
0.1 = mostly
but not fully
out
0 = fully out
0 = fully out
Table 2. Different Types of fuzzy sets
(Ragin, 2014)
As a qualitative comparative analysis method, calibrated data is influenced by researchers’
qualitative knowledge to calibrate membership scores. The calibration process should be
well-documented and rationalized to ensure the objectivity of the procedure so that the
same results could be obtained by another researcher when that person follows the
documented steps for calibration. There are two methods for calibration; the first method,
Direct Calibration, corresponds to the three-value fuzzy set which bases the calibration on

25
three qualitative anchors of fully in membership, fully out member ship and cross-over
point. Secondly, the Indirect method qualitatively groups the cases corresponding to the
values of the sets. In the data analysis chapter of this thesis, the text explains the
calibration process using Indirect method.
The validity and reliability of FS/QCA method is ensured by following the good practice
for FS/QCA research suggested in Schneider & Wagemann (2010). The calibration and
analysis in R studio are documented in the empirical research chapter and appendix
transparently so that other researchers could obtain same results following the same
process. In addition, the evaluation of solution’s validity is discussed later in details as a
part of result presentation.
3.2. Data Collection
Data collection procedure
The data for this research were collected via an online survey of 45 questions sent to fair
exhibitor contacts provided by Finnish Trade-fair Association (Messukeskus). Estimated
time to complete the survey is about 20 minutes, and in total 53 responses were received,
from 4 Business to Consumer fairs: Nordic Travel Fair 2018, Spring Fair 2018,
International Boat Fair 2018 and Tampere Horse Fair 2018. However, three respondents
were excluded for the analysis since they are from non-profit organizers whose purpose of
exhibiting does not fit in with the rest of the respondents and also the goal of this research.
The questions in the survey are chosen based on literature review on trade fair’s
performance measurement to explore possible causal conditions. Throughout the process
of data validation and minimizing property spaces for FS/QCA model analysis, not all the
questions are used for the final model solution; however, full questionnaire is presented in
the appendix. The profiles of respondents are reported in the below table.

26
Sample Characteristics
Number of
Respondents
(N = 50)
Percentage of Total
Job titles
Top Management 24 48%
Middle Management 13 26%
Specialist 9 18%
Staff 4 8%
Company Size
> 500 employees 2 4%
100 – 499 employees 4 8%
50 – 99 employees 2 4%
11 – 50 employees 17 34%
1 – 10 employees 25 50%
Exhibiting Frequency
Three times a year or more 23 46%
Twice a year 15 30%
Once a year 9 18%
Once every two years or less 3 6%
Attended Fair
Spring Fair 2018 20 40%
International Boat Fair 2018 17 34%
Nordic Travel Fair 2018 12 24%
Tampere Horse Fair 2018 1 2%
Table 3. Sample Description
Outcome Specification
Outcome of the tradeshow performance was asked in a few questions in order to search for
the best measurable outcome. In the questions regarding performance outcome at the fair,
both hard measure and soft measure were applied. To arrive at the final selected questions
to measure performance outcome, the researchers studied previous literatures on trade-fair
outcome measurement and adopted the measures to this study. However, the collected
quantitative (hard) measures regarding sales and contacts could not be used for analysis in

27
this study due to two reasons: exhibitors have diversified objectives for their participation
and the quantitative measures are specific to certain objectives; secondly, many exhibitors
do not have systematic method to keep track of quantitative results. Hence, two soft
measures of Perceived Performance and Achievement of Objectives are used in this QCA
study. In fact, Perceived performance as dependent variable is tested in Hansen (2004)
with the model resulted in positive association between Overall Perceived Performance
and Tradeshow Performance based on the key activities at the fairs. On the other hand, the
achievement of objectives as outcome of trade fairs has been studied in other researches
such as Blyth (2000) and Ling-Yee (2007).
Regarding perceived performance, the respondents were asked to rate how satisfied their
companies were with their overall performances at the fair, in a scale from 1 – 7 with 1 =
“very dissatisfied” and 7 = “very satisfied”. On the other hand, to explore how exhibitors
achieved their objectives, another question asked respondents to identify the objectives that
were set prior to the fair participation and in the case of chosen objectives, the respondents
then rated how well their companies achieved each one. In addition, the survey was
interested in whether the companies were able to record any figures of outcomes, or hard
measures, such as number of contacts acquired during the fair, number of visitors that
exhibitors were able to talked to, number of business transactions finished at the fair and
also the revenue gained from the fair. However, the results showed that not all companies
keep track of the hard-measures for the outcome.
The selection of conditions
The below table displays the maximum property space which is also the initial list of
conditions contained in the survey. The conditions were selected through extensive
literature research representing several trade show aspects and are believed to be causal to
the exhibiting performance.

28
Condition Name Text Sources
Planning time Length of planning duration before the
fair
Personnel
Resources
Number of people involved in fair
preparation (internal and out-sourced)
Material
Utilization
How much of existing material
transferred and reused from fair to fair
Booth Area Booth Area in square meters (Alberca-Oliver,
Rodríguez-Oromendía, &
Parte-Esteban, 2015;
Gopalakrishna, Lilien,
Williams, & Sequeira,
1995; Lee & Kim, 2008)
Booth Theme Existence of clear theme
Booth Design
Competitiveness
Perceived competitiveness of booth
design
(Gilliam, 2015; Ling‐yee,
2007)
Pre-show
promotion
capability
Variety of preshow promotions used (Batra & Keller, 2016;
Herbig et al., 2006; Tafesse
& Korneliussen, 2013)
At-show
promotion
capability
Variety of at-show promotion
activities used
(Batra & Keller, 2016;
Herbig et al., 2006; Tafesse
& Korneliussen, 2013)
At-show
interaction
capability
Variety of at-show activities to interact
with customers
(Batra & Keller, 2016;
Herbig et al., 2006; Tafesse
& Korneliussen, 2013)
At-show sales
promotion
capability
Variety of at-show activities to used
Follow up
capability
Which of the below follow-up
activities were used to after-show
(Batra & Keller, 2016;
Herbig et al., 2006; Tafesse
& Korneliussen, 2013)
Number of Follow
up email
Intensity of follow-up by email
(Seringhaus & Rosson,
2004)

29
Time to follow up Promptness of follow-up after the
show
(Seringhaus & Rosson,
2004)
Follow up content Follow-up content variety/ creativity
Booth staff
density
Number of booth staff
(Seringhaus & Rosson,
2004)
Booth staff
diversity
Professional background diversity of
booth staff
Booth staff
training
Training Hours for Booth Staff (Lee & Kim, 2008;
Seringhaus & Rosson,
2004)
Booth staff
capability
Capability of Booth Staff (Ling‐yee, 2007)
Information
Intelligence
capability
Comprehensive usage of tradeshow
information
Information
quality
Quality of information collected (Sirén, 2017)
Participation fee Participation Fee that your company
paid for the tradeshow organizer
(Gopalakrishna &
Williams, 1992; Seringhaus
& Rosson, 2004)
Production Cost Total Production and Logistic Cost for
the exhibition
(Gopalakrishna &
Williams, 1992; Seringhaus
& Rosson, 2004)
Trade fair annual
spends
Company’s Annual Budget for
Tradeshow Participation
Trade fair annual
% allocation
Company’s Annual Budget for
Tradeshow Participation
Table 4. Initial Conditions

30
Calibration of Outcome
As briefly discussed in the outcome specification subsection, this study relies on two “soft”
measures for the outcome variable as the numerical “hard” measures collected from
respondents contain several missing data points. The lack of numerical return measures
such as total business transactions, visitors’ traffic or revenue generated from trade fairs
indicates that exhibiting companies do not own solid method to measure their performance
in this marketing event. On the other hand, it is also arguable that it is not necessary for
companies who attend B2C trade fairs to collect these types of measures as they interact
with great amount of non-customer visiting traffic and often have non-sale related
objectives.
In addition, with FS/QCA method, only one outcome variable is allowed in a model.
Therefore, a new outcome variable is created based on the Perceived Performance outcome
and Objective Achievement outcome. Membership scores assignment for outcome is based
partly on qualitative understanding of each case and partly on descriptive statistics value.
There are cases where the companies were fully satisfied with overall performance of
tradeshow, but on the other hand they did not successfully achieve any of the objectives,
hence the case is not assigned full membership for the outcome. The below table illustrates
the guideline for assigning membership scores to studied cases.

31
Outcome Type of
Set
MBs
Scores
Definition of
MBs Scores Explanation of MBs Scores
General
Outcome
four-value
fuzzy set
0 / 0.33 /
0.67 / 1
0 Disappointment
The company are not satisfied
with the performance at the fair
and/or they do not find objectives
as successfully achieved
0.33 Modest
Satisfaction
There are hardly any objectives
that exceeded company's
expectation, and general
satisfaction is not at highest level
0.67 Moderate
Satisfaction
The company are generally
satisfied with the performance at
the fair but it is not consistent
with how well they achieve the
objectives, or vice versa.
1 High Satisfaction
The company are very confident
that they are satisfied with the
performance at the fair and they
exceeded a few objectives they
have set
Table 5. Outcome Calibration
Following this calibration rule, the outcome of 50 cases were calibrated based on each
respondent’ answers of general satisfaction and their achievement level of objectives in
question. It is logical to combine these two factors of general satisfaction and achievement
of objectives to measure General Outcome as the observation shows the inconsistency of
the factors in the cases where respondents indicated that their companies in overall were
very satisfied with the result but on the other hand, they did not quite achieve the pre-
determined objectives. The methodology FS/QCA is beneficial for the research as it
enables researchers to combine qualitative observation in the cases to compute quantitative
measures. The figure below shows the distribution of the cases on calibrated outcome

32
(“OUTCOME”), with 18/50 cases (36%) with membership of either 0.67 or 1. The
distribution of calibration has mean of 0.41 and median of 0.36.
Figure 3. Outcome Calibration
Calibration of Conditions
In this section, each condition is discussed separately with the explanation of the method
for calibration. This conditions which are discussed below is taken from the initial list of
conditions; however, after the raw data was validated, all the numerical measures
regarding financial investments are excluded due to missing data points. Also, many of the
final conditions are the combination of initial conditions to capture the distinctiveness of
condition while minimizing property spaces.
Planning Time
Sufficient planning period is known as crucial factor for the success of any event
organization, not only specifically for trade fair exhibitions. The planning period is asked
in a multiple-choice question with categorical answer options: “less than 3 months”, “3-6
months”, “7-12 months” and “more than 12 months”. Looking at the cases, no company
started planning for the fair more than 12 months, and the long planning time of “7-12
months” is not popular. As observed, in the case of annual fairs, trade fair’s organizers
often start to welcome registrations one year before the fair, giving exhibitors adequate
time to decide, register and prepare for the fair. Thus, we use 6 months as the cut-off and
assign “0” to the cases in which companies started planning for the fair 6 months or less
prior to the fair, and “1” is assigned to the rest of the cases. In total, 27 cases (54%) are
assigned with the membership score of 1. In addition, the data shows that company who

33
exhibits more frequently spends less time preparing for trade-fairs compared to less-
frequent participants. The below table summarizes the rules behind crisp set calibration.
Condition Type of
Set
MBs
Scores
Definition of
MBs Scores Explanation of MBs Scores
Preparation
Time
Crisp Set
0 / 1
0 Short Preparation
Period
Company has 6 or less months
to plan and prepare for the fair
exhibition
1 Long Preparation
Period
Company has more than 6
months to plan and prepare for
the fair exhibition
Table 6. Preparation Time Calibration
Booth Theme Complexity
Exhibitors attending trade fairs have their stories that they want to communicate to visitors.
The stories are often tied strongly with the objectives that companies aim to achieve
through the exhibition, and they are told to customers across different touch points during
the fair, whether it is a face-to-face conversation between booth staff and visitor, seminar
presentations or the just the booth design itself. However, to deliver the message to
majority of visitors, companies cannot rely on sending their staff to talk to every single
visitor at the fairs. Instead, the booth itself should have the story embodied in the design
theme of the booth, to deliver an explanatory message to the mass audience. When
managers need to decide on any marketing campaign, advertising production or any
marketing material design, they have to decide on the key message to be remembered by
target audience once they are exposed to the touchpoints. As the story gets more interesting
and engaging to visitors when there are different element and details involved, it is also
more challenging for audience to process the message and remember main points.
Booth theme question asked respondents to select of themes that company embedded in
their booths’ design: “Company milestones”, “Key products”, “Important brand
attributes”, “Brand image or positioning”, “The country or place of origin”, “Company
history”, “Marketing campaign”, “Creative concept” or “Others”. The respondents are also
asked to describe the booth theme in free text so that the researcher could get a better

34
understanding of the theme. In this research, as the purpose is to see whether the
complexity of the booth theme affects the outcome of the tradeshow, it is decided that the
condition is calibrated into crisp set. As a result, 27 out of 50 cases are assigned the
membership score of 1 in this condition.
Condition Type of Set MBs
Scores
Definition of
MBs Scores Explanation of MBs Scores
Booth Theme
Complexity
Crisp Set
0 / 1
0 Simple
The booth is designed based
on two or less themes
1 Complex The booth is designed based
on more than three themes
Table 7. Booth Theme Complexity Calibration
Booth Design Competitiveness
Companies participating at the fair compete for visitors’ attention, and booth design and
layout play such an important role in achieving this objective. If a booth is more visually
attractive compared to key competitors’ exhibition display, there would be more visitors to
stop at and engage with the company further and it eventually influences the number of
customers converted from those visitors.
Gilliam (2015) discussed the impact of exhibition booths and design elements on how
exhibitor achieving their objectives at trade fair. The key elements of booth design are
adopted from this study and brought into the question that asked respondents to evaluate
their booth design competitiveness on five constructs of overall design: lighting, design
complexity, the use of empty space between design elements, and the overall ability to tell
the story. By analyzing each respondent’s answer, the researcher is able to calibrate the
condition of Booth Design Competitiveness on a crisp set following the rules elaborated in
the below table. Within 50 study cases, only 14 cases are assigned with the membership
score of “1” in this condition.

35
Condition Type of
Set
MBs
Scores
Definition of
MBs Scores Explanation of MBs Scores
Booth Design
Competitiveness
Crisp Set
0 / 1
0
Not
Competitive
Company is not very
confident of the booth layout
elements compared to those
of competitors
1 Competitive
Company is very confident
of the booth layout element
compared to those of
competitors.
Table 8. Booth Design Competitiveness Calibration
Fair Engagement Focus
Previous literatures often examine trade fairs in three stages, Pre-show, At-show and After-
show, following the personal selling framework where prospects are exposed to the brand
and later converted into customers throughout the selling stages. Categorical questions
were used to explore the types of activities that company used to engage with prospects at
each stage of trade fair; and the options given to respondents are drawn from previous
literatures. As observed, there exists big difference in the variety of the activities before the
show, during the show and after the show. The greatest number of engagement activities
are found in the At-show stage corresponding to the conversion success rate during the
show. Therefore, At-show engagement activities are divided into communication,
interaction, and sales promotion categories in three separate questions. Communication
activities contain one-way communication that tells the story to customers over different
forms of marketing materials; Interacting activities on the other hand welcome visitors to
response to the company by immersing them in the experience created by brand. In
addition, a “call-to-action” is possibly deployed with sales promotion activities to convert
visitors into buyers. Even in many cases in which companies do not have specific selling
objective as they attend the fair, a “call-to-action” is a good technique to convert the
prospects further down the purchase funnel.

36
Looking at all of the stages and activities, it was clear that they are connected parts of the
marketing effort to engage the visitors or customers to the brands. Hence, the researcher
combined these inputs from all the stages as single condition: Trade Fair Engagement. As a
general expectation from previous studies, the more engaging the exhibition is, the better
performance outcome is achieved. At the same time, it is expected that the engagement
activities are comparable to the booth investment, as bigger companies have much more
budget to afford spacious booth areas and implement more visitor-engagement activities.
Therefore, this study aims to evaluate the company’s resource focus on Engagement
activities by compare the variety of activities with its booth areas. Small booth with
various engaging activities is assigned with high membership score on trade-fair
engagement focus; on the other extreme, large booth area with only basic engagement
activities is consider less-focus on trade-fair engagement. It is decided that a four-value
fuzzy set is used to calibrate this condition as the variance of engagement level make clear
impact on the performance of exhibitors according to previous literatures.
Condition Type of Set MBs
Scores
Definition of
MBs Scores
Explanation of MBs Scores
Trade Fair
Engagement
Focus
four-value fuzzy set
0 / 0.33 /
0.67 / 1
0
Low
engagement
Focus
The investment on engaging
activities does not match
booth investment
0.33
Modest
Engagement
Focus
The investment on engaging
activities modestly matches
booth investment
0.67
Moderate
Engagement
Focus
The investment on engaging
activities quite matches booth
investment
1
High
Engagement
Focus
The investment on engaging
activities are sufficiently
comparable to booth
investment
Table 9. Fair Engagement Calibration

37
The distribution of fair engagement membership scores is illustrated in the below graph,
with the mean of 0.44. Out of 50 cases, 9 cases are in High Engagement group, 12 cases in
the cases in the Moderate Engagement group, 15 cases are in Modest Engagement group
and 14 cases are in the Low Engagement group.
Figure 4. Fair Engagement Calibration
Staffing
Personnel resource plays essential role in the execution of marketing activities. Company
sometimes face the challenges of having sufficient financial resource to support variety of
initiatives but at the same time do not have sufficient manpower to execute the activities.
Previous literatures deliberate the importance of booth-staff density during exhibition;
however, human resource is also essential in the planning phase and pre-show promotion
stage. This study is interested in how the level of personnel quantity distributed in all the
planning and execution phases of tradeshow would influence the outcome of exhibition;
this includes both internal employees and external outsourced staff who involve in the
planning and preparation phase as well as booth-staff during the exhibition. In addition, the
staff level should be sufficiently equivalent to the investment on booth area, as companies
need to make sure to have adequate staff resource to handle the workload of the exhibition
and to maximize the use per square meter. Follow the similar method of calibration, Staff
Resource condition is calibrated in a four-value fuzzy set. The assignment of membership
scores follows the below definition table.

38
Condition Type of
Set
MBs
Scores
Definition
of MBs
Scores
Explanation of MBs Scores
Booth Staff
Resource
Sufficiency
four-value fuzzy set
0 / 0.33 /
0.67 / 1
0 Under-
staffed
The total numbers of staff (internal and
external) for planning AND presenting at the
booth per square meter are both low
0.33 Modest
Resource
Total number of staff (internal and external)
for planning OR presenting at the booth, per
square meter, is low
0.67 Moderate
Resource
The total numbers of staff (internal and
external) for planning AND presenting at the
booth per square meter are both satisfactory
1 Abundant
Resource
The total numbers of staff (internal and
external) for planning AND presenting at the
booth, per square meter, are both Abundant
Table 10. Staffing Calibration
Looking at the calibrated membership score distribution in the below graph, most of the
cases, accounted for 72% of the sample, were under-staffed or modest level of staff
preparing for and presenting at the exhibition. Hence, distribution of membership scores in
staffing has the mean of 0.32.
Figure 5. Staffing Calibration

39
Booth Staff Capability
The importance of Booth Staff Capability is undeniable contribution to the performance of
exhibitor at trade fairs, since booth staff represents the only human contact between the
visitors and the brands. As tradeshow exhibition has significant similarity to retail
experience, companies want visitors who stop at their booths to immerse in the experience
that the brands have planned. In this study, booth staff’s capability is evaluated by the
respondents’ perceptions of different areas in which booth-staff performance is significant.
The components of this condition include the ability to answer visitors’ questions, ability
to arouse visitors’ interests of the product, ability to listen actively to customers, their
selling and interpersonal skills, previous fair experience and also the knowledge about
cross-functions. The evaluation of each capability is asked in a 1-7 scale question, and the
calibration is based on all of these capabilities’ evaluation, using the four-value fuzzy sets
illustrated in the table below.
Condition Type of
Set
MBs
Scores
Definition of
MBs Scores Explanation of MBs Scores
Booth Staff
Capability
four-value fuzzy set
0 / 0.33 /
0.67 / 1
0 Low Staff
Capability
Company is not at all confident
about booth staff capability
0.33 Modest Staff
Capability
Company is less confident about
booth staff capability
0.67 Moderate Staff
Capability
Company is moderately confident
about booth staff capability
1 High Staff
Capability
Company is very confident about
booth staff capability
Table 11. Booth Staff's Capability calibration

40
Below is the membership score distribution of calibrated booth-staff capability condition,
mean is equal 0.48
Figure 6. Booth staff's capability calibration
Staff Training
Most companies attending trade fairs send their internal employees to the fair as booth-
staff, as they have adequate knowledge of the brand and the products to communicate and
interact with visitors. Looking at the functions that booth-staff are usually come from:
Sales, Marketing and Customer Services, it suggests that they have good skills for
interacting with customers as well as knowledge about product and the company.
However, as companies want to provide visitors with a consistent and professional fair
experience, training for staff before the fair, either in the forms of formal training or
meeting is necessary to make sure visitors are greeted and guided through the experience
with the consistent service from booth personnel. In addition, since not all the booth
personnel have had experience of trade-fairs prior to the show, the training would ensure
that the staff has necessary understanding of how they can best interact with visitors to be
the coordinator of visitors’ booth experience. Staff training condition is calibrated using
crisp-set, with “0” and “1” values assigned to each case that the training was not provided
and provided to booth personnel prior to the fair. In total, companies in 22 out of 50 cases
provide certain training to booth staff while the absence of this condition presents in the
rest of 56% of the cases.

41
Condition Type of
Set
MBs
Scores
Definition of
MBs Scores Explanation of MBs Scores
Staff
Training
Crisp Set
0 / 1
0
Trainings are
not provided
No training is provided to booth
staff
1 Trainings are
provided
There are certain trainings provided
to booth staff
Table 12. Staff training calibration
Information Gathering Focus
With the shift of Trade-fair from traditional to modern fair, from direct selling focus to
multi-purpose fair, companies realize that trade fair is a great place to gather information
and use it for strategic decision making. A 7-scale question asked respondents to identify
how the fair information was used in their companies; based on that, the condition
“information focus” is calibrated to evaluate the focus of company in analyzing the
information acquired at trade fair to support business decisions. The question and its
constructs are adopted from Ling-yee’s study in 2007 on the impact of marketing resources
on tradeshow performance. As a result, this study uncovered a link between the usage of
acquired information as post-show follow-up act and the outcome performance measured
by objective achievement. This condition is calibrated in crisp set as there is not sufficient
information to distinguish the variance in the company’s focus levels on intelligence
gathering at trade fair. Following the definition in below table, 24 cases out of 50 (48%)
are assigned in the group of Information gathering focus.
Condition Type of
Set
MBs
Scores
Definition of
MBs Scores Explanation of MBs Scores
Information
Gathering
Focus
Crisp Set
0 / 1
0 Do not focus
Company does not use information
gathered at show for business decision
1 Focus Company uses the information
gathered at show for business decision
Table 13. Information Gathering Focus calibration

42
3.3. Data Analysis
The purpose of this section is to briefly describe the technical steps to discover
configurations leading to the high and low performance outcome of tradeshow. Calibration
data or membership scores are firstly coded in an excel table following the calibration
process highlighted in the previous section, where each row is one case and each column is
one set of outcome and conditions. After that, the table is loaded into R studio where the
analysis is carried out using the QCA package developed for R development environment.
From this stage, the analysis consists of two parts: plotting truth table and minimizing truth
tables to produce solution models for the Outcome (high performance) and Negated
Outcome (low performance). The consistency cut-off is set to 0.95 as it is recommended in
previous studies, representing the consistency of solution. Following standard analysis
process of QCA method, complex, intermediate and parsimony solutions were calculated.
Complex solution provides the strictest explanation of the outcome, however as the name
describes, it is the most difficult to make interpretation due the high number of causalities
in all configurational paths. On the other hand, parsimony solution provides the weakest
explanation of the outcome but can be used for the straightforwardness of causality. In
addition, intermediate solution positions between these two extremes, using the
researcher’s qualitative insights to specify the direction by identifying necessary conditions
to be included in the outcome.

43
3.4. Results
High Perceived Performance of Trade show
Following the procedures with QCA package in R to recode the calibration, construct truth
table to discover patterns of configuration, the analysis provides complex, intermediate and
parsimony solutions or models. The complex solution contains of 14 configurations,
providing the consistency of 1.00 and coverage of 0.54. The consistency is at its best,
however, the coverage shows that only 54% of the cases are presented by this model. As
previously discussed, the complex solution has too many configurations with causal
complexity within each, making it hard to interpret. Additionally, from a practical
perspective, even though complex solution scores very high in consistency, the number of
cases that fit into this model is only few and thus the model has low coverage, making it
difficult to be applied in the practice (Ragin, 2006). On the other hand, it is easier and
more useful to use parsimony solution to explain outcome with causality. The parsimony
solution has consistency of 0.88, lower than in complex solution, however, appears more
reliable with better coverage of 0.71. With 8 conditions in the model, the truth table has
total 28 = 256 rows, however, 22 rows were omitted since there was no empirical cases to
represent the row. As the loose solution of parsimony solution comes from the procedure
of using logical remainders to construct the solution, 22 logical remainders are the
indicators for how reliable parsimony solution is for interpretation. The intermediate
solution is not used in this study as it requires a directional vector that identify necessary
conditions to be included in the model.
Below is the configuration of Parsimony solution, followed by summary table. Noted that
in this FS/QCA model presentation, upper-case condition’s name represents a Presence of
condition, whereas the lower-case condition’s name represents an Absence of condition.
Same logic is applied to positive outcome (OUTCOME) and its negation (outcome). In
addition, the notation “*” indicate combination of condition or logical “AND” in a
configuration, while notation “+” corresponds to logical “OR” to separate different
configurations in the model.

44
Configuration of High-performance outcome:
DESIGN_COMPETITIVENESS*info_gather +
PREPARE_TIME*STAFFING*INFO_GATHER +
theme_complexity*FAIR_ENGAGEMENT*staff_training +
DESIGN_COMPETITIVENESS*staff_capability*fair_engagement +
prepare_time*THEME_COMPLEXITY*STAFF_CAPABILITY*FAIR_ENGAGEMENT
OUTCOME
Solution Consistency: 0.881
Solution Coverage: 0.711
Configurations Cases Consistency Raw
Coverage
Unique
Covera
ge
1 DESIGN_COMPETITIVENESS*
info_gather 5 0.868 0.210 0.113
2 PREPARE_TIME*STAFFING*
INFO_GATHER 3 0.901 0.145 0.129
3
theme_complexity*
FAIR_ENGAGEMENT*
staff_training
3 0.771 0.161 0.145
4 DESIGN_COMPETITIVENESS
*staff_capability*fair_engagement 2 1.000 0.129 0.048
5
prepare_time*
THEME_COMPLEXITY*
STAFF_CAPABILITY*
FAIR_ENGAGEMENT
4 1.000 0.210 0.145
Table 14. Configurations of High-Performance Outcome
The first configuration shows that highly competitive booth design combined with the lack
of focus on information gathering would lead to the positive performance of tradeshow. It
can be deductively interpreted that when the exhibitors invest on the booth scape design to

45
attract visitors, they are likely to focus on the visitor engagement as the objectives rather
than collecting and analyzing tradeshow information. In fact, we are not looking closely in
explaining why the lack of information gathering focus appears in the configuration, as the
test of necessity shows low consistency, coverage, relevance of the necessity of negated
condition of Information gathering focus in high performance outcome. However, it is
possibly interpreted that exhibitors have either Information Gathering or Booth
Competitiveness as their objective: while a company focus on the booth design
competitiveness to optimize visitor touchpoint at booth, they might not be extensively
focus on gathering intelligence at tradeshow.
Interestingly, although the absence of information gathering focus appears in the first
configuration, the condition itself is the part of the second configuration, together with
sufficient preparation time and adequate staffing resource. This finding suggests that
exhibitors who put their focus on intelligence gathering at trade fair achieves high
performance outcome with sufficient time for preparation and enough staff who are the
information collectors during the fair. The process of using tradeshow information requires
resources in all the stages of information acquisition, information dissemination,
information quality evaluation and analyzing data. (Bettis‐Outland, Johnston, & Dale
Wilson, 2012). In order for the intelligence objective to be successfully deployed at trade
fairs, companies should consume sufficient planning time to identify the type of
information that is interesting for the company. Next a plan of how to acquire that
information during and after the show is made, followed by a blue print of necessary steps
to analyze and disseminate the insights within organization to ensure that acquisition effort
is worthwhile. In this process, staffing resource plays an important role in acquiring the
information, as they gather information through both formal sources such as seminars,
panel discussions and also informal sources such face-to-face conversations, messages,
emails with customers or peer professionals. Hence, exhibitors with intelligence gathering
focus might even need more staff than other companies as they need to balance between
the need of having staff at the company booth and having staff elsewhere in order to
maintain good booth representation as well as to acquire information outside of the booth.
The third configuration shows the importance of trade-fair engagement in the high-
performance outcome of tradeshow. This path is certainly not a surprising causality as fair
engagement has been received great attention of tradeshow’s researchers for many years.

46
Similar to design competitiveness, fair engagement condition is found in two
configurations leading to favorable outcome. At the same time, the necessary test shows a
low necessity consistency and coverage for the two negated conditions, and thus we cannot
conclude that simple theme or lack of staff training contributes to the high perceived
performance of tradeshow. On the other hand, when we look at the necessity test of Fair
Engagement condition, the consistency of necessity, relevance of necessity and coverage
are significantly higher than the same measures for the two negated conditions.
The fourth configuration is quite similar to the first one, indicating the importance of
Design competitiveness as a key factor for the high-performance outcome of trade fairs. In
addition, it is remarkable that even with poor fair engagement and poor staff capability
which both appear in other configurations, the exhibitor with strong design
competitiveness could still achieve a good result out of tradeshow, confirming the
importance of booth design in delivering exhibition’s performance. Looking back to
literatures, we also see that this argument is supported as the booth design is always at the
center of tradeshow preparation, and it is the gate to get visitor attention before any fair
engagement activity could start to convert them further through the tradeshow stages.
In the fifth configuration, we see the presence of Trade Fair Engagement again, together
with Theme Complexity and Staff Capability. In addition, one negated condition is present,
preparation time period. The negated condition suggests that long preparation period is not
needed as long as the company has succeeded in other aspects of the fair: having a strong
story to communicate, good staff capability and deployment of engagement activities. This
configuration stands true for exhibitors who participate in several fairs already every year,
thus they have a system for being efficient without a long preparation period. Moreover,
this path suggests that when the brand story is complicated, not a simple message,
exhibitors need to make sure they have skilled staff and engaging activities to
communicate the story successfully to booth visitors. In contrast, as can be interpreted
further from this finding, when the booth theme is straightforward, exhibitors can make the
communicated message stick easily without much enforcements to make visitors
remember.

47
Low perceived performance of tradeshow
The same procedure is replicated to explore the causalities of low perceived performance
outcome. The complex solution consists of four configurations with consistency level of
0.98 and solution coverage of 0.55, again making it complicated and impractical solution
to interpret; therefore, the parsimony solution is used for further interpretation. There are 6
solutions to explain negated outcome due to existence of model ambiguity; this ambiguity
is an unexpected result of analysis process due to the limitation of QM (Quine-McCluskey)
algorithm that is used in popular QCA software and also in the QCA R package used in
this thesis. Ambiguous models include two parts: main configurations presenting in all
models and ambiguity parts that is exclusive to each model. To address the problem of
model ambiguity, it’s guided that the documentation must be transparent on the selection
of model for interpretation and full data on model-fitting should be presented
(Baumgartner & Thiem, 2017).
This thesis chooses one model among the ambiguities, ensuring that the model does not
conflict with overall interpretation of the results. In addition, the selected model yields the
highest coverage of 0.61 and also the highest consistency of 0.9. This solution is presented
as below where the main configurations that appeared in all six solutions are the first three
and the later three paths inside the brackets are distinctive from other ambiguous solutions.
The full record of other five models is presented in the Appendix.
M6:
STAFFING*design_competitiveness*info_gather +
prepare_time*theme_complexity*design_competitiveness*INFO_GATHER +
staffing*design_competitiveness*fair_engagement*INFO_GATHER +
(PREPARE_TIME*staffing*staff_capability*STAFF_TRAINING +
THEME_COMPLEXITY*design_competitiveness*staff_capability*FAIR_ENGAGEME
NT +
PREPARE_TIME*theme_complexity*design_competitiveness*fair_engagement*staff_tra
ining)
outcome

48
Solution Consistency: 0.901
Solution Coverage: 0.613
Configurations Cases Consistency Raw
Coverage
Unique
Coverage
1 STAFFING*design_competitiveness*
info_gather 4 0.825 0.159 0.034
2 prepare_time*theme_complexity*
design_competitiveness*
INFO_GATHER
3 0.890 0.091 0.046
3 staffing*design_competitiveness*
fair_engagement*INFO_GATHER 4 0.929 0.147 0.068
4 PREPARE_TIME*staffing*
staff_capability*STAFF_TRAINING 4 0.910 0.114 0.000
5 THEME_COMPLEXITY*
design_competitiveness*
staff_capability*
FAIR_ENGAGEMENT
5 1.000 0.193 0.034
6 PREPARE_TIME*
theme_complexity*
design_competitiveness*
fair_engagement*staff_training
4 1.000 0.125 0.011
Table 15. Configurations of Low Performance Outcome
The first configuration shows that the absence of design competitiveness, information
gathering focus combined with sufficient amount of staff would lead to low perceived
performance outcome. This links to the previous discussion that companies attending trade
fairs might differ in strategy; while some companies focus on booth attraction and visitor
engagement, others participate in the fair to gather information of market, customer
demands or competitors. When neither of the strategy is taken place, companies are likely
to get negative outcome from the tradeshow, even with sufficient amount of personnel
supporting the fair.

49
The second and third configurations suggest similar positions, with the presence of
Information Gathering condition combined with other negated conditions. In addition, both
configurations have the presence of the negated condition of design competitive, together
with the same pattern found in the first path, suggesting that the lack of design
competitiveness is a critical condition leading to negation of high-performance outcome.
On the other hand, when an exhibitor concentrates on information gathering without the
presence of other necessary conditions to optimize their intelligence strategy, for instance
insufficient manpower or the absence of engagement activities to facilitate information
collection from visitors, the strategy or mindset only could not deliver the expected
outcome. As previously discussed in the section of High-performance outcome,
Information focus works for exhibitors who invest on the preparation time and personnel
resources; thus, while these sufficient conditions are absent, the focus on information
gathering would trigger the low performance at trade fairs.
The fourth configuration of the solution indicates that the absence of staff capability and
sufficient quantity of staff contribute to low-performance outcome. Instead, staff training
and preparation time seem not helpful in achieving good performance at trade fairs. While
Staff Training condition appears only once in the configurations for low performance
outcome, long preparation time shows up twice, indicating that long preparation period
could be a valid factor for Low-performance outcome. As an attempt for explanation, long
preparation period could impact the performance at fair as the project could face
difficulties to gather staff focus and reduce efficiency of the tasks that might only need a
few intensive days to get done. In the projects that are carried on for a longer period than
they need, loss of communication and records might occur and thus impact the efficiency
and effectiveness of the execution. In addition, weak capability of booth staff and
insufficient amount of personnel lead to low perceived performance, and the combination
of absences is impossible to be compensated by adequate training.
In the fifth configuration, we could see that the complex theme, complicated messages
combined with less competitive booth design and weak staff capability lead to unfavorable
outcome. From the communication perspective, when the message is complicated, the
tools or medians to deliver the message need to be effective; otherwise, the message would
not be perceived successfully by the audience. Moreover, even though fair engagement is
certainly a key element to improve exhibitor’s performance at trade fairs, they could
50
become only meaningless and loosely engaging activities without highly skilled staff to
coordinate the experience.
Considering all previous justifications, the sixth configuration is expected to yield low
performance outcome due to non-appearance of key factors such as design competitiveness
and fair engagement while having the long preparation period. Looking at both models for
High-performance outcome and its negation, we could see that while the causal
relationship is not symmetrical in the high-performance outcome model and its negation,
the key elements of trade fairs displayed in the configuration consistently. The Discussion
chapter would further deliberate the findings to formulate best practice for exhibitors at
trade fairs.
Evaluation of the goodness of solution
In this section, the goodness of solution is evaluated based on the standard of good practice
of FS/QCA reviewed in Schneider and Wagemann’s (2010). This study follows
exploratory research design, in which all of the possible conditions are listed based on
extensive literature research. After that, similar factors are grouped into one preliminary
condition to be added to the survey. The process is then replicated one more time after the
raw data collection, to reduce the property space and also to create the conditions that
could be meaningful in practice. Then the calibrating process is documented in details in
the chapter of Data Collection.
Regarding reporting, to ensure the transparency of research, this thesis reports calibrated
data, truth tables and consistency and coverage measures in the appendix. This practice is
to ensure that the same results could be achieved by any researchers who would replicate
the entire study procedure. In addition, Schneider and Wagemann (2010) clarified the set
of criteria regarding the selection and calibration of conditions as quality guidance for
FS/QCA, which is discussed in the below.
First, the paper noted that “There should always be an explicit and detailed justification for
the (non) selection of cases.” The questionnaire was distributed online through Finnish
Tradeshow Association’s emailing list of exhibitors. The list includes almost 500 contacts
and within those, 53 responses or cases were collected. In the analysis, 50 cases were used
as 3 cases are from governmental organization who exhibited at the fair only for awareness
51
purposes, without any other objectives and performance concern. Thus, the decision was
made to exclude those exhibitors, leaving only the cases that exhibitors clearly use trade
fairs as the marketing tools.
Secondly, best practice in FS/QCA specified that: “The conditions and the outcome should
be selected and conceptualized on the basis of adequate theoretical and empirical prior
knowledge” (Schneider & Wagemann, 2010). This criterion is to maintain the alignment of
FS/QCA with traditional statistical method even though, in contrast to the conventional
quantitative method, FS/QCA allows the re-specification of the calibration as the
continuous process throughout the research. As discussed previously in the research
strategy section, the selected conditions are derived from literature research and later
combined based on the theoretical and empirical justification of the researchers. Also,
calibration rules are well documented to ensure transparency.
In addition, Schneider and Wagemann (2010) also insisted that the number of conditions
should be kept moderate. It is also recommended that, similar to statistical method where
too many independent variables would result in insignificant result, too many conditions in
QCA generates huge number of logical remainders or it would produce the model that
could not be interpreted and meaningless in practice. Following the best practice, this
thesis also starts with several conditions and then reduced to the final property of 8
conditions. Moreover, good practice for reporting membership scores to the cases is
followed by discussing each condition calibration in details in the empirical research
chapter. In this research, no contradicting truth table was found thus the exclusion of
contradicting truth table was not performed.

52
4. DISCUSSION
The purpose of this chapter is to create the connection between empirical findings with the
conceptual framework and to formulate the best practice for trade fair exhibitors. The
literature review chapter discusses how marketing resources affect the performance
outcome, on the corporate level as well as at campaign level such as trade fair exhibition;
this concept-level resources correspond to the group of trade-fair conditions being tested
for the causalities of trade-fair’s performance outcome.
Outcome measurement at tradeshow
As it is discussed in the literature review chapter, outcome measurement of tradeshow is
the central topic for not only academic researchers but also marketing practitioners who
involve trade fair exhibition in their company’s marketing calendars. This study combines
the satisfaction of overall performance and the objective evaluations of achievement levels
of the objectives. It is discovered that while these two qualitative measures should
represent each other, the survey answers show that not all companies are consistent in
measuring the performance satisfaction and objectives achievement. For example, some
answers show high satisfaction in overall performance of tradeshow but at the same times
show low achievement level of all objectives. This inconsistency suggests two
possibilities: first, not all companies have strong understandings and focus on measuring or
monitoring performance outcome of trade fairs and second, outcome of trade fairs should
be measured by multiple dimensions. In fact, the inconsistency of different outcome
measures is not necessarily caused by mistake but rather different constructs of outcome
dimension. Hansen (2004) also attempted to decode the performance outcome of trade
fairs, however, using a different approach of construct categorization using key trade
show’s activities.
Outcome measurement is only enabled when the objectives for the exhibition are decided
properly in advance. Though objective setting is known as the critical first step for
marketing activities including trade fair exhibition, on the other hand, this step could also
be the last item to visit, measure and develop after the execution of trade-show as it drives
the entire process of planning, deployment and measurement of outcomes. Good practice
for objective settings is not anymore unfamiliar to marketing managers, but it must be
enabled by thorough understanding of the Fair organization, the market, the exhibiting

53
competitors and the pool of visitors, in connection with the company’s core business and
its resource. Whilst that it seems evident, there are companies who participate in trade fairs
only to simply keep up with competition without considering other possible objectives.
Despite that this argument might have been relevant in the past with limited channels to
reach out to customers; however, in this marketing era with plenty of options and trade-fair
is among the higher end of investment cost, companies need to be flexible and consider the
carefully the channels to invest their marketing budget, rather than following competition’s
choices.
Design Competitiveness
It is not a surprise that Design Competitiveness is a decisive factor in achieving good
performance outcome of tradeshow, even though there are not plenty of trade fair
literatures that focus on giving directional booth design strategies to exhibitors. As general
impression from this stream of literature, most studies emphasize on the atmospheric
aspect of the booth with the involvement of booth staff to facilitate visitor experience.
However, before visitors exploring the booth and interact with the elements offered by the
brand, they have to make the decision of which booth to visit and which to avoid (Bloch,
Gopalakrishna, Crecelius, & Scatolin Murarolli, 2017). There are several design elements
constructing the booth design competitiveness, and exhibitors need to make the trade-off in
choosing the elements to achieve the objective of the booth, as the exhibition booth cannot
achieve all objectives or satisfy all groups of visitors at the same time (Gilliam, 2015).
Again, clarifying the objectives is the foremost step in planning for trade fair participation
and also in designing a high-performing exhibition display.
Undeniably, design competitiveness is developed critically from the planning and
preparation phases. Companies which are used to exhibiting at trade fairs are likely to
know better how they could become competitive in booth designs and learn from the
competitive booths which at the same time attracts visiting traffic and facilitate smoothly
the visitor experience inside the booth. On the other hand, companies with less experience
or are the new comers in certain trade fair might gain an edge from secondary research to
understand the competition. In addition, using agency specializing in producing trade-fair
booth scape, exhibitors could utilize the industry experiences and design expertise to
determine the optimal booth scape for their brands.
54
Trade-fair engagements
Trade-fair engagement is probably the most popular among the topics that have been
studied regarding trade-fairs and are often reviewed in-depth as three tradeshow stages:
before, during and after the fair. In this study, however, trade fair’s stages are combined as
one visitor engagement condition as the companies are by now well aware of these stages
and it’s up to exhibitors to control the arrangement of the activities to create an engaging
experience for visitors. However, a full membership in trade-fair engagement is only
assigned to the cases with strong focus on almost all the stages with variety of activities in
promoting the fair, interacting with visitors during the exhibition day and following
through with leads after the fair. Looking at the model solutions of outcomes, it’s clear that
fair engagement is a crucial condition to achieve the positive performance outcome.
The result shows that trade-fair engagement activities deliver good impact on the positive
outcome of the fair when they are in the combination with booth theme complexity and
staff capability. Unlike design competitiveness that does not have any link to other
resources once it is all set up, trade-fair engagement contains human-involved activities
and the variety of engagement activities should be adequate with the capability of the staff
who coordinate the activities to build the booth experience for visitors. In addition,
engagement activities are often inspired by the contents from the theme of exhibition,
whether it is about the product, the brand, company founding stories or social causes; thus,
the existence of the theme complexity allow trade-fair activities to build up around the
theme and maximize their engagement effects. Interestingly, the model solution for
negated outcome shows that with the lack of staff capability and design competitiveness,
the complexity of exhibiting theme and variety of engagement activity would impact
negatively on the outcome, indicating that the staff capability is a must-have factor for this
combination to work. Overall, the combination of these three conditions show how
conceptual framework is done in practice where the Marketing planning capability,
represented by Booth Theme complexity condition, is combined with marketing
implementation capability, embedded in trade-fair activities and staff capability, to
produce high-performance outcome of trade fair.
Staffing, Staff training and Staff capability
Personnel resource is the core element for the performance of the firm and its individual
marketing activities including tradeshow exhibition. Different from other resources in the

55
firm’s possession, personnel resource has coordinating role in transforming any other
resources into the outcomes. The focus on personnel resource in this study comes from
extensive literature review where a variety of personnel related independent variables has
been studied and tested to influence trade-fair and general marketing outcomes. This is
relatable to daily business operation where many employees in marketing departments
often have coordinating roles to make use of company’s resources to deliver marketing
objectives.
It is noncontroversial that the sufficient quantity of staff is important for the performance
of the activity as long as the activity is not fully automated by computers. For trade fairs,
sufficient quantity of staff in the planning phase ensures that company’s exhibition at
trade-fair is well-planned and promoted before the fair. At the same time, during the fair
there should be enough staff at booth to coordinate visitor experience, talking to visitors to
identify leads or to research competitor landscape representing at the fair, depending on the
defined objectives. It is not uncommon during the rush hour at trade-fairs that the booths
with low staff density have no choice but losing potential customers to other competitors
as they could not provide visitors with welcoming greetings. On the other hand, exhibition
booths that have too many staff can deliver counter effect as the visitors might feel
threatened to enter the booth with awaiting salespersons. Therefore, task allocation for
staff during the fair should be carefully considered to ensure that visitors experience a
pleasant feeling to explore the fair but they are also timely assisted when in need.
Preparation period
The study shows that time required for trade fair participation varies among companies and
it does not have causal relationship to the success of trade fair. On the other hand, long
preparation period (more than 6 months) appears in the configurations of low performance
outcome. This suggests two things: firstly, trade fair exhibition has become a routine for
many companies and they become more efficient in planning for the event through the
experience. Secondly, it indicates that the concentration on preparation is more critical
than long planning period to the success of the project. To explain, long planning period
could negatively impact the concentration of team members into the project thus lower the
efficiency of the activity. Looking at the solution model, one configuration suggests that
the success of trade-fair would need the presence of long planning period when there is the
existence of information gathering focus. This combination could suggest that longer

56
planning period is beneficial in case companies employ competition landscape and
industry research prior to the fair and they use the opportunity at trade-fair to collect
marketing intelligence. This longer planning period might involve for example developing
an experiment at trade-fair or training booth staff to follow a process to collect information
they need during the limited time at the fair. From the theoretical perspective, preparation
for the fair is enabled by the planning capability of the firm. Companies who understands
its competitiveness and have clear understanding of the situation would be able to regulate
preparation period for the fairs to optimize resourcing and performance.
Information gathering
Market intelligence is important because it supplies companies with the understanding
about the external environment and it drives business strategies to sustain their position in
the market or in better case, to gain an edge over competition. In this era of digitalization,
quantitative data plays an important role in business intelligence, but qualitative insights
gathered by talking face to face with customers, observing how competitors behave and
expose should not be underestimated. Different from quantitative data which could be
automated by nowadays online solutions, qualitative data requires a setup of market
research studies that companies would either purchase from agencies or send their
employees for information gathering tasks for example during trade-fairs. In either forms
that the study would take, qualitative study requires time and effort to design and
implement the studies in order to produce useful insights for their business strategies.
To make the participation at the fair information-gathering focus, it requires good
implementation from the team. As it is suggested in the results, this condition only makes a
return on outcome when it is enabled by the sufficient amount of staff to collect the
information during fair and this step requires good implementation. Though the
information collected at the trade fairs might not lead to any direct actions for companies,
the routine for collecting information creates an addition of internal knowledge for the firm
to strengthen its planning capability. It is essential for firms to generate a culture of
intelligence gathering to enhance the total knowledge bank and it will be useful once the
firm have an opportunity or ability to make sense of the data through researches and
analyses.

57
5. MANAGERIAL IMPLICATION
This chapter summarizes the suggestions for management regarding the practical
implication of this study. Firstly, the study has confirmed the crucial elements for the
success of trade-fair participation: engagement activities at trade fair, booth design and
staffing. In addition, the model suggests the route to success, the configurations to achieve
the high-performance outcome. The configurations emphasize the importance of “single-
minded” booth scape, meaning that the exhibition focuses on the investment of resource in
one aspect instead of trying to be competitive in several activities at trade-fair. Also, the
decision of channeling resources should be driven by clearly defined objectives of the
entire trade fair project. In the other words, when company aims at generating traffic and
drawing visitor attention, booth design competitiveness has to be the main focus of all
activities, and thus most resources are allocated at booth to achieve this aspect to maximize
the its return. Similarly, if the company’s purpose is to gather market intelligence during
the fair, staffing and time resources should be allocated to maximize the performance on
this objective. While big companies could easily outspend small companies in several
aspects of trade-fair investment and thus making it impossible for small players to be
competitive with small budget. However, small companies could focus their resources to
optimize the return-on-investment and still be able to build their own market share by
doing outstanding job in the most important key areas.
Secondly, this study suggests the use of Fuzzy Set Method in marketing research as an
alternative for conventional research methods. With FS/QCA, companies can take
advantage of the enablement for small sample size and the integration of qualitative
insights in a quantitative research. It also enables marketing managers to utilize their
expert knowledge to interpret the collected response data in the useful direction for their
model. Furthermore, the model practicality is straight forward for action implementation
and it allows the unpretentious explanation across functions, as the research process is not
far away from day to day practice which begins with the outcome and exploring the input
combinations to deliver the expected outcome. In the end, the most important goal of
researches in business practice is to help formulating directions and strategies to optimize
business performance or gain an edge over competition; inevitably the application of
FS/QCA fits in with this goal.

58
6. LIMITATION
In this section, the two limitations of the study are discussed, one exists in the collected
data and the other is due to research method. First, the data in this study is collected as a
result from online survey instead of a controlled experiment. The survey was sent out to
contacts of exhibitors who had participated in the trade-fair organized by Finnish
Association of Trade Fair in the previous year and the data is processed in the assumption
that the contact’s opinions well represents the opinion of company as a whole. In many
cases, fair specialists or company management who have expertise in trade fair marketing
are contacted; however, for some cases marketing staff were the ones answered the survey
and thus their answers might not align with management’s opinion due to the gap of
expertise and perspective. In addition, the sample consists of exhibitors in four different
fairs thus the difference of outcome expectations and marketing inputs of exhibitors could
be the moderating factor but it is not discussed in the study.
The other limitation of this research is also the limitation of FS/QCA method itself, lying
under the qualitative side of the method with the qualitative reasoning of the researcher
presenting in the calibration of condition. Noting that the author of this study has not had
commercial experience with trade fair marketing, the qualitative reasoning for forming
condition by combining measures as well as for defining membership scores should be
used with attention. Should the calibration be supported with qualitative interviews with
expert in trade fair marketing, the validity might have been improved. Nevertheless, the
methodology’s limitation is recognized and thus the documentation of the research process
is done transparently so that other researchers could follow the same process to achieve the
same results.
59
REFERENCES
Alberca-Oliver, P., Rodríguez-Oromendía, A., & Parte-Esteban, L. (2015). Measuring the
efficiency of trade shows: A Spanish case study. Tourism Management, 47, 127–137.
https://doi.org/10.1016/j.tourman.2014.09.007
Barney, J. B. (1991). Firm resources and sustained competitive advantage. Journal of
Management, 17(1), 99–120. Retrieved from https://search-proquest-
com.libproxy.aalto.fi/docview/215258436?accountid=27468
Barney, J. B., Ketchen, D. J., & Wright, M. (2011). The future of resource-based theory:
Revitalization or decline? Journal of Management, 37(5), 1299–1315.
https://doi.org/10.1177/0149206310391805
Batra, R., & Keller, K. L. (2016). Integrating Marketing Communications: New Findings,
New Lessons, and New Ideas. Journal of Marketing, 80(6), 122–145.
https://doi.org/10.1509/jm.15.0419
Baumgartner, M., & Thiem, A. (2017). Model Ambiguities in Configurational
Comparative Research. Sociological Methods and Research (Vol. 46).
https://doi.org/10.1177/0049124115610351
Bettis‐Outland, H., Johnston, W. J., & Dale Wilson, R. (2012). Using trade show
information to enhance company success: an empirical investigation. Journal of
Business & Industrial Marketing, 27(5), 384–391.
https://doi.org/10.1108/08858621211236052
Blythe, J. (2000). Objectives and Measures at UK Trade. Journal of Marketing
Management, 16(1–3), 203–222.
Cavanaugh, S. (1976). Setting Objectives and Evaluating the Effectiveness of Trade Show
Exhibits. Journal of Marketing, 40(4), 100–103. https://doi.org/10.2307/1251076
Day, G. S. (1994). The Capabilities of Market-Driven Organizations. Journal of
Marketing, 58(4), 37. https://doi.org/10.2307/1251915
Fiss, P. C. (2007). A set-theoretic approach to organizational configurations. Academy of
Management Review, 32(4), 1190–1198.
https://doi.org/10.5465/AMR.2007.26586092
Gilliam, D. A. (2015). Trade show boothscapes. Journal of Marketing Management,
31(17–18), 1878–1898. https://doi.org/10.1080/0267257X.2015.1071276
Gopalakrishna, S., & Lilien, G. L. (1995). A Three-Stage Model of Industrial Trade Show
Performance. Marketing Science, 14(1), 22. https://doi.org/10.1287/mksc.14.1.22

60
Gopalakrishna, S., Lilien, G. L., Williams, J. D., & Sequeira, I. K. (1995). Do trade shows
pay off? Journal of Marketing, 59(3), 75. https://doi.org/10.2307/1252121
Gopalakrishna, S., & Williams, J. D. (1992). Planning and performance assessment of
industrial trade shows: An exploratory study. International Journal of Research in
Marketing, 9(3), 207–224. https://doi.org/10.1016/0167-8116(92)90018-G
Hansen, K. (1999). Trade Show Performance : A Conceptual Framework and Its
Implications for Future Research. Academy of Marketing Science Review, 8(08).
Hansen, K. (2004). Measuring performance at trade shows - Scale development and
validation. Journal of Business Research, 57(1), 1–13. https://doi.org/10.1016/S0148-
2963(02)00269-2
Herbig, P., Hara, B. O., Palumbo, F. A., Herbig, P., Hara, B. O., & Palumbo, F. A. (2006).
Trade show : who , what , why.
Herbig, P., O’Hara, B., & Palumbo, F. (1997). Differences between trade show exhibitors
and non‐exhibitors. Journal of Business & Industrial Marketing, 12(6), 368–382.
https://doi.org/10.1108/08858629710190222
Hooley, G. J., Greenley, G. E., Cadogan, J. W., & Fahy, J. (2005). The performance
impact of marketing resources. Journal of Business Research, 58(1 SPEC.ISS), 18–
27. https://doi.org/10.1016/S0148-2963(03)00109-7
Kerin, R. A., & Cron, W. L. (1987). Assessing Trade Show Functions and Performance:
An Exploratory Study. Journal of Marketing, 51(July 1987), 87–94.
https://doi.org/10.2307/1251649
Korhonen, K. (2016). Measuring marketing productivity A comparative study between
fuzzy-set and regression analysis. Aalto University.
Lee, C. H., & Kim, S. Y. (2008). Differential effects of determinants on multi-dimensions
of trade show performance: By three stages of pre-show, at-show, and post-show
activities. Industrial Marketing Management, 37(7), 784–796.
https://doi.org/10.1016/j.indmarman.2008.01.006
Lilien, G. L., & Rangaswamy, A. (1998). Marketing Engineering: Computer-Assisted
Marketing Analysis and Planning. Addison-Wesley Pub Co (Sd).
Ling‐yee, L. (2006). Relationship learning at trade shows: Its antecedents and
consequences. Industrial Marketing Management, 35(2), 166–177.
https://doi.org/10.1016/j.indmarman.2005.03.006
Ling‐yee, L. (2007). The effects of firm resources on trade show performance: how do
trade show marketing processes matter? Journal of Business & Industrial Marketing,

61
23(1), 35–47. https://doi.org/10.1108/08858620810841470
Ling‐yee, L. (2010). Antecedents and effect of internet implementation for trade shows.
Journal of Business & Industrial Marketing, 25(4), 272–283.
https://doi.org/10.1108/08858621011038234
Miranda, S., Tavares, P., & Queiró, R. (2017). Perceived service quality and customer
satisfaction: A fuzzy set QCA approach in the railway sector. Journal of Business
Research, (July), 1–7. https://doi.org/10.1016/j.jbusres.2017.12.040
Morgan, N. A., Clark, B. H., & Gooner, R. (2002). Marketing productivity, marketing
audits, and systems for marketing performance assessment: Integrating multiple
perspectives. Journal of Business Research, 55(5), 363–375.
https://doi.org/10.1016/S0148-2963(00)00162-4
Morgan, N. A., Vorhies, D. W., & Mason, C. H. (2009). Market orientation, marketing
capabilities, and firm performance. Strategic Management Journal, 30(8), 909–920.
https://doi.org/10.1002/smj.764
Morgan, N. A., Zou, S., Vohries, D. W., & Katsikeas, C. (2003). Experiential and
Informational Knowledge , Architectural Marketing ... Decision Sciences, 34(2), 287–
321. https://doi.org/10.1111/1540-5915.02375
Ngo, L. V., & O’Cass, A. (2012). Performance implications of market orientation,
marketing resources, and marketing capabilities. Journal of Marketing Management,
28(1–2), 173–187. https://doi.org/10.1080/0267257X.2011.621443
O’Hara, B. S. (1993). Evaluating the effectiveness of trade shows: A personal selling
perspective. Journal of Personal Selling and Sales Management, 13(3), 68–77.
https://doi.org/10.1080/08853134.1993.10753958
Phelps, J., & Johnson, E. (1996). Entering the quagmire: Examining the ‖meaning’ of
integrated marketing communications. Journal of Marketing Communications, 2(3),
159–172. https://doi.org/10.1080/135272696346123
Ragin, C. C. (2006). Set relations in social research: Evaluating their consistency and
coverage. Political Analysis, 14(3), 291–310. https://doi.org/10.1093/pan/mpj019
Ragin, C. C. (2014). The Comparative Method : Moving Beyond Qualitative and
Quantitative Strategies. Oakland, California: University of California Press.
Reid, M., Luxton, S., & Mavondo, F. (2005). The relationship between integrated
marketing communication, market orientation, and brand orientation. Journal of
Advertising, 34(4), 11–23. https://doi.org/10.1080/00913367.2005.10639210
Rosson, P. J., & Fairs, T. (2001). Firm Experience and International Trade Fairs. Journal
62
of Marketing, 0(519), 877–901.
Sarmento, M., Farhangmehr, M., & Simões, C. (2015). Participating in Business-to-
Business Trade Fairs: Does the Buying Function Matter? Journal of Convention and
Event Tourism, 16(4), 273–297. https://doi.org/10.1080/15470148.2015.1043608
Schneider, C. Q., & Wagemann, C. (2010). Standards of Good Practice in Qualitative
Comparative Analysis (QCA) and Fuzzy-Sets. Comparative Sociology, 9(3), 397–
418. https://doi.org/10.1163/156913210X12493538729793
Schultz, Don E. ; Tannenbaum, Stanley I. ; Lauterborn, R. F. (1993). Integrated marketing
communications. Lincolnwood (IL) : NTC Business Books 1993.
Seringhaus, F. H. R., & Rosson, P. (2004). An analysis model for performance
measurement of international trade fair exhibitors. Problems and Perspectives in
Management, 2(4), 152–165.
Seringhaus, F. H. R., & Rosson, P. J. (1999). An Analysis Model for Performance
Measurement of International Trade Fair Exhibitors. American Marketing
Association. Conference Proceedings-Summer 1999, 1–22.
Sirén, A. (2017). What to Gain from Trade Show Information. Aalto University. Retrieved
from http://urn.fi/URN:NBN:fi:aalto-201712208309
Tafesse, W., & Kitchen, P. J. (2017). IMC - An integrative review. International Journal
of Advertising, 36(2), 210–226. https://doi.org/10.1080/02650487.2015.1114168
Tafesse, W., & Korneliussen, T. (2013). Examining the effect of using multiple media
tools on the marketing performance of organizations in a trade campaign
environment. Journal of Marketing Communications, 19(3), 215–227.
https://doi.org/10.1080/13527266.2011.619556
Tafesse, W., & Skallerud, K. (2017). A systematic review of the trade show marketing
literature: 1980–2014. Industrial Marketing Management, 63, 18–30.
https://doi.org/10.1016/j.indmarman.2016.11.001
Tanner, J. F. (2002). Leveling the playing field: Factors influencing trade show success for
small companies. Industrial Marketing Management, 31(3), 229–239.
https://doi.org/10.1016/S0019-8501(00)00132-2
The Global Association of the Exhibition Industry. (2019). Global economic impact of
exhibitions, (December). Retrieved from https://www.ufi.org/wp-
content/uploads/2019/04/Global-Economic- Impact-of-Exhibitions_b.pdf%0A
Thomann, E., Oana, I.-E., & Wittwer, S. (2017). Performing fuzzy- and crisp set QCA with
R. A user-oriented beginner’s guide. Version 07.04.2017.

63
https://doi.org/10.1371/journal.pone.0117245
Vassinen, A. (2012). Configurational Explaination of Marketing Outcomes: A Fuzzy-Set
Qualitative Comparative Analysis Approach. Aalto University.
Vorhies, D. W. (1998). An investigation of the factors leading to the development of
marketing capabilities and organizational effectiveness. Journal of Strategic
Marketing, 6, 3–23.

64
APPENDIX
Truth Table of High-Performance Outcome

65
Complex Solution - High Performance Outcome
Parsimony Solution – High Performance Outcome

66
Truth Table of Low Performance Outcome
Complex Solution – Low Performance Outcome

67

68
Parsimony Solution – Low Performance Outcome

69
Questionnaire

70
71

72

73

74
75
76

77

78

79

80