Assessment of the Water Quality of Troia for the Multipurpose Usages
14
Assessment of the Water Quality of Troia for the Multipurpose Usages Hasan Özcan & Hüseyin Ekinci & Alper Baba & Yasemin Kavdır & Orhan Yüksel & Yusuf Yi ˘ gini Received: 16 March 2006 / Accepted: 18 July 2006 / Published online: 28 October 2006 # Springer Science + Business Media B.V. 2006 Abstract The aim of this study was to determine the origin and quality of waters in Troia. For this purpose total of 25 water samples including 2 springs, 14 surfaces and 9 groundwaters, were collected at eight different times. Global positioning system (GPS) was used to determine to coordinates of sampling points. The concentration of 6 minor elements (B, Cu, F, Fe, Pb and Zn), 9 major anions and cations (Na + , Ca 2+ , K + , Mg 2+ , SO 4 2− , PO 4 3− , HCO 3 − , Cl − and, CO 3 2− ) were determined by spectrometric, colorimetric and volu- metric methods. Water pH, EC, DO, ORP and TDS were measured in situ using probes. The data showed that the concentrations of most of minor elements were below the EPA and TSE limits except Pb which ranged between 0.001 and 4.832 mg L −1 . Statistically signif- icant relationships (P < 0.01 and r > 0.70) were ob- served between Fe and Cu, Cu and K + , Cu and Ca 2+ , B and Na + , Na + and K + . Assessing the water based on irrigation using Wilcox model showed that some well waters were not suitable for irrigation. Troia water was found to be highly corrosive and the average corrosion coefficients varied from 0.5 to 4.6. Accord- ing to the Piper and Schoeller diagrams results, the water in Troia was classified as mixed water type. Keywords Water quality . Heavy metals . Troia . Anion . Cation . Corrosion coefficient 1 Introduction Millions of migratory birds connect the continents of Europe, Asia and Africa. The Troia is an important ecological building block within the international migratory bird system. Now, the natural area is in jeopardy due to the increased usage of the land that threatens the function of the Troia as a resting place for migratory birds (Schwaderer, 2003). The agricul- tural usage of Troia land has become widespread and intensified. The environmental changes in the past four decades have had dramatic effects on migratory birds. This has been directly connected to the depletion of wetlands and also water quality. Water sources are very important for Troia National Park. The Turkish Government has designated a historical national park in 1996 and UNESCO declared the archaeological riches of Troia a world cultural heritage in 1998. Environ Monit Assess (2007) 130:389–402 DOI 10.1007/s10661-006-9406-3 H. Özcan (*) : H. Ekinci : Y. Kavdır : Y. Yi ˘ gini Department of Soil Science, Agricultural Faculty, Canakkale Onsekiz Mart University, 17020 Canakkale, Turkey e-mail: [email protected] A. Baba Department of Geological Engineering, Engineering Faculty, Canakkale Onsekiz Mart University, 17020 Canakkale, Turkey O. Yüksel Bayramiç Vocational School, Canakkale Onsekiz Mart University, 17020 Canakkale, Turkey
-
Upload
independent -
Category
Documents
-
view
0 -
download
0
Transcript of Assessment of the Water Quality of Troia for the Multipurpose Usages

Assessment of the Water Quality of Troia forthe Multipurpose Usages
Hasan Özcan & Hüseyin Ekinci & Alper Baba & Yasemin Kavdır &
Orhan Yüksel & Yusuf Yigini
Received: 16 March 2006 /Accepted: 18 July 2006 / Published online: 28 October 2006# Springer Science + Business Media B.V. 2006
Abstract The aim of this study was to determine theorigin and quality of waters in Troia. For this purposetotal of 25 water samples including 2 springs, 14surfaces and 9 groundwaters, were collected at eightdifferent times. Global positioning system (GPS) wasused to determine to coordinates of sampling points.The concentration of 6 minor elements (B, Cu, F, Fe,Pb and Zn), 9 major anions and cations (Na+, Ca2+,K+, Mg2+, SO4
2−, PO43−, HCO3
−, Cl− and, CO32−) were
determined by spectrometric, colorimetric and volu-metric methods. Water pH, EC, DO, ORP and TDSwere measured in situ using probes. The data showedthat the concentrations of most of minor elements werebelow the EPA and TSE limits except Pb which rangedbetween 0.001 and 4.832 mg L−1. Statistically signif-icant relationships (P < 0.01 and r > 0.70) were ob-served between Fe and Cu, Cu and K+, Cu and Ca2+,
B and Na+, Na+ and K+. Assessing the water based onirrigation using Wilcox model showed that some wellwaters were not suitable for irrigation. Troia waterwas found to be highly corrosive and the averagecorrosion coefficients varied from 0.5 to 4.6. Accord-ing to the Piper and Schoeller diagrams results, thewater in Troia was classified as mixed water type.
Keywords Water quality . Heavy metals . Troia .
Anion . Cation . Corrosion coefficient
1 Introduction
Millions of migratory birds connect the continents ofEurope, Asia and Africa. The Troia is an importantecological building block within the internationalmigratory bird system. Now, the natural area is injeopardy due to the increased usage of the land thatthreatens the function of the Troia as a resting placefor migratory birds (Schwaderer, 2003). The agricul-tural usage of Troia land has become widespread andintensified. The environmental changes in the pastfour decades have had dramatic effects on migratorybirds. This has been directly connected to thedepletion of wetlands and also water quality. Watersources are very important for Troia National Park.The Turkish Government has designated a historicalnational park in 1996 and UNESCO declared thearchaeological riches of Troia a world culturalheritage in 1998.
Environ Monit Assess (2007) 130:389–402DOI 10.1007/s10661-006-9406-3
H. Özcan (*) :H. Ekinci :Y. Kavdır :Y. YiginiDepartment of Soil Science, Agricultural Faculty,Canakkale Onsekiz Mart University,17020 Canakkale, Turkeye-mail: [email protected]
A. BabaDepartment of Geological Engineering,Engineering Faculty, Canakkale Onsekiz Mart University,17020 Canakkale, Turkey
O. YükselBayramiç Vocational School,Canakkale Onsekiz Mart University,17020 Canakkale, Turkey

According to topographical map (1:25,000 scale)edited in 1957, majority of lands in Troia werewetlands and swamps. Beside the area around theKırkgoz springs, some lower lands were also swamp.At the end of 1960s, the constructions of drainage
canals and intensive agriculture took place in the area.Irrigation from the 6 to 10 m deep wells caused thedecline of groundwater levels (DSI, 1996).
Water is very vital for nature and can be a limitingresource to men and other living beings. Water quality is
Figure 1 Location map of thestudy area.
390 Environ Monit Assess (2007) 130:389–402

influenced by natural and anthropogenic effects includinglocal climate, geology etc., and construction of dams andembankments, irrigation practices (Rahman, Hassan,Islam, & Shamsad, 2000). Understanding the sources,their interaction, and effects of water pollutants isessential for controlling pollutants (Manahan, 1994).One of the most significant contaminants in the waters isheavy metals such as copper, zinc and lead (Chatzoudis& Rigas, 1998; Farid, Atta, Rashid, Munnink, &Platenburge, 1993; Laxen & Harrison, 1977; Mendoza,Cortex, & Munoz, 1996; Selim & Iskandar, 1992).Copper is known as not cumulative systemic poison,however large dose (>100 mg) of copper are harmful tohumans and might cause central nervous system disorderand adverse effects on Fe-metabolism that results in liverdamage. Excess copper may also be deposited in the
eyes, brain, skin, pancreas and myocardium (McAnally,Pinto, & Flora, 1997). Lead is a cumulative poison tohumans and its major effects are impairment ofhemoglobin and porphyrins synthesis. Zinc causemuscular weaknesses and pain, irritability and nausea(AWWA, 1990).
Drainage from the active and abandoned mines(Emrich & Merritt, 1969), underground or above-ground disposal practices of domestic, municipal, orindustrial liquid (Miller, 1980; U.S. EPA, 1977), theuse of fertilizers and pesticides in agricultural oper-ations (Hassan, 1974) and, saltwater intrusion (Todd,1974) can produce a variety of groundwater pollutionproblems.
In the last century, the impact of changing land usepatterns caused stress on all types of water bodies,
Figure 2 Geological map of the study area (simplified from MTA, 2002).
Environ Monit Assess (2007) 130:389–402 391

including those under the ground. Surface water qualitymonitoring is very important to support terrestrialecosystem (Ning & Chang, 2003). Water qualitypertaining to shallow coastal aquifers has recently beenstudied worldwide for different purposes (Baba et al.,2001; Babu, Hindi, Da, & Bittencourt, 2002; Malcolm& Soulsby, 2001).
The Troia is very important place in terms of forhistory, tourism, agriculture, wetland and migratoryroute of birds. Names of some birds observed at studyarea were white stork (Ciciona ciciona), swallow(Hirundo rustica), falcon (Buteo buteo) and nightin-gale (Luscinia megarhynhos). The water systems andqualities must be determined and monitored. For thisreason, the objectives of this study were;
(a) the preliminary investigation and interpretationof hydrochemical properties of water
(b) to determine the water pollution level in andaround Troia National Park
2 Study Area
Study area was one of the oldest and most famousarchaeological sites in northwest Turkey at the southentrance of the Dardanelles (Figure 1). The settlementmound of Troy was situated in an excellent strategicposition between Europe and Asia continents. Troia isin conjunction with the special conditions of thecurrents and winds, favored trade and culturalcontacts. Study area is in the Troia National Parkand surrounded by dried canals, which are Kokona onthe east and Kırkgoz (Azmak) on the west.
3 Geology and Hydrogeology
General geology of the area in the vicinity of Troia ispresented in Figure 2. Geological structures aroundthe Troia consist of five main rocks groups. Meta-morphic crystalline schist and marble constitute thebasement rocks of the area. These are unconformablyoverlain by ultramafic and plutonic rocks. A volcanicformation overlies unconformable the ultramafic andplutonic rocks. These rocks consist of basalt, dasite,rhyolite, rhyodasite, andesite and pyroclastics. Thesedimentary rocks overlie unconformably the meta-morphic, ultramafic and volcanic rocks. Sedimentary
rocks consist of sand, clay and limestone of marinefacies (Kayan, 2000). The Quaternary alluvium is theyoungest unit and covers a large extension in thestudy area (Figure 2).
Study area consists of two different physiograph-ical units. These are: flood plain soils (young and oldriver terraces) and delta soils. Study area is mainly flatand slightly sloped. Top soil texture varies from lightto heavy; 46% of these are light, and 27% are heavyand 26% are medium textured soils (DSI, 1996).Because of the alluvial properties of these soils, sanddeposits lay below 2 m from the surface. These soilsformed on the sediments carried by Karamenderesand Dumrek rivers (Kayan, 2000). Their hydraulicconductivities are high and soil organic mattercontents ranges from 0.1% and 4%. The farms inthe area range from 0.2 to 7.9 ha in size and primarilyproduce wheat, cotton, tomato followed by corn,sunflower, alfalfa, pepper, rice or forages.
The Mediterranean climate prevails in the area.The average annual rainfall in Troia is around600 mm. In last 3 years, minimum rainfall was439 mm and maximum was 765 mm. Averagetemperatures of 3 years was 15.8°C and evaporationwas 1,266 mm.
The most important source of fresh water aroundTroia is the Karamenderes River. This river origi-nates in the northern slopes of the Ida Mountainsand collects surface waters from the greater part ofthe Biga Peninsula; it then brings them to the flood-delta plain to the west of Troia. The catchment areaof the river from Ida Mountain to Bayramic dam is435 km2 while the total catchment from Ida Mountainto the Dardanelles is 1,962 km2 (DSI, 1996). TheKaramenderes River was blocked on the TroiaNational Park border by a small dam at AraplarBogazi. This will affect the hydrological system of theKaramenderes River and it is more than likely thatagricultural irrigation of the plains will be intensified(Schwaderer, 2003). Other sources are wells, whichhave 6 to 10 m depths, two springs (Düden andKırkgöz) and drainage canals. All water sources areused for irrigation and drinking water for cows, sheepand birds. One of springs is to the south of theKaramenderes River, near Pınarbaşı (KırkgözSprings) and the other is the Düden springs to thenorth (see Figure 3) and about 17 m higher than sealevel. These karstic springs are located at theintersection of the Pınarbaşı fault and other major
392 Environ Monit Assess (2007) 130:389–402
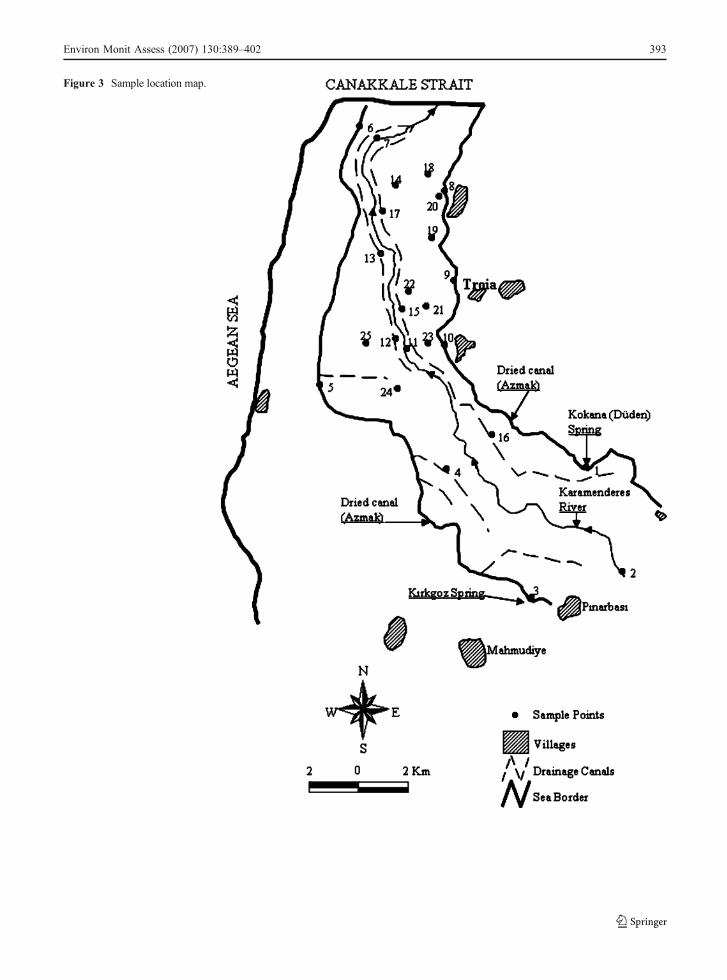
Figure 3 Sample location map.
Environ Monit Assess (2007) 130:389–402 393

faults extending NW-SE, which form the southernpart of the Karamenderes plain (Kayan, 2000).
4 Experimental
4.1 Sampling
A survey was conducted from December 2002 toSeptember 2003 in five water resources and 25 pointsinTroia (KumkaleBasin), Canakkale, Turkey (Figure 3).Water samples were collected every 2 months duringthe winter period and every month during the irrigationperiod. Sampling were done in December 2002,January 2003, March 2003, May 2003, June 2003,July 2003, August 2003 and September 2003. Globalpositioning system (GPS) was used to determine thecoordinates of sampling points.
Water samples were collected from wells where noirrigation infrastructures were available. Total of 14
samples were taken from surface water in eachsampling time (Figure 3). Collected water sampleswere field stored in a cooler on ice and brought to alab. Any samples that cannot be analyzed in the fieldor at the lab are transferred to a refrigerator and storedat 4°C. Samples were preserved according to specifictest requirements and immediately analyzed for B, F,Cu, Fe, Pb, Zn, PO4
3−, Ca2+, Mg2+, Na+, K+, CO32−,
HCO3−, SO4
2− and Cl− ions according to APHA-AWWA-WCPF 3110 (1992) (Table I). All watersamples were filtered through Whatman No: 42 filterpapers before analyzing. The pH of water samples forheavy metal analyses was adjusted to pH 2 by nitricacid (HNO3) addition. Also blank was prepared withdouble-distilled deionized water contain one to fivedrops concentrated nitric acid. Concentrations of B,Cu, F, Fe, Pb, and Zn were determined by inductivelycoupled plasma-atomic emission spectroscopy (ICP-AES) with an axial-view torch (Perkin Elmer Optima3000 XL). Calibration standards for each analysiswere made from certified standards of individualelements acquired from AccuStandard Inc. Sets ofthree different concentrations of standards were usedto establish a calibration curve.
The pH, electrical conductivity (Spcond), dissolvedoxygen (DO), total dissolved solid (TDS) and oxida-tion–reduction potential (ORP) were measured atsampling site using WTWmulti-parameter instrument.
The correlation coefficients of the calibration curveswere varied between 0.985 and 0.995. In order tominimize matrix effects, blanks and standard solutionswere accurately matched with the samples with respectto matrix. Blanks and standards of known concentrations
Table I Analytical methods (APHA-AWWA-WCPF 3110,1992)
Ions Analytical methods
Na+, K+ Flame photometerand ICP
Ca2+, Mg2+ Volumetricand ICP
CO32−, HCO3
−, Cl− VolumetricSO4
2−, F ColorimetricCu, Fe, Zn, PO4
3− ColorimetricB, F, Cu, Fe, Pb, Zn, P ICP-AES
Figure 4 Ionic balance reactionerror.
394 Environ Monit Assess (2007) 130:389–402

were run periodically throughout the analyses as quality-control checks.
LaMotte smart colorimeter and its kits were usedfor Cu, F, Fe, SO4
2−, PO43− and, Zn analyzing. Chloride,
bicarbonate and, carbonate analyses of water sampleswere performed according to Soil Survey Staff (1996).For all of above analysis, three replicates were ana-lyzed. Any replicate that deviates more than ±10% ofthe mean was recorded and reanalyzed.
Multiple regression analysis was done for allparameters by using SPSS (1988).
5 Results and Discussion
5.1 Quality of chemical data
It is an important step, before any manipulation ofchemical data, to ascertain its quality. The accuracy ofchemical data can be checked by computation of ioniccharge balance error which is explained below (Lloyd
& Heathcote, 1985; Mandel & Shiftan, 1981);
ReactionError ¼P
cations�Panions
Pcationsþ anionsð Þ � 100
∑ cations: sum of meq L−1 concentrations of cations∑ anions: sum of meq L−1 concentrations of anionsIf the reaction error of chemical data set is greater
than 10% therefore qualities of analysis questionable.In this study, reaction errors are given in Figure 4. Allthe reaction errors are within 10% range. Thereforethe quality of chemical data is acceptable according toionic charge balance criteria.
5.2 Anions and cations
Average values of major anions and cations measuredduring the 8 months period were presented in Table II.These results were plotted on Scholler and Piper dia-grams (Figures 5 and 6). According to Piper diagram(Figure 5) the samples 1, 3, 4, 7 and 8 are rich withinMg2+-Ca2+-Cl−-HCO3
− ions whereas the samples 5, 6,
Table II The average value of major element in Troia water resources (mg L−1)
Type Sample number Na+ K+ Ca2+ Mg2+ S042− HCO3
− Cl− PO43−
Spring 1 43.53 3.19 63.46 54.51 27.63 279.35 173.78 1.0083 41.53 3.05 86.11 53.72 23.13 353.34 162.49 0.503
Surface water 2 33.32 4.14 46.24 57.40 33.38 238.84 146.28 0.9564 106.20 3.08 41.33 58.95 64.38 284.26 199.98 0.8625 34.11 2.57 65.57 55.50 30.13 265.83 171.24 0.7446 38.16 5.43 48.84 64.75 36.63 276.66 169.73 0.9787 40.42 3.30 54.53 45.56 35.75 205.40 141.92 0.9348 78.67 4.01 53.86 60.39 41.38 340.34 177.59 2.03610 56.80 3.96 47.90 58.93 43.38 205.29 210.13 0.80811 43.33 3.10 39.81 53.63 35.50 238.38 131.76 1.04912 395.39 5.13 33.40 81.71 76.71 883.36 347.66 1.07013 389.30 5.21 49.35 60.59 62.00 456.04 591.69 1.46714 77.34 5.48 54.66 45.16 35.90 207.05 223.88 0.71215 108.32 3.85 63.92 57.59 58.13 290.40 239.16 0.55116 60.29 2.88 69.04 33.28 42.50 224.34 161.53 0.81517 76.88 5.34 61.70 48.33 37.13 273.93 200.41 1.946
Groundwater 9 322.80 2.66 83.11 59.76 338.63 405.18 375.66 0.59618 432.02 17.26 108.72 88.25 486.29 253.86 698.39 0.78719 345.58 17.71 85.38 83.73 552.14 289.44 418.11 1.09120 475.94 16.16 178.09 49.23 739.63 275.63 564.03 1.06621 224.68 11.55 136.96 56.50 343.14 363.76 316.58 1.01822 414.44 13.12 79.12 41.51 13.86 341.73 705.66 0.65323 108.73 6.19 56.54 47.25 57.14 277.93 205.81 0.82424 234.86 16.02 92.37 49.68 173.29 321.90 392.46 1.42925 365.54 9.71 80.80 75.31 256.71 455.33 558.29 1.977
Environ Monit Assess (2007) 130:389–402 395

10, 13 show major adjacent cations with Mg2+-Na+-Ca2+-Cl−-HCO3
− ions. Well samples 20, 21, 24 arerich with Na+-Ca2+-Mg2+-Cl−-SO4
2− while 18, 19 arerich with Na+-Mg2+-Cl−-SO4
2− and 23, 25 rich withNa+-Mg2+-Cl−-HCO3
−. According to Piper it can besaid that, well waters are rich in Na and Cl. Thissituation seems to reveal that the wells in the areahave been affected by seawater intrusion.
Schoeller diagram (Figure 6) show that water in theregion could be classified into three different groups.Especially samples 1, 2, 3, 4, 5, 6, 7, 8, 9, 10, 13, 14,15 and 16 were similar to each other which wereclassified as rich with Mg2+-Cl−-HCO3
−. Samples 17,18, 19, 20, 21, 24 and 25 were rich with Na+-Cl−, andsamples 11, 12 and 22 were rich with Na+-HCO3
−.Groundwater can be rich with any ion depending
on the chemical composition of the land. Generallywater sampled from aquifers of Kumkale Basinshowed different properties. Spatial lithologicalchanges within rocks, change of ions, increase of
solubility, reduction of sulphates etc. can partiallyaffect the properties of groundwater. For instance,when samples 9 and 18 are compared it can be seen thatconcentration of SO4
2−/Cl− is decreasing when ground-water approaches to Dardanelles. Similarly concentra-tion of Ca2+/Mg2+ is decreasing by approaching toDardanelles.
Sulphate concentrations of water wells were foundto be very high because of gypsum layers in thealluvium aquifer which were extensively heteroge-neous in lithology. Much of the sulphate could beleached by rain because of shallow wells and highgroundwater level in the region. Beside that, wellnumbers 18, 19, 20 and 21 had interesting tectonicmorphology and these wells had also high concen-trations of Na+ and sulphate suggested that thesewells could be affected by tectonics movements.Another reason could be the mixing of these waterswith hydrothermal fluids (Tuzla and Kestanbol ther-mal waters are located near the research area).
Figure 5 Chemical analysis ofwater of the study area plottedon Schoeller diagram.
396 Environ Monit Assess (2007) 130:389–402

Figure 6 Chemical analysis ofwater of the study area plottedon Piper diagram.
Table III The average value of EC, pH, TDS, DO, ORP, SAR and Total hardness in Troia water resources (mg L−1)
Type Sample number EC dS m−1 TDS g L−1 DO mg L−1 pH ORP mV SAR Total hardness mg L-1
Spring 1 0.720 0.469 7.82 7.73 51.63 0.97 3833 0.571 0.370 7.31 7.63 57.60 0.87 436
Surface water 2 0.499 0.324 7.61 7.77 56.68 0.79 3524 0.798 0.520 7.38 7.74 61.26 2.93 3465 0.573 0.370 7.27 7.65 67.24 0.78 3926 0.641 0.413 8.09 7.66 62.43 0.85 3887 0.550 0.472 7.64 7.81 69.36 0.99 3248 0.927 0.602 6.83 7.67 70.43 1.73 38310 0.715 0.464 7.31 7.63 68.21 1.30 36211 0.616 0.401 8.45 7.93 62.38 1.08 32012 1.763 1.148 7.06 8.14 56.48 8.53 42013 2.650 1.716 6.33 7.75 63.18 9.59 37314 1.052 0.685 6.89 7.72 62.04 1.80 32215 1.031 0.663 7.55 7.72 55.46 1.85 35316 0.729 0.473 7.71 7.84 67.23 1.55 30917 0.677 0.441 7.61 7.66 62.08 2.69 397
Groundwater 9 2.255 1.468 6.10 7.38 83.98 6.64 45318 4.599 2.996 5.08 7.27 78.26 6.82 63519 2.119 1.380 6.71 7.49 71.35 6.61 55820 3.820 2.487 7.39 7.53 62.09 8.73 64721 2.861 1.859 6.24 7.56 47.50 4.89 57522 3.462 2.305 5.06 7.66 64.81 9.09 36823 1.098 0.707 6.54 7.77 47.64 2.64 33624 2.375 1.543 6.86 7.54 66.44 5.13 43525 2.350 1.529 6.68 7.68 67.89 7.21 512
Environ Monit Assess (2007) 130:389–402 397

Kayan (2000) reported that in the Iliad Homermentioned hot and cold springs although there is nohot springs today in the vicinity of Troia. This could bebecause of thick alluvial sedimentation along the baseof the slope. It could be assumed that some warm-water would have continually come from rather smallsprings beneath the alluvium, which was about 10–15 m thick in some places. This water could diffuse inthe loose alluvium mixing into the present water-table.
The average concentrations of PO43− in samples
were between 0.503–2.036 mg L−1. The highest con-centration of PO4
3− was found in sample number8 (Table II) which was regularly polluted by thedischarges of the Kumkale Village sewage.
The pH values of water were between 7.03 (surface)–8.88 (well) (Table III). The mean values of dissolvedoxygen (DO) were high at all stations. Minimum valuewas 1.40 mg L−1 in well water and 12.08 mg L−1 insurface water. Average DO values were between 5.06–8.45 mg L−1 (Table III). It is expected that DO valueshould be around 10 mg L−1 in non-polluted waters. Asdissolved oxygen levels in water drop below 5.0 mg/l,aquatic life is put under stress. Oxygen levels that
remain below 1–2 mg L−1 for a few hours can result inlarge fish kills (Anonymous, 2004). The electricalconductivity is a valuable indicator of the amount ofmaterial dissolved in water; and its values ranged from0.571 to 4,599 dS m−1 (Table III). The recommendedvalue of EC for potable water is 2.5 dS m−1 (WHO,1993). The high electrical conductivity values in somewell water samples showed that they were unsuitablefor human consumption and irrigation. Total dissolvedsolids (TDS) indicate the general nature of waterquality or salinity. Water samples containing less than0.5 g L−1 of TDS is considered the Ist class water andover 5.0 g L−1 is the IVth class water according toinland water resource quality criteria (DSI, 2001). TDSvalues were between 0.229 and 4.486 in Troia watersamples therefore they can be classified between the 1stand IVth class.
EC values over 5 dSm−1 are not suitable for livestockand over 7 dS m−1 is not suitable for poultry. Our resultsshow that EC values of water were suitable for poultry.Average values of ECwere less than 5 dSm−1 (Table III),however due to temporal variations during the year; thesevalues can be lower or higher than limit value.
Figure 7 Wilcox diagram for irrigation classification of thewater (summer seasons).
Figure 8 Wilcox diagram for irrigation classification of thewater (winter seasons).
398 Environ Monit Assess (2007) 130:389–402
Average sodium absorption ratios (SAR) werebetween 0.78 and 9.59 in the area (Table III). Generallythe values of SAR in groundwater samples werehigher than those of surface water.
Oxidation–reduction potential (ORP) provides ameasurement of the oxidizing or reducing properties ofthe water. The oxidizing nature of water has implica-tions in its ability to support life. Average oxidation andreduction potentials (ORP) were between 47.50 mVand83.98 mV in the study area (Table III).
The hardness of water can naturally range fromzero to hundreds of milligrams per liter (or parts permillion). Waters with a total hardness in the range of 0to 60 mg L−1 are termed soft; from 60 to 120 mg L−1
moderately hard; from 120 to 180 mg L−1 hard; andabove 180 mg L−1 very hard (Ayyildiz, 1983). In thisstudy water samples can be classified as very hard(Table III).
5.3 Trace elements and heavy metals
B, Cu, Fe, F, Pb and Zn analysis of water sampleswere done and compared with standard values forpotable water suggested by U.S. EPA (2003), WHO(1963) and TSE (1997) (Table III). B, Cu, F and, Znvalues were lower than the standard values for potablewater. However, Pb concentration was above the US.EPA limits ranging from 0.001 to 4.832 mg L−1.Industries do not exist in the catchment area butaltered volcanic rocks are widespread in the studyarea. These altered rocks have some ore depositsminerals such as lead that could be washed around thearea and accumulated in the Kumkale Plain. Theminimum average Pb value (0.086 mg L−1) was 6times and the maximum average Pb value was 50times greater than those permitted by EPA (0.015 mgL−1) for drinking water.
Table IV The average value of minor element in Troia water resources (mg L−1)
Type Sample number B Zn Pb F Cu Fe
Spring 1 0.180 0.108 0.087 0.203 0.021 0.1513 0.198 0.097 0.468 0.156 0.039 0.053
Surface water 2 0.125 0.102 0.574 0.094 0.063 0.0764 0.225 0.087 0.150 0.149 0.029 0.0785 0.131 0.076 0.182 0.218 0.043 0.0686 0.211 0.150 0.145 0.189 0.029 0.1687 0.344 0.089 0.152 0.136 0.031 0.0548 0.340 0.076 0.136 0.238 0.117 0.12210 0.178 0.110 0.626 0.216 0.017 0.13511 0.412 0.119 0.122 0.184 0.023 0.08412 0.631 0.253 0.497 0.543 0.063 0.11113 0.772 0.179 0.243 0.397 0.064 0.25414 0.297 0.336 0.419 0.170 0.025 0.06415 0.313 0.323 0.291 0.270 0.028 0.06816 0.449 0.127 0.135 0.207 0.041 0.07217 0.464 0.145 0.161 0.164 0.091 0.129
Groundwater 9 0.357 0.171 0.234 0.406 0.019 0.26118 0.659 0.620 0.100 0.127 0.517 4.65619 0.379 0.125 0.344 0.249 0.048 0.48720 0.456 0.144 0.741 0.603 0.629 2.22921 0.479 0.484 0.083 0.253 0.048 0.52922 0.465 0.323 0.158 0.340 0.160 1.28123 0.356 0.136 0.133 0.309 0.022 0.22024 0.671 0.629 0.086 0.140 0.291 0.09125 0.926 0.471 0.207 0.357 0.057 0.239
U.S. EPA (2003) – 5 0.015 4 1.3 0.3WHO (1963) – 5 0.05 – 1 0.3TSE (1997) 2 5 0.05 1.5 3 0.2
Environ Monit Assess (2007) 130:389–402 399

When we investigated water analysis results interms of drinking water by livestock, upper limit forCu is 0.5 mg L−1and Pb 0.1 mg L−1. Especially insome well waters (18 and 20) Cu values were higherthan the upper limit. Most of the water samples hadhigher copper contents than upper limit values whichwere not suitable as a drinking water sources forlivestock (Ayers & Wescot, 1976; E.S.B., 1972).
Fe values of well numbers 18, 19, 20, 21 and 22were above the limits. Iron contents of water werebetween 0.01 mg L−1 (spring) and 14.5 mg L−1 (well).The first reason for high Fe contents in wells werefertilizer use and possibly the second was hot waterwhich was mentioned above for the sulphate.
Water samples taken in summer and winter seasonswere evaluated for irrigation using Wilcox graphs(Figures 7 and 8). According to these graphics sampleswere classified as follows: 13, 18, 21 and 22 not suitablefor the irrigation; 9, 19, 23, 25 and 26 from doubtful tounsuitable; 12 from permissible to doubtful; 1, 4, 8, 10,14, 15, 16, 17 and 24 from good to permissible; 2, 3, 5,6, 7 and 11 from excellent to good.
Multivariate statistical techniques were used toanalyze relationships among all parameters presentedin Tables II and IV. Table V shows that the cor-relations among the average values resulting from8 months of investigations. The maximum correlationwas found between sodium and chloride (P < 0.01 andr = 0.934). The higher negative correlation was foundbetween calcium and pH (P < 0.01 and r = −0.632).Statistically significant positive relationships P < 0.01)were found between F and Na+, F and HCO3
−; Cu andFe, Cu and EC, Cu and Na+, Cu and K+, Cu and Ca2+,Cu and SO4
2−, Cu and Cl−; Fe and EC, Fe and Na+, Feand K+, Fe and Ca2+, Fe and SO4
2−, Fe and Cl−; PO43−
and B; B and Zn, B and Na+, B and Cl−, B and EC;Zn and K+, Zn and Cl−, Zn and EC; Na+ and K+, Na+
and Ca2+, Na+ and SO42−, Na+ and Cl−, Na+ and EC;
K+ and Ca2+, K+ and SO42−, K+ and Cl−, K+ and EC;
Ca2+ and SO42−, Ca2+ and Cl−, Ca2+ and EC; SO4
2−
and Cl−, and were found negative relationshipsbetween pH and EC, pH and Fe, pH and K+, pH andCa2+, pH and SO4
2−.
5.4 Corrosion coefficient (K)
A very important parameter for water quality evalu-ation in Troia is corrosion coefficient (K). It was usedbecause it evaluated the quality of water regarding toT
able
VCorrelatio
ncoefficientsam
ongparameters
FCu
Fe
PO4
Spcond
pHB
Zn
Pb
Na
KCa
Mg
SO4
HCO3
Cl
F1
Cu
0.282
1
Fe
0.117
0.818**
1
PO4
0.080
0.085
−0.127
1
Spcond
0.464*
0.738**
0.778**
0.080
1
pH0.113
−0.489*
−0.579**
0.110
−0.544**
1
B0.407*
0.347
0.310
0.515**
0.650**
−0.033
1
Zn
−0.010
0.414*
0.466*
0.101
0.640**
−0.389
0.646**
1
Pb
0.384
0.214
0.022
−0.202
0.008
0.067
−0.201
−0.254
1
Na
0.691**
0.586**
0.584**
0.126
0.910**
−0.325
0.714**
0.494*
0.155
1
K0.198
0.709**
0.650**
0.137
0.816**
−0.560**
0.492*
0.629**
0.033
0.709**
1
Ca
0.342
0.720**
0.568**
−0.038
0.697**
−0.632**
0.252
0.398*
0.164
0.528**
0.691**
1
Mg
0.155
0.144
0.373
0.175
0.336
−0.204
0.312
0.274
0.090
0.455*
0.336
01
SO4
0.426*
0.688**
0.627**
0.036
0.730**
−0.626**
0.334
0.32
0.250
0.691**
0.755**
0.817**
0.416*
1
HCO3
0.628**
−0.063
−0.093
0.203
0.234
0.384
0.486*
0.173
0.133
0.505*
0.008
−0.106
0.459*
0.022
1
Cl
0.498*
0.612**
0.673**
0.113
0.933**
−0.444*
0.704**
0.585**
0.039
0.934**
0.737**
0.509**
0.367
0.582**
0.296
1
*p<0.05;**p<0.01
400 Environ Monit Assess (2007) 130:389–402
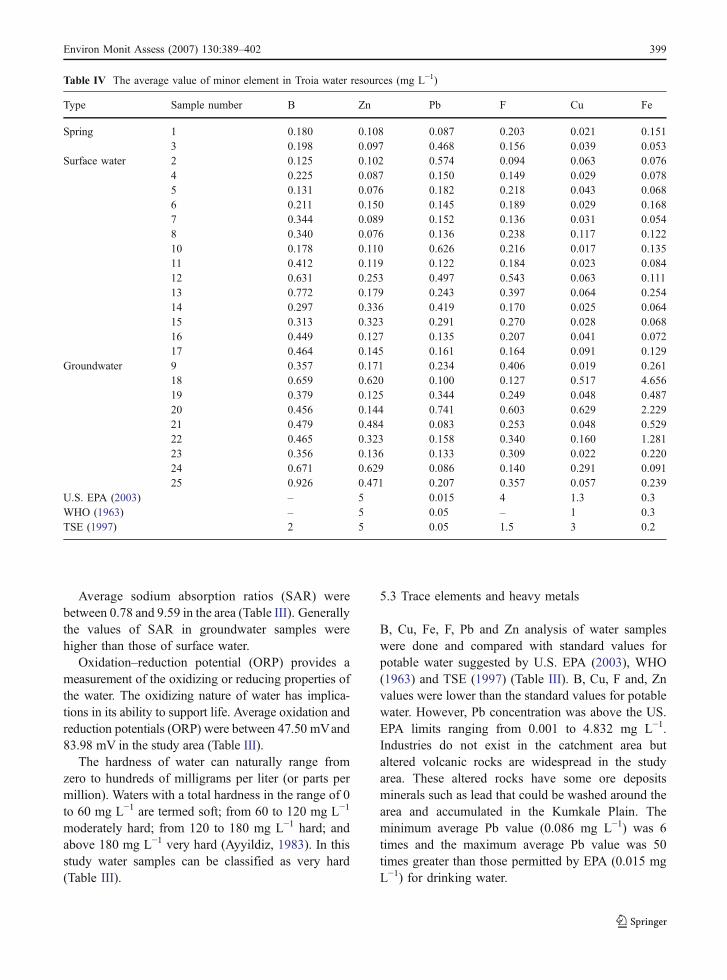
the variations of chloride and sulphate concentration.Corrosive tendency was calculated by corrosioncoefficient (K) as below;
K = (Cl− + SO42−)/HCO3
− (Alkalinity) (Larson &Scold, 1958).
The neutral pH range (7 to 8), with dissolvedoxygen ratios equal to or below 0.25, indicates generalresistance to corrosion, while higher ratios generallyindicate more corrosive waters which damage thewater supply systems (Stambuk-giljanovic, 1999).The average K value of Troia water resources waspresented in Figure 9. As it is seen in the Figure 9, allwaters are corrosive especially groundwater havehigher corrosivity than other water sources.
6 Conclusion
Generally water sampled from aquifers of Troiashowed different properties. Piper diagram showedthat, well waters were rich in Na+ and Cl−. Thissituation seems to reveal that the wells in the areahave been affected by seawater intrusion.
Some of the heavy metal concentrations values wereabove EPA limits such as lead. The minimum averagePb value (0.086 mg L−1) was 6 times and the maximumaverage Pb value was 50 times greater than thosepermitted by EPA (0.015 mg L−1) for drinking water.
In contrast, Cu, F and, Zn values were lower thanthe standard values for potable water. Iron contents of
water were between 0.01 mg L−1 (spring) and14.5 mg L−1 (well). The reason for high Fe contentsin wells was fertilizer use and possibly presence ofhot water in the area. Some of the water samples hadhigher Cu and Pb contents than upper limit valueswhich were not suitable as a drinking water sourcesfor livestock.
The corrosion coefficient (K) in Troia watersvaried based on water sources. It was lower than 1in springs; it was about 1 in surface waters whereas itwas over 1 in the groundwater. The K value ingroundwater in Troia showed that these waters wereconsiderably corrosive; it reached up to 8 and averageof 4.5. Results of the chemical analysis showed thatthe water could be related with hot water. So, it isurgently recommended that the further researchesshould be done to determine the source of water byisotope analysis and the relationships between sourceof water and tectonics need to be explained.
These results showed that the water in the area isprobably going to be affected by sea water thereforethe abstracted water should be under regulations. Alsopeople have to be aware for corrosion effects of wellwaters in the area.
Up to now we have not some important environ-mental problem in Troia, but some of the wateranalysis results showed that some heavy metals suchas Pb exceeded EPA limits. This can effect on livingorganisms in the area. For instance some birds arevery sensitive to it. Therefore more cautions must betaken into consideration for agriculture and habitats inthe area.
Figure 9 The average corro-sion coefficient of Troia waters.
Environ Monit Assess (2007) 130:389–402 401

Acknowledgment This research covered a part of the projectsupported by The Scientific and Technical Research Council ofTurkey (Project Number: 102Y031).
References
Anonymous (2004). http://www.state.ky.us/nrepc/water/wcpdo.htm.APHA-AWWA-WPCF 3110 (1992). Standard methods for
examination of water and waste water (18th ed).Washington, DC: APHA-AWWA-WPCF.
AWWA (American Water Works Association) (1990). Waterquality and treatment: A handbook for community watersupplies (4th ed.). New York, NY: McGraw Hill.
Ayers, R. S., & Wescot, D. W. (1976). Water quality foragriculture. Rome: Food and Agriculture Organization ofthe United Nations.
Ayyildiz, M. (1983). Irrigation water quality and salinityproblems (Agricultural Faculty Publication No: 879,p. 282.). Ankara University, Ankara, Turkey (in Turkish).
Baba, A., Birsoy, Y. K., Ensari, E., Andiç. T., Baykul, A., &Langeranli Y. (2001). Groundwater quality of Izmir. InGroundwater and environmental symposium (pp. 149–158).Izmir, Turkey.
Babu, S. D., Hindi, E., Da, R. F. E., & Bittencourt, A. (2002).Characteristics of Valadares Island aquifer, Paranaguacoastal plain, Brazil. Environmental Geology, 41, 954–959.
Chatzoudis, G. K., & Rigas, F. P. (1998). Polymeric condi-tioners effects on leaching of nitrogen fertilizers in soilcolumns. Journal of Environmental Science and Health,Part A, 33, 765–782.
Emrich, G. H., & Merritt, G. L. (1969). Effects of minedrainage on groundwater. Groundwater, 7, 27–32.
Environmental Studies Board (1972). Water quality criteria.National Academy of Science, National Academy ofEngineering.
Farid, M. S. M., Atta, S., Rashid, M., Munnink, J. O., &Platenburge R. (1993). Impact of reuse domestic waste-water for irrigation on ground water quality. Water Scienceand Technology, 27, 147–157.
Hassan, A. A. (1974). Water quality cycle – reflection ofactivities of nature and man. Groundwater, 12, 16–21.
Kayan, I. (2000). The water supply of Troia. In Studia Troica(pp. 135–144). Mainz am Rhein: Verlag Philipp von Zabern.
Larson, T. S., & Scold, R. W. (1958). Laboratory studiesrelating mineral quality of water to corrosion of steel andcast iron. Corrosion, 16, 285.
Laxen, D. P. H., & Harrison, R. M. (1977). The highway as asource of water pollution, an appraisal with the heavymetal lead. Water Research, 11, 1–11.
Lloyd, J. W., & Heathcote, J. A. (1985). Natural inorganichydrochemistry in relation to groundwater. An introduc-tion (p. 295). Oxford: Clarendon Press.
Malcolm, R., & Soulsby, C. (2001). Hydrogeochemistry ofgroundwater in coastal wetlands: Implications for coastalconservation in Scotland. Science of the Total Environ-ment, 265, 269–280.
Manahan, S. E. (1994). Environmental chemistry (6th ed,pp. 179–180). Florida: Lewis Publishers.
Mandel S., & Shiftan Z. L. (1981). Groundwater resources(p. 269). New York: Academic.
Mcanally, A., Pinto, A., & Flora, J. (1997). Evaluation of leadand copper corrosion control techniques. Journal ofEnvironmental Science and Health, Part A, 32, 31–53.
Mendoza, C. A., Cortes, G., & Munoz, D. (1996). Heavy metalpollution in soils and sediments of rural developing district063 Mexico environment. Environmental Toxicology andWater Quality, 11, 327–333.
Miller, D. W. (1980). Waste disposal effects on groundwater.Berkeley, CA: Premier Press.
MTA (2002). Geological map of Turkey. General Directorate ofMineral Research and Exploration, Ankara, Turkey.
Ning, S. K., & Chang, N. B. (2003). Optimal expansion ofwater quality monitoring network by fuzzy optimizationapproach. Environmental Monitoring and Assessment, 91,145–170.
Rahman, M. M., Hassan, M. Q., Islam, M. S., & Shamsad,S. Z. K. M. (2000). Environmental impact assessment onwater quality deterioration caused by the decreasedGanges outflow and saline water intrusion in south-western Bangladesh. Environmental Geology, 40, 31–40.
Schwaderer, G. (2003). Proposal for an effective protectionconcept for the Troad – A strategy for the preservation ofan important ecological building block in the internationalsystem of bird migration. In G. A. Wagner, E. Pernicha, H.P. Uerpmann (Eds.), Troia and the Troad – Scientificapproaches (pp. 285–291). Berlin: Springer Verlag.
Selim, M., & Iskandar, I. (1992). Engineering aspects of metal-waste management. London: Lewis Publishers.
Soil Survey Staff (1996). Soil survey laboratory methodsmanual. Soil Survey Investigation Report No. 42, Version3.0.
SPSS (1988). SPSS/PC, +,V.9.0. Base Manual for the IBM PC/XT/AT and PS/2, Marija and Moruis. SPSS Inc.
Stambuk-giljanovi´, C. N. (1999). Water quality evaluation byindex in Dalmatia. Water Research, 33, 3423–3440.
State Hydraulic Works (DSI) (1996). Karamenderes Project,Kumkale Plain irrigation and drainage survey and landclassification report (Project no: 401). State HydraulicWorks, Turkey (in Turkish).
State Hydraulic Works (DSI) (2001). Technical agenda. StateHydraulic Works, Ankara, Turkey (in Turkish).
Todd, D. K. (1974). Salt water intrusion and its controls.Journal of AWWA, 66, 180–187.
TSE (1997). Water intended for human consumption (TS 226/Nisan 1997). Turkish Standard Institute, Ankara.
U.S. EPA (1977). Waste disposal practices and their effects ongroundwater (pp. 81–107). United State EnvironmentalProtection Agency, Report to Congress.
U.S. EPA (2003). Groundwater and drinking water, drinkingwater standards. United State Environmental ProtectionAgency. http://www.epa.gov/safewater.
WHO (1963). Drinking water standards (In Rahn P. H., 1996).In Engineering geology: An environmental approach (2nded, pp. 256–257). Prentice Hall PTR.
WHO (1993). Guidelines for drinking-water quality. Volume 1.Recommendations (2nd ed, p. 188). Geneva: World HealthOrganization.
402 Environ Monit Assess (2007) 130:389–402