Assessment of technical efficiency of farmer teachers in the uptake and dissemination of push–pull...
14
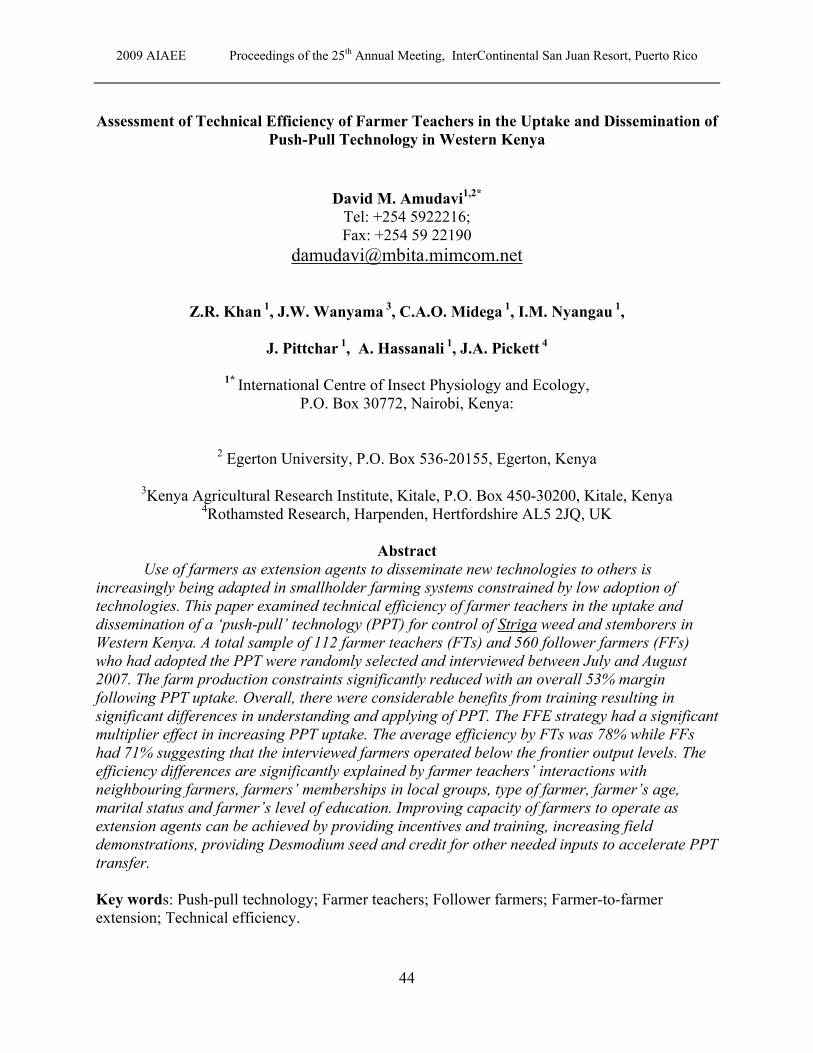
2009 AIAEE Proceedings of the 25 th Annual Meeting, InterContinental San Juan Resort, Puerto Rico 44 Assessment of Technical Efficiency of Farmer Teachers in the Uptake and Dissemination of Push-Pull Technology in Western Kenya David M. Amudavi 1,2* Tel: +254 5922216; Fax: +254 59 22190 [email protected] Z.R. Khan 1 , J.W. Wanyama 3 , C.A.O. Midega 1 , I.M. Nyangau 1 , J. Pittchar 1 , A. Hassanali 1 , J.A. Pickett 4 1* International Centre of Insect Physiology and Ecology, P.O. Box 30772, Nairobi, Kenya: 2 Egerton University, P.O. Box 536-20155, Egerton, Kenya 3 Kenya Agricultural Research Institute, Kitale, P.O. Box 450-30200, Kitale, Kenya 4 Rothamsted Research, Harpenden, Hertfordshire AL5 2JQ, UK Abstract Use of farmers as extension agents to disseminate new technologies to others is increasingly being adapted in smallholder farming systems constrained by low adoption of technologies. This paper examined technical efficiency of farmer teachers in the uptake and dissemination of a ‘push-pull’ technology (PPT) for control of Striga weed and stemborers in Western Kenya. A total sample of 112 farmer teachers (FTs) and 560 follower farmers (FFs) who had adopted the PPT were randomly selected and interviewed between July and August 2007. The farm production constraints significantly reduced with an overall 53% margin following PPT uptake. Overall, there were considerable benefits from training resulting in significant differences in understanding and applying of PPT. The FFE strategy had a significant multiplier effect in increasing PPT uptake. The average efficiency by FTs was 78% while FFs had 71% suggesting that the interviewed farmers operated below the frontier output levels. The efficiency differences are significantly explained by farmer teachers’ interactions with neighbouring farmers, farmers’ memberships in local groups, type of farmer, farmer’s age, marital status and farmer’s level of education. Improving capacity of farmers to operate as extension agents can be achieved by providing incentives and training, increasing field demonstrations, providing Desmodium seed and credit for other needed inputs to accelerate PPT transfer. Key words: Push-pull technology; Farmer teachers; Follower farmers; Farmer-to-farmer extension; Technical efficiency.
Transcript of Assessment of technical efficiency of farmer teachers in the uptake and dissemination of push–pull...
2009 AIAEE Proceedings of the 25th Annual Meeting, InterContinental San Juan Resort, Puerto Rico
44
Assessment of Technical Efficiency of Farmer Teachers in the Uptake and Dissemination of Push-Pull Technology in Western Kenya
David M. Amudavi1,2* Tel: +254 5922216; Fax: +254 59 22190
Z.R. Khan 1, J.W. Wanyama 3, C.A.O. Midega 1, I.M. Nyangau 1,
J. Pittchar 1, A. Hassanali 1, J.A. Pickett 4
1* International Centre of Insect Physiology and Ecology, P.O. Box 30772, Nairobi, Kenya:
2 Egerton University, P.O. Box 536-20155, Egerton, Kenya
3Kenya Agricultural Research Institute, Kitale, P.O. Box 450-30200, Kitale, Kenya 4Rothamsted Research, Harpenden, Hertfordshire AL5 2JQ, UK
Abstract
Use of farmers as extension agents to disseminate new technologies to others is increasingly being adapted in smallholder farming systems constrained by low adoption of technologies. This paper examined technical efficiency of farmer teachers in the uptake and dissemination of a ‘push-pull’ technology (PPT) for control of Striga weed and stemborers in Western Kenya. A total sample of 112 farmer teachers (FTs) and 560 follower farmers (FFs) who had adopted the PPT were randomly selected and interviewed between July and August 2007. The farm production constraints significantly reduced with an overall 53% margin following PPT uptake. Overall, there were considerable benefits from training resulting in significant differences in understanding and applying of PPT. The FFE strategy had a significant multiplier effect in increasing PPT uptake. The average efficiency by FTs was 78% while FFs had 71% suggesting that the interviewed farmers operated below the frontier output levels. The efficiency differences are significantly explained by farmer teachers’ interactions with neighbouring farmers, farmers’ memberships in local groups, type of farmer, farmer’s age, marital status and farmer’s level of education. Improving capacity of farmers to operate as extension agents can be achieved by providing incentives and training, increasing field demonstrations, providing Desmodium seed and credit for other needed inputs to accelerate PPT transfer. Key words: Push-pull technology; Farmer teachers; Follower farmers; Farmer-to-farmer extension; Technical efficiency.
2009 AIAEE Proceedings of the 25th Annual Meeting, InterContinental San Juan Resort, Puerto Rico
45
Introduction Recently, there has been a growing interest to use farmers in upscaling and outscaling
new technologies to many farmers (Noordin et al., 2001; Chikozho, 2005; Erbaugh, 2007). This strategy is relevant where public extension is either insufficient or ineffective to support agricultural activities. The farmer-to-farmer extension (FFE) strategy serves a shared information and learning function of achieving economies of scale in technology diffusion and system financial sustainability; issues that perpetually constrain public extension in providing services (Quizon et al., 2001; Feder et al., 2003). In this strategy farmers, are expected to influence fellow farmers to adopt new technologies and practices.
Several studies have assessed the efficacy of using FFE model in technology transfer and have produced varying results and conclusions, partly because of differences in study location, sample size, production practices and model specifications. Efficiency measurement is very important because it is a factor for productivity growth. Whereas Hasnah, et al. (2004) found that use of ‘progressive farmers’ as agents of promoting palm production in West Sumatra did not appear successful, Alene and Manyong (2006) on the other hand found in their study that the ‘lead farmers’, were more technically competent than the follower farmers in improved cowpea technology uptake in Northern Nigeria. Other scholars as Tripp et al., (2005) and Davis, (2007) indicate that although farmers may gain skills and knowledge through farmer advising, the farmers are however often reluctant to share information.
In this study, conducted in Western Kenya, we evaluated the relevance and technical efficiency (TE) of farmer teachers (FT) in the uptake and dissemination of ‘Push-pull’ technology (PPT). This innovation involves intercropping maize with a stemborer moth repellent fodder legume, Desmodium uncinatum, and planting around the intercrop an attractant trap plant, Napier grass, Pennisetum purpureum. The desmodium plant produces volatiles which repel the moths while volatiles produced by the trap plant attract them (Pickett et al., 2007). The emergent larvae from oviposition are trapped by a sticky substance produced by the Napier grass which inhibits the larvae’s full development to adulthood (Van den Berg et al., 2006). Further, desmodium roots produce chemical compounds, some of which stimulate Striga germination and others inhibit expected lateral root growth, thereby hindering its parasitic attachment to maize roots (Tsanuo et al., 2003). Consequently, the ensuing suicidal process suppresses Striga emergence and effectively reduces in situ seed bank accumulation (Khan et al., 2002).
Purpose and Objectives
PPT is being disseminated to farmers in eastern Africa through various methods (Khan et al., 2008a). As part of our continued effort to develop effective and economical dissemination strategies, we undertook a detailed assessment of farmer teachers to examine: i) influence of extension training on farmers’ understanding and use of PPT, ii) influence of PPT on selected farm production constraints, iii) extent of farmers’ PPT dissemination to fellow farmers and their technical efficiency (TE) in PPT uptake, and iv) factors influencing farmers’ technical efficiency of PPT uptake. The results obtained would help in improving competence and efficiency of farmers as extension agents in PPT uptake and dissemination.
Methods and Data Sources
Study Area The study was conducted in 10 districts in Western Kenya, namely; Vihiga, Siaya, Busia,
Trans Nzoia, Bungoma, Kisii, Rachuonyo, Migori, Homabay and Suba, where on-farm trials and
2009 AIAEE Proceedings of the 25th Annual Meeting, InterContinental San Juan Resort, Puerto Rico
46
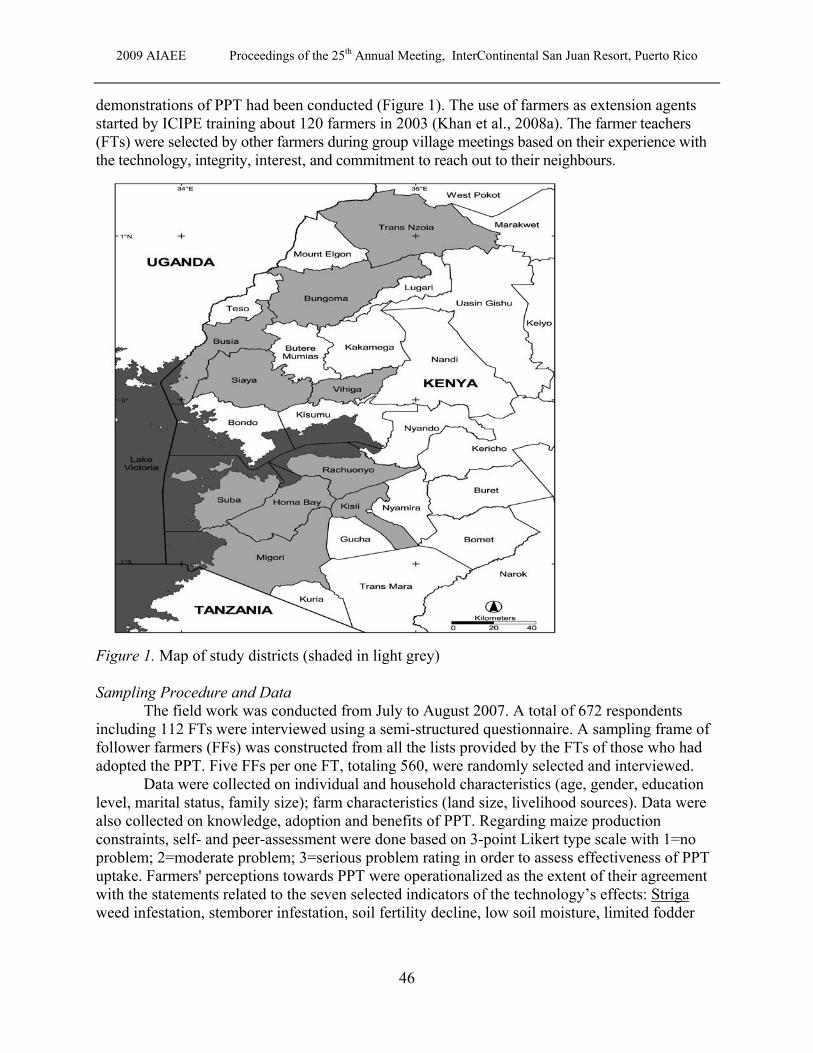
demonstrations of PPT had been conducted (Figure 1). The use of farmers as extension agents started by ICIPE training about 120 farmers in 2003 (Khan et al., 2008a). The farmer teachers (FTs) were selected by other farmers during group village meetings based on their experience with the technology, integrity, interest, and commitment to reach out to their neighbours.
Figure 1. Map of study districts (shaded in light grey) Sampling Procedure and Data
The field work was conducted from July to August 2007. A total of 672 respondents including 112 FTs were interviewed using a semi-structured questionnaire. A sampling frame of follower farmers (FFs) was constructed from all the lists provided by the FTs of those who had adopted the PPT. Five FFs per one FT, totaling 560, were randomly selected and interviewed.
Data were collected on individual and household characteristics (age, gender, education level, marital status, family size); farm characteristics (land size, livelihood sources). Data were also collected on knowledge, adoption and benefits of PPT. Regarding maize production constraints, self- and peer-assessment were done based on 3-point Likert type scale with 1=no problem; 2=moderate problem; 3=serious problem rating in order to assess effectiveness of PPT uptake. Farmers' perceptions towards PPT were operationalized as the extent of their agreement with the statements related to the seven selected indicators of the technology’s effects: Striga weed infestation, stemborer infestation, soil fertility decline, low soil moisture, limited fodder
2009 AIAEE Proceedings of the 25th Annual Meeting, InterContinental San Juan Resort, Puerto Rico
47
and inability for farming system to support multiple cropping) before and after PPT adoption; knowledge and skills gained on PPT and its dissemination following training. Analytical Framework
Farmers’ perception and actual technology uptake provide an indication of effectiveness and efficiency of the pathway in the technology’s dissemination (Garforth, 1998). Technical efficiency (TE) implies ability to produce maximum output (frontier production), given a set of inputs and available technology (Coelli, et al., 2005).
In this study, we utilized the stochastic frontier model to estimate the TE of both FTs and FFs in the uptake and dissemination of PPT. The TE of an individual farm is defined as the ratio of the observed output to the corresponding frontier output, conditional on the levels of inputs used on the farm, calculated as:
TE Y f X u u f zi i i i i i i= ⇒ − =/ [ ( , )(exp( )] exp( ) ( ; )β α (1)
where TEi is the technical efficiency of ith farmer; Yi is the possible production level of the ith farm (acreage under PPT); Xi is a vector of efficiency factors; β- and α- unknown parameters to be estimated, and zi is a vector of inefficiency factors. We estimated the model using a Transdental logarithmic (Translog) functional form of equation:
LnY Lnx Lnx Lnx v ui i i ij i jjii
= + + + −===∑∑∑β β β0
1
2
1
3
1
3
05. (2)
where Ln is the natural logarithm; Yi denotes the acreage under PPT for ith farmer; j represents the j-th input (j = 1, 2, …k) of the i-th farmer (1,2,…N); Xi1(endogenous variable) is number of years farmer ‘i’ has been practicing and disseminating PPT (endogenous variable); Xi2 is number of active visits farmer ‘i’ has had in discussing with other farmers about PPT leading to adoption (endogenous variable); (LnXi1)2 is the square product of the 1st endogenous variable; (LnXi2)2 is the square product of the 2nd endogenous variable; ([Ln Xi1]*LnXi2]) is cross product of the 1st and 2nd endogenous variables; Xi3 is the dummy variable, 1 for being a FT otherwise 0. It is assumed that the technical inefficiency effects are independently distributed and μij arises by truncation (at zero) of the normal distribution with mean uij and variance, σ2, where uij represents the TE of the ith farmer and is defined as:
μij = α0 + α1lnGENDER + α2lnAGE + α3lnFARM + α4lnMARITAL + α5lnEDUCSEC + α6lnHHOLD + α7lnCONST + α8lnSKILL + α9lnKNOW + α10lnTLU + α11lnGRPLOC + α12lnGRPSUP (3)
The exogenous variables accounting for inefficiencies included: GENDER (dummy, 1 for male and 0, otherwise); AGE (respondent’s age in years); FARM size (owned in acres); MARITAL status (if respondent is married=1, otherwise 0); EDUCSEC (respondent’s formal education at least secondary=1, otherwise 0); HHOLD (number of household members); CONST (a proxy index for ability of PPT to solve farmer production constraints); SKILL (index on skills acquired after training) and KNOW (index on knowledge acquired after training); TLU (tropical livestock units derived from the type, kind and number of livestock owned); GRPLOC (number of local groups to which respondent belongs); GRPSUP (number of higher level [supra] groups to which respondent belongs). The maximum-likelihood estimates of the β and αi coefficients in equations (4) and (5) respectively were estimated simultaneously using the program FRONTIER 4.1c (Coelli, 2007).
2009 AIAEE Proceedings of the 25th Annual Meeting, InterContinental San Juan Resort, Puerto Rico
48
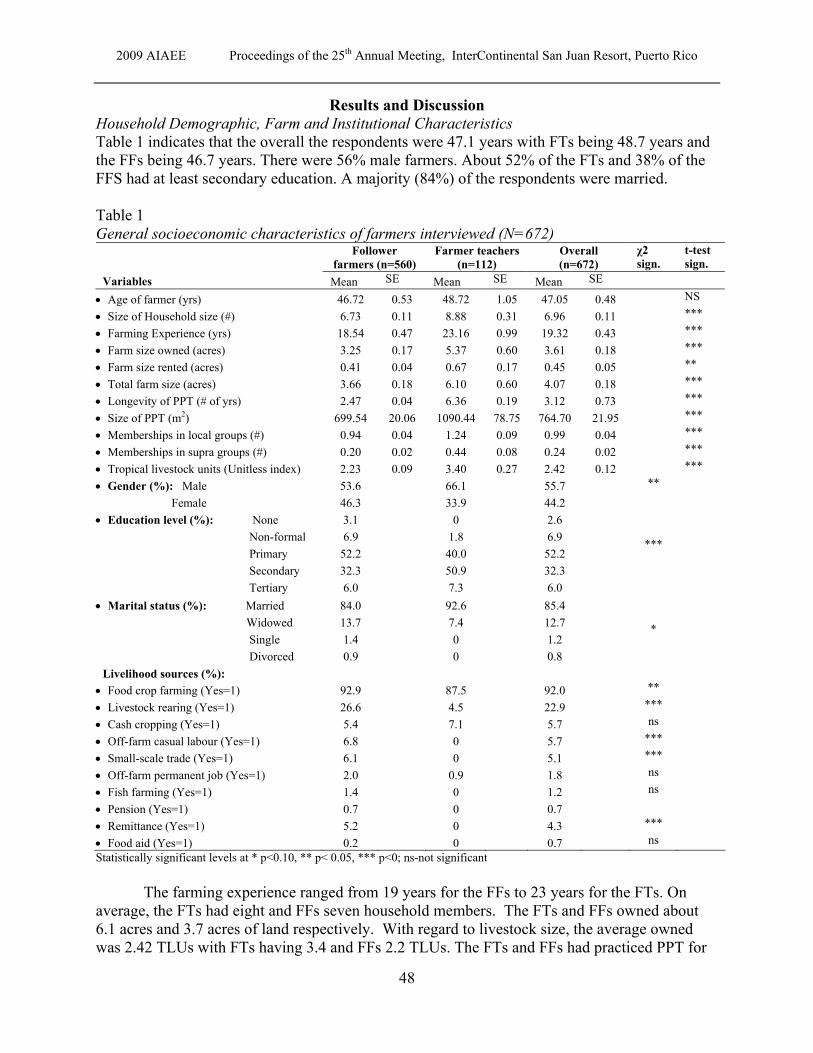
Results and Discussion Household Demographic, Farm and Institutional Characteristics Table 1 indicates that the overall the respondents were 47.1 years with FTs being 48.7 years and the FFs being 46.7 years. There were 56% male farmers. About 52% of the FTs and 38% of the FFS had at least secondary education. A majority (84%) of the respondents were married. Table 1 General socioeconomic characteristics of farmers interviewed (N=672)
Follower farmers (n=560)
Farmer teachers (n=112)
Overall (n=672)
χ2 sign.
t-test sign.
Variables Mean SE Mean SE Mean SE
• Age of farmer (yrs) 46.72 0.53 48.72 1.05 47.05 0.48 NS
• Size of Household size (#) 6.73 0.11 8.88 0.31 6.96 0.11 ***
• Farming Experience (yrs) 18.54 0.47 23.16 0.99 19.32 0.43 ***
• Farm size owned (acres) 3.25 0.17 5.37 0.60 3.61 0.18 ***
• Farm size rented (acres) 0.41 0.04 0.67 0.17 0.45 0.05 **
• Total farm size (acres) 3.66 0.18 6.10 0.60 4.07 0.18 ***
• Longevity of PPT (# of yrs) 2.47 0.04 6.36 0.19 3.12 0.73 ***
• Size of PPT (m2) 699.54 20.06 1090.44 78.75 764.70 21.95 ***
• Memberships in local groups (#) 0.94 0.04 1.24 0.09 0.99 0.04 ***
• Memberships in supra groups (#) 0.20 0.02 0.44 0.08 0.24 0.02 ***
• Tropical livestock units (Unitless index) 2.23 0.09 3.40 0.27 2.42 0.12 ***
• Gender (%): Male 53.6 66.1 55.7
Female 46.3 33.9 44.2 **
• Education level (%): None 3.1 0 2.6
Non-formal 6.9 1.8 6.9
Primary 52.2 40.0 52.2
Secondary 32.3 50.9 32.3
Tertiary 6.0 7.3 6.0
***
• Marital status (%): Married 84.0 92.6 85.4
Widowed 13.7 7.4 12.7
Single 1.4 0 1.2
Divorced 0.9 0 0.8
*
Livelihood sources (%):
• Food crop farming (Yes=1) 92.9 87.5 92.0 **
• Livestock rearing (Yes=1) 26.6 4.5 22.9 ***
• Cash cropping (Yes=1) 5.4 7.1 5.7 ns
• Off-farm casual labour (Yes=1) 6.8 0 5.7 ***
• Small-scale trade (Yes=1) 6.1 0 5.1 ***
• Off-farm permanent job (Yes=1) 2.0 0.9 1.8 ns
• Fish farming (Yes=1) 1.4 0 1.2 ns
• Pension (Yes=1) 0.7 0 0.7
• Remittance (Yes=1) 5.2 0 4.3 ***
• Food aid (Yes=1) 0.2 0 0.7 ns Statistically significant levels at * p<0.10, ** p< 0.05, *** p<0; ns-not significant
The farming experience ranged from 19 years for the FFs to 23 years for the FTs. On average, the FTs had eight and FFs seven household members. The FTs and FFs owned about 6.1 acres and 3.7 acres of land respectively. With regard to livestock size, the average owned was 2.42 TLUs with FTs having 3.4 and FFs 2.2 TLUs. The FTs and FFs had practiced PPT for
2009 AIAEE Proceedings of the 25th Annual Meeting, InterContinental San Juan Resort, Puerto Rico
49
about six and two years, respectively. The mean membership in local groups was 1.2 for FTs and 0.9 for FFs while memberships in supra (higher level) groups were much lower with 0.06 and 0.2 for FTs and FFs respectively. The majority (93%) of the respondents depended on food crops for and about 23% kept livestock for their livelihood. Other livelihood sources indicated by less than 10% of the respondents included cash cropping, off-farm labour, petty trade, fishing and pension. Effectiveness of Training in Understanding and Use of PPT
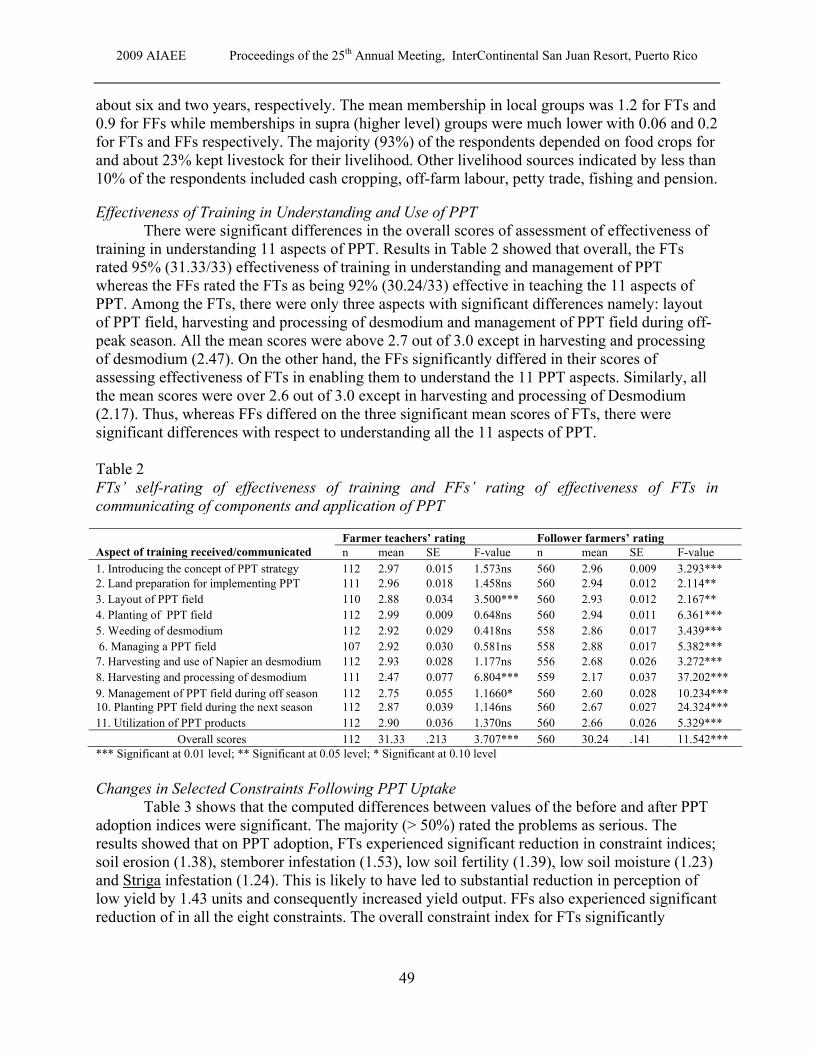
There were significant differences in the overall scores of assessment of effectiveness of training in understanding 11 aspects of PPT. Results in Table 2 showed that overall, the FTs rated 95% (31.33/33) effectiveness of training in understanding and management of PPT whereas the FFs rated the FTs as being 92% (30.24/33) effective in teaching the 11 aspects of PPT. Among the FTs, there were only three aspects with significant differences namely: layout of PPT field, harvesting and processing of desmodium and management of PPT field during off-peak season. All the mean scores were above 2.7 out of 3.0 except in harvesting and processing of desmodium (2.47). On the other hand, the FFs significantly differed in their scores of assessing effectiveness of FTs in enabling them to understand the 11 PPT aspects. Similarly, all the mean scores were over 2.6 out of 3.0 except in harvesting and processing of Desmodium (2.17). Thus, whereas FFs differed on the three significant mean scores of FTs, there were significant differences with respect to understanding all the 11 aspects of PPT. Table 2 FTs’ self-rating of effectiveness of training and FFs’ rating of effectiveness of FTs in communicating of components and application of PPT
Farmer teachers’ rating Follower farmers’ rating Aspect of training received/communicated n mean SE F-value n mean SE F-value 1. Introducing the concept of PPT strategy 112 2.97 0.015 1.573ns 560 2.96 0.009 3.293*** 2. Land preparation for implementing PPT 111 2.96 0.018 1.458ns 560 2.94 0.012 2.114** 3. Layout of PPT field 110 2.88 0.034 3.500*** 560 2.93 0.012 2.167** 4. Planting of PPT field 112 2.99 0.009 0.648ns 560 2.94 0.011 6.361*** 5. Weeding of desmodium 112 2.92 0.029 0.418ns 558 2.86 0.017 3.439*** 6. Managing a PPT field 107 2.92 0.030 0.581ns 558 2.88 0.017 5.382*** 7. Harvesting and use of Napier an desmodium 112 2.93 0.028 1.177ns 556 2.68 0.026 3.272*** 8. Harvesting and processing of desmodium 111 2.47 0.077 6.804*** 559 2.17 0.037 37.202*** 9. Management of PPT field during off season 112 2.75 0.055 1.1660* 560 2.60 0.028 10.234*** 10. Planting PPT field during the next season 112 2.87 0.039 1.146ns 560 2.67 0.027 24.324*** 11. Utilization of PPT products 112 2.90 0.036 1.370ns 560 2.66 0.026 5.329***
Overall scores 112 31.33 .213 3.707*** 560 30.24 .141 11.542*** *** Significant at 0.01 level; ** Significant at 0.05 level; * Significant at 0.10 level Changes in Selected Constraints Following PPT Uptake
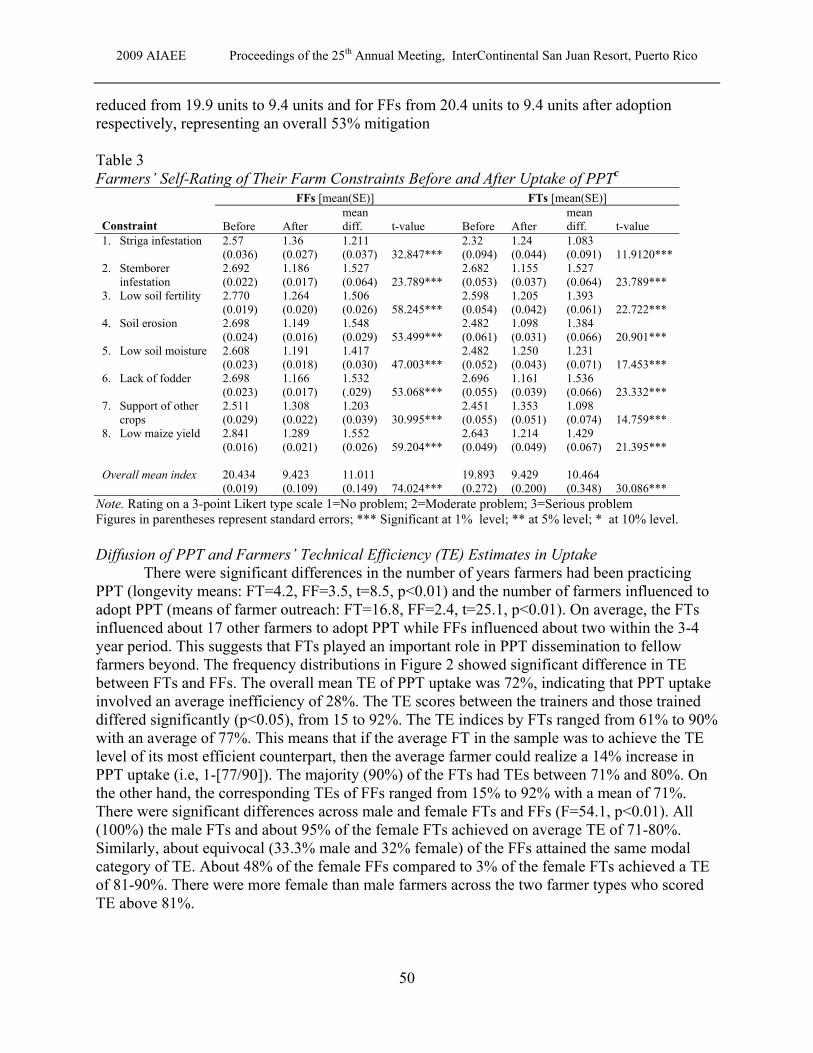
Table 3 shows that the computed differences between values of the before and after PPT adoption indices were significant. The majority (> 50%) rated the problems as serious. The results showed that on PPT adoption, FTs experienced significant reduction in constraint indices; soil erosion (1.38), stemborer infestation (1.53), low soil fertility (1.39), low soil moisture (1.23) and Striga infestation (1.24). This is likely to have led to substantial reduction in perception of low yield by 1.43 units and consequently increased yield output. FFs also experienced significant reduction of in all the eight constraints. The overall constraint index for FTs significantly
2009 AIAEE Proceedings of the 25th Annual Meeting, InterContinental San Juan Resort, Puerto Rico
50
reduced from 19.9 units to 9.4 units and for FFs from 20.4 units to 9.4 units after adoption respectively, representing an overall 53% mitigation Table 3 Farmers’ Self-Rating of Their Farm Constraints Before and After Uptake of PPTc
FFs [mean(SE)] FTs [mean(SE)] Constraint Before After
mean diff. t-value Before After
mean diff. t-value
1. Striga infestation 2.57 (0.036)
1.36 (0.027)
1.211 (0.037) 32.847***
2.32 (0.094)
1.24 (0.044)
1.083 (0.091) 11.9120***
2. Stemborer infestation
2.692 (0.022)
1.186 (0.017)
1.527 (0.064) 23.789***
2.682 (0.053)
1.155 (0.037)
1.527 (0.064) 23.789***
3. Low soil fertility 2.770 (0.019)
1.264 (0.020)
1.506 (0.026) 58.245***
2.598 (0.054)
1.205 (0.042)
1.393 (0.061) 22.722***
4. Soil erosion 2.698 (0.024)
1.149 (0.016)
1.548 (0.029) 53.499***
2.482 (0.061)
1.098 (0.031)
1.384 (0.066) 20.901***
5. Low soil moisture 2.608 (0.023)
1.191 (0.018)
1.417 (0.030) 47.003***
2.482 (0.052)
1.250 (0.043)
1.231 (0.071) 17.453***
6. Lack of fodder 2.698 (0.023)
1.166 (0.017)
1.532 (.029) 53.068***
2.696 (0.055)
1.161 (0.039)
1.536 (0.066) 23.332***
7. Support of other crops
2.511 (0.029)
1.308 (0.022)
1.203 (0.039) 30.995***
2.451 (0.055)
1.353 (0.051)
1.098 (0.074) 14.759***
8. Low maize yield 2.841 (0.016)
1.289 (0.021)
1.552 (0.026) 59.204***
2.643 (0.049)
1.214 (0.049)
1.429 (0.067) 21.395***
Overall mean index
20.434 (0.019)
9.423 (0.109)
11.011 (0.149) 74.024***
19.893 (0.272)
9.429 (0.200)
10.464 (0.348) 30.086***
Note. Rating on a 3-point Likert type scale 1=No problem; 2=Moderate problem; 3=Serious problem Figures in parentheses represent standard errors; *** Significant at 1% level; ** at 5% level; * at 10% level. Diffusion of PPT and Farmers’ Technical Efficiency (TE) Estimates in Uptake
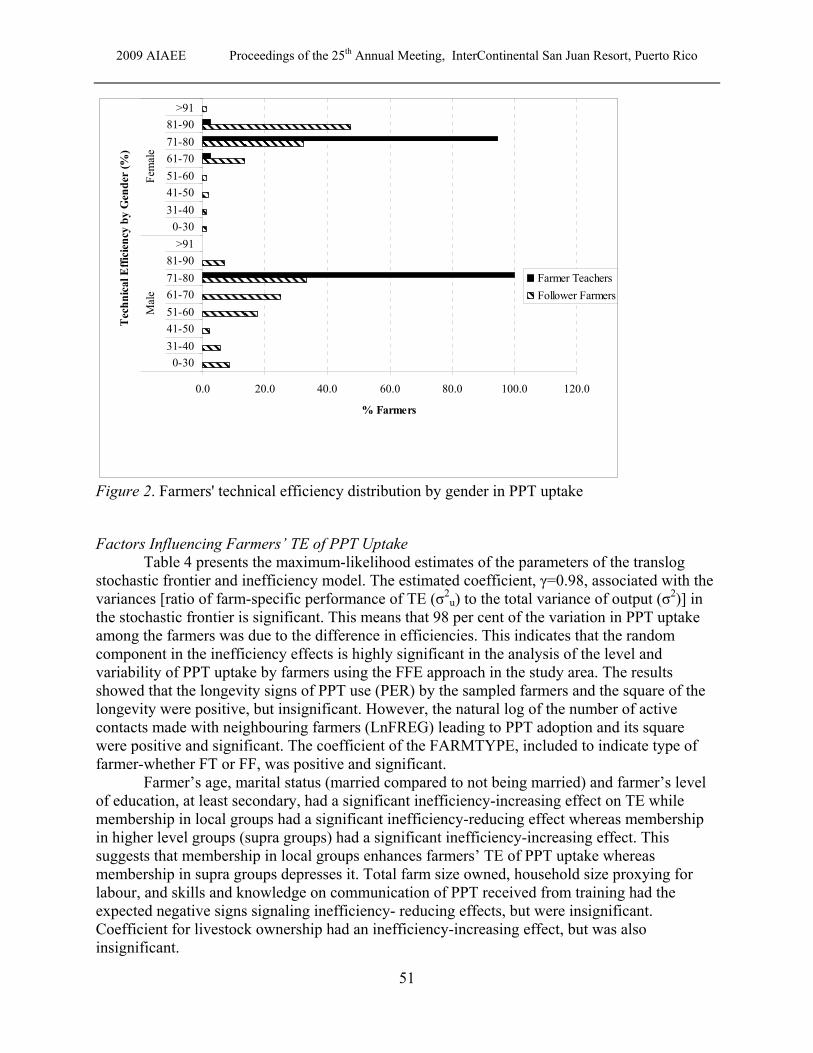
There were significant differences in the number of years farmers had been practicing PPT (longevity means: FT=4.2, FF=3.5, t=8.5, p<0.01) and the number of farmers influenced to adopt PPT (means of farmer outreach: FT=16.8, FF=2.4, t=25.1, p<0.01). On average, the FTs influenced about 17 other farmers to adopt PPT while FFs influenced about two within the 3-4 year period. This suggests that FTs played an important role in PPT dissemination to fellow farmers beyond. The frequency distributions in Figure 2 showed significant difference in TE between FTs and FFs. The overall mean TE of PPT uptake was 72%, indicating that PPT uptake involved an average inefficiency of 28%. The TE scores between the trainers and those trained differed significantly (p<0.05), from 15 to 92%. The TE indices by FTs ranged from 61% to 90% with an average of 77%. This means that if the average FT in the sample was to achieve the TE level of its most efficient counterpart, then the average farmer could realize a 14% increase in PPT uptake (i.e, 1-[77/90]). The majority (90%) of the FTs had TEs between 71% and 80%. On the other hand, the corresponding TEs of FFs ranged from 15% to 92% with a mean of 71%. There were significant differences across male and female FTs and FFs (F=54.1, p<0.01). All (100%) the male FTs and about 95% of the female FTs achieved on average TE of 71-80%. Similarly, about equivocal (33.3% male and 32% female) of the FFs attained the same modal category of TE. About 48% of the female FFs compared to 3% of the female FTs achieved a TE of 81-90%. There were more female than male farmers across the two farmer types who scored TE above 81%.
2009 AIAEE Proceedings of the 25th Annual Meeting, InterContinental San Juan Resort, Puerto Rico
51
0.0 20.0 40.0 60.0 80.0 100.0 120.0
0-3031-4041-5051-6061-7071-8081-90
>910-30
31-4041-5051-6061-7071-8081-90
>91
Mal
eFe
mal
e
Tec
hnic
al E
ffici
ency
by
Gen
der
(%) .
% Farmers
Farmer TeachersFollower Farmers
Figure 2. Farmers' technical efficiency distribution by gender in PPT uptake
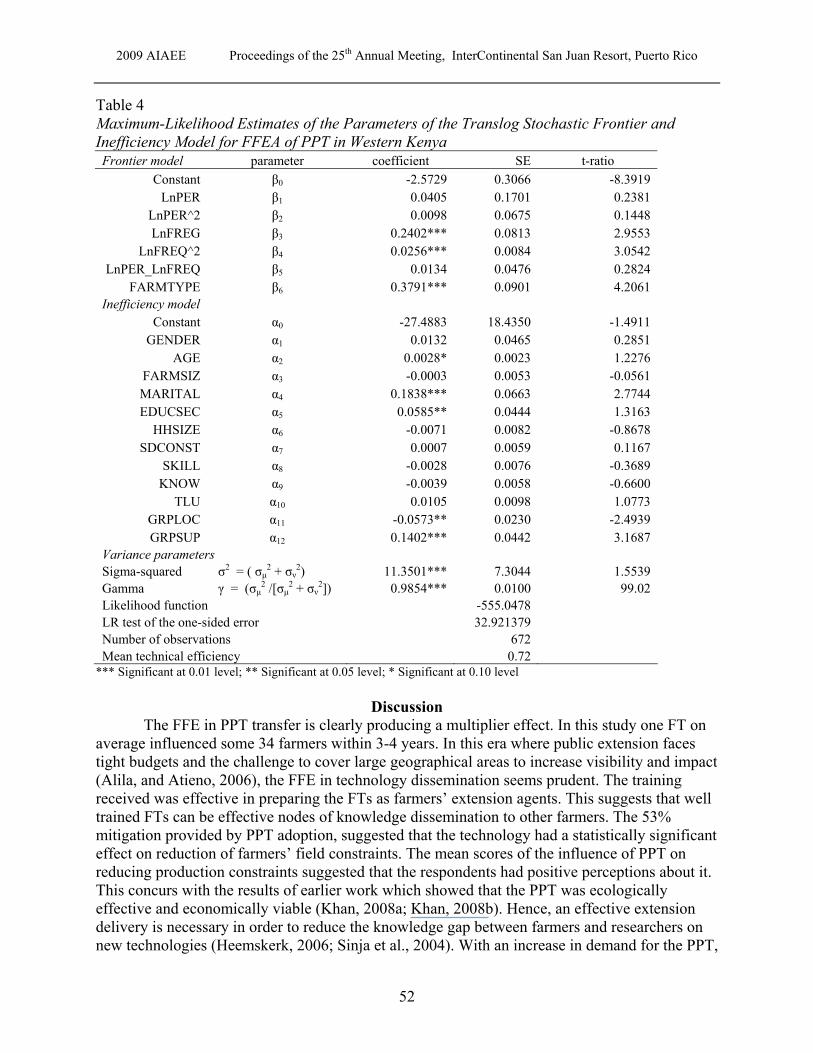
Factors Influencing Farmers’ TE of PPT Uptake Table 4 presents the maximum-likelihood estimates of the parameters of the translog
stochastic frontier and inefficiency model. The estimated coefficient, γ=0.98, associated with the variances [ratio of farm-specific performance of TE (σ2
u) to the total variance of output (σ2)] in the stochastic frontier is significant. This means that 98 per cent of the variation in PPT uptake among the farmers was due to the difference in efficiencies. This indicates that the random component in the inefficiency effects is highly significant in the analysis of the level and variability of PPT uptake by farmers using the FFE approach in the study area. The results showed that the longevity signs of PPT use (PER) by the sampled farmers and the square of the longevity were positive, but insignificant. However, the natural log of the number of active contacts made with neighbouring farmers (LnFREG) leading to PPT adoption and its square were positive and significant. The coefficient of the FARMTYPE, included to indicate type of farmer-whether FT or FF, was positive and significant.
Farmer’s age, marital status (married compared to not being married) and farmer’s level of education, at least secondary, had a significant inefficiency-increasing effect on TE while membership in local groups had a significant inefficiency-reducing effect whereas membership in higher level groups (supra groups) had a significant inefficiency-increasing effect. This suggests that membership in local groups enhances farmers’ TE of PPT uptake whereas membership in supra groups depresses it. Total farm size owned, household size proxying for labour, and skills and knowledge on communication of PPT received from training had the expected negative signs signaling inefficiency- reducing effects, but were insignificant. Coefficient for livestock ownership had an inefficiency-increasing effect, but was also insignificant.
2009 AIAEE Proceedings of the 25th Annual Meeting, InterContinental San Juan Resort, Puerto Rico
52
Table 4 Maximum-Likelihood Estimates of the Parameters of the Translog Stochastic Frontier and Inefficiency Model for FFEA of PPT in Western Kenya Frontier model parameter coefficient SE t-ratio
Constant β0 -2.5729 0.3066 -8.3919 LnPER β1 0.0405 0.1701 0.2381
LnPER^2 β2 0.0098 0.0675 0.1448 LnFREG β3 0.2402*** 0.0813 2.9553
LnFREQ^2 β4 0.0256*** 0.0084 3.0542 LnPER_LnFREQ β5 0.0134 0.0476 0.2824
FARMTYPE β6 0.3791*** 0.0901 4.2061 Inefficiency model
Constant α0 -27.4883 18.4350 -1.4911 GENDER α1 0.0132 0.0465 0.2851
AGE α2 0.0028* 0.0023 1.2276 FARMSIZ α3 -0.0003 0.0053 -0.0561 MARITAL α4 0.1838*** 0.0663 2.7744 EDUCSEC α5 0.0585** 0.0444 1.3163
HHSIZE α6 -0.0071 0.0082 -0.8678 SDCONST α7 0.0007 0.0059 0.1167
SKILL α8 -0.0028 0.0076 -0.3689 KNOW α9 -0.0039 0.0058 -0.6600
TLU α10 0.0105 0.0098 1.0773 GRPLOC α11 -0.0573** 0.0230 -2.4939 GRPSUP α12 0.1402*** 0.0442 3.1687
Variance parameters Sigma-squared σ2 = ( σμ2 + σν2) 11.3501*** 7.3044 1.5539 Gamma γ = (σμ2 /[σμ2 + σν2]) 0.9854*** 0.0100 99.02 Likelihood function -555.0478 LR test of the one-sided error 32.921379 Number of observations 672 Mean technical efficiency 0.72
*** Significant at 0.01 level; ** Significant at 0.05 level; * Significant at 0.10 level
Discussion The FFE in PPT transfer is clearly producing a multiplier effect. In this study one FT on
average influenced some 34 farmers within 3-4 years. In this era where public extension faces tight budgets and the challenge to cover large geographical areas to increase visibility and impact (Alila, and Atieno, 2006), the FFE in technology dissemination seems prudent. The training received was effective in preparing the FTs as farmers’ extension agents. This suggests that well trained FTs can be effective nodes of knowledge dissemination to other farmers. The 53% mitigation provided by PPT adoption, suggested that the technology had a statistically significant effect on reduction of farmers’ field constraints. The mean scores of the influence of PPT on reducing production constraints suggested that the respondents had positive perceptions about it. This concurs with the results of earlier work which showed that the PPT was ecologically effective and economically viable (Khan, 2008a; Khan, 2008b). Hence, an effective extension delivery is necessary in order to reduce the knowledge gap between farmers and researchers on new technologies (Heemskerk, 2006; Sinja et al., 2004). With an increase in demand for the PPT,
2009 AIAEE Proceedings of the 25th Annual Meeting, InterContinental San Juan Resort, Puerto Rico
53
the low rating on harvesting and processing of Desmodium suggests the need for training farmers on these skills in order to increase the supply of readily available Desmodium planting material.
The results showed that if the average farmer in the sample among the FTs or FFs was to achieve the TE level of its most efficient counterpart, then the average farmer could realize a 14% or 23% increase in PPT uptake respectively. The farmer’s age, marital status and formal education had a significant inefficiency-increasing effect. As suggested by Speelman et al., (2008) why age did not contribute significantly to higher technology use efficiency in small-scale irrigation in South Africa, the ambivalence is that whereas older and more experienced farmers may be knowledgeable on various practices, they are often less willing to adopt new ideas. Education level in this study had unexpected inefficiency increasing effect. Our study results suggest that farmers who had higher formal education, at least secondary, were less efficient in PPT uptake than those with lower education. This could be because higher education opens up higher opportunities for livelihoods such as off-farm employment and, hence creates lower incentives to adopt PPT. Intuitively, farmers with lower education are more likely to be limited in such opportunities and hence depend more on primary methods for their livelihoods.
The frequency of contacts between FTs and non-push-pull farmers significantly increased the likelihood of PPT adoption, suggesting that the farmers were still operating in the inefficiency zone and the marginal productivities were still increasing. This is the initial stage of the production frontier implying that FTs and FFs had the potential of increasing area put under PPT and hence increased total production during subsequent years. The results showed significant differences in TE between FTs and FFs in PPT uptake, with the FTs showing superior performance. This suggests that farmers who receive technical advice and logistical support are technically more efficient in PPT uptake than those who just receive training. Given that FTs’ and FFs’ TE measures averaged over 70%, the small differences between them further indicated that many farmers operated at a technical inefficient level and that addressing the limiting factors could improve the efficiency. Enhanced TE will not only enable farmers to increase the use of productive resources, but it will also give direction for the adjustments required in the long run to achieve food sustainability (Al-hassan, 2008).
Although TE estimates indicated that farmers fail to reach their optimal levels, the results confirm the importance of FFE in disseminating productivity enhancing technologies in smallholder farming systems in Eastern Africa (Tizikara and Kwesiga, 2006). The currently promoted platform technology allows achievement of potential yields in cereal production in these systems. As advised by Tizikara and Kwesiga (2006) agricultural research is not merely to develop and get new technologies to farmers but more importantly to empower farmers to better understand and respond to changing emergent circumstances. This is underscored by Alene and Manyong (2006), who report in their study that the failure to reach overall efficiency can be explained by the limited capacity of farmers to catalyze the dissemination process. The findings concur with those of Feder and Savastano (2006) in which farmers’ capacity to utilize new technologies and influence other farmers was increased by linking them to champions of new technologies. Our findings also suggest that if farmer interaction with trained farmers is enhanced, then more farmers are likely to try and eventually adopt the PPT. This hypothesis was tested by Okoruwa and Ogundele (2004) and the conclusion made to the effect that enhanced extension contacts with farmers increased the probability of technology adoption. Elsewhere, Aw-Hassan et al., (2008) found that informal farmer-to-farmer seed dissemination in Syria was an important vehicle for the diffusion of new barley varieties, which were grown on 27% of the barley area of monitored farmers, despite a complete lack of extension support. These insights
2009 AIAEE Proceedings of the 25th Annual Meeting, InterContinental San Juan Resort, Puerto Rico
54
imply that targeted capacity building and effective incentives can contribute substantially to the efficiency of the FFE approach. Membership in local groups had inefficiency-reducing effect on PPT uptake. For technology uptake, this is desirable and the effect is partly due to three reasons. First, farmers belonging to local groups are more likely to be reached by extension agents with information on the technology to make production decisions. Second, participation in local associations and groups provides opportunities for interactive learning about new innovations and technologies (Röling and Wagemakers, 1998). Third, membership in local groups helps amplify the “neighbourhood effect” and reduce perception of possible risks (Franzel et al., 2001). Amudavi (2007) found that participation in local groups may enhance social capital necessary for learning about new agricultural technologies whereas participation in supra groups (higher level) generates outcomes which positively influence a household’s well-being, thereby reducing dependence on farm income sources. Narayan and Pritchett (2000) found that memberships in local group networks provide low cost information access and social capital that helps overcome imperfect information caused by market failures. This suggests that to accelerate PPT uptake then, local group approach would be desirable. The positive and significant coefficient of FARMTYPE implied that there were significant differences in the efficiencies between FTs and FFs in PPT uptake, with the former being more efficient. Hence, an increased focus on FFE in technology transfer may be justified. Where production constraints are serious as in Western Kenya, an obvious implication is the need for investment in farmers’ capacities that allow for recognition of constraints and their effects, individual uptake and extension of appropriate technologies. Improving the farmers’ efficiency in technology transfer may require developing their capacities (attributes they must possess) and capabilities (what must they be able to do).
Conclusion, Educational Importance and Implications
Training offers opportunities for FTs to interact with other farmers and modalities for providing extension services to resource-poor farmers. Estimations of technical efficiencies of PPT uptake across different farmer types showed that frequency of farmer interactions and household-level factors (farmer’s age, having minimum secondary education, membership in local groups, etc.) are critical factors. Currently, the farmers are operating below their frontier output levels. PPT uptake can be increased by selecting willing farmers and training them to advise others, increasing PPT demonstrations, providing Desmodium seed and credit for other needed critical inputs. By so doing, the FFE process will enable farmers take advantage of new opportunities for PPT adoption Whereas FFE is not a “silver bullet” to accelerate farmers’ access to new technologies, it can catalyze the transfer of much needed technologies by linking farmers to research and extension in a more effective and sustainable way. To understand the impact of this approach, it is necessary to examine impacts of PPT on production and consumption by different household social categories. Further studies are also needed on allocative and economic efficiencies to evaluate the scope of farmer to farmer outscaling and upscaling the multifunctional PPT.
Acknowledgements The authors are grateful to Gatsby Charitable Foundation (UK), Kilimo Trust (East
Africa) and Biovision Foundation (Switzerland), for providing financial support. The study was conducted in collaboration with Rothamsted Research which receives grant-aided support from
2009 AIAEE Proceedings of the 25th Annual Meeting, InterContinental San Juan Resort, Puerto Rico
55
the Biotechnology and Biological Sciences Research Council (BBSRC). The authors also acknowledge assistance provided by ICIPE field staff, Ministry of Agriculture extension staff, and the farmers.
References Al-hassan, D. (2008). Technical Efficiency of Rice Farmers in Northern Ghana. AERC Research
Paper 178. African Economic Research Consortium, Nairobi. Available at http://www.aercafrica.org/documents/RP178.pdf
Alila, P. O., & Atieno, R. (2006). Agricultural Policy in Kenya: Issues and Processes. A Paper for the Future Agricultures Consortium workshop. Institute of Development Studies, Nairobi, Kenya.
Alene, D. A., & Manyong, V. M. (2006). Farmer-to-farmer technology diffusion and yield variation among adopters: the case of improved cowpea in northern Nigeria. Agric. Econ. 35, 203-211.
Amudavi, D.M. (2007). The effects of farmer community group participation on rural livelihoods in Kenya. In C.B. Barrett, A.G. Mude, & J.M. Omiti (Eds.), Decentralization and the Social Economics of Development Lessons from Kenya. Oxfordshire: CABI.
Aw-Hassan, A., Mazid, A., & Salahieh, H. (2008). The Role of Informal Farmer-to-Farmer Seed Distribution in Diffusion of New Barley Varieties in Syria. Expl Agric., 44, 413–431.
Chikozho, C. (2005). Policy and institutional dimensions of small-holder farmer innovations in the Thukela River Basin of South Africa and the Pangani River Basin of Tanzania: A comparative perspective. Physics and Chemistry of the Earth 30, 913–924.
Coelli, T. (2007). A Guide to FRONTIER Version 4.1c: A Computer Program for Stochastic Frontier Production and Cost Function estimation. CEPA Working paper. Armidale, Australia: 1-33.
Coelli, T. J., Rao, D. S. P., O'Dononell, C., & Battese, G. E. (2005). An introduction to efficiency and productivity analysis. Boston: Kluwer.
Davis, K. (2007). Farmer Field Schools: A Boon or Bust for Extension in Africa? Journal of International Agricultural and Extension Education. 13, 91-97.
Erbaugh, M. J., Donnermeyer, J., & Amujal, M. (2007). Assessing the impact of Farmer Field Schools on IPM in Uganda. Proceedings of the 23 AIAEE Conference, Polson, Montana.
Feder, G., Murgai, R., & Quizon, J.B. (2003). Sending Farmers Back to School: The Impact of Farmer Field Schools in Indonesia. The World Development Research Group Rural Development. Policy Research Working Paper 3022.
Feder, G., & Savastano, S. (2006). The Role of Opinion Leaders in the Diffusion of New Knowledge: The Case of Integrated Pest Management. World Development, 34, 1287-1300.
Franzel, S., Cooper, P., & Denning, G.L. (2001). Scaling up the benefits of agroforestry research: lessons learned and research challenges. Development in Practice 11, 524-534.
Garforth, C. (1998). Dissemination Pathways for RNR Research. Socio-economic Methodologies. Best Practice Guidelines. Chatham, UK: Natural Resource Institute.
Hasnah, Fleming, E., & Coelli, T. (2004). Assessing the performance of a nucleus estate and smallholder scheme for oil palm production in West Sumatra: a stochastic frontier analysis. Agriculture Systems 79, 17–30.
2009 AIAEE Proceedings of the 25th Annual Meeting, InterContinental San Juan Resort, Puerto Rico
56
Heemskerk, W. (2006). Strengthening the Role of Farmer’Organizations in Agricultural Innovation Systems: Case studies from Benin, Rwanda and Tanzania. Innovation Africa Symposium. Kampala, Uganda.
Khan, Z.R., Hassanali, A., Overholt, W., Khamis, T.M., Hooper, A.M., Pickett, A. J., Wadhams, L.J., & Woodcock, C.M. (2002). Control of witchweed Striga hermonthica by intercropping with Desmodium spp., and the mechanism defined as allelopathic. Journal of Chemical Ecology. 28, 1871-1885.
Khan, Z.R., Amudavi, D.M., Midega, C.A.O, Wanyama, J. M., & Pickett, J.A., (2008a). Farmers’ perceptions of a ‘push–pull’ technology for control of cereal stemborers and Striga weed in Western Kenya. Crop Protection. 27, 976–987.
Khan, Z.R., Midega, C.A.O., Amudavi, D.M., Hassanali, A., & Pickett, J.A. (2008b). On-farm evaluation of the ‘push-pull’ technology for the control of stemborers and Striga weed on maize in Western Kenya. Field Crops Resarch. 106, 224–233.
Narayan, D., & Pritchett, L. (2000). Social Capital: evidence and implications. In P. Dasgupta & I. Serageldin (Eds.), Social Capital: A Multifaceted Perspective. Washington, DC: The World Bank. pp. 269-295.
Noordin, Q., Amadou, N., Bashir, J., & Nyasimi, M. (2001). Scaling up adoption and impact of agroforestry technologies: experiences from Western Kenya. Development in Practice, 11, 509 – 523.
Okoruwa, V. O., & Ogundele, O. O. (2004). Technical Efficiency Differentials in Rice Production Technologies in Nigeria. Nigerian Institute of Social and Economic Research. Ibadan, Nigeria, pp 1017.
Pickett, J. A., Khan, Z. R., Hassanali, A., & Hooper, A. M. (2007). Chemicals Involved in Post-Germination Inhibition of Striga by Desmodium: Opportunities for Utilizing the Associated Allelochemical Traits. In G. Ejeta & J. Gressel (Eds.), Integrating New Technologies for Striga Control: Towards Ending the Witch-hunt. World Scientific Publishing Company.
Quizon, J., Feder, G., & Murgai, R. (2001). Fiscal Sustainability of agricultural extension: the case of Farmer Field School approach. Journal of International Agricultural Extension education, 8. 13-24.
Sinja, J., Karugia, J., Mwangi, D. M., Baltenwecka, I. & Romney, D. (2004). Adoption of fodder legumes technology through farmer-to-farmer extension approach. Uganda Journal of Agricultural Science, 9. 22-26.
Speelman, S., D’Haese, M., Buysse, J., & D’Haese, L. (2008). A measure for the efficiency of water use and its determinants, a case study of small-scale irrigation schemes in North-West Province, South Africa. Agriculture Systems, 98. 31–39.
Tizikara, C., & Kwesiga, F. (2006). Enhancing Agricultural Productivity in Sub-Saharan Africa through IAR4D and Competitive Grants Processes: Experiences and Lessons. Conference on Prosperity and Poverty in a Globalized World – Challenges for Agricultural Research, University of Bonn, Tropentag, October 11-13, 2006. Accessed 21-10-2008, available at www.tropentag.de/2006/abstracts/full/46.pdf.
Tripp, R., Wijeratne, M., & Piyadasa, V. H. (2005). What should we expect from farmer field schools? A Sri Lanka case study. World Development, 33. 1705-1720.
Tsanuo, M.K., Hassanali, A., Hooper, A.M., Khan, Z.R., Kaberia, F., Pickett, J.A., & Wadhams, L. (2003). Isoflavanones from the allelopathic aqueous root exudates of Desmodium uncinatum. Phytochemistry 64, 265-273.

2009 AIAEE Proceedings of the 25th Annual Meeting, InterContinental San Juan Resort, Puerto Rico
57
Van den Berg, J., De Bruyn, A.J.M., & Van Hamburg, H. (2006). Oviposition preference and survival of the maize stem borer, Busseola fusca (Lepidoptera: Noctuidae), on Napier grasses, Pennisetum spp., and maize. African Entomology, 14. 211-218.