The limited role of aquifer heterogeneity on metal reduction in an Atlantic coastal plain determined...
22
The limited role of aquifer heterogeneity on metal reduction in an Atlantic coastal plain determined by push-pull tests Brian J. Mailloux a, * , Stephanie Devlin a , Mark E. Fuller b , T.C. Onstott a , Mary F. DeFlaun b,1 , Keun-Hyung Choi c , Maria Green-Blum c , Donald J.P. Swift c , John McCarthy d , Hailiang Dong e a Department of Geosciences, Princeton University, Princeton, NJ 08544, USA b Envirogen Inc. (Now Shaw Environmental and Infrastructure), Princeton Research Center, 4100 Quakerbridge Road, Lawrenceville, NJ 08648, USA c Ocean, Earth, and Atmospheric Sciences, Old Dominion University, 4600 Elkhorn Avenue, Norfolk, VA 23529, USA d Department of Geological Sciences, The University of Tennessee, Knoxville, TN 37996, USA e Miami University of Ohio, Department of Geology, Oxford, OH 45056, USA Received 22 February 2006; accepted 15 December 2006 Editorial handling by P.B. McMahon Available online 15 February 2007 Abstract Sixty push-pull experiments were conducted to determine the factors controlling Fe(III) and Mn(IV) reduction in a well-characterized, shallow, coastal plain aquifer near Oyster, VA, USA. The five multi-level samplers each equipped with 12 ports sampled a heterogeneous portion of the aquifer from 4.4 to 8 m-bgs. Each multi-level sampler (MLS) was injected with groundwater that contained NO 3 and Br along with: (1) just groundwater (control treatment), (2) humics, (3) lactate (conducted twice) and (4) lactate plus humics. Microbially mediated Fe(III) reduction caused the aqueous Fe Tot concen- trations to increase at every depth in the lactate treatment with significant increases within 1 day even while NO 3 was pres- ent. Little change in the Fe Tot concentrations were observed in the control and humics treatment. Humics may have acted as an electron shuttle to increase Fe(III) reduction in the lactate plus humics treatment. The amount of Mn(IV) reduction was significantly lower than that of Fe(III) reduction. Geochemical modeling indicated that gas formation, sorption on reactive surfaces, and mineral precipitation were important processes and that Fe(III) and SO 2 4 reduction were co-occur- ring. Conditions were favorable for the precipitation of Fe-carbonates, Fe-sulfides and Fe-silicates. In the lactate treatment protist concentrations increased then decreased and planktonic cell concentrations steadily increased, whereas no change was observed in the control treatment. Correlations of Fe(III) reduction with physical and chemical heterogeneity were weak, probably as a result of the abundance of Fe(III) bearing minerals relative to electron donor abundance and that the push-pull test sampled a representative elemental volume that encompassed the microbial diversity within the aquifer. 0883-2927/$ - see front matter Ó 2007 Elsevier Ltd. All rights reserved. doi:10.1016/j.apgeochem.2006.12.020 * Corresponding author. Present address: Department of Environmental Sciences, Barnard College, 3009 Broadway, 404 Altschul Hall, New York, NY 10027, USA. E-mail address: [email protected] (B.J. Mailloux). 1 Present address: GeoSyntec Consultants, Research Park, Princeton, NJ 08540, USA. Applied Geochemistry 22 (2007) 974–995 www.elsevier.com/locate/apgeochem Applied Geochemistry
-
Upload
independent -
Category
Documents
-
view
2 -
download
0
Transcript of The limited role of aquifer heterogeneity on metal reduction in an Atlantic coastal plain determined...
Applied Geochemistry 22 (2007) 974–995
www.elsevier.com/locate/apgeochem
AppliedGeochemistry
The limited role of aquifer heterogeneity on metal reductionin an Atlantic coastal plain determined by push-pull tests
Brian J. Mailloux a,*, Stephanie Devlin a, Mark E. Fuller b, T.C. Onstott a,Mary F. DeFlaun b,1, Keun-Hyung Choi c, Maria Green-Blum c,
Donald J.P. Swift c, John McCarthy d, Hailiang Dong e
a Department of Geosciences, Princeton University, Princeton, NJ 08544, USAb Envirogen Inc. (Now Shaw Environmental and Infrastructure), Princeton Research Center, 4100 Quakerbridge Road,
Lawrenceville, NJ 08648, USAc Ocean, Earth, and Atmospheric Sciences, Old Dominion University, 4600 Elkhorn Avenue, Norfolk, VA 23529, USA
d Department of Geological Sciences, The University of Tennessee, Knoxville, TN 37996, USAe Miami University of Ohio, Department of Geology, Oxford, OH 45056, USA
Received 22 February 2006; accepted 15 December 2006Editorial handling by P.B. McMahon
Available online 15 February 2007
Abstract
Sixty push-pull experiments were conducted to determine the factors controlling Fe(III) and Mn(IV) reduction in awell-characterized, shallow, coastal plain aquifer near Oyster, VA, USA. The five multi-level samplers each equipped with12 ports sampled a heterogeneous portion of the aquifer from 4.4 to 8 m-bgs. Each multi-level sampler (MLS) was injectedwith groundwater that contained NO�3 and Br� along with: (1) just groundwater (control treatment), (2) humics, (3) lactate(conducted twice) and (4) lactate plus humics. Microbially mediated Fe(III) reduction caused the aqueous FeTot concen-trations to increase at every depth in the lactate treatment with significant increases within 1 day even while NO�3 was pres-ent. Little change in the FeTot concentrations were observed in the control and humics treatment. Humics may have actedas an electron shuttle to increase Fe(III) reduction in the lactate plus humics treatment. The amount of Mn(IV) reductionwas significantly lower than that of Fe(III) reduction. Geochemical modeling indicated that gas formation, sorption onreactive surfaces, and mineral precipitation were important processes and that Fe(III) and SO2�
4 reduction were co-occur-ring. Conditions were favorable for the precipitation of Fe-carbonates, Fe-sulfides and Fe-silicates. In the lactate treatmentprotist concentrations increased then decreased and planktonic cell concentrations steadily increased, whereas no changewas observed in the control treatment. Correlations of Fe(III) reduction with physical and chemical heterogeneity wereweak, probably as a result of the abundance of Fe(III) bearing minerals relative to electron donor abundance and thatthe push-pull test sampled a representative elemental volume that encompassed the microbial diversity within the aquifer.
0883-2927/$ - see front matter � 2007 Elsevier Ltd. All rights reserved.doi:10.1016/j.apgeochem.2006.12.020
* Corresponding author. Present address: Department of Environmental Sciences, Barnard College, 3009 Broadway, 404 Altschul Hall,New York, NY 10027, USA.
E-mail address: [email protected] (B.J. Mailloux).1 Present address: GeoSyntec Consultants, Research Park, Princeton, NJ 08540, USA.
watercenter
Stamp
B.J. Mailloux et al. / Applied Geochemistry 22 (2007) 974–995 975
This work indicates that stimulating metal reduction in aquifer systems is a feasible method for remediating heterogeneoussubsurface sites contaminated with metals and radionuclides.� 2007 Elsevier Ltd. All rights reserved.
1. Introduction
Iron(III) is one of the most prevalent electronacceptors in aquifer systems (Lovley and Philips,1986). At sites contaminated with chlorinated sol-vents and petroleum hydrocarbons, in situ degrada-tion can occur under Fe(III) reducing conditions(Lovley and Anderson, 2000). At sites contaminatedwith radionuclides (e.g. U, Pu and Cs) and toxicmetals (e.g. Cr, Hg and Pb) microbially mediatedreactions are being explored as potential remedialstrategies (National Research Council, 1994; Rileyand Zachara, 1992; US Department of Energy,2001). The addition of an electron donor to the sub-surface at these sites would promote both direct orindirect microbial reduction and precipitation ofmetals and radionuclides. Despite the potential ben-efit of in situ metal reduction few well-constrainedfield-scale experiments have been conducted (Istoket al., 2004; Senko et al., 2002). The goal of thisstudy is to examine the controls on Fe(III) reductionin a well characterized sandy aquifer by comparingFe(III) reduction rates determined by push-pulltests to site parameters.
Laboratory microcosm studies that examine thecontrols on Fe(III) reduction may not capture allof the relevant subsurface processes. In microcosmstudies with synthetic or aquifer sediments, only asmall percentage of the available Fe(III) is usuallyreduced (Roden and Urrutia, 2002). The cessationof Fe(III) reduction has been linked to unfavorablethermodynamic conditions and the sorption andprecipitation of Fe(II) to cell walls and mineral sur-faces (Liu et al., 2001b; Roden and Urrutia, 1999,2002; Urrutia et al., 1999). In laboratory studies,removal of Fe(II) by simulated groundwater flowenhanced the amount of Fe(III) reduction byremoving Fe(II) from the system (Roden and Urru-tia, 1999; Roden et al., 2000). The transport ofFe(II), however, is retarded (Martin and Kempton,2000) and Fe(II) may remain in the zone of Fe(III)reduction for a significant amount of time evenunder flowing conditions. In addition the movementand amount of Fe(II) can also affect abiotic reac-tions controlling mineral precipitation (Benneret al., 2002; Hansel et al., 2003). Laboratory studies,
therefore, may be poor predictors of field-scaleFe(III) reduction in dynamic aquifer systems.
The effect of aquifer heterogeneity on metalreduction has not been well studied. Microcosmstudies utilizing sediments from an anaerobic Atlan-tic Coastal Plain Aquifer have indicated that at thecentimeter scale Fe(III) reduction was not ubiqui-tous, discrete strata existed where Fe(III) reductionwas more active (Overstreet et al., 2001). Thesezones may be caused by localization of microbialcommunities, Fe(III) oxyhydroxides, or Fe(III)-bearing clays. Laboratory studies have indicatedthat the presence of electron shuttling compounds,such as humic acids, may enhance the amountFe(III) reduction because the metal reducing bacte-ria are not required to be in direct contact with theFe(III) bearing minerals (Fredrickson et al., 1998;Lovley et al., 1996; Zachara et al., 1998) but theirrole at the field-scale has not been well documented.
Push-pull experiments are a powerful method fordetermining in situ reaction rates within aquifers(Addy et al., 2002; Istok et al., 1997; McGuireet al., 2002; Schroth et al., 2001). During a push-pullexperiment groundwater is amended, added to anaquifer (pushed), and given time to react. Thegroundwater is then withdrawn (pulled) from theaquifer and the concentrations of a conservative tra-cer are compared to the reactive species in order tostudy the reactions occurring in situ.
In this study push-pull tests were conducted inmulti-level samplers (MLSs) with high vertical reso-lution to investigate the effects of small-scale,�30 cm, physical and chemical heterogeneities in awell-characterized aquifer on microbial metal reduc-tion. Five push-pull experiments that targeted fourtreatments were simultaneously performed acrossfive 12-port MLSs that spanned a 3.6 m section ofa shallow aquifer. The treatments were designed todetermine the effect of an electron donor and humicacids on metal reduction. Each experiment includedelevated levels of NO�3 to simulate conditions atDepartment of Energy (DOE) sites and Br� as aconservative tracer to determine reaction rates.Treatment 1 was a control treatment which receivedonly Br� whose goal was to determine the naturalreaction rates in the aquifer. Treatment 2 added
976 B.J. Mailloux et al. / Applied Geochemistry 22 (2007) 974–995
humic acids and whose goal was to determine theeffect of increased organic C concentrations onredox processes. Treatment 3 (performed twice)added lactate and whose goal was to determinethe effect of an electron donor on the rates of metalreduction. Treatment 4 added lactate and humicacids and whose goal was to determine the potentialof humics to act as an electron shuttle to increasethe rate and amount of Fe(III) reduction in the pres-ence of an electron donor. Rates calculated fromeach sampling port were compared to site parame-ters describing physical and chemical heterogeneity.Results indicate that aquifer heterogeneity has asmall effect on Fe(III) reduction and these resultshave important implications for remediation of sitescontaminated with metals and radionuclides.
2. Methods
2.1. Field site
Experiments were conducted at five separatewells equipped with MLSs spaced over 20 m2 inthe Columbia Aquifer at the South Oyster BacterialTransport Field Site on the Southern DelmarvaPeninsula (Fig. 1). The site has been extremely well
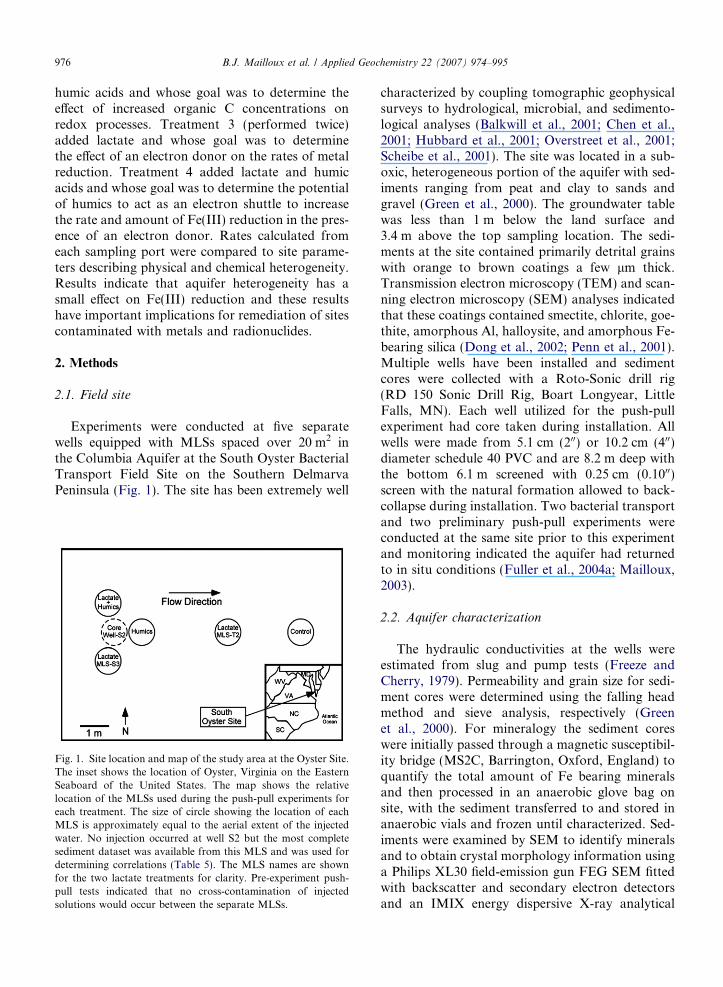
Fig. 1. Site location and map of the study area at the Oyster Site.The inset shows the location of Oyster, Virginia on the EasternSeaboard of the United States. The map shows the relativelocation of the MLSs used during the push-pull experiments foreach treatment. The size of circle showing the location of eachMLS is approximately equal to the aerial extent of the injectedwater. No injection occurred at well S2 but the most completesediment dataset was available from this MLS and was used fordetermining correlations (Table 5). The MLS names are shownfor the two lactate treatments for clarity. Pre-experiment push-pull tests indicated that no cross-contamination of injectedsolutions would occur between the separate MLSs.
characterized by coupling tomographic geophysicalsurveys to hydrological, microbial, and sedimento-logical analyses (Balkwill et al., 2001; Chen et al.,2001; Hubbard et al., 2001; Overstreet et al., 2001;Scheibe et al., 2001). The site was located in a sub-oxic, heterogeneous portion of the aquifer with sed-iments ranging from peat and clay to sands andgravel (Green et al., 2000). The groundwater tablewas less than 1 m below the land surface and3.4 m above the top sampling location. The sedi-ments at the site contained primarily detrital grainswith orange to brown coatings a few lm thick.Transmission electron microscopy (TEM) and scan-ning electron microscopy (SEM) analyses indicatedthat these coatings contained smectite, chlorite, goe-thite, amorphous Al, halloysite, and amorphous Fe-bearing silica (Dong et al., 2002; Penn et al., 2001).Multiple wells have been installed and sedimentcores were collected with a Roto-Sonic drill rig(RD 150 Sonic Drill Rig, Boart Longyear, LittleFalls, MN). Each well utilized for the push-pullexperiment had core taken during installation. Allwells were made from 5.1 cm (200) or 10.2 cm (400)diameter schedule 40 PVC and are 8.2 m deep withthe bottom 6.1 m screened with 0.25 cm (0.1000)screen with the natural formation allowed to back-collapse during installation. Two bacterial transportand two preliminary push-pull experiments wereconducted at the same site prior to this experimentand monitoring indicated the aquifer had returnedto in situ conditions (Fuller et al., 2004a; Mailloux,2003).
2.2. Aquifer characterization
The hydraulic conductivities at the wells wereestimated from slug and pump tests (Freeze andCherry, 1979). Permeability and grain size for sedi-ment cores were determined using the falling headmethod and sieve analysis, respectively (Greenet al., 2000). For mineralogy the sediment coreswere initially passed through a magnetic susceptibil-ity bridge (MS2C, Barrington, Oxford, England) toquantify the total amount of Fe bearing mineralsand then processed in an anaerobic glove bag onsite, with the sediment transferred to and stored inanaerobic vials and frozen until characterized. Sed-iments were examined by SEM to identify mineralsand to obtain crystal morphology information usinga Philips XL30 field-emission gun FEG SEM fittedwith backscatter and secondary electron detectorsand an IMIX energy dispersive X-ray analytical

B.J. Mailloux et al. / Applied Geochemistry 22 (2007) 974–995 977
system (Dong et al., 1999). For sequential extrac-tions sediment was dried in an anaerobic glovebag (90:10 N2:H2) and analyzed using a modifiedversion of published procedures (La Force and Fen-dorf, 2000; Mehra and Jackson, 1960). The sedi-ments were first shaken in degassed, deionizedwater at room temperature for 1 h to remove theanions and cations adsorbed to the sediment andsalts that had precipitated during drying in the glovebag. The Fe and Mn present in exchangeable claysites were extracted with 1 M MgCl2 at room tem-perature for 1 h. The sediments were then extractedwith 0.3 M Na citrate and 0.25 M Na dithionate at80 �C for 2 h at pH 7 for the Fe and Mn oxyhydrox-ides and at pH 13 for the Al hydroxide contents.Extracts were analyzed by ICP-OES and IC (seebelow). The sorbed organics were extracted sepa-rately from fresh sediments with 0.1 mM NaOHand the extract analyzed using a Shimadzu TOC-VTotal Organic Carbon Analyzer (Shimadzu Inc.,Columbia, MD). Initial SEM analyses were usedto design the extractions. HCl extractions leachingFe and Mn out of the clays, were not specific foroxides, and therefore were not utilized. In addition,the extractions were designed to also target the Aloxyhydroxides as these may be areas of increasedmicrobial abundance (Hall et al., 2005). Sequentialextractions have received scrutiny in the literature(Martin et al., 1987; Nirel and Morel, 1990) becausethey are operationally defined and do not target aspecific mineral phase, however, the extractionswere carefully planned and enabled a large numberof samples to be processed for site characterizationand comparisons (La Force and Fendorf, 2000).
Cores were collected and partially analyzed fromeach of the five wells used for the experiments. Theonly complete data set was available from the corecollected at MLS-S2 which was thoroughly charac-terized and centrally located (Fig. 1). Visual exami-nation, magnetic susceptibility and geochemicalanalyses of the cores along with acoustic and radartomographic cross-sections indicate that the physi-cal and chemical properties of the sediments wereuniform over several meters horizontally but variedmarkedly over �30 cm vertically. It was thereforeconcluded that the data from MLS-S2 could be uti-lized to relate sediment properties to the rate datagathered from the push-pull experiments. Sedimentcores were not collected after the push-pull experi-ment and therefore there are no direct measure-ments of mineral dissolution or precipitationduring the push-pull experiment.
2.3. Push-pull experiment
Sixty push-pull experiments were simultaneouslyconducted in the 12 vertical ports of MLSs placed infive wells beginning September 30, 2001 (Fig. 1).The MLSs were designed to be placed in 5.1 cmand 10.2 cm wells (Mailloux, 2003). By placing theMLSs inside the well, it minimized the formationcollapse that occurred during emplacement becausethe wells were closer in diameter to the drill borethan permanent MLSs. During design and testingof the MLSs it was shown that no vertical cross-contamination occurred between MLS levels (Mail-loux, 2003). The 12 ports, with one at the top, ofeach MLS were located from 4.4 to 8.0 m belowground surface (m-bgs) at 0.30 m intervals withthe water table approximately 1 m-bgs. The MLSswere emplaced so that the same port at each MLSwas always at the same depth. The wells with theMLSs were located both cross- and down-gradientfrom each other and the previous Br� tracer testdetermined that the groundwater flow rate was suf-ficiently low that the amended water from each wellwould remain in distinct zones with no cross-con-tamination occurring (Fig. 1).
To conduct the push-pull experiments water wasextracted from well B1, located 10.5 m up gradientof MLS-S2 and pumped into a 1000 L polyethylenetank (Fig. 1). The water in the tank was bubbledwith N2:CO2 (97:3), amendments of NaBr(�1.5 mM), humics, or lactate (NaC3H5O3)(�2 mM) were added, and the tank was thoroughlymixed with a pump. Previous work at the site indi-cated that bubbling gas through the water mini-mized the chemical changes that occurred to thegroundwater due to contact with the atmosphere.After mixing, the tank was emptied into 12 separate57 L, airtight, polyethylene tanks that were com-pletely filled and kept on ice out of direct sunlight.Peristaltic pumps were utilized to simultaneouslyempty each tank into one port of the MLS. Thismethod ensured that each port received exactly thesame volume of amended groundwater. The injec-tion process took �3 h. The tanks were rinsed andthe procedure was repeated for the remaining fourinjections. The predicted radius of influence for eachinjection was �0.45 m, assuming a porosity of 0.34(Scheibe et al., 2001).
The humic substances were extracted from thepeat-derived humic-rich groundwater from well E-0-D at the Kitty Hawk Woods Humic Reference Siteusing reverse osmosis (McCarthy, 2001; Sun et al.,
978 B.J. Mailloux et al. / Applied Geochemistry 22 (2007) 974–995
1995). For this study humics refer to the organic-richwater, which probably contains both humic and ful-vic acids. The humic acid injection solution washighly colored and was predominantly comprised oflarge molecular weight, hydrophobic acids, rich inaromatic groups as determined by Huffman laborato-ries (Golden, CO) (Leenheer, 1981). In contrast, theSouth Oyster site groundwater contained trace levelsof low molecular weight, hydrophilic organic matter(McCarthy et al., 1993, 1996). It was hypothesizedthat the humics rich in hydrophobic acids would actas an electron shuttle promoting Fe(III) reduction(Chen et al., 2003; Royer et al., 2002).
Initial aqueous samples were collected as thewater was pumped into each MLS. Subsequent sam-ples were collected daily from each sampling portfor the first week, then at approximately days 10,12 and 18. Sample collection was conducted witha peristaltic pump and consisted of a purge toremove the water in the MLS followed by collectionin sample vials.
2.4. Aqueous sample collection and analysis
The water samples were collected and analyzed fortemperature, pH, dissolved O2 (DO), Eh, dissolvedinorganic C (DIC), d13C of DIC, nonpurgeableorganic C (TOC), lactate, acetate, anions, cations,total cell counts, and protist counts. Temperature,pH, DO, and Eh were analyzed in the field in a custommade flow through cell. DIC was analyzed for CO2
with a Li-Cor LI-6252 (Li-Cor Inc., Lincoln, NE)after acidification, thus accounting for all inor-ganic C species and invariant of pH. Lactate andanions ðCl�; NO�2 ; SO2�
4 ; NO�3 ; PO3�4 and Br�Þ
were determined with a DX-320 ion chromatograph(IC) equipped with an AS-15 column and a limitednumber of samples were analyzed for acetate withan AS-11 column. Cation (Al, Ba, Co, Fe, Mn, P,Sr, Zn, Ca, Mg, Na, K, and Si) determinations wereperformed by Inductively Coupled Plasma OpticalEmission Spectroscopy ICP–OES DV4300 (Perkin–Elmer, Shelton, CT). Comparison between Fe(II) asdetermined by the ferrozine method and FeTot asdetermined by ICP–OES on select samples yieldedsimilar values and only FeTot concentrations are pre-sented. Samples for total organic C (TOC) were ana-lyzed using a Shimadzu TOC-V Total OrganicCarbon Analyzer (Shimadzu Inc., Columbia, MD).The aromatic content of the organic C was estimatedby measuring the UV-absorptivity at 270 nm (A270);absorbance at 270 nm was normalized to the TOC
concentration (Gauthier et al., 1987; McCarthy,2001; Traina et al., 1990). The samples for d 13C ofDIC were fixed with HgCl2 and analyzed by the com-pany Mountain Mass Spec (Evergreen, CO).
Total bacterial count samples were fixed with 1%(v:v) formaldehyde and sub-samples were amendedwith 20 mM nitrilotriacetic acid to chelate theFe(III), stained with 5 nM Syto13 (MolecularProbes Inc., Eugene, OR) and were counted on aFacSort flow cytometer (Becton Dickson Inc., SanJose, CA) (Mailloux et al., 2003; Stewart andSteinkamp, 1982). Protist samples were fixed with1% (v:v) glutaraldehyde buffered with 0.01 M cacco-dylate, at a pH of 6.0, and enumerated at 640x mag-nification with epifluorescence microscopy.
2.5. Data analysis
During a push-pull test, groundwater advectionand dispersion dilutes the injected water withgroundwater. The measured concentrations of eachspecies were corrected, where noted, for this dilutionutilizing the background and injectate concentrationof the species, the injected Br� concentration, andthe measured Br� concentrations (Haggerty et al.,1998; Snodgrass and Kitanidis, 1998). Zero orderand first order reaction rates were determined bythe method of Snodgrass and Kitanidis (1998) andall lines were fit by least squares.
Bacterial cells, Fe(II) and Mn(II) adsorb to sedi-ment grain surfaces. Since the amount of adsorbedFe(II), Mn(II) and cells could not be measured dur-ing the course of the experiment, rates of Fe(III)and Mn(IV) reduction and cell growth could notbe explicitly determined. Due to this sorption thestandard methods for calculating reaction rates forpush-pull experiments may not always be applica-ble. Therefore, two methods have been utilized forexamining the amount of change in the system.The first standard method is the determination ofrates utilizing dilution adjusted concentrations.The second method is the comparison of theobserved peak values of dissolved Fe, Mn andplanktonic cell concentrations. It is hypothesizedthat the observed peak values may be a good indica-tor of the amount and rate of metal reduction andthat combining these two methods should offerinsights into the observed processes.
The Pearson correlation coefficient (r) was uti-lized to determine two-parameter linear correlationsbetween push-pull results and the physical and geo-chemical aquifer properties. The rates and observed

B.J. Mailloux et al. / Applied Geochemistry 22 (2007) 974–995 979
concentrations from each port were compared tothe average physical and mineralogical characteris-tics available for that depth. A Student’s t-test withtwo tails and unequal sample variance was utilizedto compare the results from two treatments. P-val-ues below 0.01 were considered statistically signifi-cant, whereas results with p-values between 0.01and 0.05 were considered only significant.
2.6. Mass balance considerations
Push-pull tests are normally designed to look atthe soluble species. Metal reduction, however, canlead to solid or adsorbed phase formation and inthis experiment it was only possible to rely on theaqueous species data to draw inferences about thein situ processes. Using the DIC concentration,assuming no losses of DIC to carbonate precipita-tion or methanogenesis, it may be possible to deter-mine the main biogeochemical processes and theextent of the reactions from a mass balanceperspective:
DICt ¼ DIC0 þDICO2þDICNO�3
þDICMnðIVÞ
þDICFeðIIIÞ þDICSO2�4þDICFerm ð1Þ
At time (t) the amount of (DICt) is a function of theinitial DIC (DIC0), and the DIC produced from theredox reactions (Table 1). During the mineralizationof lactate, the production of DIC will be directlylinked to the redox reactions assuming no fermenta-tion (DICFerm = 0). Since the amount of DIC pro-duced from each reaction is not known, it canonly be estimated from the change in the redox sen-sitive species:
Table 1Reactions and Gibbs free energy of formations utilized in the thermod
Reaction
AcetateþH2O$ CH4 þHCO�34H2 þHCO�3 þHþ $ CH4 þ 3H2OLactateþ4Goethiteþ7Hþ$Acetateþ4Fe2þþHCO�3 þ6H2OLactateþ12Ferrihydriteþ22Hþ$ 12Fe2þþ3HCO�3 þ30H2OLactateþ 2H2O$ Acetateþ 2H2 þHþ þHCO�3Lactateþ 12Goethiteþ 22Hþ $ 12Fe2þ þ 3HCO�3 þ 18H2OLactate + 3O2 + H+ = 3H2O + 3CO2
Lactateþ 2:4NO�3 þ 0:4Hþ $ 1:2N2 þ 3HCO�3 þ 12H2OLac tateþ6MnO2ðgammaÞþ10Hþ$ 6Mn2þþ3HCO�3 þ6H2OLactateþ 1:5SO�4 $ 1:5HS� þ 0:5Hþ þ 3HCO�3
All thermodynamic calculations were performed with Geochemist’s WLivermore National Laboratories combined database (Delany and Lun
a The Fe(OH)3 formula for ferrihydrite was used as a simplification2FeOOH Æ 2.6H2O (Russell, 1979; Zachara et al., 2002).
DICt ¼ DIC0 þ 1:0O2 þ 1:25NO�3
þ 0:5MnðIIÞ þ 0:25FeðIIÞ þ 2:0SO2�4
þDICSorb ð2Þ
The amount of DIC (DICt) is then a function of theinitial DIC (DIC0), and the amount produced fromredox reactions (Eq. (2)) which can be measuredover time enabling a direct mass balance. Sulfatethat is adsorbed to the sediment and not representedby Eq. (2) may also be reduced and produce DIC.Fe(II) and Mn(II) may adsorb to the sediment orprecipitate following reduction, and the values inEq. (2) may underestimate the DIC produced fromthese reactions. Therefore, an additional DIC termthat reflects production from adsorbed species thatare reduced or redox products that adsorb is addedto the equation (DICSorb).
If lactate is completely oxidized, then 3 mol ofDIC (DICLact) are produced or if acetate accumu-lates than 1 mol of DIC is produced. Acetate canform as an intermediary during either fermentationor as a product of the redox reactions. The DICtcan then also be estimated from the amount of lac-tate utilized and acetate generated.
2.7. Geochemical modeling
The presence of Fe(II) in an aquifer is not alwaysa good indicator of the amount of Fe(III) reductionoccurring in an aquifer (Albrechtsen et al., 1995),therefore, geochemical modeling was undertaken.The goal of the geochemical modeling was to deter-mine the likelihood of Fe-bearing minerals to pre-cipitate, the relative energies of select geochemical
ynamic calculations
DGof (kcal/mol oflactate or CH4)
Chemical formulae
�14.4 Lactate CH3CHOHCOO�
�221.9 Acetate CH3COO�
�268.7 Goethite FeOOH�1064.8 Ferryhydritea Fe(OH)3
63.9�726.4�1252.1�1201.0�1254.8�109.5
orkbench (Rockware, Inc., Golden, CO) using the Lawrencedeen, 1990).of the possible true formulae, which may be closer to Fe2O3 Æ
980 B.J. Mailloux et al. / Applied Geochemistry 22 (2007) 974–995
reactions, and the controls on the aqueous geo-chemistry of the system. Geochemical modelingwas performed to track the saturation indices ofFe-bearing minerals and the Gibbs free energy ofmicrobial reactions. In addition reaction path mod-eling was conducted to discern the minimum num-ber of reactions and constraints required topredict the observed results. All geochemical calcu-lations were performed using Geochemist’s Work-bench (Rockware, Inc., Golden, CO) with theLawrence Livermore National Laboratories com-bined database (Delany and Lundeen, 1990).
3. Results
3.1. Site characterization
The average hydraulic conductivity across thesite was 2.4 ± 0.7 m/day with an average grain sizeof 2.2 ± 0.9 phi (0.27 ± 0.16 mm). SEM analysisindicated that the aquifer is comprised mainly of
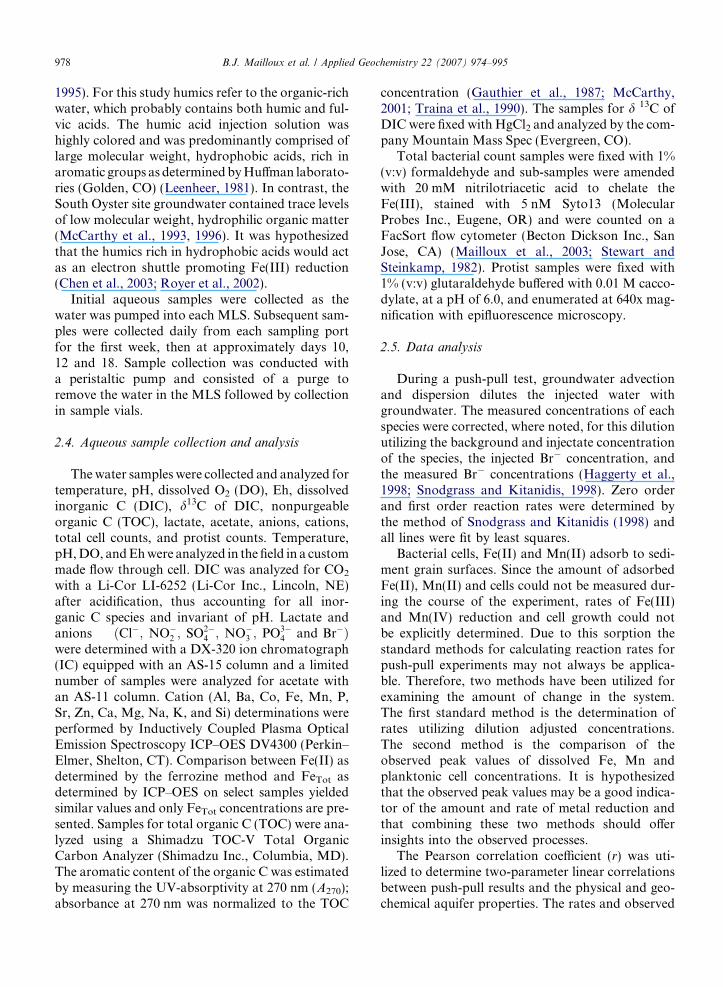
Fig. 2. SEM images and energy-dispersive spectrum of sediment collectquartz and feldspar; (B) BSE image showing goethite coating quartzcollected in SOFA water. These colloids were collected by filtering thespectrum of the colloid grains on C showing that the colloids are compand Al.
detrital quartz and feldspar with Fe oxyhdroxidespredominantly in the form of goethite coating thequartz grains or present as colloids in solution(Fig. 2). Anions and cations were adsorbed to thesediment including: SO2�
4 0.42 ± 0.25 mmol/kg, FeTot
0.60 ± 1.06 mmol/kg, MnTot 0.05 ± 0.20 mmol/kg,and AlTot 3.39 ± 7.47 mmol/kg. The averageadsorbed organic C was 26.8 ± 31.5 mmol/kg.Average values of exchangeable metals were FeTot
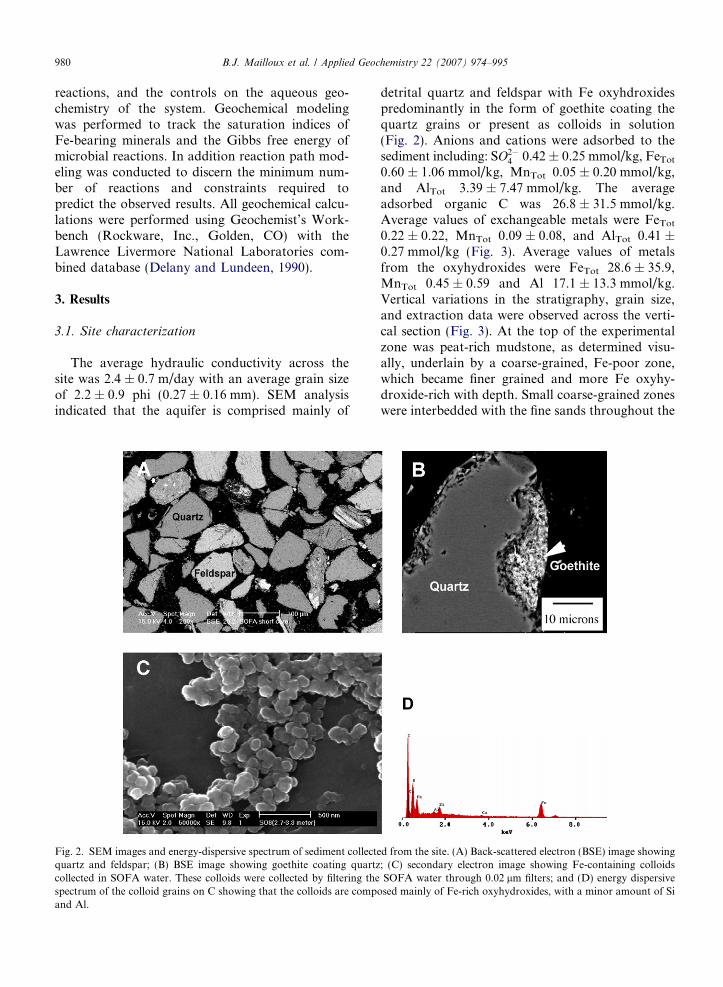
0.22 ± 0.22, MnTot 0.09 ± 0.08, and AlTot 0.41 ±0.27 mmol/kg (Fig. 3). Average values of metalsfrom the oxyhydroxides were FeTot 28.6 ± 35.9,MnTot 0.45 ± 0.59 and Al 17.1 ± 13.3 mmol/kg.Vertical variations in the stratigraphy, grain size,and extraction data were observed across the verti-cal section (Fig. 3). At the top of the experimentalzone was peat-rich mudstone, as determined visu-ally, underlain by a coarse-grained, Fe-poor zone,which became finer grained and more Fe oxyhy-droxide-rich with depth. Small coarse-grained zoneswere interbedded with the fine sands throughout the
ed from the site. (A) Back-scattered electron (BSE) image showing; (C) secondary electron image showing Fe-containing colloidsSOFA water through 0.02 lm filters; and (D) energy dispersive
osed mainly of Fe-rich oxyhydroxides, with a minor amount of Si

Hydraulic Conductivity (m/d)0.00 0.05 0.10 0.15 0.20
Percent Silt0 5 10 15 20 25
Magnetic Susc. (CGSx108)
Sam
plin
gP
ort
0.00 0.05 0.10 0.15
1
2
3
4
5
6
7
8
9
10
11
12
Sorbed Fe (mmol/kg)0.00 0.06 0.12 0.18 0.24
Exchangeable Fe (mmol/kg)0 0.1 0.2 0.3 0.4 0.5
Fe Oxyhydroxides (mmol/kg)p
g
Dep
thB
elow
Gro
und
Sur
face
(m)
0 25 50 75 100 125
4.55
4.85
5.15
5.45
5.75
6.05
6.35
6.65
6.95
7.25
7.55
7.85
Mean Grain Size (mm)
Sam
plin
gP
ort
0. 00 0.25 0.50 0.75 1.00
1
2
3
4
5
6
7
8
9
10
11
12
Sorbed Organic C (mmol/kg)
pg
Dep
thB
elow
Gro
und
Sur
face
(m)
0 2 4 6 8 10
4.55
4.85
5.15
5.45
5.75
6.05
6.35
6.65
6.95
7.25
7.55
7.85
Fig. 3. Site characterization data versus depth from the core collected at well S2 (Fig. 1). Depths are presented in terms of both thecorresponding port of the multilevel sampler (MLS) and the depth below ground surface. Data are shown for (a) mean grain size, (b)hydraulic conductivity, (c) % silt, (d) adsorbed organic C, (e) magnetic susceptibility, (f) adsorbed Fe, (g) exchangeable Fe, and (h) Feoxyhydroxides.
B.J. Mailloux et al. / Applied Geochemistry 22 (2007) 974–995 981
lower ports. Contact with the underlying clay unitof the Yorktown Formation occurred below theMLSs. 2.5 cm of rain fell during the experimentand the ambient flow rate across the site duringthe experiment was less than 5 cm/day (Scheibeet al., 2001).
3.2. Push-pull experiment
The ground water injected into the five MLSs wascompositionally identical, except for the amend-ments of (1) Control, (2) humics, (3) lactate, and (4)lactate and humics (Table 2; Fig. 1). In MLS-T2,two of the 12 ports were biostimulated with low-lev-els of Acidovorax sp. Strain OY107. This additionwas shown to have no effect on the observed resultsand the results for the lactate treatment are the sum-mation of the 24 ports from the two MLSs (Mailloux,2003). The injected water had higher DO and NO�3 ,lower DIC, MnTot, and FeTot and similar levels of
SO2�4 compared to that of the background ground
water (Table 2), which is consistent with an upgradi-ent source. The site’s pre-injection groundwatercomposition also suggests that O2 reduction, denitri-fication, Mn(IV) reduction, and Fe(III) reductionwere probably all occurring and that the push-pulltests were therefore being conducted in a mixed redoxenvironment. In all five treatments of the push-pullexperiment, the O2 was rapidly consumed from85 lM to less than 30 lM, near the detection limit,one day following injection, even in the control treat-ment (data not shown).
3.2.1. Control treatment
For the control treatment only Br� was added tothe injected water (Fig. 1) and lactate was notdetected (Fig. 4d). The Br� slowly decreased withtime from 0.99 ± 0.26 to 0.17 ± 0.12 mM with anaverage of 21% of the injected Br� remaining inall 12 ports after 18.9 days (Fig. 4a). The pH and
Table 2Summary of groundwater chemistry for background and injectedgroundwater
Parameter Backgroundgroundwater
Injectedgroundwater
pH 6.27 ± 0.07 6.15 ± 0.10Eh (mV) �54 ± 28 129 ± 23Dissolved Ch (mM) 0.005 ± 0.004 0.085 ± 0.025Dissolved inorganic carbon
(mM)0.83 ± 0.17 0.34 ± 0.04
Chloride (mM) 1.13 ± 0.36 1.40 ± 0.45Sulfate (mM) 0.54 ± 0.10 0.44 ± 0.06Lactate (mM) 0 Variablea
Br� (mM) 0.025 ± 0.031 1.76 ± 0.56Nitrate (mM) 0.015 ± 0.026 0.50 ± 0.09Nitrite (mM) 0.0005 ± 0.001 0.0004 ± 0.0007Ammonia (mM) 0.01 0.01Fe (mM) 0.077 ± 0.031 0.009 ± 0.009Mn (mM) 0.0028 ± 0.0039 0.0003 ± 0.0001Ca (mM) 0.61 ± 0.061 0.68 ± 0.08Mg (mM) 0.36 ± 0.036 0.33 ± 0.04Na (mM) 1.02 ± 0.28 3.78 ± 0.04K (mM) 0.08 ± 0.01 0.12 ± 0.01Si (mM) 0.18 ± 0.018 0.14 ± 0.03Nonpurgeable organic
carbon (TOC) (mM)0.26 ± 0.08 Variableb
a The average lactate was 0.03 ± 0.07 mM in the control treat-ment, 0 in the humic treatment, 1.96 ± 0.01 mM in the lactatetreatment, and 1.92 ± 0.07 mM in the lactate and humicstreatment.
b The TOC was 0.12+0.02 mM C in the control treatment,0.48 mM in the humics treatment, 4.3310.18 mM in the lactatetreatment, and 5.71 ± 1.00 mM in the lactate and humicstreatment.
982 B.J. Mailloux et al. / Applied Geochemistry 22 (2007) 974–995
Eh slowly decreased with time in all ports from6.17 ± 0.05 to 5.88 ± 0.12 and from 144 ± 32 to�64 ± 24 mV, respectively (Fig. 4b and c). TheNO�3 slowly decreased during the experiment withan average zero order rate of 0.010 ± 0.009 (mM/day) and a first order rate of 0.046 ± 0.049 (h�1).The DIC, FeTot and MnTot slowly increased withtime in all 12 ports from 0.37 to 0.55 ± 0.25 mMfor DIC, from 0.005 ± 0.008 to 0.031 ± 0.026 mMfor FeTot, and from 0.26 ± 0.03 to 0.75 ± 0.42 lMMnTot (Fig. 4e–g). Across the depth interval sam-pled by the 12 ports, the peak FeTot ranged from0.007 to 0.105 mM, the MnTot from 0.35 to1.93 lM. During the first week little increase wasobserved in the MnTot and FeTot with most of theincrease occurring at later times (Fig. 4f and g) withan average zero order rate of 1.6 ± 2.7 lM/day forFeTot and 0.16 ± 0.04 lM/day for MnTot (Table3). The SO2�
4 and cell concentrations remained rela-tively constant (Fig. 4h and i). The d 13C of DIC atport 10 showed no trend with values ranging from�10.9& to �14.6& PDB (data not shown). In port
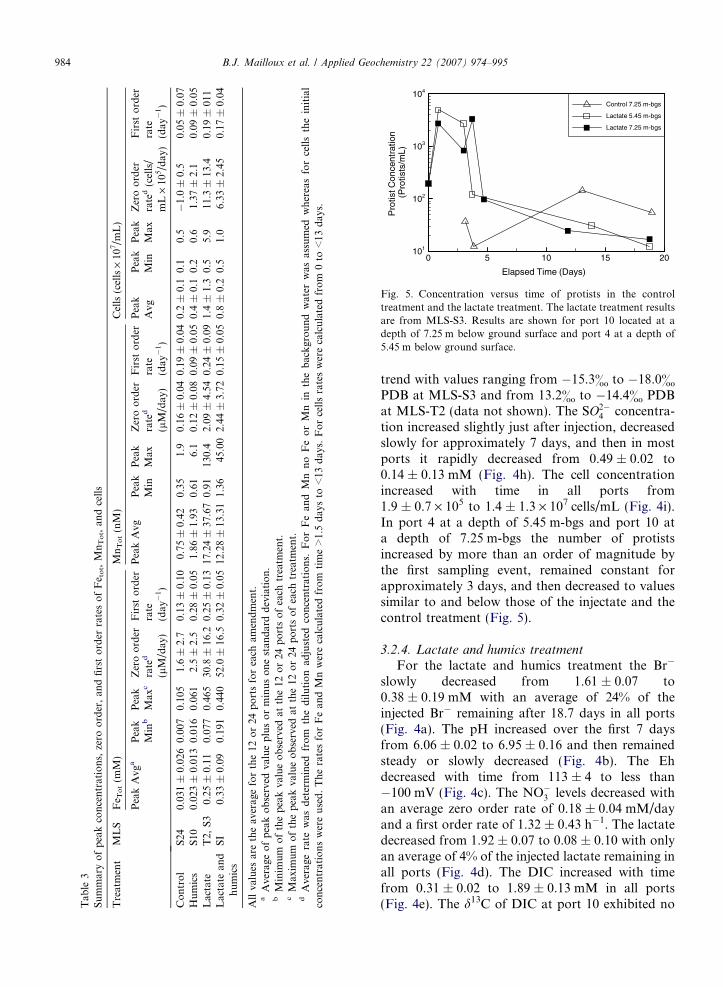
10 at a depth 7.25 m below ground surface littlechange in protist numbers were observed duringthe course of the experiment (Fig. 5).
3.2.2. Humics treatment
For the humics treatment no lactate was detected(Fig. 4d) and the Br� slowly decreased with timefrom 1.41 to 0.44 ± 0.36 mM with an average of31% of the injected Br� remaining in all 12 portsafter 18.1 days (Fig. 4a). The pH and Eh slowlydecreased with time in all 12 ports from about6.34 ± 0.00 to 5.80 ± 0.36, and from 91 ± 0 to69 ± 18 mV, respectively (Fig. 4b and c). The NO�3slowly decreased during the experiment with anaverage zero order rate of 0.034 ± 0.035 (mM/day)and a first order rate of 0.27 ± 0.22 (h�1). TheDIC slowly increased from 0.30 to0.39 ± 0.13 mM (Fig. 4e). The d13C of DIC at port10 showed no trend with values ranging from�12.3& to �14.5& PDB (data not shown). TheFeTot of the injected ground water was 0.016 mMthat decreased to 0.002 ± 0.001 mM after 1 day,remained steady for the first week, and slowlyincreased to 0.023 ± 0.012 mM in all ports(Fig. 4f). The injected water had an MnTot of0.49 ± 0.51 lM that remained steady for the firstweek and then slowly increased to 1.86 ± 1.93 lMin all ports (Fig. 4g). Amongst the 12 ports the peakFeTot varied from 0.016 to 0.061 mM, and theMnTot from 0.61 to 6.06 lM (Table 3). The FeTot
increased at an average zero order rate of2.5 ± 2.5 lM/day and the MnTot increased at a rateof 0.12 ± 0.08 lM/day (Table 3). The SO2�
4 concen-tration remained relatively constant (Fig. 4h). Theaverage cell concentration increased from4.2 ± 0.4 · 105 to 3.5 ± 1.0 · 106 cells/mL at a zeroorder rate of 1.37 ± 2.1 · 105 cells/mL-day withthe peak cell concentration ranging from 2 · 106
to 6 · 106 cells/mL (Fig. 4i, Table 3). The TOC con-tent of the injected water was elevated above thein situ concentration and decreased rapidly withtime from 0.48 to 0.25 ± 0.11 mM and was rela-tively uniform with depth (Fig. 6a). The A270, ameasure of the aromatic content of the organic C,decreased rapidly after injection, remained steadyduring the main portion of the experiment, and thenincreased during the later sampling events (Fig. 6b).
3.2.3. Lactate treatment
The lactate treatment was conducted in twowells, MLS-S3 and MLS-T2 and the results weregrouped together making it 24 ports at two MLSs

Elapsed (Days)
Mn To
t(M
)
0 5 10 15 200
6
12
18
24
30
Elapsed (Days)
Sul
fate
(mM
)
0 5 10 15 200
0.2
0.4
0.6
0.8
Elapsed (Days)
FeTo
t(m
M)
0 5 10 15 200
0.1
0.2
0.3
0.4
0.5
Elapsed (Days)
DIC
(mM
)
0 5 10 15 200
0.7
1.4
2.1
2.8
Elapsed (Days)
Lact
ate
(mM
)
0 5 10 15 200.0
0.5
1.0
1.5
2.0
Elapsed (Days)
Br
(mM
)
0 5 10 15 200.0
0.5
1.0
1.5
2.0
2.5
Elapsed (Days)
pH
0 5 10 15 20
5.7
6.2
6.7
7.2
Elapsed (Days)
Eh
(mV
)
0 5 10 15 20-100
0
100
200
Elapsed (Days)
Cel
ls/m
L
0 5 10 15 20105
106
107
Control
Lactate Humics and Lactate
Humic
Fig. 4. Concentration versus time at the control treatment (m), the humics treatment (�), the lactate treatment (j), and the lactate andhumics treatment (s) at port 10 at a depth of 7.25 m below ground surface. For the lactate treatment, data are shown from MSL-S3. Dataare shown for (a) Br� (mM), (b) pH, (c) Eh (mV), (d) lactate (mM), (e) DIC (mM), (f) FeTot (mM), (g) MnTot (lM), (h) SO2�
4 (mM), and (i)cells (cells/mL). The lower detection limit for Eh was �100 mV. This is the raw data and was not corrected for dilution with thebackground water.
B.J. Mailloux et al. / Applied Geochemistry 22 (2007) 974–995 983
that received the lactate treatment (Mailloux, 2003).The initial Br� concentrations were slightly differentbetween the two MLSs. The initial Br� at MLS-S3was 2.43 ± 0.10 and decreased to 1.37 ± 0.50 mMwith an average of 70% of the injected Br� remain-ing in all ports after 18.8 days. The initial Br� atMLS-T2 was 1.07 ± 0.02 and decreased to0.40 ± 0.26 mM with an average of 38% of theinjected Br� remaining after 16.8 days in all ports(Fig. 4a). The pH increased during the first 7 daysfrom 6.18 ± 0.07 to 6.90 ± 0.26 and then remainedsteady or slowly decreased (Fig. 4b). The Ehdecreased from 145 ± 12 to less than �100 mV,the detection limit (Fig. 4c). The NO�3 rapidlydecreased during the experiment with an averagezero order rate of 0.24 ± 0.13 (mM/day) and a firstorder rate of 2.18 ± 0.86 (h�1). The lactatedecreased with time from 1.96 ± 0.11 to0.12 ± 0.12 mM with only an average of 6% of thelactate remaining in all ports (Fig. 4d). The largest
acetate concentration determined from a limitednumber of samples was 0.3 mM with most valuesless than 0.04 mM. The DIC, FeTot and MnTot
increased with time in all ports from 0.36 ± 0.04to 2.26 ± 0.70 mM DIC, from 0.00 to0.252 ± 0.113 mM FeTot, and from 0.21 ± 0.01 to17.2 ± 37.7 lM MnTot (Fig. 4e–g). An increase inthe FeTot to 0.025 ± 0.021 mM and the MnTot to0.36 ± 0.21 lM occurred by the first sampling pointwithin 1 day with NO�3 still present (Fig. 4f and g).Across the depth interval, the peak FeTot variedfrom 0.077 to 0.465 mM, the peak MnTot variedfor 0.91–130.4 lM and the peak cells varied from0.2 · 107 to 5.9 · 107 cells/mL (Table 3; Fig. 7).The FeTot increased at an average zero order rateof 30.8 ± 16.2 lM/day and the MnTot increased ata rate of 2.09 ± 4.54 lM/day (Table 3). The amountof FeTot in the aqueous phase indicated that0.8 ± 1.3% of the Fe from the oxyhydroxides wasreduced. The d13C of DIC at port 10 showed no
Tab
le3
Su
mm
ary
of
pea
kco
nce
ntr
atio
ns,
zero
ord
er,
and
firs
to
rder
rate
so
fF
e to
t,M
nT
ot,
and
cell
s
Tre
atm
ent
ML
SF
e To
t(m
M)
Mn
To
t(n
M)
Cel
ls(c
ells
·10
7/m
L)
Pea
kA
vga
Pea
kM
inb
Pea
kM
axc
Zer
oo
rder
rate
d
(lM
/day
)
Fir
sto
rder
rate
(day�
1)
Pea
kA
vgP
eak
Min
Pea
kM
axZ
ero
ord
erra
ted
(lM
/day
)
Fir
sto
rder
rate
(day�
1)
Pea
kA
vgP
eak
Min
Pea
kM
axZ
ero
ord
erra
ted
(cel
ls/
mL
·10
5/d
ay)
Fir
sto
rder
rate
(day�
1)
Co
ntr
ol
S24
0.03
1±
0.02
60.
007
0.10
51.
6±
2.7
0.13
±0.
100.
75±
0.42
0.35
1.9
0.16
±0.
040.
19±
0.04
0.2
±0.
10.
10.
5�
1.0
±0.
50.
05±
0.07
Hu
mic
sS
100.
023
±0.
013
0.01
60.
061
2.5
±2.
50.
28±
0.05
1.86
±1.
930.
616.
10.
12±
0.08
0.09
±0.
050.
4±
0.1
0.2
0.6
1.37
±2.
10.
09±
0.05
Lac
tate
T2,
S3
0.25
±0.
110.
077
0.46
530
.8±
16.2
0.25
±0.
1317
.24
±37
.67
0.91
130.
42.
09±
4.54
0.24
±0.
091.
4±
1.3
0.5
5.9
11.3
±13
.40.
19±
011
Lac
tate
and
hu
mic
sS
I0.
33±
0.09
0.19
10.
440
52.0
±16
.50.
32±
0.05
12.2
8±
13.3
11.
3645
.00
2.44
±3.
720.
15±
0.05
0.8
±0.
20.
51.
06.
33±
2.45
0.17
±0.
04
All
valu
esar
eth
eav
erag
efo
rth
e12
or
24p
ort
sfo
rea
cham
end
men
t.a
Ave
rage
of
pea
ko
bse
rved
valu
ep
lus
or
min
us
on
est
and
ard
dev
iati
on
.b
Min
imu
mo
fth
ep
eak
valu
eo
bse
rved
atth
e12
or
24p
ort
so
fea
chtr
eatm
ent.
cM
axim
um
of
the
pea
kva
lue
ob
serv
edat
the
12o
r24
po
rts
of
each
trea
tmen
t.d
Ave
rage
rate
was
det
erm
ined
fro
mth
ed
ilu
tio
nad
just
edco
nce
ntr
atio
ns.
Fo
rF
ean
dM
nn
oF
eo
rM
nin
the
bac
kgr
ou
nd
wat
erw
asas
sum
edw
her
eas
for
cell
sth
ein
itia
lco
nce
ntr
atio
ns
wer
eu
sed
.T
he
rate
sfo
rF
ean
dM
nw
ere
calc
ula
ted
fro
mti
me
>1.
5d
ays
to<
13d
ays.
Fo
rce
lls
rate
sw
ere
calc
ula
ted
fro
m0
to<
13d
ays.
Elapsed Time (Days)
Pro
tistC
once
ntra
tion
(Pro
tists
/mL)
0 5 10 15 20101
102
103
104
Control 7.25 m-bgs
Lactate 5.45 m-bgs
Lactate 7.25 m-bgs
Fig. 5. Concentration versus time of protists in the controltreatment and the lactate treatment. The lactate treatment resultsare from MLS-S3. Results are shown for port 10 located at adepth of 7.25 m below ground surface and port 4 at a depth of5.45 m below ground surface.
984 B.J. Mailloux et al. / Applied Geochemistry 22 (2007) 974–995
trend with values ranging from �15.3& to �18.0&
PDB at MLS-S3 and from 13.2& to �14.4& PDBat MLS-T2 (data not shown). The SO2�
4 concentra-tion increased slightly just after injection, decreasedslowly for approximately 7 days, and then in mostports it rapidly decreased from 0.49 ± 0.02 to0.14 ± 0.13 mM (Fig. 4h). The cell concentrationincreased with time in all ports from1.9 ± 0.7 · 105 to 1.4 ± 1.3 · 107 cells/mL (Fig. 4i).In port 4 at a depth of 5.45 m-bgs and port 10 ata depth of 7.25 m-bgs the number of protistsincreased by more than an order of magnitude bythe first sampling event, remained constant forapproximately 3 days, and then decreased to valuessimilar to and below those of the injectate and thecontrol treatment (Fig. 5).
3.2.4. Lactate and humics treatmentFor the lactate and humics treatment the Br�
slowly decreased from 1.61 ± 0.07 to0.38 ± 0.19 mM with an average of 24% of theinjected Br� remaining after 18.7 days in all ports(Fig. 4a). The pH increased over the first 7 daysfrom 6.06 ± 0.02 to 6.95 ± 0.16 and then remainedsteady or slowly decreased (Fig. 4b). The Ehdecreased with time from 113 ± 4 to less than�100 mV (Fig. 4c). The NO�3 levels decreased withan average zero order rate of 0.18 ± 0.04 mM/dayand a first order rate of 1.32 ± 0.43 h�1. The lactatedecreased from 1.92 ± 0.07 to 0.08 ± 0.10 with onlyan average of 4% of the injected lactate remaining inall ports (Fig. 4d). The DIC increased with timefrom 0.31 ± 0.02 to 1.89 ± 0.13 mM in all ports(Fig. 4e). The d13C of DIC at port 10 exhibited no

Elapsed Time (Days)
A 270
(L/m
g-C
/cm
*103 )
0 5 10 15 200
10
20
30
40
50
Elapsed Time (Days)
Tota
lOrg
anic
Car
bon
(mM
)
0 5 10 15 200.00
0.15
0.30
0.45
0.60
5.15 m-bgs 5.75 m-bgs6.35 m-bgs 6.95 m-bgs
Pre-Inj.
Fig. 6. (a) Concentration of total organic C versus time for selectports of the humics treatment which received humics isolatedfrom Kitty Hawk, North Carolina. (b) A270 versus time for selectports of the humics treatment. A270 is an estimate of the aromaticcontent of the humic acids, based on UV absorption by p–p*
bonds at that wavelength. The dashed gray line indicates theaverage pre-injection values. Results are shown for port 3 at adepth of 5.15 m below ground surface (m-bgs), port 5 at 5.75mbgs, port 7 at 6.35 m-bgs, and port 9 at 6.95 m-bgs.
B.J. Mailloux et al. / Applied Geochemistry 22 (2007) 974–995 985
temporal trend with values ranging from �12.9& to�15.8& PDB (data not shown). The injected waterhad a FeTot of 0.018 ± 0.000 mM that remainedsteady for the first day, then steadily increased to0.331 ± 0.085 mM after 7 days (Fig. 4f) with a zeroorder rate of 52.0 ± 16.5 lM/day (Table 3). TheMnTot increased from 0.45 ± 0.02 to 12.18 ±13.31 lM with a zero order rate of 2.44 ± 3.72lM/day (Table 3). Across the depth interval thepeak FeTot ranged from 0.19 to 0.44 mM and theMnTot from 1.36 to 45.00 lM. The SO2�
4 concentra-tion increased slightly just after injection, slowlydecreased until approximately 7 days and then rap-idly decreased from an injection level of 0.46 ± 0.02
to 0.12 ± 0.05 mM in all ports (Fig. 4h). The cellconcentration increased in all ports with time from2.5 ± 3.9 · 105 to 7.6 ± 1.6 · 106 cells/mL (Fig. 4i)and the peak cells ranged from 0.5 · 107 to1.0 · 107 cells/mL (Table 3). The amount of FeTot
in the aqueous phase indicated that 1.8 ± 1.9% ofthe Fe from the oxyhydroxides was reduced.
3.2.5. Treatment comparisons
The temporal behavior of the groundwater chem-istry and cell density were distinct for the four treat-ments (Fig. 4; Tables 3 and 4). When onlycomparing port 10 at a depth of 7.25 m-bgs differ-ences were not always observed but when compar-ing across all the 12 ports statistically significantvariations were observed. Important differencesinclude that the peaks of FeTot were significantlygreater at the 99% confidence level in the lactatetreatment than the control treatment and that peakFeTot concentrations in the lactate and humics treat-ments were greater than the lactate treatment at the95% confidence level. Dilution adjusted zero orderrates for Fetot were greater in the lactate and humicsthan the lactate treatment at the 99% confidencelevel. Differences between treatments in the peakMnTot and cell concentrations were observed atthe 95% confidence interval but not the 99% confi-dence interval (Table 4C).
3.2.6. Heterogeneity
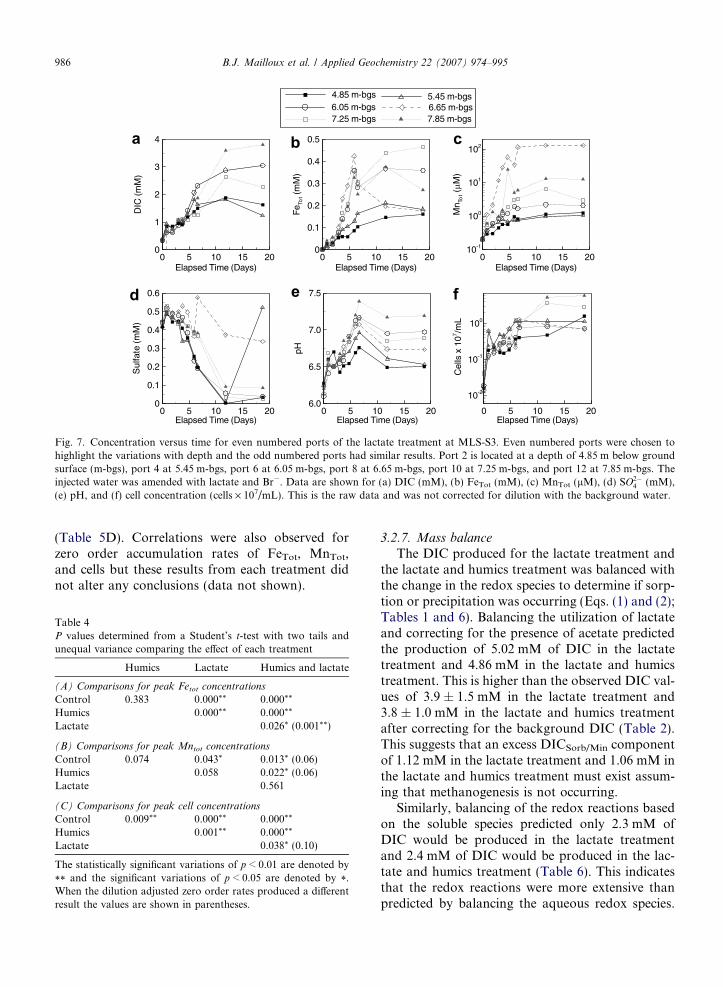
Variations in the peak concentration and the zeroorder rate of FeTot, MnTot, and cell concentrations,were observed as a function of depth for each treat-ment (Fig. 7; Table 5) and were compared to varia-tions in the physical and geochemical properties ofthe sediments. Important correlations include thatpeak FeTot concentration was positively correlatedwith the adsorbed Fe in the control treatment(Table 5A). In the humics treatment peak cell con-centrations, however, were positively correlatedwith hydraulic conductivity and negatively corre-lated with magnetic susceptibility (Table 5B). Inthe lactate treatment the peak FeTot concentrationswere negatively correlated with hydraulic conductiv-ity and adsorbed organic C and positively correlatedwith adsorbed Mn (Table 5C) and peak MnTot waspositively correlated with adsorbed Mn andexchangeable Mn. In the lactate and humics treat-ment peak FeTot concentrations were positively cor-related with adsorbed Mn and negatively correlatedwith adsorbed organic C (Table 5D) and peak cellswere positively correlated with adsorbed organic C
Elapsed Time (Days)
DIC
(mM
)
0 5 10 15 200
1
2
3
4
Elapsed Time (Days)
Sul
fate
(mM
)
0 5 10 15 200
0.1
0.2
0.3
0.4
0.5
0.6
Elapsed Time (Days)
Fe To
t(m
M)
0 5 10 15 200
0.1
0.2
0.3
0.4
0.5
Elapsed Time (Days)
pH
0 5 10 15 206.0
6.5
7.0
7.5
Elapsed Time (Days)
Cel
lsx
107 /m
L
0 5 10 15 20
10-2
10-1
100
Elapsed Time (Days)
Mn To
t(
M)
0 5 10 15 2010-1
100
101
102
4.85 m-bgs 5.45 m-bgs6.05 m-bgs 6.65 m-bgs7.25 m-bgs 7.85 m-bgs
Fig. 7. Concentration versus time for even numbered ports of the lactate treatment at MLS-S3. Even numbered ports were chosen tohighlight the variations with depth and the odd numbered ports had similar results. Port 2 is located at a depth of 4.85 m below groundsurface (m-bgs), port 4 at 5.45 m-bgs, port 6 at 6.05 m-bgs, port 8 at 6.65 m-bgs, port 10 at 7.25 m-bgs, and port 12 at 7.85 m-bgs. Theinjected water was amended with lactate and Br�. Data are shown for (a) DIC (mM), (b) FeTot (mM), (c) MnTot (lM), (d) SO2�
4 (mM),(e) pH, and (f) cell concentration (cells · 107/mL). This is the raw data and was not corrected for dilution with the background water.
986 B.J. Mailloux et al. / Applied Geochemistry 22 (2007) 974–995
(Table 5D). Correlations were also observed forzero order accumulation rates of FeTot, MnTot,and cells but these results from each treatment didnot alter any conclusions (data not shown).
Table 4P values determined from a Student’s t-test with two tails andunequal variance comparing the effect of each treatment
Humics Lactate Humics and lactate
(A) Comparisons for peak Fetot concentrations
Control 0.383 0.000** 0.000**
Humics 0.000** 0.000**
Lactate 0.026* (0.001**)
(B) Comparisons for peak Mntot concentrations
Control 0.074 0.043* 0.013* (0.06)Humics 0.058 0.022* (0.06)Lactate 0.561
(C) Comparisons for peak cell concentrations
Control 0.009** 0.000** 0.000**
Humics 0.001** 0.000**
Lactate 0.038* (0.10)
The statistically significant variations of p < 0.01 are denoted by
** and the significant variations of p < 0.05 are denoted by *.When the dilution adjusted zero order rates produced a differentresult the values are shown in parentheses.
3.2.7. Mass balance
The DIC produced for the lactate treatment andthe lactate and humics treatment was balanced withthe change in the redox species to determine if sorp-tion or precipitation was occurring (Eqs. (1) and (2);Tables 1 and 6). Balancing the utilization of lactateand correcting for the presence of acetate predictedthe production of 5.02 mM of DIC in the lactatetreatment and 4.86 mM in the lactate and humicstreatment. This is higher than the observed DIC val-ues of 3.9 ± 1.5 mM in the lactate treatment and3.8 ± 1.0 mM in the lactate and humics treatmentafter correcting for the background DIC (Table 2).This suggests that an excess DICSorb/Min componentof 1.12 mM in the lactate treatment and 1.06 mM inthe lactate and humics treatment must exist assum-ing that methanogenesis is not occurring.
Similarly, balancing of the redox reactions basedon the soluble species predicted only 2.3 mM ofDIC would be produced in the lactate treatmentand 2.4 mM of DIC would be produced in the lac-tate and humics treatment (Table 6). This indicatesthat the redox reactions were more extensive thanpredicted by balancing the aqueous redox species.

Table 5Pearson correlation coefficient between aquifer parameters andpush-pull results
Peak FeTot Peak MnTot Peak cells
(A) Control treatment
Grain size �0.32 0.34 0.52Hydraulic conductivity �0.50 �0.25 0.55Sorbed Fe 0.64* 0.25 0.08Sorbed Mn 0.49 0.03 �0.17Exchangeable Fe �0.50 �0.30 0.22Exchangeable Mn 0.20 �0.22 �0.24Fe-oxyhydroxides 0.49 �0.10 �0.44Mn-oxyhydroxides 0.22 �0.12 �0.22Magnetic susceptibility 0.05 0.01 �0.35Sorbed organic carbon �0.49 �0.36 0.12
(B) Humics treatment
Grain size 0.07 �0.41 0.22Hydraulic conductivity 0.54 �0.49 0.61*
Sorbed Fe �0.12 �0.33 �0.40Sorbed Mn �0.40 0.32 �0.16Exchangeable Fe 0.06 �0.36 0.31Exchangeable Mn �0.22 0.10 �0.07Fe-oxyhydroxides �0.09 0.15 �0.46Mn-oxyhydroxides �0.21 0.03 �0.28Magnetic susceptibility �0.17 0.16 �0.66*
Sorbed organic carbon 0.47 �0.36 0.49
(C) Lactate treatment
Grain size �0.35 �0.27 �0.38Hydraulic conductivity �0.74* �0.44 �0.31Sorbed Fe 0.11 �0.20 0.31Sorbed Mn 0.64* 0.66* �0.04Exchangeable Fe �0.44 �0.25 �0.20Exchangeable Mn 0.31 0.60* �0.16Fe-oxyhydroxides 0.37 0.30 0.28Mn-oxyhydroxides 0.38 0.56 �0.02Magnetic susceptibility 0.28 0.03 0.19Sorbed organic carbon �0.71* �0.39 �0.27
(D) Lactate and humic acid treatment
Grain size �0.16 �0.73* �0.30Hydraulic conductivity �0.31 �0.73* 0.15Sorbed Fe �0.32 0.13 0.02Sorbed Mn 0.70* 0.23 �0.51Exchangeable Fe �0.58 �0.16 0.57Exchangeable Mn 0.25 0.04 �0.05Fe-oxyhydroxides 0.17 0.50 0.02Mn-oxyhydroxides 0.39 0.25 �0.25Magnetic susceptibility 0.02 0.46 �0.03Sorbed organic carbon �0.62* �0.52 0.71*
Correlations greater than 0.6 are marked with an *. Eachparameter had 12 (24 for the lactate treatment) samples exceptgrain size and hydraulic conductivity which each had 11 samplesor (22 at the lactate treatment).
B.J. Mailloux et al. / Applied Geochemistry 22 (2007) 974–995 987
In summary, if the amount of lactate utilized isexamined the observed values of DIC are too lowand if only the aqueous redox species is examined,the observed values of DIC are too high. Therefore,geochemical modeling was required to determine
the principal electron acceptor processes involvedin mineralization of the lactate.
3.2.8. Geochemical modelingGeochemical modeling was performed to deter-
mine the saturation indices of Fe bearing mineralsover the course of the push-pull experiment. Thewater chemistry data from port 10 at a depth of7.25 m below ground surface of the lactate treat-ment were utilized for the calculations. When O2
values were less than 30 lM, 3.0 lM HS�, whichis the detection limit of the Chemet kits, wasincluded in the calculations. After approximately 3days troilite, a Fe-sulfide, became super-saturated,after 5 days siderite, a Fe-carbonate, becamesuper-saturated, and after 6 days greenalite andminnesotaite, Fe-silicates, became super-saturated(Fig. 8). Supersaturation of Fe-sulfides and theirprecipitation seems reasonable given the decreasein SO2�
4 corresponds to the production of severalhundred lM sulfide which is not detected in thegroundwater. Siderite may be a sink of DIC, how-ever, calcite was under-saturated and was probablynot a sink of DIC.
Geochemical modeling was also conducted todetermine the Gibbs free energy of the majormicrobial reactions that might be occurring in theaquifer (Table 1; Fig. 9). The most favorable reac-tions were NO�3 reduction, Mn(IV) reduction, andreduction of solid phase ferrihydrite. The nextfavorable reaction was Fe(III) reduction of goe-thite. As the Fe(II) and pH increased over thecourse of the experiment, however, SO2�
4 reductionbecomes more favorable (Fig. 10). Fermentationand methanogenesis were estimated to be consider-ably less exergonic (Fig. 10).
Geochemical reaction path modeling was per-formed to determine the main processes occurringwithin the aquifer that impacted on observedresults. The goal was to determine if the followingprocesses were important: adsorption to reactivesurfaces, mineral precipitation, and formation of agas phase. The goal was to develop a simple modelthat captured the main processes occurring in theaquifer during the push-pull experiment. The modelwas constrained by visually comparing model out-put to the observed pH and concentrations ofDIC, lactate, FeTot, and SO2�
4 averaged from thelactate treatment. Modeling was performed from 0to 12 days assuming that no mixing occurred withthe background groundwater during this time andwas parameterized with two distinct time periods.

Table 6Mass balance calculations for determining the contribution of each redox species to the observed DIG
(A) The amount of O2, nitrate and sulfate reduced, and the amount of Fetot and MnTot produced. These numbers were utilized to predictthe DICRedox from Eq. (2). All concentrations are in mM
Dissolved O2
reducedNitratereduced
FeTot produced MnTot
producedSulfate reduced Predicted DIC generated
(DICRedox)
Lactate 0.085 0.50 0.25 0.017 0.56 2.26Lactate and
humic acids0.085 0.50 0.33 0.012 0.66 2.43
(B) Mass balance numbers for DIC during the push-pull experiment. Unaccounted DIC was calculated from the observed and predictedDIC values (Eq. (2)). All concentrations are in mM
Max observedDIC (DICt)
aInitial DIC(DIC0)
Unaccounted DIC(DICSorb)
Lactateutilized
DIC produced bylactate (DICLact)
Unaccounted lactateDIC (DICSorb-lact)
Lactate 3.91 0.36 1.65 1.67 5.02 2.76Lactate and
humic acids3.70 0.31 1.27 1.62 4.86 2.43
The DIG numbers were corrected for dilution.a The maximum value was corrected for dilution by using the Br� data.
Time (Days)
Sat
urat
ion
Inde
x(L
ogQ
/K)
0 5 10 15 20-5.0
-2.5
0.0
2.5
5.0Greenalite Fe3Si2O5(OH)4
Minnesotaite Fe3Si10(OH)2
Siderite FeCO3
Troilite FeS
Fig. 8. Mineral saturation index of selected minerals versus time.Values greater than zero indicate super-saturation and thatprecipitation may have occurred. All calculations were performedwith GeoChemist’s Workbench version 3.2 (Rockware Inc.,Golden, CO). The groundwater chemistry from the lactatetreatment at MLS-S3 Port 10 at a depth of 7.25 m below groundsurface at each time point was utilized as input. When O2 valueswere less than 30 lM, 3.0 lM HS� was included for calculations.If points are not plotted they were below �5.0.
Gib
bsF
ree
Ene
rgy
(kJ/
mol
Lact
ate
orC
H4)
Ferrihydrite Reduction
Mn Oxide Reduction
Nitrate Reduction
Time (Days)0 10 15 20
-1400
-1000
-600
-200
Goethite Reduction
Autotrophic Methanogenesis
Fermentation
SulfateReduction
Acetoclastic Methanogenesis
-150
-100
-50
0
5
Fig. 9. Gibbs free energy of reaction for selected reactions (Table1) over the course of the stimulation. Calculations were performedutilizing the groundwater chemistry from each sampling time pointfor the lactate treatment at MLS-S3 Port 10 at a depth of 7.25 mbelow ground surface (Fig. 2). The gray area represents theapproximate minimum Gibbs free energy, �20 kJ/mol of ATP,required for the synthesis of ATP and to enable cell growth (Schink,1997). H2 concentrations were not measured. For fermentation H2
was estimated to be 0.5 nM from published values (Lovley et al.,1994) and acetate was estimated to be 17 lM from pre-stimulationconcentrations. Values for O2 reduction are not shown due to itsrapid removal. The scale on the y-axis is not uniform to highlightthe variation.
988 B.J. Mailloux et al. / Applied Geochemistry 22 (2007) 974–995
From 0 to 1.8 days O2 reduction and denitrificationwere simulated with rates of 0.19 and 0.14 mM/day.From 1.8 to 12 days reduction of goethite and SO2�
4
were simulated (Table 2). The rate constant forFe(III) reduction was 78 lmol/day. The SO2�
4 reduc-tion rate was varied between 4 and 52 lmol/daydepending on model conditions. All reactions weremodeled as zero order reactions. When precipitationwas modeled, the precipitation of magnetite, hema-tite, and C were suppressed. This is a simplistic rep-
resentation of the system but the goal was to use theminimal parameterization required to capture themain processes since the majority of reaction coeffi-cients are poorly constrained for natural systems.
56789
1011
0 3 6 9 12Elapsed (Days)
pH
0.0
0.1
0.2
0.3
0.4
0.5
0 3 6 9 12Elapsed (Days)
FeTo
t (m
M)
0.0
1.0
2.0
3.0
4.0
0 3 6 9 12Elapsed (Days)
DIC
(mM
)
0
0.5
1
1.5
2
2.5
0 3 6 9 12ELapsed (Days)
Lact
ate
(mM
)
0
0.2
0.4
0.6
0 3 6 9 12Elapsed (Days)
Sulfa
te (m
M)
Observed Data
No Solid Interaction
Mineral Precipitation
Min Precip and Sorption
Open Sys, Min Precip, and Sorp.
d
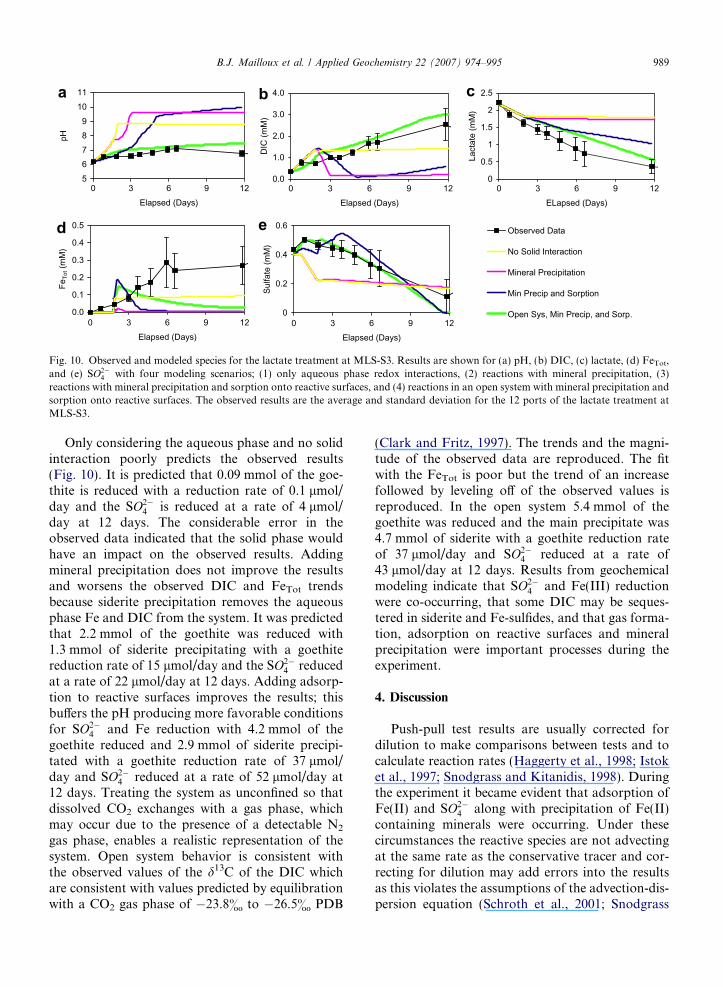
Fig. 10. Observed and modeled species for the lactate treatment at MLS-S3. Results are shown for (a) pH, (b) DIC, (c) lactate, (d) FeTot,and (e) SO2�
4 with four modeling scenarios; (1) only aqueous phase redox interactions, (2) reactions with mineral precipitation, (3)reactions with mineral precipitation and sorption onto reactive surfaces, and (4) reactions in an open system with mineral precipitation andsorption onto reactive surfaces. The observed results are the average and standard deviation for the 12 ports of the lactate treatment atMLS-S3.
B.J. Mailloux et al. / Applied Geochemistry 22 (2007) 974–995 989
Only considering the aqueous phase and no solidinteraction poorly predicts the observed results(Fig. 10). It is predicted that 0.09 mmol of the goe-thite is reduced with a reduction rate of 0.1 lmol/day and the SO2�
4 is reduced at a rate of 4 lmol/day at 12 days. The considerable error in theobserved data indicated that the solid phase wouldhave an impact on the observed results. Addingmineral precipitation does not improve the resultsand worsens the observed DIC and FeTot trendsbecause siderite precipitation removes the aqueousphase Fe and DIC from the system. It was predictedthat 2.2 mmol of the goethite was reduced with1.3 mmol of siderite precipitating with a goethitereduction rate of 15 lmol/day and the SO2�
4 reducedat a rate of 22 lmol/day at 12 days. Adding adsorp-tion to reactive surfaces improves the results; thisbuffers the pH producing more favorable conditionsfor SO2�
4 and Fe reduction with 4.2 mmol of thegoethite reduced and 2.9 mmol of siderite precipi-tated with a goethite reduction rate of 37 lmol/day and SO2�
4 reduced at a rate of 52 lmol/day at12 days. Treating the system as unconfined so thatdissolved CO2 exchanges with a gas phase, whichmay occur due to the presence of a detectable N2
gas phase, enables a realistic representation of thesystem. Open system behavior is consistent withthe observed values of the d13C of the DIC whichare consistent with values predicted by equilibrationwith a CO2 gas phase of �23.8& to �26.5& PDB
(Clark and Fritz, 1997). The trends and the magni-tude of the observed data are reproduced. The fitwith the FeTot is poor but the trend of an increasefollowed by leveling off of the observed values isreproduced. In the open system 5.4 mmol of thegoethite was reduced and the main precipitate was4.7 mmol of siderite with a goethite reduction rateof 37 lmol/day and SO2�
4 reduced at a rate of43 lmol/day at 12 days. Results from geochemicalmodeling indicate that SO2�
4 and Fe(III) reductionwere co-occurring, that some DIC may be seques-tered in siderite and Fe-sulfides, and that gas forma-tion, adsorption on reactive surfaces and mineralprecipitation were important processes during theexperiment.
4. Discussion
Push-pull test results are usually corrected fordilution to make comparisons between tests and tocalculate reaction rates (Haggerty et al., 1998; Istoket al., 1997; Snodgrass and Kitanidis, 1998). Duringthe experiment it became evident that adsorption ofFe(II) and SO2�
4 along with precipitation of Fe(II)containing minerals were occurring. Under thesecircumstances the reactive species are not advectingat the same rate as the conservative tracer and cor-recting for dilution may add errors into the resultsas this violates the assumptions of the advection-dis-persion equation (Schroth et al., 2001; Snodgrass
990 B.J. Mailloux et al. / Applied Geochemistry 22 (2007) 974–995
and Kitanidis, 1998). Fortunately, over the courseof the first 12 days of the experiment, where theanalyses were focused, the Br� concentrations wererelatively uniform, indicating minimal mixingwithin the aquifer. In addition, peak values and zeroorder rates for Mn, Fe, and cells gave similarresults. Therefore, it is assumed that the peak valuesand rates estimates could be utilized to describe thechanges in FeTot with time and make comparisonsto site parameters.
In the control treatment NO�3 and pH levelsslowly decreased and only small changes in themetal concentrations, cell concentration, and protistconcentrations were observed. These results indi-cated that the rates of microbial metal reductionin the absence of an electron donor were slow.
In the humics treatment Fe and Mn concentra-tions were elevated during injection but thendecreased to concentrations similar to the controltreatment. The very rapid decrease in the TOC con-centration to near background levels could berelated to increased microbial utilization of thehumics (Fig. 6). However, the concomitant declinein A270 of the recovered organics to pre-injectionbackground levels suggests that the reduced TOClevels were largely attributable to rapid preferentialadsorption of the more hydrophobic, aromatic-rich,and UV-absorbing humic components by the aqui-fer sediments (McCarthy et al., 1996). To test thishypothesis, humic transport experiments were con-ducted in the laboratory using the same source ofhumics and columns of repacked sediments recov-ered from the MLS-S10 core; the humics werestrongly retarded, with preferential retention ofthe UV-absorbing humic components (data notshown) suggesting sorption and not microbial activ-ity as the dominant process. The apparent effect ofthe humics treatment on cell concentrations maybe due to desorption of cells caused by masking ofpositively charged sites instead of cell growth (John-son and Logan, 1996). This is consistent with thehighest concentrations of peak cells occurring inthe high permeability, low magnetic susceptiblezones where positively charged sites would be lim-ited (Table 5). Humics alone did not have an effecton metal reduction, however, future experimentsshould utilize higher concentrations to verify theseresults.
In the lactate treatment, aqueous phase increasesin the Fe and Mn concentrations were observedwith this increase beginning within one day of thestart of the experiment. The DIC increased and
the lactate decreased faster than Br�. Since killedcontrols were not utilized it is not possible to defin-itively say the changes were microbially mediated.Bioavailable Fe(III) was present, however, withinthe aquifer in the form of Fe oxyhydroxides coatingthe quartz grains and present as colloids. Frommicrocosm studies it is known that lactate doesnot abiotically reduce or chelate Fe(III) (Fredrick-son et al., 1998). Therefore, in the lactate treatment,given the large increase in cell numbers, protists,and the changes in redox sensitive species it wasconcluded that the push-pull experiment stimulatedmicrobial activity within the aquifer. Microbialactivity occurred quickly since metal concentrationswere elevated above the control treatment withinone day while NO�3 was still present. The greatestFe(III) reducing activity occurred in the finegrained, peat poor zones with adsorbed Mn. Man-ganese(IV) reduction occurred in zones withadsorbed and exchangeable Mn. The peat rich zoneshad limited microbial activity, but, in general metalreduction occurred at all depths.
In the lactate and humics treatment, largeincreases in Fe and Mn concentrations wereobserved with the increase beginning within twodays of the injection. These increases were notcaused by the presence of humics alone but requiredan electron donor with the humics and were due tomicrobial activity. The peak Fe concentrations werehigher than in the lactate treatment at the 95% con-fidence level and the rates were faster at the 99%confidence level (Table 4). This may have beencaused by preferential sorption of humics causingdesorption of the Fe, however, the planktonic cellconcentrations did not increase and this effect wasnot observed in the humics treatment. Theincreased level of Fe(III) reduction, therefore, mayhave been caused by electron shuttling which hasbeen shown to be important in laboratory environ-ments (Lovley and Blunt-Harris, 1999; Nevin andLovley, 2000). Further studies are needed to verifythis result and the importance of electron shuttlingin situ.
The increase in protist and bacterial cell concen-trations in the lactate and lactate and humics treat-ment could be due to desorption from the sedimentor growth. Extractions from core samples indicatedthat approximately 100 protists and 1 · 105 bacteriawere associated with each gram of sediment (datanot shown, K. Choi). Complete desorption of allthe cells and protists from the sediment would resultin approximately 500 protists/mL and 5 · 105 cells/

B.J. Mailloux et al. / Applied Geochemistry 22 (2007) 974–995 991
mL in the aqueous phase. Adding this sedimentassociated concentration to the initial protist andbacterial concentrations could not account for theobserved concentrations in the aqueous phase (Figs.4 and 7) and microbial growth most likely occurred.Previous studies of protist dynamics using sitegroundwater and sediment or conducted duringbacterial transport experiments have indicatedslower response times and growth rates thanobserved in this study (data not shown, K. Choi;Zhang et al., 2001). The only increase in protist con-centrations occurred between the injection and thefirst sampling point of the stimulated MLSs. Thisindicates that the protist community preferred oxicconditions. When the system was anaerobic, thenumber of protists decreased but a sub-set of theprotist community may be able to survive in anaer-obic conditions but longer lag times may occurbefore growth is observed (Dawson and Pace,2002; Kinner et al., 2002). Future experimentsshould be able to link the change in the microbialcommunity to the changing redox processes andGibbs free energy of the system.
Geochemical modeling and mass balance calcula-tions indicated that the formation of a gas phase,adsorption to reactive surfaces, and mineral precip-itation were important processes throughout thecourse of the push-pull experiment. The formationof a gas phase caused the system to behave as if itwas open. This was observed by seeing no trend inthe d13C of DIC over time and a larger thanexpected buffering of the pH. In addition geophysi-cal monitoring indicated that a separate gas phaseformed during the initial portions of the experiment(data not shown) (Mailloux, 2003), which is inagreement with theoretical studies indicating thatduring denitrification N2 may have formed a sepa-rate gas phase (Andrews and Wilson, 1987; Heatonand Vogel, 1981; Mailloux, 2003). The formation ofa gas phase may be an important but overlookedprocess in shallow aquifers undergoing redox reac-tions. Adsorption was an important process with asignificant fraction of the Fe and SO2�
4 adsorbedto reactive sites on the mineral surfaces. Mineralprecipitation was also important with Fe silicates,Fe sulfides and Fe carbonates most likely precipitat-ing (Fig. 8). The geochemical modeling indicatedthat Fe(III) and SO2�
4 reduction were favorableand could have been co-occurring throughout thepush-pull experiment and may have supported cellgrowth and activity (Albrechtsen et al., 1995; Liuet al., 2001a; Schink, 1997; Thauer et al., 1977).
In microcosm experiments, Fe(III) reductionusually ceases before all the solid phase Fe(III) isreduced (Zachara et al., 1998). Processes wereoccurring in the aquifer that should have promotedcontinued Fe(III) reduction. Organic C was presentthat may have acted as an electron shuttle especiallyin the lactate and humics treatment. Cell growthwas occurring so new cell walls should not havebeen coated with Fe(II) (Roden and Urrutia,1999) and Fe(III) reducers which are known to bepresent in the aquifer (Fuller et al., 2004b) couldpotentially dominate (Bekins et al., 1999, 2001; Sno-eyenbos-West et al., 2000). In addition groundwaterflow was occurring helping to flush the Fe(II)(Roden et al., 2000), however, it is not clear if abi-otic transformations were occurring (Hansel et al.,2003). The conditions, therefore, existed to promotecontinued Fe(III) reduction even if changes in Fe(II)concentrations were not observed. However, smallchanges in Fe(II) concentrations may be indicativeof large changes in the redox conditions of an aqui-fer (Cozzarelli et al., 2001). It is possible to concludethat both continued SO2�
4 and Fe(III) reductionwere occurring and the only mechanism to observethese reactions was a decrease in lactate concentra-tions and an increase in DIC concentrations. Futurepush-pull experiments that examine Fe(III) reduc-tion could collect and analyze sediment samples fol-lowing the experiment to better constrain theadsorbed and precipitated phases. However, givenaquifer heterogeneity it may be difficult to sampleand constrain the sediment differences and with onlya small percent of the Fe oxyhydroxides beingreduced it may be difficult to quantitatively observechanges.
Examining the controls of Fe(III) reduction andalterations in mineralogy are common for both nat-ural and synthetic sediments (Fredrickson et al.,1998; Kukkadapu et al., 2006; Roden et al., 2000)but rates are not consistently reported. Comparisonof rates from the push-pull experiments with otherpublished values indicates that some consistenttrends develop (Table 7). The rates of the controland humics treatment are similar to those reportedfor a pristine sandy aquifer (Jakobsen and Postma,1999). The rates from the lactate and lactate andhumics treatment are similar to rates computedfrom aquifers contaminated from a landfill leachate(Cozzarelli et al., 2000; Ludvigsen et al., 1998).These rates are all significantly slower than soilsand aquifer sediments incubated with an electrondonor and a cell culture (Zachara et al., 1998).
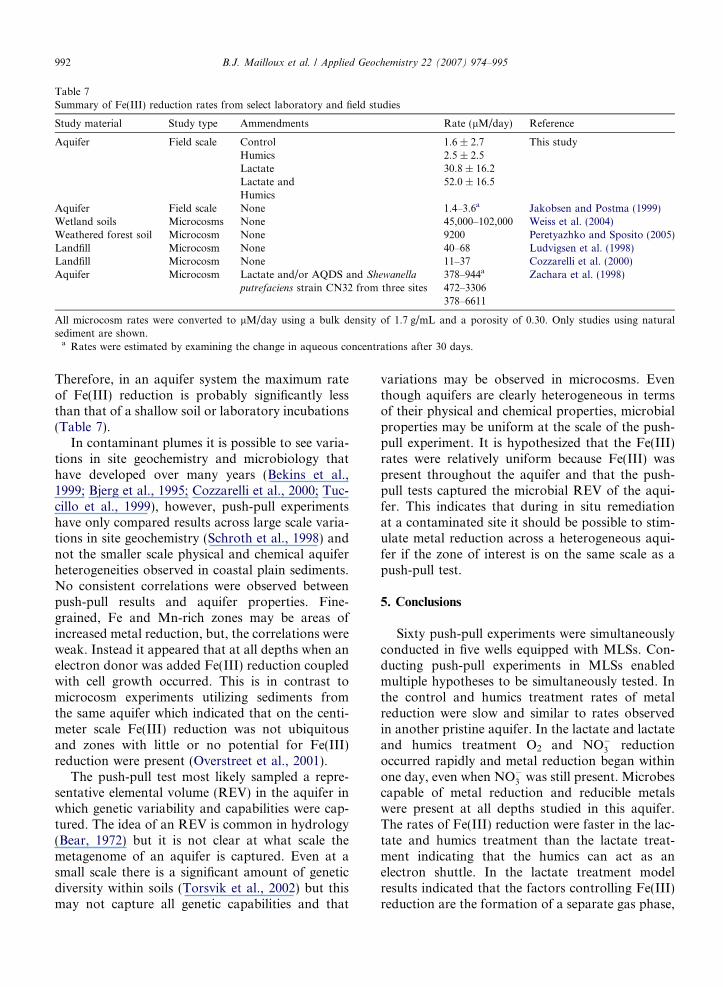
Table 7Summary of Fe(III) reduction rates from select laboratory and field studies
Study material Study type Ammendments Rate (lM/day) Reference
Aquifer Field scale Control 1.6 ± 2.7 This studyHumics 2.5 ± 2.5Lactate 30.8 ± 16.2Lactate and 52.0 ± 16.5Humics
Aquifer Field scale None 1.4–3.6a Jakobsen and Postma (1999)Wetland soils Microcosms None 45,000–102,000 Weiss et al. (2004)Weathered forest soil Microcosm None 9200 Peretyazhko and Sposito (2005)Landfill Microcosm None 40–68 Ludvigsen et al. (1998)Landfill Microcosm None 11–37 Cozzarelli et al. (2000)Aquifer Microcosm Lactate and/or AQDS and Shewanella
putrefaciens strain CN32 from three sites378–944a Zachara et al. (1998)472–3306378–6611
All microcosm rates were converted to lM/day using a bulk density of 1.7 g/mL and a porosity of 0.30. Only studies using naturalsediment are shown.
a Rates were estimated by examining the change in aqueous concentrations after 30 days.
992 B.J. Mailloux et al. / Applied Geochemistry 22 (2007) 974–995
Therefore, in an aquifer system the maximum rateof Fe(III) reduction is probably significantly lessthan that of a shallow soil or laboratory incubations(Table 7).
In contaminant plumes it is possible to see varia-tions in site geochemistry and microbiology thathave developed over many years (Bekins et al.,1999; Bjerg et al., 1995; Cozzarelli et al., 2000; Tuc-cillo et al., 1999), however, push-pull experimentshave only compared results across large scale varia-tions in site geochemistry (Schroth et al., 1998) andnot the smaller scale physical and chemical aquiferheterogeneities observed in coastal plain sediments.No consistent correlations were observed betweenpush-pull results and aquifer properties. Fine-grained, Fe and Mn-rich zones may be areas ofincreased metal reduction, but, the correlations wereweak. Instead it appeared that at all depths when anelectron donor was added Fe(III) reduction coupledwith cell growth occurred. This is in contrast tomicrocosm experiments utilizing sediments fromthe same aquifer which indicated that on the centi-meter scale Fe(III) reduction was not ubiquitousand zones with little or no potential for Fe(III)reduction were present (Overstreet et al., 2001).
The push-pull test most likely sampled a repre-sentative elemental volume (REV) in the aquifer inwhich genetic variability and capabilities were cap-tured. The idea of an REV is common in hydrology(Bear, 1972) but it is not clear at what scale themetagenome of an aquifer is captured. Even at asmall scale there is a significant amount of geneticdiversity within soils (Torsvik et al., 2002) but thismay not capture all genetic capabilities and that
variations may be observed in microcosms. Eventhough aquifers are clearly heterogeneous in termsof their physical and chemical properties, microbialproperties may be uniform at the scale of the push-pull experiment. It is hypothesized that the Fe(III)rates were relatively uniform because Fe(III) waspresent throughout the aquifer and that the push-pull tests captured the microbial REV of the aqui-fer. This indicates that during in situ remediationat a contaminated site it should be possible to stim-ulate metal reduction across a heterogeneous aqui-fer if the zone of interest is on the same scale as apush-pull test.
5. Conclusions
Sixty push-pull experiments were simultaneouslyconducted in five wells equipped with MLSs. Con-ducting push-pull experiments in MLSs enabledmultiple hypotheses to be simultaneously tested. Inthe control and humics treatment rates of metalreduction were slow and similar to rates observedin another pristine aquifer. In the lactate and lactateand humics treatment O2 and NO�3 reductionoccurred rapidly and metal reduction began withinone day, even when NO�3 was still present. Microbescapable of metal reduction and reducible metalswere present at all depths studied in this aquifer.The rates of Fe(III) reduction were faster in the lac-tate and humics treatment than the lactate treat-ment indicating that the humics can act as anelectron shuttle. In the lactate treatment modelresults indicated that the factors controlling Fe(III)reduction are the formation of a separate gas phase,

B.J. Mailloux et al. / Applied Geochemistry 22 (2007) 974–995 993
sorption of reactive species to mineral surfaces, andmineral precipitation. Physical and chemicaldescriptions of aquifer heterogeneity did not corre-late with the observed rates of Fe(III) reduction.The observed rates in the lactate and lactate andhumics treatment were similar to rates observed atlandfill sites and showed only minor variations withdepth. During the push-pull tests Fe(III) was notlimiting and a representative elemental volume(REV) of the aquifer was sampled and encompassedenough microbial diversity that Fe(III) reductionrates were relatively uniform. This indicates Fe(III)reduction is a ubiquitous process and that stimulat-ing metal reduction across a heterogeneous site is afeasible remedial alternative.
Acknowledgements
The investigators acknowledge the support of theUS Department of Energy (DOE), Office of Biolog-ical and Environmental Science (OBER), and theDOE Natural and Accelerated Bioremediation Re-search Program (NABIR) – Acceleration Element(Grant DE-FG02-97ER62472). The authors thankDr. Frank Wobber, the Program Manager for theAcceleration Element of NABIR. Access to the fieldsite was granted by The Nature Conservancy, Vir-ginia Coast Reserve. This work could not have beencompleted without the support of F. Dobbs, T.Griffin, E. Alvarez, and C. Hemingway.
References
Addy, K., Kellogg, D.Q., Gold, A.J., Groffman, P.M., Ferendo,
G., Sawyer, C., Addy, K.K.D., Gold, A.J., Groffman, P.M.,
Ferendo, G., Sawyer, C., 2002. In situ push-pull method to
determine ground water denitrification in riparian zones. J.
Environ. Qual. 31, 1017–1024.
Albrechtsen, H.-J., Heron, G., Christensen, T.H., 1995. Limiting
factors for microbial Fe(III)-reduction in a landfill leachate
polluted aquifer (Vejen, Denmark). FEMS Microbiol. Ecol.
16, 233–247.
Andrews, J.N., Wilson, G.B., 1987. The composition of dissolved
gases in deep groundwaters and groundwater degassing. In:
Fritz, P., Frape, S.K. (Eds.), Saline Water and Gases in
Crystalline Rocks. Vol. Spec. Paper 33, Geological Associa-
tion of Canada, pp. 245–252.
Balkwill, D., Chen, J., DeFlaun, M., Dobbs, F., Dong, H.,
Fredrickson, J., Fuller, M., Green, M., Ginn, T., Griffin, T.,
Holben, W., Hubbard, S., Johnson, W., Long, P.E., Mail-
loux, B., Majer, E., McInerney, M.J., Murray, C., Onstott, T.,
Phelps, T.J., Scheibe, T., Swift, D., White, D., Wobber, F.,
2001. Breakthroughs in field-scale bacterial transport. EOS
Trans. 82, 417, 423–425.
Bear, J., 1972. Dynamics of Fluids in Porous Media. Elsevier,
Amsterdam.
Bekins, B.A., Godsy, E.M., Warren, E., 1999. Distribution of
microbial physiologic types in an aquifer contaminated by
crude oil. Microbial. Ecol. 37, 263–275.
Bekins, B.A., Cozzarelli, I.M., Godsy, E.M., Warren, E., Essaid,
H.I., Tuccillo, M.E., 2001. Progression of natural attenuation
processes at a crude oil spill sit. II. Controls on spatial
distribution of microbial populations. J. Contam. Hydrol. 53,
387–406.
Benner, S.G., Hansel, C.M., Wielinga, B., Barber, T.M., Fendorf,
S., 2002. Reductive dissolution and biomineralization of iron
hydroxide under dynamic flow conditions. Environ. Sci.
Technol. 36, 1705–1711.
Bjerg, P.L., Rugge, K., Pedersen, J.K., Christensen, T.H., 1995.
Distribution of redox-sensitive groundwater quality parame-
ters downgradient of a landfill (Grindsted, Denmark). Envi-
ron. Sci. Technol. 29, 1387–1394.
Chen, J., Hubbard, S., Rubin, Y., 2001. Estimating hydraulic
conductivity at the south Oyster site from geophysical
tomographic data using Bayesian techniques based on the
normal linear regression model. Water Resour. Res. 37, 1603–
1613.
Chen, J., Gu, B., Royer, R.A., Burgos, W.D., 2003. The roles of
natural organic matter in chemical and microbial reduction of
ferric iron. Sci. Total Environ. 307, 167–178.
Clark, I.D., Fritz, P., 1997. Environmental Isotopes in Hydrog-
eology. Lewis, London.
Cozzarelli, I.M., Suflita, J.M., Ulrich, G.A., Harris, S.H., Scholl,
M.A., Schlottmann, J.L., Christenson, S., 2000. Geochemical
and microbiological methods for evaluating anaerobic pro-
cesses in an aquifer contaminated by landfill leachate.
Environ. Sci. Technol. 34, 4025–4033.
Cozzarelli, I.M., Bekins, B.A., Baedecker, M.J., Aiken, G.R.,
Eganhouse, R.P., Tuccillo, M.E., 2001. Progression of
natural attenuation processes at a crude-oil spill site. I.
Geochemical evolution of the plume. J. Contam. Hydrol.
53, 369–385.
Dawson, S.D., Pace, N.R., 2002. Novel kingdom-level eukaryotic
diversity in anaerobic environments. Proc. Natl. Acad. Sci.
USA 99, 8324–8329.
Delany, J.M., Lundeen, S.R., 1990. The LLNL thermochemical
database. Lawrence Livermore National Laboratory Report.
Dong, H., Fredrickson, J.K., Kennedy, D.W., Zachara, J.M.,
Kukkadapu, R.K., Onstott, T.C., 1999. Mineral transforma-
tions associated with the microbial reduction of magnetite.
Chem. Geol. 169, 299–318.
Dong, H.L., Onstott, T.C., Ko, C.H., Hollingsworth, A.D.,
Brown, D.G., Mailloux, B.J., 2002. Theoretical prediction of
collision efficiency between adhesion-deficient bacteria and
sediment grain surface. Coll. Surf. B 24, 229–245.
Fredrickson, J.K., Zachara, J.M., Kennedy, D.W., Dong, H.,
Onstott, T.C., Hinman, N.W., Li, S.M., 1998. Biogenic iron
mineralization accompanying the dissimilatory reduction of
hydrous ferric oxide by a groundwater bacterium. Geochim.
Cosmochim. Acta 62, 3239–3257.
Freeze, R.A., Cherry, J.A., 1979. Groundwater. Prentice-Hall,
Englewood Cliffs, NJ.
Fuller, M.E., Mailloux, B.J., Streger, S., Hall, J.A., Zhang, P.,
Vainberg, S., Johnson, W.P., Onstott, T.C., DeFlaun, M.F.,
2004a. Application of a vital fluorescent staining method for
simultaneous, near-real-time concentration monitoring of two
994 B.J. Mailloux et al. / Applied Geochemistry 22 (2007) 974–995
bacterial strains in an Atlantic Coastal Plain aquifer in
Oyster, Virginia. Appl. Environ. Microbiol. 70, 1680–1687.
Fuller, M.E., Mailloux, B.J., Streger, S.H., Hall, J.A., Zhang, P.,
Kovacik, W.P., Vainberg, S., Johnson, W.P., Onstott, T.C.,
DeFlaun, M.F., 2004b. Application of a vital fluorescent
staining method for simultaneous, near-real-time concentra-
tion monitoring of two bacterial strains in an Atlantic Coastal
Plain Aquifer in Oyster, Virginia. Appl. Environ. Microbiol.
70, 1680–1687.
Gauthier, T.D., Shane, E.C., Guerin, W.F., Seitz, W.R., Grant,
C.L., 1987. Fluorescence quenching methods for determining
equilibrium-constants for polycyclic aromatic-hyrdocarbons
binding to dissolved humic materials. Environ. Sci. Technol.
20, 1162–1166.
Green, M., Swift, D.J., Chen, J., Hubbard, S., Majer, E.L.,
Murray, C., 2000. Heterogeneity at the Narrow Channel Site,
Oyster, VA: a statistical approach to assess the sedimentary
facies prior to correlation with permeability and geophysical
imaging. EOS Trans. 81, H51A-08.
Haggerty, R., Schroth, M.H., Istok, J.D., 1998. Simplified
method of ‘‘push-pull’’ test data analysis for determining
in situ reaction rate coefficients. Ground Water 36, 314–324.
Hall, J.A., Mailloux, B.J., Onstott, T.C., Scheibe, T.D., Fuller,
M.E., Dong, H., DeFlaun, M.F., 2005. Physical versus
chemical effects on bacterial and bromide transport as
determined from on site sediment column pulse experiments.
J. Contam. Hydrol. 76, 295–314.
Hansel, C.M., Benner, S.G., Neiss, J., Dohnalkova, A., Kukk-
adapu, R.K., Fendorf, S., 2003. Secondary mineralization
pathways induced by dissimilatory iron reduction of ferrihy-
drite under advective flow. Geochim. Cosmochim. Acta 67,
2977–2992.
Heaton, T.H.E., Vogel, J.C., 1981. ‘‘Excess air’’ in groundwater.
J. Hydrol. 50, 201–216.
Hubbard, S.S., Chen, J., Peterson, J., Majer, E., Williams, K.,
Swift, D.J., Mailloux, B., Rubin, Y., 2001. Hydrogeological
characterization of the South Oyster bacterial transport site
using Geophysical Data. Water Resour. Res. 37, 2431–2456.
Istok, J.D., Humphrey, M.D., Schroth, M.H., Hyman, M.R.,
O’Reilly, K.T., 1997. Single-well, ‘‘push-pull’ test for in situ
determination of microbial activities. Ground Water 35, 619–
631.
Istok, J.D., Senko, J.M., Krumholz, L.R., Watson, D., Bogle,
M.A., Peacock, A.D., Chang, Y.J., White, D.C., 2004. In situ
bioreduction of technetium and uranium in a nitrate-contam-
inated aquifer. Environ. Sci. Technol. 38, 468–475.
Jakobsen, R., Postma, D., 1999. Redox zoning, rates of sulfate
reduction and interactions with Fe-reduction and methano-
genesis in a shallow sandy aquifer, Romo, Denmark.
Geochim. Cosmochim. Acta 63, 137–151.
Johnson, W.P., Logan, B.E., 1996. Enhanced transport of
bacteria in porous media by sediment-phase and aqueous-
phase natural organic matter. Water Resour. 30, 923–931.
Kinner, N.E., Harvey, R.W., Shay, D.M., Metge, D.W.,
Warren, A., 2002. Field evidence for a protistan role in
an organically contaminated aquifer. Environ. Sci. Technol.
36, 4312–4318.
Kukkadapu, R.K., Zachara, J.M., Fredrickson, J.K., McKinley,
J.P., Kennedy, D.W., Smith, S.C., Dong, H., 2006. Reductive
biotransformation of Fe in shale-limestone saprolite contain-
ing Fe(III) oxides and Fe(II)/Fe(III) phyllosilicates. Geochim.
Cosmochim. Acta 70, 3662–3676.
La Force, M.J., Fendorf, S., 2000. Solid-phase iron character-
ization during common selective sequential extractions. Soil
Sci. Soc. Am. J. 64, 1608–1615.
Leenheer, J.A., 1981. Comprehensive approach to preparative
isolation and fractionation of dissolved organic carbon from
natural waters and wastewaters. Environ. Sci. Technol. 15,
578–587.
Liu, C., Kota, S., Zachara, J.M., Fredrickson, J., Brinkman,
C.K., 2001a. Kinetic analysis of the bacterial reduction of
goethite. Environ. Sci. Technol. 35, 5591–5597.
Liu, C., Zachara, J.M., Gorby, Y.A., Szecsody, J.E., Brown,
C.F., 2001b. Microbial reduction of Fe(III) and sorption of
Fe(II) on Shewanella putrefaciens strain CN32. Environ. Sci.
Technol. 35, 1385–1393.
Lovley, D.R., Anderson, R.R., 2000. Influence of dissimilatory
metal reduction on fate of organic and metal contaminants in
the subsurface. Hydrogeol. J. 8, 77–88.
Lovley, D.R., Blunt-Harris, E.L., 1999. Role of humic-bound
iron as an electron transfer agent in dissimilatory Fe(III)
reduction. Appl. Environ. Microbiol. 65, 4252–4254.
Lovley, D., Philips, E.J.P., 1986. Organic matter mineralization
with reduction of ferric iron in anaerobic sediments. Appl.
Environ. Microbiol. 51, 683–689.
Lovley, D.R., Chapelle, F.H., Woodward, J.C., 1994. Use of
dissolved H2 concentrations to determine distribution of
microbially catalyzed redox conditions in anoxic groundwa-
ter. Environ. Sci. Technol. 28, 1205–1210.
Lovley, D.R., Coates, J.D., Blunt-Harris, E.L., Philips,
E.J.P., Woodward, J.C., 1996. Humic substances as
electron acceptors for microbial respiration. Nature 382,
445–448.
Ludvigsen, L., Albrechtsen, H.-J., Heron, G., Bjerg, P.L.,
Christensen, T.H., 1998. Anaerobic microbial redox processes
in a landfill leachate contaminated aquifer (Grindsted, Den-
mark). J. Contam. Hydrol. 33, 273–291.
Mailloux, B.J., 2003. The effect of aquifer and microbial
heterogeneity on the transport and activity of bacteria in
the Columbia Aquifer, Oyster, Virginia. Ph.D., Princeton
University.
Mailloux, B.J., Fuller, M.E., Onstott, T.C., Hall, J., Dong, H.,
DeFlaun, M.F., Streger, S.H., Rothmel, R.K., Green, M.,
Swift, D.J.P., Radke, J., 2003. The role of physical, chemical,
and microbial heterogeneity on the field-scale transport and
attachment of bacteria. Water Resour. Res. 39, 1142.
doi:10.1029/2002WR00159.
Martin, T.A., Kempton, J.H., 2000. In situ stabilization of metal-
contaminated groundwater by hydrous ferric oxide: an
experimental and modeling investigation. Environ. Sci. Tech-
nol. 34, 3229–3234.
Martin, J.M., Nirel, P., Thomas, A.J., 1987. Sequential extraction
techniques: promises and problems. Mar. Chem. 22, 313–341.
McCarthy, J.F., 2001. Subsurface transport of dissolved humic
substances and associated contaminants. In: Clapp, C.E.,
Hayes, M.H.B., Sense, N., Bloom, P.R., Jardine, P.M. (Eds.),
Humic Substances and Chemical Contaminants. Soil Science
Society of America, pp. 429–448.
McCarthy, J.F., Williams, T.M., Liang, L., Jardine, P.M., Jolley,
L.W., Taylor, D.L., Palumbo, A.V., Cooper, L.W., 1993.
Mobility of natural organic matter in a sandy aquifer.
Environ. Sci. Technol. 27, 667–676.
McCarthy, J.F., Gu, B., Liang, L., Mas-Pla, J., Williams, T.M.,
Yeh, T.C.J., 1996. Field tracer tests on the mobility of natural
B.J. Mailloux et al. / Applied Geochemistry 22 (2007) 974–995 995
organic matter in a sandy aquifer. Water Resour. Res. 32,
1223–1238.
McGuire, J.T., Long, D.T., Klug, M.J., Haack, E.A., Hyndman,
D.W., 2002. Evaluating behavior of oxygen, nitrate, and
sulfate during recharge and quantifying reduction rates in a
contaminated aquifer. Environ. Sci. Technol. 36, 2693–2700.
Mehra, O.P., Jackson, M.L. , 1960. Iron oxide removal from soils
and clays by dithionite–citrate system buffered with sodium
bicarbonate. In: Proceedings of the 7th National Conference
on Clays and Clay Minerals, pp. 317–327.
National Research Council, 1994. Alternatives for Groundwater
Cleanup. National Academy Press, Washington, DC.
Nevin, K.P., Lovley, D.R., 2000. Petential for nonenzymatic
reduction of Fe(III) via electron shuttling in subsurface
sediments. Environ. Sci. Technol. 34, 2472–2478.
Nirel, P.M.V., Morel, F.M.M., 1990. Pitfalls of sequential
extractions. Water Resour. 24, 1055–1056.
Overstreet, K.B., Roden, E., Murray, C., 2001. Fe(III) oxide
reduction in intact coastal plain aquifer sediments. Geol. Soc.
Am. Abstr. Prog. 33 (6), 5.
Penn, R.L., Zhu, C., Veblen, D.R., 2001. Iron oxide coatings on
sand grains from an atlantic coastal plain aquifer: high-
resolution transmission electron microscopy characterization.
Geology 29, 843–846.
Peretyazhko, T., Sposito, G., 2005. Iron(III) reduction and
phosphorous solubilization in humid tropical forest soils.
Geochim. Cosmochim. Acta 69, 36433652.
Riley, R.G., Zachara, J.M., 1992. Chemical Contaminants on
DOE Lands and Selection of Contaminant Mixtures for
Subsurface Science Research. DOE/ER-0547T. US Depart-
ment of Energy, Washington, DC.
Roden, E.E., Urrutia, M.M., 1999. Ferrous iron removal
promotes microbial reduction of crystalline iron(III) oxides.
Environ. Sci. Technol. 33, 18471853.
Roden, E.E., Urrutia, M.M., 2002. Influence of biogenic Fe(II)on
bacterial crystalline Fe(III) oxide reduction. Geomicrobiol. J
19, 209–251.
Roden, E.E., Urrutia, M.M., Mann, C.J., 2000. Bacterial
reductive dissolution of crystalline Fe(III) oxide in continu-
ous-flow column reactors. Appl. Environ. Microbiol. 66,
1062–1065.
Royer, R.A., Burgos, W.D., Fisher, A.S., Jeon, B.H., Unz, R.F.,
Dempsey, B.A., 2002. Enhancement of hematite bioreduction
by natural organic matter. Environ. Sci. Technol. 36, 2897–
2904.
Russell, J.D., 1979. Infrared spectroscopy of ferrihydrite: evi-
dence for the presence of structural hydroxyl groups. Clay
Miner. 14, 109–114.
Scheibe, T.D., Chien, Y., Radke, J.S., 2001. Use of quantitative
models to design microbial transport experiments in a sandy
aquifer. Ground Water 39, 210–222.
Schink, B., 1997. Energetics of syntrophic cooperation in meth-
anogenic degradation. Microbiol. Mol. Biol. Rev. 61, 262–280.
Schroth, M.H., Istok, J.D., Conner, G.T., Hyman, M.R.,
Haggerty, R., O’Reilly, K.T., 1998. Spatial variability in
in situ aerobic respiration and denitrification rates in a
petroleum-contaminated aquifer. Ground Water 36, 924–937.
Schroth, M.H., Istok, J.D., Haggerty, R., 2001. In situ evaluation
of solute retardation using single-well push-pull tests. Adv.
Water Resour. 24, 105–117.
Senko, J.M., Istok, J.D., Suflita, J.M., Krumholz, L.R., 2002. In
situ evidence for uranium immobilization and remobilization.
Environ. Sci. Technol. 36, 1491–1496.
Snodgrass, M.F., Kitanidis, P.K., 1998. A method to infer in situ
reaction rates from push-pull experiments. Ground Water 36,
645–650.
Snoeyenbos-West, O.L., Nevin, K.P., Anderson, R.T., Lovley,
D.R., 2000. Enrichment of Geobacter species in response to
stimulation of Fe(III) reduction in sandy aquifer sediments.
Microb. Ecol. 39, 153–167.
Stewart, C.C., Steinkamp, J.A., 1982. Quantitation of cell
concentration using the flow cytometer. Cytometry 2, 238–
243.
Sun, L., Perdure, E.M., McCarthy, J.F., 1995. Using reverse-
osmosis to obtain organic-matter from surface and ground
waters. Water Res. 29, 1471–1477.
Thauer, R.K., Jungerman, K., Decker, K., 1977. Energy conser-
vation in chemotrophic anaerobic bacteria. Bacteriol. Rev. 41,
100–180.
Torsvik, V., Ovreas, L., Thingstad, T.F., 2002. Prokaryotic
diversity – magnitude, dynamics, and controlling factors.
Science 296, 1064–1066.
Traina, S.J., Novak, J., Smeck, N.E., 1990. An ultraviolet
absorbance method of estimating the percent aromatic carbon
content of humic acids. J. Environ. Qual. 19, 151–153.
Tuccillo, M.E., Cozzarelli, I.M., Herman, J.S., 1999. Iron
reduction in the sediments of a hydrocarbon-contaminated
aquifer. Appl. Geochem. 14, 655–667.
Urrutia, M.M., Roden, E., Zachara, J.M., 1999. Influence of
aqueous and solid-phase Fe(II) complexants on microbial
reduction of crystalline iron(III) oxides. Environ. Sci. Tech-
nol. 33, 4022–4028.
US Department of Energy, 2001. Bioremediation of Metals and
Radionuclides: What it is and How it Works?
Weiss, J.V., Emerson, D., Megonigal, J.P., 2004. Geochemical
control of microbial Fe(III) reduction potential in wetlands:
comparison of the rhizosphere to non-rhizosphere soil. FEMS
Microbiol. Ecol. 48, 89–100.
Zachara, J.M., Fredrickson, J.K., Li, S., Kennedy, D.W., Smith,
S.C., Gassman, P.L., 1998. Bacterial reduction of crystalline
Fe3+ oxides in single phase suspensions and subsurface
materials. Am. Mineral. 83, 1426–1443.
Zachara, J.M., Kukkadapu, R.K., Fredrickson, J.K., Gorby,
Y.A., Smith, S.C., 2002. Biomineralization of poorly crystal-
line Fe(III) oxides by dissimilatory metal reducing bacteria
(DMRB). Geomicrobiol. J. 19, 179–207.
Zhang, P., Johnson, W.P., Scheibe, T.D., Choi, K.-H., Dobbs,
F.C., Mailloux, B.J., 2001. Extended tailing of bacteria
following breakthrough at the Narrow Channel focus area,
Oyster, Virginia. Water Resour. Res. 37, 2687–2698.