Assessment of Sustainable Construction Measures in Building ...
22
sustainability Article Assessment of Sustainable Construction Measures in Building Refurbishment—Life Cycle Comparison of Conventional and Multi-Active Façade Systems in a Social Housing Complex Stefan Sattler 1 and Doris Österreicher 2, * 1 Department of Civil Engineering and Natural Hazards, Institute of Structural Engineering, University of Natural Resources and Life Sciences, 1190 Vienna, Austria 2 Department of Landscape, Spatial and Infrastructure Sciences, Institute of Spatial Planning, Environmental Planning and Land Rearrangement, University of Natural Resources and Life Sciences, 1190 Vienna, Austria * Correspondence: [email protected]; Tel.: +43-1-47654-85515 Received: 28 May 2019; Accepted: 14 August 2019; Published: 19 August 2019 Abstract: Building refurbishment plays a key role in the de-carbonization of the European building stock. Whilst the renewal of the thermal envelope increases energy efficiency during the operational phase, the type of material is highly relevant for the overall environmental impact of the refurbishment. Expanded polystyrene (EPS) is most widely used for external thermal insulation systems but is also a material based on fossil resources. Thus, alternatives made from renewable raw materials must be more widely used in order to reach the climate goals. However, comparable data on long-term material effects over the life cycle are needed for developers and planners to make informed decisions. In a Viennese case study for the largest social housing property manager in Europe, two different façade systems have been analyzed to assess the overall environmental impact of the materials. In a comprehensive life cycle assessment, a Multi-Active Façade system based on recycled paper has been compared with a conventional external thermal insulation composite system (ETICS) using EPS. It shows that whilst the evaluation during the operational phase alone results in a similar ecological footprint of the ETICS, the analysis over the whole life cycle provides a clear positive indication for the novel Multi-Active Façade. Keywords: building refurbishment; thermal insulation materials; life cycle assessment; global warming potential; expanded polystyrene; ETICS; multi-active façade; cellulose insulation board 1. Introduction In the European Union the renovation rate is currently about 1%, which means that it would take 100 years to renovate the European building stock [1]. With buildings responsible for 40% of energy consumption and contributing to over 36% of CO 2 emissions [2] in Europe, building refurbishment plays one of the key roles in achieving the ambitious climate targets. In Austria the renovation rate is equally low with 1% [3], even though the Austrian Climate Strategies have been citing for years that the rate should be increased to at least 3% and ideally to 5% [4], with the latest Mission2030 Strategy citing an average goal of 2% between 2020 and 2030 [5]. The European Union has set itself the targets to reduce its greenhouse gas emissions to 80% below 1990 levels [6] with a new binding energy efficiency target of 32.5% [2]. In this context the regulatory framework conditions are the Energy Efficiency Directive [7], the Renewable Energy Directive [8] and the Energy Performance of Buildings Directive (EPBD) [9]. In the latest amendment of the EPBD [10], which mainly defines the legislative actions to be taken by the member states related to energy efficiency Sustainability 2019, 11, 4487; doi:10.3390/su11164487 www.mdpi.com/journal/sustainability
-
Upload
khangminh22 -
Category
Documents
-
view
0 -
download
0
Transcript of Assessment of Sustainable Construction Measures in Building ...
sustainability
Article
Assessment of Sustainable Construction Measures inBuilding Refurbishment—Life Cycle Comparison ofConventional and Multi-Active Façade Systems in aSocial Housing Complex
Stefan Sattler 1 and Doris Österreicher 2,*1 Department of Civil Engineering and Natural Hazards, Institute of Structural Engineering, University of
Natural Resources and Life Sciences, 1190 Vienna, Austria2 Department of Landscape, Spatial and Infrastructure Sciences, Institute of Spatial Planning, Environmental
Planning and Land Rearrangement, University of Natural Resources and Life Sciences, 1190 Vienna, Austria* Correspondence: [email protected]; Tel.: +43-1-47654-85515
Received: 28 May 2019; Accepted: 14 August 2019; Published: 19 August 2019�����������������
Abstract: Building refurbishment plays a key role in the de-carbonization of the European buildingstock. Whilst the renewal of the thermal envelope increases energy efficiency during the operationalphase, the type of material is highly relevant for the overall environmental impact of the refurbishment.Expanded polystyrene (EPS) is most widely used for external thermal insulation systems but is alsoa material based on fossil resources. Thus, alternatives made from renewable raw materials mustbe more widely used in order to reach the climate goals. However, comparable data on long-termmaterial effects over the life cycle are needed for developers and planners to make informed decisions.In a Viennese case study for the largest social housing property manager in Europe, two differentfaçade systems have been analyzed to assess the overall environmental impact of the materials. In acomprehensive life cycle assessment, a Multi-Active Façade system based on recycled paper has beencompared with a conventional external thermal insulation composite system (ETICS) using EPS. Itshows that whilst the evaluation during the operational phase alone results in a similar ecologicalfootprint of the ETICS, the analysis over the whole life cycle provides a clear positive indication forthe novel Multi-Active Façade.
Keywords: building refurbishment; thermal insulation materials; life cycle assessment; globalwarming potential; expanded polystyrene; ETICS; multi-active façade; cellulose insulation board
1. Introduction
In the European Union the renovation rate is currently about 1%, which means that it would take100 years to renovate the European building stock [1]. With buildings responsible for 40% of energyconsumption and contributing to over 36% of CO2 emissions [2] in Europe, building refurbishmentplays one of the key roles in achieving the ambitious climate targets. In Austria the renovation rate isequally low with 1% [3], even though the Austrian Climate Strategies have been citing for years thatthe rate should be increased to at least 3% and ideally to 5% [4], with the latest Mission2030 Strategyciting an average goal of 2% between 2020 and 2030 [5].
The European Union has set itself the targets to reduce its greenhouse gas emissions to 80% below1990 levels [6] with a new binding energy efficiency target of 32.5% [2]. In this context the regulatoryframework conditions are the Energy Efficiency Directive [7], the Renewable Energy Directive [8] andthe Energy Performance of Buildings Directive (EPBD) [9]. In the latest amendment of the EPBD [10],which mainly defines the legislative actions to be taken by the member states related to energy efficiency
Sustainability 2019, 11, 4487; doi:10.3390/su11164487 www.mdpi.com/journal/sustainability
Sustainability 2019, 11, 4487 2 of 22
in buildings, a long-term renovation strategy is required in order to decarbonize the building stock by2050. These legal framework conditions subsequently influence the building regulations and normson a member state level. In Austria the OIB Guideline No.6 of the Austrian Institute of ConstructionEngineering [11] is one of the key documents transferring the EPBD into local requirements.
Most of the regulatory framework conditions focus on the energy a building uses during itsoperation. Thus, energy efficiency in buildings is generally related to heating, cooling, ventilation andpower demand. The EPBD with its associated regulations covering the Energy Performance Certificate(EPC) rates buildings based on their primary energy demand and associated CO2 emissions duringits operational phase. Materials and associated emissions related to the production, implementationand discharge are not included in these energy calculations. Considering that buildings consumeincreasingly less energy during operation due to higher building standards, the energy used over thecomplete life cycle of buildings becomes ever more important.
Building certification schemes, which provide voluntary structures for building assessmentsalready go beyond the regulatory norms and standards. They include aspects such as land use andwater as well as factors related to the materials used in the buildings. Most relevant building certificationschemes, such as Leadership in Energy and Environmental Design (LEED) [12], Building ResearchEstablishment Environmental Assessment Method (BREEAM) [13], the German ‘German SustainableBuilding Council’ (DGNB) [14] or the ‘Austrian Society for Sustainable Real Estate’ (ÖGNI) [15],based on the DGNB or the ‘Austrian Sustainable Building Council (ASBC)’ (ÖGNB) [16] all provideassessments, which have a particular focus on materials and their use in buildings.
Insulation materials are an important component of energy-efficient construction and thuscontribute significantly to achieving climate goals. Polystyrene and other plastic based materials covertogether with mineral wool about 90% of the thermal insulation market in Europe [17]. While manynatural insulation materials are available on the market for the replacement of mineral wool, hardinsulation boards (e.g., polystyrene) have few economically competitive alternatives with equivalentproperties from renewable raw materials. Building developers and planners are increasingly awarethat the impact of materials is becoming equally important as the energy the materials are savingduring the operational phase of the building. For new developments comparable data for insulationmaterials or whole façade systems are urgently needed for informed decision making processes toselect appropriate components based on long-term environmental effects.
For a Viennese case study, a novel façade system called Multi-Active Façade (MAFa) based onrecycled paper was implemented. The aim of the case study was the renewable renovation of residentialsocial housing buildings owned by the largest housing property manager in Europe, “Wiener Wohnen”.The MAFa system has been chosen mainly due to its environmental friendly characteristics, as it isbased on recycled material and integrates passive as well as active solar gains. Another key benefitis the high degree of prefabrication, which reduces the actual construction time on site. In order toprovide data for future refurbishment projects, a study has been undertaken to analyze the impact of aconventional façade system in comparison with a novel one. The objective of the study was to compareover the life cycle of the buildings a most commonly used external thermal insulation composite system(ETICS) based on EPS insulation with the novel Multi-Active Façade. The goal was to focus on thematerial impact of these two different façade system refurbishments in order to assess the long-termenvironmental effects. As a methodology a Life Cycle Assessment (LCA) with the online-calculatorEco2Soft has been used [18]. A key aspect is to provide a holistic perspective on buildings and theireffect on resources and climate over their whole life cycle.
In the next section relevant background and state-of-the-art research related to LCA assessmentsas well as insulation materials and aspects of refurbishment measures are outlined. Section 3 describesthe main principles behind the proposed methodology, followed by the documentation of the casestudy in Section 4 and the results in Section 5. Finally, the discussion delivers a review of the approachand provides an outlook on how this methodology might be implemented in the future.

Sustainability 2019, 11, 4487 3 of 22
2. Background
For energy efficient building refurbishments, the improvement of the outer shell is of utmostimportance. In this context external insulation plays a key role to support energy savings during theoperational phase of the building. There is a multitude of insulation materials on the market with awide variety of insulation capacity, application for different uses and inherent material properties.
For exterior parts of the building, blanket insulation or (rigid) foam boards are most commonlyused. Blanket insulation consists of flexible fibers, such as fiberglass, mineral wool, plastic or naturalfibers. Foam board or rigid foams are very effective in exterior wall sheathing. The most commontypes of materials for foam boards include polystyrene and polyurethane. Overall glass and rockwool as well as expanded polystyrene (EPS) and extruded polystyrene (XPS) are the main productsfor building insulation materials. As EPS is based on fossil resources, alternative thermal insulationsystems with renewable raw materials are important for the de-carbonization of the building sector. Inaddition, EPS is also linked to health and safety issues especially concerning fire risks, thus alternativeoptions are increasingly needed [19]. Considering only the energy efficiency in buildings related tothe energy use during the operation of the building, the actual thermal conductivity of a material isa key factor. In order to move the building industry from fossil-based materials towards resourceefficient alternatives, comparable data on long-term environmental effects are however needed. In thisrespect a life-cycle analysis, which considers the impact of the material over the whole life cycle of thebuilding (i.e., from sourcing, production, implementation, operation and recycling or degradation)offers a viable way forward.
Classifying properties related to sustainability, the Environmental Product Declaration (EPD)provides a widely accepted framework as an environmental certification Type III characterizingproducts based on a life cycle approach following the International Standards Organization (ISO)14025 [20].
Several studies have already highlighted in the past the need to provide adequate data onmaterial-linked emissions and environmental impact. In a comprehensive assessment comparingthree commonly used insulation materials based on their life-cycle characteristics, Carabano et al.already stated that the LCA methodology is a globally accepted methodology to assess the impact ofmaterials. This is also acknowledging the fact that there is a need in the building sector to provide suchcomprehensive classifications of materials to select the most suitable one for a particular project [21].However, there is also evidence that suggests that different LCA tools provide a variation in resultsbased on different databases related to inventory and impact assessments [22]. In earlier studiesLCA analysis was already linked to energy consumption in order to compare the environmentalimpact of stone wool and polystyrene [23]. Focusing mostly on the global warming potential aswell as the embodied energy, Hill et al. provide in their assessment of over sixty environmentalproduct declarations a very broad view on the most commonly used insulation materials [24]. A verycomprehensive overview of commonly available materials has been provided by Adity et al., whereperformance characteristics in terms of thermal conductivity, fire resistance but also life cycle cost andembodied energy were given [25]. Audenaert et al. also argue that the results of a comprehensive lifecycle assessment can have a significant impact on the eco-score of the design, stating that the productionof the material is in this respect highly influential [26]. In a more recent study by Meex et al. the use ofLCA-based environmental impact assessments during the early stages of the building design is alsoevaluated. The authors conclude, that whilst applying LCA tools within the decision-making processof the architectural design, there are still challenges that need to be overcome for a wider application.Methodological simplification as well as usability of the software tools are cited as potential solutionsin this context [27]. Other studies focusing particularly on LCA in refurbishment also confirm thatthe environmental impact of EPS during the first year after a refurbishment is still higher than theoperational energy savings [28].
Whilst the material impact is highly relevant, the architectural integration plays an important factorin the decision for a particular façade system. As ETICS are most frequently used for retrofitting, costs
Sustainability 2019, 11, 4487 4 of 22
and architectural aspects [29] must be jointly considered in this context. Technological aspects, such asnoise protection are additional criteria for the selection of external thermal insulation systems [30].Several studies related to multi-criteria assessment of advanced insulation materials including aerogelsand insulating plaster address a series of aspects in a holistic approach: construction cost, constructiontime, thermal conductivity, diffusion resistance as well as aspects related to fire safety. With thisapproach a recent study by Tazikova et al. state that whilst an ETICS system based on EPS boardsprovides the overall best results [31], this is only valid when long-term environmental effects areexcluded. Assessing façade systems and thermal insulation materials for different climate zones,Sierra-Perez et al. conclude, that an ETICS has a better environmental performance in both warmerand colder climate zones than a ventilated façade or a system with internal insulation [32]. In a similarstudy, where the life-cycle impact of a polyurethane filled composite panel is compared to a compositepanel with rockwool, the former achieves better environmental results [33]. Another relevant factor isthe degradation of the ETICS. As these systems are exposed to mechanical and climate related damage,the life cycle of the materials used as composite systems must be taken into account when assessingthe maintenance and end-of-life aspects [34]. Addressing this aspect from an analytical point of viewXimenes et al. provided numeric indicators for degradation of ETICS based on theoretical and fieldwork [35]. Other studies focus on the financial aspects of ETICS, assessing the economic risks over thelife cycle. A recent analysis shows, that degradation factors have highest relevance in the early phasesof construction due to high cost of repair and high occurrence rates [36]. The application of buildingintegrated photovoltaic systems (BIPV) is becoming more widely accepted as the efficiency of PVsystems is improving. A study by Belussi et al. [37] concludes that the environmental impact of BIPVmodules is comparable to conventional PV modules, both in terms of emissions and consumption ofresources. Considering however the entire life-cycle, BIPV modules have the inherent advantage thatthey fulfill a double function by providing both a building skin as well as an active renewable energysystem. Other assessments of insulation materials also put a particular focus on the renewable andnon-renewable primary energy in the production process [38] as well as additional impact categoriessuch as ozone depletion, terrestrial acidification as well as freshwater and marine eutrophication [39].
Especially for refurbishment projects, the thickness of the added layers is highly relevant. Materialswith an extremely low thermal conductivity subsequently need less space in the outer wall. In caseswhere the thickness is of particular importance (i.e., when the façade must not protrude beyonda certain limit) advanced insulation materials with low thermal conductivity values are required.Vacuum insulation panels (VIPs) can provide a useful alternative to more conventional ETICS withEPS insulation, however particular care must be taken regarding temperature and moisture on theinside of the wall as well as regarding the potentially enhanced effect of thermal bridging [40]. Whilstthe energy related impact (e.g., global warming potential) of fossil-based insulation materials can berelatively high compared to non-fossil-based or recycled materials, using bio-based materials has theadded benefit of storing carbon in the very same products that also add to the energy efficiency of thebuildings. Even though these materials usually require a certain amount of processing and transport,some of the biogenic materials completely capture the carbon stored within one year due to their fastre-growing times [41].
In general the assessment of the overall environmental impact of insulation materials relates toa multitude of factors: The actual energy input in the production of the material, the transport tothe site as well as the accumulated energy savings throughout the life-span of the material, which inturn is also dependent on the type of building and building systems, must all be taken into account.Mazor et al. [42] highlights the interaction between these aspects in a study describing the life-cycleperspective of two rigid thermal insulation systems. It must therefore be considered that even materialsbased on fossil fuel with a high environmental impact during production such as EPS can have a lowoverall environmental impact compared to other insulation material when assessed over the whole lifecycle of the product [43]. Taking into account the accumulated energy savings the insulation materialprovides over time, the impact during production can become less significant if the energy used during
Sustainability 2019, 11, 4487 5 of 22
operation is high in relation to the total energy impact. This logic however alters, when buildingsbecome highly efficient and the embodied energy of the materials in the buildings have a higher energyimpact than the building during operation.
3. Methodology
A Life Cycle Assessment is a quantitative assessment process where material and energy flowsof products, systems or processes are assessed over the entire life cycle, by taking into account allindividual life stages. International standards for life cycle assessments are set out in ISO 14040 andISO 14044. A LCA assessment consists of four phases based on these standards: Goal and scopedefinition, inventory analysis, impact assessment and interpretation.
Life Cycle Assessment is currently widely known to be the best way for assessing environmentalimpacts of materials and products (see also [21–28] as noted in the Section 2). Consequently, this studyuses LCA for examining the environmental impacts of two different façade systems. The application ofan LCA during the design and post-design stage can positively influence decision-making processes.Two different designs were calculated and applied to one building. “Scenario 1 MAFa” is retrofittedwith the MAFa system, while for “Scenario 2 ETICS” an external thermal insulation composite system(ETICS) is used.
The LCA was carried out with the online calculator Eco2Soft [18], which is a widely used toolin Austria for the ecological evaluation and calculations of buildings. This software was selected asit is also compatible with the Austrian building certificate “klimaaktiv” (applied by the ÖGNB [16]).The results of the LCA could therefore be used as input parameters for this certification. Otherinternationally known tools, such as GaBi and SimaPro are of course more widely used in Europe.However, even though they also use the same ecoinvent database they are not compatible with theAustrian building certification. This compatibility and the already positive previous experience of thebuilding owner with this software were the reasons behind the decision to use Eco2Soft.
Life cycle assessments can be created for different variants of possible building renovationapproaches and can therefore form a basis for the selection process in terms of ecology and design.Eco2Soft provides the “Oekoindex OI3” which assesses the ecological quality of all materials on thebasis of the environmental indicators global warming potential, acidification potential and the need fornon-renewable primary energy. The indicator OI3 rates in a range from 0 to 100 points the qualityof the building material, the construction or the entire building. The OI3 points are based on thenumerical values of the energy certificate. A low HED of a building in the range of 15 kWh/(m2yr)can be considered excellent, as well as buildings and constructions with less than 15 OI3 points. Theeco-parameters of the building materials required for the calculation of the OI3 indicator are providedby the IBO [44] to the software manufacturers and the baubook Internet database. They are alsopublished on the IBO homepage and updated on an ongoing basis. [44].
• Global Warming Potential (GWP100)• The GWP describes the impact of a trace gas on global warming. The contributions of greenhouse
gases are determined for the time horizon of 100 years and are compared in relation to the impactof CO2. The Global Warming Potential (GWP100) is described in DIN EN 15804, Annex C (EN15804: 2012 + A1 (October 2013), Annex C) and expressed in kg-CO2 equivalents.
• The “GWP total” indicator used for the OI3 index considers both the contribution of greenhousegas emissions to global warming and the quantities of carbon dioxide stored in biomass [45].
• Acidification Potential (AP)• Acidification is mainly caused by the interaction of nitrogen oxide (NOx) and sulfur dioxide (SO2)
gases with other components in the air. The associated consequences include the acidification ofnatural waters and soils, which lead to loss of biodiversity in both ecosystems. For the calculationof the acidification potential, the average “European acidification potentials” are used. The

Sustainability 2019, 11, 4487 6 of 22
acidification potential is determined in accordance with DIN EN 15804, Annex C [EN 15804: 2012+ A1 (October 2013), Annex C] and expressed in kg-SO2 equivalents [45].
• Primary Energy Indicator for non-renewable energy resources (PEIn.ren.)• The demand for non-renewable energy resources is calculated based on the total required amount
of energy resources necessary to produce a product or service and is referred to as the primaryenergy content (PEIn.ren). The energy related resources are considered in the form of raw energythat did not undergo any technical conversion or transformation and which has not yet beentransported. The primary energy content is calculated from the lower calorific value of allenergy-containing resources used and expressed in MJ. For the OI3 index, the PEIn.ren., the primaryenergy content of all non-renewable resources (e.g., oil or coal) used for the production of thematerial is applied. In doing so, both energy and material resources are taken into account [45].
The OI3 index is based on the three individual indicators (GWP100, AP and PEIn.ren) and itassesses the overall ecological quality of the material or construction. While the OI3 index is a goodindicator for measuring resource efficiency and overall ecological impact and AP maps local effectson air quality, soil and water, this paper focuses on the global warming potential (GWP100) and thePrimary Energy Indicator for non-renewable energy resources (PEIn.ren.). This is due to the fact that theAP is only present in the construction phase of the building but it cannot be included in the operationalphase. Since one of the main aspects of the study is to assess both the construction as well as theoperational phase, only the GWP100 and PEIn.ren. were included in the results. The material data isderived from the Baubook [18] guideline as well as values verified by independent third parties, whichwere calculated according to the product category regulations of Bau EPD Company [46] and are basedon the background database ecoinvent [47]. The life cycle inventory is based on the IBO-guideline [48]values for construction materials and is accounted for in a cumulative way across all processes fromraw material extraction to the end of the production phase (Cradle to Gate, Modules A1 to A3 inaccordance with ÖNORM EN 15804). Test certificates for the building physics and building ecologyparameters are stored centrally in the life cycle inventory (see Table 1). Following successful completionof baubook quality assurance, the declared products are listed in all target group-specific platformsand can be found on the baubook database [18].
Table 1. Operating live catalog of the live cycle inventory [45].
Construction Description Operating Live
Primary Structure Support structure 100 years
Secondary structure All construction layers except: windows, ETICS, buildingsealing/foils, flooring and building services components 50 years
Windows Glazing, frames, window components 35 years
ETICS (incl. plaster, adhesives,reinforcing fabric etc.)
EPS-F, cork insulation panels, mineral wool plaster base plates,hemp insulation boards, mineral foam board (exterior facades) etc. 35 years
Plaster Plaster incl. substrates 35 years
Building sealing/foils 25 yrsConstruction foils of rubber (EPDM), PE membranes, PVCwaterproofing membranes, other waterproofing except bituminouswaterproofing, release foils etc.
25 years
Building sealing/foils 35 yrsAluminum bituminous packing, aluminum vapor barrier, bitumen,bituminous paint, bitumen board, areas of application: in particularroof/outer walls in contact to earth
35 years
Floor coverings 50 yrs Solid wood floors, floating solid parquet flooring, (ceramic) tiles,natural stone, artificial stone 50 years
Floor coverings 25 yrsMultilayered parquet, linoleum, PVC flooring, polyolefin floorcovering based on PE and PU, rubber flooring, rubber pimpledflooring, laminate flooring
25 years
Floor coverings 10 yrs Cork, corkment, textile floor coverings (polyamide carpet, woolcarpet) Screed coating etc. 10 years
Tertiary construction Technical building equipment 20/50 years
Floor- and wall coating Screed coating, paints, wall paint, etc. 10 years
Sustainability 2019, 11, 4487 7 of 22
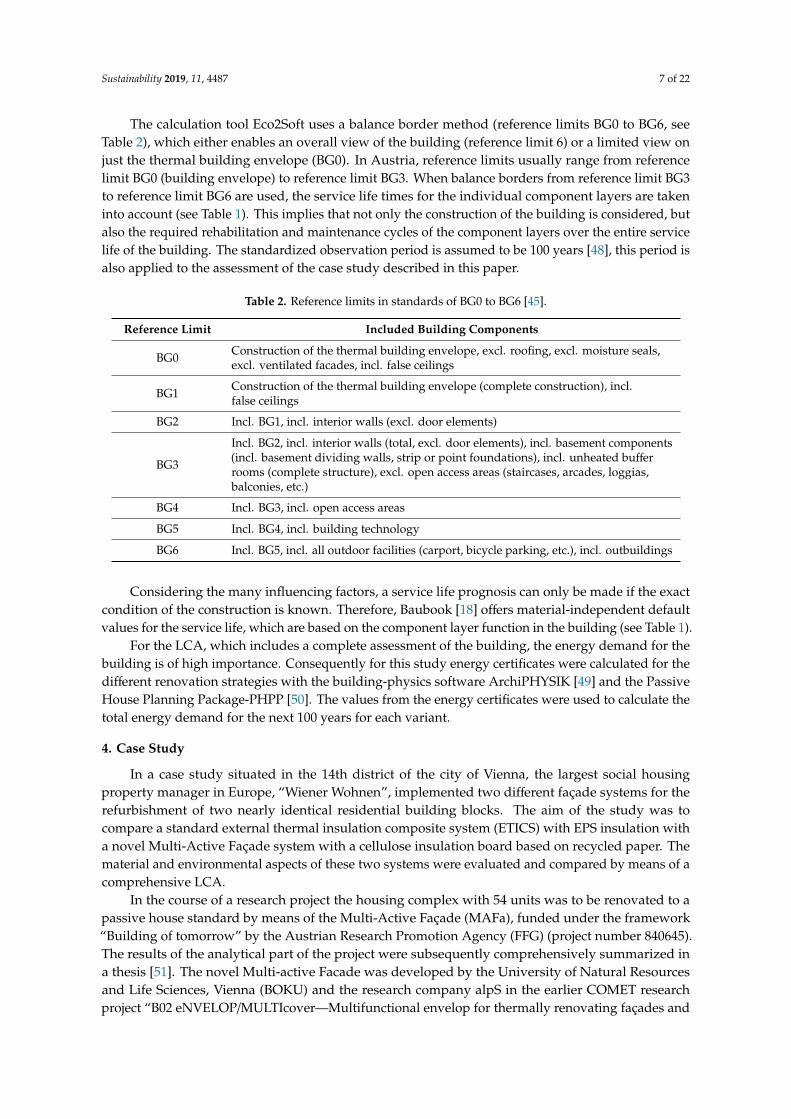
The calculation tool Eco2Soft uses a balance border method (reference limits BG0 to BG6, seeTable 2), which either enables an overall view of the building (reference limit 6) or a limited view onjust the thermal building envelope (BG0). In Austria, reference limits usually range from referencelimit BG0 (building envelope) to reference limit BG3. When balance borders from reference limit BG3to reference limit BG6 are used, the service life times for the individual component layers are takeninto account (see Table 1). This implies that not only the construction of the building is considered, butalso the required rehabilitation and maintenance cycles of the component layers over the entire servicelife of the building. The standardized observation period is assumed to be 100 years [48], this period isalso applied to the assessment of the case study described in this paper.
Table 2. Reference limits in standards of BG0 to BG6 [45].
Reference Limit Included Building Components
BG0 Construction of the thermal building envelope, excl. roofing, excl. moisture seals,excl. ventilated facades, incl. false ceilings
BG1 Construction of the thermal building envelope (complete construction), incl.false ceilings
BG2 Incl. BG1, incl. interior walls (excl. door elements)
BG3
Incl. BG2, incl. interior walls (total, excl. door elements), incl. basement components(incl. basement dividing walls, strip or point foundations), incl. unheated bufferrooms (complete structure), excl. open access areas (staircases, arcades, loggias,balconies, etc.)
BG4 Incl. BG3, incl. open access areas
BG5 Incl. BG4, incl. building technology
BG6 Incl. BG5, incl. all outdoor facilities (carport, bicycle parking, etc.), incl. outbuildings
Considering the many influencing factors, a service life prognosis can only be made if the exactcondition of the construction is known. Therefore, Baubook [18] offers material-independent defaultvalues for the service life, which are based on the component layer function in the building (see Table 1).
For the LCA, which includes a complete assessment of the building, the energy demand for thebuilding is of high importance. Consequently for this study energy certificates were calculated for thedifferent renovation strategies with the building-physics software ArchiPHYSIK [49] and the PassiveHouse Planning Package-PHPP [50]. The values from the energy certificates were used to calculate thetotal energy demand for the next 100 years for each variant.
4. Case Study
In a case study situated in the 14th district of the city of Vienna, the largest social housingproperty manager in Europe, “Wiener Wohnen”, implemented two different façade systems for therefurbishment of two nearly identical residential building blocks. The aim of the study was tocompare a standard external thermal insulation composite system (ETICS) with EPS insulation witha novel Multi-Active Façade system with a cellulose insulation board based on recycled paper. Thematerial and environmental aspects of these two systems were evaluated and compared by means of acomprehensive LCA.
In the course of a research project the housing complex with 54 units was to be renovated to apassive house standard by means of the Multi-Active Façade (MAFa), funded under the framework“Building of tomorrow” by the Austrian Research Promotion Agency (FFG) (project number 840645).The results of the analytical part of the project were subsequently comprehensively summarized ina thesis [51]. The novel Multi-active Facade was developed by the University of Natural Resourcesand Life Sciences, Vienna (BOKU) and the research company alpS in the earlier COMET researchproject “B02 eNVELOP/MULTIcover—Multifunctional envelop for thermally renovating façades and

Sustainability 2019, 11, 4487 8 of 22
buildings.” The case study buildings are typical for the Viennese post-war social housing blocks builtbetween the 1950s and the 1970s. The city of Vienna, together with its social housing providers, issuccessively trying to raise the construction standards of these buildings. Key aspects in this contextare the refurbishment of the outer shell, the update and/or renewal of the building services systems,the implementation of increased fire safety and the improvement of accessibility. The City of Viennawanted to have a best practice example to prove the feasibility of the refurbishment of low-qualitysocial housing building stock to passive house standard.
Due to the fact that the chosen residential complex was well suited to investigate various solutionsit can serve as an appropriate replication example for other similar housing estates. Furthermore, thebuilding in the south (Building 1) is affected by noise pollution due to the busy road in front of it and istherefore a good case for the application of the MAFa system as the façade offers an increased soundinsulation. Figure 1 shows an aerial view of the two buildings.
Sustainability 2019, 11, 4487 8 of 22
social housing blocks built between the 1950s and the 1970s. The city of Vienna, together with its social housing providers, is successively trying to raise the construction standards of these buildings. Key aspects in this context are the refurbishment of the outer shell, the update and/or renewal of the building services systems, the implementation of increased fire safety and the improvement of accessibility. The City of Vienna wanted to have a best practice example to prove the feasibility of the refurbishment of low-quality social housing building stock to passive house standard.
Due to the fact that the chosen residential complex was well suited to investigate various solutions it can serve as an appropriate replication example for other similar housing estates. Furthermore, the building in the south (Building 1) is affected by noise pollution due to the busy road in front of it and is therefore a good case for the application of the MAFa system as the façade offers an increased sound insulation. Figure 1 shows an aerial view of the two buildings.
Figure 1. Aerial view of the case study [52].
Both original buildings showed a relatively poor construction standard as outlined in Table 3. The heating energy demand was with 135 kWh/(m2yr) for Building 1 and 155 kWh/(m2yr) for Building 2 relatively high, compared to buildings based on current regulations with a heating energy demand well below 50 kWh/(m2yr).
Table 3. Building data before refurbishment.
Building characteristics Building 1 Building 2 Gross floor area (m2) 2522.12 1891.10 Area/Volume (m−1) 0.41 0.47 Window area (m2) 348.23 105.91
Building mean U-value (kWh/(m2yr) ) 1.112 1.297 Heating Energy Demand (HED) (kWh/(m2yr)) 135.02 154.73
For both buildings a series of refurbishment measures were carried out. These included the thermal insulation of the ground floor in case of an underlying basement, attic slabs and the exchange of the windows with integrated sunscreen. I addition a decentralized heat recovery ventilation unit was added to each flat. The novel Multi-Active Façade (MAFa) was only added to the south façade of Building 1, as direct solar radiation is a prerequisite for the façade to function in its fullest potential. On all other façades of Building 1 as well as on all façades of Building 2 a conventional ETICS façade has been implemented. Thus the “Scenario 2 ETICS” was calculated with an external thermal insulation composite system on all four facades of Building 1 and the “Scenario 1 MAFa” was calculated by applying the MAFa façade on the south side and the ETICS system on the three remaining façades of Building 1. Scenario 1 with the MAFa system in place is the variant that has actually been implemented. In Figure 2 the current status of the refurbishment with the
Figure 1. Aerial view of the case study [52].
Both original buildings showed a relatively poor construction standard as outlined in Table 3. Theheating energy demand was with 135 kWh/(m2yr) for Building 1 and 155 kWh/(m2yr) for Building 2relatively high, compared to buildings based on current regulations with a heating energy demandwell below 50 kWh/(m2yr).
Table 3. Building data before refurbishment.
Building Characteristics Building 1 Building 2
Gross floor area (m2) 2522.12 1891.10Area/Volume (m−1) 0.41 0.47Window area (m2) 348.23 105.91
Building mean U-value (kWh/(m2yr)) 1.112 1.297Heating Energy Demand (HED) (kWh/(m2yr)) 135.02 154.73
For both buildings a series of refurbishment measures were carried out. These included thethermal insulation of the ground floor in case of an underlying basement, attic slabs and the exchangeof the windows with integrated sunscreen. I addition a decentralized heat recovery ventilation unitwas added to each flat. The novel Multi-Active Façade (MAFa) was only added to the south façade ofBuilding 1, as direct solar radiation is a prerequisite for the façade to function in its fullest potential. Onall other façades of Building 1 as well as on all façades of Building 2 a conventional ETICS façade hasbeen implemented. Thus the “Scenario 2 ETICS” was calculated with an external thermal insulationcomposite system on all four facades of Building 1 and the “Scenario 1 MAFa” was calculated byapplying the MAFa façade on the south side and the ETICS system on the three remaining façades of
Sustainability 2019, 11, 4487 9 of 22
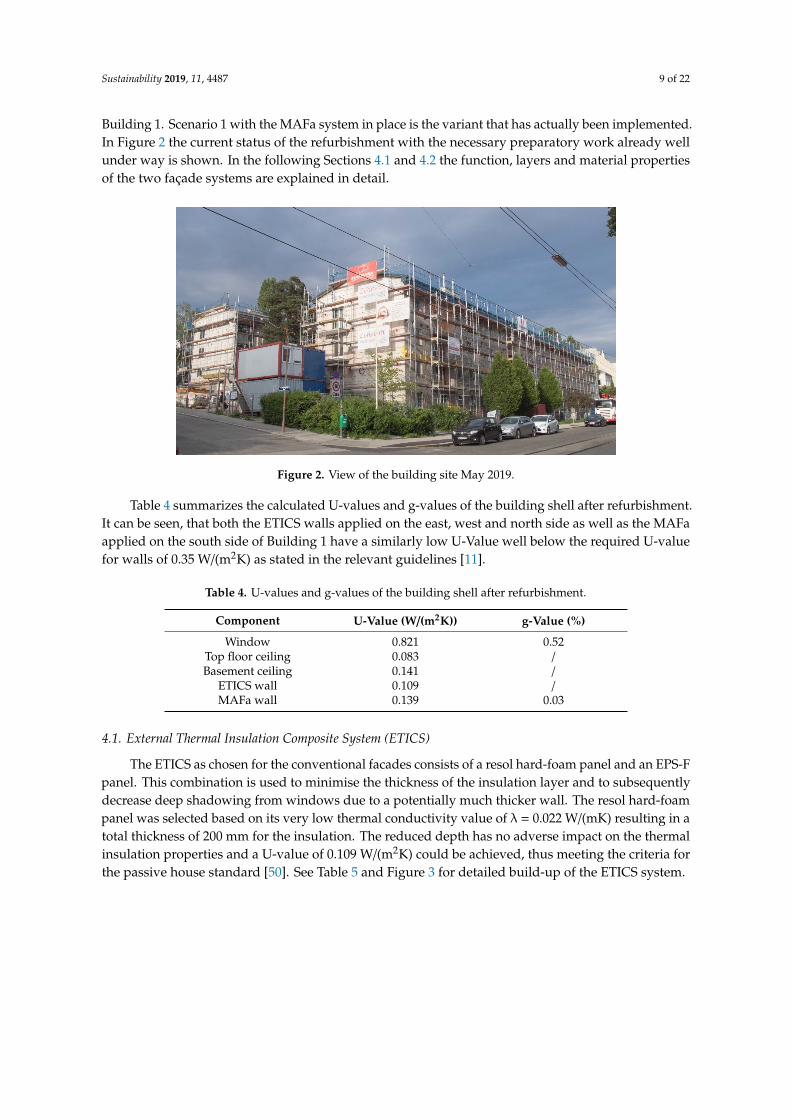
Building 1. Scenario 1 with the MAFa system in place is the variant that has actually been implemented.In Figure 2 the current status of the refurbishment with the necessary preparatory work already wellunder way is shown. In the following Sections 4.1 and 4.2 the function, layers and material propertiesof the two façade systems are explained in detail.
Sustainability 2019, 11, 4487 9 of 22
necessary preparatory work already well under way is shown. In the following Sections 4.1 and 4.2 the function, layers and material properties of the two façade systems are explained in detail.
Table 4 summarizes the calculated U-values and g-values of the building shell after refurbishment. It can be seen, that both the ETICS walls applied on the east, west and north side as well as the MAFa applied on the south side of Building 1 have a similarly low U-Value well below the required U-value for walls of 0.35 W/(m2K) as stated in the relevant guidelines [11].
Figure 2. View of the building site May 2019.
Table 4. U-values and g-values of the building shell after refurbishment.
Component U-Value (W/(m2K)) g-Value (%) Window 0.821 0.52
Top floor ceiling 0.083 / Basement ceiling 0.141 /
ETICS wall 0.109 / MAFa wall 0.139 0.03
4.1. External Thermal Insulation Composite System (ETICS)
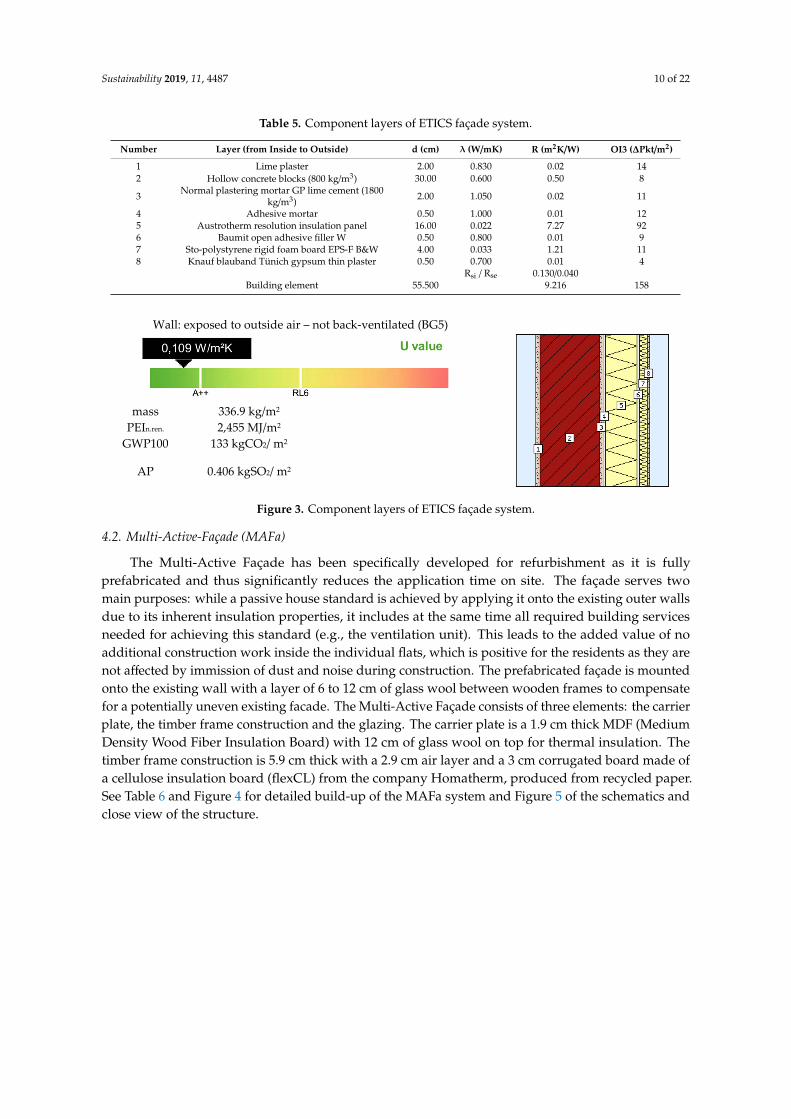
The ETICS as chosen for the conventional facades consists of a resol hard-foam panel and an EPS-F panel. This combination is used to minimise the thickness of the insulation layer and to subsequently decrease deep shadowing from windows due to a potentially much thicker wall. The resol hard-foam panel was selected based on its very low thermal conductivity value of λ = 0.022 W/(mK) resulting in a total thickness of 200 mm for the insulation. The reduced depth has no adverse impact on the thermal insulation properties and a U-value of 0.109 W/(m2K) could be achieved, thus meeting the criteria for the passive house standard [50]. See Table 5 and Figure 3 for detailed build-up of the ETICS system.
4.2 Multi-Active-Façade (MAFa)
The Multi-Active Façade has been specifically developed for refurbishment as it is fully prefabricated and thus significantly reduces the application time on site. The façade serves two main purposes: while a passive house standard is achieved by applying it onto the existing outer walls due to its inherent insulation properties, it includes at the same time all required building services needed for achieving this standard (e.g., the ventilation unit). This leads to the added value of no additional construction work inside the individual flats, which is positive for the residents as they are not affected by immission of dust and noise during construction. The prefabricated façade is mounted onto the existing wall with a layer of 6 to 12 cm of glass wool between wooden frames to compensate for a potentially uneven existing facade. The Multi-Active Façade consists of three
Figure 2. View of the building site May 2019.
Table 4 summarizes the calculated U-values and g-values of the building shell after refurbishment.It can be seen, that both the ETICS walls applied on the east, west and north side as well as the MAFaapplied on the south side of Building 1 have a similarly low U-Value well below the required U-valuefor walls of 0.35 W/(m2K) as stated in the relevant guidelines [11].
Table 4. U-values and g-values of the building shell after refurbishment.
Component U-Value (W/(m2K)) g-Value (%)
Window 0.821 0.52Top floor ceiling 0.083 /Basement ceiling 0.141 /
ETICS wall 0.109 /MAFa wall 0.139 0.03
4.1. External Thermal Insulation Composite System (ETICS)
The ETICS as chosen for the conventional facades consists of a resol hard-foam panel and an EPS-Fpanel. This combination is used to minimise the thickness of the insulation layer and to subsequentlydecrease deep shadowing from windows due to a potentially much thicker wall. The resol hard-foampanel was selected based on its very low thermal conductivity value of λ = 0.022 W/(mK) resulting in atotal thickness of 200 mm for the insulation. The reduced depth has no adverse impact on the thermalinsulation properties and a U-value of 0.109 W/(m2K) could be achieved, thus meeting the criteria forthe passive house standard [50]. See Table 5 and Figure 3 for detailed build-up of the ETICS system.
Sustainability 2019, 11, 4487 10 of 22
Table 5. Component layers of ETICS façade system.
Number Layer (from Inside to Outside) d (cm) λ (W/mK) R (m2K/W) OI3 (∆Pkt/m2)
1 Lime plaster 2.00 0.830 0.02 142 Hollow concrete blocks (800 kg/m3) 30.00 0.600 0.50 8
3 Normal plastering mortar GP lime cement (1800kg/m3) 2.00 1.050 0.02 11
4 Adhesive mortar 0.50 1.000 0.01 125 Austrotherm resolution insulation panel 16.00 0.022 7.27 926 Baumit open adhesive filler W 0.50 0.800 0.01 97 Sto-polystyrene rigid foam board EPS-F B&W 4.00 0.033 1.21 118 Knauf blauband Tünich gypsum thin plaster 0.50 0.700 0.01 4
Rsi / Rse 0.130/0.040Building element 55.500 9.216 158
Sustainability 2019, 11, 4487 10 of 22
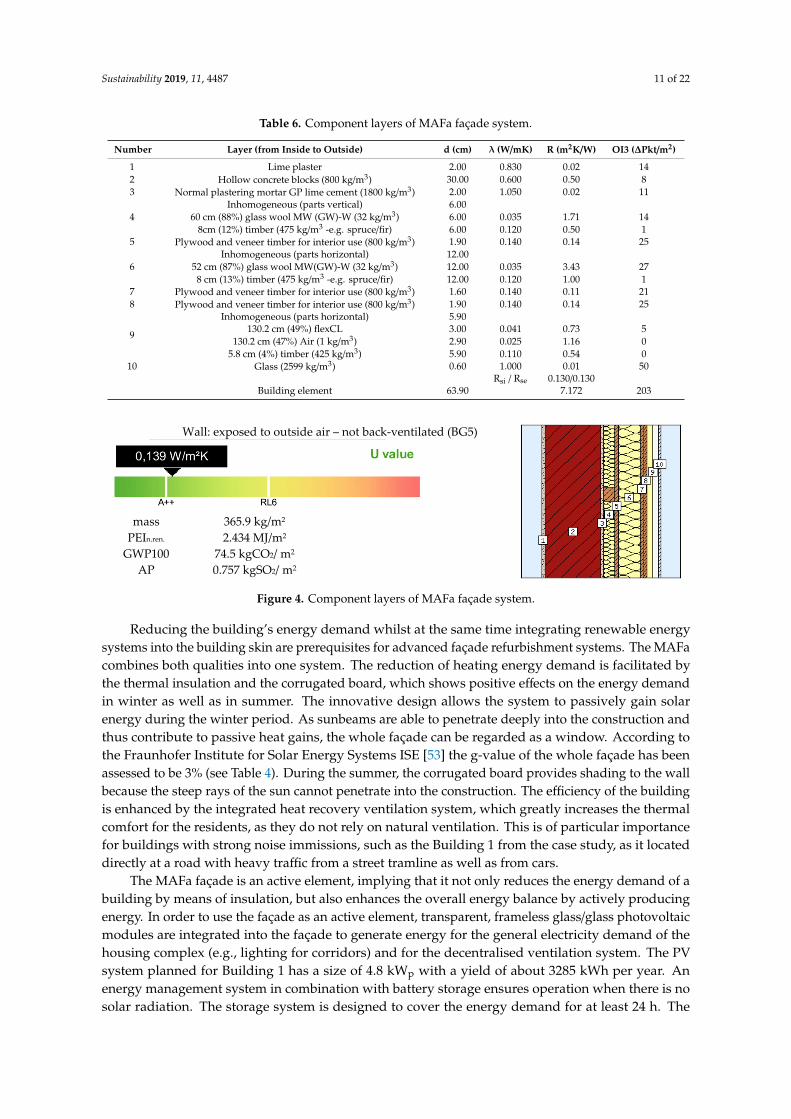
elements: the carrier plate, the timber frame construction and the glazing. The carrier plate is a 1.9 cm thick MDF (Medium Density Wood Fiber Insulation Board) with 12 cm of glass wool on top for thermal insulation. The timber frame construction is 5.9 cm thick with a 2.9 cm air layer and a 3 cm corrugated board made of a cellulose insulation board (flexCL) from the company Homatherm, produced from recycled paper. See Table 6 and Figure 4 for detailed build-up of the MAFa system and Figure 5 of the schematics and close view of the structure.
Table 5. Component layers of ETICS façade system.
Number Layer (from inside to outside) d
(cm) λ
(W/mK) R
(m2K/W) OI3
(ΔPkt/m2) 1 Lime plaster 2.00 0.830 0.02 142 Hollow concrete blocks (800 kg/m3) 30.00 0.600 0.50 8
3 Normal plastering mortar GP lime
cement (1,800 kg/m3) 2.00 1.050 0.02 11
4 Adhesive mortar 0.50 1.000 0.01 125 Austrotherm resolution insulation panel 16.00 0.022 7.27 92 6 Baumit open adhesive filler W 0.50 0.800 0.01 9
7 Sto-polystyrene rigid foam board
EPS-F B&W 4.00 0.033 1.21 11
8 Knauf blauband Tünich gypsum thin
plaster 0.50 0.700 0.01 4
Building element 55.500 Rsi / Rse 0.130 / 0.040
9.216 158
Wall: exposed to outside air – not back-ventilated (BG5)
mass 336.9 kg/m2
PEIn.ren. 2,455 MJ/m2
GWP100 133 kgCO2/ m2
AP 0.406 kgSO2/ m2
Figure 3. Component layers of ETICS façade system.
Reducing the building’s energy demand whilst at the same time integrating renewable energy systems into the building skin are prerequisites for advanced façade refurbishment systems. The MAFa combines both qualities into one system. The reduction of heating energy demand is facilitated by the thermal insulation and the corrugated board, which shows positive effects on the energy demand in winter as well as in summer. The innovative design allows the system to passively gain solar energy during the winter period. As sunbeams are able to penetrate deeply into the construction and thus contribute to passive heat gains, the whole façade can be regarded as a window. According to the Fraunhofer Institute for Solar Energy Systems ISE [53] the g-value of the whole façade has been assessed to be 3% (see Table 4). During the summer, the corrugated board provides shading to the wall because the steep rays of the sun cannot penetrate into the construction. The efficiency of the building is enhanced by the integrated heat recovery ventilation system, which greatly increases the thermal comfort for the residents, as they do not rely on natural ventilation. This is of particular importance for buildings with strong noise immissions, such as the Building 1 from the case study, as it located directly at a road with heavy traffic from a street tramline as well as from cars.
Figure 3. Component layers of ETICS façade system.
4.2. Multi-Active-Façade (MAFa)
The Multi-Active Façade has been specifically developed for refurbishment as it is fullyprefabricated and thus significantly reduces the application time on site. The façade serves twomain purposes: while a passive house standard is achieved by applying it onto the existing outer wallsdue to its inherent insulation properties, it includes at the same time all required building servicesneeded for achieving this standard (e.g., the ventilation unit). This leads to the added value of noadditional construction work inside the individual flats, which is positive for the residents as they arenot affected by immission of dust and noise during construction. The prefabricated façade is mountedonto the existing wall with a layer of 6 to 12 cm of glass wool between wooden frames to compensatefor a potentially uneven existing facade. The Multi-Active Façade consists of three elements: the carrierplate, the timber frame construction and the glazing. The carrier plate is a 1.9 cm thick MDF (MediumDensity Wood Fiber Insulation Board) with 12 cm of glass wool on top for thermal insulation. Thetimber frame construction is 5.9 cm thick with a 2.9 cm air layer and a 3 cm corrugated board made ofa cellulose insulation board (flexCL) from the company Homatherm, produced from recycled paper.See Table 6 and Figure 4 for detailed build-up of the MAFa system and Figure 5 of the schematics andclose view of the structure.
Sustainability 2019, 11, 4487 11 of 22
Table 6. Component layers of MAFa façade system.
Number Layer (from Inside to Outside) d (cm) λ (W/mK) R (m2K/W) OI3 (∆Pkt/m2)
1 Lime plaster 2.00 0.830 0.02 142 Hollow concrete blocks (800 kg/m3) 30.00 0.600 0.50 83 Normal plastering mortar GP lime cement (1800 kg/m3) 2.00 1.050 0.02 11
4Inhomogeneous (parts vertical) 6.00
60 cm (88%) glass wool MW (GW)-W (32 kg/m3) 6.00 0.035 1.71 148cm (12%) timber (475 kg/m3 -e.g. spruce/fir) 6.00 0.120 0.50 1
5 Plywood and veneer timber for interior use (800 kg/m3) 1.90 0.140 0.14 25
6Inhomogeneous (parts horizontal) 12.00
52 cm (87%) glass wool MW(GW)-W (32 kg/m3) 12.00 0.035 3.43 278 cm (13%) timber (475 kg/m3 -e.g. spruce/fir) 12.00 0.120 1.00 1
7 Plywood and veneer timber for interior use (800 kg/m3) 1.60 0.140 0.11 218 Plywood and veneer timber for interior use (800 kg/m3) 1.90 0.140 0.14 25
9
Inhomogeneous (parts horizontal) 5.90130.2 cm (49%) flexCL 3.00 0.041 0.73 5
130.2 cm (47%) Air (1 kg/m3) 2.90 0.025 1.16 05.8 cm (4%) timber (425 kg/m3) 5.90 0.110 0.54 0
10 Glass (2599 kg/m3) 0.60 1.000 0.01 50Rsi / Rse 0.130/0.130
Building element 63.90 7.172 203
Sustainability 2019, 11, 4487 11 of 22
Table 6. Component layers of MAFa façade system.
Number Layer (from inside to outside) d (cm)
λ (W/mK)
R (m2K/W)
OI3 (ΔPkt/m2)
1 Lime plaster 2.00 0.830 0.02 142 Hollow concrete blocks (800 kg/m3) 30.00 0.600 0.50 8
3 Normal plastering mortar GP lime cement
(1,800 kg/m3) 2.00 1.050 0.02 11
4 Inhomogeneous (parts vertical)
60 cm (88%) glass wool MW (GW)-W (32 kg/m3) 8cm (12%) timber (475 kg/m3 -e.g. spruce/fir)
6.00 6.00 6.00
0.035 0.120
1.71 0.50
14 1
5 Plywood and veneer timber for interior use
(800 kg/m3) 1.90 0.140 0.14 25
6 Inhomogeneous (parts horizontal)
52 cm (87%) glass wool MW(GW)-W (32 kg/m3) 8 cm (13%) timber (475 kg/m3 -e.g. spruce/fir)
12.00 12.00 12.00
0.035 0.120
3.43 1.00
27 1
7 Plywood and veneer timber for interior use
(800 kg/m3) 1.60 0.140 0.11 21
8 Plywood and veneer timber for interior use
(800 kg/m3) 1.90 0.140 0.14 25
9
Inhomogeneous (parts horizontal) 130.2 cm (49%) flexCL
130.2 cm (47%) Air (1 kg/m3) 5.8 cm (4%) timber (425 kg/m3)
5.90 3.00 2.90 5.90
0.041 0.025 0.110
0.73 1.16 0.54
5 0 0
10 Glass (2,599 kg/m3) 0.60 1.000 0.01 50 Rsi / Rse 0.130 / 0.130
Building element 63.90 7.172 203
Wall: exposed to outside air – not back-ventilated (BG5)
mass 365.9 kg/m2
PEIn.ren. 2.434 MJ/m2
GWP100 74.5 kgCO2/ m2
AP 0.757 kgSO2/ m2
Figure 4. Component layers of MAFa façade system.
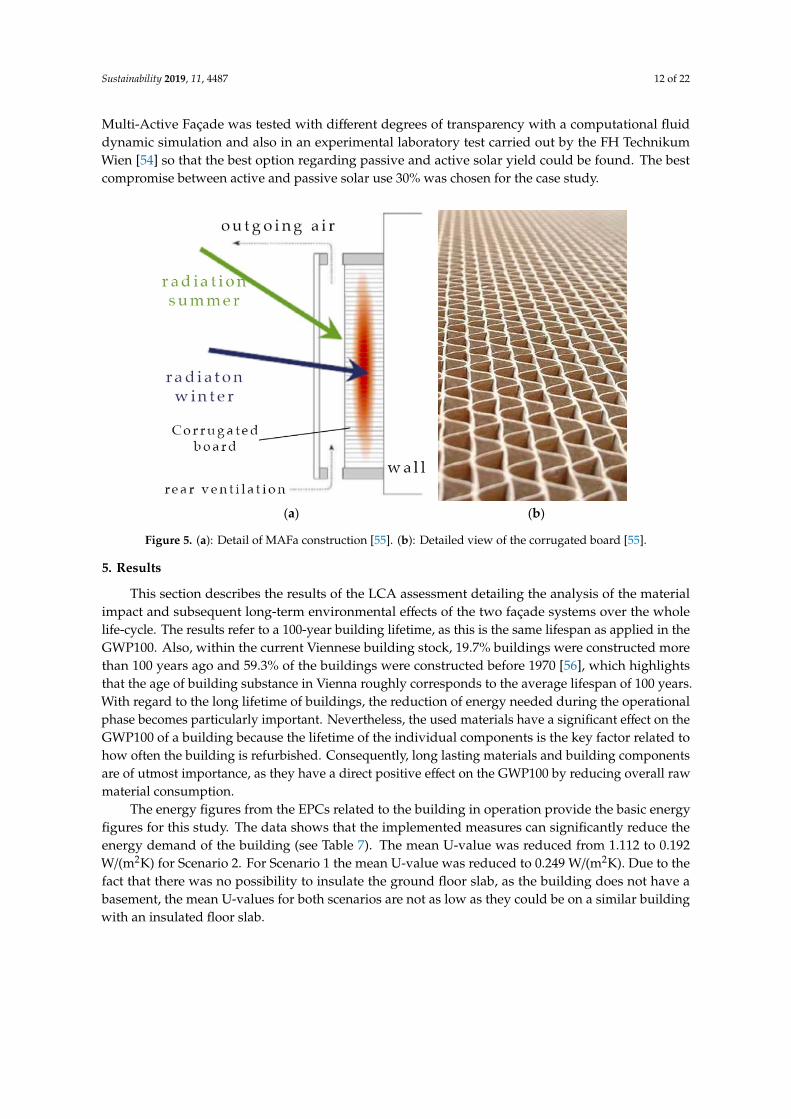
The MAFa façade is an active element, implying that it not only reduces the energy demand of a building by means of insulation, but also enhances the overall energy balance by actively producing energy. In order to use the façade as an active element, transparent, frameless glass/glass photovoltaic modules are integrated into the façade to generate energy for the general electricity demand of the housing complex (e.g., lighting for corridors) and for the decentralised ventilation system. The PV system planned for Building 1 has a size of 4.8 kWp with a yield of about 3285 kWh per year. An energy management system in combination with battery storage ensures operation when there is no solar radiation. The storage system is designed to cover the energy demand for at least 24 h. The Multi-Active Façade was tested with different degrees of transparency with a computational fluid dynamic simulation and also in an experimental laboratory test carried out by the FH Technikum Wien [54] so that the best option regarding passive and active solar yield could be found. The best compromise between active and passive solar use 30% was chosen for the case study.
Figure 4. Component layers of MAFa façade system.
Reducing the building’s energy demand whilst at the same time integrating renewable energysystems into the building skin are prerequisites for advanced façade refurbishment systems. The MAFacombines both qualities into one system. The reduction of heating energy demand is facilitated bythe thermal insulation and the corrugated board, which shows positive effects on the energy demandin winter as well as in summer. The innovative design allows the system to passively gain solarenergy during the winter period. As sunbeams are able to penetrate deeply into the construction andthus contribute to passive heat gains, the whole façade can be regarded as a window. According tothe Fraunhofer Institute for Solar Energy Systems ISE [53] the g-value of the whole façade has beenassessed to be 3% (see Table 4). During the summer, the corrugated board provides shading to the wallbecause the steep rays of the sun cannot penetrate into the construction. The efficiency of the buildingis enhanced by the integrated heat recovery ventilation system, which greatly increases the thermalcomfort for the residents, as they do not rely on natural ventilation. This is of particular importancefor buildings with strong noise immissions, such as the Building 1 from the case study, as it locateddirectly at a road with heavy traffic from a street tramline as well as from cars.
The MAFa façade is an active element, implying that it not only reduces the energy demand of abuilding by means of insulation, but also enhances the overall energy balance by actively producingenergy. In order to use the façade as an active element, transparent, frameless glass/glass photovoltaicmodules are integrated into the façade to generate energy for the general electricity demand of thehousing complex (e.g., lighting for corridors) and for the decentralised ventilation system. The PVsystem planned for Building 1 has a size of 4.8 kWp with a yield of about 3285 kWh per year. Anenergy management system in combination with battery storage ensures operation when there is nosolar radiation. The storage system is designed to cover the energy demand for at least 24 h. The
Sustainability 2019, 11, 4487 12 of 22
Multi-Active Façade was tested with different degrees of transparency with a computational fluiddynamic simulation and also in an experimental laboratory test carried out by the FH TechnikumWien [54] so that the best option regarding passive and active solar yield could be found. The bestcompromise between active and passive solar use 30% was chosen for the case study.Sustainability 2019, 11, 4487 12 of 22
(a) (b)
Figure 5. (a): Detail of MAFa construction [55]. (b): Detailed view of the corrugated board [55].
5. Results
This section describes the results of the LCA assessment detailing the analysis of the material impact and subsequent long-term environmental effects of the two façade systems over the whole life-cycle. The results refer to a 100-year building lifetime, as this is the same lifespan as applied in the GWP100. Also, within the current Viennese building stock, 19.7% buildings were constructed more than 100 years ago and 59.3% of the buildings were constructed before 1970 [56], which highlights that the age of building substance in Vienna roughly corresponds to the average lifespan of 100 years. With regard to the long lifetime of buildings, the reduction of energy needed during the operational phase becomes particularly important. Nevertheless, the used materials have a significant effect on the GWP100 of a building because the lifetime of the individual components is the key factor related to how often the building is refurbished. Consequently, long lasting materials and building components are of utmost importance, as they have a direct positive effect on the GWP100 by reducing overall raw material consumption.
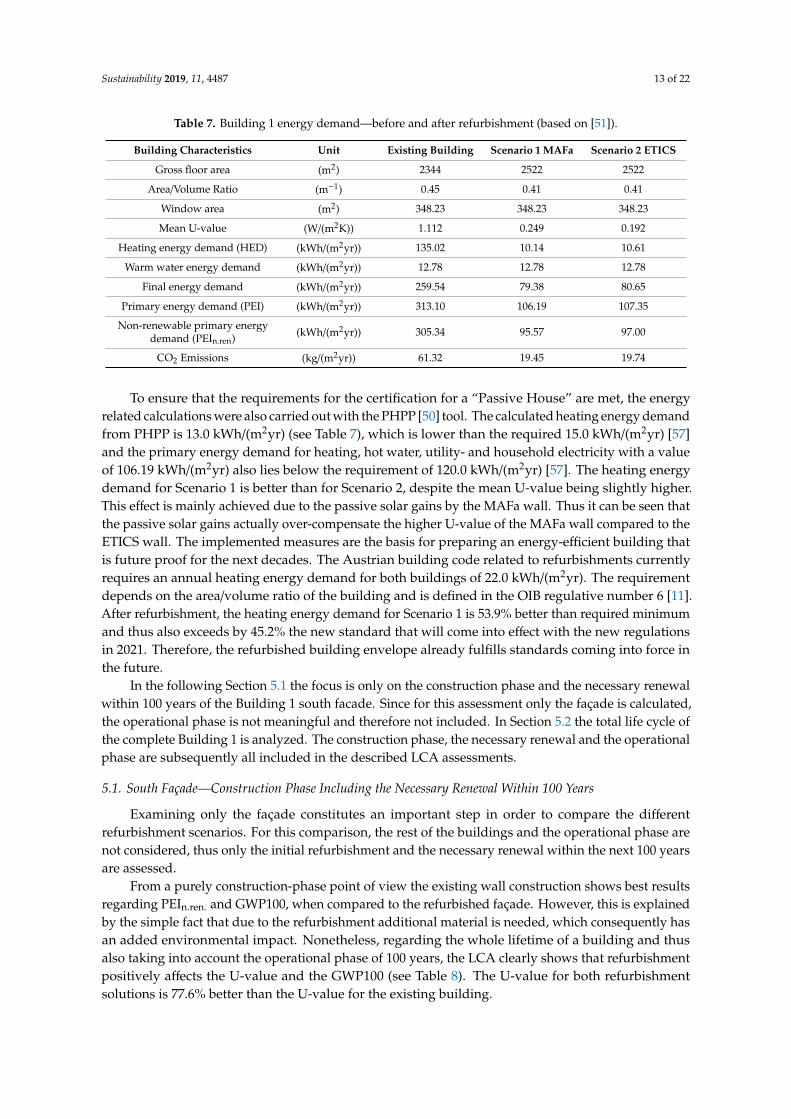
The energy figures from the EPCs related to the building in operation provide the basic energy figures for this study. The data shows that the implemented measures can significantly reduce the energy demand of the building (see Table 7). The mean U-value was reduced from 1.112 to 0.192 W/(m2K) for Scenario 2. For Scenario 1 the mean U-value was reduced to 0.249 W/(m2K). Due to the fact that there was no possibility to insulate the ground floor slab, as the building does not have a basement, the mean U-values for both scenarios are not as low as they could be on a similar building with an insulated floor slab.
Table 7. Building 1 energy demand—before and after refurbishment (based on [51]).
Building characteristics Unit Existing Building
Scenario 1 MAFa
Scenario 2 ETICS
Gross floor area (m2) 2344 2522 2522 Area/Volume Ratio (m−1) 0.45 0.41 0.41
Window area (m2) 348.23 348.23 348.23 Mean U-value (W/(m2K)) 1.112 0.249 0.192
Heating energy demand (HED) (kWh/(m2yr)) 135.02 10.14 10.61 Warm water energy demand (kWh/(m2yr)) 12.78 12.78 12.78
Final energy demand (kWh/(m2yr)) 259.54 79.38 80.65 Primary energy demand (PEI) (kWh/(m2yr)) 313.10 106.19 107.35
Non-renewable primary energy (kWh/(m2yr)) 305.34 95.57 97.00
Figure 5. (a): Detail of MAFa construction [55]. (b): Detailed view of the corrugated board [55].
5. Results
This section describes the results of the LCA assessment detailing the analysis of the materialimpact and subsequent long-term environmental effects of the two façade systems over the wholelife-cycle. The results refer to a 100-year building lifetime, as this is the same lifespan as applied in theGWP100. Also, within the current Viennese building stock, 19.7% buildings were constructed morethan 100 years ago and 59.3% of the buildings were constructed before 1970 [56], which highlightsthat the age of building substance in Vienna roughly corresponds to the average lifespan of 100 years.With regard to the long lifetime of buildings, the reduction of energy needed during the operationalphase becomes particularly important. Nevertheless, the used materials have a significant effect on theGWP100 of a building because the lifetime of the individual components is the key factor related tohow often the building is refurbished. Consequently, long lasting materials and building componentsare of utmost importance, as they have a direct positive effect on the GWP100 by reducing overall rawmaterial consumption.
The energy figures from the EPCs related to the building in operation provide the basic energyfigures for this study. The data shows that the implemented measures can significantly reduce theenergy demand of the building (see Table 7). The mean U-value was reduced from 1.112 to 0.192W/(m2K) for Scenario 2. For Scenario 1 the mean U-value was reduced to 0.249 W/(m2K). Due to thefact that there was no possibility to insulate the ground floor slab, as the building does not have abasement, the mean U-values for both scenarios are not as low as they could be on a similar buildingwith an insulated floor slab.
Sustainability 2019, 11, 4487 13 of 22
Table 7. Building 1 energy demand—before and after refurbishment (based on [51]).
Building Characteristics Unit Existing Building Scenario 1 MAFa Scenario 2 ETICS
Gross floor area (m2) 2344 2522 2522
Area/Volume Ratio (m−1) 0.45 0.41 0.41
Window area (m2) 348.23 348.23 348.23
Mean U-value (W/(m2K)) 1.112 0.249 0.192
Heating energy demand (HED) (kWh/(m2yr)) 135.02 10.14 10.61
Warm water energy demand (kWh/(m2yr)) 12.78 12.78 12.78
Final energy demand (kWh/(m2yr)) 259.54 79.38 80.65
Primary energy demand (PEI) (kWh/(m2yr)) 313.10 106.19 107.35
Non-renewable primary energydemand (PEIn.ren) (kWh/(m2yr)) 305.34 95.57 97.00
CO2 Emissions (kg/(m2yr)) 61.32 19.45 19.74
To ensure that the requirements for the certification for a “Passive House” are met, the energyrelated calculations were also carried out with the PHPP [50] tool. The calculated heating energy demandfrom PHPP is 13.0 kWh/(m2yr) (see Table 7), which is lower than the required 15.0 kWh/(m2yr) [57]and the primary energy demand for heating, hot water, utility- and household electricity with a valueof 106.19 kWh/(m2yr) also lies below the requirement of 120.0 kWh/(m2yr) [57]. The heating energydemand for Scenario 1 is better than for Scenario 2, despite the mean U-value being slightly higher.This effect is mainly achieved due to the passive solar gains by the MAFa wall. Thus it can be seen thatthe passive solar gains actually over-compensate the higher U-value of the MAFa wall compared to theETICS wall. The implemented measures are the basis for preparing an energy-efficient building thatis future proof for the next decades. The Austrian building code related to refurbishments currentlyrequires an annual heating energy demand for both buildings of 22.0 kWh/(m2yr). The requirementdepends on the area/volume ratio of the building and is defined in the OIB regulative number 6 [11].After refurbishment, the heating energy demand for Scenario 1 is 53.9% better than required minimumand thus also exceeds by 45.2% the new standard that will come into effect with the new regulationsin 2021. Therefore, the refurbished building envelope already fulfills standards coming into force inthe future.
In the following Section 5.1 the focus is only on the construction phase and the necessary renewalwithin 100 years of the Building 1 south facade. Since for this assessment only the façade is calculated,the operational phase is not meaningful and therefore not included. In Section 5.2 the total life cycle ofthe complete Building 1 is analyzed. The construction phase, the necessary renewal and the operationalphase are subsequently all included in the described LCA assessments.
5.1. South Façade—Construction Phase Including the Necessary Renewal Within 100 Years
Examining only the façade constitutes an important step in order to compare the differentrefurbishment scenarios. For this comparison, the rest of the buildings and the operational phase arenot considered, thus only the initial refurbishment and the necessary renewal within the next 100 yearsare assessed.
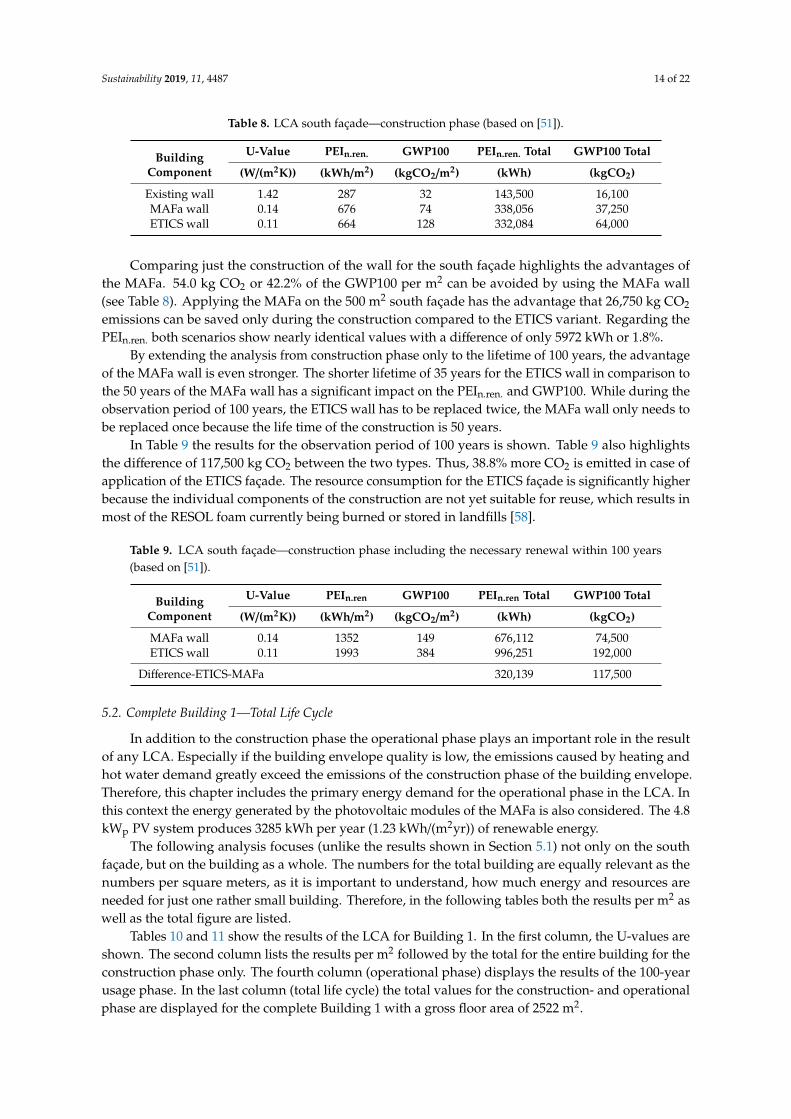
From a purely construction-phase point of view the existing wall construction shows best resultsregarding PEIn.ren. and GWP100, when compared to the refurbished façade. However, this is explainedby the simple fact that due to the refurbishment additional material is needed, which consequently hasan added environmental impact. Nonetheless, regarding the whole lifetime of a building and thusalso taking into account the operational phase of 100 years, the LCA clearly shows that refurbishmentpositively affects the U-value and the GWP100 (see Table 8). The U-value for both refurbishmentsolutions is 77.6% better than the U-value for the existing building.
Sustainability 2019, 11, 4487 14 of 22
Table 8. LCA south façade—construction phase (based on [51]).
BuildingComponent
U-Value PEIn.ren. GWP100 PEIn.ren. Total GWP100 Total
(W/(m2K)) (kWh/m2) (kgCO2/m2) (kWh) (kgCO2)
Existing wall 1.42 287 32 143,500 16,100MAFa wall 0.14 676 74 338,056 37,250ETICS wall 0.11 664 128 332,084 64,000
Comparing just the construction of the wall for the south façade highlights the advantages ofthe MAFa. 54.0 kg CO2 or 42.2% of the GWP100 per m2 can be avoided by using the MAFa wall(see Table 8). Applying the MAFa on the 500 m2 south façade has the advantage that 26,750 kg CO2
emissions can be saved only during the construction compared to the ETICS variant. Regarding thePEIn.ren. both scenarios show nearly identical values with a difference of only 5972 kWh or 1.8%.
By extending the analysis from construction phase only to the lifetime of 100 years, the advantageof the MAFa wall is even stronger. The shorter lifetime of 35 years for the ETICS wall in comparison tothe 50 years of the MAFa wall has a significant impact on the PEIn.ren. and GWP100. While during theobservation period of 100 years, the ETICS wall has to be replaced twice, the MAFa wall only needs tobe replaced once because the life time of the construction is 50 years.
In Table 9 the results for the observation period of 100 years is shown. Table 9 also highlightsthe difference of 117,500 kg CO2 between the two types. Thus, 38.8% more CO2 is emitted in case ofapplication of the ETICS façade. The resource consumption for the ETICS façade is significantly higherbecause the individual components of the construction are not yet suitable for reuse, which results inmost of the RESOL foam currently being burned or stored in landfills [58].
Table 9. LCA south façade—construction phase including the necessary renewal within 100 years(based on [51]).
BuildingComponent
U-Value PEIn.ren GWP100 PEIn.ren Total GWP100 Total
(W/(m2K)) (kWh/m2) (kgCO2/m2) (kWh) (kgCO2)
MAFa wall 0.14 1352 149 676,112 74,500ETICS wall 0.11 1993 384 996,251 192,000
Difference-ETICS-MAFa 320,139 117,500
5.2. Complete Building 1—Total Life Cycle
In addition to the construction phase the operational phase plays an important role in the resultof any LCA. Especially if the building envelope quality is low, the emissions caused by heating andhot water demand greatly exceed the emissions of the construction phase of the building envelope.Therefore, this chapter includes the primary energy demand for the operational phase in the LCA. Inthis context the energy generated by the photovoltaic modules of the MAFa is also considered. The 4.8kWp PV system produces 3285 kWh per year (1.23 kWh/(m2yr)) of renewable energy.
The following analysis focuses (unlike the results shown in Section 5.1) not only on the southfaçade, but on the building as a whole. The numbers for the total building are equally relevant as thenumbers per square meters, as it is important to understand, how much energy and resources areneeded for just one rather small building. Therefore, in the following tables both the results per m2 aswell as the total figure are listed.
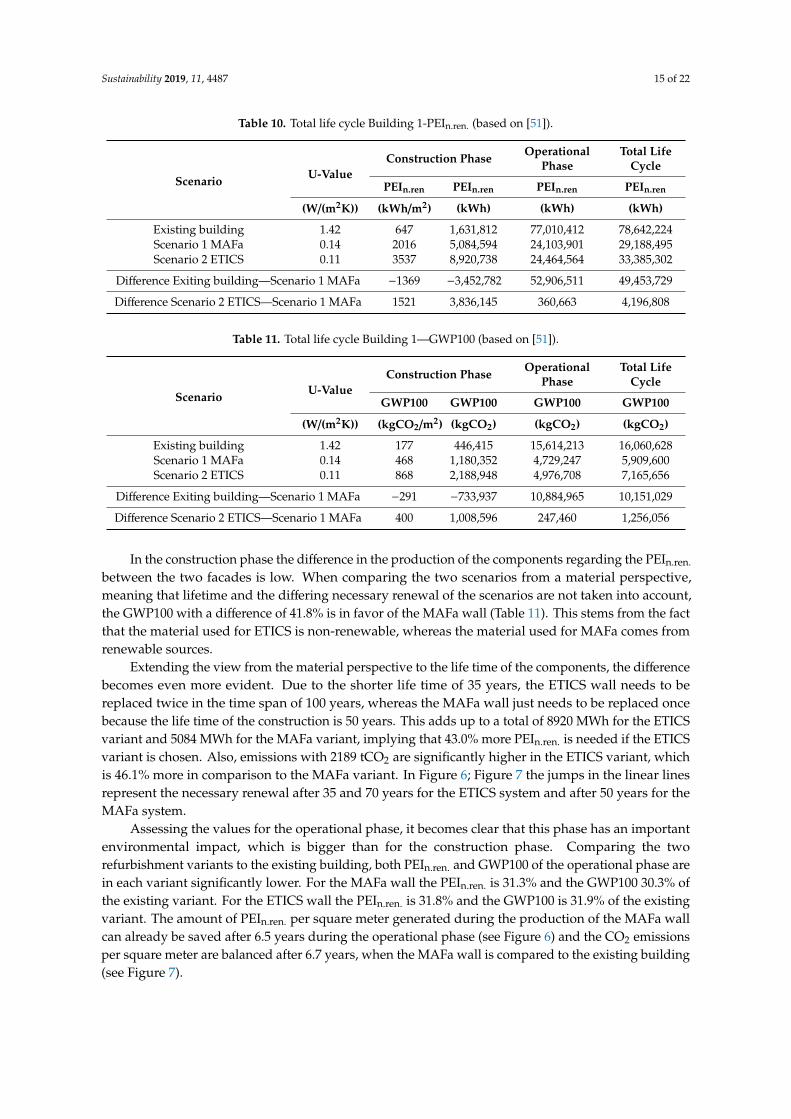
Tables 10 and 11 show the results of the LCA for Building 1. In the first column, the U-values areshown. The second column lists the results per m2 followed by the total for the entire building for theconstruction phase only. The fourth column (operational phase) displays the results of the 100-yearusage phase. In the last column (total life cycle) the total values for the construction- and operationalphase are displayed for the complete Building 1 with a gross floor area of 2522 m2.
Sustainability 2019, 11, 4487 15 of 22
Table 10. Total life cycle Building 1-PEIn.ren. (based on [51]).
Scenario U-ValueConstruction Phase Operational
PhaseTotal Life
Cycle
PEIn.ren PEIn.ren PEIn.ren PEIn.ren
(W/(m2K)) (kWh/m2) (kWh) (kWh) (kWh)
Existing building 1.42 647 1,631,812 77,010,412 78,642,224Scenario 1 MAFa 0.14 2016 5,084,594 24,103,901 29,188,495Scenario 2 ETICS 0.11 3537 8,920,738 24,464,564 33,385,302
Difference Exiting building—Scenario 1 MAFa −1369 −3,452,782 52,906,511 49,453,729
Difference Scenario 2 ETICS—Scenario 1 MAFa 1521 3,836,145 360,663 4,196,808
Table 11. Total life cycle Building 1—GWP100 (based on [51]).
Scenario U-ValueConstruction Phase Operational
PhaseTotal Life
Cycle
GWP100 GWP100 GWP100 GWP100
(W/(m2K)) (kgCO2/m2) (kgCO2) (kgCO2) (kgCO2)
Existing building 1.42 177 446,415 15,614,213 16,060,628Scenario 1 MAFa 0.14 468 1,180,352 4,729,247 5,909,600Scenario 2 ETICS 0.11 868 2,188,948 4,976,708 7,165,656
Difference Exiting building—Scenario 1 MAFa −291 −733,937 10,884,965 10,151,029
Difference Scenario 2 ETICS—Scenario 1 MAFa 400 1,008,596 247,460 1,256,056
In the construction phase the difference in the production of the components regarding the PEIn.ren.
between the two facades is low. When comparing the two scenarios from a material perspective,meaning that lifetime and the differing necessary renewal of the scenarios are not taken into account,the GWP100 with a difference of 41.8% is in favor of the MAFa wall (Table 11). This stems from the factthat the material used for ETICS is non-renewable, whereas the material used for MAFa comes fromrenewable sources.
Extending the view from the material perspective to the life time of the components, the differencebecomes even more evident. Due to the shorter life time of 35 years, the ETICS wall needs to bereplaced twice in the time span of 100 years, whereas the MAFa wall just needs to be replaced oncebecause the life time of the construction is 50 years. This adds up to a total of 8920 MWh for the ETICSvariant and 5084 MWh for the MAFa variant, implying that 43.0% more PEIn.ren. is needed if the ETICSvariant is chosen. Also, emissions with 2189 tCO2 are significantly higher in the ETICS variant, whichis 46.1% more in comparison to the MAFa variant. In Figure 6; Figure 7 the jumps in the linear linesrepresent the necessary renewal after 35 and 70 years for the ETICS system and after 50 years for theMAFa system.
Assessing the values for the operational phase, it becomes clear that this phase has an importantenvironmental impact, which is bigger than for the construction phase. Comparing the tworefurbishment variants to the existing building, both PEIn.ren. and GWP100 of the operational phase arein each variant significantly lower. For the MAFa wall the PEIn.ren. is 31.3% and the GWP100 30.3% ofthe existing variant. For the ETICS wall the PEIn.ren. is 31.8% and the GWP100 is 31.9% of the existingvariant. The amount of PEIn.ren. per square meter generated during the production of the MAFa wallcan already be saved after 6.5 years during the operational phase (see Figure 6) and the CO2 emissionsper square meter are balanced after 6.7 years, when the MAFa wall is compared to the existing building(see Figure 7).

Sustainability 2019, 11, 4487 16 of 22
Sustainability 2019, 11, 4487 15 of 22
Table 11. Total life cycle Building 1—GWP100 (based on [51]).
Scenario U-Value
Construction Phase Operational Phase
Total Life Cycle
GWP100 GWP100 GWP100 GWP100 (W/(m2K)) (kgCO2/m2) (kgCO2) (kgCO2) (kgCO2)
Existing building 1.42 177 446,415 15,614,213 16,060,628 Scenario 1 MAFa 0.14 468 1,180,352 4,729,247 5,909,600 Scenario 2 ETICS 0.11 868 2,188,948 4,976,708 7,165,656
Difference Exiting building—Scenario 1 MAFa
−291 −733,937 10,884,965 10,151,029
Difference Scenario 2 ETICS—Scenario 1 MAFa
400 1,008,596 247,460 1,256,056
In the construction phase the difference in the production of the components regarding the PEIn.ren. between the two facades is low. When comparing the two scenarios from a material perspective, meaning that lifetime and the differing necessary renewal of the scenarios are not taken into account, the GWP100 with a difference of 41.8% is in favor of the MAFa wall (Table 11). This stems from the fact that the material used for ETICS is non-renewable, whereas the material used for MAFa comes from renewable sources.
Extending the view from the material perspective to the life time of the components, the difference becomes even more evident. Due to the shorter life time of 35 years, the ETICS wall needs to be replaced twice in the time span of 100 years, whereas the MAFa wall just needs to be replaced once because the life time of the construction is 50 years. This adds up to a total of 8920 MWh for the ETICS variant and 5084 MWh for the MAFa variant, implying that 43.0% more PEIn.ren. is needed if the ETICS variant is chosen. Also, emissions with 2189 tCO2 are significantly higher in the ETICS variant, which is 46.1% more in comparison to the MAFa variant. In Figure 6; Figure 7 the jumps in the linear lines represent the necessary renewal after 35 and 70 years for the ETICS system and after 50 years for the MAFa system.
Figure 6. Building 1 total life cycle PEIn.ren—comparison of different scenarios.
Assessing the values for the operational phase, it becomes clear that this phase has an important environmental impact, which is bigger than for the construction phase. Comparing the two refurbishment variants to the existing building, both PEIn.ren. and GWP100 of the operational phase
Figure 6. Building 1 total life cycle PEIn.ren—comparison of different scenarios.
Sustainability 2019, 11, 4487 16 of 22
are in each variant significantly lower. For the MAFa wall the PEIn.ren. is 31.3% and the GWP100 30.3% of the existing variant. For the ETICS wall the PEIn.ren. is 31.8% and the GWP100 is 31.9% of the existing variant. The amount of PEIn.ren. per square meter generated during the production of the MAFa wall can already be saved after 6.5 years during the operational phase (see Error! Reference source not found.) and the CO2 emissions per square meter are balanced after 6.7 years, when the MAFa wall is compared to the existing building (see Error! Reference source not found.).
Figure 7. Building 1 total life cycle GWP10—comparison of different scenarios.
The measures applied result in a significant reduction of the energy demand and emissions. It also shows that retrofitting the building envelope provides just one step in reducing the overall energy demand (compare data line “Scenario 1 HED” and data line “Scenario 1 PEIn.ren.” in Error! Reference source not found.). Because household electricity demand and warm water energy demand are not affected in the same way by the refurbishment as the heating energy demand (which is −92.0% for the MAFa scenario in Building 1 compared to the existing scenario), generating renewable energy on site is the only way to reduce the total energy demand of non-renewable energy. The MAFa wall has PV-modules included, however, the building shape, the vertical arrangement and the limited usable façade surface narrow the size of the PV system. In addition, the roof of the building has already been prepared for the implementation of another PV-system at a later time. The energy generated by the PV is currently enough for operating the ventilation system and to power the lighting in the general areas of the building.
The complete LCA for the total life cycle of Building 1 shows that a significant amount of non-renewable energy and emissions can be saved when a building is refurbished. In comparison to the existing building the MAFa variant saves about 49,453 MWh and subsequently 10,151 t CO2. With this accumulatively saved energy 52 apartments (PEIn.ren = 95.57 kWh/(m2yr)) with 100 m2 each could be supplied for 100 years with their PEIn.ren. demand for heating, warm water and electricity (see Table 12). Looking at the GWP100, 52 apartments (CO2 = 19.45 kgCO2/(m2yr)) emit about the same amount of CO2 in 100 years. When the MAFa variant is compared to the ETICS variant, 4 apartments could be supplied with PEIn.ren. and 6 apartments would consume the same amount of CO2 (see Table 13).
Figure 7. Building 1 total life cycle GWP10—comparison of different scenarios.
The measures applied result in a significant reduction of the energy demand and emissions. Italso shows that retrofitting the building envelope provides just one step in reducing the overall energydemand (compare data line “Scenario 1 HED” and data line “Scenario 1 PEIn.ren.” in Figure 6). Becausehousehold electricity demand and warm water energy demand are not affected in the same way by therefurbishment as the heating energy demand (which is −92.0% for the MAFa scenario in Building 1compared to the existing scenario), generating renewable energy on site is the only way to reduce thetotal energy demand of non-renewable energy. The MAFa wall has PV-modules included, however,the building shape, the vertical arrangement and the limited usable façade surface narrow the size ofthe PV system. In addition, the roof of the building has already been prepared for the implementationof another PV-system at a later time. The energy generated by the PV is currently enough for operatingthe ventilation system and to power the lighting in the general areas of the building.

Sustainability 2019, 11, 4487 17 of 22
The complete LCA for the total life cycle of Building 1 shows that a significant amount ofnon-renewable energy and emissions can be saved when a building is refurbished. In comparisonto the existing building the MAFa variant saves about 49,453 MWh and subsequently 10,151 t CO2.With this accumulatively saved energy 52 apartments (PEIn.ren = 95.57 kWh/(m2yr)) with 100 m2 eachcould be supplied for 100 years with their PEIn.ren. demand for heating, warm water and electricity (seeTable 12). Looking at the GWP100, 52 apartments (CO2 = 19.45 kgCO2/(m2yr)) emit about the sameamount of CO2 in 100 years. When the MAFa variant is compared to the ETICS variant, 4 apartmentscould be supplied with PEIn.ren. and 6 apartments would consume the same amount of CO2 (seeTable 13).
Table 12. Total life cycle—comparison MAFa with existing wall and ETICS PEIn.ren (based on [51]).
Compared ScenariosDifference PEIn.ren Difference PEIn.ren Difference PEIn.ren
(kWh/(m2yr)) (kWh/yr) (kWh)
Scenario 1 MAFa—Existing building 196 494,537 49,453,729Scenario 1 MAFa—Scenario 2 ETICS 17 41,968 4,196,808
Table 13. Total life cycle—comparison MAFa with existing wall and ETICS GWP100 (based on [51]).
Compared ScenariosDifferenceGWP100
DifferenceGWP100
DifferenceGWP100
(kgCO2/(m2yr)) (kgCO2/yr) (kgCO2)
Scenario 1 MAFa—Existing building 40 101,510 10,151,029Scenario 1 MAFa—Scenario 2 ETICS 5 12,561 1,256,056
Given the fact that the thermal properties of the two scenarios are very similar, the results relatedto energy efficiency are almost equal. However, the environmental impact of the construction phasebecomes more evident when comparing the percentages of the construction versus the operationalphase as shown in Figure 8 for the primary energy indicator (PEIn.ren) and in Figure 9 for the globalwarming potential (GWP100).
Sustainability 2019, 11, 4487 17 of 22
Table 12. Total life cycle—comparison MAFa with existing wall and ETICS PEIn.ren (based on [51]).
Compared Scenarios Difference
PEIn.ren Difference
PEIn.ren Difference
PEIn.ren (kWh/(m2yr)) (kWh/yr) (kWh)
Scenario 1 MAFa—Existing building 196 494,537 49,453,729 Scenario 1 MAFa—Scenario 2 ETICS 17 41,968 4,196,808
Table 13. Total life cycle—comparison MAFa with existing wall and ETICS GWP100 (based on [51]).
Compared Scenarios Difference GWP100
Difference GWP100
Difference GWP100
(kgCO2/(m2yr)) (kgCO2/yr) (kgCO2) Scenario 1 MAFa—Existing building 40 101,510 10,151,029 Scenario 1 MAFa—Scenario 2 ETICS 5 12,561 1,256,056
Given the fact that the thermal properties of the two scenarios are very similar, the results related to energy efficiency are almost equal. However, the environmental impact of the construction phase becomes more evident when comparing the percentages of the construction versus the operational phase as shown in Error! Reference source not found. for the primary energy indicator (PEIn.ren) and in Error! Reference source not found. for the global warming potential (GWP100).
Figure 8. Building 1—comparison between construction- and operational phase regarding PEIn.ren.
It can be seen that the material impact of Scenario 1 is with 17.42% of the total impact considerably lower than Scenario 2 with 26.72%. Similarly, the GWP100 is in the MAFa Scenario with 19.97% also much lower than the overall percentage of the construction phase of the ETICS variant with 30.55%. In the existing wall the impact of the operational phase is evidently the highest. As the quality of the original building stock is relatively low, compared to the refurbished scenarios where the thermal envelope has been fully exchanged, the energy required to operate the building by far exceeds the energy input of the basic construction. Thus, an improvement of the building shell is in any case a positive way forward.
Figure 8. Building 1—comparison between construction- and operational phase regarding PEIn.ren.
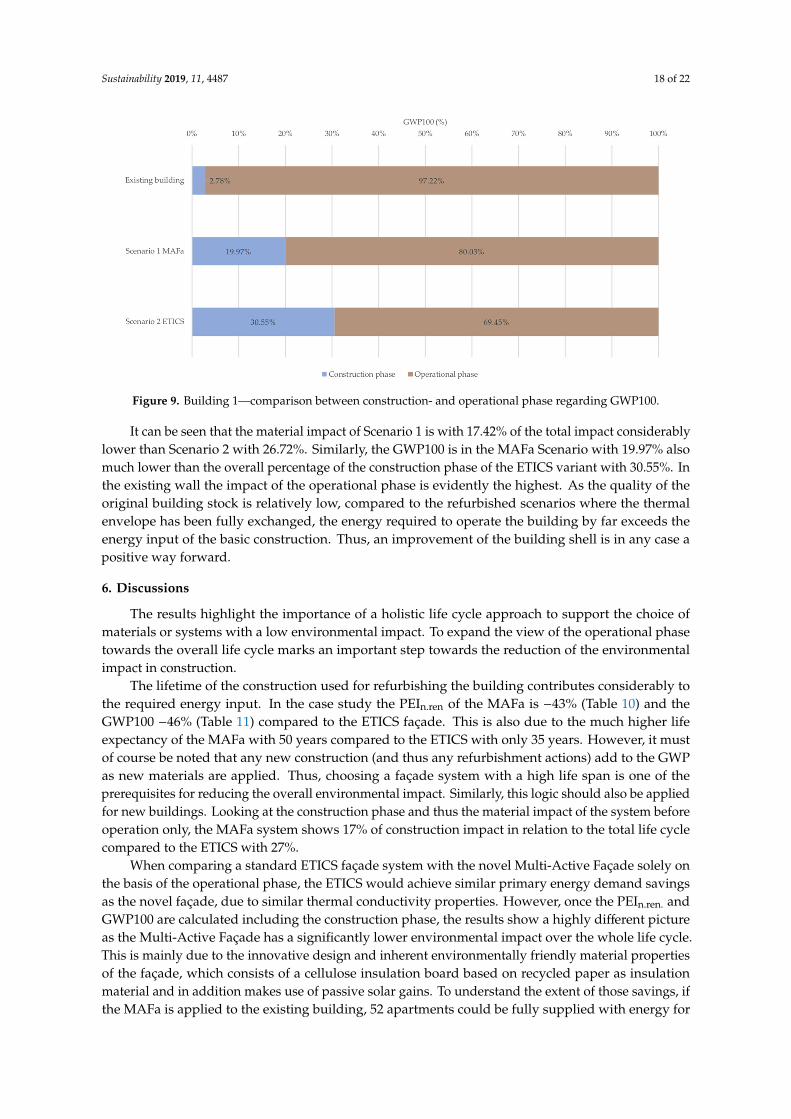
Sustainability 2019, 11, 4487 18 of 22Sustainability 2019, 11, 4487 18 of 22
Figure 9. Building 1—comparison between construction- and operational phase regarding GWP100.
6. Discussions
The results highlight the importance of a holistic life cycle approach to support the choice of materials or systems with a low environmental impact. To expand the view of the operational phase towards the overall life cycle marks an important step towards the reduction of the environmental impact in construction.
The lifetime of the construction used for refurbishing the building contributes considerably to the required energy input. In the case study the PEIn.ren of the MAFa is −43% (Table 10) and the GWP100 −46% (Table 11) compared to the ETICS façade. This is also due to the much higher life expectancy of the MAFa with 50 years compared to the ETICS with only 35 years. However, it must of course be noted that any new construction (and thus any refurbishment actions) add to the GWP as new materials are applied. Thus, choosing a façade system with a high life span is one of the prerequisites for reducing the overall environmental impact. Similarly, this logic should also be applied for new buildings. Looking at the construction phase and thus the material impact of the system before operation only, the MAFa system shows 17% of construction impact in relation to the total life cycle compared to the ETICS with 27%.
When comparing a standard ETICS façade system with the novel Multi-Active Façade solely on the basis of the operational phase, the ETICS would achieve similar primary energy demand savings as the novel façade, due to similar thermal conductivity properties. However, once the PEIn.ren. and GWP100 are calculated including the construction phase, the results show a highly different picture as the Multi-Active Façade has a significantly lower environmental impact over the whole life cycle. This is mainly due to the innovative design and inherent environmentally friendly material properties of the façade, which consists of a cellulose insulation board based on recycled paper as insulation material and in addition makes use of passive solar gains. To understand the extent of those savings, if the MAFa is applied to the existing building, 52 apartments could be fully supplied with energy for 100 years with the amount of PEIn.ren. saved within 100 years, that is 4 apartments more than with the ETICS. Thus, the novel façade could save 10.151 t of CO2 in comparison to the existing building.
The study highlights that whilst the evaluation of the operational phase alone results in a similar ecological footprint of the ETICS, the analysis over the whole life cycle provides a clear positive indication for the novel Multi-Active Façade.
Whilst the case study is focusing on one particular building in Vienna, the potential for the overall building stock of the same social housing provider has also been assessed. Based on the initial results of the case study, estimates for the application of the novel façade system for additional buildings owned by the same company have been calculated. Only buildings with similar
Figure 9. Building 1—comparison between construction- and operational phase regarding GWP100.
It can be seen that the material impact of Scenario 1 is with 17.42% of the total impact considerablylower than Scenario 2 with 26.72%. Similarly, the GWP100 is in the MAFa Scenario with 19.97% alsomuch lower than the overall percentage of the construction phase of the ETICS variant with 30.55%. Inthe existing wall the impact of the operational phase is evidently the highest. As the quality of theoriginal building stock is relatively low, compared to the refurbished scenarios where the thermalenvelope has been fully exchanged, the energy required to operate the building by far exceeds theenergy input of the basic construction. Thus, an improvement of the building shell is in any case apositive way forward.
6. Discussions
The results highlight the importance of a holistic life cycle approach to support the choice ofmaterials or systems with a low environmental impact. To expand the view of the operational phasetowards the overall life cycle marks an important step towards the reduction of the environmentalimpact in construction.
The lifetime of the construction used for refurbishing the building contributes considerably tothe required energy input. In the case study the PEIn.ren of the MAFa is −43% (Table 10) and theGWP100 −46% (Table 11) compared to the ETICS façade. This is also due to the much higher lifeexpectancy of the MAFa with 50 years compared to the ETICS with only 35 years. However, it mustof course be noted that any new construction (and thus any refurbishment actions) add to the GWPas new materials are applied. Thus, choosing a façade system with a high life span is one of theprerequisites for reducing the overall environmental impact. Similarly, this logic should also be appliedfor new buildings. Looking at the construction phase and thus the material impact of the system beforeoperation only, the MAFa system shows 17% of construction impact in relation to the total life cyclecompared to the ETICS with 27%.
When comparing a standard ETICS façade system with the novel Multi-Active Façade solely onthe basis of the operational phase, the ETICS would achieve similar primary energy demand savingsas the novel façade, due to similar thermal conductivity properties. However, once the PEIn.ren. andGWP100 are calculated including the construction phase, the results show a highly different pictureas the Multi-Active Façade has a significantly lower environmental impact over the whole life cycle.This is mainly due to the innovative design and inherent environmentally friendly material propertiesof the façade, which consists of a cellulose insulation board based on recycled paper as insulationmaterial and in addition makes use of passive solar gains. To understand the extent of those savings, ifthe MAFa is applied to the existing building, 52 apartments could be fully supplied with energy for
Sustainability 2019, 11, 4487 19 of 22
100 years with the amount of PEIn.ren. saved within 100 years, that is 4 apartments more than with theETICS. Thus, the novel façade could save 10.151 t of CO2 in comparison to the existing building.
The study highlights that whilst the evaluation of the operational phase alone results in a similarecological footprint of the ETICS, the analysis over the whole life cycle provides a clear positiveindication for the novel Multi-Active Façade.
Whilst the case study is focusing on one particular building in Vienna, the potential for the overallbuilding stock of the same social housing provider has also been assessed. Based on the initial results ofthe case study, estimates for the application of the novel façade system for additional buildings ownedby the same company have been calculated. Only buildings with similar framework conditions havebeen considered for this assessment. This included that the main façade had to be south facing withoutmajor shading by other buildings, trees or infrastructure. From a dataset of 195 buildings, which werein line to be refurbished within the following years, 40 objects with a total gross floor area of 202,300m2 were considered suitable for renovation with the Multi-Active-Façade. If the novel facade wouldbe applied to those buildings, an additional 33,356 MWh/yr of PEIn.ren. and 8837 tCO2/yr could besaved compared to a conventional system. As outlined above, the application of the MAFa should belimited to unshaded south facades, so that the benefits of the system could be fully exploited. Thefacade is however particularly suitable when noise reduction is a specific requirement.
The study shows that, as buildings become more energy efficient, an analysis of the whole life cycleof building materials and especially of primary energy demand and global warming potential becomesincreasingly important. This is of particular relevance in order for planners and developers to makeinformed decisions about the choice of construction measures. Especially for building refurbishmentthe impact of the materials must be considered. This is due to the fact that the overall life span ofbuildings increases again significantly once the building gets a new thermal envelope. Increasing therelevance of LCAs in construction work would thus support the efforts in decarbonizing the Europeanbuilding stock and ensuring that materials with minimal environmental impact are applied.
In further research projects the assessment of other innovative building construction measuresshould be addressed. Specifically, those based on recycled or natural resources should be evaluatedin comprehensive LCA assessments. Whilst this study focuses on a practical approach within a casestudy, further theoretical analysis, including costs over the whole life-cycle of the building would alsobe beneficial. Nevertheless, to carry out comprehensive assessments can be a time-consuming exercise.As stated above, other research in this context already outlined that a simplified and easily appliedLCA methodology and tool would be beneficial. This would ensure that LCA assessments would bemore widely used by planners and developers and would thus become part of decision processeswithin the design phase.
Author Contributions: S.S. contributed mainly to the Conceptualization, Analysis, Methodology, Writing andProject Management; D.Ö. contributed mainly to the Analysis, Validation and Writing.
Funding: This research was funded within the project Multi-Active Façade (MAFa), under the framework“Building of Tomorrow” by the Austrian Research Promotion Agency (FFG) with the project number 840645.
Acknowledgments: Supported by the University of Natural Resources and Life Sciences, Vienna Open AccessPublishing Fund.
Conflicts of Interest: The authors declare no conflict of interest.
References
1. European Commission. Towards Reaching the 20% Energy Efficiency Target for 2020 and Beyond; EuropeanCommission Press Release. 2017. Available online: http://europa.eu/rapid/press-release_MEMO-17-162_en.htm (accessed on 5 May 2019).
2. European Commission. Policies, Information and Services, Energy/Topics/Buildings/EnergyEfficiency/Buildings. Available online: https://ec.europa.eu/energy/en/topics/energy-efficiency/buildings(accessed on 5 May 2019).

Sustainability 2019, 11, 4487 20 of 22
3. Oberhuber, A.; Denk, D. Zahlen, Daten, Fakten zu Wohnungspolitik und Wohnungswirtschaft in ÖsterreichEndbericht; Forschungsgesellschaft für Wohnen, Bauen und Planen: Vienna, Austria, 2014.
4. Federal Ministry Republic of Austria, Agriculture, Forestry, Environment and Water Management. Anpassungder Klimastrategie Österreichs zur Erreichung des Kyoto-Ziels, 2008–2012; Bundesministerium für Land-undForstwirtschaft, Umwelt und Wasserwirtschaft: Vienna, Austria, 2007.
5. Federal Ministry Republic of Austria. Sustainability and Tourism, Transport, Innovation and Technology,Mission 2030 Austrian Climate and Energy Strategy. 2018. Available online: https://mission2030.info/wp-content/uploads/2018/10/Klima-Energiestrategie_en.pdf (accessed on 5 May 2019).
6. European Commission. A Roadmap for Moving to a Competitive Low Carbon Economy in 2050; EuropeanCommission: Brussels, Belgium, 2011.
7. European Union. Directive 2012/27/EU of the European Parliament and of the Council of 25 October 2012 on energyefficiency; European Union: Brussels, Belgium, 2012.
8. European Union. Directive 2009/28/EC of the European Parliament and of the Council of 23 April 2009 on thepromotion of the use of energy from renewable sources; European Union: Brussels, Belgium, 2009.
9. European Union. Directive 2002/91/EU of the European Parliament and of the Council of 16 December 2002 on theenergy performance of buildings; European Union: Brussels, Belgium, 2003.
10. European Union. Directive (EU) 2018/844 of the European Parliament and of the Council of 30 May 2018 amendingDirective 2010/31/EU on the energy performance of buildings Directive 2012/27/EU on energy efficiency; EuropeanUnion: Brussels, Belgium, 2018.
11. OIB Austrian Institute of Construction Engineering. OIB Guideline 6, Energy Saving and Heat Insulation;OIB-330.6-026/19; Austrian Institute of Construction Engineering: Vienna, Austria, 2019.
12. Leadership in Energy and Environmental Design (LEED). Available online: www.usgbc.org/leed (accessedon 5 May 2019).
13. Building Research Establishment Environmental Assessment Method (BRE). Available online: www.breeam.com (accessed on 5 May 2019).
14. German Sustainable Building Council (DGNB). Available online: https://www.dgnb.de/en/ (accessed on 9June 2019).
15. Österreichische Gesellschaft für Nachhaltige Immobilienwirtschaft (ÖGNI). Available online: http://www.ogni.at (accessed on 5 May 2019).
16. Austrian Sustainable Building Council (ASBC)—(ÖGNB). Available online: https://www.oegnb.net/en/oegnb.htm (accessed on 9 June 2019).
17. Pavel, C.C.; Blagoeva, D.T. Competitive Landscape of the EU’s Insulation Materials Industry for Energy-EfficientBuildings; JRC Technical Reports; European Commission: Brussels, Belgium, 2018. [CrossRef]
18. Baubook GmbH Eco2Soft Tool. Available online: https://www.baubook.info/eco2soft/ (accessed on4 May 2019).
19. Doroudiani, S.; Omidian, H. Environmental, health and safety concerns of decorative mouldings made ofexpanded polystyrene in buildings. Build. Environ. 2010, 45, 647–654. [CrossRef]
20. International Organisation for Standardisation. ISO 14025:2006, Environmental Labels and Declarations—TypeIII Environmental Declarations—Principles and Procedures; International Organisation for Standardisation:Geneva, Switzerland, 2006.
21. Carabano, R.; Hernando, S.M.; Ruiz, D.; Bedoya, C. Life Cycle Assessment (LCA) of building materials forthe evaluation of building sustainability: The case of thermal insulation materials. Rev. Constr. 2017, 16,22–32. [CrossRef]
22. Herrmann, I.T.; Moltesen, A. Does it matter which Life Cycle Assessment (LCA) tool you choose?—Acomparative assessment of SimaPro and GaBi. J. Clean. Prod. 2015, 86, 163–169. [CrossRef]
23. Papadopoulos, A.M.; Giama, E. Environmental performance evaluation of thermal insulation materials andits impact on the building. Build. Environ. 2007, 42, 2178–2187. [CrossRef]
24. Hill, C.; Norton, A.; Dibdiakova, J. A comparison of the environmental impacts of different categories ofinsulation materials. Energy Build. 2018, 162, 12–20. [CrossRef]
25. Aditya, L.; Mahlia, T.M.I.; Rismanchi, B.; Ng, H.M.; Hasan, M.H.; Metselaar, H.S.C.; Muraza, O.; Aditiya, H.B.A review on insulation materials for energy conservation in buildings. Renew. Sustain. Energy Rev. 2017, 73,1352–1365. [CrossRef]

Sustainability 2019, 11, 4487 21 of 22
26. Audenaert, A.; De Cleyn, S.H.; Buyle, M. LCA of low-energy flats using the Eco-indicator 99 method: Impactof insulation materials. Energy Build. 2012, 47, 68–73. [CrossRef]
27. Meex, E.; Hollberg, A.; Knapen, E.; Hildebrand, L.; Verbeeck, G. Requirements for applying LCA-basedenvironmental impact assessment tools in the early stages of building design. Build. Environ. 2018, 133,228–236. [CrossRef]
28. Mitterpach, J.; Hroncová, E.; Ladomerský, J.; Štefko, J. Quantification of Improvement in EnvironmentalQuality for Old Residential Buildings Using Life Cycle Assessment. Sustainability 2016, 8, 1303. [CrossRef]
29. Fernandes, C.; de Brito, J.; Cruz, C.O. Architectural integration of ETICS in building rehabilitation. J. Build.Eng. 2016, 5, 178–184. [CrossRef]
30. Vogdt, F.U.; Schafers, M. Sustainability of exterior walls with ETICS. Mauerwerk 2013, 17, 379–384. [CrossRef]31. Tazikova, A.; Strukova, Z. An Assessment and Comparative Study of Modern Thermal Insulation Systems.
TEM J. Technol. Educ. Manag. Inform. 2018, 7, 769–774. [CrossRef]32. Sierra-Perez, J.; Boschmonart-Rives, J.; Gabarrell, X. Environmental assessment of facade-building systems
and thermal insulation materials for different climatic conditions. J. Clean. Prod. 2016, 113, 102–113.[CrossRef]
33. Yilmaz, E.; Arslan, H.; Bideci, A. Environmental performance analysis of insulated composite facade panelsusing life cycle assessment (LCA). Constr. Build. Mater. 2019, 202, 806–813. [CrossRef]
34. Marques, C.; de Brito, J.; Silva, A. Application of the factor method to the service life prediction of ETIC. Int.J. Strateg. Prop. Manag. 2018, 22, 204–222. [CrossRef]
35. Ximenes, S.; de Brito, J.; Gaspar, P.L.; Silva, A. Modelling the degradation and service life of ETICS in externalwalls. Mater. Struct. 2015, 48, 2235–2249. [CrossRef]
36. Sulakatko, V.; Lill, I. The economic relevant of on-site construction activities with the external thermalinsulation composite system (ETICs). Int. J. Strateg. Prop. Manag. 2019, 23, 213–226. [CrossRef]
37. Belussi, L.; Mariotto, M.; Meroni, I.; Zevi, C.; Svaldi, S.D. LCA study and testing of a photovoltaic ceramictile prototype. Renew. Energy 2015, 74, 263–270. [CrossRef]
38. Pargana, N.; Pinheiro, M.D.; Silvestre, J.D.; de Brito, J. Comparative environmental life cycle assessment ofthermal insulation materials of buildings. Energy Build. 2014, 82, 466–481. [CrossRef]
39. Rodrigues, C.; Freire, F. Environmental impact trade-offs in building envelope retrofit strategies. Int. J. LifeCycle Assess. 2017, 22, 557–570. [CrossRef]
40. Mandilaras, I.; Atsonios, I.; Zannis, G.; Founti, M. Thermal performance of a building envelope incorporatingETICS with vacuum insulation panels and EPS. Energy Build. 2014, 85, 654–665. [CrossRef]
41. Pittau, F.; Krause, F.; Lumia, G.; Habert, G. Fast-growing bio-based materials as an opportunity for storingcarbon in exterior walls. Building Environ. 2018, 129, 117–129. [CrossRef]
42. Mazor, M.H.; Mutton, J.D.; Russell, D.A.M.; Keoleian, G.A. Life Cycle Greenhouse Gas Emissions ReductionFrom Rigid Thermal Insulation Use in Buildings. J. Ind. Ecol. 2011, 15, 284–299. [CrossRef]
43. Tingley, D.D.; Hathway, A.; Davison, B. An environmental impact comparison of external wall insulationtypes. Build. Environ. 2015, 85, 182–189. [CrossRef]
44. IBO; Austrian Institute of Construction Engineering. Oekoindex OI3. Available online: https://www.ibo.at/materialoekologie/lebenszyklusanalysen/oekoindex-oi3/ (accessed on 8 July 2019).
45. IBO; Austrian Institute of Construction Engineering. Leitfaden zur Berechnung des Oekoindex OI3 fürBauteile und Gebäude. 2018. Available online: https://www.ibo.at/fileadmin/ibo/materialoekologie/OI3_Berechnungsleitfaden_V4.0_20181025.pdf (accessed on 9 June 2019).
46. Bau-EPD Building Materials with Transparency. Available online: http://www.bau-epd.at/en/building-materials-with-transparency/ (accessed on 4 May 2019).
47. Ecoinvent—The World’s Most Consistent & Transparent Life Cycle Inventory Database. Available online:https://www.ecoinvent.org/ (accessed on 4 May 2019).
48. IBO; Austrian Institute of Construction Engineering. Materialökologie. Available online: https://www.ibo.at/materialoekologie/lebenszyklusanalysen/oekoindex-oi3/ (accessed on 4 May 2019).
49. ArchiPHYSIK. Available online: https://www.archiphysik.at/ (accessed on 4 May 2019).50. Passive House Planning Package—PHPP. Available online: https://passivehouse.com/04_phpp/04_phpp.htm
(accessed on 4 May 2019).

Sustainability 2019, 11, 4487 22 of 22
51. Sasdi, M.M. Energetisches Einsparungspotential durch den Einsatz Passive und Aktiver Solarelemente amBeispiel des Sozialen Wohnbaus der Stadt Wien. Master’s Thesis, University of Natural Resources and LifeSciences, Austria, Vienna, 2019.
52. Google Maps. Available online: https://www.google.at/maps (accessed on 5 May 2019).53. Fraunhofer Institute for Solar Energy Systems ISE. Available online: https://www.ise.fraunhofer.de/en.html
(accessed on 11 May 2019).54. FH Technikum Wien—University of Applied Sciences. Available online: https://www.technikum-wien.at/en/
(accessed on 6 July 2019).55. GAP Solution. Gap Fassaden—Technische Unterlagen. 2017. Available online: http:
//www.gap-solutions.at/fileadmin/user_upload/Downloadarea/Technische_Unterlagen_Public/gap_skin/Broschuere_gap_skin_160727.pdf (accessed on 6 July 2019).
56. Statistik Austria. Available online: https://www.statistik.at/web_de/statistiken/menschen_und_gesellschaft/wohnen/wohnungs_und_gebaeudebestand/Gebaeude/index.html (accessed on 6 June 2019).
57. Feist, W.; Baffia, E.; Schnieders, J.; Pfluger, R. Passivhaus Projektierungs Paket 2002, Anforderungenan Qualitätsgeprüfte Passivhäuser, Passivhaus Institut, Darmstadt. 2002. Available online: https://energiemanagement.stadt-frankfurt.de/Service/Rechenprogramme/PHPP/Handbuch-PHVP.pdf (accessedon 6 July 2019).
58. Mirabella, N.; Rock, M.; Saade, M.R.M.; Spirinckx, C.; Bosmans, M.; Allacker, K.; Passer, A. Strategies toImprove the Energy Performance of Buildings: A Review of Their Life Cycle Impact. Buildings 2018, 8, 18.[CrossRef]
© 2019 by the authors. Licensee MDPI, Basel, Switzerland. This article is an open accessarticle distributed under the terms and conditions of the Creative Commons Attribution(CC BY) license (http://creativecommons.org/licenses/by/4.0/).