Assessment of runoff response to landscape changes in the San Pedro subbasin (Nayarit, Mexico) using...
13
PLEASE SCROLL DOWN FOR ARTICLE This article was downloaded by: [Ruiz-Luna, Arturo] On: 9 September 2008 Access details: Access Details: [subscription number 902342466] Publisher Taylor & Francis Informa Ltd Registered in England and Wales Registered Number: 1072954 Registered office: Mortimer House, 37-41 Mortimer Street, London W1T 3JH, UK Journal of Environmental Science and Health, Part A Publication details, including instructions for authors and subscription information: http://www.informaworld.com/smpp/title~content=t713597268 Assessment of runoff response to landscape changes in the San Pedro subbasin (Nayarit, Mexico) using remote sensing data and GIS Rafael Hernández-Guzmán a ; Arturo Ruiz-Luna a ; César Alejandro Berlanga-Robles a a Centro de Investigación en Alimentación y Desarrollo A.C., Lab. Manejo Ambiental, Mazatlán, Sin., México Online Publication Date: 01 October 2008 To cite this Article Hernández-Guzmán, Rafael, Ruiz-Luna, Arturo and Berlanga-Robles, César Alejandro(2008)'Assessment of runoff response to landscape changes in the San Pedro subbasin (Nayarit, Mexico) using remote sensing data and GIS',Journal of Environmental Science and Health, Part A,43:12,1471 — 1482 To link to this Article: DOI: 10.1080/10934520802253465 URL: http://dx.doi.org/10.1080/10934520802253465 Full terms and conditions of use: http://www.informaworld.com/terms-and-conditions-of-access.pdf This article may be used for research, teaching and private study purposes. Any substantial or systematic reproduction, re-distribution, re-selling, loan or sub-licensing, systematic supply or distribution in any form to anyone is expressly forbidden. The publisher does not give any warranty express or implied or make any representation that the contents will be complete or accurate or up to date. The accuracy of any instructions, formulae and drug doses should be independently verified with primary sources. The publisher shall not be liable for any loss, actions, claims, proceedings, demand or costs or damages whatsoever or howsoever caused arising directly or indirectly in connection with or arising out of the use of this material.
Transcript of Assessment of runoff response to landscape changes in the San Pedro subbasin (Nayarit, Mexico) using...

PLEASE SCROLL DOWN FOR ARTICLE
This article was downloaded by: [Ruiz-Luna, Arturo]On: 9 September 2008Access details: Access Details: [subscription number 902342466]Publisher Taylor & FrancisInforma Ltd Registered in England and Wales Registered Number: 1072954 Registered office: Mortimer House,37-41 Mortimer Street, London W1T 3JH, UK
Journal of Environmental Science and Health, Part APublication details, including instructions for authors and subscription information:http://www.informaworld.com/smpp/title~content=t713597268
Assessment of runoff response to landscape changes in the San Pedrosubbasin (Nayarit, Mexico) using remote sensing data and GISRafael Hernández-Guzmán a; Arturo Ruiz-Luna a; César Alejandro Berlanga-Robles a
a Centro de Investigación en Alimentación y Desarrollo A.C., Lab. Manejo Ambiental, Mazatlán, Sin., México
Online Publication Date: 01 October 2008
To cite this Article Hernández-Guzmán, Rafael, Ruiz-Luna, Arturo and Berlanga-Robles, César Alejandro(2008)'Assessment of runoffresponse to landscape changes in the San Pedro subbasin (Nayarit, Mexico) using remote sensing data and GIS',Journal ofEnvironmental Science and Health, Part A,43:12,1471 — 1482
To link to this Article: DOI: 10.1080/10934520802253465
URL: http://dx.doi.org/10.1080/10934520802253465
Full terms and conditions of use: http://www.informaworld.com/terms-and-conditions-of-access.pdf
This article may be used for research, teaching and private study purposes. Any substantial orsystematic reproduction, re-distribution, re-selling, loan or sub-licensing, systematic supply ordistribution in any form to anyone is expressly forbidden.
The publisher does not give any warranty express or implied or make any representation that the contentswill be complete or accurate or up to date. The accuracy of any instructions, formulae and drug dosesshould be independently verified with primary sources. The publisher shall not be liable for any loss,actions, claims, proceedings, demand or costs or damages whatsoever or howsoever caused arising directlyor indirectly in connection with or arising out of the use of this material.

Journal of Environmental Science and Health Part A (2008) 43, 1471–1482Copyright C© Taylor & Francis Group, LLCISSN: 1093-4529 (Print); 1532-4117 (Online)DOI: 10.1080/10934520802253465
Assessment of runoff response to landscape changes in theSan Pedro subbasin (Nayarit, Mexico) using remote sensingdata and GIS
RAFAEL HERNANDEZ-GUZMAN, ARTURO RUIZ-LUNA and CESAR ALEJANDROBERLANGA-ROBLES
Centro de Investigacion en Alimentacion y Desarrollo A.C., Lab. Manejo Ambiental, Mazatlan, Sin., Mexico
Results on runoff estimates as a response to land-use and land-cover changes are presented. We used remote sensing and GIS techniqueswith rainfall time-series data, spatial ancillary information, and the curve-number method (NRCS-CN) to assess the runoff responsein the San Pedro subbasin. Thematic maps with eight land-cover classes derived from satellite imagery classification (1973, 1990,and 2000) and hydrologic soil-group maps were used as the input for the runoff calculation. About 20% to 25% of the subbasinlandscape has changed since 1973, mainly as consequence of the growth of agriculture. Forest is the main cover, although furtheranalyses indicate that forest is degrading from good to poor conditions when evaluated as a function of the spectral response. Soilswith low infiltration rates, classified as the hydrological soil-group “C”, were dominant in the area (52%). The overlaying of all thehydrological soil groups with the land-use map produced a total of 43 hydro-group and land-use categories for which runoff wascalculated using the curve-number method. Estimates of total runoff volumes (26 × 106 m3) were similar for the three dates analyzedin spite of landscape changes, but there were temporal variations among the hydro-group and land-use categories as a consequence.Changes are causing the rise of covers with high runoff potential and the increase of runoff depth is expected, but it can be reversedby different management of subbasin hydro-groups and land-use units.
Keywords: Curve number, runoff, land-use changes, watershed.
Introduction
Most of the natural resources distributed along a specificarea are able to be classified, mapped, and analyzed overtheir temporal trends of use and distribution. Once thisknowledge about the natural resources is achieved, it can beintegrated by the users for a better understanding of the roleof the resources and their relationships to the environmentand for purposes of inventory and management.
However, this comprehensive vision is not always possi-ble when large and complex systems, such as watersheds,are involved because large environments are not always to-tally accessible and include a large diversity of land use,soil treatments, and hydrologic conditions.[1] To improvethe management of natural resources, plans must be made
Address correspondence to Arturo Ruiz-Luna, Centro de Inves-tigacion en Alimentacion y Desarrollo. Lab. Manejo Ambiental,P.O. Box 711, Mazatlan, Sin., 82010, Mexico; E-mail: [email protected] or [email protected] September 26, 2007.
considering processes that occur over a large scale, such asdistribution gradients, migrations, connectivity, and localand regional ecological processes, most of them determinedby the climate and the availability of water resources. Be-cause of this, basins or subbasins are adequate levels forstudy and management purposes. They will require largeamounts of data but they can be integrated using remotesensing and GIS techniques that facilitate the analysis ofthe information no matter the extent of the watershed.
It is then possible to relate, in some logical and systematicway, spatial information on the location and distributionof hydrologic resources with qualitative and quantitativedescriptors of their condition, together with condition in-dicators of the associated landscape. Such an approach of-fers an integrated approximation, including different spatialand temporal scales, allowing for the advance of analyticaltechniques useful for resource management.
The most significant impacts on hydrologic systems havebeen caused by land-use changes derived from human activ-ities. Land conversion to agriculture, industrial, or residen-tial uses significantly alters the hydrologic characteristics ofthe land surface and modifies patterns and rates of water
Downloaded By: [Ruiz-Luna, Arturo] At: 08:55 9 September 2008
1472 Hernandez-Guzman et al.
flow by determining the characteristics of runoff processesand altering the infiltration, erosion, and evapotranspira-tion rates.[2] Currently most of the hydrological studies seemto address their efforts to quantify the effect of land-coverchanges on the dynamics of runoff in a basin.[3] This is theapproach we followed.
Contemporary methodologies to determine runoff areideally based on long time-series data of water flow rates.[4]
However, when these records are unavailable or deficient fora specific watershed, as with the Rio San Pedro subbasin, itis necessary to estimate flow and runoff using indirect meth-ods such as the runoff curve-number model (CN) devel-oped by the U.S. Natural Resources Conservation Service(NRCS) in 1956, which is based on recognition of the mea-surable characteristics of the basin such as slope, soil type,and land cover.[5] This model is attractive as it is easily usedand comprehensible because the main input characteristicsare defined in terms of land use and soil type.[6] In manycases, land cover maps are substituted by thematic mapsderived from satellite imagery analysis, especially those the-matic maps from Landsat sensors, which include the oldestand largest time-series of satellite data and which allow theassessment of runoff changes in a watershed based on theevaluation of land-use and land-cover changes.[7]
To contribute technical elements for the protection andmanagement of a semideveloped basin, which embracespart of Marismas Nacionales, the largest mangrove areaon the Pacific coast, but that also supports growing pop-ulations, our study is aimed to evaluate runoff variationsin the Rio San Pedro subbasin as consequence of land-usechanges. Because the data recording for some regions inMexico has been developed unevenly, this study takes ad-vantage of the existing satellite data and the strength of GIStools developed for watershed analysis, but mainly it usesthe runoff-CN method to achieve the assessment of runoffresponse as a function of the landscape-pattern changes.
Materials and methods
Study area
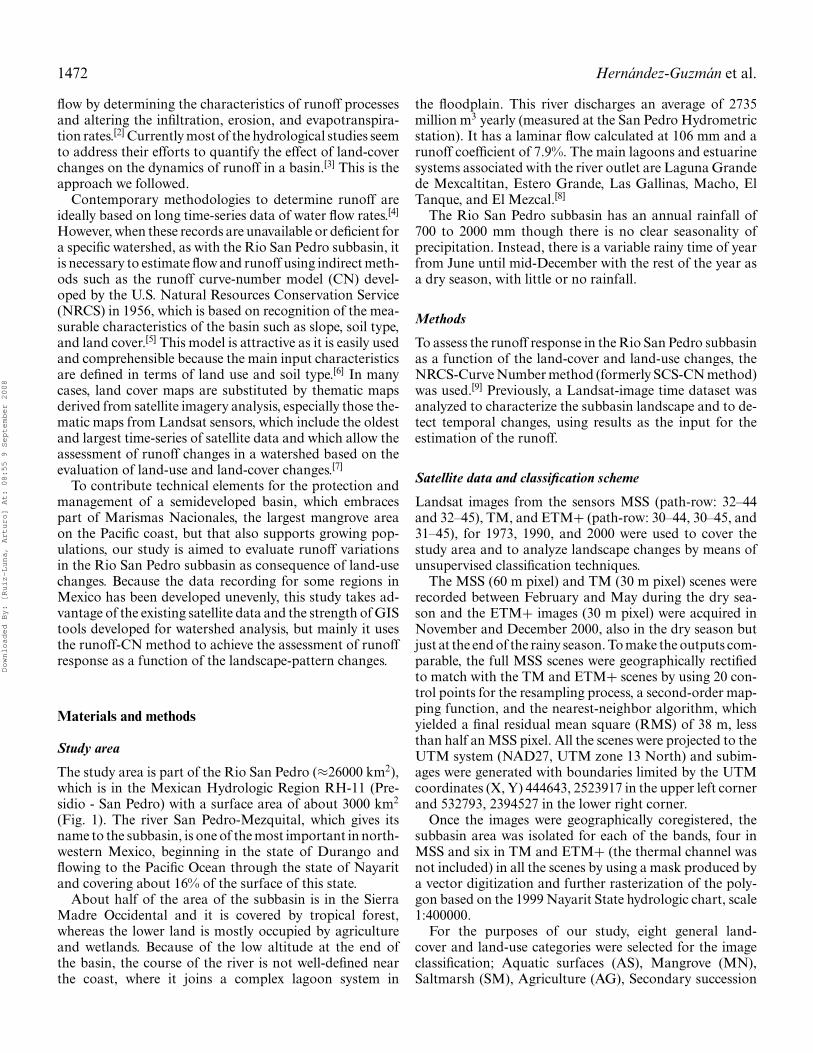
The study area is part of the Rio San Pedro (≈26000 km2),which is in the Mexican Hydrologic Region RH-11 (Pre-sidio - San Pedro) with a surface area of about 3000 km2
(Fig. 1). The river San Pedro-Mezquital, which gives itsname to the subbasin, is one of the most important in north-western Mexico, beginning in the state of Durango andflowing to the Pacific Ocean through the state of Nayaritand covering about 16% of the surface of this state.
About half of the area of the subbasin is in the SierraMadre Occidental and it is covered by tropical forest,whereas the lower land is mostly occupied by agricultureand wetlands. Because of the low altitude at the end ofthe basin, the course of the river is not well-defined nearthe coast, where it joins a complex lagoon system in
the floodplain. This river discharges an average of 2735million m3 yearly (measured at the San Pedro Hydrometricstation). It has a laminar flow calculated at 106 mm and arunoff coefficient of 7.9%. The main lagoons and estuarinesystems associated with the river outlet are Laguna Grandede Mexcaltitan, Estero Grande, Las Gallinas, Macho, ElTanque, and El Mezcal.[8]
The Rio San Pedro subbasin has an annual rainfall of700 to 2000 mm though there is no clear seasonality ofprecipitation. Instead, there is a variable rainy time of yearfrom June until mid-December with the rest of the year asa dry season, with little or no rainfall.
Methods
To assess the runoff response in the Rio San Pedro subbasinas a function of the land-cover and land-use changes, theNRCS-Curve Number method (formerly SCS-CN method)was used.[9] Previously, a Landsat-image time dataset wasanalyzed to characterize the subbasin landscape and to de-tect temporal changes, using results as the input for theestimation of the runoff.
Satellite data and classification scheme
Landsat images from the sensors MSS (path-row: 32–44and 32–45), TM, and ETM+ (path-row: 30–44, 30–45, and31–45), for 1973, 1990, and 2000 were used to cover thestudy area and to analyze landscape changes by means ofunsupervised classification techniques.
The MSS (60 m pixel) and TM (30 m pixel) scenes wererecorded between February and May during the dry sea-son and the ETM+ images (30 m pixel) were acquired inNovember and December 2000, also in the dry season butjust at the end of the rainy season. To make the outputs com-parable, the full MSS scenes were geographically rectifiedto match with the TM and ETM+ scenes by using 20 con-trol points for the resampling process, a second-order map-ping function, and the nearest-neighbor algorithm, whichyielded a final residual mean square (RMS) of 38 m, lessthan half an MSS pixel. All the scenes were projected to theUTM system (NAD27, UTM zone 13 North) and subim-ages were generated with boundaries limited by the UTMcoordinates (X, Y) 444643, 2523917 in the upper left cornerand 532793, 2394527 in the lower right corner.
Once the images were geographically coregistered, thesubbasin area was isolated for each of the bands, four inMSS and six in TM and ETM+ (the thermal channel wasnot included) in all the scenes by using a mask produced bya vector digitization and further rasterization of the poly-gon based on the 1999 Nayarit State hydrologic chart, scale1:400000.
For the purposes of our study, eight general land-cover and land-use categories were selected for the imageclassification; Aquatic surfaces (AS), Mangrove (MN),Saltmarsh (SM), Agriculture (AG), Secondary succession
Downloaded By: [Ruiz-Luna, Arturo] At: 08:55 9 September 2008
Runoff response to landscape changes in Mexico 1473
Fig. 1. Study area. Limits of the Rio San Pedro subbasin in Nayarit State (grey polygon), Mexico and location of 11 hydrologicstations.
(SS), Forest (FO), Exposed soils (ES), and Villages (VI).The last class was digitized on-screen from false color com-positions (RGB 432) for the TM (1990) and ETM+ (2000)scenes and using a topographic chart (1:50000) for 1973. Af-ter digitization, the town vectors were rasterized and addedto the final classification outputs.
Every one of the images included in the analysis was inde-pendently classified using unsupervised methods based ona histogram-peak technique (Eastman) [10] that classifiedall the pixels yielding 20 to 65 spectral classes. These classeswere then reclassified into the informational classes, exceptfor villages that were previously digitized. The three ETM+scenes for 2000 were formerly classified independently by
separate subscenes (Nov. and Dec. 2000) because recentfield data were available for the accuracy assessment andvalidation of the image classifications. To assess accuracy,an error matrix was completed using field data recordedin the study area with the aid of a GPS as reference data(columns) and the corresponding data from the classifica-tion output (rows).
Assuming that the spectral characteristics of theaquatic-surface class (negatively correlated with wave-length) and digitization of villages do not allow confusionwith other classes, they were excluded from the accuracyassessment. The output classification was accepted untilaccuracy reached at least 80%. After this, the scenes were
Downloaded By: [Ruiz-Luna, Arturo] At: 08:55 9 September 2008

1474 Hernandez-Guzman et al.
concatenated to produce a unique output map and the finalaccuracy was then estimated. From the error matrix, theglobal accuracy and estimators of the Kappa coefficient(K) were evaluated as general indicators of the classificationaccuracy, but also the User and Producer accuracy werederived from this numeric arrangement.[11] Validationsfor the 1973 and 1990 classifications were not achievedbecause field or ancillary data were not accessible for 1973and only a soil-use map (1:250000) was available for 1990.
To improve the analysis based on changes of the landcover, the Agriculture and Forest categories were reclassi-fied into three subclasses each, reflecting the vegetal condi-tion based in the spectral response. An unsupervised classi-fication on the original bands, masked with the area coveredby the agriculture and forest classes was made. All the agri-culture and forest pixels were allocated into three clustereach and their spectral signature was used to assign thecondition categories. Because the visible red is absorbedby chlorophyll and the near infrared is strongly reflectedby vegetal-wall structure, the response from both channelsare good indicators of vegetal condition. The relationshipbetween both spectral bands is frequently used to producevegetation indices such as NDVI, but here we use the wholeset of bands to define Good, Fair, and Poor condition sub-classes.
After the last classification process, the output maps from1990 and 2000 were geometrically adjusted to the same reso-lution of the MSS images (60 m) to make the multitemporal,postclassificatory analysis using a cross-tabulation methodevaluating changes in land use and land cover among threeperiods; 1973–1990, 1990–2000, and 1973–2000. This post-classification analysis, which has been used for detectionof landscape changes in the coastal zone of northwesternMexico,[12−14] allows for the calculation for all the logi-cal combinations among the same class number found intwo different maps and the output of a numeric arrange-ment similar to the error matrix, where the main diago-nal values represent pixels that remain unchanged betweenboth dates.[15,16] Further evaluations of the total change canbe achieved by evaluating the Kappa Index of Agreement(KIA) whose values range from -1.0 (total change) to 1.0(no change) and can be also calculated by class.[11,15]
Runoff estimation
The runoff calculation with the NRCS-CN (SCS-CN)method mainly depends on rainfall, hydrologic soil groups,and the land cover characteristics of the area. Thus a mapbased on the state of Nayarit Soil chart (1:400000) producedby the National Institute of Geography, Informatics, andStatistics in 1999 was digitized using the soil-classificationcriteria defined by the ISSS, ISRIC, and FAO.[17] The re-sulting map was later reclassified into the four HydrologicalSoil Groups (HSG) using the curve-number method.[9] Thethematic maps were exported to the vectorial format of Ar-
cMap and new polygons were created by the intersection ofthe land-use and the HSG layers.
Depending on the combination of attributes, a CNvalue was defined for each polygon and the outputswere processed with the tool ArcCN-Runoff developedby Zhan and Huang[18] to estimate runoff depth (Q).This approach, the same as the Long -Term HydrologicImpact Assessment (L-THIA) from Purdue University(www.ecn.purdue.edu/runoff/documentation/doc index.html) assigns a CN value of 0 for wetlands and water. Thisvalue was also used in our study for those systems eventhough some authors give them a value of 100. In general,this procedure preserves details of the spatial variation andis more exact in the determination of the curve numberthan direct calculation with data in raster format.[18]
The rainfall data for this study were provided by the Mex-ican National Meteorological Service (SMN) for 11 hydro-logic stations distributed in or close to the limits of the SanPedro subbasin. The rainfall time-series data cover 55 yearsand all precipitation events those ≥1.0 inch were selectedfor the study. From this database, a typical storm was esti-mated for 1973, 1990, and 2000 by basing each on a prece-dent period of 10-year rainfall data. Using these inputs, theevaluation was run for each data set considering just oneprecipitation event, and variations in the runoff responsewere assessed by direct comparison.
Results and discussion
For the characterization of the subbasin landscape, the fi-nal output classification for the year-2000 images was val-idated using 192 control points randomly selected fromthe database available for the area. Excluding the Aquatic-surfaces and Villages classes, the global accuracy assess-ment yielded a total of 82% because 158 of the referencedata points coincided with the classification (Table 1). Withthe same matrix data, an estimated Kappa (K) of 0.79 with aconfidence interval from 0.72 to 0.85 (CI95%) was obtained.This result represents a good agreement between the clas-sification and the reference data, which is from substantialto almost perfect strength agreement[19] and giving a clas-sification better than one produced by chance (Ztest = 23.6> 1.96). Because there are not enough ancillary data to as-sess the accuracy for the 1973 and 1990 classifications, weassumed an error level similar to that obtained for the 2000scene because the classification procedures and criteria werethe same.
Individually, the classes with the highest values for pro-ducer accuracy (PA) were mangrove, saltmarsh, and for-est with 90% each, whereas Exposed soils had the lowestvalue, < 70% (Table 1). By contrast, the user accuracy valueobtained by Exposed Soils was the highest (100%) and thesecondary succession had the lowest user-accuracy value.
Most of the error occurred among interrelated classesas with agriculture, secondary succession, and exposed
Downloaded By: [Ruiz-Luna, Arturo] At: 08:55 9 September 2008

Runoff response to landscape changes in Mexico 1475
Table 1. Accuracy assessment for an unsupervised classification ofa 2000 Landsat ETM+ scene of Rio San Pedro subbasin, Nayarit,Mexico.
Reference data
Classified data MN SM AG SS FO ES Row totals UA
Mangrove (MN) 38 1 0 0 1 0 40 95Saltmarsh (SM) 4 18 0 0 0 0 22 82Agriculture (AG) 0 0 23 2 0 3 28 82Secondary 0 1 6 23 3 4 37 62
succession (SS)Forest (FO) 0 0 1 5 36 3 45 80Exposed soil (ES) 0 0 0 0 0 20 20 100Column totals 42 20 30 30 40 30 192PA 90 90 77 77 90 67
Overall accuracy = 82%; Kappa = 0.79. UA: User accuracy. PA: Produceraccuracy.
soils or among neighboring classes as with mangrove andsaltmarsh. Differences in crop-cultivation stages, densities,and conditions allow confusion among classes, mostly withsecondary succession and exposed soils, but even pheno-logical differences cause errors, as was found especially insome areas covered by deciduous forest together with grass,whose spectral characteristics caused confusion with ex-posed soils.
The extent for each class was estimated for all three datesobtaining a slight variation (around 200 ha) in the totalsum for the three scenes, mainly caused by the geometric-rectification process to match pixel size in all the scenes(Table 2).
In general, the study area is mostly characterized by thepresence of the Forest class that was about two thirds of thetotal area in 1973 and 2000, mainly distributed in the middleand north of the area and related to higher altitudes andirregular topography (Fig. 2). The second largest class wasagriculture that roughly was about 10% of the study area.However, the extent of this cover is variable because most ofthe activity depends on the intensity and length of the rainyseason and is in association with the secondary succession
and exposed-soils areas, most of them a consequence of theagriculture development in the region. Together, the threeclasses are about 25% of the area. There is an unreliablegrowth of exposed soils in the higher land and a reductionof the forest class in the 1990 classification, which probablyis a result of a dry season that affected the canopy closureand not as a consequence of deforestation because there isa recovery for the 2000 image classification.
Deciduous and semideciduous forest and grasslands,both natural and manmade, can be totally exposed dur-ing the dry season in the area, particularly in periods ofextreme drought. This will cause misclassification becauseof variations of their spectral response.[20,21] Though this er-ror is minimized using anniversary scenes, the interannualvariations in precipitation could produce phenological dif-ferences in the natural classes and cause an apparent coverloss. An inverse tendency is also displayed by the class salt-marsh, which increased its area in 1990 and decreased in2000. The remaining classes are about 10% of the total area,with the southern area close to the coastline dominated bymangrove and saltmarsh classes.
The change detection matrices allowed the interperiodcomparison. Based on the results (Table 3), it is clear thatthe main differences were produced when the 1990 thematicmap was contrasted with the 1973 and 2000 maps. Values forthe Kappa index of agreement infer that landscape changesare < 25% of the total area, even for the worse case (1973–1990). In any case, the natural covers were widespread andthey are dominant in the Rio San Pedro subbasin as a whole.
The landscape structure is not modified substantiallyfrom 1973 to 2000 because some of the main natural covers(forest, mangrove, saltmarsh) remain with little change intheir area. It is evident that agricultural-associated classesare growing in the middle region of the study area, a plainlocated between coastal systems and the mountains. Thegrowth of agriculture has been the main modifier of land-scape in other regions of northwestern Mexico.[12,13,22]
A significant environmental impact is expected fromthis and the changes observed caused by the decreaseof aquatic surfaces and an increase of the saltmarsh
Table 2. Estimated area for eight cover and land-use classes in Rio San Pedro subbasin, Nayarit, Mexico and temporal variations(1973–2000).
Area (ha) Variation (ha)
Cover type 1973 1990 2000 1973–1990 1990–2000 1973–2000
Aquatic surfaces 9900 4100 5700 −5800 1600 −4200Mangrove 10800 9700 11200 −1100 1500 400Saltmarsh 4100 8200 6200 4100 −2000 2100Agriculture 28100 39100 31800 11000 −7300 3700Sec. Succession 10500 14500 22100 4000 7600 11600Forest 187800 128600 190900 −59200 62300 3100Exposed soil 37900 84300 20500 46400 −63800 −17400Villages 1000 1400 1600 400 200 600
Numbers are rounded to the nearest hundred.
Downloaded By: [Ruiz-Luna, Arturo] At: 08:55 9 September 2008

1476 Hernandez-Guzman et al.
Fig. 2. Land-cover and land-use time-series for the Rio San Pedro subbasin from classification of Landsat MSS, TM, and ETM+imagery (1973, 1990, and 2000).
Downloaded By: [Ruiz-Luna, Arturo] At: 08:55 9 September 2008

Runoff response to landscape changes in Mexico 1477
Table 3. Change detection matrix (ha) and Kappa index to assess the landscape change among classified Landsat scenes of the RioSan Pedro subbasin (Nayarit, Mexico) arranged in sequential dates from 1973 to 2000.
Class AS MN SM AG SS FO ES VITotal(ha)
Total(%)
1973AS 2500 800 100 300 100 200 100 0 4100 1.4MN 1200 7400 500 100 400 100 0 0 9700 3.4
1990 SM 2400 1700 2800 400 700 100 0 0 8100 2.8AG 1500 200 400 19700 7300 7500 2300 100 39000 13.5SS 900 500 200 4600 1600 5100 1500 0 14400 5.0FO 400 0 0 400 100 115400 12100 0 128400 44.4ES 800 100 100 2300 300 58900 21700 0 84200 29.1VI 0 0 0 300 100 100 100 800 1400 0.5
Total (ha) 9700 10700 4100 28100 10600 187400 37800 900 289300Total (%) 3.4 3.7 1.4 9.7 3.7 64.8 13.1 0.3
1990AS 3000 400 700 500 400 400 300 0 5700 2.0MN 700 8500 1400 100 400 0 100 0 11200 3.9
2000 SM 100 400 4400 600 600 0 0 0 6100 2.1AG 100 0 100 26300 4300 100 800 0 31700 11.0SS 100 400 1500 9000 3400 300 7300 100 22100 7.6FO 100 0 0 2100 5200 119200 64100 0 190700 65.9ES 0 0 0 200 0 8500 11700 0 20400 7.1VI 0 0 0 200 100 0 100 1200 1600 0.6
Total (ha) 4100 9700 8100 39000 14400 128500 84400 1300 289500Total (%) 1.4 3.4 2.8 13.5 5.0 44.4 29.2 0.4
1973AS 3000 800 200 700 200 600 300 0 5800 2.0MN 1700 7800 800 200 500 100 0 0 11100 3.8
2000 SM 1700 1200 2000 600 600 100 0 0 6200 2.1AG 1300 100 100 17700 7100 4700 500 100 31600 10.9SS 1200 800 900 6500 1500 6900 4200 100 22100 7.6FO 800 100 0 1900 300 164100 23300 100 190600 65.9ES 100 0 0 100 0 10900 9300 0 20400 7.1VI 0 0 0 400 100 100 100 800 1500 0.5
Total (ha) 9800 10800 4000 28100 10300 187500 37700 1100 289300Total (%) 3.4 3.7 1.4 9.7 3.6 64.8 13.0 0.4
Kappa index of agreement (KIA) = 0.75.Figures are rounded to the nearest hundred.KIA = 0.77.KIA= 0.82. Aquatic surfaces (AS), Mangrove (MN), Saltmarsh (SM), Agriculture (AG), Secondary succession (SS), Forest (FO), Exposed soils(ES), and Villages (VI).
areas that are modifying the hydrological patterns in thefloodplain.
According to Alonso-Perez,[13] deforestation, the nat-ural and anthropogenic sedimentation of estuaries andlagoons, and other changes in hydrology have been themajor causes of loss and modification in wetlands, con-sequently modifying the biodiversity and production ofthe supported communities. These tendencies of changeof natural covers toward agricultural areas and humansettlements are frequently a result of regional economicdevelopment.[14]
After the reclassification of soil types present in the SanPedro subbasin, the dominant HSGs are C and A, which
occupied 52% and 19% of the total area. The HSG-C haslow infiltration rates when thoroughly wetted, whereas theHSG-A has low runoff potential and high infiltration rates.Approximately 20% of the subbasin area has a high runoffpotential, represented by the HSG-D.[9]
The HSGs and land-use layers were overlaid to producenew polygons belonging to 43 hydro-group and land-usecategories to which curve numbers were assigned automat-ically (Table 4). The spatial distribution of the higher CNvalues in the Rio San Pedro subbasin indicates that thenorthwest and north of the area have the highest runoffpotential. This has increased in recent times in the lowerlands in association with agricultural practices (Fig. 3). The
Downloaded By: [Ruiz-Luna, Arturo] At: 08:55 9 September 2008
1478 Hernandez-Guzman et al.
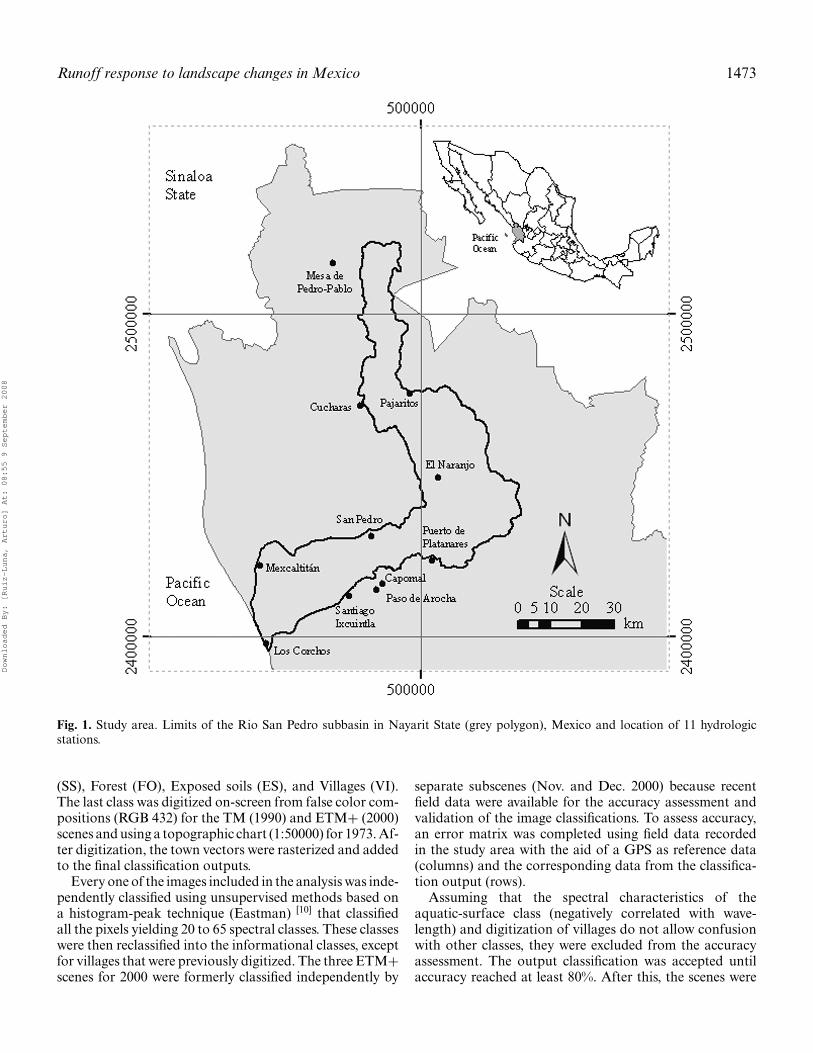
Table 4. Runoff volume (Q) values estimated for the Rio San Pedro sub-basin (Nayarit, Mexico) with the NRCS-CN method(Precipitation = 2.09 inches).
1973 1990 2000
Landuse HSG CN Area (ha) Q (m3) Area (ha) Q (m3) Area (ha) Q (m3)
Agricultural (Good) A 74 8100 802000 14000 1395000 17200 1712000Agricultural (Good) B 83 200 35000 400 60000 200 22000Agricultural (Good) C 88 900 213000 2700 705000 800 201000Agricultural (Good) D 90 1900 554000 2600 755000 1500 421000Agricultural (Poor) A 77 10400 1306000 8000 1000000 8800 1108000Agricultural (Poor) B 86 300 70000 200 33000 100 10000Agricultural (Poor) C 91 700 212000 900 269000 200 59000Agricultural (Poor) D 94 300 101000 200 54000 100 5000Agricultural (Fair) A 76 4900 569000 9500 1105000 3200 371000Agricultural (Fair) B 85 100 14000 400 66000 100 2000Agricultural (Fair) C 90 400 93000 700 197000 100 19000Agricultural (Fair) D 93 500 158000 100 21000 100 10000Water A 0 6300 0 1900 0 3000 0Water B 0 400 0 100 0 200 0Water C 0 1100 0 300 0 600 0Water D 0 2200 0 2000 0 2100 0Mangrove A 0 3900 0 2900 0 4100 0Mangrove D 0 6900 0 6900 0 7200 0Saltmarsh A 0 3600 0 7700 0 5800 0Saltmarsh D 0 600 0 600 0 400 0Residential (30%) A 57 700 7000 900 10000 1100 12000Residential (30%) B 72 100 3000 100 4000 100 5000Residential (30%) C 81 400 53000 500 68000 500 78000Exposed soil A 39 1100 0 2100 0 100 0Exposed soil B 61 2500 57000 7800 180000 900 20000Exposed soil C 74 29000 2886000 58600 5837000 15200 1514000Exposed soil D 80 5400 837000 16000 2506000 4400 687000Forest (Good) A 30 7200 0 800 0 100 0Forest (Good) B 55 10800 66000 8700 53000 3400 21000Forest (Good) C 70 48400 3380000 40000 2796000 4900 338000Forest (Good) D 77 16200 2035000 10700 1341000 1300 162000Forest (Poor) A 45 200 0 900 0 100 0Forest (Poor) B 66 9900 455000 7800 356000 6200 284000Forest (Poor) C 77 36800 4641000 25000 3150000 25900 3266000Forest (Poor) D 83 14000 2678000 9900 1904000 9000 1722000Forest (Fair) A 36 600 0 100 0 3300 0Forest (Fair) B 60 4100 80000 2900 57000 16300 318000Forest (Fair) C 73 33700 3082000 18200 1668000 95900 8794000Forest (Fair) D 79 6300 918000 4100 590000 25000 3653000Secondary succession A 35 9500 0 7700 0 9700 0Secondary succession B 56 100 1000 300 2000 1200 10000Secondary succession C 70 400 28000 4900 338000 7500 523000Secondary succession D 77 600 65000 1800 217000 3800 472000Total Runoff Volume 25399000 26737000 25819000
HSG: Hydrological soil group; CN: Curve number. Figures were rounded to the nearest hundred (Area) and to the nearest thousand (Q).
floodplain area close to the coastline embraces most of theaquatic surfaces and wetlands, corresponding to minimumpotential runoff areas. Besides wetlands and aquatic sur-faces, the minimum value was for forest in good conditions(CN = 30), whereas most of the agriculture classes had the
maximum values, up to 94. The average CN, not includingvalues lower than 30, was 71.
Distributing the CN values by intervals of 20, there wereno evident differences because the area of 61 to 80 CN(moderate to high runoff potential) was almost the same in
Downloaded By: [Ruiz-Luna, Arturo] At: 08:55 9 September 2008

Runoff response to landscape changes in Mexico 1479
Fig. 3. Spatial distribution of curve number (CN) values in the Rio San Pedro Subbasin. Runoff potential increases with CN value.
Downloaded By: [Ruiz-Luna, Arturo] At: 08:55 9 September 2008

1480 Hernandez-Guzman et al.
Fig. 4. Distribution of the Rio San Pedro subbasin area by CN intervals.
Fig. 5. Spatial distribution and temporal variation of runoff estimates in the Rio San Pedro subbasin.
Downloaded By: [Ruiz-Luna, Arturo] At: 08:55 9 September 2008

Runoff response to landscape changes in Mexico 1481
every year, about 75% of the total surface. The remainingintervals represent between 4% and 8% (Fig. 4).
From these results, runoff (Q) for each of the 43 hydro-group and land-use categories was estimated based on aprecipitation event P = 2.09 inches. This value is an aver-age of the estimates obtained for the 3 years, practically thesame. Considering that, a typical storm with a precipita-tion value (P) of 2.09 inches was used for all the calcula-tions. Results for the three years are also shown in Table 4,where it is possible to compare total and category runoffby date. The difference among total runoff outputs is notlarge, about 5% between extreme data, but there is an in-crease in the maximum runoff and the variability (standarddeviation) by category. A maximum runoff (Q) value of 8.8× 10⁶ m3 was estimated for 2000 and is associated with theC-Forest(fair) class. For the same year the highest values ofQ (> 1 × 10⁶ m3) were mainly related to forest (poor andfair conditions) and agriculture (good condition).
The analysis of runoff depth estimates for 1973 and 1990show similar conditions with different types of forest andagriculture and their HSGs as the main runoff producers.For 1973 the highest runoff (4.6 × 10⁶ m3) was producedby the complex C-Forest(poor), whereas in 1990 C-Exposedsoil was the category that contributed the highest runoff, es-timated at 5.8 × 10⁶ m3. Changes in the spatial distributionof the runoff contributions by date are in Figure 5.
Some of the detected land-use and land-cover changes,such as the reduction of aquatic surfaces and the increaseof mangrove or saltmarsh, if marginal, did not contributeto runoff volume because they have a CN value of 0. Theincrease in surface area of villages had no noticeable effecton runoff estimates because this class represents <1% of thetotal subbasin surface. Even though there is no remarkablereduction in the area of the forest class, it seems there is a lossof the condition of the vegetation. Because this was basedon the spectral response of the original forest class it wasreclassified into three subcategories (good, fair, and poor).There is a reduction of about 50% of the area evaluatedfor the subcategory good forest in 1973 compared to 2000,whereas poor forest, which has the highest runoff potential,increased its area twice as much for the same period.
Conclusion
A large transformation of the Rio San Pedro subbasin land-scape between 1973 and 2000 was detected, but the totalrunoff estimates based on the same precipitation data in-put did not show an important variation. Even so, changesin differential runoff contribution by the diverse HSG andland-use categories were identified. We then conclude thatfurther variations in the landscape structure will have an ef-fect on the runoff because changes are causing the increaseof covers with a high runoff potential, such as exposed soilor natural vegetation with poor conditions.
In our study, the differences in seasonal conditions duringthe recording of the Landsat images could be responsible
for the irregular trend of landscape changes, such as theimportant recovery of the forest class in 2000 comparedto the 1990 classification. The 2000 image dataset was allrecorded during the dry season, but the scenes correspondto the beginning of this season, when the effect of rainfall isstill present in soils and vegetation. Because runoff outputis a result of the area and characteristics of the landscapecomponents, the value calculated for 2000 is probably es-timated low compared to the 1973 and 1990 scenes, whichwere recorded in the middle of the dry season.
Because the NRCS-CN method is mainly based onland covers and hydrologic soil groups, the assessmentof runoff under different conditions allows the user totry different treatments to evaluate and understand theeffect that changes may have on this characteristic asa consequence of land development. The techniquesand methods used here are useful to evaluate runoffresponse as a consequence of land-use and land-coverchanges, especially when other hydrologic information islimited. Besides, these techniques have a great potential formanagement purposes that increases with GIS techniques,because they allow the analysis of large areas, which canbe viewed and managed as a whole or by subunits, givingflexibility to the management decisions.
Using those methods in our study, we conclude that land-scape changes are modifying the runoff conditions and itis necessary to reverse or stop natural-cover degradation inthe upper area of the basin, which is increasing the runoffpotential. Because the techniques used here allow the parti-tion of the area into small, spatially uniform units, strategiesfor conservation or management can be delineated for dif-ferent size areas, solving specific environmental problems,and maximizing the use of economic and social resources.
Acknowledgments
This research was funded by Consejo Nacional de Cienciay Tecnologia (CONACYT-CNA FONSEC 48216) and theGovernment of Nayarit (FOMIX C01-9593). R. Hernan-dez (ICMYL-UNAM PhD program) was supported by ascholarship from CONACYT. The projects were in chargeof the corresponding author. Thanks to Dr. Ellis Glazierfor editing the English-language text.
References
[1] Melesse, M.A.; Graham, W.D.; Jordan, J.D. Spatially distributedwatershed mapping and modeling: GIS-based storm runoff responseand hydrograph analysis: Part 2. J. of Spat. Hydrol. 2003, 3, 1–28.
[2] Bhaduri, B.; Harbor, J.; Engel, B.; Grove, M. Assessing watershed-scale, long-term hydrologic impacts of land use change using a GIS-NPS model. Environ. Manage. 2000, 26, 643–658.
[3] Kokkonen, T.S.; Jakeman, A.J. Structural effects of landscape andland use on streamflow response. In Environmental Foresight andModels: A Manifesto; Beck, M. B., Ed.; Elsevier, Amsterdam, 2002;303–321.
Downloaded By: [Ruiz-Luna, Arturo] At: 08:55 9 September 2008

1482 Hernandez-Guzman et al.
[4] Mendoza, M.E.; Bocco, G.; Bravo, M.; Lopez, E.G.; Osterkamp,W.R. Predicting water-surface fluctuation of continental lakes: A RSand GIS based approach in central Mexico. Water Resour. Manag.2006, 20, 291–311.
[5] Mendoza, M.; Bocco, G.; Bravo, M. Spatial prediction in hy-drology: status and implications in the estimation of hydrologicalprocesses for applied research. Prog. Phys. Geog. 2002, 26, 319–338.
[6] Ragan, R.M.; Jackson, T.J. Runoff synthesis using Landsat and SCSmodel. J. Hydraul. Div. ASCE 1980, 106, 667–678.
[7] Melesse, M.A.; Shih, S.F. Spatially distributed storm runoff depthestimation using Landsat images and GIS. Comput. Electron. Agr.2002, 37, 173–183.
[8] INEGI. Sıntesis de informacion geografica del estado de Nayarit.Mexico. Instituto Nacional de Estadıstica, Geografıa e Informatica(INEGI). Mexico, 2000, 43–54.
[9] USDA. Urban Hydrology for small watersheds. United States De-partment of Agriculture. Natural Resources Conservation Service.Conservation Engineering Division. Technical Release 55. 2nd ed.Washington, DC 1986.
[10] Eastman, J.R. Guide to GIS and Image Processing. Clark University,Worcester, MA; 2003.
[11] Congalton, R.; Green, K. Assessing the accuracy of remote senseddata: Principles and practices. Lewis Publishers, Boca Raton, FL,1999, 137.
[12] Berlanga-Robles, C.A.; Ruiz-Luna, A. Land use mapping andchange detection in the coastal zone of Northwest Mexico usingremote sensing techniques. J. Coastal. Res. 2002, 18, 514–522.
[13] Alonso-Perez, F.; Ruiz-Luna, A.; Turner, J.; Berlanga-Robles, C.A.;Mitchelson-Jacob, G. Land cover changes and impact of shrimp
aquaculture on the landscape in the Ceuta coastal lagoon system,Sinaloa, Mexico. Ocean Coast. Manage. 2003, 46, 583–600.
[14] Ruiz-Luna, A.; Berlanga-Robles, C.A. Land use, land cover changesand coastal lagoon surface reduction associated with urban growthin northwest Mexico. Landscape Ecol. 2003, 18, 159–171.
[15] Eastman, J.R.; McKendry, J. E.; Fulk, M. A. Change and time seriesanalysis. UNITAR, Switzerland; 1995.
[16] Jensen, J.R.; Cowen, D.J.; Althausen, J.D.; Narumalani, S.; Weath-erbee, O. An evaluation of coastwatch change detection protocolin South Carolina. In Remote Sensing Change Detection. Environ-mental Monitoring Methods and Applications; Lunetta, S., Elvidge,C.D., Eds.; Ann Arbor Press, Ann Arbor, MI, 1998; 75–88.
[17] FAO. World Reference Base for Soil Resources. World soil resourcesreport – 84. FAO, ISRIC and ISSS; Rome, 1998; 1–90.
[18] Zhan, X.; Huang, M.L. ArcCN-Runoff: an ArcGIS tool for gener-ating curve number and runoff maps. Environ. Modell. Softw. 2004,19, 875–879.
[19] Landis, J.R.; Koch, G.G. The measurement of observer agreementfor categorical data. Biometrics 1977, 33(1), 159–174.
[20] Yuan, D.; Elvidge, C. NALC land cover change detection pilot study:Washington, DC area experiments. Remote Sens. Environ. 1998, 66,166–178.
[21] Helmschrot, J.; Flugel, W.A. Land use characterisation and changedetection analysis for hydrological model parametrisation of largescale afforested areas using remote sensing. Phys. Chem. Earth 2002,27, 711–718.
[22] Ruiz-Luna, A.; Berlanga-Robles, C.A. Modifications in coveragepatterns and land use around the Huizache-Caimanero lagoon sys-tem, Sinaloa, Mexico: A Multi-temporal analysis using LANDSATimages. Estuar. Coast. Shelf. S. 1999, 49, 37–44.
Downloaded By: [Ruiz-Luna, Arturo] At: 08:55 9 September 2008