
Assessment of Property Changes Evaluation using Spatial Data with GIS: A Case Study of Apapa, Lagos...
9
Universal Journal of Environmental Research and Technology All Rights Reserved Euresian Publication © 2014 eISSN 2249 0256 Available Online at: www.environmentaljournal.org 2014 Volume 4, Issue 3: 134-142 Open Access Research Article 134 Adamu et al. Assessment of Property Changes Evaluation using Spatial Data with GIS: A Case Study of Apapa, Lagos (Nigeria) Bashir Adamu *1 , Ademola Omojola 2 , M. J. Fasona 2 and Prem Chandra Pandey 1 1 Centre for Landscape and Climate Research, Department of Geography, University of Leicester, Leicester, UK, LE1 7RH 2 Department of Geography and Planning, University of Lagos, Nigeria Corresponding author: [email protected] Abstract: Property use changes continuously, hence planning based on this information is a continuous process that can be very critical. In Nigeria, information depicting past and present changes in property use for environmental planning, monitoring and socio-economic development is often inadequate. Therefore, there is a need of new tool such as GIS, to analyze changes in properties in Apapa, Nigeria. The method adopted in achieving the result of this work includes collection of both spatial and ancillary data of year 1968 and 2007. Both spatial data with GPS locations of additional information were integrated using ArcGIS to update the 2007 data. The study revealed that initial plan for each property as at 1968 showed that 136 were been used for properties. Year 2007 information revealed 246 existing properties when query analysis was performed to display property information or status. Changes in property uses between 1968 and 2007 were identified in the study; some plots were merged while others have more than two properties within a single plot. The rate of change was simply determined by few parameters in last 39 years. Total properties and individual properties changes, percent dynamics change and rate of changes have been demonstrated in the study. Keywords: Property Usage, GIS, Land use, Property Management, Query analysis 1.0 Introduction: Properties or parcels are the most basic "business elements" in a County or City (Huong, 2010). Every day, planners, assessors, public works, fire, police, elections officials, school districts, and many other county/city personnel need access to parcel maps and related information such as addresses, related permits, maps, documents, tax rate areas, voter precincts, relation to flood zones and other natural hazards, etc. Improving the quality, validity, and temporal currency of parcel maps is a critical and cost-effective way to improve the effectiveness and efficiency of local government. In a developing country like Nigeria, information to depict the past and the present changes in properties in an area for physical environmental planning and socio- economic development is inadequate. The increasing economic activities in Apapa area have resulted to changes in property usage along the corridors. Despite these changes describe in above, there seems to be lack of proper acquisition and handling of accurate and comprehensive up to date spatial and non-spatial property data. Lack of such information and maps to depict the past and the present changes in properties in an area can lead to ineffective policies, poor physical environmental planning, loss of tax/revenue and uncontrolled physical developments. The increasing economic activities in Apapa have resulted to changes in property usage along the corridors. An essential pre- requisite to any development effort is to appraise the existing property situation and how the situation has been changing over time to enable authorities and planners make policy decisions for planning and revenue/taxes (Abler 1997). It has been found that adoption of new innovative technology such as GIS in administrative system will deliver unusual results as well as enhance economic and administrative competiveness (Campbell, 1999). Thus, most of the quantitative geographical studies were carried out using GIS platform (Longley, 2000). The aim of this study is to use GIS as a tool to analyze changes in property uses in the area that occurred overtime. The objective of the study is to identify existing properties in the study area as of 1968, 2007 and to analyse changes in properties
Transcript of Assessment of Property Changes Evaluation using Spatial Data with GIS: A Case Study of Apapa, Lagos...
Universal Journal of Environmental Research and Technology
All Rights Reserved Euresian Publication © 2014 eISSN 2249 0256
Available Online at: www.environmentaljournal.org
2014 Volume 4, Issue 3: 134-142
Open Access Research Article
134
Adamu et al.
Assessment of Property Changes Evaluation using Spatial Data with GIS: A Case Study of
Apapa, Lagos (Nigeria)
Bashir Adamu*1
, Ademola Omojola2, M. J. Fasona
2 and Prem Chandra Pandey
1
1Centre for Landscape and Climate Research, Department of Geography, University of Leicester,
Leicester, UK, LE1 7RH 2Department of Geography and Planning, University of Lagos, Nigeria
Corresponding author: [email protected]
Abstract: Property use changes continuously, hence planning based on this information is a continuous process that
can be very critical. In Nigeria, information depicting past and present changes in property use for
environmental planning, monitoring and socio-economic development is often inadequate. Therefore, there
is a need of new tool such as GIS, to analyze changes in properties in Apapa, Nigeria. The method adopted in
achieving the result of this work includes collection of both spatial and ancillary data of year 1968 and 2007.
Both spatial data with GPS locations of additional information were integrated using ArcGIS to update the
2007 data. The study revealed that initial plan for each property as at 1968 showed that 136 were been used
for properties. Year 2007 information revealed 246 existing properties when query analysis was performed
to display property information or status. Changes in property uses between 1968 and 2007 were identified
in the study; some plots were merged while others have more than two properties within a single plot. The
rate of change was simply determined by few parameters in last 39 years. Total properties and individual
properties changes, percent dynamics change and rate of changes have been demonstrated in the study.
Keywords: Property Usage, GIS, Land use, Property Management, Query analysis
1.0 Introduction: Properties or parcels are the most basic "business
elements" in a County or City (Huong, 2010). Every
day, planners, assessors, public works, fire, police,
elections officials, school districts, and many other
county/city personnel need access to parcel maps
and related information such as addresses, related
permits, maps, documents, tax rate areas, voter
precincts, relation to flood zones and other natural
hazards, etc. Improving the quality, validity, and
temporal currency of parcel maps is a critical and
cost-effective way to improve the effectiveness
and efficiency of local government. In a developing
country like Nigeria, information to depict the past
and the present changes in properties in an area
for physical environmental planning and socio-
economic development is inadequate. The
increasing economic activities in Apapa area have
resulted to changes in property usage along the
corridors. Despite these changes describe in
above, there seems to be lack of proper
acquisition and handling of accurate and
comprehensive up to date spatial and non-spatial
property data. Lack of such information and maps
to depict the past and the present changes in
properties in an area can lead to ineffective
policies, poor physical environmental planning,
loss of tax/revenue and uncontrolled physical
developments. The increasing economic activities
in Apapa have resulted to changes in property
usage along the corridors. An essential pre-
requisite to any development effort is to appraise
the existing property situation and how the
situation has been changing over time to enable
authorities and planners make policy decisions for
planning and revenue/taxes (Abler 1997). It has
been found that adoption of new innovative
technology such as GIS in administrative system
will deliver unusual results as well as enhance
economic and administrative competiveness
(Campbell, 1999). Thus, most of the quantitative
geographical studies were carried out using GIS
platform (Longley, 2000).
The aim of this study is to use GIS as a tool to
analyze changes in property uses in the area that
occurred overtime. The objective of the study is to
identify existing properties in the study area as of
1968, 2007 and to analyse changes in properties
Universal Journal of Environmental Research and Technology
135
Adamu et al.
over the period (1968-2007). This study
incorporated the use of Satellite imagery in
combination with GIS, database to assess the
properties increase and changes.
1.1 GIS for Local Authority Property Management
Information
A GIS provides a means of managing information
digitally and in a geographical context. Many
property management decisions require
consideration of location, geography and space.
The technology is well suited to this, but
constructing a GIS-based property information
system that records the complex interests in land
and property is a daunting task. The volume of
spatial data is often enormous and the cost of
establishing and maintaining a database will be
prohibitive unless a means of utilizing existing
resources can be developed. Historical property
data can be hard to trace due to the poor quality
and maintenance of some records, property
interests are heterogeneous. There has been
attempt to link the spatial location and regional
scale objects information with GIS (Laurini and
Thompson, 1992; Masser and Campbell, 1995;
Obermeyer and Pinto 1994). Some authors
conveyed the importance of GIS and spatial data
handling at different applications with review on
the future significant potential in new area of
research (Goodchild, 1992). They showed
effectiveness of GIS in real practice with
management (Campbell and Masser, 1995) and
also evidence of GIS monitoring in local
government and practices (Campbell et el., 1994).
Furthermore, it has been proved that pace of GIS
incorporation at regional, or national scales
indicated considerable importance at different
contexts (Campbell and Craglia, 1992; Campbell
and Masser, 1992). Thus, GIS use varies
considerably at different level of work (Campbell,
1996).
The management of property information is not
just about computer systems but about the spatial
information (Laurini and Thompson, 1992). There
are human, information and commercial issues to
be considered while collecting spatial information,
storing and using it for generating results (Longley
et al, 1999). Even a project has been clearly
specified and system and data requirements
outlined, access to certain information may not be
possible due to confidentiality constraints or
legislative barriers. There comes the need of
information strategy for GIS which needs to be
linked with management plan for successful
implications (Hendriks, 1998). Certain land and
property spatial information is commercially and
personally sensitive and must be handled
accordingly. The spatial data must be worked
carefully to avoid any positional inaccuracies
(Kiiveri, 1997). The laws of copy right and data
protection regulation must be adhered to other
constraints are integration of data for analysis may
not be compatible due to data formats variations.
The use and applications of GIS technology proved
important demands on spatial data link with
existing resources. This has challenged and
transformed the conventional techniques of
mapping (Masser, 1998) which changed spatial
data handling capabilities at local governmental
level. This may include using database, planning
and spreadsheet software in combination with GIS
(Drummond, 1995).
The necessity of Geographical Information Systems
(GIS) to manage information and link databases to
geographic locations is increasing every day.
Organizations that have implemented a GIS have
found that one of its main benefits is improved
management of their own organization and
resources. Because GIS has the ability to link data
sets together by geography, it facilitates
interdepartmental information sharing and
communication, further increasing productivity.
Local government can collect and store a
substantial amount of data, the majority which is
geographically referenced. GIS also appropriate for
local authorities because they need to consider
proximity issues (typically planning and
development control) and they are responsible for
discrete geographical areas (Ehlers and Amer,
1991). Local government is one of the largest users
of GIS and in 1993, 29 percent of local authorities
had a GIS compared to 16.5 percent in 1991
(Masser and Campbell 1994). Later surveys by the
Royal Town Planning Institute (RTPI) were carried
out in 1995 (Allison and Weston, 1999; Reeves,
2004).
The survey in 2000 showed that 94% of authorities
had either implemented, or were implementing, a
GIS. This compares with 64% of authorities in 1995
and indicates that GIS has consolidates its position
as a mainstream technology within local
government shows that around 57% of councils
considered that they had a fully operational GIS
(compared to 30% in 1995). In 1995, 8.3%
authorities had no plans to introduce GIS; this
figure is now 1%. This reduction may in part be
attributed to the increased accessibility and
affordability of pc based GIS in the advancing GIS
worlds (Wegener and Masser, 1996).

Universal Journal of Environmental Research and Technology
136
Adamu et al.
In its memorandum of evidence to the Audit
commission the Royal Institute of Chartered
Surveyors RICS (1997) recommends that (i) Local
authorities should adopt a more corporate
approach to property management, (ii) a central
property department be established in each
authority, (iii) a central database of property
owned and leased by the authority is essential to
allow performance indicators to be constructed
and to permit more informed decision making,
and, (iv) a central property database could be
used for estate management, development and by
maintenance and service department. The RICS
felt that the property portfolio is a key area of
management policy within a local authority and
therefore property information system, rather
than having the property functions dispersed
among legal, treasurers environmental services
and more informed property decisions to be
made. This type of geographical information is well
scented to input and analysis using GIS and many
authorities now use this technology to maintain
their land territories. The advantages of GIS-based
land terrier over paper-based systems are
described by (Wyatt and Ralphs 2003) as an ability
to handle changes in features overtime,
geographical analysis of property information,
high-quality map production, provision of
authority-wide access to a corporate resources
and an opportunity to tailor the DB to suit
different types of users.
The objective of the study is to identify the
different properties located in the Apapa Nigeria,
and link the goal of an information strategy with
GIS to overall use, increase, and changes in time
period. It includes the increase in the different
properties, their increase, change dynamics as well
as change rate of individual properties and overall
properties with time period.
2.0 Study Area and Methodology (add figure of
location)
The methodology includes data sources and
collection process. Data are observation made
from monitoring the real world. They are collected
as facts or evidence that may be processed to give
them meaning and turn them into information.
Spatial data are characterized by information
about position, connection with other features
and details of non-spatial characteristics (Burrogh,
1986). Personal visit to the study area was carried
out to assess and count each individual properties
located within the study area. The Geo-spatial
(Geometric) data of the properties were acquired
using the Global Positioning System (GPS) within
the area for geo-referencing the maps. The data
for this research project based on the master plan
of Apapa (1968) showing the layout of the plots,
roads and density areas. Apapa is one of Nigeria's
774 Local Government Areas and is located to the
west of Lagos Island, across Lagos Harbour (Lagos
State Government, 2012). The layout shows
proposed various land uses. The spatial data
conversion process normally begins with the
identification of the data source for the land base.
These sources of information may range from
extremely accurate surveyed maps containing no
ground control references. Source data may also
be existing in the computer files in deferent
formats. Before starting the creation of database
the source data has to be updated and verified so
as to generate the accurate existing data.
Sometimes the data is not clear enough to
distinguish the features, which create problems for
the operator and inaccurate data may get
generated. As the decisions of a planner are based
on the data, the inaccuracy in the database may
create problems to the planner too. So the map
has to be made distinguishable before considering
it as source data.
As illustrated in Figure 1, a scanned copy of the
Apapa Master Plan (1968) used a based map of the
study work. To carry out this study, master plan of
year 1968 has been used as base map of the town
as illustrated in the Figure 1 (a). Various land use
and land cover which were extracted from the
master plan of 1968 were demonstrated in the
Figure 4. These extracted land use land cover were
used to identify individual and commercial
properties. This also helps in identification of
properties with their initial uses based on the
master plan 1968. The use of IKONOS satellite
imagery in the study is to extract the properties in
the year2007 using GIS. The specification of
IKONOS satellite imagery is shown in the Table 1.
The location map of the study area is shown in
Figure 2.
Figure 4 shows various land uses in plots layout
extracted from the master of 1968 (Figure 1), it
was used to identify individual properties showing
initial uses based on the master plan. The total
number of properties (Plots) shows that there are
136 plots in the study area, commercial uses
accounted for 30 plots, industrial -44, military
barracks -1, police barracks -1, residential-57 and
drainages-3.

Universal Journal of Environmental Research and Technology
137
Adamu et al.
Figure 1: (a) The Scanned Master plan of year 1968 and (b) IKONOS Satellite image of the study area acquired
in 2001.
Figure 2. The location map of the study area, Apapa, Lagos in Nigeria
The database was created using Microsoft Excel to
store attribute information such as type of
property (ID), location, initial plan and present use
of the property. The obtained images and maps
were scanned (a high resolution scanner for image
to raster format) e.g. maps were geo-referenced
using AUTOCAD into TIFF format compatible with
the GIS software package, and imported into the
GIS environment (Arc view 3.3 as well as Arc GIS
9.2) were both used. The raster images are then
vectorised using on screen digitizing to represent
polygon – properties and lines - roads. The
digitized images were converted and stored in
shape files. This was performed in ArcView
package through the use of the ArcView polygon
attribute table (PAT). Maps and tables were
generated from the data. The map of the Apapa
Master Plan was generated using ArcView 9.2
Universal Journal of Environmental Research and Technology
138
Adamu et al.
package. Also, through ArcView software data
base were created for the properties and other
related information that are very useful for the
research. The data collected were analyzed and
presented in maps and tables. The results
obtained during the course of the study were
analyzed using maps, queries and tables. The
change dynamics of land use land cover were
illustrated in previous studies (Sharma et al.,
2012). The authors postulated the change
dynamics and change percentage for land use land
cover in different time period. This study focused
on the change and percent change of different
properties existed in 2007 and increased from
1968.
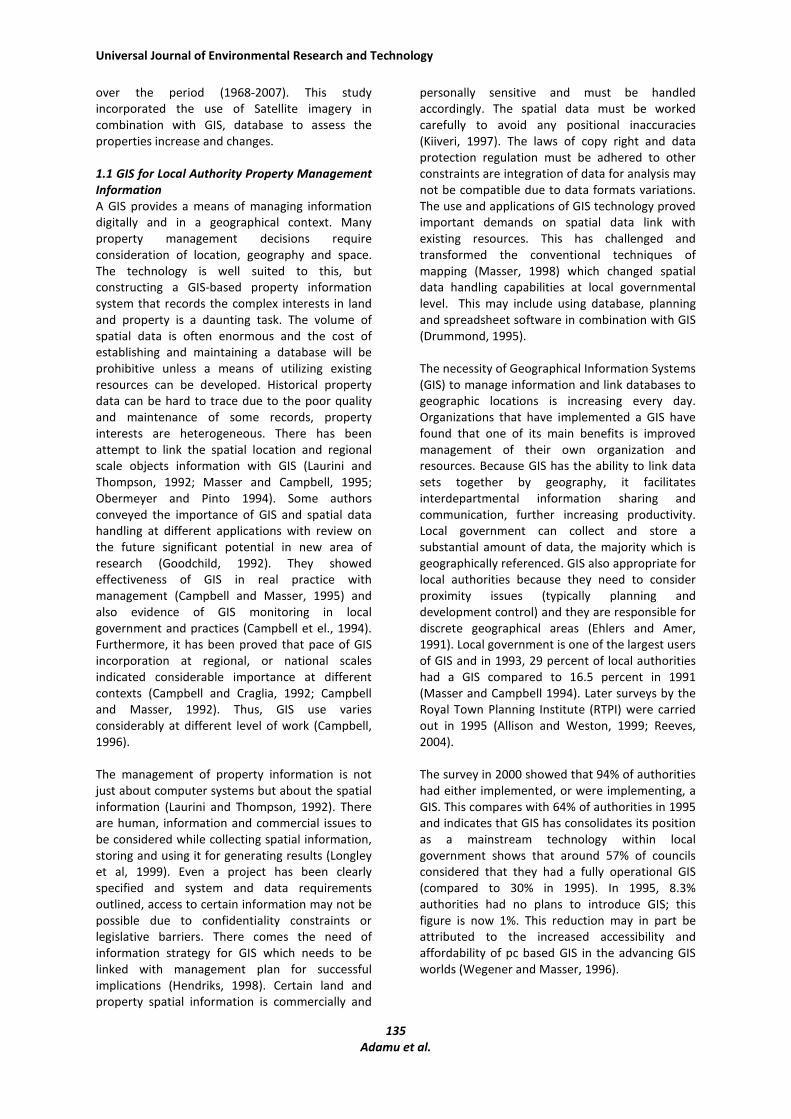
Table 1: Specification of IKONOS satellite imagery
Sr.
No Specifications Properties
1 Spatial
resolution
0.8 m PAN
4 m MSS
2 Spectral
resolution
PAN -0.45–0.90 µm
MSS-
0.445- 0.516 µm
0.506–0.595 µm
0.632–0.698 µm
0.757–0.853 µm
3 Temporal
Resolution
3-5 days off-nadir 144
& days true-nadir
4 Radiometric
resolution 11-bit
5 Swath 11 km × 11 km (single scene)
Different property uses in the study area has been
determined using properties change in time
period. Further, the rate of change of these
properties can be assessed using rate of change of
the properties per year. These above work can be
clear from the equation 1, equation 2, and
equation 3 shown below for calculating properties
changes and rate of change. The formula for
calculating Total Properties change ∆Y in the study
area is given below:
∆� = �2– �1 Equation 1
Where, P2=Total Property in Use in year 2007 and,
P1 =Total Property in Use in year 1968.
Percent increase can be assessed using the
equation mentioned below:
∆ =�–�
∗ 100 ...Equation 2
Where, P2-P1=change of properties in time period,
T= total time difference.
The formula for Rate of Change (Per Year) ∆R
change is calculated by using a simple formula
given below:
∆� = ∆�/� Equation 3
Where, ∆Y=Total Property changes between P2 –
P1. (Total changes 110)
T =Total Time Duration between P2 – P1.
(Total number of year- 39)
Therefore using the above equation 1 and 2, ∆Y
was calculated as 110 and ∆R was found to be 0.35
per year.
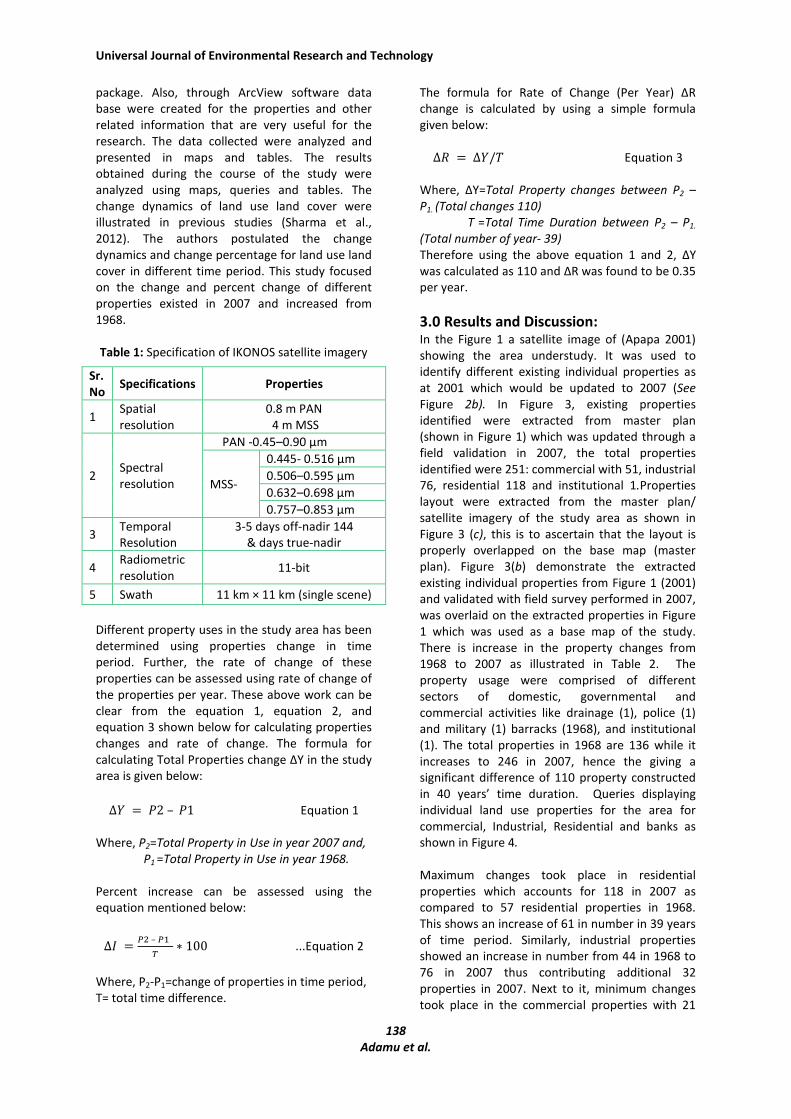
3.0 Results and Discussion: In the Figure 1 a satellite image of (Apapa 2001)
showing the area understudy. It was used to
identify different existing individual properties as
at 2001 which would be updated to 2007 (See
Figure 2b). In Figure 3, existing properties
identified were extracted from master plan
(shown in Figure 1) which was updated through a
field validation in 2007, the total properties
identified were 251: commercial with 51, industrial
76, residential 118 and institutional 1.Properties
layout were extracted from the master plan/
satellite imagery of the study area as shown in
Figure 3 (c), this is to ascertain that the layout is
properly overlapped on the base map (master
plan). Figure 3(b) demonstrate the extracted
existing individual properties from Figure 1 (2001)
and validated with field survey performed in 2007,
was overlaid on the extracted properties in Figure
1 which was used as a base map of the study.
There is increase in the property changes from
1968 to 2007 as illustrated in Table 2. The
property usage were comprised of different
sectors of domestic, governmental and
commercial activities like drainage (1), police (1)
and military (1) barracks (1968), and institutional
(1). The total properties in 1968 are 136 while it
increases to 246 in 2007, hence the giving a
significant difference of 110 property constructed
in 40 years’ time duration. Queries displaying
individual land use properties for the area for
commercial, Industrial, Residential and banks as
shown in Figure 4.
Maximum changes took place in residential
properties which accounts for 118 in 2007 as
compared to 57 residential properties in 1968.
This shows an increase of 61 in number in 39 years
of time period. Similarly, industrial properties
showed an increase in number from 44 in 1968 to
76 in 2007 thus contributing additional 32
properties in 2007. Next to it, minimum changes
took place in the commercial properties with 21
Universal Journal of Environmental Research and Technology
139
Adamu et al.
additional properties in 2007 (51 in numbers) as
compared to 1968 (30 in numbers). Commercial
properties’ share in percent of total properties
decreased from 22.06 to 20.32% in 2007. Though,
commercial properties showed an increase in
number from 30 to 51 in 2007 from 1968, it
showed decrease in the percent shared by all
properties in increase or decrease percentage
(refer Table 2 and 3). It has change dynamics of -
1.74 as per 39 time-period duration and its
percentage contribution to properties in 1968 is
22.06 and in 2007 is 20.32.
Likewise, Industrial properties showed an increase
in number from 1968 to 2007 i.e. the number
increased to 76 in 2007 from 44 in 1968. This
represents that 32 properties were added during
39 years and contributed almost 29.09 percent
among increased properties in 2007. The percent
changes showed negative trends as contribution of
industrial properties were 30.28 % of all properties
in 1968 and it declines to 32.35 % of total
properties in 2007. It represents a decline in -2.07
percent changes. The industrial properties
confirms rate of change of properties at 29.09 per
year, among all properties. The rate of change of
different properties were found to be 0.53 for
industrial, 0.82 for commercial properties, 1.56 for
residential properties, and 0.03 for other
properties. Thus, it has been found that for all
properties together, the rate of change came to be
2.82 properties per year (refer Table 3 and
Equation 3).
Figure 3. Property map of Apapa (Nigeria) in year 1968 and 2007

Universal Journal of Environmental Research and Technology
140
Adamu et al.
Table 2: Property Usage, in year 1968 and 2007 and percent increase in properties over time duration
Property
Usage
Properties in
Use 2007 (P2)
Properties
2007 (in %)
Properties in
Use 1968
(P1)
Properties in
1968 (in %)
Changes
1968-
2007
(P2- P1)
Percent
contributed in
increased
properties
Commercial 51 20.32 30 22.06 21 19.09
Industrial 76 30.28 44 32.35 32 29.09
Residential 118 47.01 57 41.91 61 55.45
Others 6 2.39 5 3.68 1 0.91
TOTAL 251 100 136 100 110 100
Table 3: Change dynamics and change rate of the different properties over time duration
Property
Usage
Properties 2007
(%)
Properties 1968
(%)
Percent changes
dynamics~ ∆I
∆� ~
(P2- P1) from
2007-1968
Rate of
Change
(Per Year)
Commercial 20.32 22.06 -1.74 21 0.53
Industrial 30.28 32.35 -2.07 32 0.82
Residential 47.01 41.91 5.1 61 1.56
Others 2.39 3.68 -1.29 1 0.03
TOTAL 100 100 - 110 2.82
Figure 4. Queries analysis generated from different land use in the study area
Universal Journal of Environmental Research and Technology
141
Adamu et al.
To cope with the study, some corridors were
selected within the study area (Marine road, creek
Road, liverpool road, park lane, point road, child
avenue, lander close, child close and park closed).
The reason for the selection of these areas is to
cut across all the land uses and some of the busy
places within the study area, as well as time frame.
To seek solution to the problem, the researcher
conducted extensive field work. The use of data
such as master plans and satellite imagery is to see
the changes that occurred overtime.
The purpose of this study was to identify existing
properties in 1968 and 2007 using master plan of
1968 and satellite imagery with query database in
2007, to analyze changes that have occurred over
time in Apapa area, Nigeria using GIS approach
(Ooi, 1990). Accurate and retrievable information
using GIS as a tool in monitoring and assessing
property change over period of time would
enhance government decision making in the area
of physical planning control, socio-
economic/revenue targets and planning etc. This
work has concentrated more on little section of
Apapa, subsequent work may be extended further
to a wider coverage using more high spatial
resolution or high spectral resolution with feature
extraction methods. This work may extend to
multi-temporal data acquisition instead of single
image data would greatly enhance the quality of
the work.
4.0 Conclusion: From the Table 2 and Table 3, it can be concluded
that the changes took place for each of the
properties classes including commercial, industrial,
residential, and others in the period of 39 years in
Apapa, Nigeria. This is all due to development and
advancement of the technology. The increase in
population of people in Apapa Nigeria may have
impact on the changes, as people need residential
properties to live, commercial and industrial
properties to sustain their lives using products
used in daily life like markets, educational
institutions etc. Thus, 39 years of time period has
shown tremendous increase in the different
properties with different percent increase,
different percent changes.
• The Apapa Master Plan (Figure 1a)
identified total of 136 properties as of 1968 and
251 properties has been identified in 2007 using
the satellite images and GIS analysis. Thus, the
satellite imagery with GIS revealed 251 existing
properties in 2007.
• Some of the existing properties have no
approval which can be displayed when a query is
run to show approval status of the property
(Figure 4 d).
• Changes in property usage were also
identified within the study area; some plots were
merged while some plots are having more than
two properties.
• Increase in number of properties from
1968 to 2007 has been identified and counted,
percent changes and change dynamics has been
assessed for the different properties and overall
properties in 2007 from 1968.
• The rate of change in property uses in the
study for the period of 39 years (1968-2007) is
2.82 per year.
5.0 Acknowledgement: The authors would like to thanks Apapa Local
Government for help and support in providing the
socio-economic and physical planning data. Much
thanks to Prof. A. Omojola who provided the
satellite data.
References: 1) Abler, R. F. (1987): The National Science
Foundation Center for Geographic
Information and Analysis. International
Journal of Geographical Information Systems,
1(4), 303-326.
2) Allison, J. and Weston, J. (1999): Information
technology literacy survey, The results of a
sample survey of RTPI members by the IT &
GIS Panel. ISBN 1 902311 183
3) Burrogh, P.A. (1986): Principles of GIS for land
resources assessment, Clarendon: Oxford.
4) Campbell, H. (1994): How effective are GIS in
practice? A case study of British local
government. International Journal of
Geographical Information Systems, 8(3), 309-
325.
5) Campbell, H. (1996): Theoretical perspectives
on the diffusion of GIS technologies, In I.
Masser, I. Campbell, Heather & Craglia,
Massimo, eds., GIS Diffusion: The Adoption
and Use of Geographical Information Systems
in Local Government in Europe, 23-48.
6) Campbell, H. (1999): Institutional
consequences of the use of GIS. Geographical
Information Systems, 2.
7) Campbell, H. and Masser, I. (1995): GIS and
Organizations: How effective are GIS in
Practice, London: Taylor & Francis.
8) Campbell, H., Masser, I., Poxon, J. and Sharp,
E. (1994): Monitoring the take up of GIS in
Universal Journal of Environmental Research and Technology
142
Adamu et al.
British local government. Report, Local
Government Management Board, 76-86.
9) Campbell, H.J. and Craglia, M. (1992): The
diffusion and impact of GIS on local
government in Europe: the need for a
European-wide research agenda, Proceedings
of the 15th Urban Data Management
Symposium, Lyon, 16-20 November, pp.133-
154, Delft: Urban Data Management Society.
10) Campbell, H.J. and Masser, I. (1992): GIS in
local government: some findings from Great
Britain, International Journal of Geographical
Information Systems, 6(6), 529-546.
11) Drummond, W. J. (1995): Extending the
revolution: Teaching land use planning in a GIS
environment. Journal of Planning Education
and Research, 14(4), 280-291.
12) Ehlers, M. and Amer, S. (1991):
Geoinformatics: an Integrated Approach to
Acquisition, Processing and Production of
Geo-Data, In EGIS 1991: Proceedings 2nd
European Conference on GIS, Brussels,
Belgium, April 1991, 301-312.
13) Goodchild, M. F. (1992): Geographical
information science, International Journal of
Geographical Information Systems, 6(1), 31-
45.
14) Hendriks, P. H. (1998): Information strategies
for geographical information systems.
International Journal of Geographical
Information Science, 12(6), 621-639.
15) Huong, D. (2010): The application of arcgis
cadastral fabric model for cadastral database
management. In International Symposium on
Geoinformatics for Spatial Infrastructure
Development in Earth and Allied Sciences.
Http://wgrass. media. osaka-cu. ac.
jp/gisideas10/viewpaper. php.
16) Kiiveri, H. T. (1997): Assessing, representing
and transmitting positional uncertainty in
maps. International Journal of Geographical
Information Science, 11(1), 33-52.
17) Lagos State Government (2012): Abstract Of
Local Government Statistics, Ministry of
Economic Planning and Budget, Secretariat,
Alausa, Ikeja, Available
online:http://www.lagosstate.gov.ng/images/
pageimages/downloadfiles/docs/ABSTRACT_O
F_LG%202012.pdf
18) Laurini, R. and Thompson, D. (1992):
Fundamentals of spatial information systems,
Vol. 37, London: Academic press-144.
19) Longley, P. (2000): Spatial Analysis in the New
Millennium, Annals of the Association of
American Geographers, Vol. 90 (1), pp. 157-
165.
20) Longley, P. A., Goodchild, M. F., Maguire, D. J.
and Rhind, D. W. (1999): Introduction. In
Geographical Information Systems: Principles,
Techniques, Management and Applications,
eds. P. A. Longley, M. F. Goodchild, D. J.
Maguire, and D. W. Rhind, vol. 1, pp. 1-20.
New York: John Wiley.
21) Masser, I. 1998. Governments and Geographic
Information, UK: Taylor and Francis.
22) Masser, I. and Campbell, H. (1994):
Monitoring the take-up of GIS in British local
government. In Salling, M., eds., Proceedings
of the 32nd Annual Urban and Regional
Information Systems Association (URISA)
Conference. Milwuakee, WI, August 1994, 1,
745-754.
23) Masser, I. and Campbell, H. (1995):
Geographical information systems in
organizations: some conditions for their
effective utilization”. In De Lepper, M. J. C.,
Scholten, H. J. and Stern, eds., The Added
Value of Geographical Information Systems in
Public and Environmental Health.
24) Obermeyer, N. J. and Pinto, J.
K. (1994): Managing Geographic Information
System, New York and London: Guilford Press.
25) Ooi, B.C. (1990): Efficient Query Processing in
Geographic Information Systems, Vol 471,
New York: Springer Verlag.
26) RCIS (1997): Code of Conduct Practice: Service
charge residential management code and
additional advice to landlords, tenants and
agents.
27) Reeves, D. (2004): Planning for diversity:
policy and planning in a world of difference.
Routledge.
28) Sharma, L., Pandey, P. C. and Nathawat, M. S.
(2012): Assessment of land consumption rate
with urban dynamics change using geospatial
techniques. Journal of Land Use Science, 7,
135-148.
29) Wegener, M. and Masser, I. (1996): Brave new
GIS worlds, In Masser, I., Campbell, H. and
Craglia, M, eds., GIS Diffusion; the Adoption
and Use of Geographical Information Systems
in Local Government in Europe, London: Taylor
& Francis, 9-22.
30) Wyatt, P, and Ralphs, M. (2003): GIS in land
and property management, New York: Taylor
and Francis Group.