8 biosensor, IFMA, and ELISA immunoassays to differentiate ...

Rep
rodu
ced
from
Cro
p S
cien
ce. P
ublis
hed
by C
rop
Sci
ence
Soc
iety
of A
mer
ica.
All
copy
right
s re
serv
ed.
Assessment of Inter Simple Sequence Repeat Markers to Differentiate Sympatric Wildand Domesticated Populations of Common Bean
A. Gonzalez, A. Wong, A. Delgado-Salinas, R. Papa, and P. Gepts*
ABSTRACT 1996) and amplified fragment length polymorphisms(AFLPs) (Tohme et al., 1996; Papa and Gepts, 2003).Efficient assessment of genetic diversity is important for conserva-The ISSR marker technique involves polymerase chaintion and utilization of genetic resources. We sought to assess the abil-reaction (PCR) amplification of DNA using a singleity of inter simple sequence repeats (ISSRs) as molecular markers toprimer composed of a microsatellite sequence, such asidentify genetic diversity both within and among sympatric populations
of common bean, Phaseolus vulgaris L. One wild and four domesti- (GACA)4, anchored at the 3� or 5� end by two to fourcated populations originating from the Sierra Norte de Puebla, Mex- arbitrary, often degenerate, nucleotides (Zietkiewiczico, were chosen because they were growing in the same region or et al., 1994). The ISSRs have proven to be a rapid,field. The ISSR diversity was assessed using four primers that revealed simple, and inexpensive way to assess genetic diversitya higher number of strong, polymorphic bands in preliminary analyses. (Kantety et al., 1995; Tsumura et al., 1996; EsselmanFifty of these bands could be mapped onto the core linkage map in et al., 1999; Gilbert et al., 1999; Sarla et al., 2003; Tanyo-population BAT93 � Jalo EEP558, whereas four were unlinked. The
lac, 2003; Jin et al., 2003), to identify closely relatedmapped bands were distributed over nine of the 11 linkage groups,cultivars (Fang and Roose, 1997; Fang et al., 1997, 1998;suggesting that they were broadly distributed in the genome. On theEiadthong et al., 1999; Prevost and Wilkinson, 1999;basis of a sample of 50 intense bands in these five populations, ISSRsMartins et al., 2003), and to study evolutionary pro-were able to clearly distinguish all populations. Most of the variation
was distributed among populations rather than within populations, cesses, such as reproductive systems (Liston et al., 2003)consistent with the predominantly selfing nature of the species. Differ- and gene flow (Wolfe et al., 1998). A recent paper byentiation among domesticated populations was much higher (FST ≈ Galvan et al. (2003) describes differences between 100.49–0.85) than between the wild and domesticated gene pools (FST � Argentinean and three French bean cultivars, in particu-0.05). Within each population, most loci had achieved near-fixation. lar broad differences between the Andean and Meso-Around 7% of individuals showed a lack of correlation between seed american gene pools.type and ISSR fingerprint. Furthermore, each population contained
In the current research, the level of genetic diversityindividuals with unusual markers but present in the other populationsand differentiation was determined among one wild and(frequency � 5 or 10%). Two nonmutually exclusive explanations werefour domesticated sympatric populations of commondiscussed—incomplete lineage sorting and introgression—to accountbean (Phaseolus vulgaris; 2n � 2x � 22) from the Sierrafor the presence of these unusual individuals. Overall, ISSR markers
were very useful to differentiate closely related populations. Further Norte de Puebla. Most studies of genetic diversity inresearch is necessary to quantify the actual level of outcrossing. common bean have been conducted in samples repre-
senting broad geographical ranges to identify major sub-divisions in its germplasm, such as gene pools and races
Efficient management of genetic resources, whether (Singh et al., 1991; Gepts, 1998). Fewer studies havefor conservation or for utilization in plant breeding been conducted to determine genetic relationships on
programs, requires accurate and fast assessment of lev- smaller geographic levels (Cattan-Toupance et al., 1998;els of genetic diversity and degrees of genetic relat- Papa and Gepts, 2003). These studies are useful becauseedness. In the last decade, increasing use has been made they provide information on evolutionary factors thatof molecular markers based on DNA analyses (Bretting can shape genetic diversity in common bean popula-and Widrlechner, 1995; Gepts, 1995). An enduring con- tions, such as gene flow. For example, Cattan-Toupancecern with these markers is that they are fairly laborious et al. (1998) showed the importance of a disease pressureand costly. Hence, there has been a trend to markers that, in determining local population differentiation, in addi-while highly polymorphic, are relatively easy and fast to tion to genetic drift. They also considered partial out-analyze. In common bean, these include randomly am- breeding to be a potential factor affecting association of
traits. Papa and Gepts (2003) showed that, in sympatry,plified polymorphic DNA (RAPD) (e.g., Freyre et al.,gene flow from domesticated to wild types is three timesmore important than in the opposite direction. Further-
A. Gonzalez and P. Gepts, Dep. of Agronomy and Range Science, more, spatial autocorrelation studies showed that wildUniv. of California, 1 Shields Ave., Davis, CA 95616-8515, USA (A.
beans exhibited a stronger local population structureGonzalez, current address: CSIRO Plant Industry, Horticulture Unit,than domesticated beans.PMB 44, Winnellie 0822, Darwin, NT, Australia); A. Wong and A.
Delgado-Salinas, Inst. de Biologıa, Univ. Nacional Autonoma de Mex- In addition to studying the level of genetic diversityico, Mexico, DF, Mexico; R. Papa, Dipartimento di Scienze degli among sympatric populations of common bean, we soughtAlimenti, Univ. Politecnica delle Marche, Ancona, Italy. This research to determine the usefulness of ISSR markers in commonwas funded by the McKnight Foundation Collaborative Crop Re-search Program. Received 28 May 2003. Plant Genetic Resources.
Abbreviations: AFLP, amplified fragment length polymorphism;*Corresponding author ([email protected]).ISSR, inter simple sequence repeat; PCR, polymerase chain reaction;RAPD, randomly amplified polymorphic DNA; RFLP, restrictionPublished in Crop Sci. 45:606–615 (2005).
© Crop Science Society of America fragment length polymorphism; SAHN, sequential, agglomerative,hierarchical, and nested.677 S. Segoe Rd., Madison, WI 53711 USA
606
Published online February 23, 2005

Rep
rodu
ced
from
Cro
p S
cien
ce. P
ublis
hed
by C
rop
Sci
ence
Soc
iety
of A
mer
ica.
All
copy
right
s re
serv
ed.
GONZALEZ ET AL.: ISSRS IN SYMPATRIC WILD AND DOMESTICATED BEANS 607
Table 1. Levels of polymorphism in wild and domesticated populations of common bean from the Sierra Norte de Puebla, Mexico.
Number of polymorphic ISSR† fragments
A B C DNo. of (GACA)3RT YR(GACA)3 (GACAC)2 (ACTG)3RG Total Nei’s gene No. of
Population individuals (12)‡ (12) (9) (17) (50) diversity haplotypes
Beige 51 6 4 1 4 15 0.02 14§Negro Brillante 85 8 7 6 15 36 0.10 46¶Negro Opaco 92 8 8 7 11 34 0.06 28¶Rojo 24 9 5 5 10 29 0.10 10§Domesticated# 252 12 9 7 15 43 0.19 95Wild 77 10 8 6 16 40 0.20 75All†† 329 12 10 8 16 46 0.29 170
† ISSR, inter simple sequence repeat.‡ ISSR primer (see Materials and Methods) and total number of fragments in parenthesis.§ 1 haplotype shared between Beige and Rojo.¶ 2 haplotypes shared between Negro Brillante and Negro Opaco.# Beige � Negro Brillante � Negro Opaco � Rojo � 3 shared haplotypes.†† Domesticated � wild.
followed by 2 min at 94�C, 1 min at 42�C, and 2 min at 70�C forbean with respect to their reproducibility, variation in35 cycles, and 5 min at 72�C for final extension. AmplificationDNA amplification among primers, relative linkage mapproducts were separated on 320 by 380 by 0.4 mm of 6%location, and levels of polymorphism detected. Thenondenaturing 30:1 bis-acrylamide gels containing 3 M ureaISSRs were able to distinguish sympatric bean popula-and 1 � tris-borate buffer (Zietkiewicz et al., 1994). A 123-bptions but also identify within-population polymorphism.molecular marker standard was included in each gel. Gelswere run for 12 h at 300 V, and PCR products were detectedby silver staining (Bassam et al., 1991) (Fig. 1). Each gel wasMATERIALS AND METHODSloaded with PCR products of at least eight individuals of each
Plant Materials accession to be able to compare the amplification pattern amongaccessions within the same gel. The PCR fragments generatedSeeds of a wild population of P. vulgaris were collected inby the ISSR primers were labeled with a code consisting of aearly winter of 1995 by Francisco Basurto (FB1934) in thedescription of the primer used for the reaction followed by themunicipalities of Xochitlan de Romero Rubio and Huapalej-molecular size of the fragment in base pairs [i.e., (ACTG)3can in the Sierra Norte de Puebla (state of Puebla, Mexico).
This wild population grows within bean fields, but surprisingly RG.434: fragment size of 434 bp].not outside fields. Seeds of four commonly grown landraces—labeled according to their seed color: Beige (B), Negro Bril-lante (NB, shiny black), Negro Opaco (NO, dull black), andRojo (R, red)—were collected from local, indigenous farmersfrom the same area. As far as we can tell, these are not bredmaterials. All landraces were indeterminate strong climbers,classified as Type IV (Singh, 1982).
DNA Extraction and ISSR Analysis
A total of 615 seeds (Table 1) were planted in a greenhouseat Davis. These seeds included 79, 156, 138, 34, and 208 individ-uals for the Beige, Negro Brillante, Negro Opaco, Rojo, andwild populations, respectively. DNA was extracted using theCTAB method as described by Doyle and Doyle (1987). Intersimple sequence repeats were analyzed using a total of 32primers synthesized by the Protein Sequencing Laboratory ofthe University of California, Davis. From the 30 primers testedoriginally, four primers were selected that produced a highlevel of polymorphism among both landraces and wild popu-lations (Table 1). Two of these primers, (GACA)3 RT and(GACAC)2, were run on the entire sample, whereas two addi-tional primers, YR (GACA)3 and (ACTG)3 RG, were onlyrun on a randomly chosen subset of 417 individuals, whichincluded 61, 100, 117, 32, and 107 individuals of the Beige,Negro Brillante, Negro Opaco, Rojo, and wild populations,respectively. Each 20-�L amplification reaction consisted of10 mM Tris-HCl (pH 9.0), 50 mM KCl, 0.1% Triton X-100,2 mM MgCl2, 200 �M of each deoxyribonucleotide phosphate,
Fig. 1. Inter simple sequence repeat electrophoretic assessment of1 �M of primer, 1 unit of Taq polymerase (Promega, Madison, genetic diversity in common bean. A gel is shown in which severalWI), and 20 ng of template DNA. Each reaction mixture was individuals showed one or more fragments (arrowheads on theoverlaid with mineral oil. Amplification was performed in a right side of the gel) that were atypical for the populations (B,96-well Ericomp thermal cycler (Ericomp, Inc., San Diego, Beige; NB, Negro Brillante; NO, Negro Opaco; W, wild) after
amplification using primer (GACA)3RT.CA) under the following conditions: 4 min at 94�C for 1 cycle,

Rep
rodu
ced
from
Cro
p S
cien
ce. P
ublis
hed
by C
rop
Sci
ence
Soc
iety
of A
mer
ica.
All
copy
right
s re
serv
ed.
608 CROP SCIENCE, VOL. 45, MARCH–APRIL 2005
Linkage Mapping strongly amplified and well-stained across gels. The bandsranged in size from 250 to 1300 bp. To examine theThe same four ISSRs primers used to generate fingerprint-distribution of these ISSR markers in the bean genome,ing in the five populations (Table 1) were used to generatea mapping study was conducted in the BAT93 � JaloPCR-amplified DNA fragments in 75 lines of the BAT93 �EEP558 recombinant inbred population, the core map-Jalo EEP556 recombinant inbred population, which had reached
the F8 generation. This population has been used previously ping population in common bean (Freyre et al., 1998).to develop a RFLP genetic linkage map (Nodari et al., 1993) The core map established in this population includesand to develop a core linkage map for the common bean ge- some 560 markers, including 120 RFLPs and 430 RAPDs.nome (Freyre et al., 1998). Segregation was scored for presence The four ISSR primers used in the gene flow studiesor absence of the ISSRs bands. Segregation of polymorphic amplified 54 polymorphic fragments in this population.fragments was analyzed by a chi-square test for goodness- The segregation data of these fragments were added toof-fit to a 1:1 ratio. Linkage analysis of the polymorphic set
those of existing framework markers to determine theirof markers was done using Mapmaker 3.0b (Lander et al.,location on the map. The Chi-square test (1:1 expecta-1987) as described in Menendez et al. (1997) (Fig. 2). Briefly,tion, P � 0.99) indicated that nine markers (16.6%)markers already previously established in the common beanshowed a segregation distortion that was significantlymap (Freyre et al., 1998) were used to anchor linkage groups.
The Assign command was then used to allocate ISSRs markers different from the expected 1:1 ratio at the 1% level.into linkage groups. To establish the most likely order of Fifty of the amplified bands mapped onto nine of themarkers within each linkage group, the command Order was 11 linkage groups of the common bean linkage map,applied under the following conditions: (i) LOD score above indicating a broad coverage of the genome by the ISSRsor equal to 3.00, and (ii) a maximum distance of 30 cM. Mark- (Fig. 2). None of the ISSRs markers scored mapped oners not placed under this limit were placed using lower LOD linkage groups 4 or 9 (Fig. 2) and four bands werescores (between 3 and 2).
unlinked. The mapped ISSRs markers were distributedmainly on linkage group 7 (11 markers), 10 (9 markers),
Analyses of Genetic Diversity and 11 (9 markers). Further inspection of Fig. 2 suggestsThe PCR products amplified using the ISSR primers were some degree of clustering of these markers on individual
scored as present (1) or absent (0) for the five populations. linkage groups.Analyses were initially conducted on individuals with resultsfrom four or two primers. Because results were similar be- Polymorphisms in Phaseolus vulgaris of thetween the two groups, only the results based on individuals Sierra Norte de Pueblawith complete data sets (four primers) are presented here. Ofa total of 20 850 data points (417 individuals � 50 markers), Ninety-two (46/50) percent of the analyzed markers1079 (5%) were considered as missing data. Individuals with displayed variation in this study (Tables 1 and 2). Fur-such missing data were excluded without effect on the results thermore, the five populations analyzed in this study(data not shown). Thus, our final sample contained 329 individ- showed contrasting levels of polymorphism. The wilduals, including 51, 85, 92, 24, and 77 individuals from the Beige, population was the most diverse, whether measured byNegro Brillante, Negro Opaco, Rojo, and wild populations, re-
the number of polymorphic fragments, Nei’s (1973) genespectively. When considering all 50 fragments together, 170diversity, or the number of haplotypes (Table 1). As amultilocus combinations (haplotypes) could be identified. Un-whole, the domesticated group (n � 252) had higherless otherwise mentioned, standard indices of genetic diversityor similar levels of polymorphism compared with thewere calculated using the Arlequin (Schneider et al., 2000) or
the POPGENE (Yeh et al., 1997) softwares. Indices of genetic sample of the wild population (n � 77) (Table 1). Nonesimilarity were calculated using Dice’s coefficient (Dice, 1945) of the regressions between population size (independentto estimate the relationship between accessions and to observe variable) and measures of genetic diversity as dependentthe placement of putative outcrossed individuals. From the variables (number of polymorphic bands, Nei’s genesimilarity matrix, a sequential, agglomerative, hierarchical, and diversity, and number of haplotypes) were statisticallynested (SAHN) cluster analysis was performed using the un- significant at the P � 0.05. Thus, differences in geneticweighted pair group method with arithmetic means (UPGMA)
diversity among populations were not due to differencesalgorithm computed using NTSYS-pc (Rohlf, 1997). A dendro-in population sizes.gram was generated using NTSYS-pc (Rohlf, 1997) to show the
genetic relationships and distances of each accession (Fig. 3).Genetic Distances and Differentiation
RESULTS The ISSR markers clearly distinguished the wild fromthe domesticated populations included in this studyDevelopment and Mapping of ISSR Markers(Fig. 3). Among the 50 markers used for the final analysis,in Common Bean 22% showed highly contrasting frequencies in the wildand domesticated gene pools: A12, A13, A40, B23, B26,The pattern of DNA amplification using ISSR prim-
ers was very reproducible based on results from at least B27, C6, C18, D9, D28, and D33. Frequencies of thesemarkers in one gene pool were below 20% and above20 different DNA extractions and PCR reactions from
each landrace, which produced reproducible banding pat- 80% in the other gene pool (Table 2). Fourteen percentwere monomorphic (frequencies 0.95) among theseterns (Fig. 1). All primers tested amplified some bands in
common bean except primers (AT)8YG and (AT)8RG, two groups (i.e., markers A24 [(GACA)3RG.703], A29[(GACA)3RG.616], B17 [YR(GACA)3], C8 [(GACAC)2.with R � G, A and Y � C, T (data not shown). The four
ISSR primers selected amplified 50 bands, which were 887], C10 [(GACAC)2.821], C12 [(GACAC)2.727], and

Rep
rodu
ced
from
Cro
p S
cien
ce. P
ublis
hed
by C
rop
Sci
ence
Soc
iety
of A
mer
ica.
All
copy
right
s re
serv
ed.
GONZALEZ ET AL.: ISSRS IN SYMPATRIC WILD AND DOMESTICATED BEANS 609
Fig. 2. Distribution of inter simple sequence repeat (ISSR) markers among linkage groups of the recombinant inbred population BAT93 � JaloEEP558. No ISSRs mapped to linkage groups B4 and B9. Only ISSR loci are shown, in addition to two previously mapped markers (Freyreet al., 1998) on each linkage group to orient them with respect to other common bean maps. The ISSR locus names include the primersequence followed after the period by the size of the scored band in bp. Markers in bold were mapped with a log-likelihood ratio above 3,those in normal type with a log-likelihood ratio below 3. Distances to the left of each linkage group are expressed in Kosambi cM. Linkagegroups were not drawn to scale.
D5 [(ACTG)3RG.1013] in Table 2). The remaining per- addition, ISSR markers were also able to clearly distin-guish the four domesticated populations, including thecentage consisted of bands with various frequency patterns
in the wild and domesticated components (Table 2). In Negro Opaco and Negro Brillante populations, in spite

Rep
rodu
ced
from
Cro
p S
cien
ce. P
ublis
hed
by C
rop
Sci
ence
Soc
iety
of A
mer
ica.
All
copy
right
s re
serv
ed.
610 CROP SCIENCE, VOL. 45, MARCH–APRIL 2005
Fig. 3. Dendrogram generated by unweighted pair group method with arithmetic means based on Dice (1945) coefficients. The clusters correspondto the populations, indicated at the right of the dendrogram. The mixed cluster includes individuals from the Negro Brillante (NB), NegroOpaco (NO), and wild (W) populations (see text for composition). Individuals listed at the right constitute exceptions to the clustering intothe Beige, Negro Brillante, Negro Opaca, Rojo, and wild populations. All 170 haplotypes are shown in this figure, although some haplotypeswere observed in more than one individual.
of the phenotypic similarities of the latter (Fig. 3). Al- more heterogeneous fingerprinting pattern was observedin the wild accessions, but nevertheless, some bands werethough the main difference between the two black-seeded
populations—the shininess of the seed—is controlled by found that had a high frequency in one group of acces-sions (either wild or domesticated) and were present ata single gene (Asp; Beninger et al., 2000), there were four
markers that were able to differentiate these two popula- a much lower frequency in the other group (Table 2).All ISSRs markers were present at some frequencytions: D12 [(ACTG)3RG.652], D25 [(ACTG)3RG.485],
D27 [(ACTG)3RG.434], and D29 [(ACTG)3RG.415]. A in the wild and the two black-seeded landraces (Table 2).
Rep
rodu
ced
from
Cro
p S
cien
ce. P
ublis
hed
by C
rop
Sci
ence
Soc
iety
of A
mer
ica.
All
copy
right
s re
serv
ed.
GONZALEZ ET AL.: ISSRS IN SYMPATRIC WILD AND DOMESTICATED BEANS 611
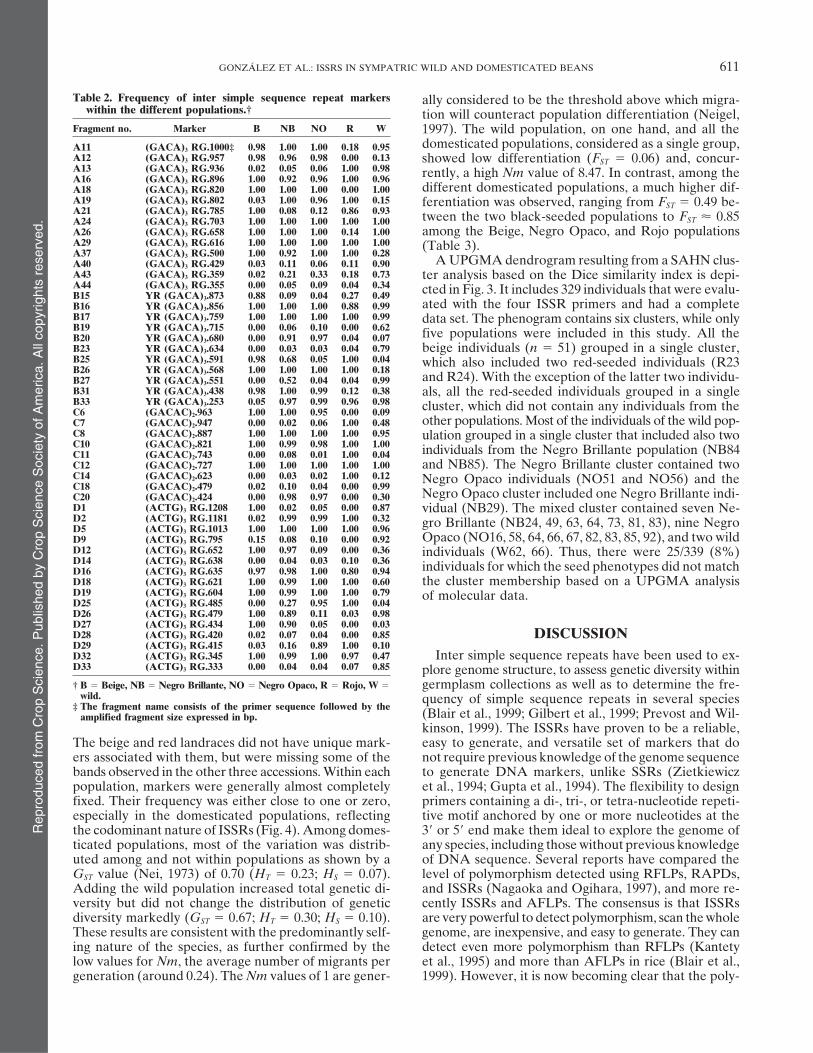
Table 2. Frequency of inter simple sequence repeat markers ally considered to be the threshold above which migra-within the different populations.† tion will counteract population differentiation (Neigel,
Fragment no. Marker B NB NO R W 1997). The wild population, on one hand, and all thedomesticated populations, considered as a single group,A11 (GACA)3 RG.1000‡ 0.98 1.00 1.00 0.18 0.95
A12 (GACA)3 RG.957 0.98 0.96 0.98 0.00 0.13 showed low differentiation (FST � 0.06) and, concur-A13 (GACA)3 RG.936 0.02 0.05 0.06 1.00 0.98 rently, a high Nm value of 8.47. In contrast, among theA16 (GACA)3 RG.896 1.00 0.92 0.96 1.00 0.96
different domesticated populations, a much higher dif-A18 (GACA)3 RG.820 1.00 1.00 1.00 0.00 1.00A19 (GACA)3 RG.802 0.03 1.00 0.96 1.00 0.15 ferentiation was observed, ranging from FST � 0.49 be-A21 (GACA)3 RG.785 1.00 0.08 0.12 0.86 0.93 tween the two black-seeded populations to FST � 0.85A24 (GACA)3 RG.703 1.00 1.00 1.00 1.00 1.00A26 (GACA)3 RG.658 1.00 1.00 1.00 0.14 1.00 among the Beige, Negro Opaco, and Rojo populationsA29 (GACA)3 RG.616 1.00 1.00 1.00 1.00 1.00 (Table 3).A37 (GACA)3 RG.500 1.00 0.92 1.00 1.00 0.28
A UPGMA dendrogram resulting from a SAHN clus-A40 (GACA)3 RG.429 0.03 0.11 0.06 0.11 0.90A43 (GACA)3 RG.359 0.02 0.21 0.33 0.18 0.73 ter analysis based on the Dice similarity index is depi-A44 (GACA)3 RG.355 0.00 0.05 0.09 0.04 0.34 cted in Fig. 3. It includes 329 individuals that were evalu-B15 YR (GACA)3.873 0.88 0.09 0.04 0.27 0.49
ated with the four ISSR primers and had a completeB16 YR (GACA)3.856 1.00 1.00 1.00 0.88 0.99B17 YR (GACA)3.759 1.00 1.00 1.00 1.00 0.99 data set. The phenogram contains six clusters, while onlyB19 YR (GACA)3.715 0.00 0.06 0.10 0.00 0.62 five populations were included in this study. All theB20 YR (GACA)3.680 0.00 0.91 0.97 0.04 0.07B23 YR (GACA)3.634 0.00 0.03 0.03 0.04 0.79 beige individuals (n � 51) grouped in a single cluster,B25 YR (GACA)3.591 0.98 0.68 0.05 1.00 0.04 which also included two red-seeded individuals (R23B26 YR (GACA)3.568 1.00 1.00 1.00 1.00 0.18
and R24). With the exception of the latter two individu-B27 YR (GACA)3.551 0.00 0.52 0.04 0.04 0.99B31 YR (GACA)3.438 0.98 1.00 0.99 0.12 0.38 als, all the red-seeded individuals grouped in a singleB33 YR (GACA)3.253 0.05 0.97 0.99 0.96 0.98 cluster, which did not contain any individuals from theC6 (GACAC)2.963 1.00 1.00 0.95 0.00 0.09
other populations. Most of the individuals of the wild pop-C7 (GACAC)2.947 0.00 0.02 0.06 1.00 0.48C8 (GACAC)2.887 1.00 1.00 1.00 1.00 0.95 ulation grouped in a single cluster that included also twoC10 (GACAC)2.821 1.00 0.99 0.98 1.00 1.00 individuals from the Negro Brillante population (NB84C11 (GACAC)2.743 0.00 0.08 0.01 1.00 0.04C12 (GACAC)2.727 1.00 1.00 1.00 1.00 1.00 and NB85). The Negro Brillante cluster contained twoC14 (GACAC)2.623 0.00 0.03 0.02 1.00 0.12 Negro Opaco individuals (NO51 and NO56) and theC18 (GACAC)2.479 0.02 0.10 0.04 0.00 0.99
Negro Opaco cluster included one Negro Brillante indi-C20 (GACAC)2.424 0.00 0.98 0.97 0.00 0.30D1 (ACTG)3 RG.1208 1.00 0.02 0.05 0.00 0.87 vidual (NB29). The mixed cluster contained seven Ne-D2 (ACTG)3 RG.1181 0.02 0.99 0.99 1.00 0.32 gro Brillante (NB24, 49, 63, 64, 73, 81, 83), nine NegroD5 (ACTG)3 RG.1013 1.00 1.00 1.00 1.00 0.96
Opaco (NO16, 58, 64, 66, 67, 82, 83, 85, 92), and two wildD9 (ACTG)3 RG.795 0.15 0.08 0.10 0.00 0.92D12 (ACTG)3 RG.652 1.00 0.97 0.09 0.00 0.36 individuals (W62, 66). Thus, there were 25/339 (8%)D14 (ACTG)3 RG.638 0.00 0.04 0.03 0.10 0.36 individuals for which the seed phenotypes did not matchD16 (ACTG)3 RG.635 0.97 0.98 1.00 0.80 0.94D18 (ACTG)3 RG.621 1.00 0.99 1.00 1.00 0.60 the cluster membership based on a UPGMA analysisD19 (ACTG)3 RG.604 1.00 0.99 1.00 1.00 0.79 of molecular data.D25 (ACTG)3 RG.485 0.00 0.27 0.95 1.00 0.04D26 (ACTG)3 RG.479 1.00 0.89 0.11 0.03 0.98D27 (ACTG)3 RG.434 1.00 0.90 0.05 0.00 0.03D28 (ACTG)3 RG.420 0.02 0.07 0.04 0.00 0.85 DISCUSSIOND29 (ACTG)3 RG.415 0.03 0.16 0.89 1.00 0.10D32 (ACTG)3 RG.345 1.00 0.99 1.00 0.97 0.47 Inter simple sequence repeats have been used to ex-D33 (ACTG)3 RG.333 0.00 0.04 0.04 0.07 0.85 plore genome structure, to assess genetic diversity within† B � Beige, NB � Negro Brillante, NO � Negro Opaco, R � Rojo, W � germplasm collections as well as to determine the fre-
wild. quency of simple sequence repeats in several species‡ The fragment name consists of the primer sequence followed by the
(Blair et al., 1999; Gilbert et al., 1999; Prevost and Wil-amplified fragment size expressed in bp.kinson, 1999). The ISSRs have proven to be a reliable,easy to generate, and versatile set of markers that doThe beige and red landraces did not have unique mark-
ers associated with them, but were missing some of the not require previous knowledge of the genome sequenceto generate DNA markers, unlike SSRs (Zietkiewiczbands observed in the other three accessions. Within each
population, markers were generally almost completely et al., 1994; Gupta et al., 1994). The flexibility to designprimers containing a di-, tri-, or tetra-nucleotide repeti-fixed. Their frequency was either close to one or zero,
especially in the domesticated populations, reflecting tive motif anchored by one or more nucleotides at the3� or 5� end make them ideal to explore the genome ofthe codominant nature of ISSRs (Fig. 4). Among domes-
ticated populations, most of the variation was distrib- any species, including those without previous knowledgeof DNA sequence. Several reports have compared theuted among and not within populations as shown by a
GST value (Nei, 1973) of 0.70 (HT � 0.23; HS � 0.07). level of polymorphism detected using RFLPs, RAPDs,and ISSRs (Nagaoka and Ogihara, 1997), and more re-Adding the wild population increased total genetic di-
versity but did not change the distribution of genetic cently ISSRs and AFLPs. The consensus is that ISSRsare very powerful to detect polymorphism, scan the wholediversity markedly (GST � 0.67; HT � 0.30; HS � 0.10).
These results are consistent with the predominantly self- genome, are inexpensive, and easy to generate. They candetect even more polymorphism than RFLPs (Kantetying nature of the species, as further confirmed by the
low values for Nm, the average number of migrants per et al., 1995) and more than AFLPs in rice (Blair et al.,1999). However, it is now becoming clear that the poly-generation (around 0.24). The Nm values of 1 are gener-

Rep
rodu
ced
from
Cro
p S
cien
ce. P
ublis
hed
by C
rop
Sci
ence
Soc
iety
of A
mer
ica.
All
copy
right
s re
serv
ed.
612 CROP SCIENCE, VOL. 45, MARCH–APRIL 2005
Fig. 4. Frequency distribution of markers within each of the five populations analyzed (B, Beige; NB, Negro Brillante; NO, Negro Opaco; R,Rojo; W, wild). The bimodal nature of the distributions reflects the codominant nature of the inter simple sequence repeat markers.
morphism detected by ISSRs is dependent on the plant cating the potential of this technique to measure geneticvariability in bean germplasm collections. The combi-species being investigated as well as the type of simple
sequence repeat incorporated in the ISSRs primer used nation of the four ISSR primers was sufficient to dis-tinguish all the populations included in this study. Gen-to amplify PCR products. Our results confirm these
earlier observations. Several characteristics make ISSRs eration of ISSR bands was based on four primers, twoof which included (GACA)4 as the repeat sequence an-also a very useful marker in common bean. They are
able to distinguish among closely related common bean chored either at the 3� or 5� end (Table 1). The doublepentanucleotide motif (GACAC)2 was not anchoredpopulations. The ISSR primers amplify fragments that
are dispersed throughout the genome as demonstrated but produced a very reliable and useful fingerprintingthat differentiated all the populations included in thisby mapping ISSR markers in the F8 generation of a
recombinant inbred population. The ISSR markers were study. Coverage of the whole genome by ISSRs has beenclaimed previously by others (Blair et al., 1999; Fangable to detect individual resulting from potential intro-
gression among wild and domesticated populations (al- and Roose, 1999). Nevertheless, ISSRs were difficult tomap in einkorn wheat (Kojima et al., 1998). In our map-though independent evidence is necessary for confirma-
tion, see below). ping, we found that a sample of some 50 markers mappedto 9 of the 11 linkage groups of the existing core geneticMicrosatellite fingerprinting in the genus Phaseolus was
investigated by Hamann et al. (1995), who concluded map of bean (Freyre et al., 1998). Although a tendencyfor clustering was observed among some of the markersthat the repetitive element (GATA)4 and, to a lesser ex-
tent, (GACA)4 were well represented in P. vulgaris and (Fig. 2), this has been also observed in some attemptsto map AFLPs markers in beans (R. Papa and P. Gepts,P. lunatus. They also concluded that that the dinucleo-
tide motif (CA)8 seemed to be less represented in the 2004, unpublished results).of P. vulgaris. On this basis, several of our primers There was a strong association between molecular hap-contained (GACA)3 and (GATA)3 as the repeat se- lotypes and seed color as 304/329 (92%) of the individu-quence. Among the five accessions tested in this study, als clustered with individuals showing the same seedwe found that the primers containing (GACA)3 as the re- color (Fig. 3). Conversely, 25/329 (8%) of the individualspetitive motif produced better amplification and higher grouped with individuals with seeds of a different color.polymorphism than those containing (GATA)3. Although A strong association is expected in predominantly self-a nonexhaustive effort was attempted to optimize and pollinated species (Hedrick et al., 1978). This reproduc-characterize all the primers designed for amplifying ISSRs, tive system leads to multilocus associations, whether theall the primers tested amplified fragments in beans, indi- loci involved are linked or not. Our results show that
ISSR markers in common bean are distributed over theTable 3. Genetic differentiation (FST) and number of migrants entire bean genome, although individual markers can(Nm) among populations included in this study.†
be linked (Fig. 2). Seed color and color pattern genes arePopulations Beige Negro Brillante Negro Opaco Rojo Wild also distributed throughout the bean genome (McCleanBeige 0.24 0.10 0.08 0.22 et al., 2002). Thus, in the absence of outcrossing and theNegro Brillante 0.68 0.52 0.19 0.25 ensuing recombination, multilocus associations betweenNegro Opaco 0.83 0.49 0.17 0.19
seed color and ISSR markers can be expected.Rojo 0.86 0.72 0.75 0.27Wild 0.69 0.67 0.73 0.65 Given this expectation, what is the origin of the indi-† Above the diagonal: Nm; below the diagonal: FST. viduals for which the association broke down? We sug-

Rep
rodu
ced
from
Cro
p S
cien
ce. P
ublis
hed
by C
rop
Sci
ence
Soc
iety
of A
mer
ica.
All
copy
right
s re
serv
ed.
GONZALEZ ET AL.: ISSRS IN SYMPATRIC WILD AND DOMESTICATED BEANS 613
gest that there are two possible reasons. First, these in- in Ibarra-Perez et al., 1997). Differences in outcrossingrates appeared to vary according to environmental con-dividuals could represent incomplete lineage sorting,
the latter being defined as the progressive loss of poly- ditions prevailing during the study, the bean genotypesinvolved, and the presence of pollinating insects.morphisms in related lineages of populations eventually
leading to the absence of shared polymorphisms. In the Debouck et al. (1993) and Freyre et al. (1996) identifiedseveral cases of gene flow from domesticated to wildtransitional period between the separation of the popu-
lations from their common ancestor and complete lin- beans in Colombia, Ecuador, and Bolivia. Beebe et al.(1997) mentioned that extensive wild-weedy-domesti-eage sorting, certain polymorphisms will remain shared
unless they arose after the separation such as the seed cated complexes of P. vulgaris were observed in regionsof Peru and Colombia where wild and domesticatedcolor alleles. The landraces included in this study are
probably not derived directly from the sympatric wild beans are sympatric. In the Mesoamerican gene pool,Vanderborght (1983) described the existence of weedypopulation as the Mesoamerican bean domestication has
been traced genetically to the west-central part of Mex- forms in Mexico and introgression rates of up to 50% inwild populations. Crosses between wild and domesti-ico (Jalisco and Guanajuato; Gepts, 1988). The archaeo-
logical record of common bean in Mesoamerica is cur- cated common beans yield viable and fertile progenies(Burkart and Brucher, 1953; Miranda Colın, 1979; Evans,rently not older than 2300 yr (Kaplan and Lynch, 1999).
Thus, on an evolutionary time scale, the separation be- 1980; Koenig and Gepts, 1989; Kornegay et al., 1993;Singh et al., 1995; Pereira et al., 1996; Mumba and Gal-tween wild and domesticated beans and among the dif-
ferent landraces may have been too short to achieve wey, 1998, 1999). With the exception of a preliminaryreport by Triana et al. (1993), all estimates of outcross-full lineage sorting.
An alternative explanation is that the unusual individ- ing in beans involved cultivars. Although the Triana et al.(1993) study involved wild as well as domesticated beans,uals actually result from hybridization one or more gen-
erations before the observations reported in this study. their study was conducted on a research station outsidethe natural distribution area of wild beans. Thus, furtherOn the basis of the dendrogram, the extent of introgres-
sion would reach about 8%. However, dendrograms may investigations into levels of outcrossing in common beanin different locations and years is of great interest. Addi-underestimate the frequency of hybrids because separate
clusters only appear when a sufficient number of mark- tional research is needed to determine whether the indi-viduals in which the correlation between seed color anders show significant differences in frequency. For exam-
ple, the two most closely related populations (Negro ISSR markers has apparently been broken or whichcarry unusual markers result from incomplete lineageOpaco and Negro Brillante; Table 3) could be distin-
guished by six markers (B25, B27, D12, D26, D27, and sorting or hybridization, or a combination of both.D29) with a frequency difference of at least 0.48 (Ta-ble 2). Introgression, however, may affect only a minor ACKNOWLEDGMENTSportion of the genome, which would only be detected We are grateful to the cooperation and assistance of Donwith a small number (1) of markers. These would not Vicente (Nauzontla, Puebla), farmer-owner of the field wherenecessarily be detected in a dendrogram. A different way the experiment took place. Field work would not have beenof analyzing this issue is to consider individual markers, possible without the assistance of Gabriel Flores Franco, Saraespecially those occurring at low frequency (�0.10 or Fuentes Soriano, Pedro Mercado Ruaro, Francisco Basurto,
and Leticia Torres Colın. This project was funded by the�0.05) in the different populations, but occur at a higherMcKnight Foundation, Minneapolis, MN, USA.frequency in the other populations analyzed (for exam-
ples, see Fig. 4). Individuals exhibiting one or more ofREFERENCESthese markers could have resulted from introgression (al-
though incomplete lineage sorting cannot be excluded, Bassam, B., G. Caetano-Anolles, and P. Gresshoff. 1991. Fast andsensitive silver staining of DNA in polyacrylamide gels. Anal. Bio-as pointed out earlier). At the more stringent level (5%),chem. 196:80–83.some 20 to 25% of the individuals carried one or more
Beebe, S., O. Toro, A. Gonzalez, M. Chacon, and D. Debouck. 1997.loci with low-frequency markers. For the less stringent Wild-weed-crop complexes of common bean (Phaseolus vulgariscriterion of 10%, the frequency ranged between 23% L., Fabaceae) in the Andes of Peru and Colombia, and their impli-
cations for conservation and breeding. Genet. Res. Crop Evol. 44:for the Beige population to 58% for the wild population73–91.(data not shown). Overall, these estimates of potentially
Beninger, C., G. Hosfield, M. Bassett, and S. Owens. 2000. Chemicaloutcrossed or introgressed individuals based on individ-and morphological expression of the B and Asp seedcoat genes in
ual loci were therefore higher that the estimates based Phaseolus vulgaris. J. Am. Soc. Hortic. Sci. 125:52–58.on the entire set of loci, obtained either statistically Blair, M., O. Panaud, and S. McCouch. 1999. Inter-simple sequence
repeats (ISSR) amplification for analysis of microsatellite motifor graphically.frequency and fingerprinting of rice (Oryza sativa L.). Theor. Appl.Common bean is considered a self-pollinated species,Genet. 98:780–792.but several lines of evidence suggest that outcrossing may Bretting, P.K., and M.P. Widrlechner. 1995. Genetic markers and
be occasionally important (Wells et al., 1988). Ibarra- plant genetic resource management. Plant Breed. Rev. 13:11–86.Burkart, A., and H. Brucher. 1953. Phaseolus aborigineus Burkart,Perez et al. (1997) recently summarized the literature
die mutmassliche andine Stammform der Kulturbohne. Zuchterreporting on experiments conducted to directly measure23:65–72.the level of outcrossing. Although the outcrossing rates Cattan-Toupance, I., Y. Michalakis, and C. Neema. 1998. Genetic
were generally below 5%, some studies reported higher structure of wild bean populations in their South-Andean centreof origin. Theor. Appl. Genet. 96:844–851.levels, reaching 60 to 80% in some instances (Table 1

Rep
rodu
ced
from
Cro
p S
cien
ce. P
ublis
hed
by C
rop
Sci
ence
Soc
iety
of A
mer
ica.
All
copy
right
s re
serv
ed.
614 CROP SCIENCE, VOL. 45, MARCH–APRIL 2005
Debouck, D.G., O. Toro, O.M. Paredes, W.C. Johnson, and P. Gepts. Kaplan, L., and T. Lynch. 1999. Phaseolus (Fabaceae) in archaeology:1993. Genetic diversity and ecological distribution of Phaseolus AMS radiocarbon dates and their significance for pre-Columbianvulgaris in northwestern South America. Econ. Bot. 47:408–423. agriculture. Econ. Bot. 53:261–272.
Dice, L.R. 1945. Measures of the amount of ecologic association Koenig, R., and P. Gepts. 1989. Segregation and linkage of genes forbetween species. Ecology 26:297–302. seed proteins, isozymes, and morphological traits in common bean
Doyle, J., and J. Doyle. 1987. A rapid DNA isolation procedure fro (Phaseolus vulgaris). J. Hered. 80:455–459.small quantities of fresh leaf tissue. Phytochem. Bull. 19:11–15. Kojima, T., T. Nagaoka, K. Noda, and Y. Ogihara. 1998. Genetic
Eiadthong, W., K. Yonemori, A. Sugiura, N. Utsunomiya, and S. linkage map of ISSR and RAPD markers in einkorn wheat inSubhadrabandhu. 1999. Identification of mango cultivars of Thai- relation to that of RFLP markers. Theor. Appl. Genet. 96:37–45.land and evaluation of their genetic variation using the amplified Kornegay, J., C. Cardona, and C.E. Posso. 1993. Inheritance of resis-fragments by simple sequence repeat-(SSR-) anchored primers. tance to Mexican bean weevil in common bean, determined bySci. Hortic. 82:57–66. bioassay and biochemical tests. Crop Sci. 33:589–594.
Esselman, E., L. Jianqiang, D. Crawford, J. Windus, and A. Wolfe. Lander, E.S., P. Green, J. Abrahamson, A. Barlow, M. Daly, S.E.1999. Clonal diversity in the rare Calamagrostis porteri ssp. insper- Lincoln, and L. Newburg. 1987. MAPMAKER: An interactiveata (Poaceae): Comparative results for allozymes and random am- computer package for constructing primary genetic linkage mapsplified polymorphic DNA (RAPD) and intersimple sequence re- of experimental and natural populations. Genomics 1:174–181.peat (ISSR) markers. Mol. Ecol. 8:443–451. Liston, A., B.L. Wilson, W.A. Robinson, P.S. Doescher, N.R. Harris,
Evans, A.M. 1980. Structure, variation, evolution, and classification and T. Svejcar. 2003. The relative importance of sexual reproduc-in Phaseolus. p. 337–347. In R.J. Summerfield and A.H. Bunting tion versus clonal spread in an aridland bunchgrass. Oecologia(ed.) Advances in legume science. Royal Botanic Gardens, Kew, UK. 137:216–225.
Fang, D., and M. Roose. 1997. Identification of closely related citrus Martins, M., R. Tenreiro, and M.M. Oliveira. 2003. Genetic related-cultivars with inter-simple sequence repeat markers. Theor. Appl. ness of Portuguese almond cultivars assessed by RAPD and ISSRGenet. 95:408–417. markers. Plant Cell Rep. 22:71–78.
Fang, D., and M. Roose. 1999. Inheritance of inter simple sequence McClean, P., R. Lee, C. Otto, P. Gepts, and M. Bassett. 2002. Molecu-repeat markers in citrus. J. Hered. 90:247–249. lar and phenotypic mapping of genes controlling seed coat pattern
Fang, D., R. Krueger, and M. Roose. 1998. Phylogenetic relationships and color in common bean (Phaseolus vulgaris L.). J. Hered.among selected Citrus germplasm accessions revealed by inter- 93:148–152.simple sequence repeat (ISSR) markers. J. Am. Soc. Hortic. Sci. Menendez, C., A. Hall, and P. Gepts. 1997. A genetic linkage map123:612–617. of cowpea (Vigna unguiculata) developed from a cross between
Fang, D., M. Roose, R. Krueger, and C. Federici. 1997. Fingerprinting two inbred, domesticated lines. Theor. Appl. Genet. 95:1210–1217.trifoliate orange germplasm accessions with isozymes, RFLPs, and Miranda Colın, S. 1979. Evolucion de Phaseolus vulgaris y P. coc-inter-simple sequence repeat markers. Theor. Appl. Genet. 95: cineus. p. 83–99. In E.M. Engleman (ed.) Contribuciones al conoci-211–219. miento del frijol (Phaseolus) en Mexico. Colegio de Postgraduados,Freyre, R., R. Rıos, L. Guzman, D. Debouck, and P. Gepts. 1996. Chapingo, Mexico.Ecogeographic distribution of Phaseolus spp. (Fabaceae) in Bo- Mumba, L., and N. Galwey. 1998. Compatibility of crosses betweenlivia. Econ. Bot. 50:195–215.
gene pools and evolutionary classes in the common bean (PhaseolusFreyre, R., P. Skroch, V. Geffroy, A.-F. Adam-Blondon, A. Shirmoha-vulgaris L.). Genet. Res. Crop Evol. 45:69–80.madali, W. Johnson, V. Llaca, R. Nodari, P. Pereira, S.-M. Tsai,
Mumba, L., and N. Galwey. 1999. Compatibility between wild andJ. Tohme, M. Dron, J. Nienhuis, C. Vallejos, and P. Gepts. 1998.cultivated common bean (Phaseolus vulgaris L.) genotypes of theTowards an integrated linkage map of common bean. 4. Develop-Mesoamerican and Andean gene pools: Evidence from the inheri-ment of a core map and alignment of RFLP maps. Theor. Appl.tance of quantitative characters. Euphytica 108:105–119.Genet. 97:847–856.
Nagaoka, T., and Y. Ogihara. 1997. Applicability of inter-simple se-Galvan, M.Z., B. Bornet, P.A. Balatti, and M. Branchard. 2003. Interquence repeat polymorphisms in wheat for use as DNA markerssimple sequence repeat (ISSR) markers as a tool for the assessmentin comparison to RFLP and RAPD markers. Theor. Appl. Genet.of both genetic diversity and gene pool origin in common bean94:597–602.(Phaseolus vulgaris L.). Euphytica 132:297–301.
Nei, M. 1973. Analysis of gene diversity in subdivided populations.Gepts, P. (ed.) 1988. Phaseolin as an evolutionary marker. p. 215–241.Proc. Natl. Acad. Sci. USA 70:3321–3323.In Genetic resources of Phaseolus beans. Kluwer, Dordrecht,
Neigel, J.E. 1997. A comparison of alternative strategies for estimatingthe Netherlands.gene flow from genetic markers. Annu. Rev. Ecol. Syst. 28:105–128.Gepts, P. 1995. Genetic markers and core collections. p. 127–146. In
Nodari, R.O., S.M. Tsai, R.L. Gilbertson, and P. Gepts. 1993. TowardsT. Hodgkin et al. (ed.) Core collections of plant genetic resources.an integrated linkage map of common bean. II. Development ofJohn Wiley & Sons, New York.an RFLP-based linkage map. Theor. Appl. Genet. 85:513–520.Gepts, P. 1998. Origin and evolution of common bean: Past events
Papa, R., and P. Gepts. 2003. Asymmetry of gene flow and differentialand recent trends. HortScience 33:1124–1130.geographical structure of molecular diversity in wild and domesti-Gilbert, J., R. Lewis, M. Wilkinson, and P. Caligari. 1999. Developingcated common bean (Phaseolus vulgaris L.) from Mesoamerica.an appropriate strategy to assess genetic variability in plant germ-Theor. Appl. Genet. 106:239–250.plasm collections. Theor. Appl. Genet. 98:1125–1131.
Pereira, P.A.A., J.E. de Souza Carneiro, H. Torres da Silva, M.J.Gupta, M., Y. Chyi, J. Romero-Severson, and J. Owen. 1994. Amplifi-Del Peloso, and P. Gepts. 1996. Introgressao de genes de feijoescation of DNA markers from evolutionarily diverse genomes usingsilvestres em feijao cultivado. p. 393–396. In Anais V Reuniaosingle primers of simple-sequence repeats. Theor. Appl. Genet. 89:Nacional de Pesquisa de Feijao, Goiania, GO. 14–18 Oct. 1996.998–1006.EMBRAPA-CNPAF, Goiania, GO, Brazil.Hamann, A., D. Zink, and W. Nagl. 1995. Microsatellite fingerprinting
Prevost, A., and M. Wilkinson. 1999. A new system of comparingin the genus Phaseolus. Genome 38:507–515.PCR primers applied to ISSR fingerprinting of potato cultivars.Hedrick, P., S. Jain, and L. Holden. 1978. Multilocus systems in evolu-Theor. Appl. Genet. 98:107–112.tion. Evol. Biol. 11:101–182.
Rohlf, F.J. 1997. NTSYS-pc. Numerical taxonomy and multivariateIbarra-Perez, F., B. Ehdaie, and G. Waines. 1997. Estimation of out-analysis system. v. 2.02. Exeter Software, Setauket, NY.crossing rate in common bean. Crop Sci. 37:60–65.
Sarla, N., S. Bobba, and E.A. Siddiq. 2003. ISSR and SSR markersJin, Y., T. He, and B.-R. Lu. 2003. Fine scale genetic structure in abased on AG and GA repeats delineate geographically diversewild soybean (Glycine soja) population and the implications forOryza nivara accessions and reveal rare alleles. Curr. Sci. 84:683–690.conservation. New Phytol. 159:513–519.
Schneider, S., D. Roessli, and L. Excoffier. 2000. Arlequin ver. 2.000:Kantety, R., X. Zeng, J. Bennetzen, and B. Zehr. 1995. AssessmentA software for population genetics data analysis [Online]. availableof genetic diversity in Dent and Popcorn (Zea mays L.) inbredat http://lgb.unige.ch/arlequin/ [verified 12 Nov. 2004]. Geneticslines using Inter-Simple Sequence Repeat (ISSR) amplification.
Mol. Breed. 1:365–373. and Biometry Laboratory, Univ. of Geneva, Switzerland.

Rep
rodu
ced
from
Cro
p S
cien
ce. P
ublis
hed
by C
rop
Sci
ence
Soc
iety
of A
mer
ica.
All
copy
right
s re
serv
ed.
GONZALEZ ET AL.: ISSRS IN SYMPATRIC WILD AND DOMESTICATED BEANS 615
Singh, S.P. 1982. A key for identification of different growth habits of inter-simple sequence repeat polymorphism in douglas-fir(Pseudotsuga menziesii) and sugi (Cryptomeria japonica). Theor.of Phaseolus vulgaris L. Annu. Rept. Bean Improv. Coop. 25:92–95.Appl. Genet. 92:40–45.Singh, S.P., P. Gepts, and D.G. Debouck. 1991. Races of common
Vanderborght, T. 1983. Evaluation of Phaseolus vulgaris wild typesbean (Phaseolus vulgaris L., Fabaceae). Econ. Bot. 45:379–396.and weedy forms. Plant Genet. Res. Newsl. 54:18–25.Singh, S.P., A. Molina, and P. Gepts. 1995. Potential of wild common
Wells, W.C., W.H. Isom, and J.G. Waines. 1988. Outcrossing rates ofbean for seed yield improvement of cultivars in the tropics. Can.six common bean lines. Crop Sci. 28:177–178.J. Plant Sci. 75:807–813.
Wolfe, A., Q. Xiang, S. Kephart, and Q. Xiang. 1998. Assessing hybrid-Tanyolac, B. 2003. Inter-simple sequence repeat (ISSR) and RAPDization in natural populations of Penstemon (Scrophulariaceae)variation among wild barley (Hordeum vulgare subsp. spontaneum)using hypervariable intersimple sequence repeat (ISSR) bands.populations from west Turkey. Genet. Res. Crop Evol. 50:611–614. Mol. Ecol. 7:1107–1125.
Tohme, J., D.O. Gonzalez, S. Beebe, and M.C. Duque. 1996. AFLP Yeh, F.C., R.-C. Yang, T.J.B. Boyle, Z.-H. Ye, and J.X.P. Mao. 1997.analysis of gene pools of a wild bean core collection. Crop Sci. POPGENE, the user-friendly shareware for population genetic36:1375–1384. analysis. Molecular Biology and Biotechnology Centre, Univ. of
Triana, B., M. Iwanaga, H. Rubiano, and M. Andrade. 1993. A study Alberta, Edmonton, AB, Canada.of allogamy in wild Phaseolus vulgaris. Annu. Rep. Bean Improv. Zietkiewicz, E., A. Rafalski, and D. Labuda. 1994. Genome finger-Coop. 36:20–21. printing by Simple Sequence Repeat (SSR)-anchored polymerase
chain reaction amplification. Genomics 20:176–183.Tsumura, Y., K. Ohba, and S. Strauss. 1996. Diversity and inheritance
Copyright © 2022 FDOKUMEN