Assessment of indoor air pollution exposure in urban hospital ...
9
Assessment of indoor air pollution exposure in urban hospital microenvironments Mahmoud Mohammadyan 1 & Sepideh Keyvani 2 & Ali Bahrami 3 & Kaan Yetilmezsoy 4 & Behzad Heibati 5 & Krystal J. Godri Pollitt 6 Received: 8 August 2018 /Accepted: 22 October 2018 /Published online: 25 October 2018 Abstract Hospitals are microenvironments containing populations with potentially enhanced sensitivity to air pollution. The objectives of this study were to characterize the concentration of indoor and outdoor size-fractionated particulate matter (PM) at two urban hospital sites in Kashan, Iran, and to evaluate the relationship between indoor and outdoor PM levels. PM 1.0 , PM 2.5 , and PM 10 concentrations were measured over a 3-month period outside each hospital with parallel sampling at four indoor locations in patient wards. The results indicated that mean indoor concentrations at the sampling sites (PM 1.0 = 17.8 μg/m 3 , PM 2.5 = 45.5 μg/ m 3 , and PM 10 = 162.7 μg/m 3 ) were found to be lower than outdoors levels (PM 1.0 = 20.6 μg/m 3 , PM 2.5 = 62.1 μg/m 3 , and PM 10 = 300.6 μg/m 3 ). Outdoor and indoor PM mass concentrations were associated with PM 1.0 , PM 2.5 , and PM 10.0 . Ambient wind speed also influenced the indoor/outdoor relationship for PM 1.0 and PM 2.5 but not for PM 10 . The average I/O ratios for PM 2.5 in the intensive care unit (ICU) and children’ s ward at Shahid Beheshti Hospital were close to or above 1.00. Indoor PM 1.0 and PM 2.5 concentrations were found to be positively associated with outdoor PM 1.0 and PM 2.5 concentrations, but no relation- ship was observed with PM 10 . The present findings may inform policymakers in implementing evidence-based efforts for the aim of improving the indoor air quality in closed and confined spaces. Keywords Indoor air quality . PM 2.5 . PM 10 . Hospitals . Iran Introduction Particulate matter (PM) exposure has been positively associated with adverse health. Enhanced PM sensitivity has been reported for children (less than 15), the elderly (over 65), and those with compromised immune systems and/or pre-existing health conditions (Park et al. 2013 ; Mohammadyan et al. 2017b ; WHO 2004 , 2006 , 2007 , 2009 ; Zereini and Wiseman 2010). Surveys of human activity patterns indi- cate a person spends on average 87% of their day in enclosed buildings (Klepeis et al. 2001). Consequently, personal exposure is primarily attributable to indoor PM Electronic supplementary material The online version of this article (https://doi.org/10.1007/s11869-018-0637-6) contains supplementary material, which is available to authorized users. * Behzad Heibati [email protected] Sepideh Keyvani [email protected] Krystal J. Godri Pollitt [email protected] 1 Health Sciences Research Centre, Faculty of Health, Mazandaran University of Medical Sciences, Sari, Iran 2 Department of Occupational Health, Faculty of Health, Mazandaran University of Medical Sciences, Sari, Iran 3 Department of Occupational Health, Faculty of Health, Kashan University of Medical Sciences, Kashan, Iran 4 Department of Environmental Engineering, Faculty of Civil Engineering, Yildiz Technical University, Davutpasa Campus, 34220 Esenler, Istanbul, Turkey 5 Air Pollution Research Center, Faculty of Health, Iran University of Medical Sciences, Tehran, Iran 6 Department of Environmental Health Sciences, Yale University, 60 College Street, New Haven, CT 06510, USA Air Quality, Atmosphere & Health (2019) 12:151–159 https://doi.org/10.1007/s11869-018-0637-6 # Springer Nature B.V. 2018
-
Upload
khangminh22 -
Category
Documents
-
view
1 -
download
0
Transcript of Assessment of indoor air pollution exposure in urban hospital ...
Assessment of indoor air pollution exposure in urbanhospital microenvironments
Mahmoud Mohammadyan1& Sepideh Keyvani2 & Ali Bahrami3 & Kaan Yetilmezsoy4 & Behzad Heibati5 &
Krystal J. Godri Pollitt6
Received: 8 August 2018 /Accepted: 22 October 2018 /Published online: 25 October 2018
AbstractHospitals are microenvironments containing populations with potentially enhanced sensitivity to air pollution. The objectives ofthis study were to characterize the concentration of indoor and outdoor size-fractionated particulate matter (PM) at two urbanhospital sites in Kashan, Iran, and to evaluate the relationship between indoor and outdoor PM levels. PM1.0, PM2.5, and PM10
concentrations were measured over a 3-month period outside each hospital with parallel sampling at four indoor locations inpatient wards. The results indicated that mean indoor concentrations at the sampling sites (PM1.0 = 17.8 μg/m3, PM2.5 = 45.5 μg/m3, and PM10 = 162.7 μg/m3) were found to be lower than outdoors levels (PM1.0 = 20.6 μg/m3, PM2.5 = 62.1 μg/m3, andPM10 = 300.6 μg/m3). Outdoor and indoor PM mass concentrations were associated with PM1.0, PM2.5, and PM10.0. Ambientwind speed also influenced the indoor/outdoor relationship for PM1.0 and PM2.5 but not for PM10. The average I/O ratios forPM2.5 in the intensive care unit (ICU) and children’s ward at Shahid Beheshti Hospital were close to or above 1.00. Indoor PM1.0
and PM2.5 concentrations were found to be positively associated with outdoor PM1.0 and PM2.5 concentrations, but no relation-ship was observedwith PM10. The present findingsmay inform policymakers in implementing evidence-based efforts for the aimof improving the indoor air quality in closed and confined spaces.
Keywords Indoor air quality . PM2.5. PM10
. Hospitals . Iran
Introduction
Particulate matter (PM) exposure has been positively associatedwith adverse health. Enhanced PM sensitivity has been reportedfor children (less than 15), the elderly (over 65), and those withcompromised immune systems and/or pre-existing health
conditions (Park et al. 2013; Mohammadyan et al.2017b; WHO 2004, 2006, 2007, 2009; Zereini andWiseman 2010). Surveys of human activity patterns indi-cate a person spends on average 87% of their day inenclosed buildings (Klepeis et al. 2001). Consequently,personal exposure is primarily attributable to indoor PM
Electronic supplementary material The online version of this article(https://doi.org/10.1007/s11869-018-0637-6) contains supplementarymaterial, which is available to authorized users.
* Behzad [email protected]
Sepideh [email protected]
Krystal J. Godri [email protected]
1 Health Sciences Research Centre, Faculty of Health, MazandaranUniversity of Medical Sciences, Sari, Iran
2 Department of Occupational Health, Faculty of Health, MazandaranUniversity of Medical Sciences, Sari, Iran
3 Department of Occupational Health, Faculty of Health, KashanUniversity of Medical Sciences, Kashan, Iran
4 Department of Environmental Engineering, Faculty of CivilEngineering, Yildiz Technical University, Davutpasa Campus,34220 Esenler, Istanbul, Turkey
5 Air Pollution Research Center, Faculty of Health, Iran University ofMedical Sciences, Tehran, Iran
6 Department of Environmental Health Sciences, Yale University, 60College Street, New Haven, CT 06510, USA
Air Quality, Atmosphere & Health (2019) 12:151–159https://doi.org/10.1007/s11869-018-0637-6
# Springer Nature B.V. 2018
concentrations rather than the outdoor environment. Inparticular, indoor exposure to PM has been consistently associ-ated with increased risk of lower respiratory infection in chil-dren and respiratory diseases among other vulnerable peoplesuch as the elderly (Campbell 1997; Ezzati and Kammen2001; Ghozikali et al. 2016a, b; Gurley et al. 2013; Smithet al. 2000; Pope et al. 2017). Gurley et al. (2013) reported thatincreased exposure to indoor PMwas associated with enhancedincidence of acute lower respiratory infection in children. Inanother study, Smith et al. (2000) reviewed acute lower respi-ratory infection and pneumonia in children under the age of2 years. They found that elevated indoor PM emitted fromcombustion of biomass fuels was associated with a higher inci-dence of acute lower respiratory infection and pneumonia.
The indoor-to-outdoor (I/O) ratio of PMmass concentrationshas been widely explored in the literature (Chen and Zhao2011; Wang et al. 2016; Zhao et al. 2015; López-Villarrubiaet al. 2016). Indoor/outdoor (I/O) ratio of PM mass concentra-tions can vary due to a larger number of factors including loca-tions, building design, and human activities. The results of theseprevious studies showed that an important background contri-bution to indoor PM from penetration of outdoor PM, andindoor sources (e.g., cooking, smoking, cleaning, and generalactivity) contributed to indoor concentrations of PM less than10 μm (PM10). While cleaning and general activity have beenreported to have minimal influence on concentrations withinthis size range, cooking and smoking (Vu et al. 2017) have beensuggested to be major indoor sources of PM less than 2.5 μm(PM2.5) and PM less than 1 μm (PM1.0).
Indoor air quality in hospitals and health facilities requiresparticular attention for the potentially high sensitivity of oc-cupants to PM exposure (Chamseddine and El-Fadel 2015;Eames et al. 2009; Slezakova et al. 2012). Themain objectivesof this study were to assess the indoor and outdoor PM massconcentrations and to evaluate the I/O ratio of PM mass con-centrations (if indoor PM levels were attributable to indoorsources or the result of penetration of outdoor PM) at two largepublic hospitals in the city of Kashan, Iran.
Materials and methods
Study location
The study was conducted at two hospitals in Kashan, Iran(latitude 33°98′59′′N, longitude 51°41′27′′E). This city has apopulation of 275,000 and is located in the province ofIsfahan, situated in central Iran at an elevation of 924 m abovesea level. A number of industrial facilities are located in thesouth-east region of Kashan, including sand and gravelmanufacturing, steel factories, textile industries, plastic pro-duction factories, and car manufacturing companies. This
industrial activity, which is approximately 10 km from the citycenter, is a major source of the ambient air pollution.
Participating hospitals
Ambient PM concentrations were measured at indoor andoutdoor sites at two public hospitals in Kashan (Fig. 1).Naghavi Hospital (latitude 33°59′13′′N, longitude 51°26′39′′E) is located in the city center, while Shahid Beheshti Hospital(latitude 33°00′46′′N, longitude 51°24′24′′E) is 10 km awayfrom the Kashan city center. Both hospitals had a similarbuilding design with ceramic flooring. No mechanical venti-lation or air conditioning was in use during the study period(March toMay 2014). However, some windows were opened,particularly during warm weather period (temperature >25 °C), which is 90% of days during the sampling period.All wards were heated through a central heating system(radiators) when the temperature dropped below 15.5 °C.The boiler was located in a separate room in the basement ofthe hospitals’ building.
Air pollution sampling
For indoor and outdoor measurements, a GRIMM dust mon-itor (GRIMM Aerosol Technik Gmbh & Co. KG, Ainrig,Germany, model 1.108) was used to measure PM1.0, PM2.5,and PM10 concentrations. An instrument flow rate of 1.2 L/min was used for all sample collection. The GRIMM monitor(GRIMM Aerosol Technik GmbH & Co. KG) contains a tef-lon filter to collect PMduring real-timemonitoring. Followingmanufacturer’s protocols, PM loaded on this filter is used forthe gravimetric calibration of optical measurements. Duringthe present study, PM was collected onto the filter in theGRIMM monitor over a 10-day monitoring period. Filterswere weighted on a microbalance (Fa-2104 AnalyticalElectronic Balance) in a humidity- and temperature-controlled room located at the Mazandaran University ofMedical Sciences. The total PM mass loaded on filters wasdivided by the calculated total volume of air sampled duringthe monitoring period to determine the mean gravimetric PMmass concentrations. Average gravimetric concentrationswere then divided by the mean particle concentrationsdownloaded from respective instruments to obtain gravimetriccalibration factors. All real-time data were multiplied by theC-factor to calculate the corrected concentrations.
Real-timemonitoring was carried out at indoor and outdoorsites over 31 days (from March 8, 2014 to May 9, 2014) with9 days in March, 17 days in April, and 5 days in May. Theindoor monitor was placed in the center of corridors or roomsin three wards (operation room and children and ICU wards)at the Shahid Beheshti Hospital and in the center of the corri-dor in the operation room at the Naghavi Hospital. The PMsampling unit was positioned 1.5 m above the floor,
152 Air Qual Atmos Health (2019) 12:151–159

corresponding to the breathing zone of an adult. Outdoormonitoring was conducted in the hospital yard. The PM mon-itor was positioned 1 m away from any obstacle and 1.5 mabove the ground (Fig. 2).
Limited availability of PM instrumentation restricted sam-pling to a single location at one time. To minimize the effectsof any diurnal variation across sites, 1-min averaged PMmass
concentrations were collected over a 5-min period at eachsampling site, alternating between indoor and outdoor loca-tions. PM was evaluated at each sampling location twice aday, once in the morning (08:00 to 12:00) and in the afternoon(13:00 to 15:00) at each hospital over 31 days. The total mon-itoring time at each sampling location across the samplingcampaign was 51 min for each monitoring location. The
Fig. 1 Study locations of Naghavi and Shahid Beheshti hospitals in the city of Kashan
Fig. 2 Sampling locations of thehospitals and the monitor location
Air Qual Atmos Health (2019) 12:151–159 153
sampled air was collected by a sampling pump and passedthrough the instrument continuously. This flow configurationprevented the contamination of the sample.
Determinants of indoor PM concentrations
Factors that were deemed to be potential determinants of in-door PM concentrations were characterized for each samplinglocation during the monitoring period. These factors includedthe number of people in the vicinity of the monitoring locationand air ventilation. A technician operating the PM instrumentcompleted questionnaires to quantify these factors for eachsampling location and interval. The technician also noted op-eration of the heating system in door and room areas.Information on hourly wind speed, temperature, and relativehumidity were obtained from a nearby meteorological station(latitude 33°58′59″N and longitude 51°26′11″E) (Fig. 2).
Statistical analyses
All size fractions of PM concentration are presented as the meanwith the associated standard deviation (SD). The normality ofPM mass concentration measurements was graphically assessed
using quantile-quantile plots and also formally using theKolmogorov–Smirnov test. Differences between paired PM in-door and outdoor measurements were assessed using theKruskal–Wallis test for each hospital wards (operation room,pediatrics, and intensive care units). The association for eachindoor and outdoor PM size fraction and I/O PM mass ratioswith environmental variables (door and room areas, hourly windspeed and wind direction, temperature, relative humidity, andnumber of people)was further evaluated individually using linearregression models, in which the independent variables were theindoor PM1.0, PM2.5, and PM10 concentrations. A p value < 0.05was considered to be significant at 95% confidence level.
Results
Descriptive analysis of indoor and outdoor hospitalenvironments
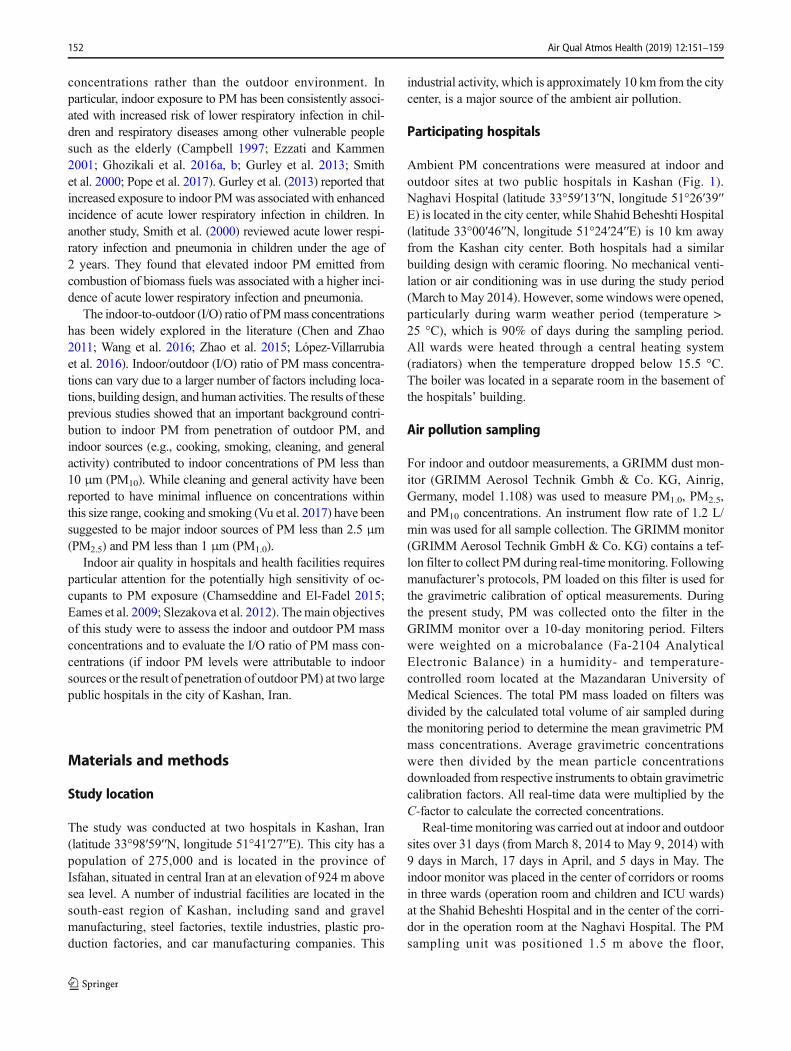
Within the framework of the sampling campaign, tempera-tures ranged from 6.9 to 27.8 °C in the city of Kashan. Theaverage temperature was 20.5 °C (SD = 12.5 °C, where SDdenotes standard deviation). Table 1 summarizes the
Table 1 Descriptive statistics of indoor PM1.0, PM2.5, and PM10 concentrations (μg/m3) in hospital wards and paired outdoor PM1.0, PM2.5, and PM10
concentrations
Ward Location Size fraction Mean Standard deviation Median Interquartile range Range
Naghavi Hospital Operation room Indoor PM10 145.5 176.4 100.5 78.7 26.3–1398.3
PM2.5 45.3 56.4 28.1 26.0 10.3–439.5
PM1.0 17.0 14.7 12.6 10.2 5.3–119.2
Outdoor PM10 304.4 287.6 191.4 227.1 64.3–1327.3
PM2.5 62.7 49.9 44.8 39.0 16.8–228.4
PM1.0 21.5 11.9 18.1 14.6 6.3–58.5
Shahid Beheshti Hospital Operation room Indoor PM10 166.5 167.7 114.2 111.9 22.3–995.2
PM2.5 42.0 42.4 29.4 29.4 8.0–227.7
PM1.0 16.1 10.9 13.3 10.9 4.3–53.7
Outdoor PM10 265.7 372.2 164.2 146.3 22.1–2353.6
PM2.5 57.4 66.9 38.6 30.4 6.8–416.4
PM1.0 19.8 14.7 16.3 14.8 2.5–86.6
Pediatric Indoor PM10 227.1 311.9 144.1 92.2 20.0–2395.6
PM2.5 55.8 76.7 36.1 22.4 11.5–496.9
PM1.0 19.3 18.0 15.1 9.9 4.5–113.4
Outdoor PM10 429.3 1225.6 136.5 130 35.4–7541.5
PM2.5 79.9 176.2 36.6 29.7 12.5–1036.4
PM1.0 23.5 34.9 15.8 9.9 5.0–210.6
Intensive care unit Indoor PM10 112.5 84.9 89.5 73.5 5.0–442.3
PM2.5 38.6 42.0 26.9 27.2 4.3–341.1
PM1.0 18.7 30.4 11.5 14.3 2.0–293.9
Outdoor PM10 200.4 255.0 124.6 117.4 26.6–1291
PM2.5 48.1 47.4 31.7 26.4 9.5–231.2
PM1.0 17.5 10.8 15.3 12.0 3.8–47.7
154 Air Qual Atmos Health (2019) 12:151–159

descriptive statistics and cumulative frequency results of theoutdoor and indoor PM1.0, PM2.5, and PM10 concentrationsmeasured in each of the hospital wards.
The mean outdoor PM1.0 concentrations in operationrooms (Beheshti, 19.8 μg/m3, SD = 14.7 μg/m3; Naghavi,21.5 μg/m3, SD = 11.9 μg/m3) and children ward (23.5 μg/m3, SD = 34.9 μg/m3) were higher than the mean of indoorPM1.0 concentrations in operation rooms (Beheshti, 16.1 μg/m3, SD = 10.9 μg/m3; Naghavi, 17.0 μg/m3, SD = 14.7 μg/m3) and children ward (19.3 μg/m3, SD = 18.0 μg/m3), re-spectively (p ≤ 0.01). The mean outdoor PM2.5 concentrationsin operation rooms (Beheshti, 62.7 μg/m3, SD = 49.9 μg/m3;Naghavi, 57.4 μg/m3, SD = 66.9 μg/m3), children ward(79.9 μg/m3, SD = 176.2 μg/m3), and ICU (48.1 μg/m3,SD = 47.4 μg/m3) were higher than the mean of indoorPM2.5 concentrations in operation rooms (Beheshti, 42.0 μg/m3, SD = 42.4 μg/m3; Naghavi, 45.3 μg/m3, SD = 56.4 μg/m3), children ward (55.8 μg/m3, SD = 76.7 μg/m3), and ICU(38.6 μg/m3, SD = 42.0 μg/m3), respectively (p ≤ 0.01).
Moreover, the mean outdoor PM10 concentrations in oper-ation rooms (Beheshti, 265.7 μg/m3, SD = 372.2 μg/m3;Naghavi, 304.4 μg/m3, SD = 287.6), children ward(429.3 μg/m3, SD = 1225.6 μg/m3), and ICU (200.4 μg/m3,SD = 255 μg/m3) were higher than the mean of indoor PM10
concentrations in operation rooms (Beheshti, 166.5 μg/m3,SD = 167.7 μg/m3; Naghavi, 145.5 μg/m3, SD = 176.4 μg/m3), children ward (227.1 μg/m3, SD = 311.9 μg/m3), andICU (112.5 μg/m3, SD = 84.9 μg/m3), respectively (p ≤ 0.01).
The maximum PM concentrations measured in the presentstudy were observed in the children’s ward at Shahid BeheshtiHospital in a warm (26.8 °C) but highly windy (26.0 m/s) dayin April (PM1.0, 19.3 μg/m3; PM2.5, 2396 μg/m3; and PM10,497 μg/m3) (Table 1). These elevated concentrations wereprimarily observed when a large number of occupants with ahigh movement and activity were inside the patient’s roomand the door was left open to outside.
Table 2 summarizes building characteristics of indoor hos-pital spaces as well as meteorological parameters. The hospitalrooms characterized in this study accommodated between 5and 13 patients for areas ranging from 18.0 to 50.0 m2. Themean door areas open to other spaces and opening windowareas to outdoor were 3.3 m2 and 0.88 m2, respectively.
Relative humidity varied from 18 to 69%, and the averagewind speed was 8.6 m/s during the monitoring period (rangingfrom 0 to 26 m/s). Significant differences were found betweenconcentrations of indoor and outdoor size-fractionated partic-ulate matter (PM1.0, PM2.5, and PM10) in all patient wards atthe two hospital sites (p < 0.001).
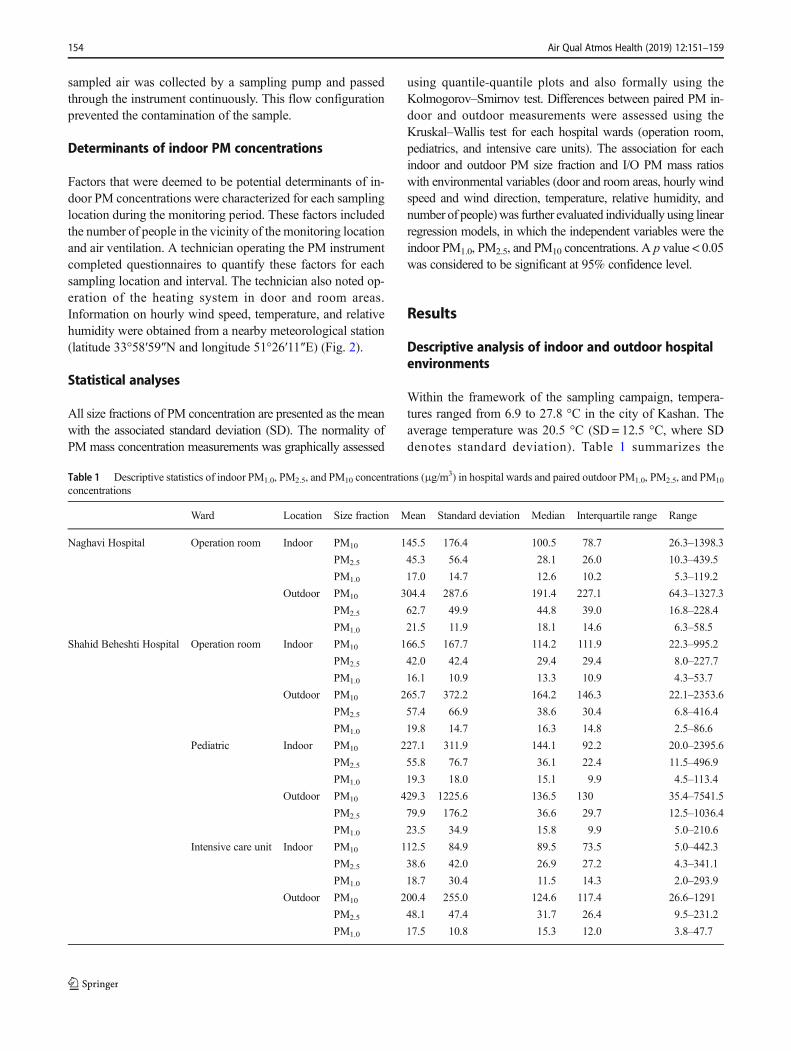
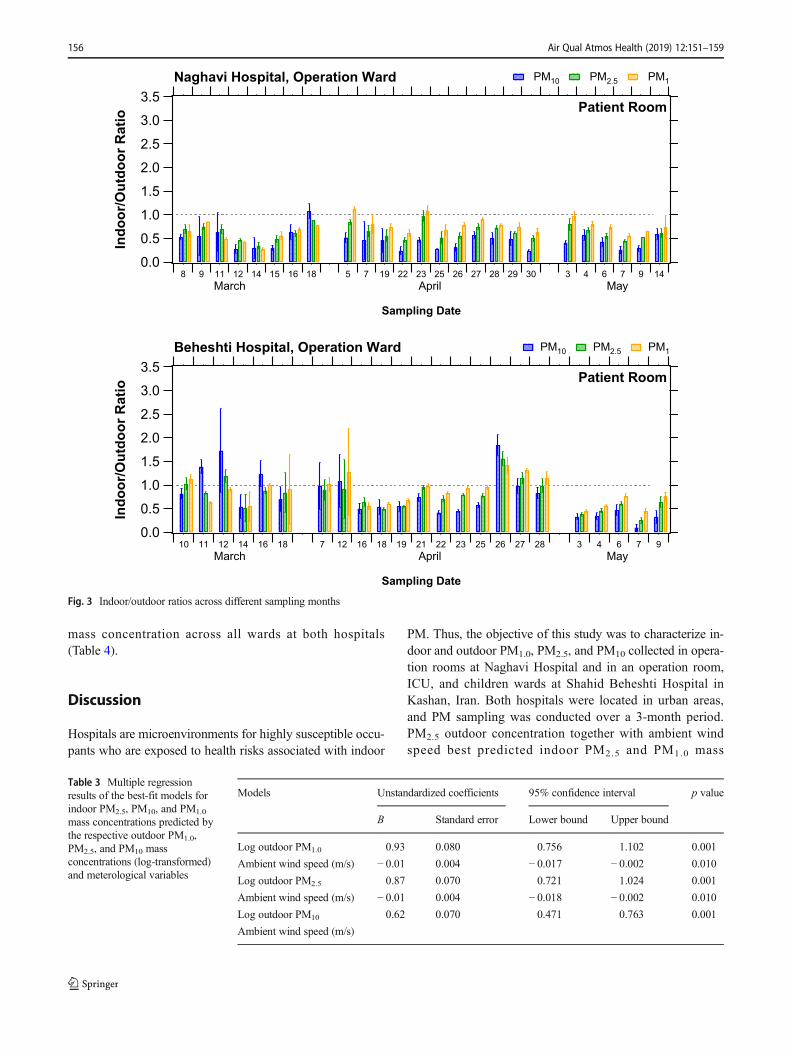
Indoor-to-outdoor ratios of size-fractioned PMmeasured
The I/O PM mass ratios for the different wards of two hospi-tals are shown in Fig. 3 and Fig. S1–4. The average I/O PM2.5
mass ratio (0.92, SD = 0.43) in the operation ward at ShahidBeheshti Hospital was greater than that obtained for NaghaviHospital (0.7, SD = 0.13). The I/O PM mass ratio of the ICUward for PM2.5 mass (0.84, SD = 0.50) was lower than that ofthe other wards at Shahid Beheshti Hospital. The highest I/OPM2.5 mass ratio was 2.28 (SD = 0.57) in the children’s wardat Shahid Beheshti Hospital. No difference was found be-tween the average I/O ratios across all size-fractioned PMmass on weekends (0.93, SD = 0.50) compared to weekdays(0.88, SD = 0.43).
Determinants of indoor PM1.0, PM2.5, and PM10
concentration
Indoor PM2.5 concentration in all wards was found to be pos-itively associated with outdoor PM2.5 concentration and am-bient wind speed (Table 3). These two variables accounted for83% of the variation in indoor PM2.5 concentrations. Othervariables, such as number of occupants, ambient temperature,door area, windows area, and room area, were not found to besignificant predictors of indoor PM2.5 concentrations. IndoorPM1.0 concentration was also associated with outdoor PM1.0
and ambient wind speed (Table 3). These variables accountedfor 81% of variation in indoor PM1.0 concentrations. In con-trast to the other PM size fractions measured, indoor PM10
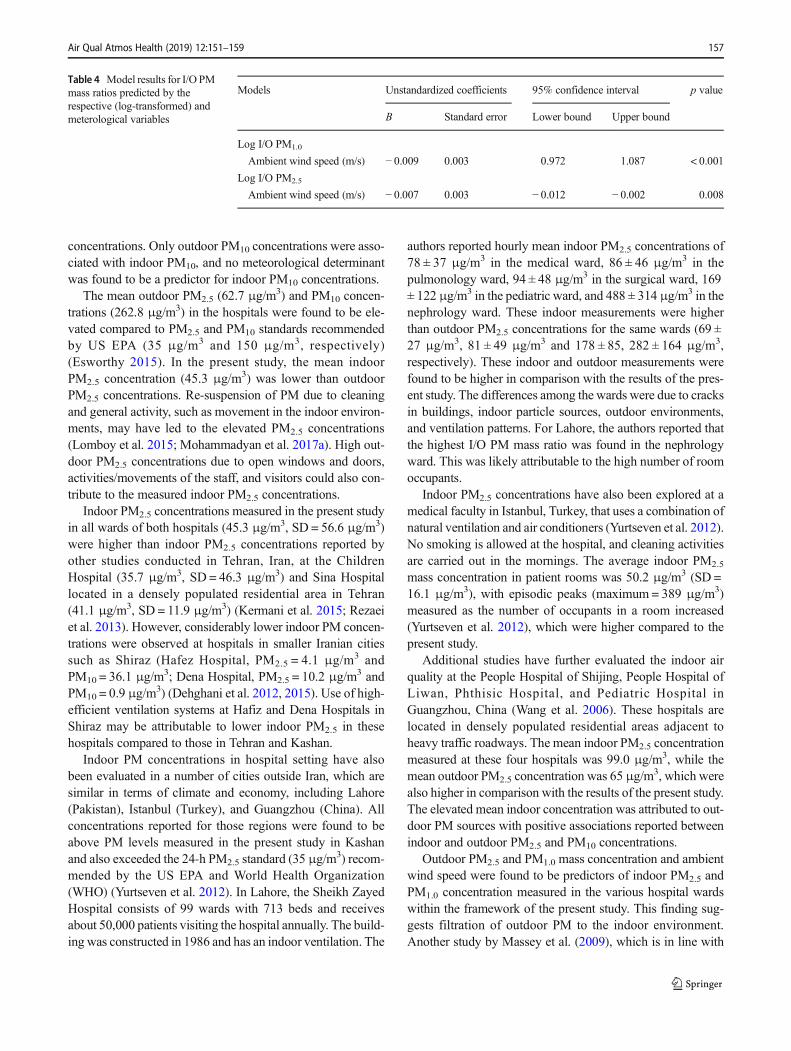
was only found to be associated with only outdoor PM10 butnot with ambient wind speed. Outdoor PM10 mass concentra-tions accounted for 72% of variation in indoor PM10 concen-tration. When evaluating I/O PM mass ratios, wind speed wasfound to be associated with I/O ratios of PM1.0 and PM2.5
Table 2 Descriptive statistics ofthe hospital buildingcharacteristics and meterologicalvariables across the 31-day studyperiod
Variable Mean Standard deviation Minimum Maximum
Room’s area (m2) 27.7 14.5 18.0 50.0
Door area (m2) 3.3 0.9 1.5 4.0
Opening area to outdoor (m2) 0.88 0.8 1.5 3.0
Number of people indoor 7.6 1.3 5.0 13.0
Ambient temperature (°C) 19.8 4.6 7.3 26.8
Ambient relative humidity (%) 34.8 12.5 18.0 69.0
Ambient wind speed (m/s) 7.6 5.8 0.0 26.0
Air Qual Atmos Health (2019) 12:151–159 155
mass concentration across all wards at both hospitals(Table 4).
Discussion
Hospitals are microenvironments for highly susceptible occu-pants who are exposed to health risks associated with indoor
PM. Thus, the objective of this study was to characterize in-door and outdoor PM1.0, PM2.5, and PM10 collected in opera-tion rooms at Naghavi Hospital and in an operation room,ICU, and children wards at Shahid Beheshti Hospital inKashan, Iran. Both hospitals were located in urban areas,and PM sampling was conducted over a 3-month period.PM2.5 outdoor concentration together with ambient windspeed best predicted indoor PM2.5 and PM1.0 mass
3.5
3.0
2.5
2.0
1.5
1.0
0.5
0.0
Indo
or/O
utdo
or R
atio
8 9 11 12 14 15 16 18 5 7 19 22 23 25 26 27 28 29 30 3 4 6 7 9 14
Sampling Date
yaMlirpAMarch
Patient Room
Naghavi Hospital, Operation Ward PM10 PM2.5 PM1
3.5
3.0
2.5
2.0
1.5
1.0
0.5
0.0
Indo
or/O
utdo
or R
atio
10 11 12 14 16 18 7 12 16 18 19 21 22 23 25 26 27 28 3 4 6 7 9
Sampling Date
yaMlirpAhcraM
Beheshti Hospital, Operation Ward
Patient Room
PM10 PM2.5 PM1
Fig. 3 Indoor/outdoor ratios across different sampling months
Table 3 Multiple regressionresults of the best-fit models forindoor PM2.5, PM10, and PM1.0
mass concentrations predicted bythe respective outdoor PM1.0,PM2.5, and PM10 massconcentrations (log-transformed)and meterological variables
Models Unstandardized coefficients 95% confidence interval p value
B Standard error Lower bound Upper bound
Log outdoor PM1.0 0.93 0.080 0.756 1.102 0.001
Ambient wind speed (m/s) − 0.01 0.004 − 0.017 − 0.002 0.010
Log outdoor PM2.5 0.87 0.070 0.721 1.024 0.001
Ambient wind speed (m/s) − 0.01 0.004 − 0.018 − 0.002 0.010
Log outdoor PM10 0.62 0.070 0.471 0.763 0.001
Ambient wind speed (m/s)
156 Air Qual Atmos Health (2019) 12:151–159
concentrations. Only outdoor PM10 concentrations were asso-ciated with indoor PM10, and no meteorological determinantwas found to be a predictor for indoor PM10 concentrations.
The mean outdoor PM2.5 (62.7 μg/m3) and PM10 concen-trations (262.8 μg/m3) in the hospitals were found to be ele-vated compared to PM2.5 and PM10 standards recommendedby US EPA (35 μg/m3 and 150 μg/m3, respectively)(Esworthy 2015). In the present study, the mean indoorPM2.5 concentration (45.3 μg/m3) was lower than outdoorPM2.5 concentrations. Re-suspension of PM due to cleaningand general activity, such as movement in the indoor environ-ments, may have led to the elevated PM2.5 concentrations(Lomboy et al. 2015; Mohammadyan et al. 2017a). High out-door PM2.5 concentrations due to open windows and doors,activities/movements of the staff, and visitors could also con-tribute to the measured indoor PM2.5 concentrations.
Indoor PM2.5 concentrations measured in the present studyin all wards of both hospitals (45.3 μg/m3, SD = 56.6 μg/m3)were higher than indoor PM2.5 concentrations reported byother studies conducted in Tehran, Iran, at the ChildrenHospital (35.7 μg/m3, SD = 46.3 μg/m3) and Sina Hospitallocated in a densely populated residential area in Tehran(41.1 μg/m3, SD = 11.9 μg/m3) (Kermani et al. 2015; Rezaeiet al. 2013). However, considerably lower indoor PM concen-trations were observed at hospitals in smaller Iranian citiessuch as Shiraz (Hafez Hospital, PM2.5 = 4.1 μg/m3 andPM10 = 36.1 μg/m3; Dena Hospital, PM2.5 = 10.2 μg/m3 andPM10 = 0.9 μg/m3) (Dehghani et al. 2012, 2015). Use of high-efficient ventilation systems at Hafiz and Dena Hospitals inShiraz may be attributable to lower indoor PM2.5 in thesehospitals compared to those in Tehran and Kashan.
Indoor PM concentrations in hospital setting have alsobeen evaluated in a number of cities outside Iran, which aresimilar in terms of climate and economy, including Lahore(Pakistan), Istanbul (Turkey), and Guangzhou (China). Allconcentrations reported for those regions were found to beabove PM levels measured in the present study in Kashanand also exceeded the 24-h PM2.5 standard (35 μg/m
3) recom-mended by the US EPA and World Health Organization(WHO) (Yurtseven et al. 2012). In Lahore, the Sheikh ZayedHospital consists of 99 wards with 713 beds and receivesabout 50,000 patients visiting the hospital annually. The build-ing was constructed in 1986 and has an indoor ventilation. The
authors reported hourly mean indoor PM2.5 concentrations of78 ± 37 μg/m3 in the medical ward, 86 ± 46 μg/m3 in thepulmonology ward, 94 ± 48 μg/m3 in the surgical ward, 169± 122 μg/m3 in the pediatric ward, and 488 ± 314 μg/m3 in thenephrology ward. These indoor measurements were higherthan outdoor PM2.5 concentrations for the same wards (69 ±27 μg/m3, 81 ± 49 μg/m3 and 178 ± 85, 282 ± 164 μg/m3,respectively). These indoor and outdoor measurements werefound to be higher in comparison with the results of the pres-ent study. The differences among the wards were due to cracksin buildings, indoor particle sources, outdoor environments,and ventilation patterns. For Lahore, the authors reported thatthe highest I/O PM mass ratio was found in the nephrologyward. This was likely attributable to the high number of roomoccupants.
Indoor PM2.5 concentrations have also been explored at amedical faculty in Istanbul, Turkey, that uses a combination ofnatural ventilation and air conditioners (Yurtseven et al. 2012).No smoking is allowed at the hospital, and cleaning activitiesare carried out in the mornings. The average indoor PM2.5
mass concentration in patient rooms was 50.2 μg/m3 (SD =16.1 μg/m3), with episodic peaks (maximum = 389 μg/m3)measured as the number of occupants in a room increased(Yurtseven et al. 2012), which were higher compared to thepresent study.
Additional studies have further evaluated the indoor airquality at the People Hospital of Shijing, People Hospital ofLiwan, Phthisic Hospital, and Pediatric Hospital inGuangzhou, China (Wang et al. 2006). These hospitals arelocated in densely populated residential areas adjacent toheavy traffic roadways. The mean indoor PM2.5 concentrationmeasured at these four hospitals was 99.0 μg/m3, while themean outdoor PM2.5 concentration was 65 μg/m
3, which werealso higher in comparison with the results of the present study.The elevated mean indoor concentration was attributed to out-door PM sources with positive associations reported betweenindoor and outdoor PM2.5 and PM10 concentrations.
Outdoor PM2.5 and PM1.0 mass concentration and ambientwind speed were found to be predictors of indoor PM2.5 andPM1.0 concentration measured in the various hospital wardswithin the framework of the present study. This finding sug-gests filtration of outdoor PM to the indoor environment.Another study by Massey et al. (2009), which is in line with
Table 4 Model results for I/O PMmass ratios predicted by therespective (log-transformed) andmeterological variables
Models Unstandardized coefficients 95% confidence interval p value
B Standard error Lower bound Upper bound
Log I/O PM1.0
Ambient wind speed (m/s) − 0.009 0.003 0.972 1.087 < 0.001
Log I/O PM2.5
Ambient wind speed (m/s) − 0.007 0.003 − 0.012 − 0.002 0.008
Air Qual Atmos Health (2019) 12:151–159 157

the present results, considered the influence of outdoor windspeed on PM concentrations in indoor environments. The au-thors measured PM2.5 concentrations inside and outside thehomes located in roadside, rural and urban area, along with thefield survey study done in the same region in Agra, India. Thehighest average PM2.5 and PM1.0 indoor concentrations werefound for the rural homes (173.03 μg/m3 and 133.26 μg/m3,respectively) followed by roadside homes (137.93 μg/m3 and117.09 μg/m3, respectively), and then by urban homes(135.55 μg/m3 and 102.92 μg/m3, respectively). The elevatedmean indoor concentrations compared to outdoor were con-sistent with the fact that indoor PM1.0 and PM2.5 were not onlyfrom outdoor environment through infiltration but also fromindoor sources/activities. The average I/O ratios for PM2.5,PM1.0, PM0.5, and PM0.25 concentrations in roadside areaswere close to 1 (0.98, 0.96, 0.98, and 0.98), for rural areaswere 1 or larger than 1 (1.11, 1.08, 1.00, and 1.17), and forurban areas were smaller than 1 (0.92, 0.87, 0.80, and 0.95),respectively. The authors reported that these ratios were relat-ed to indoor activities using occupants’ diary entries. A posi-tive correlation was further found between indoor and outdoorPM concentrations (Massey et al. 2009).
Indoor/outdoor (I/O) concentrations can vary largelydue to a larger number of factors, including locations,building design, different activities, and the time. I/O ratiois an indicator for evaluating the difference between indoorconcentrations and the corresponding outdoor levels(Massey et al. 2009). These ratios calculated in the presentstudy are shown in Fig. 3. Elevated I/O PM mass ratioswere observed on weekends compared to weekdays in thepresent study. These elevated I/O PM mass ratios may beattributable to activity patterns which could have lead toresuspension of PM. In contrast to weekends with littleactivity, more clinicians and nurses observed patient roomson weekdays at the hospital. In addition, the average I/Oratio in operation room was greater than 1 on some days inApril (05, 21, 26–28), which could be attributed to an out-door PM emission source (Chen and Zhao 2011).
Limitations
Due to logistic limitations, we were not able to conduct theoutdoor and indoor measurements simultaneously at both hos-pitals. One instrument was used to sequentially measure in-door and outdoor PM concentrations across sampling sites.For this reason, 1-min averaged PMmass concentrations werecollected over a 5-min period at each sampling site, alternatingbetween indoor and outdoor locations. This may have affectedour comparison of indoor and outdoor PM concentrations. Inaddition, we were not able to measure air exchange rate in thepresent study as I/O ratios depend on this factor. It should beevaluated as a part of future work.
Conclusions
Indoor and outdoor size-fractionated PM concentrations wereevaluated at two public urban hospitals in Kashan, Iran.Indoor PM concentrations were found to be lower than out-door PM levels. The association between the indoor and out-door PM levels was assessed to identify predictors of the in-door levels. Outdoor PM2.5 and PM1.0 concentrations werefound as the primary predictors for indoor PM2.5 and PM1.0
concentrations, respectively. Ambient wind speed variablewas also among the predictors for indoor PM2.5 and PM1.0
concentrations but not for indoor PM10 concentrations. Thepresent study evaluating the relationship between indoor andoutdoor PM levels in hospital settings in Iran has several im-plications for local epidemiological studies that can use out-door PM2.5 and PM1.0 concentrations to predict levels of PMmeasured indoors. Most of these studies rely on the effect ofoutdoor concentrations on the occupants’ health. On the otherhand, the present findings regarding the predictors of indoorair pollution concentrations can inform policy makers whenimplementing targeted interventions to improve the air quality,such as using high-efficient ventilation systems at the hospi-tals. In addition, seasonal and temporal variations of particlesin the wards also are required to be considered to investigatethe influence of background activities and meteorological fac-tors on the variation of indoor dust.
Acknowledgements The authors thank the manager and personnel of theShahid Beheshti and Naghavi Hospitals for their kind cooperation.
Funding Information This work was financially supported byMazandaran University of Medical Sciences (Award Number: 93-7225).
Compliance with Ethical Standards
Conflict of interest The authors declare that they have no conflict ofinterest.
References
Campbell H (1997) Indoor air pollution and acute lower respiratory in-fections in young Gambian children. Health Bull 55:20
Chamseddine A, El-Fadel M (2015) Exposure to air pollutants in hospi-tals: indoor–outdoor correlations. WIT Trans Built Env 168:707–716
Chen C, Zhao B (2011) Review of relationship between indoor and out-door particles: I/O ratio, infiltration factor and penetration factor.Atmos Environ 45:275–288
Dehghani M, Kamali Y, Shamsedini N, Ghanbarian M (2015) A study ofthe relationship between indoor/outdoor particle concentration inDena hospital in Shiraz. J Health Res Community 1:49–55
Dehghani M, Saeedi AA, Zamanian Z (2012) A study of the relationshipbetween indoor and outdoor particle concentrations in HafezHospital in Shiraz, Iran
Eames I, Tang J, Li Y, Wilson P (2009) Airborne transmission of diseasein hospitals. J R Soc Interface 6:1–9
158 Air Qual Atmos Health (2019) 12:151–159
Esworthy R (2015) 2006 National Ambient Air Quality Standards(NAAQS) for fine particulate matter (PM2.5): designatingnonattainment areas, congressional research service report,December 23, 2015, Fayetteville, USA
Ezzati M, Kammen DM (2001) Indoor air pollution from biomass com-bustion and acute respiratory infections in Kenya: an exposure-response study. Lancet 358:619–624
Ghozikali M, Borgini A, Tittarelli A, Amrane A, Mohammadyan M,Heibati B, Yetilmezsoy K (2016a) Quantification of health effectsof exposure to air pollution (PM10) in Tabriz, Iran. Global NEST J18:708–720
Ghozikali MG, Heibati B, Naddafi K, Kloog I, Conti GO, Polosa R,Ferrante M (2016b) Evaluation of chronic obstructive pulmonarydisease (COPD) attributed to atmospheric O3, NO2, and SO2 usingAir Q model (2011–2012 year). Environ Res 144:99–105
Gurley ES, Homaira N, Salje H, Ram PK, Haque R, Petri W, Bresee J,Moss WJ, Breysse P, Luby SP, Azziz-Baumgartner E (2013) Indoorexposure to particulate matter and the incidence of acute lower re-spiratory infections among children: a birth cohort study in urbanBangladesh. Indoor Air 23:379–386
Kermani M, Arfaeinia H, Nabizadeh R, AlimohammadiM, AalamolhodaA (2015) Levels of PM2.5-associated heavymetals in the ambient airof Sina hospital district, Tehran, Iran. J Air Pollut Health 1:1–6
Klepeis NE, Nelson WC, Ott WR, Robinson JP, Tsang AM, Switzer P,Behar JV, Hern SC, Engelmann WH (2001) The National HumanActivity Pattern Survey (NHAPS): a resource for assessing exposureto environmental pollutants. J Expo Sci Environ Epidemiol 11:231–252
Lomboy MFTC, Quirit LL, Molina VB, Dalmacion GV, Schwartz JD,Suh HH, Baja ES (2015) Characterization of particulate matter 2.5in an urban tertiary care hospital in the Philippines. Build Environ92:432–439
López-Villarrubia E, Iñiguez C, Costa O, Balleste F (2016) Acute effectsof urban air pollution on respiratory emergency hospital admissionsin the Canary Islands. Air Qual Atmos Health 9:713–722
Massey D, Masih J, Kulshrestha A, Habil M, Taneja A (2009) Indoor/outdoor relationship of fine particles less than 2.5 μm (PM2.5) inresidential homes locations in central Indian region. Build Environ44:2037–2045
Mohammadyan M, Alizadeh-Larimi A, Etemadinejad S, Latif MT,Heibati B, Yetilmezsoy K, Abdul-Wahab SA, Dadvand P (2017a)Particulate air pollution at schools: indoor-outdoor relationship anddeterminants of indoor concentrations. Aerosol Air Qual Res 17:857–864
Mohammadyan M, Ghoochani M, Kloog I, Abdul-Wahab SA,Yetilmezsoy K, Heibati B, Pollitt KJG (2017b) Assessment of in-door and outdoor particulate air pollution at an urban backgroundsite in Iran. Environ Monit Assess 189:235
Park M, Luo S, Kwon J, Stock TH, Delclos G, Kim H, Yun-Chul H(2013) Effects of air pollution on asthma hospitalization rates in
different age groups in metropolitan cities of Korea. Air QualAtmos Health 6:543–551
Pope R, Stanley KM, Domsky I, Yip F, Nohre L, Mirabelli MC (2017)The relationship of high PM2.5 days and subsequent asthma-relatedhospital encounters during the fireplace season in Phoenix, AZ,2008–2012. Air Qual Atmos Health 10:161–169
Rezaei S, Naddafi K, Jabbari H, Yonesian M, Jamshidi A, Sadat A,Raygan Shirazinejad A (2013) Relationship between the particulatematter concentrations in the indoor and ambient air of the Tehranchildren hospital in 2007. Iran J Health Environ 6:103–112
Slezakova K, da Conceição Alvim-Ferraz M, do Carmo Pereira M (2012)Elemental characterization of indoor breathable particles at aPortuguese urban hospital. J Toxic Environ Health A 75:909–919
Smith KR, Samet JM, Romieu I, Bruce N (2000) Indoor air pollution indeveloping countries and acute lower respiratory infections in chil-dren. Thorax 55:518–532
Vu TV, Ondracek J, Zdímal V, Schwarz J, Delgado-Saborit JM, HarrisonRM (2017) Physical properties and lung deposition of particles emit-ted from five major indoor sources. Air Qual Atmos Health 10:1–14
Wang F, Meng D, Li X, Tan J (2016) Indoor-outdoor relationships ofPM2.5 in four residential dwellings in winter in the Yangtze RiverDelta, China. Environ Pollut 215:280–289
Wang X, Bi X, Sheng G, Fu J (2006) Hospital indoor PM10/PM2.5 andassociated trace elements in Guangzhou, China. Sci Total Environ366:124–135
WorldHealth Organization (WHO) (2004) Health aspects of air pollution,results from theWHO project: systematic review of health aspects inEurope. WHO Press, Copenhagen
World Health Organization (WHO) (2006) Air quality guidelines: globalupdate 2005, particulate matter, ozone, nitrogen dioxide and sulfurdioxide. WHO Regional Office for Europe, Copenhagen
World Health Organization (WHO) (2007) Health risks of heavy metalsfrom long range trans-boundary air pollution. WHO Press,Copenhagen
World Health Organization (WHO) (2009) Global health risks: mortalityand burden of disease attributable to selected major risks. WHOPress, Geneva
Yurtseven E, Erdogan MS, Ulus T, Alver Sahin U, Onat B, Erinoz E,Vehid S, Koksal S (2012) An assessment of indoor PM2.5 concen-trations at a medical faculty in Istanbul, Turkey. Environ Prot Eng38:115–127
Zereini F, Wiseman CL (2010) Urban airborne particulate matter: origin,chemistry, fate and health impacts. Springer, Berlin. https://doi.org/10.1007/978-3-642-12278-1
Zhao L, Chen C, Wang P, Chen Z, Cao S, Wang Q, Xie G, Wan Y, WangY, Lu B (2015) Influence of atmospheric fine particulate matter(PM2.5) pollution on indoor environment during winter in Beijing.Build Environ 87:283–291
Air Qual Atmos Health (2019) 12:151–159 159