Mango Spraying for the Control of Fruit Flies in Khartoum State
Upload
khangminh22Category
view
0download
0
Assessment of Groundwater Quality in Omdurman City
1
بسم اهللا الرحمن الرحيم
University Of Khartoum Faculty of Public and Environmental Health
Department of Environmental Health
and Environmental Studies
Assessment of Ground Water
Quality in Omdurman City
By: Mazahir Elhadi Abdallah Mohammed
(B. Sc.Honours)
A thesis Submitted to the University of Khartoum in partial fulfillment to master degree (M.Sc)
in the Faculty of Public and Environmental Health, Khartoum University in Environmental Health
Supervised By
Dr. Bashir Mohammed Elhassan Department of Chemical Engineering Faculty of Engineering and Architecture University Of Khartoum
2007

Assessment of Groundwater Quality in Omdurman City
2
بسم اهللا الر حمن الرحيم
-:قال تعالى
انا نسوق الماء الي االرض الجرز فنخرج به زرعا تاآل منه واأولم ير(
).انعامهم وانفسهم افال يبصرون هسورة السجد
)27(االيه
اهللا الذي يرسل الرياح فتثير سحابا فيبسطه في السماء آيف يشاء ويجعله (
ه فاذا اصاب به من يشاء من عباده اذا هم آسفا فتري الودق يخرج من خالل
).يستبشرون
الروم سورة )48( االيه

Assessment of Groundwater Quality in Omdurman City
3
Dedication
the soul of my father
my mother
my brothers and sisters
my friends
those who encouraged me to complete
this work.
Acknowledgement

Assessment of Groundwater Quality in Omdurman City
4
My thanks due to all those who participated in bringing this study
to life. It is a great pleasure to be able to express my appreciation
and gratitude to all of them.
I would like to express my sincere thank s and deep appreciation
to Dr. Bashir Mohammed Elhassan, Department of Chemical
Engineering, Faculty of Engineering, University of Khartoum, for
keen supervision, orientation, valuable assistance and
constructive comments during the preparation of this research.
Acknowledgements are due to those who helped in the stag of
data collection, through to dissertation production.
I would like also to thank Administration of Environmental
Health- Ministry of Health -Khartoum state, and also to public
health laboratory staff.
I would like to thank University of ElImam Elmahdi, which
supported my M.Sc study financially.
I would like to take this opportunity to convey my sincere
gratitude to my friends in Environmental Health Department for
their collaboration during masters course.
Avery special thank to my friend Sit Elbanat Ahmed Hashim for
her generous assistance and limitless help.
Finally, my thanks extended to my family members who deserve
special acknowledgement for their continuous support and
encouragement.
Contents

Assessment of Groundwater Quality in Omdurman City
5
Contents Page No
I االيــــــــــــــةDedication II Acknowledgement III List of Contents IV List of Tables VI List of Figures VIII List of Appendices IX Abstract – English X Abstract – Arabic XIII
Chapter One Introduction
1-1 General Introduction 1 1-2 Objectives 4 1-3 Justification 5
Chapter Two literature review
2-1 Introduction 6 2-2 Importance of water 6 2-3 Water Safe and Wholesome 6 2-4 Water requirement 7 2-5 Uses of water 8 2-6 Source of water 9 2-7 Water quality 18 2-8 Water related diseases 27 2-9 Water pollution 28 2-10 Ground water protection 34 2-11 Water treatment process 35 2-12 Water distribution 44
Chapter Three Materials and Methods
3-1 Study area 45 3-2 Sample Size 49 3-3 Samples Collection 53 3-4 Laboratory analysis 53
Chapter Four Results and Discussion
Results and Discussion 60-80

Assessment of Groundwater Quality in Omdurman City
6
Chapter Five
Conclusion & Recommendations 5-1 Conclusion 81 5-2 Recommendations 83
Chapter Six References
References 85

Assessment of Groundwater Quality in Omdurman City
7
List of Tables
Chapters Table title Page No
Chapter Two Table (2-1) Hardness classification of water 25 Table (2-2) Principal Chemical Constituents in
Groundwater their Sources, Concentration, and Effect on Usability
32
Table (2-3) Most Effective Treatment Methods for Removal Of Inorganic Contaminants
42
Table (2-4) Water and Waste Treatment Processes 43
Chapter Three Table (3-1) Statistic overview of hydrochemical
characteristics of ground water
48
Table (3-2) Number of samples for Khartoum state 49 Table (3-3) The total and target Number of Boreholes
Khartoum state 49
Table (3-4) the total number of samples from the Khartoum state from boreholes not connected direct to network
50
Table (3-5) the total number of samples from the Khartoum state from boreholes connected direct to network
50
Table (3-6) The Total Number of Samples in the Study Area From Boreholes Served by Direct Net wok
51
Table (3-7) The Total Number of Samples in the Study Area from Boreholes Not Served by Direct Network
51
Table (2-8) Sample from Boreholes Served Direct by Network
52
Table (2-9)
Samples from Boreholes not served Direct by Network
52

Assessment of Groundwater Quality in Omdurman City
8
Chapter Four
Table (4-1) Chemical Examination of Water From Boreholes in Omdurman area
60
Table (4-2) Relationship between TDS and Conductivity in Study Area
61
Table (4-3)
Physical Examination of Water from Boreholes in Omdurman area
62
Table (4-4)
bacteriological examination of water from boreholes Served directly by network in Omdurman locality
63
Table (4-5)
bacteriological examination of water from boreholes Not served directly by net work in omdurman locality
64
Table (4-6)
Bacteriological Examination of Water from Boreholes Served Directly by Network in Karrari locality
65
Table (4-7)
Bacteriological Examination of Water from Boreholes Not Served Directly by Network in Karrari locality
66
Table (4-8)
Bacteriological Examination of Water from Boreholes Served directly by network in Ombada locality
67
Table (4-9)
Bacteriological Examination of Water from Boreholes not Served directly by network in Ombada locality
68
Table (4-10)
Bacteriological Examination of Water from locations in the study area
69

Assessment of Groundwater Quality in Omdurman City
9
List of Figures
Figures No Title Page No
Fig1 Hydrologic Cycle 7 Fig2 Groundwater in the water cycle
8
Fig3 The Pollution level of Boreholes in the study area
78
Fig4 Comparison of Pollution between houses connected direct, and those not direct connected to net work
79
Fig5 The water pollution in water towers in the study area
80

Assessment of Groundwater Quality in Omdurman City
10
List of Appendices
Appendix Title 1 Results of chemical and physical water
analysis 2 Results bacteriological water analysis 3 Sudanese standard of water quality 4 WHO guide line of water quality 5 Maps of study area Map (5-1) Omdurman Location Map (5-2) Omdurman in Khartoum State
(Upper left ) Map (5-3) Omdurman Locality
Assessment of Groundwater Quality in Omdurman City
11
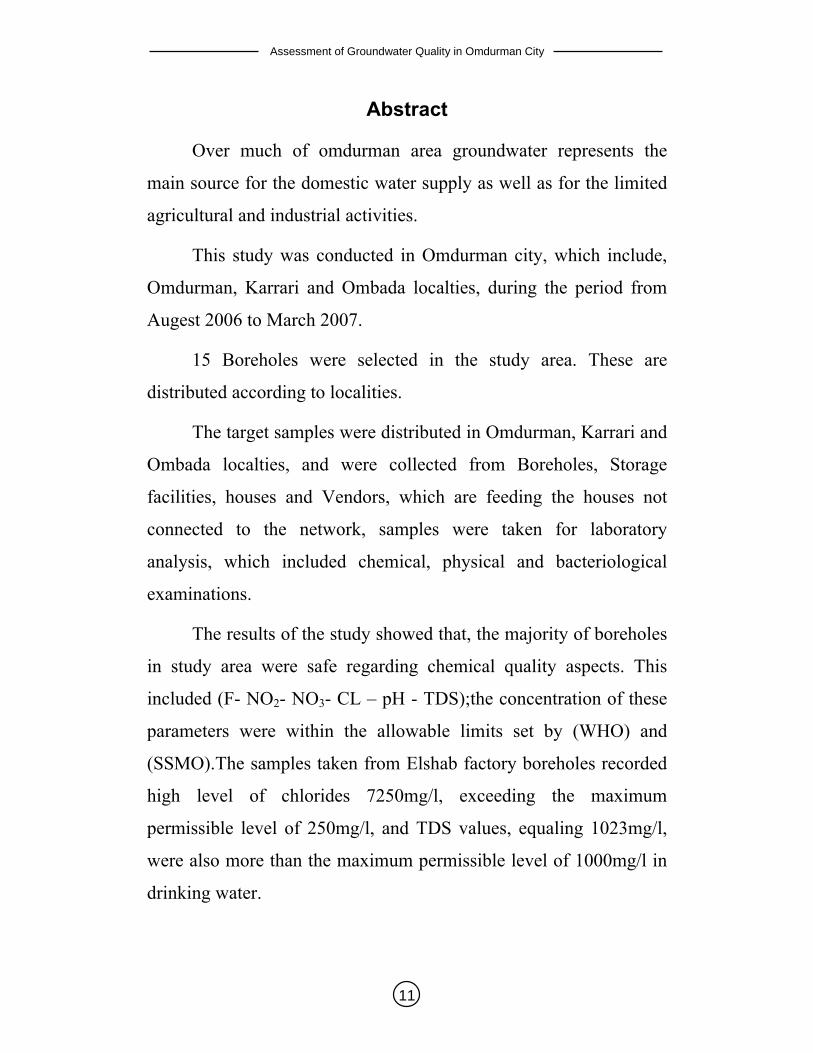
Abstract
Over much of omdurman area groundwater represents the
main source for the domestic water supply as well as for the limited
agricultural and industrial activities.
This study was conducted in Omdurman city, which include,
Omdurman, Karrari and Ombada localties, during the period from
Augest 2006 to March 2007.
15 Boreholes were selected in the study area. These are
distributed according to localities.
The target samples were distributed in Omdurman, Karrari and
Ombada localties, and were collected from Boreholes, Storage
facilities, houses and Vendors, which are feeding the houses not
connected to the network, samples were taken for laboratory
analysis, which included chemical, physical and bacteriological
examinations.
The results of the study showed that, the majority of boreholes
in study area were safe regarding chemical quality aspects. This
included (F- NO2- NO3- CL – pH - TDS);the concentration of these
parameters were within the allowable limits set by (WHO) and
(SSMO).The samples taken from Elshab factory boreholes recorded
high level of chlorides 7250mg/l, exceeding the maximum
permissible level of 250mg/l, and TDS values, equaling 1023mg/l,
were also more than the maximum permissible level of 1000mg/l in
drinking water.

Assessment of Groundwater Quality in Omdurman City
12
The results of physical quality of water samples, taken from
the study area, were acceptable.
The bacteriological analysis of the water samples taken from
the boreholes in the study area recorded higher level of
thermotolerant and Ecoli, (46%) were more than the permissible
levels set by (WHO) and (SSMO) standards.
The results of samples taken from the Storage facilities showed that
(66.7%) of these facilities were safe (not polluted).
As for the Bacteriological quality of water samples taken from
Houses, samples were found to be polluted by Ecoli and
thermotolerant coliforms.
It was observed that the contamination rate of water in houses which
are not connected to the net work was (62.3%) higher in comparison
with those directly connected to the net work. This demonstrates the
importance of distribution system in alimentally the contamination
rate.
This study comes out with many suggested recommendations,
the important of which are that the pollution sources should be sited
away from boreholes, Septic tank and latrines should be of proper
designs to eliminate infiltration to boreholes through soil layers.
Also disinfection of wells is important. On the other hand legislative
acts and regulation for well drilling and proper disposal of effluent is
of high importance.

Assessment of Groundwater Quality in Omdurman City
13
• Health education and awareness to consumers should be
provided regarding protecting and conservation of water
in houses.
• Connect all houses in the study area to the public net
work of drinking water.
• Encourage research in groundwater quality in order to
protect, monitor and control pollution.
• Establish ground water conservation programme.

Assessment of Groundwater Quality in Omdurman City
14

Assessment of Groundwater Quality in Omdurman City
15
-:ملخص الدراسة
لقد أصبحت المياه الجوفية مصدر رئيسي يعتمد عليها لتوفير ميـاه الـشرب
لمجموعة مقدرة من سكان مدينة امدرمان الستعمالها في أغـراض مـشاريع التنميـة
. المحدودة في الزراعة والصناعة
) امبـدة و يكرروامدرمان (أجريت هذه الدراسة في مدينة امدرمان التي تضم محليات
.بهدف تقييم نوعية المياه الجوفية ,2007 مارس ى ال2006في الفترة ما بين أغسطس
. بئر من منطقة الدراسة وزعت حسب المحليات15تم اختيار
العينات المختارة تم توزيعها على محليات امدرمان وكرري وامبدة حيـث تـم
كاورو التي تغذى المنازل غيـر جمع هذه العينات من اآلبار و الخزانات و المنازل وال
من اجل التحليل المعملي الـذي يـشمل الفحـص الكيميـائي و , المرتبطة بشبكة المياه
.زيائى والبكتريولوجىيالف
أوضحت نتائج الدراسة أن غالبية اآلبار في منطقة الدراسة سليمة من النـواحي
تركيز هـذه حيث أن (F- NO2- NO3 – CL – PH- TDS)الكيميائية التي تضمنت
بينمـا (SSMO) و (WHO) "مواصـفات "المواد وفق الحد المسموح به من قبـل
ملجرام 7250(العينات الماخوذه من بئر مصنع سحاب سجلت تركيز عالي للكلورايد
كذلك تركيز المواد الصلبة ) لتر/ ملجرام 250(اعلي من الحد المسموح به وهو ) لتر/
أعلى من الحد المسموح به فـي ميـاه ) لتر/ ملجرام 1023(الذائبة في هذه البئر بلغ
).لتر/ ملجرام 1000(الشرب
.أوضحت الدراسة أن نوعية المياه من النواحي الفيزيائية مقبولة
أوضحت الدراسة أن النوعية البكترلوجية لعينات المياه المأخوذة مـن االبـار سـجلت
E. Coli andريـا القولونيـة بالبكت%) 46.6(مستويات عالية من التلـوث بلغـت
thermotolerantتد المسموح بـه مـن قبـل مواصـفا ح اعلئ من ال (WHO)و (SSMO)
أوضحت الدراسة أن النوعية البكترلوجية لعينات المياه المـأخوذة مـن الخزانـات أن
.من العينات سليمة من الناحية البكترلوجية%) 66.7(

Assessment of Groundwater Quality in Omdurman City
16
ـ كذلك النوعية الجرثومية لعينات الميا ةه المأخوذة من المنـازل فـي منطقـة الدراس
. E. coli and thermotolerantملوثه بالبكتريا القولونية %) 49.6(أوضحت أن
من المالحظ أن النسبة المئوية لمعدل التلوث في المنازل غير المرتبطة بشبكة الميـاه
هـذا %) 38.3(عالية مقارنة مع المنازل األخرى المرتبطة مباشرة بالشبكة %) 62.3(
.يدل على أهمية نظام التوزيع في الحد من التلوث
-:خرجت الدراسة بعدة توصيات أهمها
.ن مصادر التلوثع ادياآلبار يجب ان يكون بعموقع •
وأحواض التحليل بطريقـة جيـدة تمنـع ضيجب أن يكون تصميم المراحي •
.تسرب محتوياتها لآلبار من خالل طبقات التربة
واللوائح في حفر اآلبار وطرق الـتخلص مـن المخلفـات القوانين تطبيق •
.السائلة
التثقيف الصحي والتوعية للمواطن بكيفية حفظ وحماية المياه على مـستوى •
.المنازل من التلوث
. ربط جميع المنازل بمدينة امدرمان بالشبكة العامة لمياه الشرب •
ة الحماية والرقاب تشجيع البحث في مجال التقصي عن المياه الجوفية من اجل •
.والتحكم في التلوث
.تأسيس برنامج الحفاظ على المياه الجوفية •

Assessment of Groundwater Quality in Omdurman City
17
CHAPTER 1
Introduction

Assessment of Groundwater Quality in Omdurman City
18
1-1 General
Groundwater is one of the most important sources of water for
human life and for flora and fauna. It is generally considered to be a
safer source of drinking water than surface water but can also be
contaminated by bacteria. It has been a frequent cause of epidemics,
sometimes with high death toll, chemical pollution, although not
directly identified as such has become equally serious (Jousma and
etal, 1987).Every effort should be made to achieve a drinking water
quality as high practicable. Protection of water supplies from
contamination is the first line of defense. Source protection is almost
invariably the best method of ensuring safe drinking water supply to
render it suitable for consumption .Once a potentially hazardous
situation has been recognized, however, the risk to health, the
availability of alternative source and the availability of suitable
remedial measures must be considered so that decision can be made
about the acceptability of the supply (WHO, 1993).
The world's total water resources are estimated at 1.37 x 10⁸
million ha-m, of this global water resource about 97.2% is salty
water, mainly in oceans, and only 2.8% is available as fresh water at
any time on the planet earth. Out of this 2.8%, about 2.2% is
available as surface water and 0.6% as ground water. Even out of
this 2.2% of surface water, 2.15% is the fresh water in glaciers ice
cap and only of the order of 0.01%( 1.36 x10⁴ M ha-m) is available
in lakes and reservoirs, and 0.0001% in streams the remaining being
in other forms – 0.0001% as water vapour in atmosphere, and
0.002% as soil moisture in the top 0.6m out of 0.6% of stored

Assessment of Groundwater Quality in Omdurman City
19
ground water, only about 0.3% (41.1 x 10⁴ M ha-m) can be
economically extracted with the present drilling technology, the
remaining being unavailable as it is situated below a depth of 800 m.
Thus ground water is the largest source of fresh water on the
planet excluding the polar ices caps and glaciers.
At present nearly one fifth of all the water used in the world is
obtained from ground water resources (Raghunath, 1987).
Within the next 50 years the world could be facing critical water
shortages.
The current water crisis has two dimensions:
• Water supply, sanitation and irrigation are often inadequate.
• The development and management of water sources are not
sustainable.
One billion people still lack access to safe water and 2.8 billion
are without sanitation. In 2025 the World Bank foresees a general
shortage of safe drinking water in third world countries. Despite
major investment, the quality and reliability of services are often
unacceptable. Water supply, sanitation and irrigation policies are
frequently outdated inappropriate and financial mechanism is
ineffective. As a result four million children die each year from
causes related to lack of safe water and sanitation (WMO, 1997).
Water source is becoming increasingly scare due to over
exploitation, wastage and pollution .Although readily accessible
fresh water supplies comprise less than one percent of all the water
on earth, even this quantity is considered sufficient to meet all the

Assessment of Groundwater Quality in Omdurman City
20
human needs. Unfortunately, it is not distributed evenly over the
globe, either temporally or spatially, thereby providing the basis for
water conflicts use in countries and between countries sharing Trans-
boundary waters. Thus water remains a major global survival issue,
though this reality continues to be ignored in many political arenas
(UNEP, 1997).
Water is by far the most important liquid found on earth and is
the substance most familiar to man.

Assessment of Groundwater Quality in Omdurman City
21
1-3 Objectives
General Objective:
To Assess the Ground Water Quality in Omdurman City.
Specific Objectives: To assess:-
1- The chemical parameters of ground water (fluorid, chloride,
nitrite, nitrate, pH and total dissolved solid).
2- The physical parameters of ground water (taste, odour and
conductivity).
3- The Bacteriological parameters of ground water (E.coli,
thermo-tolerant coli form and Coli form.).

Assessment of Groundwater Quality in Omdurman City
22
1-2 Justification
A survey conducted by WHO in 1972 with participation of
most members state, showed that more than a half of urban
population and 88% of rural population are still without satisfactory
water supply and environmental sanitation.
Water is inevitably associated with many problems, but serious
health problems are raised due to the nature of the inputs in these
source.
In an unpublished study conducted by Izzeldin and others
(1999) for UNDP, they found serious background bacteriological
contamination in many wells in Khartoum State .This supported by
complains from consumers of water quality degradation as well as
outbreak of diarrhea in some areas.
Therefore this study has come out to investigate those
problems and to identify their magnitudes.

Assessment of Groundwater Quality in Omdurman City
23
CHAPTER 2
Literature Review

Assessment of Groundwater Quality in Omdurman City
24
2- Literature Review
2-1 Introduction
Much of the ill-health which affects humanity especially in the
developing countries can be traced to lack of safe and wholesome
water supply. Water that easily accessibly adequate in quantity, free
from contamination, safe readily available throughout the year.
There can be no state of positive health and well being without safe
water. Water is not only a vital environment factor to all forms of
life, but it has also a great role to play in socio-economic
development of human population (Park, 2002).
2-2 Importance of water:
Water is considered an economic good, therefore each unit of
it should be used efficiently, equitably and soundly (UNESCO,
1997).
2-3 Water Safe and Wholesome:
Water intended for human consumption should be both safe and
wholesome. This has been defined as water that is:
• Free from pathogenic agents.
• Free from harmful chemical substances.
• Pleasant to the taste, free from odour and colour.
• Usable for domestic purposes.
Water is said to be polluted or contaminated when it does not fulfill
the above criteria. Water pollution is a growing hazard in many
developing countries owing to human activity without ample and

Assessment of Groundwater Quality in Omdurman City
25
safe drinking water; we can not provide health care to the
community (park, 2002).
2-4 Water Requirements:
The basic physiological requirements for drinking water have
been estimated at about 2 liters per head per day.
This is just for survival. But from the standpoint of public health and
improvement of the quality of life, water should be provided in an
adequate volume. It will help to reduce the incidence of many water-
related diseases among the people most at risk. The consumption of
water, however, depends upon climatic conditions, standard of living
and habits of the people. A daily supply of 150 - 200 liters per captia
is considered an adequate supply to meet the needs for all domestic
purposes (park, 2002).
FIG2: Hydrologic Cycle
Rain clouds Cloud formation Hydrologic cycle
Precipitation as Rain, snow and dew
Evaporation
Vegetation
Lakes, ponds, ocean
Stream, Rivers Surface Run off
Infiltration in soil (wells, springs) (Vidya, 1983)

Assessment of Groundwater Quality in Omdurman City
26
FIG2: Groundwater in the water cycle
htt:// en. Wikipedia.org/ wiki/ Groundwater
No higher resolution available.
A cross sectional diagram showing qualitative flow times for various pathways through a
typical aquifer system, from USGS circular 1139.
2-5 Uses of water:
The uses of water in a community are many, and the
requirements in quantity are varied, conventionally it has been
convenient in quantity to serve all uses and suitable in quantity to
meet drinking requirement, even though only a small fraction of total
water supply, is actually used for drinking.
The uses of water include:
• Domestic uses: on domestic front, water is required for
drinking, cooking, washing and bathing, flushing of toilets
gardening etc.

Assessment of Groundwater Quality in Omdurman City
27
• Public purposes: cleaning streets, recreational purposes like
swimming pools, public fountains and ornamental ponds, fire
protection and public parks.
• Industrial purposes: for processing and cooling.
• Agricultural purposes: irrigation.
• Power production from hydropower and steam power.
• Carrying away waste from all manner of establishments and
institutions.
Water is therefore an essential factor in the economic, social and
cultural development of a community; it can eliminate diseases,
promote rural development and improve quality of life (Park, 2002).
2-6 Source of water:
The source of water commonly determines the nature of the
collection, purification, transmission, and distribution works.
Common sources of fresh water and their development are:
2-6-1 Rain water:
• From roofs, stored in cisterns, for small individual supplies.
• From larger, prepared watersheds, or stored in reservoirs, for
large communal supplies.

Assessment of Groundwater Quality in Omdurman City
28
2-6-2Surface water:
• From streams, natural ponds and lakes of sufficient size, by
continuous draft.
• From streams with adequate flood flows, by intermittent
seasonal, or selective draft of clean flood waters, and their
storage in reservoirs adjacent to the streams, or otherwise
readily accessible from them.
• From streams with low dry-weather flows but with sufficient
annual discharge by continuous draft through storage of
necessary flow in excess of daily use in one or more reservoirs
impounded by dams thrown across the stream valleys (Gordon
and etal, 1966).
2-6-3Ground water:
Ground water is underground water that occurs in the saturated
zone of variable thickness depth, below the earth, surface, cracks and
pore in existing rocks and un consolidated crystal layers, make up a
large underground reservoir, where part of precipitation is stored
(Santosh, 2005)
2-6-3-1 Utilization of ground water:
Ground water is an important source of water supply
throughout the world. Its use in irrigation, industries, municipalities,
and rural homes continues to increase (David, 1995)
Assessment of Groundwater Quality in Omdurman City
29
2-6-3-2 Occurrence of ground water:
The rainfall that percolates below the ground surface passes
through the voids of rocks and joins the water table, voids are
generally inter connected, permitting the movement of the ground
water. But in some rocks, they may be isolated and thus, preventing
the movement of water interstices. Hence, it is evident that the mode
of occurrence of ground water depends largely upon the type of
formation, and hence upon the geology (Santosh, 2005).
Conditions affecting the amount of rainfall that may percolate
into the ground water include:
• Amount and intensity of rainfall.
• The distribution of rainfall.
• The topography and permeability of ground surface.
• The water capacity of the ground.
2-6-3-3 Location of ground water supplies:
Because of the cost of well drilling, it is desirable to have
some assurance that a well will reach a satisfactory aquifer. It may
be possible to predict the depth and productivity of an aquifer from
conditions in other wells in the vicinity. Large projects will justify
exploration by a competent geologist. Sub surface exploration is
often done with small-diameter best holes from which sample of the
soil and rock may be obtained and tested for permeability and
specific yield. Pumping test may also be conducted on these test
wells to determine the transmissibility and storage constant for the
aquifer.

Assessment of Groundwater Quality in Omdurman City
30
Seismic surveys are conducted by firing a charge of explosive
near the ground surface and timing the travel of resulting shock
waves to a series of geophones remote from the shot point. The
velocity of the shock wave depends on type of formation and the
presence of water. From the differences in indicated velocity's to the
several geophones it may be possible to estimate the depth to the
water table or to the interface between formations. Resistivity
surveys make use of the fact that the depth of penetration of current
between two electrodes in the soil surface increases as the electrodes
spacing increases.
It is possible to estimate the relative Resistivity of formation at
different depth by measuring the current flow with various electrode
spacing. Since water the increases the conductivity of soil or rock,
the presence of ground water may be indicated by a decrease in
Resistivity. Both seismic and Resistivity surveys should be made
and interpreted by persons trained in the work. Neither method
specifically locates groundwater but merely indicates discontinuities
which may bound and aquifer. With a few test holes as control
points, large areas may be surveyed rapid by seismic or Resistivity
methods (Ray and et al, 1979).
2-6-3-4 The main sub-surface sources are:
1- Springs: ground water reappears at the ground in the form of
springs. Springs are brought about under the following condition:
• When the surface of the earth drops sharply below the normal
ground water table, the water bearing stratum (aquifer) is
exposed to the atmosphere and springs are created. The

Assessment of Groundwater Quality in Omdurman City
31
formation of such springs results from an overflow of the
ground water table. This type of springs is also called as
(Gravity) or shallow springs and water table in such springs
varies with the rainfall.
• When due to an obstruction ground water is stored in the form
of a reservoir and this water is forced to overflow at surface.
Springs of this type are most common. These are formed when
an imperious stratum, which is supporting the ground water
reservoir, becomes out crops. The storage capacity of these
springs is very small which ceases after a drought. They can be
developed by the construction of cut off trench.
• When a fissure in an impervious stratum allows artesian water
to flow in the form springs.
Such types of springs come across when ground water arise
though a fissure in the upper impervious stratum. These are also
known as "artesian" springs in these the water appears at the ground
surface under pressure. The amount of water available is large and
the rate of flow of water is constant because water comes out by a
constant pressure.
Deep-seated spring: a deep seated spring is one which is
formed exposing of a pervious stratum enclosed between two
impervious strata i.e. which has impervious strata both above and
below it. These springs usually have a large length of watershed and
their out crop is too for away from spring.

Assessment of Groundwater Quality in Omdurman City
32
The water come out in the from spring under pressure. The
first three springs detailed above are called surface springs and the
last called deep-steated spring (Lai, & etal, 2006).
Some springs contain minerals like sulphur, iron, manganese
etc. and are called mineral springs these at some place are used for
therapeutic purposes. The springs usually hard and unfit for
washing-source pollution of springs are leaking cesspool, privies,
stables situated near and above them (Richard and etal, 1982).
2- Infiltration galleries:
A gallery is a horizontal or approximately horizontal tunnel or
open ditch constructed through water bearing material in a direction
approximately normal to direction of flow at the underground water.
As we have seen earlier that sub-surface water always tries to
travel towards lakes, rivers or streams. This traveling water can be
intercepted by digging a trench or constructing a tunnel with holes
on sides or right angle to the direction of follow of underground
water. These underground tunnels used for tapping underground
water near lakes, river, are called infiltration galleries.
The yield from these galleries may be as much as 1.5 x 10⁴
liters/day/meter length of the infiltration gallery. For maximum
yield, the galleries are placed at the full depth of aquifer. These are
constructed with bricks or concrete with weep holes of 5cm x 10 cm.
Infiltration galleries are surrounded on sides and top with gravel or
crushed stones to increase their intake capacity.

Assessment of Groundwater Quality in Omdurman City
33
3- Porous pipe galleries:
If there is a much greater amount of water (ground water)
available over a wide area, it can be cheaply collected by laying
porous pipes or pipe with open joints in the full area at some
distances. These longitudinal and cross pipes will be given a slope
such that water should be brought towards appoint.
There intake capacity can be increased by surrounding them
with rubble, gravel and sand (Lai, and etal, 2006).
4- Wells:
Wells are dug or driven holes to reach the under ground water.
Types of well:
• Shallow well: This is a dug well up to ground water lying
between surface and first impermeable layer. It is an unsafe
source of water as it gets easily polluted from surface with
sewage, and other impurities from surrounding cesspools
leaking drains, privies, droppings of animal and plant
leaves.
• Deep well: This is a dug well, which goes beyond the first
impervious layer to reach the water strata below. This water
is and free from surface contamination, though it may be
hard due to nitrites and nitrates.
• Artesian well: This is a variety of deep wells. In this, water
strata lies between to impermeable layers. The strata are
cup-shaped and surface of well is much lower than the
upper level of water stratum tapped.

Assessment of Groundwater Quality in Omdurman City
34
• Tube-well: consists of iron-tubing (8-15 cm) driven into
ground up to required depth. These are more sanitary than
dug wells. Deep tube wells can serve as one of the ideal
source of water supply.
• Ideal well: an ideal well is deep well with the following
characteristics:-
o Soil should be good and well away (60 meters) from
sources of pollution.
o Site should be at a higher level to prevent draining of
surface water into well.
o Site should have water roof wall from within out side
consisting of clay, bricks and cement respectively.
o A parapet about 3/4 meters high should be here with top
sloping outwards.
o The mouth of the well should be covered to prevent
leaves and other droppings from falling into the well.
o Water should be drawn by a hand pump or by a single
bucket and rope only.
o Washing clothes, cleaning utensils and bathing should be
prohibited near the well. Such a provision may,
however, be made through a short distance away from
the well.
o Proper drainage of water to a safe distance should be
provided.
Assessment of Groundwater Quality in Omdurman City
35
• Well Cleaning:
This is usually carried out at the end of summer, when water in
the well is at its lowest. All water, mud, stones etc, are removed
from the bottom, and the well is disinfected with slaked time (1
part to 4 parts water) or pot. Permanganate (just enough to make
water pinkish). Periodic disinfection of well is carried out at night
with 102mg bleaching power per 1000 gallons of water. This
esures at least 6hours contact needed for proper disinfection.
• Well Inspection:
o Depth of well and depth of water level.
o Nature of soil condition wall of the well, and whether
mouth is covered or open.
o Parapet, its construction, height and slopes.
o Any location of cesspools and privies, area of cone of
filtration.
o Depression of water by pumping and time taken for its
restoration.
o Water sample testing: water sample is collected from
surface and bottom preferably at days end (Richard and
etal, 1982).
2-6-3-5 Ground water in Sudan:
Ground water is potentially available in large areas away from
Nile, major water aquifers cover about 50% of the surface of the
country, and it occurs either in shallow aquifer along the major

Assessment of Groundwater Quality in Omdurman City
36
seasonal streams or in deep aquifer of Nubian sand stone formation
(SNCESCO, 2000).
The main Aquifers fall under three categories:-
i- The Nubian sand stone aquifers
ii- The Detrital quaternary .Tertiary aquifers.
iii- The recent alluvial wadi- fill aquifers (Izzeldin et al ,2000).
2-6-3-6 Quality of ground water:
Generally recognized that the quality of ground water is just
as important as its quantity. All ground water contain salts in
solution that are derived from location and past movement of the
water. The quality of ground water supply depends on it is purpose.
Thus need for drinking water, industrial and irrigation water vary
widely. To establish quality criteria, measures of chemical, physical,
biological and radiological constituents must be specified, as well as
standard methods for reporting and comparing results of water
analysis, dissolved gases in ground water can pose hazards if their
presence goes under unrecognized. The uniformity of ground water
temperature is advantageous for water supply and industrial
purposes, and underlying saline ground water are important because
they puffer potential benefits (David,1995).
2-7 Water quality:
The quality of the aquatic environment can be defined by :(i) a
set of concentrations, speciation and physical partition of inorganic
or organic substance, and (ii) the composition and state of aquatic
biota found in water body. The quality of aquatic environment shows

Assessment of Groundwater Quality in Omdurman City
37
temporal and spatial variations due to factors internal and external to
the body (Deborah, 1992).
2-7-1 Physical characteristic:
Physical parameters are usually used to determine water
quality; they depend on condition of water bodies:
1- Transparency:-
Transparency is determined by the color and turbidity i.e. it is
affected by various colored leaves and suspended organic and
inorganic materials. Using white colored paper of know dimension
and lowing it in the water column the depth at with it is
distinguished is used as measure of transparency.
2- Temperature:-
Temperature: the tendency of changes in water quality. All
reaction, chemicals and biological, in water are affected by
temperature, the amount of gases in water and the process of
chemical and biochemical self-purification and the formation of
secondary pollutants are affected by temperature variation. Degree
of saturation is highly influenced by temperature.
3- Electrical conductivity:-
Electrical conductivity dissociated cations and anions in water
determine its electrical conductivity, the electrical conductivity is
measured by finding the inverse of electrical Resistivity between two
electrodes (each having an area of km2) one centimeter apart. The
unit used is micro siemens per centimeter. The electrical

Assessment of Groundwater Quality in Omdurman City
38
conductivity reflects the amount or concentration of dissolved
substances in water (INWRDAM, 1997).
4- Taste and odour:-
Objection to taste and small is to some extant subjective for
example, the concentration of iron which makes water unacceptable
varies from 0.04 mg/l to over 200 mg/l-water chloride in excess 250
mg/l is sometime considered as unpalatable.
Odours is stronger at higher temperature. They may be due to the
release of dissolved gases such as hydrogen sulphide, to the growth
of microorganisms which release taste and odour producing
substances, or to the decomposition of dead microorganisms, leaves,
grass and aquatic vegetation, even if taste and odour are harmless in
themselves, consumer often interpret them as evidence of pollution
and consequently use other sources which are inferior from a health
point of view (Richard and etal, 1982).
5- Colour:
Drinking water should be free colour which may be due to
the presence of colored organic matter (primarily humic substance)
metals such as iron and manganese or highly colored industrial
waste, consumers may turn to alternative, perhaps unsafe, source
when their water is colored to an aesthetically displeasing degree.
The guideline value is up to 15 true color units (TCU) although level
of color above 15 TCU can be detected in a glass of water.
6- Turbidity:
On aesthetic grounds, drinking water should be free from
turbidity. Turbidity in drinking water is caused by particulate matter

Assessment of Groundwater Quality in Omdurman City
39
that may be present as a consequence of inadequate treatment or
from resuspension of sediment in the distribution system. It may also
be due to the presence of inorganic particulate matter in some
ground water. Turbidity interferes with disinfection and
microbiological determinations. Water with turbidity of less than 5
nephelometric turbidity units (NTU) is usually acceptable to
consumer (Park, 2002).
2-7-2 Chemical characteristic:
Chemical parameters enable us to classify the water and find
degree of pollution and cause of sharp increase of polluting
substances. The main parameters can be stated as:-
1- PH:-
PH one of the main objectives in controlling the PH is to
minimize corrosion and incrustation in the distribution system. PH
level of less than 7 may cause severe corrosion of metals in the
distribution pipes and elevated concentrations of certain chemical
substances such as lead, may result. At PH levels above 8 there is a
progressive decrease in the efficiency of the chlorine disinfection
process. An acceptable PH for drinking water is between 6.5 - 8.5.
2- Hydrogen sulphide:
In water are estimated to be between 0.05 and 0.1 mg/l. the
hydrogen sulphide is particularly noticeable in some ground waters
and stagnant drinking water in distribution system as the result of
oxygen depletion and the subsequent reduction of sulphate by
bacterial activity, sulphide is oxidized rapidly to sulphade in well.

Assessment of Groundwater Quality in Omdurman City
40
3- Iron:
Iron anoreobic ground water may contain ferrous at
concentrations of up to several mg/liter without discoloration
turbidity in water when directly pumped from the well. At level
above 0.3 mg/liter, iron stains laundry and plumbing fixture.
4- Sodium:
The taste threshold concentration of sodium in water depends
on the associated anion and the temperature of the solution. At room
temperature the average taste threshold for sodium is about 200
mg/l.
5- Sulphate:
The presence of Sulphate in drinking water can cause noticeable
taste. It is generally considered that taste impairment is minimal at
levels below 250 mg/liter.
6- Total dissolved solids:
(TDS) can have an important effect an the taste of drinking water.
The palatability of water with a TDS level of less than 600 mg/liter
is generally considered to be good. Drinking water become
increasingly unpalatable at TDS levels greater than 1200 mg/l. water
with extremely low concentration of TDS may be unacceptable
because of it is flat, insipid taste. The presence of high levels of TDS
may also be objectionable to consumer owing to excessive scaling in
water pipes, heaters, boilers..etc Water with concentrations of TDS
below1000mg/l is usually acceptable to consumers.

Assessment of Groundwater Quality in Omdurman City
41
7- Manganese:
Manganese concentrations below 0.1 mg/l are usually
acceptable to consumers. At level above 0.1 mg/l manganese in
water supplies stains sanitary ware and laundry, and causes an
undesirable taste in beverages. It may lead to accumulation of
deposits in the distribution system. Even at concentration of 0.02
mg/liter manganese will often form a coating on pipes, which may
slough off as a black precipitate.
8- Nitrate and nitrite:
Nitrate and nitrite are naturally occurring ions that are part of
nitrogen cycle. Naturally occurring levels in surface and ground
water are generally a few milligrams per liter. In many ground
waters, an increase of nitrate level has been observed owing to the
intensification of farming practice.
In some countries, up to 10 percent of the population may be
exposed to nitrate level in drinking water of above 50 mg/liter. The
guideline value for nitrate in drinking water is solely to prevent
methamoglobinaemia, which depends upon the conversion of nitrate
into nitrite.
As a result of recent evidence of the presence of nitrite in some
water supplies, it was concluded that a guideline value of 3 mg/liter
for nitrite should be proposed (Park, 2002).
9- Fluoride:
The concentration of fluoride is critical for dental health in
children. Too high a concentration can result in dental flourosis, in
some children, but small amount is essential for the prevention of

Assessment of Groundwater Quality in Omdurman City
42
dental caries. The desirable concentration varies with average
ambient temperature; it should be 0.9-1.7 mg/l at 10°c, 0.7-1.2 mg/l
at 20°c and 0.6-0.8 mg/l at 30°c (Richard et al 1982).
Ground water may contain about 10 mg/l in areas rich in
fluoride – containing minerals. The guideline value suggested is 1.5
mg/l (Park, 2002).
10- Chloride:
Large quantities of chlorides are usually present in surface and
ground waters, Pollution of water by industrial activities might be
the cause for further increase in chloride concentration (INWRDAM,
1997).
11- Free Ammonia:
Free ammonia represents the first product of decomposition of
organic matter, thus appreciable concentration of free ammonia
usually indicate "fresh pollution" of sanitary significance. Ammonia
in the range of 0.2 to 2.0 mg/l is toxic to many fish.
12- Alkalinity:
The alkalinity of water passing through iron distribution system
should be in the range of 30 to 100 mg/L as ca co3, to present serious
corrosion, up to 200 mg/l is standpoint of PH, hardness, carbon
dioxide and dissolved oxygen content – corrosion of iron pipe is
prevented by the maintenance of calcium – carbonate stability –
sufficient alkalinity is needed to water to react with added alum to
form a floc in water coagulation. Insufficient alkalinity will cause
alum to remain in solution. Bathing or washing in water of excessive

Assessment of Groundwater Quality in Omdurman City
43
alkalinity can change the PH of the lacrimal fluid around the eye,
causing eye irritation.
13- Hardness:
Hardness results from the presence of divalent metallic
cations, of which calcium and magnesium are the most abundant in
ground water. These ions react with soap to form precipitates and
with certain anions present in the water to form scale. Because of
their adverse action with soap, hard waters are unsatisfactory for
household cleaning purposes. Hence water softening processes for
removal of hardness are needed (Santosh, 2005)
Hardness may be classified as:
(1) Temporary hardness: the presence of bicarbonates of calcium
and magnesium in water known as temporary hardness.
(2) Permanent hardness: the presence of sulphates, chloride and
nitrates of calcium and magnesium in water known as
permanent hardness (Basak, 2004).
The degree of hardness in water commly based on classification
listed in table:
Table (2-1) Hardness Classification of Water
H mg/l as caco3 Water class 0 – 75 Soft 75 – 150 Moderately hard 150 – 200 Hard Over 300 Very hard
(Santosh,2005)

Assessment of Groundwater Quality in Omdurman City
44
2-7-3 Bacteriological characteristic:
From the health point of view the most important characteristic
of good water obviously an absence of pathogenic organism, most
microorganisms are actually harmless, however, some of the people
who pollute a water source may have diseases and there for all faecal
organisms should ideally be absence. Faeces of healthy as well as ill
people contain millions of Echerchia cloi and these are generally
taken as a measure of faecal pollution although faecal streptococci
and clostridium perfingers are also used (Richard and etal, 1982).
1- Escherichia coli:
E-coli is a member of the family enterobacteriaceae, and
characterized by possession of the enzymes B-galactosidase and B-
glucuronidase. It grows at 44-45°c on complex media, ferments
lactose and manitol with the production of acid and gas, and
produces indol from tryptophan. Some strains can grow at 37°c and
some do not produce gas. E-coli dose not produce oxidase or
hydrolyse urea. The WHO international standard lay down that in
piped supplies there should be no E.coli. This high level of purity is
attainable.
2- Thermo tolerant coli form bacteria:
These are defined as the group of coliform organism that are
able to ferment lactose at 44-45°c. They comprise the genus E-coli,
thermo tolerant coli forms other that E.coli may also originate from
organically enriched water such as industrial effluents or from
decaying plant materials and soils.

Assessment of Groundwater Quality in Omdurman City
45
Re-growth thermotolerant coliforms organisms in the distribution
system is unlikely unless sufficient bacterial nutrients are present or
unsuitable materials are in contact with treated water, water
temperature is above 13°c, and there is no free residual chlorine.
The concentration of thermo tolerant coli forms are under most
circumstances, directly related to that of E coli. Hence, their use in
assessing water quality is considered acceptable for routine
purposes.
3- Coliform organisms (total coliforms):-
Coliform organisms have long been recognized as a suitable
microbial indicator of drinking water quality, largely because they
are easy to detect in water. The term coliform organism refers to
gram-negative, rod-shaped bacteria capable of growth in the
presence of bile salt or other surface agent with similar growth-
inhiting properties and able to ferment lactose at 35-37°c with the
production of acid, gas and aldhyed within 24-48 hours. They are
also oxidase-negative and non spore-forming. Coliform bacteria
should not be detectable in treated water supplies and, if found,
suggest inadequate treatment, post treatment contamination, or
excessive nutrients (WHO, 1995).
2-8 Water related diseases:
Up to 80% of all sickness and diseases in the world is caused
by inadequate sanitation, polluted water, or un availability of water
Approximately three out five persons in developing countries do not
have access to safe drinking water and only about one of four has
any kind of sanitation facility (WHO, 1971).

Assessment of Groundwater Quality in Omdurman City
46
Pollution and contamination can lead to water-related diseases which
causing a great suffering to whole communities causes of high
morbidity and mortality in developing countries, especially in infants
under the age of five.
Children are particularly vulnerable to faecal-oral diseases
transmission (Stockman, 1994).
Water related diseases could be further divided into four categories:-
• Water-washed diseases: Which are caused by insufficient
water for personal hygiene example, dysentery-diarrhea.
• Water-borne diseases: Which are caused by drinking water
contaminated with the harmful organisms. As example
hepatitis, typhoid and cholera.
• Water based diseases: Which arise through agent, which
spend part of their lives in aquatic amimls. As example
Schistosomiasis, and Guinea worm.
• Water related insect vector diseases: Which are due to
insects that spend part of their lives in water and transmit
parasites to man. As example: plasmodium spp (WASH,
1982).
2-9 Water pollution:
The world health organization consider water to be polluted
when charged in composition or condition, directly or indirectly, as a
result of man's activities, making them unsuitable, or less suitable for
any or all of functions or purposes for which they would be suitable
in their natural state (WHO,1988).

Assessment of Groundwater Quality in Omdurman City
47
The maximum permitted concentration of various substances in
public water supply is controlled throughout the world by legislation
and varies to some extent for country to country (Overman, 1976).
2-9-1 Pollution of ground water:
Groundwater pollution may be defined as the artificially
induced degradation at natural ground water quality. Pollution can
impair the use of water and create hazard to public health through
toxicity or the spread of diseases. Most pollution originates from
disposal of waste water following the use of water for any of a wide
variety of purposes. Thus, a large number of source and causes can
modify ground water quality (David, 1995).
Polluted groundwater is extremely difficult to purify on
account of its slow flow rates, inaccessibility and its huge volume.
Aquifers are becoming increasingly polluted as a result of human
action in three forms:
1- Pollution from urbanization:
Urbanization introduces many changes to the aquifers that lie
under cities. Natural recharge mechanisms are modified or replaced
and new ones introduced. Leakages and seepages from mains water
and sanitation system become an important part of the hydrological
cycle in the urban environment.
Many sub-city aquifers are polluted with human wastes in
Sudan. Septic tank, pits and latrine are common in Sudan and
operated inefficiently. Effluent is often discharged directly into
inland waterways; hence pollutants find their way into underlie

Assessment of Groundwater Quality in Omdurman City
48
aquifer. In a city like Khartoum, which has over 0.5 million of septic
tanks and latrines, the ensuring pollution is serious.
Other forms of excreta disposal can even be more dangerous
since they often drain directly into the ground, carrying with them
pathogens responsible for many human diseases.
Since about 50%, drinking water in Khartoum is provided by
groundwater, which is inadequately protected from pollutions
causing, pathogens like helminthes, protozoa bacteria and virus.
Most the pathogens of will be reduced within 10 day, however, some
of them 200 days. Wastewater discharge and solid waste disposal
can also give rise to serious ground water pollution.
2- Pollution from industry:
Nearly all industries produce liquid effluent in developing
countries, no strict legislation has insured that much of this effluent
is properly treated, where industries are commonly sited on the
outskirts of towns and cities, these industries generate effluent
containing spend acids, oils, fuels and solvents, many of which are
discharged directly into the ground or nearby water sources. These
effluents also often contain high levels of metals such as iron, zinc,
chromium and cadmium.
Many are highly toxic, even carcinogenic. High concentration
of chromium and cyanide may be found in shallow groundwater.
Mining and petroleum extraction pose special risks to ground water.
Removing the protective layer above an aquifer, leaving it more
vulnerable to pollution. Deep mines or oil fields may produce fluids

Assessment of Groundwater Quality in Omdurman City
49
that are disposed of at the surface and may therefore contaminate the
aquifer.
3- Pollution from agriculture:
Agriculture is responsible for the serious pollution of many
aquifers; the main problem arises from the intensive use of nitrogen-
rich fertilizers and of pesticides. High level of nitrates and in some
areas pesticides in groundwater have been identified as originating
from intensive agriculture (Tag Elsir and etal, 2000).

Assessment of Groundwater Quality in Omdurman City
50
Table (2-2): Principal Chemical Constituents in Groundwater, their Sources, Concentration, and Effect on Usability
(Modified from G. N. Durfer, and E. Baker, USGS Water-Supply Paper 1812, 1964)
Constituent Major Natural Sources Constituent in Natural Water Effect on Usability of Water
Silica (SiO2) Feldspars, ferromagnesium and clay minerals, amorphous silica, chert, opal
Ranges generally from 1.0 to 30 mg/l, although as much as 100 mg/l id fairly common; as much as 4000 mg/l is found in brines
In the presence of calcium and magnesium, silica forms a scale in boilers and on steam turbines that retards heat; the scale is difficult to remove, silica may be added to soft water to inhibit corrosion of iron pipes.
Iron (Fe) Igneous rocks, amphiboles, ferromagnesium micas, ferrous sulfide (FeS), ferric sulfide or iron pyrite (FeS2), magnetite (Fe3O4) sandstone rocks, carbonates, and sulfides or iron clay minerals.
Generally less than 0.50 mg/l in fully aerated water. Groundwater having a pH less than 8.0 may contain 10 mg/l; rarely as much as 50 mg/l may occur. Acid water from thermal springs, mine wastes, and in dustrial wastes may contain more than 6000 mg/l.
More than 0.i mg/l precipitates after exposure to air; causes turbidity, stains plumbing fixtures, laundry, and cooking utensils, and imparts objectionable tastes and colors to foods and drinks, more than 0.2 mg/l is objectionable for most industrial uses.
Manganese (Mn)
Manganese in natural water probably comes most often from soils and sediments. Metamorphic and sedimentary rocks and mica biotite and amphibole minerals contain large amount of manganese.
Generally 0.20 mg/l or less, groundwater and acid mine water may contain more than.
More than 0.2 mg/l precipitates upon oxidation; causes undesirable tastes, deposits on foods during cooking, stains plumbing fixtures and laundry, and fosters growths in reservoirs, filters, and distribution systems.
Calcium (Ca) Amphiboles, fedspars, gypsum, pyroxenes, aragonite, calcite, dolomite, clay minerals
Generally less than 100 mg/l, brines may contain as much as 75.000 mg/l.
Magnesium (Mg)
Amphiboles, olivine, pyroxenes, dolomite, magnesite, clay minerals
Generally less than 50 mg/l; ocean water contain more than 1000 mg/l, and brines may contain as much as 57.000 mg/l.
Calcium and magnesium combine with bicarbonate, car bonate, sulfate and silica to form heat retarding, pipe clogging scale in boilers and in other heat-exchange equipment. Calcium and magnesium combine with ions of fatty acid in soaps to form soapsuds; the more soap required to form suds. a high concentration of magnesium has a laxative effect, especially on new users of the supply.
Sodium (Na) Feldspars (albite), clay minerals, evaporates, such as halite (NaCI) and mirabilite (Na2SO410H2o) industrial wastes.
Generally less 200 mg/l, about 10.000 mg/l in seawater; about 25.000 mg/l in brines
More than 50 mg/l sodium and potassium in the presence of suspended matter causes foaming, which accelerate scale for mation and corrosion in boilers. Sodium and potassium carbonate in recalculating cooling water can cause deterioration of wood in cooling towers. More than 65 mg/l of sodium can cause problems in ice manufacture

Assessment of Groundwater Quality in Omdurman City
51
Table (2-2)Continued
Constituent Major Natural Sources
Constituent in Natural Water Effect on Usability of Water
Carbonate (CO3) Commonly less than 10 mg/l in groundwater. Water high in sodium may contain as much as 50 mg/l of carbonate
Bicarbonate (HCO3) Limestone, dolomite Commonly less than 500 mg/l except in water highly charged with carbon dioxide
Upon heating, bicarbonate is changed into steam carbon dioxide and carbonate. The carbonate combines with alkaline earths-principally calcium carbonate that retards flow of heat through pipes. Water containing large amounts of bicarbonate and alkalinity is undesirable in many industries
Sulfate (SO4) Oxidation of sulfide ores; gypsum, snhydrite
Commonly less than 300 mg/l except wells influenced by acid mine drainage. As much as 20.000 mg/l in some brines.
Sulfate combines with calcium to form an adherent, heat retarding scale. More than 250 mg/l is objectionable in water in some industries. Water containing about 500 mg/l of sulfate testes bitter; water containing about 1000 mg/l may be cathartic
Chloride (C1) Chief source is sedimentary rock (evaporates), minor sources are igneous rocks
Commonly less than 10 mg/l in humid regions but up to 1000 mg/l in more arid regions. About 19.300 in seawater; and as mush as 200.000 mg/l in brines
Chloride in excess of 100 mg/l imparts a salty taste. Concentration greatly in excess of 100 mg/l may cause physiological damage. Food process less than 250mh/l. some in dustries-textile processing paper manufacturing. And synthetic rubber manufacturing desire less than 100 mg/l.
Fluoride (F) Amphiholes (hornblende), apatite, fluorite, mica
Concentration generally do not exceed 10 mg/l. concentrations may be as much as 1600 mg/l in brines
Fluoride concentrations between 0.6 and 1.7 mg/l in drinking water has a beneficial effect on the structure and resistance to decay of children's teeth. Fluoride in excess of 1.5 mg/l in some areas causes "mottled enamel" in children's teeth. Fluoride in excess of 6.0 mg/l causes pronounced mottling and disfiguration of teeth
Nitrate (NO3) Atmosphere, legumes, plant, debris, animal excrement
Commonly less tan 10 mg/l Water containing large amounts of nitrate (more than 100 mg/l) is bitter tasting and may cause physiological distress. Water from shallow wells containing more than 45 mg/l has been reported to cause methemoglobinemia in infants. Some amounts of nitrate help reduce cracking of high pressure boiler steel
Dissolved solids The mineral constituents dissolved in water constitute the dissolved solid
Commonly contains less than 5000 mg/l, some brines contain as much as 300.000 mg/l
More than 500 mg/l is undesirable for drinking and many in dustrial uses. Less than 300 mg/l desirable for dyeing of textiles and the manufacture of plastics, pulp paper, rayon. Dissolved solids cause foaming in steam boilers, the maximum permissible content de creases with increases in operating pressure
(David, 995)

Assessment of Groundwater Quality in Omdurman City
52
2-10 Ground water protection:
The most significant risk to human health related to drinking
water quality is from microbiological particularly fecal
contamination. Health protection thus demands, that sources of
microbiological contamination are located sufficiently far from
drinking water sources so as minimize or eliminate the health risk.
When abstraction from a water source for consumption is being
considered, the minimum safe distance for all potentially polluting
activities should be fixed during the planning stage. Both surface and
ground water sources of drinking water quality in its natural state is
generally of good quality, and because subsurface water movement
is relatively slow, it is usually easier to control sources of
contamination of groundwater than it is for surface water source.
The minimum safe distance should be determined from the time
taken by contaminants to travel from their source to the source of
drinking water. This will depend on local conditions, the most
important of which are the geological and hydrological conditions of
the area, the quantity of fecal matter likely to be discharged, and the
number of existing and planned sources of contamination. It is
therefore very difficult to specify a universally applicable minimum
distance between the location of, for instance, pit latrines and a water
source. In an area where the a aquifer is highly permeable the
minimum safe distance for a latrines will be far greater than area
where a relatively thick and impermeable un saturated zone over lies
an aquifer of relatively low permeability (WHO, 1997).

Assessment of Groundwater Quality in Omdurman City
53
The direction of flow of groundwater in an area will also
influence the MSD, as a general rule, shallow groundwater
movement reflects surface topography; source of contamination
should therefore be located downhill of drinking water source
wherever possible (WHO 1997).
2-11 Water treatment process:
The purpose of water treatment is to produce water that is safe
and wholesome. The components of a typical water treatment system
comprise one or more of the following manures:
1- Storage:
By mere storage, the quality of water improves. Physically:
About 90 per cent of the suspended impurities settle down in 24
hours by gravity. The water becomes clearer. Chemically: Certain
chemical changes also take place during storage, the aerobic bacteria
oxidize the organic matter present in the water with the aid of DO.
As the result, the content of free ammonia is reduced and a rise in
nitrate occurs. Biological, the pathogenic organisms gradually die
out. It is found that when by river water storage the total bacterial count
drops is by as much as 90 percent in the first 5-7 days (Park, 2002)
2- Filtration:
Filtration is the second stage in the purification of water and
quite an important, because 98-99% of bacteria are removed by
filtration. Two types of filters are in use: "slow sand" filters and
"rapid sand" filters (Park, 2002).

Assessment of Groundwater Quality in Omdurman City
54
3- Disinfection:
The principle reason for disinfecting drinking-water is to
ensure the destruction of pathogens, entering the distribution system
(WHO, 1984).
Water may be disinfected by various physical or chemical means:-
• Boiling.
• Ultra violet radiation.
• Chemical procedures.
The most commonly used chemical reagent are chlorine and its
compounds (WHO, 1995) on small scale, water can also be
disinfected by small quantities of metals or metal salt, this
phenomenon is called oligdynamic action of metals or metal salt
(Metcalf and etal,1991).
Chlorinating of water at house hold level can be applied as an
emergency measure or as a part of every day life in some cases, the
water needs pretreatment like filtering in order to remove turbidity
(Tom and et al, 1997).
Disinfection of wells:-
Wells are the main source of water supply in the rural areas. The
need often arises to disinfect them, sometimes on a mass scale during
epidemics of cholera and gastroenteritis. The most effective and cheapest
method of disinfecting wells is by bleaching power. Potassium
permanganate should not be used, as it is not a satisfactory disinfection
agent.

Assessment of Groundwater Quality in Omdurman City
55
Steps in Well Disinfection:
1- Find the volume of water in well:
a- Measure the depth of water column … (h) meter.
b- Measure the diameter of well … (d) meter.
c- Substitute h and d in:
Volume (liter)
d- One cubic meter = 1000 liter of water.
2- Find the amount of bleaching powder required for disinfection:
Estimate the chlorine demand of the well water by horrock’s
apparatus and calculate the amount of bleaching powder required to
disinfect the well. Roughly, 2.5 grams of good quality bleaching
powder would be required to disinfect, 1000 liter of water. This will
give an approximate dose of 0.7mg of applied chlorine per liter of
water (Park, 2002)
3- Dissolve bleaching powder in water:
The bleaching powder required for disinfecting the well is
placed in a bucket and made into a thin paste. More water is added
till the bucket is nearly three – fourths full. The content are stirred
well, and allowed to sediment for 5 to 10 minutes when time settles
down. The supernatant solution which is chlorine solution is
transferred to another bucket, and the chalk or lime is discarded.
4- Delivery of chlorine solution into the well:
The bucket containing the chlorine solution is lowered some
distance below the water surface, and the well water is agitated by
moving the bucket violently both vertically and laterally. This
3.14 X d2 4
X h X 1000
Assessment of Groundwater Quality in Omdurman City
56
should be done several times so that the chlorine solution mixes
intimately with the water inside the well.
5- Contact period:
A contact period of one hour is allowed before the water is
drawn for use.
6- Orthotolidine arsenite test:
It is good practice to test for residual chlorine at the end of one
hour contact. If the “free” residual chlorine level is less than
0.5mg/liter, the chlorination procedure should be repeated before
any water is drawn. Wells are best disinfected at night after the day’s
draw off. During epidemics of cholera, wells should be disinfected
every day (Park, 2002)
Adsorption:
Is a physical process in which dissolved molecules or small
particles "the adsorbs" are attracted and become attached to the
surface of something larger "the adsorbent". An activated carbon
adsorbs dissolved molecules and sub-micro particles, heavy metals
like lead and cadmium that gets to water from corrosion of plumping
materials (Everpure, 2000).
4- Aeration:
Aeration is a process used in preparing potable water. It may
be used to remove:
• Undesirable gases dissolved in water (degasification) or
• To add oxygen to water to convert undesirable substances to
more manageable from (oxidation).

Assessment of Groundwater Quality in Omdurman City
57
• Volatile liquids such as humic acids and phenols.
• Iron and manganese (precipitate after aeration).Aeration is
more often used to treat ground water (Howards,1986).
5- Removal of turbidity
Turbidity refers to solids and organic matter that do not settle
out of water. Groundwater is rarely turbid unlike surface water
which often contains suspended solids and colloidal or soluble
organic matter. Shallow Groundwater taken from area near swamp
and marshes, however may by high insoluble organic matter.
Eliminating turbidity not only increases the aesthetic quality of
water, it also helps remove contaminants that cling to suspended
solids and inhibits the formation trihalomethanes, after treatment, by
removing organic precursor substances. Maximum contaminant level
has been established for turbidity because solid in water can interfere
with disinfection process and microbiological determinations.
6- Removal of inorganic substances:
Research by U.S "EPA" shown that no one treatment method
is effective for removing all inorganic chemicals. The most effective
treatment methods are presented in table (2-3) other metallic ions
such as iron, manganese, calcium and magnesium are not harmful at
concentration found in ground water, but are often remove or
reduced in concentration for taste, color or other reasons. Table (2-4)
lists general treatment processes that remove suspended, colloidal,
and dissolved solids. Conventional coagulation and lime softening
are the principal methods, although ion exchange and reverse
osmosis are some times used. Other methods such as distillation my

Assessment of Groundwater Quality in Omdurman City
58
be effective in removing these contaminants in homes, but are too
expensive for large scale systems (Flecher, 1986).
7- Removal of fluoride:
High fluoride levels in groundwater can be removed by filtering
through bone char. Which can subsequently be regenerated and this
approach has been adopted for small community water supplies
(WHO, 1997).
8- Removal of Iron and Manganese:-
Both well and surface waters, but particularly the former are
likely to have iron dissolved with them as the result of Carbon
dioxide coming in contact with Iron are form soluble ferrous
bicarbonate. Manganese may be associated with the iron and in this
case removal is more difficult.
Treatments required for removal of iron and Manganese will
depend upon the conditions under which they exist in the water. Iron
alone in the absence of organic matter can usually be removed by
simple aeration followed by sedimentation and filtration.
Combinations of iron and Manganese or iron alone, loosely bound to
organic mater may require aeration in trickling beds containing coke,
gravel, or crushed pyrolusite, followed by sedimentation and
filtration. In other cases aeration, chlorination, or chlorination alone,
followed by sedimentation and filtration will be more efficient. If
organic acids are also present, aeration, dosage with lime,
sedimentation, and Filtrations are effective. Well waters containing
no dissolved oxygen can be treated without aeration sodium zeolite
units and manganese zeolite if necessary. Soft well waters without

Assessment of Groundwater Quality in Omdurman City
59
oxygen can be treated by feeding time into enclosed mixing and
settling tank, followed by a pressure filter. Sedimentation, where
mentioned above, usually also must be aided by coagulation, and the
filters, where bacteriological contamination is not present, may be of
the pressure type (Steel, 1960).
9- Water softening:
Water softening is defined as the removal of hardness from
water. It is essential to soften the water to make it safe for public
uses.
The advantage of softening is:
• Reduction of soap consumption.
• Lowered cost in maintaining plumbing fixtures.
• Removed taste of food preparation.
The methods of removing temporary hardness is boiling or by
adding lime (Santosh, 2005).
10- Removal of coliform organism:
In the past, most groundwater was of such high quality that
disinfection, although often required by law, was probably the
unnecessary. Today, presence of microbes in groundwater is
becoming more wide spread, and more rigorous treatment of
groundwater is required. For example Gaiadia limblia has spread
from mountain streams in the Rocky Mountain to wells in Clorado,
Montana, and other western states. In large water treatment system,
the Giardia cysts generally cannot be removed by disinfection alone,
although recent research has shown that ozone is effective in

Assessment of Groundwater Quality in Omdurman City
60
deactivating cysts of some giardia species (Wickramana etal,
1985).Diatomaceous earth or granular-media filtration methods must
also be used.
Table (2-3) Most Effective Treatment Methods for Removal
Of Inorganic Contaminants
Contaminant Most effective methods
Arsenic As+3
Ferric sulfate coagulation, pH 6-8 Alum coagulation, pH 6-8 Excess lime softening Oxidation sulfate coagulation
As+5 Ferric coagulation, pH 6-7 Alum coagulation, pH 6-7 Excess lime softening
Barium (Ba) lime softening, pH 10-11 ion exchange
Cadmium Cr+3
Ferric sulfate coagulation, pH 6-9 lime softening Excess lime softening
Cr+3 Ferrous sulfate coagulation, pH 7-9-5 Fluoride (F) Ion exchange with activated-alumina or bone-char
media Lead (Pb) Ferric sulfate coagulation, pH 6-9
Alum coagulation, pH 6-9 lime softening Excess lime softening
Mercury (Hg) Inorganic Organic
Ferric sulfate coagulation, pH 7-8 Granular activated carbon
Nitrate (NO3) Ion exchange Selenium
Se+4
Se+6
Ferric sulfate coagulation, pH 6-7 Ion exchange Reverse osmosis Ion exchange Reverse osmosis
Silver (Ag) Ferric sulfate coagulation, pH 7-9 Alum coagulation, pH 6-9 lime softening Excess lime softening
(U.S. EPA, 1978)

Assessment of Groundwater Quality in Omdurman City
61
Table (2-4) Water and Waste Treatment Processes
Process General use or capability Advantage Disadvantage
Coagulation sedimentation, and filtration
Reduction in suspended solids by 90-98%
Low cost Simplicity
Large area required Dose not remove dissolved salts or dissolved organics
Softening Reduction in hardness level by 95-100%
Relatively low in cost for low hardness water Simplicity
Requires frequent regeneration Chemical regeneration need increases linearly with hardness
Ion exchange Reduction of dissolved salts by 95-100%
Can reach very low levels of salinity
Does not remove dissolved organics Requires regeneration chemical which adds to waste loading
Biological treatment
Reduction of organic loading by 50-90%
Low in cost Subject to upsets and variations Cannot remove more than 90% of organic loading which is subject to biological degradation
Carbon columns Reduction of absorbable organic loading by 95-100%
Effective way to remove small quantities of organic
Relatively expensive regeneration Remove only specific organic
Evaporation Removal of dissolved solids and suspended solid
Well demonstrated Can handle wide range of application
High energy use
Reverse osmosis Reduction of nearly all contaminants by 90-95%
Simple Low energy utilization
Membrane subject to fouling or deterioration if Not properly operated Not effective to very low molecular weight organics General requires some form of pretreatment Limited chemical compatibility
(Office of Water Research and Technology, 1979)
Assessment of Groundwater Quality in Omdurman City
62
2-12 Water distribution:
• Water distribution systems are needed to convey the water
drawn from the source, through treatment and storage
facilities, to the point where it is delivered to the users.
• Water distribution system should be kept simple. They should
.however be designed and constructed in a proper way as they
represent a substantial capital investment that should always
be useful and cost effective.
• An appropriate water distribution system should ensure an
even converge of water need among the places of population.
• The design, construction, operation and maintenance of the
water supply system should be carried out bearing in mind the
need to minimize water wastage. This is particularly.
Important in systems based on low yield water source or on
those requiring treatment or pumping.
Water distribution system should be built to deliver the required
quantity of water to individual users and under satisfactory pressure.
The main system components are the pipelines, other basic
component are break pressure tanks, valves, service reservoirs and
watering points(UNHCR, 1992).

Assessment of Groundwater Quality in Omdurman City
63
CHAPTER 3
Methodology

Assessment of Groundwater Quality in Omdurman City
64
3- Materials and Methods
This study was conducted at Omdurman city in the period
from August 2006 to March 2007.
3-1 Study Area: Geographical Location:-
Omdurman is a significant city that constitutes part of the
triple capital of the Sudan .It is situated at the junction of the Blue
and the White Nile and is bounded by latitudes 15° - 30 – 15° - 45 N
and longitutedes 32° -20 – 31° S.
htt:www.khartoum State. Com
This study was carried out in Omdurman (Omdurman, Ombadah and
Kararri localities) Climate:-
The climate conditions of the study area generally is Khartoum
state climatic condition characterized as very hot in summer
(maximum temperature is 45°c), cold dry in short winter that begins
in January extending to march every year, (temperature between 20-
30°c, and mean relative humidity is less than 16%).
The rainy season is of short duration, begins in June and rise to
peak rain fall in august ranging between (100-200mm) annually
(K.P.H.S.M. Reports, 1999). Demography:-
Omdurman has a population of about 2.758.401 persons
(Omdurman locality 508,401 person, Kararri 750.000 persons,
Ombada 1.500.000 persons).

Assessment of Groundwater Quality in Omdurman City
65
The ethnic constitution of population is diverse and there are an
intensive migration from the different states of the Sudan. (important
characteristics of Khartoum state localities Report 2004). Socioeconomic Status:-
There are three socioeconomic levels:
1. High socioeconomic level.
2. Medium socioeconomic level.
3. Low socioeconomic level. Sanitation:-
In the new peripheral, Harras are (neighborhoods) very poor with
low sanitary standard, and with no system for solid waste disposal. Health services:-
In a country torn by wars and poverty, more facilitated
hospitals are needed in the whole of Sudan. Furthermore being a
highly-populated city, small private clinics that are scattered
throughout the city, are a common sight, especially close to Hay
Alshuhada.
Some Hospitals Include:
• Omdurman Teaching Hospital, a public hospital with an
emergency centre.
• Blue Nile Hospital, a private hospital
• Aldayat Teaching Hospital, a public hospital specializing in
pregnancy and delivery
• Army Hospital
• Altigany Almahy Teaching Hospital, a public historical
hospital specializing in psychological and mental disorders.

Assessment of Groundwater Quality in Omdurman City
66
Education:-
There are several educational institutions in Omdurman. Some of
the notable high schools include:
• Abu Kadok High Secondary School.
• Almutmar High Secondary School.
• Omdurman Ahlia High Secondary School.
• Omdurman High Secondary School.
• Wadi Saydna High Secondary School- one of famous
historical high schools in Sudan.
Colleges and universities include:
• Ahfad University for Women.
• College of Technological Sciences.
• Omdurman Ahlia University.
• Omdurman Islamic University.
• University of Holy Quran and Holy Sciences.
Furthermore, there are several public libraries in Omdurman.
Albashir Alrayah Library is a famous library, a hot destination for
students, researchers and intellectuals. The library hosts several
lectures and panels offered by various guest speakers and
organizations.
Transportation and Communication:-
The study area has streets that link all parts of Omdurman
(Ombada, Omdurman, Kararri, localities) and also three bridges
connecties with Khartoum and Khartoum North,(Omdurman bridges

Assessment of Groundwater Quality in Omdurman City
67
Shambatt bridges Elfethab bridges), and also is served with
telephone, internet…… etc.
Electricity:-
The study areas are supplied with public electricity, but the
major new expansions of Omdurman are without electricity.
htt:www.KhartoumState.Com
Water supply:-
Table No (3-1): Statistical overview of hydrochemical
characteristics of groundwater
p://www.worldsummit2002.org/texts/SudanR-ASIM.pdf
Eastern area Central area Omdurman area Parameters Min. Max. Mean Min. Max. Mean Min. Max. Mean
PH 6.5 8.4 7.6 7.2 8.4 7.8 6.8 9.6 7.7 EC (µs/cm) 281 4070 918 263 3180 718 116.1 4690 867 TDS 150 2890 626 184 2204 492 180 3283 751 Hardness 52 618 208 42 920 174 70 950 194 Alkalinity 124 372 232 75 573 239 2 402 30.3 HCO-3 122 372 237 98 573 233 110 402 239 Cl- 12 817 105 10 585 78 12 1007 137
Na+ 25 980 116 8 304 96 16 504 127

Assessment of Groundwater Quality in Omdurman City
68
3-2 Sample size:-
Table No (3-2): Number of Samples form Khartoum State:-
Total of Samples
Number of Population Sources No
151 1404848 Boreholes Served with direct
Net work
1
188 1775611 Boreholes Not Served with
Direct Net work
2
339 3180459 Total 3
Note:- The calculation of samples according to (1) samples per
(10000) population, plus 10 additional samples (WHO, 1993).
Table No (3-3): The total and Target Number
of Boreholes in Khartoum State.
Target of Boreholes Total of Boreholes
Total Not Served by Direct Net Work
Served by Direct Net
work Total
Not Served by Direct Net Work
Served by Direct Net work
Area No
1 0111011Khartoum1
14 31113728109Jabel Awlia2
5 23531934Omdurman3
6 15701753Karrari4
4 3136288Ombada5
8 17771265Bahri6
8 1774767Sharq Elnil7
46 1135458111347Total8
The number of boreholes selected was 46 which represent about
10% from the total number of boreholes in Khartoum state. Sample
was determined by the ministry of health.

Assessment of Groundwater Quality in Omdurman City
69
In the study area, the number of boreholes selected are 15, nine of
them were served by direct network while six are not served by
direct net work.
The following tables show the distribution of samples over the study area.
Table (3-4) the total number of samples from the Khartoum state from
boreholes not connected direct to network
Of sample No Locality Target of
boreholes Source Water tower
Distribution system
Total
1 Kh - - - - - 2 Jabal awlia 3 3 3 45 51 3 Omd 2 2 2 31 35 4 Kararri 1 1 1 15 17 5 Ombada 3 3 3 45 51 6 Bahri 1 1 1 15 17 7 1 1 1 15 17 8 Total 11 11 11 166 188
Table (3-5) the total number of samples from the Khartoum state from boreholes connected direct to network
Of sample No Locality Target of
boreholes Source Water tower
Distribution system
Total
1 Kh 1 1 1 2 4 2 Jabal awlia 11 11 11 26 48 3 Omd 3 3 3 7 13 4 Kararri 5 5 5 12 22 5 Ombada 1 1 1 2 4 6 Bahri 7 7 7 16 30 7 Sharg Alnil 7 7 7 16 30 8 Total 35 35 35 81 151

Assessment of Groundwater Quality in Omdurman City
70
Table No (3-6): The Total Number of Samples in the Study Area from
Boreholes Served by Direct Net wok:-
No. of Samples Total Distribution
System Water Tower Source
No. of Target
Boreholes Area No
39 21 9 9 9 Omdurman City 1
Table No (3-7): The Total Number of Samples in the Study Area from Boreholes Not Served by Direct Network:-
No. of Samples Total Distribution
System Water Tower Source
No. of Target
Boreholes Area No
103 91 6 6 6 Omdurman City
1

Assessment of Groundwater Quality in Omdurman City
71
Number of Target Samples According the Localities
Table No (3-8): (1) Sample from Boreholes Served Direct by Network
No of samples
Localities No. of target boreholes Source Towers Distribution
system Total
Omdurman 3 3 3 7 13
Kararri 5 5 5 12 22
Ombada 1 1 1 2 4
Table No (3-9): (2) Samples from Boreholes not served Direct by Network
No of samples Localities No. of target
boreholes Source Towers Distribution system
Total
Omdurman 2 2 2 31 35
Kararri 1 1 1 15 17
Ombada 3 3 3 45 51

Assessment of Groundwater Quality in Omdurman City
72
3-3 Samples Collection:-
Water samples for bacteriological examination were collected
in a sterilized bottle. The out side of the tap was sterilized by flame,
and then water was allowed to run for two minutes to wash out any
organism in the pipe. The bottle was then filled with water and
closed immediately. Samples should be clearly labeled with the site,
date, time and nature of their work. Then water samples were
transported to the public health laboratory– Khartoum state for
analysis. Water samples for the chemical and physical examination
where collected in the clean bottles of 500ml. 3-4 Laboratory Analysis:-
Chemical, Physical and Bacteriological analysis.142 Samples
of water were collected for the bacteriological analysis .Samples for
bacteriological examination were collected in sterile bottles of 250
ml size.
15 Samples of water according to the number of wells in study
area were collected for chemical and physical analysis. 1- Bacteriological analysis:-
Presence – absence test for total coliform bacteria:-
Presence – absence tests may sometimes be appropriate where
positive results are known to be rare. They are not quantitative and,
as their name suggests, they indicate only the presence or absence of
the indicator sought. Such results are of little use in countries or
situations where contamination is common and the purpose of the
analysis is then to determine the degree of contamination rather than
simply to indicate its presence. Thus presence – absence tests are not
recommended for use in the analysis of the surface water, untreated

Assessment of Groundwater Quality in Omdurman City
73
small – community supplies in countries where operation and
maintenance difficulties may occasionally occur.
Before a decision is taken to use the presence – absence test for
the analysis of a water source, the results obtained by the test should
be compared with those obtained with a recognized, quantitative
method of analysis. Approximately 100 samples should be examined
by both methods (WHO, 1997). Preparation of medium:-
The medium used for the presence-absence test for coliform
bacteria are lauryl tryptose sulphate broth, make this media double
strength when examining 50ml sample.
1. Dissolve the dehydrated lauryl tryptose sulphate broth
sequentially in water, without heating.
2. Dispense 50ml of the medium into screw-cap glass dilution
bottles of capacity 250-300 ml. A fermentation tube is
necessary.
3. Autoclave for 12 minutes at 121°c, limiting the total time in
the autoclave to 30 minutes or less.
4. Measure the PH of the medium after autoclaving; it should be
6.8
1- Presumptive Test: -
1. Mix the sample thoroughly by inverting the sample bottle
several times.
2. Add 50ml of the sample to the dilution bottle.
3. Incubate at 35°c and examine after 48 hours.

Assessment of Groundwater Quality in Omdurman City
74
4. A positive result is indicated by the production of gas and
turbidity and regarded as a positive presumptive test (WHO,
1997).
2- Conifirmative Test:-
Each gas positive presumptive tube was inoculated into a tube
containing 5ml brilliant green bile broth with inverted Durham's
tube.
All tubes were incubated at 44-45°c for 24 hours to detect
feacal coliform. Negative tubes were described and results were
recorded. Positive tubes were shown by gas production and turbidity
appearance.
i- E.coli test (completed test)
A loop full of brilliant green positive tubes inoculated into 5ml
of peptone water and incubated at 44-45°c for 24hours, a drop of
kovac's reagent (0.2-0.3ml) was added. The dark red colour on the
surface culture indicated a positive test for indol. The only coliform
bacteria that is capable of producing indole from medium containing
tryptophane at 44-45°c is Ecoli (Mackie and Macartney,1997).
ii- Confirmative E.Coli Test:-
Insulate EMB media E.Coli produce green metallic cheen.
2- Chemical Analysis:-
1-Nitrite (NO2):-
1- Pipette 5ml of the sample in to a test tube.
2- Add 1 blue micro spoon ful of NO2-1AN.
3- Shake vigorously to dissolve the solid substance.

Assessment of Groundwater Quality in Omdurman City
75
4- Check the PH, specified range: PH 2—2,5.
5- If required, add dilute sodium hydroxide solution or sulfuric
acid drop by drop to adjust the PH.
6- Reaction time 10 minutes.
7- Transfer the solution in to a corresponding cell.
8- Select method with Auto Selector.
9- Place the cell in to the cell compartment.
2-Nitrate:-
1- Pipette 4ml of NO3-1 in to an empty round cell.
2- Add 0.5 ml of the sample, do not mix.
3- Add 0.5 ml of NO3-2 and mix. (Caution, cell becomes very
hot).
4- Reaction time 10 minutes.
5- Transfer the solution into a corresponding cell.
6- Select method with auto selector.
7- Place the cell into the cell compartment.
3-Chloride:-
1- Check the PH of the sample, specified range: PH 1-12.
2- If required, add dilute nitric acid or ammonia solution drop by
drop to adjust the PH.
3- Pipette 1 (for 10 -250 mg/L) or 5ml (2.5 -25 mg/L) of the
sample into a test tube.
4-Add 2.5 ml Cl-1 and mix.

Assessment of Groundwater Quality in Omdurman City
76
5-Add 0.5 ml Cl-2 and mix.
6- Reaction time 1 minute.
7- Transfer the solution into a cell.
8- Select method with auto selector.
9- Place the cell into the cell compartment.
4-Fluoride:-
1- Reagent F-1 (2ml).
2- Pipette into a test tube.
3- Pretreated sample (10-40°c) 5ml.
4- Add using pipette and mix.
5- Reagent F-2 (1 level blue micro spoon in the cap of the F-2
bottle).
6- Add and shake vigorously until the reagent is completely
dissolved.
7- Leave to stand for 5min (reaction time), then fill the sample
into 10 ml cell, and measure in the photometer.
5- PH Measuring (PH Cond. 340 i):-
1- Connect PH electrode to the measuring instrument.
2- Plug the electrical socket in to the mains line.
3- Switch on the PH meter by press (Open) key.
4- Remove the cap from the electrode
5- Wash the electrode by distilled water and the sample.
6- Immerse the electrode in the sample.
Assessment of Groundwater Quality in Omdurman City
77
7- Press (AR- Auto Red); key to activate auto reading
measurement (AR) appears on the display.
8- Press (RUN/Enter) to start the measuring until the reading
stable record the measuring value.
6-TDS Measuring:-
(Portable conductivity meter – model a ccumet AP75).
1- Rinse the probe with deionized or distilled water before use,
shake or air dry (to avoid contamination or dilution of your
sample), rinse probe with a small volume of your sample
liquid.
2- Press on (ON /OFF key) to switch on meter the MEAS a
nnunciator appears on the top center of the display.
3- Before taking reading ,calibrate READY indicator and HOLD
auto end point function by:-
3-1- Press setup key to enter to set up mode.
3-2- Press the ∆ and ◊ keys to scroll through subgroups until you
viet parameter P4.0.
3-3-Press the ENTER key to select parameter 4, 1.
3-4-Press the ∆ and ◊ keys to select the on and HOID together
switches the auto endpoint feature on.
3-5-Press the ENTER key to confirm selection.
3-6- Press the (AL/MEA) key to return measurement mode.

Assessment of Groundwater Quality in Omdurman City
78
4- Dip the probe in to the sample (when dipping the probe must
be immersed above the second steelband stir the probe gently in
the sample to create homogenous sample.
5- When reading stabilize REDY and HOID appears on the
display.
60 Record the reading value with the temperature in the results
book.
7-Press the HOID key to release the display freezes.
3- Physical Analysis:-
1-Taste and Odour:-
Taste of water sample measured by tasting.
Odour of water measured by smelling.
2- Conductivity:-
(Measuring PH/Cond 340i).
1. Connect the conductivity electrode to the measuring
instrument.
2. Plug the electrical socket in to the mains line.
3. Switch on the PH meter by press (Open) key.
4. Wash the electrode by distilled water and the sample.
5. Immerse the electrode in the sample.
6. Press (AR- Auto Red), key to activate auto reading
measurement (AR) appears on the display.
7. Press (RUN/Enter) to start the measuring until the reading
stable record the measuring value.

Assessment of Groundwater Quality in Omdurman City
79
CHAPTER 4
Results and Discussion

Assessment of Groundwater Quality in Omdurman City
80
4- Results and Discussion
Table No (4-1): Chemical Examination of Water From Boreholes in Omdurman area
No Well/Name F⎯ NO2⎯ NO3⎯ CL⎯ PH T.D.S
1 Jabarona Asqure (5) .89 <0.03 2.6 56 7.53 363 mg/ l at 22.1°c
2 Darelslam ombada asqure (11-12)
.78 <0.03 2.6 49 7.3 391 mg/l ar 22.4°c
3 Alamereia Asqure (44) – Awed Elkarem
1.05 <0.03 2.5 54 7.33 343 mg/l at 22.5°c
4 Teba Eliahamda 0.38 0.05 <2.2 5 7.5 270 mg/l at 21.9°c
5 Elgeaha (2) Elslha 095 0.05 <2.2 232 7.58 959 mg/l at 21.5°c
6 Elkede Awlad Haj Elteep
.0.06 <0.03 9.3 79 7.88 495 mg/l at 21.7°c
7 Elnoba South Karrari 0.35 <0.03 <2.2 4 7.68 223 mg/l at 22.5°c
8 Elsrorab – Elkawahla Kararri
0.25 <0.03 <2.2 12 7.59 296 mg/l at 23.2°c
9 Elthowera Elhara (53) Kararri
0.24 <0.03 <2.2 5 7.43 187 mg/l at 23.2°c
10 Elthowra Elhara (59) Kararri
0.37 <0.03 <2.2 23 7.4 276 mg/l at 23.7°c
11 Elshatabe Factor Kararri
0.35 <0.03 <2.2 65 7.62 348 mg/l at 22.9°c
12 Ombada Elhara (15) 0.54 <0.03 6.4 13 7.16 283 mg/l at 25.6°c
13 Jebial Eltrena South 0.27 <0.03 2.2 45 7.45 27 mg/l at 25.1°c
14 Elsahab For Water Factory
0.43 <0.03 23.5 72.50 7.18 1023 mg/l at 25.5°c
15 Faculty of Engineering University of Omdurman Alslamia
0.22 0.09 3.1 97 7.37 417 mg/l at 25.7°c

Assessment of Groundwater Quality in Omdurman City
81
Table No (4-2): Relationship Between TDS and Conductivity in Study Area
No Well/Name TDS Conductivity TDS/
Conductivity
1 Jabarona Asqure (5) 363 mg/ l at
22.1°c
695 ms/cm at 22.0°c 0.52
2 Dar Elslam Ombada Asqure
(11-12)
391 mg/l at
22.4°c
729 ms/cm at 22.6°c 0.53
3 Alamereia Asqure (44) –
Awed Elkarem
343 mg/l at
22.5°c
629 ms/cm at 22.1°c 0.54
4 Teba Eliahamda 270 mg/l at
21.9°c
506 ms/cm at 22.1°c 0.53
5 Elgeaha (2) Elslha 959 mg/l at
21.5°c
1815 ms/cm at
21.6°c
0.52
6 Elkede Awlad Haj Elteep 495 mg/l at
21.7°c
939 ms/cm at 21.6°c 0.52
7 Elnoba South Karrari 223 mg/l at
22.5°c
430 ms/cm at 22.3°c 0.51
8 Elsrorab – Elkawahla Kararri 296 mg/l at
23.2°c
559ms/cm at 23.1°c 0.52
9 Elthowera Elhara (53) Kararri 187 mg/l at
23.2°c
353 ms/cm at 32.1°c 0.52
10 Elthowra Elhara (59) Kararri 276 mg/l at
23.7°c
521 ms/cm at 32.5°c 0.52
11 Elshatabe Factor Kararri 348 mg/l at
22.9°c
658 ms/cm at 32.0°c 0.52
12 Ombada Elhara (15) 283 mg/l at
25.6°c
555 ms/cm at 24.7°c 0.50
13 Jebial Eltrena South 27 mg/l at
25.1°c
526 ms/cm at 25.5°c 0.51
14 Elsahab For Water Factory 1023 mg/l at
25.5°c
1928 ms/cm at
25.2°c
0.53
15 Faculty of Engineering
University of Omdurman
Alslamia
417 mg/l at
25.7°c
526ms/cm at 24.9°c 0.79

Assessment of Groundwater Quality in Omdurman City
82
Table No (4-3): Physical Examination of Water from Boreholes in Omdurman area
No Well/Name Odour Taste Conductivity
1 Jabarona Asqure (5) Acceptable Acceptable 695 ms/cm at 22.0°c
2 Dar Elslam Ombada Asqure (11-12) Acceptable Acceptable 729 ms/cm at 22.6°c
3 Alamereia Asqure (44) – Awed Elkarem Acceptable Acceptable 629 ms/cm at 22.1°c
4 Teba Eliahamda Acceptable Acceptable 506 ms/cm at 22.1°c
5 Elgeaha (2) Elslha Acceptable Acceptable 1815 ms/cm at 21.6°c
6 Elkede Awlad Haj Elteep Acceptable Acceptable 939 ms/cm at 21.6°c
7 Elnoba South Karrari Acceptable Acceptable 430 ms/cm at 22.3°c
8 Elsrorab – Elkawahla Kararri Acceptable Acceptable 559ms/cm at 23.1°c
9 Elthowera Elhara (53) Kararri Acceptable Acceptable 353 ms/cm at 32.1°c
10 Elthowra Elhara (59) Kararri Acceptable Acceptable 521 ms/cm at 32.5°c
11 Elshatabe Factor Kararri Acceptable Acceptable 658 ms/cm at 32.0°c
12 Ombada Elhara (15) Acceptable Acceptable 555 ms/cm at 24.7°c
13 Jebial Eltrena South Acceptable Acceptable 526 ms/cm at 25.5°c
14 Elsahab For Water Factory Acceptable Acceptable 1928 ms/cm at 25.2°c
15 Faculty of Engineering University of Omdurman Alslamia
Acceptable Acceptable 526ms/cm at 24.9°c

Assessment of Groundwater Quality in Omdurman City
83
Table No (4-4) Bacteriological examination of water from boreholes
Served directly by network in Omdurman locality
Samples From Boreholes Samples From water Towers Samples From Houses No Name of Boreholes No. of
Samples +ve % -ve % No. of Samples +ve % -ve %
No. of Sample
s +ve % -ve %
1 Elgeaha 1 1 100 - - 1 - - 1 100 16 1 6.25 15 93.7
5
2 Elsehab Factory For Water 1 - - 1 100 1 - - 1 100 1 - - 1 100
3 Jebail Eltena 1 - - 1 100 1 - - - - 6 2 33.3 4 66.7
4 Faculty of Engineering University
Omdurman Eleslamia 1 1 100 - - 1 1 100 - - 1 1 100 - -
5 Total 4 2 50 2 50 3 1 33.3 2 66.7 24 4 16.67 20 83.3

Assessment of Groundwater Quality in Omdurman City
84
Table No (4-5) bacteriological examination of water from boreholes
Not served directly by network in Omdurman locality
Samples From Boreholes Samples water From Towers Samples From vendors Samples From Houses
No Name of Boreholes No. of
sample +ve % -ve % No. of Samples +ve % -ve % No. of
Samples +ve % -ve % No. of Samples +ve % -ve %
1 Ekkedy Awad Haj Elteep 1 - - 1 100 1 1 100 - - 2 - - 2 100 13 - - 13 100
2 Total 1 - - 1 100 1 1 100 - - 2 - - 2 100 13 - - 13 100

Assessment of Groundwater Quality in Omdurman City
85
Table No (4-6) Bacteriological Examination of Water from Boreholes
Served Directly by Network in Karrari locality
Samples From Boreholes Samples water From Towers Samples From Houses No Name of Boreholes No. of
Samples +ve % -ve % No. of Samples +ve % -ve % No. of
Samples +ve % -ve %
1 Elnoba south 1 1 100 - - - - - - - 3 - - 3 100
2 Elsarorab 1 - - 1 100 - - - - - 4 - - 4 100
3 Elhara 53 - - - - - 1 - - 1 100 3 - - 3 100
4 Elhara 29 1 1 100 - - - - - - - 5 5 100 - -
5 Elshatay factor - - - - - 1 1 100 - - 2 2 100 - -
6 Total 3 2 66.7 1 33.3 2 1 50 1 50 17 7 41.18 10 58.826y

Assessment of Groundwater Quality in Omdurman City
86
Table No (4-7) Bacteriological Examination of Water from Boreholes
Not Served Directly by Network in Karrari locality
Samples From Boreholes Samples From water Towers Samples From vendors Samples From Houses
No Name of Boreholes No. of
sample +ve % -ve % No. of Samples +ve % -ve % No. of
Samples +ve % -ve % No. of Samples +ve % -ve %
1 Elahamada 1 1 100 - - - - - - - - - - - - 16 14 78.5 2 12.5
2 Total 1 1 10 - - - - - - - - - - - - 16 14 78.5 2 12.5

Assessment of Groundwater Quality in Omdurman City
87
Table No (4-8) Bacteriological Examination of Water from Boreholes
Served directly by network in Ombada locality
Samples From Boreholes Samples water From Towers Samples From Houses No Name of Boreholes No. of
Samples +ve % -ve % No. of Samples +ve % -ve % No. of
Samples +ve % -ve %
1 Dar Elsalam Acquire (12) 1 1 100 - - - - - - - 16 10 62.3 6 37.5
2 Ambada Elhara (15) 1 - - 1 100 - - - - - 3 2 66.7 1 33.3
3 Total 2 1 50 1 50 - - - - - 19 12 63.2 7 36.8
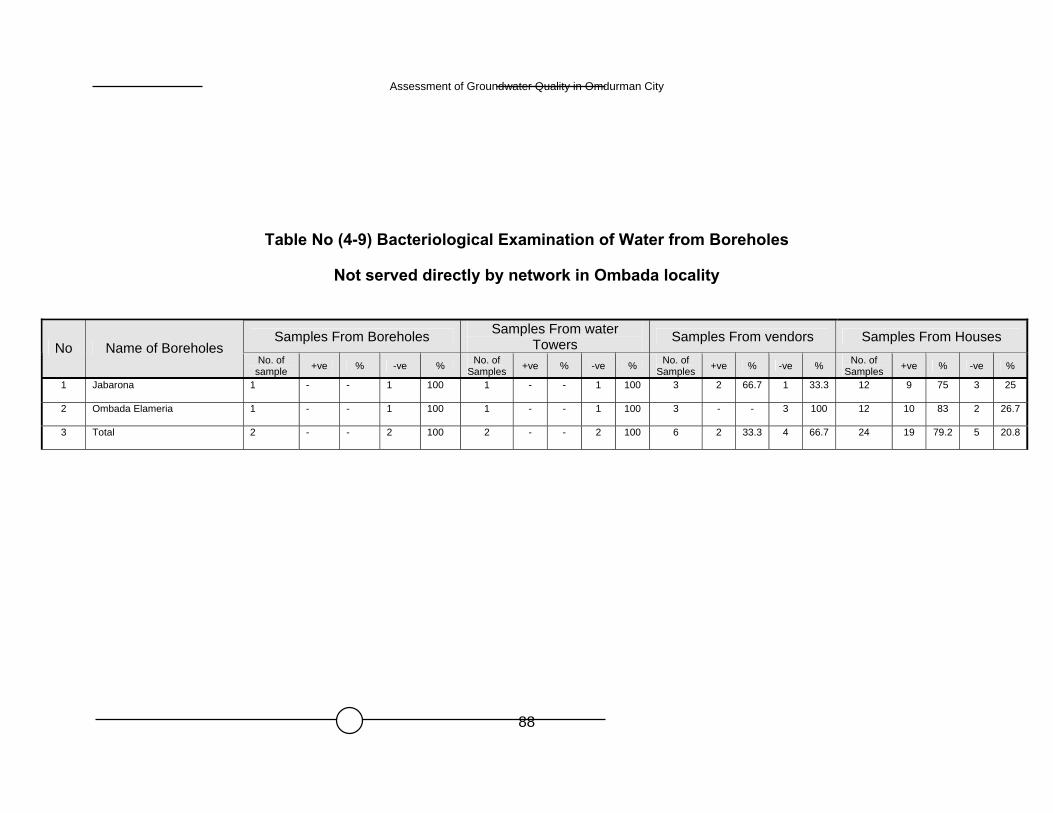
Assessment of Groundwater Quality in Omdurman City
88
Table No (4-9) Bacteriological Examination of Water from Boreholes
Not served directly by network in Ombada locality
Samples From Boreholes Samples From water Towers Samples From vendors Samples From Houses
No Name of Boreholes No. of
sample +ve % -ve % No. of Samples +ve % -ve % No. of
Samples +ve % -ve % No. of Samples +ve % -ve %
1 Jabarona 1 - - 1 100 1 - - 1 100 3 2 66.7 1 33.3 12 9 75 3 25
2 Ombada Elameria 1 - - 1 100 1 - - 1 100 3 - - 3 100 12 10 83 2 26.7
3 Total 2 - - 2 100 2 - - 2 100 6 2 33.3 4 66.7 24 19 79.2 5 20.8

Assessment of Groundwater Quality in Omdurman City
89
Table No (4-10) Bacteriological Examination of Water
From locations in the study area
Samples From Boreholes Samples From water
Towers Samples From vendors Samples From Houses No Name of Boreholes
No. of sample +ve % -ve % No. of
Samples +ve % -ve % No. of Samples +ve % -ve % No. of
Samples +ve % -ve %
1 Jabaroba 1 - - 1 100 1 - - 1 100 3 2 66.7 1 33.3 12 9 75 3 25
2 Ombada Elameria 1 - - 1 100 1 - - 1 100 3 - - 3 100 12 10 83 2 16.7
3 Elzedy Awad Haj Elteep 1 - - 1 100 1 1 100 - - 2 - - 2 100 13 - - 13 100
4 Elahamada 1 1 100 - - - - - - - - - - - - 16 14 78.5 2 12.5
5 Elgeaha 1 1 100 - - 1 - - 1 100 - - - - - 16 1 6.25 6 93.75
6 Dar Elsalam Block 12 1 1 100 - - - - - - - - - - - - 16 10 62.5 6 37.5
7 Ambada Elhara (15) 1 - - 1 100 - - - - - - - - - - 3 2 66.7 1 33.3
8 Wlswhab Factory For Water 1 - - 1 100 1 - - 1 100 - - - - - 1 - - 1 100
9 Jebail Atena 1 - - 1 100 - - - - - - - - - - 6 2 33.3 4 66.7
10 Faculty of Engineering
University Omdurman Eleslamia 1 1 100 - - 1 1 100 - - - - - - - 1 1 100 - -
11 Elnoba South 1 1 100 - - - - - - - - - - - - 3 - - 3 100
12 Elsaroran Alkawahla 1 - - 1 1001 - - - - - - - - - 4 - - 4 100
13 Elthwra Elhara (53) - - - - - 1 1 100 - - - - - - - 5 5 100 - -
14 Elthwra Elhara (29) 1 1 100 - - - - - - - - - - - - 2 2 100 - -
15 Elshatabi Factor - - - - - 1 1 100 - - - - - - - 2 2 100 - -
Total 13 6 46.2 7 53.8 9 3 33.3 6 66.7 8 2 2.5 6 75 113 56 49.6 57 50.44

Assessment of Groundwater Quality in Omdurman City
90
To a achieve the study objectives, data were collected for 15
boreholes in the study area, water sampling activities followed by
chemical, physical analysis and bacteriological testing. The water
source at study area was also visited.
Omdurman Town:
The geological formation of the area is dominated by the
presence of mudstone. In certain locations shallow sandy layers on
top are followed by mudstone in deeper layers. Outcrops of basaltic
rocks are identified within certain areas.
Groundwater is found in depth between 15 to 50m from
ground surface, most of wells in omdurman have hard water (high
and medium concentration of Ca CO3, Na2CO3).
In areas where septic tanks and disposal wells are used, occurrence
of organic pollution was identified. In many locations in this town,
there is the tendency by residents to dig deep wells more than 30m in
order to dispose off effluents of septic tanks. This is a direct
injection of pollutants into groundwater which is very risky to
ground water resources (IHP, national committee of Sudanese,
national commission for education, science and culture, (2000, Amal
et al)
Chemical assessment:
The chemical characteristic of groundwater resource in the
study area focused on the following parameters; PH, nitrite, nitrate,
fluoride, chloride and TDS, to assess the general situation of potable
water source and compare the result with guidelines and
recommended levels used in Sudan.

Assessment of Groundwater Quality in Omdurman City
91
International standards for drinking water includes specific
rules defining acceptable limits of significant physical and chemical
characteristics of water delivered to consumers, the chemical
parameters which were investigated in study area are illustrated as
the follows:-
Table No.(4-1) shows that the concentration of fluorides in all
boreholes in the study area ranged between(0.22 mg/l) in boreholes
of the Faculty of Engineering - Omdurman Islamic University to
(0.06) in Elkede boreholes, this range illustrates that fluoride is in
agreement with standards of (SSMO) that stated the maximum
permissible level as( 0.5 mg/l). Also with reference to the results in
Table No.(4-1), nitrites (No2) and nitrates (No3) values showed
large variations and fluctuations in the study area. This due to
transformation of those nitrogen compounds from one shape to
another. This is in contradiction with Lewis and Hutton (1980) who
explained that nitrite, ammonia in the natural water are presumabley
similar to the source and stated that the oxidation of nitrogen is
probably controlled by biochemical process, however the
concentration of nitrite in study area ranged between( < 0.03 mg/l) in
most of boreholes to( 0.09 mg/l). This is in agreement with the
(WHO, 1995) recommendations, which states nitrite levels in
surface and groundwater are generally in the range of few milligram
per liter. Where as the nitrate values ranged between (2.2 to 23.5)
mg/l. These are also less than the maximum permissible level set by
WHO, which is (50mg/l).Chlorides usually present in groundwater,
pollution of water by industrial activities might cause further
increases in chloride concentration (INWRDAM, 1997). The study

Assessment of Groundwater Quality in Omdurman City
92
illustrates in table No.(4-1) the concentration of chlorides in the
study area range between (5 to 23) mg/l in majority of Boreholes
except in Elsahab factory Borehole (7250mg/l). The concentration of
chloride is more than the maximum permissible level set by (SSMO)
which is 250mg/l this may be due to industrial pollution. PH is a
measure of acidity in groundwater and expressed as pH = - log [H+].
Where H+ is hydrogen ion concentration. The result presented in
table No.(4-1) reveals that pH values in all locations in the study
area is within range between (7.18 to 7.88). This range is in
agreement with (WHO) recommendation, that states an acceptable
PH of drinking water is between (6.5 to 8.5). Also the result
presented in table No.(4-1) reveals that TDS concentration of
majority of Boreholes in the study area were within (187 to 956)
mg/l. This is in agreement with (SSMO) which states the maximum
permissible of TDS as (1000mg/l). Where as the result shows that
the level of TDS in Elsahab factory Borehole (1023mg/l) is more
than the standard. (Park,2002)stated that the presence of high level
of TDS in drinking water may be objectionable to consumers owing
to excessive scaling in water pipe, heater and boilers. On the other
hand, with reference to result present in table No.(4-2), there is
significant relationship between TDS and conductivity in drinking
water source, (AbdelRhman ,1993) previously stated that there is a
close relationship between TDS and conductivity. It was also
observed that high TDS relate to high conductivity as in this study.

Assessment of Groundwater Quality in Omdurman City
93
Physical assessment:
Generally and with reference to result presented in table
No.(4-3) all water samples collected from Boreholes in the study
area were found to be acceptable in odour because, groundwater is
characterized by odorless and colorless, appearance due to effect of
filtration(William,1966). Also the result reveals that the taste was
acceptable.
Microbial indicators for bacteriological contamination:
The major indicator organisms are E.coli, Thermotolernt and
other Coliform bacteria. Some pathogenic bacteria such as typhoid
bacillus, dysentery bacilli and vibrio cholera, which may
contaminate water, are extremely difficult to isolate directly from
water. However, it is very fortunate that they are always
accompanied by large number of E.coli (WHO, 1995 and Smith,
1948). The bacteriological analysis of water is done primarily to
determine its portability and fitness for drinking. The sanitary
acceptability of water quality is presently judged by bacteriolcal
standard. The international standard for drinking water adopted by
(WHO) and (SSMO) stated that water intended for human
consumption must be free from organism hazardous to health. The
bacteriological results of samples collected from water source
(Boreholes) in the study area which include (Omdurman, Karrari,
Ombada localitie) illustrated as the following:
Omdurman locality:
The result presented in table No.(4-4) for water analysis from
Boreholes connected direct to network showed that (50%) of

Assessment of Groundwater Quality in Omdurman City
94
samples were polluted by thermotolerant coliform where as (50 %)
of sample were not polluted. The result also revealed that (33.3%) of
total samples from water towers were polluted by thermotolerant
where as (66.7%) were not polluted. However (16.67%) of total
samples from houses were polluted by E. coli and thermotolerany
and (83.3%) were not polluted. The result presented in table No.(4-
5) for water analysis from boreholes, not connected direct to network
shows that samples from boreholes, vendors, and houses were safe
(100%),where as the samples from water towers were polluted
(100%) by E. coli and thermotolerant.
Karrari locality:
Table No.(4-6) reveals that (66.7%) of samples from boreholes
connected direct to network were polluted by E. coli thermotolerant,
where as (33.3%) not polluted, also the result illustrates that (50%)
of samples from water towers were polluted by thermotolerant, also
(41.18%) of sample from houses were polluted by thermotolerant
and E. coli.
Table No.(4-7) for water analysis from boreholes not
connected direct to network reveals that the sample was polluted
(100%) by E. coli and thermotolerant, and (78.35%) samples from
houses polluted by E. coli and thermotolerant.
Ombada locality:
Table No.(4-8) for water analysis from boreholes connected
direct to network reveals that (50%) of samples from boreholes were
polluted by E. coli and thermotolerant, also (63.25%) of samples
from houses were polluted by E. coli and thermotolerant.

Assessment of Groundwater Quality in Omdurman City
95
Table No.(4-9) shows that the samples from boreholes not
connected directly to network and samples from water towers were
safe (100%), where as (33.3%) of samples from vendors were
polluted by E. coli and thermotolerant, also (79.2%) of samples from
houses were polluted by E. coli and thermotolerant.
Table No.(4-10) fig (1) illustrate that (46.2%) of samples from
total boreholes in the study area were polluted and this is
incontradiction with (WHO) recommendation. Nevertheless, it is
thought that the presence of thermotolerant coli form is probably
due to absence of inspection and poor water quality control methods
that are used in potable water resource. This is in agreement with the
(WHO,1981) which states that typically (70 - 80%) of small supplies
are contaminated in developing countries that failing to apply
standard of water quality control methods as far at the well structure
is concernd, (Campell and Lehr, 1973) described the following
means by which pollution may occur:
• Via an opening in the surface cap or seal or between the casing
and the base surface movement pump.
• As a result of reverse flow through the discharge systems.
• Through the distribution zone immediately surrounding the
casing.
• Via improper constructed and sealed gravel pack due to the in
ability of well structure, or seepage resulting from reduced
effectiveness of surface seal.

Assessment of Groundwater Quality in Omdurman City
96
• As a result of the grout or cementing material forming the
seals failing through cracking... etc.
In addition to the above mentioned, the building of latrines near
the wells (less than 30 meter) increases the risk of contamination,
this is in agreement with the study results observed, some site of
boreholes the in study area are within a distance less than 30 meter
from latrines, also for some boreholes in the study area there is a
water recharge, this may increase contamination. In the other sites
there is no direct tap from boreholes in certain locations. With the
reference to result presented in table No.(4-10), fig (2) (33.3%) of
samples from water towers were polluted, this is may be due to the
improper design of water towers and also it was observed that some
of the water towers in the study area are open, this lead to
contamination by dusts which hold number of contaminants. Where
as (66.7%) of samples were safe as the result of good storage the
pathogen well removed, this is in agreement with (Park, 2000) who
stated that a tremendous drop takes place in bacterial count during
storage. The pathogenic organisms gradually die out. It is found that
in river water storage the total bacterial count drops by as such as 90
percent in first (5 – 7) days. The study also illustrates that the
percentage of polluted water from venders and houses (25%, 40.6%)
that presented in table No.(4-10) may occur due to improper
designed venders carts or the behaviors of persons who work in
water may contaminate water through distribution system by many
reason such as damage in pipes, or in pack syphonage … etc.

Assessment of Groundwater Quality in Omdurman City
97
This is in agreement with (WHO, 1995) which states that,
distribution systems are especially vulnerable to contamination when
the pressure falls, particularly in the intermittent supplies of many
cities in developing countries, underground storage tanks and service
must be inspected for deterioration and for infiltration of surface and
ground water. It is desirable for the land enclosing underground
storage tank to be fenced off to prevent damage the structure. Repir
Works to mains offer another possibility for contamination. Local
loss of pressure may result in back syphonage leading to
contamination of water.
In other side with reference to result presented in fig (3) are notes
that the percentage of contaminated samples from houses not
connected direct to network were high (62.35%) to comparison with
other that connected direct to network. This result explains that
proper distribution system play an important role in elimination of
water contamination.

Assessment of Groundwater Quality in Omdurman City
98
Figure (3) The Pollution of Boreholes in the study area.
46.2%
53.8%
42%
44%
46%
48%
50%
52%
54%
poistive Negative
poistive Negative
Positive
Positive

Assessment of Groundwater Quality in Omdurman City
99
Figure (4) Comparison of Pollution level between houses connected direct, and those not connected direct to net work
38.3%
61.7% 62.3%
37.7%
0%
10%
20%
30%
40%
50%
60%
70%
net work not net work
poistive negative Positive

Assessment of Groundwater Quality in Omdurman City
100
Figure (5) The water Pollution in water towers in the study area
33.3%
66.7%
poistive Negative Positive

Assessment of Groundwater Quality in Omdurman City
101
CHAPTER 5
Conclusion and Recommendations

Assessment of Groundwater Quality in Omdurman City
102
5-1 Conclusions
• Investigation of groundwater quality is very important to health
improvement. It eliminates the hazards produced due to water
pollution and it protects water source.
• Urbanization introduces many changes to aquifers that lies under
cities. Natural recharge mechanisms are modified or replaced,
and new ones are introduced.
• Many sub-city aquifers are polluted with human wastes, septic
tank, pit latrine are operated inefficiently and discharge
directly into inland.
• An important out come of this study showed that, the majority of
chemical and physical groundwater quality of Boreholes in
Omdurman city is within the acceptable limits for drinking
water as proposed by (WHO) and (SSMO) standards.
• Chlorides and total dissolved solids recorded concentrations over
allowable standards (7250mg/l, 1023mg/l) in Sahap factory
Boreholes.
• Degradation of bacteriological quality of water in Omdurman
city.
• High percentage of polluted Boreholes by E.coli and
Thermotolerant Cliform.
• The most significant risk to human health related to drinking
water quality is from microbiological, particularly feacal
contamination.

Assessment of Groundwater Quality in Omdurman City
103
• Water from houses not connected direct to net work is polluted
by Cliform bacteria.
• Observed locations of latrine in many locations in Omdurman
city not far from Boreholes.
• There is no treatment system (disinfection) for groundwater in
Omdurman city.

Assessment of Groundwater Quality in Omdurman City
104
5-2 Recommendation
It is recommended that:-
• Well construction should be carried out adequately and
according to proper design specifications.
• Soil should be good, and Boreholes should be sited away
from pollution sources.
• Site should be at higher level to prevent draining of surface
water into Boreholes.
• Septic tank, and latrines should be of a proper design to
eliminate infiltration to Boreholes through soil layers.
• Select proper designs for distribution system and avoid the
damage in pipes.
• Health protection demands, that sources of microbiological
contamination are located sufficiently far from drinking
water source so as minimize or eliminate the health risk.
• The Boreholes should be disinfected to insure that water is
free from biological contamination.
• Health education and awareness to consumers for how to
protect and conserve water within houses from
contamination and encourage good behavior for water
utilization.
• Establish good monitoring system to early detection of any
change of water quality.
Assessment of Groundwater Quality in Omdurman City
105
• Encourage the research for groundwater quality in order to
protect, monitor and control the pollution.
• Application of legislatives acts and regulations for well
drilling and proper disposal of effluent.
• Establish groundwater conservation programmes.

Assessment of Groundwater Quality in Omdurman City
106
CHAPTER 6
References

Assessment of Groundwater Quality in Omdurman City
107
Reference
• Amal Elfadil, Al Mutaz Abdalla, Nazik Eleasheed, Mouada El
Gaeel(2000).Vulnerability of Groundwater Recourses of
Sudan to Pollution Risks, Khartoum.
• AbdElRahman. M.A (1993). Sanitary Measure for Protection
of Groundwater Quality in Elobied and Eldilling Area. MSc.
Thesis U of K.
• Basak .N N (2004). Environmental Engineering Tata Mc
Graw. Hill Company Limited. New Delhi.
• Campell and other (1973). Cited in Abd-ElRahman. M. A
(1993). Sanitary Measure for Protection of Groundwater
Quality in Elobied and Eldilling Area. MSc. Thesis U of K.
• David Jeith Todd (1995). Groundwater Hydrology Second
Edition, Johnwiley and Sons. New York.
• Deborah Chapman (1992). Water quality assessment,
Chapman and Hall Ltd, 2-6E18HN, Boundary Row, London,
Cambridge.
• Ernest W. Steel (1960) Water Supply and Sewerage. Mc
Graw. Hill book company, New York.
• Everpure, (2000). Water Quality Issues. INC, New York
London.
• Flasher G. Dris Coll, (1986). Groundwater and Wells Second
Edition, Johoson Division, St. Paul, Minnesota 55112, United
States of America.

Assessment of Groundwater Quality in Omdurman City
108
• Gordon Maskew Fair, John Charles Geyer, Daniel Alexander,
(1966). Water and Wastewater Engineering Volume1. John
Wiley, INC. New York, London Sydney.
• Howard S. Peavy Donald, R. Rowe, George Tchobanoglous
(1986). Environmental Engineering. Mc Graw. Hill book co,
Singapore for Manufacture and Export.
• INWRDAM (1997). Water Resources Management. Islamic
Educational, Scientific and Cultural Organization (ISECO).
Morocco.
• Izzeldin Ahmed Yousif (2000). Vulnerability of Groundwater
Resources of Sudan to Pollution Risk, Khartoum.
• Jousma.G. J. bear, Y. Y Haimes and F. Walter (1989).
Groundwater contamination: Use of Models in Decision
Making (PS) Klumer Academic. London.
• Karari Province Health Services Management, Reports,(1999).
• Lewis,W.J. and Hutton, L.G (1980) Nitrate Pollution of
Groundwater in Botswana.Proc.6th WEDC, Conf. Zaria,
Nigeria.
• Lai. D (2006).Water Supply and Waste Water Engineering
Sanjeev Kataria for, S.K, Kataria and Sons, Dellhi.
• Metacalf and Eddy (1991). Wastewater Engineering
(Treatment, disposal, reuse).Tata Mc Graw. Hill- New Delhi.
• Mackie and Macarthy (1997).Examination of Water
Practical Medical Microbiology, 14th ed. Churchill Living
Stone .381-83. (1997). New York.
• Overman. M (1976). Water Solution to a Problem of Supply
Demand, Revised. The Open University Press London.

Assessment of Groundwater Quality in Omdurman City
109
• Park. K (2000) Preventive and Social Medicine, Prem Nagar,
Jabalpur India.
• Park. K (2002) Preventive and Social Medicine, Prem Nagar,
Jabalpur India.
• Ray. K Linsley. Joseph B Franzini (1979). Water Resources
Engineering Third Edition. McGraw. Hill Book Company
London.
• Richard Feachem, Michael Mc Garry, Duncan Mara
(1982).Water, Waste and Health in Hot Climates- Awiley –
interscience. New Delhi.
• Raghunath H. M (1987). Groundwater 2nd Edition, K.K Gupta
for New Age international (P) Ltd, 4835/24, Ansari Road,
Daryaganj, New Delhi.
• Santosh Kumar Gary (2005). Water Supply Engineering.
Romesh Chender Khanna. Delhi.
• SNCESO (2000) Vulnerability of Groundwater Recourses of
Sudan to Pollution Risks, Khartoum.
• Stockman. D (1994) Guide Lines for Developing Countries
International Technology publications Ltd. UK.
• Smith. N. R (1948) cited in Nurain. A.B.O (1998). Domestic
Water, Behavioal and Health, Aspects, case study-Gezeria
Schme. MSc. Thesis, U.ofK.
• Tage Elsir, Abdalla, Bashir Mohamed Al Hassan, Mohamed
Ahmed Khadam, Hamid Omer Ali (2000) Vulnerability of
Groundwater Recourses of Sudan to Pollution Risks,
Khartoum.

Assessment of Groundwater Quality in Omdurman City
110
• Tomdeveer J.L, Brikked. F. Bredero. M and Josment. N.
Water Supply and Sanitation Report Geneva.
• UNESCO (1997) Down To Last Drop. Geneva.
• UNEP and WHO (1988) Assessment of Fresh Water Quality,
A report on the results of the UNEP /WHO Program on health
related environmental Monitoring,P.15-29., Nairobi, Kenya.
• UNEP (1997) Transboundary Waters (The of Integrated
Management) Geneva.
• UNHCR (1992) Water Manual for Refugee Situations.
Programme and Technical Support Section. Geneva.
• Vidya Ratan (1983) Hand Book of Preventive and Social
Medicine, Jaypce Protshers Medical, India.
• WHO (1993) Guide Lines for Drinking Water Quality,
Geneva.
• WHO (1971) International Standard for Drinking Water 3rd.ed,
Geneva.
• WASH (1982) Water and Sanitation for Health Project No 37,
Washington.
• WHO (1997) Guide Lines for Drinking Water Quality
Volume3, surveillance and Control of Community Supplies,
Geneva.
• WMO (1997) The World Day for Water, 22 March Geneva.
• WHO (1992) Annual Report, Geneva.
• WHO (1995). Guide Lines for Drinking Water Quality 2th,
Vol.1, Recommendations, Geneva.
• WHO (1981). Drinking Water and Sanitation (1981-1990)
Away to Health.1211, Geneva, 27- Switerland.

Assessment of Groundwater Quality in Omdurman City
111
• William, B. (1966) Textbook of Microbiology18thed, W.B
Saunders CO, USA. Web Site:-
• htt://www. Khartoum State. Com
• htt://en.Wikipedia.org/wiki/ Groundwater.
Copyright © 2022 FDOKUMEN