
Assessment of EnKF Data Assimilation of Satellite Derived ...
24
Assessment of EnKF Data Assimilation of Satellite Derived Soil Moisture Over the Indian Domain with the Noah Land Surface Model Vibin Jose Indian Institute of Space Science and Technology Anantharaman Chandrasekar ( [email protected] ) Indian Institute of Space Science and Technology Research Article Keywords: Data assimilation , Ensemble Kalman Filter (EnKF) , Noah, Advanced Scatterometer (ASCAT) , Land Information System (LIS) Posted Date: July 23rd, 2021 DOI: https://doi.org/10.21203/rs.3.rs-664035/v1 License: This work is licensed under a Creative Commons Attribution 4.0 International License. Read Full License
-
Upload
khangminh22 -
Category
Documents
-
view
0 -
download
0
Transcript of Assessment of EnKF Data Assimilation of Satellite Derived ...

Assessment of EnKF Data Assimilation of SatelliteDerived Soil Moisture Over the Indian Domain withthe Noah Land Surface ModelVibin Jose
Indian Institute of Space Science and TechnologyAnantharaman Chandrasekar ( [email protected] )
Indian Institute of Space Science and Technology
Research Article
Keywords: Data assimilation , Ensemble Kalman Filter (EnKF) , Noah, Advanced Scatterometer (ASCAT) ,Land Information System (LIS)
Posted Date: July 23rd, 2021
DOI: https://doi.org/10.21203/rs.3.rs-664035/v1
License: This work is licensed under a Creative Commons Attribution 4.0 International License. Read Full License

Theoretical and Applied Climatology manuscript No.
(will be inserted by the editor)
Assessment of EnKF data assimilation of satellite derived soil
moisture over the Indian domain with the Noah Land Surface
Model
Vibin Jose1 · Anantharaman Chandrasekar1∗
Received: date / Accepted: date
Abstract Land Surface Models (LSMs) are typically forced with observed precipitation and
surface meteorology and hence the soil moisture estimates obtained from LSM do not reflect
the contribution of irrigation to the soil moisture estimates. However, the satellite retrievals
of soil moisture estimates do register the signature of the irrigation effects. It is suggested
that the soil moisture estimates obtained from LSM may reflect the role of irrigation if they
are assimilated with soil moisture estimated from satellites.
The present study evaluates the improvement of soil moisture estimates obtained from
Noah LSM by ingesting them with the satellite derived Advanced Scatterometer (ASCAT)
soil moisture retrievals over the Indian domain for the year 2012. The above ingesting of
soil moisture estimates is performed using the Land Information System (LIS). The im-
proved soil moisture estimates are validated with the in-situ India Meteorological Depart-
ment (IMD) soil moisture observations and also with the high-resolution Indian Monsoon
Data Assimilation and Analysis (IMDAA) regional reanalysis data. The percentage of grid
points over the Indian domain where the improvement parameter shows positive values are
59.14% (winter), 69.17% (pre-monsoon), 43.59% (monsoon), and 77.53% (post-monsoon).
Furthermore, the forecast impact parameter also indicates the positive impact of data assim-
ilation. Also, 12 of the 22 stations show reduced RMSE soil moisture error after data assimi-
lation is performed while only 6 of the 22 stations show higher correlation coefficient in soil
moisture without data assimilation, when validated with the in-situ IMD soil moisture ob-
servations. The study has also evaluated the irrigation impact of ASCAT in the assimilated
soil moisture using triple collocation (TC) method. For the TC analysis, the model based
Global Land Data Assimilation System (GLDAS)Catchment Land Surface Model (CLSM),
and MERRA (Modern-Era Retrospective analysis for Research and Applications) Land data
set together with soil moisture model outputs with and without ASCAT assimilation are used
to calculate the error and correlation coefficient of each of the two set of triplets. The results
of the TC analysis further conclusively shows the positive impact of irrigation effects in the
ASCAT assimilated soil moisture model output.
∗Corresponding Author:Anantharaman Chandrasekar
E-mail: [email protected] Department of Earth and Space Sciences, Indian Institute of Space Science and Technology, Valiamala P.O.,
Thiruvananthapuram - 695 547 Kerala, India

2 Vibin Jose1, Anantharaman Chandrasekar1∗
Keywords Data assimilation · Ensemble Kalman Filter (EnKF) · Noah, Advanced
Scatterometer (ASCAT) · Land Information System (LIS)
1 Introduction
Soil moisture plays a vital role in the exchange of moisture and energy fluxes at the land-
atmosphere boundary. Hence, the accurate estimation of surface soil moisture is of utmost
importance for various application studies such as the weather forecast, flood or drought
prediction, soil erosion, and climate change (Walker and Houser, 2001).
Ground-based soil moisture observations are point observations and are limited in spa-
tial and temporal extent and are expensive to maintain (Dorigo et al., 2011; Robinson et al.,
2008). Land Surface Models (LSM) can provide for continuous and spatially distributed soil
moisture estimates over a time period by integrating the LSM with appropriate atmospheric
forcings. Regional and continental soil moisture estimates are entirely based on the output
from LSM (Srinivasan et al., 2000). LSMs are usually forced with observed precipitation
and surface meteorology and hence the soil moisture estimates obtained from LSM do not
reflect the contribution of irrigation to the soil moisture estimates. However, the satellite
retrievals of soil moisture estimates are effective in capturing the irrigation effects (Kumar
et al., 2015; Nair and Indu, 2019). It is suggested that the soil moisture estimates obtained
from LSM may reflect the role of irrigation if they are assimilated with soil moisture es-
timated from satellites (Kumar et al., 2015). Furthermore, the above assimilation would
contribute to reduced uncertainties in the LSM soil moisture estimates to ultimately yield
a much improved soil moisture estimate. Although such studies that ingest soil moisture
obtained from LSM with satellite retrievals exist in the literature (Kumar et al., 2015; Nair
and Indu, 2019), there are very few instances where such studies have been carried out over
India.
Ensemble Kalman Filter (EnKF) technique is widely employed in data assimilation for
the following reasons (i) the suitability of its sequential structure for processing the satellite
retrievals in real time, (ii) its easy implementability even with nonlinear model equations,
and (iii), its ability to consider a number of model errors (Reichle et al., 2002). Blankenship
et al. (2016) assimilated the Soil Moisture and Ocean Salinity (SMOS) satellite retrieval
into the Noah Land surface states via EnKF and showed that the anomaly correlation of soil
moisture at 10 cm depth has increased from 0.45 to 0.57 with respect to in-situ measure-
ments over the central and southeastern United States. Nair and Indu (2016) studied the im-
provement of Noah LSM soil moisture by assimilating Soil Moisture Operational Products
System (SMOPS) satellite soil moisture over the Indian domain and showed an improve-
ment in the results with the values of average correlation of 0.96 and average root mean
square difference of 0.03 m3m-3. Drusch (2007) studied the impact of data assimilation on
the European Centre for Medium-Range Weather Forecasts (ECMWF) integrated forecast
system using Tropical Rainfall Measuring Mission (TRMM) Microwave Imager (TMI) soil
moisture data set.
The main objective of this study is to examine, whether the LSM soil moisture esti-
mates after assimilation, do reflect the contribution of irrigation considering that India is
a reasonably well irrigated country. Towards realizing the above objective, an attempt is
made to improve the LSM soil moisture estimates by assimilating Advanced Scatterome-
ter (ASCAT) satellite soil moisture retrievals into the Noah LSM using an EnKF technique.
Furthermore, a detailed validation of the improved near surface soil moisture estimate is per-
formed by comparing the assimilated land surface state with in-situ ground based weekly
Data assimilation using EnKF over the Indian domain 3
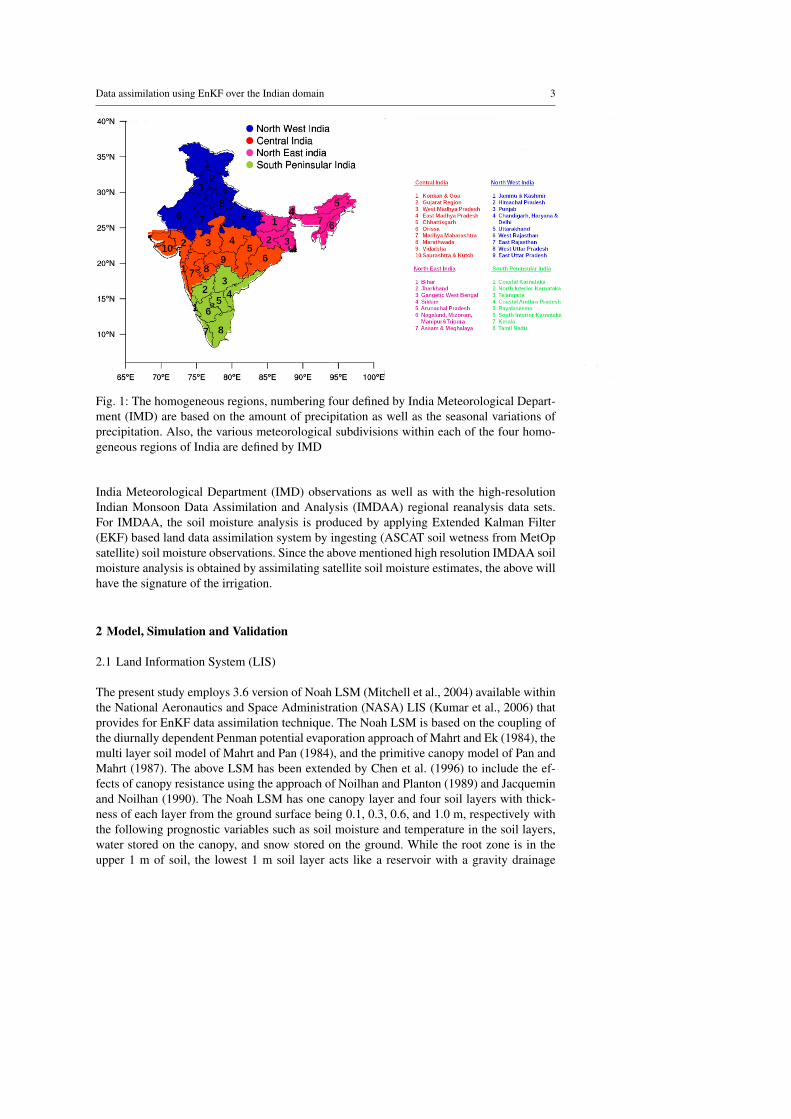
Fig. 1: The homogeneous regions, numbering four defined by India Meteorological Depart-
ment (IMD) are based on the amount of precipitation as well as the seasonal variations of
precipitation. Also, the various meteorological subdivisions within each of the four homo-
geneous regions of India are defined by IMD
India Meteorological Department (IMD) observations as well as with the high-resolution
Indian Monsoon Data Assimilation and Analysis (IMDAA) regional reanalysis data sets.
For IMDAA, the soil moisture analysis is produced by applying Extended Kalman Filter
(EKF) based land data assimilation system by ingesting (ASCAT soil wetness from MetOp
satellite) soil moisture observations. Since the above mentioned high resolution IMDAA soil
moisture analysis is obtained by assimilating satellite soil moisture estimates, the above will
have the signature of the irrigation.
2 Model, Simulation and Validation
2.1 Land Information System (LIS)
The present study employs 3.6 version of Noah LSM (Mitchell et al., 2004) available within
the National Aeronautics and Space Administration (NASA) LIS (Kumar et al., 2006) that
provides for EnKF data assimilation technique. The Noah LSM is based on the coupling of
the diurnally dependent Penman potential evaporation approach of Mahrt and Ek (1984), the
multi layer soil model of Mahrt and Pan (1984), and the primitive canopy model of Pan and
Mahrt (1987). The above LSM has been extended by Chen et al. (1996) to include the ef-
fects of canopy resistance using the approach of Noilhan and Planton (1989) and Jacquemin
and Noilhan (1990). The Noah LSM has one canopy layer and four soil layers with thick-
ness of each layer from the ground surface being 0.1, 0.3, 0.6, and 1.0 m, respectively with
the following prognostic variables such as soil moisture and temperature in the soil layers,
water stored on the canopy, and snow stored on the ground. While the root zone is in the
upper 1 m of soil, the lowest 1 m soil layer acts like a reservoir with a gravity drainage

4 Vibin Jose1, Anantharaman Chandrasekar1∗
at the bottom. The surface skin temperature is determined following Mahrt and Ek (1984)
by applying a single linearized surface energy balance equation representing the combined
ground-vegetation surface with the ground heat flux determined by the diffusion equation
for soil temperature. The prognostic equation for the volumetric soil moisture content is
determined by the Richard diffusion equation which is derived from Darcy’s law under the
assumption of a rigid, isotropic, homogeneous, and one-dimensional vertical flow domain.
The Noah LSM has a simple snow and sea-ice model; the snow model has a single layer of
snow cover and simulates the snow accumulation, sublimation, melting, and heat exchange
at snow-atmosphere and snow-soil interfaces. The precipitation is categorized as snow when
the temperature in the lowest atmospheric layer is below 0◦C. The Noah LSM employs the
vegetation type and soil texture as the two primary variables upon which other secondary
parameters such as minimal canopy resistance and other soil hydraulic properties are deter-
mined. More details are available from Chen and Dudhia (2001).
The Noah LSM is forced with meteorological forcings and land surface parameters. For
the present study, the land cover data is obtained from the Moderate Resolution Imaging
Spectroradiometer-International Geosphere-Biosphere Programme (MODIS-IGBP), with a
horizontal resolution of 1 km. State Soil Geographic-Food and Agriculture Organization
(STATSGO-FAO) blended soil texture map data provides the soil texture data set for this
study. Shuttle Radar Topography Mission (SRTM) data is used for elevation. The monthly
albedo, maximum snow albedo, Greenness fraction and Slope type data sets are obtained
from corresponding NCEP data sets with a spatial resolution of 0.01◦× 0.01◦. Bottom
temperature information is taken from the International Satellite Land Surface Climatol-
ogy Project 1 (ISLSCP1) bottom temperature data sets. The meteorological forcing data is
taken from Global Data Assimilation System (GDAS) except for the rainfall rate which is
from IMD gridded rainfall data with a spatial resolution of 0.25◦× 0.25◦.
Soil moisture is an important variable, that needs to be initialized accurately. For the
present study, the Noah LSM was spun-up by cycling five times (five loops) through the
period from 01 January 2011 00 UTC to 01 January 2012 00 UTC using all the meteoro-
logical forcing data from GDAS and rainfall data from IMD. The deepest soil layer (0.60
m to 1 m) soil moisture content in the Noah LSM is utilized for assessing the establishment
of the equilibrium condition by checking and ensuring that the differences between the soil
moisture content at the deepest layer for the present and the previous loop is less than 5%
(Case et al., 2007; Rodell et al., 2005).
The study area is over the Indian land domain spanning a latitude ranging from 6.375◦N
to 38.375◦N and a longitude encompassing from 66.375◦E to 99.875◦E with a horizontal
resolution of 0.125◦×0.125◦. In this study, the Indian landmass domain is divided into four
homogeneous regions namely, Northwest India, Northeast India, Central India, and South
Peninsular India according to the distribution of monsoon rainfall over the Indian domain.
The four homogeneous regions and their meteorological subdivisions are shown in Figure
1.
2.2 ASCAT and LIS simulation
ASCAT is a real aperture radar system carried on-board the Meteorological Operational
(Metop) polar satellites launched by the European Space Agency (ESA) which provides
day-night measurements unaffected by cloud cover. The surface soil moisture estimated
from ASCAT for the topmost soil layer (< 5 cm) is given in degree of saturation, ranging

Data assimilation using EnKF over the Indian domain 5
Table 1: Summary of Perturbations
Variable Perturbation Standard Cross
type deviation Correlation
SW LW P NST
Short Wave (SW) Multiplicative 0.2 (Wm-2) 1 -0.3 -0.5 0.3
Forcing Long Wave (LW) Additive 0.3 (Wm-2) -0.3 1 0.5 0.6
Precipitation (P) Multiplicative 0.5 (mm) -0.5 0.5 1 -0.1
Near Surface Additive 0.5 (K) 0.3 0.6 -0.1 1
Temperature (NST)
Soil Moisture L1 L2 L3 L4
Layer 1 (L1) Additive 6.00×10⁻³m3m-3 1 0.6 0.4 0.2
State Layer 2 (L2) Additive 1.10×10⁻⁴m3m-3 0.6 1 0.6 0.4
variable Layer 3 (L3) Additive 6.00×10⁻⁵m3m-3 0.4 0.6 1 0.6
Layer 4 (L4) Additive 4.00×10⁻⁵m3m-3 0.2 0.4 0.6 1
Observation ASCAT Additive 0.04 m3m-3
from 0% (dry) to 100% (wet) and are available with a resolution of 0.25◦×0.25◦on daily
intervals. In this study, ASCAT data is obtained from SMOPS(Liu et al., 2012).
Two simulations are performed to evaluate the positive impact of assimilation of daily
ASCAT soil moisture retrievals with the Noah LSM land surface states; (i) control run (CN-
TRL run) with no assimilation and (ii) assimilation run using EnKF (EXP run). The Noah
LSM is integrated from 01 January 2012 00 UTC to 31 December 2012 00 UTC. The ENKF
data assimilation algorithm has a sequential approach having the two following steps, (i) a
forecast step, and (ii) an update step. EnKF method utilized thirty ensemble members, ob-
tained from perturbations on meteorological forcing, model estimated states, and observa-
tions. The details of perturbations that represent the uncertainty in the land surface condi-
tions are given in Table 1 and are based on study by (Yin et al., 2015). The 30 ensembles
are generated by applying random Gaussian error with zero mean. Values of cross correla-
tion in perturbation of near soil temperature (NST), Precipitation, and radiation fields (Short
Wave(SW) and Long Wave(LW)) are shown in Table 1. The ASCAT soil moisture obser-
vations are perturbed with random Gaussian noise with a standard deviation of 0.04 m3m-3
(Nair and Indu, 2019).
Data assimilation theory requires both unbiased observation and unbiased model states.
However, there are large differences between the temporal moments of the model and the
satellite retrievals. Hence, the present study accounted for the bias correction using the cu-
mulative distribution function (CDF) matching technique (Reichle and Koster, 2004).
2.3 IMDAA regional reanalysis data and IMD in-situ data
High resolution soil moisture data both at near surface as well as at three depths (0-0.1 m,
0.1-0.35 m, 0.35-1 m, and 1-3 m) are available from the Indian Monsoon Data Assimila-
tion and Analysis (IMDAA) re-analysis (Ashrit et al., 2020). The IMDAA soil moisture
reanalysis data is available at every hour and with a horizontal resolution of 12 km over
the domain spanning latitude from -15◦S to 45◦N and longitude from 30◦E to 120◦E. The
IMDAA system with 63 vertical levels is based on the Met Office four-dimensional vari-
ational data assimilation (4DVAR) and its Unified Model, and uses a 6 hour intermittent
data assimilation cycle. Lateral boundary conditions for the reanalysis run are taken from
the global reanalysis (ECMWF Re-Analysis) ERA-Interim. The following observations are

6 Vibin Jose1, Anantharaman Chandrasekar1∗
Fig. 2: IMD in-situ Station locations as numbered in Table 2.
assimilated in the 4DVAR system, (i) Surface observations, (ii) Upper air, (iii) Aircraft, (iv)
Atmospheric motion vector from Geostationary Meteorological Satellite-4, and (v) TOVS
(Microwave Sounding Unit (MSU) and High-resolution Infrar Red Sounder (HIRS)) satel-
lite radiances.
IMD in-situ soil moisture data from 22 stations are utilized in this study to validate the
improved soil moisture estimates obtained from the EnKF data assimilation for the year
2012. The in-situ data are available every week at different depths (0 m, 0.075 m, 0.15 m,
0.30 m, 0.45 m, and 0.60 m). The IMD in-situ station locations are shown in Figure 2.
2.4 Validation
The quantitative evaluation of the assimilated soil moisture with respect to IMDAA data is
calculated using an improvement parameter and a forecast impact parameter. Improvement
parameter is defined as
η =| SMobs −SMCNTRL | − | SMobs −SMEXP | (1)
where SMobs, SMCNTRL, and SMEXP refer to surface soil moisture that is obtained from
IMDAA, and from CNTRL and EXP runs. The positive value of improvement parameter

Data assimilation using EnKF over the Indian domain 7
‘η’ is a measure of the positive improvement of the soil moisture estimate due to EnKF data
assimilation.
The forecast impact (FI) parameter is defined as
FI =
(
1−RMSE(E)
RMSE(C)
)
×100 (2)
where RMSE (E) and RMSE (C)are the Root Mean Square Error (RMSE) of the EXP and
CNTRL runs soil moisture data (at 5 cm depth) with respect to the IMDAA data. The posi-
tive value of the FI parameter indicates the positive impact of soil moisture data assimilation.
A two-sample Kolmogorov-Smirnov distance (KS-D) (Chakravarty et al., 1967) statis-
tical test is used in this study to quantitatively compare the probability distribution between
the CNTRL and EXP run. It is based on a null hypothesis that the two sample distributions
(CNTRL and EXP) are taken from the same source distribution. The KS-D value gives the
empirical difference between the two sample distributions.
2.5 Evaluation using Triple Collocation (TC) method
The present study employed the TC method to evaluate the irrigation impact of ASCAT in
the assimilated soil moisture. The basic idea of this approach is to obtain the unknown error
standard deviations of three independent (it is assumed that the errors are uncorrelated) mea-
surements, without the knowledge of the truth [Stoffelen (1998)]. Initially, the TC method
was widely employed in oceanographic studies to evaluate the errors in sea surface temper-
ature measurements (Gentemann, 2014; O’Carroll et al., 2007). Subsequently, it has been
applied in soil moisture studies (Nair and Indu, 2019). In order to ensure that the errors of
the three measurements remain uncorrelated, the present study has utilized soil moisture
obtained from Global Land Data Assimilation System (GLDAS)Catchment Land Surface
Model (CLSM), and MERRA (Modern-Era Retrospective analysis for Research and Ap-
plications) Land data set along with the CNTRL run for the TC analysis. Furthermore, TC
analysis is also performed on the soil moisture obtained from GLDAS CLSM and MERRA
data along with the EXP run. The above mentioned approach will be able to evaluate the
irrigation impact of ASCAT in the assimilated soil moisture with the same reference since
the first two data sets (GLDAS CLSM and MERRA) remain the same in each of three inde-
pendent data sets.
3 Results and discussion
Figure 3 shows the spatial distribution of improvement parameter for different seasons dur-
ing the year 2012 at 5 cm depth. The percentage of grid points over land where the im-
provement parameter is positive with respect to the total number of grid points is named
‘α’ and the values of ‘α’ for the winter (January-February), pre-monsoon (March-May),
southwest monsoon (June-September), and post-monsoon (October-November) seasons are
59.14%, 69.17%, 43.59%, and 77.53% respectively. For the south-west monsoon season,
the percentage of improvement parameter is slightly less than 50%. It is well known that
Noah LSM’s soil moisture estimate is completely devoid of any effects of irrigation while
the satellite derived soil moisture does register the signature of the irrigation effects. Also
the IMDAA soil moisture has the signature effects of irrigation. It is well known that India
as a whole receives as much as 80% of its annual rainfall during its south-west monsoon

8 Vibin Jose1, Anantharaman Chandrasekar1∗
Fig. 3: The spatial distribution of improvement parameter for the year 2012, where a, b, c, d
represents winter, pre-monsoon, monsoon, and post-monsoon respectively.
season lasting four months. The monsoon season being the rainy season, the requirement of
irrigation of the same magnitude and extent becomes less for India during the monsoon sea-
son as compared to the other three seasons. Keeping the above in mind, the results of Figure
3c that reveal the lack of extensive regions of improvement in the soil moisture estimates due
to ingestion of satellite derived soil moisture (the latter incorporating the irrigation effects)
during the monsoon season are not surprising.
Figure 4 shows the spatial distribution of the forecast impact parameter for the year 2012
at 5 cm depth. The percentage of grid points over land where the forecast impact parameter
is positive with respect to the total number grid points is named ‘β ’ and the values of ‘β ’ for
winter, pre-monsoon, southwest monsoon, and post-monsoon seasons are 58.43%, 69.26%,
45.85%, and 75.66% respectively. The southwest monsoon season has a lower percentage
of grid points having requirement of irrigation during the southwest monsoon season.
The resulting values for the K-S distance(D) for different seasons are shown in Figure
5. When the K-S-D value is close to zero, the above indicates that the CNTRL and EXP
run soil moisture distributions are similar. Contrarily, larger values of K-S-D suggests that
the differences between the probability distribution of CNTRL and EXP integrations are
marked. The presence of regions having large values of K-S-D may be attributed to the
impact of irrigation over the above regions.
Figures 6a-6d depict the difference in near surface soil moisture between ASCAT and
CNTRL run for different seasons (winter, pre-monsoon, monsoon, and post-monsoon) of
2012. India, as a whole had near normal annual rainfall (-11% departure with respect to nor-
mal), with the monsoon season receiving 78% of annual rainfall with a -7% departure of its

Data assimilation using EnKF over the Indian domain 9
Fig. 4: The spatial distribution of forecast impact parameter for the year 2012, where a, b, c,
d represents winter, pre-monsoon, monsoon, and post-monsoon respectively.
monsoon rainfall. Figure 6a shows that the differences in the soil moisture are quite small
during the winter season. The winter season has the least amount of rainfall (3.7% of annual
rainfall) and hence the soil moisture values from ASCAT are not high. With the CNTRL run
overestimating soil moisture values as compared to IMDAA, it is not surprising that CNTRL
soil moisture values are higher than ASCATs. The lack of marked differences between AS-
CAT and CNTRL soil moisture values would result in lack of pronounced positive impact
due to EnKF data assimilation, as reflected in Figures 3a and 4a.
Figure 6b shows that the differences in the soil moisture in pre-monsoon season is
marked and has negative values over Madhya Maharashtra, Marathwada, Vidarbha, Saurash-
tra and Kutch (all part of central India) and also over Telangana and North Interior Karnataka
(part of South Peninsular India). Most of the above mentioned regions have experienced
deficit rainfall during pre-monsoon season with percentage departures ranging from -40%
(Madhya Maharashtra) to -94% (Saurashtra and Kutch) (Kaur and Purohit, 2013) and these
regions contain mostly non irrigated croplands as compared to other homogeneous regions
(Figure 3 of Ambika et. al (Krishnankutty Ambika et al., 2016)) leading to lower soil mois-
ture as estimated by ASCAT. With the overestimation of CNTRL soil moisture, the dif-
ference between ASCAT and CNTRL run is markedly negative in the above regions. The
above-mentioned regions also have the largest positive FI values during the pre-monsoon
season (refer Figure 4b). The above result reveals that the overestimation of CNTRL soil
moisture has reduced in the EXP run, resulting in positive impact, when the LSM is assimi-
lated with ASCAT soil moisture.

10 Vibin Jose1, Anantharaman Chandrasekar1∗
Fig. 5: KolmogorovSmirnov distance (D) from comparison of soil moisture distributions
from CNTRL and EXP integrations for the year 2012 where a, b, c, d represents winter,
pre-monsoon, monsoon, and post-monsoon respectively.
Figure 6c shows that the differences in the soil moisture in the monsoon season are
quite small and have mostly positive values except for regions over Tamil Nadu, South In-
terior Karnataka, North Interior Karnataka (all part of South Peninsular India), Saurashtra
and Kutch, and Gujarat (part of Central India). Most parts of India received normal rainfall
during the monsoon season (78% of annual rainfall) in 2012, increasing the soil moisture
estimates from ASCAT and contributing to positive differences in soil moisture between
ASCAT and CNTRL run. A few regions, however, received lower rainfall with percentage
departure during monsoon season being -23% for Tamil Nadu and South Interior Karnataka,
-36% for North Interior Karnataka, -34% for Saurashtra and Kutch and -28% for Gujarat
region (Kaur and Purohit, 2013). Lower rainfall over these regions contributed to lower soil
moisture and hence differences between ASCAT and CNRL soil moisture became negative
over these regions. However, the magnitude of the decrease (i.e. large negative differences as
seen during the pre-monsoon season) is considerably reduced during the monsoon season.
Figure 4c shows that the above regions show a marginal impact of EnKF data assimila-
tion while the K-S-D values are also close to zero over these regions during the southwest
monsoon season (Figure 5c).
Figure 6d shows that the differences in the soil moisture is quite small during the post-
monsoon season. Figure 6d is similar to Figure 6a except that for the post-monsoon case, the
ASCAT soil moisture has higher soil moisture values over more regions than the CNTRL run
as compared to the winter season. The above can be explained by considering that the post-
monsoon follows the monsoon season with the latter contributing 78% of the annual rainfall
Data assimilation using EnKF over the Indian domain 11
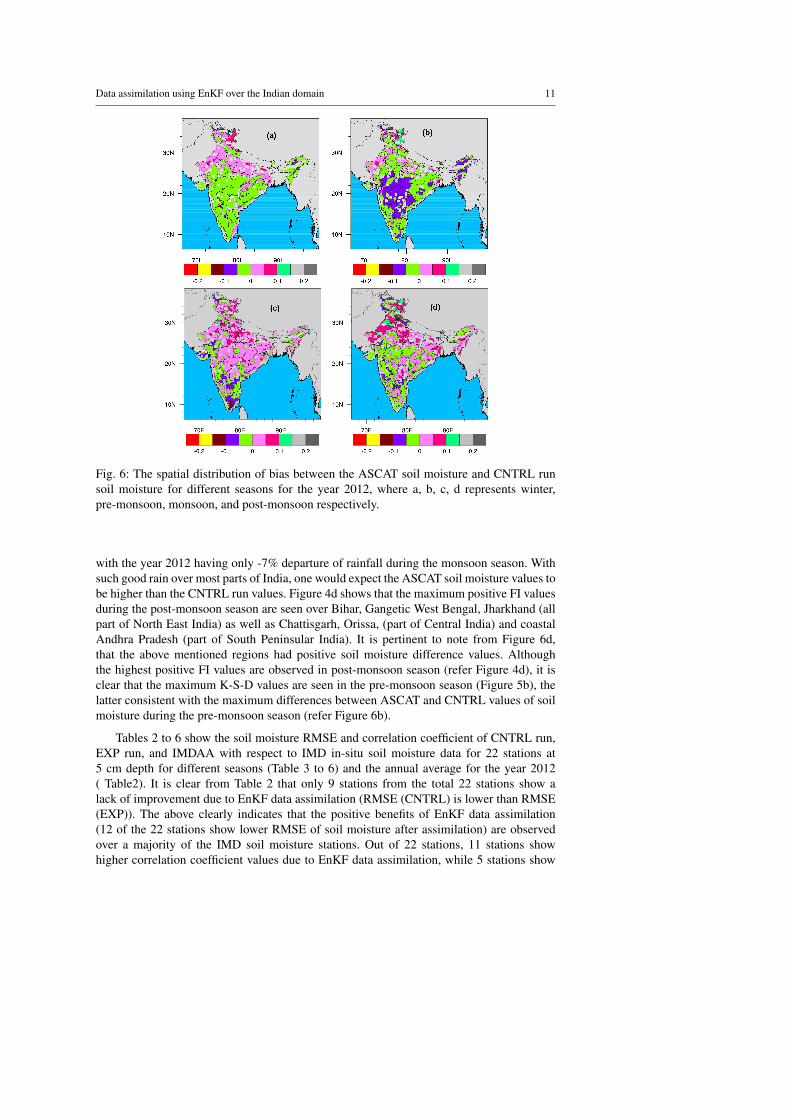
Fig. 6: The spatial distribution of bias between the ASCAT soil moisture and CNTRL run
soil moisture for different seasons for the year 2012, where a, b, c, d represents winter,
pre-monsoon, monsoon, and post-monsoon respectively.
with the year 2012 having only -7% departure of rainfall during the monsoon season. With
such good rain over most parts of India, one would expect the ASCAT soil moisture values to
be higher than the CNTRL run values. Figure 4d shows that the maximum positive FI values
during the post-monsoon season are seen over Bihar, Gangetic West Bengal, Jharkhand (all
part of North East India) as well as Chattisgarh, Orissa, (part of Central India) and coastal
Andhra Pradesh (part of South Peninsular India). It is pertinent to note from Figure 6d,
that the above mentioned regions had positive soil moisture difference values. Although
the highest positive FI values are observed in post-monsoon season (refer Figure 4d), it is
clear that the maximum K-S-D values are seen in the pre-monsoon season (Figure 5b), the
latter consistent with the maximum differences between ASCAT and CNTRL values of soil
moisture during the pre-monsoon season (refer Figure 6b).
Tables 2 to 6 show the soil moisture RMSE and correlation coefficient of CNTRL run,
EXP run, and IMDAA with respect to IMD in-situ soil moisture data for 22 stations at
5 cm depth for different seasons (Table 3 to 6) and the annual average for the year 2012
( Table2). It is clear from Table 2 that only 9 stations from the total 22 stations show a
lack of improvement due to EnKF data assimilation (RMSE (CNTRL) is lower than RMSE
(EXP)). The above clearly indicates that the positive benefits of EnKF data assimilation
(12 of the 22 stations show lower RMSE of soil moisture after assimilation) are observed
over a majority of the IMD soil moisture stations. Out of 22 stations, 11 stations show
higher correlation coefficient values due to EnKF data assimilation, while 5 stations show

12 Vibin Jose1, Anantharaman Chandrasekar1∗
no change in correlation coefficient value due to assimilation. The remaining 6 stations show
lower correlation coefficient values after data assimilation.
The irrigation map of India for the year 2012 is shown in Figure 7d (Devanand et al.,
2019). The above figure shows that the most irrigated areas are observed over the Indo-
Gangetic plain while least irrigated areas are seen over the south western region of India.
Table 7 has tabulated the 22 IMD in-situ stations into three classes namely, a low irrigated
(< 6 mm), moderately irrigated (6 to 14 mm), and highly irrigated (above 14 mm) based on
Figure 7d. Three of the highly irrigating stations such as Basti, Ranchi, and Solapur have
shown positive impact due to the assimilation of ASCAT soil moisture in terms of lower
RMSE of soil moisture of the EXP run as compared to CNTRL run (refer Tables 2 to 6).
Since the ASCAT soil moisture values have a signature of irrigation effects (Nair and Indu,
2019; Zhang et al., 2018), one would expect that over highly irrigated regions, assimilation
of ASCAT soil moisture would result in much-improved estimates closer to the ground
truth after data assimilation. The above hypothesis is confirmed with lower RMSE values
of EXP run as compared with CNTRL run for each of the four seasons as well as for the
annual average. Another highly irrigated station, Karnal show the same RMSE values of soil
moisture before and after assimilation (refer Table 2), indicating that there is no degradation
of the soil moisture estimates after data assimilation.
Among the 11 moderately irrigated stations, seven of the stations (Bhubaneswar, Lud-
hiana, Durgapura, Sagar, Bellari, Chatha, and Vedasundar) have shown positive impact due
to the assimilation of ASCAT soil moisture in terms of lower RMSE of soil moisture of
the EXP run as compared to CNTRL run. It is clear that the above mentioned moderately
irrigated stations have shown improvement in soil moisture estimates after assimilation of
ASCAT soil moisture, the latter having the signature of irrigation. It is pertinent to note that
irrespective of rainfall received that includes stations receiving below normal rainfall (depar-
ture of annual rainfall from normal for Bellari is -13%, for Bhubaneswar is -17%, for Sagar
is -23%) or receiving normal rainfall (Durgapura, Jaipur district has 10% departure of an-
nual rainfall from normal and Chatha, Jammu district has 5% departure) or receiving deficit
rainfall (Vedasundar, Dindigul district has -32% departure of annual rainfall from normal
and Ludhiana has -55% departure), all these seven moderately irrigated stations have shown
positive impact. Two other moderately irrigated stations (Anakapalle and New Delhi) have
a very small difference in the RMSE of soil moisture before and after ASCAT soil moisture
assimilation (0.007 and 0.001).
One would expect a negative impact due to the assimilation of ASCAT soil moisture over
stations that are low irrigated considering that the ASCAT soil moisture has the signature of
irrigation effects. The above expectation turns out to be true for four (Rahuri, Pune, Niphad,
and Bhopal) of the six stations that have low irrigation values. All the above mentioned four
stations have higher RMSE of soil moisture after data assimilation as compared to CNTRL
run for the annual average(refer Table 2).
It is certainly true that a small number of stations are showing deviant behavior from the
above hypothesis. Sabour a station in Bhagalpur district in the state of Bihar despite being
a highly irrigated station has shown a negative impact after data assimilation with a higher
RMSE value of soil moisture for the EXP run as compared to the CNTRL run (refer Tables 2
to 6). Similarly, two stations among the moderately irrigated stations (Udaipur and Nagpur)
have shown a negative impact after data assimilation. Furthermore, two of the low irrigated
stations (Vellanikara and Vittal) have shown a positive impact after data assimilation.
It is clear that a substantial majority of the stations (17 out of 22)have shown a clear
positive/negative impact, including no or very small impact, that assimilation of ASCAT
soil moisture has impacted positively for most of the stations that have high irrigation and

Data assimilation using EnKF over the Indian domain 13
or stations that have moderately irrigation while assimilation of ASCAT soil moisture has
impacted negatively for most of the stations that have very low irrigation levels. Overall,
the above results lead to confirm the notion that the ASCAT soil moisture has the signature
of irrigation effects and assimilating the ASCAT soil moisture would invariably lead to an
improved soil moisture estimate closer to the ground truth.
13 out of 22 stations show larger values of RMSE of IMDAA soil moisture as compared
to the RMSE of both model runs (CNTRL and EXP runs), while for 6 stations the RMSE
of IMDAA soil moisture is less than the RMSE of both model runs. For 3 stations, RMSE
of IMDAA soil moisture has values intermediate between the RMSE of model runs (higher
than CNTRL and lower than EXP). The soil moisture correlation value of IMDAA has lower
values for 11 stations (out of 22) and higher values for 7 stations as compared to CNTRL
and EXP runs. For 4 stations, IMDAA correlation values are either intermediate or equal to
the model runs (CNTRL and EXP). The above results may appear surprising considering
that both IMDAA and EXP run have assimilated ASCAT soil moisture observation. How-
ever, it is to be noted that the Richardson equation for soil water used in Noah LSM is not a
linear partial differential equation since the diffusion term is not linear. It is well known that
EnKF data assimilation provides better results as compared to EKF for nonlinear equations.
The reason for a majority (13 out of 22) of stations reporting lower CNTRL RMSE soil
moisture values as compared to IMDAA RMSE values are somewhat harder to explain. The
soil moisture from CNTRL run is obtained by integrating a relatively simple model (Noah
LSM) with observed IMD rainfall forcings and realistic surface meteorology from GDAS.
However, the IMDAA regional reanalysis utilized the Unified model and employed 4DVAR
data assimilation for the atmospheric variables and utilized EKF data assimilation for soil
moisture fields. The LSM called Joint UK Land Environment System (JULES) is coupled
to the Unified Model and soil moisture analysis is performed by EKF method for IMDAA.
While it is indeed surprising that the soil moisture RMSE of CNTRL (without any data as-
similation) run has lower RMSE values as compared to RMSE of IMDAA analysis, it has to
be noted that rainfall forcing is a very important forcing in the LSM; while in the CNTRL
run, the Noah LSM is forced with observed IMD rainfall forcings, the rainfall forcings for
the JULES LSM for IMDAA analysis is forced by the model (Unified Model) simulated
precipitation. Thus, despite carrying EKF assimilation involving ASCAT soil moisture esti-
mate in IMDAA, due to errors and uncertainties in the model generated rainfall forcings, the
soil moisture analysis from IMDAA may show larger RMSE values of soil moisture as com-
pared to RMSE CNTRL values. In general most data assimilation methods such as EnKF
and EKF assume that the random error for the model and observations are Gaussian. Also
land surface exhibits the following characteristics such as (i) heterogeneity (smaller spatial
scale as compared to atmosphere and ocean), (ii) non-linearities, and non- Gaussiality (e.g
hydrological cycle) that pose serious challenges while applying data assimilation methods.
The above mentioned features of land surface, especially those related to non-linear and
non-Guassiality have important implications while applying Kalman filter methods (Lahoz
and Schneider, 2014).
The assimilated soil moisture estimate is further evaluated using triple collocation (TC)
method. For the TC analysis, two sets of triplet soil moisture data sets have been selected.
The GLDAS and MERRA model soil moisture estimates are kept same for both sets of
triplets, while the role of the third data set in each of the two triplets is played by soil mois-
ture in the CNTRL run and EXP run. The first set of triplet soil moisture datasets (GLDAS
CLSM, MERRA and CNTRL run) will all be devoid of any signature of irrigation effects
[Nair and Indu (2019)], However, while the first two of the second set of triplet soil moisture
data sets (GLDAS CLSM, MERRA and EXP run) lack any signature of irrigation effects,
14 Vibin Jose1, Anantharaman Chandrasekar1∗
the soil moisture data set obtained from the EXP run has the signature of irrigation effects
due to assimilation of ASCAT soil moisture in the EXP run. One would expect that the TC
analysis with soil moisture from EXP run will exhibit high errors and low correlations over
the irrigated regions [(Kolassa et al., 2017; Nair and Indu, 2019)]. On the contrary, the TC
analysis with soil moisture from CNTRL run will exhibit low errors and high correlations
over the irrigated regions.
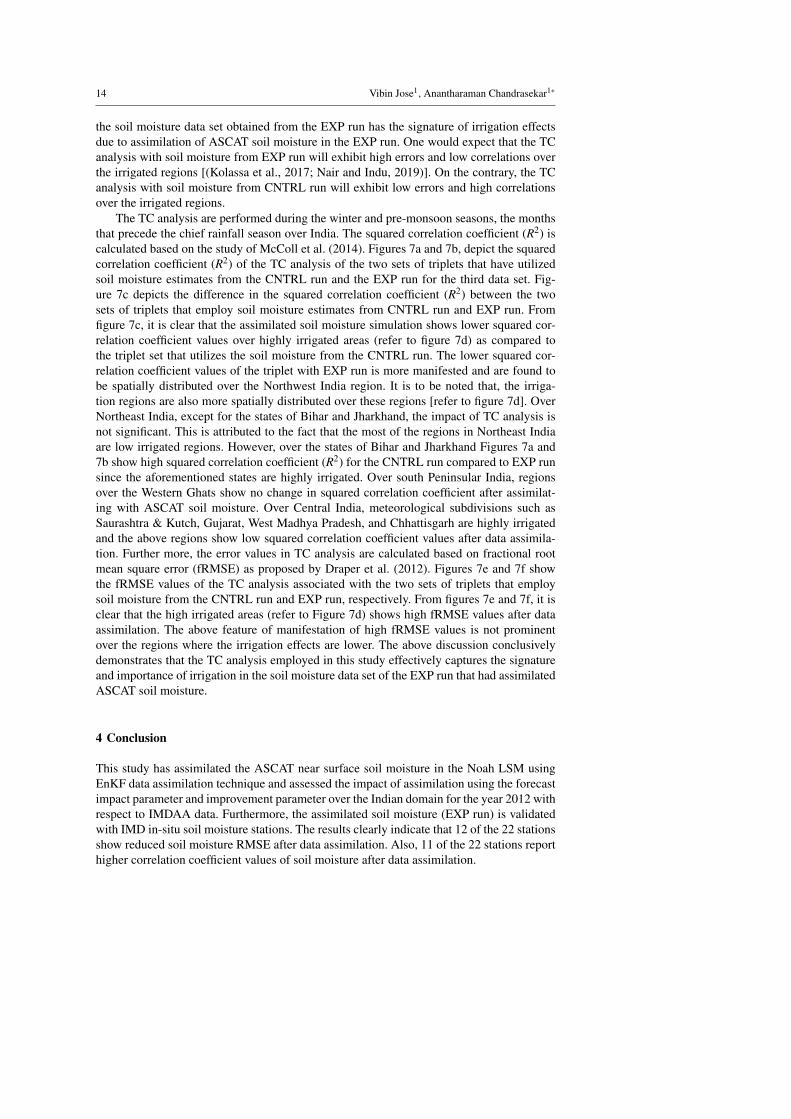
The TC analysis are performed during the winter and pre-monsoon seasons, the months
that precede the chief rainfall season over India. The squared correlation coefficient (R2) is
calculated based on the study of McColl et al. (2014). Figures 7a and 7b, depict the squared
correlation coefficient (R2) of the TC analysis of the two sets of triplets that have utilized
soil moisture estimates from the CNTRL run and the EXP run for the third data set. Fig-
ure 7c depicts the difference in the squared correlation coefficient (R2) between the two
sets of triplets that employ soil moisture estimates from CNTRL run and EXP run. From
figure 7c, it is clear that the assimilated soil moisture simulation shows lower squared cor-
relation coefficient values over highly irrigated areas (refer to figure 7d) as compared to
the triplet set that utilizes the soil moisture from the CNTRL run. The lower squared cor-
relation coefficient values of the triplet with EXP run is more manifested and are found to
be spatially distributed over the Northwest India region. It is to be noted that, the irriga-
tion regions are also more spatially distributed over these regions [refer to figure 7d]. Over
Northeast India, except for the states of Bihar and Jharkhand, the impact of TC analysis is
not significant. This is attributed to the fact that the most of the regions in Northeast India
are low irrigated regions. However, over the states of Bihar and Jharkhand Figures 7a and
7b show high squared correlation coefficient (R2) for the CNTRL run compared to EXP run
since the aforementioned states are highly irrigated. Over south Peninsular India, regions
over the Western Ghats show no change in squared correlation coefficient after assimilat-
ing with ASCAT soil moisture. Over Central India, meteorological subdivisions such as
Saurashtra & Kutch, Gujarat, West Madhya Pradesh, and Chhattisgarh are highly irrigated
and the above regions show low squared correlation coefficient values after data assimila-
tion. Further more, the error values in TC analysis are calculated based on fractional root
mean square error (fRMSE) as proposed by Draper et al. (2012). Figures 7e and 7f show
the fRMSE values of the TC analysis associated with the two sets of triplets that employ
soil moisture from the CNTRL run and EXP run, respectively. From figures 7e and 7f, it is
clear that the high irrigated areas (refer to Figure 7d) shows high fRMSE values after data
assimilation. The above feature of manifestation of high fRMSE values is not prominent
over the regions where the irrigation effects are lower. The above discussion conclusively
demonstrates that the TC analysis employed in this study effectively captures the signature
and importance of irrigation in the soil moisture data set of the EXP run that had assimilated
ASCAT soil moisture.
4 Conclusion
This study has assimilated the ASCAT near surface soil moisture in the Noah LSM using
EnKF data assimilation technique and assessed the impact of assimilation using the forecast
impact parameter and improvement parameter over the Indian domain for the year 2012 with
respect to IMDAA data. Furthermore, the assimilated soil moisture (EXP run) is validated
with IMD in-situ soil moisture stations. The results clearly indicate that 12 of the 22 stations
show reduced soil moisture RMSE after data assimilation. Also, 11 of the 22 stations report
higher correlation coefficient values of soil moisture after data assimilation.

Data assimilation using EnKF over the Indian domain 15
Fig. 7: Depicts the squared correlation coefficient (R2) from Triple collocation method for
(a) CNTRL run and (b) EXP run, (c) the change (CNTRL-EXP) in squared correlation
coefficient of CNTRL and EXP run, (d) the irrigation map of India in mm for the year 2012,
fractional RMSE of (e)CNTRL run and (f) EXP run using Triple collocation method.

16 Vibin Jose1, Anantharaman Chandrasekar1∗
Table 2: Comparison of soil moisture RMSE and correlation coefficient (R) of CNTRL run,
EXP run, and IMDAA at 5 cm depth at 22 stations for the year 2012.
No. Station RMSE
(CN-
TRL)
RMSE
(EXP)
RMSE
(IM-
DAA)
R (CN-
TRL)
R
(EXP)
R (IM-
DAA)
m3/m3 m3/m3 m3/m3
1 Basti 0.036 0.032 0.100 0.90 0.90 0.77
2 Bhubaneswar 0.100 0.096 0.142 0.85 0.87 0.84
3 Ranchi 0.168 0.164 0.203 0.76 0.73 0.60
4 Sabour 0.085 0.097 0.119 0.65 0.65 0.48
5 Chatha 0.069 0.066 0.087 0.56 0.56 0.71
6 Ludhiana 0.171 0.165 0.097 0.83 0.80 0.84
7 Karnal 0.055 0.055 0.070 0.73 0.71 0.74
8 New Delhi 0.080 0.081 0.110 0.65 0.67 0.60
9 Durgapura 0.116 0.110 0.076 0.87 0.90 0.86
10 Udaipur 0.071 0.121 0.078 0.88 0.85 0.80
11 Solapur 0.073 0.061 0.087 0.86 0.89 0.61
12 Rahuri 0.055 0.063 0.147 0.56 0.64 0.32
13 Pune 0.083 0.093 0.094 0.76 0.76 0.83
14 Niphad 0.051 0.056 0.141 0.78 0.82 0.68
15 Nagpur 0.091 0.120 0.104 0.75 0.72 0.75
16 Bhopal 0.078 0.109 0.080 0.79 0.64 0.73
17 Sagar 0.106 0.095 0.071 0.89 0.92 0.92
18 Bellari 0.080 0.068 0.062 0.79 0.84 0.73
19 Vellanikara 0.130 0.125 0.149 0.86 0.86 0.89
20 Vedasundar 0.166 0.152 0.074 0.37 0.42 0.68
21 Vittal 0.119 0.110 0.146 0.90 0.92 0.92
22 Anakapalle 0.061 0.068 0.016 0.81 0.82 0.85
Since the model output is subjected to errors from atmospheric forcings, initial con-
ditions, model discrepancies, and model deficiencies (such as not incorporating some im-
portant effects that are present), the CNTRL run soil moisture overestimates the IMDAA
soil moisture. The most significant improvements due to assimilation are found over the
western parts of the Central Indian region during the pre-monsoon season that are asso-
ciated with large negative differences between ASCAT and CNTRL soil moisture values.
The above regions experienced lower rainfall rate and have non irrigated croplands over the
Central Indian region contributing to reduced overestimation of the CNTRL soil moisture
after assimilation. The least improvements of soil moisture due to data assimilation are seen
during the monsoon season. Possibly, the irrigation requirements are minimum during the
typical rainy season (monsoon season). Most of the stations that are highly irrigated and or
moderately irrigated show reduced soil moisture RMSE after assimilation with respect to
IMD in-situ data, while majority of the stations that have low irrigation levels show negative
impact due to data assimilation showing that the effects of irrigation as reflected in the AS-
CAT soil moisture data do contribute to improved soil moisture states and hence, significant
improvements to incorporate the effect of irrigation in LSMs, may improve the model soil
moisture estimates.
The impact of irrigation on assimilated soil moisture is further evaluated using the triple
collocation (TC) method. The TC analysis is performed using GLDAS CLSM, and MERRA
Land data with EXP and CNTRL run soil moisture estimates as the third data set for each
of the two triplets. As the GLDAS CLSM and MERRA data do not have the signature of
irrigation, the assimilated soil moisture shows a low correlation coefficient value and high

Data assimilation using EnKF over the Indian domain 17
Table 3: Same as Table 2 but for Winter season.
No. Station RMSE
(CN-
TRL)
RMSE
(EXP)
RMSE
(IM-
DAA)
R (CN-
TRL)
R
(EXP)
R (IM-
DAA)
m3/m3 m3/m3 m3/m3
1 Basti 0.030 0.030 0.040 0.23 0.20 0.26
2 Bhubaneswar 0.030 0.030 0.026 0.83 0.84 0.64
3 Ranchi 0.112 0.111 0.120 -0.05 -0.05 -0.05
4 Sabour 0.036 0.056 0.070 0.86 0.87 0.71
5 Chatha 0.053 0.046 0.100 -0.24 -0.22 -0.23
6 Ludhiana 0.152 0.154 0.110 0.70 0.69 0.67
7 Karnal 0.040 0.040 0.040 0.70 0.62 0.59
8 New Delhi 0.070 0.070 0.030 0.33 0.33 0.84
9 Durgapura 0.076 0.079 0.010 -0.06 -0.03 -0.01
10 Udaipur 0.070 0.126 0.020 -0.96 0.92 0.98
11 Solapur 0.080 0.079 0.040 0.74 0.90 0.61
12 Rahuri 0.100 0.100 0.210 0.73 0.74 -0.59
13 Pune 0.035 0.036 0.110 0.66 0.67 0.66
14 Niphad 0.040 0.047 0.150 -0.42 -0.45 -0.25
15 Nagpur 0.030 0.068 0.110 0.35 -0.45 0.31
16 Bhopal 0.040 0.049 0.060 0.21 0.24 0.13
17 Sagar 0.070 0.068 0.050 0.96 0.97 0.95
18 Bellari 0.090 0.090 0.030 -0.27 -0.25 -0.35
19 Vellanikara 0.120 0.130 0.090 0.96 0.96 0.94
20 Vedasundar 0.113 0.103 0.010 0.99 0.99 0.94
21 Vittal 0.090 0.090 0.040 0.93 0.93 0.93
22 Anakapalle 0.040 0.040 0.020 0.84 0.87 0.98
fRMSE value over highly irrigated regions. These results indicate that the TC analysis has
effectively captured the impact of irrigation on data assimilation.
The land surface characteristics such as land cover and soil texture types are predefined
in Noah LSM and the land cover and soil texture types are fixed to a single land cover class
and a single soil texture one for each grid point. However, in reality, the above parameters
have spatial heterogeneity even within a grid cell. In addition, the variation of the soil texture
type with soil depth is also not considered and modelled in the Noah LSM. Furthermore,
the one dimensional Noah LSM used in the present study is not adequate to describe the
land surface interactions in the horizontal. The Noah LSM can only provide for the vertical
variations of soil moisture and soil temperatures over various soil depths. The drained water
from the bottom layer removes immediately in Noah LSM, which results in fewer memories
of preceding weather and climate changes. Since the Noah model has a shallow soil column,
the model is unable to capture the soil critical zone (up to 5 m depth). The Noah LSM has
a combined soil and vegetation surface. Hence, it is difficult to implement the dynamic leaf
model in Noah LSM.
ACKNOWLEDGMENT
The authors thank the Hydrological Sciences Laboratory, at NASA GSFC and NCAR for
providing the LIS and the Noah LSM. The authors thank the Director-General of IMD and
Head, NCMRWF for providing the IMD in-situ soil moisture and IMDAA data. The first
author thanks the CSIR for providing Research fellowship. The authors acknowledge the

18 Vibin Jose1, Anantharaman Chandrasekar1∗
Table 4: Same as Table 2 but for Pre-monsoon season.
No. Station RMSE
(CN-
TRL)
RMSE
(EXP)
RMSE
(IM-
DAA)
R (CN-
TRL)
R
(EXP)
R (IM-
DAA)
m3/m3 m3/m3 m3/m3
1 Basti 0.030 0.020 0.070 0.55 -0.01 0.61
2 Bhubaneswar 0.036 0.035 0.020 0.90 0.90 0.84
3 Ranchi 0.068 0.066 0.010 0.84 0.84 0.80
4 Sabour 0.044 0.066 0.090 0.035 -0.13 -0.35
5 Chatha 0.061 0.070 0.050 -0.08 0.05 0.57
6 Ludhiana 0.166 0.123 0.020 0.61 0.38 0.77
7 Karnal 0.040 0.035 0.020 0.39 0.34 0.85
8 New Delhi 0.050 0.055 0.010 -0.09 -0.12 -0.15
9 Durgapura 0.076 0.075 0.010 0.25 0.27 0.15
10 Udaipur 0.060 0.152 0.020 0.89 0.85 0.85
11 Solapur 0.100 0.085 0.003 0.73 0.72 0.48
12 Rahuri 0.040 0.041 0.100 0.68 0.74 0.29
13 Pune 0.060 0.069 0.070 0.32 0.41 0.49
14 Niphad 0.060 0.058 0.110 0.84 0.87 0.69
15 Nagpur 0.050 0.122 0.100 0.22 0.24 0.20
16 Bhopal 0.030 0.045 0.080 0.84 0.77 0.74
17 Sagar 0.100 0.089 0.020 0.03 -0.07 0.18
18 Bellari 0.078 0.079 0.040 0.68 0.74 0.71
19 Vellanikara 0.100 0.088 0.100 0.82 0.83 0.84
20 Vedasundar 0.125 0.117 0.060 0.53 0.60 0.75
21 Vittal 0.080 0.076 0.060 0.81 0.82 0.87
22 Anakapalle 0.045 0.046 0.010 0.76 0.76 0.68
Director of IIST for support, encouragement, and computing facility. The authors also thank
Dr. Subimal Ghosh and Ms. Anjana Devanand for providing the data to plot Figure 7d. Fi-
nally, the authors thank the anonymous reviewer for the valuable suggestions and comments
which have improved the quality of the manuscript.
Funding
The present study has not received any specific grant or funding from any agency.
Author’s Contributions
While the second author assisted in the design of the study and contributed to interpretation
and broad conclusion of the results, the first author contributed in carrying out the detailed
model simulations, as well as additional analysis that were carried out. Furthermore, the first
author contributed to writing the manuscript.
Availability of data and material
The data sets and material used in the present study, except for the IMD in-situ soil moisture
data are freely available in the web.

Data assimilation using EnKF over the Indian domain 19
Table 5: Same as Table 2 but for Monsoon season.
No. Station RMSE
(CN-
TRL)
RMSE
(EXP)
RMSE
(IM-
DAA)
R (CN-
TRL)
R
(EXP)
R (IM-
DAA)
m3/m3 m3/m3 m3/m3
1 Basti 0.048 0.044 0.110 0.76 0.79 0.68
2 Bhubaneswar 0.134 0.132 0.220 0.79 0.79 0.83
3 Ranchi 0.250 0.240 0.350 -0.26 -0.26 -0.20
4 Sabour 0.127 0.137 0.170 0.69 0.70 0.42
5 Chatha 0.090 0.077 0.120 0.78 0.69 0.76
6 Ludhiana 0.181 0.145 0.140 0.83 0.82 0.83
7 Karnal 0.076 0.075 0.110 0.81 0.77 0.70
8 New Delhi 0.100 0.120 0.190 0.69 0.70 0.61
9 Durgapura 0.157 0.143 0.130 0.74 0.78 0.74
10 Udaipur 0.086 0.118 0.100 0.73 0.73 0.64
11 Solapur 0.079 0.070 0.100 0.84 0.91 0.43
12 Rahuri 0.030 0.033 0.120 0.50 0.54 0.35
13 Pune 0.125 0.126 0.060 0.63 0.58 0.91
14 Niphad 0.050 0.053 0.160 0.80 0.79 0.67
15 Nagpur 0.136 0.139 0.110 0.54 0.63 0.58
16 Bhopal 0.110 0.125 0.090 0.71 0.68 0.65
17 Sagar 0.130 0.110 0.110 0.87 0.92 0.89
18 Bellari 0.060 0.050 0.090 0.92 0.92 0.74
19 Vellanikara 0.149 0.114 0.210 0.61 0.62 0.67
20 Vedasundar 0.220 0.200 0.070 0.36 0.43 0.85
21 Vittal 0.150 0.140 0.200 0.62 0.64 0.53
22 Anakapalle 0.070 0.072 0.020 0.60 0.64 0.56
Code availability
The codes employed in this study are available to be shared on request.
Ethics approval
The authors declare that the contents and the results of the manuscript have not been pub-
lished in any other journal or conference.
Consent to participate and Consent for publication
The authors provide their consent and willingness to participate in the publication process
and to publish the above manuscript.
Disclosure statement
No conflict of interest is reported by the authors.

20 Vibin Jose1, Anantharaman Chandrasekar1∗
Table 6: Same as Table 2 but for Post-monsoon season.
No. Station RMSE
(CN-
TRL)
RMSE
(EXP)
RMSE
(IM-
DAA)
R (CN-
TRL)
R
(EXP)
R (IM-
DAA)
m3/m3 m3/m3 m3/m3
1 Basti 0.036 0.015 0.140 0.99 0.99 0.83
2 Bhubaneswar 0.120 0.097 0.120 0.69 0.73 0.84
3 Ranchi 0.170 0.140 0.130 0.67 0.63 0.82
4 Sabour 0.080 0.080 0.090 0.06 0.08 -0.07
5 Chatha 0.061 0.038 0.050 -0.17 -0.2 0.51
6 Ludhiana 0.182 0.147 0.020 0.25 0.34 -0.31
7 Karnal 0.042 0.045 0.040 0.55 0.62 0.86
8 New Delhi 0.048 0.058 0.030 -0.17 -0.16 -0.59
9 Durgapura 0.113 0.106 0.010 0.52 0.57 0.18
10 Udaipur 0.060 0.116 0.100 0.90 0.91 0.93
11 Solapur 0.060 0.043 0.090 0.76 0.79 0.70
12 Rahuri 0.058 0.063 0.180 0.50 0.52 0.31
13 Pune 0.060 0.069 0.140 0.88 0.88 0.94
14 Niphad 0.050 0.054 0.170 0.62 0.63 0.57
15 Nagpur 0.088 0.112 0.090 0.73 0.65 0.81
16 Bhopal 0.098 0.148 0.090 -0.16 -0.22 0.81
17 Sagar 0.100 0.090 0.050 0.69 0.71 0.68
18 Bellari 0.077 0.050 0.050 0.89 0.89 0.70
19 Vellanikara 0.158 0.118 0.170 0.89 0.89 0.88
20 Vedasundar 0.166 0.113 0.140 0.88 0.89 0.79
21 Vittal 0.120 0.119 0.180 0.94 0.95 0.93
22 Anakapalle 0.090 0.095 0.010 0.96 0.97 0.93
Table 7: IMD in-situ stations are tabulated, based on irrigation.
Low Irrigated Moderately Irrigated Highly Irrigated
(6 mm or less) ( 6 to 14 mm) (Above 14 mm)
Rahuri Bhubaneswar Basti
Pune Ludhiana Sabour
Niphad New Delhi Ranchi
Bhopal Durgapura Karnal
Vellanikkara Udaipur Solapur
Vittal Nagpur
Sagar
Bellari
Chatha
Vedasundar
Anakapalle
References
Ashrit R, Indira Rani S, Kumar S, Karunasagar S, Arulalan T, Francis T, Routray A,
Laskar SI, Mahmood S, Jermey P, Maycock A, Renshaw R, George JP, Rajagopal EN
(2020) Imdaa regional reanalysis: Performance evaluation during indian summer mon-
soon season. Journal of Geophysical Research: Atmospheres 125(2):e2019JD030973,
DOI 10.1029/2019JD030973

Data assimilation using EnKF over the Indian domain 21
Blankenship C, Case J, Zavodsky B, Crosson W (2016) Assimilation of smos retrievals
in the land information system. IEEE Transactions on Geoscience and Remote Sensing
54:1–13, DOI 10.1109/TGRS.2016.2579604
Case JL, LaCasse KM, Santanello JA, Lapenta WM, Peters-Lidard CD (2007) Improved
modeling of landatmosphere interactions using a coupled version of wrf with the land
information system. In: 21st Conf. on Hydrology, San Antonio, TX, Amer. Meteor. Soc.,
5A.4
Chakravarty IM, Laha RG, Roy JD (1967) Handbook of methods of applied statistics.
McGraw-Hill, New York, NY, URL https://cds.cern.ch/record/109749
Chen F, Dudhia J (2001) Coupling an advanced land surfacehydrology model with the penn
statencar mm5 modeling system. part i: Model implementation and sensitivity. Monthly
Weather Review 129:569–585, DOI 10.1175/1520-0493(2001)129〈0569:CAALSH〉2.0.
CO;2
Chen F, Mitchell K, Schaake J, Xue Y, Pan HL, Koren V, Duan QY, Ek M, Betts A (1996)
Modeling of land surface evaporation by four schemes and comparison with fife observa-
tions. Journal of Geophysical Research: Atmospheres 101(D3):7251–7268
Devanand A, Huang M, Ashfaq M, Barik B, Ghosh S (2019) Choice of irrigation water man-
agement practice affects indian summer monsoon rainfall and its extremes. Geophysical
Research Letters 46(15):9126–9135, DOI 10.1029/2019GL083875
Dorigo W, W W, Hohensinn R, Hahn S, Paulik C, Drusch M, S M, Oevelen P, A R, Jackson
T (2011) The international soil moisture network: A data hosting facility for global in
situ soil moisture measurements. Hydrology and Earth System Sciences Discussions 15,
DOI 10.5194/hessd-8-1609-2011
Draper CS, Reichle RH, De Lannoy GJM, Liu Q (2012) Assimilation of passive and active
microwave soil moisture retrievals. Geophysical Research Letters 39(4), DOI 10.1029/
2011GL050655
Drusch M (2007) Initializing numerical weather prediction models with satellite-derived
surface soil moisture: Data assimilation experiments with ecmwf’s integrated forecast
system and the tmi soil moisture data set. Journal of Geophysical Research: Atmospheres
112(D3), DOI 10.1029/2006JD007478
Gentemann CL (2014) Three way validation of modis and amsr-e sea surface temper-
atures. Journal of Geophysical Research: Oceans 119(4):2583–2598, DOI 10.1002/
2013JC009716
Jacquemin B, Noilhan J (1990) Sensitivity study and validation of a land surface
parametrization using the hapex-mobilihy data set. Boundary-Layer Meteorology 52:93–
134, DOI 10.1007/BF00123180
Kaur S, Purohit M (2013) Rainfall statistics of india-2012. Indian Meteorological Depart-
ment, Hydromet Division, New Delhi Report No. :ESSO /IMD /HS / R.F. REP / 02 (2013)
/ 16
Kolassa J, Gentine P, Prigent C, Aires F, Alemohammad S (2017) Soil moisture retrieval
from AMSR-E and ASCAT microwave observation synergy. part 2: Product evaluation.
Remote Sensing of Environment 195:202–217, DOI 10.1016/j.rse.2017.04.020
Krishnankutty Ambika A, Wardlow B, Mishra V (2016) Remotely sensed high resolution
irrigated area mapping in india for 2000 to 2015. Scientific Data 3:160118, DOI 10.1038/
sdata.2016.118
Kumar S, Peters-Lidard C, Tian Y, Houser P, Geiger J, Olden S, Lighty L, Eastman J, Doty B,
Dirmeyer P, Adams J, Mitchell K, Wood E, Sheffield J (2006) Land information system:
An interoperable framework for high resolution land surface modeling. Environmental
Modelling & Software 21(10):1402 – 1415, DOI https://doi.org/10.1016/j.envsoft.2005.

22 Vibin Jose1, Anantharaman Chandrasekar1∗
07.004
Kumar S, Peters-Lidard C, Santanello J, Reichle R, Draper C, Koster R, Nearing G, Jasinski
M (2015) Evaluating the utility of satellite soil moisture retrievals over irrigated areas
and the ability of land data assimilation methods to correct for unmodeled processes.
Hydrology and Earth System Sciences 19, DOI 10.5194/hess-19-4463-2015
Kumar SV, Peters-Lidard CD, Santanello JA, Reichle RH, Draper CS, Koster RD, Near-
ing G, Jasinski MF (2015) Evaluating the utility of satellite soil moisture retrievals
over irrigated areas and the ability of land data assimilation methods to correct for
unmodeled processes. Hydrology and Earth System Sciences 19(11):4463–4478, DOI
10.5194/hess-19-4463-2015
Lahoz WA, Schneider P (2014) Data assimilation: making sense of earth observation. Fron-
tiers in Environmental Science 2:16, DOI 10.3389/fenvs.2014.00016
Liu Y, Dorigo W, Parinussa R, de Jeu R, Wagner W, McCabe M, Evans J, van Dijk A (2012)
Trend-preserving blending of passive and active microwave soil moisture retrievals. Re-
mote Sensing of Environment 123:280 – 297, DOI https://doi.org/10.1016/j.rse.2012.03.
014
Mahrt L, Ek M (1984) The influence of atmospheric stability on potential evaporation.
Journal of Applied Meteorology - J APPL METEOROL 23:222–234, DOI 10.1175/
1520-0450(1984)023〈0222:TIOASO〉2.0.CO;2
Mahrt L, Pan H (1984) A 2-layer model of soil hydrology. Boundary-Layer Meteorology
29:1–20, DOI 10.1007/BF00119116
McColl KA, Vogelzang J, Konings AG, Entekhabi D, Piles M, Stoffelen A (2014) Ex-
tended triple collocation: Estimating errors and correlation coefficients with respect
to an unknown target. Geophysical Research Letters 41(17):6229–6236, DOI 10.1002/
2014GL061322
Mitchell KE, Lohmann D, Houser PR, Wood EF, Schaake JC, Robock A, Cosgrove BA,
Sheffield J, Duan Q, Luo L, Higgins RW, Pinker RT, Tarpley JD, Lettenmaier DP, Mar-
shall CH, Entin JK, Pan M, Shi W, Koren V, Meng J, Ramsay BH, Bailey AA (2004) The
multi-institution north american land data assimilation system (nldas): Utilizing multi-
ple gcip products and partners in a continental distributed hydrological modeling system.
Journal of Geophysical Research: Atmospheres 109(D7), DOI 10.1029/2003JD003823
Nair A, Indu J (2019) Improvement of land surface model simulations over india via data
assimilation of satellite-based soil moisture products. Journal of Hydrology 573:406–421,
DOI 10.1016/j.jhydrol.2019.03.088
Nair AS, Indu J (2016) Enhancing noah land surface model prediction skill over indian
subcontinent by assimilating smops blended soil moisture. Remote Sensing 8(12), DOI
10.3390/rs8120976
Noilhan J, Planton S (1989) A simple parameterization of land surface processes for mete-
orological models. Monthly Weather Review 117:536–, DOI 10.1175/1520-0493(1989)
117〈0536:ASPOLS〉2.0.CO;2
O’Carroll A, Eyre J, Saunders R (2007) Three-way error analysis between aatsr, amsr-e and
in situ sea surface temperature observations. European Space Agency, (Special Publica-
tion) ESA SP
Pan H, Mahrt L (1987) Interaction between soil hydrology and boundary-layer development.
Boundary-Layer Meteorology 38:185–202
Reichle RH, Koster RD (2004) Bias reduction in short records of satellite soil moisture.
Geophysical Research Letters 31(19), DOI 10.1029/2004GL020938
Reichle RH, McLaughlin DB, Entekhabi D (2002) Hydrologic data assimilation with
the ensemble kalman filter. Monthly Weather Review 130(1):103–114, DOI 10.1175/

Data assimilation using EnKF over the Indian domain 23
1520-0493(2002)
Robinson D, Campbell C, Hopmans J, Hornbuckle B, Jones S, Knight R, Ogden F,
Selker J, Wendroth O (2008) Soil moisture measurement for ecological and hydrologi-
cal watershed-scale observatories: A review. Vadose Zone Journal - VADOSE ZONE J 7,
DOI 10.2136/vzj2007.0143
Rodell M, Houser PR, Berg AA, Famiglietti JS (2005) Evaluation of 10 methods for
initializing a land surface model. Journal of Hydrometeorology 6(2):146–155, DOI
10.1175/JHM414.1
Srinivasan G, Robock A, Entin JK, Luo L, Vinnikov KY, Viterbo P (2000) Soil mois-
ture simulations in revised amip models. Journal of Geophysical Research: Atmospheres
105(D21):26635–26644, DOI 10.1029/2000JD900443
Stoffelen A (1998) Toward the true near-surface wind speed: Error modeling and calibration
using triple collocation. Journal of Geophysical Research: Oceans 103(C4):7755–7766,
DOI 10.1029/97JC03180
Walker JP, Houser PR (2001) A methodology for initializing soil moisture in a global climate
model: Assimilation of near-surface soil moisture observations. Journal of Geophysical
Research: Atmospheres 106(D11):11761–11774, DOI 10.1029/2001JD900149
Yin J, Zhan X, Zheng Y, Liu J, Fang L, Hain CR (2015) Enhancing Model Skill by Assimi-
lating SMOPS Blended Soil Moisture Product into Noah Land Surface Model. Journal of
Hydrometeorology 16(2):917–931, DOI 10.1175/JHM-D-14-0070.1
Zhang X, Qiu J, Leng G, Yang Y, Gao Q, Fan Y, Luo J (2018) The potential utility of
satellite soil moisture retrievals for detecting irrigation patterns in china. Water 10(11),
DOI 10.3390/w10111505