Assessment of air pollution around coal mining area: Emphasizing on spatial distributions, seasonal...
8
Atmospheric Pollution Research 5 (2014) 79‐86 © Author(s) 2014. This work is distributed under the Creative Commons Attribution 3.0 License. Atm spheric Pollution Research www.atmospolres.com Assessment of air pollution around coal mining area: Emphasizing on spatial distributions, seasonal variations and heavy metals, using cluster and principal component analysis Bhanu Pandey 1 , Madhoolika Agrawal 1 , Siddharth Singh 2 1 Laboratory of Air Pollution and Global Climate Change, Department of Botany, Banaras Hindu University, Varanasi–221005, India 2 Environmental Management Group, Central Institute of Mining & Fuel Research (CSIR), Barwa road, Dhanbad–826015, India ABSTRACT Jharia Coal field (JCF) in Jharkhand is the richest coal bearing area in India, which contains large quantities of high grade coking coal. The conventional coal fuel cycle is among the most destructive activities on the earth, threatening the health, polluting the air and water, harming the land, and contributing to global warming. The variations in air quality in terms of sulfur dioxide (SO 2 ), nitrogen dioxide (NO 2 ) and particulate matter around JCF were evaluated over the period of 2010 and 2011 at five sites during different seasons. Air pollution index (API), calculated on the basis of suspended particulate matter (SPM), SO 2 and NO 2 concentrations was highest near the coal mining area. The ambient concentrations of heavy metals (in PM 10 ) also showed significant temporal and spatial variations at different sites around coal mining areas. Pollutants dispersion and spatial variations were explained by the use of cluster analysis (CA). Multivariate statistical analyses were adopted including; principal component analysis (PCA) to identify the major sources of air pollutants in the area. The mean concentrations of heavy metals in PM 10 were found in the order of Fe>Cu>Zn>Mn>Pb>Cr>Cd>Ni. The major sources contributing to air pollution in Jharia were coal mining related activities and active mine fires, and secondarily vehicular emissions, while wind–blown dust through unpaved roads also contributed to some extent. Keywords: Jharia Coal Field (JCF), Air Pollution Index (API), Heavy metals, Cluster Analysis (CA), Principal Component Analysis (PCA) Corresponding Author: Madhoolika Agrawal : +91‐941‐53628573 : +91‐542‐2368174 : [email protected] Article History: Received: 17 July 2013 Revised: 12 October 2013 Accepted: 31 October 2013 doi: 10.5094/APR.2014.010 1. Introduction The link between environmental issues and the development is one of the leading issues of the present time. The development progression has customarily been accompanied by rapid increases in energy demand (Kaygusuz, 2012). Different sources of energy, from fossil fuels to nuclear, pollute the environment in different ways and at different levels (Omer, 2008). Presently, energy is largely produced by burning of fossil fuels such as coal, oil and natural gas (Veziroglu and Sahin, 2008). Among all these energy sources, coal is a crucial resource, most abundantly present, and is also the cheapest source of energy (Franco and Diaz, 2009). Coal provides 29.6% of global primary energy needs, generates 42% of the world's electricity, and global coal consumption has increased by 46% during 2001 to 2010 (World Coal Association, 2011). In order to meet the energy requirement, the overall coal production and coal mining have tremendously increased in India, which ranks third among top ten coal producing countries (World Coal Association, 2011). The mining activities contribute to the problem of air pollution directly or indirectly (Baldauf et al., 2001; Collins et al., 2001). The most important emissions during coal mining and through active mine fires are particulate matter (PM), sulfur dioxide (SO 2 ), nitrogen dioxide (NO 2 ) and heavy metals. These air pollutants deteriorate air quality and ultimately affect the human health, flora and fauna in and around coal mining areas (Singh et al., 1991) The activities responsible for pollution in and around coal mine areas are drilling, blasting, overburden loading and unloading, coal loading and unloading, haul roads, transport roads, stock yards, exposed overburden dumps, coal handling plants, exposed pit faces, presence of fire, exhausts from heavy earth moving machinery, crushing of coal to a convenient size in the feeder breaker and workshop (Ghose and Majee, 2000a). On the other hand, burning of coal also leads to increase in concentrations of particulate and gaseous pollutants in the atmosphere causing severe air pollution around coal mining areas (Tripathi and Gautam, 2007). Coal mining is a leading industry causing fatal injuries, and is associated with chronic health problems among miners, such as black lung disease, which causes permanent scarring of the lung tissues (Schins and Borm, 1999). In addition to the miners themselves, communities near coal mines are also adversely affected by mining operations due to the effects of blasting, the collapse of abandoned mines, and the dispersal of dust from coal trucks (Reardon, 1996). Environmental ill–effects of coal mining are potentially very broad including air, soil and water pollution and loss of biota (Moody, 2005). Therefore environmental impact of coal mining areas must be assessed periodically for air quality assessment (Jones, 1993). It is required to optimize the air quality monitoring network using the practical alternative methods such as Principal Components Analysis (PCA) and Cluster Analysis (CA). PCA is a
-
Upload
independent -
Category
Documents
-
view
1 -
download
0
Transcript of Assessment of air pollution around coal mining area: Emphasizing on spatial distributions, seasonal...

Atmospheric Pollution Research 5 (2014) 79‐86
© Author(s) 2014. This work is distributed under the Creative Commons Attribution 3.0 License.
Atm spheric Pollution Research www.atmospolres.com
Assessment of air pollution around coal mining area: Emphasizing on spatial distributions, seasonal variations and heavy metals, using cluster and principal component analysis Bhanu Pandey 1, Madhoolika Agrawal 1, Siddharth Singh 2
1 Laboratory of Air Pollution and Global Climate Change, Department of Botany, Banaras Hindu University, Varanasi–221005, India 2 Environmental Management Group, Central Institute of Mining & Fuel Research (CSIR), Barwa road, Dhanbad–826015, India
ABSTRACT Jharia Coal field (JCF) in Jharkhand is the richest coal bearing area in India, which contains large quantities of high grade coking coal. The conventional coal fuel cycle is among the most destructive activities on the earth, threatening the health, polluting the air and water, harming the land, and contributing to global warming. The variations in air quality in terms of sulfur dioxide (SO2), nitrogen dioxide (NO2) and particulate matter around JCF were evaluated over the period of 2010 and 2011 at five sites during different seasons. Air pollution index (API), calculated on the basis of suspended particulate matter (SPM), SO2 and NO2 concentrations was highest near the coal mining area. The ambient concentrations of heavy metals (in PM10) also showed significant temporal and spatial variations at different sites around coal mining areas. Pollutants dispersion and spatial variations were explained by the use of cluster analysis (CA). Multivariate statistical analyses were adopted including; principal component analysis (PCA) to identify the major sources of air pollutants in the area. The mean concentrations of heavy metals in PM10 were found in the order of Fe>Cu>Zn>Mn>Pb>Cr>Cd>Ni. The major sources contributing to air pollution in Jharia were coal mining related activities and active mine fires, and secondarily vehicular emissions, while wind–blown dust through unpaved roads also contributed to some extent.
Keywords: Jharia Coal Field (JCF), Air Pollution Index (API), Heavy metals, Cluster Analysis (CA), Principal Component Analysis (PCA)
Corresponding Author:
Madhoolika Agrawal : +91‐941‐53628573 : +91‐542‐2368174 : [email protected]
Article History: Received: 17 July 2013 Revised: 12 October 2013 Accepted: 31 October 2013
doi: 10.5094/APR.2014.010
1. Introduction
The link between environmental issues and the development
is one of the leading issues of the present time. The development progression has customarily been accompanied by rapid increases in energy demand (Kaygusuz, 2012). Different sources of energy, from fossil fuels to nuclear, pollute the environment in different ways and at different levels (Omer, 2008). Presently, energy is largely produced by burning of fossil fuels such as coal, oil and natural gas (Veziroglu and Sahin, 2008). Among all these energy sources, coal is a crucial resource, most abundantly present, and is also the cheapest source of energy (Franco and Diaz, 2009). Coal provides 29.6% of global primary energy needs, generates 42% of the world's electricity, and global coal consumption has increased by 46% during 2001 to 2010 (World Coal Association, 2011). In order to meet the energy requirement, the overall coal production and coal mining have tremendously increased in India, which ranks third among top ten coal producing countries (World Coal Association, 2011).
The mining activities contribute to the problem of air pollution
directly or indirectly (Baldauf et al., 2001; Collins et al., 2001). The most important emissions during coal mining and through active mine fires are particulate matter (PM), sulfur dioxide (SO2), nitrogen dioxide (NO2) and heavy metals. These air pollutants deteriorate air quality and ultimately affect the human health, flora and fauna in and around coal mining areas (Singh et al., 1991)
The activities responsible for pollution in and around coal mine areas are drilling, blasting, overburden loading and unloading, coal loading and unloading, haul roads, transport roads, stock yards, exposed overburden dumps, coal handling plants, exposed pit faces, presence of fire, exhausts from heavy earth moving machinery, crushing of coal to a convenient size in the feeder breaker and workshop (Ghose and Majee, 2000a). On the other hand, burning of coal also leads to increase in concentrations of particulate and gaseous pollutants in the atmosphere causing severe air pollution around coal mining areas (Tripathi and Gautam, 2007).
Coal mining is a leading industry causing fatal injuries, and is
associated with chronic health problems among miners, such as black lung disease, which causes permanent scarring of the lung tissues (Schins and Borm, 1999). In addition to the miners themselves, communities near coal mines are also adversely affected by mining operations due to the effects of blasting, the collapse of abandoned mines, and the dispersal of dust from coal trucks (Reardon, 1996). Environmental ill–effects of coal mining are potentially very broad including air, soil and water pollution and loss of biota (Moody, 2005). Therefore environmental impact of coal mining areas must be assessed periodically for air quality assessment (Jones, 1993).
It is required to optimize the air quality monitoring network
using the practical alternative methods such as Principal Components Analysis (PCA) and Cluster Analysis (CA). PCA is a
Pandey et al. – Atmospheric Pollution Research (APR) 80
multivariate statistical technique that creates new variables, commonly known as principal components (PCs) that are orthogonal and uncorrelated to each other. These PCs are linear combinations of the original variables (Wang and Xiao, 2004). To simplify the influence of each original variable in the PCs, a rotational algorithm such as Varimax rotation is usually applied to obtain the rotated factor loadings that stand for the contribution of each variable to a specific PC (Pires et al., 2008). On the other hand, CA is a categorization method used to separate the data in classes or clusters. Its main aim is to create a set of clusters such that objects in the same cluster are similar to each other and different from objects located in further clusters (Manly, 1994). This classification method can additionally be helpful for data reduction. In earlier studies, Gramsch et al. (2006) used the PCA and CA to determine the seasonal trends and spatial distribution of PM10 and O3 in Santiago, Chile. Shah and Shaheen (2008) employed these techniques to identify the major sources of airborne trace metals in Islamabad, Pakistan.
The present study was conducted over a period of two years
to quantify the spatial and seasonal variations in air pollutant concentrations around coal mining areas of Jharia coalfield, situated in Dhanbad district of Jharkhand state in India. To identify the contribution of different activities in the mining area on air
pollutant concentrations, PCA was performed. Heavy metal concentrations in PM10 were also estimated to understand their variations related with different mining activities.
2. Materials and Methods 2.1. Study area
The present study was carried out in Jharia coalfield (JCF),
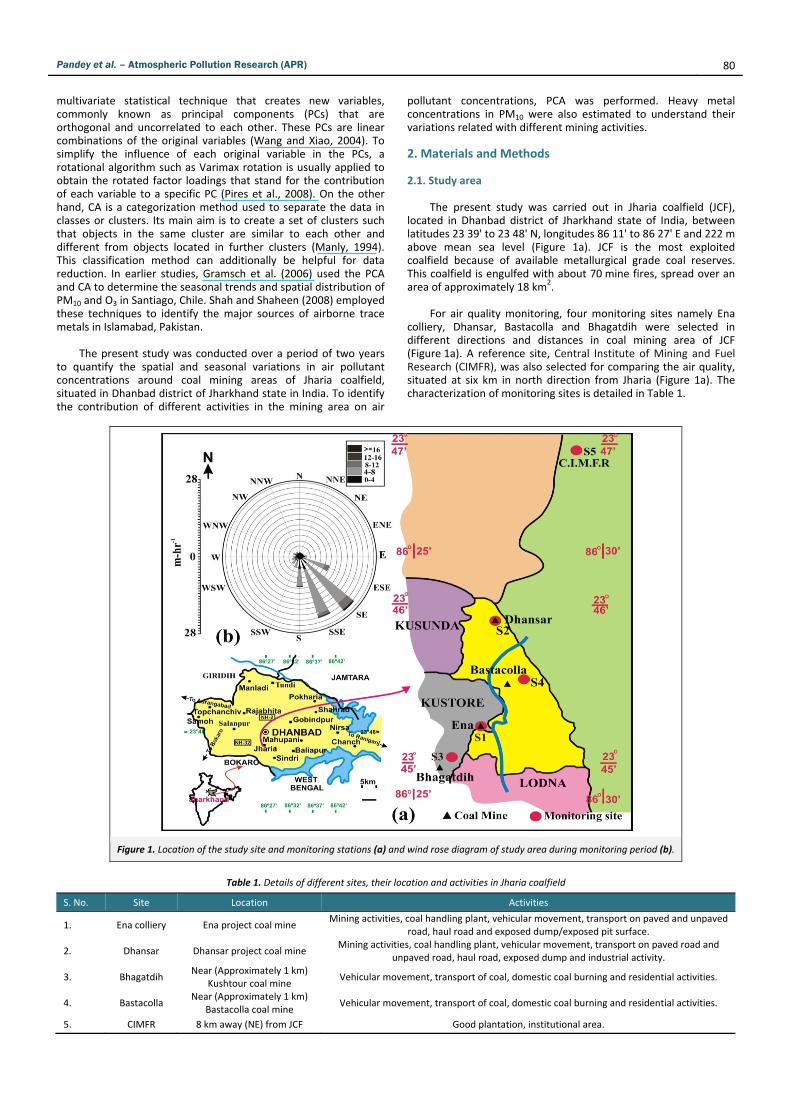
located in Dhanbad district of Jharkhand state of India, between latitudes 23 39' to 23 48' N, longitudes 86 11' to 86 27' E and 222 m above mean sea level (Figure 1a). JCF is the most exploited coalfield because of available metallurgical grade coal reserves. This coalfield is engulfed with about 70 mine fires, spread over an area of approximately 18 km2.
For air quality monitoring, four monitoring sites namely Ena
colliery, Dhansar, Bastacolla and Bhagatdih were selected in different directions and distances in coal mining area of JCF (Figure 1a). A reference site, Central Institute of Mining and Fuel Research (CIMFR), was also selected for comparing the air quality, situated at six km in north direction from Jharia (Figure 1a). The characterization of monitoring sites is detailed in Table 1.
Figure 1. Location of the study site and monitoring stations (a) and wind rose diagram of study area during monitoring period (b).
Table 1. Details of different sites, their location and activities in Jharia coalfield
S. No. Site Location Activities
1. Ena colliery Ena project coal mine Mining activities, coal handling plant, vehicular movement, transport on paved and unpaved
road, haul road and exposed dump/exposed pit surface.
2. Dhansar Dhansar project coal mine Mining activities, coal handling plant, vehicular movement, transport on paved road and
unpaved road, haul road, exposed dump and industrial activity.
3. Bhagatdih Near (Approximately 1 km)
Kushtour coal mine Vehicular movement, transport of coal, domestic coal burning and residential activities.
4. Bastacolla Near (Approximately 1 km)
Bastacolla coal mine Vehicular movement, transport of coal, domestic coal burning and residential activities.
5. CIMFR 8 km away (NE) from JCF Good plantation, institutional area.
Pandey et al. – Atmospheric Pollution Research (APR) 81
The region experiences sub–tropical climate. It is cool during
winter season from November to February. The month of May has been the hottest. It remains hot until the monsoon outbreaks, towards the middle of June. With the setting of rains, the temperature falls and humidity rises. The rainy season continues from July to October. The dominant wind directions in the area are SE/SSE with low calm conditions (5.3%). Dominant wind speed generally ranges between 4 to 6 m h−1 (Figure 1b). The variation of meteorological parameters in the area is given in the Supporting Material (SM) (Figure S1).
2.2. Monitoring of particulate and gaseous pollutants
The air quality monitoring for SPM, SO2 and NO2 was done at
different study sites for two consecutive years from 2010–2011, while PM2.5 and PM1.0 were monitored only during 2011. The gaseous pollutants were analyzed through wet chemistry method using portable gas samplers (Precision Instruments Ltd., India) once in a fortnight at each site for eight hours from 09:00 to 17:00 h. To determine the SO2 concentration in ambient air, sample was collected by drawing air at flow rate of 1.2 L min
–1 through absorbing solution of 0.04 M potassium tetra chloro‐mercurate (K2HgCl4). A dichloro sulphitomercurate complex thus formed and reacted with sulphamic acid (0.6%), pararosaniline and formaldehyde (0.2%) to form intensely colored pararosaniline methyl sulphonic acid. The absorbance of the solution was measured at 560 nm using UV–VIS spectrophotometer (Model 2450, Shimadzu Corporation, Japan) by following the improved method of West and Gaeke (1956).
For NO2, sample was collected by drawing air at a similar flow
rate through a mixture of 0.4% sodium hydroxide (NaOH) and 0.1% sodium arsenite (NaAsO2–). The concentration of nitrite ion (NO2
–) produced during sampling was determined colorimetrically by reacting the nitrite ion with phosphoric acid, sulfanilamide, and N–(1–naphthyl)–ethylenediamine di–hydrochloride (NEDA) and measuring the absorbance of highly colored azo–dye at 540 nm using a UV–VIS spectrophotometer (Model 2450, Shimadzu Corporation, Japan) by the method described and modified by Jacobs and Hochheiser (1958).
The SPM was collected for eight hour from 09:00 to 17:00 h by
drawing air at a flow rate of 1.1 m3 min–1 through Whatman glass fiber filter (20.4 cm × 25.4 cm) using a high volume sampler (Model APM 415, Envirotech, India). The difference of weight of filter before and after sampling was used to calculate PM10 concentration and SPM concentration was calculated by adding the concentration of particulate collected through hopper. Eight hourly monitoring of PM1.0 and PM2.5 was also done by portable aerosol spectrometer (Model 1.109, Grimm technology Inc., USA).
The air pollution index (API) is a measure of the ratio of the
pollutant concentration in ambient air to the national standards of the pollutants. API was calculated by the formula given by Rao and Rao (1989).
13 100 (1)
where, SSPM, SSO2 and SNO2 represent the ambient air quality standards (CPCB, 2009) for SPM, SO2 and NO2.
2.3. Metal analyses
For the analysis of heavy metals in PM10, glass fiber filter
paper was digested in HNO3 and HClO4 solution at a ratio of 9:4 according to the methodology by Gaidajis (2003). The extracted solution was filtered and washed by double distilled water and
stored in inert glass until analyzed by using atomic absorption spectrophotometer (Model AAnalyst 800, Perkin–Elmer, USA). Heavy metal concentrations were quantified from twelve replicates filter papers representing different months in a year and the data were shown as annual average.
2.4. Statistical analyses
Obtained data were processed for statistical analyses
including three–way multivariate analysis of variance for examining the effects of site, season, year and their interactions on different parameters. In order to identify sources of air pollutants and heavy metals in PM10 at study sites, PCA was conducted by the Varimax rotated factor matrix method, based on the orthogonal rotation criterion with Kaiser normalization. CA on API was utilized to group the sites based on the similarity between them. Rescaled distance cluster combine (RDCC) was employed to compute the distance among monitoring stations and the clustering method between–group linkage based on the Z–scores standardized transformation. All the statistical analyses were performed by using IBM SPSS Statistics 16 software and all the presentation was done using SigmaPlot 11.0 (Systat Software, Inc) software.
2.5. Quality control analysis
The wet chemistry methods for SO2 and NO2 monitoring were
standardized with automatic SO2 photometric analyzer (Model 319, Kimoto, Japan) and chemiluminescence NO/NOX analyzer (Model 200E, Teledyne Instruments, U.S.), respectively. Precision and accuracy of heavy metal analysis was assured through repeated analysis of samples against National Institute of Standards and Technology, Standard Reference Material (SRM 1570) for all the heavy metals. The results were found within ±2% of the certified values. Quality control measures were taken to assess contamination and reliability of data. Blank and drift standards (Sisco Research Laboratories Pvt. Ltd., India) were run after five determination to calibrate the atomic absorption spectrophotometer. The coefficients of variation of replicate analysis were determined for different determinations for precision of analysis and variations below 10% were considered correct.
3. Results and Discussion
Assessment of air quality monitoring data showed that all
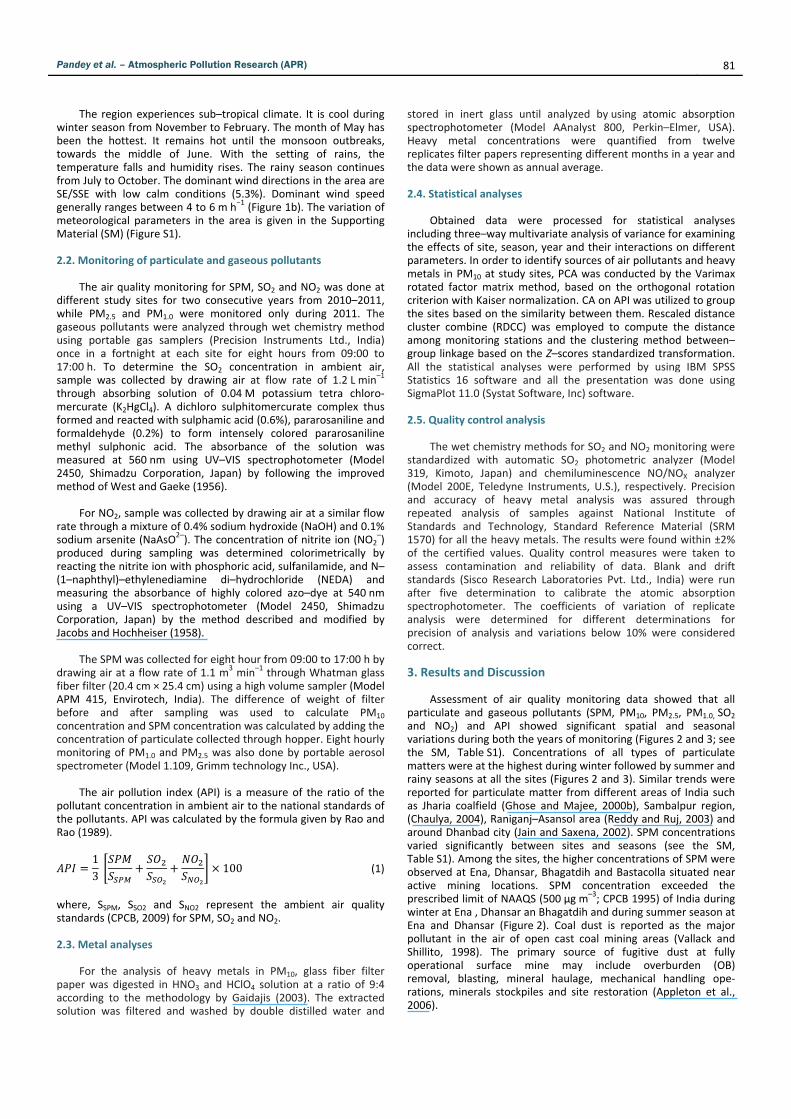
particulate and gaseous pollutants (SPM, PM10, PM2.5, PM1.0, SO2 and NO2) and API showed significant spatial and seasonal variations during both the years of monitoring (Figures 2 and 3; see the SM, Table S1). Concentrations of all types of particulate matters were at the highest during winter followed by summer and rainy seasons at all the sites (Figures 2 and 3). Similar trends were reported for particulate matter from different areas of India such as Jharia coalfield (Ghose and Majee, 2000b), Sambalpur region, (Chaulya, 2004), Raniganj–Asansol area (Reddy and Ruj, 2003) and around Dhanbad city (Jain and Saxena, 2002). SPM concentrations varied significantly between sites and seasons (see the SM, Table S1). Among the sites, the higher concentrations of SPM were observed at Ena, Dhansar, Bhagatdih and Bastacolla situated near active mining locations. SPM concentration exceeded the prescribed limit of NAAQS (500 µg m–3; CPCB 1995) of India during winter at Ena , Dhansar an Bhagatdih and during summer season at Ena and Dhansar (Figure 2). Coal dust is reported as the major pollutant in the air of open cast coal mining areas (Vallack and Shillito, 1998). The primary source of fugitive dust at fully operational surface mine may include overburden (OB) removal, blasting, mineral haulage, mechanical handling ope‐rations, minerals stockpiles and site restoration (Appleton et al., 2006).
Pandey et al. – Atmospheric Pollution Research (APR) 82
Figure 2. Seasonal variations in SPM and PM10 during 2010 to 2011 and PM2.5 and PM1.0 during 2011 (Mean±SE). Bars with different letters between sites show significant difference (p<0.05) at different sites and at a specific season.
Figure 3. Seasonal variations in gaseous pollutant (SO2 and NO2) concentrations and air pollution index (API) at different sites during2010 to 2011 (Mean±SE). Bars with different letters between sites show significant difference (p<0.05) at a specific season.
Pandey et al. – Atmospheric Pollution Research (APR) 83
The concentrations of PM10 at Ena, Dhansar, Bhagatdih and
Bastacolla during winter of 2010 were respectively 271.9, 233.9, 213.4 and 196.1 µg m–3 and were 2.7, 2.3, 2.1 and 2 times higher than NAAQS (100 µg m
–3; CPCB 2009) guidelines of India (Figure 2). During summer 2010, PM10 concentrations were 1.9, 1.9, 1.7 and 1.6 times higher than NAAQS at respective sites. During rainy season only Ena had slightly higher concentration of PM10 (135.9 µg m–3) than NAAQS. The trends of variation in PM10 con‐centrations were more or less similar during 2011 (Figure 2). PM10 concentration varied significantly due to season, site and season × site interaction (see the SM, Table S1). The coarse particles (PM10) are formed due to mechanical disruption (e.g. crushing, grinding and abrasion of surfaces), evaporation of sprays and re–suspension of dusts (Cole and Zapert, 1995) near coal mining areas, hence proportions of coarse particles were high in the coal mining region.
The concentrations of PM2.5 at Ena, Dhansar, Bhagatdih and
Bastacolla during winter of 2010 were 1.9, 1.8, 1.6 and 1.6 times higher than NAAQS (60 µg m
–3; CPCB 2009) guidelines of India (Figure 2). During summer, PM2.5 concentrations were 1.6, 1.6, 1.5 and 1.5 times higher than NAAQS at respective sites (Figure 2). During rainy season only Ena had slightly higher concentration of PM2.5 than NAAQS. PM1.0 concentration was recorded the highest at Ena followed by Dhansar, Bhagatdih, Bastacolla and the least at CIMFR (Figure 2). PM2.5 and PM1.0 concentrations showed significant variations due to season and site (see the SM, Table S1). Fine particles (PM2.5) and ultrafine particles (PM1.0) are formed by chemical reaction; nucleation, condensation, coagulation, evapo‐ration of fog and cloud droplets, in which gases also dissolve and react (Wilson and Suh, 1997). Combustion of coal is a major source for fine and ultrafine particles and the active mine fires present in JCF play a major role in generation of PM2.5 and PM1.0 at all the four monitoring sites around the coal mining area. Lowest concentration of particulates at CIMFR is due to the fact that the site is far away from the mining areas. Very small difference in the concentration of PM1.0 during summer and winter season (Figure 2) may be attributed to the fact that PM1.0 remains airborne through nonlinear processes for days–to–weeks during monsoon months as washout processes are least effective for cleansing these particles.
Pollutant dispersion mechanisms suggest that the site
topography and the meteorological conditions strongly influence the concentrations of particulates (Charron and Harrison, 2005). Higher concentrations of particulate matter during winter can be attributed to low temperature (see the SM, Figure S1) and low wind speed, which lead to lower mixing height and poor dispersion conditions. During summer season, particulate matter concen‐trations were found to be lower than winter due to enhanced dispersion caused by high wind speed. The lowest concentration was observed during monsoon season, which may be attributed to washout by rainfall and also due to higher relative humidity (see the SM, Figure S1), which reduces re–suspension of dust.
The concentrations of SO2 were high around coal mine areas
compared to CIMFR in all the season and in both years (Figure 3). Three–way ANOVA analysis showed that variations in SO2 concen‐trations were significant between the sites and seasons, yearly variations were, however, not significant (see the SM, Table S1). The seasonal trend of SO2 concentration (winter>summer>rainy) can be explained by the chemistry of SO2. It is directly emitted (fossil fuel combustion, industrial processes) and then lost from the atmosphere through dry deposition at the surfaces or oxidation to sulfate (Pio and Feliciano, 1996). Oxidation of SO2 in the atmosphere can occur homogeneously in the gas phase and aqueous phase (raindrops), heterogeneously on the surfaces of particles or combinations of all three (Finlayson–Pitts and Pitts, 1986). Rates of oxidation of SO2 were suggested to be higher in summer than in winter, while dry deposition velocity was found to be higher in winter than summer (Pio and Feliciano, 1996). Wind speed, air masses and height of mixing layer also govern SO2
concentration (Pio and Feliciano, 1996). The concentration of SO2 at Ena, Dhansar, Bhagatdih and Bastacolla exceeded the prescribed limit of NAAQS India (80 µg m–3) during winter in 2011. The lowest concentration of SO2 in rainy season may be attributed to washout by rain as rainfall was about more than 90% during rainy season (see the SM, Figure S1). High SO2 at Ena and Dhansar sites may be ascribed to active mine fires near Ena colliery and hard–coke industries in the Dhansar region. Because of the easy availability of coal as the cheapest energy source (World Coal Association, 2011), frequent use of coal for domestic purposes is also the reason of high SO2 concentration in the area.
Concentration of NO2 was below NAAQS (80 µg m–3)
guidelines of India during all the seasons and at all the sites (Figure 3). The trend of mean concentration of NO2 during winter season was Ena>Dhansar>Bhagatdih>Bastacolla>CIMFR (Figure 3). However, in summer and rainy seasons, the trends were Dhansar>Ena>Bhagatdih>Bastacolla>CIMFR during 2010. Mean concentrations of NO2 showed more or less similar spatial and seasonal variations in the year 2011 (Figure 3). NO2 concentrations showed significant variations due to season and site (see the SM, Table S1). Anthropogenic emissions of NO2 in the area may be mainly due to combustion processes, including vehicle exhaust, coal, oil and natural gas, with some emissions during blasting. The seasonal variations in NO2 concentrations are mainly determined by the varying day length over the year. In absence of sunlight, NO2 has a longer lifetime in the atmosphere (Li et al., 2008), which explains the reason of higher NO2 during winter. There is consid‐erably less mixing in the lower air boundary during winter, which leads to elevated levels of NO2 during this season (Atkins and Lee, 1995). Higher concentrations of NO2 at four sites around mining area are also attributed to presence of active mine fires, high load of vehicular movement for coal transport and other mining activities.
API showed significant seasonal and spatial variations (see the
SM, Table S1). The high API values at sites near coal mining areas are due to high concentrations of nearly all the air pollutants monitored (Figure 3). The increase in API value was mainly due to increase in SPM concentration. During winter, sites in or near to coal mining areas (Ena, Dhansar, Bhagatdih and Bastacolla) showed heavy pollution (index value was 76–100), while during summer Ena and Dhansar sites were heavily polluted (index value was 76–100) (Figure 3, Table S2). Bhagatdih and Bastacolla were mode‐rately polluted during summer and rainy seasons. Light air pollution (index value was 26–50) was observed at CIMFR during winter season (see the SM, Table S2).
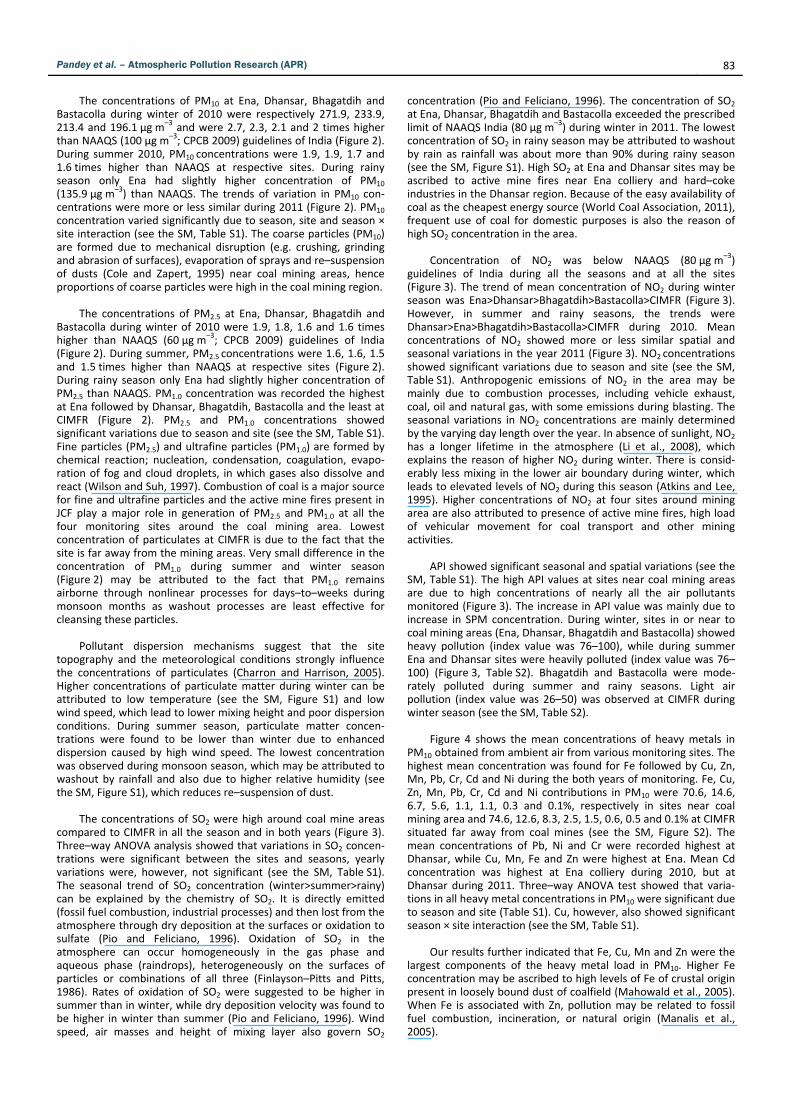
Figure 4 shows the mean concentrations of heavy metals in
PM10 obtained from ambient air from various monitoring sites. The highest mean concentration was found for Fe followed by Cu, Zn, Mn, Pb, Cr, Cd and Ni during the both years of monitoring. Fe, Cu, Zn, Mn, Pb, Cr, Cd and Ni contributions in PM10 were 70.6, 14.6, 6.7, 5.6, 1.1, 1.1, 0.3 and 0.1%, respectively in sites near coal mining area and 74.6, 12.6, 8.3, 2.5, 1.5, 0.6, 0.5 and 0.1% at CIMFR situated far away from coal mines (see the SM, Figure S2). The mean concentrations of Pb, Ni and Cr were recorded highest at Dhansar, while Cu, Mn, Fe and Zn were highest at Ena. Mean Cd concentration was highest at Ena colliery during 2010, but at Dhansar during 2011. Three–way ANOVA test showed that varia‐tions in all heavy metal concentrations in PM10 were significant due to season and site (Table S1). Cu, however, also showed significant season × site interaction (see the SM, Table S1).
Our results further indicated that Fe, Cu, Mn and Zn were the
largest components of the heavy metal load in PM10. Higher Fe concentration may be ascribed to high levels of Fe of crustal origin present in loosely bound dust of coalfield (Mahowald et al., 2005). When Fe is associated with Zn, pollution may be related to fossil fuel combustion, incineration, or natural origin (Manalis et al., 2005).
Pandey et al. – Atmospheric Pollution Research (APR) 84
Figure 4. Annual variations in heavy metal concentrations at different sites during 2010 to 2011 (Mean±SE). Bars with different letters between sites show significant difference (p<0.05) at a specific year.
Use of leaded gasoline is not continuing, but re–suspension of
Pb rich dust due to vehicle movement increases Pb concentration in ambient air. Mining activities itself are responsible for Pb emissions into atmosphere as it occurs in the earth crust (Cheng and Hu, 2010). As the residence time and transport of atmospheric Pb is linked to the characteristics of aerosols (U.S. ATSDR, 2005), particles with aerodynamic diameters of >2.5 μm settle out of the atmosphere fairly rapidly and are deposited relatively close to emission sources, hence low concentration of Pb was recorded at site away from mining area. Only natural windblown dust and vehicles are the sources of Pb at CIMFR site.
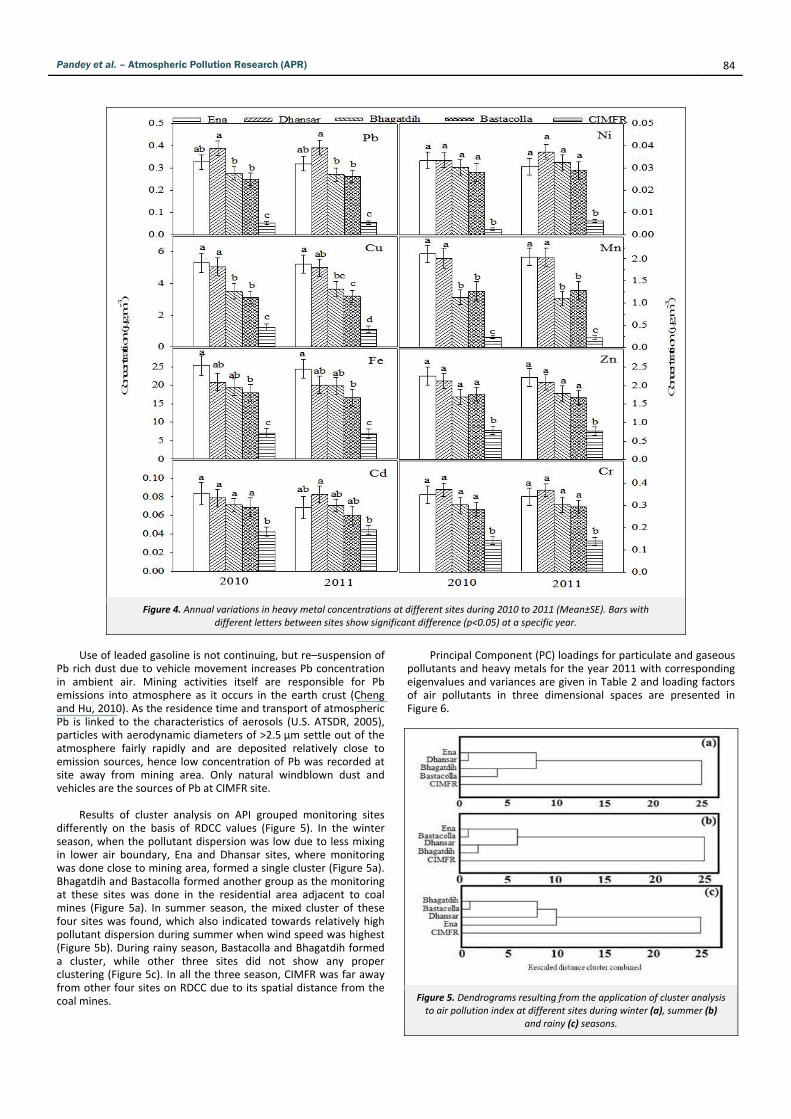
Results of cluster analysis on API grouped monitoring sites
differently on the basis of RDCC values (Figure 5). In the winter season, when the pollutant dispersion was low due to less mixing in lower air boundary, Ena and Dhansar sites, where monitoring was done close to mining area, formed a single cluster (Figure 5a). Bhagatdih and Bastacolla formed another group as the monitoring at these sites was done in the residential area adjacent to coal mines (Figure 5a). In summer season, the mixed cluster of these four sites was found, which also indicated towards relatively high pollutant dispersion during summer when wind speed was highest (Figure 5b). During rainy season, Bastacolla and Bhagatdih formed a cluster, while other three sites did not show any proper clustering (Figure 5c). In all the three season, CIMFR was far away from other four sites on RDCC due to its spatial distance from the coal mines.
Principal Component (PC) loadings for particulate and gaseous pollutants and heavy metals for the year 2011 with corresponding eigenvalues and variances are given in Table 2 and loading factors of air pollutants in three dimensional spaces are presented in Figure 6.
Figure 5. Dendrograms resulting from the application of cluster analysis to air pollution index at different sites during winter (a), summer (b)
and rainy (c) seasons.

Pandey et al. – Atmospheric Pollution Research (APR) 85
Figure 6. Three‐dimensional factors loading of air pollutants in JCF during 2011.
Three PCs with eigenvalues greater than 1.0 were extracted
with 79.1% cumulative variance for coal mining areas. The rela‐tionships between the principal component and the chemical compounds are indicated by the factor loadings and related to the source emission composition. All the source categories for the coal mining area have distinct characteristics, and hence assigned on the basis of marker species. High loadings for SPM, PM10, SO2, PM2.5, PM1.0, Ni and Cu in PC1 indicate coal mining (SPM, PM10, PM2.5 and PM1.0), coal burning and active mine fires (SO2, Ni and Cu) as major sources. Most of the variance of PM10, SO2, PM1.0, Ni and Cu appeared in PC1, providing evidence for mining operations, coal burning and active mine fires. The maximum percent variance (53.71%) for this PC suggests that these operations are the major sources of pollutants in this area. In PC2, the direct vehicular sources can be identified by high loadings of NO2, Pb, Cd and Cr. Pb and NO2 are good vehicular markers (Dubey et al., 2012). Cd and Cr have significant contributions from crude–oil combustion and metallurgical units housed in the industrial areas and vehicular emissions (Tasdemir et al., 2006). One of the most important sources of Cd, Cr and Pb in the urban environment is road traffic. There is a small distance in position of Pb in three dimensional space from the group having Cd, Cr and NO2, suggesting that Pb has more than one significant source in the coal mining area. The PC3 with 7.54% total variance shows highest loadings for Fe, Mn and Zn. This revealed close association of Fe and Mn, mainly contributed by earth crust/wind–blown soil/coal fly ash (Quiterio et al., 2004).
Table 2. Rotated principal components loading for gaseous and particulate
pollutants in Jharia coalfield
PC1 PC2 PC3
SPM 0.589 –0.159 0.636
SO2 0.662 0.413 –0.046
NO2 0.095 0.917 0.16
PM10 0.776 0.327 0.378
PM2.5 0.697 0.267 0.512
PM1.0 0.65 0.21 0.484
Pb 0.363 0.834 0.312
Ni 0.77 0.141 0.205
Cu 0.726 0.122 0.517
Mn 0.235 0.182 0.77
Fe 0.257 0.139 0.846
Zn 0.183 0.175 0.865
Cd 0.162 0.91 –0.006
Cr 0.211 0.909 0.177
Eigen value 7.52 2.49 1.06
% Variance 53.71% 17.85% 7.54%
Cumulative 53.71% 71.85% 79.1%
4. Conclusion Assessment of air quality monitoring data around JCF showed
significant spatial and seasonal variations in concentrations of PM10, PM2.5, PM1.0, SO2, NO2 and heavy metals in PM10 depending on pollutant emission or formation and pollutant dispersion mechanisms, which are also influenced by meteorological conditions and distance of the site from sources. Wind speed, relative humidity, temperature and rainfall were the governing parameters of seasonal variations in air pollutant concentrations in the area. Sites near coal mining areas resided under heavily polluted category on API. CA showed that pollution behavior of sites changed in different seasons. PCA recognized that coal mining and active mine fires (57.71% variance) are the main contributors of air pollutants in the study area. Vehicular emissions (17.85% variance) and windblown dust through unpaved roads and over burdens (7.54% variance) are the other causes of air quality deterioration around the coal mining areas. Pollution prevention advanced mining technology and effective strategies as well as public awareness and education may be reasonable and useful ways to reduce hazardous air pollutant emissions around coal mining areas. The outcomes of this study may provide a comprehensive catalogue for outlining a proper scheme for required mitigative/preventive measures. Acknowledgments
We thank, Head, Department of Botany, Banaras Hindu
University and Director, Central Institute of Mining and Fuel Research, Dhanbad for providing all the necessary laboratory facilities during the research work. Authors are also grateful to Ministry of Coal, Government of India, New Delhi for financial assistance (EE/39).
Supporting Material Available
Monthly rainfall, relative humidity and temperature during
2010 and 2011 in the study area. (Figure S1), Percentage metal contribution in PM10 in coal mining region (a) and at CIMFR (b) (Figure S2), F values and significance levels for various air pollutants and heavy metals as obtained by three way ANOVA test (Table S1), Air pollution index and quality remarks (Table S2). This information is available free of charge via the Internet at http://www.atmospolres.com
References
Appleton, T.J., Kingman, S.W., Lowndes, I.S., Silvester, S.A., 2006. The
development of a modelling strategy for the simulation of fugitive dust
emissions from in–pit quarrying activities: A UK case study.
International Journal of Mining, Reclamation and Environment 20, 57–82.
Atkins, D.H.F., Lee, D.S., 1995. Spatial and temporal variation of rural
nitrogen dioxide concentrations across the United Kingdom. Atmospheric Environment 29, 223–239.
Baldauf, R.W., Lane, D.D., Marote, G.A., 2001. Ambient air quality
monitoring network design for assessing human health impacts from exposures to airborne contaminants. Environmental Monitoring and
Assessment 66, 63–76.
Charron, A., Harrison, R.M., 2005. Fine (PM2.5) and coarse (PM2.5–10) particulate matter on a heavily trafficked London highway: Sources and
processes. Environmental Science & Technology 39, 7768–7776.
Chaulya, S.K., 2004. Assessment and management of air quality for an opencast coal mining area. Journal of Environmental Management 70,
1–14.
Cheng, H.F., Hu, Y.A., 2010. Lead (Pb) isotopic fingerprinting and its applications in lead pollution studies in China: A review. Environmental
Pollution 158, 1134–1146.
Pandey et al. – Atmospheric Pollution Research (APR) 86
Cole, C.F., Zapert J.G., 1995. Air Quality Dispersion Model Validation at
Three Stone Quarries. National Stone Association, Washington, D.C.,
14884 pages.
Collins, M.J., Williams, P.L., McIntosh, D.L., 2001. Ambient air quality at the
site of a former manufactured gas plant. Environmental Monitoring
and Assessment 68, 137–152.
CPCB (Central Pollution Control Board), 2009. National Ambient Air Quality
Standards (NAAQS), Gazette Notification, New Delhi.
CPCB (Central Pollution Control Board) , 1995. National Ambient Air Quality Standards (NAAQS), Gazette Notification, New Delhi.
Dubey, B., Pal, A.K., Singh, G., 2012. Trace metal composition of airborne
particulate matter in the coal mining and non–mining areas of Dhanbad Region, Jharkhand, India. Atmospheric Pollution Research 3,
238–246.
Franco, A., Diaz, A.R., 2009. The future challenges for "clean coal technologies": Joining efficiency increase and pollutant emission
control. Energy 34, 348–354.
Finlayson–Pitts, B.J., Pitts, J.N.Jr., 1986. Atmospheric Chemistry: Fundamentals and Experimental Techniques, Wiley, New York, pp. 100‐
103.
Gaidajis, G., 2003. Ambient concentrations of total suspended particulate matter and its elemental constituents at the wider area of the mining
facilities of TVX Hellas in Chalkidiki, Greece. Journal of Environmental
Science and Health Part A–Toxic/Hazardous Substances & Environmental Engineering 38, 2509–2520.
Ghose, M.K., Majee, S.R., 2000a. Assessment of dust generation due to
opencast coal mining – an Indian case study. Environmental Monitoring and Assessment 61, 255–263.
Ghose, M.K., Majee, S.R., 2000b. Assessment of the impact on the air
environment due to opencast coal mining – an Indian case study. Atmospheric Environment 34, 2791–2796.
Gramsch, E., Cereceda–Balic, F., Oyola, P., von Baer, D., 2006. Examination
of pollution trends in Santiago de Chile with cluster analysis of PM10
and ozone data. Atmospheric Environment 40, 5464–5475.
Jacobs, M.B., Hochheiser, S., 1958. Continuous sampling and
ultramicrodetermination of nitrogen dioxide in air. Analytical Chemistry 30, 426–28.
Jain, M.K., Saxena, N.C., 2002. Air quality assessment along Dhanbad–Jharia
road. Environmental Monitoring and Assessment 79, 239–250.
Jones, T., 1993. The role of environmental–impact assessment in coal
production and utilization. Natural Resources Forum 17, 170–180.
Kaygusuz, K., 2012. Energy for sustainable development: A case of developing countries. Renewable & Sustainable Energy Reviews 16,
1116–1126.
Li, S.P., Matthews, J., Sinha, A., 2008. Atmospheric hydroxyl radical production from electronically excited NO2 and H2O. Science 319,
1657–1660.
Mahowald, N.M., Baker, A.R., Bergametti, G., Brooks, N., Duce, R.A., Jickells, T.D., Kubilay, N., Prospero, J.M., Tegen, I., 2005. Atmospheric
global dust cycle and iron inputs to the ocean. Global Biogeochemical
Cycles 19, art. no. GB4025.
Manalis, N., Grivas, G., Protonotarios, V., Moutsatsou, A., Samara, C.,
Chaloulakou, A., 2005. Toxic metal content of particulate matter
(PM10), within the Greater Area of Athens. Chemosphere 60, 557–566.
Manly, B.F.J., 1994. Multivariate Statistical Methods: A Primer, Chapman
and Hall/CRC, London, pp. 129–133.
Moody, R., 2005. The Risks We Run: Mining, Communities and Political Risk
Insurance, International Books, Utrecht, the Netherlands, pp. 51‐63.
Omer, A.M., 2008. Energy, environment and sustainable development. Renewable & Sustainable Energy Reviews 12, 2265–2300.
Pio, C.A., Feliciano, M.S., 1996. Dry deposition of ozone and sulphur dioxide
over low vegetation in moderate southern European weather conditions: Measurements and modeling. Physics and Chemistry of the
Earth 21, 373–377.
Pires, J.C.M., Sousa, S.I.V., Pereira, M.C., Alvim–Ferraz, M.C.M., Martins, F.G., 2008. Management of air quality monitoring using principal
component and cluster analysis – Part I: SO2 and PM10. Atmospheric
Environment 42, 1249–1260.
Quiterio, S.L., da Silva, C.R.S., Arbilla, G., Escaleira, V., 2004. Metals in
airborne particulate matter in the industrial district of Santa Cruz, Rio
de Janeiro, in an annual period. Atmospheric Environment 38, 321–331.
Rao, M.N., Rao, H.V.N., 1989. Air Pollution Indices: Air Pollution, Tata
McGraw–Hill Publishing Ltd., New Delhi, pp. 271–272.
Reardon, J., 1996. The effect of the united mine workers of America on the probability of severe injury in underground coal mines. Journal of Labor
Research 17, 239–252.
Reddy, G.S., Ruj, B., 2003. Ambient air quality status in Raniganj–Asansol area, India. Environmental Monitoring and Assessment 89, 153–163.
Schins, R.P.F., Borm, P.J.A., 1999. Mechanisms and mediators in coal dust
induced toxicity: A review. Annals of Occupational Hygiene 43, 7–33.
Shah, M.H., Shaheen, N., 2008. Annual and seasonal variations of trace
metals in atmospheric suspended particulate matter in Islamabad,
Pakistan. Water Air and Soil Pollution 190, 13–25.
Singh, J.S., Singh, K.P., Agrawal, M., 1991. Environmental degradation of the
Obra Renukoot–Singrauli Area, India, and its impact on natural and
derived ecosystems. The Environmentalist 11, 171–180.
Tasdemir, Y., Kural, C., Cindoruk, S.S., Vardar, N., 2006. Assessment of trace
element concentrations and their estimated dry deposition fluxes in an
urban atmosphere. Atmospheric Research 81, 17–35.
Tripathi, A. K., Gautam, M., 2007. Biochemical parameter of plants as
indicators of air pollution. Journal of Environmental Biology 28, 127–
132.
U.S. ATSDR (U.S. Agency for Toxic Substances and Disease Registry), 2005.
Toxicological Profile for Lead, U.S. Department of Health and Human
Services, Public Health Service, Atlanta, U.S.A, 582 pages.
Vallack, H.W., Shillito, D.E., 1998. Suggested guidelines for deposited
ambient dust. Atmospheric Environment 32, 2737–2744.
Veziroglu, T.N., Sahin, S., 2008. 21st Century’s energy: Hydrogen energy system. Energy Conversion and Management 49, 1820–1831.
Wang, S.W., Xiao, F., 2004. AHU sensor fault diagnosis using principal
component analysis method. Energy and Buildings 36, 147–160.
West, W., Gaeke, G. C., 1956. Fixation of sulphur dioxide on
disulfitomercurate II and subsequent colorimetric estimation.
Analytical Chemistry 28, 1816–1819.
Wilson, W.E., Suh, H.H., 1997. Fine particles and coarse particles:
Concentration relationships relevant to epidemiologic studies. Journal
of the Air & Waste Management Association 47, 1238–1249.
World Coal Association, 2011. Coal Facts 2011,
http://www.worldcoal.org/resources/coal–statistics/, accessed in April
2013.


![[Peritoneal pseudomyxoma: An overview emphasizing pathological assessment and therapeutic strategies].](https://static.fdokumen.com/doc/165x107/6331d121b6829c19b80bab58/peritoneal-pseudomyxoma-an-overview-emphasizing-pathological-assessment-and-therapeutic.jpg)