Assessment and Outcomes of HealthPartners 10,000 Steps(R) Program in an Academic Work Site
10
Health Promotion Practice Month XXXX Vol. XX, No. X, xx-xx DOI: 10.1177/1524839908330745 ©2009 Society for Public Health Education Authors’ Note: All correspondence and requests for reprints should be addressed to Kathryn H. Schmitz, PhD, MPH, Center for Clinical Epidemiology and Biostatistics, University of Pennsylvania, 921 Blockley Hall, 423 Guardian Drive, Philadelphia, PA 19104; e-mail: [email protected]. Assessment and Outcomes of HealthPartners 10,000 Steps Program in an Academic Work Site Rebecca M. Speck, MPH Rhonda K. Hill, MPH Nico P. Pronk, PhD, MA Mark P. Becker, PhD Kathryn H. Schmitz, PhD, MPH The authors examined the feasibility, acceptability, and potential for physical activity behavior change of a 21-week, 10,000 Steps® program in an academic work site. In a pre-post, noncontrolled study design, partici- pants were supplied a pedometer, online resource, and health promotional activities. Means, medians, ranges, and frequencies of self-reported average daily steps (ADS) described physical activity behavior change. An online exit survey assessed the acceptability of the inter- vention. Of 1,322 eligible participants, 619 (47%) regis- tered; 74% of participants tracked step counts at least once, and 57 (9%) tracked them all 21 weeks. The pro- portion of cohort participants with <7,499 ADS tracking all 21 weeks was significantly less than that same cohort tracking only at baseline (p < .02). Survey results showed that 85% of the participants reported general satisfac- tion with content and navigation of the program Web site. Results suggest elements of feasibility and accept- ability but limited potential for physical activity behav- ior change. Future studies should assess preenrollment ADS and barriers to retaining participants. Keywords: work site; physical activity; health promotion > INTRODUCTION It has been reported that physical inactivity contributes to 300,000 preventable deaths a year in the United States (U.S. Department of Health and Human Services [DHHS], 1996/1999). Despite overwhelming 1 evidence of the protective health benefits of regular leisure time physical activity, the U.S. DHHS reports that two thirds of adults do not participate in regular physical activity (U.S. DHHS, 1996/1999), and at least one quarter of the American population is completely inactive (Center for Disease Control and Prevention, 2003; U.S. DHHS, 1996/1999). Physical activity in the United States is the first of 10 “leading indicator” areas of Healthy People 2010 (Health People 2010, 2000). Healthy People 2010 objectives include a goal to “increase the proportion of work sites offering employer- sponsored physical activity and fitness programs to 75% by 2010” (Healthy People 2010, 2000). The goal was based on 1999 national survey data released by the Office of Disease Prevention and Health Promotion, indicating that 46% of work sites offered health programs to their employees (Association for Worksite Health Promotion, 1999). Well over 135 million people are employed in the United States (National Institute for Occupational Safety and Health, 2004). On average, most American adults spend 8 hours a day at work, making the workplace a potential environment for interventions to promote healthy living. Work sites provide for the opportunity to encourage employees and their families to increase their levels of physical activity (Dishman, Oldenburg, O’Neal, & Shepard, 1998). Work site organizational structures allow for communication and coordination of health promotion efforts, including e-mail messaging and electronic newsletters, social support from management Health Promot Pract OnlineFirst, published on January 31, 2009 as doi:10.1177/1524839908330745
-
Upload
independent -
Category
Documents
-
view
3 -
download
0
Transcript of Assessment and Outcomes of HealthPartners 10,000 Steps(R) Program in an Academic Work Site

Health Promotion PracticeMonth XXXX Vol. XX, No. X, xx-xxDOI: 10.1177/1524839908330745©2009 Society for Public Health Education
Authors’ Note: All correspondence and requests for reprints should be addressed to Kathryn H. Schmitz, PhD, MPH, Center for Clinical Epidemiology and Biostatistics, University of Pennsylvania, 921 Blockley Hall, 423 Guardian Drive, Philadelphia, PA 19104; e-mail: [email protected].
Assessment and Outcomes of HealthPartners 10,000 Steps Program in an Academic Work Site
Rebecca M. Speck, MPHRhonda K. Hill, MPH
Nico P. Pronk, PhD, MAMark P. Becker, PhD
Kathryn H. Schmitz, PhD, MPH
The authors examined the feasibility, acceptability, and potential for physical activity behavior change of a 21-week, 10,000 Steps® program in an academic work site. In a pre-post, noncontrolled study design, partici-pants were supplied a pedometer, online resource, and health promotional activities. Means, medians, ranges, and frequencies of self-reported average daily steps (ADS) described physical activity behavior change. An online exit survey assessed the acceptability of the inter-vention. Of 1,322 eligible participants, 619 (47%) regis-tered; 74% of participants tracked step counts at least once, and 57 (9%) tracked them all 21 weeks. The pro-portion of cohort participants with <7,499 ADS tracking all 21 weeks was significantly less than that same cohort tracking only at baseline (p < .02). Survey results showed that 85% of the participants reported general satisfac-tion with content and navigation of the program Web site. Results suggest elements of feasibility and accept-ability but limited potential for physical activity behav-ior change. Future studies should assess preenrollment ADS and barriers to retaining participants.
Keywords: work site; physical activity; health promotion
> INTRODUCTION
It has been reported that physical inactivity contributes to 300,000 preventable deaths a year in the United States (U.S. Department of Health and Human Services [DHHS], 1996/1999). Despite overwhelming
1
evidence of the protective health benefits of regular leisure time physical activity, the U.S. DHHS reports that two thirds of adults do not participate in regular physical activity (U.S. DHHS, 1996/1999), and at least one quarter of the American population is completely inactive (Center for Disease Control and Prevention, 2003; U.S. DHHS, 1996/1999). Physical activity in the United States is the first of 10 “leading indicator” areas of Healthy People 2010 (Health People 2010, 2000). Healthy People 2010 objectives include a goal to “increase the proportion of work sites offering employer-sponsored physical activity and fitness programs to 75% by 2010” (Healthy People 2010, 2000). The goal was based on 1999 national survey data released by the Office of Disease Prevention and Health Promotion, indicating that 46% of work sites offered health programs to their employees (Association for Worksite Health Promotion, 1999).
Well over 135 million people are employed in the United States (National Institute for Occupational Safety and Health, 2004). On average, most American adults spend 8 hours a day at work, making the workplace a potential environment for interventions to promote healthy living. Work sites provide for the opportunity to encourage employees and their families to increase their levels of physical activity (Dishman, Oldenburg, O’Neal, & Shepard, 1998). Work site organizational structures allow for communication and coordination of health promotion efforts, including e-mail messaging and electronic newsletters, social support from management
Health Promot Pract OnlineFirst, published on January 31, 2009 as doi:10.1177/1524839908330745

2 HEALTH PROMOTION PRACTICE / Month XXXX
and coworkers, and organization of walking groups or other physical activities.
> BACKGROUND
An existing physical activity promotion program that may be useful in increasing employee physical activity is the HealthPartners 10,000 Steps program. By encouraging participants to accumulate 10,000 steps throughout the day, the 10,000 Steps program may be a feasible and acceptable means to implementing a physical activity intervention within the work environment. Proposed indices of pedometer-determined physical activity classify <5,000 steps per day as a sedentary lifestyle index; 5,000 to 9,999 steps per day includes a range of daily activities to some volitional activities and might be considered low active to somewhat active; and ≥10,000 steps per day classifies individuals as active (Tudor-Locke & Bassett, 2004). Accumulation of 10,000 steps per day is roughly equivalent to 5 miles of walking per day. As such, promoting the accumulation of 10,000 steps per day in sedentary office workers, defined by the previously mentioned <5,000 index, could encourage participants to walk an extra 5,000 or more steps per day, or upward of 3 miles. Given 1 mile can be walked in approximately
20 minutes, this translates to a potential increase of 60 minutes of walking per day. Achieving this goal would enable participants to glean the well-established health benefits from performing 30 minutes of moderate-intensity physical activity on most days of the week (Institute of Medicine, 2002; U.S. DHHS, 1996/1999).
A small number of studies have used pedometers to assess physical activity in the workplace, varying in sample size and length of observation (Aittasalo, Miilunpalo, & Suni, 2004; Chan, Ryan, & Tudor-Locke, 2004; Jatkinson, Goody, & Walker, 2005; Miller & Brown, 2004). Little research exists that has specifically examined the feasibility and acceptability of a 10,000 Steps program in a work site environment (Lindberg, 2000; Rooney, Smalley, Larson, & Havens, 2003; Thomas & Williams, 2006; Van Wormer, Pronk, & Boucher, 2006). Of particular interest is the extent to which such programs are capable of recruiting sedentary individuals, increasing their activity level, and maintaining that higher level of physical activity.
> METHOD
Design and Study Population
A pre-post, noncontrolled study design was used to assess the feasibility, acceptability, and potential for physical activity behavior change from a 21-week 10,000 Steps program in an academic work site setting. The intervention targeted individual workers/students, taking advantage of the social and physical environments of the work site. The intervention program took on the title “School of Public Health Wellness Initiative” (SPH Wellness Initiative) and was funded internally.
Eligible study participants included students, staff, and faculty from the University of Minnesota SPH during the 2003-2004 academic year. Specific inclusion criteria were faculty of any appointment; part-time or full-time civil service and bargaining unit or professional and administrative staff; and full-time, part-time, or distance learning students. According to the SPH demographics report, dated January 29, 2003, there were 689 eligible faculty and staff. The eligible SPH student population (noncompleted degree status) as of August 2003 was 633, yielding a total eligible population of N = 1,322.
All study procedures were submitted to and approved by a University of Minnesota committee on human subjects research prior to beginning any research activities. The consent materials were e-mailed to all eligible participants. Hard copies were also provided in mailboxes of those who worked on campus. The choice
The Authors
Rebecca M. Speck, MPH, is with the Division of Clinical Epidemiology, University of Pennsylvania, Philadelphia, Pennsylvania. At the time of this study, Ms. Speck was with the Division of Health Services Research and Policy, University of Minnesota, Minneapolis, Minnesota.
Rhonda K. Hill, MPH, is at the Arkansas Center for Health Improvement, Little Rock, Arkansas. At the time of this study, Ms. Hill was with the Division of Epidemiology and Community Health, University of Minnesota, Minneapolis, Minnesota.
Nico P. Pronk, PhD, MA, is with the Health and Behavior Group, HealthPartners, Minneapolis, Minnesota.
Mark P. Becker, PhD, is President of Georgia State University in Atlanta, Georgia. At the time of this study, Dr. Becker was with the Office of the Dean, School of Public Health, University of Minnesota, Minneapolis, Minnesota.
Kathryn H. Schmitz, PhD, MPH, Division of Clinical Epidemiology, University of Pennsylvania, Philadelphia, Pennsylvania. At the time of this study, Dr. Schmitz was with the Division of Epidemiology and Community Health, University of Minnesota, Minneapolis, Minnesota.
Speck et al. / ASSESSMENT AND OUTCOMES OF HEALTHPARTNERS 10,000 STEPS 3
to register for the program and access the online exit survey were considered to be indication of informed consent. Thus, consent was provided by all participants prior to any research activities.
Recruitment
The main tools for recruitment were e-mail messaging and posters. Supervisors (e.g., SPH Dean, division chairs, faculty, and project managers) sent initial e-mail communi- cations. E-mail content accentuated the benefits of the SPH Wellness Initiative, outlined the reasons for conducting the program, and invited SPH members to join. This recruitment strategy showed support for the program and capitalized on the referent power of supervisors, which has been shown to play a key role in motivating individuals to participate in a health promotion program (Gibbs, 1982; Thomlinson, 1965). The initial enrollment period extended from October 8 to November 14, 2003. Posters encouraging enrollment were placed in prominent public spaces in six of the nine SPH work settings where the majority of SPH activities occurred.
Intervention
HealthPartners 10,000 Steps® online program. Partici-pants were given a step-counting pedometer (Yamax, Digi-Walker, SW-200) and use of an online 10,000 Steps program (www.healthpartners.com/10000steps) supplied by HealthPartners, Inc., a nonprofit, consumer-governed integrated health system in Minnesota. Daily progress was self-reported through the Web site. The Web site included nutritional information, an area for individual journaling, the ability to forward personal step totals to friends, motivational tips, a conversion chart to allow participants to count nonambulatory physical activity (swimming, weight training) toward step counts, and other health-related resources. The 10,000 Steps program materials provided to partici-pants suggested a goal of obtaining 10,000 steps per day; however, the online program allowed registrants to choose their own personal daily step goal.
Promotional activities. Contiguous to the online pro-gram, six nonoverlapping promotional activities and events specific to SPH-identified needs were offered during the intervention. A 2-mile walk and health fair kicked off the program, followed by three e-mail/poster promotions beginning at Weeks 5, 12, and 16. Throughout the promotions, participants were entered in raffles for incentives if they accomplished the promotional goal (early registration and use of online tracking, taking
the stairs, and consecutive days of online tracking). Incentives included athletic socks, jackets, T-shirts, and water bottles. The activities and events were followed by a request for motivational success stories from program participants that were then shared with all participants via e-mail. Additionally, there was a “finale” event that included health snacks and prizes.
Measures
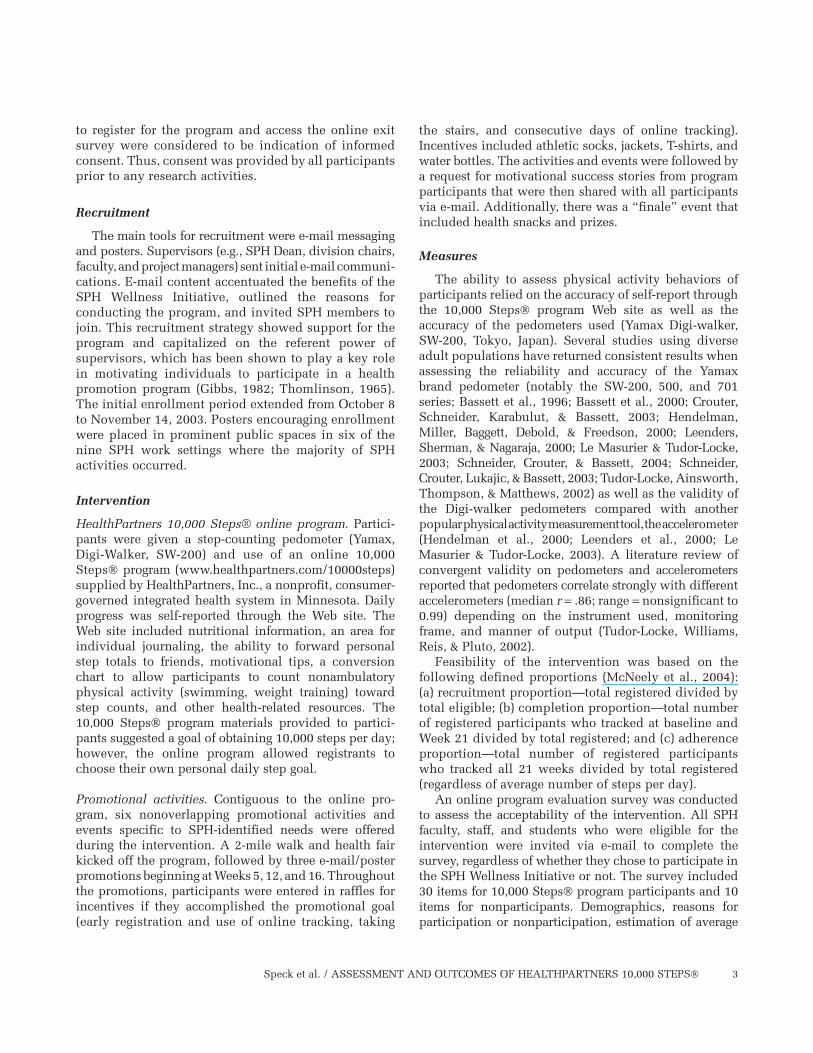
The ability to assess physical activity behaviors of participants relied on the accuracy of self-report through the 10,000 Steps program Web site as well as the accuracy of the pedometers used (Yamax Digi-walker, SW-200, Tokyo, Japan). Several studies using diverse adult populations have returned consistent results when assessing the reliability and accuracy of the Yamax brand pedometer (notably the SW-200, 500, and 701 series; Bassett et al., 1996; Bassett et al., 2000; Crouter, Schneider, Karabulut, & Bassett, 2003; Hendelman, Miller, Baggett, Debold, & Freedson, 2000; Leenders, Sherman, & Nagaraja, 2000; Le Masurier & Tudor-Locke, 2003; Schneider, Crouter, & Bassett, 2004; Schneider, Crouter, Lukajic, & Bassett, 2003; Tudor-Locke, Ainsworth, Thompson, & Matthews, 2002) as well as the validity of the Digi-walker pedometers compared with another popular physical activity measurement tool, the accelerometer (Hendelman et al., 2000; Leenders et al., 2000; Le Masurier & Tudor-Locke, 2003). A literature review of convergent validity on pedometers and accelerometers reported that pedometers correlate strongly with different accelerometers (median r = .86; range = nonsignificant to 0.99) depending on the instrument used, monitoring frame, and manner of output (Tudor-Locke, Williams, Reis, & Pluto, 2002).
Feasibility of the intervention was based on the following defined proportions (McNeely et al., 2004): (a) recruitment proportion—total registered divided by total eligible; (b) completion proportion—total number of registered participants who tracked at baseline and Week 21 divided by total registered; and (c) adherence proportion—total number of registered participants who tracked all 21 weeks divided by total registered (regardless of average number of steps per day).
An online program evaluation survey was conducted to assess the acceptability of the intervention. All SPH faculty, staff, and students who were eligible for the intervention were invited via e-mail to complete the survey, regardless of whether they chose to participate in the SPH Wellness Initiative or not. The survey included 30 items for 10,000 Steps program participants and 10 items for nonparticipants. Demographics, reasons for participation or nonparticipation, estimation of average

4 HEALTH PROMOTION PRACTICE / Month XXXX
daily steps (ADS) if they did not track online, and ease of using the online tracking service were assessed. Consistent with the majority of communication throughout the intervention, the survey was available through accessing a secure Web site. Responses were anonymous and not linked in any way to the data collected by the online 10,000 Steps program. Respondents were given the opportunity to provide additional comments before sub-mitting the survey. All exit survey respondents were eligible to win one of five SPH fleece jackets as incentive for survey completion, regardless of whether they participated in the intervention.
Data Analysis
Means, medians, ranges, and frequencies were determined to describe the SPH Wellness Initiative participants and the survey sample as well as to describe the acceptability data from the survey. z Scores were calculated for two-sample tests of proportions, comparing demographics of the eligible population to registered participants. The distribution of activity level—ADS—for those who tracked steps at the beginning versus throughout the study was compared using a chi-square test. Analysis was completed in 2007.
> RESULTS
HealthPartners 10,000 Steps Program: SPH Wellness Initiative
The total eligible SPH population was 1,322. After all recruitment methods were complete, 47% (n = 619) of eligible individuals registered to participate in the program. Specifically, 36% of students, 47.8% of faculty, 63.2% of professional and administrative staff, and 56.7% of civil service/bargaining unit staff registered for the program. More than 500 participants (82.2%) were female, which differs significantly from the 73.1% female gender distribution of eligible SPH students, staff, and faculty (p < .001). Participant demographic characteristics as self-reported on the HealthPartners Web site are outlined in Table 1. Ethnicity was not requested on the Web site. However, SPH human resources data indicate that the vast majority of eligible students, faculty, and staff were Caucasian (>80%).
Table 2 outlines the number of participants tracking per week; the ADS they tracked in a given week; and the minimum, maximum, median, and standard deviation by week. Those who tracked steps online at least once per week typically did so all 7 days most weeks (data not shown). The ADS for those who tracked regularly averaged more than 9,000 steps daily for most weeks, and Weeks 16 to 18 averaged more than
10,000. The maximum values for ADS indicated in Table 2 are high enough to question whether the values might have been based on a single weekly logging of an individual or individuals who wore the monitor for multiple days but logged the pedometer’s total steps rather than entering the daily total as instructed. For example, it is possible through participant error that an individual could have a single log entry of 30,000 steps, when in reality that accumulation was from 3 days of wearing the pedometer, and the appropriate step total to enter was really 10,000 for each of those 3 days. Although examination of individual participants and weekly step counts indicates that this is possible for three given weeks of the intervention, interestingly, the data show that one unique individual consistently tracking 7 days a week is responsible for 11 of the 21 week maximum ADS counts.
Of the 619 registered participants, 458 or 74% tracked steps at least once on the HealthPartners Web site. Steps were tracked by 424 participants during the first 2 weeks (defined hereafter as baseline), of which 36% self-reported more than 10,000 ADS. Of the 163 or 26% of registered participants who tracked steps at baseline and at the end of the program, 45% tracked more than 10,000 ADS at baseline. Finally, 57 or 9% of registered participants tracked steps every week of the 21-week program, 54% of whom had self-reported ADS greater than 10,000 at baseline. The proportion of participants identified at baseline as the low active cohort, with ADS < 7,499, who tracked throughout all 21 weeks was significantly smaller than the proportion of low active cohort participants tracking only at baseline (distributions compared with a chi-square test, χ2 = 8.82, df = 2, p < .02). These data are shown in Table 3.
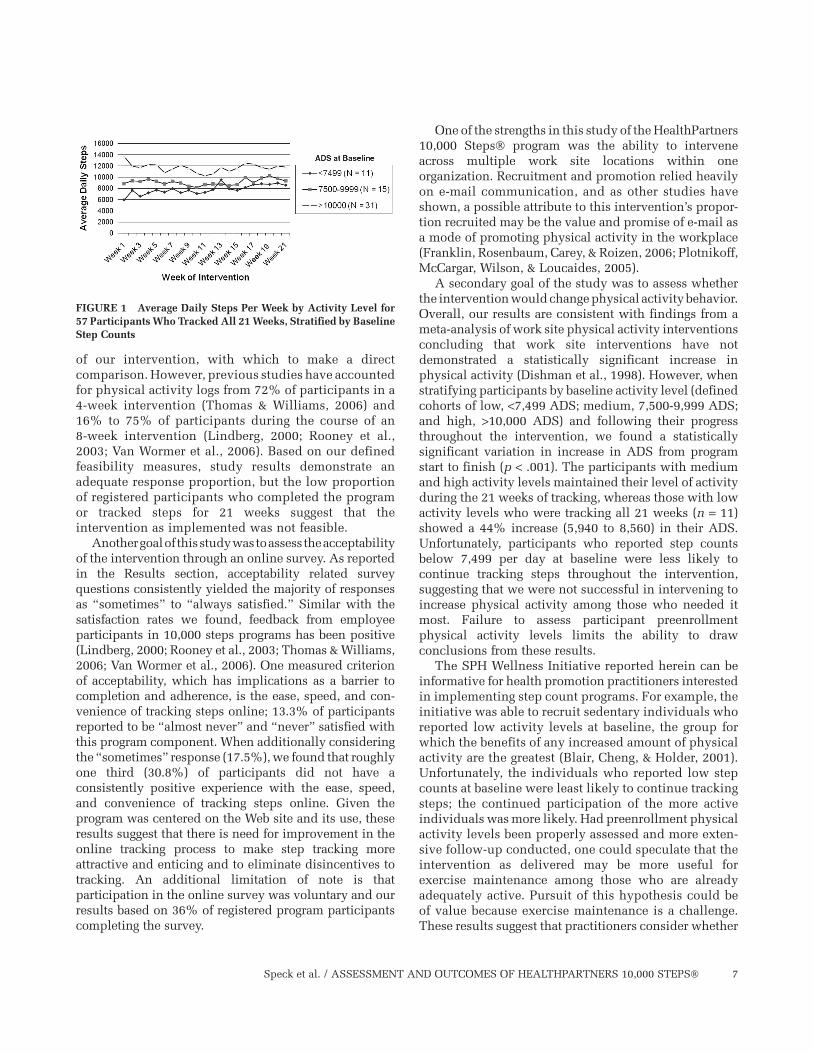
Figure 1 shows the progress of the 57 participants who tracked every week of the 21-week program, grouped by baseline activity level. Of the 57 participants, 31 were already active in tracking >10,000 ADS at program onset, 15 were in the 7,500 to 9,999 ADS range, whereas 11 had an activity level < 7,499 ADS. The <7,499 participant group increased their ADS from 5,940 to 8,560, and the 7,500 to 9,999 range participants went from 8,849 to 9,311 ADS throughout the 21-week program.
Exit Survey
The total number of survey respondents was 321 for a response rate of 24.3% (assuming little to no change in the SPH eligible population during the 21-week interven-tion), of whom 96 did not participate in the 10,000 Steps program. Survey respondents’ demo graphics were statistically similar to intervention partici pant

Speck et al. / ASSESSMENT AND OUTCOMES OF HEALTHPARTNERS 10,000 STEPS 5
demographics in age, underweight, overweight, and obese BMI, and job classification but differed in percentage of normal-weight BMI respondents (59.5% vs. 52.7%, p = .046) and gender (female participants = 74.1% vs. 82.2%, p = .005). Ethnicity was assessed, and 85% of the respondents were Caucasian.
Table 4 shows that 92% of survey respondents who participated in the intervention were satisfied with the pedometer component of the program. Navigation and content of the Web site component of the program received a satisfaction rating of “sometimes satisfied” to “always satisfied” from 84.9% of respondents. The ease, speed, and convenience of tracking steps online received a rating of “sometimes satisfied” to “always satisfied” by 75.1% of respondents. Additionally, 64.9% of respondents were “sometimes satisfied” or “always satisfied” with the daily e-mail message sent from the online program, and 74.7% were “sometimes satisfied” to “always satisfied” with the step conversion chart. Survey participants were also asked about the frequency with which they wore the pedometer and tracked online and which promotional events they took part in (results not shown). Nearly two thirds (64.4%) reported wearing their pedometer 5 to 7 days per week. However, less
than half (47.6%) tracked 5 to 7 days per week in any given week. Survey participants reported varying levels of involvement in the promotional events. The health walk had a 13.8% participation rate, whereas 40.9% participated in an online tracking promotion.
Among the 96 exit survey respondents who did not participate in the program, the top three reasons for not participating were as follows: (a) already more active than the program goals, n = 36 (37.5%); (b) program was too physically challenging, n = 36 (37.5%); and (c) did not have enough time to participate, n = 24 (25%).
> DISCUSSION
The primary goal of this intervention was to assess the feasibility of the HealthPartners 10,000 Steps program over 21 weeks among students, staff, and faculty of the SPH at a large Midwestern university. Results indicate that 47% of the eligible population registered to participate. In comparison, Thomas and Williams reported a participation rate of 34% of eligible staff in the Ten Grand Steps program, a work site promotion of 10,000 steps per day (Thomas & Williams, 2006). Despite the fact that step counts were tracked by
TABLE 1Self-Reported Demographics of SPH Individuals Who Registered for the
HealthPartners 10,000 Steps® Program (N = 619)
Female Male Total n (%) n (%) n (%)
Gender 509 (82.2) 110 (17.8) 619 (100)Age ≤27 130 (25.5) 16 (14.5) 146 (23.6) 28-37 135 (26.5) 29 (26.4) 164 (26.5) 38-48 124 (24.4) 30 (27.3) 154 (24.9) 49+ 120 (23.6) 35 (31.8) 155 (25.0) Total 509 110 619BMI Underweight ≤ 18.5 14 (2.8) 0 (0.0) 14 (2.3) Normal weight = 18.5-24.9 283 (55.6) 43 (39.1) 326 (52.7) Overweight = 25-29.9 99 (19.4) 48 (43.6) 147 (23.7) Obese ≥ 30 67 (13.2) 16 (14.5) 83 (13.4) Height or weight not reported 46 (9.0) 3 (2.7) 49 (7.9) Total 509 110 619Job class Student 199 (39.1) 29 (26.4) 228 (36.8) Faculty 26 (5.1) 29 (26.4) 55 (8.9) Civil service/Bargaining unit staff 199 (39.1) 34 (30.9) 233 (37.6) Professional and administrative staff 85 (16.7) 18 (16.4) 103 (16.6) Total 509 110 619

6 HEALTH PROMOTION PRACTICE / Month XXXX
74% of registered participants at least once during the 21-week program, our completion proportion was only 26%, and the adherence proportion for participants tracking regularly during all 21 weeks was only 9%. Participants could opt to receive daily messages from
the HealthPartners 10,000 Steps site, including a live link to the step-tracking site. Though 68.2% opted to receive the message, it did not translate to a similar tracking adherence proportion. There are no figures in the literature, given the length and priority population
TABLE 2Number of Participants Who Tracked by Week and Average Daily Steps Per Week
Total Participants Average Daily Who Tracked Steps Tracked Minimum Maximum Median SD
Week 1 284 9,746.4 586 35,153 9,430 3,826Week 2 304 9,479 2,098 30,900 9,180 3,393Week 3 312 9,324.4 1,233 35,125 8,916 3,646Week 4 319 9,608 629 39,504a 9,045 4,236Week 5 310 9,471.6 1,462 26,519 9,406 3,217Week 6 291 8,962.9 950 25,297 8,673 3,460Week 7 278 9,218.3 2,867 26,559 8,746 3,300Week 8 233 9,441.3 1,701 21,740 9,254 3,421Week 9 183 9,406.4 1,000 28,022a 9,633 3,758Week 10 150 9,438.7 3,620 27,629 8,879 3,745Week 11 137 9,155.7 2,494 22,723 9,146 3,646Week 12 139 9,146.5 2,500 26,852a 8,749 3,369Week 13 129 9,729.9 3,626 24,193 9,190 3,490Week 14 139 9,438.8 2,550 20,048 9,013 3,150Week 15 144 9,440.4 1,318 20,852 8,982 3,352Week 16 152 10,013.1 1,000 22,780 9,720 3,932Week 17 143 10,259 3,005 25,463 9,951 3,531Week 18 137 10,318.5 1,028 39,938 9,764 4,557Week 19 147 9,996.3 1,155 26,331 9,891 3,653Week 20 185 9,750.8 3,325 24,790 9,500 3,434Week 21 174 9,653.1 982 25,894 9,478 3,417
NOTE: SD = standard deviation.a. Based on a single participant who tracked steps once in that week
TABLE 3Number of Participants Who Tracked Stratified by Baseline Activity Level
Baseline Activity Total Participants Total Participants Total Participants Level by Average Who Tracked at Who Tracked at Who Tracked All Daily Steps Baseline n (%) Program End n (%) 21 Weeksa n (%)
Overall 424 163 57<7,499 103 (24) 34 (33) 11 (19)7,500-9,999 167 (39) 60 (36) 15 (26)>10,000 154 (36) 69 (45) 31 (54)
a. This distribution is statistically significantly different from the distribution of participants who tracked at baseline only (χ2 = 8.82, df = 2, p < .02).
Speck et al. / ASSESSMENT AND OUTCOMES OF HEALTHPARTNERS 10,000 STEPS 7
of our intervention, with which to make a direct comparison. However, previous studies have accounted for physical activity logs from 72% of participants in a 4-week intervention (Thomas & Williams, 2006) and 16% to 75% of participants during the course of an 8-week intervention (Lindberg, 2000; Rooney et al., 2003; Van Wormer et al., 2006). Based on our defined feasibility measures, study results demon strate an adequate response proportion, but the low proportion of registered participants who completed the program or tracked steps for 21 weeks suggest that the intervention as implemented was not feasible.
Another goal of this study was to assess the acceptability of the intervention through an online survey. As reported in the Results section, acceptability related survey questions consistently yielded the majority of responses as “sometimes” to “always satisfied.” Similar with the satisfaction rates we found, feedback from employee participants in 10,000 steps programs has been positive (Lindberg, 2000; Rooney et al., 2003; Thomas & Williams, 2006; Van Wormer et al., 2006). One measured criterion of acceptability, which has implications as a barrier to completion and adherence, is the ease, speed, and con-venience of tracking steps online; 13.3% of participants reported to be “almost never” and “never” satisfied with this program component. When additionally considering the “sometimes” response (17.5%), we found that roughly one third (30.8%) of participants did not have a consistently positive experience with the ease, speed, and convenience of tracking steps online. Given the program was centered on the Web site and its use, these results suggest that there is need for improvement in the online tracking process to make step tracking more attractive and enticing and to eliminate disincentives to tracking. An additional limitation of note is that participation in the online survey was voluntary and our results based on 36% of registered program participants completing the survey.
One of the strengths in this study of the HealthPartners 10,000 Steps program was the ability to intervene across multiple work site locations within one organization. Recruitment and promotion relied heavily on e-mail communication, and as other studies have shown, a possible attribute to this intervention’s propor-tion recruited may be the value and promise of e-mail as a mode of promoting physical activity in the workplace (Franklin, Rosenbaum, Carey, & Roizen, 2006; Plotnikoff, McCargar, Wilson, & Loucaides, 2005).
A secondary goal of the study was to assess whether the intervention would change physical activity behavior. Overall, our results are consistent with findings from a meta-analysis of work site physical activity interventions concluding that work site interventions have not demonstrated a statistically significant increase in physical activity (Dishman et al., 1998). However, when stratifying participants by baseline activity level (defined cohorts of low, <7,499 ADS; medium, 7,500-9,999 ADS; and high, >10,000 ADS) and following their progress throughout the intervention, we found a statistically significant variation in increase in ADS from program start to finish (p < .001). The participants with medium and high activity levels maintained their level of activity during the 21 weeks of tracking, whereas those with low activity levels who were tracking all 21 weeks (n = 11) showed a 44% increase (5,940 to 8,560) in their ADS. Unfortunately, participants who reported step counts below 7,499 per day at baseline were less likely to continue tracking steps throughout the intervention, suggesting that we were not successful in intervening to increase physical activity among those who needed it most. Failure to assess participant preenrollment physical activity levels limits the ability to draw conclusions from these results.
The SPH Wellness Initiative reported herein can be informative for health promotion practitioners interested in implementing step count programs. For example, the initiative was able to recruit sedentary individuals who reported low activity levels at baseline, the group for which the benefits of any increased amount of physical activity are the greatest (Blair, Cheng, & Holder, 2001). Unfortunately, the individuals who reported low step counts at baseline were least likely to continue tracking steps; the continued participation of the more active individuals was more likely. Had preenrollment physical activity levels been properly assessed and more exten-sive follow-up conducted, one could speculate that the intervention as delivered may be more useful for exercise maintenance among those who are already adequately active. Pursuit of this hypothesis could be of value because exercise maintenance is a challenge. These results suggest that practitioners consider whether
FIGURE 1 Average Daily Steps Per Week by Activity Level for 57 Participants Who Tracked All 21 Weeks, Stratified by Baseline Step Counts

8 HEALTH PROMOTION PRACTICE / Month XXXX
TABLE 4Exit Survey Response From Program
Participants (n = 225)
Satisfaction With Various Program Components n (%)
Satisfaction with pedometer Sometimes/Always 207 (92.0) Almost never/Never 6 (2.7) No response 12 (5.3)Satisfaction with HealthPartners Web site Sometimes/Always 191 (84.9) Almost never/Never 12 (5.3) No response 22 (9.8)Ease, speed, convenience of tracking steps online Sometimes/Always 169 (75.1) Almost never/Never 30 (13.3) No response 26 (11.6)Satisfaction with the daily e-mail message Sometimes/Always 146 (64.9) Almost never/Never 48 (21.3) Did not receive the daily tip 16 (7.1) No response 15 (6.7)Usefulness of conversion chart Sometimes/Always 168 (74.7) Almost never/Never 34 (15.1) No response 23 (10.2)Timeliness of response to questions Sometimes/Always 142 (63.1) Almost never/Never 9 (4.0) No response 74 (32.9)Feasibility and acceptability of promotion activities Did you participate in the following promotional activities? Gopher health walk: kick-off event 31 (13.8) Promotion # 1: Track & Win 92 (40.9) Promotion # 2: Take the Stairs 68 (30.2) Promotion # 3: Track 20 Days 58 (25.8) Promotion # 4: Motivational Stories 72 (32.0) Finale event: fruit & veggie finale 41 (18.2) How satisfied with the promotions? Satisfied/Very satisfied 171 (76.0) Somewhat dissatisfied/Very 3 (1.3) dissatisfied No response 51 (22.7)
The SPH Wellness Initiative as delivered requires revision to meet the goal of getting less active individuals to stay more active. To guide those revisions and the development and implementation of similar interventions in the future, we recommend testing the adoption of a behavior change theory or model that is helpful in health promotion efforts to explain why some members of a given population are performing a behavior whereas others are not (Fishbein et al., 2001). A model particularly applicable to this situation is the stages of change model (Prochaska et al., 1994). With the stages of change model in mind, intervention materials targeting individuals in the precontemplation through action stages could be tested and evaluated for their effectiveness in sustaining interest in the intervention. For example, testing and evaluating the use of e-mail messages tailored to partici-pants based on their stage of change, as determined by their Web site tracking activity and ADS totals, and whether that improves the usefulness of an online-based health promotion application similar to the HealthPartners 10,000 Steps Web site for individuals who report no or few steps during early weeks of the intervention may be of interest. Additional overall recommendations include the following: (a) assessment of preenrollment physical activity level, (b) more exten sive participant follow-up, and (c) ongoing solicitation of participant successes and difficulties to determine program strengths and barriers in real time.
Finally, it must be reiterated that all study data were self-reported. Self-reported step counts in this and other studies are dependent on the accuracy of pedometer data. As previously cited, pedometers have been determined to be accurate and reliable in studies with a diversity of participants, yet there is the potential that placement of the pedometer on the body could alter the accuracy of step counts. Furthermore, prior studies have reported conflicting results regarding the impact of body size on pedometer accuracy (Shepherd, Toloza, McClung, & Schmalzried, 1999; Swartz, Bassett, Moore, Thompson, & Strath, 2003). One study suggested that participants be personally assessed for effective pedometer placement on their body (Shepherd et al., 1999). In the current study, and in most large inter vention studies, this may not have been feasible.
> CONCLUSIONS
The SPH Wellness Initiative as implemented in this priority population was not feasible, as indicated by the low proportion of registered participants who completed or adhered to the program. A goal of this program evaluation was to assess the extent to which participants in the HealthPartners 10,000 Steps program
the goal of a step count intervention program is to get less active individuals to become and stay more active or to target exercise maintenance.

Speck et al. / ASSESSMENT AND OUTCOMES OF HEALTHPARTNERS 10,000 STEPS 9
would use the tracking system as provided on the Web site. One interpretation of the results is that the tracking system was not attractive or enticing enough to sustain participation throughout 21 weeks. There is a need through use of human behavior theory and modeling to identify the barriers to and challenges in engaging and retaining participation of initially sedentary workers once they are registered in the 10,000 Steps program. Additionally, it is recommended that future studies measure preenrollment physical activity levels to better determine physical activity behavior change in a pedometer program promoting 10,000 steps.
REFERENCES
Aittasalo, M., Miilunpalo, S., & Suni, J. (2004). The effective-ness of physical activity counseling in a work-site setting: A randomized, controlled trial. Patient Education Counseling, 55, 193-202.
Association for Worksite Health Promotion. (1999). 1999 National Worksite Health Promotion Survey. Northbrook, IL: Author.
Bassett, D. R., Jr., Ainsworth, B. E., Leggett, S. R., Mathien, C. A., Main, J. A., Hunter, D. C., et al. (1996). Accuracy of five electronic pedometers for measuring distance walked. Medicine and Science in Sports and Exercise, 28, 1071-1077.
Bassett, D. R., Jr., Ainsworth, B. E., Swartz, A. M., Strath, S. J., O’Brien, W. L., & King, G. A. (2000). Validity of four motion sen-sors in measuring moderate intensity physical activity. Medicine and Science in Sports and Exercise, 32, S471-S480.
Blair, S. N., Cheng, Y., & Holder, S. (2001). Is physical activity or physical fitness more important in defining health benefits? Medicine and Science in Sports and Exercise, 33, S379-S399.
Center for Disease Control and Prevention. (2003). Obesity trends. Atlanta, GA: Author.
Chan, C. B., Ryan, D. A., & Tudor-Locke, C. (2004). Health benefits of a pedometer-based physical activity intervention in sedentary workers. Preventive Medicine, 39, 1215-1222.
Crouter, S. E., Schneider, P. L., Karabulut, M., & Bassett, D. R., Jr. (2003). Validity of 10 electronic pedometers for measuring steps, distance, and energy cost. Medicine and Science in Sports Exercise, 35, 1455-1460.
Dishman, R. K., Oldenburg, B., O’Neal, H., & Shepard, R. J. (1998). Worksite physical activity interventions. American Journal of Preventive Medicine, 15, 344-361.
Fishbein, M., Triandis, H. C., Kanfer, F. H., Becker, M., Middlestadt, S. E., & Eichler, A. (2001). Handbook of health psychology. Mahwah, NJ: Lawrence Erlbaum.
Franklin, P. D., Rosenbaum, P. F., Carey, M. P., & Roizen, M. F. (2006). Using sequential e-mail messages to promote health behaviors: evidence of feasibility and reach in a worksite sample. Journal of Medical Internet Research, 8(1), e3. Retrieved January 2, 2009, from http://www.jmir.org/2006/1/e3/
Gibbs, J. P. (1982). Social control: Views from the social sciences. Beverly Hills, CA: Sage.
Healthy People 2010. Volume II. (2000). Retrieved August 30, 2007, http://www.healthypeople.gov/
Hendelman, D., Miller, K., Baggett, C., Debold, E., & Freedson, P. (2000). Validity of accelerometry for the assessment of moderate intensity physical activity in the field. Medicine and Science in Sports and Exercise, 32, S442-S449.
Institute of Medicine. (2002). The future of the public’s health in the 21st century. Washington, DC: Author.
Jatkinson, J., Goody, R. B., & Walker, C. A. (2005). Walking at work: A pedometer study assessing the activity levels of doctors. Scottish Medical Journal, 50, 73-74.
Leenders, N. Y. J. M., Sherman, W. M., & Nagaraja, H. N. (2000). Comparisons of four methods of estimating physical activity in adult women. Medicine and Science in Sports and Exercise, 32, 1320-1326.
Le Masurier, G. C., & Tudor-Locke, C. (2003). Comparison of pedometer and accelerometer accuracy under controlled condi-tions. Medicine and Science in Sports and Exercise, 35, 867-871.
Lindberg, R. (2000). Active living: On the road with the 10,000 Steps (sm) program. Journal of the American Dietetic Association, 100, 878-879.
McNeely, M. L., Parliament, M., Courneya, K. S., Seikaly, H., Jha, N., Scrimger, R., et al. (2004). A pilot study of a randomized con-trolled trial to evaluate the effects of progressive resistance exer-cise training on shoulder dysfunction caused by spinal accessory neurapraxia/neurectomy in head and neck cancer survivors. Head & Neck, 26, 518-530.
Miller, R., & Brown, W. (2004). Steps and sitting in a working popu-lation. International Journal of Behavioral Medicine, 11, 219-224.
National Institute for Occupational Safety and Health. (2004). Worker health chartbook 2004. Retrieved August 30, 2007, from http://www.cdc.gov/niosh/docs/chartbook/
Plotnikoff, R. C., McCargar, L. J., Wilson, P. M., & Loucaides, C. A.(2005). Efficacy in an e-mail intervention for the promotion of physical activity and nutrition behavior in the workplace context. American Journal of Health Promotion, 19, 422-429.
Prochaska, J. O., Velicer, W. F., Rossi, J. S., Goldstein, M. G., Marcus, B. H., Rakowski, W., et al. (1994). Stages of change and decisional balance for 12 problem behaviors. Health Psychology, 13, 39-46.
Rooney, B., Smalley, K., Larson, J., & Havens, S. (2003). Is know-ing enough? Increasing physical activity by wearing a pedometer. WMJ: Official Publication of the State Medical Society of Wisconsin, 102(4), 31-36.
Schneider, P. L., Crouter, S. E., & Bassett, D. R. (2004). Pedometer measures of free-living physical activity: Comparison of 13 mod-els. Medicine and Science in Sports and Exercise, 36, 331-335.
Schneider, P. L., Crouter, S. E., Lukajic, O., & Bassett, D. R., Jr. (2003). Accuracy and reliability of 10 pedometers for measuring steps over a 400-m walk. Medicine and Science in Sports and Exercise, 35, 1779-1784.
Shepherd, E. F., Toloza, E., McClung, C. D., & Schmalzried, T. P. (1999). Step activity monitor: Increased accuracy in quanti-fying ambulatory activity. Journal of Orthopedic Research, 17, 703-708.
Swartz, A. M., Bassett, D. R., Moore, B., Thompson, D. L., & Strath, S. J. (2003). Accuracy of the electronic pedometer in obese, overweight and normal weight adults. International Journal of Sports Medicine, 24, 588-592.

10 HEALTH PROMOTION PRACTICE / Month XXXX
Thomas, L., & Williams, M. (2006). Promoting physical activity in the workplace: Using pedometers to increase daily activity levels. Health Promotion Journal of Australia, 17, 97-102.
Thomlinson, R. (1965). Sociological concepts and research: Acquisition, analysis and interpretation of social information. New York: Random House.
Tudor-Locke, C., Ainsworth, B. E., Thompson, R. W., & Matthews, C. E. (2002). Comparison of pedometer and accelerometer mea-sures of free-living physical activity. Medicine and Science in Sports and Exercise, 34, 2045-2051.
Tudor-Locke, C., & Bassett, D. R., Jr. (2004). How many steps/day are enough? Preliminary pedometer indices for public health. Sports Medicine, 34, 1-8.
Tudor-Locke, C., Williams, J. E., Reis, J. P., & Pluto, D. (2002). Utility of pedometers for assessing physical activity: Convergent validity. Sports Medicine, 32, 795-808.
U.S. Department of Health and Human Services. (1996/1999). Physical activity and health: A report of the surgeon general. Atlanta, GA: U.S. Department of Health and Human services, Centers for Disease Control and Prevention, National Center for Chronic Disease Prevention and Health Promotion.
Van Wormer, J. J., Pronk, N. P., & Boucher, J. L.(2006). Experience analysis of a practice-based, online pedometer program. Diabetes Spectrum, 4(19), 197-200.