Assessing Variation Among Manufactured Housing Tenures ...
20
Full Terms & Conditions of access and use can be found at https://www.tandfonline.com/action/journalInformation?journalCode=rhpd20 Housing Policy Debate ISSN: 1051-1482 (Print) 2152-050X (Online) Journal homepage: https://www.tandfonline.com/loi/rhpd20 The Contribution of Manufactured Housing to Affordable Housing in the United States: Assessing Variation Among Manufactured Housing Tenures and Community Types Noah J. Durst & Esther Sullivan To cite this article: Noah J. Durst & Esther Sullivan (2019): The Contribution of Manufactured Housing to Affordable Housing in the United States: Assessing Variation Among Manufactured Housing Tenures and Community Types, Housing Policy Debate, DOI: 10.1080/10511482.2019.1605534 To link to this article: https://doi.org/10.1080/10511482.2019.1605534 Published online: 11 Jun 2019. Submit your article to this journal Article views: 70 View Crossmark data
-
Upload
khangminh22 -
Category
Documents
-
view
0 -
download
0
Transcript of Assessing Variation Among Manufactured Housing Tenures ...
Full Terms & Conditions of access and use can be found athttps://www.tandfonline.com/action/journalInformation?journalCode=rhpd20
Housing Policy Debate
ISSN: 1051-1482 (Print) 2152-050X (Online) Journal homepage: https://www.tandfonline.com/loi/rhpd20
The Contribution of Manufactured Housing toAffordable Housing in the United States: AssessingVariation Among Manufactured Housing Tenuresand Community Types
Noah J. Durst & Esther Sullivan
To cite this article: Noah J. Durst & Esther Sullivan (2019): The Contribution ofManufactured Housing to Affordable Housing in the United States: Assessing VariationAmong Manufactured Housing Tenures and Community Types, Housing Policy Debate, DOI:10.1080/10511482.2019.1605534
To link to this article: https://doi.org/10.1080/10511482.2019.1605534
Published online: 11 Jun 2019.
Submit your article to this journal
Article views: 70
View Crossmark data

The Contribution of Manufactured Housing to AffordableHousing in the United States: Assessing Variation AmongManufactured Housing Tenures and Community TypesNoah J. Durst a and Esther Sullivanb
aSchool of Planning, Design and Construction, Michigan State University, East Lansing, USA; bDepartment ofSociology, University of Colorado Denver, USA
ABSTRACTManufactured housing (MH) is a central component of affordable hous-ing in the United States. Yet the MH tenure ranges from manufacturedhomes on privately owned property to rental units, to owned homesplaced on rented lots in mobile home parks. Despite the widespread useof MH, no current research has analyzed the high level of internalvariation within MH or documented how this variation impacts housingaffordability between MH tenures. Moreover, little is known about thedegree of segregation of manufactured homes, which are often clusteredin mobile home parks and informal subdivisions. This study representsa first-time national analysis of demographic, spatial, and affordabilitycharacteristics with regard to variation between MH tenures, using datafrom the American Housing Survey. By disaggregating various MHtenures and clustered community arrangements, we detail the demo-graphic and geographic characteristics of MH households by housingtenure, analyze how housing costs differ across MH tenures, and demon-strate that MH is highly segregated from the conventional housing stockin a way that impacts housing affordability. These findings offer policyprescriptions for MH policy specifically and may contribute to broaderaffordable housing policy in the United States.
ARTICLE HISTORYReceived 6 October 2018Accepted 6 April 2019
KEYWORDSmanufactured housing;tenure; affordability;informality
Manufactured homes, more often called mobile homes or trailers, house approximately 18 millionresidents (U.S. Census Bureau, 2010) and provide the largest source of unsubsidized affordablehousing in the United States (CFED, 2011). Unlike conventional homes, which are built on site,manufactured homes are homes built on a chassis in a factory and then transported and installedon a site.1 Factory production lowers the cost of manufactured housing units and contributes totheir widespread use as a form of low-income housing, although it may also contribute to commonperceptions that manufactured homes are substandard and impermanent structures (Apgar,Calder, Collins, & Duda, 2002; Beamish, Goss, Atiles, & Kim, 2001). Nonetheless, today manufacturedhomes make up a substantial portion of U.S housing. The Joint Center for Housing Studiesestimated that two thirds of all affordable units added to the U.S. housing stock in the 1990swere manufactured homes (Apgar et al., 2002).
Manufactured housing (MH) is widely overlooked in both academic scholarship and housingpolicy (Sullivan, 2018). Moreover, the few studies that document the widespread use of MH asaffordable housing treat it as a monolith, comparing owned MH with owned or rented conven-tional housing (Boehm, 1995; Boehm & Schlottman, 2008; Owens, 1996). These studies are
CONTACT Esther Sullivan [email protected]
HOUSING POLICY DEBATEhttps://doi.org/10.1080/10511482.2019.1605534
© 2019 Virginia Polytechnic Institute and State University
important in that they provide a baseline analysis of MH, but several features necessitate a morenuanced understanding of this housing form. MH is not only widespread and central to theU.S. affordable housing stock, but it is also a highly diverse and adaptable housing form. Fourkey features of MH contribute to the high level of variation within MH tenures.
First, MH plays a crucial role in both urban and rural affordable housing stocks. As the analysisbelow demonstrates, about half of MH units (54%) are located in nonmetropolitan areas, yet 46%(2.98 million MH units) are found in metropolitan parts of the country.2 Thus, MH representsa substantial, although understudied, supply of affordable housing for metropolitan residents aswell as for those in nonmetropolitan areas.3
Second, manufactured homes are both rented and owner occupied. As the analysis belowshows, there are over 1.7 million MH renter households and more than 5.3 MH homeownersin the United States. However, the different links between owned and rented MH and factorssuch as location and affordability have yet to be systematically studied.
Third, owner-occupied MH is also differentiated by the tenure of land itself. Some manufacturedhomes are located on property owned by homeowners, whereas others are located on propertyowned by landlords in mobile home park (MHP) tenures. Popular images perpetuate a notion thatmanufactured homes are primarily located in MHPs (Sullivan, 2018). As the analysis illustrates,however, more than half of MH households live on property they also own, whereas only abouttwo out of five live on rented land within MHPs. This variation in ownership structures may haveimportant implications for the housing affordability and tenure security of low-income households,warranting more nuanced comparison between MH tenures.
Fourth, mobile homes play an important but understudied role in expanding homeownershipfor low-income and minority households in so-called informal subdivisions (ISs) across the country(described in greater detail below; also see Durst, 2018). Informal housing in the United States hasreceived a wave of scholarly interest in recent years (Durst & Wegmann, 2017; Herbert, 2018;Mukhija & Mason, 2015; Wegmann & Mawhorter, 2017), as have ISs specifically (Larson, 2002; Way,2010), including in metropolitan areas (Durst, 2018; Sullivan & Olmedo, 2015; Ward & Peters, 2007).The widespread use of MH as a source of owner-occupied housing in ISs makes these communitiesan important although potentially distinct dimension of MH specifically, and of affordable housingmore generally.
Recent housing scholarship has called for increased attention to “the vast diversity of housingtenures in the United States” (Wegmann, Schafran, & Pfeiffer, 2016, p. 194). Despite the widespreaduse of MH as affordable housing in the United States, no current research has analyzed the highlevel of internal variation within MH tenures or documented how this variation impacts housingaffordability between various MH tenures. Moreover, little is known about the clustering ofmanufactured homes in MHPs and ISs across the country. Disaggregating various MH tenuresshould uncover the degree to which MH is segregated within these communities. Recent researchon homeownership (McCabe, 2016) has identified housing tenure segregation (residential separa-tion between homeowners and renters) as a notable dependent and independent variable inanalysis of housing policy. Research has demonstrated that low-income renter households areconcentrated in low-income neighborhoods, and examined the implications for renter households(De Luca, Garboden, & Rosenblatt, 2013). Yet no study has examined the implications of clusteringfor the low-income households living in MH.
This study represents a first-time national analysis of demographic, spatial, and affordability char-acteristics with regard to variation betweenMH tenures. We begin by using data from the 2013wave ofthe American Housing Survey (AHS), a nationally representative survey of housing units in the UnitedStates, to distinguish between three MH tenure types: MH owners (those who own both the dwellingand the land); MH renters (those who rent both the dwelling and the land); and MH owner/renters(those who own the dwelling but rent the land). We then use the AHS data to identify MH in twodistinct community types: MHPs and ISs. Our analysis focuses on the following research questions:
2 N. J. DURST AND E. SULLIVAN
(1) What MH tenures are associated with higher levels of affordability?(2) How prevalent is the clustering of MH units into two major MH community types—ISs and
MHPs—and how are these communities distributed across the country?(3) How do the demographic/socioeconomic characteristics of residents, the physical character-
istics of housing units, and the characteristics of neighborhoods differ between ISs andMHPs?
(4) Does housing affordability differ between ISs and MHPs?
In the following section, we identify key gaps in existing research on MH. We then describe thedata and methods used in our analysis, before discussing the key findings. Our results providea nuanced account of the affordability of MH by tenure, set the stage for future research on MH inboth metro and nonmetropolitan areas, and demonstrate that MH is highly segregated from theconventional housing stock in a way that impacts housing affordability. These findings offer policyprescriptions for MH policy specifically and may contribute to broader affordable housing policy inthe United States.
Literature Review
National analyses of MH have been undertaken primarily as industry reports (Consumers Union,2001a, 2001b) or policy papers (Apgar et al., 2002; Carter, Williamson, DeArmond, & Sheldon, 2004;CFPB, 2014; Vermeer & Louie, 1997). These studies are essential in establishing the key sociodemo-graphic characteristics of MH households and charting the growth of MH as a form of low-incomehousing in the United States. Taken together, these studies establish that MH is unique in threeprimary areas: the demographic characteristics of MH households, the spatial characteristics of MHlocations, and the levels of affordability provided by the MH stock.
Demographics of MH Households
MH is demonstrated to house a large low-income population (Apgar et al., 2002; Beamish et al.,2001; Boehm & Schlottman, 2008). The median income for MH households is only half that ofhouseholds in conventional homes (CFPB, 2014). Additionally, older households, householdswith only a high school degree, and households with relatively low net worth are all dispro-portionately represented among MH households (CFPB, 2014). Elderly households are especiallyprevalent in MH, where 32% of households are headed by a retiree (compared with 24% forconventional homes; CFPB, 2014). These households are also more financially insecure; themedian net worth of MH households is about one quarter of the net worth of households inconventional homes (CFPB, 2014). Although existing studies clearly demonstrate that MH house-holds are primarily low-income residents who utilize MH to access affordable housing and low-cost homeownership (Beamish et al., 2001), little research analyzes how various MH tenurescontribute to these goals.
Spatial Characteristics of MH
Common perceptions depict MH as a primarily rural housing type (Soloman & MacTavish, 2017). Inpart, this is attributable to the fact that MH accounts for about 6% of all occupied housing unitsnationwide, but approximately 14% of housing units in nonmetropolitan counties (CFPB, 2014).However, existing studies also demonstrate that MH is found across metropolitan parts of thecountry (Boehm & Schlottmann, 2008). Importantly, however, these studies do not examine howspecific MH tenures (MH owners, MH renters, and MH owners/renters) are distributed acrossmetropolitan or nonmetropolitan regions or how these tenures contribute to the affordablehousing stock in these areas.
HOUSING POLICY DEBATE 3
Affordability of MH
Despite its important role in providing affordable housing in the United States, there is a relativedearth of research on MH within housing and urban scholarship (Sullivan, 2018). The most in-depthstudies available are important in filling this gap, showing that MH as a whole offers deep levels ofaffordability (Beamish et al., 2001; Boehm & Schlottman, 2008). A new manufactured home costsless than half per square foot what a new site-built home costs (U.S. Census Bureau, 2017), andthroughout the 1990s MH was responsible for 66% of the new affordable housing produced in theUnited States (Apgar et al., 2002). However, the affordability of MH is likely dependent on a varietyof factors that have yet to be studied. For example, whether the manufactured home is owned,rented, or located on leased land in a divided MH owner/renter arrangement is a central determi-nant of housing costs, since land makes up a major portion of total housing costs, and different MHtenures are associated with different land tenures. Additionally, little is known about how afford-ability differs across the predominant MH community types where these different MH tenures arecommon: MHPs and ISs.
The Clustering of MH: MHPs and ISs
The image of the trailer park dominates public perceptions of MH. Certainly, MHPs, more colloqui-ally called trailer parks, contain a sizable portion of the nation’s MH.4 According to estimates by theU.S. Census Bureau (2017), approximately one third of new U.S. mobile homes are placed in MHPs.The communities that we collectively term MHPs for the purposes of this analysis vary significantlyin community age and size, in the type and quality of MH units they contain, and in themaintenance and amenities offered by the community. Despite this variation in communityattributes, a common housing tenure distinguishes these communities, whether they are termedtrailer parks, MH communities, or (most common in the academic literature) mobile home parks(Beamish et al., 2001; Dawkins & Koebel, 2009; Kusenbach, 2009, 2017; Sullivan, 2018; Wallis, 1991).MHPs are land-lease communities, where residents rent lots from park owners (whether they thenown or rent their home). MHPs are developed and owned by private landlords. MHP residentspurchase homes on site in MHPs or from MH retailers, most often using chattel loans that resemblepersonal property loans rather than formal mortgages (Sullivan, 2018). MHP residents then leasethe land from the landlord, often on a month-to-month basis. Homes in MHPs may also be rented,but the distinction between the home rent and the lot rent remains. MHP residents are subject tofrequent lot rent increases and additional park fees (CFED, 2011; Consumers Union, 2001b). Thisform of “divided asset ownership” (Hirsch & Rufolo, 1999) or “halfway homeownership” (Sullivan,2014) means that MHPs are characterized by high levels of housing insecurity, since residents’investment in their homes depends upon landlords’ decisions to continue to operate and maintainthe parks where their homes are placed (CFED 2011; Consumers Union, 2001b). MHPs are alsospatially distinct. In metropolitan areas, local laws and zoning codes often require that mobilehomes be located exclusively within MHPs and segregated from single-family housing (Dawkins &Koebel, 2009). This often means MHPs are isolated into commercial and industrial zones and keptseparate from conventional housing. These organizational and spatial characteristics make MHPhousing unique and may have important implications for the affordability of MH located in MHPs.
However, as we will describe below, a large proportion of MH is not located in MHPs, but ratheron land owned by the MH homeowner. A substantial number of these manufactured homes arelocated in what we call informal subdivisions (Durst, 2018; Durst & Wegmann, 2017), communitiesthat are thus far less recognized by scholars as a distinct neighborhood type worthy of systematicstudy. ISs are, as the name suggests, residential subdivisions that are developed with austere levelsof infrastructure and services (often lacking paved roads, sidewalks, streetlights, sewer service, andsometimes even piped water and electricity) and under minimal regulatory control—often guidedby subdivision regulation but not by zoning or building codes (Durst, 2016, 2018; Durst & Ward,
4 N. J. DURST AND E. SULLIVAN

2016; Larson, 2002; Ward & Peters, 2007). Residents in ISs most often use developer financing topurchase tracts of land and begin incremental building on these lots (Durst & Ward, 2016; Stroud,1995). Land developers often employ exploitative sales tactics and high interest rates, and some-times make false promises regarding the provision of infrastructure (Olmedo & Ward, 2016; Stroud& Spikowski, 1999; Ward, 1999). Many residents rely on self-help, building the home themselvesover many years—but in the interim period, many live in older, dilapidated manufactured homes(Durst, 2016). Relatively little is known about the extent of these communities across the country ortheir contribution to the affordable housing stock. However, an analysis of unincorporated com-munities in metropolitan and micropolitan areas across the country suggests that as many as 35%of manufactured homes may be located in ISs and that they play a key role in expanding affordablehousing options for minorities and the poor (Durst, 2018).
The four images in Figure 1 highlight the variation among MHP communities and distinguishthe land-use patterns found in MHPs and ISs. These images show: (a) an older MHP of single-section mobile homes in Austin, Texas; (b) a high-amenity MHP of double-section mobile homesoutside Lansing, Michigan; (c) an IS in Hidalgo County, Texas, that is a mix of mobile homes andsite-built dwellings, including one unfinished home (just cinderblock walls); and (d) an IS north ofDenver, Colorado. These photos highlight the variation in housing conditions within MHP and IScommunity types and also demonstrate how these communities can often be distinguished byanalyzing their physical footprint. Here we used county property records to confirm that a andb are MHPs, since all of the housing units shown are located on a single parcel, whereas c and d areISs, since each housing unit is located on an individually owned lot.
Data
This study relies on data from the 2013 wave of the AHS.5 The AHS is a nationally representativesurvey of housing units (i.e., the AHS follows housing units, not households, over time)conducted biennially in odd-numbered years. The AHS includes a range of variables measuringthe type, quality, and age of housing units and the socioeconomic and demographic character-istics of households. Most importantly for this study, the AHS includes detailed data on thetenure status of households residing in MH as well as the characteristics of housing in theneighborhood.
Figure 1. The physical footprint of informal subdivisions and mobile home parks.
HOUSING POLICY DEBATE 5

We use three variables in the AHS to identify MH and to distinguish different MH tenurearrangements: MH owners, MH renters, and MH owner/renters. We first identified MH units inthe AHS using the variable TYPE. We then disaggregated MH tenures based on whether thehousehold owned or rented either the dwelling itself (TENURE) or the land on which it sits(OWNLOT). This led to four MH tenure types, three of which are used in this study: MH ownersown both the dwelling and the land (in total, there were 990 survey responses in this category); MHowner/renters own the dwelling but rent the land (761 responses); and MH renters rent both thedwelling and the land (393 responses). Cases in which the land was owned but the dwelling wasrented were exceedingly rare (32 cases, or approximately 1% of mobile homes captured by the2013 wave of the AHS), so this category is excluded from the analysis that follows. Disaggregatingthe various types of MH tenures in this manner allows us to examine whether the affordability ofMH differs according to MH tenure status. This is one of the core analytical contributions of thisarticle. In the first set of analyses that follow, we use sampling weights (WEIGHT) provided by theAHS to produce national estimates.
We also examine the clustering of mobile homes to distinguish between MHPs and ISs. To ourknowledge, this is the first effort to distinguish between these two communities using data fromthe AHS. We used the variable NHDBLDMH, which identifies whether the housing unit in questionwas located within one half block of another manufactured home, to identify MH units located inone of two community types—MHPs and ISs. We classified MH units as being located in an IS ifthey were located on land owned by the household and were located within one half block ofanother manufactured home. We classified manufactured homes as being in an MHP if they werelocated on rented land (regardless of whether the dwelling unit was owned or rented) and werelocated within one half block of another manufactured home. Any housing units that were notlocated in close proximity to another manufactured home were considered scattered sites andwere excluded from the analysis that follows. We weighted estimates of the characteristics of ISsand MHPs using an alternative sampling weight (SPLTWGT2) to account for the fact that thequestion regarding proximity to a mobile home (NHDBLDMH) was asked of only approximatelyhalf of households.
One important limitation of this method of classification is that it will tend to overestimate thenumber of dwellings located in MHPs and underestimate (possibly substantially) the number ofhomes in ISs. This is true for two primary reasons. First, our classification of MHPs includes all MHowner/renters (i.e., those who own the home but rent the land) and MH renters (those who rentboth the land and dwelling) that are located within one half block of another mobile home. Some,and perhaps many, of these MH owner/renters and MH renters may, in fact, be located in ISs onseparate parcels that are leased from the owner of the lot. If this is the case, it will artificially inflateour estimates of the number of housing units located in MHPs and deflate our estimates of thenumber of housing units in ISs. Second, although MH units are commonplace in ISs, site-builtdwellings are as well (Durst, 2016, 2018). For example, in a study of ISs in Texas, Durst (2016)illustrated that in newer ISs the share of dwellings that are mobile homes is close to 50%, whereasin older ISs less than a quarter of dwellings are mobile homes. This transition away from mobilehomes parallels the construction and expansion of site-built homes, often through self-help (Durst& Ward, 2016). Taken together, these two factors suggest that our analysis captures the phenom-enon of MH clustering but likely overestimates the number of housing units located in MHPs andunderestimates the number in ISs.
Below we examine the affordability of various mobile home tenures—mobile home owners,mobile home owner/renters, and mobile home renters—in comparison with conventional home-ownership and conventional rental tenures. We use total monthly housing costs, which entail thesum of all real-estate-related costs and the cost of utilities and services, as a baseline comparison ofhousing costs across housing types and tenures. However, to account for the fact that thecharacteristics of both housing units and the households that reside in them may differ acrosstenure categories, we also measure housing costs per square foot and cost-to-income ratios.6
6 N. J. DURST AND E. SULLIVAN
Lastly, to account for the fact that housing costs differ widely by market condition, we measurehousing costs relative to the local fair market rent (FMR)7 using a cost-to-FMR ratio.
We then turn to a detailed analysis of the two primary communities in which mobile homes areclustered: MHPs and ISs. We estimate the number of mobile homes in each type of community,their geographic distribution across metropolitan and nonmetropolitan areas and across the fourregions in the country, the demographic and socioeconomic characteristics of residents in thesecommunities, and key characteristics of the housing units themselves and of the neighborhoods inwhich they are located. We conclude with an analysis of four measures of affordability and howthey differ across the types of communities studied here.
Findings
The Affordability of Manufactured Home Tenures
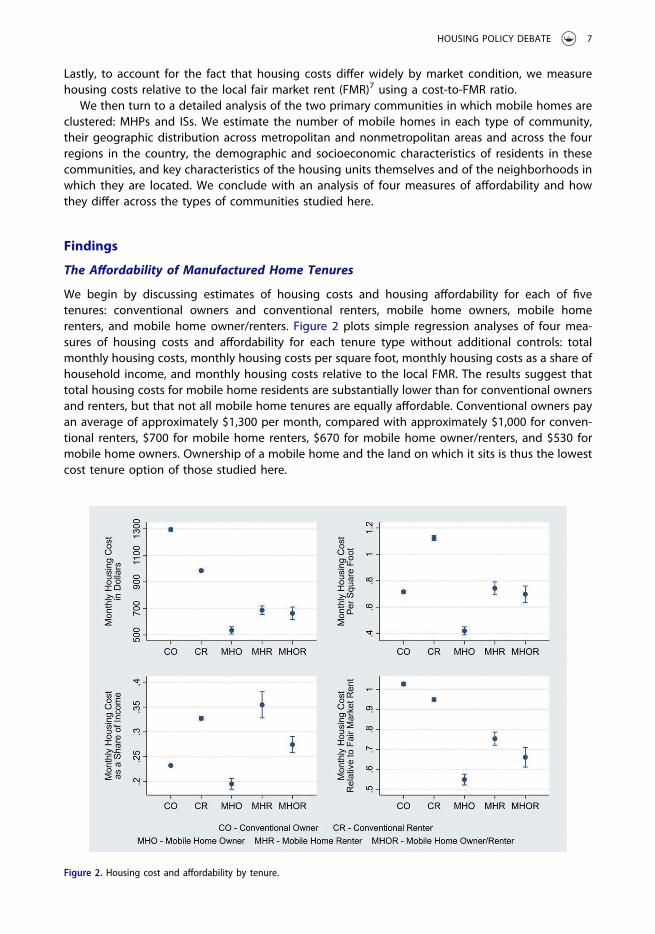
We begin by discussing estimates of housing costs and housing affordability for each of fivetenures: conventional owners and conventional renters, mobile home owners, mobile homerenters, and mobile home owner/renters. Figure 2 plots simple regression analyses of four mea-sures of housing costs and affordability for each tenure type without additional controls: totalmonthly housing costs, monthly housing costs per square foot, monthly housing costs as a share ofhousehold income, and monthly housing costs relative to the local FMR. The results suggest thattotal housing costs for mobile home residents are substantially lower than for conventional ownersand renters, but that not all mobile home tenures are equally affordable. Conventional owners payan average of approximately $1,300 per month, compared with approximately $1,000 for conven-tional renters, $700 for mobile home renters, $670 for mobile home owner/renters, and $530 formobile home owners. Ownership of a mobile home and the land on which it sits is thus the lowestcost tenure option of those studied here.
Figure 2. Housing cost and affordability by tenure.
HOUSING POLICY DEBATE 7
Alternative measures of housing costs and affordability provide a more nuanced portrait ofdifferences between the tenure types. Measured relative to the size of the dwelling, mobile homeowners also have the lowest housing costs, with an average monthly housing cost of approxi-mately $0.40 per square foot, compared with approximately $0.70 for conventional owners, mobilehome renters, and mobile home owner/renters. The least affordable tenure option on a squarefootage basis is conventional renting, where the average household pays approximately $1.10 permonth per square foot. Mobile home owners also allocate a lower proportion of their incometoward housing (approximately 20%) than do conventional owners (23%), mobile home owner/renters (27%), conventional renters (33%), and mobile home renters (35%). This last statistic isstriking, as it illustrates that living in a rented mobile home on leased land is not affordable for theaverage household. Lastly, our analysis of housing costs relative to the FMR suggests that mobilehome owners have housing costs that are approximately 55% of the local FMR—this tenure optionis therefore more affordable than the mobile home owner/renter tenure (with a 65% cost-to-FMRratio) and mobile home renter tenure (75% cost-to-FMR ratio) and substantially more affordablethan the conventional renter (95%) and conventional owner (103%) tenures.
The Clustering of MH: Evidence Regarding the Prevalence of ISs and MHPs
Given that mobile home tenures appear to be accompanied by wide variation in housing costs andaffordability, it is a salient policy question to consider whether the two major types of communitiesin which mobile homes are commonplace—ISs and MHPs—also differ in affordability as well as inthe characteristics of residents who live in them, the quality of housing, and the broader conditionof the neighborhood. We now turn to that analysis.
We begin by providing estimates of the number and share of housing units located in each typeof community, disaggregated by metropolitan and nonmetropolitan regions. Our analysis suggeststwo broad conclusions: (a) MH in the United States is highly segregated from other types ofhousing; (b) the distribution of MHPs and ISs varies markedly across urban and rural geographies.
We estimate that of the nearly 7 million occupied mobile homes in the country, approximately69% are located within one half block of another manufactured home, compared with only 4% ofconventional owners and conventional renters. This substantial degree of clustering points eitherto the self-sorting of mobile home residents into MHPs or ISs, perhaps for lifestyle or affordabilityreasons, or to land-use regulation and housing policies that lead to the concentration of MH inspecific areas (Dawkins & Koebel, 2009). Our analysis suggests that 30% of the occupied manu-factured homes in the country (or nearly 2.1 million in total) are located in an IS whereasapproximately 39% (or 2.7 million) are located in an MHP. These two types of community aretherefore home to more than two thirds of the occupied mobile homes in the country.
Our analysis indicates that ISs and MHPs are distributed unevenly across the geography of thecountry. As illustrated in Table 1, the vast majority of ISs are located in the South. This is not drivensolely by the fact that the South contains a disproportionate number of housing units as a whole:for example, although 37% of the nation’s occupied housing units are located in the South,a remarkable 75% of mobile homes in ISs are located there, compared with only 15% in theWest, 6% in the Midwest, and 4% in the Northeast. This is likely driven by the widespreaddevelopment of ISs in states such as Florida prior to the adoption of stricter land-use regulationin unincorporated areas, and the ongoing proliferation of ISs in Texas. Notably, MHPs are moreevenly distributed across the country’s four regions: approximately 43% of the mobile homes inMHPs are located in the South, 24% in the West, 21% in the Midwest, and 10% in the Northeast.The distribution of MHPs therefore more closely parallels the distribution of all housing units acrossthe country, where 37%, 22%, 22%, and 18% are located in the South, West, Midwest, andNortheast, respectively.
ISs and MHPs are also distributed unevenly across the range of urban and rural contexts. Ouranalysis, shown in Table 1, suggests that 58% of housing units in ISs are located in rural parts of
8 N. J. DURST AND E. SULLIVAN
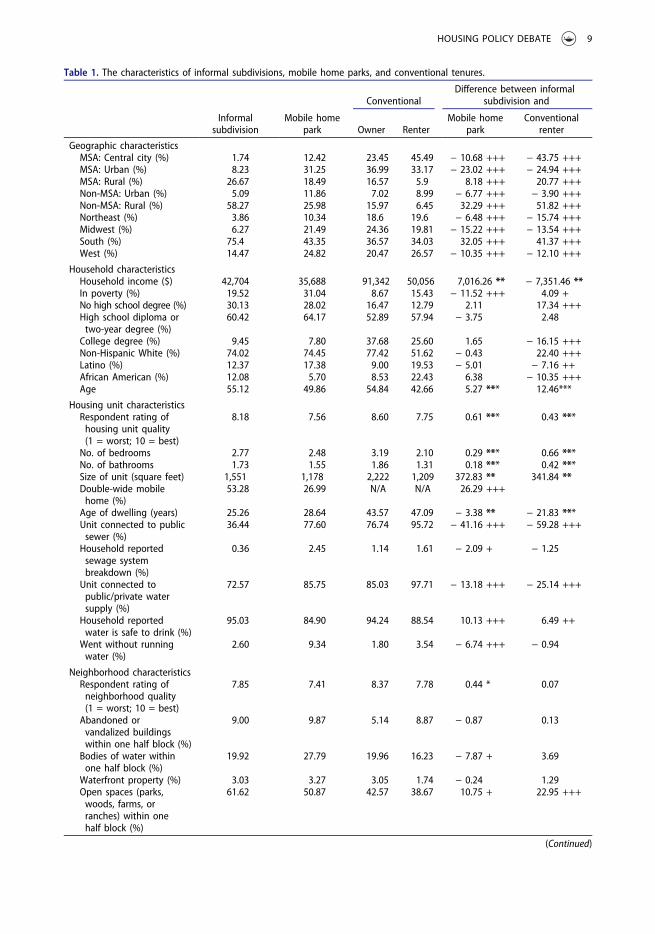
Table 1. The characteristics of informal subdivisions, mobile home parks, and conventional tenures.
ConventionalDifference between informal
subdivision and
Informalsubdivision
Mobile homepark Owner Renter
Mobile homepark
Conventionalrenter
Geographic characteristicsMSA: Central city (%) 1.74 12.42 23.45 45.49 − 10.68 +++ − 43.75 +++MSA: Urban (%) 8.23 31.25 36.99 33.17 − 23.02 +++ − 24.94 +++MSA: Rural (%) 26.67 18.49 16.57 5.9 8.18 +++ 20.77 +++Non-MSA: Urban (%) 5.09 11.86 7.02 8.99 − 6.77 +++ − 3.90 +++Non-MSA: Rural (%) 58.27 25.98 15.97 6.45 32.29 +++ 51.82 +++Northeast (%) 3.86 10.34 18.6 19.6 − 6.48 +++ − 15.74 +++Midwest (%) 6.27 21.49 24.36 19.81 − 15.22 +++ − 13.54 +++South (%) 75.4 43.35 36.57 34.03 32.05 +++ 41.37 +++West (%) 14.47 24.82 20.47 26.57 − 10.35 +++ − 12.10 +++
Household characteristicsHousehold income ($) 42,704 35,688 91,342 50,056 7,016.26 ** − 7,351.46 **In poverty (%) 19.52 31.04 8.67 15.43 − 11.52 +++ 4.09 +No high school degree (%) 30.13 28.02 16.47 12.79 2.11 17.34 +++High school diploma ortwo-year degree (%)
60.42 64.17 52.89 57.94 − 3.75 2.48
College degree (%) 9.45 7.80 37.68 25.60 1.65 − 16.15 +++Non-Hispanic White (%) 74.02 74.45 77.42 51.62 − 0.43 22.40 +++Latino (%) 12.37 17.38 9.00 19.53 − 5.01 − 7.16 ++African American (%) 12.08 5.70 8.53 22.43 6.38 − 10.35 +++Age 55.12 49.86 54.84 42.66 5.27 *** 12.46***
Housing unit characteristicsRespondent rating ofhousing unit quality(1 = worst; 10 = best)
8.18 7.56 8.60 7.75 0.61 *** 0.43 ***
No. of bedrooms 2.77 2.48 3.19 2.10 0.29 *** 0.66 ***No. of bathrooms 1.73 1.55 1.86 1.31 0.18 *** 0.42 ***Size of unit (square feet) 1,551 1,178 2,222 1,209 372.83 ** 341.84 **Double-wide mobilehome (%)
53.28 26.99 N/A N/A 26.29 +++
Age of dwelling (years) 25.26 28.64 43.57 47.09 − 3.38 ** − 21.83 ***Unit connected to publicsewer (%)
36.44 77.60 76.74 95.72 − 41.16 +++ − 59.28 +++
Household reportedsewage systembreakdown (%)
0.36 2.45 1.14 1.61 − 2.09 + − 1.25
Unit connected topublic/private watersupply (%)
72.57 85.75 85.03 97.71 − 13.18 +++ − 25.14 +++
Household reportedwater is safe to drink (%)
95.03 84.90 94.24 88.54 10.13 +++ 6.49 ++
Went without runningwater (%)
2.60 9.34 1.80 3.54 − 6.74 +++ − 0.94
Neighborhood characteristicsRespondent rating ofneighborhood quality(1 = worst; 10 = best)
7.85 7.41 8.37 7.78 0.44 * 0.07
Abandoned orvandalized buildingswithin one half block (%)
9.00 9.87 5.14 8.87 − 0.87 0.13
Bodies of water withinone half block (%)
19.92 27.79 19.96 16.23 − 7.87 + 3.69
Waterfront property (%) 3.03 3.27 3.05 1.74 − 0.24 1.29Open spaces (parks,woods, farms, orranches) within onehalf block (%)
61.62 50.87 42.57 38.67 10.75 + 22.95 +++
(Continued)
HOUSING POLICY DEBATE 9

nonmetropolitan areas, whereas 26% are located in rural parts of metropolitan areas. Less than 2%and approximately 8% are located in central cities or urban parts of metropolitan areas, respec-tively, and only 5% are located in urban parts of nonmetropolitan areas. This suggests that ISs areprimarily a rural phenomenon. MHPs exist in significant numbers within central cities and urba-nized areas: 12% of the housing units in MHPs are located within a central city, 31% are located inan urban part of a metropolitan area, and 18% are located in a rural part of an MSA, whereas 12%and 26% are located in urban or rural parts of nonmetropolitan areas, respectively. This unevendistribution of ISs and MHPs across the geography of the country may be accompanied bydifferences in the characteristics of residents, the nature and quality of housing and neighborhoodconditions, and the level of affordability that mobile homes provide. We now turn to theseanalyses.
Household Characteristics
We examined selected socioeconomic and demographic characteristics of households in ISs andMHPs as well as for conventional renters and conventional owners. These results are presented inTable 1. We also conducted comparisons of means tests and chi-square tests to examine whetherthe characteristics of residents in ISs differed from those of residents in MHPs or those of conven-tional renters. The significance of these tests is shown in the last two columns of Table 1. Thesocioeconomic profile of these communities illustrates that households in ISs, and especially inMHPs, are more economically disadvantaged than the average renter or owner household in theUnited States. For example, our findings suggest that household incomes in ISs ($42,704) are higheron average than in MHPs ($35,688), although they are still markedly lower than those of conven-tional owners ($91,342) and conventional renters ($50,056). Similarly, as illustrated in Table 1,households residing in MHPs are more likely to be living in poverty (31%), compared with 20%of households in ISs and 15% and 9% of conventional renters and conventional owners, respec-tively. Educational attainment by heads of household in MHPs and ISs is statistically indistinguish-able; however, residents in both of these communities are substantially less likely to have a college
Table 1. (Continued).
ConventionalDifference between informal
subdivision and
Informalsubdivision
Mobile homepark Owner Renter
Mobile homepark
Conventionalrenter
Businesses/institutions(stores, restaurants,schools or hospitals)within one half block (%)
9.53 25.40 19.16 47.96 − 15.87 +++ − 38.43 +++
Minor road repairsneeded (%)
36.24 34.76 28.16 34.55 1.48 1.69
Major road repairsneeded (%)
10.83 8.98 5.09 6.83 1.85 4.00
No roads present (%) 1.55 2.30 2.32 1.35 − 0.75 0.20
Housing costsMonthly housing cost ($) 486.24 660.61 1,309.86 993.28 − 174.37 *** − 507.03 ***Cost per square foot ($) 0.41 0.69 0.71 1.09 − 0.28 *** − 0.68 ***Housing cost as a shareof income (%)
18.94 30.33 23.14 32.68 − 11.40 *** − 13.74 ***
Housing cost as a shareof the fair market rent(%)
50.62 68.27 104.16 95.55 − 17.66 *** − 44.93 ***
Fair market rent ($) 957.23 982.33 1,241.97 1,043.83 − 25.11 − 86.61 ***
Note. MSA = metropolitan statistical area.Difference in means test: * p < .05, ** p < .01, *** p < .001; Chi-square test: + p < .05, ++ p < .01, +++ p < .001.
10 N. J. DURST AND E. SULLIVAN
degree and substantially more likely to have not graduated from college than are conventionalowners and conventional renters.
The demographic profile of these communities also provides some interesting insights. Theaverage head of household in ISs is 55 years of age, on par with the age of conventional ownersand substantially higher than the age of MHP household heads (50) and conventional renters (43).8
Notably, non-Hispanic Whites represent approximately three quarters of heads of household in ISs,MHPs, and the conventional owner tenure, but only half of heads of household in the conventionalrenter tenure. Latinos and African Americans, on the other hand, both make up approximately 12%of heads of household in ISs, marginally more than their share among conventional owners(approximately 9%).9 This reaffirms findings from prior research (Durst, 2018; Durst & Ward, 2016;Durst & Wegmann, 2017) suggesting that ISs provide an important means of access to home-ownership opportunities for racial and ethnic minorities. Interestingly, 17% of heads of householdin MHPs are Latino, whereas only 6% of heads of household in MHPs are African American.
Housing Unit and Neighborhood Characteristics
We examined housing and neighborhood conditions in ISs and MHPs compared with conventionalownership and renting. In general, our analysis suggests that residents in ISs are relatively contentwith their housing units and that, compared with other tenure arrangements, housing units in ISs—at least across the country—offer a number of benefits and relatively few disadvantages. Asillustrated in Table 1, when asked to rate their housing unit on a scale of 1 (worst) to 10 (best),the average respondent in ISs reported a value of 8.18. This is lower than the rating of conventionalowners (8.6) but, notably, is statistically significantly higher than that of conventional renters (7.75)and residents in MHPs (7.56). Moreover, houses in ISs are larger than those in MHPs and thoseoccupied by traditional renters, as measured by the total square footage (1,551 square feet vs.approximately 1,200 square feet), the number of bathrooms, and the number of bedrooms. Houses inISs also tend to be newer, are more likely to be double-wide mobile homes, and are more likely tohave central air.
Other measures of the quality of housing units suggest that, across the nation, ISs providea number of benefits and relatively few disadvantages compared with MHPs and conventionalrental tenures. Although only 36% of houses in ISs are connected to public sewers—far less thanthe 77% of housing units in MHPs and 96% of conventional renters—residents in ISs are less likelyto report sewage system breakdowns (.4% of respondents) than are residents in MHPs (2.45%) orconventional renters (1.6%). Similarly, only 73% of housing units in ISs were connected to a publicor private water supply (the vast majority of the rest relied on private wells), compared with 86% ofhousing units in MHPs and 98% of conventional renters. However, 95% of residents in ISs reportedthat their water was safe to drink, compared with 85% of respondents in MHPs and 89% ofconventional renters, whereas only 2.6% of residents in ISs reported that they had once gonewithout running water, compared with 3.5% of conventional renters and a troubling 9% ofresidents in MHPs.
ISs across the country do not appear on average to have major neighborhood problems thatmight contribute to the lower cost of housing. In fact, respondents in ISs rated their neighborhoodquality at 7.85, on average, on a scale of 1 to 10, as indicated in Table 1; this is slightly lower thanthe score for conventional owners (8.37), comparable with that of conventional renters (7.78), andstatistically significantly higher than that of MHP residents (7.41). ISs were no more likely to haveroads in need of major or minor repair than were MHPs or neighborhoods occupied by conven-tional renters. Housing units in ISs were also no more likely to be located near abandoned orvandalized buildings or to be located on waterfront property than were units in MHPs or homes ofconventional renters, although they are more likely to be located near open space and less likely tobe located near businesses—two factors that could be viewed by some respondents as positiveamenities. Notably, the 2013 wave of the AHS did not collect data on sidewalks or streetlights for
HOUSING POLICY DEBATE 11

the cases used in this analysis, and therefore we cannot examine whether these conditions differacross neighborhood types.
Housing Costs and Affordability
The above analysis of housing and neighborhood quality is especially notable given the extremelevels of affordability that come with residing in an IS or MHP, particularly compared withconventional homeownership and conventional rental tenures. In Table 1, we present estimatesof the four measures of housing costs discussed earlier: the monthly housing cost in dollars, thecost in dollars per square foot, housing costs as a percentage of household income, and housingcosts as a percentage of the FMR. These estimates suggest that ISs are the lowest cost housingoption, regardless of how housing cost or affordability is measured. Respondents in ISs reportlower total monthly housing costs, lower costs per square foot, lower cost-to-income ratios, andlower cost-to-FMR ratios.
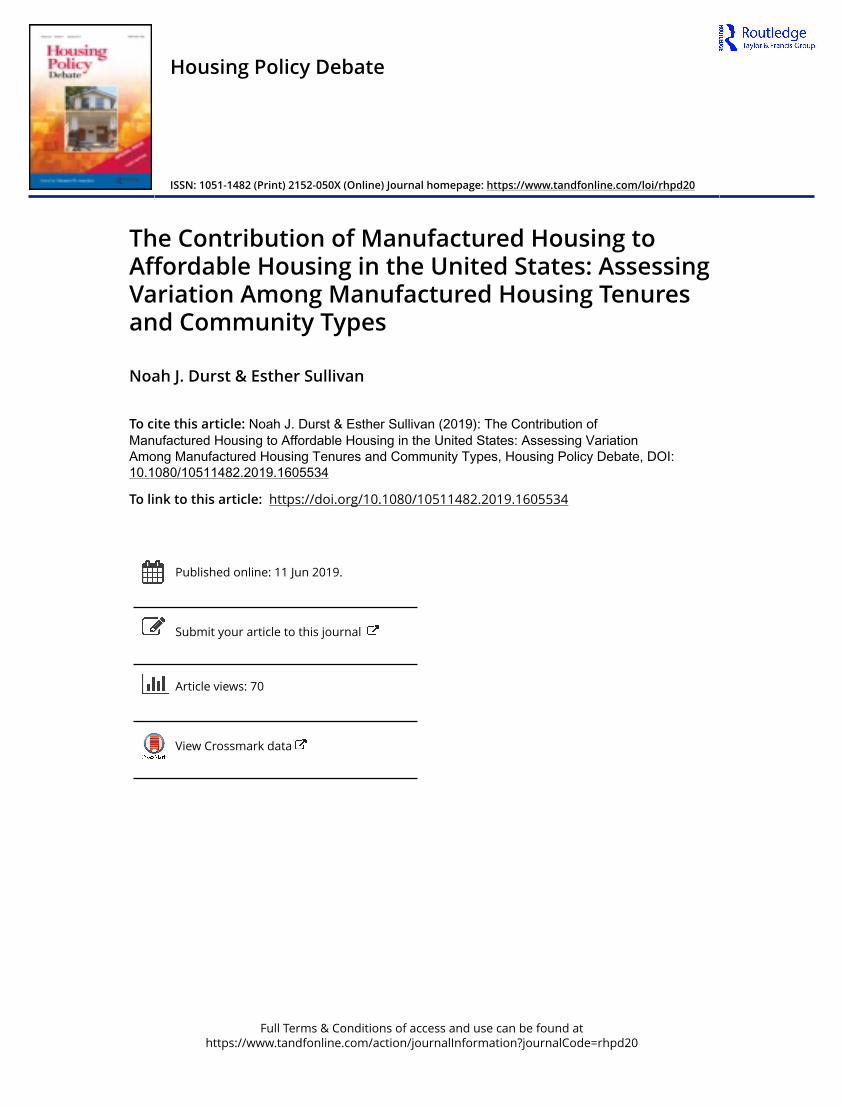
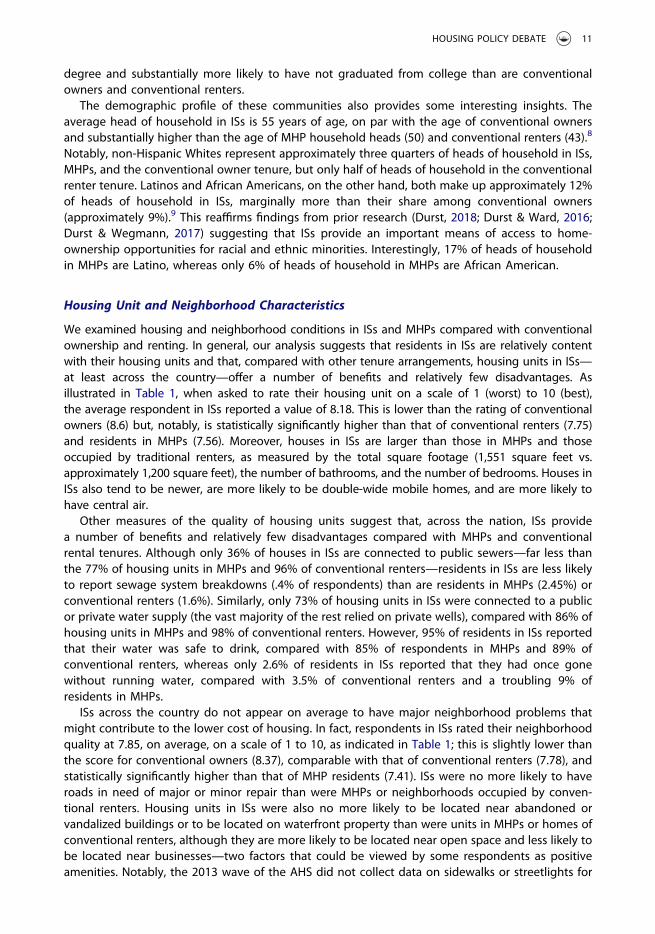
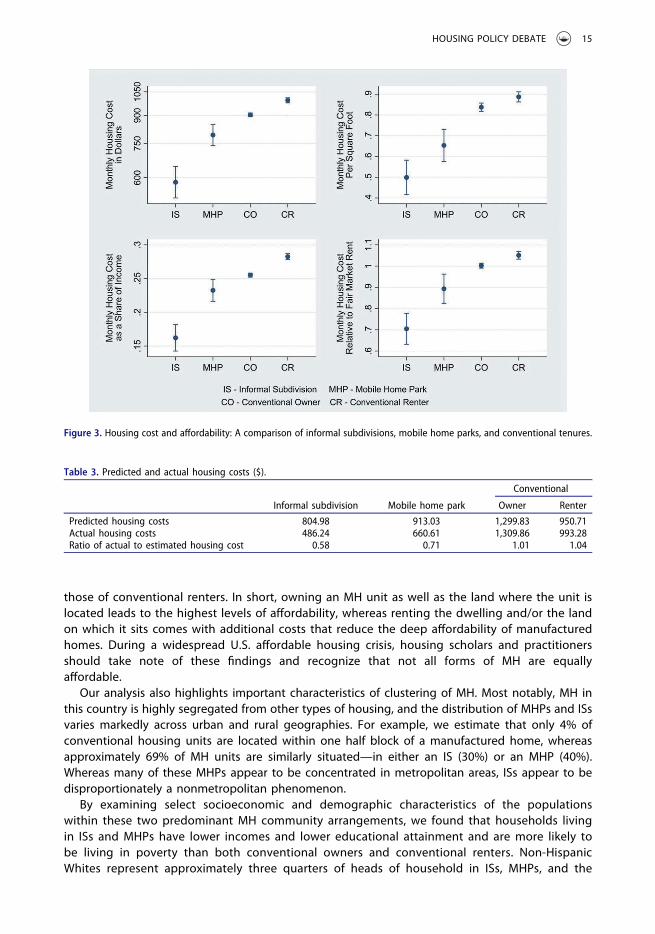
To examine whether the lower cost and greater affordability of ISs persist after controlling forhousing unit, neighborhood, housing market, and geographic factors, we conducted a regressionanalysis that examines the relationship between the various measures of affordability discussedabove while controlling for the variables presented in Table 1. The full results of these regressionsare presented in Table 2 to allow the reader to examine the relationship among all controlvariables. Here, however, we primarily discuss the results of the marginal effects plots, presentedin Figure 3, which examine differences in estimated housing costs and affordability for the variousneighborhood types.
The results suggest that ISs consistently provide a greater degree of affordability compared witheither MHPs or conventional ownership or renting. For example, as shown in the top left plot inFigure 3, households in ISs pay an estimated $600 per month after controlling for the household,housing unit, and neighborhood characteristics discussed above, substantially less than theapproximately $800 paid by residents in MHPs or the $900 and $1,000 paid by conventionalowners and conventional renters, respectively. The affordability of ISs persists after measuringcosts relative to the size of the dwelling, as illustrated in the top right plot in Figure 3. For example,residents in ISs pay approximately $0.50 per square foot per month, significantly less than MHPresidents ($0.65), conventional owners ($0.83 per square foot), and conventional renters ($0.89).
Moreover, as shown in the bottom left of Figure 3, IS households have cost-to-income ratios of17%; these are substantively and statistically significantly lower than the housing cost burdens ofMHP residents (24%), conventional owners (25%), and conventional renters (28%). Lastly, as shownin the bottom right plot of Figure 3, IS residents have housing costs that are approximately 70% ofthe FMR, substantially lower than those of MHP residents (90%), conventional owners (100%) andconventional renters (105%). These results suggest that ISs provide deep levels of affordability,regardless of how that affordability is measured and even when controlling for household, housingunit, neighborhood, and geographic characteristics.
We then sought to further document the relative affordability of the various tenure types byexamining whether and how the actual monthly housing costs reported by the AHS for each of thetenure categories differed from the monthly housing cost that one would expect given thecharacteristics of the housing units themselves or those of the neighborhoods and geographicareas in which they are located. To do so, we estimated a modified version of the models in Table 2in which we used monthly housing costs as the dependent variable and the housing unit,neighborhood, and geographic characteristics shown in Table 1 as the independent variables(i.e., we removed the controls for tenure types as well as those for household characteristics).After estimating the model, we estimated predicted housing costs based on these housing unit,neighborhood, and geographic characteristics for each tenure type. These are presented in Table 3,alongside the actual housing costs from Table 1.
12 N. J. DURST AND E. SULLIVAN
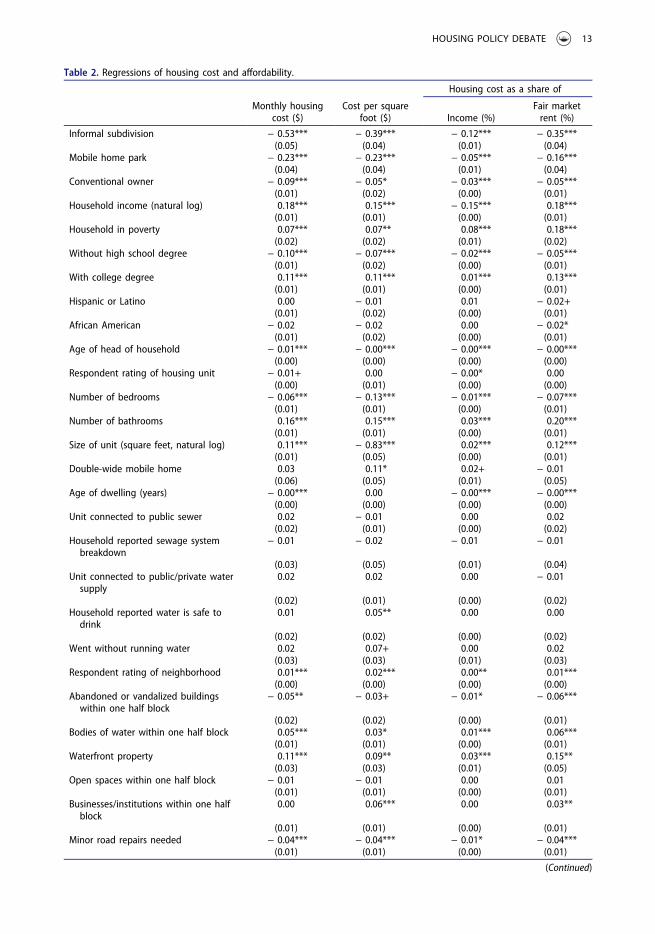
Table 2. Regressions of housing cost and affordability.
Housing cost as a share of
Monthly housingcost ($)
Cost per squarefoot ($) Income (%)
Fair marketrent (%)
Informal subdivision − 0.53*** − 0.39*** − 0.12*** − 0.35***(0.05) (0.04) (0.01) (0.04)
Mobile home park − 0.23*** − 0.23*** − 0.05*** − 0.16***(0.04) (0.04) (0.01) (0.04)
Conventional owner − 0.09*** − 0.05* − 0.03*** − 0.05***(0.01) (0.02) (0.00) (0.01)
Household income (natural log) 0.18*** 0.15*** − 0.15*** 0.18***(0.01) (0.01) (0.00) (0.01)
Household in poverty 0.07*** 0.07** 0.08*** 0.18***(0.02) (0.02) (0.01) (0.02)
Without high school degree − 0.10*** − 0.07*** − 0.02*** − 0.05***(0.01) (0.02) (0.00) (0.01)
With college degree 0.11*** 0.11*** 0.01*** 0.13***(0.01) (0.01) (0.00) (0.01)
Hispanic or Latino 0.00 − 0.01 0.01 − 0.02+(0.01) (0.02) (0.00) (0.01)
African American − 0.02 − 0.02 0.00 − 0.02*(0.01) (0.02) (0.00) (0.01)
Age of head of household − 0.01*** − 0.00*** − 0.00*** − 0.00***(0.00) (0.00) (0.00) (0.00)
Respondent rating of housing unit − 0.01+ 0.00 − 0.00* 0.00(0.00) (0.01) (0.00) (0.00)
Number of bedrooms − 0.06*** − 0.13*** − 0.01*** − 0.07***(0.01) (0.01) (0.00) (0.01)
Number of bathrooms 0.16*** 0.15*** 0.03*** 0.20***(0.01) (0.01) (0.00) (0.01)
Size of unit (square feet, natural log) 0.11*** − 0.83*** 0.02*** 0.12***(0.01) (0.05) (0.00) (0.01)
Double-wide mobile home 0.03 0.11* 0.02+ − 0.01(0.06) (0.05) (0.01) (0.05)
Age of dwelling (years) − 0.00*** 0.00 − 0.00*** − 0.00***(0.00) (0.00) (0.00) (0.00)
Unit connected to public sewer 0.02 − 0.01 0.00 0.02(0.02) (0.01) (0.00) (0.02)
Household reported sewage systembreakdown
− 0.01 − 0.02 − 0.01 − 0.01
(0.03) (0.05) (0.01) (0.04)Unit connected to public/private watersupply
0.02 0.02 0.00 − 0.01
(0.02) (0.01) (0.00) (0.02)Household reported water is safe todrink
0.01 0.05** 0.00 0.00
(0.02) (0.02) (0.00) (0.02)Went without running water 0.02 0.07+ 0.00 0.02
(0.03) (0.03) (0.01) (0.03)Respondent rating of neighborhood 0.01*** 0.02*** 0.00** 0.01***
(0.00) (0.00) (0.00) (0.00)Abandoned or vandalized buildingswithin one half block
− 0.05** − 0.03+ − 0.01* − 0.06***
(0.02) (0.02) (0.00) (0.01)Bodies of water within one half block 0.05*** 0.03* 0.01*** 0.06***
(0.01) (0.01) (0.00) (0.01)Waterfront property 0.11*** 0.09** 0.03*** 0.15**
(0.03) (0.03) (0.01) (0.05)Open spaces within one half block − 0.01 − 0.01 0.00 0.01
(0.01) (0.01) (0.00) (0.01)Businesses/institutions within one halfblock
0.00 0.06*** 0.00 0.03**
(0.01) (0.01) (0.00) (0.01)Minor road repairs needed − 0.04*** − 0.04*** − 0.01* − 0.04***
(0.01) (0.01) (0.00) (0.01)
(Continued)
HOUSING POLICY DEBATE 13

The results of this analysis suggest that both ISs and MHPs provide housing that is substantiallymore affordable than would be predicted based on the characteristics of the housing unit itself orof the neighborhood or geographic area in which they are located. For example, the averagehousehold in ISs pays $486 per month, substantially lower than the $804 predicted by theregression model. Thus, the actual cost of housing for households in ISs is only 58% of what onewould expect given their housing unit, neighborhood, and geographic characteristics. Similarly, theaverage household in MHPs pays $660 per month for housing, or only 71% of the predictedhousing cost of $913. Conventional owners and conventional renters, on the other hand, haveactual housing costs that largely mirror their predicted housing cost. These findings provide furtherevidence that mobile homes—but especially ISs—provide deep levels of affordability.
Discussion and Conclusion
The primary goal of this study is to document how housing tenure impacts affordability acrossdifferent MH tenure groups and different communities where MH is clustered. Our regressionanalyses of four measures of housing costs and affordability for conventional owners, conven-tional renters, and the three MH tenure types (MH owner, MH renter, and MH owner/renter)reveal that MH provides high levels of affordability compared with that experienced by bothconventional owners and conventional renters, but that not all MH tenures are equally afford-able. Indeed, housing costs differ significantly across MH tenures. Across a number of theaffordability measures used here, MH owner/renters bear significantly higher costs than MHowners do, although both tenures are significantly more affordable than conventional owner-ship and renter tenures. However, MH renters face much higher housing costs, on par with
Table 2. (Continued).
Housing cost as a share of
Monthly housingcost ($)
Cost per squarefoot ($) Income (%)
Fair marketrent (%)
Major road repairs needed − 0.03 − 0.04+ 0.00 − 0.03+(0.02) (0.02) (0.00) (0.02)
No roads present 0.01 − 0.01 − 0.01 0.02(0.03) (0.02) (0.01) (0.04)
Fair market rent (natural log) 0.70*** 0.94*** 0.15*** − 0.28***(0.02) (0.04) (0.01) (0.03)
MSA: Urban 0.01 − 0.07*** 0.00 − 0.01(0.01) (0.02) (0.00) (0.01)
MSA: Rural − 0.05** − 0.08*** − 0.01** − 0.08***(0.02) (0.02) (0.00) (0.02)
Non-MSA: Urban − 0.07*** 0.00 − 0.01 − 0.09***(0.02) (0.02) (0.00) (0.02)
Non-MSA: Rural − 0.10*** 0.01 − 0.01** − 0.12***(0.02) (0.02) (0.00) (0.02)
Midwest − 0.06*** − 0.06*** − 0.01*** − 0.07***(0.01) (0.02) (0.00) (0.02)
South − 0.19*** − 0.20*** − 0.04*** − 0.19***(0.01) (0.02) (0.00) (0.01)
West − 0.14*** − 0.22*** − 0.03*** − 0.15***(0.01) (0.02) (0.00) (0.01)
Intercept − 0.41* − 0.94*** 0.77*** 0.33+(0.19) (0.25) (0.05) (0.20)
N 31,056 31,062 29,497 31,062R2 0.447 0.324 0.463 0.242
Note. MSA = metropolitan statistical area. Standard errors are given in parentheses.+ p < .1. * p < .05. ** p < .01. *** p < .001.
14 N. J. DURST AND E. SULLIVAN
those of conventional renters. In short, owning an MH unit as well as the land where the unit islocated leads to the highest levels of affordability, whereas renting the dwelling and/or the landon which it sits comes with additional costs that reduce the deep affordability of manufacturedhomes. During a widespread U.S. affordable housing crisis, housing scholars and practitionersshould take note of these findings and recognize that not all forms of MH are equallyaffordable.
Our analysis also highlights important characteristics of clustering of MH. Most notably, MH inthis country is highly segregated from other types of housing, and the distribution of MHPs and ISsvaries markedly across urban and rural geographies. For example, we estimate that only 4% ofconventional housing units are located within one half block of a manufactured home, whereasapproximately 69% of MH units are similarly situated—in either an IS (30%) or an MHP (40%).Whereas many of these MHPs appear to be concentrated in metropolitan areas, ISs appear to bedisproportionately a nonmetropolitan phenomenon.
By examining select socioeconomic and demographic characteristics of the populationswithin these two predominant MH community arrangements, we found that households livingin ISs and MHPs have lower incomes and lower educational attainment and are more likely tobe living in poverty than both conventional owners and conventional renters. Non-HispanicWhites represent approximately three quarters of heads of household in ISs, MHPs, and the
Figure 3. Housing cost and affordability: A comparison of informal subdivisions, mobile home parks, and conventional tenures.
Table 3. Predicted and actual housing costs ($).
Conventional
Informal subdivision Mobile home park Owner Renter
Predicted housing costs 804.98 913.03 1,299.83 950.71Actual housing costs 486.24 660.61 1,309.86 993.28Ratio of actual to estimated housing cost 0.58 0.71 1.01 1.04
HOUSING POLICY DEBATE 15

conventional owner tenure, but only half of heads of household in the conventional rentertenure, whereas non-Hispanic Whites comprise the majority of residents in MH; notably, Latinosmake up approximately 12% of heads of household in ISs and 17% of heads of household inMHPs—more than their share among conventional owners (approximately 9%). This indicatesthat for Latinos MH and MHPs specifically provide an important vehicle for affordable housingand homeownership.
Moreover, whereas both ISs and MHPs offer sites of low-income homeownership through MH,they provide markedly different levels of affordability. Residents in MHPs have higher total housingcosts than residents in ISs do; they pay substantially more of their income toward housing, andthey also have substantially higher housing costs relative to the local FMR. Meanwhile, householdsin ISs have the lowest housing costs of all of the tenure types studied here. Existing scholarship ofcolonias and ISs highlights the myriad challenges these communities face (especially regardingpoor infrastructure; Larson, 2002; Stroud & Spikowski, 1999; Ward, 1999), and more work is neededto ensure that existing ISs have adequate water and wastewater services, paved roads, and side-walks. Our analysis, however, highlights that ISs also serve as one of the most affordable housingoptions in this country and an important means of low-income homeownership. This level ofaffordability is notable for the IS arrangement especially, given that IS residents self-rated theirhousing unit satisfaction on par with conventional owners and statistically significantly higher thanconventional renters and residents of MHPs. Similar measures of housing unit and neighborhoodquality indicate that ISs provide a number of benefits and relatively few disadvantages comparedwith MHPs and conventional rental tenures, at least at the national level.
These findings are particularly important for local housing policies. For example, in an analysis ofthe barriers to placing MH in metropolitan areas, Dawkins and Koebel (2009) recommend flexibleregulations, not only those that allow the placement of manufactured homes in single-family zonesbut also those that promote the establishment of MHPs, which, they argue, “can help createa bundled supply of land for developing manufactured housing” (Dawkins & Koebel, 2009, p. 85).Our results, however, suggest that MHPs are not, in fact, the most affordable MH communityarrangement, and offer lower levels of housing and neighborhood satisfaction than ISs do. Instead,our findings point toward the development of ISs as a more effective strategy for promotingaffordable forms of MH tenure. Thus, in addition to removing regulatory barriers to the placementof MH in MHPs, local and state policies should encourage their development in single-familydistricts. Steps should be taken to ensure that new ISs are equipped with adequate levels ofinfrastructure and services, which undoubtedly are accompanied by higher land costs (see Durst,2018). These higher land costs would potentially reduce the placement of MH on scattered sites(Dawkins & Koebel, 2009) and would almost certainly reduce the affordability of ownership in ISs,although by how much is unclear. Nevertheless, given the wide disparity we document betweenmeasures of affordability in ISs and MHPs, there is considerable opportunity to promote affordablehomeownership by promoting the development of new ISs.
The lowest hanging fruit, however, is policy that directly addresses the challenges faced byresidents in MHPs. Our results suggest that ownership of both the land and the dwelling con-tributes to lower housing costs and higher resident satisfaction in ISs than in MHPs, whereresidents do not own the land. Additionally, the lack of land ownership underlies the classificationof MH in MHPs as personal property rather than real property. This classification comes with lessfavorable financing, fewer consumer protections, lower appraised values, and less home apprecia-tion (NCLC, 2014). Our analysis of the differences in affordability and housing quality between ISsand MHPs is significant in light of current efforts, primarily spearheaded by housing nonprofitgroups such as Resident Owned Communities USA, that work to promote land ownership in MHPsby converting landlord-owned MHP properties to resident-owned communities. Conversion ofMHP land to resident-owned communities could yield some of the benefits found in ISs, substan-tially contributing to housing affordability while promoting housing security for low-income MHhouseholds. Such efforts should be actively encouraged and further evaluated.
16 N. J. DURST AND E. SULLIVAN

In conclusion, our analysis suggests that not all MH tenures are equally affordable, nor are theyevenly distributed across metropolitan and nonmetropolitan parts of the country. Local, state, andfederal policy should aim to ensure a diversity of tenure options for low-income households, butshould prioritize tenures, such as ownership of the dwelling and the land, that are accompanied bythe greatest degree of affordability and housing quality.
Notes
1. Manufactured homes are defined as homes built after 1976 when the U.S. Department of Housing and UrbanDevelopment (HUD) instituted the HUD Manufactured Home Construction and Safety Standards code toimprove the safety, quality, and durability of manufactured housing. Mobile homes are homes built prior to1976.
2. In the American Housing Survey data and in this analysis, metropolitan areas include central cities as well asurban and rural parts of metropolitan statistical areas (MSAs; i.e., urban and rural areas that are still locatedwithin a census-defined MSA). Nonmetropolitan areas include both urban and rural areas that are locatedoutside an MSA.
3. HUD defines housing affordability in terms of percentage of income, using 30% of income as the maximumthreshold for housing costs. Households paying over 30% of monthly income on housing costs are consideredhousing cost burdened by HUD standards (https://www.huduser.gov/portal/pdredge/pdr-edge-featd-article-081417.html).
4. In this article we follow architectural historians and scholars of the mobile home in using the categorical termmobile home park (MHP) to refer to the range of MH land-lease communities (trailer parks, MHPs, MHcommunities, etc.), which may vary significantly from each other in terms of age, type of homes, and propertymaintenance (Beamish et al., 2001; Dawkins & Koebel, 2009; Kusenbach, 2009, 2017; Solomon & MacTavish,2017; Wallis, 1991).
5. We rely on the 2013 wave instead of the more recent 2015 wave because a number of variables of interest,such as proximity to other mobile homes, are not available in the 2015 public-use file.
6. To do so, we divide monthly housing costs by one twelfth of the reported annual household income.7. FMRs are calculated by HUD for metropolitan areas and nonmetropolitan counties and are used to determine
federal assistance for subsidized rental housing. We use them here as a means of measuring the affordability oftenure types relative to alternative affordable housing options.
8. As noted above, existing research has found MH to be an important source of housing for retirees, whocomprise 32% of MH household heads compared with 24% of household heads in conventional housing(CFPB, 2014). Our findings disaggregate MH households in ISs and MHPs from this larger MH population.Contrary to some popular perceptions of MHP residents as elderly, we find that MHP heads of household areyounger than their counterparts in conventional housing, and IS heads of household are similar in age. Thisimplies that the prevalence of elderly households in MHPs is more likely to be a regional phenomenon (in theSouth and Sunbelt states, perhaps) than a national characteristic of MHP or IS households.
9. In keeping with AHS data, we define a Latino as a person who is Mexican, Mexican American, Chicano, PuertoRican, Cuban, Cuban American, or some other Spanish, Hispanic or Latino group.
Disclosure Statement
No potential conflict of interest was reported by the authors.
Notes on Contributors
Noah J. Durst is an assistant professor of urban and regional planning at Michigan State University. His researchfocuses on low-income housing, urban informality, and municipal annexation.
Esther Sullivan is an assistant professor of sociology at the University of Colorado Denver. Her research focuses onpoverty, spatial inequalities, legal regulation, housing, and the built environment.
ORCID
Noah J. Durst http://orcid.org/0000-0002-2724-1707
HOUSING POLICY DEBATE 17
References
Apgar, W., Calder, A., Collins, M., & Duda, M. (2002). An examination of manufactured housing as a community and assetbuilding strategy. Washington, DC: Neighborhood Reinvestment Corporation in collaboration with the Joint Centerfor Housing Studies of Harvard University.
Beamish, J., Goss, R., Atiles, J. H., & Kim, Y. (2001). Not a trailer anymore: Perceptions of manufactured housing. HousingPolicy Debate 12(2), 373–391.
Boehm, T. P. (1995). A comparison of the determinants of structural quality between manufactured housing andconventional tenure choices: Evidence from the American Housing Survey. Journal of Housing Economics 4(4),373–391.
Boehm, T. P., & Schlottman, A. (2008). Is manufactured housing a good alternative for low-income families? Evidencefrom the American Housing Survey. Cityscape 10(2), 159–225.
Carter, C. L., Williamson, O., DeArmond, E., & Sheldon, J. (2004). Manufactured housing community tenants: Shifting thebalance of power. Washington, DC: Public Policy Institute AARP.
Consumer Financial Protection Bureau (CFPB). (2014). Manufactured-housing consumer finance in the United States.Washington, DC: Author.
Consumers Union. (2001a). Manufactured housing rental community tenants rights (Consumer Reports). Retrieved fromhttps://advocacy.consumerreports.org/wp-content/uploads/2013/04/RightsDoc.pdf.
Consumers Union. (2001b). Manufactured homeowners who rent lots lack security of basic tenants rights (ConsumerReports).
Corporation for Enterprise Development (CFED). (2011). Promoting resident ownership of communities. Washington, DC:Author. Retrieved from https://prosperitynow.org/files/resources/purchaseopportunity_resourceguide_AppA_10_2011.pdf
Dawkins, C. J., & Koebel, C. T. (2009). Overcoming barriers to placing manufactured housing in metropolitancommunities. Journal of the American Planning Association 76(1), 73–88.
De Luca, S., Garboden, P. M. E., & Rosenblatt, P. (2013). Segregating shelter: How housing policies shape the residentiallocations of low-income minority families. Annals of the American Academy of Political and Social Science 647,268–299.
Durst, N. J. (2016). The nature and extent of self-help housing in Texas: From colonias to model subdivisions. Journal ofPlanning Education and Research, 36(2), 145–157.
Durst, N. J. (2018). Informal and ubiquitous: Colonias, premature subdivisions and other unplanned suburbs onAmerica’s urban fringe. Urban Studies. doi:10.1177/0042098018767092
Durst, N. J., & Ward, P. M. (2016). Colonia housing conditions in model subdivisions: A déjà vu for policy makers.Housing Policy Debate, 26(2), 316–333.
Durst, N. J., & Wegmann, J. (2017). Informal housing in the United States. International Journal of Urban and RegionalResearch 41(2), 282–297.
Herbert, C. W. (2018). Like a good neighbor, squatters are there: Property and neighborhood stability in the context ofurban decline. City & Community, 17(1), 236–258.
Hirsch, W. Z., & Rufolo, A. M. (1999). The regulation of immobile housing assets under divided asset ownership.International Review of Land and Economics 19(3), 383–397.
Kusenbach, M. (2009). Salvaging decency: Mobile home residents‘ strategies of managing the stigma of “trailer” living.Qualitative Sociology 32(1), 399–428.
Kusenbach, M. (2017). Look at my house!’ Home and mobile home ownership among Latino/a immigrants in Florida.Journal of Housing and the Built Environment 32(1), 29–47.
Larson, J. E. (2002). Informality, illegality, and inequality. Yale Law & Policy Review 20(1), 137–182.McCabe, B. J. (2016). No place like home: Wealth, community, and the politics of homeownership. New York: Oxford
University Press.Mukhija, V., & Mason, D. R. (2015). Resident-owned, informal mobile home communities in rural California: The case of
Rancho Don Antonio, Coachella Valley. Housing Policy Debate 25, 179–194.National Consumer Law Center (NCLC). (2014). Manufactured housing resource guide: Titling homes as real property.
Washington, DC: Author. Retrieved from https://www.nclc.org/images/pdf/manufactured_housing/cfed-titling-homes.pdf
Olmedo, C., & Ward, P. M. (2016). Model subdivisions: The new face of developer lot sales for low-income colonia-typehousing in Texas. Land Use Policy 52, 181–194.
Owens, W. J. (1996). Who’s buying manufactured homes? Urban Land 55(1), 21–23.Soloman, S., & MacTavish, K. T. (2017). Singlewide: Chasing the American dream in a rural trailer park. Ithaca, NY: Cornell
University Press.Stroud, H. B. (1995). The promise of paradise: Recreational and retirement communities since 1950. Baltimore, MD: John
Hopkins University Press.Stroud, H. B., & Spikowski, W. M. (1999). Planning in the wake of Florida land scams. Journal of Planning Education and
Research 19(1), 27–39.
18 N. J. DURST AND E. SULLIVAN

Sullivan, E. (2014). Halfway homeowners: Eviction and forced relocation among homeowners in manufactured homeparks in Florida. Law & Social Inquiry 39(2), 474–497.
Sullivan, E. (2018). Manufactured insecurity: Mobile home parks and Americans’ tenuous right to place. Berkeley, CA:University of California Press.
Sullivan, E., & Olmedo, C. (2015). Informality on the urban periphery: Housing conditions and self-help strategies inTexas informal subdivisions. Urban Studies 52(6), 1038–1053.
U. S. Census Bureau. (2010). 2010–2014 American community survey 5-year estimates. Retrieved from http://factfinder.census.gov/faces/tableservices/jsf/pages/productview.xhtml?pid = ACS_14_5YR_B25033&prodType = table
U.S. Census Bureau. (2017). Cost and size comparison for manufactured and site built homes. Manufactured HousingSurvey Annual Data. Retrieved from https://www.census.gov/data/tables/2017/econ/mhs/2017-manufactured-housing-survey-annual-data.html
Vermeer, K., & Louie, J. (1997). The future of manufactured housing. Cambridge, MA: Joint Center for Housing Studies.Wallis, A. (1991). Wheel estate: The rise and decline of mobile homes. Oxford, UK: Oxford University Press.Ward, P. M. (1999). Colonias and public policy in Texas and Mexico: Urbanization by stealth. Austin, TX: University of
Texas Press.Ward, P. M., & Peters, P. A. (2007). Self-help housing and informal homesteading in peri-urban America: Settlement
identification using digital imagery and GIS. Habitat International, 31(2), 205–218.Way, H. K. (2010). Informal homeownership in the United States and the law. Saint Louis University Public Law Review
29(1), 113–192.Wegmann, J., & Mawhorter, S. (2017). Measuring informal housing production in California cities. Journal of the
American Planning Association 83(2), 119–130.Wegmann, J., Schafran, A., & Pfeiffer, D. (2016). Breaking the double impasse: Securing and supporting diverse housing
tenures in the United States. Housing Policy Debate 27(2), 193–216.
HOUSING POLICY DEBATE 19