The Changing International Division of Labor in Manufactured ...
45
World Bank Reprint Series: Number 114 Bela Balassa The Changing International Division of Labor in Manufactured Goods Reprinted with permission from Banca Nazionale del Lavoro Quarterly Review, no. 130 (September 1979), pp. 243-85 Public Disclosure Authorized Public Disclosure Authorized Public Disclosure Authorized Public Disclosure Authorized
-
Upload
khangminh22 -
Category
Documents
-
view
2 -
download
0
Transcript of The Changing International Division of Labor in Manufactured ...

World Bank Reprint Series: Number 114
Bela Balassa
The Changing InternationalDivision of Laborin Manufactured Goods
Reprinted with permission from Banca Nazionale del Lavoro Quarterly Review,
no. 130 (September 1979), pp. 243-85
Pub
lic D
iscl
osur
e A
utho
rized
Pub
lic D
iscl
osur
e A
utho
rized
Pub
lic D
iscl
osur
e A
utho
rized
Pub
lic D
iscl
osur
e A
utho
rized

The Changing International Divisionof Labor in Manufactured Goods*
Introduction
This paper will examine the changing pattern of the inter-
national division of labor in manufactured goods between deve-
loped and developing countries. It will consider recent and pros-
pective changes in trade flows between the two groups of countries
and analyse the employment implications of these flows for the
developed countries.Section 1 of the paper will describe changes in trade in man-
ufactures between developed and developing countries following
the oil crisis of 1973. The employment effects of this trade for the
developed countries will be analysed in Section II, with further
consíderation given to the skill-composition of employment. In-
formation will also be provided on the physical and the human
capital intensity of the manufactured exports and imports of the
developed countries in trade with the developing countries.Section 111 will consider possible future changes in manufactur-
ed trade between the developed and the developing countrius ancl
indicate the employment implications of the projected trade flows.
In so doing, distinction will again be made among skill classes.
Finally, the policy implications of the findings will be discussed.
The author is Professor of Political Economy at the Johns Hopkins Uni-versity and Consultant at the World Bank. He prepared this paper as a back-ground study for World Developrent Report, 1979. However, thc paper expressesthe author's views alone and should not be interpreted to reflect those of cheBank.
The author is indebted to Robert E. Baldwin for useful comments on ancarlier draft and, to participants of a Worid Bank seminar for helpful discussions.Thanks are also due to Joung-Yong Lee, Michel Noel, and Kishore Nadkarni forresearch assistance.
244 Banca Nazionalc del Lavoro
1. Recent Trends in I'rade in Manufactured Goods belween theDeveloped Industrial and the Developing Countries'
The Time Pattern of Trade
In popular discussions, as well as in intertnational fora, muchattention has been given in recent years to the growth of themanufactured imports of the developed countries fromn the deve-loping countries. In particular, questions have been raised con-cerning the effects of increased imports on output and emoloymentin the forimer group of countries.
Changes in the imports of the developed countries from thedeveloping countries cannot, however, be considered independentlyfrorn changes in their exports to them. Correspondingly, in thefollowing, we will examine the time pattern of manufactured exportsand imports in trade between developed and developing countries.This will be done for the period 1973-77, fturther disaggregatingthe results according to major country and industry groups. Unlessotherwise noted, all data have been expressed i'n current U.S.dollars.
Use has been made of data reported by the developed in-dustrial countries (for short, the industrial counturies), including theUnited States, Canada, the European Common Market, the Eu-ropean Free Trade Association, and Japan. In turn, among thedeveloping countries, distinction has been made between oil-export-ing and oil-importing countries. Australia, New Zcaland, and SouthAfrica, the countries of Southern Europe, anid the CommunistcoLuntries have not been included in either grouping.
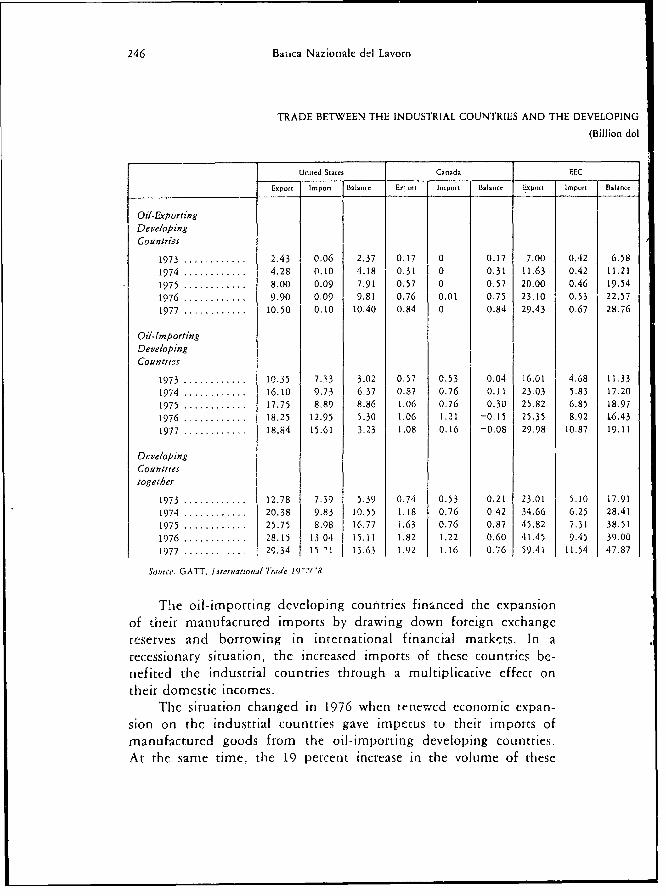
Tables 1 anld 2 provide annual data for the period 1973-77 ontrade between industrial and developing countries in manufacturedgoods (defined as commodity classes 5 to 8 in the U.N. StandardInternatial 7rade Classification less 68 nonferrous metals) in a geo-graphical and in an industry breakdown, respectively. Within themanufa¿turing category, -- .ition has been made among thefollowing commodity groups: nonelectrical and electrical machineryand transport equípment; chemicals, iron and' stecl; textiles; clo-thing; and consumer goods other than clothing and their inter-mediate inpLuts. The latter caregory inclucle, leather and leather
Statistical work for thís section f the paper was done by Michel Noel.
The Changing International Division of Lalbor in Manufactured Goods 245
products, rubber products, wood and cork products, paper and
paper products, non-metallic mineral manufactures, sanitary
plumbing, heating, and lighting equipment, furniture, shoes, and
miscellaneous manufactures.Little needs to be said of the industríal countries' trade in
manufactured goods with the oil-exporting developing countries.
The latter group of countries export few manufactured goods while
their imports have been rising rapidly since the quadrupling of oil
prices in late 1973. As a resilt, the industrial countries increased
their exports of manufactured goods to the oil-exporting developíng
countr.es from $12.9 billíon in 1973 to $55.5 billion in 1977.
Several phases may be distinguished in regard to trade in
manufactures between the industrial countries and thc oil-impor t-
ing developing countries. In the years of the world recession, 1974
and 1975, the industrial countries' imports of manufactured goods
from the developing countries increased by 27 percent. Adiusáing
for price ncreases of 31 percent,2 the volume of these imporí.s
declined by 3 percent between 1973 and 1975. In the same period,
the mnanufactured exports of the industrial countries to the oil-
imnporting developing countries rose by 59 percent, represeriting
price incrcases of 37 percent and a volume increase of 16 perccnt.
These changes in trade flows led to an increase in the export
surplus of the industrial countries in their manufactured trade with
the oil-importing developing countries from $23.9 billion in 1973
to $42.9 billion in 1975, The United States accounted for two-
thirds of the rise in the surplus, with an export increase of 71.5
percent as against average increases of 54.2 percent for the other
industrial countries, reflecting largely an improvenenct of the U.S.
competitive position following the devaluation of the dollar.The described developments were associated with the conti-
nued growth of the national economies of oil-irmporting developing
countries in the midst of the world recession. The combined GDP
of these countries increased by 9.7 percent between 1973 and 1975
while the 1975 GDP of the industrial countries barely reached the
1973 level.
2 The unlit value indices used in deflating the currcnt dollar value of the
malnufactured CxportS of thc developing countrics have becen derived from daltpublished in GATT, ¡Vetworks of W'or/d Trade by Areas and Commodiív CGlasses,
1955 1976, CG;I1C\na. 1978. Thc corresponding data for the developed counicries are
published in United Nations, Mrowbi'y BuíaieN of Staiistics, December 1978.
246 Baíica Nazionale del Lavoro
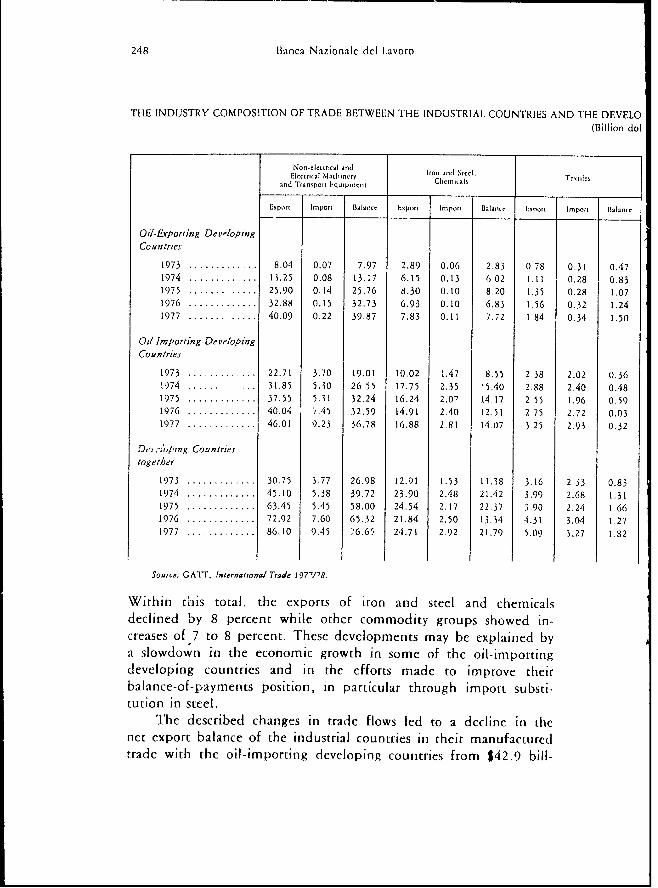
TRADE BETWEEN THE INDUSTRIAL COUNTRIES AND THE DEVELOPING
(Billion dol
Un,ted SmatCs Canada EEC
Expont lmport |Balance Er rt Import Balance Export Imponr Balantce
Oil-ExportingDevelopingCountries
1973 .... ....... 2.43 0.06 2.37 0.17 0 0.17 7.00 0.42 6.581974. 8 ............4.28 0.10 4.18 0.31 0 0.31 11.63 0.42 11.211975. 0 ............8.00 0.09 7.91 0.57 0 0.57 20.00 0.46 19.541976. 0 ............9.90 0.09 9.81 0.76 0.01 0.75 23.10 0.53 22.571977 ............. 10.50 0.10 10,40 0.84 0 0.84 29.43 0.67 28.,6
Oil-ImportingDevelopingCountrifls
1973 . 5 ............10.35 7.33 3.02 0.57 0.53 0.04 16.01 4.68 11.331974 ............ 16.10 9.73 6.37 0.87 0.76 0.11 23 03 5.83 17.201975 ............ 17.75 8.89 8.86 1.06 0.76 0.30 25.82 6.85 18.971976 ............ 18.25 12.95 5.30 I.06 1.21 -0. 1 5 25.35 8.92 16.431977 .......... 18.84 15.61 3.23 1.08 0.16 -0.08 29.98 10.87 19.11
DevelopingCountríes¡ogether
1973 ............ 12.78 7.39 5.39 0.74 0.53 0.21 23.01 5.10 17.911974 ...... 20.38 9.83 10.55 1.18 0.76 0.42 34.66 6.25 28.411975 ............. 25.75 8.98 16.77 1.63 0.76 0.87 45.82 7.31 38.511976 ............. 28.15 13.041 15.11 1,82 1.22 0.60 41.45 9.45 39.001977 ....... .... 29.34 15 S1 13.63 1.92 1. 16 0.76 59.41 11.54 47.87
Source, GA1T, lIoernautona/ Trade 19 '7/ 8
Thae oil-importing developing countries financed the expansionof tnheir manufactured imports by drawing down foreign exchangereserves and borrowing in international financial markets. In arecessionary situation, the increased imports of these countries be-nefited the industrial countries through a multiplicative effect ontheir domestic incomes.
The situation changed in 1976 when rernewcd economic expan-sion on the industrial countries gave impecus to thcir impotts ofmanufactured goods from the oil-importing developing countries.At the same time, the 19 percent increase in the volume of these
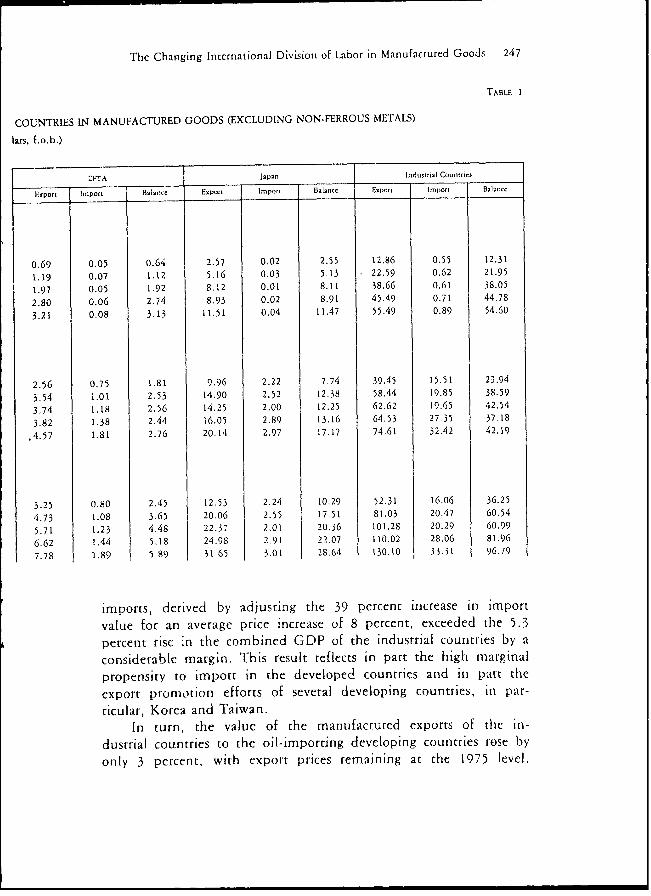
The Chanigng International Division of Labor in Manufactured Goods 247
TABLE 1
COUNTRIES IN MANUFACTURED GOODS (EXCLUDING NON-FERROUS METALS)
lars, f.o.b.)
FTA Japan Indusurial Countrics
F.xpot Inxport B21.nce Export 1mpon B.aInce Exporn Import BaLocC
0.69 0.05 0.64 2.57 0.02 2.55 12.86 0.55 12.31
1.19 0.07 1.12 5,16 0.03 5.13 22.59 0.62 21.95
1.97 0.05 1.92 8.12 0.01 8.11 38.66 0.61 38.05
2.80 0.06 2.74 8.93 0.02 8.91 45.49 0.71 44.78
3.21 0.08 3.13 11.51 0.04 11.47 55.49 0.89 54.60
2.56 0.75 1.81 9.96 2.22 7.74 39.45 15.51 23.94
3.54 1.01 2.53 14.90 2.52 12.38 58.44 19.85 38.59
3.74 1.18 2.56 14.25 2.00 12.25 62.62 19.65 42.54
3.82 1.38 2.44 16.05 2.89 13.16 64.53 27.35 37.18
,4.57 1.81 2.76 20.14 2.97 17.17 74.61 32,42 42.19
3.25 0.80 2.45 12.53 2.24 10.29 52.31 16.06 36.25
4.73 1.08 3.65 20.06 2.55 17.51 81.03 20.47 60.54
5.71 1.23 4.48 22.37 2.01 20.36 101.28 20.29 60.99
6.62 1.44 5.18 24.98 2.91 22.07 110.02 28.06 81.96
7.78 1.89 5.89 31 65 3.01 28.64 130.10 33.31 96.79
imports, derived by adjusting the 39 percent increase in import
value for an average price increase of 8 percent, exceeded the 5.3
percent rise in the combined GDP of the industrial countries by a
considerable margin. This result reflects in part the high marginalpropensity to import in the developed countries and in part the
export prormotion efforts of several developing countries, in par-ticular, Korea and Taiwan.
In turn, the value of the manufactrured exports of tic in-
dustrial courntries to the oil-importing developing countries rose by
only 3 percent, with export prices remaining at the 1975 level.
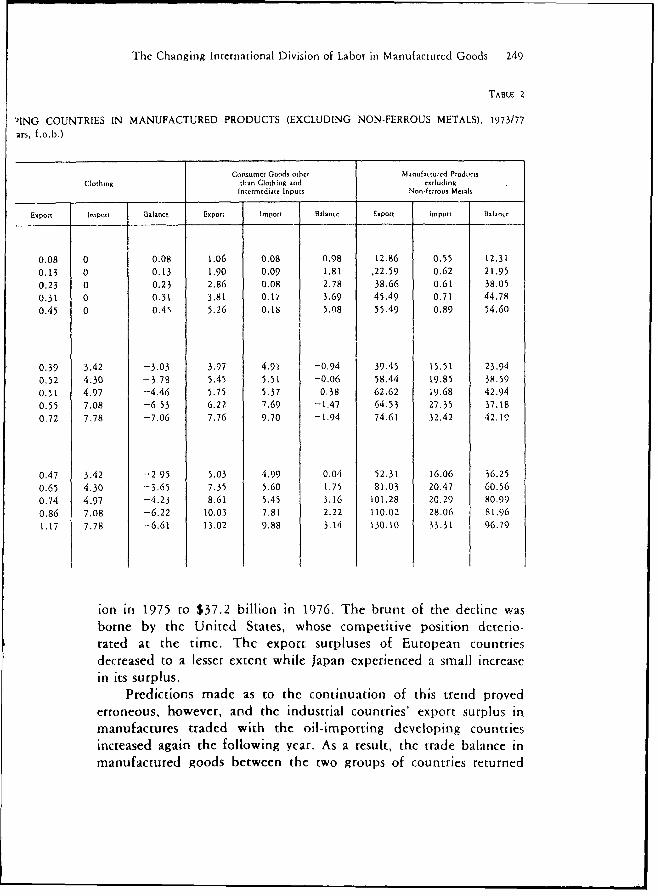
248 Banca Nazionale del Lavoro
THE INDUSTRY COMPOSITION OF TRADE BETWEEN THE INDUSTRIAL COUNTRIES AND THE DEVELO(Billion dol
Non-electracal audElectric al Mlachanleey Irm, atad Stecl
and T~r.nsport b,quiprnnaCemcasTeti
Exp.rt Impor Bala1c Ekxponr | Itmpon Balane r",p,c,t I -Pr 13alan1ce
Oil- Fxporting Deve/opingCountr¡es
1973 ............. ... 8.04 0.07 7.97 2.89 0,06 2.83 0.78 0.31 0.471974 ............. .. 13.25 0.08 13.17 6.15 0.13 6f02 1.11 0.28 0.831975 .......... .... 25.90 0.14 25.76 8.30 0.10 8.20 1.35 0.28 1.071976 ............. .32.88 0.15 32.73 6.93 0.10 6.83 1.56 0.32 1.241977 ............. 40.09 0.22 39.87 7.83 0.11 7.,72 1 84 0.34 1.50
Oil lmporting Devte/opingCountr¡es
1973 .......... .... 22.71 3.70 19.01 10.02 1.47 8.55 2.38 2.02 0.36!974 ............. 31.85 5.30 26 55 17.75 2.35 15.40 2.88 2.40 0.481975 ......... .... .37.55 5.31 32.24 16.24 2,07 14.17 2 55 1.96 0.591976 ............. .40.04 a .45 32. 59 14.91 2.40 12.51 2 75 2.72 0.031977 ..... ....... 46.01 9.23 36.78 16.88 2.h1 14 07 3 25 2.93 0.32
Da :a/'ns, Countrzestogether
1973 ............. .. 30.75 3.77 26.98 12.91 1.53 11.38 3.16 2.33 0.831974 ............. .45.10 5.38 39.72 23.90 2.48 21.42 3.99 2.68 1.311975 ............. .63.45 5.45 58.00 24.54 2.17 22.37 3.90 2.24 1.661976 ............. .72.92 7.60 65.32 21.84 2.50 13.34 4.31 3.04 1.271977 ............. .. 86.10 9.4 5 76.6, 24.71 2.92 21.79 5.09 3.27 1.82
Source; GATr, Internato.nal Trade ¡ 977/'8.
Within this total, the exports of iron and steel and chemicalsdeclined by 8 percent while other commodity groups showed in-creases of 7 to 8 percent. These developments may be explained bya slowdown in the economic growth in some of the oil-importingdeveloping countrics and in the efforts made to improve theirbalance-of-payments position, in particular through import substi-tution in steel.
The described changes in trade flows led to a decline in thenet export balance of the industrial countries in their manufacturedtrade with the oil-importing developing countries from $42.9 bilí-
The Changing International Division of Labor in Manufactured Goods 249
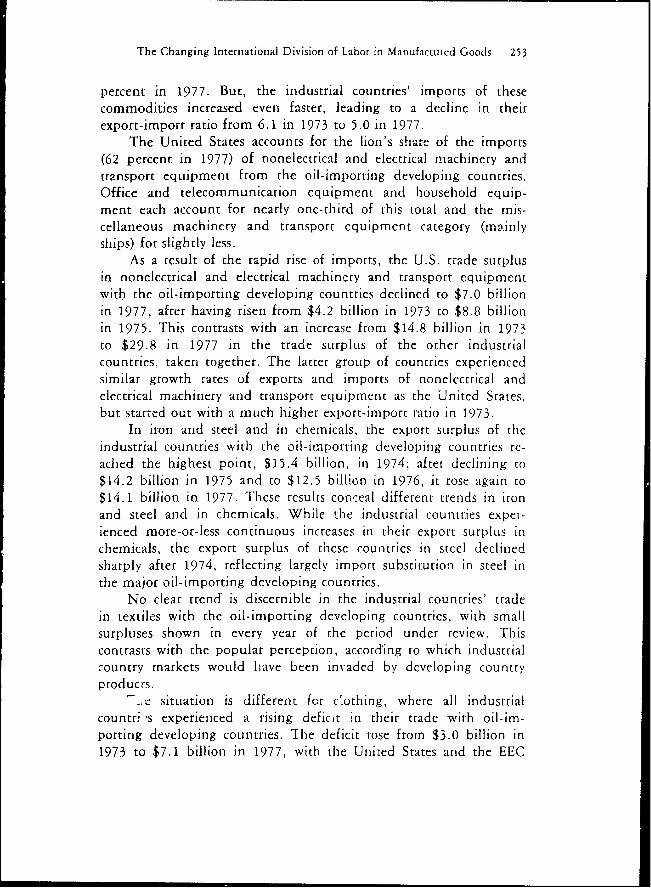
TABLE 2
9ING COUNTRIES IN MANUFACTURED PRODUCTS (EXCLUDING NON-FERROUS METALS), 1973/77
ars, f.o.b.)
Consumer Goods other Mat,ufattured Products
Clothing than Clothing and 1xcludínRIntcrmcdiac Inputs Non.ferrous Mc(als
Export Import Balance Export Import Bil.ance Expon Impont B.a¡.,,c
0.08 0 0.08 I.06 0.08 0.98 12.86 0.55 12.31
0.13 0 0.13 1.90 0.09 1.81 ,22.59 0.62 21.95
0.23 0 0.23 2.86 0.08 2.78 38.66 0.61 38.05
0.31 0 0.31 3.81 0.1? 3,69 45.49 0.71 44.78
0.45 0 0.4s 5.26 0,18 5.08 55.49 0.89 54.60
0.39 3.42 -3.03 3.97 4.9i -0.94 39.45 15,51 23.94
0.52 4.30 -3.7 5.45 5.51 -0.06 58.44 t9.85 38.59
0.51 4.97 -4.46 1 5.75 5.37 0.38 62.62 19.68 42.94
0.55 7.08 -653 6.22 7.69 -1.47 64.53 27.35 37.18
0.72 7.78 -7.06 7.76 9.70 -1.94 74.61 32.42 42.19
0.47 3.42 -2 95 5.03 4.99 0.04 52.31 16.06 36.25
0.65 4.30 -3.65 7.35 5.60 1.75 81.03 20.47 60.56
0.74 4.97 -4.23 8.61 5.45 3.16 101.28 20.29 80.99
0.86 7.08 -6.22 10.03 7.81 2.22 110.02 28.06 81.96
1.17 7.78 -6.61 13.02 9.88 3.14 130.10 33.31 96.79
ion in 1975 to $37.2 billion in 1976. The brunt of the decline wvas
borne by the United States, whose competitive position deterio-
rated at the time. The export surpluses of European countries
decreased to a lesser extent while Japan experienced a small increase
in Its surplus.Predictions made as to the continuation of this trend proved
erroneous, however, and the industrial countries' export surplus in
manufactures traded with the oil-importing dcveloping countries
íncreased again the following year. As a result, the trade balance in
manufactured goods between the two groups of countries returned

250 Banca Nazionale del Lavoro
to approximately the 1975 level, exceeding the level reached ¡i1973 by more than thrce-fourths.
The improverent in the industrial countries' trade balance inmanufactured goods with the oil-importing developing countricsbetween 1976 and 1977 reflects a deceleration in the growth oftheir imports and an acceleration in the rise of their exports. Therates of iricrease were 19 percent and 16 percent, respectively, whenthe average prices of manufactured goods in world trade increasedby 9 percent.
The slowdown in the imports of the industrial countries wasconcentrated in Japan, whose manufactured imports from the oil-importing developing countries rose by only 3 percent in 1977, aswefl as it1 Canada, wh(ose imporcs fell in absolute terms. In bothcases, a decline in the rate of economic growth and continuedprotection against developing country products contcributed to theoutcome. Despite increased protection of textiles and clorhing and adeceleration of econiomic growth, U.S. and European imports ofmanufactured goods from the non-oil producing developing coun-tries rose by more than one-fifth becwccn 1976 and 1977.
With a continued deterioration ín its competitive posit on,however, U.S. exports of manufactured goods to the oil-imnportingdeveloping countries increased by only 3 percent. As a result, themanLifactured trade surplus of the United States with thesc coun-tries declined further, from $5.3 billion in 1976 to $3.2 billion in19777. In turc, slow inercases in imports, accompanied by a one-fourth rise in exports, led to an incrcase in Japan's trade surplus inmanufactured goods with the oil-imnporting developing countriesfrom $13.2 billion in 19-76 to S.2 billion in 197,7. In the sameperiod, the trade surpluses of the European countries with theoil-imnporting developinig countries increased by about one-sixth.
Amonog individual product groups, the slowdown in the in-du.striai councries' iniporís was the most pronounced in textiles andclochinng, with imercases of 8 and 10 percent, respectively, reflectingin part a ¿Osoll¡d,ciorin a fter the unsustainable increase of about 40perecll in 1976 and in part the effects of protectionist' measurestakecn. By contrast, the imports of nonelectrical and clectrical ma-chinery and tranisport equípicnt, and of consumer goods otherthanc tcxtileis and their intermediate inputs, incretas(d by ahoutonc-fourth and imports of iron and steel and chemicals by one-sixth.

The Changing International Division of Labor in Manufactured Goods 251
In the exports of the industrial countries to the non-oil im-
porting developing countries an increase by one-fourth occurred inconsumer goods other than textiles and their intermediate inputs.The exports of clothing rose at a somewhat faster (31 percent), andtextile export3 at a somewhat slower (18 percent), rate. Finally, theexports of nonelectrical and electrical machinery and transportequipment and of iron and steel and chemicals increased by 15 and13 percent respectively.
The Changíng Position of Individual Countries and CountryGroups
For the 1973-77 period as a whole, the manufactured tradesurplus of the industrial countries with the oil-exporting developingcountries increased nearly four-and-a-half times, from $12.3 billionin 1973 to $54.6 billion in 1977. There were relatively small va-riations in percentage increases of the export surplus among theindustrial couneries, with Canada (394 percenlt) at the upper, andthe EEC countries (337 percent) at the lower end of the range.
In turn, the manufactured trade surplus of the industrial coun-tries with the oil-importing developing countries rose from $23.9billion in 1973 to $42.2 billion in 1977, with substantial variationsshown among the major industrial countries andc country groups.The U.S. surplus increased from $3.0 billion in 1973 to $3.2 billionin 1975, with practically no change in Canada, increases in thesurpluses of the EEC and the EFTA countries from $l1.3 billion to$19.1 billion and from $1.8 billion to $2.8 billion, respectively,and a rise from $7.7 bíllion to $17.2 billion in Japan.
The observed changes in net balance of the Common Marketcountries and the United States in their manufactured trade withthe oil-importing developing countries are largely explained by re-ference to the initial situation in 1973. The EEC countries in-creased their imports of manufactured goods from the oil-importingdeveloping countries (132 percent) more rapidly than the UnitedStates (113 percent) and experienced only a slíghtly larger rise intheir exports to these countries (87 percent as compared to 82percent in the U.S.). However, they benefited from the fact thattheir export-import ratio in manufactured trade with the oil-irn-porting developing countries was 3.4 in 1973 as compared to 1.4 in
the United States.

252 Banca Nazionale del Lavoro
Similar considerations apply in United States-EFTA relation-ships. Thus, the imports of manufactured goods b- the EFTAcountries from the oil-importing developing countries rose more(141 percent) than imports into the United States, while theirexports increased less (79 percent) than U.S. exports. But, theEFTA countries had an export-import ratio of 3.4 in ma.nufacturedtrade with the oil-importing developing countries in 1973, just asthe Common Market.
Differences in the initial situation, in turn, are largely explainedby the more liberal import policy followed vis-a-vis the developingcountries by the United States, as compared to European countries,in. the early seventies. The contrast is even greater with Japan,whose export-import ratio in manufactured trade with the oil-im-porting developing countries was 4.5 in 1973. At the same time,Japar,'s imports from these countries rose by only 34 percent be-tween 1973 and 1977, represenring an absolute decline in volumeterms.
The protectionist policies followed by Japan, together with thegreater similarity of its economic strLctnure to that of the moreadvanced developíing countries, may, áccount for these results. Atthe same time, the 102 percent rise in Japan's exports was aided byits increased competitiveness. As a result, japan's manufacturedtrade surplus with oil-imporcing developing countries more thandoubled between 1973 and 197 7.
The Commodity Composition o/ Tr.¡de
The manufactured exports of the industrial countries to theoil-exporting developing countries are increasingly dominated bynonelectrical and electrical mnachinery and transport equipment,which accounted for 62.5 percent of the total in 1973 and for 72.3percent in 1977. Other commodity groups of importance, with their1977 share in parenntlesis, are iron and steel and chemicals (14.1percent) and consumer goods other than clothing and their inter-mediate inputs (9.5 percent).
Noneletrical and electrical machinery and transport equipmentalso assurned inereasíng importance in the manufactujr<ed exports ofthe industrial countries to oil-importing developing countrics, withtheir share in thc total rising from 57.6 percent in 1973 to 61.7
The Changing International Division of Labor ¡n Manufactured Goods 253
percent in 1977. But, the industrial countries' imports of thesecommodities increased even faster, leading to a decline in theirexport-import ratio from 6.1 in 1973 to 5.0 in 1977.
The United States accounts for the lion's share of the imports(62 percent in 1977) of nonelectrical and electrical machinery andtransport equipment from the oil-importing developinig countries.Office and telecommunication equipment and household equip-ment each account for nearly one-third of this total and the mis-cellaneous machinery and transport equipment category (ma.inlyships) for slightly less.
As a result of the rapid rise of imports, the U.S. trade surplusin nonelectrical and electrical machinery and transport equipmentwith the oil-importing developing countries declined to $7.0 billionin 1977, after having risen from $4.2 billion in 1973 to $8.8 billionin 1975. This contrasts with an increase from $14.8 billion in 1973to $29.8 in 1977 in the trade surplus of the other industrialcountries, taken together. The latter group of countries experiencedsimilar growth rates of exports and imports of nonelectrical andelectrical machinery and transport equipment as the United Srates,but star,ed out with a much higher export-imnport ratio in 1973.
In iron and steel and in chemicals, the export surplus of theindustrial countries with the oil-importing developing countries re-ached the highest point, $15.4 billion, in 1974; after declining to$14.2 billion in 1975 and to $12.5 billion in 1976, it rose again to$14.1 billion in 1977. These results conceal differenr trends in ironand steel and in chemicals. While the industrial countries exper-ienced more-or-less continuous increases in their export surplus inchemicals, the export surplus of these countries in steel declinedsharply after 1974, reflecting largely import substitution in steel inthe major oil-importing developing countries.
No clear trend is discernible in the industrial countries' tradein textiles with the oil-importing developing countries, with smallsurpluses shown in every year of the period under review. Thiscontrasts with the popular perception, according to which industrialcountry markets would liave been invaded by developilng countryproducz-ss.
e situation is different for c'othing, where all industrialcountr; s experienced a rising defic¿t in their trade with oil-im-porting developing countries. Ihe deficit rose from $3.0 billion in1973 to $7.1 billion in 1977, with the United States and the EEC
254 Banca Nazionale del Lavoro
each accountitng for about two-fifths of the total. Even Japan exper-ienced a trade deficit in clothing with the oil-importing developingcountries.
Finally, from a deficit of $0.9 billion in 1973, the tradebalance of the industrial countries in consumer goods other. thanclothing and their intermediate inputs temporarily turned into asmall surplus in 1975 and again showed a deficit ($1.9 billion) in1977. This deficit is composed of a growing deficit in consumergoods other than clothing and a small surplus in their intermediateinputs.
Among the individual countries and country groups, Japan andEFTA have experienced a rising surplus, the Common Market arnore-or-less continuous decline in its surplus, and the United Statesa growing deficit, in trade with the oil-importing developing coun-tries in consumer goods other than clothing and their intermediateinputs. At the same time, changes in the two commodity sub-groups that make up this catcgory were about the same in eachcountry and country group.
11. The Employment Effects of Trade in Manufactures betweenDeveloped and Developing Countries3
The Aval/able Evidence
We have considered so far changes in trade in manufacturedgoods between the developed industrial and the developing coun-tries. The next question relates to the employment effects of thistrade. While much of the recent discussion has concentrated on theemployment implications of increased imnports by the developedcountries from the developing countries, our concern is with theemployment effects of changes in exports and imports in tradebetween the two groups of countries. In this connection, referencewill first be made to the findings of studies on the employmenteffects of multilateral trade liberalization.
These studies have concluded that net changes in trade andemployment in the developed countries resulting from multilateral
Thic voluminous sctaistical work underly¡ing the estimates of this sectioni wasundertakcn by Kishore Nadkarn¡.

The Changing International Division of Labor in Manufactured Goods 255
trade liberalization would be negligible. Baldwin finds, for exam-ple, that - for his preferred set of elasticities - a 50 percentmultilateral across-the-board tariff cut in all commodities, excludingtextiles in U.S. exports and imports, petroleum in U.S. imports,and agricultural products in U.S. exports to the EEC, would havepractically no effect on the U.S. trade balance and would representa net employment loss of only 15 thousand in the United States(1976, p. 146). Thus, 'the main conclusion emerging from thestudy is that the United States can participate in a substantialtariff-cutting negotiation without causing significant adverse tradeand employment effects in the country" (p. 148).
Baldwin's calculation refers to direct plus indirect changes inemployment, the latter being derived by utilizing the 367 sectorU.S. input-output table for 1967. Cline et al. provide estimates ofdirect and indirect employment effects for twelve alternative tariff-cutting formulas, all of which exclude petroleum products andtextiles. Labor-input coefficients have been available in a 92 sectorbreakdown in the United States, a 160 sector breakdown for Japan,and a 10 to 30 sector breakdown for the Commen Market coun-tries. For Canada, U.S. coefficients have been used (19078, p. 63).
Under formula (1), representing a 60 percent multilateral a-cross-the-board tariff cut that approximately corresponds to the me-dian of the twelve alternative estimates, a net direct employmentgain of 18.8 thousand and a direct plus indirect employment gainof 28.9 thousand is shown for the United States while the cor-responding figures are -25.7 and -50.6 thousand for Canada, 2.7and 23.9 thousand in Japan, and -112.2 thousand (direct effectsonly) for the EEC; in the latter case, it is estimated that totalexports would decline as the decrease in intra-EEC trade wouldoutweigh the increase in extra-EEC exports (pp. 125-6). Correspond-ingly, Cline concludes that '-'those who fear serious employmentdislocation from liberalizing imports are without empirical support"(p. 232).
The results of these studies do not permit one, however, toderive conclusions as regards the employment effects of increasedtrade between developed and developing countries, in part becausethe estimates include trade among the developed countries that faroutweighs trade between developed and developing countries, andin part because textiles, an important export product of the de-

256 Banca Nazionale del Lavoro
veloping countries, has been excluded., In the following, we willconcentrate on the employment effects of trade in manufacturedgoods between developed and developing countries.
In a paper entitied -lmpact of LDC Exports on Employmentin American Industry--, Anne Krueger has estimated the directemployment effects of changes in the share of imports in domnesticconsumnption and in the net trade balance of the United States forthe 1970-76 period in the two-digit breakdown of the U.S. Stan-dard Industrial Classification, encompassing 20 manufacturing sec-tors. While additional estimates are provided on the employmenteffects of imports in some four-digit categories where import com-petition has been especially strong, the employment effects of im-ports from, and exports to, the developinig countrics are not se-parately examined. Krueger thus relies oll data on total imports inrejecting --the belief that the underlying cause of the difficulties ofindustries seeking protection is competition from abroad, especiallyfrom the LDCs'' (19718, p. 2).
In turn, Grinols and Thorbecke have estimated the direct pluisindirect employment effects of changes in the U.S. trade balancewith developing couLntries between 1963 andc 1975 for a sample of22 industries among the 157 sectors of the 1972 inpiit-output table,where changes in the net trade balance exceeded $175 million. Tiheauthors find that there has been a net gain of 219 tchousand jobs inthe United States, which is reduced to 147 thousand jobs if thefour food processing industries are excluded (1978, p. 11). Havingfurther examined "the effects on U.S. ernploy,ment of a hypo-thetical 10% change iti the prevailing IUS-LDC trade pattern forevery year of the sample period'' (p. 36), tihey conclude thlat"protectionistic measures as they relate co US-LDC trade are morelikely to reduce domestic employment thani increase it- (Ibída.
The results obtained by Grinols and Thorbecke are explainedby the growiing export surplus of the United States in manufacturedtrade with the devclopilng countries. Thus, between 1963 and 1975,the sum of positive incrernenllts in the [J.S. trade balance in man-ufactured goods with the developing councries itn the 18 man-ufacturing industries (excluding food processing) exceeded the sumn)f negative incremncts about thrce-and-a-h-alf times. If WvC adjust
C liGie e al., however, also ceslmated the dirctr eimlrl ilili.nt eIfef s ofmultilateral trade liberalization in textiles. T['hese are -37 thousa'and jobs in thcUniited Srates, -6 in Canada. -17 in 1:1:(. and -41 in Japan (pp. 1I 2-35).
The Changing International Division of Labor in Manufactured Goods 257
for differences in the absolute increment in trade flows, and cal-culate the average number of jobs per $1 million of exports andimports, the conclusions reached by Grinols and Thorbecke arereversed: an increase in exports of $1 million would entail a gain of34.7 jobs in industries of the first group as compared to a loss of56.3 jobs resulting from a $1 million increase in imports in thesecond group, i.e., a ratio of .62 (p. 11).' At the same time, to theextent that the application of protectionist measures would lead todecreases in imjiports and exports by equal amounts, it is the latterresults that indicate the employment implications of such measures.
Estimates of the employment effects of increased trade withthe developing countries have also been made for Belgium and forGermany. In the first case, the ratio of direct plus indirect em-ployment for BF 1 billion worth of exports to that for imports hasbeen estimated at .84 for 1970 by utilizing a 27 sector input-outputtable, of which 20 sectors produce manufactured goods (de Grauwe,et al., 1978, p. 9). In the second case, two sets of estimates areavailable.
Utilizing a 47 sector input-output table, with 28 sectors pro-ducing manufactured commodities, Schumacher has estimated theratio of the direct plus indirect employment effects of a balancedincrease of German trade in manufactured goods with the deve-loping countries at .96 while a net employment gain is shown ifonly the direct .effects in the manufacturing sector are considered(1977, p. 39). The latter estimate contrasts with more recent cal-culations by Hiemenz and Schatz who projected a gain of 400thousand jobs through increased exports and a loss of 846 thousandjobs through increased imports in trade in manufactured goods withthe developing countries for 1985, assuming that recent trendscontinue and utilizing the same industrial breakdown as Schuma-cher (1979, pp. 48-49).
In turn, Lydall has utilized a 20 sector input-output table, ofwhich 10 sectors produce manufactured goods, to estimate thedirect plus indirect employment effects of trade liberalization inselected industries of the developed countries, matched by there-spending of increased export proceeds by the developing coun-tries in the country of importation. Results obtained for the UnitedStates, France, Germany, and the United Kingdomn show net losses
The cited estimates excludc processed food that is not part of manufactur-ed goods under the definition used in this paper.
258 Banca Nazionale del Lavoro
in employment if trade in textiles and ctothing is liberalized; thereis a net gain if trade liberalization occurs in wood products, paperand printing, and ferrous and nonferrous metals; and net em-ployment effects are approximately nil for machinery and othermanufactured goods (1975, pp. 110-li).
Lydall has compared employment changes in selected import-competing industries with across-the-board changes in export in-dustries that would result from the re-spending of increased exportproceeds by the developing countries. The re-spending assumptionhas also been made by Birnberg, who has compared the directemployment effects of a 60 percent across-the-board tariff cut forU.S. imports of manufactured goods other than textiles from thedeveloping countries with the employment effects of the increase inU.S. exports that would result from the speniding of the inicrementin the foreign exchange earnings of the developing countries in theUnited States. Birnberg's results show a gain of 31.5 jobs for a $1million increase in the exports and a loss of 37.1 jobs for a $1million increase in the imports of the United States, '.e. a ratio of.85 (1978, p. 66). The results for imports from the developingcountries originate from Cline s study while exports have beenestimated in the framework of a 21 sector input-output table, with16 sectors producinlg manufactured commodities.
These estimates of the employment effects of trade in man-ufactured goods between developed and developing countries aresubject to various limitations. Lvdall and Birnberg make differentassunmptions as regards exports and imports; they as well as deGrauLwe, el al., Schumacher, and Hiemenz and Schatz use highly-aggregated commodity classificatilon schemes that include productsof varying labor intensity in the individual categories; while Gri-nols and Thorbecke, who employ a more detailed classificationscheme, cover only selected commodity categories.
Thl1e EI.r¡imaes of Thiir Stíuy
In the present study, a detailed commodity framework hasbeen u.sed to estimate the employmcnt effects for the developedcouLntries of the simultaneous expansion of manufactured exportsand imports in their trade with the dcvclpiíw countries. For' thispurpose, use has becn made of a 184 commodity category break-
The Changing International Division of Labor in Manufactured Goods 259
down of the manufacturing sector that was earlier employed in astudy of the changing pattern of comparative advantage (Balassa,1979).6 Each commodity category includes products that have si-milar economic characteristics, including labor intensity.
The labor-input coefficients used in the calculations originatefrom the U.S. Census of Manufacturing for the year 1975. TheCensus provides data for the four-digit categories of the StandardIndustrial Classification, which have been combined whenever con-sidered necessary in arriving at the 184 commodity category clas-sification scheme. This classification scheme has further been ma-tched against the UN Standard International Trade Classificationthat is used in reporting trade statistics.
The U.S. labor-input coefficients have been utilized for theother developed countries as well. Whilc LydalI shows that labor-input coefficients are negatively correlated with per capita incomes,the differences in the coefficients are considerably smaller at thehigher income leveis of the developed countries (1975, p. 87). Atany rate, by 1975 most developed countries have approached -
and some have even exceeded - U.S. incomes per head.At the same time, the choice of U.S. coefficients has been
made necessary by reason of the lack of labor-input coefficients in acomparable commodity breakdown for the other developed coun-tries. In the only other country, Japan, that has a detailed in-dustrial classification scheme, rapid increases of labor productivityhave rendered the 1970 coefficients used by Cline out of date, andcomparability with the 184 commodity category classification sche-me could not be assured. Note further that unpublished calculationsby Robert E. Baldwin show that the use of Japanese input-outputcoefficients give results very close to those obtained by Grinols andThorbecke for the sectors covered by the latter.
The coefficients pertain to labor inputs used directly in theproduction process. In the absence of an input-output table in theappropriate breakdown, estimating the indirect emnployment effectsof trade in manufactured goods wouild have involved a very sub-stantial effort. At the same time, for reasons noted below, such aneffort did not appear warranted.
6 Wc have excIuded from our purview primary productw whcrc thc avali-ability of natural resourccs affccts thc outcomne. At any rate, in public discussionisattention has becn concentratecd on the employment cffects of trade in rnan-ufactured goods.
260 Banca Nazionale del Lavoro
To begin with, calculating indirect effects on the basis ofhistorical coefficients assumes unchanged proportions of domestical-ly produced and imported inputs that would not be appropriate forestimating the employment effects of an expansion of trade. This isbecause product market equilibrium requires that the marginal costof domestically produced inputs equals the world market price plusthe tariff, so that the increased demand for inputs at higher exportleveis would be satisfied from abroad.
Nontraded inputs by definition originate from domestic sour-ces and should ideally be included in the calculations. Such inputsare, however, of limited importance, averaging 8-12 percent of theproduct price, and their omission is not likeiy to bias the results.This is because, other things being equal, nontraded inputs used inimport-substituting industries can be expected to be more laborintensive than nontraded inputs used in export industries.
Still, the question may be raised what difference the use ofdirect, as against direct plus indirect, labor-input coefficients maymake for the results. Cline's estimates ot the employment effects ofmultilateral trade liberalization, reporned above, show small dif-ferences between the two alternatives in relation to the total tradeof developed countries. The same conclusion applies to Schuma-cher's estimates of the employment effects of increased trade inmanufactured goods between Germany and the developingcountries.
Employment EJfects in the Deve/oped Countries Resullíng fromn theExp.ns¡Zo? of Their Trade in lían l red Goods uith the De-ielopíing Co<¡níri¿'S
'Ihe employment effects in the developed countries that wouldresult fror an ba¿'anred expansion of their trade in manufacturedgoods with the developing countries (i.e. with exports and importsrising by equal amnounts) have been estimated in the present studyon the :1ssumImp(io)n of the unchanged composition of exports and ofimports. Under this assumption, comparisons of averagc labor-inputcocfficients for exports and for goods competing with imports willindicate the employment effects of balanced trade expansion.
Averagc labor-input cocfficients for the exports and the im-ports of manufactured goods in tracle between developed and de-
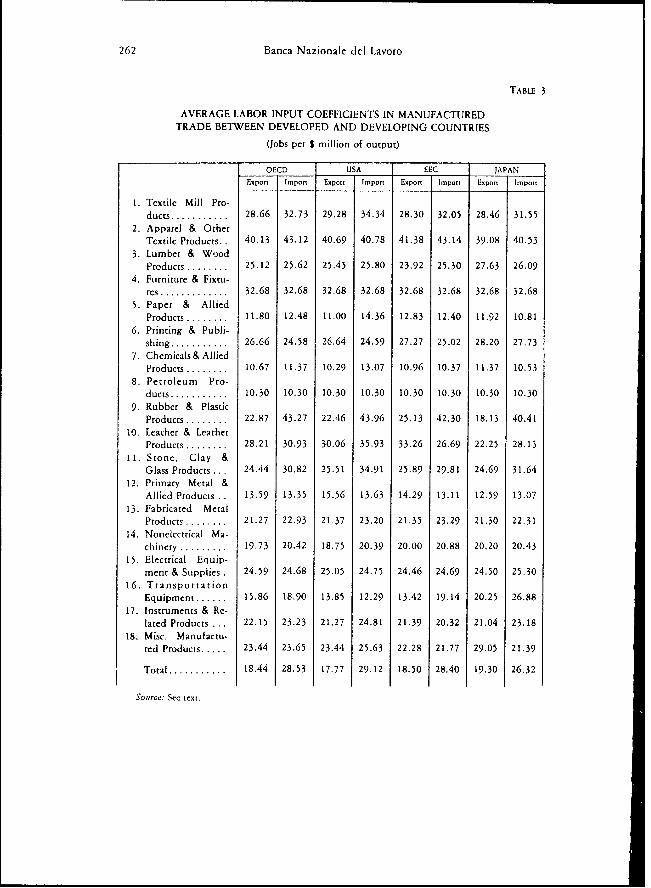
The Changing International Division of Labor in Manufactured Goods 261
veloping countries are reported in Table 3. The estimates shown foreighteen industry groups are weighted averages of the labor-inputdata obtained for the 184 industries, derived by using the value ofexports and imports in trade between developed and developingcountries in the year 1976 as weights. The tab!e provides estimatesfor the OECD as a whole, the United States, the EEC and Japan.
The estimates show the existence of considerable differences inaverage labor-input coefficients for the exports and for the importsof manufactured goods of the developed countries in trade with thedeveloping countries. For the OECD, taken as a whole, the averagenumber of jobs for $1 million of output is 18.4 for exports to, and28.5 for imports froin, the developing countries, the ratio of thetwo being .65. The corresponding ratinos are .61 for the UnitedStates, .65 for the EEC, and .73 for Japan. Thus, among thedeveloped countries, the average ratio of labor-input coefficients forexports and imports is negatively correlated with per capita incomesas the Heckscher-Ohlin theory would lead us to expect.
These estimates conflict with the by-now popular view, ac-cording to which trade in manufactured goods between the de-veloped and the developing countries has negligible net employ-ment effects. At the same time, they confirm the results reached inthe author's study on the stages approach to comparative advan-tage, according to which developing countries tend to specialize inlabor-intensive commodities.
Comparisons with the results obtained by other authors inregard to the employment effects of trade with the developingcountries offer further Interest. As shown above, the average ratioof direct plus indirect employment coefficients for U.S. exports andimports of manufactured goods in trade with the developing coun-tries was .62 for selected industrik in the Grinols-Thorbecke study.Thus, the differences between the direct employment effects es-timated in this study and the direct plus indirect employmenteffects estimated by Grinols and Thorbecke is small, although the
The OECD includes the industrial countries (the Uníted States, Canada,the EEC, EFTA, and Japan) as well as the countries of Southern Europe, (Greece,Spain, and Turkey), Australia and New Zealand. Differences in country corn-position as well as differences in commodity composition (e.g. synthctic fibers havebeen included with manufactured goods in the 184 industry breckidown althoughthey are not part of commodity classes 5 to 8) account for difWerences in the valueof manufactured trade shown in Tables 1 and 2 and that reported in the sub-sequent tables.
262 Banca Nazionale del Lavoro
TABLE 3
AVERAGE LABOR INPUT COEFFICIENTS IN MANUFACTIlREDTRADE BETWEEN DEVELOPED AND DEVELOPING COUNTRIES
(Jobs per $ million of output)
OECD USA EEC JAPAN
Export Import Export Import Export Imp.rt Expon Im pot
1. Textile Mill Pro-ducts ........... 28.66 32.73 29.28 34.34 28.30 32.05 28.46 31.55
2. Apparel & Ot.herTextile Products, . 40.13 43.12 40.69 40.78 41.38 43.14 39.08 40.53
3. Lumber & WoodProducts ........ 25.12 25.62 25.45 25.80 23.92 25.30 27.63 26.09
4. Furniture & Fixtu-res ............. 32.68 32.68 32.68 32.68 32.68 32.68 32,68 32.68
5. Paper & AlliedProducts ........ 11.80 12.48 11.00 14.36 12.83 12.40 11.92 10.81
6. Printing & Publi-shing ........... 26.66 24.58 26.64 24.59 27.27 25.02 28.20 27.73
7. Chemicals & AlliedProducts ........ 10.67 11.37 10.29 13.07 10.96 10.37 11.37 10.53
8. Petroleum Pro-ducts ........... 10.30 10.30 10.30 10.30 10.30 10.30 10.30 10.30
9. Rubber & PlasticProducts ........ 22.87 43.27 22.46 43.96 25.13 42.30 18.13 40.41
10. Learher & LeatherProducts ....... 28.21 30.93 30.06 35.93 33.26 26.69 22.25 28.13
11. Stone, Clay &Glass Products ... 24.44 30,82 25,51 34.91 25.89 29.81 24.69 31.64
12. Primary Metal &Allied Products . . 13.59 13.35 15.56 13.63 14.29 13.11 12.59 13.07
13. Fabricated MetalProducts . ....... 21.27 22.93 21.37 23,20 21.35 23.29 21.30 22.31
14. Nonelectrical Ma-chinery .......... 19.73 20.42 18.75 20.39 20.00 20.88 20,20 20.43
15. Electrical Equip-ment & Supplics . 24.59 24.68 25.05 24.75 24.46 24.69 24.50 25.30
16. TransportationEquipment ...... 15.86 18.90 13.85 12.29 13.42 19.14 20.25 26.88
17. Instruments & Re-lated Products . . . 22.15 23.23 21.27 24.81 21.39 20.32 21.04 23.18
18. Misc. Manufactu-red Products ..... 23.44 23.65 23,44 25.63 22.28 21.77 29.05 21.39
Total ........... 18.44 28.53 17.77 29.12 18,50 28,40 19.30 26.32
Source: Sec text.
The Changing International Division of Labor in Manufactured Goods 263
comparability of the results is reduced by diffcrences in industrycoverage.
In trlrn, de Grauwe's results for Belgium and Schumacher'sestimates for Germany refer to earlier years, and shifts have since
occurred in favour of the importation of labor-intensive goods, suchas clothing and electronics, from the developing countries at cheexpense of capital-intensive iron and steel and chemicais, In fact,
Schumacher's results show increases in the relative labor-inttensity of
imports after 1972, although the ratio of estimated average direct
plus indirect labor-input coefficients for German exports and im-
ports of manufactured goods was only .94 for changes in the
composition of this trade between 1972 and 1976 (1978, p. 10).
Furthermore, as we have seen, projections made by Hiemenz and
Schatz indicate a considerable employment loss for German trade in
manufactured goods with the developing countries.<Also, the Belgian and the German estimates are based on thc
assumption that labor-input coefficients are the same for exports
and for imports in each industry group. The estimates of thepresent study, however, show the existentc of considerable differ-
ences in the coefficients as between the developed countrics' exports
and imports in trade with the developing countries ¿1/i.hi9n rnost
industry groups. This is indicated by a comparison of average labor-input coefficients for exports and for imports in the 18 industrygroup breakdown (Table 3).
To begin with, there are large differences in average labor-
input coefficients for exports and imports in the case of rubber and
plastic products; stone, clay and glass products; and transportationi
equipment. In these industry groups, the ratíos of the averagelabor-input coefficients for exports as compared to imports are .53,.79, and .84, respectively, for the OECD taken as a whole.
The results for these industry groups are explained by thedominant role played by highly labor-intensive rubber footwear in
the developed countries' imports, and by the relative importance ofhighly capital-intensive tires and tubes in their exports, of rubberand plastic products; by the high share of relatively lab'r-i mensive
8 SchumacherCs more recent estimates do not report direct labor-input tocffictents alone. Also, there seems to be a conflict betwcc estirnates of dirc(t plusindirect employment effects in Schumacher's estimates reported in his 1977 (1). 39)and 1978 (p. 8) articles as weil as betwcen thc rcsults shown in two of thc tables inhis 1978 paper (pp. 9 and lo).
264 Banca Nazionale del I.avoro
glass containers in the imports, and the high share of relativelycapital intensive exports of cement in the exports, of stone, clay andglass products by the developed countries; and by the high share ofrelatively labor-intensive ships and boats in the imports, and thehigh share of relatively capital-intensive motor vehicles in theexports, of transportation equipment by these countries.
Labor-input coefficients are higher for imports than for exportsin the trade of the OECD countries with the developing countries
in most other industry groups, too. The opposite result is shownonly for printing and publishing and for primary metals. But, inthese cases, the differences are small; the ratio of labor-input coef-ficients in export-import relationships is 1.08 in the first case and1.02 in the second. At the same time, printing and publishing is arelatively unimportant item in trade between developed and de-veloping countries.'>
There are a few additional exceptions for individual developedcountries and country groups but the differences exceed 10 percentonly for transportation equipment in the United States (a ratio of1.13), leather and leather products in the EEC (a ratio of 1.25),and miscellaneous manufactured products in Japan (a ratio of 1.36).In the United States. the result has been due to the relatively highshare of th imports of auromobile parts and accessories that arecombined with capital-intensive motor vehicles; in the EEC, thehigh export share of capital-intensive leather has contributed to theoutcome; while in Japan the exportation of relatively labor-intensivetoys and sports goods is largely responsible for the result obtainedin regard to miscellaneous manufactured products.
The numerical magnitudes of average betwveen and w¡thin in-dustry group differences on labor-input coefficients are of furtherinterest. The5e can be shown by comparing the ratios of averagelabor-input coefficients for exports and imports reported above withthe ratios derived on the assumption that labor-input coefficientsare invariant within each of the eighteen industry groups. Therelevant results are .65 and .71 for the OECD, taken as a whole,.61 and .66 for the United States, .65 and .70 for the EEC, and .73and .81 for Japan. It appears, then, that within-industry groupdifferences in labor-input coefficients account for about one-sixth of
'> Labor-input cocfficierits are the same for exports and for rrnpcts ¡ti thecase of furniture and pctrolcurn produccs where, due to data limitations, furtherdisaggregation was not feasible
The Changing International Division of Labor in Manufactured Goods 265
the difference in average labor-input coefficients for exports andimports, estimated in a 184 commodity category breakdown. Itmay be suggested that additional disaggregation would furtherincrease differences in the coefficients.
Thus far, we have compared average labor-input coefficientsfor manufactured goods traded between developed and developingcountries. These coefficients will be relevant in the event of abalanced expansion of manufactured trade between the two groupsof countries. In such an eventuality, the number of jobs lostthrough increased imports would be about one-half higher than thenumber of jobs gained through exporting, for the OECD taken as awhole.
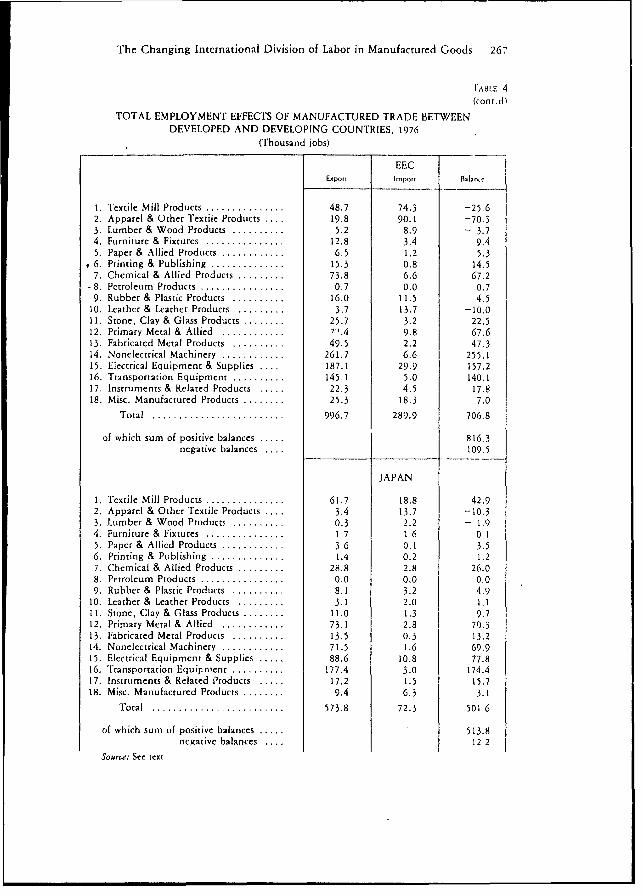
An alternative hypothesis postulates equiproportionate increa-ses in the exports and imports of manufactured goods in tradebetween developed and developing countries (i.e. identical rates ofchange for exports and imports); for short, a proportional expansionof trade. Assuming further unchanged export and import structuresas beforehand, the employment effects of a proportional expansionof trade are indicated in Table 4 that provides information on thelabor content of manufactured exports, and of products competingwith manufactured imports, in the trade of the developed countrieswith the developing countries. The estimates have been derived bymultiplying export and import values for 1976 by the labor-inputcoefficients estimated in the 184 industry breakdown.
The results show substantial positive employment effects forthe OECD countries in their trade in manufactured goods with thedeveloping countries. Similar conclusions apply to the United Sta-tes, the EEC, and Japan. Thus, in the event of a proportionalexpansion of trade, the ratio of jobs gained through exports to jobslost through imports would be 2.8 in the OECD taken as whole,1.4 in the United States, 3.4 in the EEC, and 7.9 in Japan. It isapparent that differences in the results shown in Tables 3 and 4 areexplained by intercountry variations in export-import ratios in man-ufactured trade with the developing countries. 1
The proportional expansion of manufactured trade betweendeveloped and developing countries would create new jobs in mostindustry groups in the developed countries. Exceptions are textiles,clothing, lumber and wood products, rubber and plastic products,leather and leather products, and miscellaneous manufactures. Forthe OECD countries, taken together, a 10 percent proportionial

266 Banca Nazionale del Lavoro
TABLE 4
TOTAL EMPLOYMENT EFFECTS OF MANUFACTURED TRADE BETWEENDEVELOPED AND DEVELOPING COUNTRIES, 1976
(Thousand iobs)
OECDExpon I..pon Die
1. Textile Mill Products ............... . .. 138.9 192.2 - 53,32. Apparel & Other Textile Products ..-. 40.8 218.2 -177,.43. Lumber & Wood Produccs 0.......... 1.4 26.3 - 15.94. Furniture & Fixtures ................ 19.7 10.6 9.15. Paper & Allied Products ... - ..... 33 3 2.8 30.56. Printing & Publishing ............... 25.0 2.7 22 37. Chcmical & Allied Products 163.4 23.4 140.08. Petroleum Products ................. ..... 1.1 0.0 1 19. Rubber & Plastic ProducCs . .. 32.2 63.1 30.9
10. Leather & Leather Products . ...... 10.1 36.2 - 26 2II, Stone, Clay & Glass Products ........ 51.6 10.9 40?12. Primary Metal & Allied ............ 194.2 27.7 166.513. Fabrica ted Metal Products .......... 91.9 7 3 84.514. Nonelectrical Machinery .......... .. .. 527.4 18. 508.715. Electrical Equipment & Supplies 417.3 122.7 294.616. Transportation Equipment ..... ... 486.2 13.7 472. 517. Instrumenrs & Related Products . . .72 17.8 54.918. Misc. Maniufactured Produces 'Y'. ,7 . 58.0 - 103
Total .................... 2 563 R8 852.5 1511 3
of whlich stim of positive balances 1825 4negative balances . . . 314.1
USA
1. Textile Mill Products .............. 15.4 62.5 -47.12. Apparel & Other Textile Proclucts . . 13. 0 81.5 -68.53. Lumber & Wood Products 2.0 11.5 - 9.54. Furniture & Fixtures ............. 3.4 4.1 - 0.'5. Paper & Altied Products ....... . . 8.6 1.0 7.66. Printing & Publishing .............. . 1.5 0.8 3.77. Chemical & Allied Products .375 10.4 27.18. Pectroleurn Products .......... - . 0.0 0.0 0.09. Rubbcr & Plastic Products 4.4 41.8 -37.4
10. Leather & Leather Products 2..... . 25 15.1 -12.6I1. Stone, Clay & Glass Products 6....... 6. 4.5 2.1
12. Primarv Metal & Allied ............ 25.' 11.9 13.813. Fabricated Metal Products ... ........ 15.9 2,8 13.1
14. Nonlecetrical MRachinery ............ 142.7 6.4 136.315 Electrical Eqtuipment & Supplies .. ,. 106.3 77.9 28.416. Transportation Equipment .......... 108.0 2.6 105.4
17. Instruments & Related Products 16.3 9.5 6.818. Misc. Manufactured Products 9.1 27.2 -18.1
Total. 521.9 371.5 150.4
of which surm of positivc balanccs 344.3negacívc balances . . 193.9
The Changing International Division of Labor in Manufactured Goods 267
L'ABLE 4(cont.d)
TOTAL EMPLOYMENT EFFECTS OF MANUFACTURED TRADE BETWEENDEVELOPED AND DEVELOPING COUNTRIES. 1976
(Thousand jobs)
EECExport Imporr B.I.,ue
1. Textile Mill Products ............... 48.7 74.3 -25.62. Apparel & Other Textile Products ... 19.8 90.1 -70.33. Lumber & Wood Products .......... 5.2 8.9 - 3.74. Furniture & Fixtures ............... 12.8 3.4 9.45. Paper & Allied Products 6........... 6.5 1,2 5.36 6. Printing & Publishing .................... 15.3 0.8 14.57. Chemical & Allied Prcducts ......... 73.8 6.6 67.2
- 8. Petroleum Products .... ......... ..... 0.7 0.0 0.79. Rubber & Plastic Products .......... 16.0 11.5 4.5
10. Leather & Leather Products ......... 3.7 13.7 -10.011. Stone, Clay & Glass Products ........ 25.7 3.2 22.512. Primary Metal & Allied .7.4.......... ---A 9.8 67.613. Fabricated Metal Products .......... 49.5 2.2 47.314. Nonelectrical Machinery ............ 261.7 6.6 255.115. Electrical Equipment & Supplies .... 187.1 29.9 157.216. Transportation Equipment .......... 145.1 5.0 140.117. Instruments & Relatcd Products ..... 22.3 4.5 17.818. Misc. Manufactured Products ........ 25.3 18.3 7.0
Total .............................. 996.7 289.9 706.8
of which sum of positive balances 816.3negative balances .... 109.5
JAPAN
1. Textile Mill Products ............... 61.7 18.8 42.92. Apparel & Other Textile Products .... 3.4 13.7 -10.33. Lumber & Wood Products .......... 0.3 2.2 - 1.94. Furniture & Fixtures ............... 1.7 1.6 0.15. Paper & Allied Products ............ 3.6 0.1 3.56. Printing & Publishing ...... ............... 1.4 0.2 1.27. Chemical & Allied Products ......... 28.8 2.8 26.08. Petroleum Products ................ 0.0 0.0 0.09. Rubber & Plastic Products ........... S1 3,2 4,9
10. Leather & Leather Products, ........ 3.1 2.0 1.111. Stone, Clay & Glass Products 1......... l0 1.3 9.712. Primary Metal & Allied ............ 73.1 2.8 70.313. Fabricated Metal Products ........ 13.5 0.3 13.214. Nonelectrical Machinery ............ .... 71.5 1,6 69.915. Electrical Equipment & Supplies ..... 88.6 10.8 77.816. Transportation Equipnment ..........r 177.4 3.0 174.417. lnstruments & Related Products ..... 17.2 1.5 15.718. Misc. Manufactured Products . . . ..... 9.4 6.3 3.1
Total ......................... .. . 573.8 72.3 501.6
of which sum of positive balances 5 13.8negative balances .. . 12.2
Source: Set text

268 Banca Nazionale del Lavoro
increase in trade flows would entaiíl the loss of altogether 31thousand jobs in these industries as compared to a total gain of 183thousand jobs in the other industry groups. Comparable figures are19 thousand and 34 thousand for the United States and 11 thou-sand and 82 thousand for the EEC. Finally, Japan would experiencea gain of 51 thousand jobs in its export industries, with practicallyno loss of jobs elsewhere.'°1
The Sk/ll-Intensity of Trade
We have seen that average labor inpu.-coefficients are aboutone-half greater for the manufactured imports of the developedcountries from the developing countries than for their exports tothese countries. The opposite conclusion obtains if we considerprofessional and technical labor alone. In this occupational group,the ratio of labor-input coefficients for exports as compared toimports is 1.20 in the OECD taken as a whole, 1.20 in the UniredStates, 1.29 in the EEC, and 1.12 in Japan (Table 5A). Thus, therewould be a gain in the employment of professional and technicallabor in the developed countries, even if one assumed a balancedexpansion of their trade in manufactured goods with the developingcountries. On the OECD level, as well as for the EEC and Japan,there would also be gains in the employment of foremen andskilled workers, while a small loss in this category is shown for theUnited States. In turn, the largest losses would be incurred inregard to semi-skilled and unskilled production workers, where theratio of labor-input coeffipients for exports as compared to importsis .44 for the OECD taken as a whole, .42 for the United States,.45 for the EEC, and .50 for Japan."
The resulrs cited in Table 5A point to the existence of con-siderable differences in the occupational structure of production forexports and for import substitution in the trade of the developedcountries with the developing countries. These differences are put
rito focus in Table 5B that provides information on the average
lO In al] cases, we have taken one-tenth of the sum of positive and negativeemployment balances shown in Table 4. It is apparent from the table that the netemployment effects for particular industries were generally of the same sign in theindividual developed countries and country groups as for the OECD as a whole.
" Results for the individual occupational groups have been obtained byutilizing U.S. statistics on Occupation by Industry for the year 1970.

The Changing International Division of Labor in Manufactured Goods 269
TABLE 5
EMPLOYMENT EFFECTS OF TRADE IN MANUFACTURED PRODUCTS BETWEENDEVELOPED AND DEVELOPING COUNTRIES ACCORDING
TO OCCUPATIONAL CATEGORIES
OECD USA EEC JAPAN
Exporw Impon Exporr Import Expon Import Expon,v Imponr
A. Labor-Input Coe/ficients(No.ojJobs per$ Ml/ion of Output)
1. Professional and TechnicalWorkers ..................... ...07 1.72 2.36 1.97 2.03 1.57 1.93 1.'22. Managersand Administrators 1.03 1.40 1.06 1.47 1,08 1.36 0.91 1.323. Sales Workers . ............... 0.28 0.50 0.28 0.51 0.37 0.51 0.22 0.474. Clerical Workers ...............29 2.93 2.35 3.08 2.32 2.85 2.23 2.725. Foremen and Skilled Workers(Craftsmen) 4.28 3.84 3.69 3.89 4.08 3.69 5.26 3.946. Production Workers, Unskilledand Semi-skilled (Operators) 7.32 16.57 7.08 16.68 7.53 16.81 7.36 14.637. Workers in Construction, Tran.sportation, Material Handling, etc. 0.39 0.50 0.36 0.50 0.38 0.50 0.42 0.488. Laborers .................. 0.78 1.06 0.60 1.02 0.76 1.11 0.99 1.04
Total ............ 18.44 28.53 17.77 29.12 18.50 28.40 19.30 26.32
B. Employment Shares (percent)
1. Professional and TechnicalWorkers ................... 11.22 6.04 13,26 6 77 10.98 5.52 9.99 6.532. Managersand Adminisrrators 5.57 4.91 5.96 5.04 5.83 4.80 4.73 5 013. Sales Workers . . ...............54 1.76 1.56 1.75 1.72 1,78 1.14 1.784. Clerical Workers ............ 12.43 10.27 13.20 10.59 12.55 10.03 115.3 10.325. Foremen and Skilled Workers(Crafrsmen) ................. 23.23 13.45 20.76 13.37 22.07 12.99 27.25 14.966. Production Workers, Unskilledand Semi-skilled (Operators) 39.71 58.08 39.84 57.27 40.58 59.19 38.11 55.607. Workers in Construction, Tran-sportation, Material Handling, etc. 2.09 1.76 2.04 1.7 3 2.07 1.77 2.15 1 848. Laborers ................... 4.23 3.73 3.39 3.49 4.11 3.9)2 5.14 3 95
Total ........... 100.00 100.00 100.00 100.00 100.00 100.00 100.00 100.00
C. Employmen: Ejfects of Tradeín 1976 Thousands of/Jobs)
1. Professional and TechnicalWorkers ... ............... 265.2 51.5 69.2 25.2 109.4 16.0 57 3 4.72. Managersand Administrators . 131.8 41.9 31.1 18.7 58.2 13.9 27.1 3.63. Saics Workers . ...............36.4 15.0 8.1 6.5 17.2 5.2 6 5 1.34. Clerical Workers......... .. 294.0 87.6 68.9 39.3 125 1 29.1 66.2 - 55. Foremen and Skilled Workers(Craftsmen) ................. 549.0 114.7 108.4 49.7 220.0 37, .7 156.3 10.86. Production Workers, Unskilledand Semi-skilled (Operators) 938.6 495.1 207.9 212.7 405.5 171.6 2 18. 4 0 27. Workers in Construction, Tran.sportation, Material Handling, etc. 494A 15.0 10.6 6.4 20 6 5.1 12.4 1 18. Laborers .................. 99.8 31.8 17.6 13.0 40.9 11.4 29.5 2 9
Total ........... 2363.8 852.5 521.9 371.5 996.7 289.9 573.8 72.2
270 Banca Nazionale del Lavoro
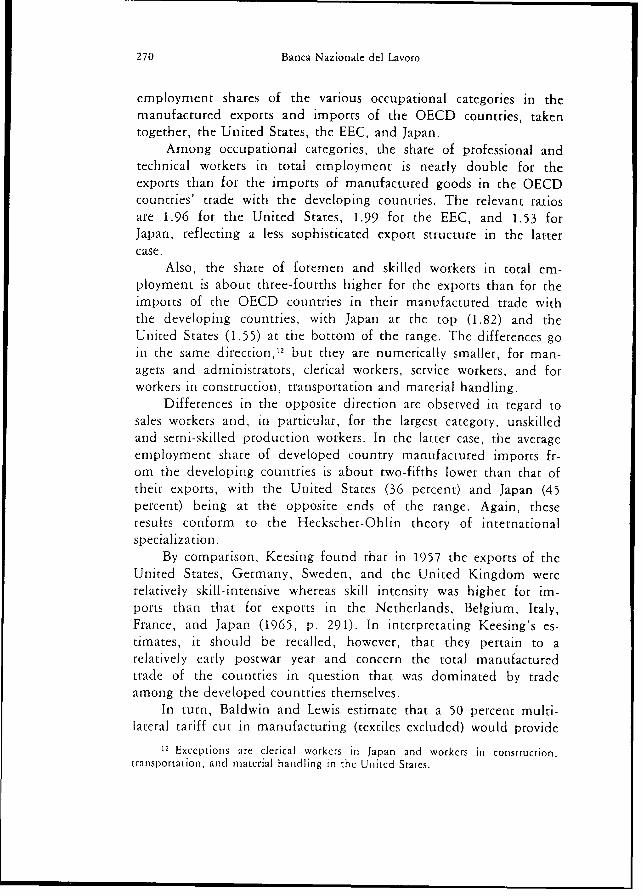
employment shares of the various occupational categories in themanufactured exports and imports of the OECD countries, takentogether, the United States, the EEC, and Japan.
Among occupational categories, the share of professional andtechnical workers in total einployment is nearly double for theexports than for the imports of manufactured goods in the OECDcountries' trade with the developing countries. The relevant ratios
are 1.96 for the United States, 1.99 for the EEC, and 1.53 forJapan, reflecting a less sophisticated export structure in the latter
case.Also, the share of foremen and skilled workers in total em-
ployment is about three-fourths higher for the exports than for theimports of the OECD countries in their manufactured trade with
the developing countries, with Japan at the top (1.82) and theUnited States (1.55) at the bottom of the range. The differences goin the same direction,12 but they are numerically smaller, for man-
agers and administrators, clerical workers, service workers, and forworkers in construction, transportation and material handling.
Differences in the opposite direction are observed in regard tosales workers and, in particular, for the largest category, unskilledand semi-skilled production workers. In the latter case, the averageemployment share of developed country manufactured imports fr-om the developing countries is about two-fifths lower than that of
their exports, with the United States (36 percent) and Japan (45percent) being at the opposite ends of the range. Again, theseresults conform to the Heckscher-Ohlin theory of international
specialization.By comparison, Keesing found that in 1957 the exports of the
United States, Germany, Sweden, and the United Kingdom wererelatively skill-intensive whereas skill intensity was higher for im-ports than that for exports in the Netherlands, Belgium, Italy,France, and Japan (1965, p. 291). In interpretating Keesing's es-timates, it should be recalled, however, that they pertain to a
relatively early postwar year and concern the total manufacturedtrade of the countries in question that was dominated by tradeamong the developed countries themselves.
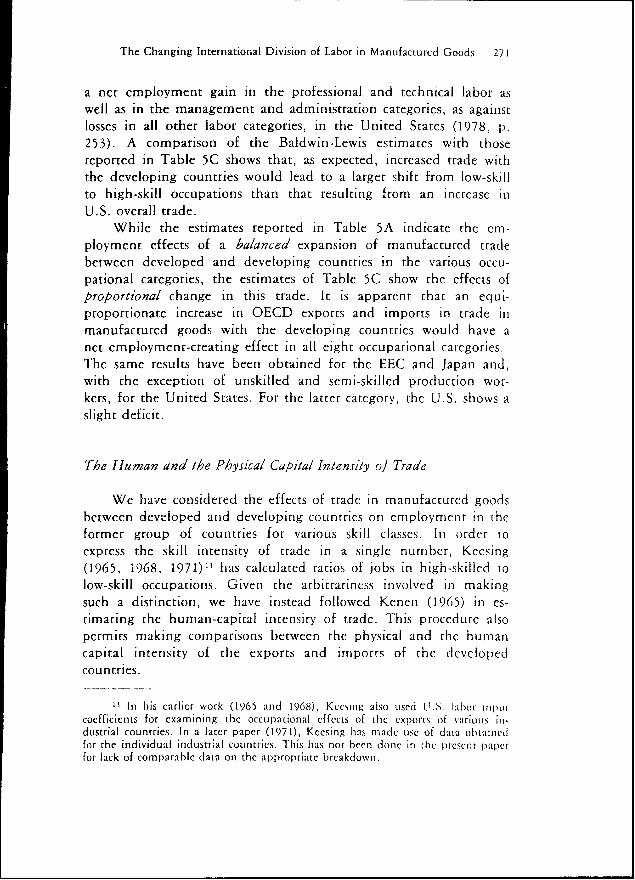
In turn, Baldwin and Lewis estimate that a 50 percent multi-lateral tariff cut in manufacturing (textiles excluded) would provide
12 Exceptions are clerical workers in Japan and workers in construction,tranisportation. and material handling in the United States.
The Changing International Division of Labor in Manufactured Goods 271
a net employment gain in the professional and technical labor aswell as in the management and administration categories, as againstlosses in all other labor categories, in the United States (1978, p.253). A comparison of the Baldwin-Lewis estimates with thosereported in Table 5C shows that, as expected, increased trade withthe developing countries would lead to a larger shift from low-skillto high-skill occupations than that resulting from an increase inU.S. overall trade.
While the estimates reported in Table 5A indicate the em-ployment effects of a balanced expansion of manufactured tradebetween developed and developing countries in the various occu-pational categories, the estimates of Table SC show the effects ofproportional change in this trade. kt is apparent that an equi-
proportionate increase in OECD exports and imports in trade inmanufactured goods with the developing countries would have anet employment-creating effect in all eight occupational categories.The same results have been obtained for the EEC and Japan and,with the exception of unskilled and semi-skilled production wor-kers, for the United States. For the latter category, the U.S. shows aslight deficit.
The Human and the Physical Capital Intensity of Trade
We have considered the effects of trade in manufactured goodsbetween developed and developing countries on employment in theformer group of countries for various skill classes. In order toexpress the skill intensity of trade in a singlc number, Kccsing(1965, 1968, 1971)'3 has calculated ratios of jobs in high-skilled rolow-skill occupations. Given the arbitrariness involved in makingsuch a distinction, we have instead followcd Kenen (1965) in es-timating the human-capital intensity of trade. This procedure alsopermits making comparisons between the physical and the humancapital intensity of the exports and imports of the dcvelopedcountries.
15 In bis carlier work (1965 and 1968), Kccsiig also usedi l.S. labor onpcoefficients for examining the occupational effecis of thc exports of various in.dustrial countries. In a later paper (1971), Kcesing has made use of data obtamnedfor the individual industrial countries. This has tlot becoi done ¡i the present papcrfor lack of comparable data on the appropriate brcakdown,
272 Banca Nazionale del Lavoro
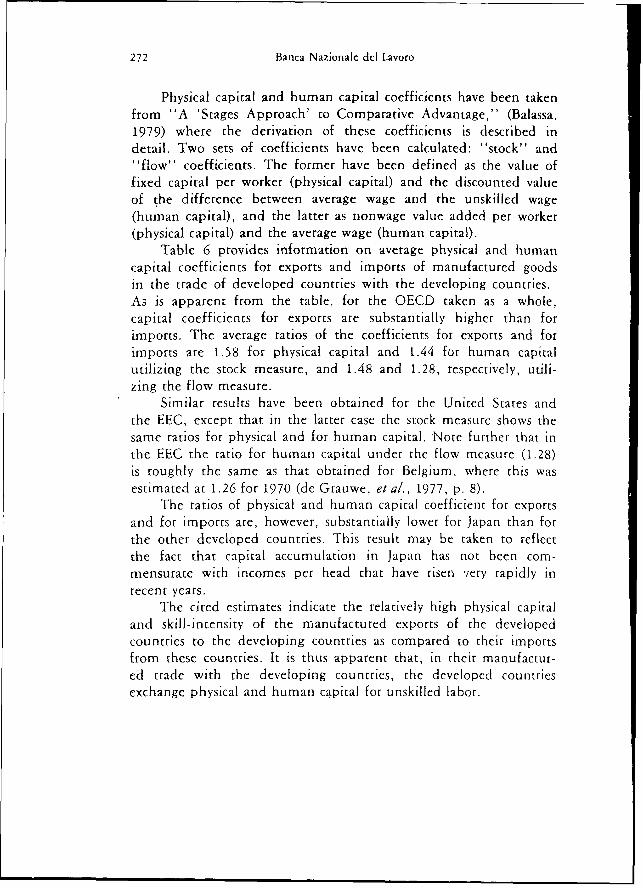
Physical capital and human capital coefficients have been taken
from "A 'Stages Approach' to Comparative Advantage,- (Balassa,
1979) where the derivation of these coefficients is described in
detail. Two sets of coefficients have been calculated: "stock" and
"flow" coefficients. The former have been defined as the value of
fixed capital per worker (physical capital) and the discounted value
of the difference between average wage and the unskilled wage
(human capital), and the latter as nonwage value added per worker
(physical capital) and the average wage (human capital).
Table 6 provides information on average physical and human
capital coefficients for exports and imports of manufactured goods
in the trade of developed countries with the developing countries.
As is apparent from the table, for the OECD taken as a whole,
capital coefficients for exports are substantially higher than for
irnports. The average ratios of the coefficients for exports and for
imports are 1.58 for physical capital and 1.44 for human capital
utilizing the stock measure, and 1.48 and 1.28, respectively, utilí-
zing the flow measure.Similar results have been obtained for the United States and
the EEC, except that in the latter case tie stock measure shows the
same ratios for physical and for human capital. Note further that ini
the EEC the ratio for human capital under the flow measure (1.28)
is roughly the same as that obtained for Belgium, where this was
estimated at 1.26 for 1970 (de Grauwe, et al., 1977, p. 8).The ratios of physical and human capital coefficient for exports
and for imports are, however, substantially lower for Japan than for
the other developed countries. This result rnay be taken to reflect
the fact that capital accumulation in Japan has not been com-
mensurate with incomes per head that have riseri very rapidly in
recent years.The cited estimates indicate the relatively high physical capital
and skill-intensity of the n;anufactured exports of the developed
countries to the developing countries as compared to their imports
from these countries. It is thus apparent that, in their manufactur-
ed trade with the developing countries, the developed countries
exchange physical and human capital for unskilled labor.
The Changing International Division of Labor in Manufactured Goods 273
TABLE 6PHYSICAL AND HUMAN CAPITAL COEFFICIENTS FOR MANUFACTURED EXPORTS
AND IMPORTS OF DEVELOPED COUNTRIES(Thousand dollars per worker)
OECDExport Import Ratio
Stock Measures
Physical Capital ...................... 16.6 10.5 1.58Human Capital ....................... 29.7 20.6 1.44Together ............................... 46.3 31.1 1.49
Flow Measures
Physical Capital ............................ 8.6 5.8 1.48Human Capital ....................... 9.6 7.5 1.28Together ........................... .18.2 13.4 1.36
USAStock Measures
Physical Capital ............................ 15.6 9.2 1.68Human Capital ....................... 30.6 19.9 1.54Together ............................... 46.2 29.2 1.58
F/ow Meas.ures
Physical Capital ............................ 8.8 5.5 1.60Human Capital ....................... 9.8 7.6 1.29Together ............................... 18.7 13.1 1.42
EECStock Measures
Physical Capital ............................ 15.3 11.0 1.39
Human Capital ....................... 29.1 21.0 1.39
Together ................. ........... 44.4 32.0 1.39
F/ow Measures
Physical Capital ........................... 9.0 5.9 1.53Human Capital ............................. 9.5 7.4 1.28Togethcr ............................ 18.5 13.3 1.39
JAPANStock Measures
Physical Capital ....................... 14.1 11.9 1.18Human Capital ....................... 24.8 22.0 1.13Together ............................ 38.9 33.9 1.15
,Fow Measures
Physical Capital ....................... 8.1 6.7 1.21Human Capital ....................... 8.4 7.6 1.10Together ............................ 16.5 14.3 1.15
Source See tcxt.

274 Banca Nazionale del Lavoro
III. Employment Implications of Prospective Trends in Trade inManufactured Goods between Developed and DevelopingCountries14
Projections for Growth and Trade
In the preceding section, we have examined the employment
implications for the developed countries of a balanced and a pro-
portional expansion of their trade in manufactured goods with the
developing countries. Consíderation has further been given to the
occupational structure and to the physical and human capital-in-
tensity of this trade.Neither a balanced nor a proportional expansion of trade in
manufactured goods between developed and developing countries is
a likely occurrence. Rather, these alternatives represent extreme
cases, assuming a zero trade balance in manufactured goods on the
margin in the first case, and an equiproportionate expansion of all
manufactured trade flows in the second.Correspondingly, in order to evaluate the employment impli-
cations of future trade in manufactured goods between the de-
veloped and the developing countries, projections of trade flows
would have to be rnade. In projecting trade flows, we have taken
the estimates of the Worid Development Report as a point of
departure.The Report forecasts the followíng growth rates of the total
exports of manufactured goods from the developing countries be-
tween 1975 and 1985: textiles, 6.2 percent; clothing, 8.3 percent;
chemicals, 13.0 percent; iron and steel, 14.5 percent; machinery
and transport equipment, 17.3 percent; and othcr manufactures
10.0 percent; averaging 12.2 percent (1978, p. 29). The same
estimates are employed in regard to the developing countries'
exports to the developed countries, which account for about three-
fourths of the total.We have applied the export growth rates assumed in the
Wlorld Development Report for 1975-85 to project the future expor-
ts of the developing countries to the developed countries in in-
'4 The calculations reported in this section were performed by joung-YongLee.
The Changing International Division of Labor in Manufactured Goods 275
dividual industry groups for the 1976-86 period. The resultingestimates, reported in Table 7, entail an average growth rate formanufactured exports of 12.6 percent, slightly higher than the 12.2
percent shown in the Report (p. 29). The difference is largely dueto the fact that nonelectrical and electrical machinery and transportequipment, which have the highest projected growth rate, had alarger share in the developing countries exports of manufacturedgoods in 1976 than in 1975.
Our estimates for textiles and clothing represent a departure
from the projections of the World Development Report that cali for
deyeloping country exports to increase at an arnnual average rate of4.5 percent in the first case, and 5.5 percent in the second, be-tween 1976 and 1986 (p. 28). The latter figures appear overly low.
For one thing, they assume no change in the market share of thedeveloping countries in the domestic consumption of textiles and
clothing in the developed countries, although the developing coun-tries may further increase their share at the expense of developed
country exporters such as Japan. For another thing, the estimates donot take account of the continuous upgrading of the exports of
textiles and clothing from the developing countries that has raised
the unit value of these exports at a rate much exceeding averageprices in world trade (Keesing, 1978).
More generally, the question needs to be answered if the1975-85 export growth rates projected in the World Development
Report could be applied to the 1976-86 period, given that themanufactured exports of the developing countries to the developedcountries rose by 29 percent in volume terms in 1976 (cf. p. 4
above). The results for 1977, an increase of 9 percent in volume
terms, would point to the need for a downward adjustment. How-
ever, this decline has proved to be temporary and GATT reports
that ''in volu.me terms... exports from the oil-importing deve-loping countries, which had only a small increase in 1977, appearto h,ave increased at a much faster pace, mainly on account ofmanufactures" in 1978 (GATT/1231, February 9, 1978, p. 4). Infact, among the major developing country exporters of manufactur-ed goods, the volume of total exports rose by 14 percent in Koreaand by 24 percent in Taiwan in 1978 while manufactured exports,including processed food, increased by 28 percent in Brazil.15 The
15 International Financial Siatistics, May 1979 and Conjuntuira Económica,April 1979.
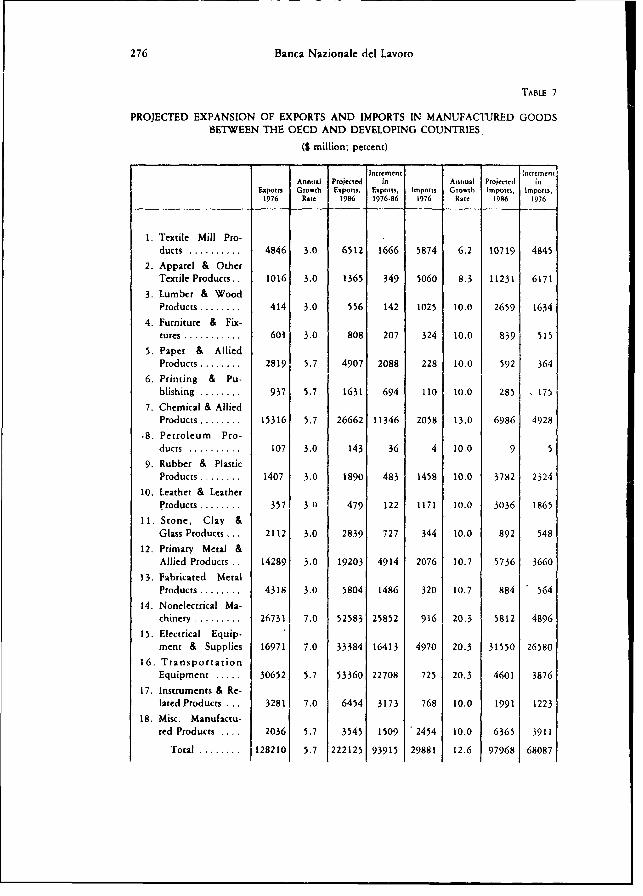
276 Banca Nazionale del Lavoro
TABLE 7
PROJECTED EXPANSION OF EXPORTS AND IMPORTS IN MANUFACTURED GOODSBETWEEN THE OECD AND DEVELOPING COUNTRIES
(S million; percent)
Increment IncrementAnnual Projected in Annual Proiected in
Exports Gro.th Exports, Expoats, mports Growrh Impots, Impoms,1976 Rate 1986 1976-86 1976 Rate 1986 1976
1. Textíle Mill Pro-ducts ........... 4846 3.0 6512 1666 5874 6.2 10719 4845
2. Apparel & OtherTextile Products. . 1016 3.0 1365 349 5060 8.3 11231 6171
3. Lumber & WoodProducts ......... 414 3.0 556 142 1025 10,0 2659 1634
4. Furniture & Fix-tures ............ 601 3.0 808 207 324 10.0 839 515
5. Paper & AlliedProducts ......... 2819 5.7 4907 2088 228 10.0 592 364
6. Princing & Pu-blishing ....... 937 5.7 1631 694 110 10.0 285 . 175
7. Chemical & AlliedProducts ......... 15316 5.7 26662 11346 2058 13.0 6986 4928
.8. Petroleum Pro-ducts ......... 107 3.0 143 36 4 10.0 9 5
9. Rubber & PlasticProducts ......... 1407 3.0 1890 483 1458 10.0 3782 2324
10. Leather & LeatherProducts ......... 357 3 9 479 122 1171 10.0 3036 1865
11. Stone, Clay &Glass Products .. . 2112 3.0 2839 727 344 10.0 892 548
12. Primary Metal &Allied Products 14289 3.0 19203 4914 2076 10.7 5736 3660
13. Fabricated MetalProducts ......... 4318 3.0 5804 1486 320 10.7 884 564
14. Nonelectrical Ma-chinery .......... 26731 7.0 52583 25852 916 20.3 5812 4896
15. Electrical Equip-ment & Supplies 16971 7.0 33384 16413 4970 20.3 31550 26580
1 6. TransportationEquipment 30652 5.7 53360 22708 725 20.3 4601 3876
17. Instruments & Re-lated Products . .. 3281 7.0 6454 3173 768 10.0 1991 1223
18. Misc. Manufactu-red Products .... 2036 5.7 3545 1509 ' 2454 10.0 6365 3911
Total ........ .. 128210 5.7 222125 93915 29881 12.6 97968 68087

The Changing International Division of Labor in Manufactured Goods 277
increases would be larger if we considered manufactured goodsalone. IG
Furthermore, the Korean 15-year plan calls for manufacturedexports to rise at an average annual rate of 14.9 percent between1977 and 1991 (1978, p. 53); the corresponding projections ofTaiwan's 6-year plan are 15.8 percent for the period 1978-81 (1978,p. 12); and unofficial projections for Brazil cali for increases ofslightly over 10 percent for total exports, with substantially highergrowth rates for manufactured exports. Note finally that the es-timates of this study exclude, and those of the World DevelopmentReport include, the countries of Southern Europe that have exper-ienced considerably lower growth rates of manufactured exportsthan all other developing countries, taken as a group.
In estimating the future exports of manufactured goods fromthe developed countries to the developing countries, we have app-lied the GDP growth rate of 5.7 percent projected in the WorldDevelopment Report for the developing countries in the 1975-85period (1978, p. 32) to the 1976-86 period.,' Next, we have as-sumed varying income elasticities of demand in demand in thedeveloping countries for different groups of manu1actures, con-strained to an average of 1.0 for all manufactured goods combined.The latter figure has been derived from the overall average elast-
icity of .88 assumed in the Report (PP. 30, 32), with adjustmentmade for past relationships between the relevant elasticities. Thus,in the 1965-76 period, the ratio of the elasticity of import demandfor manufactured imports to that for all imports by the developingcountries was 1.15. In conformity with the experience of this peri-od, it has further been assumed that share of the developed coun-tries in the manufactured imports of the developing countrieswould remain unchanged during the period of projection.
An income elasticity of import demand of approximately 1.2
16 Manufactured goods account for 85 percent of total exports in Korea and88 percent in Taiwan while processed food rcpresents 38 percent of Braziliaiiexports of manufactured goods, inclusive of processed food. At thc same time,historically, manufactured exports have been rising more rapidly than the exportsof unprocessed and processed prímary commodities.
11 Again. the definition of developing countries used in this study diffcrsfrom that employed in the Reporr. as wc exciude the tountries of SoulhemEurope; in turn, we include Kuwalt, L¡bya, and Saudi Arabia in the group. Thcseadjustments are unlikely to modify the results by more chan one or two tenths of apercentage point, however.
278 Banca Nazionale del Lavoro
has been assumed for nonelectrical and electrical machinery and for
instruments and related products that are required by the invest-
ment effort developing countries would have to make in order to
reach high rates of economic growth, In turn, an income elasticityof import demand of 1.0 has been assurned for paper and paper
products, printing and publishing, chemicais, and transport equip-
ment, where a high income elasticity of domestic demand is coun-ter-balanced by ímport substitution. Finally, an elasticity of import
demand of approximately 0.5 has been assumned for all other in-
dustry groups, where income elasticities of domestic demand are
relatively low and the import substitution effort tends to be con-
siderable.These estimates would give rise to an average rate of growth of
5.7 percent for the exports of manufactured goods from the de-
veloped countries to the developing countries between 1976 and
1978 as compared to the projected growth rate of 12.6 percent for
their imports. Expressed in 1976 prices, there would be an absolute
increment of $94 billion in the exports, and $68 billion in the
imports, of manufactured goods by the OECD countries in their
trade with the developing count.ries during the 1976-86 period
(Table 7). The ratio of exports to imports would correspondinglydecline from 4.3 in 1976 to 2.3 in 1986, with the incremenltal ratio
being 1.4.
The Employment Effects of Projected Trade Flows
The employment implications of projected trade in manu-
factured goods between developed and developing countries will be
considered in the following for the OECD taken as a whole. The
estimates have been made on the assumption that labor-input coef-
ficients would remain unchanged during the 1976-86 period. Cor-
respondingly, changes in employment resulting from trade flows
have becn overestimated by neglecting future increases in labor
productivity and the substitution of capital for labor in response to
increases in real wages.As shown in Table 8A, the projected expansion of trade in
manufactured goods between the developed and the developing
countries would have practically no net effect on employmnent in
the former group of countries. The increase of employment in
The Changing International Division of Labor in Manufactured Goods 279
exports is estimated at 1747 thousand and the decline of employ-ment in imports at 1736 thousand.
The average labor-input coefficients for increases in exports andin imports are estimated at 18.6 and 25.5, respectively, with theirratio being .73. It is thus apparent that the projections would entaila slight reduction in the labor-intensity of imports from the de-veioping countries that would result from changes in thc com-modity composition of this trade. Similar considerations apply tothe capital coefficients shown in Table 8C.
Nevertheless, substantial differences in labor-input cocffic eitsand in capital intensity remain as between projected exports andimports in manufactured trade between developed and developingcountries. Also, there are cotisiderable differences in projected chan-ges in employment among occupational categories, involving a shiftfrom low-skill to high-skiil employment. The major loser is theunskilled and semi-skilled production workers category, with a netdecline of 197 thousand jobs. These results are not surprising, giventhe occupational distribution of labor in production for exportsand for imports in the developed countries.
Prima facie, it is surprising, however, that the largest projectedgain among the skilled and technical labor categories is slhown forforemen and skilled workers, with an incremental export-importratio of 1.54, rather than for professional and technical workers,where the incremental ratio is 1.18. This result is explaialed by tihefact that in electrical machinery and equipment, the industry groLupwith the highest professional and technical labor coefficients, irn-ports from developing counttries are projected to rise at a rapid rate,with the absolute increment in imports exceeding the increment ¡ithe exports of these commodities between 1976 and 1986.
At the same time, projected increases of imports of electricalmachinery and equipment from th,e developing countries are likelvto involve the increased importation of parts, components, andaccessories, coupled with the eventual dominance of these countriesin the world export of radios, television sets, automotive c lcctricalequipment, and simple electronics. The products iti quCstio0n havclower professional and technical labor requirements thani electricalmachinery and equipment in general. This is not shown by tlbcresults, however, because the occupational statistics werc not ava¡-lable in sufficient detail, so that a distinction between the twogroups of electrical machinery and equipment could not be made.
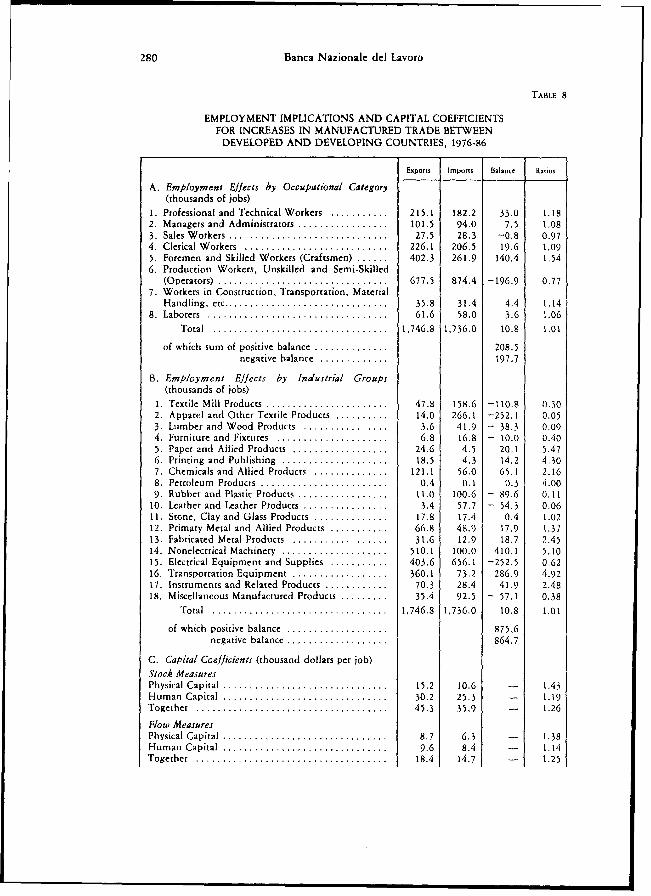
280 Banca Nazionale del Lavoro
TABLE 8
EMPLOYMENT IMPLICATIONS AND CAPITAL COEFFICIENTSFOR INCREASES IN MANUFACTURED TRADE BETWEEN
DEVELOPED AND DEVELOPING COUNTRIES, 1976-86
Exporrs Imports Balanice Ratios
A. Employment Effects by Occupational Category(thousands of jobs)
1. Professional and Technical Workers ............ 215.1 182.2 33.0 1.18
2. Managers and Administrators ................. 101.5 94.0 7.5 1.08
3. Sales Workers .............................. 27.5 28.3 -0,8 0.97
4. Clerical Workets ........................... 226.1 206.5 19.6 1.09
5. Foremen and Skilled Workers (Craftsmen) , ..... 402.3 261.9 140,4 1,54
6. Production Workers, Unskilled and Semi-Skilled(Operators) ................................ 677.5 874.4 -196.9 0.77
7. Workers in Construction, Transportation, MaterialHandling, etc .................... .......... 35.8 31.4 4.4 1,14
8. Laborers .................................. 61.6 58.0 3.6 1.06
Total ................................. 1,746.8 1,736.0 10.8 1,01
of which sum of positive balance 208,5
negative balance 197.7
B. Employment Effects by Industrial Groups(thousands of jobs)
1. Textile Mill Products ......................... 47.8 158.6 -110.8 0.30
2. Apparel and Other Textile Products .......... 14.0 266.1 -252.1 0.05
3. Lumber and Wood Products ... ............... , .3.6 41.9 - 38.3 0.09
4. Furniture and Fixtures ..................... . 6.8 16.8 - 10.0 0.40
5. Paper znd Allied Products .................. , . 24.6 4.5 20.1 5.47
6. Printing and Publishing .................... , .18.5 4.3 14.2 4.30
7. Chemicals and Allíed Products ............... 121,1 56.0 65.1 2.16
8. Petroleum Products . ...................... 0.4 0.1 0.3 4.00
9. Rubber and Plastic Products ................. 11.0 100.6 - 89.6 0,11
10. Leather and Leather Products ............... .... 3.4 57.7 - 54.3 0.06
11. Stone, Clay and Glass Products .... ........ .... 17.8 17.4 0.4 1.02
12. Primary Metal and Allied Products ............... .66.8 48.9 17.9 1.37
13. Fabricated Metal Products ................... 6..31. 12.9 18.7 2.45
14. Nonelectrical Machinery .................... 510.1 100.0 410.1 5.10
15. Electrical Equipment and Supplies . ................ 403.6 656.1 -252.5 0.62
16. Transportation Equipment .................. 360.1 73.2 286.9 4.92
17. lnstruments and Related Products .... ......... 70.3 28.4 41.9 2.48
18, Miscellancous Manufactured Products ......... 335.4 92.5 - 57.1 0.38
Total ................................. 1,746.8 1,736.0 10.8 1.01
of which positive balance 875.6negative balance .......... 864.7
C. Capital Coefficients (thousand dollars per job)
Stock MeasuresPhysical Capital .............................. 15.2 10.6 - 1.43
Human Capital ............................... 30.2 25.3 - 1.19
Together ................. ................ 453 35.9 - 1.26
FIow MeasuresPhysical Capital ............................... 8.7 6.3 - 1.38
Human Capital ............................... 9.6 8.4 - 1.14
Together .................................. 18.4 14.7 - 1.25
The Changing International Division of Labor in Manufactured Goods 281
It follows that the results shown in Table 8A understate thegain in professional and technical employment in the developedcountries that would result from increased trade in manufacturedgoods with the developing countries. The same conclusion is likelyto apply to other skilled categories, all of which show a net em-ployment gain. Thus, the shift from low-skill to high-skill occu-pations in the developed countries, resulting from their increasedtrade in manufactured goods with the developing countries, wouldbe greater than estimated here.
Among the 18 industry groups, total employment in the de-veloped countries would rise in paper and allied products, printingand publishing, chemicals and allied products, primary metals andfabricated metal products, with the largest gains experienced innonelectrical machinery, transport equipment, and instruments andrelated products (Table 8B). In turn, there would be employmentlosses in textiles, clothing, lumber and wood products, furniture,rubber and plastic products, leather and leather products, electricalmachinery and equipment, and miscellaneous manufactures, wher-eas practically no change is shown for petroleum and coal productsand stone, clay, and glass products. The implicatrons of theseresults will be examined in the concluding section of the paper.
Conclusion and Poiicy Implications
We have seen that the export surplus of the developed in-dustrial countries in manufactured trade with the developing coun-tries increased from $36.3 billion in 1973 to $96.8 billion in 1977.And while the bulk of this increase occurred in trade with theoil-exporting developing countries, the export surpius in manu-factured trade with the oil-Importing developing countries also rosefrom $23.9 billion in 1973 to $42.2 billion in 1977.
Alt major industrial countries and country groups experiencedan increase in their trade surplus in manufactured goods with theoil-importing developing countries, with the largest increases shownfor Japan and the smallest for the United States. These diffrciceshave been explained by reference to differences in the initial sí-tuation in 1973 and in the trade policies followed.
We have further considered the employment implications forthe developed countries of their manufactured trade with the de-

282 Banca Nazionale del Lavoro
veloping counttries. The employment effects of a balanced expan-
sion of trade have been indicated by the use of labor-input coef-
ficients that are, on the average, one-half larger for the imports than
for the exports of manufactured goods in the developed countries.
In turn, due to differences in trade volume, the ratio of jobs gained
chrough exports to jobs lost through imports in the OECD countries
would be 2.8 in the event of p,oportional increase in their man-
ufactured exports and imports in trade with ilhe developing coun-
tries, taking 1976 trade flows as a basis.
Neither a balanced increase nor a proportionate increase in
manufactured trade between developed and developing countries is
a likely occurrence, however. We have, therefore, estimated the
employment implications of the expected expansion of this trade in
the period 1976-86, by taking the projections of the W'orld De-
velopment Reporl as a starting point. The resulrs s}how no net
employment effects for the OECD countries as well as a continuing
shift of labor from low-skill to high-skill occupations in these coun-
tries. Particular interest attaches to the effects of trade in man-
ufactured goods on the skill-composition of labor, since one should
look to general economic policies rather than tradce policies to
ensure a satisfactory level of overall employrnent.
The upgrading of the labor force, as well as the exchanige of
physical and human capital for unskilled labor, would have fa-
vorable effects on resource allocation and on economic growth in
the developed countries.1Y At the same time, welfare gains are not
limited ro the exchange of productive factors through trade. Thuls,
additional gains would be forthcoming as a result of increased
competition that provides inducements to tcchnological change.
The shift from low-skill to high-skill occupations would be
n.ssociated with a shift of labor from unskilled-labor intensive to
skill-and physical capital-intensive industries. The sum of iob losses
in the former group of industries would not, however, reach one
million, accounting for a small proportion of employmnent in these
industries. In the case of textiles, clothing, leather and leather
products, the 'trimated job loss of 416 thousand compares to a
total employrment of 9213 thousand in this sector in the OECD
couriiries. taken together, 1976. For the nisccll:Luniit manu-
1< Ncverí hclss. in this studs tc rate of GiNP gro\s,lw lihas bccn tak-e as
exogecnous and CsLimiltCs of the cffcts of trade otn conomci growth have not bcen
made.
The Changing International Division of Labor in Manufactured Goods 283
facturing product group, the comparable figures are 57 thousandand 1421 thousand (Table 8B and OECD, Labor Force Statíriics,1978).
4-ote further that the ten-year time period considered in thisstudy may permit adjustments to take place ámong industries andallow sufficient time for the upgrading of labor. In fact, one mna)envisage larger increases in the imports of manufactured goods bythe developed countrics from the developing countries than pro-jected in the World Development Report without appreciable ad-verse effects on employment in import-competing industries. Forone thing, the Report foresees a decline in the incremental share ofmanufactured goods imported from' the developing countries indeveloped couintry markets from 7.1 perce.nt in 1970-75 to 5.4percent in 1975-85 (1978, p. 28), despite the large increase in thisshare that occurred between 1975 and 1976. For another thing,there are possibilities for additional increases in the share of exportsto the developing countries in the manufactured OL1tpUt of thedeveloped countries, which is projected to rise only slightly fromnthe 1975 level in the Report.''
The above considerations indicate the advantages of liberaltrade policies for the developed countries. This conclusion is stren-gthened if we consider that the import-competing industries of tWedeveloped countries may not experience job losses in absolute termsinasmuch as increased demand associated with economic growNthleads to higher domestic consumption and production. Furthermo-re, increased imports of labor-intensive products rnay be a sub-stitute for the immigration of unskilled and semi-skilled labor,whether legal or illegal.2'u By disregarding labor migration, theabove calculations overestimate job losses to the nationais of thedeveloped countries in import-competing industries.
Reference should further be made to the incre;asing importanceof developing country markets for the developed industrial coun-tries. Excluding U.S.-Canada trade that is in large part intra-firmtrade and one-third of which does not involve the payment ofduties in the framework of rhe automortive agreement, as well astrade in manufactured goods within the Europeao industrial free-
'> Results based on trade data and on information provided n the 11 orIt!Development Reporí (p. 28).
211 In the case of Germany, one-fifch of the projected job loss would be collm-pensated by a decline in irnmigration (H¡1MI.NZ and S(& ;.Niz, 1979, p. 50).
284 Banca Nazionale del Lavoro
trade area, the developing countries offer larger markets to the
exports of the developed industrial countries than does trade among
groups of these countries. In fact, the ratio of the sales of man-
ufactured goods by the developed industrial countries in developing
country markets to their exports to other developed industrial coun-
tries increased from 1.03 in 1973 to 1.55 in 1977. And while
increases were much larger than the average in manufactured expor-
ts to the oil-exporting developing countries, with the ratio of these
exports to trade among groups of developed industrial countries
rising from .25 to .66, increases in this ratio are shown with respect
to exports to the oil-importing developing countries as well (from
.78 in 1973 to .89 in 1979).Concentrating our attention to the oil-importing developing
countries, it may be suggested that increases in the manufactured
exports of these countries have multiplicative effects on their na-
tional incomes and, by increasing their creditworthiness for bor-rowing in international markets, on their imports. lt follows that,
apart from adverse effects on the economic growth of the deve-
loping countries, protectionist actions taken in the developed coun-
tries would adversely affect economic growth in the developed coun-
tries therrselves by foregoing employment gains in high-skill oc-
cupations and in technologically advanced industries that can be
obtained through increased trade in manufactured goods.
Washington, D.C.BEI A BALASSA
REFERENCES
BALASSA, BELA, 'A 'Stages Approach' to Comparative Advantage.," in EconomicGrowih and Resoatrces, Proceedings of the 5th World Congrcss of chcInternational Economic Association held in Tokyo in September 1977, Lon-
don, Macmillan, 1979.BALDWIN, ROBERT E., "Trade and Errployment Effeccts in che United Statcs Multi-
lateral Tariff Reductions,' American Economic *Review, Papers and Pro-
ceedings, May 1976, pp. 142-48.BALDWIN, ROBERr E. and WAYNE E. LEwIS, "U.S. Tariff Effects on Trade and Em-
ployment in Detaíled SIC Industries,' The Impact oj Internatlonal Trade
and Investment iín EJmployment, Proceedings of a Conference on the De-partment of Labor Rcsearch Results, held in December 2 and 3, 1970,Washington, D.C., U.S. Department of Labor. 1978.
The Changing International Division of Labor in Manufactured Goods 285
BIRNBERG, THOMAS, "Economic Effects of Changes in Trade Relations between De-veloped and Less Developed Countries," NIEO Monograph Series, OverseasDevelopment Council, Summer, 1978.
CUNE, WILLIAM, et al, Trade Negotiations in the Tokyo Round: A QuantitativeAssessment, Washington, D.C., The Brookings Institution, 1978.
COUNCIL FOR ECONOMIC PLANNING and DEVELOPMENT, Revised Plan Jor the SecondThree-Year Period (1978-1981) of the Six-Year Plan Jor the EconomicDevelopment of Taiwan, Republic of China, Taipei, 1978.
DE GRAUWE P., W. KENNES, T. PEETERS, and R. VAN STRAELElN, -Trade Liberalizationwith the less Developed Countries: A Case Study of Belgium', Buí/etin del'IRES, No. 44, 1977, pp. 1-16.
FELS, GERHARD, "The Choice of Industry Mix in the Division of Labor betweenDeveloped and Developing Countries," Weltwirtsch4ftliches Archiv, 1972(1), pp. 71-121.
GRINOLS, ERROL and ERIK THORBECKE, -The Effects of Trade between the U.S. andDeveloping Countries in U.S. Employment," Working Paper No. 171, De-partment of Economics, Cornell University, 1978.
HIEMENZ, U. and K.W. SCHATZ, Trade in Place of Migration, Geneva, InternationalLabour Office, 1979.
HsIEH, C., "Measuring the Effects of Trade Expansion on Employment: A Rcviewof Some Research," International Labor Review, January 1973, pp. 1-79.
KEESING, DONALD B., 'Different Countries' Labor Skill Coefficients and theSkill Intensity of International Trade Flows," Journal of InternationalEconomics, November 1971, pp. 443-52.
KEESING, DONALD B., 'Labor Skills and trSe Stnucture of Trade in Manufactures,"in The Open Economy (Peter B. Kenen and Robert Laurence, cd.), NewYork, Columbia University Press, 1968, Pp. 3-18.
KEESING, DONALD B., "Labor SkilJs and International Trade: Evaluating Many TradeFlows with a Single Measuring Device," Review of Economics and Statistics,August 1965, pp. 287-94.
KEESING, DONALD B., "World Trade and Output of Manufactures: Structural Trendsand Developing Countries' Exports," Washington, D.C., World Bank, Fe-bruary 1978, (mimeo).
KENEN, PETER B., "Nature, Capital, and Trade," Journal of Politica¡ Economy,October 1965.
KOREA DEVELOPMENT INSTITUTE, Long-term Prospects for Economic and Social De-velopment 1979-91, Seoul, 1978.
KRUEGER, ANNE O., "Impact of LDC Exports on Employrnent in American In-dustry," Paper presented to the Annual Conference of the InternationalEconomic Study Group, White House, Isle of Thorns, Sussex, England, 1978(mimeo).
LYDALL, H. F., Trade and Employment, Geneva, International Labor Office, 1975.SCHUMACHER, D., "Verstarkter Handel mit der Dritten Welt: Eher Unisetzung als
Freisetzung deutscher Arbeitskrafte," DIW Wochenbericht 5/77, February 3,1977, pp. 35-40.
SCHUMACHER, D., "Beschaftigungswirkungen von Importen aus Entwicklungslan-dern nicht drarnatisieren," DIW Wochenbericht 1/78, January, 1978, Pp.6-11.
THE WORLD BANKHeadquarters:1818 H Street, N.W.Washington, D.C. 20433, U.S.A.European Office:66, avenue d'Iéna75116 Paris, FranceTokyo Office:Kokusai Building,1-1 Marunouchi 3-chomeChiyoda-ku, Tokyo 100, Japan
The full range of World Bank publications, both free and for sale, isdescribed in the World Bank Catalog of Publications, and of the continuingresearch program of the World Bank, in World Bank Research Program:Abstracts of Current Studies. The most recent edition of each is availablewithout charge from:
PUBLICATIONS UNIT
THE WORLD BANK
1818 H STREET, N.W.
WASHINGTON, D.C. 20433
U.S.A.