Assessing river ecological quality using benthic macroinvertebrates in the Hindu Kush-Himalayan...
18
RIVERS IN THE HINDU KUSH-HIMALAYA Assessing river ecological quality using benthic macroinvertebrates in the Hindu Kush-Himalayan region Thomas Korte • Abul Basar Mohammad Baki • Thomas Ofenbo ¨ck • Otto Moog • Subodh Sharma • Daniel Hering Received: 5 February 2009 / Revised: 6 May 2009 / Accepted: 10 May 2009 / Published online: 16 May 2010 Ó Springer Science+Business Media B.V. 2010 Abstract We developed a system for the assess- ment of ecological condition for rivers in the lower mountains and lowlands of the Hindu Kush-Himala- yan region (Pakistan, India, Nepal, Bhutan, and Bangladesh). We used benthic invertebrates collected from 198 rivers, located in five different ecoregions and covering degradation gradients; samples were taken twice (pre-monsoon and post-monsoon) apply- ing a multi-habitat sampling procedure. Out of 38 environmental parameters, we constructed complex principal component analysis (PCA) gradients, sep- arately for the stressors organic pollution, eutrophi- cation, floodplain land use, and hydromorphological degradation. Correlation analysis between inverte- brate metrics and environmental parameters revealed those biological metrics that are most responsive to river deterioration. Redundant metrics were deleted, and the most robust metrics were selected. The range of the index values under reference conditions was defined, and a five-class river quality system was generated. Keywords Bioassessment Á Multimetric Á Metric Á Ecoregion Á ASSESS-HKH Á Stressor Introduction In many parts of the world, benthic invertebrates are used for ecological river assessment. Among a variety of potentially suited assessment methodolo- gies, multimetric indices are increasingly popular, particularly in North America (e.g., Barbour et al., 1999; Weigel et al., 2002), South America (Silveira et al., 2005; Baptista et al., 2007; Moya et al., 2007), Europe (e.g., Hering et al., 2004), and South Africa (Ollis et al., 2006). In Asia (Oriental biogeographic region), river assessment with benthic invertebrates is Guest editors: D. Hering, S. Sharma & O. Moog / Rivers in the Hindu Kush-Himalaya – Ecology and Environmental Assessment T. Korte (&) Á D. Hering Department of Applied Zoology/Hydrobiology, Institute of Biology, University of Duisburg-Essen, Universita ¨tsstr. 5, 45141 Essen, Germany e-mail: [email protected] A. B. M. Baki Department of Water Resources Engineering, Bangladesh University of Engineering & Technology, Dhaka 1000, Bangladesh T. Ofenbo ¨ck Á O. Moog Department of Water, Atmosphere & Environment, Institute for Hydrobiology & Water Management, University of Natural Resources and Applied Life Sciences, BOKU – Max Emanuel-Strasse 17, 1180 Vienna, Austria S. Sharma Department of Environmental Science and Engineering, Aquatic Ecology Centre, Research Development & Consultancy, Kathmandu University, Dhulikhel, P.O. Box 6250, Kathmandu, Nepal 123 Hydrobiologia (2010) 651:59–76 DOI 10.1007/s10750-010-0290-z
Transcript of Assessing river ecological quality using benthic macroinvertebrates in the Hindu Kush-Himalayan...

RIVERS IN THE HINDU KUSH-HIMALAYA
Assessing river ecological quality using benthicmacroinvertebrates in the Hindu Kush-Himalayan region
Thomas Korte • Abul Basar Mohammad Baki •
Thomas Ofenbock • Otto Moog • Subodh Sharma •
Daniel Hering
Received: 5 February 2009 / Revised: 6 May 2009 / Accepted: 10 May 2009 / Published online: 16 May 2010
� Springer Science+Business Media B.V. 2010
Abstract We developed a system for the assess-
ment of ecological condition for rivers in the lower
mountains and lowlands of the Hindu Kush-Himala-
yan region (Pakistan, India, Nepal, Bhutan, and
Bangladesh). We used benthic invertebrates collected
from 198 rivers, located in five different ecoregions
and covering degradation gradients; samples were
taken twice (pre-monsoon and post-monsoon) apply-
ing a multi-habitat sampling procedure. Out of 38
environmental parameters, we constructed complex
principal component analysis (PCA) gradients, sep-
arately for the stressors organic pollution, eutrophi-
cation, floodplain land use, and hydromorphological
degradation. Correlation analysis between inverte-
brate metrics and environmental parameters revealed
those biological metrics that are most responsive to
river deterioration. Redundant metrics were deleted,
and the most robust metrics were selected. The range
of the index values under reference conditions was
defined, and a five-class river quality system was
generated.
Keywords Bioassessment � Multimetric � Metric �Ecoregion � ASSESS-HKH � Stressor
Introduction
In many parts of the world, benthic invertebrates are
used for ecological river assessment. Among a
variety of potentially suited assessment methodolo-
gies, multimetric indices are increasingly popular,
particularly in North America (e.g., Barbour et al.,
1999; Weigel et al., 2002), South America (Silveira
et al., 2005; Baptista et al., 2007; Moya et al., 2007),
Europe (e.g., Hering et al., 2004), and South Africa
(Ollis et al., 2006). In Asia (Oriental biogeographic
region), river assessment with benthic invertebrates is
Guest editors: D. Hering, S. Sharma & O. Moog / Rivers in the
Hindu Kush-Himalaya – Ecology and Environmental
Assessment
T. Korte (&) � D. Hering
Department of Applied Zoology/Hydrobiology, Institute
of Biology, University of Duisburg-Essen, Universitatsstr.
5, 45141 Essen, Germany
e-mail: [email protected]
A. B. M. Baki
Department of Water Resources Engineering, Bangladesh
University of Engineering & Technology, Dhaka 1000,
Bangladesh
T. Ofenbock � O. Moog
Department of Water, Atmosphere & Environment,
Institute for Hydrobiology & Water Management,
University of Natural Resources and Applied Life
Sciences, BOKU – Max Emanuel-Strasse 17,
1180 Vienna, Austria
S. Sharma
Department of Environmental Science and Engineering,
Aquatic Ecology Centre, Research Development &
Consultancy, Kathmandu University, Dhulikhel,
P.O. Box 6250, Kathmandu, Nepal
123
Hydrobiologia (2010) 651:59–76
DOI 10.1007/s10750-010-0290-z

still in its infancy. The knowledge about riverine
biodiversity is incomplete and biomonitoring, and
conservation of rivers is underdeveloped (Dudgeon,
2003). In the Hindu Kush-Himalayan region, targeted
by our study, first steps toward ecological river
quality assessment with benthic invertebrates were
previously done in Nepal (Sharma & Moog, 2005)
and India (CPCB, 1999), applying modified versions
of the Biological Monitoring Working Party
(BMWP) and the Average Score per Taxon (ASPT;
Armitage et al., 1983), respectively. However,
assessment methods based on benthic invertebrates
are potentially well-suited tools for water manage-
ment in Asia, due to steep pollution gradients and the
impacts of other stressors (e.g., Messerli & Ives,
1997; Sharma et al., 2005; CPCB, 2006), which are
well reflected by the biota. Despite the widespread
lack of invertebrate-based assessment methods in the
Hindu Kush-Himalayan region, several studies deal
with other aspects of the benthic invertebrate fauna,
e.g., structural and functional aspects (Rundle et al.,
1993; Ormerod et al., 1994; Suren, 1994; Brewin
et al., 1996, 2000; Nesemann et al., 2007).
This study aimed at developing a multimetric
assessment procedure for streams in the low moun-
tain areas of the Hindu Kush-Himalayan region and
covered the countries Pakistan, India, Nepal, Bhutan,
and Bangladesh. The method is designed for use in
practical water management. Bioassessment of rivers
is a valuable addition of monitoring programmes,
which focus merely on measurements of abiotic
parameters. The community parameters of benthic
macroinvertebrates (metrics) have a strong linkage to
quality and intensity of various stressors. The benthic
invertebrate community provides reliable and rele-
vant signals about the biological effects of human
activities and integrates the effects of stressors over
time. Costs to implement biomonitoring of rivers are
low compared to physical and chemical monitoring
(Resh, 1995; Dudgeon, 2003; Barbour et al., 2004).
The development procedure included the delinea-
tion of ‘‘stream types’’ mainly based on the ecoregion
approach, the a priori classification of sampling sites
to cover a gradient in environmental quality, and the
correlation of a large number of biotic indices against
environmental parameters. We tested if metrics
frequently applied in North America, Europe, and
South America are also suited to detect perturbation of
rivers in the HKH region and if metrics are stressor-
specific, reflecting, e.g., the degree of organic pollu-
tion, eutrophication, land use of the floodplain or
hydromorphological degradation. Finally, for each of
the stream types, a set of robust core metrics reflecting
river degradation was selected and combined into a
multimetric system.
Materials and methods
Study area
The HKH region covers 600,000 km2 and includes
parts of eight countries from Pakistan in the west to
Myanmar in the east. It is subdivided into three parallel
zones of different altitudinal ranges, each with a west–
east extension of 3,500 km: the High Mountains
([5,000 m above sea level) bordering the high plateau
of Tibet, the Middle Mountains (2,000–5,000 m) and
the Siwaliks (500–2,000 m). In the south, the area
descends to the Indo-Gangetic Plains, which cover
parts of India, Nepal, and Bangladesh. We investigated
rivers in the lower parts of the Middle Mountains
located in Bhutan, India, and Pakistan, in the Siwaliks
located in Bhutan, India, Nepal, and Pakistan, and in
the northern parts of the Indo-Gangetic Plains (Ban-
gladesh, India, and Nepal) (Fig. 1).
Stream ‘‘typology’’
We developed multimetric indices for five ecoregions
(based on the WWF Global 2000 ecoregion; Olson
et al., 2001). Within this framework of ecoregions, a
rough top-down stream ‘‘typology’’ was generated,
which was based on catchment size, altitude (see
Table 1). Additionally, in terms of hydrology, all
streams investigated are characterized by permanent
flow (i.e., wadeable in the dry season) and fed by
sources. The HKH Index was developed for each
ecoregion separately. In the following, ecoregion
names are used as synonyms for the stream types.
Selection of sampling sites
In each country sharing a stream type, sites of
different environmental quality were selected, in
most cases equally distributed over a five class river
60 Hydrobiologia (2010) 651:59–76
123

quality system ranging from reference status to poor
quality status. A pre-classification procedure was
applied, comprising (1) assessment of sensory fea-
tures, (2) assessment of the abundance of bacteria,
fungi, and periphyton, and (3) screening of the
benthic macroinvertebrate assemblage (Table 2). At
least 17 sites per stream type and country were
selected. A set ideally comprised four sampling sites
pre-classified ‘‘high,’’ four sites classified ‘‘good,’’
three sites classified ‘‘moderate,’’ three sites classified
‘‘poor,’’ and three sites classified ‘‘bad.’’ Overall, 198
sampling sites were selected (Table 1).
Sampling and processing
Sampling teams were trained in a standardized
sampling procedure (based on Barbour et al., 1999;
AQEM Consortium, 2002) to guarantee for harmo-
nized sampling effort in all countries. Sites were
ideally sampled twice, post-monsoon (from late
October 2005 to December 2005) and pre-monsoon
(from mid March 2006 to early June 2006) resulting
in 373 samples. Multi-habitat samples, reflecting the
proportion of the microhabitat types present with
C5% cover, were taken from each stream site. At
each site, 20 sample units were taken, each notionally
of 25 cm 9 25 cm dimensions, resulting in ca.
1.25 m2 of stream bottom being sampled. Inverte-
brates were sorted and identified to the lowest
attainable taxonomic level (usually genus). Samples
containing less than 20 specimens due to heavy
pollution were not considered in the analysis. Con-
sequently, the developed multimetric index can only
be applied to rivers with a certain degree of ‘‘higher’’
life.
A total of 38 environmental parameters reflecting
river perturbation were recorded at each sampling site
(Table 3), either in the field or based on the analysis
of water samples or using GIS. The parameters were
selected to reflect a range of different stressors, i.e.,
organic pollution, eutrophication, land use in the
floodplain, and degradation of hydromorphology. In
addition, a Land Use Index and a Hydromorphology
Index were calculated according to Hering et al.
Fig. 1 Study area. 1Pakistan, 2 India, 3 Nepal, 4Bhutan, 5 Bangladesh, 6Himalayan Subtropical Pine
Forest, 7 Western
Himalayan Broadleaf
Forest, 8 Upper Gangetic
Plains, 9 Eastern Himalayan
Broadleaf Forest, 10 Lower
Gangetic Plains
Table 1 Number of sampling sites per ecoregion and country
Ecoregion Altitude
range (m)
Catchment
size (km2)
Bangladesh Bhutan Nepal India Pakistan Total number
of sites
Eastern Himalayan
Broadleaf Forest
1000–2500 50–500 17 17 34
Himalayan Subtropical
Pine Forest
500–2000 50–500 17 17 19 25 78
Western Himalayan
Broadleaf Forest
1000–2500 50–500 17 17
Lower Gangetic Plains 45–250 500–1000 34 17 51
Upper Gangetic Plains 45–250 500–1000 18 18
Hydrobiologia (2010) 651:59–76 61
123

(2006b) and included into the analysis, with the Land
Use Index being calculated as ‘‘% urban area in the
catchment ? 0.5*% cropland,’’ assuming that urban
area more strongly influence the quality of streams
than cropland, while the impact of forest and pasture
is minimal; the Hydromorphology Index is calculated
as ‘‘% shoreline covered with woody riparian vege-
tation ? % no bank fixation ? % no bed fixation
- (stagnation * 100) - (straightening * 100)’’ reflect-
ing habitat degradation.
Gradient analysis
Principal component analysis (PCA) was applied to
reduce the dimensionality of the environmental data
set and to define proxies for the impact of the
addressed stressors. Parameters were transformed as
shown in Table 3. As we aimed at the development of
a stressor type specific assessment system, we
constructed four individual PCA gradients for moun-
tain and lowland streams, restricted to parameters
reflecting the four different stressor types: organic
pollution, eutrophication, land use in the floodplain,
and degradation of hydromorphology. As the devel-
opment of a stressor type specific analysis demands
for sampling sites not severely impacted by a second
stressor, we applied threshold values to exclude
sampling sites heavily impacted by another stressor
(BOD [6 mg/l; Ortho-phosphate C700 lg/l for low-
land, and C600 lg/l for mountainous rivers; Land
Use Index[40 for lowland and[30 for mountainous
rivers; Hydromorphology Index [0). From each
analysis, we selected (a) the two most important
independent environmental parameters, i.e., strongest
explanatory power in the PCA and (b) the values of
PCA axes 1 and 2 as independent variables for the
selection of biotic indices.
Metric calculations
A total of 29 metrics (Table 4) were calculated with
the taxalists of the two sampling season comprising
373 benthic invertebrate samples. The latter metrics
were correlated against the selected environmental
Table 2 Parameters
applied to pre-classify the
impact of pollution
according to Moog &
Sharma (2005); simplified
Assessment features Parameter
Sensory features Non-natural turbidity
Non-natural color
Foam
Odor
Waste dumping
Ferro-sulfide reduction
(lentic zones)
% mud with aerobic surface
% mud with anaerobic surface
% lower surface of stones
% upper and lower surface of stones
Ferro-sulfide reduction
(lotic zones)
% mud with aerobic surface
% mud with anaerobic surface
% lower surface of stones
% upper and lower surface of stones
Bacteria, fungi,
periphyton
Abundance of sewage fungi and bacteria (visible with the naked eye)
Abundance of sulfur bacteria (visible with the naked eye)
Abundance of stones with algal vegetation (periphyton) in thin layers
% of thick, significant layers of algae
Abundance of filamentous green algae
Benthic
macroinvertebrates
Species richness (five abundance classes)
Abundance of different clean water taxa according to BMWP/
NEPBIOS (Sharma & Moog, 2005)
Abundance of different tolerant taxa (leeches, red Chironomids,
Tubificidae, air-breathing insects, Hydropsychidae)
62 Hydrobiologia (2010) 651:59–76
123

parameters. These metrics have been used in previous
studies from other regions to detect river perturbation
caused by organic pollution, eutrophication, hydro-
morphological impact, and land use of the floodplain
(Barbour et al., 1996; Sponseller et al., 2001; Lorenz
et al., 2004; Sandin & Hering, 2004). Metrics were
based on relative abundance (%), abundance classes
(Ab_cl), and individual numbers (No.) and were
beforehand assigned to metric types: (1) composition/
abundance metrics (C/A-metrics) provide different
Table 3 Environmental parameters used for PCA
Stressor type Abbrev. Parameter Transform.
Land use in the floodplain D_FOR % deciduous native forest Arcsin sq.root
C_FOR % coniferous native forest Arcsin sq.root
FOR % forest (D_FOR ? M_FOR) Arcsin sq.root
N__UNV % naturally unvegetated Arcsin sq.root
CROP % crop land (tillage, lowland) Arcsin sq.root
PAST % pasture Arcsin sq.root
O_GRA % open grass-/bushland (natural) Arcsin sq.root
URB % urban area Arcsin sq.root
VILL % villages Arcsin sq.root
LUI Land Use Index Arcsin sq.root
S_ZEN % shading at zenith Arcsin sq.root
R_BED Removal mineral bed material (yes/no) Arcsin sq.root
Hydromorphology W_RIP % average density of wooded riparian vegetation Arcsin sq.root
BA_FIX % bank fixation Arcsin sq.root
BE_FIX % bed fixation Arcsin sq.root
R_VEG Removal/lack of natural floodplain vegetation (yes/no) Log 10
F_TYP No. flow types Log 10
L_IMP Longitudinal impoundments at sampling site (yes/no) Log 10
HYI Hydro-morphology Index Arcsin sq.root
Organic pollution/eutrophication NS_POL Non-source pollution (yes/no) Log 10
S_OVE Sewage overflows (yes/no) Log 10
EUT Signs of eutrophication (yes/no) Log 10
W_USE No. water uses Log 10
FISH Fisheries (yes/no) Log 10
C_WAT Cattle watering place (yes/no) Log 10
RUB Rubbish (yes/no) Log 10
FAE Feces (yes/no) Log 10
WAS Washing/bath (yes/no) Log 10
FOA Foam (yes/no) Log 10
TUR Turbidity (yes/no) Log 10
CON Conductivity (lS/cm), field Log 10
OXY Oxygen saturation (%), field Log 10
CHL Chloride (mg/l), field, laboratory Log 10
BOD BOD5 (mg/l), laboratory Log 10
NIT Nitrate (mg/l), field, laboratory Log 10
O_PHO Ortho-phosphate (lg/l), laboratory Log 10
E_COL E. coli (n/100 ml), laboratory Log 10
AMM Ammonium (mg/l), laboratory Log 10
Hydrobiologia (2010) 651:59–76 63
123

Table 4 Metrics investigated. EPT Ephemeroptera, Plecopter-
a, Trichoptera. Metrics EPT, Ephemeroptera, Plecoptera, and
Trichoptera, and Diptera were applied on species (SP), genus
(GEN), and family (FAM) level. Composition/abundance
metrics were applied on relative abundance level and individ-
ual abundance level. For rationale of metrics see ‘‘Metric
calculations’’ and ‘‘Discussion’’ sections
Metric type Metric Definition Expected response
to increasing stress
Composition/
abundance
(C/A-metrics)
EPT Metric measures relative abundance of Ephemeroptera,
Plecoptera and Trichoptera
Decrease
Ephemeroptera Metric measures relative abundance of Ephemeroptera Decrease
Trichoptera Metric measures relative abundance of Trichoptera Decrease
Plecoptera Metric measures relative abundance of Plecoptera Decrease
Diptera Metric measures abundance of Diptera Increase
Richness/
diversity
(R/D-metrics)
No. taxa Metric counts all taxonomical units Decrease
No. families Metric counts all families Decrease
No. genus Metric counts all genera Decrease
No. species Metric counts all species Decrease
No. individuals Metric counts all individuals Decrease
No. EPT-taxa Metric measures abundance of Ephemeroptera, Plecoptera and
Trichoptera
Decrease
No. Ephemeroptera taxa Metric measures abundance of Ephemeroptera Decrease
No. Trichoptera taxa Metric measures abundance of Trichoptera Decrease
No. Plecoptera taxa Metric measures abundance of Plecoptera Decrease
No. Diptera taxa Metric measures abundance of Diptera Increase
Shannon Wiener
Diversity
SHAN explains the homogeneity of taxa distribution (Shannon &
Weaver 1976).
Decrease
Evenness Diversity EVEN gives the maximum diversity of a given SHAN
(Meschkowski 1968).
Decrease
Margalef Diversity Relation between all taxa to total amount of individuals (Margalef
1969).
Decrease
Maximum Diversity HMAX gives the degree to which all taxonomical units are equal
distributed (Meschkowski, 1968).
Decrease
Sensitivity/
tolerance
(S/T-metrics)
Oligochaeta Metric measures abundance of Oligochaeta Increase
Chironomidae Metric measures abundance of Chironomidae individuals Increase
Batidae-Simuliidae-
Hydropsychidae-
Chironomidae
Metric counts Baetidae (BA),Simuliidae (SI), Hydropsychidae
(HY) and Chironomidae (CH)
Increase
BMWP and ASPT
(NEPBIOS)
Biological Monitoring Working Party. Taxa were classified
according to their sensitivity to organic pollution (Armitage
et al., 1983); BMWP and ASPT were used which were adapted
by Sharma & Moog (2005) to the rivers in Nepal (NEPBIOS).
Decrease
Functional
(F-metrics)
Pelal preference Metric counts the taxonomical units with mud preferences Decrease
No. Lithobiont Metric counts the taxonomical units only living on stones Decrease
No. Lithophil Metric counts the taxonomical units living preferably on stones
but also on other substrates
Decrease
No. Lithal Metric counts the taxonomical units with stone preferences
(LBIO ? LPHI)
Decrease
No. Lotic Metric counts the taxonomical units with preferences to high flow
velocities
Decrease
64 Hydrobiologia (2010) 651:59–76
123

classes of information. They may give the relative
proportion of a taxon or taxonomic group with
respect to its total number or abundance, respectively.
The rationale is that a stable community under
reference conditions will be relatively consistence in
its proportional representation, though measuring of
individual abundances may vary in magnitude. Abun-
dance of key taxa, e.g., Ephemeroptera, Plecoptera,
and Trichoptera (EPT), provides information about the
condition of the targeted assemblage. (2) Richness/
diversity metrics (R/D-metrics) reflect the diversity of
the community. They measure the availability of
habitat, food source, and other requirements to support
survival and propagation of many species. Increasing
metric values correlate with increasing health of the
community. Diversity metrics are number of families,
genera, or lower taxa within a certain taxonomical
entity, including all diversity indices. (3) Sensitivity/
tolerance metrics (S/T-metrics) give taxa known to
respond sensitively or tolerantly to a stressor or a single
aspect of the stressor, respectively. (4) Functional
metrics (F-metrics) give ecological function of taxa,
e.g., feeding types, substrate preferences, current
preferences, life cycle parameters, and others. They
reflect habitat type and quality of the observed river
stretch and can be compared with the belonging
situation under reference condition (Barbour et al.,
1999; Hering et al., 2006a) (Table 4).
Selection of candidate metrics
Candidate metrics were selected for each stream type
and stressor type separately. Metrics responding
monotonically to the increase or decrease of envi-
ronmental stress were considered most suitable.
Frequency scatter plots in combination with Spear-
man rank correlation (threshold r [ 0.5) were applied
to correlate metrics against environmental parame-
ters. In addition, sampling sites were divided into
stressed (threshold value 33rd percentile) and
unstressed (threshold value 67th percentile) sites
with respect to a given stressor. A metric was selected
as candidate if the interquartiles (25th/75th percen-
tile) of stressed and unstressed sampling sites were
not overlapping (according to Vlek et al., 2004). The
aim was to select three metrics per metric type and
stressor. If less than three metrics met this criterion,
we then considered metrics for which interquartile
ranges of the 30th/70th percentile were not
overlapping. This statistical procedure was restricted
to ecologically meaningful metrics, i.e., those con-
sistent with ecological principles and biological
knowledge.
Selection and processing of core metrics
In order to select core metrics to be included into the
multimetric index from the set of candidate metrics,
the following rules were applied: (1) core metrics
should cover different metric types (see above);
(2) metrics should not give redundant information.
Inter-correlation tests between candidate metrics
were carried out to detect redundant metrics (thresh-
old value Spearman’s r [ 0.75). Of correlating
metrics, we kept those increasing or decreasing with
stress intensity in a more monotonic way (graphical
analysis of scatterplots), and separating stressed and
unstressed sampling sites more clearly (graphical
analysis of box-and-whisker plots). Furthermore, we
considered the overall correlation to the selected
metrics.
The range of the selected core metrics was
restricted through ‘‘upper and lower anchor values,’’
with the upper anchor (95th percentile) corresponding
to reference conditions and the lower anchor (5th
percentile) to heavily impacted sites. The different
numerical scales of metrics (e.g., %, abundance class,
number of individuals) were normalized to unitless
scores between 0 and 1. Finally, a metric was selected
as a core metric if 75% of the normalized metric
values in sites pre-classified as ‘‘high’’ and ‘‘good’’
obtained values C0.5 (‘‘75% rule’’) and if the
coefficients of variance (CV) was \1. The ‘‘75%
rule’’ in combination with the CV guaranteed for
robust and reproducible core metrics.
Seasonal aspect
The climate of the HKH region is ruled by the
monsoon, with a wet season from early June until
September and a dry season occurring from early
October to the end of May. The discharge of the
rivers is therefore highly variable. We tested if the
core metrics are affected by seasonality or if metrics
are robust enough to allow sampling during the entire
dry season. Pre- and post-monsoon metric values
were tested for differences (Mann–Whitney U test).
Hydrobiologia (2010) 651:59–76 65
123

Only sampling sites that were pre-classified ‘‘high’’
or ‘‘good’’ (reference sites) were considered for this
analysis.
Calculation of the HKH Index and setting of class
boundaries
We calculated a multimetric index (‘‘HKH Index’’) as
the mean of the normalized core metric results, which
is the basis for a classification of sites into five quality
classes (‘‘high,’’ ‘‘good,’’ ‘‘moderate,’’ ‘‘poor,’’ and
‘‘bad’’), expressing the deviation from reference
conditions. The 25th percentile value of a single
core metric under reference conditions (sites pre-
classified ‘‘high’’) was defined as threshold value for
class ‘‘high.’’ This value takes the natural variability
of core metric values under reference conditions into
account. The quality classes ‘‘good’’ to ‘‘bad’’ were
evenly spread over the range that was left after setting
the boundary for class ‘‘high.’’
Results
Gradient analysis
According to PCA results, the parameters that best
reflect the variability in the environmental datasets
are widely similar for mountain and lowland streams
(Fig. 2).
BOD and E. coli best reflect the variability of the
environmental parameters representing organic pol-
lution. The vectors of these variables display nearly a
right angle those for the mountain and for the lowland
stream dataset, suggesting independence from each
other and explaining different portions of the data
set’s variability. In the lowland dataset, E. coli and
BOD are almost parallel to PCA axes 1 and 2,
respectively, hence reflecting the overall variability
within the data set. In the mountain data set, the
arrangements of sites parallel to the second PCA axis
reveal another important gradient independent of the
selected environmental parameters.
Ortho-phosphate represented best stress by eutro-
phication, both in the lowland and mountain sampling
sites, supplemented by nitrate (lowland) and conduc-
tivity (mountains).
The Land Use Index best reflects variability in the
floodplain land-use data set, while % forest was the
second important gradient for the mountain sampling
sites and % cropland and % villages for the lowlands.
Of the two latter, % villages was selected, because
sampling sites were more lined up along this gradient
than along that for % cropland.
Average density of wooded riparian vegetation
and % bank fixation were the most important
gradients in the hydromorphological stressor group.
These two parameters best explained the variability
within both in the mountainous rivers and in the
lowland rivers data set.
In addition to these parameters, we used the PCA
values of axes 1 and 2 as independent variables for
subsequent analysis.
Selection of candidate and core metrics
For each stream type, at least six candidate metrics
passed the threshold criteria. However, only rivers of
the Eastern Himalayan Broadleaf Forest revealed at
least three metrics per stressor type. In all stream
types, values of metrics which consists of Epheme-
roptera, Plecoptera, and Trichoptera taxa decreased
with the intensity of all four stress types. In four out
of five stream types (exception Lower Gangetic
Plains), diversity indices qualified as candidate met-
rics for the detection of all stressor types. BMWP and
ASPT were selected in all ecoregions as indicators to
detect organic pollution and/or eutrophication. Only
in the ecoregion of Eastern Himalayan Broadleaf
Forest and Upper Gangetic Plains did the functional
metrics respond to stream deterioration (Table 5).
Himalayan Subtropical Pine Forest
Thirteen candidate metrics were detected which
passed the threshold criteria. Nine metrics indicate
eutrophication, eight organic pollutions, and only one
land use of the floodplain. % EPT FAM, No. EPT
FAM, Margalef Diversity, ASPT, and BMWP detect
both eutrophication and organic pollution. Alto-
gether, eight candidate metrics are related to some
aspect of EPT. The three selected diversity indices
mostly detect eutrophication and organic pollution
(Table 5). Of the metrics addressing EPT, which
Fig. 2 PCA biplots of environmental parameters representing
different stressor groups for lowland and mountain rivers. For
abbreviations of environmental gradients see Table 3
c
66 Hydrobiologia (2010) 651:59–76
123

Hydrobiologia (2010) 651:59–76 67
123

Table 5 Candidate metrics per stream type and stressor group.
x = metrics meeting the ‘‘non-overlapping (n-o)’’ criteria with
at least one environmental gradient of the according stressor
group. C/A composition/abundance metrics, R/D richness/
diversity metrics, S/T sensitivity/tolerance metrics, F func-
tional metrics, EPT Ephemeroptera, Plecoptera, and Trichop-
tera, EU eutrophication, OP organic pollution, H-Mhydromorphological degradation
Candidate metrics Metric
type
Spearman r [ 0.5 and
continuous increase or
decrease
Non-overlapping
of 25%/75% tile
Non-overlapping
of 30%/70% tile
EU OP H-M LU EU OP H-M LU EU OP H-M LU
Himalayan Subtropical Pine Forest
% EPT FAM C/A -0.56 -0.56
% Trichoptera FAM C/A -0.57
% Ephemeroptera FAM C/A x
No. EPT FAM R/D -0.52 x
No. Ephemeroptera GEN R/D x
No. Trichoptera FAM R/D x
Margalef Diversity R/D -0.54 x
Shannon Wiener Diversity R/D -0.51
Evenness R/D x
Ab_cl Plecoptera IND R/D x
Ab_cl Chironomidae IND S/T x
ASPT S/T x x
BMWP S/T x x
Eastern Himalayan Broadleaf Forest
% Trichoptera IND C/A x
No. EPT FAM R/D -0.66 0.58
No. Ephemeroptera FAM R/D -0.57 x x
No. Trichoptera FAM R/D x
No. Trichoptera GEN R/D x
No. families R/D 0.62 x
Evenness R/D x x x
Margalef Diversity R/D -0.63 -0.65 0.69
Maximum Diversity R/D x
Shannon Wiener Diversity R/D -0.66 0.65 x
Ab_cl Diptera IND R/D x
Ab_cl Plecoptera IND R/D -0.66 x x
Ab_cl Oligochaeta IND S/T 0.62
Ab_cl Chironomidae IND S/T x
ASPT S/T -0.65 x
Ab_cl Lithophil IND F -0.62 x x x
Western Himalayan Broadleaf Forest
% Plecoptera FAM C/A x
% EPT IND C/A x
% Diptera IND C/A x
Ab_cl Diptera IND R/D -0.62
Margalef Diversity R/D x
68 Hydrobiologia (2010) 651:59–76
123

were usually correlated, we selected % EPT FAM as
core metric, because it reflected river perturbation
caused by eutrophication and organic pollution
(Table 5). Of the correlated diversity indices, we
selected Margalef Diversity as it was slightly better
correlating to organic pollution (Table 5). Overall,
seven metrics (two C/A-metrics, three R/D-metrics,
and two S/T-metric) were selected as potential core
metrics, which mainly reflect the intensity of organic
pollution and eutrophication; in addition, only the
metric ‘‘Ab_cl Plecoptera IND’’ reflected land use
intensity (Table 6).
The standardized values of three potential core
metrics (% EPH FAM, Ab_cl Plecoptera IND, and
Ab_cl CHIRO IND) varied strongly between refer-
ence sites, i.e., \75% of standardized metric values
increased by 0.5. Thus, they were removed from the
set of candidate metrics leading finally to four core
metrics (Table 6).
Eastern Himalayan Broadleaf Forest
Compared to the other mountainous ecoregions, the
highest number of metrics responded significantly to
Table 5 continued
Candidate metrics Metric
type
Spearman r [ 0.5 and
continuous increase or
decrease
Non-overlapping
of 25%/75% tile
Non-overlapping
of 30%/70% tile
EU OP H-M LU EU OP H-M LU EU OP H-M LU
Ab_cl Batidae-Simuliidae-Hydropsychidae-
Chironomidae IND
S/T -0.67
Ab_cl Chironomidae IND S/T -0.66
ASPT S/T x
Upper Gangetic Plains
% EPT FAM C/A x
% Trichoptera FAM C/A x
% Ephemeroptera FAM C/A x
% Diptera FAM C/A x
Ab_cl Diptera IND R/D x x
Ab_cl Ephemeroptera IND R/D x
No. EPT FAM R/D x
No. Trichoptera FAM R/D x
Evenness R/D x
Shannon Wiener Diversity R/D x
BMWP S/T x
ASPT S/T x
Ab_cl Chironomidae IND S/T x
Ab_cl Batidae-Simuliidae-Hydropsychidae-
Chironomidae IND
S/T x
Ab_cl Lithal IND F x
Ab_cl Lithobiont IND F x
Lower Gangetic Plain
% EPT FAM C/A x
Ab_cl Ephemeroptera IND R/D x
No. EPT GEN R/D x x
No. families R/D x
Ab_cl Oligochaeta IND S/T x
BMWP S/T x
Hydrobiologia (2010) 651:59–76 69
123

Table 6 Statistics of potential core metrics; final core metrics
in italics. UA upper anchor value (reference), LA lower anchor
value (impacted), EU eutrophication, OP organic pollution,
H-M hydromorphological degradation, LU land use of the
floodplain; P level derived from comparison of metric values
between pre- and post monsoon, P \ 0.05 indicate signif-
icant difference between pre- and post monsoon season
Metrics/stream type Stressor Threshold of
‘‘75% rule’’
CV UA LA Plevel
Himalayan Subtropical Pine Forest
% EPT FAM PCA axis 2, OP 0.61 0.21 68.8 0 0.09
Conductivity 0.57
% Ephemeroptera FAM E. coli 0.49
Ab_cl Plecoptera IND PCA axis 1, LU 0.25
Margalef Diversity PCA axis 2, OP 0.52 0.42 7.4 1.07 0.48
Conductivity 0.5
Evenness Conductivity 0.67 0.25 0.86 0.23 0.63
ASPT Conductivity 0.55 0.16 7.5 1 0.54
PCA axis 2, OP 0.59
Ab_cl Chironomidae IND Conductivity 0.43
Eastern Himalayan Broadleaf Forest
No. EPT FAM PCA axis 1, H-M 0.39
PCA axis 1, LU 0.34
No. Ephemeroptera FAM Ortho-phosphate 0.67 0.3 6 0 0.71
Shannon Wiener Diversity Ortho-phosphate 0.73 0.29
% Average density wooded
riparian vegetation
0.73
ASPT PCA axis 1, OP 0.86 0.04 7 1 0.34
Ortho-phosphate 0.91
Ab_cl Oligochaeta Ortho-phosphate 0.57 0.39 0 7 0.34
Ab_cl Chironomidae Ortho-phosphate 0.5 0.7 0 6 0.55
Ab_cl Lithophil IND Land Use Index 0.63 0.23 12 0 0.62
% Average density wooded
riparian vegetation
0.58
Ortho-phosphate 0.5
PCA axis 2, OP 0.5
Western Himalayan Broadleaf Forest
% Plecoptera FAM PCA axis 1, H-M 0.5 0.72 14.2 0 0.14
% EPT IND PCA axis 2, EU 0.75 0.35 14.2 0 \0.01
Margalef Diversity % Forest in the floodplain 0.7 0.21 3.92 0.8 0.25
ASPT PCA axis 2, EU 0.5 0.24 7.3 1 0.52
Ab_cl Baetidae- Simuliidae-
Hydropsychidae-ChironomidaePCA axis 2, EU 0.5 0.73 4 16 \0.01
Upper Gangetic Plains
% Ephemeroptera FAM PCA axis 1, LU 0.66 0.24 33.3 0 0.13
Shannon Wiener Diversity PCA axis 1, LU 0.69 0.32 2.73 0.9 0.67
BMWP Land Use Index 0.52 0.15 146 0 0.61
Ab_cl Lithobiont IND % Average density wooded
riparian vegetation
0.25
70 Hydrobiologia (2010) 651:59–76
123
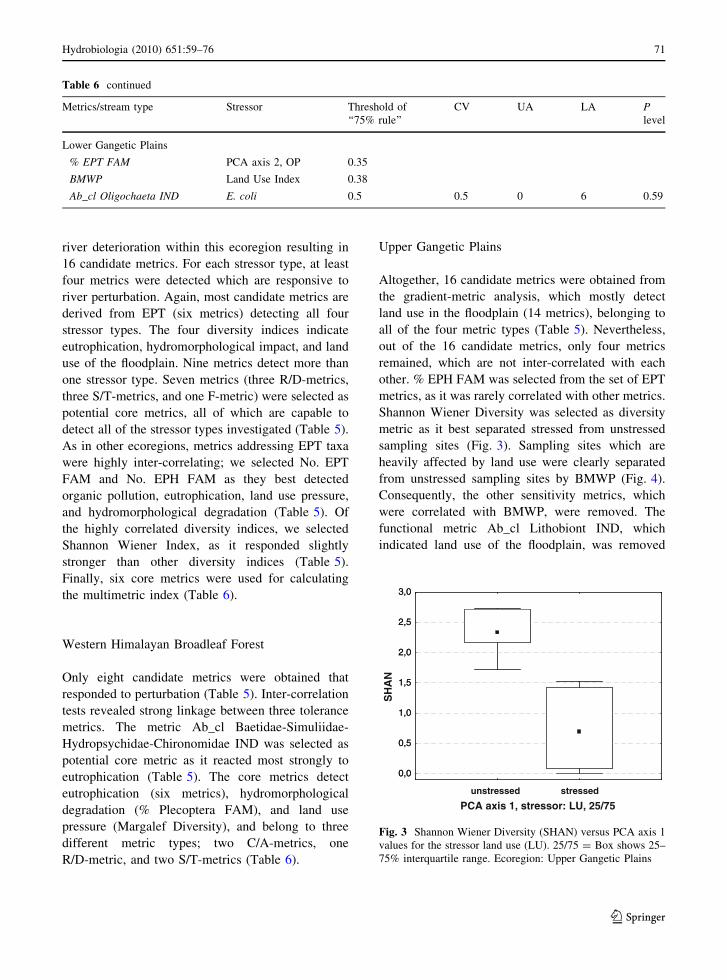
river deterioration within this ecoregion resulting in
16 candidate metrics. For each stressor type, at least
four metrics were detected which are responsive to
river perturbation. Again, most candidate metrics are
derived from EPT (six metrics) detecting all four
stressor types. The four diversity indices indicate
eutrophication, hydromorphological impact, and land
use of the floodplain. Nine metrics detect more than
one stressor type. Seven metrics (three R/D-metrics,
three S/T-metrics, and one F-metric) were selected as
potential core metrics, all of which are capable to
detect all of the stressor types investigated (Table 5).
As in other ecoregions, metrics addressing EPT taxa
were highly inter-correlating; we selected No. EPT
FAM and No. EPH FAM as they best detected
organic pollution, eutrophication, land use pressure,
and hydromorphological degradation (Table 5). Of
the highly correlated diversity indices, we selected
Shannon Wiener Index, as it responded slightly
stronger than other diversity indices (Table 5).
Finally, six core metrics were used for calculating
the multimetric index (Table 6).
Western Himalayan Broadleaf Forest
Only eight candidate metrics were obtained that
responded to perturbation (Table 5). Inter-correlation
tests revealed strong linkage between three tolerance
metrics. The metric Ab_cl Baetidae-Simuliidae-
Hydropsychidae-Chironomidae IND was selected as
potential core metric as it reacted most strongly to
eutrophication (Table 5). The core metrics detect
eutrophication (six metrics), hydromorphological
degradation (% Plecoptera FAM), and land use
pressure (Margalef Diversity), and belong to three
different metric types; two C/A-metrics, one
R/D-metric, and two S/T-metrics (Table 6).
Upper Gangetic Plains
Altogether, 16 candidate metrics were obtained from
the gradient-metric analysis, which mostly detect
land use in the floodplain (14 metrics), belonging to
all of the four metric types (Table 5). Nevertheless,
out of the 16 candidate metrics, only four metrics
remained, which are not inter-correlated with each
other. % EPH FAM was selected from the set of EPT
metrics, as it was rarely correlated with other metrics.
Shannon Wiener Diversity was selected as diversity
metric as it best separated stressed from unstressed
sampling sites (Fig. 3). Sampling sites which are
heavily affected by land use were clearly separated
from unstressed sampling sites by BMWP (Fig. 4).
Consequently, the other sensitivity metrics, which
were correlated with BMWP, were removed. The
functional metric Ab_cl Lithobiont IND, which
indicated land use of the floodplain, was removed
Table 6 continued
Metrics/stream type Stressor Threshold of
‘‘75% rule’’
CV UA LA Plevel
Lower Gangetic Plains
% EPT FAM PCA axis 2, OP 0.35
BMWP Land Use Index 0.38
Ab_cl Oligochaeta IND E. coli 0.5 0.5 0 6 0.59
PCA axis 1, stressor: LU, 25/75
0,0
0,5
1,0
1,5
2,0
2,5
3,0
unstressed stressed
0,0
0,5
1,0
1,5
2,0
2,5
3,0
SH
AN
Fig. 3 Shannon Wiener Diversity (SHAN) versus PCA axis 1
values for the stressor land use (LU). 25/75 = Box shows 25–
75% interquartile range. Ecoregion: Upper Gangetic Plains
Hydrobiologia (2010) 651:59–76 71
123

from the analysis, because standardized metric values
were highly variable in reference site (Table 6)
leading finally to three core metrics (Table 6).
Lower Gangetic Plains
Only six candidate metrics were extracted from the
gradient-metric analysis (Table 5). % EPT FAM was
kept as a potential core metric, because separation
between stressed and unstressed sites is better than
for No. EPT GEN, especially if the non-outlier range
is also considered (Fig. 5). Finally, three metrics
remained as potential core metrics (one C/A-metric
and two S/T-metrics), although two of those (% EPT
FAM and BMWP) exhibited a large range under
reference conditions (Table 6).
Calculation of the HKH Index and setting of class
boundaries
Table 7 gives the range of the indices for each of the
five river quality classes. Natural variability between
stream types for class boundary between ‘‘high’’ and
‘‘good’’ ranges from 0.5 to 0.68.
Seasonal effects
Of 22 core metrics, only two showed significant
abundance differences in reference sites between
pre-monsoon and post-monsoon season (Mann–
Whitney U Test), namely % EPT IND and Ab_cl
Baetidae-Simuliidae-Hydropsychidae-Chironomidae
in the Western Himalayan Broadleaf Forest
(Table 5).
Discussion
Selection of core metrics
The selection of EPT taxa as core metric in all stream
types underlines the worldwide suitability of this
group for ecological river quality assessment and is in
consistence with studies from different regions, e.g.,
Barbour et al. (1999, North-America), Maxted et al.
(2000, North America), Sandin & Hering (2004,
Europe), Ollis et al. (2006, South-Africa), Baptista
et al. (2007, South-America). In four of the five
stream types, diversity indices were selected as core
metrics. As diversity indices depend on the quality
and availability of habitats (Barbour et al., 1999),
they reflect the impact of all investigated stressors
independent of ecoregion boundaries. The metrics
ASPT and BMWP were selected in all stream types
as sensitivity metrics. Both metrics are most suitable
to detect organic pollution also in other regions, e.g.,
in Europe (Sandin & Hering, 2004). The metric
Ab_cl Baetidae-Simuliidae-Hydropsychidae-Chiro-
nomidae was developed to detect organic pollution,
which increases the abundance of these families
(Buss et al., 2002; Buss & Salles, 2007). Suspension
feeders (Hydropsychidae and Simuliidae), grazers
0
20
40
60
80
100
120
140
160
0
20
40
60
80
100
120
140
160B
MW
P
LUI, stressor: LU, 25/75unstressed stressed
Fig. 4 BMWP versus Land Use Index (LUI) for the stressor
land use (LU). 25/75 = Box shows 25–75% interquartile
range. Ecoregion: Upper Gangetic Plains
0
5
10
15
20
25
30
35
40
45
% E
PT
FA
M
0
5
10
15
20
25
30
35
40
45
PCA axis 2, stressor: OP, 30/70unstressed stressed
Fig. 5 % EPT FAM versus PCA axis 2 values for the stressor
organic pollution (OP). 30/70 = Box shows 30–70% inter-
quartile range. Ecoregion: Lower Gangetic Plains
72 Hydrobiologia (2010) 651:59–76
123

(Baetidae), and oxygen depletion resistant collectors
(many Chironomidae) may benefit from eutrophica-
tion and organic pollution and may be summed up to
reflect pollution status. Only two functional metrics
describing habitat preferences have been identified as
core metrics. Habitat and current preferences are the
only functional metrics available for benthic inverte-
brates in the HKH region (Korte et al., 2008). Other
potentially suited functional metrics such as feedings
types (e.g., Kerans & Karr, 1994; Rawer-Jost et al.,
2000) have yet not been defined for the HKH fauna.
Selection of sampling sites and the definition
of reference class boundaries
Selection and pre-classification of sampling sites were
partly based on the biota (Table 2); thus, the develop-
ment of the multimetric index included a circular
component. However, the selection of core metrics
depended solely on correlation with environmental
parameters. Metric values under reference conditions
are comparable to values obtained by Barbour et al.
(1996), Maxted et al. (2000), Ofenbock et al. (2004),
and Baptista et al. (2007). When defining class
boundaries for reference conditions, the natural range
of a metric must be taken into account (e.g., Bailey
et al., 2004). Generally, we followed the approach used
in North America (e.g., Barbour et al., 1996) and
Europe (Hering et al., 2006a) and used the 25%
percentile values of metrics from reference sites as the
reference class boundary. Additionally, core metrics
were restricted to metrics with 75% of its standardized
values in reference sites C0.5 and CV \ 1. The five
different class boundaries for class ‘‘high’’ range
between 0.5 and 0.68 exhibiting a relatively low
threshold value for references. However, each defini-
tion to set the ‘‘reference’’ boundary for a metric is
artificial, because variability of macroinvertebrate
communities and its patterns are multidimensional
and could hence not be defined by a single value.
Development of the multimetric index
The development of a stressor type specific multi-
metric index was not possible for all stream types, as
the pre-selection of sampling sites mainly accounted
for pollution parameters and did not specifically
target a hydromorphological gradient. Nevertheless,
the resulting sampling sites exhibited land use and
hydromorphological gradients, which were reflected
by several metrics: number and proportion of EPT
taxa (Plecoptera in particular), Shannon Wiener, and
Margalef Diversity indices, BMWP, and number of
lithobiont taxa. Hydromorphological degradation
mainly reflects habitat availability (e.g., loss of
wooded riparian vegetation or loss of bank habitats
due to fixation); the biotic metrics mentioned above
are all related to habitat availability, as a low number
of habitats leads to less niches for invertebrate
families. This also affects metrics such as BMWP
which are primarily reflecting river pollution; how-
ever, several EPT taxa being sensitive to pollution are
affected by habitat availability, too. For the Lower
Gangetic Plains, only a single metric (number of
Oligochaeta) was robust, most likely due to the lack
of reference sites in our sampling scheme.
Seasonal aspects
Brewin et al. (2000) investigated seasonal effects of
the monsoon climate on the abundance of benthic
macroinvertebrates in mountain streams of Nepal; in
pristine sampling sites, abundance did not change
from post-monsoon to pre-monsoon season. Our
results confirmed these findings, because all metrics
in the mountainous rivers (500–2500 m) did not show
Table 7 Class boundaries
Ecoregion/water quality class ‘‘High’’ ‘‘Good’’ ‘‘Moderate’’ ‘‘Poor’’ ‘‘Bad’’
Himalayan Subtropical Pine Forest C0.57 C0.43 C0.29 C0.15 \0.15
Western Himalayan Broadleaf Forest C0.59 C0.44 C0.29 C0.14 \0.14
Eastern Himalayan Broadleaf Forest C0.68 C0.51 C0.34 C0.17 \0.17
Upper Gangetic Plains C0.62 C0.46 C0.3 C0.14 \0.14
Lower Gangetic Plains C0.5 C0.37 C0.24 C0.11 \0.11
Hydrobiologia (2010) 651:59–76 73
123

significant differences between post- and pre-
monsoon seasons (Table 6). There are two excep-
tions: % EPT IND and Ab_cl Baetidae-Simuliidae-
Hydropsychidae-Chironomidae showed significant
seasonal abundance differences in the Western
Himalayan Broadleaf Forest (Table 6). However,
for % EPT IND, the interquartile range of pre- and
post-monsoon seasons broadly overlapped. The
increased abundances of Ab_cl Baetidae-Simulii-
dae-Hydropsychidae-Chironomidae in the post-mon-
soon season may be caused by fast development rates
of these taxa, leading to more than one generation
within one dry season and to an abundance peak in
the post-monsoon season.
For the application of the HKH indices, sampling
is possible through the entire dry season. Neverthe-
less, we propose sampling in the pre-monsoon season
at times of minimum discharge, maximum pollutant
concentration, and water temperatures.
Conclusion
For all five stream types investigated, a multimetric
index was developed to detect river deterioration
caused by human impacts. Results obtained for the
Himalayan Subtropical Pine Forest are based on a
large set of sampling sites and allow for full
application of four robust core metrics. In the Eastern
Himalayan Broadleaf Forest (34 sampling sites), the
Western Himalayan Broadleaf Forest (17 sampling
sites), and the Upper Gangetic Plains (18 sampling
sites), the number of sampling sites were relatively
low. Hence, relations by chance between environ-
mental gradients and metrics could have occurred;
however, all metrics selected are justified by ecolog-
ical principles and also widely used for biomonitoring
in other world regions. In order to prove effectiveness
of these metrics, further sites should be investigated.
In the Lower Gangetic Plains, we detected only one
robust metric; most likely because of the lack of
reference sites in our population of sampling sites.
Finally, for all observed stream types metrics were
detected that are responsive to river deterioration,
mainly pollution. The selected core metrics for rivers
in the HKH region are used worldwide for ecological
river assessment and are consistent with ecological
principles and biological knowledge. Consequently,
the multimetric indices are an effective tool for water
managers to evaluate the health of rivers in the HKH
region. Compared to conventional monitoring tools
(e.g., measurements of physical and chemical param-
eters), the application of multimetric indices is cheap
and provides accurate information about many
stressor types, and its affects on the river ecosystem.
Especially, impacts of pollution are detected by
benthic macroinvertebrates at a fraction of cost and
technical expertise than is required when using
merely measurements of pollutants and other envi-
ronmental parameters.
Acknowledgments This study was supported by the European
Commission (contract number: INCO-CT-2005_003659 ASSE
SS-HKH project). We thank all ASSESS-HKH partners for their
contribution to the development of the multimetric index.
References
AQEM Consortium, 2002. Manual for the application of the
AQEM method. A comprehensive method to assess Euro-
pean streams using benthic macroinvertebrates, developed
for the purpose of the Water Framework Directive. Last
update 10/10/2006. Retrieved 09/07/2008 from http://
www.aqem.de/mains/products.php.
Armitage, P. D., D. Moss, J. F. Wright & M. T. Furse, 1983.
The performance of a new biological water quality score
system based on macroinvertebrates over a wide range of
unpolluted running-water sites. Water Research 16: 1465–
1477.
Bailey, R. C., R. H. Norris & T. B. Reynoldson, 2004. Bio-
assessment of Freshwater Ecosystems: Using the Refer-
ence Condition Approach. Springer, New York.
Baptista, D. F., D. F. Buss, M. Egler, A. Giovanelli, M. P.
Silveira & J. L. Nessimian, 2007. A multimetric index
based on benthic macroinvertebrates for evaluation of
Atlantic Forest streams at Rio de Janeiro State, Brazil.
Hydrobiologia 575: 83–94.
Barbour, M. T., J. Gerritsen, G. E. Griffith, R. Frydenborg, E.
Mc Carron, J. S. White & M. L. Bastian, 1996. A
framework for biological criteria for Florida streams using
benthic macroinvertebrates. Journal of the North Ameri-
can Benthological Society 15: 185–211.
Barbour, M. T., B. D. Gerritsen, B. D. Synder & J. B. Stribling,
1999. Rapid Bioassessment Protocols for Use in Wade-
able Streams and Rivers: Periphyton, Benthic Macroin-
vertebrates and Fish, 2nd edn. EPA 841-b-99-002. United
States Environmental Protection Agency, Office of Water,
Washington, DC.
Barbour, M. T., S. B. Norton, K. W. Thornton & H. R. Preston
(eds), 2004. Ecological Assessment of Aquatic Resources:
Linking Science to Decision-Making. SETAC Press,
Pensacola, FL.
Brewin, P. A., T. M. L. Newman & S. J. Ormerod, 1996.
Patterns of macroinvertebrate distribution in relation to
altitude, habitat structure and land use in streams of the
74 Hydrobiologia (2010) 651:59–76
123

Nepalese Himalaya. Archiv fur Hydrobiologie 135:
79–100.
Brewin, P. A., S. T. Buckton & S. J. Ormerod, 2000. The
seasonal dynamics and persistence of stream macroin-
vertebrates in Nepal: do monsoon floods represent dis-
turbance? Freshwater Biology 44: 581–594.
Buss, D. F. & F. F. Salles, 2007. Using Baetidae species as
biological indicators of environmental degradation in a
Brazilian river basin. Environmental Monitoring and
Assessment 130: 365–372.
Buss, D. F., D. F. Baptista, M. P. Silveira, J. L. Nessimian & L.
F. Dorville, 2002. Influence of water chemistry and
environmental degradation on macroinvertebrate assem-
blages in a river basin in south-east Brazil. Hydrobiologia
481: 125–136.
Central Pollution Control Board (CPCB) (ed.), 1999. Bio-
mapping of rivers. Parivesh. Ministry of Environment &
Forest, Delhi.
Central Pollution Control Board (CPCB) (ed.), 2006. Report on
survey of the river Yamuna and its pollution sources – a
245 km stretch between Hathnikund - Delhi. Interim draft
report. Parivesh. Ministry of Environment & Forest. Delhi.
Dudgeon, D., 2003. The contribution of scientific information
to the conservation and management of freshwater bio-
diversity in tropical Asia. Hydrobiologia 500: 295–314.
Hering, D., O. Moog, L. Sandin & P. F. M. Verdonschot, 2004.
Overview and application of the AQEM assessment sys-
tem. Hydrobiologia 516: 1–20.
Hering, D., C. K. Feld, O. Moog & T. Ofenbock, 2006a. Cook
book for the development of a multimetric index for bio-
logical condition of aquatic ecosystems: experiences from
the European AQEM and STAR projects and related ini-
tiatives. Hydrobiologia 566: 311–324.
Hering, D., R. K. Johnson, S. Kramm, S. Schmutz, K. Szosz-
kiewicz & P. F. M. Verdonschot, 2006b. Assessment of
European streams with diatoms, macrophytes, macroin-
vertebrates and fish: a comparative metric-based analysis
of organism response to stress. Freshwater Biology 51:
1757–1785.
Kerans, B. L. & J. R. Karr, 1994. A benthic index of biotic
integrity (B-IBI) for rivers of the Tennessee valley. Eco-
logical Applications 4: 768–785.
Korte, T., D. Hering & O. Moog, 2008. Untersuchungen zu
Habitatpraferenzen ausgewahlter Makroinvertebraten der
Hindu Kush-Himalayan region. Jahrestagung Deutsche
Gesellschaft Limnologie (DGL). Erweiterte Zusammenf-
assungen der Jahrestagung 2007. Eigenverlag der DGL,
Munster: 146–150.
Lorenz, A., D. Hering, C. K. Feld & P. Rolauffs, 2004. A new
method for assessing the impact of hydromorphological
degradation on the macroinvertebrate fauna of five Ger-
man stream types. Hydrobiologia 516: 107–127.
Maxted, J. R., M. T. Barbour, J. Gerritsen, J. Poretti, N.
Primrose, A. Silvia, D. Penrose & R. Renfro, 2000.
Assessment framework for mid-Atlantic coastal plain
streams using benthic invertebrates. Journal of the North
American Benthological Society 19: 128–144.
Meschkowski, H., 1968. Wahrscheinlichkeitsrechnung. Bibli-
ogr. Inst., Wien, Zurich.
Messerli, B. & J. D. Ives, 1997. Mountains of the World: A
Global Priority. Parthenin, New York.
Moog, O. & S. Sharma, 2005. Guidance for pre-classifying the
ecological status of HKH rivers. Working paper within
ASSESS-HKH. Retrieved 09/09/2008 from http://www.
assess-hkh.at/downloads/D10_Methodology.pdf.
Moya, N., S. Tomanova & T. Oberdorff, 2007. Initial devel-
opment of a multi-metric index based on aquatic macro-
invertebrates to assess streams condition in the Upper
Isiboro-Secure Basin, Bolivian Amazon. Hydrobiologia
589: 107–116.
Nesemann, H., S. Sharma, G. Sharma, S. N. Khanal, B. Prad-
han, D. N. Shah & R. D. Tachamo, 2007. Aquatic
Invertebrates of the Ganga River System. Mollusca,
Annelida, Crustacea (in part). H. Nesemann, Kathmandu.
Ofenbock, T., O. Moog, J. Gerritsen & M. T. Barbour, 2004. A
stressor specific multimetric approach for monitoring
running waters in Austria using benthic macro-inverte-
brates. Hydrobiologia 516: 251–268.
Ollis, D. J., H. F. Dallas, K. J. Esler & C. Boucher, 2006.
Bioassessment of the ecological integrity of river eco-
systems using aquatic macroinvertebrates: an overview
with a focus on South Africa. African Journal of Aquatic
Science 31: 205–227.
Olson, D. M., E. Dinerstein, E. D. Wikramanaya, N. D. Bur-
gess, G. V. N. Powell, E. C. Underwood, J. A. D’amico, I.
I. Hollye, S. J. C. Morrison, C. J. Loucks, T. F. Allnutt, T.
H. Ricketts, Y. Kura, J. F. Lamoreux, W. W. Wettengel,
P. Hedao & K. R. Kassem, 2001. Terrestrial ecoregions of
the world: a new map of life on earth. BioScience 51:
933–938.
Ormerod, S. J., S. D. Rundle, S. M. Wilkinson, G. P. Daly, K.
M. Dale & I. Juttner, 1994. Altitudinal trends in diatoms,
bryophytes, macroinvertebrates and fish of a Nepalese
river system. Freshwater Biology 31: 309–322.
Rawer-Jost, C., J. Bohmer, J. Blank & H. Rahmann, 2000.
Macroinvertebrate functional feeding group methods in
ecological assessment. Hydrobiologia 422–423: 225–232.
Resh, V. H., 1995. Freshwater benthic macroinvertebrates and
rapid assessment procedures for water quality monitoring
in developing and newly industrialized countries. In
Davis, S. D. & T. P. Simon (eds), Biological Assessment
and Criteria. Tools for Water Resource Planning and
Decision Making. Lewis Publishers, Boca Raton, London,
Tokyo: 167–180.
Rundle, S., A. Jenkins & S. J. Ormerod, 1993. Macroinverte-
brate communities in streams in the Himalaya, Nepal.
Freshwater Biology 30: 169–180.
Sandin, L. & D. Hering, 2004. Comparing macroinvertebrate
indices to detect organic pollution across Europe: a con-
tribution to the EC Water Framework Directive intercal-
ibration. Hydrobiologia 516: 55–68.
Shannon, C. E. & W. Weaver, 1976. Mathemathische Grund-
lagen der Informationstheorie. Oldenbourg, Munchen,
Wien.
Sharma, S. & O. Moog, 2005. A reference based Nepalese
biotic score and its application in the midland hills and
lowland plains for river water quality assessment and
management. In Tripathi, R. D., K. Kulshrestha, M.
Agrawal, K. J. Ahmed, C. K. Varsehen, F. Sagar &
P. Pushpangadan (eds), Proceedings of the Conference
Plant Response to Environmental Stress. IBD and CO
Publisher, Lucknow.
Hydrobiologia (2010) 651:59–76 75
123

Sharma, S., R. M. Bajracharya, B. K. Sitaula & J. Merz, 2005.
Water quality in the central Himalaya. Current Science
89: 774–786.
Silveira, M. P., P. F. Baptista, J. L. Nessimian & M. Egler,
2005. Application of biological measures for stream
integrity assessment in south-east Brazil. Environmental
Monitoring and Assessment 101: 117–128.
Sponseller, R. A., E. F. Benfield & H. M. Valett, 2001. Rela-
tionships between land use, spatial scale and stream
macroinvertebrate communities. Freshwater Biology 46:
1409–1424.
Suren, A. M., 1994. Macroinvertebrate communities of streams
in western Nepal: effects of altitude and land use. Fresh-
water Biology 32: 323–336.
Vlek, H. E., P. F. M. Verdonschot & R. C. Nijboer, 2004.
Towards a multimetric index for the assessment of Dutch
streams using benthic macroinvertebrates. Hydrobiologia
516: 173–189.
Weigel, B. M., L. J. Henne & L. M. Martinez-Rivera, 2002.
Macroinvertebrate-based index of biotic integrity for
protection of streams in west-central Mexico. Journal of
the North American Benthological Society 21: 686–700.
76 Hydrobiologia (2010) 651:59–76
123