“Descripción anatómica e histológica de la concha nácar Pteria sterna, Mollusca: Pteriidae

Environmental ScienceProcesses & Impacts rsc.li/process-impacts
ISSN 2050-7887
PAPERLiam Morrison et al.Assessing metal contamination from construction and demolition (C&D) waste used to infi ll wetlands: using Deroceras reticulatum (Mollusca: Gastropoda)
Volume 16 Number 11 November 2014 Pages 2463–2668

EnvironmentalScienceProcesses & Impacts
PAPER
Publ
ishe
d on
01
Oct
ober
201
4. D
ownl
oade
d by
May
noot
h U
nive
rsity
on
21/1
0/20
14 1
1:38
:37.
View Article OnlineView Journal | View Issue
Assessing metal
aApplied Ecology Unit, Centre for Environme
National University of Ireland, Galway, IrelbDepartment of Entomology, University of CcApplied Ecology Unit, Centre for Environme
National University of Ireland, Galway, IreldBehavioural Ecology and Biocontrol Labo
University of Ireland, Maynooth, IrelandeEarth and Ocean Sciences, School of Natura
Galway, IrelandfEarth and Ocean Sciences and Ryan Institu
University of Ireland, Galway, Ireland. E-
+353 91493200
Cite this: Environ. Sci.: ProcessesImpacts, 2014, 16, 2477
Received 31st May 2014Accepted 1st October 2014
DOI: 10.1039/c4em00300d
rsc.li/process-impacts
This journal is © The Royal Society of C
contamination from constructionand demolition (C&D) waste used to infill wetlands:using Deroceras reticulatum (Mollusca:Gastropoda)
John A. Staunton,a Rory J. Mc Donnell,b Michael J. Gormally,c Chris D. Williams,d
Tiernan Henrye and Liam Morrison*f
Large quantities of construction and demolition waste (C&D) are produced globally every year, with little
known about potential environmental impacts. In the present study, the slug, Deroceras reticulatum
(Mollusca: Gastropoda) was used as the first biomonitor of metals (Ag, As, Ba, Cd, Co, Cr, Cu, Mn, Mo, Ni,
Pb, Sb, Se, Ti, Tl, V and Zn) on wetlands post infilling with construction and demolition (C&D) waste. The
bioaccumulation of As, Ba, Cd, Co, Sb, Se and Tl were found to be significantly elevated in slugs
collected on C&D waste when compared to unimproved pastures (control sites), while Mo, Se and Sr
had significantly higher concentrations in slugs collected on C&D waste when compared to known
contaminated sites (mining locations), indicating the potential hazardous nature of C&D waste to biota.
Identifying exact sources for these metals within the waste can be problematic, due to its heterogenic
nature. Biomonitors are a useful tool for future monitoring and impact studies, facilitating policy makers
and regulations in other countries regarding C&D waste infill. In addition, improving separation of C&D
waste to allow increased reuse and recycling is likely to be effective in reducing the volume of waste
being used as infill, subsequently decreasing potential metal contamination.
Environmental impact
Large quantities of construction and demolition waste (C&D) are produced globally every year, with little known about potential environmental impacts.Deroceras reticulatum (Mollusca: Gastropoda) was used as the rst biomonitor of metals (Ag, As, Ba, Cd, Co, Cr, Cr, Cu, Mn, Mo, Ni, Pb, Sb, Se, Ti, Tl, V and Zn) onwetlands inlled with construction and demolition (C&D) waste. The bioaccumulation of As, Ba, Cd, Co, Sb, Se and Tl were signicantly elevated in slugscollected on C&D waste when compared to unimproved pastures (control sites), while Mo, Se and Sr had signicantly higher concentrations in slugs collected onC&D waste when compared to known contaminated sites (mining locations), indicating the potential hazardous nature of C&D waste.
Introduction
Wetlands are among the world’s most important habitats,providing many ecologically and economically importantecosystem services including water storage and ltration, oodcontrol, carbon xation, and habitat provision.1,2 Covering an
ntal Science, School of Natural Sciences,
and
alifornia, Riverside, CA 92521, USA
ntal Science, School of Natural Sciences,
and
ratory, Department of Biology, National
l Sciences, National University of Ireland,
te, School of Natural Sciences, National
mail: [email protected]; Tel:
hemistry 2014
estimated nine million km2 globally, they include habitats suchas swamps, bogs, fens, marshes and wet grasslands which occurfrom polar to tropical latitudes.2 Despite their importance,many wetlands have been and continue to be signicantlyimpacted by anthropogenic activities, including draining,dredging and inlling.1 While draining is responsible for thelargest amount of wetland loss, inlling is also a signicantcontributor,1 with construction and demolition (C&D) wasteoen being used under license3 for this purpose.4
Construction and demolition waste results from theconstruction, renovation or demolition of any structures, suchas buildings, roads and bridges.5,6 For example C&D wastesproduced on building sites is dependent on factors such asvariations in regional building practices, such as the increaseduse of timber in Scandinavian countries,7 and the structure, sizeand nature of source activity.5,8 The contents of C&D waste aretherefore variable and can include materials such as soil,stones, concrete, timber, plastics, gypsum, metal and
Environ. Sci.: Processes Impacts, 2014, 16, 2477–2487 | 2477
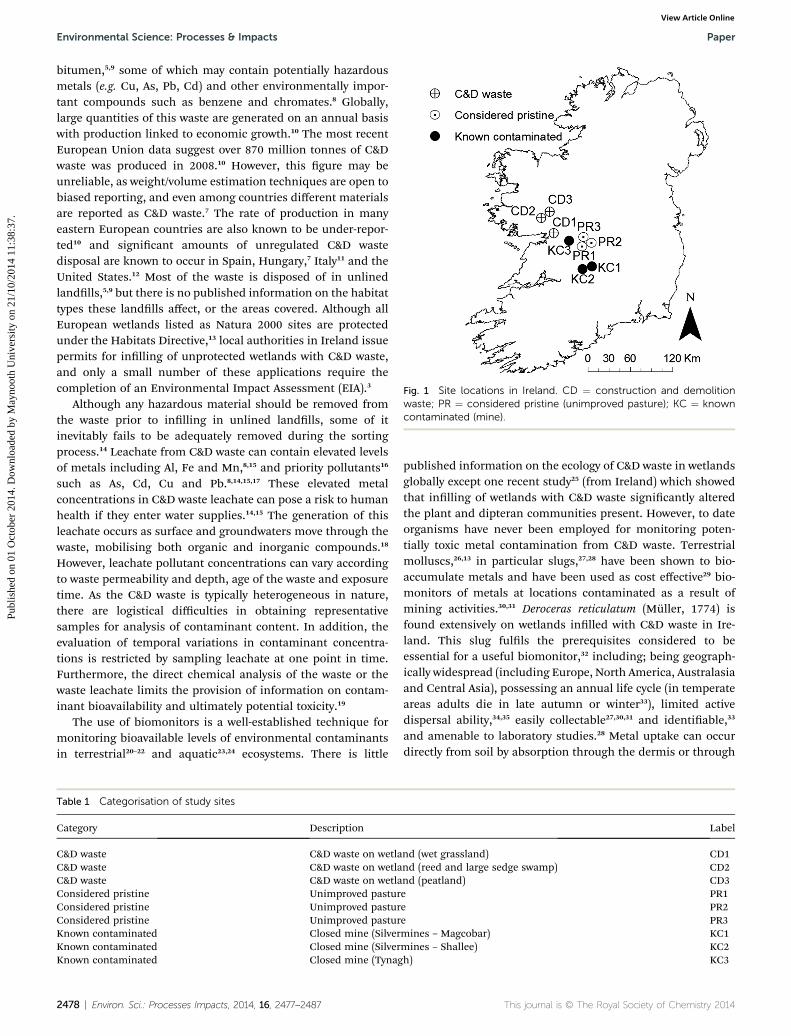
Fig. 1 Site locations in Ireland. CD ¼ construction and demolitionwaste; PR ¼ considered pristine (unimproved pasture); KC ¼ knowncontaminated (mine).
Environmental Science: Processes & Impacts Paper
Publ
ishe
d on
01
Oct
ober
201
4. D
ownl
oade
d by
May
noot
h U
nive
rsity
on
21/1
0/20
14 1
1:38
:37.
View Article Online
bitumen,5,9 some of which may contain potentially hazardousmetals (e.g. Cu, As, Pb, Cd) and other environmentally impor-tant compounds such as benzene and chromates.8 Globally,large quantities of this waste are generated on an annual basiswith production linked to economic growth.10 The most recentEuropean Union data suggest over 870 million tonnes of C&Dwaste was produced in 2008.10 However, this gure may beunreliable, as weight/volume estimation techniques are open tobiased reporting, and even among countries different materialsare reported as C&D waste.7 The rate of production in manyeastern European countries are also known to be under-repor-ted10 and signicant amounts of unregulated C&D wastedisposal are known to occur in Spain, Hungary,7 Italy11 and theUnited States.12 Most of the waste is disposed of in unlinedlandlls,5,9 but there is no published information on the habitattypes these landlls affect, or the areas covered. Although allEuropean wetlands listed as Natura 2000 sites are protectedunder the Habitats Directive,13 local authorities in Ireland issuepermits for inlling of unprotected wetlands with C&D waste,and only a small number of these applications require thecompletion of an Environmental Impact Assessment (EIA).3
Although any hazardous material should be removed fromthe waste prior to inlling in unlined landlls, some of itinevitably fails to be adequately removed during the sortingprocess.14 Leachate from C&D waste can contain elevated levelsof metals including Al, Fe and Mn,8,15 and priority pollutants16
such as As, Cd, Cu and Pb.8,14,15,17 These elevated metalconcentrations in C&D waste leachate can pose a risk to humanhealth if they enter water supplies.14,15 The generation of thisleachate occurs as surface and groundwaters move through thewaste, mobilising both organic and inorganic compounds.18
However, leachate pollutant concentrations can vary accordingto waste permeability and depth, age of the waste and exposuretime. As the C&D waste is typically heterogeneous in nature,there are logistical difficulties in obtaining representativesamples for analysis of contaminant content. In addition, theevaluation of temporal variations in contaminant concentra-tions is restricted by sampling leachate at one point in time.Furthermore, the direct chemical analysis of the waste or thewaste leachate limits the provision of information on contam-inant bioavailability and ultimately potential toxicity.19
The use of biomonitors is a well-established technique formonitoring bioavailable levels of environmental contaminantsin terrestrial20–22 and aquatic23,24 ecosystems. There is little
Table 1 Categorisation of study sites
Category Description
C&D waste C&D waste on wetlaC&D waste C&D waste on wetlaC&D waste C&D waste on wetlaConsidered pristine Unimproved pasturConsidered pristine Unimproved pasturConsidered pristine Unimproved pasturKnown contaminated Closed mine (SilverKnown contaminated Closed mine (SilverKnown contaminated Closed mine (Tynag
2478 | Environ. Sci.: Processes Impacts, 2014, 16, 2477–2487
published information on the ecology of C&D waste in wetlandsglobally except one recent study25 (from Ireland) which showedthat inlling of wetlands with C&D waste signicantly alteredthe plant and dipteran communities present. However, to dateorganisms have never been employed for monitoring poten-tially toxic metal contamination from C&D waste. Terrestrialmolluscs,26,13 in particular slugs,27,28 have been shown to bio-accumulate metals and have been used as cost effective29 bio-monitors of metals at locations contaminated as a result ofmining activities.30,31 Deroceras reticulatum (Muller, 1774) isfound extensively on wetlands inlled with C&D waste in Ire-land. This slug fulls the prerequisites considered to beessential for a useful biomonitor,32 including; being geograph-ically widespread (including Europe, North America, Australasiaand Central Asia), possessing an annual life cycle (in temperateareas adults die in late autumn or winter33), limited activedispersal ability,34,35 easily collectable27,30,31 and identiable,33
and amenable to laboratory studies.28 Metal uptake can occurdirectly from soil by absorption through the dermis or through
Label
nd (wet grassland) CD1nd (reed and large sedge swamp) CD2nd (peatland) CD3e PR1e PR2e PR3mines – Magcobar) KC1mines – Shallee) KC2h) KC3
This journal is © The Royal Society of Chemistry 2014

Paper Environmental Science: Processes & Impacts
Publ
ishe
d on
01
Oct
ober
201
4. D
ownl
oade
d by
May
noot
h U
nive
rsity
on
21/1
0/20
14 1
1:38
:37.
View Article Online
the digestive tract (ingested soil).36 However, molluscs tend toaccumulate the majority of metals from ingested food36–40 withtheir tissue metal content being indicative of ambient plant andsoil metal concentrations.39
The primary aim of this study was to assess the environ-mental impact of inlling wetlands with C&D waste, in terms ofmetal bioavailability by employing for the rst time D. retic-ulatum as a biomonitor of metal contamination. Nine samplinglocations (Fig. 1), subdivided into three categories (wetlandsinlled with C&D waste, known contaminated mining sites andpristine unimproved pasture) (Table 1) were selected on thebasis of representing different levels of metal contaminationwhich should be reected in the metal content of the slugtissue.
MethodsStudy area
Slug samples were collected from nine sites in Ireland (seedetails in Fig. 1 and Table 1) which consisted of three C&D wastesites (CD), three known contaminated sites (KC), and three siteswhich were considered pristine (PR). Deroceras reticulatum waspresent on all nine sites and the presence of short vegetationpermitted the use of slug refuge traps (see below). The CD siteswhich are typical of C&D waste inll sites on wetlandsthroughout Ireland and indeed Europe, included C&D waste onwet grassland (CD1), reed and large sedge swamps (CD2) andpeatland (CD3). These wetland habitats are now heavily modi-ed and considered damaged wetlands with altered ora andfauna communities and a lower soil moisture content.25 Allthree sites were licensed aer 2001, and contained, for the mostpart, concrete, bitumen, soil and stone. CD2 was still beingactively inlled at the time of this study, but none of the siteshad been levelled or covered with topsoil. The PR sites, locatedin rural areas, >5 km from municipal and industrial centreswere pastures where no chemical treatments including, fertil-isers and pesticides had been applied for at least 50 years andhence were considered pristine and selected as controls forcomparative purposes. These locations were selected overmatching wetlands (for CD1–3) because D. reticulatum wasabundant on these pastures which were removed from potentialsources of contamination.
Experimental procedure
The variability in metal concentrations for small samples ofslugs has been documented37 for Cd, Pb and Zn. Standarddeviations oen larger than the mean concentrations have beenrecorded with sample sizes of only three specimens.37 Relativelysmaller standard deviations were found in otherstudies20,30,31,41,42 with sample sizes of up to 18. To address thelimitations of previous studies, a larger sample size (n¼ 30) andparametric range (18 elements) were used in the present study.At each site adult D. reticulatum (n¼ 30; average length – 23 mm� 4mm;mean wet and dry weights of 0.87 g (�0.2 g) and 0.079 g(�0.02 g) respectively) were collected over 2 days in September,2011 using 36 (60 � 60 cm) refuge traps placed 2 m apart in a
This journal is © The Royal Society of Chemistry 2014
6 � 6 grid. Samples were transported to the laboratory in cleanpolythene bags (one slug per bag; at 4 �C during transportation)and rinsed using Milli-Q (Millipore, Bedford, USA) water. Dep-uration was allowed (48 hours at 4 �C) in clean plasticcontainers (1 slug per container) using damp lter paper(changed aer 24 hours to minimise coprophagy31). The slugswere further rinsed with Milli-Q and freeze dried (Freezone 12,Labconco, Kansas City, USA) at �50 �C. Sample decompositionwas performed using a microwave sample preparation system(Multiwave 3000, Anton Paar, Graz, Austria). Samples (indi-vidual slugs) were digested in a class 10 000 (ISO class 7) cleanroom using 4 cm3 of HNO3 (Trace Metal Grade, 67–69%, Fisher,UK) and 2 cm3 of H2O2 (TraceSELECT® Ultra $30%, SIGMA-ALDRICH, USA). Metal concentration (Ag, As, Ba, Cd, Co, Cu,Mn, Mo, Ni, Pb, Sb, Se, Sr, Ti, Tl, V, Zn) was determined usingInductively Coupled Plasma Mass Spectrometry (ICP-MS; ELANDRC-e, Perkin Elmer, Waltham, USA) in a class 1000 (ISO class6) clean room.
Quality assurance
Certied Reference Materials (CRMs) of TORT-2 (lobster hepa-topancreas; National Research Council Canada) and NIES no. 6(Mytilus edulis; National Institute for Environmental StudiesJapan) were used with method blanks to validate the accuracy ofdata for quality assurance purposes. All analytical batches (20samples) contained four procedural blanks and 4 CRMs and theprecision of the methodology was assessed through theperformance of duplicate analysis at a frequency of one to everyten samples and the analysis of calibration check standardsaer every ten samples.
Statistical analysis
The Anderson–Darling test was used to test for data normality.The Kruskal–Wallis test with a Dunn’s multiple comparisonpost hoc test was used to determine where signicant differ-ences in slug metal concentration occurred among site cate-gories. All statistical calculations were performed using Minitab(version 16) and SPSS (version 20). Non-detects were treated aszero to avoid positively skewing the analyses. One-way ANOVAPower Analysis was used to determine the most efficientminimum sample sizes for potential future biomonitoringstudies using D. reticulatum. SigmaPlot (version 12.0) was usedto create graphs.
Results and discussion
All previous studies employing D. reticulatum as a biomonitor ofenvironmental contamination have focused on Cd, Cu, Pb andZn.20,30,31,41,42 In addition to these EU-List Priority Substances49
the present study included a further 13 metals (Ag, As, Ba, Co,Cr, Cr, Mo, Ni, Sb, Se, Ti, Tl, V) considered a signicant risk toenvironmental quality and included in the EU-List II PrioritySubstances (Mn was also included, though not a PrioritySubstance). At elevated concentrations, all 18 elements arepotentially toxic to the biota.43
Environ. Sci.: Processes Impacts, 2014, 16, 2477–2487 | 2479

Table 3 Median metal concentrations in Deroceras reticulatum foreach site category (n ¼ 90 per site category). Interquartile range inparentheses. All values are mg g�1. LOD ¼ limit of detection
Element Mining C&D Pasture
Ag 0.45 (0.85) <LOD of 1.9 � 10�4 0.036 (0.045)As 0.38 (1.1) 0.19 (0.10) 0.13 (0.062)Ba 79 (71) 9.9 (5.8) 2.6 (4.5)Cd 37 (29) 6.5 (4.6) 3.8 (3.5)Co 0.61 (0.66) 0.39 (0.27) 0.31 (0.16)Cu 104 (52) 46 (18) 50 (24)Mn 731 (803) 97 (119) 226 (382)Mo 1.8 (0.91) 3.1 (1.3) 2.8 (2.6)Ni 1.8 (1.51) 1.1 (0.52) 1.3 (0.93)Pb 7.3 (59) 0.31 (0.41) 0.34 (0.24)Sb 0.054 (0.11) 0.015 (0.023) 0.0095 (0.015)Se 0.70 (0.74) 1.9 (1.4) 0.71 (0.62)Sr 43 (21) 48 (38) 54 (28)Ti 38 (6.8) 31 (5.6) 38 (10.8)Tl 0.43 (0.94) 0.017 (0.012) 0.011 (0.0077)V 0.10 (0.075) 0.12 (0.054) 0.13 (0.051)Zn 795 (519) 207 (70) 197 (96)
Environmental Science: Processes & Impacts Paper
Publ
ishe
d on
01
Oct
ober
201
4. D
ownl
oade
d by
May
noot
h U
nive
rsity
on
21/1
0/20
14 1
1:38
:37.
View Article Online
The results (As, Cd, Co, Cu, Mn, Mo, Ni, Pb, Se, Sr and Zn)from the analysis of the Mytilus edulis and lobster hepatopan-creas reference tissues (Table 2) are in good agreement withtheir respective certied ranges. In the case of Ag in NIES no. 6,the observed values and the recoveries obtained are likely afunction of their close proximity to the LOD of the analyticaltechnique. These reference materials represent the closestpossible matrix match for slug tissue which is currentlycommercially available. Metal concentrations are similar towhat was potentially expected in the present study, based onprevious investigations on the metal content of D. reticulatumtissue from a range of sites.30,31,41
Metal concentrations in D. reticulatum are presented for eachsite category (mean value from three sites in each category) inTable 3, while Fig. 2–4 show individual site data. Zinc exhibitedthe highest median concentration of all elements measuredacross all C&D waste site samples (207.83 mg g�1), while Mn hadthe highest median value across all mine (731 mg g�1) andunimproved pasture site samples (226.3 mg g�1). As micro-nutrients, both Mn and Zn44 are broadly more abundant inbiological tissue when compared to other metals.45 Kruskal–Wallis tests performed on the data showed that all 18 metalsdisplayed some signicant (P < 0.05) differences betweensamples recovered from the different site categories (Table 4).There were 11 signicant (P < 0.05) differences for datacomparisons between C&D waste and pasture samples, whilecomparisons of both ‘C&D waste vs. mining’ and ‘mining vs.
Table 2 Observed results from analysis of certified reference mate-rials, with certified and reference values. All values are mg g�1. n ¼ 30
Element TORT-2 certied value (�SD) Observed this study (�SD)
Ag — —As 21.6 (�1.8) 21.53 (�1.02)Cd 26.7 (�0.6) 27.82 (�1.24)Co 0.51 (�0.09) 0.47 (�0.05)Cu 106 (�10) 110 (�9.63)Mn 13.6 (�1.2) 13.82 (�2.03)Mo 0.95 (�0.10) 0.98 (�0.05)Ni 2.50 (�0.19) 2.30 (�0.31)Pb 0.35 (�0.13) 0.34 (�0.08)Se 5.63 (�0.67) 6.09 (�0.57)Sr 45.2 (�1.9) 52.41 (�7.51)Zn 180 (�10) 180 (�10.2)
Element NIES no. 6 certied value (�SD) Observed this study (�SD)
Ag 2.7 � 10�3 (�3 � 10�3) 4.4 � 10�2 (�4 � 10�2)As 9.2 (�0.5) 9.56 (�0.56)Cd 0.82 (�0.03) 0.85 (�0.03)Co 0.37 (reference value) 0.30 (�0.04)Cu 4.90 (�0.30) 6.18 (�1.05)Mn 16.3 (�1.2) 15.2 (�1.44)Mo 0.95 (�0.10) 0.85 (�0.05)Ni 0.93 (�0.06) 0.80 (�0.10)Pb 0.91 (�0.04) 0.81 (�0.12)Se 1.5 (reference value) 1.65 (�0.57)Sr 17 (reference value) 17.4 (�1.30)Zn 106 (�6) 106 (�7.74)
2480 | Environ. Sci.: Processes Impacts, 2014, 16, 2477–2487
pasture’ samples each showed 16 signicant (P < 0.05)differences.
Concentrations of As, Ba, Cd, Co, Sb, Se and Tl were signif-icantly (P < 0.05) elevated in slugs from C&D waste sites whencompared to unimproved pasture (Table 4). Arsenic and Cd8,15
have been reported at elevated concentrations in C&D leachate,from simulations used in the laboratory, small eld test cellsand full scale C&D waste inll sites.8,15,17 Isolating the source(s)of the increased metal concentrations within the C&D waste inthis study is difficult due to its variable nature. They aregenerally known to originate from permitted substances such aspigments used on C&D waste materials (for Cd and Sb), woodtreated with preservatives (As), and cement (Tl).8,43 Anotherlikely source of these metals is from unpermitted items orsubstances mixed through the C&D waste, some of which maybe hazardous, such as municipal waste (As, Cd), electricalequipment (Cd, Sb, Tl) and pesticide/paint containers (As, Cd,Sb).8,14,43 Determining the abundance of these unpermitteditems present in C&D waste is not feasible due to the volumeand associated cost, but the presence of such items was notedfrequently at the C&D waste sites.
Concentrations of three essential43 metals (Mo, Se, Sr) weresignicantly higher (P < 0.05) in the slugs from C&D waste sitesthan from mines (KC1, 2 and 3). A nationwide soil geochemicalatlas46 suggests that the C&D waste sites have higher back-ground levels for Mo, Se and Sr, compared to KC1 and KC2, andthis is reected in the slug tissue concentrations. Soil S (in theform of sulphate) and P compete for the same uptake pathwaysas Mo in plants,47 and as a result, uptake of Mo by plants may bereduced in mining locations with higher concentrations of Sand P. Likewise a correspondingly lower concentration of Mowould, therefore be expected in herbivorous slugs such as D.reticulatum on these sites. A similar scenario could be expectedfor Se which is known to share similar uptake pathways inplants as S.48 The signicantly higher Sr concentrations in slugs
This journal is © The Royal Society of Chemistry 2014
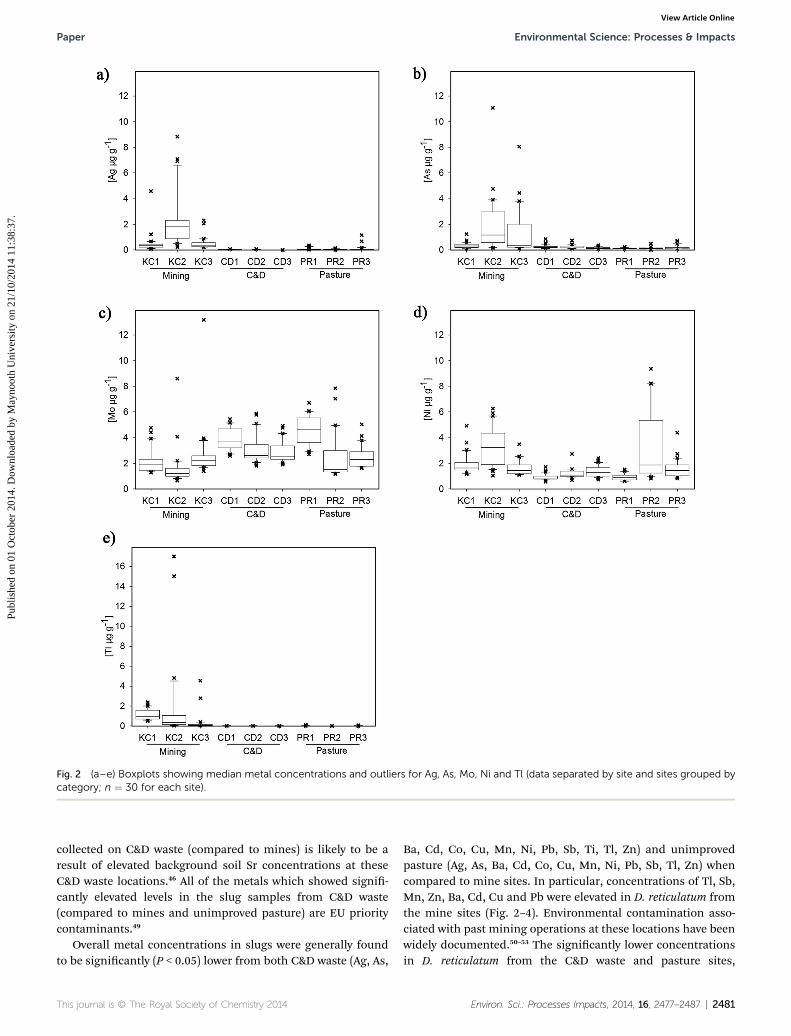
Fig. 2 (a–e) Boxplots showing median metal concentrations and outliers for Ag, As, Mo, Ni and Tl (data separated by site and sites grouped bycategory; n ¼ 30 for each site).
Paper Environmental Science: Processes & Impacts
Publ
ishe
d on
01
Oct
ober
201
4. D
ownl
oade
d by
May
noot
h U
nive
rsity
on
21/1
0/20
14 1
1:38
:37.
View Article Online
collected on C&D waste (compared to mines) is likely to be aresult of elevated background soil Sr concentrations at theseC&D waste locations.46 All of the metals which showed signi-cantly elevated levels in the slug samples from C&D waste(compared to mines and unimproved pasture) are EU prioritycontaminants.49
Overall metal concentrations in slugs were generally foundto be signicantly (P < 0.05) lower from both C&D waste (Ag, As,
This journal is © The Royal Society of Chemistry 2014
Ba, Cd, Co, Cu, Mn, Ni, Pb, Sb, Ti, Tl, Zn) and unimprovedpasture (Ag, As, Ba, Cd, Co, Cu, Mn, Ni, Pb, Sb, Tl, Zn) whencompared to mine sites. In particular, concentrations of Tl, Sb,Mn, Zn, Ba, Cd, Cu and Pb were elevated in D. reticulatum fromthe mine sites (Fig. 2–4). Environmental contamination asso-ciated with past mining operations at these locations have beenwidely documented.50–53 The signicantly lower concentrationsin D. reticulatum from the C&D waste and pasture sites,
Environ. Sci.: Processes Impacts, 2014, 16, 2477–2487 | 2481

Fig. 3 (a–f) Boxplots showing median metal concentrations and outliers for Sr, Ti, Ba, Pb, V and Cd (data separated by site and sites grouped bycategory; n ¼ 30 for each site).
Environmental Science: Processes & Impacts Paper
Publ
ishe
d on
01
Oct
ober
201
4. D
ownl
oade
d by
May
noot
h U
nive
rsity
on
21/1
0/20
14 1
1:38
:37.
View Article Online
compared with the mine sites coincided with metals that wereknown to exist at elevated concentrations in soils at KC3 –
Tynagh Mines50,51 (As, Ba, Cd, Cu, Ni, Pb, Zn) and SilverminesKC1 and 250,52 (Cd, Pb, Zn). All slug samples were collected onvegetated mine tailings, with KC2 having a disused smeltingplant and laboratories adjacent to the sampling location.
Compared to C&D waste, only four metals (Ag, Mn, Ni, andTi) had signicantly (P < 0.05) higher concentrations in slugscollected on pasture sites (Table 3), with two of these (Mn and
2482 | Environ. Sci.: Processes Impacts, 2014, 16, 2477–2487
Ti) signicantly (P < 0.05) elevated in specimens from one site(PR2) in particular (compared to PR1 and PR3; Fig. 2 and 3). Inaddition Mo, Sr and V also displayed signicantly higherconcentrations in slugs from the unimproved pasture than frommining sites. Previous studies with the aquatic snail Lymnaeastagnalis (Linnaeus L.) and the slug Arion ater (Linnaeus, 1758)have similarly shown control samples (unpolluted canal andremote hilltops respectively) to have elevated concentrations ofMn, Sr and Ti,22,23 with no known reasons for the increased
This journal is © The Royal Society of Chemistry 2014
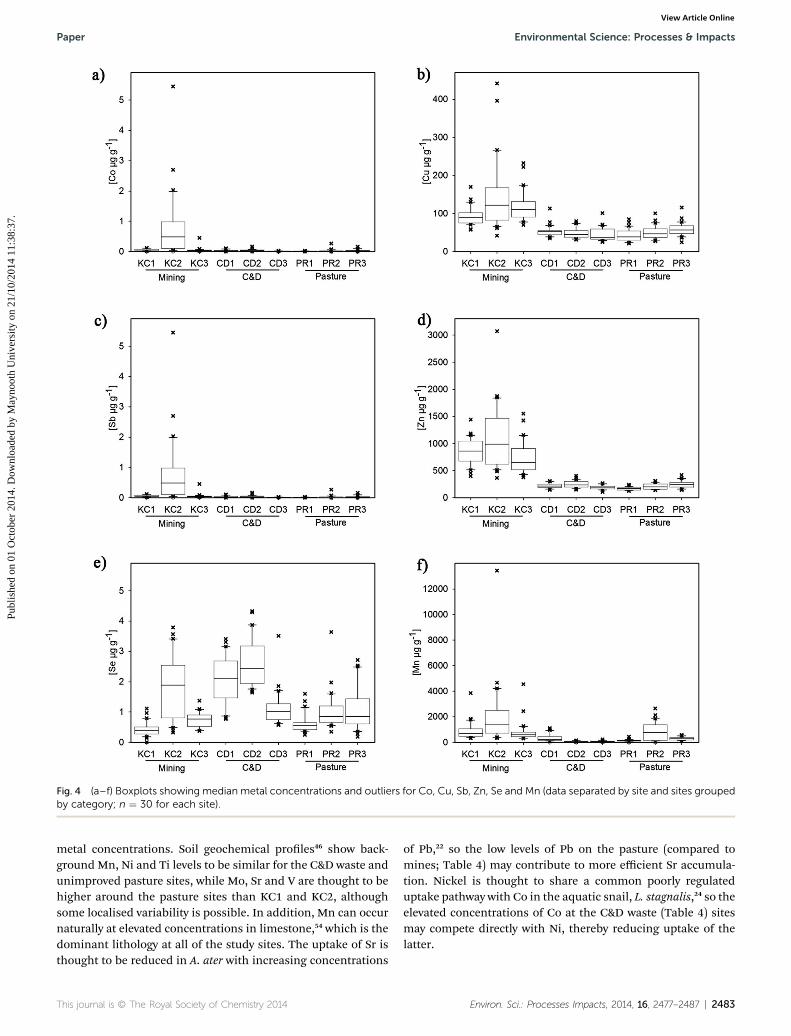
Fig. 4 (a–f) Boxplots showing median metal concentrations and outliers for Co, Cu, Sb, Zn, Se and Mn (data separated by site and sites groupedby category; n ¼ 30 for each site).
Paper Environmental Science: Processes & Impacts
Publ
ishe
d on
01
Oct
ober
201
4. D
ownl
oade
d by
May
noot
h U
nive
rsity
on
21/1
0/20
14 1
1:38
:37.
View Article Online
metal concentrations. Soil geochemical proles46 show back-ground Mn, Ni and Ti levels to be similar for the C&D waste andunimproved pasture sites, while Mo, Sr and V are thought to behigher around the pasture sites than KC1 and KC2, althoughsome localised variability is possible. In addition, Mn can occurnaturally at elevated concentrations in limestone,54 which is thedominant lithology at all of the study sites. The uptake of Sr isthought to be reduced in A. ater with increasing concentrations
This journal is © The Royal Society of Chemistry 2014
of Pb,22 so the low levels of Pb on the pasture (compared tomines; Table 4) may contribute to more efficient Sr accumula-tion. Nickel is thought to share a common poorly regulateduptake pathway with Co in the aquatic snail, L. stagnalis,24 so theelevated concentrations of Co at the C&D waste (Table 4) sitesmay compete directly with Ni, thereby reducing uptake of thelatter.
Environ. Sci.: Processes Impacts, 2014, 16, 2477–2487 | 2483

Table 4 Comparison (between site categories; n ¼ 90 per site cate-gory) of metal concentrations inDeroceras reticulatum, using Kruskal–Wallis test with Dunn’s multiple comparison post hoc test. Valuesshown are test statistic ‘K’; * indicates significant difference at P #
0.05; ** indicates significant difference at P # 0.01
Betweensites
Mining vs.pasture
Mining vs.C&D
C&D vs.pasture
Minimum samplesize for future studiesa
Ag 100** 160** 59** 40As 116** 72** �42** 23Ba 166** 101** �65** 11Cd 156** 109** �47** 15Co 84** 53** �30* 14Cu 120** 127** 6.7 13Mn 75** 136** 60** 16Mo �63** �87** �24 20Ni 58** 95** 36** 12Pb 134** 135** 0.96 10Sb 118** 87** �30** 17Se �2.03 �89** �87** 9Sr �56** �39** 16 15Ti �10 91** 102** 9Tl 153** 114** �38** 43V �44** �26 17 20Zn 142** 127** �14 11
a Most efficient sample size determined using one way ANOVA PowerAnalysis with power value of 0.95 (P ¼ 0.05).
Environmental Science: Processes & Impacts Paper
Publ
ishe
d on
01
Oct
ober
201
4. D
ownl
oade
d by
May
noot
h U
nive
rsity
on
21/1
0/20
14 1
1:38
:37.
View Article Online
The signicantly elevated concentrations of Ag found inslugs from the pasture (compared to those from C&D waste),may be exaggerated by the slow excretion rates of Ag ingastropods.55 It is worth noting that Ag (Fig. 2) was found to bebelow the limit of detection for many samples on both C&Dwaste and unimproved pasture, and so this difference may belimited in it signicance.
The concentrations of Zn and Cu observed in this study formine sites concur with previous studies that used D. reticulatum(Table 5) collected on contaminated sites.20,30,41 The concentra-tions of Cd found during the present study are slightly lowerthan the concentrations recorded in other eld studies fromcontaminated sites.20,30,31,41 Sphalerite (a Zn containing mineralmined at Silvermines52 and Tynagh51) is associated with low Cdconcentrations,56 as evident from Cd concentrations close to thelimit of detection in groundwater from KC2 (even when otherelements were present in high concentrations).53 For one site inthis study (KC2), Pb concentrations were found to be similar toprevious eld studies (on mines).20,30,31,41,42
Although there is still some between-site variability, it islikely that slug metal content is a true reection of the actualsoil metal content across all sites. In the case of KC2, whichshows signicantly (P < 0.05) elevated concentrations for Ba, Co,Mn, Pb, Sb, Tl and V relative to the other mine sites, theseincreased soil metal concentrations are likely associated withthe onsite smelting plant52 (as seen near smelting plants onother mines57).
Concentration factors (ratio of metal concentration in slugscompared to the vegetation) have been shown to decrease as themetal concentrations increase, with the exception of Pb.37 This
2484 | Environ. Sci.: Processes Impacts, 2014, 16, 2477–2487
suggests that care must be taken when attempting to determineprecise metal concentrations in soil and vegetation based onD. reticulatum metal concentrations. However, metal concen-trations (Cd, Pb, Zn) in D. reticulatum increase as concentrationsincrease in their food source.37 This would suggest that slugmetal concentrations should reect ambient metal concentra-tion trends in the surrounding vegetation, and also that metalaccumulation in these plants impacts on slug metal concen-trations. Although sub-lethal concentrations of some metals(such as Cd and Zn) are known to cause sub-cellular damage(e.g. nucleolus alteration, mitochondrial swelling and microvillishortening) in gastropods,58 including D. reticulatum,28 detoxi-cation is utilised as a survival strategy.33 This detoxicationcan involve either immobilisation (e.g. activation of metal-binding proteins such as metallothionein for Cd and Zn59)within cell lysosomes or precipitation into granules60 (Pb) whichcan be excreted via faeces.28 Detoxication is metal specic,with essential metals, needed for biological functions, havingthe most efficient rates.61 The non-essential Cd and Pb have noknown function in biological systems and tend to be morepoorly regulated.59 Growth rates of molluscs are also known tobe reduced by elevated concentrations of some metals (Cd, Cu,Ni),24 which in turn may increase overall metal concentrations,because the potential dilution effect of newly generated tissue isreduced.62,13 This may, therefore, compound slug metal contentin contaminated sites. The uptake rate of metals by inverte-brates is species specic, and dependant on a number of biotic(e.g. feeding behaviour and physiology36) and abiotic factors (e.g.metal speciation,27 temperature63 and pH36). In addition, theinteractions of such biotic and abiotic factors with site speciccharacteristics could inuence metal uptake.
The results of the one-way ANOVA Power Analysis (Table 4)suggest that the concentration of most of the target metals inthis study could be accurately calculated using a smallernumber of samples, i.e. n < 20. Therefore, future studies and siteassessments could potentially involve even more cost-effectivesampling.
Although the variable nature of C&D waste means thatassumptions should not be made about which metals may beelevated at any single site, the present study highlights thebioaccumulation of priority metal pollutants (As, Ba, Cd, Co,Mo, Sb, Se, Sr and Tl) in slugs at C&D waste sites. While slugsfrom C&D waste sites should not have the same apparent degreeof exposure to hazardous metals as slugs from mine sites, it isimportant to note that potential mobilisation of metals is not acriterion considered when waste licenses are issued for thedisposal of such waste in the EU and elsewhere. Leachate fromC&D waste is known8,14,15,17 to contain elevated concentrations ofmetals (Al, As, Cd, Cu, Fe, Mn, Pb). One of the most importantand useful aspects of utilising biomonitors in environmentalmonitoring and assessment is that their tissues provide quan-titative information on the bioavailable fraction of contami-nants, which also have the potential for biomagnication in thefood chain. Many of the difficulties associated with obtainingrepresentative soil and groundwater samples from a heteroge-neous matrix (such as C&D waste) are also avoided. This studyhas identied that certain metals known to attain high
This journal is © The Royal Society of Chemistry 2014

Table 5 Comparison of available published metal data (mg g�1 dry weight) in Deroceras reticulatum. Concentrations expressed as mean �standard deviation
Reference Location Pb Cd Zn CuFe (and Fecompounds) Comment
Greville and Morgan,1989 (ref. 31 and 41)
UK (RhonddaCynon Taf)
130 � 15 65 � 10 900 � 100 70 � 15 — Contaminatedsite (mine)(September data)
Greville and Morgan,1990 (ref. 30)
UK (RhonddaCynon Taf)
130 � 15.2 64.2 � 10.4 874.9 � 122.1 68.8 � 16 — Contaminatedsite (mine)
Greville and Morgan,1991 (ref. 20)
UK (RhonddaCynon Taf)
162.4 � 21.6 65.1 � 17.5 735.2 � 119.6 — — Contaminatedsite (mine)
UK (Vale ofGlamorgan)
3.2 � 0.3 9.3 � 0.8 205.2 � 32.1 — — Control site
Bullock et al.,1992 (ref. 27)
Laboratory — — — — 2554 � 140.5 Exposed tocontamination
UK (Hertfordshire) — — — — 103 � 5.2 Irrigated eldGreville and Morgan,1993 (ref. 42)
UK (RhonddaCynon Taf)
62.5 � 10 — — — — Contaminatedsite (mine)
UK (Vale ofGlamorgan)
4.7 � 1.9 — — — — Control site
Graff et al., 1996(ref. 37)
Laboratory 1168.6 � 1532.3 245.9 � 135 4252.4 � 2785 ContaminatedLaboratory 7.6 � 9.3 7.8 � 8.9 92.8 � 69.1 — — Control
Kohler et al., 1996(ref. 70); Triebskornand Kohler, 1996(ref. 28); Kohler andTriebskorn, 1998(ref. 71)
Laboratory 1168.6 � 1532.3 245.9 � 135 4252.4 � 2785 — — ContaminatedLaboratory 178.7 � 115.2 121.8 � 7.6 393.1 � 192.0 — — Medium
contaminationLaboratory 4.4 � 7.2 2.9 � 1.4 76.1 � 26.5 — — Control
This study Ireland (Galway) 0.47 � 0.35 4.86 � 2.81 220.7 � 47.2 53.3 � 14.6 91.9 � 25.8 C&D (CD1)Ireland (Galway) 0.65 � 0.38 8.65 � 2.88 246.4 � 64.4 48.4 � 13.8 82.2 � 20.3 C&D (CD2)Ireland (Galway) 0.22 � 0.17 8.63 � 5.35 193.6 � 39.3 43.9 � 17.4 100.2 � 69.6 C&D (CD3)Ireland (Galway) 0.42 � 0.14 2.35 � 1.22 170.0 � 31.9 43.2 � 16.1 110.8 � 30.5 Unimproved
pasture (PR1)Ireland (Galway) 0.41 � 0.32 5.04 � 3.05 206.8 � 50.1 49.6 � 17.2 90.5 � 16.9 Unimproved
pasture (PR2)Ireland (Galway) 0.30 � 0.14 4.89 � 2.26 246.2 � 66.7 58.7 � 17.8 111.5 � 36.0 Unimproved
pasture (PR3)Ireland (Tipperary) 5.74 � 3.62 42.9 � 19.4 857.5 � 249.3 92.9 � 24.2 80.8 � 34.5 Mine (KC1)Ireland (Tipperary) 274.2 � 215.2 34.4 � 18.5 1086.1 � 573.2 144.7 � 91.6 298.4 � 338 Mine (KC2)Ireland (Galway) 8.29 � 6.27 51.0 � 45.7 742.6 � 301.1 120.0 � 40.0 90.8 � 43.2 Mine (KC3)
Paper Environmental Science: Processes & Impacts
Publ
ishe
d on
01
Oct
ober
201
4. D
ownl
oade
d by
May
noot
h U
nive
rsity
on
21/1
0/20
14 1
1:38
:37.
View Article Online
concentrations in C&D leachate, including As and Cd, arebioavailable, and therefore ecotoxicologically relevant. This canresult in signicantly elevated concentrations in gastropods onC&D waste, compared to the baseline unimproved pasture. Thepotential risks of metal contamination in the biota at highertrophic levels or adjacent to such waste are not yet known,although terrestrial biomagnication is known to occur.64
Insectivores such as Erinaceus europaeus L.,65 are known to besensitive to diet-borne metal accumulation. Any potentialcontamination threat to adjacent areas would likely be site-dependent, with variables such as waste contents,8,15
geology,54 soil36 recharge, aspect (direction of surface runoff)and groundwater ow likely to be inuential factors. Theelevated metal concentrations in the leachate (as evident fromprevious studies) and slugs from C&D waste indicate that actionshould be taken to minimise the risk of future contamination.By separating waste more efficiently (such as source/on-siteseparation)66 and diverting more C&D waste to recycling,67 thedependency on disposal would be reduced, meaning fewer inll
This journal is © The Royal Society of Chemistry 2014
sites would be required.68 This improved separation would alsobe likely to reduce the amount of unpermitted items/substancesthat occur in C&D waste inll.
Conclusions and recommendations
This study demonstrates the potential usefulness of employingD. reticulatum as a biomonitor of metals on C&D waste sites andhas, for the rst time, shown that gastropods collected on C&Dwaste have signicantly higher metal concentrations than thosefrom the unimproved pasture (for As, Ba, Cd, Co, Sb, Se and Tl),and mines (for Mo, Se and Sr). The most likely source of theseEU priority pollutants is the C&D waste itself, although the exactsources of contamination within the waste are difficult to isolatedue to the varied nature of the materials within each site (andeven between regions or countries). Improved waste separationand recycling rates would be likely to reduce the number of inllsites and the volume of unpermitted items mixed through thewaste. Unlike soil or water analyses, these biomonitors reect
Environ. Sci.: Processes Impacts, 2014, 16, 2477–2487 | 2485

Environmental Science: Processes & Impacts Paper
Publ
ishe
d on
01
Oct
ober
201
4. D
ownl
oade
d by
May
noot
h U
nive
rsity
on
21/1
0/20
14 1
1:38
:37.
View Article Online
only the bioavailable (and so ecotoxicologically important)forms of metal, indicating the importance of such monitoring.This study is a rst, from which other studies around the worldcan be compared. It has highlighted the need for furtherinvestigation into the bioaccumulation (and potential bio-magnication) of metals in the biota from such C&D waste inllsites (and the toxicity thresholds of those metals), which arecommon and oen unregulated throughout the world. Devel-oping Ecological Investigation Levels69 for molluscs to assesssite contamination would increase their usefulness as futurebiomonitors. Small sample sizes (n < 20) should be sufficient formost metals, making the use of D. reticulatum a cost-effectivebiomonitor choice. Where metals are found to be bio-accumulating in organisms to dangerous concentrations, thereis a need for better enforcement of existing environmentalprotection policies and possibly implementing policy changesto reduce the impact of such sites on other environmentalcompartments and to encouragemore sustainable developmentin the future.
Acknowledgements
Research funded by the Thomas Crawford-Hayes ResearchFund (School of Natural Sciences, NUIG) and funding based onresearch grant-aided by the Department of Communications,Energy and Natural Resources under the National GeoscienceProgramme 2007–2013 (Griffiths Research Award). The viewsexpressed in this study are the author’s own and do notnecessarily reect the views and opinions of the Minister forCommunications, Energy and Natural Resources. The authorsthank landowners, O. Doherty, E. Williams, M. Staunton and T.Williams for eld and technical support.
Notes and references
1 W. J. Mitsch and J. G. Gosselink, Wetlands, John Wiley andSons Inc., New York, 2000, 3rd edn, pp. 571–638.
2 P. A. Keddy, Wetland Ecology: Principles and Conservation,Cambridge University Press, England, 2000, pp. 3–80.
3 Statutory Instrument No. 821 of 2007, Waste Management(Facility Permit and Registration) Regulations 2007,Government of Ireland, 2007.
4 Environmental Protection Agency, National Waste Report,2010, Environmental Protection Agency, Ireland, 2012, pp.45–48.
5 Franklin Accociates, Characterization of Building-RelatedConstruction and Demolition Debris in the United States,Report prepared for U.S. Environmental Protection Agency,Washington, 1998.
6 C. Clarke, J. Jambeck and T. Townsend, Crit. Rev. Environ.Sci. Technol., 2006, 36(2), 141–186.
7 European Commission DG ENV, Service contract onmanagement of construction and demolition waste – SR1.Final Report Task 2, European Commission, Brussels, 2011.
8 W. J. Weber, Y. C. Jang, T. G Townsend and S. Laux, J.Environ. Eng., 2002, 128(3), 237–245.
2486 | Environ. Sci.: Processes Impacts, 2014, 16, 2477–2487
9 P. T. Williams, Waste Treatment and Disposal, John Wiley &Sons Ltd, England, 1998, pp.114–115.
10 Eurostat, Eurostat Yearbook 2011: Environment, ThePublications Office of the European Union, Luxembourg,2011, pp. 480–489.
11 Symonds Group, ARGUS, COWI, PRC Bouwcentrum,Construction and demolition waste management practices andtheir economic impacts, 1999, http://ec.europa.eu/environment/waste/studies/cdw/cdw_report.htm, accessed9th March, 2014.
12 ICF Incorporated, Construction and Demolition WasteLandlls, Report prepared for U.S. EnvironmentalProtection Agency Office of Solid Waste, 1995.
13 J. L. Metcalfe-Smith, R. H. Green and L. C. Grapentine, Can.J. Fish. Aquat. Sci., 1996, 53, 205–219.
14 N. Roussat, J. Mehu, M. Abdelghafour and P. Brula, WasteManagement, 2008, 28, 2032–2040.
15 B. A. Melendez, A study of leachate generated from constructionand demolition landlls, Florida Univ Gainsville Dept ofEnvironmental Engineering Sciences, 1996, pp. 1–51.
16 USEPA (United States Environmental Protection Agency),Priority Pollutants, http://water.epa.gov/scitech/methods/cwa/pollutants.cfm, accessed 10th February, 2014.
17 A. Lopez and A. Lobo, Waste Management, 2014, DOI:10.1016/j.wasman.2014.04.004.
18 B. Faeiza, A. K. Mohamad Syarizal and M. D. Fairus, e-Proceeding of 17th Analysis Chemistry Malaysia Symposium,Swiss-Garden Resort & Spa, Kuantan, Pahang, 2004, pp.699–708.
19 L. Leita, G. Petruzzelli, F. Pedron, M. Alja, R. Mena andM. Valentini, E3S Web of Conferences, 2013, vol. 1, p. 13008.
20 R. W. Greville and A. J. Morgan, Environ. Pollut., 1991, 74,115–127.
21 M. Boshoff, K. Jordaens, T. Blackeljau, S. Lettens, F. Tack,B. Vandecasteele, M. De Jonge and L. Bervoets, Sci. TotalEnviron., 2013, 449, 470–481.
22 J. D. Popham and J. M. D’Auria, Water, Air, Soil Pollut., 1980,14, 115–124.
23 F. B. Pyatt, A. J. Pyatt and V. W. Pentreath, Environ. Toxicol.Chem., 1997, 16, 1393–1395.
24 S. Niyogi, K. V. Brix and M. Grosell, Aquat. Toxicol., 2014,DOI: 10.1016/j.aquatox.2014.02.012.
25 J. Staunton, C. D. Williams, R. J. McDonnell,G. T. A. Fleming, T. Henry and M. J. Gormally, Appl. Ecol.Environ. Res., 2014, 12, 457–479.
26 B. Berger and R. Dallinger, Environ. Monit. Assess., 1993, 25,65–84.
27 J. I. Bullock, N. P. Coward, G. W. Dawson, I. F. Henderson,L. F. Larkworthy, A. P. Martin and S. P. McGrath, CropProt., 1992, 11, 329–334.
28 R. Triebskorn and H. R. Kohler, Environ. Pollut., 1996, 93(3),327–343.
29 I. Marigomez, M. Kortabitarte and G. B. J. Dussart, Arch.Environ. Contam. Toxicol., 1998, 34, 167–176.
30 R. W. Greville and A. J. Morgan, J. Moll. Stud., 1990, 56, 355–362.
This journal is © The Royal Society of Chemistry 2014

Paper Environmental Science: Processes & Impacts
Publ
ishe
d on
01
Oct
ober
201
4. D
ownl
oade
d by
May
noot
h U
nive
rsity
on
21/1
0/20
14 1
1:38
:37.
View Article Online
31 R. W. Greville and A. J. Morgan, J. Moll. Stud., 1989, 55, 31–36.
32 P. Jones and P. L. Kaly, in Detecting Ecological Impacts:Concepts and Applications in Coastal Habitats, ed. R. J.Schmitt and P. J. Osenberg, Academic Press, UK, 1996, ch.3, pp. 29–48.
33 A. Wiktor, Annales Zoologici, 1999, 49(4), 348–590.34 S. Aubry, C. Labaune, F. Magnin, P. Roche and L. Kiss, J.
Anim. Ecol., 2006, 75, 802–813.35 B. Baur, Ann. Naturhist. Mus. Wien, 1993, 94–95, 307–321.36 W. J. G. M. Peijnenburg, in Bioavailability of Metals in
Terrestrial Ecosystems, ed. H. E. Allen, Society ofEnvironmental Toxicology and Chemistry, Florida, 2002,ch. 5, pp. 89–112.
37 S. Graff, M. Berkus, G. Alberti and H. R. Kohler, BioMetals,1997, 10, 45–53.
38 R. Dallinger, B. Berger, R. Triebskorn-Kohler and H. Kohler,in Soil Biology and Ecotoxicology, ed. G. M. Barker, CABInternational, UK, 2001, ch. 14, pp. 489–525.
39 M. J. M. Notten, A. J. P. Oosthoek, J. Rozema and R. Aerts,Environ. Pollut., 2005, 138, 178–190.
40 M. N. Croteau and S. N. Luoma, Environ. Sci. Technol., 2008,42, 1801–1806.
41 R. W. Greville and A. J. Morgan, J. Moll. Stud., 1989, 59, 287–303.
42 R. W. Greville and A. J. Morgan, Environ. Pollut., 1993, 81,213–216.
43 D. C. Adriano, Trace Elements in Terrestrial Environments:Biogeochemistry, Bioavailability, and Risks of Metals,Springer-Verlag, New York, 2nd edn, 2001, pp. 1–28.
44 USEPA, The Micronutrient Fertilizer industry: From IndustrialBy-product to Benecial Use, Office of Enforcement andCompliance Assurance, USEPA, Washington, DC, 2001.
45 R. Laskowski and S. P. Hopkin, Environ. Pollut., 1996, 91,289–297.
46 D. Fay, G. Kramers, C. Zhang, D. McGrath and E. Grennan,Soil Geochemical Atlas of Ireland, Teaagasc andEnvironmental Protection Agency, Wexford, 2007, pp. 19–111.
47 H. Heuwinkel, E. A. Kirkby, J. Le Bot and H. Marschner, J.Plant Nutr., 1992, 15(5), 549–568.
48 T. G. Sors, D. R. Ellis and D. E. Salt, Photosynth. Res., 2005,86(3), 373–389.
49 Council Directive 2006/11/EC of the European Parliament andof the Council, European Commission, Brussels, 2006.
50 G. Stanley, V. Gallagher, F. Nı Mhairtın, J. Brogan, P. Lally,E. Doyle and L. Farrell, Historic Mine Sites – Inventory andClassication, EPA and GSI, Ireland, 2009, vol. 1.
51 J. Brogan, Report of the investigation into the presence oflead and other heavy metals in the Tynagh Mines Area,Report prepared for Office of Environmental Enforcement,Environmental Protection Agency, Ireland, County Galway,2003.
This journal is © The Royal Society of Chemistry 2014
52 Office of Environmental Enforcement, Final report of expertgroup for Silvermines, Co. Tipperary, EnvironmentalProtection Agency, Ireland, 2004.
53 T. Henry, An Integrated Approach to Characterising theHydrogeology of the Tynagh Mine Catchment, CountyGalway, Ireland, PhD thesis, National University of Ireland,Galway, 2014.
54 S. C. Homoncik, A. M. MacDonald, K. V. Heal, B. E. ODochartaigh and B. T. Ngwenya, Sci. Total Environ., 2010,408, 2467–2473.
55 P. B. Lobel, C. D. Bajdik, S. P. Belkhode, S. E. Jackson andH. P. Longrich, Arch. Environ. Contam. Toxicol., 1991, 21,409–421.
56 M. N. Croteau, S. K. Misra, S. N. Luoma and E. Valsami-Jones, Environ. Sci. Technol., 2011, 45, 6600–6607.
57 J. D. Hem, Study and Interpretation of the ChemicalCharacteristics of Natural Water, United States GeologicalSurvey Water-supply Paper 2254, USGS, Washington, DC,3rd edn, 1989.
58 B. J. Alloway, Heavy Metal in Soils, Springer Dordrecht,London, 2013, pp. 3–50.
59 E. Hodl, E. Felder, M. Chabicovsky and R. Dallinger, CellTissue Res., 2010, 341, 159–171.
60 M. G. Vijver, C. A. M. Van Gestel, R. P. Lanno, N. M. VanStraalen and W. J. G. M. Peijnenburg, Environ. Sci.Technol., 2004, 38, 4705–4712.
61 I. Marigomez, M. Soto, M. P. Cajaraville, E. Angulo andL. Giamberini, Microsc. Res. Tech., 2002, 56, 358–392.
62 S. N. Luoma and P. S. Rainbow, Environ. Sci. Technol., 2005,39, 1921–1931.
63 A. Fritioff, L. Kautsky and M. Greger, Environ. Pollut., 2005,133, 265–274.
64 N. M. Van Straalen and W. H. O. Ernst, Oikos, 1991, 62, 255–256.
65 A. Rautio, M. Kunnasranta, A. Valtonen, M. Ikonen,H. Hyvarinen, I. J. Holopainen and J. V. K. Kukkonen, Arch.Environ. Contam. Toxicol., 2010, 59, 642–651.
66 V. W. Y. Tam and C. M. Tam, Build. Res. Inform., 2008, 36, 37–43.
67 X. Duran, H. Lenihan and B. O’Regan, Resour., Conserv.Recycl., 2006, 46, 302–320.
68 Symonds Group Ltd., Construction and demolition wastemanagement practices, and their economic impacts. Finalreport to DGXI, European Commission, Brussels, 1999.
69 D. Heemsbergen, M. Warne, M. McLaughlin andR. Kookana, The Australian methodology to derive EcologicalInvestigation Levels in contaminated soils, CSIRO, Australia,2009.
70 H. R. Kohler and R. Triebskorn, Biomarkers, 1998, 2, 109–127.
71 H. R. Kohler, B. Rahman, S. Graff, M. Berkus andR. Triebskorn, Chemosphere, 1996, 33, 1327–1340.
Environ. Sci.: Processes Impacts, 2014, 16, 2477–2487 | 2487
Copyright © 2022 FDOKUMEN