ASO_S.pdf - UNIVERSITY OF FLORIDA THESIS OR ...
323
1 SYNERGISTIC ENZYMATIC HYDROLYSIS OF CASSAVA STARCH AND ANEAROBIC DIGESTION OF CASSAVA WASTE By SAMUEL NWANELE ASO A DISSERTATION PRESENTED TO THE GRADUATE SCHOOL OF THE UNIVERSITY OF FLORIDA IN PARTIAL FULFILLMENT OF THE REQUIREMENTS FOR THE DEGREE OF DOCTOR OF PHILOSOPHY UNIVERSITY OF FLORIDA 2013
-
Upload
khangminh22 -
Category
Documents
-
view
4 -
download
0
Transcript of ASO_S.pdf - UNIVERSITY OF FLORIDA THESIS OR ...

1
SYNERGISTIC ENZYMATIC HYDROLYSIS OF CASSAVA STARCH AND ANEAROBIC DIGESTION OF CASSAVA WASTE
By
SAMUEL NWANELE ASO
A DISSERTATION PRESENTED TO THE GRADUATE SCHOOL OF THE UNIVERSITY OF FLORIDA IN PARTIAL FULFILLMENT
OF THE REQUIREMENTS FOR THE DEGREE OF DOCTOR OF PHILOSOPHY
UNIVERSITY OF FLORIDA
2013

2
© 2013 Samuel NwaneLe Aso

3
To the memory of my parents: Chief Rufus Nyeweiba Aso [Chief Ntoyi]
Mrs. Elizabeth Ndem Aso [Madam Taproot] Prophetess Mrs. Caroline Ogonda Onyenma

4
ACKNOWLEDGMENTS
I want to thank the President of the University of Florida, Bernie Machen, and his
team of administrators for enabling environment conducive for academic work. I express
great gratitude to members of the supervisory graduate committee: Dr. Arthur A.
Teixeira; Dr. Bruce A. Welt; Dr. Pratap C. Pullammanappallil; Dr. Robert P. Bates; Dr.
Spyros A. Svoronos; and Dr. Weihua Yang; for advice, encouragement, guidance and
support.
I am grateful to Dr. Ray A. Bucklin for providing laboratory space for this project;
and to various persons that allowed me access to their labs and facilities. Dr. Bin Gao
for use of spectrophotometer, vortex machine, pipettes and distilled water; Dr. Melanie
J. Correll for use of microscope, convection oven, spectrophotometer and distilled
water; Dr. Bruce A. Welt for use of vacuum oven, dessicator jars and chemicals; Dr.
Pratap C. Pullammanappallil for use of centrifuges, gas partitioner, anaerobic digester,
incubator, Hach reactor and colorimeter; Dr. Weihua Yang for portable refractometer;
Dr. Keith R. Schneider for water bath; Dr. Jesse F. Gregory for the two books:
Fennema’s Food Chemistry and Principles of Enzymology for the food Sciences; Dr.
Robert P. Bates, Dr. Charles A. Sims, Rob Pelick and Bridget Stokes of the department
of food science and human nutrition for portable and table top refractometers, vacuum
evaporator, freeze dryer, cooking range and accessories. I also thank DSM, Genencor,
Novozymes, BioCat, and BioSun corporations for donating enzymes used in this
project.
I thank all the persons I have met and worked with: The librarians, folks at
Agricultural and Biological Engineering Department, as well as colleagues; for friendship
and support. My regards go to Dr. Thomas F. Burks, Dr. James D. Leary, Dr. Wendell

5
A. Porter, Robin, Veronica, Paul, Billy, Orlando, Steve, Patrick, James, Cesar, Donna,
Amy, Christan, Shannon, etc. I am thankful to my student assistants and mentees:
Brandon A. Doan, Jeremy D. Foxx, Alex Hyyti, Garrett Gant, Kelly Calderon, and
Frances de Asis. Whether it was peeling cassava roots, slicing and drying peeled roots
to produce cassava chips; milling chips into flour; conducting physical properties tests;
conducting hydrolysis experiments; or cataloging equipment used, I appreciate all the
help rendered.
I would like to thank doctors, nurses and staff at the student health care center.
Phillip A. Barkley, M.D. and Guy W. Nicolette, M.D. thanks for the care and support
provided. Thank you also to the Disability Resource Center [DRC]. When I sustained
incapacitating wrist injury while conducting research experiments, doctors did their job
and DRC supported my application for work place accommodation. Thank you to
everyone.
Furthermore, I dish out special regards to members of my family and relations for
relentless support, encouragement and prayers. To Nnenne, Apu, Uzoma, Chibuzor,
Ozioma, and Papa Edwin Onyenma, I say meka weh. My nephews and nieces:
Chimezie, Junior, Joy, Stephanie and Caro; my cousins: Nnanna (Chief of staff),
Chibuenyi (Boyoyo), Bright (Britoe) and Obi (Obilolo); and Mr. Iroha Iroha (Alias Agadi)
and Mrs. Iroha (Madam Agadi), I say bravo to you all.
I want to use this opportunity to thank those that created the internet. The
information cyber space is making it easier to access knowledge and do research. I
thank the scientists, thinkers and builders that worked assiduously to develop the
theories, equations and numerous other facilities we take for granted today. The likes of

6
Thomas Edison, Isaac Newton, Nikola Tesla, Albert Einstein, Alexander Graham Bell,
Galileo Galilei, Johannes Kepler and many others. I also remember Nicolas Appert,
Louis Pasteur, Carl Sagan and Karl Jansky. Thanks to you all for your service, vision
and creativity. You all are indeed the giants on whose shoulders present-day workers
are seeing from. I send a shout out to my space friends and inspirers: NASA, ESA, RKA
(Roscosmos), Robert Farquhar, Robert Zubrin, Peggy A Whitson and Charles T.
Bourland. Thanks for keeping space enthusiasm alive.
Funding: I am hugely appreciative of all funding assistances that supported the
PhD endeavor. Government of Rivers State of Nigeria, Mr. Stephen Majebi and Mrs.
Silverline Majebi assisted me to make the crucial down payment that started the PhD
program. Without the down payment, seed of PhD program most probably may not
have been planted in the first place, and we would not be at this juncture today. I thank
them immensely for the seed funding and their continued support over the years. After a
seed is planted and germinated, it needs nourishment to grow and blossom. Dr. Tex
worked hard to arrange funding support from Chemonics. For this I greatly thank Dr.
Tex and Chemonics. When the funding support from Chemonics expired, Dr. Dorota Z.
Haman was benevolent and assisted the project. Thank you Dr. Haman.
At some points in the course of this project, I may have been anxious to get the
work done and thus could have offended people without knowing. I use this medium to
sincerely apologize and beg for full forgiveness.
TO GOD BE ALL THE GLORY.

7
TABLE OF CONTENTS
Page
ACKNOWLEDGMENTS .................................................................................................. 4
LIST OF TABLES .......................................................................................................... 12
LIST OF FIGURES ........................................................................................................ 15
ABSTRACT ................................................................................................................... 19
CHAPTER
1 INTRODUCTION .................................................................................................... 22
1.1 Background ....................................................................................................... 22 1.1.1 Importance .............................................................................................. 22
1.1.2 Advantages ............................................................................................. 24 1.2 Justifications ..................................................................................................... 24
1.2.1 Rationale ................................................................................................. 24 1.2.2 Challenges and Opportunities ................................................................. 33
1.3 Objectives ......................................................................................................... 36 1.4 Organization of Dissertation .............................................................................. 38
2 REVIEW OF LITERATURE .................................................................................... 39
2.1 Part 1: Cassava ................................................................................................ 39
2.1.1 Origin and Distribution ............................................................................. 39 2.1.2 Classification ........................................................................................... 40
2.1.3 Agro Climatic Conditions ......................................................................... 42 2.1.4 Propagation ............................................................................................. 43
2.1.5 Production ............................................................................................... 43 2.1.6 Cassava Utilization .................................................................................. 47
2.1.6.1 Starch ............................................................................................. 47 2.1.6.2 Flour ............................................................................................... 49
2.1.6.2.1 Gluten free flour .......................................................................... 50 2.1.6.3 Chips .............................................................................................. 50
2.1.6.4 Packaging ...................................................................................... 51 2.1.7 Sweetener Production ............................................................................. 51
2.1.7.1 Historical overview ......................................................................... 53 2.1.7.2 Acid or enzyme hydrolysis ............................................................. 55
2.1.7.3 Amylolytic enzymes........................................................................ 55 2.1.7.4 Synergistic and direct methods of glucose sweetener production .. 56
2.1.8 Starch Chemistry ..................................................................................... 57 2.1.8.1 Amylose ......................................................................................... 59
2.1.8.2 Amylopectin ................................................................................... 61

8
2.1.8.3 Cassava Starch .............................................................................. 66 2.1.8.4 Enzymatic Hydrolysis of Starch ...................................................... 71
2.1.8.4.1 Alpha amylase ( -amylase: EC 3.2.1.1) ...................................... 72
2.1.8.4.2 Beta amylase (β-amylase: EC 3.2.1.2) ....................................... 74
2.1.8.4.2 Gamma amylase (γ-amylase: EC 3.2.1.3) .................................. 75
2.1.8.4.3 Comparison of starch hydrolyzing enzymes ................................ 78
2.1.9 Cassava Toxicity ..................................................................................... 80 2.1.10 Cassava Detoxification .......................................................................... 86
2.1.11 Cassava Food Products ........................................................................ 96 2.1.11.1 Akpakpuru .................................................................................... 97
2.1.11.2 Attieke .......................................................................................... 97 2.1.11.3 Casabe ......................................................................................... 98
2.1.11.4 Chickwangue ............................................................................... 99 2.1.11.5 Farina ......................................................................................... 100
2.1.11.6 Fufu ............................................................................................ 100 2.1.11.7 Fuku ........................................................................................... 101
2.1.11.8 Gaplek ........................................................................................ 101 2.1.11.9 Gari ............................................................................................ 101
2.1.11.10 Konkonte .................................................................................. 102 2.1.11.11 Lafun ........................................................................................ 102 2.1.11.12 Landang (cassava rice) ............................................................ 103
2.1.11.13 Peujeum or Tapai ..................................................................... 103 2.1.11.14 Puttu ......................................................................................... 103
2.1.11.15 Thundam .................................................................................. 104 2.1.11.16 Other Cassava food and beverage products ............................ 104
2.2 Part 2: Production of Amylolytic Enzymes ...................................................... 105 2.2.1 Background ........................................................................................... 105
2.2.2 Amylolytic Enzymes Production by Solid-State Fermentation ............... 107 2.2.2.1 Substrates support structures ...................................................... 110
2.2.2.2 Carbon supplementation .............................................................. 117 2.2.2.3 Nitrogen supplementation ............................................................ 117
2.2.2.4 Porosity and aeration ................................................................... 118 2.2.2.5 Moisture content and water activity .............................................. 119
2.2.2.6 Incubation temperature ................................................................ 122 2.2.2.7 Inoculums concentration .............................................................. 123
2.2.2.8 Fermentation time and pH ............................................................ 125 2.2.3 Bioreactor Designs in Solid-State Fermentation .................................... 126
2.2.3.1 Packed bed reactor ...................................................................... 126 2.2.3.2 Tray bioreactor ............................................................................. 127
2.2.3.3 Drum bioreactor ........................................................................... 127 2.2.3.4 Fluidized bed bioreactor ............................................................... 128
2.2.4 Submerged Fermentation (SmF) ........................................................... 129 2.2.4.1 Temperature and pH .................................................................... 129
2.2.4.2 Carbon and nitrogen .................................................................... 131 2.2.4.3 Salts ............................................................................................. 133
2.2.5 Summary on Enzyme Production .......................................................... 134

9
3 PHYSICAL PROPERTIES OF CASSAVA FLOUR MADE FROM SOLAR CONVECTION-DRIED CASSAVA CHIPS ............................................................ 135
3.1 Background ..................................................................................................... 135 3.2 Objectives ....................................................................................................... 136
3.3 Methods and Procedures ................................................................................ 136 3.3.1 Scope of Work ....................................................................................... 136
3.3.2 Fresh Cassava Root .............................................................................. 137 3.3.2.1 Sample preparation ...................................................................... 137
3.3.2.2 Moisture content and water activity for sorption isotherms ........... 138 3.3.2.3 Drying curve ................................................................................. 138
3.3.3 Cassava Flour ....................................................................................... 139 3.3.3.1 Sample preparation ...................................................................... 139
3.3.3.2 Physical properties ....................................................................... 140 3.4 Results ............................................................................................................ 141
3.4.1 Sorption Isotherm and Drying Curves for Fresh Cassava Root Pulp ..... 141 3.4.2 Physical Properties of Cassava Flour .................................................... 142
3.5 Summary ........................................................................................................ 145
4 SYNERGISTIC ENZYMATIC HYDROLYSIS OF CASSAVA STARCH ................ 146
4.1 Background ..................................................................................................... 146 4.2 Objectives ....................................................................................................... 154
4.3 Materials and Methods .................................................................................... 155 4.3.1 Enzymes ................................................................................................ 155
4.3.2 Substrates ............................................................................................. 156 4.3.2.1 Roots ............................................................................................ 157
4.3.2.2 Flour ............................................................................................. 157 4.3.2.3 Starch ........................................................................................... 157
4.3.3 Sample Preparation ............................................................................... 157 4.3.3.1 Root ............................................................................................. 157
4.3.3.2 Flour ............................................................................................. 159 4.3.3.3 Starch ........................................................................................... 159
4.3.4 Reactor .................................................................................................. 159 4.3.5 Analytical Methods ................................................................................ 160
4.3.5.1 Proximate composition, starch, and sugar analysis ..................... 160 4.3.5.2 Glucose Analysis.......................................................................... 161
4.3.5.3 Determination of Reducing Sugar ................................................ 162 4.3.6 Experimental Procedure ........................................................................ 165
4.3.7 Mass Balance Stoichiometry ................................................................. 170 4.3.8 Reaction Kinetics ................................................................................... 171
4.3.9 Statistical Analysis ................................................................................. 173 4.4 Results and Discussion ................................................................................... 173
4.4.1 Compositional analysis of different substrates ...................................... 173 4.4.2 Enzyme hydrolysis at 60°C .................................................................... 173
4.4.3 Enzyme hydrolysis at 37°C .................................................................... 178 4.4.4 Reaction Kinetics of Enzyme Hydrolysis ............................................... 181

10
4.4.4.1 First-order rate constants ............................................................. 181 4.4.4.2 Activation energy.......................................................................... 183
5 ANAEROBIC DIGESTION OF CASSAVA WASTE FOR PRODUCTION OF BIOGAS AND AMYLOLYTIC ENZYMES .............................................................. 186
5.1 Background ..................................................................................................... 186 5.2 Objectives ....................................................................................................... 187
5.3 Materials and Methods .................................................................................... 188 5.3.1 Cassava Roots ...................................................................................... 188
5.3.2 Reactor .................................................................................................. 188 5.3.3 Inoculum ................................................................................................ 190
5.3.4 Bulking Agent ........................................................................................ 190 5.3.5 Sample Preparation ............................................................................... 190
5.3.5.1 Root components proportion ........................................................ 190 5.3.5.2 Anaerobic digestion samples ....................................................... 193
5.3.6 Anaerobic Digestion Procedure ............................................................. 193 5.3.7 Analysis ................................................................................................. 194
5.3.7.1 Biogas composition ...................................................................... 194 5.3.7.2 Soluble chemical oxygen demand (sCOD) .................................. 196
5.3.7.3 pH ................................................................................................ 197 5.3.7.4 Total solids (TS), volatile solids (VS), and other properties .......... 197
5.3.8 Enzyme Extraction and Enzyme Activity ............................................... 199 5.3.8.1 Enzyme extraction........................................................................ 199
5.3.8.1.1 Cell free enzyme ....................................................................... 199 5.3.8.1.2 Cell associated enzyme ............................................................ 200
5.3.8.1.3 Biofilm associated enzyme ........................................................ 200 5.3.8.2 Enzyme activity ............................................................................ 201
5.4 Results and Discussion ................................................................................... 202 5.4.1 Cassava Root Components Proportions ............................................... 202
5.4.2 Composition of Cassava Peel Waste .................................................... 203 5.4.3 Biogasification of Cassava Peel Waste ................................................. 205
5.4.4 Soluble Chemical Oxygen Demand (sCOD) .......................................... 206 5.4.5 Total Solids (Dry Matter) and Volatile Solids Reduction ........................ 208
5.4.6 Enzyme Activity ..................................................................................... 209 5.5 Dividends and Applications of Anaerobic Digestion of Cassava Peel Waste .. 210
5.5.1 Biomethane Potential and Applications of Biogas ................................. 210 5.5.2 Fertilizer Value Potential of Effluent from Mesophilic Anaerobic
Digestion of Cassava Peel Waste ............................................................... 213 5.5.2.1 Nitrogen ....................................................................................... 215
5.5.2.2 Phosphorus .................................................................................. 216 5.5.2.3 Potassium .................................................................................... 216
6 CONCLUSIONS AND RECOMMENDATIONS ..................................................... 219
6.1 Conclusions .................................................................................................... 219
6.2 Recommendations for Future Work ................................................................ 222

11
APPENDIX
A PHOTOGRAPHS OF SOME MATERIALS AND EQUIPMENT USED AND THE PRODUCTS CREATED ........................................................................................ 224
B RECOMMENDED REFERENCES FOR FUTHER READING .............................. 265
LIST OF REFERENCES ............................................................................................. 272
BIOGRAPHICAL SKETCH .......................................................................................... 322

12
LIST OF TABLES
Table Page 1-1 Agricultural Commodities in the whole World in 2011 Ranked by Production
Quantity .............................................................................................................. 25
1-2 Agricultural Commodities in the whole World in 2011 Ranked by Monetary Value ................................................................................................................. 26
1-3 Agricultural Commodities in Africa in 2011 Ranked by Production Quantity ...... 27
1-4 Agricultural Commodities in Africa in 2011 Ranked by Monetary Value ............ 28
1-5 Agricultural Commodities in Asia in 2011 Ranked by Production Quantity ........ 29
1-6 Agricultural Commodities in Asia in 2011 Ranked by Monetary Value .............. 30
1-7 Agricultural Commodities in the Americas in 2011 Ranked by Production Quantity ............................................................................................................. 31
1-8 Agricultural Commodities in the Americas in 2011 Ranked by Monetary Value ........................................................................................................................... 32
1-9 Global Rank of Cassava in 2011 among all Agricultural Commodities in terms of Production Quantity and Monetary Value ...................................................... 33
2-1 Cassava’s ranking among World Agricultural Commodities: 1999 to 2011......... 44
2-2 Global Statistics on Cassava Production in 2011, by Country ........................... 45
2-3 Global Statistics on Cassava Production in 2011, by Region ............................ 46
2-4 Some Properties of Amyloses from Cereal, Legume and Root and Tuber Starches ............................................................................................................ 60
2-5 Some Properties of Amylopectins from Cereal, Legume and Root and Tuber Starches ............................................................................................................ 65
2-6 Some Distinguishing Properties between Amylose and Amylopectin ................. 65
2-7 Some Properties of Cassava Starch ................................................................... 68
2-8 Degree of Hydrolysis of Native Cassava Starch Achieved with Various Enzymes and Operating Conditions ................................................................... 81
2-9 Detoxification of Cassava Components and Products by various Processing Methods .............................................................................................................. 87

13
2-10 Advantages and Disadvantages of Solid State Fermentation (SSF) ................ 108
2-11 Substrates used in Microbial Fermentations, Organisms Employed and the Products Generated ......................................................................................... 111
2-12 Optimum moisture content [% W/W] for various combinations of microorganism and substrate in enzyme production ........................................ 121
2-13 Optimum temperature for enzyme production and activity with various combinations of microorganism and substrate ................................................. 124
3-1 Saturated Salt Solutions and Associated Equilibrium Relative Humidity when placed in Desiccator Jars.................................................................................. 139
3-2 Physical properties of cassava flour with particle size ≤ 0.5 mm. ..................... 144
4-1 Some Results of Alpha Amylase Hydrolysis of Starch from Sources other than corn .......................................................................................................... 152
4-2 Statistics of Enzymes used in the Research Work ........................................... 155
4-3 Assay Methods used by ABC Research Laboratories for Analysis of Samples 161
4-4 Experimental Design for Synergistic Enzymatic Hydrolysis of Different Cassava Substrates ......................................................................................... 169
4-5 Compositional Analysis of Different Cassava Substrates ................................ 174
4-6 Maximum Starch Converted to Glucose in Different Cassava Substrates after 24 hours of Enzyme Hydrolysis at 60 o C ......................................................... 176
4-7 Maximum Starch Converted to Glucose in Different Cassava Substrates after 96 hours of Enzyme Hydrolysis at 37 o C ......................................................... 179
4-8 Reaction Rate Constant (k), Correlation Coefficient (R2) and Regression Equation of First Order Reaction for Enzyme Hydrolysis of Different Cassava Substrates at 60 o C.......................................................................................... 183
4-9 Reaction Rate Constant (k), Correlation Coefficient (R2) and Regression Equation of First Order Reaction for Enzyme Hydrolysis of Different Cassava Substrates at 37 o C.......................................................................................... 183
4-10 Activation Energy (EA) and Regression Equations for Estimating the Arrhenius Temperature Dependency of Rate Constant for Enzyme Hydrolysis of Different Cassava Substrates ....................................................................... 184
4-11 Reaction Kinetics Parameters for Enzyme Hydrolysis of Starch in Different Cassava Substrates ......................................................................................... 185

14
5-1 Formulae for Methane Yield Analysis and for Determination of Properties of Cassava Peel Waste used as Feedstock/Substrate in Anaerobic Digestion for Biogas and Enzyme Production .................................................................. 198
5-2 Mass Distribution of Cassava Root Components ............................................. 202
5-3 Substrate Characteristics and Bio-Methane Potentials of Mesophilic Anaerobic Digestion of Cassava Peel Waste ................................................... 204
5-4 Dry Matter and Volatile Solids Reduction during Anaerobic Digestion of Cassava Peel Waste. ....................................................................................... 208
5-5 The Activities of Enzymes Produced by Anaerobic Digestion of Cassava Peel Waste . ............................................................................................................. 209
5-6 The Activities of Enzymes Produced by Anaerobic Digestion of Pieces of Whole Unpeeled Cassava Roots . .................................................................... 209
5-7 Specific Activities of Enzymes Produced by Anaerobic Digestion of Cassava Root Materials ................................................................................................. 210
5-8 Methodologies used for the Analysis of Fertilizer Components of Post Anaerobic Digestion Liquor .............................................................................. 214
5-9 Organic Fertilizer Potential of Anaerobic Digestion of Cassava Peel Waste .... 218

15
LIST OF FIGURES
Figure Page 1-1 Components of Cassava Crop: Roots; Leaves; and Seeds . .............................. 23
1-2 Overview/Global Architecture of Scheme of Study ............................................. 37
2-1 Schematic of Unit Operations for the Manufacture of Cassava Chips, Flour, and Starch . ........................................................................................................ 52
2-2 An Overview of the Structure of Starch Granule ................................................. 58
2-3 Structural Formula and Linear Configuration of Amylose .................................. 60
2-4 Structural Features of Amylopectin Highlighting α (1 → 4) Linkages and α (1 → 6) branch points ............................................................................................ 61
2-5 Structural Formula and Profiles of Amylopectin Branches and Clusters . ........... 62
2-6 Basic labeling of chains in amylopectin ............................................................. 63
2-7 A model of how the clusters of amylopectin build up the semi-crystalline granular rings . .................................................................................................... 64
2-8 Structure of Alpha Amylase with calcium and chloride ions visible .................... 72
2-9 Schematics of how -Amylase randomly splits Starch Molecules to liberate
Glucose, Maltose and -Limit Dextrins. .............................................................. 73
2-10 Structural Features of Beta Amylase. ................................................................. 74
2-11 Hydrolysis of Starch by β-Amylase to liberate Maltose and β-Limit Dextrins ...... 75
2-12 Structure of Glucoamylase ................................................................................ 76
2-13 Glucoamylase Model and Mechanism of Starch Digestion ................................ 77
2-14 Hydrolysis of Starch by γ-Amylase to liberate Glucose Molecules ..................... 78
2-15 Overview of the Pattern of Starch Digestion by major Starch Hydrolyzing Enzymes ............................................................................................................ 79
2-16 Structures of the Aliphatic Cyanogenic Glucosides of Cassava: Linamarin and Lotaustralin ................................................................................................. 82
2-17 The Biosynthesis Pathway of Linamarin showing Valine as the Precursor ........ 83

16
2-18 The Separation cum Distribution of Linamarin and Linamarase in the Plant System .............................................................................................................. 84
2-19 Mechanism of Hydrolysis of Cyanogenic Glucosides and Liberation of Hydrogen Cyanide ............................................................................................. 85
2-20 Production and Toasting of Casabe on a Wood-Fired Griddle . ......................... 99
2-21 Three Dimensional Image of Alpha-Amylase ................................................... 106
2-22 Schematic of a Fluidized Bed Bioreactor that uses Humidified Air for Pneumatic Agitation. ......................................................................................... 128
3-1 Prototype Solar Convection Dryer used for Drying Cassava Chips .................. 137
3-2 Air Flow Apparatus for Determination of Permeability ...................................... 140
3-3 Sorption Isotherm of Fresh Cassava Root Pulp Slices for Drying into Chips . .. 142
3-4 Replicate Drying Curves for Drying Cassava Slices into Chips. ....................... 143
3-5 Particle Size Distribution in Cassava Flour from Grinding Dry Cassava Chips under various Blender Operating Conditions. ......................................... 143
4-1 Size Reduction Devices used in Sample Preparations.. ................................... 158
4-2 Reactor Devices and Systems for Hydrolysis Experiments . ............................ 160
4-3 Stoichiometry for the Detection of Reducing Sugars as Glucose through Reactions with 3,5-dinitrosalicylic acid (DNS) Reagents .................................. 163
4-4 Spectrophotometers used for Measurement of Absorbance in Samples Reacted with DNS Reagent in Order to Determine Reducing Sugars as Glucose . .......................................................................................................... 164
4-5 Calibration Curve used for Estimation of Reducing Sugars (As Glucose) in the 3, 5-dinitrosalicylic acid (DNS) Analytical Method. ...................................... 165
4-6 Scales used for Mass Measurements . ............................................................. 166
4-7 Pipettes used in Sample withdrawals and Analysis ......................................... 167
4-8 Monitoring Devices for pH, and Soluble Solids . ............................................... 168
4-9 Vacuum Evaporator Used for Glucose Syrup Concentration .......................... 170
4-10 Mass Balance Stoichiometry for Enzymatic Hydrolysis of Different Cassava Substrates . ...................................................................................................... 171

17
4-11 Profile of Glucose Content Vs. Time during Enzyme Hydrolysis of Commercial Cassava Starch at 60 o C ............................................................ 175
4-12 Profile of Glucose Content Vs. Time during Enzyme Hydrolysis of Flour Produced from Solar Dried Cassava Chips at 60 o C ...................................... 175
4-13 Profile of Glucose Content Vs. Time during Enzyme Hydrolysis of Ground Fresh Cassava Root Pulp at 60 o C ................................................................. 176
4-14 Comparison Profile of Glucose Content Vs. Time during Enzyme Hydrolysis of Commercial Cassava Starch, Flour Produced from Solar Dried Cassava Chips and Ground Fresh Cassava Root Pulp at 60 o C ................................... 177
4.15 Conversion Profile of Enzyme Hydrolysis of Starch to Glucose in Different Cassava Substrates at 60 o C.. ......................................................................... 177
4-16 Profile of Glucose Content Vs. Time during Enzyme Hydrolysis of Commercial Cassava Starch at 37 o C ............................................................. 178
4-17 Profile of Glucose Content Vs. Time during Enzyme Hydrolysis of Flour Produced from Solar Dried Cassava Chips at 37 o C ....................................... 178
4-18 Profile of Glucose Content Vs. Time during Enzyme Hydrolysis of Ground Fresh Cassava Root Pulp at 37 o C .................................................................. 179
4-19 Comparison Profile of Glucose Content Vs. Time during Enzyme Hydrolysis of Commercial Cassava Starch, Flour Produced from Solar Dried Cassava Chips and Ground Fresh Cassava Root Pulp at 37 o C .................................... 180
4-20 Conversion Profile of Enzyme Hydrolysis of Starch to Glucose in Different Cassava Substrates at 37 o C ........................................................................... 180
4-21 Semi-log Plot of Unaccomplished Glucose Conversion over Time for Estimation of First Order Reaction Rate Constants for Enzyme Hydrolysis of Starch with Different Cassava Substrates at 60 o C ......................................... 182
4-22 Semi-log Plot of Unaccomplished Glucose Conversion over Time for Estimation of First Order Reaction Rate Constants for Enzyme Hydrolysis of Starch with Different Cassava Substrates at 37 o C ......................................... 182
4-23 Semi-log Plot of First Order Reaction Rate Constants versus Reciprocal Absolute Temperature for Estimation of Arrhenius Activation Energy for Enzyme Hydrolysis of Cassava Starch at 37 o C and 60 o C ............................ 184
5-1 Anaerobic Digestion System Design ................................................................ 189
5-2 My Weigh Shipping Scale used to weigh out Cassava Roots........................... 190

18
5-3 Implements used to Peel Cassava Roots and Prepare the Peelings for Experiments ..................................................................................................... 191
5-4 Components of Cassava Root. ......................................................................... 192
5-5 Gas Chromatograph (GC) System used to Estimate the Methane and Carbon dioxide Contents of Biogas Generated by Anaerobic Digestion of Cassava Peel Waste . ..................................................................................................... 195
5-6 Laboratory Equipment used in sCOD analysis of Leachate from Anaerobic Digestion of Cassava Peel Waste . .................................................................. 196
5.7 Clinical Centrifuge used for Enzyme Extraction ............................................... 199
5-8 Methane Yield of Mesophilic Anaerobic Digestion of Cassava Peel Waste ...... 205
5-9 Profiles of Soluble Chemical Oxygen Demand (sCOD) for Mesophilic Anaerobic Digestion of Cassava Peel Waste ................................................... 207
5-10 Mass Balance for Anaerobic Digestion of Peel Waste from one tonne (1000 kg) of fresh Cassava Root ................................................................................ 211
5-11 Mass Balance for Anaerobic Digestion of 1 tonne (1000 kg) of Cassava Peel Waste .............................................................................................................. 213

19
Abstract of Dissertation Presented to the Graduate School of the University of Florida in Partial Fulfillment of the Requirements for the Degree of Doctor of Philosophy
SYNERGISTIC ENZYMATIC HYDROLYSIS OF CASSAVA STARCH AND
ANEAROBIC DIGESTION OF CASSAVA WASTE
By
Samuel NwaneLe Aso
December 2013
Chair: Arthur A. Teixeira Major: Agricultural and Biological Engineering
Cassava is a major root crop and source of food and feed carbohydrate for
humans and livestock. Cassava provides economic and subsistence value to more than
800 million to one billion people in Brazil, China, Haiti, India, Indonesia, Nigeria,
Thailand and many other countries. However, current processes for conversion of
cassava roots to value added products are far from optimum. Glucose is produced by
first extracting starch from the roots. The starch is then subjected to two separate
operations called liquefaction and saccharification. Each operation incurs many cost
elements. Liquefaction for example demands elaborate equipment and energy inputs,
while starch extraction is energy, labor and technology intensive. These requirements
place glucose and other value added cassava products beyond the reach of many
developing nations. It would be efficient and advantageous if liquefaction and
saccharification could be carried out simultaneously as one operation and the starch
hydrolyzed directly without going through the extraction procedure. Furthermore, over
60 % of global cassava output (which was 252.2 x 10⁹ kg in 2011) is processed
annually for human food, generating enormous quantities of organic waste matter with

20
attendant environmental and disposal issues. Anaerobic digestion of cassava wastes
could generate beneficial products and at the same time be environment friendly.
The objectives of this study were to develop and demonstrate a village-scale
method of processing fresh cassava root into flour from solar-convection dried cassava
chips, produce glucose sweetener from combined liquefaction and saccharification
hydrolysis of native starch that was not first extracted, and generate biogas (methane)
from anaerobic digestion of cassava waste.
A solar convection dryer requiring no fuel or electricity was used to dry thin slices
of cassava root into dry chips that were subsequently ground into cassava flour. The
flour as well as freshly ground cassava root (pulp) was used as substrate for conversion
into glucose by enzyme hydrolysis. The rates of conversion (kinetics) for both
substrates were determined at two different temperatures and compared with those of
commercially available refined cassava starch. Cassava waste from peelings and
trimmings was used as feedstock for anaerobic digestion into methane fuel.
Results showed that rates of reaction for hydrolysis of all three substrates were
similar to each other at both temperatures, but resulted in different extent of reaction.
The cassava flour and pulp produced syrup with 3-4% glucose, while the commercial
starch produced 10% glucose within 4 hours at 60°C, and 72 hours at 37°C. Anaerobic
digestion of cassava waste produced bio-methane yield of 0.25 liter/ gram volatile solids
with a production efficiency of 71 %. These findings would suggest the possibility of a
cottage industry cassava processing operation that would be self-sufficient in which
fresh cassava roots could be solar-convection dried to make flour. The flour and grated
root pulp could be hydrolyzed in one step to make glucose syrup sweetener, while the

21
waste peelings and trimmings could be processed by anaerobic digestion to produce
useful energy in the form of biogas for maintaining digester temperature and/or
supplementing heat required for hydrolysis and in the solar dryer. In addition, amylolytic
(starch hydrolyzing) enzymes could be harvested from the anaerobic digestion liquor,
and the post digestion effluent applied to farm land as source of organic fertilizer.

22
CHAPTER 1 INTRODUCTION
1.1 Background
Cassava is known botanically as Manihot esculenta Crantz. It is variously
referred to as Mandioca (in Portuguese); Manioc (in French); Yuca (in Spanish);
Cassave (in Haitian Creole) and Akpakpuru (in Ikwerre, a Nigerian language). Cassava
is a perennial plant widely grown in more than 90 countries in tropical and sub tropical
regions of the world (Wilson and Dufour, 2002). It is chiefly cultivated for its starchy
roots (FAO, 1990; Chadha, 1961). However, young cassava leaves are consumed by
humans as a vegetable (Bokanga, 1994 a; Koch et al., 1994; FAO, 1990; Hahn, 1983;
Lancaster and Brooks, 1983), or used as protein supplement in livestock feeds (Borin et
al., 2005; Wanapat et al., 2000; Ravindran, 1993, 1992; Hahn et al., 1992; Balagopalan
et al., 1988; Moore, 1976). The seeds are used mainly in breeding programs (Ceballos
et al., 2012; Nassar and Ortiz, 2010; Rajendran et al., 2005; El-Sharkawy, 2004;
Iglesias et al., 1994; Nartey, 1978). Figure 1-1 shows some useful components of the
cassava crop.
1.1.1 Importance
Cassava has been reported to be the fourth most important food crop in
developing nations after rice, wheat and maize/corn (Johnson et al., 2005; Koch et al.,
1994; FAO, 1989). Cassava has also been reported to be world’s third largest source of
carbohydrates for human food (Nassar and Ortiz, 2010; Claude and Denis, 1990;
Fauquet and Fargette, 1990; Phillips, 1982). In Zaire, 60% of the daily calorie intake is
provided by cassava roots, while 20% of protein comes from cassava leaves (Koch et
al., 1994).
23
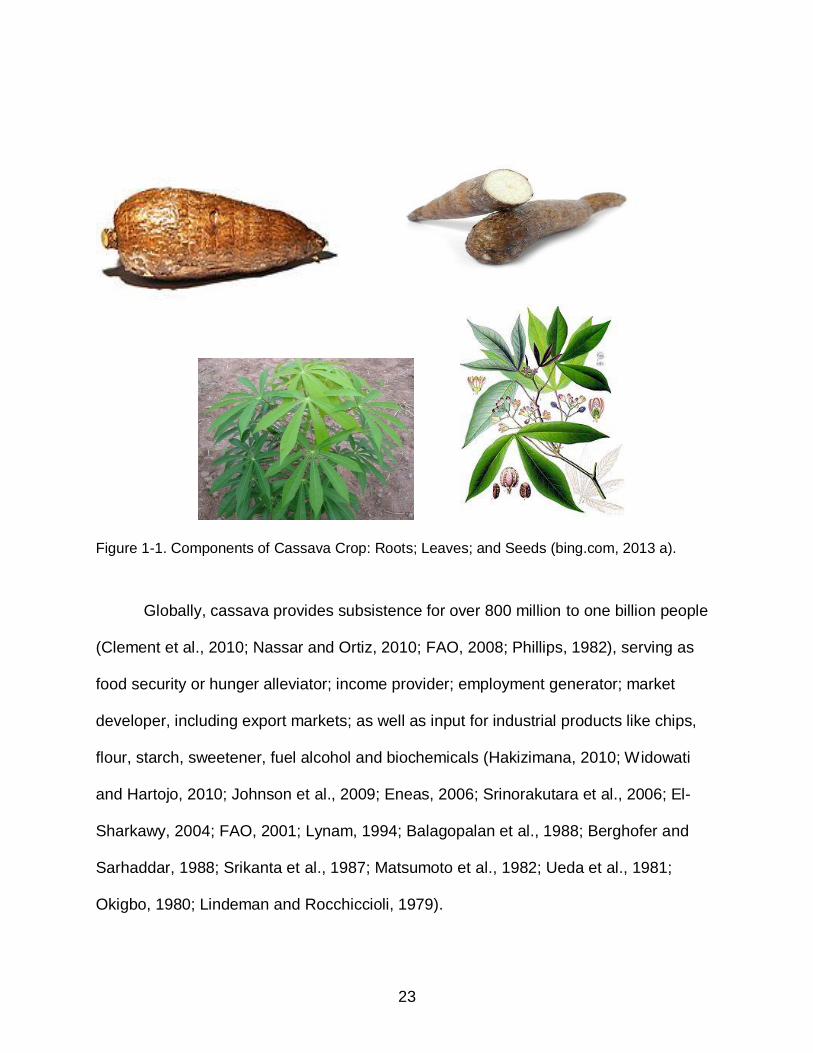
Figure 1-1. Components of Cassava Crop: Roots; Leaves; and Seeds (bing.com, 2013 a).
Globally, cassava provides subsistence for over 800 million to one billion people
(Clement et al., 2010; Nassar and Ortiz, 2010; FAO, 2008; Phillips, 1982), serving as
food security or hunger alleviator; income provider; employment generator; market
developer, including export markets; as well as input for industrial products like chips,
flour, starch, sweetener, fuel alcohol and biochemicals (Hakizimana, 2010; Widowati
and Hartojo, 2010; Johnson et al., 2009; Eneas, 2006; Srinorakutara et al., 2006; El-
Sharkawy, 2004; FAO, 2001; Lynam, 1994; Balagopalan et al., 1988; Berghofer and
Sarhaddar, 1988; Srikanta et al., 1987; Matsumoto et al., 1982; Ueda et al., 1981;
Okigbo, 1980; Lindeman and Rocchiccioli, 1979).

24
1.1.2 Advantages
With possible exception of sugarcane, cassava’s productivity in terms of calories
per unit land area per unit of time is said to be significantly higher than that of other
staple food crops (Shetty et al., 2007; Koch et al., 1994; Balagopalan et al., 1988;
Okigbo, 1980). As a root crop, cassava has high biological efficiency because the most
important edible carbohydrate part (the root) lies underground and does not require
support from heavy stems and branches (Coursey and Haynes, 1970). Cassava can be
planted most time of the year and is available all year long; is productive on poor soils;
tolerant of adverse climatic conditions; adaptable to various farming systems and can
be intercropped with beans, maize (corn), yam and several other crops. Cassava is
resistant to pests and diseases; is easily propagated by stem cuttings and its production
is less labor intensive than yam. Also, cassava has more than two years harvest
window. This advantage precludes the need for expensive energy intensive
preservation cum storage technique like refrigeration, affords farmers protection against
famine, and guarantees flexible labor management schedules. Furthermore, cassava is
endowed with good quality starch (Tonukari, 2004; Westby, 2002; International Starch
Institute, 1999; O’Hair, 1995; Koch et al., 1994; Hahn, 1992; Balagopalan et al., 1988);
that can be transformed to products with huge industrial applications.
1.2 Justifications
1.2.1 Rationale
Despite huge economic and social relevance demonstrated in the enumerated
importance and advantages, cassava crop is considered an orphan crop, only suitable
for poor subsistence farmers of low economic status. Cassava has traditionally received
relatively minor investment and attention for research and development (Ceballos et al.,

25
2012; FAO, 2008; Cock, 1985; Hahn and Keyer, 1985; Rogers, 1965). The rankings of
top 20 agricultural commodities produced in the world in 2011 in terms of quantity and
monetary value are presented in Table 1-1 and Table 1-2 for entire planet earth; Table
1-3 and Table 1-4 for Africa; Table 1-5 and Table 1-6 for Asia; and Table 1-7 and Table
1-8 for the Americas.
Table 1-1. Agricultural Commodities in the whole World in 2011 Ranked by Production Quantity (Source: Compiled from FAO online statistical data base; FAO, 2013)
Rank
Commodity
Production Quantity (1 x 10⁹ kg)
1
Sugar cane
1794.35
2 Maize 883.46
3 Rice, paddy 722.76
4 Wheat 704.08
5 Cow milk, whole, fresh 606.66
6 Potatoes 374.38
7 Sugar beet 271.64
8 Vegetables fresh 268.37
9 Soybeans 260.91
10 Cassava 252.20
11 Tomatoes 159.02
12 Barley 134.27
13 Indigenous Pig meat 108.64
14 Bananas 106.54
15 Watermelons 104.47
16 Sweet potatoes 104.25
17 Buffalo milk, whole, fresh 93.01
18 Indigenous Chicken Meat 89.55
19 Onions, dry 85.37
20 Apples 75.63

26
Table 1-2. Agricultural Commodities in the whole World in 2011 Ranked by Monetary Value (Source: Compiled from FAO online statistical data base; FAO, 2013)
Rank
Commodity
Monetary Value
(Int $1 x 10⁹)
1
Rice, paddy 187.88
2 Cow milk, whole, fresh 181.27
3 Indigenous Cattle Meat 168.94
4 Indigenous Pig meat 167.00
5 Indigenous Chicken Meat 127.56
6 Wheat 86.27
7 Soybeans 64.14
8 Tomatoes 58.10
9 Maize 57.42
10 Sugar cane 56.63
11 Hen eggs, in shell 53.86
12 Potatoes 50.27
13 Vegetables fresh 46.12
14 Grapes 39.81
15 Cotton lint 37.30
16 Buffalo milk, whole, fresh 36.55
17 Apples 31.84
18 Bananas 29.57
19 Cassava 24.59
20 Mangoes, mangosteens, guavas 23.30

27
Table 1-3. Agricultural Commodities in Africa in 2011 Ranked by Production Quantity (Source: Compiled from FAO online statistical data base; FAO, 2013)
Rank
Commodity
Production Quantity
(1 x 10⁹ kg)
1
Cassava
140.96
2 Sugar cane 83.45
3 Maize 65.05
4 Yams 54.35
5 Plantains 28.81
6 Cow milk, whole, fresh 27.50
7 Rice, paddy 26.53
8 Potatoes 26.32
9 Wheat 22.08
10 Sorghum 20.78
11 Vegetables fresh 17.49
12 Sweet potatoes 17.10
13 Tomatoes 16.55
14 Bananas 15.39
15 Millet 10.78
16 Sugar beet 9.92
17 Groundnuts, with shell 9.43
18 Onions, dry 8.34
19 Oranges 7.13
20 Taro (cocoyam) 7.07

28
Table 1-4. Agricultural Commodities in Africa in 2011 Ranked by Monetary Value (Source: Compiled from FAO online statistical data base; FAO, 2013)
Rank
Commodity
Monetary Value
(Int $1 x 10⁹)
1
Cassava
14.63
2 Indigenous Cattle Meat 13.57
3 Yams 11.34
4 Cow milk, whole, fresh 8.33
5 Rice, paddy 7.06
6 Indigenous Chicken Meat 6.51
7 Maize 6.22
8 Tomatoes 6.11
9 Plantains 5.38
10 Bananas 4.33
11 Groundnuts, with shell 3.96
12 Potatoes 3.96
13 Indigenous Sheep Meat 3.53
14 Vegetables fresh 3.29
15 Cocoa beans 3.00
16 Sorghum 2.94
17 Wheat 2.87
18 Indigenous Goat Meat 2.75
19 Sugar cane 2.65
20 Olives 2.59

29
Table 1-5. Agricultural Commodities in Asia in 2011 Ranked by Production Quantity (Source: Compiled from FAO online statistical data base; FAO, 2013)
Rank
Commodity
Production
Quantity
(1 x 10⁹ kg)
1
Sugar cane
710.93
2 Rice, paddy 653.24
3 Wheat 317.86
4 Maize 270.86
5 Vegetables fresh 231.29
6 Potatoes 174.63
7 Cow milk, whole, fresh 163.34
8 Tomatoes 96.47
9 Buffalo milk, whole, fresh 90.16
10 Watermelons 87.75
11 Sweet potatoes 83.07
12 Cassava 76.68
13 Indigenous Pig meat 61.88
14 Bananas 61.64
15 Onions, dry 56.73
16 Cucumbers and gherkins 56.72
17 Cabbages and other brassicas 51.85
18 Coconuts 49.19
19 Apples 48.13
20 Eggplants (aubergines) 44.15
30
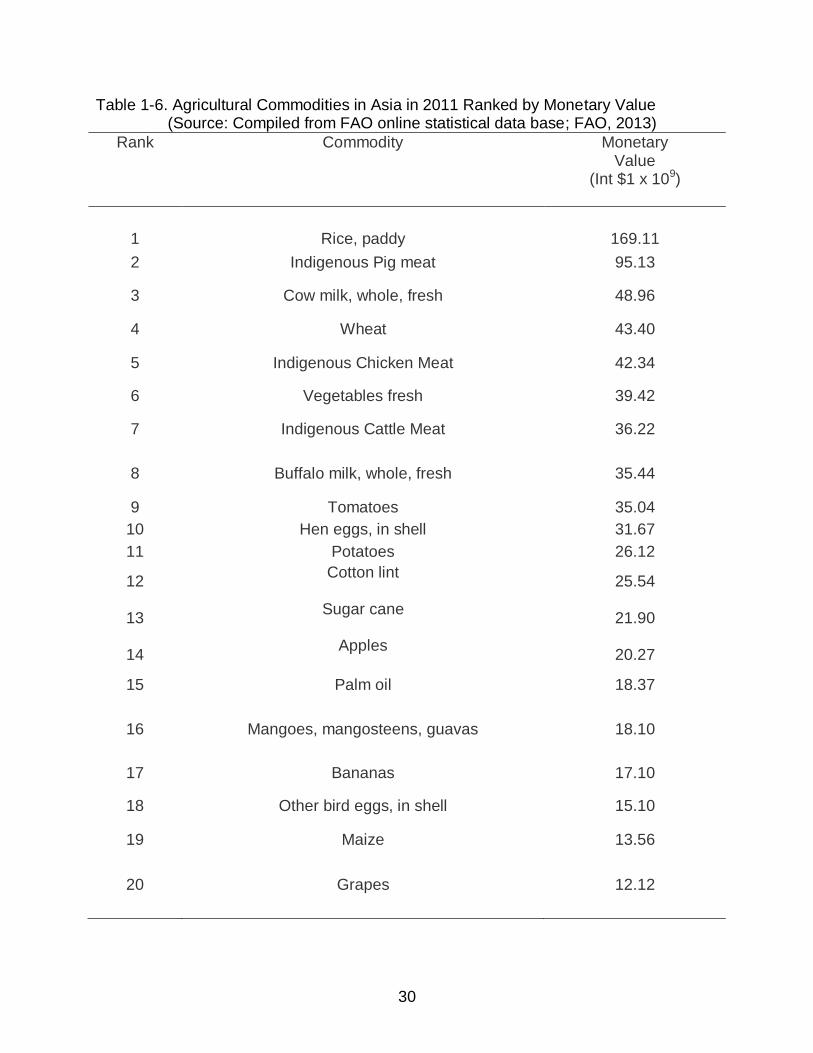
Table 1-6. Agricultural Commodities in Asia in 2011 Ranked by Monetary Value (Source: Compiled from FAO online statistical data base; FAO, 2013)
Rank
Commodity
Monetary Value
(Int $1 x 10⁹)
1
Rice, paddy
169.11
2 Indigenous Pig meat 95.13
3 Cow milk, whole, fresh 48.96
4 Wheat 43.40
5 Indigenous Chicken Meat 42.34
6 Vegetables fresh 39.42
7 Indigenous Cattle Meat 36.22
8 Buffalo milk, whole, fresh 35.44
9 Tomatoes 35.04
10 Hen eggs, in shell 31.67
11 Potatoes 26.12
12 Cotton lint
25.54
13 Sugar cane
21.90
14 Apples
20.27
15 Palm oil 18.37
16 Mangoes, mangosteens, guavas 18.10
17 Bananas 17.10
18 Other bird eggs, in shell 15.10
19 Maize 13.56
20
Grapes 12.12

31
Table 1-7. Agricultural Commodities in the Americas in 2011 Ranked by Production Quantity (Source: Compiled from FAO online statistical data base; FAO, 2013)
Rank
Commodity
Production Quantity
(1 x 10⁹ kg)
1
Sugar cane
972.68
2 Maize 438.38
3 Soybeans 223.70
4 Cow milk, whole, fresh 179.29
5 Wheat 110.35
6 Potatoes 41.56
7 Indigenous Chicken Meat 39.43
8 Rice, paddy 37.87
9 Oranges 36.15
10 Cassava 34.36
11 Indigenous Cattle Meat 30.29
12 Sugar beet 28.85
13 Bananas 27.86
14 Tomatoes 24.19
15 Sorghum 19.96
16 Indigenous Pig meat 18.03
17 Barley 16.63
18 Rapeseed 15.12
19 Grapes 15.11
20 Hen eggs, in shell 13.20

32
Table 1-8. Agricultural Commodities in the Americas in 2011 Ranked by Monetary Value (Source: Compiled from FAO online statistical data base; FAO, 2013)
Rank
Commodity
Monetary Value
(Int $1 x 10⁹)
1
Indigenous Cattle Meat
81.83
2 Soybeans 56.80
3 Indigenous Chicken Meat 56.17
4 Cow milk, whole, fresh 54.01
5 Maize 33.67
6 Sugar cane 31.18
7 Indigenous Pig meat 27.72
8 Wheat 15.54
9 Hen eggs, in shell 10.95
10 Rice, paddy 10.32
11 Tomatoes 8.94
12 Grapes 8.63
13 Cotton lint 8.23
14 Bananas 7.70
15 Oranges 6.98
16 Potatoes 6.51
17 Coffee, green 5.10
18 Indigenous Turkey Meat 4.39
19 Rapeseed 4.19
20
Apples
3.88
A careful review of Tables 1-1 through 1-8 reveals that cassava is not receiving
commensurate financial value for the quantity produced. Apart from Africa, other
regions of the world rewarded large quantities of cassava produced with low monetary
33
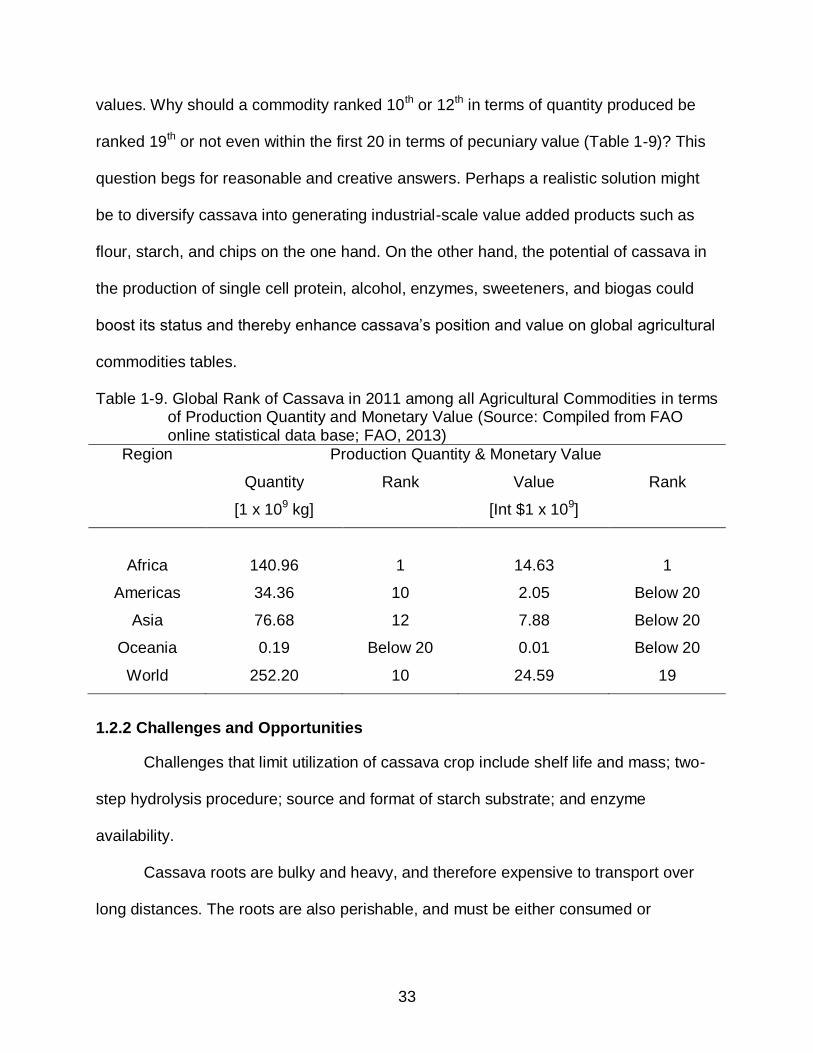
values. Why should a commodity ranked 10th or 12th in terms of quantity produced be
ranked 19th or not even within the first 20 in terms of pecuniary value (Table 1-9)? This
question begs for reasonable and creative answers. Perhaps a realistic solution might
be to diversify cassava into generating industrial-scale value added products such as
flour, starch, and chips on the one hand. On the other hand, the potential of cassava in
the production of single cell protein, alcohol, enzymes, sweeteners, and biogas could
boost its status and thereby enhance cassava’s position and value on global agricultural
commodities tables.
Table 1-9. Global Rank of Cassava in 2011 among all Agricultural Commodities in terms of Production Quantity and Monetary Value (Source: Compiled from FAO online statistical data base; FAO, 2013)
Region Production Quantity & Monetary Value
Quantity
[1 x 10⁹ kg]
Rank Value
[Int $1 x 10⁹]
Rank
Africa
140.96
1
14.63
1
Americas 34.36 10 2.05 Below 20
Asia 76.68 12 7.88 Below 20
Oceania 0.19 Below 20 0.01 Below 20
World 252.20 10 24.59 19
1.2.2 Challenges and Opportunities
Challenges that limit utilization of cassava crop include shelf life and mass; two-
step hydrolysis procedure; source and format of starch substrate; and enzyme
availability.
Cassava roots are bulky and heavy, and therefore expensive to transport over
long distances. The roots are also perishable, and must be either consumed or

34
processed within a few days after harvest. Transforming cassava root into value added
product such as glucose sweetener could alleviate this challenge.
A major limitation of conventional method of producing glucose sweetener is the
procedure of two separate operations called liquefaction and saccharification.
Liquefaction is the first stage whereby starch is gelatinized by heat treatment and
thermostable alpha-amylase enzyme partially hydrolyses the starch into maltodextrins.
Saccharification commences in the second stage where the partially hydrolyzed starch
is converted to glucose by the action of glucoamylase. This protocol requires more
process vessels, piping, and associated equipment; conditioning for enzyme systems;
and starch gelatinization is energy intensive. An advantageous alternative approach
would be to deploy alpha-amylase and glucoamylase enzymes simultaneously, and
carry out both liquefaction and saccharification processes inside the same reactor
vessel as a single unit operation. This option should be simpler, and more efficient. It is
termed synergism and is the hydrolysis technique investigated in this study.
Maize (corn) is the dominant raw material for global starch production (De Baere,
1999; Gordon, 1999; Swinkels, 1985), accounting for more than 80% of the total starch
processed (Johnson et al., 2005; De Braganca and Fowler, 2004; De Baere, 1999).This
has relegated other sources of starch such as cassava to the background. In the
conventional method of glucose sweetener production, starch is first extracted in the
pure form from the native raw material. Subsequently, the extracted starch is subjected
to hydrolysis to produce glucose. However, the starch extraction process is time,
energy, technology, labor and cost intensive; and therefore not feasible in most
developing nations. A more feasible alternative is to use the direct conversion method.

35
Direct conversion procedure involves hydrolyzing native starch in raw materials with
minimal value added history. Two approaches to the direct conversion technique were
investigated in this work. The first was to hydrolyze cassava flour. The flour was
produced from cassava chips that were dried with a solar-convection dryer developed at
the University of Florida (Schiavone et al., 2013). However, the cassava flour
accumulated some cost and value adding processes; but not to the extent of extracted
starch. The second approach investigated wet ground cassava root as substrate for
enzyme hydrolysis. This latter approach would appear to be the best and simplest
method over flour and starch because it accumulated the least cost and value adding
operations.
Enzymes are expensive. In 2011 a gram of alpha amylase could cost as much as
US $252. Worldwide enzyme sales were over $1.5 billion in 1998 (Beilen and Li, 2002).
This value is projected to rise to $7 billion in 2013 (ReportLinker, 2009). Because
culture medium and substrate are important factors in the synthesis of industrial
enzymes, the use of low cost substrates such as cassava peels and other biomaterials
or agricultural byproducts can help reduce the cost of sweetener production. Cassava
wastes such as peels are generated during the processing and production of numerous
cassava based food products such as chikwangue, farinha de mandioca, and gari. With
manual peeling, the peel can constitute 20 – 35 % of the total weight of the root
(Ekundayo, 1980). Therefore, enormous organic waste is generated from cassava
processing. This waste should be good feed stock for anaerobic digestion and
fermentation processes that could generate biogas and hydrolytic enzymes. (Adeniran
and Abiose, 2011; Silva et al., 2009; Cuzin et al., 1992). It will appear to be a win and

36
win again opportunity if cassava peel is digested to produce biogas that could be used
as a source of energy while extracting hydrolytic enzymes from the digestate at the
same time. This study explored both opportunities.
1.3 Objectives
The objectives of the study were to:
1. Demonstrate a cottage industry level process for the production of cassava flour from solar-convection dried cassava chips. The flour could be used for the manufacture of bread and other bakery products.
2. Demonstrate a cottage industry level process for the production of glucose sweetener from synergistic hydrolysis with commercial enzymes on the following substrates:
a) Commercially available refined cassava starch.
b) Flour produced from solar-convection dried cassava chips.
c) Freshly ground cassava root pulp.
The sweeteners would serve as sugar substitutes to consumers; and as
industrial ingredient for use in the beverage, confectionery, pharmaceutical and the
allied industries.
3. Estimate first-order kinetic parameters (rate constant along with the Arrhenius activation energy) from the enzyme hydrolysis of each substrate at two different temperatures.
4. Demonstrate anaerobic digestion of cassava waste by performing experiments and reporting performance indicators such as: methane yield, sCOD, pH, etc.
5. Isolate and determine the activity of enzymes from post anaerobic digestion broth.
The architecture of the entire scheme of study is presented in Figure 1-2.

37
Figure 1-2. Overview/Global Architecture of Scheme of Study
Peels
Package: Product
Clean Peeled Roots
Enzyme Biogas
Glucose Sweetener
Wet Slurry
Flour Chips
Chipping & Dicing, Drying; Grinding/Milling, Sieving
Package: Product
Synergistic Enzymatic Hydrolysis
Package: Product
Anaerobic Digestion Grating/Rasping
Package: Product Package: Product
Washing and Peeling of Cassava Roots

38
1.4 Organization of Dissertation
The work reported in this dissertation was presented in a series of self-contained
chapters as follows. Chapter 1: introduction; Chapter 2: literature review which
consisted of two parts. Part 1 dealt with cassava, its products and potential for enzyme
hydrolysis. Part 2 discussed the production of enzymes by submerged and solid- state
fermentations. Chapter 3 dealt with physical properties of cassava flour made from
solar-convection dried cassava chips. Chapter 4 reported on synergistic enzymatic
hydrolysis of cassava starch. Chapter 5 reported on experiments done on anaerobic
digestion of cassava waste for production of biogas and amylolytic enzymes
Chapters 3, 4, and 5 each began with a concise background that contained an
overview of the literature pertinent to that chapter, followed by methodology and results
of the work reported in that chapter. Each chapter serves as the basis for preparing a
manuscript suitable for submission to be published in a scientific journal.

39
CHAPTER 2 REVIEW OF LITERATURE
The subject of this dissertation project concerns the enzyme hydrolysis of
cassava starch for conversion to glucose. Therefore a review of the literature was
undertaken in two parts.
PART 1: Cassava. Its origin, classification, agro-climatic conditions, propagation,
production, utilization, packaging, etc.
PART 2: Production of enzymes by submerged and solid-state fermentations.
2.1 Part 1: Cassava
2.1.1 Origin and Distribution
Numerous reports have supported the view that cassava originated in South
America (Clement et al., 2010; Nassar and Ortiz, 2010; Léotard et al., 2009; Allem,
2002; Olsen and Schaal, 2001, 1999; FAO, 1990; Fauquet and Fargette, 1990;
Balagopalan et al., 1988; Lancaster et al., 1982; Okigbo, 1980; Coursey and Haynes,
1970, Rogers, 1965, Chadha, 1961). Cassava is said to have been domesticated as far
back as 4000 BC. By 1500 AD, Portuguese explorers cultivated cassava plantations in
South America. The Portuguese introduced cassava into Congo river basins of Africa
around 1558 in the 16th century; into Java in 1810; India in 1840; and Singapore and
Malaysia in 1850 (FAO, 1990; Fauquet and Fargette, 1990; Balagopalan et al., 1988;
Cock, 1985; Lancaster et al., 1982; Hohnholz, 1980; Okigbo, 1980). Today, Cassava is
widely distributed and cultivated in most tropical and sub tropical regions of planet earth.
In the year 2011, one hundred countries in the world cultivated cassava (FAO, 2013).

40
2.1.2 Classification
There has been ongoing scientific debate about the botanic classification and
domestication of cassava. On the one hand, there is the view that cassava emanated as
a hybridization of several species (Ugent et al., 1986, Rogers and Appan, 1973; Rogers,
1965). On the other hand, cassava is postulated to have a sole progenitor (Léotard et
al., 2009; Allem, 2002; Olsen and Schaal, 2001; Roa et al., 2000; Olsen and Schaal,
1999; Allem, 1994). Allem (1994) argued the recognition of three subspecies viz:
Manihot esculenta esculenta; Manihot esculenta peruviana; and Manihot esculenta
flabellifolia. Manihot esculenta esculenta comprises the domesticate and includes all
cultivars in cultivation. Manihot esculenta Crantz belongs to the family Euphorbiaceae
and is the flagship of cultivated cassava crop. This family is generally divided into two
main groups; the bitter or toxic variety and the sweet or non toxic variety (Elias et al.,
2004; Nye, 1991). The bases for classification have ranged from subjective opinions
about organoleptic tastes to objective quantifiable cyanide content.
Scientific reports have correlated bitter cassava with high cyanogenic potential
(Pereira et al., 1981; Sinha and Nair, 1968). It was reported that the ratio of total
cyanide in the peel to that in the parenchyma is low for bitter cassava varieties and high
for the sweet varieties. In other words, in “sweet cassava”, the linamarin concentration
of the peel is considerably higher than the linamarin concentration of the parenchyma
whereas in “bitter cassava”, linamarin concentration is more evenly distributed
throughout the entire root (Dufour, 2007, 1988; Gomez et al. 1985). Consequently,
sweet cassava with high cyanogenic potential and bitter cassava with low cyanogenic
potential have been found (Bokanga, 1994 b; Sinha and Nair, 1968). There is little
correlation between the cyanogenic content of the peeled root and the leaves. The latter

41
tend to be high in cyanogens in both low (sweet) - and high (bitter) -cyanogenic cultivars
(Gomez et al. 1985). Furthermore, it was also reported that there is no strong
morphological relationship established between cyanogenic potential and other traits
(Mahungu, 1994; Nye, 1991; Rogers, 1965). Therefore, using sensory taste to
determine cynogenic potential may be misleading as there is considerable overlap
between the cyanide content of bitter and sweet classes. This was demonstrated by
Coursey (1973). By graphically representing the results of Sinha and Nair (1968),
Coursey (1973), clearly illustrated the overlapping of cyanide content of Sweet, Non-
bitter, Bitter, and Very bitter cassava varieties; which were respectively (in ppm HCN [or
mg HCN/kg]): 40 to 130, 30 to 180, 80 to 412.5, and 280 to 490 (Okigbo, 1980).
Nevertheless, some criteria have been used to distinguish between bitter and sweet
cassava varieties.
In one characterization arising from a survey within the framework of the
Collaborative Study of Cassava in Africa (COSCA), the sweet non toxic cassava
varieties were defined as those which can be eaten raw or after simple boiling; while the
bitter toxic varieties were those that must be processed adequately before consumption
(Nweke and Bokanga, 1994). This classification has been echoed by others (Clement et
al., 2010; Wilson and Dufour, 2002; Mckey and Beckerman, 1993). Bolhuis (1954)
noted that Koch (1933) was the author who tried to classify cassava roots according to
their toxicity (cyanide content). In that work, three levels of classification were proposed
(Tewe, 2004; Balagopalan et al., 1988; Okigbo, 1980; Coursey, 1973; Bolhuis, 1954;
Koch, 1933):
Innocuous: Less than 50 mg HCN per kg of fresh peeled root.
Moderately poisonous: 50 to 100 mg HCN per kg fresh peeled root.

42
Dangerously poisonous: More than 100 mg HCN per kg fresh peeled root.
It should be noted that this classification was based on the premise that 50 to 60
mg HCN is the theoretical lethal dose for an adult weighing 50 kg (Boorsma, 1905).
However, citing Rosling (1988), Lynam (1994) noted that up to 100 mg HCN equivalent
per day can be detoxified by the body under normal dietary circumstances. Based on
the foregoing, some workers now classify sweet cassava varieties as those with low
cyanogenic potential defined as having less than 50 mg HCN equivalent per kilogram of
fresh peeled root, and bitter cassava varieties as those with more than 50 mg HCN
equivalent per kilogram of fresh peeled root (Clement et al., 2010; Elias et al., 2004;
Wilson and Dufour, 2002). Other workers have used 100 mg HCN equivalent per
kilogram of fresh peeled root to define the limit of low cyanogenic potential (Dufour,
2007; Dixon et al., 1994). On the other hand, World Health Organization (WHO)
standard (Codex Alimentarius Standard) for the total hydrocyanic acid content of edible
cassava flour is 10 mg/kg maximum (FAO/WHO, 1995).
2.1.3 Agro Climatic Conditions
There is a range of agro climatic conditions conducive for the production of
cassava. The crop is suitably cultivated in the areas between 30 o North and 30 o South
of the equator; at elevations from sea level to 2,500 meters and from areas with as little
as 500 mm of rainfall, to tropical rain forest zones with more than 6,000 mm of rain per
year. Cassava can adapt to soils pH of 3 to 9.5; temperatures between 8 and 33 o C;
and relative humidity of 15 % to near saturation at 90 % (Wilson and Dufour, 2002;
Consultative Group on International Agricultural Research [CGIAR], 1997; Cock, 1985;
Hohnholz, 1980; Lozano et al., 1980; Okigbo, 1980; Rogers, 1965). Cassava is noted to
perform poorly under flooded soil conditions and at temperatures below 17 o C or above

43
37 oC (El-Sharkawy, 2004; Balagopalan et al., 1988; Hohnholz, 1980). Conditions
reported for optimum performance of cassava include 1000 to 1500 mm of annual
rainfall, pH of 5 to 8, and temperatures between 25 o C and 30 o C (El-Sharkawy, 2004;
Cock, 1985).
2.1.4 Propagation
Cassava may be propagated by stem cuttings or seeds. Although seeds have
been used for propagation operations (Rajendran et al., 2005; Sambatti et al., 2001;
Rajendran et al., 2000; Iglesias et al., 1994), most farmers use stem cuttings for
multiplication and planting purposes (Ceballos et al., 2012; Iglesias et al., 1994; Kakes,
1990; Cock, 1985; Nartey, 1978; Chadha, 1961). Stem cuttings or stakes used for
propagation may vary between 15 and 30 cm in length (Ceballos et al., 2012; El-
Sharkawy, 2004; Hahn and Keyser, 1985). Each plating stake can have 5 to 11 nodes
and may be planted horizontally, inclined, or vertically on ridges or mounds formed over
shallow pits and troughs. Using different stake lengths of 6.25 cm, 16 cm and 25 cm, it
was shown that cassava can be cultivated at densities of 1000 to 4000 stakes per
hectare (Keating et al., 1988). However, the number of plants per hectare ranges
between 10000 and 15000 (Shetty et al., 2007).
2.1.5 Production
Cassava has emerged as one of the top twenty agricultural commodities in the
World. In terms of quantity produced, cassava has consistently ranked among the first
ten for the past consecutive twelve years (Table 2-1). Between 1999 and 2011, cassava
output worldwide increased by more than 48%, from 169781525 to 252203769 metric
tonnes (169.78 to 252.20 x 10⁹ kg) (Table 2-1). The increase in global output may be
attributed to improved varieties, better farming systems and increased cultivated land

44
Table 2-1. Cassava’s ranking among World Agricultural Commodities: 1999 to 2011 (Values were achieved, compiled, deduced and/or computed from FAO online statistical data base; FAO, 2013)
Year Production Quantity [1 x 10⁹ kg]
Production Quantity Rank
Monetary Value [Int $1 x 10⁹]
Monetary Value Rank
2011 252.20 10 24.59 19
2010 236.70 9 23.00 19
2009 235.45 8 22.89 19
2008 232.00 8 22.45 20
2007 226.42 9 21.64 20
2006 223.56 9 21.31 20
2005 205.64 10 19.51 20
2004 201.11 10 19.08 20
2003 190.82 9 18.22 20
2002 184.28 9 17.50 20
2001 181.92 9 17.35 20
2000 176.27 9 16.82 20
1999 169.78 9 16.18 20
areas (Phillips et al., 2004; Tewe, 2004; Cock, 1985). Under traditional farming
practices, cassava crop yield has been reported at 0.53 to 0.78 kg per plant (Wilson and
Dufour, 2002); and 5 to 20 tonnes per hectare (Tewe, 2004; Balagopalan et al., 1988;
Keating et al., 1988; Cock, 1985; Hahn and Keyser, 1985; Hahn, 1983; Amsterdam,
1980; FAO, 1977; Chadha, 1961). In 2011, the average yield in India was 36.4 tonnes
per hectare (Table 2-2). With modern farming techniques and inputs, yields over 60
tonnes per hectare may be normal (FAO, 1977). Cassava can produce 250 x 103
calories per hectare per day compared to 200 x 103 for maize (corn); 176 x 103 for rice;
114 x 103 for sorghum; and 110 x 103 for wheat (Coursey and Haynes, 1970).
The top countries that produce cassava in the world are shown in Table 2-2.
Nigeria is the world leader in cassava production. In 2011, Nigeria produced 52403500
metric tonnes (52.40 x 10⁹ kg) of cassava worth about Int $5.47 x 10⁹. This production

45
Table 2-2. Global Statistics on Cassava Production in 2011, by Country (Values were achieved, compiled, deduced and/or computed from FAO online statistical data base; FAO, 2013)
Country
Rank of Country in Cassava
production
Rank of Cassava
Among All the Crops Produced
in the Country
Production Quantity and Proportion
Production Value
(Int $1 x 10
9)
Area Harvested
[1 x 10⁶
Ha]
Yield [1 x 10
3
kg/Ha] Quantity
[1 x 10⁹ kg]
Proportion [%]
Nigeria 1 1 52.40 20.7 5.47 3.73 14.0 Brazil 2 5 25.44 10.0 1.32 1.74 14.6
Indonesia 3 2 24.00 9.5 2.45 1.18 20.3 Thailand 4 3 21.91 8.6 2.28 1.13 19.2
Democratic Republic of the Congo
5
1 15.56
6.1
1.61
2.17
7.1
Angola 6 1 14.33 5.6 1.49 1.07 13.3 Ghana 7 1 14.24 5.6 1.48 0.88 16.0
Viet Nam 8 3 9.87 3.9 1.03 0.56 17.6 India 9 20 8.07 3.2 0.84 0.22 36.4
Mozambique 10 1 6.26 2.4 0.65 0.97 6.4 Uganda 11 2 4.75 1.8 0.49 0.42 11.1 United
Republic of Tanzania
12
1 4.64
1.8
0.46
0.73
6.2
China 13 Below 20 4.51 1.7 0.42 0.27 16.3 Cambodia 14 2 4.36 1.7 0.45 0.20 21.2
Malawi 15 1 4.25 1.6 0.44 0.19 21.5 Cameroon 16 1 3.90 1.5 0.36 0.28 13.9
Benin 17 1 3.60 1.4 0.37 0.25 13.9 Madagascar 18 2 3.30 1.3 .34 0.36 8.9
Rwanda 19 2 2.57 1.0 0.26 0.20 12.3 Paraguay 20 4 2.45 0.9 0.13 0.18 13.5
Haiti 32 2 0.65 0.2 0.06 0.15 4.1 World 10 252.20 100.0 24.59 19.64 12.8
quantity accounted for 20.7% of the global output. The production quantity was
harvested from 3737090 hectares of land at the yield rate of 14.0 tonnes per hectare.
Nigeria was followed by Brazil, second producer in the world; Indonesia, third; Thailand,
fourth; Democratic Republic of the Congo, fifth; Angola, sixth; and Ghana, seventh.
These seven nations accounted for more than 60% of global cassava output in
2011(Table 2-2). Haiti was ranked 32nd; having produced about 0.2% of world output.

46
However, Haiti is a major cassava producer in the South America and Caribbean region
(Henry and Hershey, 2002). In 2011, Haiti was the largest cassava producer in the
Caribbean, seconded by Cuba; and cassava was produced in the second largest
quantity in Haiti, exceeded only by sugar cane (FAO, 2013).
The 2011 statistics of global cassava output from the different regions of the
world is presented in Table 2-3. Africa dominated world production with 55.8% share
and 39 countries in active production. Asia followed with 30.4% and 14 countries. The
Americas was third with 35 countries producing 13.6% of world cassava output.
Oceania produced less than 0.1% of global cassava output in 2011 (Table 2-3).
Table 2-3. Global Statistics on Cassava Production in 2011, by Region (Values were achieved, compiled, deduced and/or computed from FAO online statistical data base; FAO, 2013).
Region
Global Rank of
Region in Cassava
Production
Rank of Cassava
Among All the Crops
Produced in the Region
Production Quantity and Proportion
Monetary Value
(Int $1 x 10
9)
Area Harvested
[1 x 10⁶
Ha]
Total No. of
Countries Quantity
[1 x10⁹ kg
]
Proportion [%]
Africa 1 1 140.96 55.8 14.63 13.04 39 Western 1 76.06 30.1 7.94 5.70 15
Middle 1 36.25 14.3 3.72 4.02 9 Eastern 2 28.64 11.3 2.97 3.30 15
Asia 2 12 76.68 30.4 7.88 3.91 14 South-
Eastern
3 63.79
25.2
6.59
3.39
10
Eastern Below 20 4.51 1.7 0.42 0.27 1 Southern Below 20 8.36 3.3 0.86 0.24 3
Americas 3 10 34.36 13.6 2.05 2.66 35 South 5 32.30 12.8 1.86 2.34 11
Caribbean 5 1.35 0.5 0.12 0.26 16 Central Below 20 0.70 0.2 0.06 0.05 8
Oceania 4 Below 20 0.19 < 0.1 0.01 0.01 12 Melanesia 13 0.1696 < 0.1 0.0171 0.01 4 Polynesia 6 0.0145 < 0.1 0.0013 0.000929 7
Micronesia 4 0.0089 < 0.1 0.0009 0.000738 1
World
10
252.20 100.0 24.59 19.64
100

47
2.1.6 Cassava Utilization
Constraints that limit the utilization of cassava crop include shelf life and mass.
Cassava roots are bulky and heavy commodities and therefore expensive to transport
over long distances. The roots are also extremely perishable, thus must be either
consumed or processed within a few days after harvest (Eneas, 2006; Balagopalan et
al., 1988; Kuppuswamy, 1961). To overcome these limitations, it may be prudent to
process cassava roots near the source of production; and into products that are less
bulky and with longer shelf life. Such products include chips, flour, and starch. Other
constraints on the utilization of cassava crop are associated with cost and technology as
highlighted below.
2.1.6.1 Starch
Cassava root is richly endowed with good quality starch to the extent of 30 – 32
wt% (Westby, 2002; International Starch Institute, 1999; O’hair, 1995; Balagopalan et
al., 1988). In addition, Cassava starch exhibits vital benefits and advantages over other
sources of starch such as wheat, corn, and waxy maize. The reported advantages and
benefits include the following (Central Tuber Crops Research Institute (CTCRI), 2010;
Juszczak et al., 2003; Larotonda, et al., 2003; Balagopalan, 2002; Lopez-Ulibarri and
Hall, 1997; Balagopalan et al., 1988; Franco et al., 1988; Vijayagopal et al., 1988;
Cereda and Wosiacki, 1985; Moorthy, 1985; Swinkels, 1985):
Unique functional and structural qualities.
Most bland flavor starch in the world. Does not have any mealy or undesirable starch flavors.
Gelatinizes and swells rapidly in a narrow temperature range.

48
The film has high: clarity, gloss, transparency, smoothness, continuity, flexibility, plasticity, folding endurance, internal strength, tensile strength, solubility, and rewetting capacity.
High paste viscosity, clarity, and stability.
High binding force and thickening power.
Good solubility and dry starch mobility.
Fair resistance to retrogradation and syneresis (weeping).
Less corrosion of granules from enzyme attacks.
Smoother granules structure than potato starch granules.
No foam building.
Easy extractability.
Complete and easier hydrolysis.
The imperfections that have been noted for cassava starch are instability of hot
gels and stickiness in cooking, fall in viscosity at elevated temperatures, and poor shear
resistance (CTCRI, 2010; Balagopalan et al., 1988; Swinkels, 1985).
Aschengreen et al. (1979) concluded: “… it is possible to obtain isomerization
results with syrups from tapioca, wheat, or potato starch, which are as good as those
obtained with maize starch based syrups or dextrose.” Despite the tremendous
advantages and quality of cassava starch, there is no significant application of its use in
the manufacture of sweeteners such as glucose and high fructose syrup; unlike the
case for corn starch. The limited application appears to be due to the extensive cost and
technological requirements associated with the industrial production of glucose and high
fructose syrup from corn (Johnson et al., 2009; Hoehn et al., 1983). The devices,
equipment, and techniques exploited for cooking/heating; clarification/filtration;
concentration/evaporation; refining; enrichment/fractionation; crystallization, dehydration
49
and other duties include the use of steam, extrusion, centrifugation, vacuum
evaporation, carbon/ion exchange chromatographic separation regimes, membrane
separation (ultra-filtration) reactors, encapsulation, spray dehydration, and various
proprietary polishing, decolorizing and other unit operations methodologies (Cavette,
2010; Wikipedia, 2010; PUROLITE, 2007; Akdogan, 1999; Lopez-Ulibarri and Hall,
1997; Prazeres and Cabral, 1994; Hanover and White, 1993; Darnoko et al., 1989;
Hoehn et al., 1983). These levels of input can surpass the financial and technological
capabilities of developing nations. Alternative, less cost and technology intensive
approaches to the manufacture of sweeteners from cassava starch are therefore
necessary; and will appear to be desired options for farmers in developing countries.
2.1.6.2 Flour
Cassava flour is more difficult to preserve in storage (Balagopalan et al., 1988).
This may be attributed to the hygroscopic nature of cassava flour (Kuppswamy, 1961),
which is more than those of cassava chips and starch (CTCRI, 1986). Cassava flour at
6.7% moisture content that was packed in cloth or gunny bags picked up additional 5%
moisture within 6 months of storage (Kuppswamy, 1961). Also, cassava flour is most
commonly infested by Tribolium castaneum insect species (CTCRI, 1986; McFarlane,
1982; Ingram and Humphries, 1972); Bacillus and Enterococci species of bacteria, and
Aspergillus fungi species (Ingram and Humphries, 1972). In one comparative evaluation
of packaging materials, polyethylene-lined jute bags were found to be most effective for
storage of cassava flour for up to 90 days (Etorma, 1936). Proper initial drying and the
maintenance of low moisture content with the use of water-vapor transmission resistant
packaging material have been suggested for the packaging of cassava flour in order to
prevent fungal or bacterial infection (Balagopalan et al., 1988; McFarlane, 1982). On the

50
other hand, cassava starch is thought to be neither attacked nor relished by the insects
(Nanda and Potty, 1985; MacFarlane, 1982). However, high density polyethylene
(HDPE) bags or polyethylene impregnated jute bags were recommended for the storage
of cassava starch for up to 180 days in order to determine moisture, viscosity, total
microbial count, and viable bacterial and fungal populations (Nanda and Potty, 1985).
2.1.6.2.1 Gluten free flour
Celiac disease is a condition in which the mucous membrane of the small
intestine of gluten intolerant people is damaged by gluten, resulting in inflammation and
poor absorption of nutrients and consequently, weight loss, diarrhea, anemia, fatigue,
flatulence, deficiency of folate and osteopenia (Blades, 1997; Thompson, 1997). The
disease was first described as “coeliac disorder” more than 100 years ago by Samuel
Gee (St. Bartholomew's Hospital Reports of 1888). Coeliac disorder was defined as a
chronic indigestion occurring in people of all ages, particularly in one to- five years old
children. Cassava is free from gluten (Rudrappa, 2013). Cassava flour and starch can
be used to formulate gluten-free breads (Ahlborn et al., 2005; López et al., 2004;
Sanchez et al., 2002; Eggleston et al., 1992). Eating gluten-free diet helps people with
celiac disease control the symptoms and prevent complications (Mayo Clinic, 2013).
2.1.6.3 Chips
The requirement to transform cassava tubers to dried chips may be justified on
account of the fact that the tubers are very perishable, bulky, and heavy. By
transforming into chips, it will be possible to transport cassava economically (by mass
and volume) to far distances on the one hand. On the other hand, cassava can then be
preserved for a prolonged period because the chips store better and longer than the
physiologically active tubers. Consequently, it will be possible to produce flour or starch

51
from the chips at any time; and from facilities/plants that are distant or remote from the
cassava crop production centers.
2.1.6.4 Packaging
A food package is expected to provide protection against humidity, light, oxygen,
moisture/condensation, heat/temperature, compression, shock, and vibration exposure
that are associated with not only the physical environment, but also the storage,
distribution and transportation system (Robertson, 2006; Soroka, 2002). Cassava
starch, flour and chips must be protected from unwanted interaction with the
environment. Water vapor transmission rate (WVTR) resistance is frequently the prime
consideration in protective packaging of cassava products (Balagopalan et al., 1988).
This is because to various degrees, starch, flour and chips but especially flour is
hygroscopic (CTCRI, 1986; Kuppuswamy, 1961). These products absorb moisture
freely and hence suffer from biochemical deterioration, and biological spoilage from
insect infestation, microbial growth, etc (Nanda and Potty, 1985; McFarlane, 1982;
Parker and Booth, 1979; Balagopal and Nair, 1976).
The relevant unit operations involved, as well as the equipment requirement for
the production of cassava products are identified in Figure 2-1 (Aso, 2004; Olomo and
Ajibola, 2003; Lopez - Ulibarri and Hall, 1997; Onabolu et al., 1998; Osunsami et al.,
1989).
2.1.7 Sweetener Production
Sweeteners are in great industrial demand for applications in the food,
confectionary, beverage, pharmaceutical, and allied industries (Kroger et al., 2006;
BeMiller, 2002; Coulston and Johnson, 2002; Vuilleumier, 1993; Balagopalan et al.,
1988). In these industries, sweeteners may be used to achieve, control, modify, or

52
Drying
Dewatering & Drying
Grinding/ Milling
Screening/Sieving Drying
Centrifugation & Decantation
Washing & Peeling
Reception Of Cassava Roots
Grating/Rasping Slicing/Dicing
Solubilization & Sieving
Pulverization & Screening/Sieving
Solubilization & Sieving
Centrifugation & Decantation
Drying
Pulverization & Screening/Sieving
Pulverization & Screening/Sieving
Figure 2-1. Schematic of Unit Operations for the Manufacture of Cassava Chips, Flour, and Starch. Equipment/Machinery Required for Cassava Chips, Flour & Starch Production include: Washers; Peelers; Chipping/Dicing Machines; Wet Grinding/Rasping Machines; Pressing Machines (to dewater); Dryers; Dry Grinding/Milling Machines; Dry Sieving Machines; Wet Mixing Machines (to Solubilize); Wet Sieving Machines; Centrifuges; Packaging Systems.
Fresh Roots
Peeled Roots
Wet Chips
Cassava Flour
Dry Chips Product
Ground Meal
Cassava Starch
Starch Milk
Wet Starch Cake
Dry Starch Cake
Cassava Flour Cassava Starch
Starch Milk
Wet Starch Cake
Dry Starch Cake
Wet Pulp
Dry Pulp

53
influence one or more of the following properties: viscosity, hygroscopicity, flavor, size,
adhesiveness, appearance, emulsification, etc (Coulston and Johnson, 2002;
International Pectin Producers Association (IPPA), 2001; McWilliams, 2001; Nabors,
2001; Hanover and White, 1993; Grenby, 1991; White and Lauer, 1990; Hoehn et al.,
1983; Palmer, 1975).
2.1.7.1 Historical overview
The genesis of nutritive sweeteners can be traced to 1811 when Kirchhoff, a
Russian chemist discovered that heating a starch-water mixture with dilute acid
produced a sugar-like sweet substance (Roberts et al., 1995; Balagopalan et al., 1988;
MacAllister, 1980). At the time it was thought that the substance was common sugar
(sucrose). However, in 1814 Saussure proved that the substance was indeed glucose
(Radley, 1940). In 1866, Dextrose was produced from corn starch; and in 1957,
enzymatic conversion of d-glucose to d-fructose was developed (Marshall and Kooi,
1957). Today, a gargantuan quantity of sweeteners is used to produce an astonishing
array of products in the bakery, beverage, confectionery, food, pharmaceutical, and
other industries. However, the growth in the sweetener arena benefited from and was
boosted by advances in other sectors such as starch crop agronomy, enzyme
engineering, and process technologies. Following is a brief sketch of the historical
background on the production of sweeteners and High Fructose Syrup or HFS
(Tomasik, and Horton 2012; Cavette, 2010; Wikipedia, 2010; BeMiller, 2009; Corn
Refiners Association, 2007; Ensymm Consulting on Biotechnology, 2005; Hein et al.,
2005; Medical Ecology, 2004; Olson, 1995; Roberts et al., 1995; Bagopalan et al., 1988;
MacAllister, 1980; Marshall and Kooi, 1957; Dale and Langlios, 1940).
Early 1700s. Device to shell corn (remove kernels from cob) was patented.

54
1811. GSC Kirchoff (a Russian chemist) produced dextrose and other starch derived sweeteners by heating potato starch in a weak solution of sulfuric acid. [Genesis of acid hydrolysis of starch?]!!
1841. The wet milling process (separation of starch from kernels) was patented by Orlando Jones.
1842. The first commercial wet milling plant in the USA was established by Thomas Kingsford.
1844. The first dedicated corn starch plant in the world operated in Jersey City, New Jersey, USA.
1866. Dextrose was produced from corn starch. This was the first corn sweetener produced by adapting the acid conversion of starch method.
1882. First manufacture of refined corn sugar (Anhydrous sugar).
1900. Introduction of thin boiling starches.
1915. Introduction of chlorinated starches.
1921. Introduction of crystalline dextrose hydrate.
1940. Dale and Langlois introduced enzyme conversion systems for syrups that were preliminarily made by acid hydrolysis. [Genesis of enzyme catalyzed hydrolysis of starch?]!!
1940s. Introduction of waxy maize starch.
Mid 1950s. Introduction of high-amylose corn starch. Development of various corn sweeteners; Introduction of Maltodextrins and low DE (Dextrose Equivalent) syrups.
1957. Richard O Marshall and Earl P Kooi developed the enzymatic method of converting d-Glucose to d-Fructose.
1967. First commercialization of batch process enzyme catalyzed High Fructose Syrup (HFS) production; at 15% Fructose content.
1968. First commercial shipment of enzyme catalyzed HFS production; at 42% Fructose content.
1972. A continuous method of enzyme catalyzed starch conversion process was introduced.
1975-1985. HFS became the sweetener of choice; and was used extensively by the processed foods and soft drinks industries.

55
1996. About 11.4 billion kilograms of corn were converted to corn syrup and other sweeteners; accounting for over 55% of the nutritive sweetener market in the USA.
2.1.7.2 Acid or enzyme hydrolysis
Depending on the type of sweetener desired (glucose or fructose for example),
production may require two or three process steps; excluding downstream processing.
Basically starch is hydrolyzed to glucose in two steps (liquefaction and saccharification);
and then the glucose is transformed by isomerization into fructose (Aschengreen, 1975;
Johnson et al., 2009). Starch hydrolysis may be achieved with the use of acids and or
enzymes. Acid hydrolysis is often avoided because of several disadvantages such as
low yield, extensive product purification and equipment demands, destruction of starch
macromolecules, discoloration and product contamination, charring and dehydration
reactions, and the toxic, erosive and hazardous nature of all acids (Aschengreen, 1975;
Heitmann and Mersmann, 1997; Johnson et al., 2005; Srinorakutara et al., 2006). For
these reasons, the work reported here was conducted with enzyme hydrolysis.
2.1.7.3 Amylolytic enzymes
Enzymes employed in industrial hydrolysis of starch have been noted to be the
second largest consumer of the world’s enzyme output (Satyanarayana et al., 2004).
The glucose producing enzymes alone (the Amylases such as α-amylase,
glucoamylase), account for up to 33% of the market share (Nguyen et al., 2002).
Generally, the world’s industrial enzyme market has steadily increased over the past
decades. The market value rose from $180 million in 1960 to $817 million in 1985
(Enzymes used in food industry, 2011). In 1998, worldwide enzyme sales were over
$1.5 billion (Beilen and Li, 2002). This value is projected to rise to $7 billion in 2013
(ReportLinker, 2009). Because culture medium and substrate are important factors in

56
the synthesis of industrial enzymes, the use of low cost substrates such as cassava
peels and other biomaterials/agricultural byproducts can help reduce the cost of
sweetener production (Kar et al., 2010; Roses and Guerra, 2009; Silva et al., 2009;
Rajagopalan and Krishnan, 2008; Spier et al., 2006; Ayerno et al., 2002; Pandey et al.,
2000 a). In addition, the onsite production of such enzymes will obviate transportation
and associated logistical costs.
2.1.7.4 Synergistic and direct methods of glucose sweetener production
Perhaps the two major constraints to conventional method of glucose production
are the two-step liquefaction cum saccharification procedure, and starch extraction
process. The two step procedure requires that liquefaction be carried out first, followed
by saccharification. This protocol is inefficient in use of resources: process vessels,
piping, and associated equipment, enzyme conditioning, etc. Similarly, the starch
extraction is time, energy and labor intensive. It would be advantageous if liquefaction
and saccharification processes can be combined as a single unit operation, inside one
reactor vessel; and if minimally processed starch source such as fresh cassava root is
used as the substrate. The former is called synergism and the latter, direct conversion.
Some authors have tried to study these phenomena. Gauss et al., (1976) patented a
process for alcohol production by simultaneous saccharification and fermentation of
cellulosic materials. Arasaratnam and Balasubramaniam (1993), observed that
synergistic hydrolysis of dry milled starch was more efficient than wet milled starch.
Linko and Javanainen (1996) claimed 98% yield of lactic acid when 130 g/L starch was
simultaneously liquefied, saccharified and fermented. Kearsley and Nketsia-Tabiri
(1979) performed direct hydrolysis of native starches in grains, roots and tubers and

57
reported that unprocessed native starches compared favorably with commercial
starches, especially in total starch conversion.
However, little work has been reported in the literature on direct conversion
techniques coupled with the synergistic procedure, particularly where glucose
sweetener is the desired end product. Most of the reported work was done for the
production of alcohol or lactic acid where a reducing sugar, such as glucose, is a
transition item to be fermented to the desired end product. The work undertaken in this
study was an attempt to combine both direct conversion and synergistic techniques in
the production of glucose sweetener, using cassava substrates as the raw materials
source. Further objectives included determination of Arrhenius type reaction kinetics:
rate constant and activation energy of each substrate at two different temperatures.
2.1.8 Starch Chemistry
Starch, with the chemical or molecular formula [(C6H10O5) n] is a polysaccharide
carbohydrate composed of glucose monomer units that are joined by glycosidic bonds.
Starch occurs widely in plant tissues in the form of storage granules in fruits (banana,
breadfruit), roots (cassava, arrowroot), seeds (corn/maize, rice and wheat), tubers (yam,
potato), stem pith (sago) and other parts (Buleon and Colonna, 2007; Eliasson, 2004;
Jane et al., 1994; Jenner, 1982). Starch contributes 50–70% of the energy in the human
diet (Copeland et al., 2009), and is the principal components of such staple foods like
beans, bread, and pasta products (Wang et al., 1998). Pure starch has an auto-ignition
temperature of 410 o C; gelatinization temperature of 60 o C – 80 o C; density of about
1.5 g/cm3; is white, odorless, tasteless, insoluble in cold water or alcohol; and is
composed of two major molecules known as amylose and amylopectin (Encyclopedia
Britannica: http://www.britannica.com/EBchecked/topic/563582/starch [Accessed

58
10/27/2013]; Water Structure and Science:
http://www.lsbu.ac.uk/water/hysta.html#r1758 [Accessed 10/27/2013]; Wikipedia:
http://en.wikipedia.org/wiki/Starch [Accessed 10/27/2013]; Copeland et al, 2009; Yuryev
et al., 2007) . Figure 2-2 illustrates an overview of the structure of starch granule.
Figure 2-2. An Overview of the Structure of Starch Granule. Source: Purdue University, http://www.cfs.purdue.edu/class/f&n630/pdfs/Starch_yao.pdf [Accessed 10/30/2013]
Depending on botanical source, starch generally may have crystallinity of 15 % to
45 %, granule size of less than 1 μm to more than 100 μm and be composed of 17 % to
25% amylose and 75 % to 83% amylopectin by weight (Perez and Bertoft, 2010;
Charles et al., 2004; Lindeboom et al., 2004; Bahnassey and Breene, 1994). However,

59
waxy starches could have amylopectin contents of over 99% (Bahnassey and Breene,
1994). The structure of starch (Figure 2-2) and the methods of studying it have been
reported by many authors (Blazek and Gilbert, 2011; Lopez-Rubio and Gilbert, 2009;
Belton, 2007; Limbach and Kremer, 2006; Sanguansri and Augustin, 2006; Ubbink and
Mezzenga, 2006; Lindeboom et al., 2004; Molinero et al., 2004; Donald et al., 2001;
You et al., 1999; Jenkins and Donald, 1996; Aberle et al., 1994; Jenkins et al., 1993;
Hizukuri, 1985; Blanshard et al., 1984; Rosenthal et al., 1974). Starch has varied utilities
in the paper, textile, pharmaceutical, bioplastics, and oil drilling and other industries. It is
the source of energy and carbon in food and feed; used for texture and functionalities in
processed foods; and serves as feed stock for sweetener and ethanol production.
2.1.8.1 Amylose
Amylose is a linear molecule composed of mostly α (1 → 4) linked D-glucopyranosyl
units. The 1-carbon on one glucose molecule is linked to the 4-carbon on the next
glucose molecule giving rise to (α (1→ 4)) bonds or linkages. However, recent studies
are revealing that amylose contains slight degree of branching with α (1 → 6) linkage
(Hoover, 2001; Takeda et al., 1992; Hizukuri et al., 1981). Amylose has a packed
structure with propensity to retrograde. With its low degree of branching, amylose easily
forms insoluble semi-crystalline aggregates of tough gels and strong films that are
resistant to digestion. Amylose influences stickiness, texture, water absorption capacity
and the digestibility of processed foods (Copeland et al., 2009). It is reported that
amylose is positively correlated to hardness and gumminess of starch gels (Sandhu and
Singh, 2007). Figure 2-3 represents the structural formula and linear profile of amylose.
Some amylose properties of the starches from cereal, legume and root and tuber crops
are presented in Table 2-4.
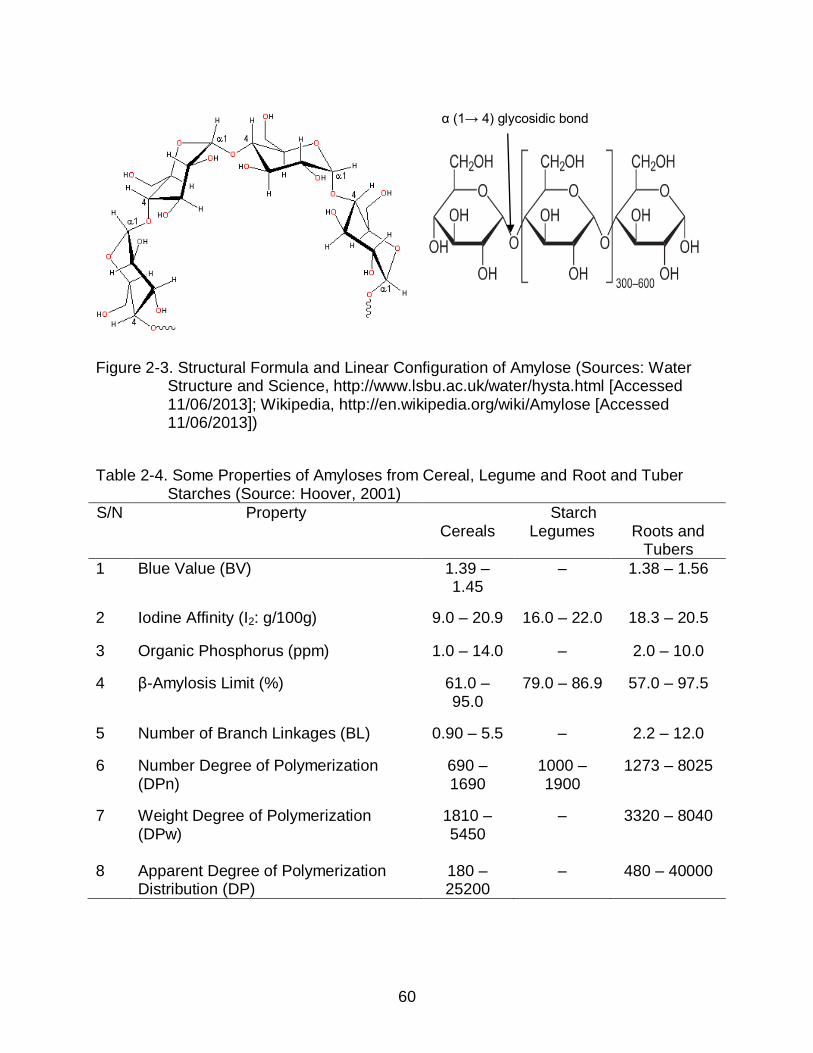
60
Figure 2-3. Structural Formula and Linear Configuration of Amylose (Sources: Water Structure and Science, http://www.lsbu.ac.uk/water/hysta.html [Accessed 11/06/2013]; Wikipedia, http://en.wikipedia.org/wiki/Amylose [Accessed 11/06/2013])
Table 2-4. Some Properties of Amyloses from Cereal, Legume and Root and Tuber
Starches (Source: Hoover, 2001)
S/N Property Starch Cereals Legumes Roots and
Tubers
1 Blue Value (BV) 1.39 – 1.45
– 1.38 – 1.56
2 Iodine Affinity (I2: g/100g) 9.0 – 20.9 16.0 – 22.0 18.3 – 20.5
3 Organic Phosphorus (ppm) 1.0 – 14.0 – 2.0 – 10.0
4 β-Amylosis Limit (%) 61.0 – 95.0
79.0 – 86.9 57.0 – 97.5
5 Number of Branch Linkages (BL) 0.90 – 5.5 – 2.2 – 12.0
6 Number Degree of Polymerization (DPn)
690 – 1690
1000 – 1900
1273 – 8025
7 Weight Degree of Polymerization (DPw)
1810 – 5450
– 3320 – 8040
8 Apparent Degree of Polymerization Distribution (DP)
180 – 25200
– 480 – 40000
α (1→ 4) glycosidic bond
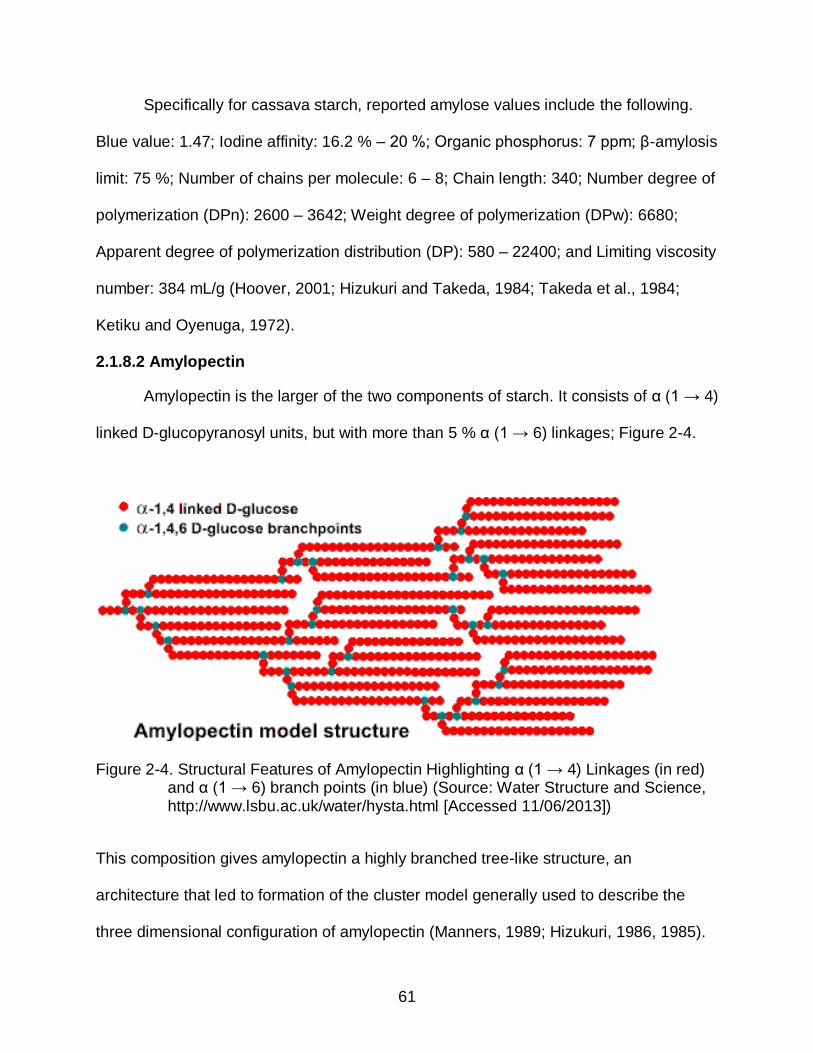
61
Specifically for cassava starch, reported amylose values include the following.
Blue value: 1.47; Iodine affinity: 16.2 % – 20 %; Organic phosphorus: 7 ppm; β-amylosis
limit: 75 %; Number of chains per molecule: 6 – 8; Chain length: 340; Number degree of
polymerization (DPn): 2600 – 3642; Weight degree of polymerization (DPw): 6680;
Apparent degree of polymerization distribution (DP): 580 – 22400; and Limiting viscosity
number: 384 mL/g (Hoover, 2001; Hizukuri and Takeda, 1984; Takeda et al., 1984;
Ketiku and Oyenuga, 1972).
2.1.8.2 Amylopectin
Amylopectin is the larger of the two components of starch. It consists of α (1 → 4)
linked D-glucopyranosyl units, but with more than 5 % α (1 → 6) linkages; Figure 2-4.
Figure 2-4. Structural Features of Amylopectin Highlighting α (1 → 4) Linkages (in red) and α (1 → 6) branch points (in blue) (Source: Water Structure and Science, http://www.lsbu.ac.uk/water/hysta.html [Accessed 11/06/2013])
This composition gives amylopectin a highly branched tree-like structure, an
architecture that led to formation of the cluster model generally used to describe the
three dimensional configuration of amylopectin (Manners, 1989; Hizukuri, 1986, 1985).

62
Figure 2-5 highlights representative structural formula and branching profiles of
amylopectin.
Figure 2-5. Structural Formula and Profiles of Amylopectin Branches and Clusters (Sources: Purdue University, http://www.cfs.purdue.edu/class/f&n630/pdfs/Starch_yao.pdf [Accessed 11/02/2013]; Water Structure and Science, http://www.lsbu.ac.uk/water/hysta.html [Accessed 11/06/2013]; Wikipedia, http://en.wikipedia.org/wiki/Amylopectin [Accessed 11/06/2013].
α (1→ 6) glycosidic bond
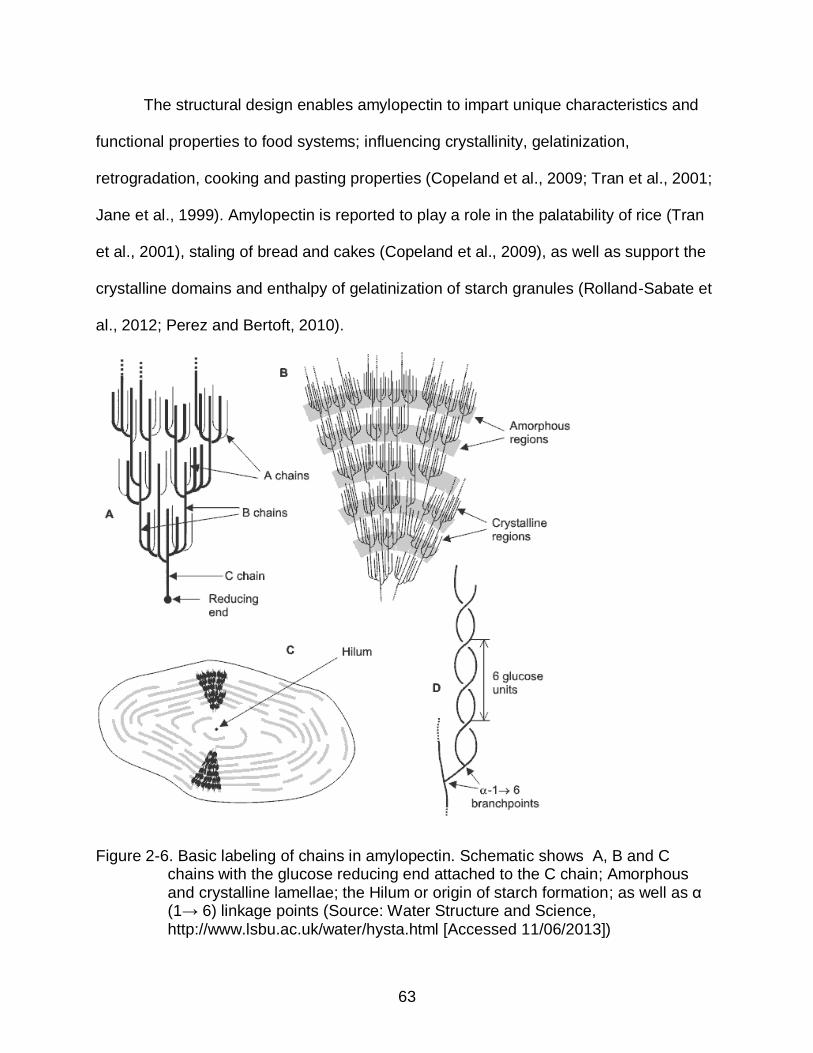
63
The structural design enables amylopectin to impart unique characteristics and
functional properties to food systems; influencing crystallinity, gelatinization,
retrogradation, cooking and pasting properties (Copeland et al., 2009; Tran et al., 2001;
Jane et al., 1999). Amylopectin is reported to play a role in the palatability of rice (Tran
et al., 2001), staling of bread and cakes (Copeland et al., 2009), as well as support the
crystalline domains and enthalpy of gelatinization of starch granules (Rolland-Sabate et
al., 2012; Perez and Bertoft, 2010).
Figure 2-6. Basic labeling of chains in amylopectin. Schematic shows A, B and C chains with the glucose reducing end attached to the C chain; Amorphous and crystalline lamellae; the Hilum or origin of starch formation; as well as α (1→ 6) linkage points (Source: Water Structure and Science, http://www.lsbu.ac.uk/water/hysta.html [Accessed 11/06/2013])

64
Amylopectin is composed of three classes of glucose chains or branches
designated as A, B and C chains (Copeland et al., 2009; Wang et al., 1998; Manners,
1989). As represented in Figure 2-6, the A chains are defined as unsubstituted; they
only bind to the B chains. On the other hand, B chains are said to be substituted in that
they can bind to other B chains or to the C chains. The C chains feature as the
backbone of amylopectin molecules. There is only one C chain per amylopectin
molecule, and it is the C chains that carry the reducing glucose (Figure 2-6A). Studies
have shown that A chains are the shortest, B chains the longest, while C chains are
intermediate in length (Hizukuri, 1986, 1985). Figure 2-7 depicts the building block
construction model for amylopectin.
Figure 2-7. A model of how the clusters of amylopectin build up the semi-crystalline granular rings. (a) 3D illustration of the building block structure of the cluster of amaranth amylopectin. The blocks are attached to a backbone forming a network of chains in the amorphous lamella. Numbers indicate types of building blocks with a corresponding number of chains. IB-CL = inter block chain length. (b) The same structure with the external chains added forming five double-helices symbolized as dark cylinders in the crystalline lamella. (c) Several hundred double helices from a large number of clusters interact to build up the crystalline lamella (Source: Perez and Bertoft, 2010).
Some amylopectin properties of the starches from cereal, legume and root and
tuber crops are presented in Table 2-5. Specific values for cassava amylopectin include
Blue value: 0.104; Iodine affinity: 0 % – 1.39 %; β-amylosis limit: 57 %; and Average

65
Table 2-5. Some Properties of Amylopectins from Cereal, Legume and Root and Tuber Starches (Source: Hoover, 2001)
S/N Property Starch
Cereals Legumes Roots and Tubers
1 Blue Value (BV) 0.049 – 0.441 – 0.104 – 0.245
2 Iodine Affinity (I2: g/100g) 0.39 – 4.63 1,0 – 5.3 0.06 – 1.1
3 Organic Phosphorus (ppm) 19 – 119 – 21 – 900
4 β-Amylosis Limit (%) 56 – 61 56 – 66.5 43.8 – 66.7
5 Average Chain length (CL) 19 – 32 20 – 34 19 – 44
chain length (CL): 21 – 27.6 (Hoover, 2001; Jane et al., 1999; Hizukuri, 1986, 1985;
Ketiku and Oyenuga, 1972). In Table 2-6 are presented some distinguishing properties
between amylose and amylopectin.
Table 2-6. Some Distinguishing Properties between Amylose and Amylopectin
S/N Property Unit Amylose Amylopectin Reference(s)
1 Chemical Interaction with Iodine
– Blue Color Purple; Reddish-Brown Color
Wang et al., 1998; Whistler and Daniel, 1984
2 Iodine Affinity % 19 % – 20 % < 0.2 % Wang et al., 1998; Rickard et al., 1991
3 General Structure
– Linear Branched Perez and Bertoft, 2010; Jane et al., 1999; Aberle et al., 1994; Rickard et al., 1991
4 Linkages – Mainly α[1 → 4]; Less than 0.5 % α[1 → 6]
α[1 → 4] with more than 5 % α[1 → 6]
Copeland et al., 2009; Eliasson, 2004

66
Table 2-6 Continued. Some Distinguishing Properties between Amylose and Amylopectin
S/N Property Unit Amylose Amylopectin Reference(s)
5 Molecular Weight g/mole 1 x 10⁵ – 1 x 10⁶
1 x 10⁸ Copeland et al., 2009; Wang et al., 1998
6 Degree of Polymerization (DP)
Glucose Units
1000 – 10000
Up to 1 x 10⁶ or more
Copeland et al., 2009; Manners, 1989
7 Retrogradation Time
Minutes – Days
Minutes – Hours
Hours – Days Copeland et al., 2009
8 β-Amylosis Limit % 73 – 95 55 – 60 Hoover, 2001; Takeda et al., 1986, 1984
9 Average Chain Length (Glucose Residues)
CL 100 – 10000 20 – 30 Rickard et al., 1991
10 Solubility in Water % Variable Soluble Rickard et al., 1991
11 Stability in Aqueous Solution
– Retrogrades Stable, may retrograde at high conc.
Rickard et al., 1991
12 Conversion to maltose by β-amylase
% ≈ 70 ≈ 50 Rickard et al., 1991
2.1.8.3 Cassava Starch
Starch is the principal component of cassava crop, especially the root. Cassava
starch is of great value as an important source of nutritional calories in both human food
and animal feed. Cassava starch is also finding utilities in the industrial sector. It is used
in the production of glucose and high fructose syrup, in the sizing of paper and textiles,

67
and in the manufacture of adhesives and alcohol (Tonukari, 2004; Rickard et al., 1991;
Chadha, 1961). Furthermore, cassava starch has been recommended for the
manufacture of extruded snacks, processed baby foods and as filler and bonding agent
in the biscuit and confectionery industries. These applications are possible because
cassava starch is reported to impart to the products, a fine structure, light color,
transparent look, smooth surface, and bland flavor (Seibel and Hu, 1994).
Cassava starch is increasingly being extracted and used in many countries. It is
a major source of starch in Brazil, China, India, Indonesia, Philippines and Thailand
(Moorthy, 2002; Rickard et al., 1991). Studies have demonstrated that there are
variabilities in the physicochemical properties of starch not only between different
botanical sources, but also within the same species (Rolland-Sabate et al., 2012;
Martinez-Bustos et al., 2007; Charles et al., 2004; Moorthy, 2002; Hoover, 2001;
Santisopasri et al., 2001; Defloor et al., 1998; Asaoka et al., 1991; Rickard et al., 1991).
However, Perez and Bertoft (2010), stated that the following facts have been
established for starch:
Occurrence of segments of amylopectin with a left-handed, parallel-strand double-helical structure.
Two types of stable arrangement of double helices can occur, as found in the A and B polymorphs.
Up to 200 double-helical segments are densely packed in platelet nanocrystals, which are polar and chiral.
The 1→ 6 branching does not preclude the formation of double helical arrangements.
The ‘amorphous’ amylopectin may contain a significant amount of double helical components.

68
Some of the important properties that have been reported for cassava starch are
presented in Table 2-7.
Table 2-7. Some Properties of Cassava Starch
S/N Property Unit Value Reference(s)
1
Amylose Content (Normal crop)
% 13.6 – 27
Sanchez et al., 2009; Ceballos et al., 2008; Charles et al., 2005 a, 2004; Hoover, 2001; Jane et al., 1999; Defloor et al., 1998; Asoaka et al., 1991; Olorunda et al., 1981; Ketiku and Oyenuga, 1972
Amylose Content (Mutated crop)
% 28 – 36
Rolland-Sabate et al., 2012; Ceballos et al., 2008
2 Ash % 0.02 – 0.49
Nwokocha et al., 2009; Asoaka et al., 1991; Rickard et al., 1991; Rosenthal et al., 1974; Rasper, 1969
3 Crude Fat % 0.08 – 1.54
Asoaka et al., 1991; Rickard et al., 1991; Soni et al., 1985; Rosenthal et al., 1974
4 Crude Protein % 0.03 – 0.61
Asoaka et al., 1991; Rickard et al., 1991; Rosenthal et al., 1974
Gelatinization
5 Start Tempt. (To) o C 54 –
64 Charles et al., 2004; Santisopasri et al., 2001; Bahnassey and Breene, 1994; Defloor et al., 1988
6 Peak Tempt. (Tp) o C 63 –
76 Charles et al., 2004; Santisopasri et al., 2001; Bahnassey and Breene, 1994; Defloor et al., 1988
7 Complete Tempt. (Tc)
o C 72 – 83
Charles et al., 2004; Bahnassey and Breene, 1994; Defloor et al., 1988
8 Enthalpy Change (∆H)
J/g 9 – 16.9
Rolland-Sabate et al., 2012; Charles et al., 2005 a, 2004; Santisopasri et al., 2001; Defloor et al., 1988

69
Table 2-7 Continued. Some Properties of Cassava Starch
S/N Property Unit Value Reference(s)
9 Granule Shape – Oval, Round, Spherical, Truncated
Ceballos et al., 2008; Soni et al., 1985; Ketiku and Oyenuga, 1970
10 Granule Size μm 2.4 – 32 Nwokocha et al., 2009; Ceballos et al., 2008; Santisopasri et al., 2001; Defloor et al., 1998; Jane et al., 1994; Asoaka et al., 1991; Ketiku and Oyenuga, 1970
11 Size of Amylopectin Cluster (Repeat Distance)
nm 9.1 Jenkins et al., 1993
12 Nitrogen % 0.008 – 0.013 Nwokocha et al., 2009; Defloor et al., 1998
13 Phosphorus % 0.0075 – 0.021
Asoaka et al., 1991; Soni et al., 1985; Rosenthal et al., 1974
14 Starch % 73.7 – 98.7 Valetudie et al., 1993; Rickard et al., 1991; Rickard and Behn, 1987; This Dissertation (Chapter 4; Table 4-5)
15 Total Pectin mg GA/kg
314 This Dissertation (Chapter 4; Table 4-5)
16 Crystallinity % 15.3 – 40 Rolland-Sabate et al., 2012; Hoover, 2001; Asoaka et al., 1991
Rheological (Pasting) Characteristics
17 Pasting Temperature (PT)
o C 58.8 – 74.6 Sanchez et al., 2009; Ceballos et al., 2008; Charles et al., 2005 a; Santisopasri et al., 2001; Rasper, 1969
18 Peak Viscosity (PV)
% RVA
24.2.0 – 142.6
Charles et al., 2005 a; Bahnassey and Breene, 1994; Deffenbaugh and Walker, 1989 a, 1989 b

70
Table 2-7 Continued. Some Properties of Cassava Starch
S/N Property Unit Value Reference(s)
18 Cont.
Peak Viscosity (PV) mPa.s 22.0 – 1505.0
Sanchez et al., 2009; Ceballos et al., 2008
19 Minimum or Hot Paste Viscosity at 95 o C (HPV)
% RVA
11.0 – 30.5
Charles et al., 2005 a; Bahnassey and Breene, 1994; Deffenbaugh and Walker, 1989 a
20 Final or Cold Paste Viscosity at 50 o C (CPV)
% RVA
12.5 – 127.0
Charles et al., 2005 a; Bahnassey and Breene, 1994; Deffenbaugh and Walker, 1989 a
21 Breakdown (PV – HPV)
% RVA
12.2 – 118.0
Charles et al., 2005 a; Bahnassey and Breene, 1994; Deffenbaugh and Walker, 1989 a
mPa.s 28.1 – 859.0
Sanchez et al., 2009
22 Setback (CPV – PV) % RVA
(– 18.8) to ( – 9)
Charles et al., 2005 a; Bahnassey and Breene, 1994; Deffenbaugh and Walker, 1989 a
mPa.s (– 702.0) to (273.0)
Sanchez et al., 2009
23 Consistency (CPV – HPV)
% RVA
0.5 – 102.4
Charles et al., 2005 a; Bahnassey and Breene, 1994; Deffenbaugh and Walker, 1989 a
mPa.s 0.0 – 620.0
Sanchez et al., 2009
24 Cooking Ability (Time to PV – Time to PT)
Min. 1.0 – 5.6 Sanchez et al., 2009; Bahnassey and Breene, 1994
25 Solubility at 35 o C – 95 o C
% 0.2 – 48 Sanchez et al., 2009; Ceballos et al., 2008; Charles et al., 2005 a; Moorthy, 2002; Hoover, 2001; Rickard et al, 1991

71
Table 2-7 Continued. Some Properties of Cassava Starch
S/N Property Unit Value Reference(s)
26 Swelling Power at 35 o C – 95 o C
g/g 0.8 – 71.0 Sanchez et al., 2009; Ceballos et al., 2008; Charles et al., 2005 a; Moorthy, 2002; Hoover, 2001; Rickard et al, 1991; Rosenthal et al., 1974
27 Paste Clarity % 12.5 – 96.6 Sanchez et al., 2009; Ceballos et al., 2008
28 Storage Modulus (G’) at 25 o C and [90 o C]
Pa 4970 – 19370 [471.7 – 1937]
Charles et al., 2004
29 Loss Shear Modulus (G’’) at 25 o C and [90 o C]
Pa 453 – 3060 [51.3 – 219]
Charles et al., 2004
30 Loss Tangent at 25 o C and [90 o C]
Tan δ
0.12 – 0.19 [0.10 – 0.13]
Charles et al., 2004
31 Iodine Affinity % 3.07 – 4.7 Jane et al., 1999; Rosenthal et al., 1974
32 Water Holding Capacity
% 71.8 Soni et al., 1991
2.1.8.4 Enzymatic Hydrolysis of Starch
Enzyme technologies are increasingly being used in numerous processes in the
pharmaceutical, fine chemical, food, brewing, fermentation, distilling, paper and textile
industries, as well as in clinical, medicinal and analytical chemistries (Pandey et al.,
2000 b; Solomon, 1978). One of the areas of high application is starch conversion
(Satyanarayana et al., 2004; Nguyen et al., 2002). It has been reported that enzyme
technology applied to the processing of starch provides higher yields, significant

72
improvements in product quality, as well as energy savings (Reichelt, 1983; Ueda,
1981). A variety of enzymes may be used for starch conversion. These include alpha
amylase, beta amylase, amyloglucosidase, isoamylase, pullulanase, etc. (Tomasik and
Horton, 2012; Uhlig, 1998; James and Lee, 1997; Roberts et al., 1995; Whitaker, 1994;
Fogarty, 1983; Lyons, 1983; Solomon, 1978; Fogarty and Griffin, 1973).
2.1.8.4.1 Alpha amylase ( -amylase: EC 3.2.1.1)
-amylase is alternatively known as α–1,4–D– glucan glucanohydrolase or
dextrogenic amylase. It is widely distributed in microorganisms such as bacteria and
fungi, and has an optimum pH range of 5 – 7. The structure of -amylase is shown in
Figure 2-8.
Figure 2-8. Structure of Alpha Amylase with calcium ion (khaki) and chloride ion (green)
visible. (Source: Wikipedia, http://en.wikipedia.org/wiki/File:Salivary_alpha-amylase_1SMD.png [Accessed 11/09/2013])

73
The -amylase is referred to as endo-acting enzyme in that it cleaves the
substrate links in the interior of the molecule, acting from any side of the chain. If starch
is treated with -amylase enzyme, the enzyme will randomly hydrolyze α (1 → 4)
glucosidic bonds in amylose and amylopectin, whereas α (1 → 6) linkages are not
attacked. This reaction gives rise to the formation of maltose, maltotriose, glucose, and
α-limit dextrins. The dextrins contain all the α (1 → 6) linkages (Fogarty, 1983; Solomon,
1978) and polysaccharide chain segments. Figure 2-9 illustrates the operating
mechanism of alpha amylase during the hydrolysis of starch.
=
Figure 2-9. Schematics of how -Amylase randomly splits Starch Molecules to liberate Glucose, Maltose and -Limit Dextrins.
α (1 → 4) links
α (1 → 6) link
α split
α split
α splits
Glucose units
Maltose units
-Limit Dextrins
Amylose
The Reducing Ends
Amylopectin

74
2.1.8.4.2 Beta amylase (β-amylase: EC 3.2.1.2)
The β-amylase enzyme is also known as α–1,4–D– glucan maltohydrolase or
saccharogenic amylase. This enzyme is widely distributed in plants like sweet potatoes
and soybeans, but can also occur as extracellular enzyme in microorganisms. It has the
optimum pH of about 4 – 5. The structure of β-amylase is represented in Figure 2-10.
Figure 2-10. Structural Features of Beta Amylase. (Source: Wikipedia, http://en.wikipedia.org/wiki/File:2xfr_b_amylase.png [Accessed 11/09/2013])
The β-amylase is an exo acting enzyme that hydrolyses every second α (1 → 4)
linkage from the non reducing end, splitting off two glucose units (maltose) at a time.
The β-amylase does not bypass or cleave α (1 → 6) linkages (James and Lee, 1997),
and therefore produces incomplete starch hydrolysis; resulting in 50 % – 60 %
conversion to maltose and formation of β-limit dextrins (Perez and Bertoft, 2010; Uhlig,
1998; James and Lee, 1997). The β-limit dextrins contain all unhydrolyzed α (1 → 6)

75
branches and other polysaccharide chain segments. Consequently, if starch is treated
with β-amylase, the alternate α (1 → 4) linkages of the starch molecules (amylase and
amylopectin) are quickly hydrolyzed to maltose (and perhaps some amounts of
maltotriose). The α (1 → 6) branches are not hydrolyze, but rather constitute part of the
β-limit dextrins; Figure 2-11.
=
Figure 2-11. Hydrolysis of Starch by β-Amylase to liberate Maltose and β-Limit Dextrins
2.1.8.4.2 Gamma amylase (γ-amylase: EC 3.2.1.3)
The gamma amylase is popularly known as glucoamylase. However, it is also
alternatively called α–1,4–D– glucan glucohydrolase, Exo-1,4-α-glucosidase, and
amyloglucosidase. The structure of glucoamylase is shown in Figure 2-12. The
glucoamylase enzyme is exo-acting and liberates glucose molecules from the non-
reducing chain ends of polysaccharides (Whitaker, 1994; Ueda, 1981). It has an
optimum pH range of about 3.5 – 5 and is found mostly in fungi.
α (1 → 4) links
α (1 → 6) link
β splits
β split
β splits
Amylose
The Reducing Ends
Amylopectin
β-Limit Dextrins
Maltose units

76
Figure 2-12. Structure of Glucoamylase (Source: bing.com/images, http://www.public.iastate.edu/~cfford/GAstructure.jpg [Accessed 11/09/2013])
Glucoamylase can cleave both α (1 → 4) and α (1 → 6) linkages; but the α (1 →
6) linkages are hydrolyzed more slowly. When starch is exposed to glucoamylase, the
glycosidic bonds (α (1 → 4), α (1 → 6)) are hydrolyzed consecutively (Fogarty, 1983;
Solomon, 1978) to release glucose molecules. Therefore, if incubated for sufficient
amount of time, the glucoamylase is able to completely hydrolyze starch (James and
Lee, 1997). A model for glucoamylase and its mechanism of hydrolysis of starch has
been proposed by the institute of food research in the United Kingdom; Figure 2- 13. In
this paradigm, glucoamylase is considered a multi-domain enzyme, consisting of

77
A B C
Figure 2-13. Glucoamylase Model and Mechanism of Starch Digestion. A). Proposed model of glucoamylase; B). Coupling of glucoamylase model with starch molecule; C). Locking/binding of glucoamylase model with starch chain ends and subsequent cleavage. (Source: Institute of Food Research, http://www.ifr.ac.uk/SPM/glucoamylase.html [Accessed 11/09/2013])
smaller starch-binding domain (SBD) which is attached to the larger catalytic domain
(LCD); Figure 2-13A. Complex formation with starch molecule is dominated by the SBD
with, the catalytic domain decorating the outside of the starch-SBD ring as illustrated in
Figure 2-13B. The nature of starch (amylose) – SBD complex suggests a role for the
SBD. The SBD is considered to recognize and dock onto the ends of amylose double
helices. This locks the otherwise mobile chain ends at the end of the helix in the vicinity
of the LCD (Figure 2-13C), facilitating binding and subsequent cleavage. When this
happens to consecutive α (1 → 4) bond and α (1 → 6) linkages, the result is complete
digestion of starch to glucose as represented in Figure 2-14.
SBD
LCD
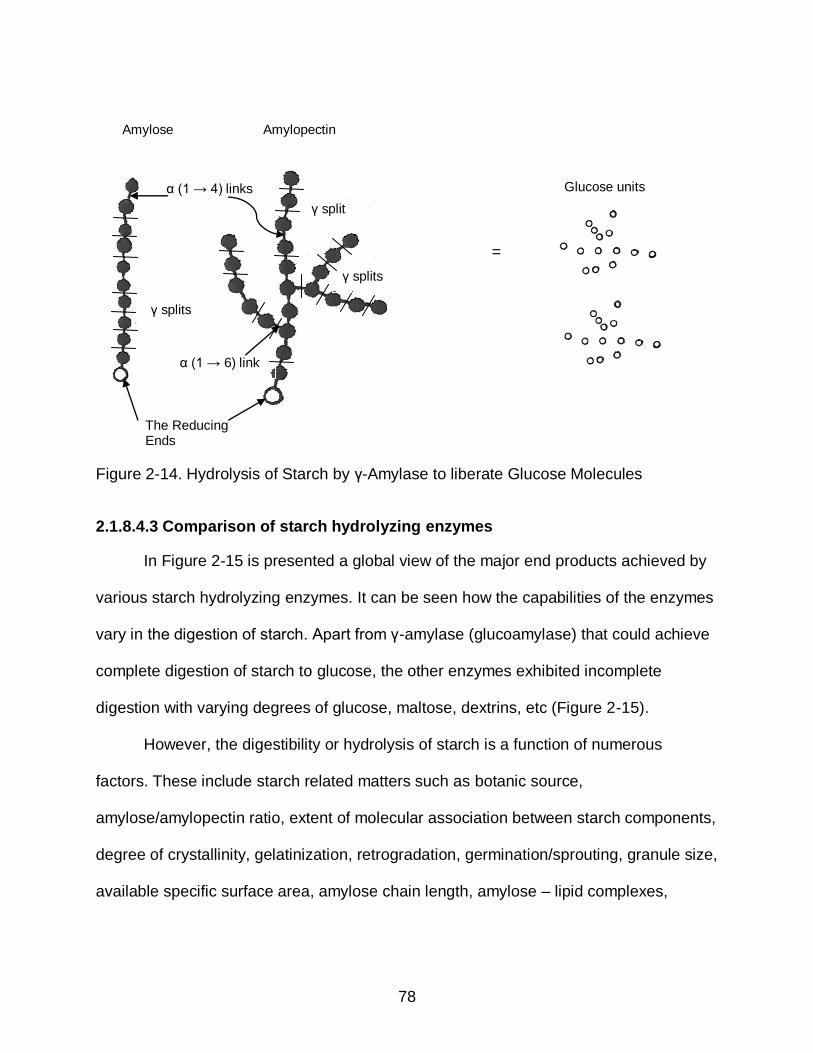
78
=
Figure 2-14. Hydrolysis of Starch by γ-Amylase to liberate Glucose Molecules
2.1.8.4.3 Comparison of starch hydrolyzing enzymes
In Figure 2-15 is presented a global view of the major end products achieved by
various starch hydrolyzing enzymes. It can be seen how the capabilities of the enzymes
vary in the digestion of starch. Apart from γ-amylase (glucoamylase) that could achieve
complete digestion of starch to glucose, the other enzymes exhibited incomplete
digestion with varying degrees of glucose, maltose, dextrins, etc (Figure 2-15).
However, the digestibility or hydrolysis of starch is a function of numerous
factors. These include starch related matters such as botanic source,
amylose/amylopectin ratio, extent of molecular association between starch components,
degree of crystallinity, gelatinization, retrogradation, germination/sprouting, granule size,
available specific surface area, amylose chain length, amylose – lipid complexes,
α (1 → 4) links
α (1 → 6) link
γ splits
γ split
γ splits
Amylose
The Reducing Ends
Amylopectin
Glucose units

79
Figure 2-15. Overview of the Pattern of Starch Digestion by major Starch Hydrolyzing Enzymes (Tomasik and Horton, 2012)
porosity, presence of activators/inhibitors, moisture content during heat treatment,
structural inhomogeneities and degree of integrity; as well as many other enzyme
associated issues (Chen et al., 2011; Copeland et al., 2009; Shariffa et al., 2009;
Jayakody and Hoover, 2008; Hoover and Vasanthan, 1994; Jood et al., 1988; Ring et
al., 1988; Hoover and Sosulski, 1985; Dreher et al., 1984; Fogarty, 1983; Snow and
O'Dea, 1981, Wiseman, 1973).

80
In general, it has been reported that ungelatinized root and tuber starches are
more resistant to enzyme hydrolysis than their cereal counterparts (Valetudie et al.,
1993; Rickard et al., 1991; Dreher et al., 1984; Ueda, 1981; Rasper et al., 1974; Leach
and Schoch, 1961). On the other hand, cassava starch was found to be the least
resistant to enzymatic digestion among the non-cereal starches (Valetudie et al., 1993;
Gorinstein and Lii, 1992; Rickard et al., 1991; Rasper et al., 1974), with digestibilities
reported to be comparable to those of corn starch (Ueda, 1981; Leach and Schoch,
1961). The activity of an enzyme on the digestibility of native (raw, ungelatinized)
starch is often expressed as the percentage of the activity of the enzyme on the native
starch as compared to the activity of the enzyme on the gelatinized starch. However, it
is difficult to make direct comparisons among the digestibilities of various starches
reported in the literature due to a number of reasons. The reasons among others
include differences in the type and sources of enzyme used, enzyme purity, enzyme
concentration, botanic sources of the starch, varietal differences of the starch; as well
as experimental conditions such as time of hydrolysis, pH, temperature, etc.
Nevertheless, an attempt has been made here to present some of the reported data on
the digestibility of native cassava starch in Table 2-8.
2.1.9 Cassava Toxicity
A major concern for the handling, consumption and use of cassava products is
their potential to engender cyanide poisoning. It was reported that diets high in cassava
led to increased levels of cyanide in the blood, and elevated concentrations of
thiocyanate in the urine (Delange et al., 1973; Osuntokun, 1973). The consumption of
cassava has also been associated with such diseases as TAN: tropical ataxic

81
Table 2-8. Degree of Hydrolysis of Native Cassava Starch Achieved with Various Enzymes and Operating Conditions S/N Starch
Conc. [%]
Type/Name of Enzyme
Enzyme Activity
Enzyme Conc.
Hydrolysis Tempt. [o C]
Hydrolysis pH
Hydrolysis Time [Hours]
Degree of Hydrolysis Achieved
Reference(s)
1 25 STARGEN 001TM 3736 units/g
1 % 35 5 – 6 24 36 % Shariffa et al., 2009
2 4 Bacillus subtilis -
amylase
2.8 μkat/g starch
37 6.7 24 44.0 % Valetudie et al., 1993
3 4 Porcine Pancreatic -amylase
2.8 μkat/g starch
37 6.7 24 52.9 % Valetudie et al., 1993
4 17 Bacterial -
amylase
3490 SKB units
37 5.2 36 57.5 % Franco et al., 1987
5 80 Glucoamylase from Rhizopus spp
10 mg/mL
55 4.8 2 14 – 16 Rickard and Behn, 1987
6 Glucoamylase from Endomycopsis fibuligera
1.71 units/mL
40 4.5 24 34.9 % Ueda and Saha, 1983
7 10 Bacterial -
amylase
10 EU/mg 30 6.4 48 4.7 % Maltose
Rasper et al., 1974
8 10 Bacterial -
amylase
10 EU/mg 30 6.4 24 2.5 % Maltose
Rasper et al., 1974
9 10 Fungal Glucoamylase
Grade II 30 5.0 48 4.1 % Maltose
Rasper et al., 1974
10 10 Fungal Glucoamylase
Grade II 30 5.0 24 2 % Maltose Rasper et al., 1974
11 20 Bacterial -amylase
16000 SKB 0.5 % 50 6.5 24 55.7 % Leach and Schoch, 1961
12 10 (Root Pulp)
Bacterial -
amylase (25%) Plus Fungal Glucoamylase (75 %)
5 x 10⁶ BAAU/g Plus 1000 AG/g
0.015 % 37 4.3 – 6.6 96 55 % This Dissertation; Chapter 4

82
neuropathy (Osuntokun, 1973; Osuntokun et al., 1970), endemic goiter (Bourdoux et al.,
1978; Ekpechi, 1973, 1967) and perhaps konzo (Tylleskar et al., 1992; Mlingi et al.,
1991). The source of these disorders is believed to be the cyanogenic potential of
cassava. The cassava crop is reported to accumulate two aliphatic cyanogenic
glucosides known as linamarin: 2(β-D-glucopyranosyloxy) isobutyronitrile, which is the
major glucoside in the plant, and to a lesser extent, a higher homologue of linamarin
called lotaustralin: 2(β-D-glucopyranosyloxy) 2-methylbutyronitrile (Cooke et al., 1978;
Zitnak et al., 1977; Nartey, 1968). The structures of these cyanogens are shown in
Figure 2-16. The biosynthesis pathway of linamarin with valine as the precursor is
presented in Figure 2-17.
A
B
Figure 2-16. Structures of the Aliphatic Cyanogenic Glucosides of Cassava. A:
Linamarin and B: Lotaustralin. (Sources: http://en.wikipedia.org/wiki/File:Linamarin_3D_sticks.png [Accessed 11/14/2013]; http://en.wikipedia.org/wiki/File:Lotaustralin_3D_sticks.png [Accessed 11/14/2013]; Nartey, 1968)

83
Figure 2-17. The Biosynthesis Pathway of Linamarin showing Valine as the Precursor
(Kakes, 1990).
Cassava is also known to harbor a β-glucosidase called linamarase, EC 3.2.1.21
also known as linamarin β-D-glucoside glucohydrolase (Ikediobi et al., 1980; Cooke et
al., 1978) and another catabolic enzyme, -Hydroxynitrile lyase, EC 4.1.2.37 (HNL,
acetone cyanohydrin lyase, or oxynitrilase) (Conn, 1994; Hughes et al., 1994; Conn,
1969). Linamarase is an enzyme that catalyzes the hydrolysis of the glucosides to
ultimately liberate hydrogen cyanide. The cyanogenic glucoside, linamarin, is thought to

84
be synthesized in the leaves and petioles and accumulated in the vacuoles (Selmar,
1994; Kakes, 1990), where it is separated from the enzymes; Figure 2-18.
Figure 2-18. The Separation cum Distribution of Linamarin and Linamarase in the Plant System (Kakes, 1990)
The linamarin is thereafter translocated to other parts of the plant via the phloem.
The peel of the root and the leaves are the main sinks for the cyanogenic glucosides
(Koch et al., 1994; Nambisan and Sundaresan, 1994; Pereira et al., 1981; de Bruijn,
1973; Nartey, 1968). Bokanga (1994 a) noted that the leaves including the petioles

85
possess the highest cyanogenic potential in a plant. However, it has been argued that
synthesis of linamarin does occur in the root also, and at rates comparable to those in
the leaves (White et al., 1994). In intact plants, the cyanogenic compounds and the
enzymes capable of hydrolyzing them are separated in different compartments, and
shielded by the cell walls and other cell components; Figure 2-18. However, if the plant
is physically injured or the cell wall becomes ruptured, the enzymes will make contact
with the glucosides thereby facilitating hydrolysis of the later and the subsequent
production of hydrogen cyanide. The mechanism of hydrolysis is demonstrated in
Figure 2-19 and briefly explained here.
A1
+
Linamarase
pH = 5.5
A2
+
A3
B1
Hydroxynitrile
Lyase
B2
+
B3
C
Figure 2-19. Mechanism of Hydrolysis of Cyanogenic Glucosides and Liberation of
Hydrogen Cyanide (Conn, 1994; Ikediobi et al., 1980; Meuser and Smolnik, 1980; Cooke, 1978)
pH > 5.0
pH < 5.0

86
The process is a two step reaction. First, linamarin, shown in Figure 2-19 A1 is
initially hydrolyzed by the β-glucosidase, linamarase, to form free glucose; Figure 2-19
A2 and the acetone cyanohydrin or 2-hydroxyisobutyronitrile identified by Figure 2-19
A3. This step is favored by pH of about 5.5 (Meuser and Smolnik, 1980). In the second
step, if the pH is alkaline or greater than 5, or the temperature is greater than 35 o C,
acetone cyanohydrins will dissociate spontaneously into hydrogen cyanide (HCN);
Figure 2-19 B2 (Dufour, 2007; Cooke, 1978) and acetone; Figure 2-19 B3 (Conn, 1994).
Otherwise, the reaction can be catalyzed by the second catabolic enzyme,
hydroxynitrile lyase to achieve the dissociation (White et al., 1998). Figure 2-19 C
illustrates the discussed phenomenon as applied to the hydrolysis of lotaustralin
(Ikediobi et al., 1980). Lotaustralin is the higher homologue of linamarin (Nartey, 1968).
Hydrogen cyanide (HCN) has a density of about 0.69 g/cm3; and the boiling and
freezing points of about 26 o C and –14 o C respectively. These properties enable HCN
to rapidly vaporize and dissipate at near room temperature. However, HCN is highly
toxic and poisonous. It inhibits cellular oxidative processes and therefore hazardous to
human and animal health if consumed. Because cassava roots and leaves are food and
feed items, they must be processed to reduce the content of poisonous cyanogens [the
cyanogenic glucosides and their hydrolysis products (cyanohydrins and free cyanide
ions)] to safe levels in the final products before consumption. The Codex Alimentarius
Commission requires that the total hydrocyanic content of edible cassava flour not
exceed 10 mg/kg (FAO/WHO, 1995).
2.1.10 Cassava Detoxification
The prime goal of detoxifying cassava is to render it safe for consumption,
whether as human food or animal feed. A number of processing techniques have been

87
used to achieve the detoxification of cassava products. Some of the methods used are
dehydration, boiling, baking, steaming, frying, soaking, fermentation, storage,
maceration, etc. (Nambisan, 1994; Oke, 1994; Balagopalan et al., 1988). These
processing techniques can and have been used in combinations. In Table 2-9 are
presented typical detoxification levels achieved with some of the methods. Among the
more efficient processes reported are combined grating/pounding,
fermentation/dewatering, followed by drying/roasting. These combinations have been
reported to detoxify cyanogens in cassava by 80 % to 100 % (Nambisan, 2011;
Mahungu et al., 1987).
Table 2-9. Detoxification of Cassava Components and Products by various Processing Methods
S/N Cassava Component
Process Applied Detoxification of Total Cyanogens Achieved
[%]
Reference(s)
Leaf and Leaf Products
1 Pounded; then boiled for 30 minutes
96.3 – 99.6 Ngudi et al., 2003
2 Pounded for 15 minutes 63.0 – 73.0 Bokanga, 1994 a
3 Pounded for 15 minutes, then Boiled for 15 minutes
99.1 – 99.5 Bokanga, 1994 a
4 Chopped and then boiled for 15 minutes
85.5 Nambisan, 1994
5 Crushed or pounded and then boiled
97.0 Nambisan, 1994
6 Wilting at 30 o C for 5 hours 63 Nambisan,
1994
7 Wilting at 30 o C for 12 hours 76 Nambisan,
1994
8 Chopped and then dried at 70 o C
30 Nambisan, 1994

88
Table 2-9 Continued. Detoxification of Cassava Components and Products by various
Processing Methods
S/N Cassava Component
Process Applied Detoxification of Total Cyanogens Achieved
[%]
Reference(s)
Leaf and Leaf Products
9 Kisamvu preparation: Pound fresh young leaves into small pieces
86.0 Gidamis et al., 1993
10 Kisamvu: Pound fresh young leaves into small pieces, boil for 30 to 45 minutes
95.7 Gidamis et al., 1993
11 Apical leaves are grated to a pulp 76.9 – 83.8 Dufour, 1989
12 Apical leaves are grated to a pulp, then cooked for 10 minutes
98.6 – 99.1 Dufour, 1989
13 Apical leaves are grated to a pulp, then cooked for 20 minutes
98.9 – 99.5 Dufour, 1989
14 Apical leaves are grated to a pulp, then cooked for 30 minutes
99.0 – 99.6 Dufour, 1989
15 Apical leaves are grated to a pulp, cooked for 30 minutes, then cooled to ready to eat
99.3 – 99.6 Dufour, 1989
16 Dried at 45 o C for 24 hours 74.0 – 80.1 Padmaja, 1989
17 Dried at 60
o C for 24 hours 78.7 – 85.9 Padmaja, 1989
18 Wilted at 30 o C for 16 hours then
Dried at 60 o C for 24 hours
87.3 – 91.7 Padmaja, 1989
19 Wilted at 30 o C for 16 hours,
Chopped to 1 cm length and then Dried at 60
o C for 24 hours
77.3 – 87.3 Padmaja, 1989
20 Dried at 75 o C for 24 hours 64.2 – 84.4 Padmaja, 1989
21 Mpondu: Blanch, pound, cook 95.7 Mahungu et al.,
1987
22 Dried leaves 3.7 Bourdoux et al., 1982
23 Mpondu preparation: Wash fresh leaves
6.9 Bourdoux et al., 1982
24 Wash fresh leaves, grind and boil for 15 minutes
94.6 Bourdoux et al., 1982

89
Table 2-9 Continued. Detoxification of Cassava Components and Products by various
Processing Methods
S/N Cassava Component
Process Applied Detoxification of Total Cyanogens Achieved
[%]
Reference(s)
Leaf and Leaf Products
25 Mpondu: Wash fresh leaves, grind and boil for 30 minutes
98.3 Bourdoux et al., 1982
26 Mpondu: Blanch for 10 minutes, mash/pound into a pulp
62.0 Maduagwu and Umoh, 1982
27 Mpondu: Blanch for 10 minutes, mash/pound into a pulp, boil for 80 minutes
92.3 Maduagwu and Umoh, 1982
Root and Root Products
28 Boiling 50 g pieces 25 Nambisan, 1994
29 Boiling 25 g pieces 50 Nambisan, 1994
30 Boiling 5 g pieces 75 Nambisan, 1994
31 Pieces are blanched (boiled for 5 to 10 minutes)
50.0 Nambisan, 1994
32 Peeled and boiled 69.8 Mahungu et al., 1987
33 Crushed and sun dried for 8 hours 96.8 – 98.5 Nambisan and Sundaresan, 1985
34 Sliced into 3 cm x 2 cm x 1 cm pieces and then boiled for 30 minutes
44.5 – 47.2 Nambisan and Sundaresan, 1985
35 Sliced into 3 cm x 2 cm x 1 cm pieces and then oven dried at 70
o
C for 24 hours
25.2 – 29.2 Nambisan and Sundaresan, 1985
36 Sliced into 3 cm x 2 cm x 1 cm pieces and then baked at 110
o C
for 20 minutes
12.9 – 15.0 Nambisan and Sundaresan, 1985
37 Sliced into 3 cm x 2 cm x 1 cm pieces and then steamed in a pressure cooker for 20 minutes
13.5 – 18.3 Nambisan and Sundaresan, 1985

90
Table 2-9 Continued. Detoxification of Cassava Components and Products by various Processing Methods
S/N Cassava
Component Process Applied Detoxification of
Total Cyanogens Achieved
[%]
Reference(s)
Root and Root Products
38 Sliced into 3 cm x 2 cm x 1 cm pieces and then fried in oil for 5 minutes
8.8 – 14.4 Nambisan and Sundaresan, 1985
39 Sun drying 10 mm thick chips 67.4 – 72.2 Nambisan and Sundaresan, 1985
40 Oven drying 10 mm thick chips at 50 o
C
49.5 – 53.6 Nambisan and Sundaresan, 1985
41 Oven drying 10 mm thick chips at 70 o
C 40.0 – 46.2 Nambisan and
Sundaresan, 1985
42 Sun drying 3 mm thick chips 41.6 – 48.0 Nambisan and Sundaresan, 1985
43 Oven drying 3 mm thick chips at 50 o
C 35.8 – 40.0 Nambisan and
Sundaresan, 1985
44 Oven drying 3 mm thick chips at 70 o
C 20.0 – 25.8 Nambisan and
Sundaresan, 1985
45 Oven drying : Peeled chips (5 to 10 x 2 to 4 x 0.3 to 0.6) cm dimensions at 20 kg/m
2 loading rate, at 60
o C for 20
to 22 hours
72.0 Gomez et al., 1984
46 Oven drying : 1 cm thick peeled slices at 20 kg/m
2 loading rate, at 60
o C for
20 to 22 hours
49.0 Gomez et al., 1984
47 Oven drying : Irregular root peel pieces at 14 to 15 kg/m
2 loading rate,
at 60 o C for 20 to 22 hours
64.0 Gomez et al., 1984
48 Sweet variety boiled for 20 minutes 87.9 Bourdoux et al., 1982

91
Table 2-9 Continued. Detoxification of Cassava Components and Products by various Processing Methods
S/N Cassava
Component Process Applied Detoxification of Total
Cyanogens Achieved [%]
Reference(s)
Root and Root Products
49 Pulp: Freeze dried 51.2 Meuser and Smolnik, 1980
50 Pulp: Air dried at 40 o C 98.5 Meuser and
Smolnik, 1980
51 Pulp: Drum dried 99.1 Meuser and Smolnik, 1980
52 Fermented pulp: Drum dried 86.5 Meuser and Smolnik, 1980
53 Fermented pulp: Dried with heated air at 180
o C
91.4 Meuser and Smolnik, 1980
54 Chips: Dried with heated air at 180 o C
98.4 Meuser and Smolnik, 1980
55 Chips: Air dried at 40 o C 98.5 Meuser and
Smolnik, 1980
56 Slices: Flash dried 52.0 Meuser and Smolnik, 1980
57 Chips (40 mm x 8.2 mm x 6.8 mm) oven dried at 46.5
o C for 18 hours
29 % of bound cyanide detoxified; 82.5 % of free
cyanide detoxified
Cooke and Maduagwu, 1978
58 Chips (40 mm x 8.2 mm x 6.8 mm) oven dried at 60
o C for 18 hours
26 % of bound cyanide detoxified; 83 % of free
cyanide detoxified
Cooke and Maduagwu, 1978
59 Chips (40 mm x 8.2 mm x 6.8 mm) boiled for 25 minutes
55 % of bound cyanide and > 90 % of free cyanide detoxified
Cooke and Maduagwu, 1978
60 Chips (40 mm x 8.2 mm x 6.8 mm) soaked and stirred in cold (24
o C)
water for 18 hours
50 % of bound cyanide detoxified; 90 % of free
cyanide detoxified after 4 hours
Cooke and Maduagwu, 1978
61 Storage: Roots packed in plastic bags, each bag stapled shut, bags then stored in the shade at ambient conditions for 72 hours.
9.93 Dufour, 1988

92
Table 2-9 Continued. Detoxification of Cassava Components and Products by various Processing Methods
S/N Cassava Component
Process Applied Detoxification of Total Cyanogens
Achieved [%]
Reference(s)
Root and Root Products
62 Whole roots of sweet cassava stored in field clamps for two weeks
50.0 Booth et al., 1976
63 Whole roots of bitter cassava stored in field clamps for two weeks
Toxicity increased by
19.7 %
Booth et al., 1976
64 Attieke Peel, grate, ferment, add oil and salt, dewater, sun dry
95.9 Mahungu et al., 1987
65 Casabe Scrape, grate, wash to separate starch, ferment for 48 hours, dewater, cook/toast
92.4 – 98.5 Dufour, 2007; 1989
66 Scrape, grate, wash to separate starch, ferment for 24 hours, dewater, cook/toast
86.8 – 96.8 Dufour, 1989
67 Scrape, grate, cook/toast; obtain fresh casabe
85.4 – 95.2 Dufour, 1989
68 Baton de Manioc
Peel, cut into cubes 20 mm to 40 mm size, remove fibers, soak/ferment for 2 days, dewater for 1 hour, pound/grind to fine paste, wrap in leaves and boil for 20 to 30 minutes
99.3 – 100 (Mean = 99.6)
O'Brien et al., 1992
69 Chikwangue Peel, ferment (3 days), sieve, steam (45 minutes), knead, boil (1 to 2 hours)
100 Mahungu et al., 1987
70 Chinyanya Peel, slice and pound to small pieces, sun-dry for 2 to 3 hours, re-pound, sun-dry for 2 to 3 hours, sieve, obtain final flour
82.2 – 86.6 Mlingi et al., 1995; Mlingi and Bainbridge, 1994
71 Eba: Derived from gari
Gari (stored for 4 months), soak in boiling water (2 to 5 minutes), knead into soft paste
99.8 Mahungu et al., 1987
72 Farina Soak whole roots for 2 to 4 days, peel, grate, ferment for ≥ 3 days, dewater, sift, toast
99.2 Dufour, 1989
73 Farine de Manioc
Peel, cut into 60 mm to 90 mm thick chunks, soak/ferment for 2 days, crush and dewater for 24 hours, sun-dry, pound into flour, boil flour to form thick porridge
91.3 – 99.9 (Mean = 94.4)
O'Brien et al., 1992

93
Table 2-9 Continued. Detoxification of Cassava Components and Products by various Processing Methods
S/N Cassava Component
Process Applied Detoxification of Total Cyanogens
Achieved [%]
Reference(s)
Root and Root Products
74 Farinha d’agua
Peel, soak, grate, ferment, dewater, toast
99.0 Dufour, 2007
75 Flour preparation
Soak flour 1 : 1.25 ratio (flour : water), spread the mixture out in a thin layer, heat in the oven at 30
o C for 5 hours
83.3 Cumbana et al., 2007
76 Soak/Wet flour at 30 o C for 5 hours
55 Bradbury, 2006
77 Flour production
Peel, cut into 4 cm x 4 cm dimensions, sun-dry for 4 days, mill into flour
27.8 Muzondo and Zvauya, 1995
78 Reconstitute flour at 30 % to 35 % moisture content, steam for 20 minutes, cool to room temperature, oven dry for 2 days at 60
o C; obtain “gelatinized
cassava flour”
35.6 Muzondo and Zvauya, 1995
79 Ferment gelatinized cassava flour at 40 o
C with formulated media for 50 hours, obtain “fermented cassava flour”
64.6 Muzondo and Zvauya, 1995
80 Peel; heap, cover and incubate for 3 days; remove mold; crush; sun-dry; pound; obtain flour
82.7 – 98.5 Essers, 1994
81 Fufu Ghana style: Peel, boil, pound 80.4 Mahungu et al., 1987
82 Nigeria style: Peel, soak (1 day), grate, dehydrate, steam, pound
95.4 Mahungu et al., 1987
83 Zaire style: Peel, ferment (3 days), sun dry, mill, cook
99.8 Mahungu et al., 1987
84 Preparation: Soak whole roots for 3 days 82.6 Bourdoux et al., 1982
85 Peel Soaked roots, break into small fragments and sundry for 3 days
85.9 Bourdoux et al., 1982
86 Grind sun dried fragments into Flour (uncooked fufu)
97.8 Bourdoux et al., 1982

94
Table 2-9 Continued. Detoxification of Cassava Components and Products by various Processing Methods
S/N Cassava Component
Process Applied Detoxification of Total Cyanogens
Achieved [%]
Reference(s)
Root and Root Products
87 Fufu Soak whole roots for 3 days, Peel soaked roots, break into small fragments and sundry for 3 days, Grind sun dried fragments into flour, Cook the flour in boiling water to form firm paste, (obtain fufu)
98.7 Bourdoux et al., 1982
88 Fuku Peel, cut into small pieces, dry (2 days), grind into flour (uncooked fuku)
83.6 Bourdoux et al., 1982
89 Peel, cut into small pieces, dry (2 days), grind into flour, cook flour into a gruel (cooked fuku)
95.3 Bourdoux et al., 1982
90 Gari/gari production
Peel, grate, add water at 75 % (v/w); heat at 50
o C for 6 hours
> 99 % Sokari, 1992
91 Peel, grate, dehydrate, ferment, fry 83.2 Mahungu et al., 1987
92 Peel, grate, dehydrate, ferment, fry, store (4 months)
98.1 Mahungu et al., 1987
93 Peel, grate, dewater with screw press for 24 hours, garify (roast)
99.0 – 99.6 Estimated from Maduagwu & Oben, 1981
94 Peel, grate, dewater with traditional press (weights of heavy stones) for 72 hours, garify (roast)
93.5 – 97.9 Estimated from Maduagwu & Oben, 1981
95 Peel, grate, ferment (48 hours), press (48 hours), roast
71.3 Ketiku et al., 1978
96 Ijapu Peel, boil for 25 minutes, slice, soak slices in cold water for 24 hours, rinse
84.5 – 95.3 Sokari, 1992
97 Konkonte Cote d’Ivoire style: Dry chips (unfermented), mill, cook
95.4 Mahungu et al., 1987
98 Lafun Peeling, soaking, fermenting, mashing, drying
88.1 Ketiku et al., 1978
99 Makopa; normal size
Peel, split longitudinally, sun-dry on rock/platform for 8 days, pound, obtain flour
45.7 – 70.7 Mlingi et al., 1995; Mlingi and Bainbridge, 1994

95
Table 2-9 Continued. Detoxification of Cassava Components and Products by various
Processing Methods
S/N Cassava Component
Process Applied Detoxification of Total Cyanogens
Achieved [%]
Reference(s)
Root and Root Products
100 Makopa; normal size
Peel, split longitudinally, sun-dry on rock/platform for 17 days, pound, obtain flour
63.2 – 73.1 Mlingi and Bainbridge, 1994
101 Manicuera Boiled cassava starch juice beverage 98.6 – 99.6 Dufour, 1989
102 Ntuka Zaire style: Peel, ferment (3 days), steam (2 hours)
99.8 Mahungu et al., 1987
103 Oyoko Zaire style: Peel, grate, mix with fermenting pulp (3:1), steam
90.8 Mahungu et al., 1987
104 Plakali Cote d’Ivoire style: Peel, grate, mix with fermenting pulp (3:1), sun dry, pound, cook
96.6 Mahungu et al., 1987
105 Ugali wa mhogo (from peeled root)
Air Drying Method: Slice peeled roots into 30 mm to 50 mm thick pieces, oven dry at 40
o
C for 3 days
93.7 Gidamis et al., 1993
106 Pound dried pieces and sieve into flour 95.1 Gidamis et al., 1993
107
Prepare Ugali wa mhogo by boiling 1 : 2 (flour : water) ratio and stirring
95.3 Gidamis et al., 1993
108 Ugali wa mhogo (from unpeeled root)
Soaking Method: Soak unpeeled root in water at 30
o C for 8 days,
62.7 Gidamis et al., 1993
109 Slice soaked roots and oven dry at 40 o C for
3 days
96.4 Gidamis et al., 1993
110 Pound dried pieces and sieve into flour 96.8 Gidamis et al., 1993
111 Prepare Ugali wa mhogo by boiling 1 : 2 (flour : water) ratio and stirring
98.3 Gidamis et al., 1993
112 Animal Feed Silage: Unpeeled roots were washed and cut into chips. Chips were packed into wooden silos lined with sheet metal and plastic. Silos were covered with thick plastic sheet and made airtight with wood shavings. Silos were maintained in shaded area and ensiled for 26 weeks
64 – 74 8 Gomez and Valdivieso, 1988

96
Cardoso et al., (2005), proposed equations that may be used to relate the initial
cyanide content of cassava to the percent cyanide retention after processing. Based on
their analyses, it may be possible to estimate the initial maximum total cyanide content
for a specific processing method to achieve the 10 ppm cyanide safety standard of
WHO. Consequently, the more efficient processing methods such as grating/pounding,
fermentation/dewatering, that are used to produce farinha and gari should start with
cassava having initial maximum total cyanide content of about 222 ppm. On the other
hand, to achieve the same safety margin (10 ppm cyanide in the final product), the less
efficient process such as frying or the sun drying used for flour production should start
with cassava having initial maximum total cyanide content of about 33 ppm (Cardoso et
al., 2005). Below is a brief discussion on cassava food systems from around the world.
2.1.11 Cassava Food Products
A wide range of cassava food products have been developed in different parts of
the world. Procedures for these food systems may vary from country to country; and
even between different regions of the same country. Cassava food systems may be
fermented; grated; dried; fried; boiled; or subjected to various other unit operations or
combinations thereof. Among food products of cassava prepared and consumed around
the world are: akpakpuru, attieke, casabe, chickwangue, farina, fou-fou, fuku, gaplek,
gari, ijapu, konkonte, kpokpo gari, lafun, landang (cassava rice), mpondu, ntuka,
peujeum or tapai, puttu, tapioca, thundam, etc. In many products, grating, fermenting
drying etc. minimize hydrocyanic acid concentration (Mahungu et al., 1987; Ketiku et al.,
1978). Some of the mentioned cassava food systems are briefly highlighted.

97
2.1.11.1 Akpakpuru
In the Rivers State of Nigeria and various states in Eastern and Southern Nigeria,
a dumpling-type fermented cassava product is produced and consumed both in the rural
areas and in the cities. The dumplings have acquired personality of sorts. They are sold
as 10 – 12 cm balls wrapped with polyethylene sheets in city streets and touted by
different names such as “loiloi” and “packet shirt”. Details of preparation vary from
locality to locality. The Ikwerre people of Rivers State of Nigeria call both cassava crop
and this product the same name: Akpakpuru. The traditional preparation method is as
follows. Whole cassava roots are soaked in 90 – 100 cm diameter 10 – 25 cm deep
dug-out pits or fence protected areas at the edges of tidal streams for five or more days.
Fermentation occurs during this soaking period, softening the roots parenchyma
considerably. Root peels and central fibers are removed; the soft parenchymatous pulp
is crumbled and sieved into jute sacks with raffia basket mesh. Mass of sieved pulp is
dewatered, wrung dried and stored in the sacks until required for consumption.
Akpakpuru is prepared for consumption by molding the pulp into 10 – 12 cm
diameter balls, boiling for 10 – 15 minutes and pounding the balls into dough with pestle
and mortar. The boiling and pounding is repeated a couple of times or until the dough is
well cooked. Akpakpuru is then eaten as dumpling when served with delicately prepared
stews and soups rich in vegetables, game meat, and sea foods such as clams, crabs,
oysters, periwinkles and shrimps.
2.1.11.2 Attieke
Attieke is a grated and fermented product in Cote d’Ivoire (Ross, 2012;
Balagopalan et al., 1988; Mahungu et al., 1987; Lancaster et al., 1982). It is produced
through laborious and time consuming manual unit operations which include peeling,

98
washing, grating, fermenting, dewatering, sieving, granulating, drying and steaming.
Cassava roots are peeled, washed and grated or mashed. A starter culture of 5 – 10 %
of the mass of mash is added to facilitate fermentation. About 1 % of palm oil and some
salt are also added after which fermentation is allowed to proceed for fifteen hours. The
fermented mass is dewatered, sieved and granulated. The granules are sun dried briefly
for about an hour and then gelatinized by steaming over a boiling pot of water for thirty
minutes. While steaming, the granules are stirred with a spatula to prevent them from
sticking together. The fermentation process is reported to impart a slightly sour taste to
the finished product (Ross, 2012; Balagopalan et al., 1988; Lancaster et al., 1982).
Attieke can be prepared for eating like couscous. Mix equal parts of attieke and water
(or broth of choice) in a saucepan and stand for ten minutes. Attieke will absorb the fluid
and swell. After the ten minutes wait add salt, butter and desired spices and herbs. Stir
and steam cook for ten minutes or until desired tenderness. Like couscous, Attieke may
be served and eaten with stewed meats such as beef, fish, pork and poultry; and with
vegetables and milk. Attieke can also be used as replacement of grains in various
dishes (Ross, 2012).
2.1.11.3 Casabe
Casabe is a flat, cracker-like bread that is made from cassava root. It is a
traditional food of the Amazonians, and its preparation can range from simple to
elaborate. In the simplest form, fresh cassava roots are peeled and grated into a mash.
The mash is subsequently dewatered and placed on hot clay or stone griddle, pressed
down into a thin layer and toasted on each side (Figure 2-20). The resulting flat circular
cake is the cassava bread known as casabe (Lancaster et al., 1982; Seigler and

99
Pereira, 1981). A more elaborate method of preparing casabe was described in the
literature (Dufour, 2007; 1994; 1989).
Figure 2-20. Production and Toasting of Casabe on a Wood-Fired Griddle (Wikipedia, 2013 B).
2.1.11.4 Chickwangue
Chickwangue is a fermented cassava food product. Variations of it are prepared
and consumed in many parts of Africa, including Zaire, Sudan, Gabon, Congo, Central
African Republic, Cameroon, and Angola. It has been reported to be the most popular
processed food from cassava in Zaire (Hahn, 1992). Basically, the cassava root is
fermented in water for 3 – 5 days. Peeling of the root may be effected before or after the
fermentation process. Following fermentation, the soft pulp is recovered, washed clean
and pounded into a thick paste. The paste is subsequently securely wrapped and
tied in leaves of Megaphrynium macrostachyum, banana, plantain, or leaves of other
plant of Marantaceae or Zingiberaceae family (Congocookbook.com, 2013; Hahn,
1992). The wrapped paste is then steamed for several hours to near consistency of
modeling clay. Viola, chickwangue is done. Sizes of the product vary. In Central Africa,

100
two sizes of chickwangue wraps are common: 2.54 – 5.08 cm diameter by 30.48 cm
long and 10.16 cm diameter by 30.48 cm long (Congocookbook.com, 2013). In
Cameroon, “Myondo” and “Bobolo” are cassava products that belong to chickwangue
group. Myondo is 1.5 – 2.0 cm in diameter by 15.0 – 20.0 cm long; while Bobolo is 2.0 –
4.0 cm in diameter by 30.0 – 40.0 cm long (Hahn, 1992). Chickwangue and its group of
products may be served with soup, stew, or any sauce dish (Congocookbook.com,
2013).
2.1.11.5 Farina
Farina is a popular method of preparing cassava in tropical America. It is
prepared in the form of a meal or granules and also called farinha de mandioca in Brazil
(Lages and Tannenbaum, 1978). In the preparation of farina, fresh roots are peeled,
grated, dewatered and sifted to obtain an even textured mash. The mash is roasted on
a griddle with continuous stirring until cooked to less than 10 % moisture content (Oke,
1994). In traditional Amazonia, the grater board, tipiti (a basket work sleeve press), and
clay griddle are used respectively for grating/rasping the root, dewatering and roasting
the mash (Dufour, 1994). In some preparation styles, the cassava root is soaked or
fermented in water for some days before processing (Balagopalan et al., 1988).
2.1.11.6 Fufu
Cassava fufu may be processed in a variety of ways. In one production style,
cassava roots are peeled, washed and grated. The grated mash is packed into sacks,
weighted down with heavy objects to squeeze out contained juice, and allowed to
ferment for a few days. The resulting dough is used to produce fufu (Lancaster et al.,
1992). In Ghana, the fufu is said to be prepared by adding quantities of the dough into
boiling water and stirring until desired consistency is achieved (Doku, 1969). In another

101
production method, the peeled cassava roots are first soaked in water and allowed to
ferment for several days. The soft root pulp is mashed, sieved in a basin of water, and
allowed to sediment or settle. The sediment paste is thinned down in a pot and cooked
on low fire with constant stirring until desired consistency is achieved (Ayankunbi et al.,
1991)
2.1.11.7 Fuku
Fuku is a cassava root product consumed in Zaire. Cassava roots are peeled, cut
into pieces and dried in the sun. Dried chips are pounded into flour and partially
fermented with corn. Fermentation is stopped by grilling, and the fuku flour is consumed
as a meal gruel prepared in boiling water (Bourdoux et al., 1983).
2.1.11.8 Gaplek
Gaplek is a popular traditional famine protector cassava food product in Java and
other parts of Indonesia. Fresh cassava roots are peeled and sliced into 15.24 – 20.32
cm pieces. The pieces are dried in the sun for 1 – 3 or more days depending on
weather conditions. The dried pieces are stored in a cool and dry place as vanguard
against hunger. When other sources of food become scarce or expensive, gaplek is
retrieved from storage, pounded into smaller pieces and cooked and consumed like
rice.
2.1.11.9 Gari
Gari is a popular cassava food product consumed extensively in many parts of
West Africa including Benin, Ghana, Guinea, Nigeria, and Togo. In these countries, gari
may be consumed as a snack in various forms or eaten as the main dish. It is eaten
plain just as it is; eaten with groundnuts, coconuts, or palm kernel; eaten soaked in cold
water with or without the addition of milk and sugar; or eaten as eba in combination of
102
soups of fish, beef, game meat, poultry, vegetables, etc. Eba is derived when gari is
soaked in hot water and kneaded. The consistency of eba ranges from that of a soft
paste to jell to modeling clay. The preparation of gari is similar to that of farina, but
requires more elaborate equipment, processes and time. The basic unit operations for
gari production are washing, peeling, grating, dewatering/fermenting, sifting, and then
garification; which consists of roasting/frying (Aso, 2004; Collard and Levi, 1959). Fresh
cassava roots are grated or ground into a mash after washing and peeling operations.
The mash is packed into a jute or polypropylene sack and wrung dried/fermented for a
few days. The clumped cake is crumbled and sifted through sieves. The sifted mass is
then garified (roasted/fried) in shallow iron pots to produce gari. Palm oil may be added
during fermentation, and or during garification stage to improve nutritional (Vitamin A)
content and minimize sticking to the iron pots. After cooling, the gari may be sieved to
obtain homogenous granules.
2.1.11.10 Konkonte
Konkonte is a cassava root product. It is consumed in Cote d’Ivoire, Ghana, and
the Caribbean. It is often regarded as poverty food for low income earners. Konkonte is
fairly easy to prepare. Fresh cassava roots are peeled, sliced into chips and dried in the
sun. Dried chips are milled into flour and consumed as a gruel or runny porridge, being
enjoyed with a specially prepared soup.
2.1.11.11 Lafun
For "lafun" production in the Western States of Nigeria, peeled or unpeeled
cassava roots are immersed in a stream, in stationary water (near a stream) or in an
earthenware vessel, and fermented until the roots become soft. The peel and central
fibers of the fermented roots are manually removed and the recovered pulp is hand

103
mashed or pounded and sun dried. The dried mash is then milled into lafun flour (Oke,
1994; Hahn, 1992). To prepare the lafun, an estimated amount of lafun flour is mixed
with an estimated amount of boiling water. The mixture is allowed to cook while stirring
continuously to prevent clumps and burning, until the desired consistency is achieved
(Ayankunbi et al., 1991). A similar product is reported to be processed in Angola where
the dried pulp is called bombo or makessu, and the ground flour is referred to as fuba
(Alberto, 1958).
2.1.11.12 Landang (cassava rice)
In the Philippines, a popular dish known as landing or cassava rice is produced
by first peeling and grating cassava roots. The grated mass is loaded into jute sacks
and the juice squeezed out with applied weight. The mass is then winnowed into small
pellets with a basket, dried, steamed, and dried again (Lancaster et al., 1982). Landang
can be eaten as is or it may be cooked and eaten like rice or maize.
2.1.11.13 Peujeum or Tapai
Peujeum is a traditional cassava food product in Java. However, it is wide spread
in Asia where it is known by various names including tapai ketela in Indonesia; tapai ubi
kayu in Malaysia; and binuburang ube or tapay panggi in the Philippines. Peeled fresh
cassava roots are steamed to tenderness, cooled to 30 o C and dusted with a special
mixture of flour and spices known as ragi. The dusted root is layered in a basket or
wrapped in banana leaves in an earthenware pot and allowed to ferment for a couple of
days. The peujeum may be eaten as is or baked before consumption.
2.1.11.14 Puttu
In Sothern India, boiled cassava roots are grated and mixed with shredded
coconut. The product is called puttu and is often served with cardamom seed. Grated

104
roots may be minced, mixed with fried onions, cashew nuts, black gram and coriander
leaves. The mixture is then molded into balls, dusted with Bengal gram flour and fried.
This product is then called pakkoda (Lancaster et al., 1982). Also, parboiled cassava
pieces could be mixed with fat, ginger, coriander and curry leaves, mustard seeds,
Bengal dhal and black gram dhal to produce uppuma (Balagopalan et al., 1988).
2.1.11.15 Thundam
In Southern India, thundam is prepared by removing the whole peel from
cassava roots, slicing and drying the peeled roots. Dried chips may be boiled or fried for
consumption. Alternatively, chips are converted to flour for a variety of uses.
2.1.11.16 Other Cassava food and beverage products
A variety of nonconventional food systems have been produced from cassava.
These include cassava rava, porridge, pappads, and wafers (Nanda et al, 2002).
Preparations from cassava flour include dumplings, cakes, and fritters. Similarly several
beverages have been produced from cassava. Alcoholic drinks include beers, banu or
uala, kasili, yaraqui, amoiuare, paya, yakari, tapana, malicha, paiwarri (Balagopalan et
al., 1988; Lancaster et al., 1982). Lancaster et al., (1982) reported that the Karinya
people produce a non-alcoholic beverage called karato from cassava. Dufour (1989,
1988), noted that Tukanoan Indians in Northwest Amazonia also process bitter cassava
into a boiled cassava juice known as “manicuera” and a starch drink called “mingao”.
Mowat (1989), described Chicha as the generic name applied to native beer and
other beverages in South America. Chicha may be derived from sweet or bitter cassava,
maize, sugar cane, and various fruits. Among the beverages made from cassava by the
Amazonian Indians are the non alcoholic drinks like boiled juice that was expressed
from grated cassava root with the tipiti; and boiled cassava starch. Beers and other
105
fermented alcoholic beverages from cassava include bernia, kachiri, kurai, masato,
paiwarri and puchokwa (Mowat, 1989).
2.2 Part 2: Production of Amylolytic Enzymes
2.2.1 Background
The development of enzymatic processes and the market for enzymes is growing
because the use of enzymes has numerous advantages. These include cheaper
production; great specificity and enhanced rate reactions; application to various current
and frontier fields like agriculture, chemicals, clean energy, food, pharmaceuticals,
clinical, medicinal and analytical chemistries, materials, textile, brewing and distilling
industries; the potential to address issues of health, raw materials, sustainability and
environment; as well as the possibility to benefit from use of genetics knowledge to
produce enzymes specifically tailored for special applications (Beilen and Li, 2002;
Pandey et al., 2000 b). The study of amylolytic enzymes is of great importance for the
improvement of industrial processes (Gupta et al., 2003), treatment of waste waters and
animal nutrition applications (Buendia et al., 2003), among others. There are many
sources of amylolytic enzymes. Perhaps the most important source for industrial
processes is microbial; especially from some strains of bacteria and fungi (Tomasik and
Horton, 2012; Sousa and Magalhães, 2010; Uhlig, 1998; Srivastava and Baruah, 1986;
Tani et al., 1986; Pestana and Castillo, 1985; Michelena and Castillo, 1984; Forgarty,
1983).
Glucoamylase and α-amylase are starch converting enzymes used for the
production of a wide range of products such as dextrins, modified starches, glucose
syrups, organic acids, flavor and aroma compounds, mushrooms and ethanol from

106
starch degradation (Couto and Sanroman, 2006; Gupta et al., 2003; Stamford et al.,
2002; Pandey et al., 2000 a; Labeille et al., 1997). Glucoamylase or amyloglucosidase
(EC 3.2.1.3), is an exo-amylase that produces glucose as final product from starch,
hydrolyzing glucose units from the non-reducing ends (α-1,4 and α-1,6 linkages) of
amylose and amylopectin (Tomasik and Horton, 2012; Anto et al., 2006; Ellaiah et al.,
2002; Uhlig, 1998; James and Lee, 1997; Roberts et al., 1995). On the other hand, α-
amylase (EC 3.2.1.1) catalyzes the hydrolysis of internal α-1,4-O-glycosidic bonds in
polysaccharides. Indeed α-amylase is the most reported endo-amylase that produces
oligodextrins as main product (Castro et al., 2011). Figure 2-21 is a photo image of
Alpha-Amylase.
Figure 2-21. Three Dimensional Image of Alpha-Amylase (bing.com, 2013 b; Mobini-Dehkordi and Javan, 2012)
Some of the enzymes that are available for industrial applications do not
withstand the extreme processes and conditions in the industries. This has led to the
search for extremophile microorganisms that survive non-standard conditions. It is
presumed that the enzymes from these microbes can be adapted and optimized for
107
extreme environmental factors (Atomi, 2005; Van Den Burg, 2003; Demirjian et al.,
2001; Hough and Danson, 1999; Niehaus et al., 1999).
The production of exogenous enzymes has been studied using: solid state
fermentation (Hashemi, et al., 2011; Murado et al., 1997); submerged fermentation
(Aguilar et al., 2008; Amoozegar et al., 2003; Aguilar et al., 2001; Soccol et al., 1994);
encapsulated strains (Konsoula and Liakopoulou-Kyriakides, 2006 a; 2006 b); and with
the advances in genetics, using recombinant microorganisms (Rasiah and Rehm, 2009;
Murakami et al., 2007; Hashim et al., 2005; Lin et al., 2003; Bruins et al., 2001; Lo et al.,
2001).
This review highlights fermentation processes and microorganisms used for the
production of amylolytic enzymes, as well as the process variables.
2.2.2 Amylolytic Enzymes Production by Solid-State Fermentation
Solid-State Fermentation (SSF) may be defined as a fermentation process that
occurs on solid matrix in virtual absence of free water. The solid matrix or substrate
provides physical support and may contain sufficient moisture in absorbed form to
supply nutrients (Couto and Sanroman, 2006; Pandey, 1992). SSF technology is used
for many applications in Asia. Examples include the production of soy sauce, miso and
koji. Koji is made from rice with Aspergillus oryzae and is used as a starter culture for
processing several food products (Hölker and Lenz, 2005). Durand (2003) described
SSF as an “ancient art” that is becoming a modern technology. The process is suitable
for growth of fungi which are the microorganisms commonly used (Aguilar et al., 2008;
Viniegra-González et al., 2003). SSF characteristics are similar to fungi’s natural
environment, thus increasing the fungi activity (Barrios-Gonzalez, 2012; Couto and
Sanroman, 2006; Hölker and Lenz, 2005; Pandey, 2003; Castilho et al., 2000). Fungi
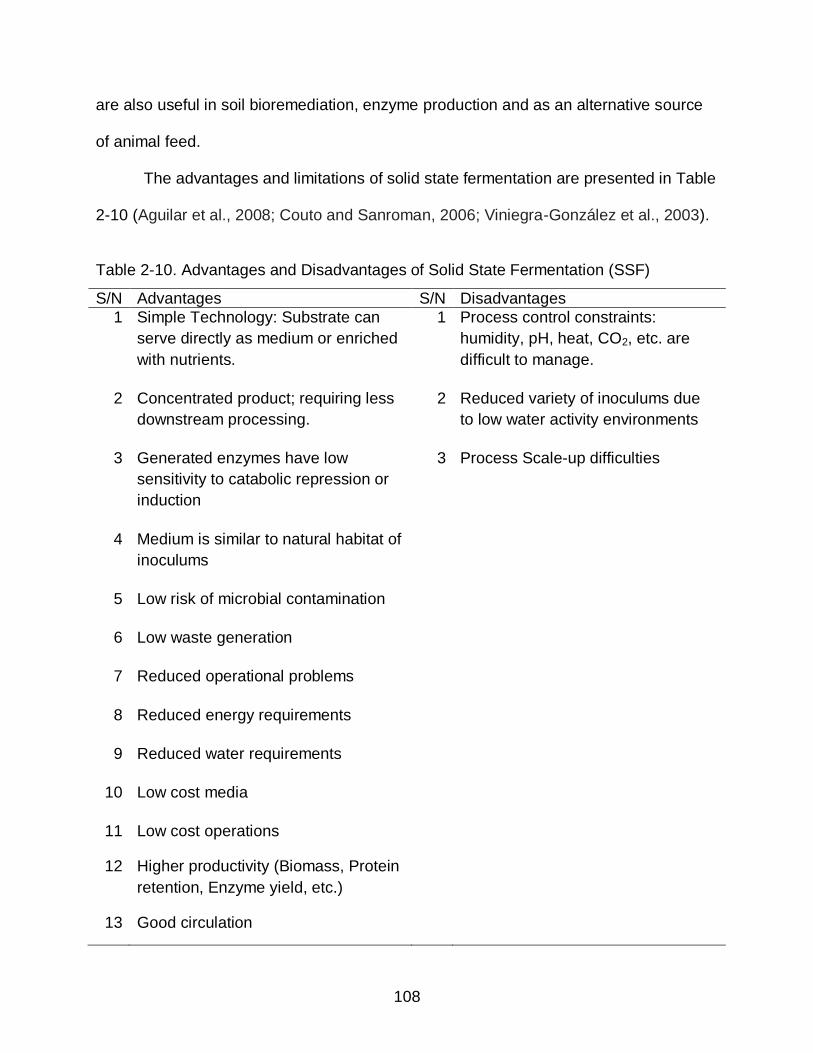
108
are also useful in soil bioremediation, enzyme production and as an alternative source
of animal feed.
The advantages and limitations of solid state fermentation are presented in Table
2-10 (Aguilar et al., 2008; Couto and Sanroman, 2006; Viniegra-González et al., 2003).
Table 2-10. Advantages and Disadvantages of Solid State Fermentation (SSF)
S/N Advantages S/N Disadvantages
1 Simple Technology: Substrate can
serve directly as medium or enriched
with nutrients.
1 Process control constraints:
humidity, pH, heat, CO2, etc. are
difficult to manage.
2 Concentrated product; requiring less
downstream processing.
2 Reduced variety of inoculums due
to low water activity environments
3 Generated enzymes have low
sensitivity to catabolic repression or
induction
3 Process Scale-up difficulties
4 Medium is similar to natural habitat of
inoculums
5 Low risk of microbial contamination
6 Low waste generation
7 Reduced operational problems
8 Reduced energy requirements
9 Reduced water requirements
10 Low cost media
11 Low cost operations
12 Higher productivity (Biomass, Protein
retention, Enzyme yield, etc.)
13 Good circulation

109
The process is relatively simple; utilizes marginal inputs; and has low energy
requirements and production costs. SSF processes can proceed at water activities of
0.935 – 0.980 (Ruijter et al., 2004; Ishida et al., 2000; Grajek & Gervais, 1987 a, 1987
b) and therefore, produces less waste (Anto et al., 2006; Hölker and Lenz, 2005). In
some cases the fermented product is also used as an enzyme source for other
hydrolytic processes (Hölker and Lenz, 2005).
Microorganisms used for SSF and the sources from which they are isolated are
very diverse. Bacteria may be isolated from hot springs (Sodhi et al., 2005); Cow dung
(Swain and Ray, 2009; 2007); or from soils (Kar et al., 2010; Oyeleke and Oduwole,
2009; Kumar and Satyanarayana, 2004; Srivastava and Baruah, 1986). Fungi isolated
from soils and seeds are also used (Saxena and Singh, 2011; Varalakshmi et al., 2009;
Alva et al., 2007; Anto et al., 2006). In the case of amylolytic enzymes production, the
diversity is useful for a variety of applications such as the creation of detergents, bakery
products, sugar syrups, brewery products, etc. In SSF, the solid material used can be
the source of nutrients for the microorganism and or provide physical support to the
system for immobilization. When an inert material such as polyurethane foam, acreolite
or a resin is used as SSF support structure, the extraction and purification of
fermentation products become less costly and cumbersome than when agro-industrial
wastes serve as fermentation matrix (Pandey, 2003; Murado et al., 1997).
Important variables that require control during SSF include physicochemical and
biochemical parameters. One-variable-at-a-time approach has often been used to study
fermentation processes for enzyme production. However, this kind of approach tends to
overlook or cloud interactions between factors and responses that are revealed when

110
adequate experimental designs and response surface methodologies are adopted
(Deepak et al., 2008; Kumar and Satyanarayana, 2004). Some of the SSF control
variables are discussed below and include:
Substrate Support Structure
Carbon Supplementation
Nitrogen Supplementation
Porosity and Aeration
Moisture Content and Water Activity
Incubation Temperature
Inoculums Concentration
Fermentation Time and pH 2.2.2.1 Substrates support structures
Agricultural, biological and industrial materials, products and wastes have been
used as physical support structures in SSF processes with various microorganisms
including species of bacteria: Bacillus, Clostridium, Streptomyces; yeast:
Kluyveromyces, Saccharomycopsis, Zygosaccharomyces; and many fungi: Aspergillus,
Ceratocystis, Neurospora, Penicillium, Rhizopus, and Thermomyces. Products
generated include amylases, pectinases, proteases, flavor compounds, etc. The gamut
of substrate covers seeds, grains, tubers, leaves, as well as industrial by-products that
are used in different formats. For example, cassava has been used and studied in the
form of starch, flour, bagasse, peel, gelatinized, and fibrous residue; maize and corn in
the format of steep liquor, flour, crushed, and as corn cobs; mustard as seed cake; oat
as flour; plantain as peel; potato as flour, starch and solid waste; coffee as husk; rice as
bran, flake, flour/powder, grains, hull, and gelatinized; soybean as meal and seeds;
sugar beet as pulp; sugarcane as bagasse; sun flour as seeds; while wheat has been
utilized in the form of bran, crushed seeds, flakes, flour; and yam as peel. Table 2-11
highlights these substrates, the organisms used as well as the products generated.

111
Table 2-11. Substrates used in Microbial Fermentations, Organisms Employed and the Products Generated
S/N Substrate Organism Employed Product Generated
Reference(s)
1 Amaranth Grain Rhizopus oryzae Flavor (Aroma
Compound)
Christen et al., 2000
Rhizopus oryzae ATCC
34612
Flavor (Aroma
Compound)
Bramorski et al.,
1998
2 Apple Pomace Rhizopus oryzae Flavor (Aroma
Compound)
Christen et al., 2000
Rhizopus oryzae ATCC
34612
Flavor (Aroma
Compound)
Bramorski et al.,
1998
3 Barley Bran Thermomyces
lanuginosus
Amylase Enzyme Kunamneni et al.,
2005
4 Cassava
Bagasse
Aspergillus oryzae TISTR
3605
Alpha Amylase Pengthamkeerati et
al., 2012;
Kluyveromyces marxianus Flavor (Aroma
Compound)
Medeiros et al.,
2001
Rhizopus oryzae Flavor (Aroma
Compound)
Christen et al., 2000
A. niger LPB 21; A. niger
NRRL 2001; A. niger
CFTRI 30; Ceratocystis
fimbriata; K. marxianus; L.
edodes; P. sajor-caju;
Rhizopus sp.; R. oryzae
Aroma
Compounds;
Mushrooms;
Organic Acids;
Glucose
Hydrolysates
Pandey et al., 2000
B
Rhizopus oryzae ATCC
34612
Flavor (Aroma
Compound)
Bramorski et al.,
1998
NA Citric Acid Soccol, 1996
5 Cassava
(Cooked)
Rhizopus delamer ATCC
34612; Rhizopus oryzae
MUCL 28168; Rhizopus
oryzae MUCL 28627
Protein
enrichment; Alpha
Amylase;
Glucoamylase
Soccol et al., 1994 A
6 Cassava
Fibrous Residue
Streptomyces erumpens
MTCC 7317
Alpha Amylase Kar et al., 2010
Bacillus subtilis CM3 Alpha Amylase Swain and Ray,
2007

112
Table 2-11. Continued. Substrates used in Microbial Fermentations, Organisms Employed and the Products Generated
S/N Substrate Organism Employed Product Generated Reference(s) 7 Cassava
Flour
(Gelatinized)
Aspergillus niger; Amylases Soccol, 1996
8 Cassava
Flour
(Steam
cooked)
Rhizopus oryzae Protein Enrichment Daubresse et al.,
1987
9 Cassava Peel Aspergillus flavus Amylase Sani et al., 1992
Aspergillus niger Amylase Sani et al., 1992
10 Cassava
(Raw)
Rhizopus delamer ATCC
34612; Rhizopus oryzae
MUCL 28168; Rhizopus
oryzae MUCL 28627
Protein enrichment;
Alpha Amylase;
Glucoamylase
Soccol et al.,
1994 A
11 Cassava Root Rhizopus sp. Amyloglucosidase;
Single-cell protein
Sukara and
Doelle, 1989
12 Cassava
Starch
Saccharomycopsis
fibuligera
Alpha Amylase;
Glucoamylase
Gonzalez et al.,
2008
Rhizopus sp. Protein Enrichment Soccol, 1996 B
Aspergillus sp. N–2 Glucoamylase Tani et al., 1986
13 Cassava
Waste
Rhizopus stolonifer
Aspergillus niger
Aspergillus terreus
Cellulasses;
Beta Glucosidase;
Protein Enrichment
Pothiraj et al.,
2006
14 Chestnut
Flour
Bacillus subtilis α-amylase;
β-galactosidase
Konsoula &
Liakopoulou-
Kiriakides, 2007
15 Coconut Oil
Cake
Aspergillus sp. JGI 12 Amylase Alva et al., 2007
16 Coffee Husk Ceratocystis fimbriata Flavor (Aroma
Compound)
Soares et al.,
2000
17 Corncobs Thermomyces lanuginosus Amylase Kunamneni et al.,
2005
18 Corn Flour Bacillus subtilis α-amylase;
β-galactosidase
Konsoula &
Liakopoulou-
Kiriakides, 2007
19 Corn Starch Bacillus subtilis Alpha Amylase Konsoula &
Liakopoulou-
Kiriakides, 2006
a; 2006 b

113
Table 2-11. Continued. Substrates used in Microbial Fermentations, Organisms Employed and the Products Generated
S/N Substrate Organism Employed Product Generated
Reference(s)
20 Corn Steep
Liquor
Bacillus subtilis α-amylase;
β-galactosidase
Konsoula &
Liakopoulou-
Kiriakides, 2007
Clostridium
thermosulfurogenes SV2
Beta Amylase Rama Mohan Reddy
et al., 2003
21 Cowpea Waste Aspergillus oryzae BS41 Gluco Amylase Kareem et al., 2009
22 Giant Palm
Bran
Kluyveromyces
marxianus
Flavor (Aroma
Compound)
Medeiros et al., 2001
23 Gram Husk Bacillus sp. Amylase Saxena & Singh, 2011
24 Ground Nut Oil
Cake
Aspergillus sp. JGI 12 Amylase Alva et al., 2007
25 Kumara; a
starchy root
crop
Aspergillus niger Citric Acid Lu et al., 1998
26 Maize
(Crushed)
Thermomyces
lanuginosus
Amylase Kunamneni et al.,
2005
27 Maize Meal Thermomyces
lanuginosus
Amylase Kunamneni et al.,
2005
28 Millet Cereal Thermomyces
lanuginosus
Amylase Kunamneni et al.,
2005
29 Millet (Pearl
Millet) Flour
Clostridium
thermosulfurogenes SV2
Beta Amylase Rama Mohan Reddy
et al., 2003
30 Miso Zygosaccharomyces
rouxii
Flavor (Aroma
Compound)
Sugawara et al., 1994
31 Molasses Bran Thermomyces
lanuginosus
Amylase Kunamneni et al.,
2005
32 Mustard Oil
Seed Cake
Bacillus sp. Amylase Saxena & Singh, 2011
33 Oat Flour Bacillus subtilis α-amylase;
β-galactosidase
Konsoula &
Liakopoulou-
Kiriakides, 2007
34 Plantain Peel Aspergillus niger Beta Amylase Adeniran et al., 2010
35 Potato Flour Bacillus subtilis α-amylase;
β-galactosidase
Konsoula &
Liakopoulou-
Kiriakides, 2007

114
Table 2-11. Continued. Substrates used in Microbial Fermentations, Organisms Employed and the Products Generated
S/N Substrate Organism Employed Product Generated
Reference(s)
36 Potato Starch Bacillus subtilis Alpha Amylase Konsoula & Liakopoulou-Kiriakides, 2006 a; 2006 b
Clostridium thermosulfurogenes SV2
Beta Amylase Rama Mohan Reddy et al., 2003
37 Potato Waste (Solid)
Anaerobic sludge and waste water innocula
Amylase, Carboxymethyl Cellulase, Filter paper Cellulase, Xylanase, Pectinase and Protease
Parawira et al., 2005.
38 Rice Bran Bacillus sp. Amylase Saxena & Singh, 2011
Aspergillus sp. JGI 12 Amylase Alva et al., 2007 Thermomyces lanuginosus
Amylase Kunamneni et al., 2005
Aspergillus terreus GTC 826
Glucoamylase Ali et al., 1989
Aspergillus sp. N–2 Glucoamylase Tani et al., 1986 39 Rice Flake
Manufacturing Waste
Aspergillus sp. HA-2. Glucoamylase Anto et al., 2006
40 Rice Flour Bacillus subtilis α-amylase; β-galactosidase
Konsoula & Liakopoulou-Kiriakides, 2007
Aspergillus awamori Glucoamylase Pestana and Castillo, 1985
Aspergillus foetidus Alpha Amylase Michelena and Castillo, 1984.
41 Rice (Gelatinized)
Neurospora sp Flavor (Aroma Compound)
Pastore et al., 1994
42 Rice Hull Aspergillus sp. N–2 Glucoamylase Tani et al., 1986
43 Rice Husks Penicillium citrinum Cellulasses Kuhad and Singh, 1993
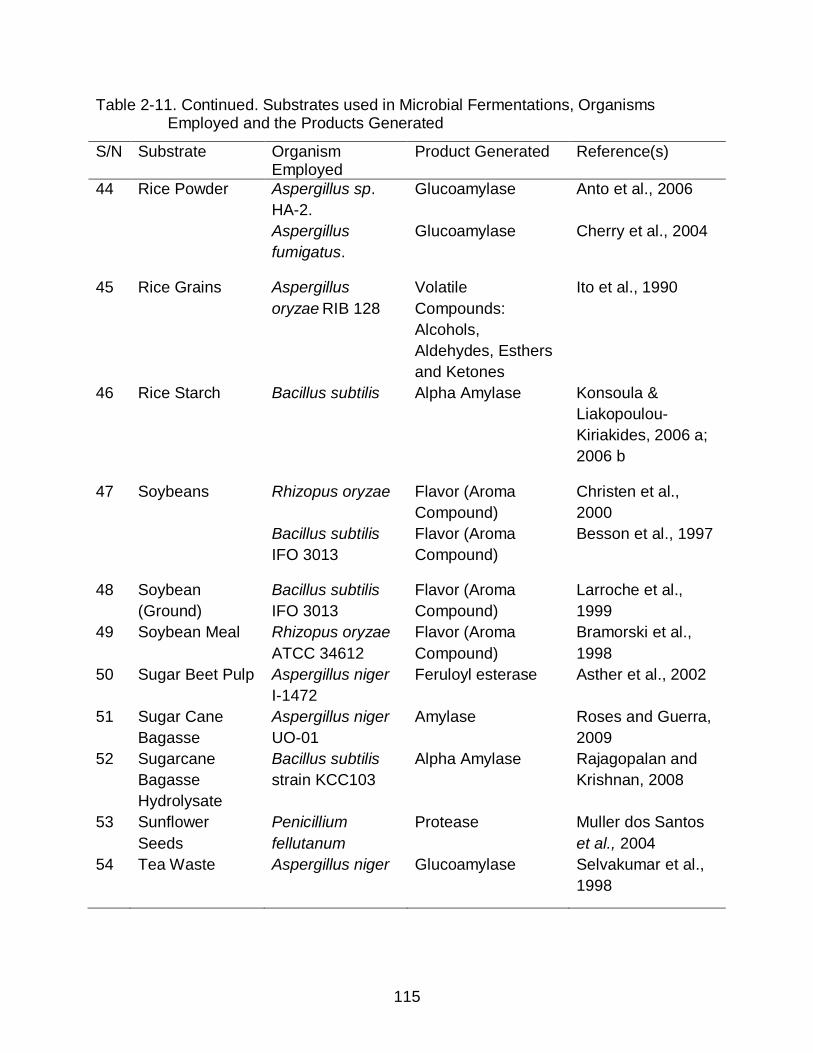
115
Table 2-11. Continued. Substrates used in Microbial Fermentations, Organisms Employed and the Products Generated
S/N Substrate Organism Employed
Product Generated Reference(s)
44 Rice Powder Aspergillus sp.
HA-2.
Glucoamylase Anto et al., 2006
Aspergillus
fumigatus.
Glucoamylase Cherry et al., 2004
45 Rice Grains Aspergillus
oryzae RIB 128
Volatile
Compounds:
Alcohols,
Aldehydes, Esthers
and Ketones
Ito et al., 1990
46 Rice Starch Bacillus subtilis Alpha Amylase Konsoula &
Liakopoulou-
Kiriakides, 2006 a;
2006 b
47 Soybeans Rhizopus oryzae Flavor (Aroma
Compound)
Christen et al.,
2000
Bacillus subtilis
IFO 3013
Flavor (Aroma
Compound)
Besson et al., 1997
48 Soybean
(Ground)
Bacillus subtilis
IFO 3013
Flavor (Aroma
Compound)
Larroche et al.,
1999
49 Soybean Meal Rhizopus oryzae
ATCC 34612
Flavor (Aroma
Compound)
Bramorski et al.,
1998
50 Sugar Beet Pulp Aspergillus niger
I-1472
Feruloyl esterase Asther et al., 2002
51 Sugar Cane
Bagasse
Aspergillus niger
UO-01
Amylase Roses and Guerra,
2009
52 Sugarcane
Bagasse
Hydrolysate
Bacillus subtilis
strain KCC103
Alpha Amylase Rajagopalan and
Krishnan, 2008
53 Sunflower
Seeds
Penicillium
fellutanum
Protease Muller dos Santos
et al., 2004
54 Tea Waste Aspergillus niger Glucoamylase Selvakumar et al.,
1998

116
Table 2-11. Continued. Substrates used in Microbial Fermentations, Organisms Employed and the Products Generated
S/N Substrate Organism
Employed
Product Generated Reference(S)
55 Wheat Bran Aspergillus oryzae
IFO
30103
Alpha Amylase Dey & Banerjee,
2011
Bacillus
sp. KR-8104
Alpha Amylase Hashemi et al., 2011
Bacillus sp. Amylase Saxena & Singh,
2011
Aspergillus niger
JGI 24
Alpha Amylase Varalakshmi et al.,
2009
Aspergillus sp. JGI
12
Amylase Alva et al., 2007
Aspergillus sp. HA-
2.
Glucoamylase Anto et al., 2006
Thermomyces
lanuginosus
Amylase Kunamneni et al.,
2005
Bacillus sp. PS-7 Alpha Amylase Sodhi et al. 2005
Thermomucor
indicae-seudaticae
Glucoamylase Kumar &
Satyanarayana, 2004
Ceratocystis
fimbriata
Aroma Compound Christen et al., 1997
56 Wheat (Crushed) Thermomyces
lanuginosus
Amylase Kunamneni et al.,
2005
57 Wheat Flakes Thermomyces
lanuginosus
Amylase Kunamneni et al.,
2005
58 Wheat Flour Bacillus subtilis α-amylase;
β-galactosidase
Konsoula &
Liakopoulou-
Kiriakides, 2007
Aspergillus oryzae Alpha Amylase Rahardjo et al., 2005
59 Wheat Powder Aspergillus
fumigates
Glucoamylase Cherry et al., 2004
60 Yam Peel Aspergillus niger Amyloglucosidase Adeniran et al., 2010
Aspergillus niger Amylase Uguru et al., 1997

117
2.2.2.2 Carbon supplementation
For effective performance of microorganisms and optimal secretion of products,
substrates are often supplemented with carbon sources. Various sources of carbon
such as glucose, lactose, sucrose, and soluble starch, have been studied. These
studies revealed that the production rate of enzyme with added sugars could vary
widely depending on type of sugar, strain or type of microorganism and composition of
substrate. The highest production rates were obtained when sucrose was added to the
culture media during fermentation with Aspergillus sp. (Ellaiah et al., 2002; Anto et al.,
2006) and Aspergillus niger (Selvakumar et al., 1998). However, the latter was shown to
have a negative impact on enzyme production when fructose and lactose were added
(instead of sucrose). For Aspergillus. niger JG 24, the addition of glucose and sucrose
repressed the enzyme production rate when wheat bran was used as the solid material
(Varalakshmi et al., 2009). On the other hand, when cassava bagasse was used for
enzyme production, the addition of glucose had no significant impact on enzyme yields,
but the addition of starch to the culture medium had a negative impact on α-amylase
production with Aspergillus oryzae (Pengthamkeerati et al., 2012).
During production of β-amylase with Clostridium thermosulfurogenes, wheat bran
was used as support enriched with potato starch and corn steep liquor. A gradual
increase in the yield was observed when concentrations of potato starch and corn steep
liquor were increased from 5% to 20% and 0.5% to 2% respectively (Rama Mohan
Reddy et al., 2003).
2.2.2.3 Nitrogen supplementation
The effect of organic and inorganic nitrogen has also been studied, revealing an
improvement in production when yeast extract (YE) (Anto et al., 2006), malt extract

118
(Selvakumar et al., 1998), casein, meat extract (Varalakshmi et al., 2009), peptone,
tryptone (Kunamneni et al., 2005), and urea (Ellaiah et al., 2002; Kunamneni et al.,
2005) were added to the solid media. However, a negative effect on α-amylase
production was observed when a mixed substrate of biosludge and cassava bagasse
was used with the nitrogen sources (Penghamkeerati et al., 2012). The addition of
organic sources enhanced the production of α-amylase when wheat bran and
Aspergillus niger were used for enzyme production; but, the opposite occurred with urea
supplementation (Varalakshmi et al., 2009). In the case of glucoamylase production,
supplementation of wheat bran, corn steep liquor and peptone with urea showed
varying degrees of improvement in enzyme yields (Ellaiah et al., 2002).
2.2.2.4 Porosity and aeration
Porosity of the bulk solid materials used in SSF plays an important role in the
efficacy of solid state fermentations. Porosity can be quantified by the ratio of empty air
spaces (pores) to the total bulk volume of the porous material (Durand, 2003). Greater
porosity will promote improved aeration, enhancing oxygenation and regulation of
humidity and temperature because the combination of air and solid matrix has lower
thermal diffusivity compared to water (Pandey, 2003). Porosity also contributes to the
distribution of volatile compounds and amount of CO2 produced during the process
(Graminha et al., 2008). Air flow rate affects the production of enzymes such as α-
amylase, in which the use of different rates of air flow produce different enzymatic
activities during fermentation with Aspergillus oryzae IFO 30103 as the biocatalyst and
wheat bran as the substrate. One study obtained highest enzyme activity at a flow rate
of 0.1 L min-1 g-1 of wheat bran. Beyond that flow rate, the α-amylase activity dropped
gradually (Dey & Banerjee, 2012). Anto et al. (2006) used wastes from rice production

119
of flakes as carbon source for the substrate (coarse waste, medium waste, rice
powder), as well as wheat bran. Maximum enzyme production was obtained with wheat
bran according to Sodhi et al. (2005) and Ellaiah et al. (2002), followed by coarse and
medium waste. These results correlated well with starch content in the samples and
characteristics of the substrate used. Coarse wastes contain rice bran particles as
substrate and husk as support, increasing the porosity in the media and access to the
nutrients, thus allowing germination of spores and growth of mycelia.
Fermentation of wheat dough with A. oryzae, Rahardjo et al. (2005) resulted in
higher α-amylase and biomass production rates, along with production of aerial mycelia
by taking advantage of porosity to increase macroscopic respiration rate. The effect of
porosity on microorganism growth was reported by Murado et al. (1997) in which
negative signs in terms involving density of the solid support in a mathematical model
showed the restriction in intra-particular diffusion when working with high densities using
polyurethane foams as solid support during α-amylase production with A. oryzae.
In SSF, porosity is a key characteristic because the open pore structure of the
solid used as substrate or anchorage benefits the enzyme diffusion and the substrate
degradation happens inside. The fragments of substrate that are soluble in water have
to diffuse out of the solid matrix where the enzymes action produces metabolizable
compounds (Raghavarao et al., 2003).
2.2.2.5 Moisture content and water activity
Moisture content also affects the efficacy of SSF, and should neither be too high
nor too low. High moisture content decreases the porosity of the medium and impedes
oxygen penetration, while too low a moisture content can impede microbial growth
because of poor accessibility to nutrients (Pandey, 2003). Water activity is a measure of

120
the amount of water for any given moisture content that is freely available to support
microbial and biochemical activity. It can determine the type of microorganism that can
grow in SSF systems. For example, yeasts and molds can grow at water activities much
lower than the higher levels needed for bacteria. The relatively low water activities (aw)
used in SSF influence the physiological aspects of microorganisms, metabolite
production and enzyme activity (Graminha et al., 2008). Kareem et al. (2009) tried
different levels of initial moisture content for the production of glucoamylase by the
cultures A. oryzae BS41. Highest enzymatic activity was obtained with 60% initial
moisture content. The same moisture content (60%) was also found to be optimum in
the production of α-amylase by a strain of A. oryzae with cassava bagasse and
biosludge as culture medium. Higher moisture contents showed decreasing activity of α-
amylase (Pengthamkeerati et al., 2012). Furthermore, initial moisture content of 60%
was found to be the optimum for production of glucoamylase from fermentation of tea
waste with Aspergillus niger NCIM 1248, achieving maximum enzyme production of
198.4 IU/gds (glucoamylase units/gram dry substrate) at 96 hours of fermentation
(Selvakumar et al., 1998). The same 60%moisture content was also optimum for
fermentation with Streptomyces erumpens MTCC 7317 of cassava fibrous residue (Kar
et al., 2010).
However, a moisture content of 90% produced the highest enzyme activity (298
U/g) when the thermophilic strain Thermomyces lanuginosus was used with wheat bran
as the solid material support. Activity of less than 150 U/g was obtained when 60% initial
moisture content was used during the same fermentation (Kunamneni et al., 2005). When
the fermentation was made with a bacterial strain like Bacillus sp. PS-7 for the
production of α-amylase, the moisture content that produced the best enzyme yield was

121
60%; obtained when a ratio of 1:1.5 (wheat bran: tap water) was used (Sodhi et al.,
2005). The same ratio of wheat bran and distilled water (60% moisture) was obtained as
an optimum during fermentation with A. oryzae HS-3 for the production of
amyloglucosidase (Singh & Soni, 2001). Figure 2-12 summarizes the optimum moisture
contents found for various combinations of microorganism and substrate in enzyme
production.
Table 2-12. Optimum moisture content [% W/W] for various combinations of microorganism and substrate in enzyme production
S/N
Microorganism
Substrate
Optimum Moisture Content for
Enzyme Produced
Reference
Gluco-amylase
Alpha-amylase
1.
Aspergillus oryzae
BS41
Not reported
60
–
Kareem et al.
(2009)
2.
Aspergillus oryzae
Cassava fibrous
residue and
biosludge
–
60
Pengthamkeerati
et al., 2011
3.
Aspergillus niger
NCIM 1248
Tea waste
60
–
Selvakumar et
al., 1998
4.
Streptomyces
erumpens MTCC 7317
Cassava fibrous
residue
60
–
Kar et al., (2010)
5.
Thermomyces
lanuginosus
Wheat bran
90
–
Kunamneni et
al., (2005
6.
Bacillus sp. PS –7
Wheat bran
60
Sodhi et al.,
(2005
7.
Aspergillus oryzae
HS–3
Wheat bran
60
–
Singh & Soni,
(2001)

122
2.2.2.6 Incubation temperature
Temperature is a main factor during SSF for enzyme production, not only
because it affects the growth of the microorganism, but because during the production
of some thermolabile enzymes, the increasing temperature due to microorganism
metabolism can cause its denaturation, lowering the yield of the process. Muller dos
Santos et al. (2004) developed a mathematical model that showed the behavior of
temperature during SSF for the production of protease with P. fellatanum in a large
scale process with a mixing bioreactor, controlled air flow and water-jacket. This system
reached a temperature of 48°C using one volume of air per total bioreactor volume per
minute and cooling water temperature at 30°C. However, results showed that only 25%
of the enzyme produced retained any activity. On the other hand, using the same air
flow rate with water temperature of 14.5°C, approximately 87% activity was retained.
For A. oryzae the effect of temperature showed a maximum α-amylase activity
when the fermentation process was carried out at 32°C, with a sharp decrease at higher
temperatures (Dey & Banerjee, 2012). Similar results were obtained by Ellaiah et al.
(2002) at an optimum temperature of 30°C for glucoamylase production with A. oryzae
SP-3. Francis et al. (2003) also found similar results during optimization of fermentation
parameters when producing α-amylase with spent brewers grains and Bacillus sp. PS-7.
Highest productivity was obtained at 37°C with optimum enzyme activity at 60°C, which
remained very thermostable at 50°C during 6 hours (Sodhi et al., 2005). It should be
noted that optimum temperatures for the production of the enzyme are not the same as
those for enzyme activity. For A. niger JGI 24, the maximum α-amylase activity was
obtained at 22°C, being negatively affected with higher temperatures (37°C and 40°C).
The best activity of the purified enzyme was obtained at 30°C (Varalakshmi et al.,

123
2009). Enzymes produced by thermophilic microorganisms like Thermomyces
lanuginosus have better activity during fermentation at higher temperatures. The
optimum temperature for amylase production was found to be 50 °C (263 U/g) with very
high thermostability at this temperature. Optimal enzyme activity was found at 60°C
(Kunamneni et al., 2005), in accordance with the results obtained by Kar et al. (2010)
during optimization of fermentation for production of α-amylase using cassava fibrous
residue as a culture medium and the actinomycete strain Streptomyces erumpens
MTCC 7317. Table 2-13 summarizes the optimum temperature for enzyme production
and activity with various combinations of microorganism and substrate.
2.2.2.7 Inoculums concentration
The inoculum level is an important factor for the production of amylase. During
glucoamylase production with A. niger NCIM 1248, different inoculum concentrations
were used (1, 2, 3, 4, 5%). An inoculums level of 4% produced maximum glucoamylase
(198.4 IU/gds at 96 h of fermentation), with no increase in enzyme production at any
higher concentration of inoculum (Selvakumar et al., 1998). In the case of A. oryzae
TISTR 3605 with cassava bagasse and biosludge as culture medium, an inoculum level
of 3x10⁷ spores/ml was found to produce the maximum α-amylase activity with 60%
initial moisture content and 35°C over 48 hours of incubation. The growth curve for this
strain of A. oryzae showed an exponential phase of microbial growth during the first 48
hours of incubation followed by a decreasing period after reaching the optimum
(Pengthamkeerati et al., 2012). This same behavior was observed by Dey & Banerjee
(2012), who obtained a maximum α-amylase activity of 17989 U/gds at 48 hours of
incubation followed by reduction of activity beyond the 48 hours.

124
Table 2-13. Optimum temperature for enzyme production and activity with various combinations of microorganism and substrate
S/N Microorganism Substrate Optimum Temperature for Enzyme Production
and Activity (oC)
Reference
Enzyme Production
Enzyme Activity
1.
P. fellatanum
Not reported
14.5
Dos Santos et al. (2004)
2.
Aspergillus oryzae
Not reported
32
Dey &
Banerjee, (2011)
3.
A. oryzae SP-3
Not reported
30
Ellaiah et al.
(2002) 4.
Bacillus sp. PS-7
Spent brewer’s grains
37
60
Francis et al.
(2003); (Sodhi et al.,
2005). 5.
A. niger JGI 24
Not reported
22
30
Varalakshmi et al., (2009)
6.
Thermomyces lanuginosus
Not reported
50
60
Kunamneni
et al., (2005), 7.
Streptomyces erumpens MTCC
7317
Cassava fibrous residue
50
60
Kar et al.
(2010)
Another strain of A. oryzae BS 41 produced optimum glucoamylase production
(980 U/ml) with an inoculum concentration of 4%. A lower concentration could be
insufficient for initiating the growth and production of the enzyme during fermentation
time (72 hours), and a higher concentration would result in diminished enzyme activity
due possibly to reduced nutrient availability (Kareem et al., 2009). This inhibitory effect
of high levels of inoculum was also seen by Kunamneni et al. (2005) with the highest
enzyme production of 267 U/g at an inoculum level of 10% (v/w) and Kumar &

125
Satyanarayana (2004) during fermentation of wheat bran with the thermophilic mold,
Thermomucor indicae-seudaticae for glucoamylase production.
On the contrary in the study of Anto et al. (2006), the inoculum size showed little
effect on enzyme production during fermentation with Aspergillus sp. HA-2, obtaining an
activity of 264 ± 0.64 U/gds when wheat bran was used as a culture medium, followed
by 211.5 ± 1.44 in rice coarse waste and 192.1 ± 1.15 U/gds in medium waste with an
optimum inoculum size of 106 spores/ml. Dey & Banerjee (2012) and Sodhi et al. (2005)
used an inoculum concentration of 1x10⁶ spores/ml for A. oryzae IFO 30103 and 1.5
x106 cells/ml for Bacillus sp. PS-7 respectively.
2.2.2.8 Fermentation time and pH
Fermentation time at a given temperature for optimum production of enzyme
must also be controlled. In the case of Streptomyces erumpens, the optimum time at a
given temperature was 60 hours, after which enzyme yield decreased (Kar et al., 2010).
In the case of Thermomyces lanuginosus, the enzyme activity was observed to increase
from 24 to 120 hours, reaching a maximum activity of 262 U/g. Beyond the 120 hours,
activity decreased, possibly due to denaturation or loss of moisture during the process
(Kunamneni et al., 2005). The pH is also an important factor in fermentation processes,
and acts in synergy with other process parameters (Kumar & Satyanarayana, 2004).
This became evident in a study Pengthamkeerati et al. (2012) showing lower α-amylase
production and activity at pH values other than 7.0 during fermentation with A. oryzae
TISTR 3605. This pH value of 7.0 was also very close to the optimum value obtained by
Varalakshmi et al. (2009) for fermentation with A. niger JG24. Some strains of
Aspergillus sp. have an optimum value of pH in the acidic range of 4 – 6 (Ellaiah et al.,
2002; Anto et al., 2006; Dey & Banerjee, 2012).

126
2.2.3 Bioreactor Designs in Solid-State Fermentation
Important factors that affect the design and scale-up of bioreactors for solid-state
fermentation (SSF) are the following:
Thermal gradients caused by the lack of heat transfer across surfaces and poor thermal conductivity of the substrate, as well as air flow could impede removal of the metabolic heat produced during the growth of the microorganisms (Mitchell et al., 2000).
Transfer of oxygen, nutrients and enzymes affect the substrate characteristics and moisture content (Durand, 2003; Raghavarao et al., 2003).
Operation of mixers where microorganisms or substrates are sensitive to shear forces.
Bioreactors for SSF are normally classified by their size or capacity in order to
appropriate for laboratory scale, pilot plant, or industrial scale (Durand 2003). Various
SSF bioreactor designs commonly used are described briefly below:
2.2.3.1 Packed bed reactor
Packed-bed reactors consist of a column with a perforated base, and use forced
aeration, making it possible to control oxygen supply, temperature and moisture content
(Pandey et al., 1994; Lu et al., 1998). However, the unidirectional nature of the air flow
causes an axial temperature gradient which can cause low yields or cell death (Ashley
et al., 1999; Mitchel et al., 2010). Based on this factor, Lu et al. (1998) compared the
behavior of a glass-packed bed bioreactor using a single layer and a multi-layer
configuration. No significant differences in temperature, residual starch concentration or
citric acid production could be found among the layers. The single layer configuration
showed a temperature gradient up to 2 °C, and the citric acid production was lower than
that in the four layer bioreactor when using a strain of Aspergillus niger and kumara as
substrate. Mitchel et al. (1999) observed that the behavior of temperature in packed-bed

127
reactors using a single layer steadily increased with height. Their study concluded that
the bed height must be lower than the height at which the critical temperature is
reached during fermentation.
Mitchel et al. (2010) modeled the performance of a multi-layer configuration with
10 levels, using the N-tanks-in-series approach. Sahir et al. (2007) used different
operation strategies in order to avoid temperature gradients. Best results were obtained
by operating the reactor as a continuous plug-flow, multi-layer packed-bed, which has a
lower rate of heat generation than batch operation. Silva & Yang (1998) found that the
performance of a packed-bed reactor with forced aeration was superior to that obtained
with tray type fermentation reactor.
2.2.3.2 Tray bioreactor
Tray bioreactors are based on a simple design that evolved from ancient
technology. It consists of flat trays that can be perforated or not where the substrate is
placed in a thin layer (15 cm maximum) and kept under controlled temperature with
humidified air. During fermentation of rice for amylase production with Aspergillus
oryzae, the static solid-state fermentation showed that mass transfer is a problem in this
type of reactor, even when the bed depth is only several centimeters (Silva & Yang,
1998), and is used in thermostatic chambers (Couto and Sanroman, 2006; Durand,
2003).
2.2.3.3 Drum bioreactor
In drum bioreactors, mixing can be carried out continuously or discontinuously by
gently rotating the entire cylindrical drum, and controlling the temperature by circulating
water in a jacket (Durand, 2003; Kalogeris et al., 1999). Other designs use ribbon-
shaped baffles for the mixing with rotation of a basket (Raghavarao et al., 2003). In

128
some cases the continuous agitation can change the characteristics of the medium or
cause the damage of the mycelium, and must be avoided (Durand, 2003).
2.2.3.4 Fluidized bed bioreactor
Fluidized bed designs use forced air in order to maintain continuous agitation to
avoid adhesion and aggregation of substrate particles, but the shear forces that develop
can cause damage to the mycelium and affect the final product yield. Figure 2-22 is a
schematic of a fluidized bed bioreactor (Couto & Sanroman, 2006).
Figure 2-22. Schematic of a Fluidized Bed Bioreactor that uses Humidified Air for
Pneumatic Agitation. (Photo from Couto & Sanroman, 2006).

129
2.2.4 Submerged Fermentation (SmF)
Submerged fermentation (SmF) is carried out by dispersing the substrate
ingredients in an excess of water (Singhania et al., 2010). The control of temperature
and pH is not as complicated as in SSF. One of the most important variables is oxygen
transfer which depends on size and shape of the reactor. The ability to transfer oxygen
independently of reactor volume can be quantified by the oxygen transfer coefficient KLa
(Durand, 2003), which is an important parameter for fermentation process design. Other
factors that need to be specified are the medium composition and process conditions
that are discussed below.
2.2.4.1 Temperature and pH
Various types and strains of microorganism have been studied under varied
temperature and pH conditions to produce amylolytic enzymes. These organisms, each
with special characteristics were assessed for enzymes that can be adapted to
industrial processes, like starch liquefaction that requires α-amylases with high thermo-
stability (Gupta et al.,2003). Some strains such as Chromohalobacter sp. TVSP 101,
produces thermo-stable, halo-tolerant and alkali-stable α-amylases. Other strains that
were studied include the following:
Halobacillus sp. MA-2 (Prakash et al., 2009) ,
Micrococcus sp. NS 211 with the capacity to grow in an acid medium and at high temperatures (Amoozegar et al., 2003),
Microbacterium foliorum GA2, a psychrotolerant amylolitic bacteria (Samie et al., 2012),
Bacillus cereus GA6 (Kuddus et al., 2012),

130
Pseudoalteromonas arctica (Lu et al., 2010),
Bacillus sp. (Syu & Chen, 1997; Burhan et al., 2003; Goyal et al., 2005; Liu & Xu, 2008), and
Streptomyces sp. ML 12, a marine actinobacterium isolated by Sivakumar et al., (2012).
The strain Chromohalobacter sp. produced enzyme over a broad range of pH;
from 6.0 to 10 with an optimum of 9.0, at an optimum growth temperature of 37°C.
These optima process conditions were also found for Bacillus sp. ANT-6 during α-
amylase production (Burhan et al., 2003). Since Chromohalobacter sp. is quite halo-
tolerant, maximum enzyme production was obtained when the culture medium
contained 20% NaCl or 15% KCl. Under these conditions, two isozymes were secreted
when grown with high-salt contents from 10 to 30% (Prakash et al., 2009). Two α-
amylase isoforms were also found during fermentation with Aspergillus oryzae,
obtaining an increase in concentration of one of these isozymes (AmyB), while the other
(AmyA) disappeared through the culture (Sahnoun et al., 2012).
For production of thermo-stable enzymes with Micrococcus sp., the highest
levels of amylase were found at 85°C. The microbe was capable of growing at
temperatures of 110°C and pH from 1.2 to 8.0 with an optimum pH of 3.5 when starch
was used as the carbon source in the culture medium (Samie et al., 2012). On the other
hand, Microbacterium foliorum and Bacillus cereus isolated from soil from the Gangotri
glacier in western Himalaya-India produced maximum α-amylase at 20°C. Both strains
were pH tolerant with a maximum production of amylase at pH 9 and 10 respectively.
With the strain of Bacillus subtilis, maximum α-amylase yield was obtained at pH 7.0
and 50°C. Supplementation of the medium with calcium stimulated enzyme production
and bacterial growth (Asgher et al., 2007). Konsoula & Liakopoulou-Kiriakides (2007)
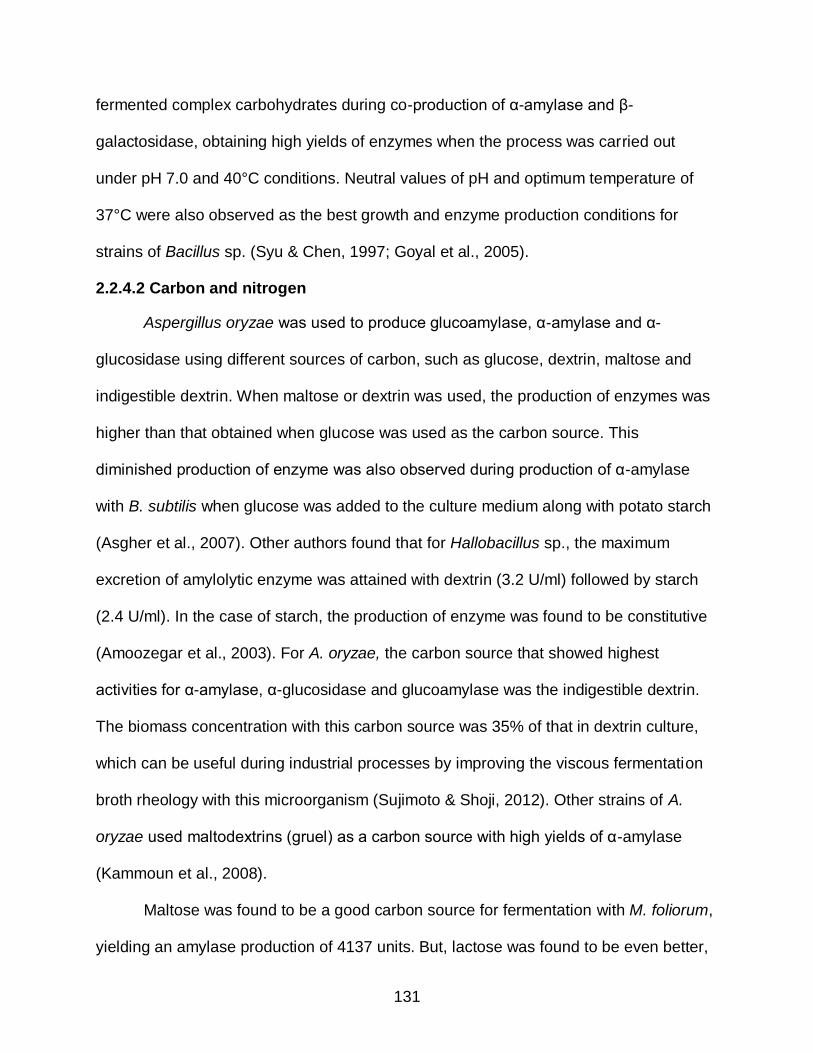
131
fermented complex carbohydrates during co-production of α-amylase and β-
galactosidase, obtaining high yields of enzymes when the process was carried out
under pH 7.0 and 40°C conditions. Neutral values of pH and optimum temperature of
37°C were also observed as the best growth and enzyme production conditions for
strains of Bacillus sp. (Syu & Chen, 1997; Goyal et al., 2005).
2.2.4.2 Carbon and nitrogen
Aspergillus oryzae was used to produce glucoamylase, α-amylase and α-
glucosidase using different sources of carbon, such as glucose, dextrin, maltose and
indigestible dextrin. When maltose or dextrin was used, the production of enzymes was
higher than that obtained when glucose was used as the carbon source. This
diminished production of enzyme was also observed during production of α-amylase
with B. subtilis when glucose was added to the culture medium along with potato starch
(Asgher et al., 2007). Other authors found that for Hallobacillus sp., the maximum
excretion of amylolytic enzyme was attained with dextrin (3.2 U/ml) followed by starch
(2.4 U/ml). In the case of starch, the production of enzyme was found to be constitutive
(Amoozegar et al., 2003). For A. oryzae, the carbon source that showed highest
activities for α-amylase, α-glucosidase and glucoamylase was the indigestible dextrin.
The biomass concentration with this carbon source was 35% of that in dextrin culture,
which can be useful during industrial processes by improving the viscous fermentation
broth rheology with this microorganism (Sujimoto & Shoji, 2012). Other strains of A.
oryzae used maltodextrins (gruel) as a carbon source with high yields of α-amylase
(Kammoun et al., 2008).
Maltose was found to be a good carbon source for fermentation with M. foliorum,
yielding an amylase production of 4137 units. But, lactose was found to be even better,

132
producing a maximum yield at 5862 units. However, use of lactose as a carbon source
for amylase production with B. cereus produced a lesser yield of 4744 units (Kuddus et
al., 2012). When starch and glycerol were used with Bacillus subtilis IMG 22, a perfect
interaction between these variables was found to yield maximum enzyme activity when
optimum levels of starch and glycerol were added; the latter with the greater effect on
enzyme production (Tanyildizi et al., 2005). The use of starch for enzyme production
with B. subtilis was also studied by Konsoula & Liakopoulou-Kiriakides (2007). The
authors concluded that soluble starch was a good carbon source for enzyme
production, while sugars like glucose, maltose or lactose suppressed the production of
α-amylase and β-galactosidase.
The alkaline amylase producer Bacillus sp. JCM 9141 yielded maximum amylase
activity of 45U amylase/ml with starch as carbon source, and 50U amylase/ml with
glucose as a carbon source, showing that for this strain, starch is not a great inducer for
amylase production (Zhang et al., 2004). Studies on α-amylase production with Bacillus
licheniformis ATCC 9945a were also reported by Božić et al. (2011). Enzyme production
was associated with cell growth for Bacillus sp. (Zhang et al., 2004). This same
observation was made during fermentation with Bacillus subtilis JS-2004 using 1% of
waste potato as a carbon source (Asgher et al., 2007), as well as with Bacillus sp.
(Goyal et al., 2005; Liu & Xu, 2008).
Agroindustrial wastes like yam peel (Uguro et al., 1997), gruel (wheat grinding
by-product) (Kammoun et al., 2008) have also been used as carbon sources for
submerged fermentation. For industrial fermentation, the design of the medium is very
important, as it affects the cost and the product yield. Sivakumar et al. (2012) used

133
wheat bran, rice bran and tapioca as carbon sources. They showed that wheat and rice
bran enhanced the production of α-amylase, resulting in 42.412 IU/ml, while tapioca
was not a significant factor during culture media optimization. Production of α-amylase
from fermentation of brewery waste water with the strain Aspergillus niger UO-1 was
found to increase when supplemented with starch and the use of casamino acids, yeast
extract and peptone (Hernandez et al., 2006).
Kuddus et al. (2012) evaluated nitrogen sources, such as casein, glycine, yeast
extract, ammonium acetate and ammonium sulfate. Maximum production of α-amylase
was obtained with B. cereus and ammonium acetate, or with M. foliorum and yeast
extract. Similar results were found with Bacillus subtilis JS-2004 when yeast extract
and calcium were added in the medium, increasing bacterial growth and α-amylase
production (Asgher et al., 2007). On the contrary, during fermentation with B. subtilis
IMG 22, the use of yeast extract was not significant for the improvement of α-amylase
production (Tanyildizi et al., 2005). It has also been reported that wheat bran when
supplemented with metal ions, carbon and nitrogen sources was the best substrate
(among those tested) for the production of amylase and protease (Shivakumar, 2012).
2.2.4.3 Salts
The maximum production of enzyme with Halobacillus sp. was observed in a
medium with 15% (w/v) NaSO4, followed by 10% NaCl. When sodium nitrate was added
to the medium, no extracellular amylase production was observed (Amoozegar et al.,
2003). When potassium nitrate, citrate, potassium chloride and calcium chloride were
used with Streptomyces sp., the salts found to have significant effect on α-amylase
activity were sodium chloride and magnesium sulfate (Sivakumar et al., 2012).

134
The use of calcium to enhance the production of α-amylase with Bacillus sp. has
been reported by several workers (Asgher et al., 2007; Konsoula and Liakopoulou-
Kiriakides, 2007; Kuddus et al., 2012). However, in the case with A. oryzae CBS
819.72, the presence of Ca2+ had no effect on α-amylase production, while magnesium
and phosphate where very important (Kammoun et al., 2008).
2.2.5 Summary on Enzyme Production
Production of amylolytic enzymes suitable for industrial use is very important due
to the wide range of applications like detergent industry, bakery products, sugar syrups,
brewery etc. Because of the differences between these processes, microorganisms
isolated from sources as different as glaciers and hot springs or soil and marine sources
have been studied in order to obtain enzymes with special characteristics. Studies in
search of optimum combinations of microorganisms, substrate composition and process
conditions revealed there was no one-size-fits-all. Optimum conditions for maximum
yields varied widely depending on specific strain of microorganism and substrate
composition used in the fermentation process. Submerged fermentation continues to be
the most widely used method of microbial enzyme production in western countries.
However, solid-state fermentation has gained interest in recent years for fermentation of
bulk solids. Novel bioreactor designs are of interest for researchers because of the
necessity to improve mass and heat transfer during fermentation with large amounts of
substrate.

135
CHAPTER 3 PHYSICAL PROPERTIES OF CASSAVA FLOUR MADE FROM SOLAR
CONVECTION-DRIED CASSAVA CHIPS
3.1 Background
Cassava, Manihot esculenta Crantz, sometimes also referred to as Mandioca,
Manioc, Tapioca or Yuca is the third largest source of carbohydrate for human food in
the world (Nassar and Ortiz, 2010; Claude and Denis, 1990; Phillips, 1982). Most of the
world’s production comes from developing countries. At present, Nigeria is the number
one cassava producer both in Africa and in the world (FAO, 2013; Phillips et al., 2004;
Hillocks, 2002). In 2008, Nigeria produced 44.582 million tons of cassava valued at over
$ 3.312 x 10⁹ (Food and Agriculture Organization of the United Nations (FAO), 2010).
Haiti is known as a major cassava producer in the South America and Caribbean region
(Henry and Hershey, 2002]. The 435,000 tons of cassava produced by Haiti in 2008
ranked her 5th in the region. Haiti’s output was exceeded only by Brazil (26.703 million
t); Paraguay (2.219 million t); Columbia (1.803 million t) and Peru (1.172 million t) (FAO,
2010). These nations have been increasing their output mainly due to cassava’s high
productivity; cash and subsistence crop profile; tolerance of poor soils and low rainfall;
good resistance to pests and diseases; and more than two years harvest window. The
long harvest window affords poor farmers not only some protection against famine, but
also guarantees flexible labor management schedules. Because farmers can “store”
the starchy roots underground in the field, they do not need to worry about expensive
refrigeration or other food preservation techniques. Perhaps more importantly however,
is the fact that the cassava crop can be transformed into such products as starch, flour,
and ethanol; with huge potential industrial applications (Hakizimana, 2010; Widowati
and Hartojo, 2010; Johnson et al., 2009; Eneas, 2006; Srinorakutara et al., 2006;

136
Balagopalan et al., 1988; Berghofer and Sarhaddar, 1988; Srikanta et al., 1987;
Matsumoto et al., 1982; Ueda et al., 1981; Lindeman and Rocchiccioli, 1979).
3.2 Objectives
Constraints that limit the utilization of cassava crop include shelf life and mass.
Cassava roots are bulky and heavy, and therefore expensive to transport over long
distances. The roots are also extremely perishable, thus must be either consumed or
processed within a few days after harvest (Eneas, 2006; Balagopalan et al., 1988;
Kuppuswamy, 1961). To overcome these limitations, cassava roots would need to be
processed near the source of production using appropriate technology, and into
products that are less bulky and with longer shelf life such as chips, flour, starch and
sweeteners. The objectives of the work reported in this study were to:
1. Produce dried cassava chips using a prototype solar convection dryer, 2. Produce cassava flour from grinding the chips, 3. Determine and report the following properties of chips and flour:
a) Sorption isotherms and drying curves on the chips, and b) Moisture content, particle size distribution, bulk density, solid particle density,
porosity, permeability and specific surface area of the flour.
3.3 Methods and Procedures
3.3.1 Scope of Work
The scope of work undertaken in this study consisted of a series of efforts to
determine basic physical properties for cassava chips and flour. These included
sorption isotherms and drying curves on the fresh cassava pulp to produce the dried
chips, and moisture content, particle size distribution, bulk density, solid particle density,
porosity, permeability and specific surface area of the flour.
The work was carried out in the physical properties laboratory of the Agricultural
and Biological Engineering (ABE) Department at the University of Florida. The purpose

137
of this work was to obtain estimates for physical properties of cassava chips and flour
that could be used for design work.
3.3.2 Fresh Cassava Root
3.3.2.1 Sample preparation
Fresh cassava roots were purchased from Brooks Tropicals, Homestead, Florida.
Fresh cassava chips were made by peeling the tubers and slicing them into thin chips
with approximate thickness of 2 mm using a Hobart Slicer, Model 1712E (Hobart
Corporation, Troy, Ohio). The sliced fresh chips at about 60% (wb) moisture were
spread onto screen mesh trays in a single layer, and placed into a prototype solar
convection dryer; shown in Figure 3-1, designed and fabricated at the University of
Florida (Schiavone et al., 2013). The chips were dried to approximately 10% (db)
moisture, and stored in air-tight containers until ready for use.
Figure 3-1. Prototype Solar Convection Dryer used for Drying Cassava Chips. Photo courtesy of A. A. Teixeira.
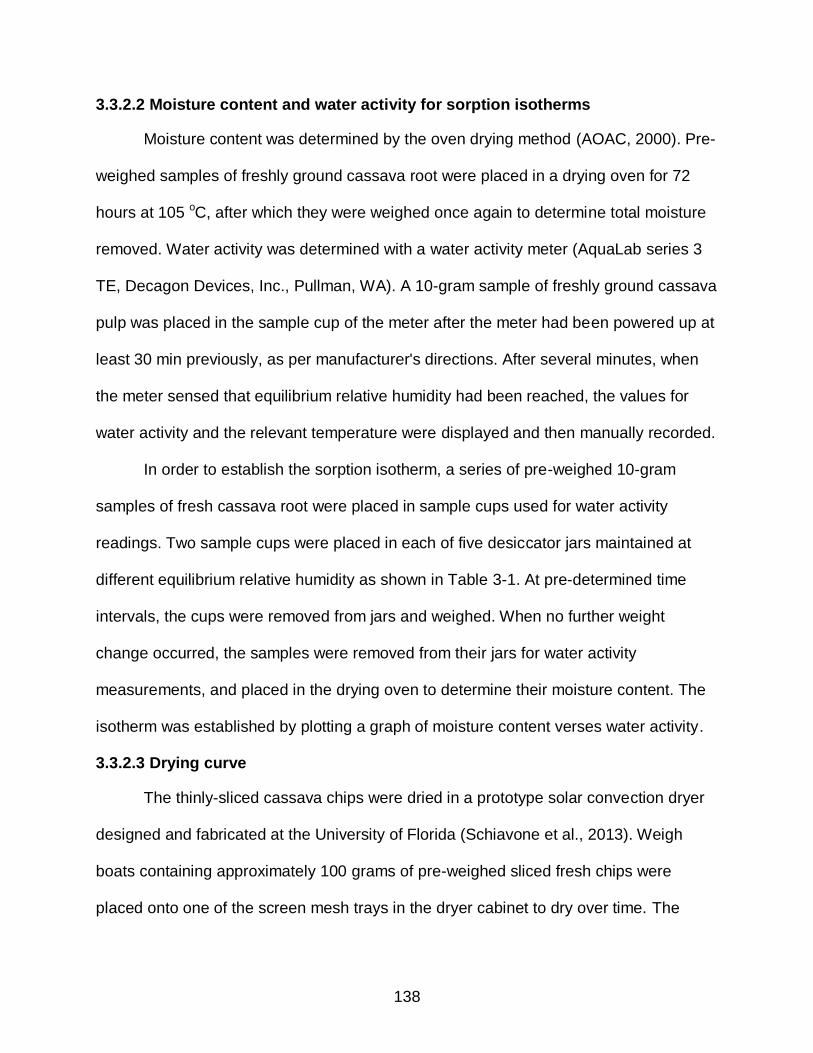
138
3.3.2.2 Moisture content and water activity for sorption isotherms
Moisture content was determined by the oven drying method (AOAC, 2000). Pre-
weighed samples of freshly ground cassava root were placed in a drying oven for 72
hours at 105 oC, after which they were weighed once again to determine total moisture
removed. Water activity was determined with a water activity meter (AquaLab series 3
TE, Decagon Devices, Inc., Pullman, WA). A 10-gram sample of freshly ground cassava
pulp was placed in the sample cup of the meter after the meter had been powered up at
least 30 min previously, as per manufacturer's directions. After several minutes, when
the meter sensed that equilibrium relative humidity had been reached, the values for
water activity and the relevant temperature were displayed and then manually recorded.
In order to establish the sorption isotherm, a series of pre-weighed 10-gram
samples of fresh cassava root were placed in sample cups used for water activity
readings. Two sample cups were placed in each of five desiccator jars maintained at
different equilibrium relative humidity as shown in Table 3-1. At pre-determined time
intervals, the cups were removed from jars and weighed. When no further weight
change occurred, the samples were removed from their jars for water activity
measurements, and placed in the drying oven to determine their moisture content. The
isotherm was established by plotting a graph of moisture content verses water activity.
3.3.2.3 Drying curve
The thinly-sliced cassava chips were dried in a prototype solar convection dryer
designed and fabricated at the University of Florida (Schiavone et al., 2013). Weigh
boats containing approximately 100 grams of pre-weighed sliced fresh chips were
placed onto one of the screen mesh trays in the dryer cabinet to dry over time. The

139
Table 3-1. Saturated Salt Solutions and Associated Equilibrium Relative Humidity when placed in Desiccator Jars.
Saturated Salt Solution
Equilibrium Relative Humidity at 22 o C (%)
Magnesium Chloride
32.8
Sodium Bromide 57.6
Sodium Chloride 75.3
Potassium Bromide 81.8
Potassium Sulfate 97.3
initial moisture content of these chips was determined using the oven dry method
(AOAC, 2000) with sister samples of chips. At pre-determined time intervals, the weigh
boats were removed from the dryer for weight measurement, and returned to the dryer.
The drying process was terminated after about 28 hours when no further weight loss
was observed. The moisture content at each pre-determined time interval was
calculated by knowing the initial weight of the sample and the weight reached at that
time interval. The drying curve was established by plotting a graph of moisture content
(dry basis) verses time. This work was repeated three times to obtain three replicate
drying curves.
3.3.3 Cassava Flour
3.3.3.1 Sample preparation
Samples of cassava flour were made by blending dried chips (10% moisture db)
with Osterizer® Designer Cycle Blender (Sunbean Corporation, Fort Lauderdale,
Florida) until particle sizes less than 0.5 mm could be obtained. Optimum blender

140
operating conditions were chosen by comparing particle size distribution profiles
obtained from different combinations of grinding time and blender speed on chips made
from two different varieties of cassava (Algodon and Valencia) and two different chip
thicknesses (2mm and 4mm). Particle size distributions were obtained using a vibrating
stacked sieving machine (Octagon-2000, Endicotts Ltd. London, England).
3.3.3.2 Physical properties
Bulk density, solid particle density and porosity were determined by use of a
multi-pycnometer (Quantachrome®, Boynton Beach, FL). Permeability was measured
using an air flow apparatus fabricated in shop facilities of the Agricultural and Biological
Engineering Department at the University of Florida. This apparatus is illustrated in
Figure 3-2. It provided a means by which a sample of cassava flour contained in a
Figure 3-2. Air Flow Apparatus for Determination of Permeability
cylindrical sample holder of known dimensions could be placed in the path of airflow at
known flow rate. By measuring the pressure drop across the sample while air was
flowing, the permeability of the sample could be determined as a function of this
pressure drop and air flow rate. The cylindrical sample holder was 10cm in length and
2cm in diameter. The pressure drop across the sample was measured with an inclined

141
oil manometer, and flow rate was determined with use of an annubar flow measuring
device (F.W. Dwyer MFG. Co., Michigan City, Indiana) for measurement of flow rate.
With the airflow on, the pressure drop across the annubar was recorded with the same
oil manometer to calculate air flow rate, and the pressure drop across the sample of
flour was determined. The permeability (K) was calculated from Darcy's equation (eq. 3-
1). Once the permeability was known, the specific surface area of the flour could be
estimated as a function of permeability and porosity using the Carmen-Kozeny equation
(eq. 3-2).
K = (q L) / (A Ps) (eq. 3-1)
K = P3 / [5 S2 (1-P)2] (eq. 3-2)
Where K = material permeability (m2), q = air flow rate (m3/sec), = viscosity of air
(1.82E-5 Pa.s), L = length of cylindrical sample holder (m), A = cross sectional area of
cylindrical sample holder (m2), Ps = pressure across sample (Pa), P = porosity
(dimensionless), and S = specific surface area (m2/m3).
3.4 Results
3.4.1 Sorption Isotherm and Drying Curves for Fresh Cassava Root Pulp
The sorption isotherm for the fresh cassava root pulp is shown in Figure 3-3. The
profile is typical of most sorption isotherms, showing that moisture content decreases
rapidly with decreasing water activity at relatively high water activity, but slows down
dramatically at water activity less than 0.6. A water activity of 0.6 is well below the water
activity at which most yeast and bacterial activity could occur (Isengard et al., 2011).
The moisture content at water activity of 0.6 (approximately 10% db) was chosen as
target end point for the drying of fresh cassava slices into dried chips.

142
The three replicate drying curves shown in Figure 3-4 suggest that the target
moisture level of 10% db could be reached within 25-28 hours of residence time in the
solar convection dryer. This was well within the 48 hours actually used for drying the
cassava chips in this study.
Figure 3-3. Sorption Isotherm of Fresh Cassava Root Pulp Slices for Drying into Chips (Error bars at two standard deviations).
3.4.2 Physical Properties of Cassava Flour
Particle size distributions in samples of cassava flour made from grinding dry
cassava chips under various blender operating conditions are shown in Figure 3-5. The
particle size distribution profiles shown in the figure were obtained from different
5
7
9
11
13
15
17
19
0.3 0.4 0.5 0.6 0.7 0.8 0.9
Moisture Content
[% Dry Basis]
Water Activity [Aw]
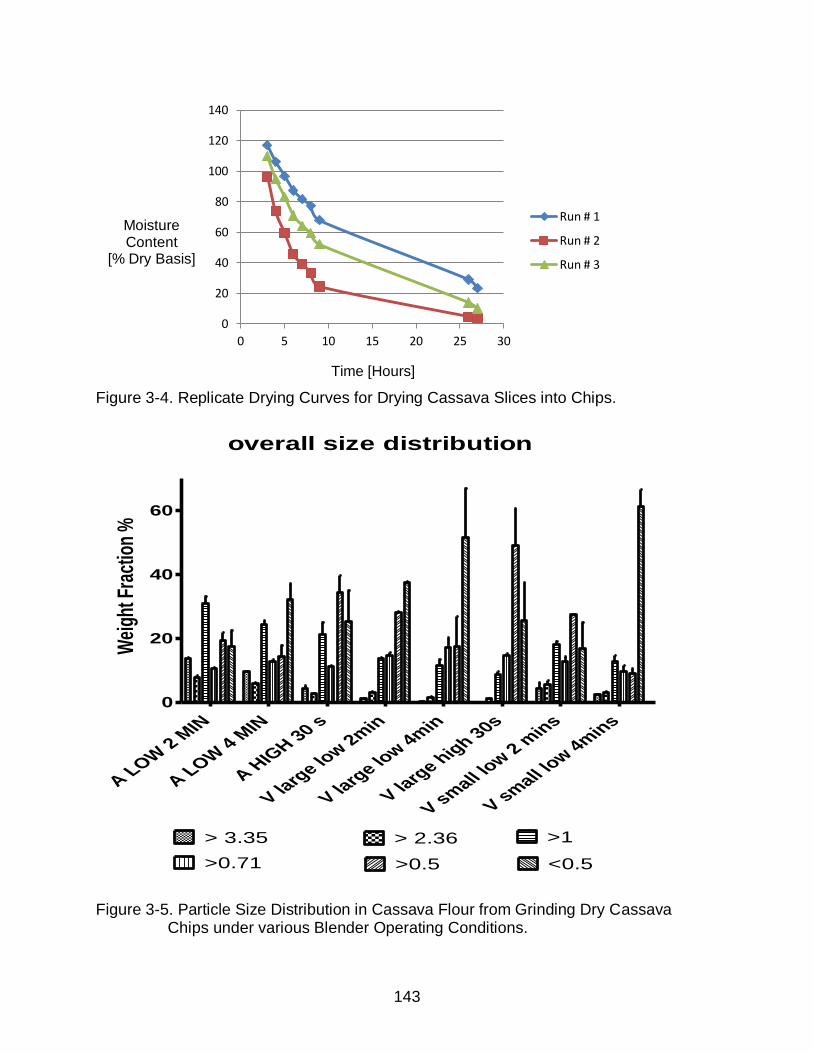
143
Figure 3-4. Replicate Drying Curves for Drying Cassava Slices into Chips.
overall size distribution
A LOW
2 M
IN
A LOW
4 M
IN
A HIG
H 30 s
V larg
e low 2
min
V larg
e low 4
min
V larg
e hig
h 30s
V sm
all lo
w 2 m
ins
V sm
all lo
w 4m
ins
0
20
40
60
> 3.35 > 2.36 >1
>0.71 >0.5 <0.5
Wei
ght F
ract
ion
%
Figure 3-5. Particle Size Distribution in Cassava Flour from Grinding Dry Cassava Chips under various Blender Operating Conditions.
0
20
40
60
80
100
120
140
0 5 10 15 20 25 30
Moisture Content
[% Dry Basis]
Time [Hours]
Run # 1
Run # 2
Run # 3

144
combinations of grinding time and blender speed (high or low) on chips made from two
different varieties of cassava, Algodon (A) and Valencia (V) and two different chip
thicknesses, small (2mm) and large (4mm). Small chips from Valencia roots were
chosen for the study. The profiles for these small chips for two different blending times
at slow speed appear at the far right side of the figure. The profile obtained from four
minutes at low speed produced a sample in which more than 60% of the sample weight
consisted of the desired particle size (less than 0.5 mm). These were the grinding
conditions chosen for producing the samples of flour used in this study.
Physical properties of moisture content, bulk density, solid particle density,
porosity, permeability and specific surface area are summarized in Table 3-2, along with
statistics showing number of replicate measurements and minimum and maximum
values found among the replicates.
Table 3-2. Physical properties of cassava flour with particle size ≤ 0.5 mm.
Physical Property Mean Value
Number of Replicates
Minimum Value
Maximum Value
Moisture Content (%db)
12.35
2
12.34
12.37
Bulk Density (kg/m3)
550
2
530
570
Solid Particle Density (kg/m3)
1,480
2
1,442
1,517
Porosity (Dimensionless)
0.636
2
0.630
0.642
Permeability (m2)
1.0 x 10⁻⁶
2
1 x 10⁻⁶
1 x 10⁻⁶
Specific Surface Area (m2/m3)
367
2
367
367

145
3.5 Summary
The measurements of drying characteristics and physical properties of cassava
chips and flour were carried out and reported in this study. These included a sorption
isotherm and drying curve on the chips, and moisture content, particle size distribution,
bulk density, solid particle density, porosity, permeability and specific surface area of
the flour. A prototype solar-convection dryer was used to produce the dried cassava
chips which were ground into flour as a means of preservation and adding value to the
cassava crop. Data on physical properties reported in this study will be most useful to
carry out engineering design of storage, handling, and processing systems for the flour
thus produced.

146
CHAPTER 4 SYNERGISTIC ENZYMATIC HYDROLYSIS OF CASSAVA STARCH
4.1 Background
Sugar generally refers to a class of chemically-related sweet-flavored
substances, most of which are used as food. They are carbohydrates, composed of
carbon, hydrogen and oxygen. There are different types of sugar which include
monosaccharides (fructose, galactose, glucose); disaccharides (lactose, maltose,
sucrose); and many others (Wikipedia, 2013 a; Damodaram et al., 2008). Sucrose can
be extracted from plants such as sugarcane and sugar beet while fructose and glucose
may be derived from starch by hydrolysis reactions. Global sugar production and
consumption has been rising in recent years. In 2009/2010, 2011/2012, and 2012/2013,
global sugar production (and consumption) were respectively 153.6 x 10⁹ kg (153.7 x
109 kg); 168.2 x 10⁹ kg (160.2 x 10⁹ kg); and 174.0 x 10⁹ kg (163.0 x 10⁹ kg) (USDA,
2013). In 1999, per capita sugar consumption in the world was 24 kg, and this is
estimated to reach 25.1 kg by 2015 (FAO, 2002). In the United States, per capita
consumption of refined sugar in 1972 was 46.2 kg. This rose to 71.6 kg in 1999; and
48.8% of the total was corn derived sweeteners (Huntrods et al., 2012; Coulston and
Johnson, 2002).
Starch is fundamental raw material for production of glucose and fructose
sweeteners. These sweeteners are important commercial commodities used extensively
in bakery, beverage, confectionery, food, pharmaceutical, and allied industries.
However, a great proportion of starch used in the world today comes from corn/maize
(Johnson et al., 2005; De Braganca and Fowler, 2004; De Baere, 1999). Similarly, most
sweeteners used are produced from corn starch (BeMiller, 2009; Gordon, 1999;
147
Swinkles, 1985). The conventional method of glucose sweetener production requires
first extraction of starch from its raw material, followed by two separate unit operations:
Liquefaction and Saccharification (Johnson et al., 2009; Berghofer and Sarhaddar,
1988; Solomon, 1978; Aschengreen, 1975; Pomeranz et al., 1964). This rather round
about procedures impose constraints and implications in terms of energy; enzyme;
labor; equipment; technology; time and associated costs. It would be more efficient to
hydrolyze the starch in its native raw material and to conduct liquefaction and
saccharification operations simultaneously in the same reactor if possible.
It has been stated that sweeteners can be made from any starch, and that such
sweeteners are essentially identical regardless of which starch is used as the raw
material (BeMiller, 2002; Aschengreen et al., 1979). It is also reported that fungal
amylases can be used to liquefy starch irrespective of the source of the starch (Witt,
1985). Cassava root is said to be richly endowed with good quality starch to the extent
of 30 – 32 wt% (Westby, 2002; International Starch Institute, 1999; O’hair, 1995;
Balagopalan et al., 1988). In addition, Cassava starch has been reported to exhibit vital
benefits and advantages over other sources of starch such as wheat, corn, and waxy
maize (Central Tuber Crops Research Institute, 2010; Juszczak et al., 2003; Larotonda,
et al., 2003; Balagopalan, 2002; Lopez-Ulibarri and Hall, 1997; Balagopalan et al., 1988;
Franco et al., 1988; Vijayagopal et al., 1988; Cereda and Wosiacki, 1985; Moorthy,
1985; Swinkels, 1985). Therefore cassava crop can be an alternative source of starch
for production of sweeteners.
Attempts have been made to obtain reducing or fermentable sugars from starch
sources other than corn. Researchers have used cereal grains, seeds, stems and

148
tubers in various experiments. Nakamura and Park (1975) characterized some physico-
chemical properties of cassava starch. Their work demonstrated that fermented
cassava starch is more soluble in water, and also less viscous when heated, than
unfermented starch. Kearsley and Nketsia-Tabiri (1979) conducted hydrolysis
experiments with commercial starches as well as whole grains, tubers and roots of rice,
wheat, potato, and cassava. They concluded that it was possible to produce glucose
syrups from a wide variety of starch containing crops. Aschengreen et al., (1979)
liquefied, saccharified and isomerized starches from sources other than maize,
including potato and tapioca. Greenfield and Brooks (1982) investigated the effect of
size reduction operations on liquefaction, saccharification and fermentation of cassava
roots and stems to ethanol. They discovered that the resulting bimodal particle size
distribution peaked around 15 μm; and represented released starch granules, all of
which were readily hydrolysable. Hoehn et al., (1983), produced high fructose syrups
from Jerusalem artichoke tubers. Monma et al., (1989) successfully digested starches
from potato, rice and sago. Gorinstein and Lii (1992) subjected amaranth, cassava and
potato starches to enzymatic hydrolysis. Their report revealed that cassava starch is
less resistant to thermostable alpha-amylase than amaranth and potato starches. These
cited works clearly demonstrated that reducing and fermentable sugars can be
produced from various starch sources other than corn.
However, a major limitation of conventional production of glucose sweetener is
the two separate operations of liquefaction and saccharification. Liquefaction is the first
stage whereby starch is gelatinized by heat treatment and thermostable alpha-amylase
partially hydrolyses the starch to maltodextrins. Saccharification commences in the

149
second stage where the partially hydrolyzed starch is converted to glucose by the action
of glucoamylase. This protocol requires more process vessels, piping, and associated
equipment; conditioning for enzyme systems; and gelatinization is energy intensive. It
would be advantageous to deploy alpha-amylase and glucoamylase simultaneously and
carry out both liquefaction and saccharification processes inside the same reactor
vessel as a single unit operation. This option is simple, and more time, energy,
equipment and labor efficient. It is termed synergism and has been studied by several
authors.
Gauss et al., (1976) patented a process for alcohol production by simultaneous
saccharification and fermentation of cellulosic materials with cellulase enzyme and
alcohol producing microorganism. Wankhede and Ramteke (1982) studied the
synergistic digestibility of native starches by various enzymes. Substrates studied
included Ragi (Eleusine coracana), Foxtail millet (Sataria italica), Jowar (Sorghum
vulgare) and Rice (Oryza sativa). The study revealed that where one enzyme system
hydrolyzed native starch by 35.58%, synergistic action hydrolyzed 71.20%. The works
of Fujii et al., (1981), Fujii and Kawamura (1985), and Fujii et al., (1988) illuminated
synergistic hydrolysis mechanism of alpha-amylase and glucoamylase. According to
their model, alpha-amylase catalyzes endo-wise random cleavage of large molecules
on the surface of starch granules. The splitting action produces maltodextrins and non
reducing sugars that blanket the granule, inhibiting alpha-amylase from further attacks
on the substrate. At this juncture, glucoamylase peels off the blanket of maltodextrins,
hydrolyzing them to glucose and thereby exposing interior glycosidic bonds of the
substrate to new surface attacks by alpha-amylase. After the molecular weight of the

150
substrate decreases to about 5000, the action of alpha-amylase can be neglected and
the rate of formation of glucose is governed by the kinetics of glucoamylase (Fujii and
Kawamura, 1985). The cooperative action between alpha-amylase and glucoamylase
constitutes synergism and results in enhanced hydrolysis yields and increased enzyme
activity, perhaps making the energy intensive gelatinization pretreatment process
unnecessary.
Franco et al., (1989) demonstrated increased levels of reducing sugars (glucose
and maltose) in hydrolysis systems subjected to synergistic actions of alpha-amylase
and glucoamylase. Rattanachomsri et al., (2009) reported increased fermentable sugars
(glucose and xylose) and alcohol production from simultaneous multi-enzyme
saccharification and yeast fermentation. The process was said to be energy efficient by
obviating the pre-gelatinization step. Arasaratnam and Balasubramaniam (1993),
observed that synergistic hydrolysis of dry-milled starch was more efficient than wet-
milled starch; and that optimum ratio of glucoamylase to alpha-amylase was 1.8 AGU
(Amyloglucosidase Unit)/1.0 KNU (Kilo Novo Unit). Shevel’kova and Sinitsyn (1993),
reported that the synergistic effect of alpha-amylase and glucoamylase hydrolysis of
starch is a function of many variables including substrate composition, concentration,
and degree of polymerization, as well as reaction duration. The synergistic technique
was applied to production of lactic acid. Linko and Javanainen (1996) claimed 98% yield
of lactic acid when 130 g/L starch was simultaneously liquefied, saccharified and
fermented. Lactic acid concentration of 162 g/L was reported. Similarly, Anuadha et al.
(1999), reported higher yields of 1.21 g/L.hour lactic acid production for simultaneous
systems over conventional two step processes. Liakopoulou-Kyriakides et al. (2001),

151
investigated the synergistic effects of different combinations of alpha-amylase and
glucoamylase from various sources. Their report showed that the combination of
Bacillus licheniformis alpha-amylase and Rhizopus mold glucoamylase gave the highest
substrate conversion of 76% at 50 o C; and that combination of Bacillus licheniformis
alpha-amylase and Aspergillus niger glucoamylase enzymes retained initial activity after
incubation at 60 o C.
Another important constraint to conventional glucose sweetener production is the
time, energy, and labor intensive starch extraction process. Most of the work reported in
literature on glucose production used model systems of soluble or commercial starches.
Very few authors have tried the possibility of using direct conversion technique. Direct
conversion procedure involves hydrolyzing native starch in raw materials with minimal
value adding processing history. Lages and Tannenbaum (1978), conducted laboratory
scale batch operations for the production of glucose from tapioca meal (also called
farinha de mandioca). Tapioca meal is the flour produced after rasped peeled cassava
roots are toasted and dried. The authors reported virtual 100% conversion of the meal
after 24 – 36 hours of hydrolysis. This compares to 12 – 24 hours required for 100%
conversion of pure cassava starch. Menezes et al., (1978), hydrolyzed cassava root
slurry with alpha-amylase and glucoamylase in conventional two stage hydrolysis
procedure. However, fungal cellulase was synergistically added at the saccharification
stage. The authors reported not only increased rate of sugar formation and starch
conversion, but also improved rheological properties. Kearsley and Nketsia-Tabiri
(1979), performed direct hydrolysis of native starches in grains, roots and tubers with
alpha- and beta amylase enzymes. The results for alpha amylase experiments shown
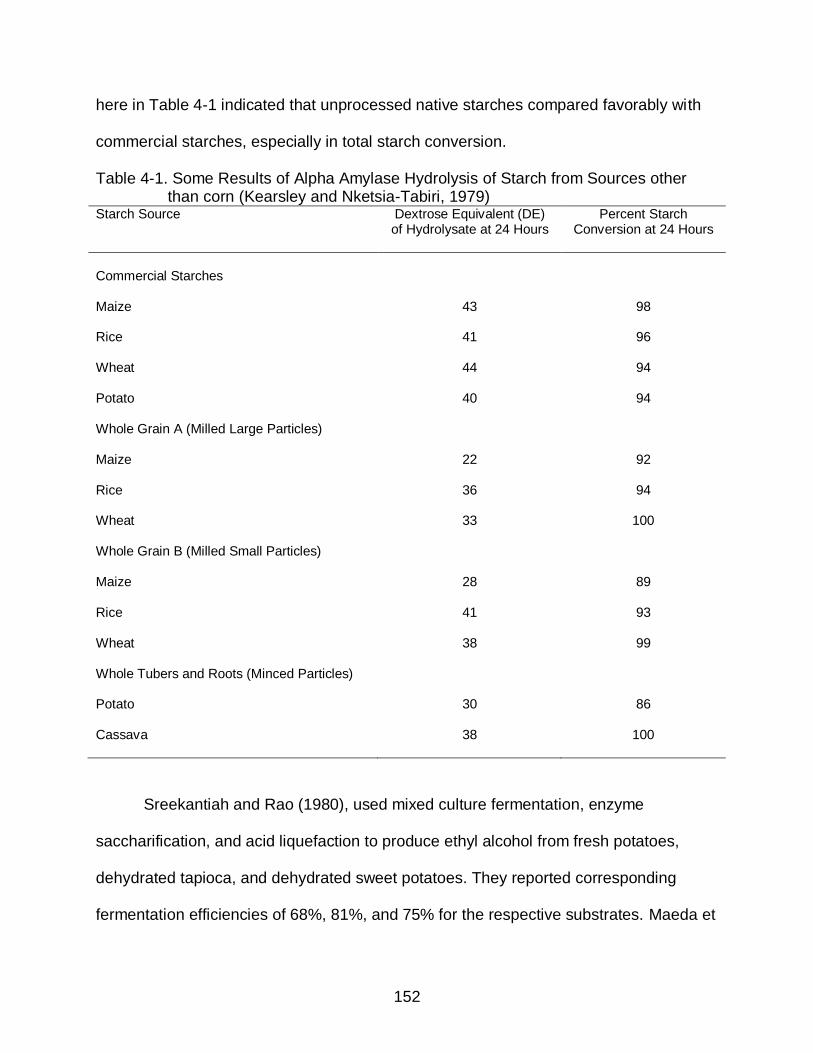
152
here in Table 4-1 indicated that unprocessed native starches compared favorably with
commercial starches, especially in total starch conversion.
Table 4-1. Some Results of Alpha Amylase Hydrolysis of Starch from Sources other than corn (Kearsley and Nketsia-Tabiri, 1979)
Starch Source Dextrose Equivalent (DE) of Hydrolysate at 24 Hours
Percent Starch Conversion at 24 Hours
Commercial Starches
Maize 43 98
Rice 41 96
Wheat 44 94
Potato 40 94
Whole Grain A (Milled Large Particles)
Maize 22 92
Rice 36 94
Wheat 33 100
Whole Grain B (Milled Small Particles)
Maize 28 89
Rice 41 93
Wheat 38 99
Whole Tubers and Roots (Minced Particles)
Potato 30 86
Cassava 38 100
Sreekantiah and Rao (1980), used mixed culture fermentation, enzyme
saccharification, and acid liquefaction to produce ethyl alcohol from fresh potatoes,
dehydrated tapioca, and dehydrated sweet potatoes. They reported corresponding
fermentation efficiencies of 68%, 81%, and 75% for the respective substrates. Maeda et

153
al. (1982), subjected dried cassava chips slurry to alpha amylase liquefaction. After a
clarification and centrifugation step aided by various enzymes, the supernatant fluid was
continuously saccharified by immobilized glucoamylase gel. The authors reported
glucose content of resulting product to be 94.4%. Srikanta et al., (1987), reported
production of ethanol from fresh cassava roots, flour and starch. After liquefaction of
20% solids content substrates with alpha amylase, saccharification was executed with
moldy bran or commercial glucoamylase before fermentation with yeast inoculation.
Their result indicated that after 4 hours of saccharification at 60 o C, the hydrolysis
scheme yielded 9 – 10% reducing sugars which on fermentation, generated alcohol
fermentation efficiencies of 95 to 98% among the different substrates. Berghofer and
Sarhaddar (1988), investigated glucose production directly from fresh and dried
cassava roots. The authors reported conversion yield of 88 – 89% of the overall starch
content of raw material (fresh unpeeled tuber) compared to 82 – 87% conversion
through conventional starch extraction processes.
Ghildyal et al., (1989), performed comparative economic analysis of the
production of high fructose syrup from cassava chips and extracted cassava starch.
They reported that the unit cost for production of 10 t of high fructose syrup per day was
US $ 0.51/kg and US $ 0.46/kg respectively for cassava chips and extracted cassava
starch. They noted that the gain in lower expenses on cassava chips raw material as
compared to extracted cassava starch was upset by higher capital investment on plant
and machinery; as well as higher operating expenses on process steam, activated
carbon, and purification requirements for cassava chips products. The authors
concluded that direct utilization of cassava chips does not offer any economic

154
advantage. Johnson et al., (2009), applied the direct conversion technique to production
of glucose and high fructose syrup from cassava roots and sweet potato tubers. They
used various enzymes and reported glucose yields of 22 – 25% and 14.0 – 15.7% for
cassava roots and sweet potato tubers respectively. Fructose yields were reported to be
8.36 – 9.78% for cassava, and 5.2 – 6.0% for sweet potato. Total starch conversion to
glucose was reported to be higher with cassava at 95 – 98%; compared to 88 – 92%
with sweet potato. However, the authors used the conventional two-step procedure of
liquefaction followed by saccharification, except that one of the enzymes used;
StargenTM 001, had both alpha amylase and glucoamylase activities.
From extensive literature search, it is observed that there is dearth of information
on direct conversion technique on the one hand; and on synergistic procedure on the
other hand, especially where glucose sweetener is the desired end product. Most of the
reported work was done for the production of alcohol or lactic acid, where reducing
sugar such as glucose is a transition item to be fermented to the desired end product.
4.2 Objectives
Based on the foregoing, the objectives of the work undertaken in this study were
to:
1. Combine both direct conversion and synergistic techniques in the production of glucose sweetener, using cassava crop as the raw materials source.
2. Demonstrate the conversion of starch to glucose sweetener from synergistic hydrolysis with commercial enzymes on the following substrates:
a) Commercially available refined cassava starch.
b) Flour produced from solar-convection dried cassava chips.
c) Freshly ground cassava root pulp.

155
3. Estimate reaction kinetics parameters such as first-order rate constant and Arrhenius activation energy from enzyme hydrolysis of each substrate at two different temperatures.
4.3 Materials and Methods
4.3.1 Enzymes
The enzymes used in this study are presented in Table 4-2.
Table 4-2. Statistics of Enzymes used in the Research Work
Enzyme Manufacturer
Manufacturer’s Product Name
Type of Enzyme
Source of Enzyme
Enzyme Activity
Bio-Cat Inc. Fungal Amylase Alpha amylase Fungal: Aspergillus oryzae
100,000 SKB/g. One SKB Unit is the number of grams of soluble starch dextrinized, in the presence of excess beta amylase per hour under the assay conditions
Glucoamylase Glucoamylase Fungal: Aspergillus niger
1000 AG/g. One AG Unit is the amount of glucoamylase that will liberate 0.1 mol of p-nitrophenol per minute from PNPG solution under the assay conditions
BioSun Alpha Amylase Alpha Amylase
Bacterial: Bacillus subtilis
5 x 10⁶ BAAU/g. One BAAU Unit is
amount of enzyme that breaks down 5.26 mg of Lintner starch per hour under the assay conditions
Starch Clear-ase Glucoamylase Fungal: Aspergillus niger
200 GAU/g One GAU Unit is the amount of enzyme that breaks down 0.1 mole of p-nitrophenol per minute from a substrate of PNPG under the assay conditions.
DSM Validase BAA 1000L
Alpha Amylase
Bacterial: Bacillus subtilis
1 x 10⁶ MWU/g. One MWU Unit is
the amount of enzyme activity that will dextrinize 1 mg of soluble starch to a defined blue color in thirty minutes under the assay conditions
Validase GA 400L
Glucoamylase Fungal: Aspergillus niger
400 GAU/mL. One GAU Unit is the amount of enzyme activity that will liberate 1 g of reducing sugar as D-glucose per hour under the assay conditions.
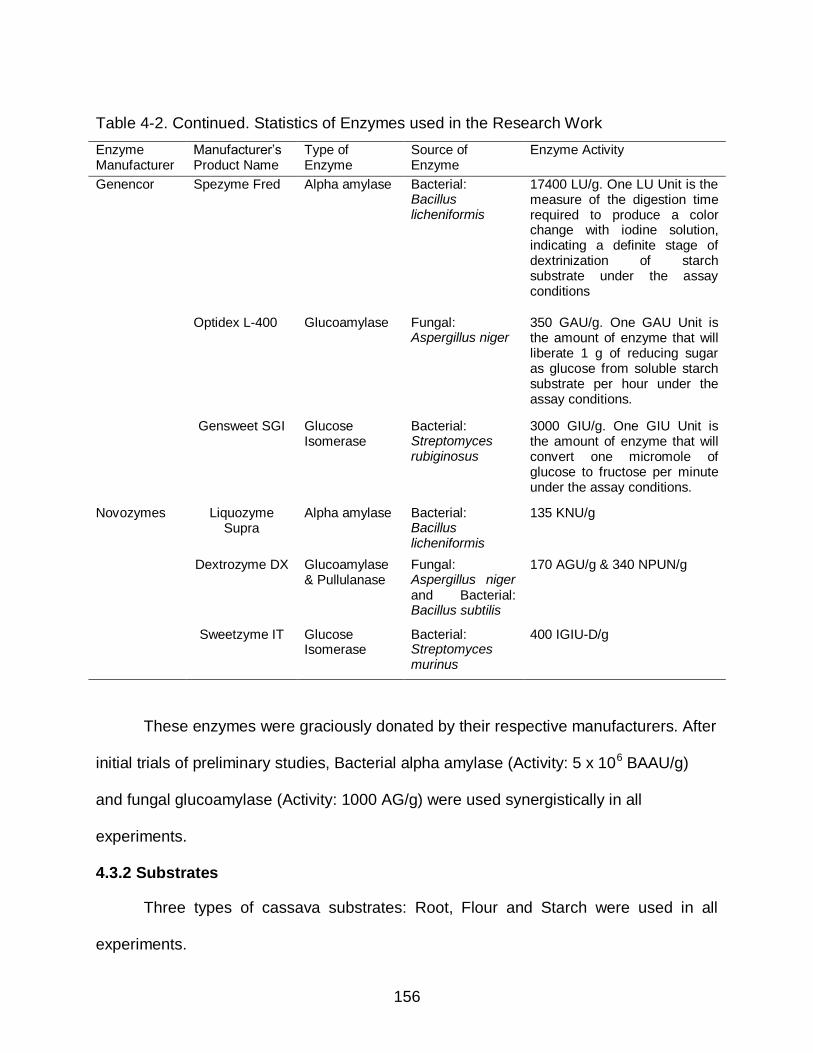
156
Table 4-2. Continued. Statistics of Enzymes used in the Research Work
Enzyme Manufacturer
Manufacturer’s Product Name
Type of Enzyme
Source of Enzyme
Enzyme Activity
Genencor Spezyme Fred Alpha amylase Bacterial: Bacillus licheniformis
17400 LU/g. One LU Unit is the measure of the digestion time required to produce a color change with iodine solution, indicating a definite stage of dextrinization of starch substrate under the assay conditions
Optidex L-400 Glucoamylase Fungal: Aspergillus niger
350 GAU/g. One GAU Unit is the amount of enzyme that will liberate 1 g of reducing sugar as glucose from soluble starch substrate per hour under the assay conditions.
Gensweet SGI Glucose Isomerase
Bacterial: Streptomyces rubiginosus
3000 GIU/g. One GIU Unit is the amount of enzyme that will convert one micromole of glucose to fructose per minute under the assay conditions.
Novozymes Liquozyme Supra
Alpha amylase Bacterial: Bacillus licheniformis
135 KNU/g
Dextrozyme DX Glucoamylase & Pullulanase
Fungal: Aspergillus niger and Bacterial: Bacillus subtilis
170 AGU/g & 340 NPUN/g
Sweetzyme IT Glucose Isomerase
Bacterial: Streptomyces murinus
400 IGIU-D/g
These enzymes were graciously donated by their respective manufacturers. After
initial trials of preliminary studies, Bacterial alpha amylase (Activity: 5 x 10⁶ BAAU/g)
and fungal glucoamylase (Activity: 1000 AG/g) were used synergistically in all
experiments.
4.3.2 Substrates
Three types of cassava substrates: Root, Flour and Starch were used in all
experiments.

157
4.3.2.1 Roots
Fresh roots were purchased commercially from Brooks Tropicals, Homestead,
Florida. The roots were coated with food wax and supplied refrigerated in 18 kg boxes.
Each consignment or batch was promptly received and maintained under refrigeration
(< 10 o C) until utilized.
4.3.2.2 Flour
All the flour used in the experiments was of particle size ≤ 45 μm. The flour was
produced in our laboratories from solar dried chips of the fresh roots.
4.3.2.3 Starch
Cassava starch was purchased from commercial source; My Spice Sage,
Yonkers, New York. The starch was supplied in 25 kg packaging and was stored under
ambient conditions (≈ 22 o C, 38% RH).
4.3.3 Sample Preparation
4.3.3.1 Root
Fresh cassava roots were retrieved from refrigeration, placed on a cutting board
(Figure 4-1A), and peeled with a kitchen knife (Figure 4-1B). The peeling process
involved carefully removing the peel (pellicle (periderm or epidermis) and cortex) from
the parenchymatous tissue. The exposed parenchyma was cut into slices of about 10
cm long x 3 cm wide x 3 cm deep dimensions. Subsequently, the slices were rasped
into shreds with a kitchen grater (Figure 4-1C). The shreds were pulverized into smooth
paste with a blender. Two types of blender were used. Figure 4-1D: Osterizer Designer
Cycle Blender (Sunbean Corporation, Fort Lauderdale, Florida), and Figure 4-1E:
SmartPower Cuisinart Blender, Model CPB-300 (Intertek Group, London, England). One

158
blender was used when the other required a period of cooling off. The paste was
constituted with distilled water to obtain a 10% (w/w) suspension.
A
B
C
D
E
F
G
H
I
Figure 4-1. Size Reduction Devices used in Sample Preparations. A) Cutting Board B) Knives C) Grater D) Blender 1 E) Blender 2 F) Slice-O-Matic G) Hobart Slicer H) Solar Convection Dryer I) Vibrating Sieving Machine. All photos courtesy of the author.

159
4.3.3.2 Flour
Depending on size of root, either a kitchen knife (Figure 4-1B) or one of two
slicers: Slice-O-Matic Slicer (TeleBrands, Fairfield, New Jersey; Figure 4-1F) or Hobart
Slicer, Model 1712E (Hobart Corporation, Troy, Ohio; Figure 4-1G) was used for slicing.
Peeled roots were sliced into approximately circular chips of 0.5 cm thickness. The
sliced chips were subsequently dried to less than 10% moisture content dry basis using
a solar natural convection dryer developed at the University of Florida (Schiavone et al.,
2013; Figure 4-1H). It took about 1.5 to 3 days to achieve required drying, depending on
loading density, solar radiation and other weather and operating conditions. Dried chips
were pulverized with blenders and sieved through 45 μm pore sieve (ASTME Standard
Sieve No. 325) with the aid of a vibrating stacked sieving machine: Octagon 2000;
Serial No. OCT 2000/2 340 96 (Endocotts Limited, London, England; Figure 4-1I). Flour
produced was constituted with distilled water to achieve a 10% (w/w) suspension.
4.3.3.3 Starch
The commercial cassava starch purchased was constituted with distilled water to
achieve a 10% (w/w) suspension.
4.3.4 Reactor
The batch reactors used for hydrolysis experiments are shown in Figure 4-2A.
They were 1000 mL capacity Pyrex Griffin Beakers (Fisher Scientific Inc., Waltham
Massachusetts). The beakers were mounted in a precision microprocessor controlled
water bath, Model 285 (Thermo Scientific Inc., Waltham Massachusetts). The system
was coupled to a Phipps and Bird Stirrer (Phipps and Bird Inc., Richmond, Virginia). A
typical setup of an experimental run of the reactors, water bath and stirrer is presented
in Figure 4-2B.

160
A
B
Figure 4-2. Reactor Devices and Systems for Hydrolysis Experiments A) Reactor
Beakers for Hydrolysis Experiments B) Typical Setup of a Test Run System with Reactors, Water Bath and Stirrer. Photos courtesy of the author.
4.3.5 Analytical Methods
4.3.5.1 Proximate composition, starch, and sugar analysis
Proximate composition, starch, and sugar profile analyses were conducted by
ABC Research Laboratories, Gainesville, Florida. Samples of cassava root, flour from
solar dried chips, and commercial starch were delivered to ABC Research Laboratories
sealed in transparent plastic sachets and bowls. Aliquots of selected hydrolysate
samples were delivered in sanitary laboratory vials under refrigerated conditions.
Reports from ABC Research Laboratories indicated that the following assay methods
(Table 4-3) were used, with modifications where appropriate.

161
Table 4-3. Assay Methods used by ABC Research Laboratories for Analysis of Samples
S/N Component Assay Method
1 Ash AOAC 942.05, 920.153
2 Calories By Computation
3 Carbohydrate By Computation
4 Crude Fiber AOAC 978.10
5 Fat AOAC 948.15
6 Moisture AOAC – Moisture
7 Protein AOAC 981.10
8 Starch AOAC 996.11
9 Total Pectin JBT 6th Edition # 23; AES Bulletin 570 1
Sugars
10 Fructose AOAC 977.20 MOD
11 Glucose AOAC 977.20 MOD
12 Lactose AOAC 977.20 MOD
13 Maltose AOAC 977.20 MOD
14 Sucrose AOAC 977.20 MOD
4.3.5.2 Glucose Analysis
Glucose is a monosaccharide carbohydrate because it cannot be broken
down to any simpler carbohydrate molecule via hydrolysis. Therefore, glucose like any
other monosaccharide is called a simple sugar. Glucose is also classified as an aldose.
An aldose is a monosaccharide whose carbonyl function is an aldehyde (known as the
aldehydo group). A second group of monosaccharides are called ketoses. A ketose is a
monosaccharide whose carbonyl function is a ketone (the keto group). Oxidation is the
loss of electrons while reduction is the gain of electrons. In a chemical reaction, aldoses
can readily give up electrons to an oxidizing agent which accepts electrons from the
aldose. In such a reaction, the oxidizing agent is reduced and the aldose is oxidized by
acting as reducing agent. Aldoses are therefore referred to as reducing sugars.

162
However, under alkaline conditions, ketoses are isomerized to aldoses and can
thus act as reducing sugars (BeMiller and Huber, 2008). A reducing sugar may
therefore be defined as a sugar that contains the free aldehydo carbonyl group or is
capable of forming such a free group. Examples of reducing sugars are: arabinose,
xylose (pentoses); galactose, glucose, mannose (hexoses). Pentoses have five carbon
atoms while hexoses have six carbon atoms (BeMiller, 2010). “The presence of any
substituent on the anomeric hydroxyl group of a sugar prevents the sugar from
undergoing the equilibrium between ring forms and the open-chain form” (Dr. Jesse F
Gregory, 2012; Personal Communication). Consequently, such a sugar does not have a
free or reducing end; and so is not reactive. Sucrose is not a reducing sugar because
sucrose does not have a free carbonyl group or reducing end. Both anomeric carbons
on sucrose are in glycosidic linkage.
4.3.5.3 Determination of Reducing Sugar
One analytical technique used to determine reducing sugars is the 3,5-
dinitrosalicylic acid (DNS) method. It was developed by James Sumner and coworker in
1921 to estimate reducing sugars in diabetic patients (Sumner, 1924; Sumner and
Graham, 1921). The DNS method tests for the presence of free carbonyl (aldehydo)
group in a sample. This is achieved by the oxidation/reduction reaction pathway. When
3,5-dinitrosalicylic acid is reacted with a reducing sugar, aldehydo group is oxidized
while 3.5-dinitrosalicylic acid is reduced. The reaction is such that the nitrate group
(NO2) in 3,5-dinitrosalicylic acid is reduced to the amino group (NH2). The reduction
product is called 3-amino-5-nitrosalicylic acid. Figure 4-3 represents classical
stoichiometry of the reaction scheme. 3-amino-5-nitrosalicylic acid is a colored aromatic

163
compound that absorbs light strongly at 540 nm. The absorbance can be read with a
spectrophotometer and used to estimate the quantity of reducing sugar in a sample.
+
C6H12O6 C7H4O7
C7H6N2O5
1 mole Glucose 1 mole 3,5-Dinitrosalicylic
acid
1 mole 3-Amino-5-nitrosalicylic acid
180 g
228 g
198 g
Figure 4-3. Stoichiometry for the Detection of Reducing Sugars as Glucose through Reactions with 3,5-dinitrosalicylic acid (DNS) Reagents
The DNS technique has been adopted, modified, adapted and utilized in various
materials, products, and applications. Sumner (1935) applied it to the determination of
saccharase activity. Bernfeld (1955) suggested the technique be used to estimate alpha
and beta amylases activities. In 1959, Gail Miller modified the reagent to minimize the
loss of sugar in the assay (Miller, 1959); and in 1973 Lindsay applied the assay to the
measurement of reducing sugars in potatoes (Lindsay, 1973). In the work presented
here, the DNS Reagent was composed as follows (Lindsay, 1973; Bernfeld, 1955):
1 g of 3,5-Dinitrosalicylic acid
20 cm3 of 2M Sodium Hydroxide [2M = Mix 2 g NoaH with 25 cm3 distilled water]
50 cm3 of Distilled water
30 g of Sodium Potassium Tartrate Tetrahydrate (Rochelle Salt)
Add distilled water to bring volume to 100 cm3

164
In the assay for reducing sugars as glucose, 1 mL of relevant hydrolysate or
control sample (starch, flour or root) was reacted with 2 mL of DNS reagent in a 10 mL
test tube. The test tube containing the mixture was heated for 10 minutes in boiling
water and then cooled to room temperature. After addition of 2 mL of distilled water, the
absorbance of the reaction product was read at 570 nm with a spectrophotometer
(Evolution 60, Model No. 840-189600, Thermo Fisher Scientific Inc., Waltham
Massachusetts; Figure 4-4A or Milton Roy Analytical Spectrophotometer, Model No.
335402, Milton Roy Analytical Products, Rochester, New York; Figure 4-4B). A blank
sample was prepared in the same manner but without the hydrolysate. The blank was
used to zero the spectrophotometers. The percentage of reducing sugar (as glucose) in
each sample was estimated by reference to a calibration curve (Figure 4-5); established
with reagent grade D-Glucose
A
B
Figure 4-4. Spectrophotometers used for Measurement of Absorbance in Samples Reacted with DNS Reagent in Order to Determine Reducing Sugars as Glucose. A) Evolution 60 Spectrophotometer B) Milton Roy Spectrophotometer. Photos courtesy of the author.

165
Figure 4-5. Calibration Curve used for Estimation of Reducing Sugars (As Glucose) in the 3, 5-dinitrosalicylic acid (DNS) Analytical Method. The Absorbance was read with Spectrophotometers at 570 nm with 1 cm path length cuvette cells. (Graph is showing the mean of six replications with error bars at two standard deviations).
4.3.6 Experimental Procedure
The experiments were conducted in batches and at two temperatures: 60 o C and
37 o C. Total reaction mass for each batch was 800 g and the repartition of components
was as follows: Substrate, 10%; Enzyme, 0.015%; Distilled water made up the balance.
The two enzymes applied synergistically were bacterial alpha amylase (BAA) and fungal
glucoamylase (FGA). The ratio of enzyme application was 3 : 1 (FGA : BAA). A typical
sequence of experimental run at 60 o C required preheating the water bath to the
operating temperature. The desired substrate was constituted in the reactor beaker and
an aliquot ≈ 7 mL was withdrawn into a test tube to be used to characterize the reaction
y = 0.5048x R² = 0.9995
0
0.2
0.4
0.6
0.8
1
1.2
0 0.5 1 1.5 2 2.5
Absorbance
Glucose [mg/mL]

166
mass at time zero (T0). Mass of the beaker with sample was then measured and
recorded (Ohaus Adventure Scale, Model AR 5120, Ohaus Corporation, Pine Brook,
New Jersey; Figure 4-6A).
A
Figure 4-6. Scales used for Mass Measurements. A) Ohaus Scale; Precision at 0.1 g
B) Mettler Scale; Precision at 0.001 g. Photos courtesy of the author.
The weighed reactor was carefully positioned in the water bath and covered with
aluminum foil sheet that had a slit. The flat blade stirrer was inserted through the slit and
installed so as not to touch any side or bottom of the beaker. A mercury-in-glass
thermometer was also installed into the reactor beaker for temperature tracking. Finally,
a fabricated steel mass was placed over the reactor as a ballast, to insure stability. The
stirrer was then started to operate at 180 ± 5 rpm. On attainment of the operating
temperature, in this case 60 o C, the two enzymes were carefully measured out,
introduced into the reactor simultaneously, and hydrolysis proceeded. Measurement of
the mass of enzymes to three decimal places was achieved with Mettler Scale, Model
PE 160 (Mettler-Toledo, Columbus, Ohio; Figure 4-6B). Samples were withdrawn for
analysis at predetermined time intervals {T1: 5 minutes (0.083 hours); T2: 10 minutes
B
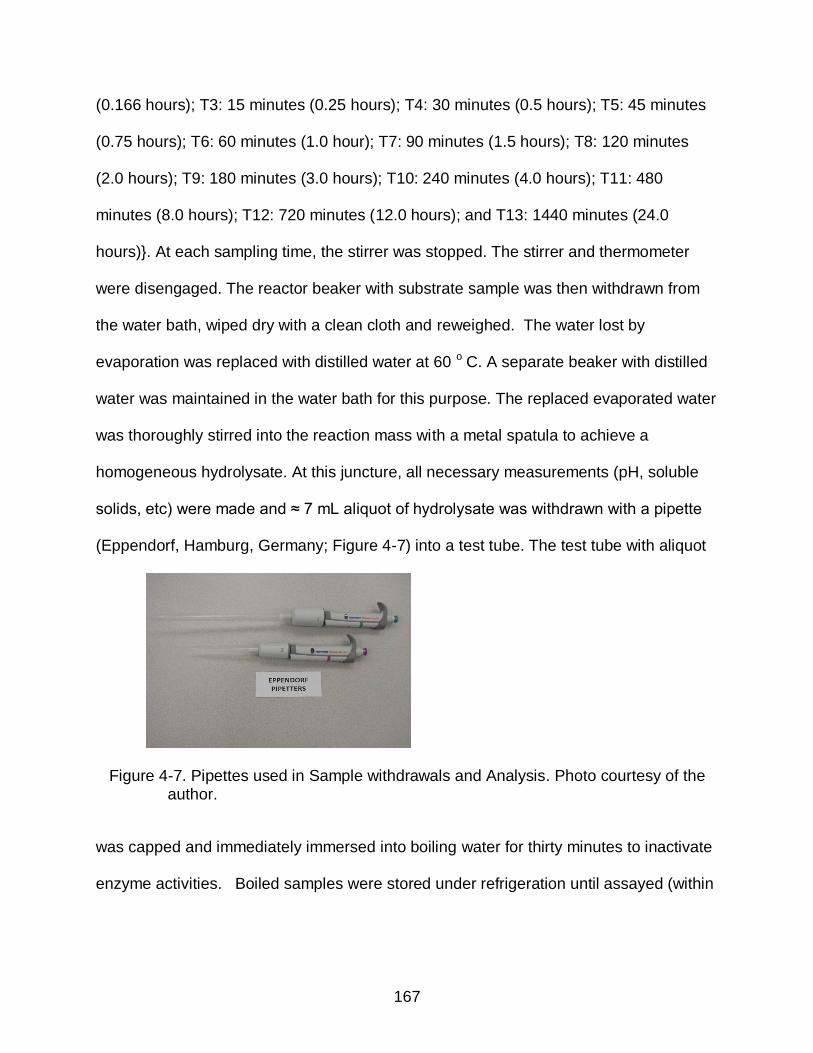
167
(0.166 hours); T3: 15 minutes (0.25 hours); T4: 30 minutes (0.5 hours); T5: 45 minutes
(0.75 hours); T6: 60 minutes (1.0 hour); T7: 90 minutes (1.5 hours); T8: 120 minutes
(2.0 hours); T9: 180 minutes (3.0 hours); T10: 240 minutes (4.0 hours); T11: 480
minutes (8.0 hours); T12: 720 minutes (12.0 hours); and T13: 1440 minutes (24.0
hours)}. At each sampling time, the stirrer was stopped. The stirrer and thermometer
were disengaged. The reactor beaker with substrate sample was then withdrawn from
the water bath, wiped dry with a clean cloth and reweighed. The water lost by
evaporation was replaced with distilled water at 60 o C. A separate beaker with distilled
water was maintained in the water bath for this purpose. The replaced evaporated water
was thoroughly stirred into the reaction mass with a metal spatula to achieve a
homogeneous hydrolysate. At this juncture, all necessary measurements (pH, soluble
solids, etc) were made and ≈ 7 mL aliquot of hydrolysate was withdrawn with a pipette
(Eppendorf, Hamburg, Germany; Figure 4-7) into a test tube. The test tube with aliquot
Figure 4-7. Pipettes used in Sample withdrawals and Analysis. Photo courtesy of the author.
was capped and immediately immersed into boiling water for thirty minutes to inactivate
enzyme activities. Boiled samples were stored under refrigeration until assayed (within

168
48 hours) for reducing sugars as glucose using the DNS methodology. A control reactor
without enzyme input was incubated and sampled in a similar way.
The mass of the beaker and remaining substrate sample was weighed again and
recorded. The beaker was returned to the water bath; the stirrer, thermometer,
aluminum foil sheet and steel ballast were reinstalled and timing for the experiment was
continued when the reaction mass temperature reached 60 o C. The time spent in the
sampling process was discounted. In other words, only the actual time the substrate
sample was maintained at the operating temperature was computed into sampling time
requirements. This sampling scheme was applied to all the sampling times; including 24
hours and 96 hours for 60 o C and 37 o C experiments respectively. No other control
was imposed on the system. No cofactors were added and no buffers were added. The
pH of reaction mass was as obtained by mixing substrate sample with distilled water.
However, hydrolysate pH was routinely assessed at selected sampling time intervals
with Orion 3 Star portable pH meter, serial no. A 11326 (Thermo Fisher Scientific Inc.,
Waltham, Massachusetts; Figure 4-8A). Soluble solids were occasionally monitored with
Figure 4-8. Monitoring Devices for pH, and Soluble Solids. A) pH Meter B) Table Top Refractometer C) Portable Refractometer. Photos courtesy of the author.
A
B C

169
the aid of refractometers; Abbe Mark II, Model # 10480 (Leica Inc., Buffalo, New York,
Figure 4-8B).
The described scheme was replicated three times for each substrate at 60 o C.
The same protocol was adopted at 37 o C. However, at 37 o C each experiment was run
for 96 hours. Therefore additional hydrolysate samples were withdrawn for glucose
assay at T14: 2880 minutes (48 hours); T15: 4320 minutes (72 hours); and T16: 5760
minutes (96 hours). Table 4-4 highlights the experimental design executed.
Table 4-4. Experimental Design for Synergistic Enzymatic Hydrolysis of Different Cassava Substrates
Temperature
[o C]
Substrate
Replication
Operating
pH
Substrate
Concentration
Enzyme
Concentration
Enzyme Type
and Proportion
60 for 24 Hours
Commercial Cassava Starch
S1 @ 60 As obtained by mixing substrate
with distilled water
10 % 0.015 % Fungal Glucoamylase
75 %
PLUS
Bacterial Alpha Amylase
25 %
S2 @ 60 S3 @ 60
Flour from solar dried cassava chips
F1 @ 60 F2 @ 60 F3 @ 60
Fresh Cassava Root Pulp
R1 @ 60 R2 @ 60 R3 @ 60
37 for 96 Hours
Commercial Cassava Starch
S1 @ 37 As obtained by mixing substrate
with distilled water
10 % 0.015 % Fungal Glucoamylase
75 %
PLUS
Bacterial Alpha Amylase
25 %
S2 @ 37 S3 @ 37
Flour from solar dried cassava chips
F1 @ 37 F2 @ 37 F3 @ 37
Fresh Cassava Root Pulp
R1 @ 37 R2 @ 37 R3 @ 37

170
All the hydrolysate remaining in the reactor at the end of each experiment: 24
hours for 60 o C and 96 hours for 37 o C were pooled together, clarified by
sedimentation, and concentrated to various soluble solids content using Precision
vacuum evaporator Model Cat. No. 65486 (Precision Scientific Company, Chicago,
Illinois; Figure 4-9).
Figure 4-9. Vacuum Evaporator Used for Glucose Syrup Concentration . Photo courtesy
of the author.
4.3.7 Mass Balance Stoichiometry
To determine the efficiency of hydrolysis in terms of the rate and absolute
conversion of starch to glucose, the law of conservation of matter (Antoine-Laurent de

171
Lavoisier; 26 August 1743 – 8 May 1794) was applied. Since the enzymes only
catalyzed the hydrolysis, they did not go into the hydrolysis equation. Therefore the
hydrolysis stoichiometry was derived for cassava starch reaction with water to produce
glucose. The stoichiometry as presented in Figure 4-10 revealed that 1 gram of starch
yields 1.1111 gram of glucose. This was the basis for all mass balance computations.
Cassava Starch Water Glucose
+
[C6H10O5]n = 1 H2O C6H12O6
1 Mole of
Starch 1 Mole of Water 1 Mole of Glucose
162 g 18 g 180 g
Therefore: 1 g Starch ≈ 1.1111 g Glucose
Figure 4-10. Mass Balance Stoichiometry for Enzymatic Hydrolysis of Different Cassava Substrates. Image of water and glucose structure courtesy of Wikipedia.
4.3.8 Reaction Kinetics
Mathematical models capable of simulating the process of enzyme hydrolysis are
very useful because they are able to predict processing outputs in response to different
input variables, such as substrate concentration and hydrolysis time. The kinetic model
most widely used to describe enzymatic hydrolysis is the Michaelis-Menten rate

172
expression (Shuler and Kargi, 2002). Well-designed batch reactors with cell-free
enzymes are typically operated as homogeneous systems in which the enzyme and
substrate are well mixed to ensure uniform distribution of temperature, pH, and
concentration throughout the reactor. Under these conditions, process design and
operation rely essentially on the reaction rate or enzyme kinetics. Conventional methods
for determining kinetic parameters for the Michaelis-Menten rate expression are used to
obtain the reaction rate as a function of substrate concentrations (Zhou et al., 2003) and
then perform a graphical method of data analysis or a direct linear plot (Cavaille and
Combes, 1995), such as the Lineweaver-Burk plot (Doran, 1995).
However, it is difficult to find a proper model for an enzymatic reaction that obeys
inhibition kinetics. In addition, a kinetic model obtained in this way is only valid for an
enzyme reaction under predetermined optimal process conditions. Two well-known
mathematical models based on the Michaelis-Menten rate expression were used to
show the complexity of describing these types of enzymatic reactions. Model 1 is for
enzyme hydrolysis in which the reaction rate is a function of substrate concentration
only. Most studies of animal and vegetable protein hydrolysis showed inhibition by the
substrate (Kristinsson and Rasco, 2000; Van Den Heuvel and Beeftink, 1988), as well
as uncompetitive inhibition in the case of vegetable proteins, which was assumed for
model 1 (Marquez Moreno and Fernando Cuadrado, 1993). Model 2 reflects the more
complex situation in which the reaction rate is a function of both substrate and active
enzyme concentrations.
In the work undertaken in this study, the enzyme reaction was carried out under
predetermined optimal process conditions of enzyme and substrate concentrations.

173
Under these conditions only the substrate composition changes with time as the
enzyme hydrolysis proceeds. This type of reaction can be described by first order
kinetics, which was the type of model chosen for this work.
4.3.9 Statistical Analysis
Data were analyzed by descriptive statistics (Ott and Longnecker 2010;
Montgomery, 2009). Means, standard deviations, correlation coefficients, etc. were
computed using Microsoft Office Excel Software Package 2007. The excel software
was also used to plot graphs, derive and display equations, as well as generate
constants.
4.4 Results and Discussion
4.4.1 Compositional analysis of different substrates
Results from laboratory analyses on the composition of each substrate are
summarized in Table 4-5. Aside from differences in moisture content which were
approximately 11 %, 8 % and 61 % respectively for commercial cassava starch, flour
from solar dried cassava chips and ground fresh cassava root pulp, these data show
that pure starch accounted for more than 80% total solids in the commercial starch,
about 75% of total solids in the cassava flour, and 29% of total solids in the cassava
root pulp. These differences dictated the maximum glucose concentration that could be
reached when hydrolyzing substrates made with the same weight percent of substrate
ingredient.
4.4.2 Enzyme hydrolysis at 60°C
Profiles of glucose concentration over time during enzyme hydrolysis at 60°C of
commercial cassava starch, flour from solar dried cassava chips and ground fresh
cassava root pulp are shown in Figures 4-11, 4-12 and 4-13, respectively. All three
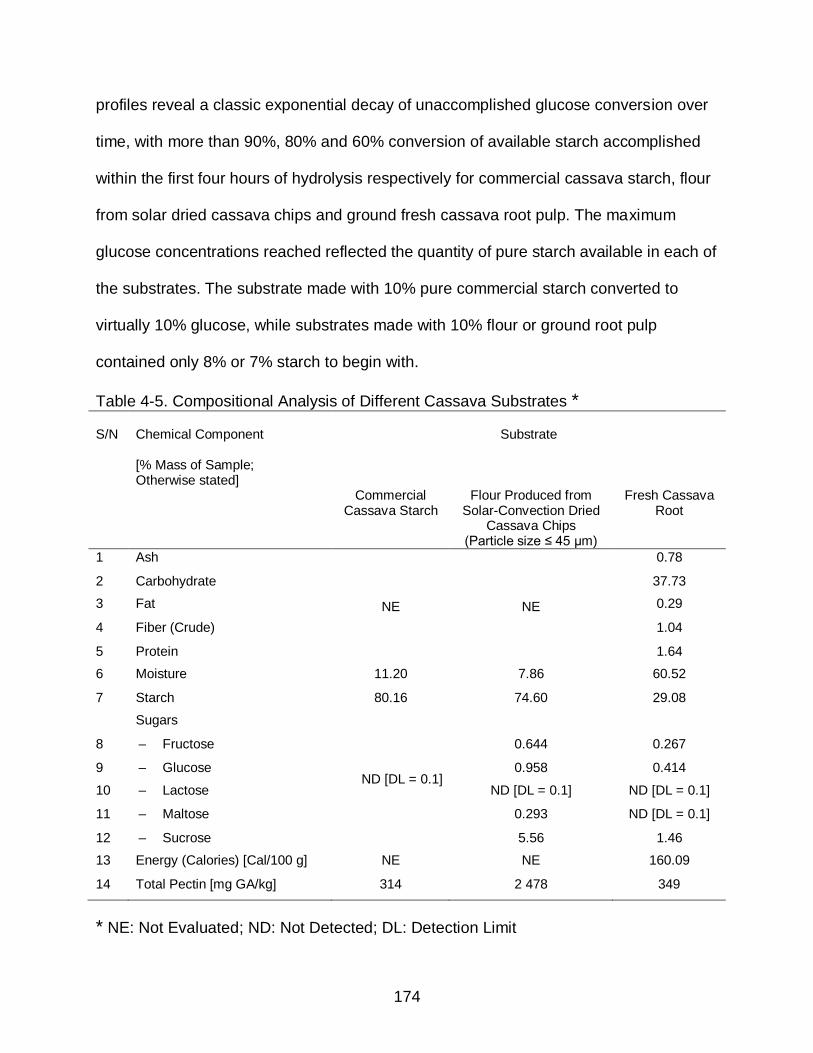
174
profiles reveal a classic exponential decay of unaccomplished glucose conversion over
time, with more than 90%, 80% and 60% conversion of available starch accomplished
within the first four hours of hydrolysis respectively for commercial cassava starch, flour
from solar dried cassava chips and ground fresh cassava root pulp. The maximum
glucose concentrations reached reflected the quantity of pure starch available in each of
the substrates. The substrate made with 10% pure commercial starch converted to
virtually 10% glucose, while substrates made with 10% flour or ground root pulp
contained only 8% or 7% starch to begin with.
Table 4-5. Compositional Analysis of Different Cassava Substrates * S/N
Chemical Component [% Mass of Sample; Otherwise stated]
Substrate
Commercial
Cassava Starch
Flour Produced from
Solar-Convection Dried Cassava Chips
(Particle size ≤ 45 μm)
Fresh Cassava
Root
1 Ash
NE NE
0.78
2 Carbohydrate 37.73
3 Fat 0.29
4 Fiber (Crude) 1.04
5 Protein 1.64
6 Moisture 11.20 7.86 60.52
7 Starch 80.16 74.60 29.08
Sugars
8 – Fructose
ND [DL = 0.1]
0.644 0.267
9 – Glucose 0.958 0.414
10 – Lactose ND [DL = 0.1] ND [DL = 0.1]
11 – Maltose 0.293 ND [DL = 0.1]
12 – Sucrose 5.56 1.46
13 Energy (Calories) [Cal/100 g] NE NE 160.09
14 Total Pectin [mg GA/kg] 314 2 478 349
* NE: Not Evaluated; ND: Not Detected; DL: Detection Limit

175
Figure 4-11. Profile of Glucose Content Vs. Time during Enzyme Hydrolysis of Commercial Cassava Starch at 60 o C (Mean of three replications; and error bars of standard deviations)
Figure 4-12. Profile of Glucose Content Vs. Time during Enzyme Hydrolysis of Flour Produced from Solar Dried Cassava Chips at 60 o C (Mean of three replications; and error bars of standard deviations)
0
2
4
6
8
10
12
0 2 4 6 8 10 12 14 16 18
Glucose Content [g/100 g]
Time [Hours]
0
0.5
1
1.5
2
2.5
3
3.5
4
0 2 4 6 8 10 12 14 16 18
Glucose Content [g/100 g]
Time [Hours]

176
Figure 4-13. Profile of Glucose Content Vs. Time during Enzyme Hydrolysis of Ground Fresh Cassava Root Pulp at 60 o C (Mean of three replications; and error bars of standard deviations)
Maximum starch conversions reached after 24 hours with each substrate are
presented in Table 4-6. A comparison of all three glucose-time profiles is shown as a
family of curves on one graph in Figure 4-14. A similar comparison using bar graphs to
represent percent starch conversion to glucose with each substrate at various points in
time during hydrolysis is shown in Figure 4-15. The results are similar to those of
Srikanta et al. (1987) who also reported greater conversion with pulp than with flour.
Table 4-6. Maximum Starch Converted to Glucose in Different Cassava Substrates after 24 hours of Enzyme Hydrolysis at 60 o C
Substrate
Starch Conversion [%]
Commercial Starch
96
Flour from Solar Dried Chips
27
Ground Fresh Root Pulp
53
0
0.5
1
1.5
2
2.5
3
3.5
4
0 2 4 6 8 10 12 14 16 18
Glucose Content [g/100 g]
Time [Hours]
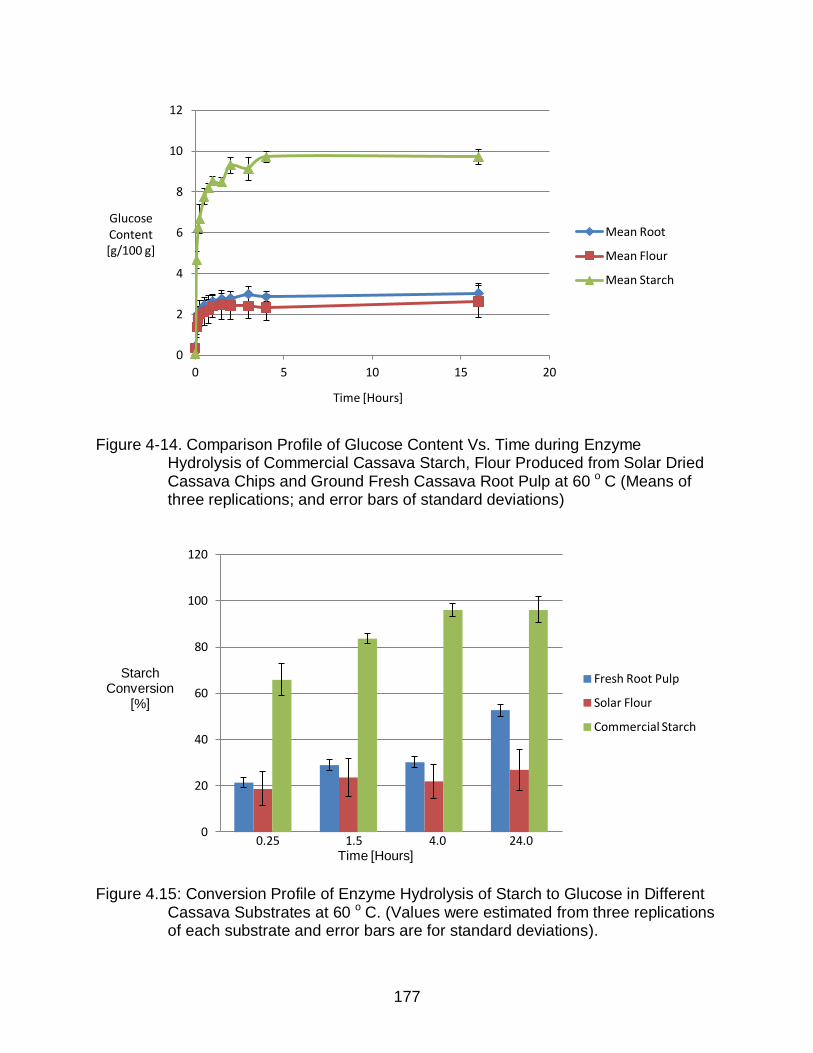
177
Figure 4-14. Comparison Profile of Glucose Content Vs. Time during Enzyme Hydrolysis of Commercial Cassava Starch, Flour Produced from Solar Dried Cassava Chips and Ground Fresh Cassava Root Pulp at 60 o C (Means of three replications; and error bars of standard deviations)
Figure 4.15: Conversion Profile of Enzyme Hydrolysis of Starch to Glucose in Different Cassava Substrates at 60 o C. (Values were estimated from three replications of each substrate and error bars are for standard deviations).
0
2
4
6
8
10
12
0 5 10 15 20
Glucose Content [g/100 g]
Time [Hours]
Mean Root
Mean Flour
Mean Starch
0
20
40
60
80
100
120
Starch Conversion
[%]
Time [Hours]
Fresh Root Pulp
Solar Flour
Commercial Starch
0.25 1.5 4.0 24.0

178
4.4.3 Enzyme hydrolysis at 37°C
Profiles of glucose concentration over time during enzyme hydrolysis at 37°C of
commercial cassava starch, flour produced from solar dried cassava chips and ground
fresh cassava root pulp are shown in Figures 4-16, 4-17 and 4-18, respectively.
Figure 4-16. Profile of Glucose Content Vs. Time during Enzyme Hydrolysis of
Commercial Cassava Starch at 37 o C
Figure 4-17. Profile of Glucose Content Vs. Time during Enzyme Hydrolysis of Flour
Produced from Solar Dried Cassava Chips at 37 o C
0
2
4
6
8
10
12
0 20 40 60 80 100 120
Glucose Content [g/100 g Sample]
Time [Hours]
0
1
2
3
4
5
6
7
8
0 20 40 60 80 100 120
Glucose Content [g/100 g Sample]
Time [Hours]

179
Figure 4-18. Profile of Glucose Content Vs. Time during Enzyme Hydrolysis of Ground
Fresh Cassava Root Pulp at 37 o C
All three profiles also reveal a classic exponential decay of unaccomplished
glucose conversion over time, but much more slowly than at 60 ° C. At 37 ° C,
hydrolysis must proceed for approximately 72 hours (three days) in order to reach 80 –
90% conversion of available starch to glucose. Again, the maximum glucose
concentrations reached after 96 hours of hydrolysis reflected the quantity of pure starch
originally present in each of the substrates, and are given in Table 4-7.
Table 4-7. Maximum Starch Converted to Glucose in Different Cassava Substrates after
96 hours of Enzyme Hydrolysis at 37 o C
Substrate
Starch Conversion [%]
Commercial Starch
100
Flour from Solar Dried Chips
72
Ground Fresh Root Pulp
55
0
1
2
3
4
5
6
0 20 40 60 80 100 120
Glucose
Content [g/100 g Sample]
Time [Hours]

180
A comparison of all three glucose-time profiles is shown as a family of curves on
one graph in Figure 4-19. A similar comparison using bar graphs to represent percent
starch conversion to glucose with each substrate at various points in time during
hydrolysis is shown in Figure 4-20.
Figure 4-19. Comparison Profile of Glucose Content Vs. Time during Enzyme Hydrolysis of Commercial Cassava Starch, Flour Produced from Solar Dried Cassava Chips and Ground Fresh Cassava Root Pulp at 37 o C
Figure 4-20. Conversion Profile of Enzyme Hydrolysis of Starch to Glucose in Different
Cassava Substrates at 37 o C
0
2
4
6
8
10
12
0 50 100 150
Glucose Content [g/100 g Sample]
Time [Hours]
Root
Flour
Starch
0
20
40
60
80
100
120
Starch Conversion
[%]
Time [Hours]
Fresh Root
Solar Flour
Commercial Starch
1 4 48 72 96

181
4.4.4 Reaction Kinetics of Enzyme Hydrolysis
As noted earlier, all glucose-time profiles revealed a classic exponential decay of
unaccomplished glucose conversion over time. All experiments were carried out using
the same substrate and enzyme concentrations. Under these conditions, any
differences in performance of hydrolysis with different substrates would be noted in the
rate of reaction. Therefore, the exponential decay of unaccomplished glucose
conversion over time could be treated as a first order biochemical reaction that could be
described by first-order reaction kinetics. These kinetics can be quantified by reporting
numerical values for first-order rate constants (k) at different temperatures, and the
Arrhenius activation energy (EA) describing the temperature dependency of the rate
constants.
4.4.4.1 First-order rate constants
The first-order rate constants were taken from the slopes of straight lines
obtained on a semi-log graph of unaccomplished glucose conversion over time. The
unaccomplished glucose conversion was expressed mathematically as the difference
between maximum glucose concentration reached [Cmax] and the glucose concentration
at any point in time, [C]. Semi-log plots of unaccomplished glucose conversion over time
for all three substrates at 60°C are presented in Figure 4-21, and at 37°C in Figure 4-22.
First-order rate constants [k] were taken from the slope of the straight line of best
fit by linear regression for each substrate, and are listed in Table 4-8 and Table 4-9 for
hydrolysis at 60°C and 37°C respectively.
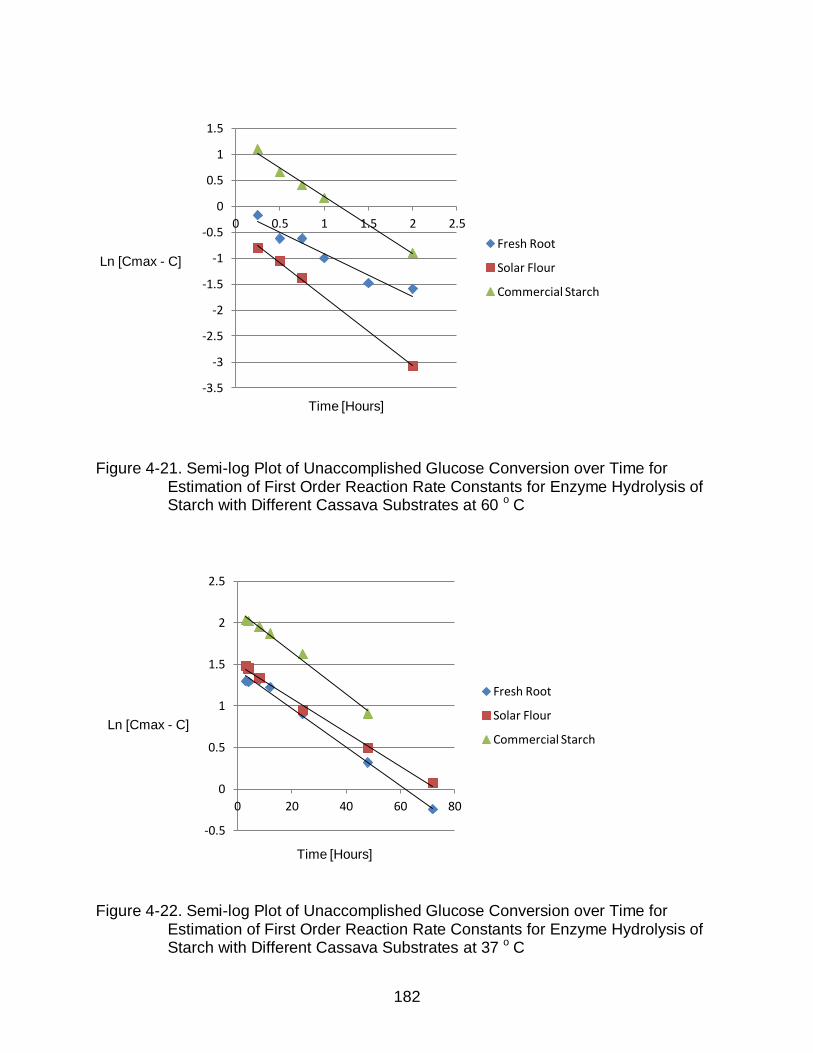
182
Figure 4-21. Semi-log Plot of Unaccomplished Glucose Conversion over Time for
Estimation of First Order Reaction Rate Constants for Enzyme Hydrolysis of Starch with Different Cassava Substrates at 60 o C
Figure 4-22. Semi-log Plot of Unaccomplished Glucose Conversion over Time for
Estimation of First Order Reaction Rate Constants for Enzyme Hydrolysis of Starch with Different Cassava Substrates at 37 o C
-3.5
-3
-2.5
-2
-1.5
-1
-0.5
0
0.5
1
1.5
0 0.5 1 1.5 2 2.5
Ln [Cmax - C]
Time [Hours]
Fresh Root
Solar Flour
Commercial Starch
-0.5
0
0.5
1
1.5
2
2.5
0 20 40 60 80
Ln [Cmax - C]
Time [Hours]
Fresh Root
Solar Flour
Commercial Starch

183
Table 4-8. Reaction Rate Constant (k), Correlation Coefficient (R2) and Regression Equation of First Order Reaction for Enzyme Hydrolysis of Different Cassava Substrates at 60 o C.
Substrate
k Value [Hour – 1]
R2
Equation
Commercial Starch
1.1017
0.9920
y = -1.1017x + 1.2825
Solar Flour
1.3198
0.9986
y = -1.3198x - 0.4222
Fresh Root
0.8164
0.9397
y = -0.8164x - 0.0949
Table 4-9. Reaction Rate Constant (k), Correlation Coefficient (R2) and Regression
Equation of First Order Reaction for Enzyme Hydrolysis of Different Cassava Substrates at 37 o C.
Substrate
k Value [Hour – 1]
R2
Equation
Commercial Starch
0.0250
0.9886
y = -0.025x + 2.1476
Solar Flour
0.0205
0.9953
y = -0.0205x + 1.5058
Fresh Root
0.0232
0.9921
y = -0.0232x + 1.4363
4.4.4.2 Activation energy
The Arrhenius activation energy (EA) describing the temperature dependency of
the rate constants was taken from the slope of the straight line obtained on an Arrhenius
plot of the natural log of rate constant against reciprocal absolute temperature.
Arrhenius plots for each substrate are shown in Figure 4-23, and the resulting activation

184
energies for each substrate are listed in Table 4-10. A full report of the reaction kinetics
for each of the three substrates is summarized in Table 4-11.
Figure 4-23. Semi-log Plot of First Order Reaction Rate Constants versus Reciprocal
Absolute Temperature for Estimation of Arrhenius Activation Energy for Enzyme Hydrolysis of Cassava Starch at 37 o C and 60 o C
Table 4-10. Activation Energy (EA) and Regression Equations for Estimating the
Arrhenius Temperature Dependency of Rate Constant for Enzyme Hydrolysis of Different Cassava Substrates
Substrate
EA
[kJ/mol]
Equation
Commercial Starch
143.067
y = -17208x + 51.720
Solar Flour
157.392
y = -18931x + 57.070
Fresh Root
134.562
y = -16185x + 48.353
-4.5
-4
-3.5
-3
-2.5
-2
-1.5
-1
-0.5
0
0.5
0.00295 0.003 0.00305 0.0031 0.00315 0.0032 0.00325
Ln k
1/T [1/K]
Fresh Root
Solar Flour
Commercial Starch

185
Table 4-11. Reaction Kinetics Parameters for Enzyme Hydrolysis of Starch in Different
Cassava Substrates
Substrate
Reaction Rate Constant; k
[Hour – 1]
Activation Energy; EA
[kJ/mol]
37 o C
60 o C
Commercial Starch
0.0250
1.1017 143.0670
Solar Flour
0.0205
1.3198 157.3920
Fresh Root
0.0232
0.8164 134.5620

186
CHAPTER 5 ANAEROBIC DIGESTION OF CASSAVA WASTE FOR PRODUCTION OF BIOGAS
AND AMYLOLYTIC ENZYMES
5.1 Background
As a result of climate change and other environmental issues, inevitable
depletion of fossil fuels supply, sustainability, renewability and biodegradability
concerns, energy security, balance of trade and foreign exchange matters, as well as
associated socio economic implications, considerable efforts are being deployed
globally to the development of renewable energy sources (Nigam and Singh, 2011;
Demirbas, 2009, International Energy Agency (IEA), 2009; Demirbas, 2007; Lin and
Tanaka, 2006; Wyman et al., 2005; Lynd and Wang, 2004; Wyman, 1999; Lynd et al.,
1991; Menezes, 1982). To this effect, biomass in its various forms appears to be a
major energy source (Bloomberg New Energy Finance, 2012; Nigam and Singh, 2011;
Renewable Energy Policy Network for the 21st Century (REN21), 2011; Ruiz et al.,
2011; Demirbas, 2009; Herrera, 2006; Lin and Tanaka, 2006; Ragauskas et al., 2006).
However, the use of edible parts of food crops (e.g. sugarcane, corn/maize, soybean,
palm oil) for biofuel (e.g. bioethanol, biodiesel) production has raised ethical concerns
about diversion of food to fuel production (Pullammanappallil, 2013; Cheng and
Timilsina, 2011; Glover et al., 2010; Godfray et al., 2010; Thomson et al., 2010;
Fargione et al., 2008; Searchinger et al., 2008; The Royal Society, 2008). Therefore, a
reasonable alternative is biofuel production from agricultural residues and wastes, as
well as from microalgae, and lignocellulosic biomass originating from non-food sources.
Cassava wastes such as peels are generated during the processing and
production of numerous cassava based food products like casabe, chickwangue,
farinha de mandioca, fufu, fuku, gaplek, gari, konkonte, landang, and peujeum. The

187
cassava peel is reported to constitute 15 – 19 % fresh weight of the cassava root
(Gomez and Valdivieso, 1983; Gomez et al., 1985). With manual peeling, the peel can
constitute 20 – 35 % of the total weight of the root (Ekundayo, 1980). More than 60 % of
global cassava production is processed as food for human consumption (Tonukari,
2004). In 2011, world cassava output was 252.20 x 10⁹ kg and most of it was produced
by developing countries (FAO, 2013). Therefore enormous organic waste is generated
from cassava processing. This waste could potentially be a good feed stock for
anaerobic digestion and fermentation processes for the production of biogas and
hydrolytic enzymes.
Agricultural residues such as cassava peel, cowpea waste, plantain peel, rice
bran; yam peel, etc have been reported as suitable fermentation substrates for the
production of enzymes (Adeniran and Abiose, 2011; Adeniran et al., 2010; Adeniran
and Abiose, 2009; Kareem et al., 2009; Silva et al., 2009; Alva et al., 2007; Swain and
Ray, 2007; Uguru et al., 1997; Sani et al., 1992). Also, cassava stem residues, waste
water and peel are reported to have been used in biogas production (Zhu et al., 2013,
Gao et al., 2012; Cuzin et al., 1992). However, the author did not identify any report that
evaluated simultaneous production of biogas and enzymes from cassava waste. It will
appear to be a win and win again situation if it is possible to use cassava peel waste in
anaerobic digestion to produce biogas that could be used as a source of energy on the
one hand; and also to extract a natural cocktail of hydrolytic enzymes from the post
digestion broth on the other hand. This study explored these possibilities.
5.2 Objectives
The objectives of the work reported in this study were to:

188
Determine the proportions of cassava root components. These include the peel (periderm/epidermis or outer coat and cortex), the parenchymatous tissue, the head and the tail ends.
Demonstrate the feasibility of anaerobic digestion of cassava waste by performing experiments with cassava peels and reporting performance indicators such as: methane yield, chemical oxygen demand (COD), pH, etc.
Explore feasibility of extracting from the post anaerobic digestion broth, active enzymes that are capable of hydrolyzing cassava starch.
Determine the activity of any extracted enzyme.
5.3 Materials and Methods
5.3.1 Cassava Roots
Fresh cassava roots were purchased from Brooks Tropicals, Homestead, Florida.
The roots were coated with food wax and supplied refrigerated in 18 kg boxes. Upon
receipt, each consignment or batch was promptly received and maintained under
refrigerated storage (< 10 o C) until utilized.
5.3.2 Reactor
The reactor used in this study constituted mesophilic anaerobic digester. The
digester vessel was fabricated from a Pyrex glass jar about 0.2540 m high from base to
shoulder and 0.1651 m in diameter (Figure 5-1 b). The neck was approximately 0.0889
m in length and 0.0889 m in diameter. Volume capacity of the reactor was ≈ 0.0054 m3;
of which 0.003 m3 was utilized in each batch of the experiments. The reactor was
charged from top through the neck opening. The opening was capped with air and
liquid-tight closure system that consisted of Pyrex lid, Teflon O ring and Stainless steel
clamp. The vessel was fitted with ports at top of the lid and on the side close to the
bottom for biogas transfer and leachate withdrawal respectively. The reactor vessel was
incubated at mesophilic temperature (36 ± 3 o C) in a converted household refrigerator

189
chamber, heated with a 65 W Sylvania light bulb (Sylvania lighting Services
Corporation, Danvers, Massachusetts). The bulb was controlled by BFG thermostat,
model #6910796 (Whirlpool Corporation, Benton Harbor, Michigan). Biogas production
was monitored with a positive displacement type gas meter that was connected from
outside of the incubator chamber. The meter device consisted of a transparent PVC U-
tube that was filled with orange colored anti-freeze solution; float switch (W W Grainger,
Lake Forest, Illinois); solenoid valve (Fabco-Air Inc., Gainesville, Florida); Dayton off
time delay relay model 6X153E (W W Grainger, Lake Forest, Illinois); and a counter
(Redington Counters Inc., Windsor, Connecticut). The design assembly of the
anaerobic reactor digester and biogas measurement system is shown in Figure 5-1.
Figure 5-1. Anaerobic Digestion System Design

190
5.3.3 Inoculum
About 0.003 m3 of mixed liquor from an active municipal solid waste fed
mesophilic lab-scale digester was used as inoculum to start up the first experiment.
Subsequently, mixed liquor from previous experiment was used as inoculum for next
experiment.
5.3.4 Bulking Agent
To prevent compaction of peel waste in the digester, about 1.5 kg of lava rocks
was used as bulking agent. The rocks which were irregularly shaped and about 2.5 cm
in average dimension were obtained from a landscaping supplier.
5.3.5 Sample Preparation
5.3.5.1 Root components proportion
For each experimental run, between 1780 g to 2828 g of fresh cassava roots was
retrieved from refrigeration and used. Roots were weighed with heavy duty shipping
scale serial # HD 150 (My Weigh, Phoenix, Arizona, Figure 5-2). Deliberate efforts were
Figure 5-2. My Weigh Shipping Scale used to weigh out Cassava Roots

191
made to include for each batch, small, medium and large size roots. The measured
roots were placed on a cutting board shown in Figure 5-3 A, and then peeled with a
kitchen knife (Figure 5-3 B).
A
B
Figure 5-3. Implements used to Peel Cassava Roots and Prepare the Peelings for
Experiments. A) Cutting Board B) Peeling Knives. Photos courtesy of author.
The peeling process involved two steps; first, carefully cutting off the head and
tail ends of each root such that the main edible portion (the parenchyma) was not
affected. Secondly, the peel (periderm/epidermis or bark/outer coat, and cortex) was
separated from the parenchymatous tissue, again making sure that the parenchyma
was not affected. The root components: Head and Tail ends; Periderm/Epidermis;
Cortex; and Parenchyma were subsequently weighed separately to determine root
mass proportions. The masses were thereafter added and compared to the initial mass
of roots to estimate the lost mass. Figure 5-4 shows the different components and the
types, shapes and sizes of roots encountered. The described operations were
replicated four times.

192
A
D
Figure 5-4. Components of Cassava Root. A), B), C), D) and F) Head & Tail Ends
Shown E) and G) Periderm/Epidermis, Cortex and Parenchyma Shown. Photos B, C, D and E courtesy of google.com images; Photo G courtesy of bing.com/images. The remainder of the photos courtesy of author.
E
Head
Tail
Parenchyma
Periderm Coat
Cortex
Head
Tail
Tail
Head
Head Tail
G:
Parenchyma
Periderm Coat
Cortex
Head
Tail
F
C B

193
5.3.5.2 Anaerobic digestion samples
For anaerobic digestion experiments, the cortex which was 0.203 to 0.224 cm
thick was cut into pieces of 2.5 cm average dimension. Similarly, the head and tail ends,
as well as the periderm or epidermis was reduced to pieces of about 2.5 cm average
dimensions. These cut up three root components (Head and Tail ends,
Periderm/epidermis, and Cortex) were combined, mixed thoroughly and used as
substrates in all the anaerobic digestion experiments. The substrate as prepared was
used either immediately or stored under frozen (≤ – 10 o C) refrigeration until required.
5.3.6 Anaerobic Digestion Procedure
Two hundred grams of substrate was charged for each batch of anaerobic
digestion experiment. Freshly prepared substrate was used or previously frozen sample
was thawed overnight before utilization. To start the loading process, the substrate was
divided into two equal portions of one hundred grams each; and the 1.5 kg lava rock
bulking agent was divided into three equal portions of five hundred grams each. The
reactor vessel cap was then disengaged and one portion of the bulking agent (five
hundred grams) layered on the bottom of the vessel. The first one hundred grams
portion of substrate was spread on the rocks. Then the second portion of five hundred
grams of lava rocks was layered over the substrate and the remaining one hundred
grams portion of substrate spread on the rocks. Finally, the remaining five hundred
grams of lava rocks was layered over the substrate. The first run was inoculated with
3000 cm3 of mixed culture inoculums and 35 g of soda ash (sodium bicarbonate) was
added to buffer against pH changes. The digester cap was replaced and clamped tight;

194
digester placed in the incubator chamber; biogas lines were connected; the incubator
door was closed; and anaerobic digestion allowed to proceed.
When gas production capacity was depleted (no biogas produced in two or more
consecutive days), the process was interrupted and stopped. The cap was opened and
the second batch (200 g) of substrate was loaded from the top. Similarly, the third and
fourth batches of 200 g substrate each was charged at the end of the second and third
runs respectively. Each subsequent run was therefore initiated by the post digestion
broth of the preceding experiment; no additional inoculums or buffer were added. At the
end of the fourth run, all the contents of the digester were discharged and the digestion
broth and substrate digestate (residue) were analyzed for enzyme activity. For the fifth
experiment, 200 g of substrate was prepared and layered as described for run number
one above. The remaining broth from the first four runs was made up to 3000 cm 3 with
fresh inoculums and used for inoculation; no additional buffer was added.
Each batch of experiment was operated in a batch mode; as a single-stage,
leach-bed, and unmixed system. The digester contents were not agitated.
5.3.7 Analysis
5.3.7.1 Biogas composition
The methane and carbon dioxide composition of biogas produced was analyzed
with Gas Chromatograph (GC) Series 580 (Gow-Mac Instrument Co., Bethlehem,
Pennsylvania) that was coupled with Gas Partitioner Model 1200 (Fisher Scientific Inc.,
Waltham, Massachusetts). The GC was equipped with thermal conductivity detector
and calibrated with a mixture of nitrogen (N2), methane (CH4), and carbon dioxide (CO2)
in the volume ratio of 25:45:30 [N2:CH4:CO2]. The GC analytical system that is being
described and was used in the experimental work is shown in Figure 5-5.
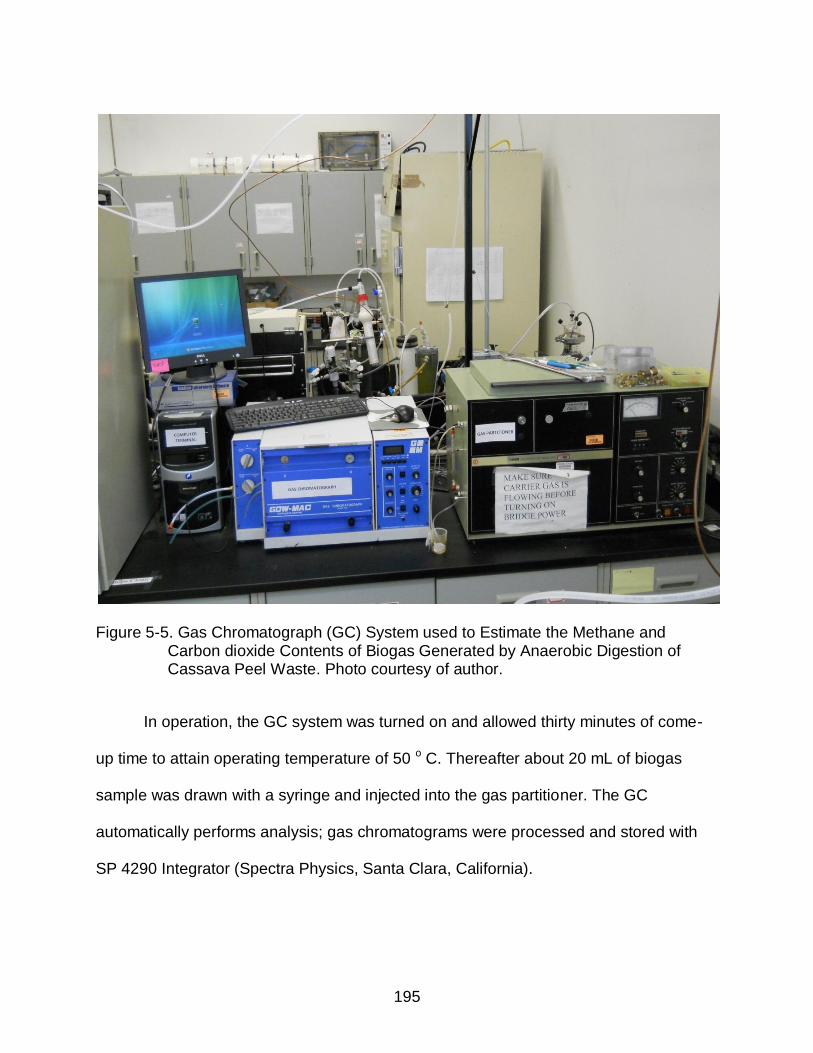
195
Figure 5-5. Gas Chromatograph (GC) System used to Estimate the Methane and
Carbon dioxide Contents of Biogas Generated by Anaerobic Digestion of Cassava Peel Waste. Photo courtesy of author.
In operation, the GC system was turned on and allowed thirty minutes of come-
up time to attain operating temperature of 50 o C. Thereafter about 20 mL of biogas
sample was drawn with a syringe and injected into the gas partitioner. The GC
automatically performs analysis; gas chromatograms were processed and stored with
SP 4290 Integrator (Spectra Physics, Santa Clara, California).

196
5.3.7.2 Soluble chemical oxygen demand (sCOD)
The soluble chemical oxygen demand (sCOD) was analyzed for daily leachate
samples drawn from the digester using Hach COD reagent kit (Hach Company,
Loveland, Colorado). About 4 mL of leachate was withdrawn from the digester and
centrifuged for ten minutes at 2500 rpm with Marathon Micro H centrifuge (Fisher
Scientific Inc., Waltham, Massachusetts; Figure 5-6 A). The supernatant was
Figure 5-6. Laboratory Equipment used in sCOD analysis of Leachate from Anaerobic Digestion of Cassava Peel Waste. A) Marathon Micro H Centrifuge B) Hach sCOD Reactor C) Hach sCOD Colorimeter. Photos courtesy of the author.
filtered with 0.45 μm pore size filter paper (Whatman Plc., Maidstone, Kent, UK). The
filtrate was diluted twenty times and 2 mL pipetted into Hach COD reagent vials (with
A
B
C

197
the range: 20 – 1500 mg/L (2 – 150 ppm) COD). The vials were digested (incubated) for
two hours at 150 o C in the COD reactor model # 45600-00 (Hach Company, Loveland,
Colorado; Figure 5-6 B). Subsequently, the COD of the leachate was read with DR/890
colorimeter (Hach Company, Loveland, Colorado; Figure 5-6 C), after zeroing with a
blank.
5.3.7.3 pH
The pH of digester broth was monitored about the same time daily with Orion 3
Star pH Bench top (Thermo Scientific Inc., Waltham Massachusetts). Assay technique
involved withdrawing 20 mL of broth in a plastic vial. The pH meter was turned on and
warmed for thirty minutes. Meter probe which had been properly calibrated with neutral
and acidic standard media was rinsed with distilled water and wiped dry with lint free
kimwipes (Kimberly-Clark Corporation, Irving Texas). The probe was subsequently
inserted into the broth and held until the meter gave a stable reading.
5.3.7.4 Total solids (TS), volatile solids (VS), and other properties
Total solids (TS) and volatile solids (VS) constituents of the peel waste
(feedstock) were determined gravimetrically. About 100 g of sample was dried for 72
Hrs at 105 o C using Isotemp Oven Model 350 G (Fisher Scientific Inc., Waltham,
Massachusetts). The dried sample was then burnt in Isotemp Muffle Furnace (Fisher
Scientific Inc., Waltham, Massachusetts) at 550 o C for 2 Hrs. From the masses of the
sample, dried sample, ash residue, sample pan, etc., TS, VS, and other properties were
computed. The formulae used for computations and methane yield analysis are

198
presented in Table 5-1. The procedure described was executed for each batch or
replication of the experiment.
Table 5-1. Formulae for Methane Yield Analysis and for Determination of Properties of Cassava Peel Waste used as Feedstock/Substrate in Anaerobic Digestion for Biogas and Enzyme Production
Parameter Symbol
Parameter ID Unit Computational Formula
A Mass of Dish and Sample Dried for 72 Hrs at 105 o C
g
B Mass of Dish Alone
g
C Mass of Wet Sample and Dish
g
D Mass of Dish and Sample Burnt for 2 Hrs at 550 o C
g
E Cumulative Methane Production
L
F Batch of Feedstock ( Peel Waste) Charge in the Digester
g
G
Total Solids
%
H Volatile Solids
%
I Volatile Solids Proportion
g VS
J Fixed Solids
%
K Moisture Content; Wet Basis
%
L Moisture Content; Dry Basis
%
M Methane Yield Per Feedstock Charge
L/g
N Methane Yield Per Volatile Solids
L/g VS
O Methane Production Efficiency
%
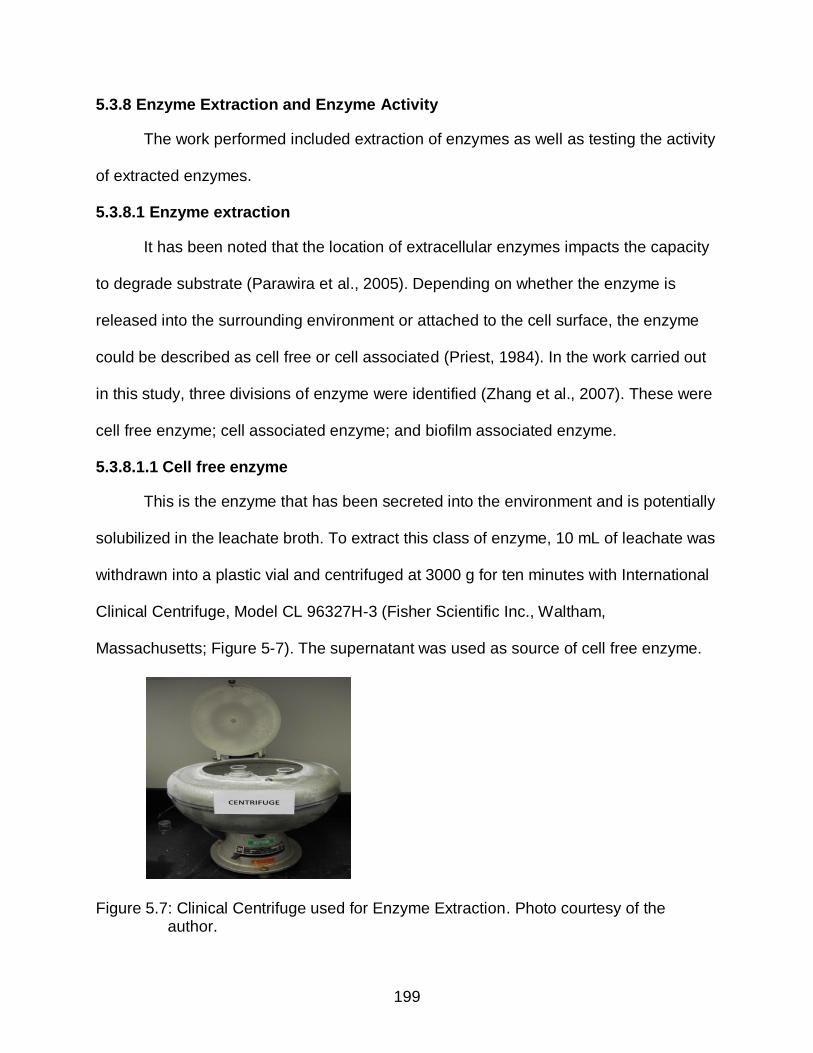
199
5.3.8 Enzyme Extraction and Enzyme Activity
The work performed included extraction of enzymes as well as testing the activity
of extracted enzymes.
5.3.8.1 Enzyme extraction
It has been noted that the location of extracellular enzymes impacts the capacity
to degrade substrate (Parawira et al., 2005). Depending on whether the enzyme is
released into the surrounding environment or attached to the cell surface, the enzyme
could be described as cell free or cell associated (Priest, 1984). In the work carried out
in this study, three divisions of enzyme were identified (Zhang et al., 2007). These were
cell free enzyme; cell associated enzyme; and biofilm associated enzyme.
5.3.8.1.1 Cell free enzyme
This is the enzyme that has been secreted into the environment and is potentially
solubilized in the leachate broth. To extract this class of enzyme, 10 mL of leachate was
withdrawn into a plastic vial and centrifuged at 3000 g for ten minutes with International
Clinical Centrifuge, Model CL 96327H-3 (Fisher Scientific Inc., Waltham,
Massachusetts; Figure 5-7). The supernatant was used as source of cell free enzyme.
Figure 5.7: Clinical Centrifuge used for Enzyme Extraction. Photo courtesy of the author.

200
5.3.8.1.2 Cell associated enzyme
The cell associated enzyme is presumed to be attached to the surface cells of
organisms that are freely suspended in leachate liquor (broth). On centrifugation,
suspended cells are separated from the liquor into a pellet; carrying the attached
enzymes with them. The pellet is harvested and the cell associated enzyme extracted
from it thus:
Wash the pellet resulting from cell free enzyme extraction two times. For each washing, centrifuge with 10 mL of potassium dihydrogen phosphate buffer (pH 7.0; 0.1 mol L–1) for two minutes at 3000 g.
Suspend the washed pellet in 2 mL of sodium acetate buffer (pH 6.0; 0.05 mol L–1). Then centrifuge the suspension at 3000 g for ten minutes. The supernatant is collected as the source of cell associated enzyme.
5.3.8.1.3 Biofilm associated enzyme
In the milieu of anaerobic digestion, some microbes are attached to the surface
of the substrate as biofilm. Those enzymes that are attached to microbes that
themselves are attached to the substrate are called biofilm associated enzymes. A
biofilm associated enzyme is neither in solution in the leachate broth (cell free enzyme)
nor attached to the surface of organisms that are suspended in the leachate broth (cell
associated enzyme). Biofilm associated enzyme was extracted with a procedure similar
to that used for cell associated enzyme.
About 5 g of substrate was taken out of the anaerobic digester (or 5 g of digestate was taken at the end of a batch anaerobic digestion operation).
The substrate/digestate was washed twice. Each washing process was carried out with 10 mL of potassium dihydrogen phosphate buffer (pH 7.0; 0.1 mol L–1); by centrifuging for two minutes at 3000 g.
Washed substrate/digestate was suspended in 2 mL of sodium acetate buffer (pH 6.0; 0.05 mol L–1). The suspension was centrifuged at 3000 g for ten minutes. The supernatant was then collected as the source of biofilm associated enzyme.

201
5.3.8.2 Enzyme activity
The determination of enzymatic activity was carried out for each of the three
divisions of enzyme: cell free; cell associated; and biofilm associated. Specifically,
amylase activity was estimated by method of Bernfeld (Bernfeld 1955), but with
modifications where appropriate. Assay system used to determine activity for each
enzyme division contained 0.5 mL of the crude enzyme solution and 0.5 mL of 1 %
commercial cassava starch. The 1 % starch may be used as is; not buffered to estimate
overall amylolytic activity. The starch may be buffered with disodium hydrogen
phosphate buffer (pH 6.9; 0.1 mol L–1) to estimate amylase activity (Adeniran et al.,
2010; Zhan et al., 2007). Alternatively, the 1 % starch solution may be buffered with
sodium acetate buffer (pH 4; 0.1 mol L–1) to estimate glucoamylase activity (Adeniran et
al., 2010; de Moraes et al., 1999; Zanin and De Moraes, 1998). The mixture was then
incubated at 37 o C for thirty minutes and the released reducing sugar (as glucose)
estimated with the 3,5-dinitrosalicylic acid (DNS) procedure. The DNS methodology was
defined and discussed in chapter four of this dissertation.
One unit of enzyme activity (EU) was defined as the amount of the enzyme that
liberated 1μg of reducing sugar (as glucose) per minute, under the assay conditions.
Specific activity was expressed as enzyme unit per μg protein (EU/ μg protein). The
protein content of each enzyme solution was estimated by the modified Lowry’s method
(Thermo Fisher Scientific Inc., 2011; Lowry et al., 1951), taking liquid bovine serum
albumin or BSA (Thermo Scientific, Rockford Illinois) as the standard.

202
5.4 Results and Discussion
5.4.1 Cassava Root Components Proportions
Table 5-2 shows the proportion of cassava root components on fresh mass
basis. The major human food component, the parenchyma, constituted the largest mass
with the average value of 81.16 % and range of 80.72 % to 81.75 %. The cortex was
second with the range of 12.76 % to 13.33 % and mean value of 13.11 %. The periderm
or epidermis, also known as the bark or outer coat, averaged 3.31%; while head and tail
ends had a mean value of 1.71 %. Since the peel consists of cortex and periderm, its
mean proportion of cassava fresh root was computed to be 16.42 %. This value is
similar to the work of Gomez and Valdivieso (1983) and Gomez et al., (1985) who
Table 5-2. Mass Distribution of Cassava Root Components
S/N Component
Mass Proportion [% Fresh Mass]
Run No. 1
Run No. 2
Run No. 3
Run No. 4
Mean
Edible Portion
1 Parenchyma 81.30 81.75 80.88 80.72 81.16
Waste Portion
2 Cortex 13.33 12.76 13.24 13.11 13.11
3 Periderm 3.51 3.19 3.38 3.15 3.31
4 Head & Tail Ends 1.35 1.18 1.79 2.54 1.71
Lost Portion
5 Lost Mass 0.51 1.12 0.71 0.48 0.71
6 Total Waste = Sum of waste portion = 18.13 %
reported cassava root peel proportions of 15 % – 18 % and 15 % – 19 % respectively.
Dufour (1988), reported relative contributions of the bark (periderm) and cortex fractions

203
to root fresh weight of 1.6 % and 14 3 % respectively. Furthermore, it has also been
reported in the literature that after 4 months to 10 months of cultivation, the cortex
constituted about 15 % of total fresh weight of root (Cooke and de la Cruz, 1982).
An interesting root component presented in Table 5-2 is termed lost mass. It was
discovered that the sum of the masses of conventional root components (parenchyma,
cortex, periderm, and head and tail ends) was less than the total mass of root that was
started out with. The lost mass may be due to evaporative loss of moisture, micro and
nano particles that may have drifted away, volatilization and loss of the wax coating, etc.
The lost mass concept was therefore introduced to account for these irrecoverable
losses. Consequently, the lost mass was discounted, and the total waste associated
with the peeling process was reported to be the sum of cortex, periderm, and head and
tail ends. The sum of these waste components, and therefore the total waste, averaged
18.13 % of the fresh mass of cassava root.
5.4.2 Composition of Cassava Peel Waste
The characteristics of the cassava peel waste are presented in Table 5-3. The
mean moisture content of the peel wastes was 66.79 % wet basis. The values ranged
from 63.14 % for run number one to 73.33 % for run number two. Total solids
composition averaged 33.19 % and on average, 96.37 % of the solids was volatile. The
range for total solids varied from 26.66 % (run number two) to 36.85 % (run number
one); while that for volatile solids varied from 95.38 % (run number four) to 96.90 % (run
number three). Furthermore, the dry weight mean was 66.36 g, ranging from 53.32 g for
run number two to 73.70 g for run number one, while for the fixed solids, the range was
from 3.09 % for run number three to 4.61 % for run number four, with the mean value of
3.61 % (Table 5-3).

204
Table 5-3. Substrate Characteristics and Bio-Methane Potentials of Mesophilic Anaerobic Digestion of Cassava Peel Waste
S/N
Variable Parameter
Run
Number One
Run
Number Two
Run
Number Three
Run
Number Four
Mean
1 Mass of Wet Substrate Charge [g]
200
200
200
200
200
2 Moisture Content, Wet Basis [%] 63.14 73.33 63.21 67.50 66.79
3 Moisture Content, Dry Basis [%] 171.26 275.00 171.82 207.69 206.44
4 Total Solids [%] 36.85 26.66 36.78 32.50 33.19
5 Dry Weight of Solids [g] 73.70 53.32 73.56 65.00 66.36
6 Volatile Solids [%] 96.81 96.42 96.90 95.38 96.37
7 Volatile Solids Proportion [gVS] 71.35 51.42 71.30 62.00 64.01
8 Organic Load [gVS/L]
23.78 17.13 23.75 20.66 21.33
9 Fixed Solids [%] 3.18 3.57 3.09 4.61 3.61
10 Cumulative Methane Production
[L] 14.21 15.94 12.71 19.11 15.49
11 Methane Yield Per Substrate
Charge [L /g] 0.0710 0.0797
0.0635 0.0955 0.0774
12 Methane Yield Per Volatile
Solids Proportion [L @ STP /gVS]
0.1991
0.3099
0.1782
0.3082 0.2488
13 Residence Time [Days] 30.37 24.93 19.35 33.28 26.98
14 Biogasification Efficiency [%]
56.89 88.55 50.91 88.06 71.10

205
5.4.3 Biogasification of Cassava Peel Waste
The profiles of cumulative methane yield versus time for the four runs are
presented in Figure 5-8. Run number two had the highest performance, followed by run
Figure 5-8. Methane Yield of Mesophilic Anaerobic Digestion of Cassava Peel Waste
number four. Run number one Biogasification was initiated with mixed liquor from an
anaerobic digester treating municipal solid waste. It is quite possible that the organisms
were not adapted to wastes from cassava processing. This may explain the long lag
time of six days that it took to commence methanogenesis and biogas production in run
number one. However, eight days later, on day fourteen from date of start up, methane
production rate peaked at 2.48 L per day. After about nineteen days from
commencement of the experiment, methane production dropped to 0.12 L per day. Gas
production capacity was eventually exhausted by the thirtieth day when gas production
rate dropped to zero. Run number two was initiated with the now active broth from run
number one. It can be seen from Figure 5-8 that there was no lag time in commencing
-0.05
0
0.05
0.1
0.15
0.2
0.25
0.3
0.35
0 10 20 30 40
Methane Yield
[L @ STP/gVS]
Time Elapsed [Days]
Run No. One
Run No. Two
Run No Three
Run No. Four

206
biogas production. Methanogenesis started quickly and gas production rate peaked on
day seven at 2.14 L per day. Biogas production thereafter slowly tapered off and was
exhausted by day twenty five with the cumulative methane yield of 0.31 L @ STP/gVS.
Residence time for the batch operations (the time from when the digester was
charged or loaded to the time when no biogas was produced in two or more consecutive
days) ranged from 19.35 days for run number three to 33.28 days for run number four.
The mean residence time was 26.98 days. The mean cumulative methane yield for all
the runs was 0.25 L @ STP/gVS. The range was from ≈ 0.18 L @STP/gVS for run
number three to 0.31 L @ STP/gVS for run number two and four; Table 5-3.
The range and mean results of cumulative methane yield for cassava peel waste
are in accord with what have been reported in the literature as biochemical methane
potential for biomass and waste feedstocks such as sorghum, napiergrass, poplar,
sugarcane, willow, municipal solid waste, as well as spent sugar beet processing by-
products (Koppar and Pullammanappallil, 2008; Polematidis et al., 2008; Hutnan et al.,
2001, 2000; Chynoweth et al., 1993; Stoppok and Buchholz, 1985; Frostell et al., 1984).
5.4.4 Soluble Chemical Oxygen Demand (sCOD)
Profiles of Soluble Chemical Oxygen Demand (sCOD) of Mesophilic Anaerobic
Digestion of Cassava Peel waste for run number one and run number three are shown
in Figure 5-9. The day one sCOD for run number one was 2440 mg/L. Ten days later,
on day eleven of the experiment, sCOD for run number one peaked at 14340 mg/L. On
that peak date, the cumulative methane production, cumulative methane production
rate, and cumulative methane yield for run number one were respectively 2.56 L, 1.27 L
per day, and 0.0359 L @ STP/gVS. The sCOD thereafter tapered down and

207
Figure 5-9. Profiles of Soluble Chemical Oxygen Demand (sCOD) for Mesophilic Anaerobic Digestion of Cassava Peel Waste
approached the value of 2840 mg/L by day nineteen of the run.
Run number three started with sCOD of 2140 mg/L on the loading day. Six hours
later the value was 3540 mg/L, and by the next day (day one) sCOD for run number
three rose to 6700 mg/L. The sCOD value continued the rise and peaked on day seven
at 19320 mg/L. On that peak date of sCOD of run number three, the cumulative
methane production, cumulative methane production rate, and cumulative methane
yield were respectively 2.61 L, 0.528 L per day, and 0.0366 L @ STP/gVS. The sCOD
thereafter tapered down and approached the value of 2220 mg/L at the end of the run.
A careful study of Figures 5-8 and 5-9 revealed some interesting phenomena.
First, the cumulative methane yield for runs one and three were similar on the days the
sCOD peaked. These were 0.0359 L @ STP/gVS (on day eleven) and 0.0366 L @
STP/gVS (on day 7) respectively for run number one and run number three; Figure 5-9.
0
5000
10000
15000
20000
25000
0 5 10 15 20 25
sCOD [mg/L]
Elapsed Time [Days]
Run Number One
Run Number Three

208
Secondly, methane production rate peaked on day fourteen for run number one and on
day ten for run number three; Figure 5-8. It is interesting to note that these dates were
respectively three days after sCOD peaked. It may appear like maximum methane
production rate is preceded by three days of sCOD peak. These might be relevant data
for optimal design of mesophilic anaerobic digesters/reactors for cassava peel waste
and similar biomass.
5.4.5 Total Solids (Dry Matter) and Volatile Solids Reduction
The total dry matter and volatile solids reduction and their computational scheme
are presented in Table 5-4. After four runs, the 254.8 g of dry matter loaded had only
76.08 g remaining; thus 70.14 % (178.72 g) was digested. Similarly, out of 245.55 g of
volatile solids loaded, 71.06 g remained; translating to 71.06 % volatile solids reduction
or the digestion of 174.49 g of volatile solids, Table 5-4. The percent volatile solids
reduction corresponded with the Biogasification efficiency of the cassava peel waste
presented earlier in Table 5-3.
Table 5-4. Dry Matter and Volatile Solids Reduction during Anaerobic Digestion of Cassava Peel Waste.
S/N Variable Parameter Parameter ID and
Computing Formula
Parameter Value
1 Dry matter added during the four runs A 254.8 g
2 Dry matter remaining at the end of four runs B 76.08 g
3 Total dry matter (solids) reduction C = [(A-B)/A]*100 70.14 %
4 Volatile solids added during the four runs D 245.55 g
5 Volatile solids remaining at the end of four runs
E 71.06 g
6 Volatile solids reduction F = [(D-E)/D]*100 71.06 %

209
5.4.6 Enzyme Activity
The activities of enzymes isolated as a consequence of anaerobic digestion of
cassava peel waste are presented in Table 5-5. When the experiment was performed
with cut up pieces of whole unpeeled cassava roots, higher activities were obtained.
The data are shown in Table 5-6. It appears like the production of amylolytic enzymes
Table 5-5. The Activities of Enzymes Produced by Anaerobic Digestion of Cassava Peel
Waste (Mean of duplicate measurements).
Time of Enzyme Extraction [Days]
Enzyme Activity [EU = (μ g/mL min)]
Cell Free Enzyme
Cell Associated
Enzyme
Biofilm Associated
Enzyme
1
29.58
–
–
2
29.58
2.50
–
3
29.18
2.64
–
46 (Last Day)
13.93
0.79
9.17
Table 5-6. The Activities of Enzymes Produced by Anaerobic Digestion of Pieces of Whole Unpeeled Cassava Roots (Mean of duplicate measurements).
Time of Enzyme Extraction [Days]
Enzyme Activity [EU = (μ g/mL min)]
Cell Free Enzyme
Cell Associated
Enzyme
Biofilm Associated
Enzyme
2
68.93
2.37
26.08
3
48.79
2.70
13.66
4
46.28
4.55
10.10
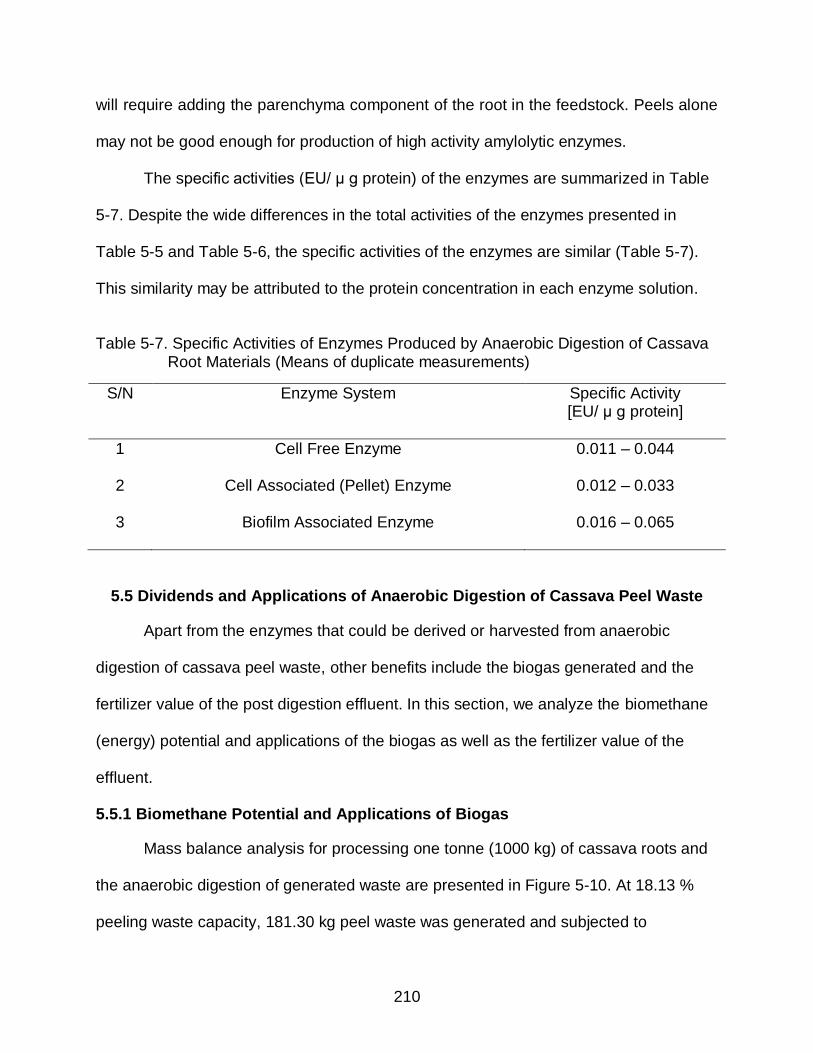
210
will require adding the parenchyma component of the root in the feedstock. Peels alone
may not be good enough for production of high activity amylolytic enzymes.
The specific activities (EU/ μ g protein) of the enzymes are summarized in Table
5-7. Despite the wide differences in the total activities of the enzymes presented in
Table 5-5 and Table 5-6, the specific activities of the enzymes are similar (Table 5-7).
This similarity may be attributed to the protein concentration in each enzyme solution.
Table 5-7. Specific Activities of Enzymes Produced by Anaerobic Digestion of Cassava Root Materials (Means of duplicate measurements)
S/N Enzyme System Specific Activity [EU/ μ g protein]
1 Cell Free Enzyme 0.011 – 0.044
2 Cell Associated (Pellet) Enzyme 0.012 – 0.033
3 Biofilm Associated Enzyme 0.016 – 0.065
5.5 Dividends and Applications of Anaerobic Digestion of Cassava Peel Waste
Apart from the enzymes that could be derived or harvested from anaerobic
digestion of cassava peel waste, other benefits include the biogas generated and the
fertilizer value of the post digestion effluent. In this section, we analyze the biomethane
(energy) potential and applications of the biogas as well as the fertilizer value of the
effluent.
5.5.1 Biomethane Potential and Applications of Biogas
Mass balance analysis for processing one tonne (1000 kg) of cassava roots and
the anaerobic digestion of generated waste are presented in Figure 5-10. At 18.13 %
peeling waste capacity, 181.30 kg peel waste was generated and subjected to

211
Figure 5-10. Mass Balance for Anaerobic Digestion of Peel Waste from one tonne (1000 kg) of fresh Cassava Root
anaerobic digestion. About 81.16 % (811.6 g) of the fresh root mass was realized as
root pulp or edible parenchyma, while the balance of 0.71 % (7.1 g) represented the lost
mass; Table 5-2. The parenchyma could be used to produce chips, flour, starch,
glucose, etc. However, anaerobic digestion of the peel waste generated 10.44 kg
(14621 L) of methane with estimated energy value of 581.25 MJ computed as follows.
One Tonne of Cassava Roots (1000 kg)
Peeling Operation
Parenchyma: Root Pulp (811.60 kg)
Anaerobic Digestion Operation
Biogas (42.26 kg) 31.82 kg CO2 (16199.29 L) 10.44 kg CH4 (14621 L)
Peel Waste (181.30 kg
Moisture (121.09 kg) Dry Matter (60.21 kg)
58.02 kg VS 2.18 kg Ash
Effluent (139.01 kg 121.09 kg Liquid
17.92 kg Dry Matter
15.74 kg VS 2.18 kg Ash
212
The high heating value (heat of combustion) and molecular weight of methane
are respectively 890.8 kJ/g mole and ≈ 16 g/g mole (Doran, 1995). Therefore the 10.44
kg of methane will yield: {[(890.8 kJ/g mole)/(16 g/g mole)] x [(10.44 kg CH4)(1000 g/kg
CH4)]} = 581247 kJ or 581.25 MJ of thermal energy. This energy could have at least two
possible applications.
a. Boil Water: The energy [Q (kJ)] required to boil a given mass of water [M (kg)] can be estimated with the equation: Q = MCp∆T + M∆hv ……………… (eq. 5-1) where Cp is specific heat of water (4.187 kJ/kg o C); ∆T is temperature difference (o C); and ∆hv is the latent heat of vaporization of water (2256.9 kJ/kg). From equation 5-1, to boil 1 kg of water initially at 25 o C, with ∆T = 100 – 25 or 75 o C requires: {(1 kg x 4.187 kJ/kg o C x 75 o C) + (1 kg x 2256.9 kJ/kg)} = 2570.925 kJ. Consequently, the water that could be boiled with 581247 kJ from the anaerobic digestion of the cassava peel waste is (581247 kJ/2570.925 kJ) x 1 kg = 226.08 kg.
b. Generate Electricity: Alternatively, the 581247 kJ (581.247 MJ) energy value of the biomethane can be transformed to electricity. At the conversion factor of 0.2778 kWHe/MJ, and conversion efficiency of 40 %, the electricity obtained would be {(581.247 MJ x 0.2778 kWHe/MJ) x (40/100)} = 64.588 kWHe. This electric energy could be used to light homes in a rural village and enable children to do home work and read/study at night.
The Figure 5-11 shows the mass balance for anaerobic digestion of one tonne
(1000 kg) of cassava peel waste. The composition of the fresh peel waste as shown in
Figure 5-11A consisted of moisture: 66.8 % (668 kg), volatile solids: 32 % (320 kg), and
ash: 1.2 % (12 kg). After the peel waste was subjected to anaerobic digestion, the
results were carbon dioxide, 55 % (176 kg), methane, 18 % (57.6 kg), and residual
organic matter, 27 % (86.4 kg); Figure 5-11B. This amount of methane could boil
1247.34 kg of water or generate 356.35 kWHe. To achieve this quantity of peel waste
would require processing approximately 5515.72 kg of fresh cassava roots.

213
Figure 5-11. Mass Balance for Anaerobic Digestion of 1 tonne (1000 kg) of Cassava
Peel Waste. A) Components distribution of the fresh Cassava Peel Waste before anaerobic digestion. B) Repartition of Volatile Solids after anaerobic digestion.
5.5.2 Fertilizer Value Potential of Effluent from Mesophilic Anaerobic Digestion of Cassava Peel Waste
The liquid effluent from anaerobic digestion of the cassava peel waste was
analyzed to determine its value as a source of organic fertilizer if applied on farm land.
Moisture (668 kg = 66.8%)
Volatile Solids (320 kg = 32.0%)
Ash (12 kg = 1.2%)
A
Carbon Dioxide (176.0 kg = 55%) Methane
(57.6 kg = 18%)
Residual Organic Matter (86.4 kg = 27%)
B

214
The analyses for Nitrogen (N), Phosphorus (P), and Potassium (K) and other
constituents were conducted according to the methodologies presented in Table 5-8.
Table 5-8. Methodologies used for the Analysis of Fertilizer Components of Post Anaerobic Digestion Liquor. (All the fertilizer component analyses were carried out by the University of Florida Institute of Food and Agricultural Sciences Analytical Services Laboratories)
S/N Fertilizer Components Analytical Methods and Instruments
1 Ammonia EPA 350.1 on a Continuous Flow Autoanalyzer. Alpkem Flow IV (O-I Analytical, College Station, TX 77842)
2 Nitrate + Nitrite EPA 353.2 on a Continuous Flow Autoanalyzer. Alpkem Flow IV (O-I Analytical, College Station, TX 77842)
3 Total Kjeldahl Nitrogen EPA 351.2 on a Continuous Flow Autoanalyzer. A2 Analyzer (Astoria Pacific International, Clackamas, OR 97015)
4 Metals EPA 200.7 on an Inductively Coupled Plasma Spectrophotometer (ICP). Spectro Arcos (Spectro Analytical Instruments, Mahwah, NJ 07430)
5 Ortho-Phosphorus EPA 365.1 on an AQ2 Discrete Analyzer (Seal Analytical, Mequon, WI 53092)
6 Total Phosphorus EPA 365.1 on a Continuous Flow Autoanalyzer. Alpkem Flow IV (O-I Analytical, College Station, TX 77842)
The results showed that each liter of effluent contained 572.7 mg, 30890 µg, and
1066 mg of (N), (P) and (K) respectively. It has been estimated that 600 kg of NPK (15:
15: 15) fertilizer per hectare is required to produce 25 tonnes of cassava roots
(http://cassavabiz.org/agroenterprise/farming.htm [Accessed 10/17/2013]). It is also
reported that the fertilizer nutrients are available to plants as elemental nitrogen for (N);

215
as P2O5 for (P); and as K2O for (K) (http://en.wikipedia.org/wiki/NPK_rating [Accessed
10/27/2013]). Based on these data, we compute that 24 kg of NPK (15: 15: 15) fertilizer
is required to produce one tonne of cassava roots; with the 15 % of (N) supplied or
available as elemental nitrogen; the 15 % of (P) available as P2O5; and the 15 % of (K)
available as K2O.
5.5.2.1 Nitrogen
The nitrogen requirement is estimated as:
Nitrogen = 15 % [24 kg (elemental N)/t cassava root]
= 3.6 kg (N)/t cassava root.
Nitrogen that can be obtained from digestion is estimated as:
From effluent analysis, (N) concentration = 572.7 mg/L.
Thus for the 3 L of digester volume, (N) = 3 L (572.7 mg/L) = 1718.1 mg.
Nitrogen fertilizer value of the effluent can now be estimated.
Note that 1718.1 mg is mass of (N) in the dry matter of 4 experimental runs.
Since the dry matter was 254.8 g, the mass of (N) per unit dry matter
= 1718.1 mg (N)/254.8 g dry Wt. x (1 g/1000 mg) = 0.00674 g (N)/g dry Wt.
However, for 1tonne of roots, only 60.21 kg dry matter was generated.
This dry matter was fed the digester, see mass balance schematics; Figure 5-10.
Consequently, potential (N) = 0.00674 g (N)/g dry Wt x (60.21 kg dry Wt.)
= 0.4058 kg (N)
But 3.6 kg (N) is required to produce one tonne of cassava roots.
Therefore proportion of (N) met by anaerobic digestion
= 0.4058 kg (N)/ 3.6 kg (N) x (100) = 11.27 %

216
5.5.2.2 Phosphorus
The phosphorus requirement is estimated as:
Phosphorus = 15 % [24 kg (P2O5)/t cassava root]
= {[3.6 kg (P2O5)/t cassava root] x [62 kg (elemental P)/142 kg (P2O5)]}
= 1.5718 kg (P)/t cassava root.
Phosphorus that can be obtained from digestion is estimated as:
From effluent analysis, (P) concentration = 30890 µg/L.
Thus for the 3 L of digester volume, (P) = 3 L (30890 µg/L)
= 92670 µg or 92.67 mg.
Phosphorus fertilizer value of the effluent can now be estimated.
The 92.67 mg is mass of (P) in the dry matter of 4 experimental runs.
Since the dry matter was 254.8 g, the mass of (P) per unit dry matter
= 92.67 mg (P)/254.8 g dry Wt. x (1 g/1000 mg) = 0.000363 g (P)/g dry Wt.
However, for 1tonne of roots, only 60.21 kg dry matter was generated.
This dry matter was fed the digester, see mass balance schematics; Figure 5-10.
Consequently, potential (P) = 0.000363 g (P)/g dry Wt x (60.21 kg dry Wt.)
= 0.021898 kg (P)
But 1.5718 kg (P) is required to produce one tonne of cassava roots.
Therefore proportion of (P) met by anaerobic digestion
= 0.021898 kg (P)/ 1.5718 kg (P) x (100) ≈ 1.40 %
5.5.2.3 Potassium
The potassium requirement is estimated as:
Potassium = 15 % [24 kg (K2O)/t cassava root]
= {[3.6 kg (K2O)/t cassava root] x [78 kg (elemental K)/94 kg (K2O)]}

217
= 2.9872 kg (K)/t cassava root.
Potassium that can be obtained from digestion is estimated as:
From effluent analysis, (K) concentration = 1066 mg/L.
Thus for the 3 L of digester volume, (K) = 3 L (1066 mg/L)
= 3198 mg.
Potassium fertilizer value of the effluent can be estimated thus:
We now have 3198 mg of (K) in the dry matter of 4 experimental runs.
Since the dry matter was 254.8 g, the mass of (K) per unit dry matter
= 3198 mg (K)/254.8 g dry Wt. x (1 g/1000 mg) = 0.01255 g (K)/g dry Wt.
However, for 1tonne of roots, only 60.21 kg dry matter was generated.
This dry matter was fed the digester, see mass balance schematics; Figure 5-10.
Consequently, potential (K) = 0.01255 g (K)/g dry Wt x (60.21 kg dry Wt.)
= 0.755696 kg (K)
But 2.9872 kg (K) is required to produce one tonne of cassava roots.
Therefore proportion of (K) met by anaerobic digestion
= 0.755696 kg (K)/ 2.9872 kg (K) x (100) ≈ 25.30 %
The organic fertilizer generation capability of anaerobic digestion of cassava peel waste
is summarized in Table 5-9. Obviously, anaerobic digestion can comfortably satisfy at
least one quarter of the potassium requirement.

218
Table 5-9. Organic Fertilizer Potential of Anaerobic Digestion of Cassava Peel Waste
S/N Organic Fertilizer Element
Quantity Required
[kg/tonne of Cassava Root
Produced]
Quantity Generated by Anaerobic Digestion of Cassava Peel Waste [kg/tonne of Cassava
Root Processed]
Proportion of Fertilizer
Requirement Met [%]
1 Nitrogen (N) 3.60 0.406 11.30
2 Phosphorus (P) 1.57 0.022 1.40
3 Potassium (P) 2.99 0.756 25.30

219
CHAPTER 6 CONCLUSIONS AND RECOMMENDATIONS
6.1 Conclusions
The researches conducted for this doctoral dissertation demonstrated several
value added potentials for the cassava crop. Namely dehydration of cassava root
parenchyma to produce chips using solar-convection dryer; production of cassava flour
from the solar-convection dried cassava chips; glucose sweetener production by
simultaneous and synergistic enzymatic hydrolysis of native unprocessed cassava
starch; as well as anaerobic digestion of cassava waste to produce biomethane and
amylolytic enzymes. Based on these demonstrations, the following conclusions can be
drawn.
1 Fresh cassava roots can be processed into flour from solar-convection dried
cassava chips. The drying process does not require any payment for fuel or
electricity.
2 The characterized physical properties of the chips and flour such as sorption
isotherm, drying curve, moisture content, particle size distribution, bulk
density, solid particle density, porosity, permeability and specific surface area
are beneficial to the execution of engineering design of storage, handling, and
processing systems.
3 Simultaneous and synergistic enzymatic hydrolysis of cassava starch is
possible. In this technique, liquefaction and saccharification processes are
executed as a single unit operation.
4 The simultaneous and synergistic application of fungal gluco-amylase (FGA)
and bacterial alpha-amylase (BAA) at ratio of 3:1 (FGA:BAA), yielded 96 %,

220
27 %, and 53 % conversion of starch to glucose at 60 o C after 24 hours of
hydrolysis respectively for commercial cassava starch, flour produced from
solar-convection dried cassava chips , and fresh cassava root pulp.
5 At 37 o C operating temperature and 96 hours incubation time, the synergistic
hydrolysis protocol achieved 100 %, 72 %, and 55 % conversion of starch to
glucose respectively for commercial cassava starch, flour produced from
solar-convection dried cassava chips, and fresh cassava root pulp.
6 Glucose sweetener can be obtained by direct conversion of cassava starch
substrate. With this technique cassava root pulp or flour can be hydrolyzed
directly to glucose without going through the expensive, time and energy
intensive starch extraction process.
7 The simultaneous/synergistic and direct conversion approaches minimize
energy, equipment and technical inputs, as well as the overall cost hitherto
required for the production of sweeteners by first extracting the starch from
cassava root.
8 First-order kinetic parameters (rate constant along with the Arrhenius
activation energy) were determined for the enzyme hydrolysis of each
substrate at the two different temperatures.
9 Cassava root processing wastes such as peels can be converted to bio-
methane via anaerobic digestion. The methane is a clean and renewable
energy that could reduce dependence on fossil fuels and thus mitigate
associated adverse environmental impacts.

221
10 The biomethane may be used to heat/boil water or generate electricity. The
electrical power can help pupils in villages do their homework and study at
night.
11 Processing one tonne (1000 kg) of fresh cassava root creates 181.30 kg of
peel waste. The waste can be digested in anaerobic reactor to generate
10.44 kg (14621 L) of methane with energy value of 581.25 MJ. This thermal
energy can boil 226.08 kg of water which was initially at 25 o C. Alternatively;
the thermal energy could be used to generate 64.58 kWHe for illumination or
motive power applications.
12 The post digestion effluent can be used as source of organic fertilizer to
supplement the nitrogen (at 11 %) and potassium (at 25 %) requirements for
cassava cultivation.
13 The anaerobic digestion of cassava waste demonstrated viability of digester
reactor operation with the following performance indices. Organic load of 20
gVS/m3 (gram volatile solids/cubic meter); residence time of 27 days; bio-
methane yield of 0.25 L/gVS (liter/ gram volatile solids); and bio-methane
production efficiency of 71 %.
14 It is possible to obtain amylolytic (starch hydrolyzing) enzymes from
mesophilic anaerobic digestion of cassava waste.
15 Extracellular enzymes were located in the three divisions defined as cell free
(leachate) enzyme; cell associated (pellet) enzyme; and biofilm associated
enzyme.

222
16 Beta amylase and Glucoamylase activities were identified in the cell free, cell
associated and biofilm associated portions of the digester substrate.
17 Anaerobic digestion of pieces of whole unpeeled cassava root resulted in
much higher activities than those obtained with the peel waste alone.
18 The highest activity was found in the cell free portion, followed by the biofilm
associated portion. The cell associated portion had minimal activity.
19 The activity of the cell free enzyme was 1.5 to 3.0 times higher than that of
the biofilm associated enzyme at 13.93 EU to 68.93 EU and 9.17 EU to 26.08
EU respectively for the cell free and biofilm associated enzymes.
20 The specific activities (EU/μ g protein) for all the enzyme systems; cell free,
cell associated and biofilm associated were found to be similar.
21 The processes demonstrated can be accommodated by developing nations to
foster appropriate technologies for cottage industries, encourage the use of
indigenous raw materials, enable local capacity building, as well as promote
economic empowerment.
6.2 Recommendations for Future Work
This is an exciting endeavor in that we are engaged in a new research frontier of
simultaneous and synergistic hydrolysis reactions, as well as mesophilic anaerobic
digestion of agricultural and biological materials. The results of our research can be
applied by people with low income or financial resources and little or no technical skills
anywhere in the world for the production of flour, sweeteners, biomethane and enzymes
that could be used by the households and industries. However, in order to maximize the
value adding potentials of these endeavors, optimization of the research demonstrations
are urged. Areas to be considered for further/future work include:

223
Development and implementation of purification system for the digester derived enzymes.
Evaluation of activity and stability of the digester derived enzymes at different temperatures.
Evaluation of the capability of the digester derived enzymes to hydrolyze native un-extracted starch in cassava flour and root pulp.
To understand and characterize the relationship, if any, between biomethane production, enzyme production and enzyme activity.
Development of an economic model with comprehensive plant design and cost benefit analysis for a closed-loop system that simultaneously produces biomethane and amylolytic enzymes. The enzymes would be used for hydrolysis of cassava starch for the production of sweeteners while the methane would be used to heat both the anaerobic digester and the hydrolysis reactors.

224
APPENDIX A PHOTOGRAPHS OF SOME MATERIALS AND EQUIPMENT USED AND THE
PRODUCTS CREATED*
A-1. Solar-Convection Dryer
* All the photos courtesy of the author unless otherwise indicated.

225
A-2. Cassava Chips that were Dried by Solar-Convection Dryer
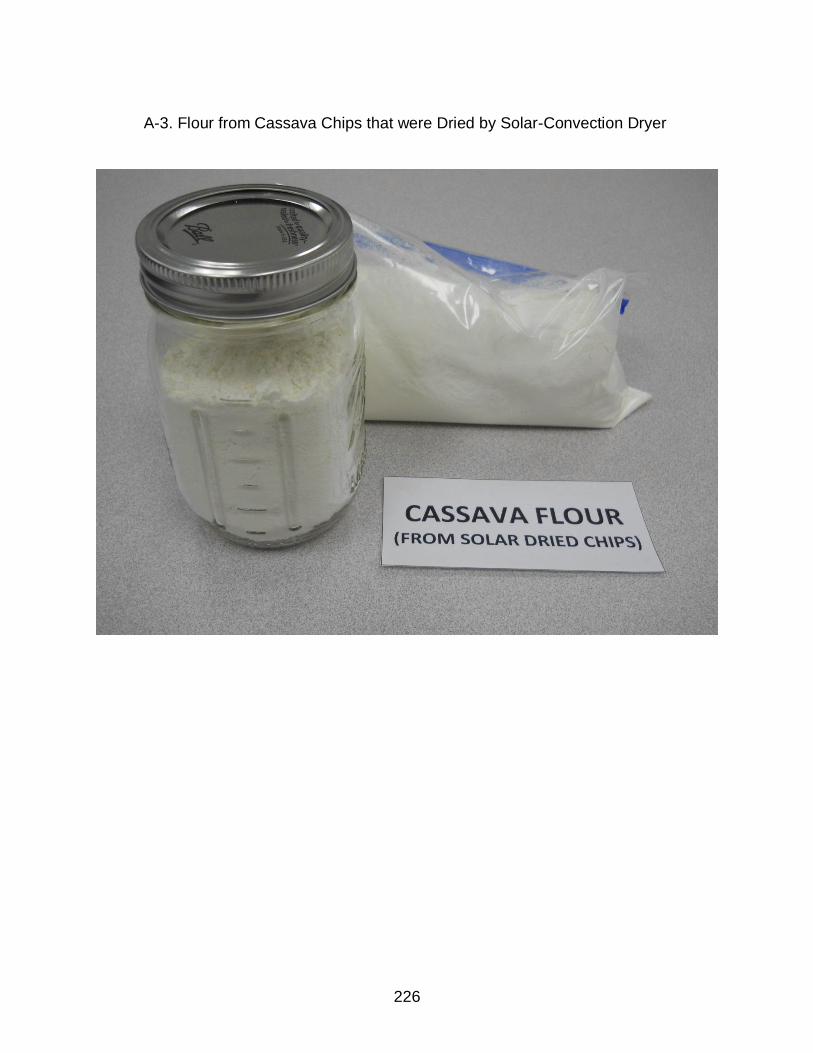
226
A-3. Flour from Cassava Chips that were Dried by Solar-Convection Dryer

227
A-4. Electric-Convection Oven

228
A-5. Cassava Chips Dried by Electric-Convection Oven
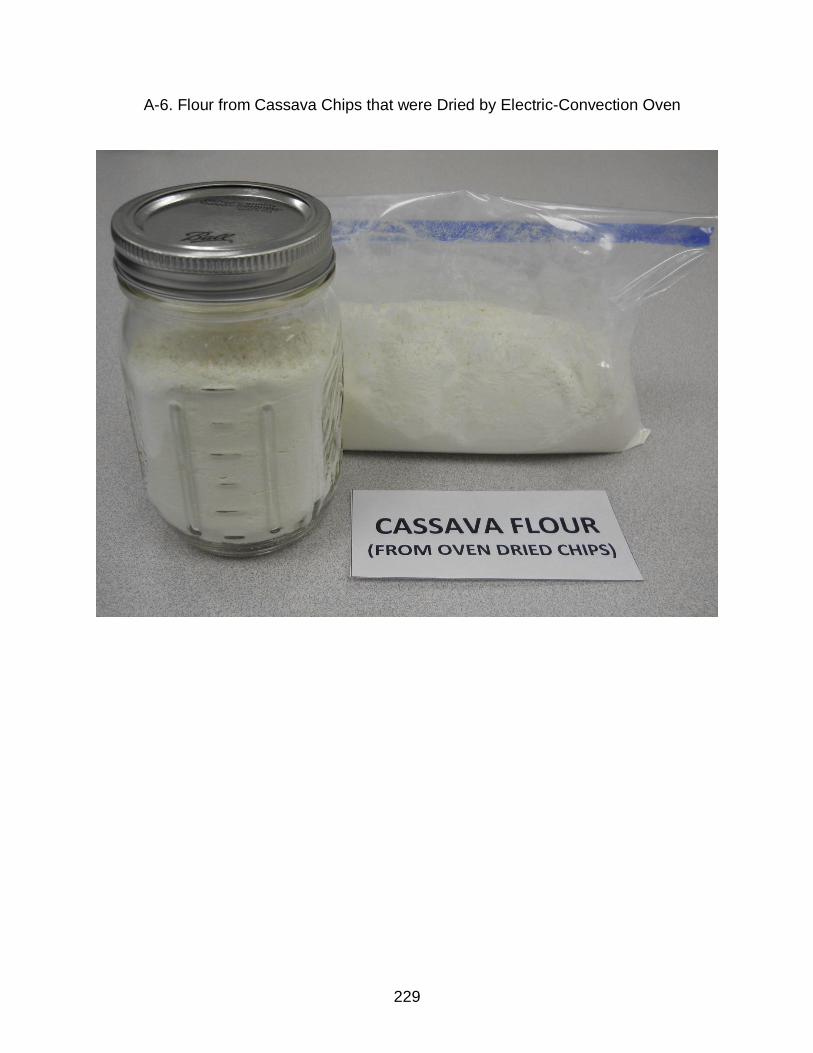
229
A-6. Flour from Cassava Chips that were Dried by Electric-Convection Oven

230
A-7. Freeze Dryer

231
A-8. Freeze Dried Cassava Chips

232
A-9. Cassava Flour Produced from Freeze Dried Cassava Chips

233
A-10. Cassava Chips that were Dried by Different Drying Methods

234
A-11. Flour from Cassava Chips that were Dried by Different Drying Methods

235
A-12. Microphotograph of Cassava Flour

236
A-13. Glucose Syrup [27.7 o Brix] Produced by Synergistic Enzymatic Hydrolysis
of Cassava Substrates (Commercial Starch, Flour, and Fresh Roots]
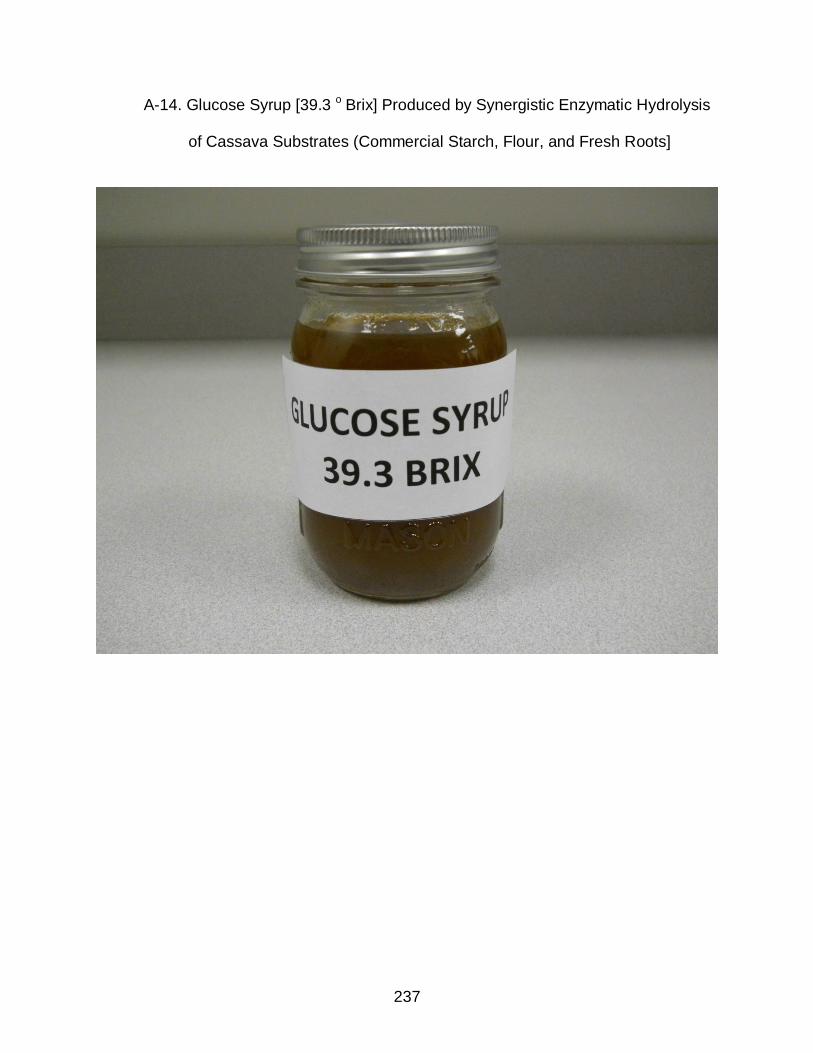
237
A-14. Glucose Syrup [39.3 o Brix] Produced by Synergistic Enzymatic Hydrolysis
of Cassava Substrates (Commercial Starch, Flour, and Fresh Roots]

238
A-15. Glucose Syrup [42 o Brix] Produced by Synergistic Enzymatic Hydrolysis of
Cassava Substrates (Commercial Starch, Flour, and Fresh Roots]

239
A-16. Glucose Syrup [53 o Brix] Produced by Synergistic Enzymatic Hydrolysis of
Cassava Substrates (Commercial Starch, Flour, and Fresh Roots]

240
A-17. Glucose Syrup of Various Soluble Solids [o Brix] Produced by Synergistic Enzymatic Hydrolysis of Cassava Substrates (Commercial Starch, Flour, and Fresh Roots]
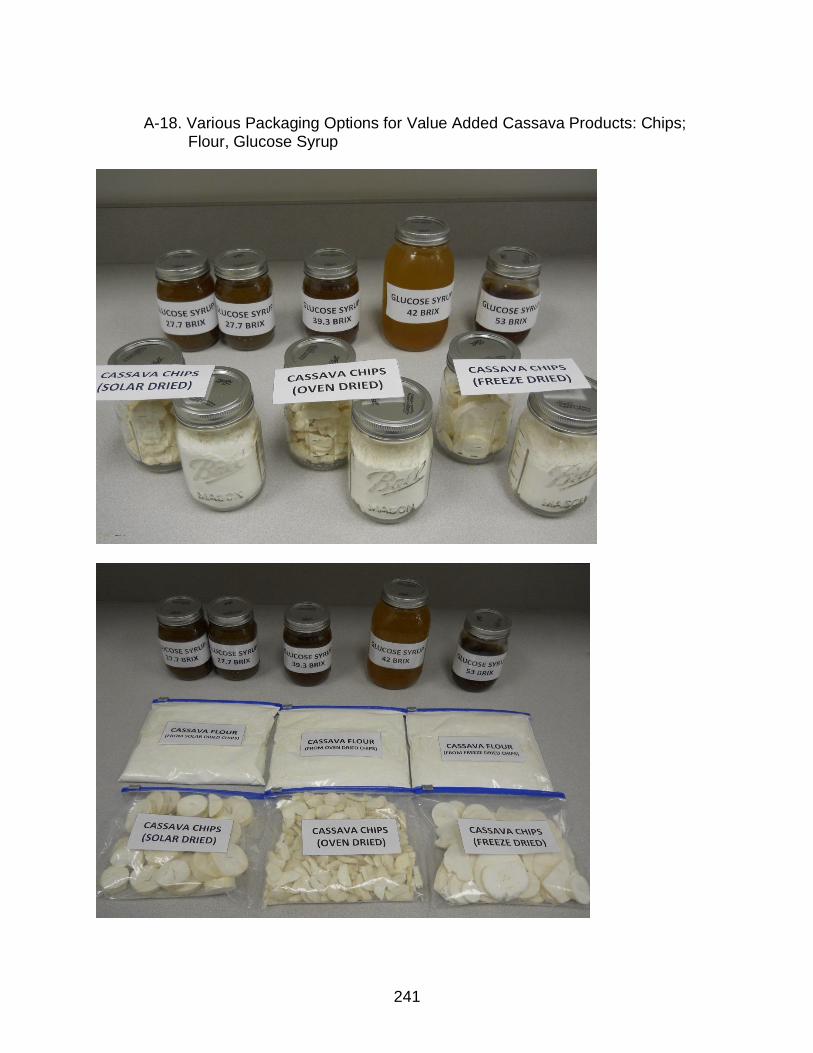
241
A-18. Various Packaging Options for Value Added Cassava Products: Chips; Flour, Glucose Syrup
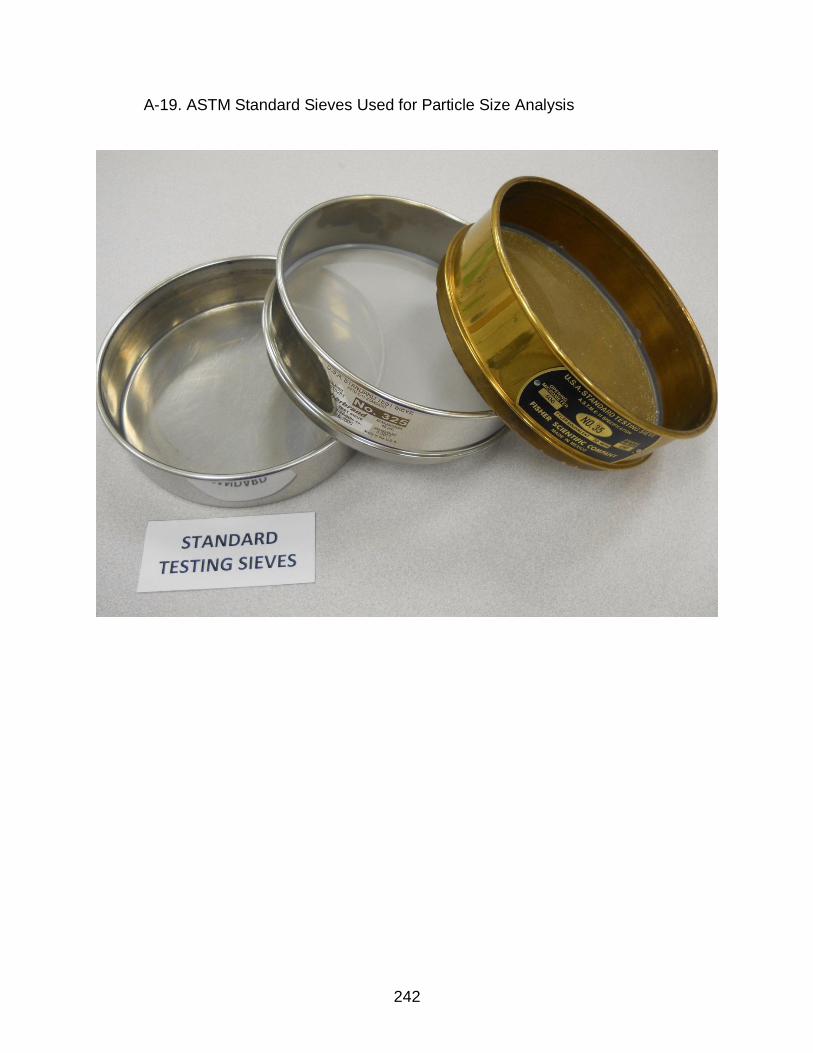
242
A-19. ASTM Standard Sieves Used for Particle Size Analysis

243
A-20. Incubators for Anaerobic Digestion Reactors

244
A-21. Mesophilic Anaerobic Digester Incubating at 26 ± 3 o C

245
A-22. Cylinders for Carrier Gases used with GC Equipment (background) for Biogas Analysis

246
A-23. Electric Range and Pots Used to Concentrate Glucose Syrups

247
A-24. Mason Jars Used for Packaging and Canning Cassava Products

248
A-25. Walk-in Freezer Used to Freeze Samples at – 20 o C

249
A-26. Vortex Machines Used to Homogenize Research Samples for Analysis

250
A-27. Rack, Test Tubes and Stir-Plate/Heater Used to Hold and Prepare Samples for Analysis

251
A-28. Desiccator Jars and Cassava Samples Used for Sorption Isotherm Experiments

252
A-29. Weights Used as Ballast to Stabilize Research Samples under Centrifugal Force Field
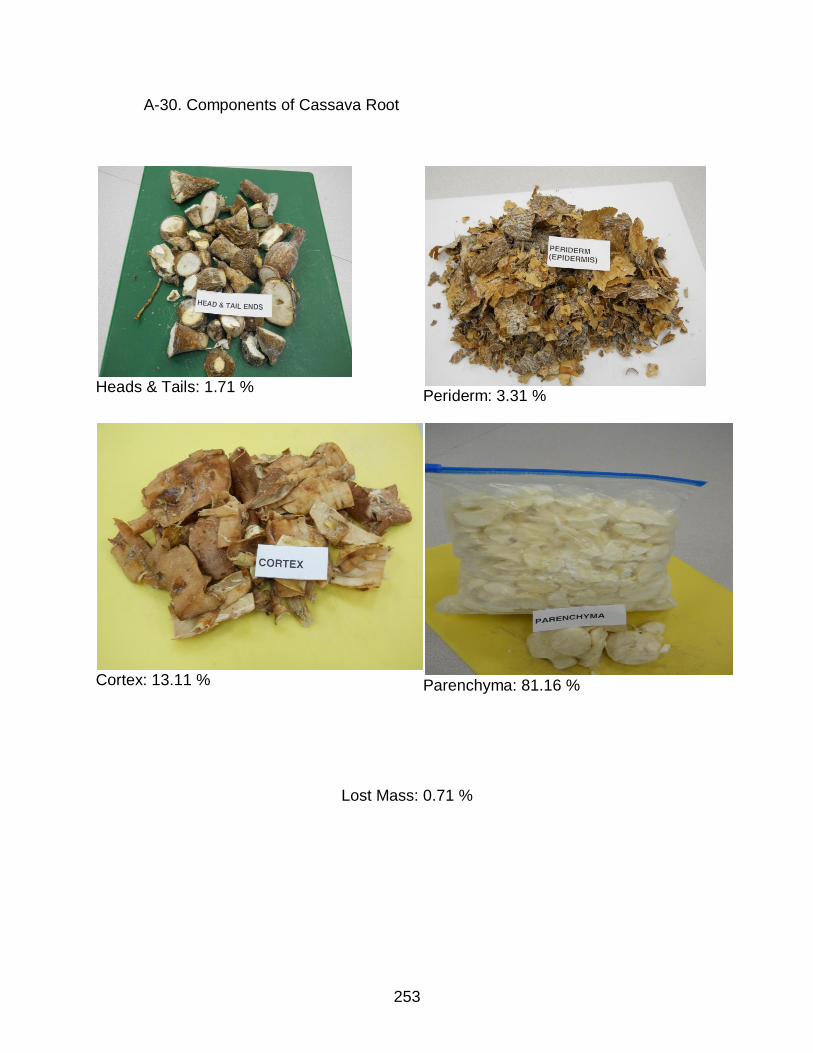
253
A-30. Components of Cassava Root
Lost Mass: 0.71 %
Heads & Tails: 1.71 %
Periderm: 3.31 %
Cortex: 13.11 %
Parenchyma: 81.16 %

254
A-31. Heads & Tails of Cassava Root

255
A-32. Periderm/Epidermis (Bark or Outer Coat) of Cassava Root

256
A-33. Cortex of Cassava Root

257
A-34. Parenchyma (Pulp) of Cassava Root; Frozen Slices

258
A-35. Cassava Root Peeling Waste (Heads & Tails, Periderm and Cortex) used as Feedstock/Substrate in Anaerobic Digestion Experiments for Biomethane and Enzyme Production

259
A-36. Cell Free Enzyme Derived from Anaerobic Digestion of Cassava Waste

260
A-37. Cell Associated (Pellet) Enzyme Derived from Anaerobic Digestion of
Cassava Waste

261
A-38. Biofilm Associated Enzyme Derived from Anaerobic Digestion of Cassava Waste

262
A-39. PhD Candidate & Graduate Committee Members [Front row from Right to
Left: Dr Wade Yang, Member; Dr Arthur A Teixeira, Chairman; Sammy Aso, PhD Candidate. Back row from left to right: Dr Bruce A Welt, Member; Dr Robert P Bates, Member; Dr Spyros A Svoronos, Member, and Dr Pratap C Pullammanappallil, Member

263
A-40. Graduate Committee Members

264
A-41. Hydrolysate Samples’ Analysis
265
APPENDIX B
RECOMMENDED REFERENCES FOR FUTHER READING
B-1. Catalytic Efficiency
http://chemwiki.ucdavis.edu/Physical_Chemistry/Kinetics/Complex_Reactions/Catalytic_efficiency_of_enzymes [Accessed Friday 27th April 2012]
B-2. Enzyme Kinetics
http://graphpad.com/curvefit/introduction63.htm [Accessed Friday 27th April 2012]
http://users.rcn.com/jkimball.ma.ultranet/BiologyPages/E/EnzymeKinetics.html [Accessed Friday 27th April 2012]
http://class.fst.ohio-state.edu/fst605/605p/Enzymekinetics.pdf [Accessed Friday 27th April 2012] recommended
B-3. Ultrahigh Pressure and Cassava
Alves, HM, Tar , G, A.T Fonseca, AT, and Ferreira, JMF.(1998). Processing of porous cordierite bodies by starch consolidation. Materials research bulletin, 33 (10): 1439–1448
Cereda, MP and Mattos, MCY. (1996). Linamarin - The Toxic Compound of Cassava. Journal of Venomous Animals and Toxins, 2 (1): version ISSN 0104-7930
Che, L, Li, D, Wang, L Özkan, N, Chen, XD and Mao, Z. (2007). Effect of High-Pressure Homogenization on the Structure of Cassava Starch. International Journal of Food Properties, 10 (4): 911 – 922.
Kasemwong K, Ruktanonchai, UR, Srinuanchai, W, Itthisoponkul, T and Sriroth, K. (2011). Effect of high-pressure microfluidization on the structure of cassava starch granule. Starch – Stärke, 63 (3): 160–170, March 2011
B-4. Pulsed UV Light and Cassava
Bertolini AC, Mestres C, Colonna P. (2000). Rheological properties of acidified and UV-irradiated starches. Starch/Stärke 52:340–4.
Bertolini AC, Mestres C, Colonna P, Raffi J. (2001A). Free radical formation in UV- and gamma-irradiated cassava starch. Carbohydrate Polymers, 44:269–71.

266
Bertolini AC, Mestres C, Raffi J, Buléon A, Lerner D, Colonna P. (2001B). Photodegradation of cassava and corn starches. Journal of Agricultural and Food Chemistry, 49:675–82.
Bhat, R and Karim, AA. (2009). Impact of Radiation Processing on Starch. Comprehensive Reviews in Food Science and Food Safety, 8 (2): 44–58. Also available at: http://onlinelibrary.wiley.com/doi/10.1111/j.1541-4337.2008.00066.x/full#b30
Franco, CML, Ogawa, C, Rabachini, T, Rocha, TS, Cereda, MP and Jane, J. (2010). Effect of lactic acid and UV irradiation on the cassava and corn starches. Brazilian Archives of Biology and Technology, 53 (2): HTML Version
Zucca C. (1953). Mucinolytic action of ultraviolet rays on some polysaccharides. 1st. Botan. University Lab. crittoge . Pavia , Atti , Vol. 10, 85 p.
B-5. Gamma Irradiation [Flours and Starches]
Greenwood CT, Mackenzie C. (1963). The irradiation of the starch Part I: the properties of potato starch and its components after irradiation with high-energy electron. Die Starke 15:359–63.
Kume T, Tamura N. (1987). Change in digestibility of raw starch by gamma irradiation. Starch 39:71–4
Adeil Pietranera MS, Narvaiz P. (2001). Examination of some protective conditions on technological properties of irradiated food grade polysaccharides. Radiation Physics and Chemistry, 60:195–201.
Rombo GO, Taylor JRN, Minnaar A. (2001). Effect of irradiation, with and without cooking of maize and kidney bean flours, on porridge viscosity and in vitro starch digestibility. Journal of the Science of Food and Agriculture, 81:497–502.
B-6. Ultrasounds in Cassava
Boonapatcharoen, N, Meepian, K, Chaiprasert, P and Techkarnjanaruk, S. (2007). Molecular Monitoring of Microbial Population Dynamics During Operational Periods of Anaerobic Hybrid Reactor Treating Cassava Starch Wastewater. Microbial Ecology, 54 (1): 21-30
Gao, W, Lin, X, Lin, X, Ding, J, Huang, X and Wu, H. (2011). Preparation of nano-sized flake carboxymethyl cassava starch under ultrasonic irradiation. Carbohydrate Polymers, 84 (4): 1413–1418.
Hao, X, Gu, C, Liu, J, Song, W and Chen, S. (2007). Study on Properties and Preparation Conditions of Cassava Amylodextrins with Acid-alcohol Media. Food Science, December 2007.

267
Nitayavardhana, S, Rakshit, SK, Grewell, D, Leeuwen, JH and Khanal, SK. (2008). Ultrasound pretreatment of cassava chip slurry to enhance sugar release for subsequent ethanol production. Biotechnology and Bioengineering, 101 (3): 487–496.
Nitayavardhana, S, Shrestha, P, Rasmussen, ML, Lamsal, BP, Leeuwen, JH and Khanal, SK. (2010). Ultrasound improved ethanol fermentation from cassava chips in cassava-based ethanol plants. Bioresource Technology, 101 (8): 2741–2747
Xiaoming, C, Kaimian, L, Jianxiang, T, Jianqiu, Y, Xiaojing, L and Feijie, L. (2012). Response Surface Methodology on Ultrasonic Extraction Technology of Total Coumarin from Cassava Peel. Transactions of the Chinese Society for Agricultural Machinery, 1, 027 (January 2012). OR? {Jianxiang, C. X. L. K. T., & Feijie, Y. J. L. X. L. (2012). Response Surface Methodology on Ultrasonic Extraction Technology of Total Coumarin from Cassava Peel. Transactions of the Chinese Society for Agricultural Machinery, 1, 027.}
B-7. Statistics References
Box, GEP. (1999). Statistics as a Catalyst to Learning by Scientific Method Part II—A Discussion. Journal of Quality Technology. Vol. 31, No.1 Pp 16 – 29.
Box, GEP and Liu, PYT. (1999). Statistics as a Catalyst to Learning by Scientific Method Part I--An Example. Journal of Quality Technology. Vol. 31, No.1 Pp 1 – 15.
Box, GEP and Wilson, KB. (1951). On the Experimental Attainment of Optimum Conditions. Journal of the Royal Statistical Society Series B (Methodological), Vol. 13, No. 1. Pp 1 – 45.
Hill, WJ and Hunter, WG. (1966). A Review of Response Surface Methodology: A Literature Survey. Technometrics, Vol. 8 No. 4, Pp. 571 – 590.
Li, W, Du, W and Liu, DH. (2007). Optimization of whole cell-catalyzed methanolysis of soybean oil for biodiesel production using response surface methodology. Journal of Molecular Catalysis B: Enzymatic, Vol. 45 Nos. 3 – 4, Pp. 122 – 127.
Mead, R and Pike, DJ. 1975. A biometrics invited paper. A review of response surface methodology from a biometric viewpoint. Biometrics, Vol. 31 No. 4, Pp. 803 – 851.
Montgomery, DC. (2009). Design and Analysis of Experiments, 7th Edition. John Wiley and Sons, Inc.
268
Myers, RH, Khuri, AI and Carter, WH. (1989). Response surface methodology: 1966 – 1988. Technometrics, Vol. 31 No. 2 Pp. 137 – 157.
Myers, RH, Montgomery, DC, Vining, GG, Borror, CM and Kowalski, SM. (2004). Response surface methodology: A retrospective and literature survey. Journal of Quality Technology. Vol. 36 No. 1. Pp 53 – 77.
Naveena, BJ, Altaf, Md, Bhadrayya, K, Madhavendra, SS and Reddy, G. (2005). Direct fermentation of starch to 1(+) lactic acid in SSF by Lactobacillus amylophilus GV6 using wheat bran as support and substrate: medium optimization using RSM. Process Biochemistry, Vol. 40 No. 2, Pp. 681 – 690.
Noordin, MY, Venkatesh, VC, Sharif, S, Elting, S and Abdullah, A. (2004). Application of response surface methodology in describing the performance of coated carbide tools when turning AISI 1045 steel. Journal of Materials Processing Technology, Vol. 145 No.1, Pp. 46 – 58.
B-8. Fermentation/Hydrolysis Papers
Adney, WS, Rivard, CJ, Shiang, M and Himmel, ME. (1991). Anaerobic Digestion of Lignocellulosic Biomass and Wastes. Cellulases and Related Enzymes. Applied Biochemistry and Biotechnology, Vol. 30, No. 2, Pp. 165 – 183.
Balan, V, Bals, B, Chundawat, SPS, Marshall, D and Dale, BE. (2009). Lignocellulosic Biomass Pretreatment Using AFEX. In Biofuels, Methods and Protocols. Vol. 581, Pp 61 – 77. Jonathan R. Mielenz (Ed.).
Eveleigh, DE, Mandels, M, Andreotti, R and Roche, C. (2009). Measurement of saccharifying cellulose. Biotechnology for Biofuels, 2:21 doi: 10.1186/1754-6834-2-21. Also available online at: http://www.biotechnologyforbiofuels.com/content/2/1/21
Ghose, TK. (1987). Measurement of Cellulase Activities. Pure & Applied Chemistry, 59 (2), 257 – 268.
Gomec CY, Kim, M, Ahn, Y and Speece, RE. (2002). The role of pH in mesophilic anaerobic sludge solubilization. Journal of Environmental Science and Health, Part A: Toxic/Hazardous Substances and Environmental Engineering, Vol. 37 No. 10, Pp 1871 – 1878
Liaw, WC, Chen, CS, Chang, WS and Chen, KP. (2008). Xylitol production from rice straw hemicellulose hydrolyzate by polyacrylic hydrogel thin films with immobilized candida subtropicalis WF79. Journal of Bioscience and Bioengineering, Vol. 105 No. 2, Pp. 97 – 105.
Olsson, L and Hahn-Hägerdal, B. (1996). Fermentation of lignocellulosic hydrolysates for ethanol production. Enzyme Microbial Technology, 18 (5), 312 – 331.

269
Taherzadeh, MJ and Karimi, K. (2008). Pretreatment of Lignocellulosic Wastes to Improve Ethanol and Biogas Production: A Review. International Journal of Molecular Sciences, Vol. 9 No. 9, Pp. 1621 – 1651; doi:10.3390/ijms9091621.
Wang, YM and van Eys, J. (1981). Nutritional Significance of Fructose and Sugar Alcohols. Journal of Annual Review of Nutrition, Vol. 1, Pp. 437 – 475.
B-9. Cassava Toxicity and Cyanide Determinations
Cooke, RD, Howland, AK and Hahn, SK. (1978). Screening cassava for low cyanide using an enzymatic assay. Experimental Agriculture, 14 (4), 367 – 372.
Joachim, A. W. R., & Pandittesekere, D. G. (1944). Investigations on the hydrocyanic acid content of manioc. Tropical Agriculturist, 100, 150-163.
Maduagwu, E. N. (1983). Differential effects on the cyanogenic glycoside content of fermenting cassava root pulp by β-glucosidase and microbial activities. Toxicology Letters, 15(4), 335-339.
Okafor, N., & Ejiofor, M. A. N. (1986). The microbial breakdown of linamarin in fermenting pulp of cassava (Manihot esculenta Crantz). MIRCEN Journal of Applied Microbiology and Biotechnology, 2(2), 327-338.
Vasconcelos, A. T., Twiddy, D. R., Westby, A., & Reilly, P. J. A. (1990). Detoxification of cassava during gari preparation. International Journal of Food Science & Technology, 25(2), 198-203.
Westby, A. (1991). Strategies for research into the mechanisms of cyanide reduction during the fermentation of cassava. Food Laboratory News, 7(2), 24-28.
B-10. Others
Che, LM, Li, D, Wang, LJ, Chen, XD and Mao, ZH. (2007). Micronization and Hydrophobic Modification of Cassava Starch. International Journal of Food Properties, 10 (3): 527-536.
Das, S, Das, AK, Murphy, RA, Punwani, IC, Nasution, MP and Kinghorn, AD. (2009). Evaluation of the cariogenic potential of the intense natural sweeteners stevioside and rebaudioside A. Caries research, 26 (5): 363 – 366.
Ekpechi, O. L., Dimitriadou, A., & Fraser, R. (1966). Goitrogenic activity of cassava (a staple Nigerian food). Nature, 210 (5041): 1137 – 1138.
Hillocks, RJ, Thresh, JM and Bellotti, A. (2002). Cassava: Biology, production and utilization. Cabi Publishing.

270
Hladik, C. M., Hladik, A., Linares, O. F., Pagezy, H., Semple, A., & Hadley, M. (1993). Tropical forests, people and food: biocultural interactions and applications to development. Parthenon Publishing Group.
Huang Z-Q, Lu J-P, Li X-H, Tong Z-F. (2007 B). Effect of mechanical activation on physico-chemical properties and structure of cassava starch. Carbohydrate Polymers, 68:128–35.
Iglesias, C. A., & Hershey, C. H. (1991, October). Cassava breeding at CIAT: heritability estimates and genetic progress in the 1980s. In Symposium on Tropical Root Crops in a Developing Economy 380 (pp. 149-163).
Ihemere U, Arias-Garzon D, Lawrence S, Sayre R. (2006). Genetic modification of cassava for enhanced starch production. Plant Biotechnology Journal, 4:453–65.
Leach, H. W., McCowen, L. D., & Schoch, T. J. (1959). Structure of the starch granule. I. Swelling and solubility patterns of various starches. Cereal Chemistry, 36(6), 534-544.
McKEY, D., & Beckerman, S. (1993). Chemical ecology, plant evolution and traditional manioc cultivation systems. Man and the Biosphere Series, 13, 83-83.
Menoli AV, Beleia A. (2007). Starch and pectin solubilization and texture modification during pre-cooking and cooking of cassava root (Manihot esculenta Crantz). LWT - Food Science and Technology, 40:744–7.
Muir, J. G., & O'dea, K. (1992). Measurement of resistant starch: factors affecting the amount of starch escaping digestion in vitro. The American Journal of Clinical Nutrition, 56(1), 123-127.
O'dea, K., Snow, P., & Nestel, P. (1981). Rate of starch hydrolysis in vitro as a predictor of metabolic responses to complex carbohydrate in vivo. The American Journal of Clinical Nutrition, 34(10), 1991-1993.
Panke, S and Wubbolts, MG. (2002). Enzyme technology and bioprocess engineering. Current opinion in biotechnology, 13 (2): 111 – 116.
Pszczola, DE. (2001). From soybeans to spaghetti: the broadening use of enzymes. Food technology, 55(11), 54-69.
Rajan A, Abraham TE. (2006). Enzymatic modification of cassava starch by bacterial lipase. Bioprocess and Biosystems Engineering, 29:65–71.
Rajan A, Sudha JD, Abraham TE. (2008). Enzymatic modification of cassava starch by fungal lipase. Industrial Crops and Products, 27:50–9.

271
Ren, G. Li, D, , Wang, L, Özkan, N and Mao, Z. (2010). Morphological properties and thermoanalysis of micronized cassava starch, Carbohydrate Polymers, 79 (1): 101 – 105.
Sievert, D., & Pomeranz, Y. (1989). Enzyme-resistant starch. I. Characterization and evaluation by enzymatic, thermoanalytical, and microscopic methods. Cereal Chemistry, 66(4), 342-347.
Takasaki, M., Konoshima, T., Murata, Y., Sugiura, M., Nishino, H., Tokuda, H., & Yamasaki, K. (2003). Anticarcinogenic activity of natural sweeteners, cucurbitane glycosides, from Momordica grosvenori. Cancer letters, 198(1), 37-42.
Waduge, R. N., Hoover, R., Vasanthan, T., Gao, J., & Li, J. (2006). Effect of annealing on the structure and physicochemical properties of barley starches of varying amylose content. Food Research International, 39(1), 59-77.
Yamane, T. (1987). Enzyme technology for the lipids industry: an engineering overview. Journal of the American Oil Chemists’ Society, 64(12), 1657-1662.

272
LIST OF REFERENCES
Abera, S and Rakshit, SK. (2003). Comparison of Physicochemical and Functional Properties of Cassava Starch Extracted from Fresh Root and Dry Chips. Starch, 55 (7): 287 – 296.
Aberle, T., Burchard, W., Vorwerg, W., & Radosta, S. (1994). Conformational contributions of amylose and amylopectin to the structural properties of starches
from various sources. Starch‐Stärke, 46(9), 329-335.
Abe, S and Takagi, M. (1991). Simultaneous saccharification and fermentation of cellulose to lactic acid. Biotechnology and Bioengineering, 37 (1): 93 – 96.
Abraham, TE, Krishnaswamy, C and Ramakrishna, SV. (1987). Effect of Hydrolysis Conditions of Cassava on Oligosaccharide Profile and Alcohol Fermentation. Starch, 39 (7): 237 – 240.
Adeniran, A. H., & Abiose, S. H. (2009). Amylolytic potentiality of fungi isolated from some Nigerian agricultural wastes. African Journal of Biotechnology, 8 (4): 667 – 672.
Adeniran, H. A., Abiose, S. H., & Ogunsua, A. O. (2010). Production of fungal β-amylase and amyloglucosidase on some Nigerian agricultural residues. Food and Bioprocess Technology, 3(5), 693-698.
Adeniran, H. A., & Abiose, S. H. (2011). Partial purification, characterization and hydrolytic activities of amylases from Bacillus licheniformis and Aspergillus niger cultured on agricultural residues. African Journal of Biotechnology, 11(6), 1465-1477.
Aguilar, CN, Augur, C, Favela-Torres, E and Viniegra-González, G. (2001). Induction and repression patterns of fungal tannase in solid-state and submerged cultures. Process Biochemistry, 36 (6): 565 – 570.
Aguilar, CN, Gutiérrez-Sánchez, G, Prado-Barragán, L, Rodríguez-Herrera, R, Martínez-Hernandez, JL and Contreras-Esquivel, JC. (2008). Perspectives of solid state fermentation for production of food enzymes. American Journal of Biochemistry and Biotechnology, 4 (4): 354 – 366.
Ahlborn, G. J., Pike, O. A., Hendrix, S. B., Hess, W. M., & Huber, C. S. (2005). Sensory, mechanical, and microscopic evaluation of staling in low-protein and gluten-free breads. Cereal Chemistry, 82(3), 328-335.
Akdogan, H. (1999). High moisture food extrusion. International Journal of Food Science & Technology, 34(3), 195-207.

273
Akinrele, IA, Cook, AS and Holgate, RA. (1962). The manufacture of gari from cassava. Research Report No. 12. Federal Ministry of Commerce and Industry, Lagos, Nigeria. (Modified version of original paper). {Cited by Hendershott, 1972}.
Alberto, J. (1958). A mandioca III Sues derivados, prepares e usos. Gaz. Agric. Angola 3: 128 – 131. [Cited by Lancaster et al., 1982].
Ali, S., Mahmood, S., Alam, R., & Hossain, Z. (1989). Culture condition for production of glucoamylase from rice bran by Aspergillus terreus. MIRCEN Journal of Applied Microbiology and Biotechnology, 5(4), 525-532.
Allem, AC. (1994). The origin of Manihot esculenta Crantz (Euphorbiaceae).Genetic Resources and Crop Evolution, 41 (3): 133 – 150.
Allem, AC. (2002). The origins and taxonomy of cassava. In: RI Hillocks, JM Thresh and AC Bellotti (Eds.). Cassava: biology, production and utilization, Pp. 1 – 16. CABI Publishing.
Almonacid, S, Abakarov, A, Simpson, R, Chavez, P and Teixeira, A. (2009). Estimating Reaction Rates in Squid Protein Hydrolysis Using Artificial Neural Networks. Transactions of the ASABE. 52(6): 1969-1977.
Alva, S., Anupama, J., Savla, J., Chiu, Y. Y., Vyshali, P., Shruti, M., & Varalakshmi, K. N. (2007). Production and characterization of fungal amylase enzyme isolated from Aspergillus sp. JGI 12 in solid state culture. African Journal of Biotechnology, 6(5), 576-581.
Amoozegar, MA, Malekzadeh, F and Malik, KA. (2003). Production of amylase by newly isolated moderate halophile, Halobacillus sp. strain MA-2. Journal of Microbiological Methods, 52 (3): 353 – 359.
Amsterdam, AC. (1980). Simplified Economical Cassava Starch Process. Starch, 32 (2); 48 – 54.
Anto, H, Trivedi, UB and Patel, KC. (2006). Glucoamylase production by solid-state fermentation using rice flake manufacturing waste products as substrate. Bioresource Technology, 97 (10): 1161 – 1166.
Anuradha, R, Suresh, AK and Venkatesh, KV. (1999). Simultaneous saccharification and fermentation of starch to lactic acid. Process Biochemistry, 35 (3 – 4): 367 – 375.
AOAC – Association of Official Analytical Chemists International. (2000). Official Methods of Analysis of AOAC International, 17th Edition, Volume 1. William Horwitz, editor. Test Method 996.11, Locator Number 32.2.05A, Pp 35 – 38.
Arasaratnam, V and Balasubramaniam, K. (1993). Synergistic action of -Amylase and
Glucoamylase on raw Corn. Starch/Starke, 45 (6): 231 – 233.

274
Aro, S. O., Aletor, V. A., Tewe, O. O., & Agbede, J. O. (2010). Nutritional potentials of cassava tuber wastes: A case study of a cassava starch processing factory in south-western Nigeria. Livestock Research and Rural Development, 22 (11):Article #213. Retrieved September 21, 2013, from http://www.lrrd.org/lrrd22/11/aro22213.htm
ASAE (American Society of Agricultural Engineers). (1996). ASAE Standards 1996. Standards, engineering practices data adopted by American Society of Agricultural Engineers. ASAE, St. Joseph, Michigan.
Asaoka, M., Blanshard, J. M. V., & Rickard, J. E. (1991). Seasonal Effects on the Physico‐chemical Properties of Starch from Four Cultivars of Cassava.
Starch‐Stärke, 43(12), 455-459.
Aschengreen, NH. (1975). Production of Glucose/Fructose. Process Biochemistry. 10 (4): 17 – 19.
Aschengreen, NH, Nielsen, BH., Rosendal, P and Ostergaard, J. (1979). Liquefaction, saccharification and isomerization of starch from sources other than maize. Starch/Starke, 31(2): 64 – 66.
Asgher, M., Asad, M. J., Rahman, S. U., & Legge, R. L. (2007). A thermostable α-amylase from a moderately thermophilic Bacillus subtilis strain for starch processing. Journal of Food Engineering, 79(3), 950-955.
Ashley, V. M., Mitchell, D. A., & Howes, T. (1999). Evaluating strategies for overcoming overheating problems during solid-state fermentation in packed bed bioreactors. Biochemical Engineering Journal, 3(2), 141-150.
Aso, SN. (2004). Food engineering stratagem to protect the environment and improve the income opportunities of gari processors. Journal of Nigerian Environmental Society (JNES). 2 (1): 31 – 36.
Asther, M., Haon, M., Roussos, S., Record, E., Delattre, M., Lesage-Meessen, L., & Labat, M. (2002). Feruloyl esterase from Aspergillus niger-a comparison of the production in solid state and submerged fermentation. Process Biochemistry, 38(5), 685-691.
Atomi, H. (2005). Recent progress towards the application of hyperthermophiles and their enzymes. Current Opinion in Chemical Biology, 9 (2): 166 – 173.
Ayankunbi, MA, Keshinro, OO and Egele, P. (1991). Effects of methods of preparation on the nutrient composition of some cassava products – Garri (Eba), ‘Lafun’ and ‘Fufu. Food Chemistry, 41 (3): 349 – 354.
Ayernor, GS, Hammond, TK and Grafham, A. (2002). The combination of rice malt and amyloglucosidase for the production of sugar syrup from cassava flour. African Jnl. Sci. & Tech. (AJST); Science and Engineering Series. Vol. 3 (1): 10 – 17.

275
Bahnassey, Y. A., & Breene, W. M. (1994). Rapid Visco‐Analyzer (RVA) Pasting Profiles of Wheat, Corn, Waxy Corn, Tapioca and Amaranth Starches (A. hypochondriacus and A cruentus) in the Presence of Konjac Flour, Gellan, Guar,
Xanthan and Locust Bean Gums. Starch‐Stärke, 46(4), 134-141.
Bai, S and Ghazali, HM. (1986). Communication II. Production of Cassava Syrup with Glucoamylase Immobilized to Acid-washed Charcoal. Pertanika, 9 (1): 125 – 129.
Bailey, JE and Ollis, DF. (1986). Biochemical Engineering Fundamentals. McGraw-Hill Book Company.
Balagopal, C and Nair, PG. (1976). Studies on the microflora of market cassava chips of Kerala. Jnl. Root Crops. 2(2): 57 – 58.
Balagopalan, C, Padmaja, G, Nanda, SK and Moorthy, SN. (1988). Cassava in Food, Feed, and Industry. CRC Press, Inc. Boca Raton, Florida.
Balagopalan, C. (2002). Cassava utilization in food, feed, and industry. In: RI Hillocks, JM Thresh and AC Bellotti (Eds.). Cassava biology, production and utilization. CABI Publishing.
Barrios-González, J. (2012). Solid-state fermentation: physiology of solid medium, its molecular basis and applications. Process Biochemistry, 47 (2): 175 – 185.
Beilen, JBV and Li, Z. (2002). Enzyme technology: an overview. Current Opinion in Biotechnology, 13 (4): 338 – 344.
Belton, P. (Ed.). (2007). The chemical physics of food. Blackwell Publishing Ltd., Oxford, UK .
BeMiller, JN. (2002). Corn. McGraw-Hill Encyclopedia of Science and Technology, 9th Edition, Vol. 4. Pp 748 – 758.
BeMiller, JN and Huber, KC. (2008). Carbohydrates. In Fennema’s Food Chemistry. Fourth Edition. Damodaran, S, Parkin, KL and Fennema, OR, Editors. CRC Press, Boca Raton. Pp. 83 – 154.
BeMiller, JN. (2009). One hundred years of commercial food carbohydrate in the United States. Journal of Agricultural and Food Chemistry, 57, 8125 – 8129.
BeMiller, JN. (2010). Carbohydrate Analysis. In Food Analysis. Fourth Edition. Nielsen, SS, Editor. Springer. Pp. 147 – 177.
Berghofer, E and Sarhaddar, S. (1988). Production of glucose and high fructose syrup by enzymatic direct hydrolysis of cassava roots. Process Biochemistry. 23 (6): 188 – 194.

276
Bernfeld, P. (1955). Amylases, alpha and beta. Methods in enzymology I, 149-158.
Besson, I., Creuly, C., Gros, J. B., & Larroche, C. (1997). Pyrazine production by Bacillus subtilis in solid-state fermentation on soybeans. Applied Microbiology and Biotechnology, 47(5), 489-495.
Bhosale, DH, Rao, MB and Deshpande, VV. (1996). Molecular and industrial aspects of Glucose Isomerase. Microbiological Reviews, 60 (2): 280 – 300.
bing.com, (2013 A). Images of Cassava. http://www.bing.com/search?q=cassava&qs=HS&form=QBLH&pq=ca&sc=8-2&sp=1&sk=&ghc=1 Accessed: 05/30/2013.
Bing.com. (2013 B). Images of Amylases. http://www.bing.com/images/search?q=Amylases+a+and+%2cB.&qpvt=Amylases+a+and+%2cB.&FORM=IGRE Accessed 07/08/2013.
Blades, M. (1997). Food allergies and intolerances: an update. Nutrition & Food Science, 97(4), 146-151.
Blanshard, J. M. V., Bates, D. R., Muhr, A. H., Worcester, D. L., & Higgins, J. S. (1984). Small-angle neutron scattering studies of starch granule structure. Carbohydrate polymers, 4(6), 427-442.
Blazek, J., & Gilbert, E. P. (2011). Application of small-angle X-ray and neutron scattering techniques to the characterization of starch structure: A review. Carbohydrate Polymers, 85(2), 281-293.
Bloomberg New Energy Finance. (2012). Global Trends In Renewable Energy Investment 2012. UNEP Collaborating Centre Frankfurt School of Finance & Management.
Bokanga, M. (1994 a). Processing of cassava leaves for human consumption. Acta Horticulturae, No. 375: 203 – 207.
Bokanga, M. (1994 b). Distribution of cyanogenic potential in cassava germplasm. Acta Horticulturae, No. 375: 117 – 123.
Bolhuis, GG. (1954). The toxicity of cassava roots. Netherlands Journal of Agricultural Science, 2 (3): 6 – 14.
Boorsma, WG. (1905). Vergiftige Cassava. (Poisonous Cassava). Teysmannia, 17 (1905): 483 – 489 [Cited by Bolhuis, 1954].
Booth, R. H., Buckle, T. D., Cardenas, O. S., Gomez, G., & Hervas, E. (1976). Changes in quality of cassava roots during storage. International Journal of Food Science & Technology, 11(3), 245-264.

277
Borin, K, Lindberg, JE, and Ogle, RB. (2005). Effect of variety and preservation method of cassava leaves on diet digestibility by indigenous and improved pigs. Animal Science, 80 (3): 319 – 324.
Bos, C and Norr, NJ. (1974). Experience with the DDS-Kroyer Direct Hydrolysis Process. Starch/Starke, 26(6): 181 – 185.
Bourdoux, P., Delange, F., Gérard, M., Mafuta, M., Hanson, A., & Ermans, A. M. (1978). Evidence that cassava ingestion increases thiocyanate formation: a possible etiologic factor in endemic goiter. Journal of Clinical Endocrinology & Metabolism, 46(4), 613-621.
Bourdoux, P., Seghers, P., Mafuta, M., Vanderpas, J., Vanderpas-Rivera, M., Delange, F. & Ermans, A. M. (1982). Cassava products: HCN content and detoxification processes. In: Nutritional factors involved in the goitrogenic action of cassava, F Delange, FB Iteke and AM Ermans, Editors. Pp. 51-58. International Development Research Centre (IDRC), Ottawa, Canada. Report No. IDRC–184e.
Bourdoux, P, Seghers, P, Mafuta, M, Vanderpas, J, Vanderpas-Rivera, M, Delange, F and Ermans, MA. (1983). Traditional cassava detoxification processes and nutritional education in Zaire. In Cassava toxicity and thyroid; research and public health issues; proceedings of a workshop held in Ottawa, Canada, 31 May – 2 June 1982. International Development Research Centre (IDRC) Monograph 207e, Pp 134 – 137. F Delange and R Ahluwalia, Editors. IDRC, Ottawa, Canada. Report No. IDRC–207e.
Božić, N., Ruiz, J., López-Santín, J., & Vujčić, Z. (2011). Production and properties of the highly efficient raw starch digesting α-amylase from a Bacillus licheniformis ATCC 9945a. Biochemical Engineering Journal, 53(2), 203-209.
Bowler, P, Towersey, PJ and Galliard, T. (1985). Some effects of the minor components of wheat starch on glucose syrup production. Starch, 37 (10): 351 – 356.
Bradbury, J. H. (2006). Simple wetting method to reduce cyanogen content of cassava flour. Journal of Food composition and Analysis, 19(4), 388-393.
Bradbury, J. H., & Denton, I. C. (2010). Rapid wetting method to reduce cyanogen content of cassava flour. Food Chemistry, 121(2), 591-594.
Bramorski, A., Christen, P., Ramirez, M., Soccol, C. R., & Revah, S. (1998). Production of volatile compounds by the edible fungus Rhizopus oryzae during solid state cultivation on tropical agro-industrial substrates. Biotechnology letters, 20(4), 359-362.
Bruins, ME, Janssen, AE and Boom, RM. (2001). Thermozymes and their applications. Applied biochemistry and biotechnology, 90 (2): 155 – 186.

278
Buendía, RG, Mendoza, MGD, Bárcena, GR, Ortega, ME, Solis, HJ and Lara, BA. (2003). Effects of glucoamylase from Aspergillus niger on in vitro digestibility of maize and sorghum and on lamb performance. Agrociencia, 37 (4): 317 – 322.
Buleon, A and Colonna, P. (2007). Physicochemical behavior of starch in food applications. In: The chemical physics of food. P. Belton, editor. Blackwell Publishing Ltd., Oxford, UK .
Burhan, A., Nisa, U., Gökhan, C., Ömer, C., Ashabil, A., & Osman, G. (2003). Enzymatic properties of a novel thermostable, thermophilic, alkaline and chelator resistant amylase from an alkaliphilic Bacillus sp. isolate ANT-6. Process Biochemistry, 38(10), 1397-1403.
Cardoso, A. P., Mirione, E., Ernesto, M., Massaza, F., Cliff, J., Rezaul Haque, M., & Bradbury, J. H. (2005). Processing of cassava roots to remove cyanogens. Journal of Food Composition and Analysis, 18(5), 451-460.
Castilho, LR, Medronho, RA and Alves, TL. (2000). Production and extraction of pectinases obtained by solid state fermentation of agroindustrial residues with Aspergillus niger. Bioresource Technology, 71 (1) 45 – 50.
Castro, AM, Castilho, LR and Freire, DM. (2011). An overview on advances of amylases production and their use in the production of bioethanol by conventional and non-conventional processes. Biomass Conversion and Biorefinery, 1 (4): 245 – 255.
Cavaille, D., and D. Combes. (1995). Characterization of -galactosidase from Kluyveromyces lactis. Biotechnology and Applied Biochemistry, 22(1): 55-64.
Cavette, C. (2010). Corn Syrup. How products are made. Vol. 4. http://www.madehow.com/Volume-4/CornSyrup.html Accessed Monday 8th March 2010.
Ceballos, H, Iglesias, CA, Perez, JC, and Dixon, AG. (2004). Cassava breeding: opportunities and challenges. Plant Molecular Biology, 56 (4): 503 – 516.
Ceballos, H., S nchez, T., Denyer, K., Tofi o, A. P., Rosero, E. A., Dufour, D., ... & Fahy, B. (2008). Induction and identification of a small-granule, high-amylose mutant in cassava (Manihot esculenta Crantz). Journal of Agricultural and Food Chemistry, 56(16), 7215-7222.
Ceballos, H, Kulakow, P and Hershey, C. (2012). Cassava breeding: current status, bottlenecks and the potential of biotechnology tools. Tropical Plant Biology, 5 (1): 73 – 87.
Central Tuber Crops Research Institute (CTCRI). http://www.ctcri.org/ Accessed Saturday 13th March 2010.

279
Cereda, MP and Wosiacki, G. (1985). Characterization of pinhao starch. Part II: Rheological Properties of the pastes. Starch, 37 (12): 404 – 407.
Cereda, MP and Takahashi, M. (1996). Cassava wastes: their characterization and uses and treatment in Brazil. In Dufour, D., O’Brien, GM and Best, R. (Editors). Cassava Flour and Starch. CIAT, Cali, Columbia, P. 222. {Cited by Pandey et al., 2000}.
CGIAR: Consultative Group on International Agricultural Research. (1997). Report on the Inter-Centre Review of Root and Tuber Crops Research in the CGIAR. FAO, Rome. http://www.fao.org/Wairdocs/TAC/X5791E/x5791e00.htm Accessed 26th May 2013.
Chadha, YR. (1961). Sources of Starch in Commonwealth Territories. III. Cassava. Tropical Science, 3 (3): 101 – 113.
Charles, AL., Chang, YH., Ko, WC., Sriroth, K and Huang, TC. (2004). Some Physical and Chemical Properties of Starch Isolates of Cassava Genotypes. Starch, 56 (9): 413 – 418.
Charles, A. L., Chang, Y. H., Ko, W. C., Sriroth, K., & Huang, T. C. (2005 a). Influence of amylopectin structure and amylose content on the gelling properties of five cultivars of cassava starches. Journal of agricultural and food chemistry, 53(7), 2717-2725.
Charles, AL., Sriroth, K and Huang, T. (2005 b). Proximate composition, mineral contents, hydrogen cyanide and phytic acid of 5 cassava genotypes. Food Chemistry, 92 (4): 615 – 620.
Chen, Y., Cheng, J. J., & Creamer, K. S. (2008). Inhibition of anaerobic digestion process: a review. Bioresource Technology, 99(10), 4044-4064.
Chen, Y., Huang, S., Tang, Z., Chen, X., & Zhang, Z. (2011). Structural changes of cassava starch granules hydrolyzed by a mixture of α-amylase and glucoamylase. Carbohydrate Polymers, 85(1), 272-275.
Cheng, J. J., & Timilsina, G. R. (2011). Status and barriers of advanced biofuel technologies: A review. Renewable Energy, 36 (12): 3541-3549.
Cherry, H. M., Hussain, T., & Anwar, M. N. (2004). Extracellular glucoamylase from the isolate Aspergillus fumigatus. Pakistan Journal of Biological Sciences 7(11), 1988-1992.
Christen, P., Meza, J. C., & Revah, S. (1997). Fruity aroma production in solid state fermentation by Ceratocystis fimbriata: influence of the substrate type and the presence of precursors. Mycological Research, 101(8), 911-919

280
Christen, P., Bramorski, A., Revah, S., & Soccol, C. R. (2000). Characterization of volatile compounds produced by Rhizopus strains grown on agro-industrial solid wastes. Bioresource Technology, 71(3), 211-215.
Chynoweth, D. P., Turick, C. E., Owens, J. M., Jerger, D. E., & Peck, M. W. (1993). Biochemical methane potential of biomass and waste feedstocks. Biomass and Bioenergy, 5(1), 95-111.
Claude, F and Denis, F. (1990). African Cassava Mosaic Virus: Etiology, Epidemiology, and Control. Plant Diseases 74(6): 404 – 411
Clement, CR, de Cristo-Araújo, M, Coppens D’Eeckenbrugge, G, Alves Pereira, A and Picanço-Rodrigues, D. (2010). Origin and domestication of native Amazonian crops. Diversity, 2 (1): 72 – 106.
Cock, JH. (1985). Cassava. New potential for a neglected crop. Westview Press.
Collard, P and Levi, S. (1959). A two-stage fermentation of cassava. Nature, 183 (4661): 620 – 621.
Congocookbook.com. (2013). Baton de Manioc & Chikwangue. http://congocookbook.com/staple_dish_recipes/baton_de_manioc_and_chikwangue.html Accessed Friday 13th September 2013.
Conn, E. E. (1969). Cyanogenic glycosides. Journal of Agricultural and Food Chemistry, 17(3), 519-526.
Conn, E. E. (1994). Cyanogenesis-a personal perspective. In International Workshop on Cassava Safety. Acta Horticulturae, No. 375 (pp. 31-44).
Cooke, RD. (1978). An enzymatic assay for the total cyanide content of cassava (Manihot esculenta Crantz). Journal of the Science of Food and Agriculture, 29 (4): 345 – 352.
Cooke, RD, Blake, GG and Battershill, JM. (1978). Purification of cassava linamarase. Phytochemistry, 17 (3): 381 – 383.
Cooke, R. D., & Maduagwu, E. N. (1978). The effects of simple processing on the cyanide content of cassava chips. International Journal of Food Science & Technology, 13(4), 299-306.
Cooke, R. D., & de la Cruz, E. M. (1982). The changes in cyanide content of cassava (Manihot esculenta Crantz) tissues during plant development. Journal of the Science of Food and Agriculture, 33(3), 269-275.
Copeland, L., Blazek, J., Salman, H., & Tang, M. C. (2009). Form and functionality of starch. Food Hydrocolloids, 23 (6), 1527-1534.

281
Corn Refiners Association. (2007). A brief history of the corn refining industry. http://www.corn.org/historycornrefining.htm [Accessed 03/13/2010].
Coulston AM, and Johnson RK. (2002). Sugar and sugars: Myths and realities. Journal of American Dietary Association, 102 (3): 351 – 353.
Coursey, D. G. (1973, January). Cassava as food: toxicity and technology. In Chronic Cassava Toxicity: Proc. Interdisciplinary Workshop, held in London, England (pp. 27 – 36).
Coursey, DG and Haynes, PH. (1970). Root crops and their potential as food in the tropics. World Crops, 22 (4): 261 – 265.
Couto, SR and Sanroman, MA. (2006). Application of solid-state fermentation to food industry – A review. Journal of Food Engineering, 76 (3): 291 – 302.
Cumbana, A., Mirione, E., Cliff, J., & Bradbury, J. H. (2007). Reduction of cyanide content of cassava flour in Mozambique by the wetting method. Food Chemistry, 101(3), 894-897.
Cuzin, N, Farinet, JL, Segretain, C and Labat, M. (1992). Methanogenic fermentation of cassava peel using a pilot plug flow digester. Bioresource Technology, 41(3): 259 – 264.
Dale, JK and Langlios, DP. (1940). Starch conversion syrups. US Patent No. 2201609 [Cited by BeMiller, 2009; MacAllister, 1980].
Damodaran, S, Parkin, KL and Fennema, OR, Editors, (2008). Fennemas Food Chemistry. Fourth Edition. CRC Press, Boca Raton.
Darnoko, M, Cheryan, M and Artz, WE. (1989). Saccharification of Cassava starch in an ultrafiltration reactor. Enzyme Microb. Technol., Vol. 11: 154 – 159.
Daubresse, P., Ntibashirwa, S., Gheysen, A., & Meyer, J. A. (1987). A process for protein enrichment of cassava by solid substrate fermentation in rural conditions. Biotechnology and bioengineering, 29(8), 962-968.
De Baere, H. (1999). Starch Policy in the European Community. Starch, 51 (6): 189 – 193.
De Braganca, RM and Fowler, P. (2004). Industrial Markets for Starch. The BioComposites Centre, University of Wales, Bangor, Gwynedd, LL57 2UW.
De Bruijn, GH. (1973). The cyanogenic Character of Cassava (Manihot esculenta). In: Chronic Cassava Toxicity, Proceedings of an interdisciplinary workshop. London, England, 29 – 30 January, 1973. B. Nestle and R. MacIntyre, Editors. International Development Research Centre (IDRC), Ottawa, Canada. Pp. 43-48.
282
Deepak, V, Kalishwaralal, K, Ramkumarpandian, S, Babu, SV, Senthilkumar, SR and Sangiliyandi, G. (2008). Optimization of media composition for Nattokinase production by Bacillus subtilis using response surface methodology. Bioresource Technology, 99 (17): 8170 – 8174.
Deffenbaugh, L. B., & Walker, C. E. (1989 a). Comparison of starch pasting properties in the Brabender Viscoamylograph and the Rapid Visco-Analyzer. Cereal Chemistry, 66(6), 493-499.
Deffenbaugh, L. B., & Walker, C. E. (1989 b). Use of the Rapid‐Visco‐Analyzer to
Measure Starch Pasting Properties. Part I: Effect of Sugars. Starch‐Stärke, 41(12), 461-467.
Defloor, I., Dehing, I., & Delcour, J. A. (1998). Physico‐Chemical Properties of Cassava
Starch. Starch‐Stärke, 50(2‐3), 58-64.
Delange, F., Van der Velden, M., & Ermans, A. M. (1973). Evidence of an antithyroid action of cassava in man and in animals. In: Chronic Cassava Toxicity, Proceedings of an interdisciplinary workshop. London, England, 29 – 30 January, 1973. B. Nestle and R. MacIntyre, Editors. International Development Research Centre (IDRC), Ottawa, Canada. Pp. 147-151.
Demirbas, A. (2007). Progress and recent trends in biofuels. Progress in energy and combustion science, 33(1), 1-18.
Demirbas, A. (2009). Progress and recent trends in biodiesel fuels. Energy Conversion and Management, 50(1), 14-34.
Demirjian, DC, Mor s-Varas, F and Cassidy, CS. (2001). Enzymes from extremophiles. Current Opinion in Chemical Biology, 5 (2): 144 – 151.
de Moraes, L. M., Astolfi Filho, S., & Ulhoa, C. J. (1999). Purification and some properties of an α-amylase glucoamylase fusion protein from Saccharomyces cerevisiae. World Journal of Microbiology and Biotechnology, 15(5), 561-564.
Dey, T. B., & Banerjee, R. (2012). Hyperactive α‐amylase production by Aspergillus oryzae IFO 30103 in a new bioreactor. Letters in applied microbiology, 54(2), 102-107; DOI: 10.1111/j.1472-765X.2011.03177.x
Dixon, AGO, Asiedu, R and Bokanga, M. (1994). Breeding of cassava for low cyanogenic potential: Problems, progress and prospects. Acta Horticulturae, No. 375: 153 – 161.
Doku, EV. (1969). Cassava in Ghana. Ghana University Press, Accra. [Cited by Lancaster et al., 1982].
Donald, A. M., Kato, K. L., Perry, P. A., & Waigh, T. A. (2001). Scattering studies of the
internal structure of starch granules. Starch‐Stärke, 53(10), 504-512.

283
Doran, PM. (1995). Bioprocess Engineering Principles. Academic Press
Dreher, M. L., Dreher, C. J., Berry, J. W., & Fleming, S. E. (1984). Starch digestibility of foods: a nutritional perspective. CRC Critical Reviews in Food Science & Nutrition, 20(1), 47-71
Dufour, D. L. (1988). Cyanide content of cassava (Manihot esculenta, Euphorbiaceae) cultivars used by Tukanoan Indians in Northwest Amazonia. Economic Botany, 42(2), 255-266.
Dufour, D. L. (1989). Effectiveness of cassava detoxification techniques used by indigenous peoples in Northwest Amazonia. Interciencia, 14(2), 86-91.
Dufour, DL. (1994). Cassava in Amazonia: Lessons in utilization and safety from native peoples. In: Bokanga et al., Editors. International workshop on cassava safety. Ibadan, Nigeria, 1st – 4th March 1994. Acta Horticulturae, No. 375, Pp. 175 – 182.
Dufour, D. L. (2007). “Bitter” Cassava: Toxicity and Detoxification. In: Proceedings of First International Meeting on Cassava Breeding, Biotechnology and Ecology, Pp. 171 – 184. R. Ortiz and N. Nassar, Editors. University of Brasilia, http://www.geneconserve.pro.br/site/pags/meeting2/proceedings.pdf#page=171 [Accessed 11/16/2013].
Durand, A. (2003). Bioreactor designs for solid state fermentation. Biochemical Engineering Journal, 13 (2): 113 – 125.
Dziedzic, SZ. (1981). Production and physico-chemical properties of isomerized glucose syrup. Starch, 33 (11): 369 – 372.
Eggleston, G., Omoaka, P. E., & Ihedioha, D. O. (1992). Development and evaluation of products from cassava flour as new alternatives to wheaten breads. Journal of the Science of Food and Agriculture, 59(3), 377-385.
Ekpechi, O. L. (1967). Pathogenesis of endemic goitre in Eastern Nigeria. British Journal of Nutrition, 21(03), 537-545.
Ekpechi, OL. (1973). Endemic Goitre and High Cassava Diets in Eastern Nigeria. In: Chronic Cassava Toxicity, Proceedings of an interdisciplinary workshop. London, England, 29 – 30 January, 1973. B. Nestle and R. MacIntyre, Editors. International Development Research Centre (IDRC), Ottawa, Canada. Pp. 139-145.
Ekundayo, JA. (1980). An appraisal of advances in biotechnology in central Africa. In: Fungal Biotechnology. Smith, JE; Berry, DR and Kristiansen, B. Editors. Academic Press. Pp. 243 – 271.
284
Elias, M, Mühlen, GS, McKey, D, Roa, AC and Tohme, J. (2004). Genetic diversity of traditional South American landraces of cassava (Manihot esculenta Crantz): an analysis using microsatellites. Economic Botany, 58 (2): 242 – 256.
Eliasson, A. C. (Ed.). (2004). Starch in food: Structure, function and applications. Cambridge/ Boca Raton: Woodhead Publishing Limited/CRC Press LLC.
Ellaiah, P, Adinarayana, K, Bhavani, Y, Padmaja, P and Srinivasulu, B. (2002). Optimization of process parameters for glucoamylase production under solid state fermentation by a newly isolated Aspergillus species. Process Biochemistry, 38 (4): 615 – 620.
El-Sharkawy, MA. (2004). Cassava, biology and physiology. Plant Molecular Biology, 56 (4): 481 – 501.
Encyclopedia Britannica. (2010). Isomerization. http://www.britanica.com/EBchecked/topic/296381/isomerization Accessed Saturday 13th March 2010.
Eneas, G. (2006). Cassava: A BioFuel. The Bahama Journal. http://www.jonesbahamas.com/?c=47&a=7415 Accessed 12/20/2010.
Ensymm Consulting on Biotechnology. (2005). Project study for enzymatic production of High Fructose Syrup (HFS). http://www.ensymm.com [Accessed 03/13/2010].
Enzymes Used in Food Industry. http://prof.dr.semih.otles.tripod.com/enzymesused/enzymesused.htm Assessed Wednesday 1st June 2011.
Essers, AJA. (1994). Making safe flour from bitter cassava by indigenous solid substrate fermentation. Acta Horticulturae, No. 375. Pp 217 – 224.
Etorma, SB. (1936). Chemical studies on cassava products, I. The critical moisture- molding content of cassava starch. Philippines Journal of Agriculture. (7) 4: 409 – 412.
FAO (Food and Agriculture Organization of the United Nations). (1953). Food Composition Tables for International Use. 2nd Edition, January 1953, Pp. 23 – 24. FAO, Rome. {Cited by Hendershott, 1972}.
FAO. (1954). Food Composition Tables – Minerals and Vitamins for International Use. March 1954, Pp. 30 – 33. FAO, Rome. {Cited by Hendershott, 1972}.
FAO. (1968). Food composition table for use in Africa. FAO, Rome. {Cited by Latham, 1979}.
FAO. (1977). Cassava Processing. http://www.fao.org/docrep/X5032E/x5032E01.htm Accessed 09/05/2011.

285
FAO: Food and Agriculture Organization of the United Nations. (1989). Utilization of tropical foods: Roots and tubers. FAO Food Nutrition Paper 47/2. FAO, Rome. (cited by Koch et. al, 1994) .
FAO. (1990). Roots, tubers, plantain and bananas in human nutrition. FAO Food and Nutrition Series No. 24. FAO, Rome.
FAO. (2001). State of Food Insecurity in the World 2001,(The). Food Insecurity: When People Live with Hunger and Fear Starvation. FAO, Rome.
FAO. (2002). World Agriculture: Towards 2015/2030 Summary Report. FAO, Rome. ftp://ftp.fao.org/docrep/fao/004/y3557e/y3557e.pdf [Accessed 08/27/2013].
FAO (2008) Cassava for Food and Energy Security - Investing in Cassava Research and Development Could Boost Yields and Industrial Uses. Food and Agriculture Organization (FAO) of the United Nations, Rome. Posted by: African press organization, 25 July 2008. http://appablog.wordpress.com/2008/07/25/cassava-for-food-and-energy-security-investing-in-cassava-research-and-development-could-boost-yields-and-industrial-uses/ [Accessed 24th October 2013].
FAO. (2010). FAOSTAT: Online Statistical Database for Food and Agricultural Commodities Production. FAO. Rome. http://faostat.fao.org Accessed Sunday 19th December 2010.
FAO. (2013). FAOSTAT. Online Statistical Database for Food and Agricultural Commodities Production. FAO, Rome. http://faostat.fao.org Accessed Thursday 6th June 2013.
FAO/WHO. (1995). Codex Alimentarius International Food Standards. Codex Standard 176 – 1989: Standard for Edible Cassava Flour. http://www.codexalimentarius.org/standards/list-of-standards/en/ [Accessed 5th June 2013].
Farber, GK, Glasfeld, A, Tiraby, G, Ringe, D and Petsko, GA. (1989). Crystallographic studies of the mechanism of xylose isomerase. Biochemistry, 28 (18): 7289 – 7297.
Fargione, J., Hill, J., Tilman, D., Polasky, S., & Hawthorne, P. (2008). Land clearing and the biofuel carbon debt. Science, 319 (5867): 1235 – 1238.
Fauquet, C and Fargette, D. (1990). African Cassava Mosaic Virus: Etiology, Epidemiology and Control. Plant Disease, 74 (6): 404 – 411.
Fay, J. P., Jakober, K. D., Cheng, K. J., & Costerton, J. W. (1990). Esterase activity of pure cultures of rumen bacteria as expressed by the hydrolysis of p-nitrophenylpalmitate. Canadian Journal of Microbiology, 36(8), 585-589.

286
Fogarty, WM. (1983). Microbial amylases. In Microbial Enzymes and Biotechnology. WM Fogarty, ed., Pp 1 – 92. Applied Science Publishers, London.
Fogarty, WM and Griffin, PJ. (1973). Studies on the production of an Extracellular Amylase of Bacillus polymyxa in Batch Culture. Journal of Applied Chemistry and Biotechnology, 23 (1): 166 – 167.
Francis, F., Sabu, A., Nampoothiri, K. M., Ramachandran, S., Ghosh, S., Szakacs, G., & Pandey, A. (2003). Use of response surface methodology for optimizing process parameters for the production of α-amylase by Aspergillus oryzae. Biochemical Engineering Journal, 15(2), 107-115.
Franco, CML, Preto, SJR and Ciacco, CF. (1987). Studies on the susceptibility of granular cassava and corn starches to enzymatic attack. Part I: Study of the Conditions of Hydrolysis. Starch/Starke, 39 (12): 432 – 435.
Franco, JM, Murado, MA, Siso, MIG, Miron, J and Gonzalez, MP. (1989). A HPLC method for specific determination of -amylase and glucoamylase in complex
enzymatic preparations. Chromatographia, 27 (7/8): 328 – 332.
Frostell, B., Sointio, J., & Bonkoski, W. (1984, January). Methane generation from the anaerobic digestion of beet pulp. In Symposium Papers: Energy From Biomass and Wastes VIII." DL Klass,(Ed.), Inst. Gas Technol., Chicago, Ill
Fujii, M, Murakami, S, Yamada, Y, Ona, T and Nakamura, T. (1981). A kinetic equation for hydrolysis of polysaccharides by mixed exo- and endo- enzyme systems. Biotechnology and Bioengineering, 23 (6): 1393 – 1398.
Fujii, M and Kawamura, Y. (1985). Synergistic action of -amylase and glucoamylase on
hydrolysis of starch. Biotechnology and Bioengineering, 27 (3): 260 – 265.
Fujii, M., Homma, T., & Taniguchi, M. (1988). Synergism of α‐amylase and glucoamylase on hydrolysis of native starch granules. Biotechnology and Bioengineering, 32(7), 910-915.
Gao, R, Yuan, X, Li, J, Wang, X, Cheng, X, Zhu, W and Cui, Z. (2012). Performance and Spatial Succession of a Full-Scale Anaerobic Plant Treating High-Concentration Cassava Bioethanol Wastewater. Journal of Microbiology and Biotechnology, 22 (8): 1148-1154.
Garfí, M, Ferrer-Martí, L, Velo, E and Ferrer, I. (20120. Evaluating benefits of low-cost household digesters for rural Andean communities. Renewable and Sustainable Energy Reviews, 16 (1): 575 – 581.
Gauss, WF, Suzuki, S, and Takagi, M. (1976). Manufacture of alcohol from cellulosic materials using plural ferments. US Patent # 3,990,944. November 9th 1976.

287
Ghildyal, NP, Ramakrishna, M and Lonsane, BK. (1989). Comparative economics of the production of high fructose syrup from cassava chips and cassava starch. Starch. 41 (2): 64 – 68.
Gidamis, A. B., O'brien, G. M., & Poulter, N. H. (1993). Cassava detoxification of traditional Tanzanian cassava foods. International Journal of Food Science & Technology, 28(2), 211-218.
Giraud, E, Champailler, A and Raimbault, M. (1994). Degradation of raw starch by a wild amylolytic strain of Lactobacillus plantarum. Applied and Environmental Microbiology, 60 (12): 4319 – 4323.
Glover, J. D., Reganold, J. P., Bell, L. W., Borevitz, J., Brummer, E. C., Buckler, E. S., … & Xu, Y. (2010). Increased food and ecosystem security via perennial grains. Science (Washington), 328 (5986): 1638-1639.
Godfray, H. C. J., Beddington, J. R., Crute, I. R., Haddad, L., Lawrence, D., Muir, J. F., ... & Toulmin, C. (2010). Food security: the challenge of feeding 9 billion people. Science, 327 (5967): 812-818.
Godfrey, T and Reichelt, J. (1983). Industrial Enzymology. The applications of Enzymes in Industry. Macmillan Publishers and The Nature Press
Gomez, G and Valdivieso, M. (1983). The effect of variety and plant age on cyanide content, chemical composition and quality of cassava roots. Nutrition Reports International, 27 (4): 857 – 865.
Gomez, G, Valdivieso, M, Zapata, LE and Pardo, C. (1984). Cyanide elimination, chemical composition and evaluation in breadmaking of oven dried cassava peeled root chips or slices. Journal of Food Technology, 19 (4): 493 – 498.
Gomez, G, Valdivieso, M and Noma, AT. (1985). The influence of cultivar and plant age on the chemical composition of field-grown cassava leaves and roots. Qualitas plantarum - plant foods for human nutrition, 35 (2): 109 – 119.
Gómez, G. G., & Valdivieso, M. (1988). The effects of ensiling cassava whole-root chips on cyanide elimination. Nutrition reports international, 37(6), 1161-1166.
Gonzalez, C. F., Farina, J. I., & de Figueroa, L. I. C. (2008). Optimized amylolytic enzymes production in Saccharomycopsis fibuligera DSM-70554: An approach to efficient cassava starch utilization. Enzyme and Microbial Technology, 42(3), 272-277.
Gordon, I. (1999). Starches from differing sources- supply, demand, price formation. Starch, 51 (6): 193 – 196.
Gorinstein, S and Lii, C. (1992). The effects of enzyme hydrolysis on the properties of potato, cassava and amaranth starches. Starch, 41 (12): 461 – 466.

288
Goyal, N., Gupta, J. K., & Soni, S. K. (2005). A novel raw starch digesting thermostable α-amylase from Bacillus sp. I-3 and its use in the direct hydrolysis of raw potato starch. Enzyme and Microbial Technology, 37(7), 723-734.
Grajek, W., & Gervais, P. (1987 A). Effect of the sugar-beet pulp water activity on the solid-state culture of Trichoderma viride TS. Applied microbiology and biotechnology, 26(6), 537-541.
Grajek, W., & Gervais, P. (1987 B). Influence of water activity on the enzyme biosynthesis and enzyme activities produced by Trichoderma viride TS in solid-state fermentation. Enzyme and Microbial Technology, 9(11), 658-662.
Graminha, E. B. N., Goncalves, A. Z. L., Pirota, R. D. P. B., Balsalobre, M. A. A., Da Silva, R., & Gomes, E. (2008). Enzyme production by solid-state fermentation: Application to animal nutrition. Animal Feed Science and Technology, 144(1), 1-22.
Greenfield, PF and Brooks, RB. (1982). Processing of cassava to produce ethanol- Effect of raw material preparation. Starch, 34 (6): 192 – 197.
Grenby, TH. (1991). Intense sweeteners for the food industry: an overview. Trends in Food Science & Technology, 2, 2-6.
Gupta, R, Gigras, P, Mohapatra, H, Goswami, VK, and Chauhan, B. (2003). Microbial α-amylases: a biotechnological perspective. Process Biochemistry, 38 (11): 1599 – 1616.
Hahn, SK (1983). Cassava research to overcome the constraints to production and use in Africa. In Workshop on Cassava Toxicity and Thyroid, Ottawa (Canada), 31 May – 2 June 1982. IDRC: International Development Research Centre.
Hahn SK. (1992). An overview of traditional processing and utilization of cassava in Africa. Cassava as livestock feed in Africa: Proceedings of the IITA/ILCA/University of Ibadan workshop on the potential utilization of cassava as livestock feed in Africa, 14-18 November 1988, Ibadan, Nigeria. Pages: 16 – 27. http://www.fao.org/Wairdocs/ILRI/x5458E/x5458e05.htm Accessed 26th May 2013
Hahn, SK and Keyser, J. (1985). Cassava: A basic food for Africa. Outlook on Agriculture, 14, 95 – 99.
Hahn, SK, Reynolds, L and Egbunike, GN, Editors. (1992). Cassava as livestock feed in Africa. Proceedings of the IITA/ILCA/University of Ibadan Workshop on the Potential Utilization of Cassava as Livestock Feed in Africa. 14 – 18 November 1988, Ibadan Nigeria. International Institute of Tropical Agriculture (IITA)/International Livestock Centre for Africa (ILCA).

289
http://books.google.com/books?id=LouWDfm5T_QC&pg=PA52&lpg=PA52&dq=the+utilization+of+cassava+forage+in+ruminant+feeding&source=bl&ots=dzplqq6XYD&sig=h3PseIldJVZx4VFBDq_aOzxXWGk&hl=en&sa=X&ei=Q_6nUbbrJYj29gTPoIDwCg&ved=0CEIQ6AEwAw#v=onepage&q=the%20utilization%20of%20cassava%20forage%20in%20ruminant%20feeding&f=false Accessed 05/30/2013.
Hakizimana, A. (2010). Successful launch of Mayange’s cassava flour plant. Millennium Villages Blog. http://blogs.millenniumpromise.org/index.php/2010/01/04/successful-launch-of-mayange... Accessed 12/28/2010.
Hanover, LM and White JS. 1993. Manufacturing, composition, and application of fructose. Journal of Clinical Nutrition. 58: 724 – 732.
Hashim, SO, Delgado, OD, Martínez, MA, Kaul, RH, Mulaa, FJ and Mattiasson, B. (2005). Alkaline active maltohexaose-forming α-amylase from Bacillus halodurans LBK 34. Enzyme and Microbial Technology, 36 (1): 139 – 146.
Hashemi, M, Mousavi, SM, Razavi, SH and Shojaosadati, SA. (2011). Mathematical modeling of biomass and α-amylase production kinetics by Bacillus sp. in solid-state fermentation based on solid dry weight variation. Biochemical Engineering Journal, 53 (2): 159 – 164.
Hein, GL, Storey, ML, White, IS and Lineback, DR. (2005). High and lows of High Fructose Syrup. Nutrition Today, 40 (6): 253 – 256.
Heitmann, T, Wenzig, E and Mersmann, A. (1997). Characterization of three different potato starches and kinetics of their enzymatic hydrolysis by an α-amylase. Enzyme and Microbial Technology, 20 (4): 259 – 267.
Hendershott, CH, Ayers, JC, Brannen, SJ, Dempsey, AH, Lehman, PS, Obioha, FC, Rogers, DJ, Seerley, RW and Tan, KH. (1972). A Literature Review and Research Recommendations on Cassava (Manihot esculenta, Crantz). AID Contract No. csd/2497. University of Georgia, Athens, Georgia, USA.
Henry, G and Hershey, C. (2002). Cassava in South America and the Caribbean. In: RI Hillocks, JM Thresh and AC Bellotti (Eds.). Cassava: biology, production and utilization. CABI Publishing.
Hernández, M. S., Rodríguez, M. R., Guerra, N. P., & Rosés, R. P. (2006). Amylase production by Aspergillus niger in submerged cultivation on two wastes from food industries. Journal of Food Engineering, 73(1), 93-100.
Herrera, S. (2006). Bonkers about biofuels. Nature Biotechnology, 24(7), 755-760.
Hillocks, RJ. (2002). Cassava in Africa. In: RI Hillocks, JM Thresh and AC Bellotti (Eds.). Cassava: biology, production and utilization. CABI Publishing.

290
Hizukuri, S. (1985). Relationship between the distribution of the chain length of amylopectin and the crystalline structure of starch granules. Carbohydrate Research, 141(2), 295-306.
Hizukuri, S. (1986). Polymodal distribution of the chain lengths of amylopectins, and its significance. Carbohydrate Research, 147(2), 342-347.
Hizukuri, S., & Takagi, T. (1984). Estimation of the distribution of molecular weight for amylose by the low-angle laser-light-scattering technique combined with high-performance gel chromatography. Carbohydrate Research, 134(1), 1-10.
Hizukuri, S., Takeda, Y., Yasuda, M., & Suzuki, A. (1981). Multi-branched nature of amylose and the action of debranching enzymes. Carbohydrate Research, 94(2), 205-213.
Hoehn, E, Mckay, CJ and Murray, DE. (1983). Production of high fructose syrup from inulin involving ultrafiltration. United States Patent 4421852.
Hohnholz, JH. (1980). Manioc Cultivation in South-East Asia. An Agricultural Geographic Survey. Applied Geography and Development, 16, 117 – 135.
Hölker, U and Lenz, J. (2005). Solid-state fermentation—are there any biotechnological advantages? Current Opinion in Microbiology, 8 (3): 301 – 306.
Holm, J., Björck, I., Ostrowska, S., Eliasson, A. C., Asp, N. G., Larsson, K., & Lundquist,
I. (1983). Digestibility of Amylose‐Lipid Complexes in‐vitro and in‐vivo.
Starch‐Stärke, 35(9), 294-297.
Hoover, R. (2001). Composition, molecular structure, and physicochemical properties of tuber and root starches: a review. Carbohydrate Polymers, 45(3), 253-267.
Hoover, R., & Sosulski, F. (1985). Studies on the functional characteristics and
digestibility of starches from Phaseolus vulgaris biotypes. Starch‐Stärke, 37(6), 181-191.
Hoover, R., & Vasanthan, T. (1994). Effect of heat-moisture treatment on the structure and physicochemical properties of cereal, legume, and tuber starches. Carbohydrate Research, 252 (15 January 1994): 33 – 53.
Hough, D. W., & Danson, M. J. (1999). Extremozymes. Current Opinion in Chemical Biology, 3(1), 39-46.
Hughes, J., Decarvalho, J. P. C., & Hughes, M. A. (1994). Purification, Characterization, and Cloning of α-Hydroxynitrile Lyase from Cassava Manihot esculenta Crantz). Archives of Biochemistry and Biophysics, 311(2), 496-502.
291
Huntrods, D, Koundinya, V and Geisler, M. (2012). Sugarcane Profile. Agricultural Marketing Research Center. http://www.agmrc.org/commodities__products/grains__oilseeds/sugarcane_profile.cfm# [Accessed 08/27/2013].
Hutnan, M., Drtil, M., & Mrafkova, L. (2000). Anaerobic biodegradation of sugar beet pulp. Biodegradation, 11(4), 203-211.
Hutnan, M., Drtil, M., Derco, J., Mrafkova, L., Hornak, M., & Mico, S. (2001). Two-step pilot-scale anaerobic treatment of sugar beet pulp. Polish Journal of Environmental Studies, 10(4), 237-244.
Iglesias, C, Hershey, C, Calle, F and Bolaños, A. (1994). Propagating cassava (Manihot esculenta) by sexual seed. Experimental Agriculture, 30 (3): 283 – 290. doi:10.1017/S0014479700024388.
International Energy Agency: IEA. (2009). World Energy Outlook 2009 Edition. IEA, Paris, France.
Ikediobi, CQ, Eluwah, CE and Onyia, GOC. (1980). A rapid and inexpensive enzymatic assay for total cyanide in cassava (Manihot esculenta Crantz) and cassava products. Agricultural and Biological Chemistry, 44 (12): 2803 – 2809.
INCAP (Institute de Nutricion de Centro America y Panama). (1968). Tabla de composicion de pastos, forrajes y ostros alimentos de Centro America y Panama. (Tables of composition of pasture grasses, forages, and other food material of Central America and Panama). INCAP Publication No. E-440.
Ingram, JS and Humphries, JRO. (1972). Cassava storage: A review. Tropical Science, 14, 131 – 148.
International Starch Institute. (1999). Cassava. International Starch Institute. Aarhus, Denmark. http://www.starch.dk/isi/starch/cassava.htm Accessed 02/15/2010
IPCC: Intergovernmental Panel on Climate Change. (2007). Climate Change 2007: Synthesis Report. IPCC, Geneva, Switzerland.
IPPA: International Pectin Producers Association. (2001). Facts about pectin. IPPA, http://www.ippa.info/history_of_pectin.htm Accessed 06/01/2013.
Isengard, HD, Labuza, TP, Lillford PJ and Reid, DS. (2011). Taking the Measure of Water. The World of Food Science, http://www.worldfoodscience.org/cms/?pid=1005734 [Accessed 10/21/2013].
Ishida, H., Hata, Y., Kawato, A., Abe, Y., Suginami, K., & Imayasu, S. (2000). Identification of functional elements that regulate the glucoamylase-encoding gene (glaB) expressed in solid-state culture of Aspergillus oryzae. Current Genetics, 37(6): 373-379.

292
Ito, K., Yoshida, K., Ishikawa, T., & Kobayashi, S. (1990). Volatile compounds produced by the fungus Aspergillus oryzae in rice Koji and their changes during cultivation. Journal of Fermentation and Bioengineering, 70(3), 169-172.
James, JA and Lee, BH. (1997). Glucoamylases: Microbial sources, industrial applications and molecular biology – A review. Journal of Food Biochemistry, 21 (6): 1 – 52.
Jane, J. L., Kasemsuwan, T., Leas, S., Zobel, H., & Robyt, J. F. (1994). Anthology of starch granule morphology by scanning electron microscopy. Starch‐Stärke, 46(4), 121-129.
Jane, J., Chen, Y. Y., Lee, L. F., McPherson, A. E., Wong, K. S., Radosavljevic, M., & Kasemsuwan, T. (1999). Effects of amylopectin branch chain length and amylose content on the gelatinization and pasting properties of starch 1. Cereal Chemistry, 76(5), 629-637.
Jayakody, L., & Hoover, R. (2008). Effect of annealing on the molecular structure and physicochemical properties of starches from different botanical origins–A review. Carbohydrate Polymers, 74(3), 691-703.
Jenkins, P. J., Cameron, R. E., & Donald, A. M. (1993). A universal feature in the
structure of starch granules from different botanical sources. Starch‐Stärke, 45(12), 417-420.
Jenkins, P. J., & Donald, A. M. (1996). Application of small-angle neutron scattering to the study of the structure of starch granules. Polymer, 37(25), 5559-5568.
Jenner, C. F. (1982). Storage of starch. In Plant Carbohydrates I: Encyclopedia of Plant Physiology, 13 (A): 700 – 747. Springer Berlin Heidelberg.
Johnson, R, Moorthy, SN, and Padmaja, G. (2005). Optimized parameters for the enzyme catalyzed liquefaction and saccharification of sweet potato starch. Jnl. Root Crops, 31 (1): 7 – 13.
Johnson, R, Padmaja, G and Moorthy, SN. (2009). Comparative production of glucose and high fructose syrup from cassava and sweet potato roots by direct conversion techniques. Journal of Innovative Food Science & Emerging Technologies. Vol. 10(4): 616 – 620.
Johnson, R, Moorthy, SN and Padmaja, G. (2010). Production of high fructose syrup from cassava and sweet potato flours and there blends with cereal flours. Food Science and Technology International, 16 (3): 251 – 258.
Jood, S., Chauhan, B. M., & Kapoor, A. C. (1988). Contents and digestibility of carbohydrates of chickpea and black gram as affected by domestic processing and cooking. Food Chemistry, 30(2), 113-127.

293
Juszczak, L Fortuna, T and Krok, F. (2003). Non-contact atomic force microscopy of starch granules surface. Part I. Potato and Tapioca starches. Starch. 55(2003): 1 – 7.
Kádár, Z, Christensen, AD, Thomsen, MH and Bjerre, AB. (2011). Bioethanol production by inherent enzymes from rye and wheat with addition of organic farming cheese whey. Fuel, 90 (11): 3323 – 3329.
Kakes, P. (1990). Properties and functions of the cyanogenic system in higher plants. Euphytica, 48 (1): 25 – 43.
Kalogeris, E., Fountoukides, G., Kekos, D., & Macris, B. J. (1999). Design of a solid-state bioreactor for thermophilic microorganisms. Bioresource Technology, 67(3), 313-315.
Kammoun, R., Naili, B., & Bejar, S. (2008). Application of a statistical design to the optimization of parameters and culture medium for α-amylase production by Aspergillus oryzae CBS 819.72 grown on gruel (wheat grinding by-product). Bioresource Technology, 99(13), 5602-5609.
Kanlayakrit, W., Ishimatsu, K., Nakao, M., & Hayashida, S. (1987). Characteristics of raw-starch-digesting glucoamylase from thermophilic Rhizomucor pusillus Journal of Fermentation Technology, 65(4), 379-385.
Kar, S, Datta, TK and Ray, RC. (2010). Optimization of Thermostable - Amylase
Production by Streptomyces erumpens MTCC 7317 in Solid-state Fermentation Using Cassava Fibrous Residue. Brazilian Archives of Biology and Technology, 53 (2): 301 – 309.
Kareem, S. O., Akpan, I., & Oduntan, S. B. (2009). Cowpea waste: a novel substrate for solid state production of amylase by Aspergillus oryzae. African Journal of Microbiology Research, 3(12), 974-977.
Katz, M and Reese, ET. (1968). Production of glucose by enzymatic hydrolysis of cellulose. Applied Microbiology, 16 (2): 419 – 420.
Kearsley, MW and Nketsia-Tabiri, J. (1979). The Enzymic Hydrolysis of Starch Containing Crops. Food Science and Technology, 12 (4): 199 – 202.
Keating, BA, Wilson, GL and Evenson, JP. (1988). Effects of length, thickness, orientation, and planting density of cassava (Manihot esculenta Crantz) planting material on subsequent establishment, growth and yield. East African Agricultural and Forestry Journal. 53: 145 – 149.
Ketiku, AO and Onyenuga, VA. (1970). Preliminary Report on the Carbohydrate Constituents of Cassava Root and Yam Tuber. Nigerian Journal of Science, 4 (1): 25 – 30.

294
Ketiku, AO and Onyenuga, VA. (1972). Changes in the Carbohydrate Constituents of Cassava Root-Tuber (Manihot utilissima Pohl) During Growth. Journal of the Science of Food and Agriculture, 23 (7): 1451 – 1456.
Ketiku, AO, Akinyele, IO, Keshinro, OO and Akinnawo, OO. (1978). Changes in the hydrocyanic acid concentration during traditional processing of cassava into gari and lafun. Food Chemistry, 3 (3): 222 – 228.
Koch, BM, Sibbesen, O, Swain, E, Kahn, RA, Liangcheng, D, Bak, S, Halkier, BA and Moller, BL. (1994). Possible use of a biotechnological approach to optimize and regulate the content and distribution of cyanogenic glucosides in cassava to increase food safety. Acta Horticulturae, No. 375: 45 – 60.
Koch, L. (1933). Cassaveselectie (Cassava selection). Thesis, Wageningen [Cited by Bolhuis, 1954].
Konsula, Z., & Liakopoulou-Kyriakides, M. (2004). Hydrolysis of starches by the action of an α-amylase from Bacillus subtilis. Process Biochemistry, 39(11), 1745-1749.
Konsoula, Z and Liakopoulou-Kyriakides, M. (2006 A). Starch hydrolysis by the action of an entrapped in alginate capsules - α amylase from Bacillus subtilis. Process Biochemistry, 41 (2): 343 – 349.
Konsoula, Z and Liakopoulou-Kyriakides, M. (2006 B). Thermostable α-amylase production by Bacillus subtilis entrapped in calcium alginate gel capsules. Enzyme and Microbial Technology, 39 (4): 690 – 696.
Konsoula, Z., & Liakopoulou-Kyriakides, M. (2007). Co-production of α-amylase and β-galactosidase by Bacillus subtilis in complex organic substrates. Bioresource Technology, 98(1), 150-157.
Koppar, A., & Pullammanappallil, P. (2008). Single-stage, batch, leach-bed, thermophilic anaerobic digestion of spent sugar beet pulp. Bioresource technology, 99(8), 2831-2839.
Kretchmer, N and Hollenbeck, CB. (1991). Sugar and Sweeteners, CRC Press, Inc.
Kristinsson, H. G., & Rasco, B. A. (2000). Fish protein hydrolysates: production, biochemical, and functional properties. Critical reviews in food science and nutrition, 40(1), 43-81.
Kroger, M, Meister, K and Kava, R. (2006). Low-calorie Sweeteners and Other Sugar Substitutes: A Review of the Safety Issues. Comprehensive Reviews in Food Science and Food Safety, 5 (2): 35 – 47.
295
Kuddus, M., Roohi, S & Ahmad, I. Z. (2012). Cold-active extracellular α-amylase production from novel bacteria Microbacterium foliorum GA2 and Bacillus cereus GA6 isolated from Gangotri glacier, Western Himalaya. Journal of Genetic Engineering and Biotechnology, 10(1), 151-159.
Kuhad, RC and Singh, A. (1993). Enhanced production of cellulases by penicillin citrinum in solid state fermentation of cellulosic residue. World Journal of Microbiology and Biotechnology, 9: 100 – 101.
Kumar, S and Satyanarayana, T. (2004). Statistical optimization of a thermostable and neutral glucoamylase production by a thermophilic mould Thermomucor indicae-seudaticae in solid-state fermentation. World Journal of Microbiology and Biotechnology. 20 (9): 895 – 902.
Kunamneni, A, Permaul, K, and Singh, S. (2005). Amylase production in solid state fermentation by the thermophilic fungus Thermomyces lanuginosus. Journal of Bioscience and Bioengineering, 100 (2): 168 – 171.
Kuppuswamy, S. (1961). Studies on the dehydration of tapioca. Food science, 11, 99.
Labeille, P, Baret, JL, Beaux, Y and Duchiron, F. (1997). Comparative study of wheat flour saccharification and ethanol production with two glucoamylase preparations. Industrial Crops and Products, 6 (3): 291 – 295.
Labeille, P., Baret, J. L., Beaux, Y., & Duchiron, F. (1997). Comparative study of wheat flour saccharification and ethanol production with two glucoamylase preparations. Industrial Crops and Products, 6(3), 291-295.
Labout, JJM. (1985). Conversion of Liquified Starch into Glucose using a Novel Glucoamylase System. Starch/Starke, 37(5): 157 – 161.
Lages, ACA and Tannenbaum, SR. (1978). Production of Glucose from Tapioca (Cassava Starch) and Farinha de Mandioca (Cassava Meal). 1978. Journal of Food Science, 43 (3): 1012 – 1014.
Lancaster, PA and Brooks, JE. (1983). Cassava leaves as human food. Economic Botany, 37 (3): 331 – 348.
Lancaster, PA, Ingram, JS, Lim, MY and Coursey, DG. (1982). Traditional Cassava–Based Foods: Survey of Processing Techniques. Economic Botany, 36 (1):12 – 45.
Larotonda, FDS, Matsul, KS, Paes, SS and Laurindo, JB. (2003). Impregnation of kraft paper with cassava-starch acetate – Analysis of the tensile strength, water absorption and water vapor permeability. Starch, 55 (2003): 504 – 510.

296
Larroche, C., Besson, I., & Gros, J. B. (1999). High pyrazine production by Bacillus subtilis in solid substrate fermentation on ground soy-beans. Process Biochemistry, 34 (6) 667 – 674.
Latham, MC. (1979). Human Nutrition in Tropical Africa. FAO Food and Nutrition Series, No. 11 Rev. 1 (Second edition). FAO, Rome.
Leach, H. W., & Schoch, T. J. (1961). Structure of the starch granule. II. Action of various amylases on granular starches. Cereal Chemistry, 38(1), 34-36.
Léotard, G, Duputié, A, Kjellberg, F, Douzery, EJ, Debain, C, de Granville, JJ and McKey, D. (2009). Phylogeography and the origin of cassava: new insights from the northern rim of the Amazonian basin. Molecular Phylogenetics and Evolution, 53 (1): 329.
Leung, WTW, Butrum, RR and Chang, FH. (1972). Proximate composition, mineral and vitamin contents of East Asian Foods. In: Food composition table for East Asia. US Government Printing Press. {Cited by Hohnholz, 1980}.
Liakopoulou-Kyriakides, M, Karakatsanis, A, Stamatoudis, M and Psomas, S. (2001). Synergistic Hydrolysis of Crude Corn Starch by -Amylases and Glucoamylases
of various origins. Cereal Chemistry, 78 (5): 603 – 607.
Limbach, H. J., & Kremer, K. (2006). Multi-scale modelling of polymers: perspectives for food materials. Trends in Food Science & Technology, 17(5), 215-219.
Lin, LL, Lo, HF, Chiang, WY, Hu, HY, Hsu, WH and Chang, CT. (2003). Replacement of methionine 208 in a truncated Bacillus sp. TS-23 α-amylase with oxidation-resistant leucine enhances its resistance to hydrogen peroxide. Current microbiology, 46 (3): 0211 – 0216.
Lin, Y., & Tanaka, S. (2006). Ethanol fermentation from biomass resources: current state and prospects. Applied microbiology and biotechnology, 69(6), 627-642.
Lindeboom, N., Chang, P. R., & Tyler, R. T. (2004). Analytical, biochemical and physicochemical aspects of starch granule size, with emphasis on small granule
starches: a review. Starch‐Stärke, 56(3‐4), 89-99.
Lindeman, LR and Rocchiccioli, C. (1979). Ethanol in Brazil: brief summary of the state of the industry in 1977. Biotechnology and Bioengineering. 21 (7): 1107 – 1119.
Linko, YY and Javanainen, P. (1996). Simultaneous liquefaction, saccharification and lactic acid fermentation on barley starch. Enzyme and Microbial Technology, 19 (2): 118 – 123.
Lindsay, H. (1973). A colorimetric estimation of reducing sugars in potatoes with 3, 5-dinitrosalicylic acid. Potato Research, 16(3), 176-179.

297
Linko, Y. Y., & Javanainen, P. (1996). Simultaneous liquefaction, saccharification, and lactic acid fermentation on barley starch. Enzyme and Microbial Technology, 19(2), 118-123.
Liu, X. D., & Xu, Y. (2008). A novel raw starch digesting α-amylase from a newly isolated Bacillus sp. YX-1: Purification and characterization. Bioresource Technology, 99(10), 4315-4320.
Lo, HF, Lin, LL, Chen, HL, Hsu, WH and Chang, CT. (2001). Enzymic properties of a SDS-resistant Bacillus sp. TS-23 α-amylase produced by recombinant Escherichia coli Process Biochemistry, 36 (8): 743 – 750.
López, A. C. B., Pereira, A. J. G., & Junqueira, R. G. (2004). Flour mixture of rice flour, corn and cassava starch in the production of gluten-free white bread. Brazilian Archives of Biology and Technology, 47(1), 63-70.
Lopez-Rubio, A., & Gilbert, E. P. (2009). Neutron scattering: a natural tool for food science and technology research. Trends in Food Science & Technology, 20(11), 576-586.
Lopez-Ulibarri, R and Hall, GM. (1997). Saccharification of Cassava flour starch in a hollow-fiber membrane reactor. Enzyme Microb. Technol., Vol. 21: 398 – 404.
Lowry, O. H., Rosebrough, N. J., Farr, A. L., & Randall, R. J. (1951). Protein measurement with the Folin phenol reagent. Journal of. Biological Chemistry, 193 (1), 265 - 275.
Lozano, JC, Byrne, D. and Bellotti, A. (1980). Cassava/ecosystem relationships and their influence on breeding strategy. Tropical Pest Management, 26 (2): 180 – 187.
Lu, MY, Maddox, IS and Brooks, JD. (1998).Application of a multi-layer packed-bed reactor to citric acid production in solid state fermentation using Aspergillus niger. Process Biochemistry, 33 (2): 117 – 123.
Lu, M. S., Fang, Y., Li, H., Liu, H., & Wang, S. (2010). Isolation of a novel cold-adapted amylase-producing bacterium and study of its enzyme production conditions. Annals of Microbiology, 60(3), 557-563.
Lu, Y., Ding, Y., & Wu, Q. (2011). Simultaneous saccharification of cassava starch and fermentation of algae for biodiesel production. Journal of Applied Phycology, 23(1), 115-121.
Lynam, J. (1994). Cassava safety and development. Acta Horticulturae, No. 375: 361 – 371.
Lynd, LR, Cushman, JH, Nichols, RJ and Wyman CE. (1991). Fuel ethanol from cellulosic biomass. Science, Vol. 251 Pp. 1318 – 1323.

298
Lynd, L. R., & Wang, M. Q. (2004). A Product‐Nonspecific Framework for Evaluating the
Potential of Biomass‐Based Products to Displace Fossil Fuels. Journal of Industrial Ecology, 7(3‐4), 17-32.
Lyons, TP. (1983). Alcohol – Power/Fuel. In: Industrial enzymology: the application of enzymes in industry. T. Godfrey & J. Reichelt, Editors. The Nature Press, Macmillan Publishers Ltd. Pp. 179 – 193.
MacAllister, RV. (1980). Manufacture of high fructose corn syrup using immobilized glucose isomerase. In: Wayne H Pitcher (Ed.) Immobilized Enzymes for Food Processing. CRC Press Inc. Boca Raton, Florida.
Madsen, GB, Norman, BE and Slott, S. (1973). A new heat stable bacterial amylase and its use in high temperature liquefaction. Starch/Starke, 25 (9): 304 – 308.
Maduagwu, E. N., & Oben, D. H. E. (1981). Effects of processing of grated cassava roots by the ‘screw press’ and by traditional fermentation methods on the cyanide content of gari. International Journal of Food Science & Technology, 16(3), 299-302.
Maduagwu, E. N., & Umoh, I. B. (1982). Detoxification of cassava leaves by simple traditional methods. Toxicology Letters, 10(2-3), 245-248.
Maeda, H, Kajiwara, S and Araujo, NQ. (1982). The Separation of Solids from the Liquefied Mash of Cassava Tuber and Continuous Saccharification by Immobilized Glucoamylase. European Journal of Applied Microbiology and Biotechnology, 16 (2-3), 92 – 98.
Mahler, HR and Cordes, EH. (1966). Biological Chemistry. Second Edition. Harper and Row Publishers, New York.
Mahungu, NM. (1994). Relationships between cyanogenic potential of cassava and other agronomic traits. Acta Horticulturae, No. 375: 125 – 129.
Mahungu, NM, Yamaguchi, Y, Almazan, AM and Kahn, SK. (1987). Reduction of cyanide during processing of cassava into some traditional African foods. Journal of Food and Agriculture, 1(1-3): 11 – 15.
Manjunath, P., Shenoy, B. C., & Raghavendra Rao, MR. (1983). Fungal glucoamylases. Journal of Applied Biochemistry, 5 (4-5), 235 – 260.
Manners, D. J. (1989). Recent developments in our understanding of amylopectin structure. Carbohydrate Polymers, 11(2), 87-112.
Marquez Moreno, MC and Fernandez Cuadrado, V. (1993). Enzymic hydrolysis of vegetable proteins: mechanism and kinetics. Process Biochemistry, 28(7), 481-490.

299
Marshall, RO and Kooi, ER. (1957). Enzymatic conversion of D-Glucose to D-Fructose. Science, New Series, 125 (3249): 648 – 649.
Martin, AM. Editor. 1998. Bioconversion of Waste Materials to Industrial Products. Second Edition. Blackie Academic and Professional Publishers.
Martínez‐Bustos, F., Amaya‐Llano, S. L., Carbajal‐Arteaga, J. A., Chang, Y. K., &
Zazueta‐Morales, J. D. J. (2007). Physicochemical properties of cassava, potato and jicama starches oxidised with organic acids. Journal of the Science of Food and Agriculture, 87(7), 1207-1214.
Matsumoto, M, Fukushi, O, Miyanaga, M, Kakihara, K, Nakagima, E and Yoshizumi, M. (1982). Industrialization of a non-cooking system for alcoholic fermentation from grains. Agricultural and biological chemistry, 46, 1549 – 1558.
Mayo Clinic. (2013). Gluten-free diet: What's allowed, what's not. http://www.mayoclinic.com/health/gluten-free-diet/my01140 [Accessed 19th October 2013].
McFarlane, JA. (1982). Cassava storage Part 2: Storage of dried cassava products. Tropical science. 24 (4): 205 – 236.
McWilliams, M. (2001). Foods: Experimental Perspectives, 4th Edition. Upper Saddle River, NJ.
Medeiros, A. B., Pandey, A., Christen, P., Fontoura, P. S., de Freitas, R. J., & Soccol, C. R. (2001). Aroma compounds produced by Kluyveromyces marxianus in solid state fermentation on a packed bed column bioreactor. World Journal of Microbiology and Biotechnology, 17(8), 767-771.
Medical Ecology. (2004). Corn. http://www.MedicalEcology.org/food/grain/f_corn.htm [Accessed 03/13/2010].
Megazyme International. 2011. Megazyme total starch assay procedure (Amyloglucosidase/ -Amylase Method). Megazyme International Ireland Limited.
Menezes, TJB. (1978). Saccharification of Cassava for Ethyl Alcohol Production. Process Biochemistry. 13 (9): 24 – 26.
Menezes, TJB. (1982). Starchy Materials for Alcohol Fuel Production. Process Biochemistry, 17 (3): 32 – 35.
Menezes, TJB, Arakaki, T, Delamo, PR and Sales, AM. (1978). Fungal Cellulases as an Aid for the Saccharification of Cassava. Biotechnology and Bioengineering, 20 (4): 555 – 565.
Meuser, F., & Smolnik, H. D. (1980). Processing of cassava to gari and other foodstuffs. Starch‐Stärke, 32(4), 116-122.

300
Michelena, VV and Castillo, FJ. (1984). Production of amylase by Aspergillus foetidus on rice flour medium and characterization of the enzyme. Journal of Applied Bacteriology, 56 (3): 390 – 407.
Mielenz, J. R. (2001). Ethanol production from biomass: technology and commercialization status. Current opinion in microbiology, 4(3), 324-329.
Miller, GL. (1959). Use of Dinitrosalicylic Acid Reagent for Determination of Reducing Sugar. Analytical Chemistry, 31 (3): 426 – 428.
Miller, G. L., Blum, R., Glennon, W. E., & Burton, A. L. (1960). Measurement of carboxymethylcellulase activity. Analytical Biochemistry, 1(2), 127-132.
Mitchell, D. A., Pandey, A., Sangsurasak, P., & Krieger, N. (1999). Scale-up strategies for packed-bed bioreactors for solid-state fermentation. Process Biochemistry, 35(1), 167-178.
Mitchell, D. A., Krieger, N., Stuart, D. M., & Pandey, A. (2000). New developments in solid-state fermentation: II. Rational approaches to the design, operation and scale-up of bioreactors. Process Biochemistry, 35(10), 1211-1225.
Mitchell, D. A., Cunha, L. E. N., & Machado, A. V. L. (2010). A model-based investigation of the potential advantages of multi-layer packed beds in solid-state fermentation. Biochemical Engineering Journal, 48(2), 195-203.
Mlingi, N., Kimatta, S., & Rosling, H. (1991). Konzo, a paralytic disease observed in southern Tanzania. Tropical Doctor, 21(1), 24 – 25.
Mlingi, NLV, & Bainbridge, Z. (1994). Reduction of cyanogen levels during sun-drying of cassava in Tanzania. In: International Workshop on Cassava Safety. Acta Horticulturae, No. 375. Pp 233 – 240.
Mlingi, N. L. V., Bainbridge, Z. A., Poulter, N. H., & Rosling, H. (1995). Critical stages in cyanogen removal during cassava processing in southern Tanzania. Food Chemistry, 53(1), 29-33.
Mobini-Dehkordi, M., & Javan, F. A. (2012). Application of alpha-amylase in biotechnology. Journal of Biology, 1(1), 39-50.
Molinero, V., Çagin, T., & Goddard, W. A. (2004). Mechanisms of nonexponential relaxation in supercooled glucose solutions: The role of water facilitation. The Journal of Physical Chemistry A, 108(17), 3699-3712.
Monma, M, Yamamoto, Y, Kagei, N, and Kainuma, K. (1989). Raw Starch Digestion by -Amylase and Glucoamylase from Chalara paradoxa. Starch/Starke, 41 (10):
382 – 385.
Montgomery, DC. (2009). Design and analysis of experiments. John Wiley & Sons Inc.

301
Moore, PC. (1976). The utilization of cassava forage in ruminant feeding. International Seminar on Tropical Livestock Products, 8 – 12 March, Acapulco, Mexico, 21p. http://ciat-library.ciat.cgiar.org/ciat_digital/CIAT/63435.pdf Accessed 05/30/2013.
Moorthy, SN. (1985). Acetylation of cassava starch using perchloric acid catalysis. Starch, 37(9): 307 – 308.
Moorthy, S. N. (2002). Physicochemical and functional properties of tropical tuber
starches: a review. Starch‐Stärke, 54(12), 559-592.
Mowat, L. (1989). Cassava and Chicha. Bread and Beer of the Amazonian Indians. Shire publications Ltd. Aylesbury, Bucks, UK.
Muller dos Santos, M., Souza da Rosa, A., Dal'Boit, S., Mitchell, D. A., & Krieger, N. (2004). Thermal denaturation: is solid-state fermentation really a good technology for the production of enzymes?. Bioresource Technology, 93(3), 261-268.
Murado, MA, González, MP, Torrado, A and Pastrana, L. M. (1997). Amylase production by solid state culture of Aspergillus oryzae on polyurethane foams. Some mechanistic approaches from an empirical model. Process Biochemistry, 32 (1), 35 – 42.
Murakami, S., Nishimoto, H., Toyama, Y., Shimamoto, E., Takenaka, S., Kaulpiboon, J. & Aoki, K. (2007). Purification and Characterization of Two Alkaline, Thermotolerant. ALPHA.-Amylases from Bacillus halodurans 38C-2-1 and Expression of the Cloned Gene in Escherichia coli. Bioscience, Biotechnology, and Biochemistry, 71(10), 2393-2401.
Muzanila, YC, Brennan, JG and King, RD. (2000). Residual cyanogens, chemical composition and aflatoxins in cassava flour from Tanzanian villages. Food Chemistry, 70 (1): 45 – 49.
Muzondo, MI and Zvauya, R. (1995). Solid state fermentation of cassava flour: Protein enrichment and cyanide degradation. Food Science and Technology Challenges for Africa Towards the Year 2000, Proceedings of the ESCA-FOST Food Science and Technology Conference. 12 – 16 September, 1994. Harare, Zimbabwe. Pp. 176 – 183. FT Marovatsanga and JRN Taylor, editors. Sebri Printers.
Nabors, LO. (2001). American Sweeteners. Pp. 374 – 375.
Nakamura, IM and Park, YK. (1975). Some physic-chemical properties of fermented cassava starch. Starch, 27 (9): 295 – 297.
Nambisan, B. (1994). Evaluation of the effect of various processing techniques on cyanogen content reduction in Cassava. Acta Horticulturae, No. 375: 193 – 201.

302
Nambisan, B. (2011). Strategies for elimination of cyanogens from cassava for reducing toxicity and improving food safety. Food and Chemical Toxicology, 49(3), 690-693.
Nambisan, B., & Sundaresan, S. (1985). Effect of processing on the cyanoglucoside content of cassava. Journal of the Science of Food and Agriculture, 36(11), 1197-1203.
Nanda, SK and Potty, VP. (1985). Evaluation of packaging materials for storage of cassava starch. Journal of root crops. 11 (1 & 2): 45 – 50.
Nanda, SK, Balagopalan, C, Padmaja, G, Moorthy, SN and Sajeev, MS. (2002). Post-harvest management of cassava for industrial utilization in India. In: 7th Regional Cassava Workshop: Sustainable cassava production system in Asia. 28th October – 1st November 2002, Bangkok, Thailand. International Center for Tropical Agriculture (CIAT). Pp. 564 – 581.
Nartey, F. (1968). Studies on cassava, Manihot utilissima Pohl—I. Cyanogenesis: The biosynthesis of linamarin and lotaustralin in etiolated seedlings. Phytochemistry, 7(8), 1307-1312.
Nartey, F. (1978). Manihot Esculenta (Cassava): Cyanogenesis, Ultrastructure and Seed Germination. 1st Edition. D. Sc. Thesis, University of Copenhagen, Denmark. Munksgaard.
Nassar, N and Ortiz, R. (2010). Breeding Cassava to Feed the Poor. Scientific American, Vol. 302: 78 – 84. doi:10.1038/scientificamerican0510-78 http://www.nature.com/scientificamerican/journal/v302/n5/full/scientificamerican0510-78.html {Also available at http://stopogm.net/webfm_send/249} Accessed 05/31/2013.
Nelson, DL and Cox MM. (2008). Lehninger Principles of Biochemistry. Fifth Edition. W. H. Freeman and Company, New York.
Ngudi, D. D., Kuo, Y. H., & Lambein, F. (2003). Cassava cyanogens and free amino acids in raw and cooked leaves. Food and Chemical Toxicology, 41(8), 1193-1197.
Nguyen, QD, Rezessy-Szabó, JM, Claeyssens, M, Stals, I and Hoschke, A. (2002). Purification and characterisation of amylolytic enzymes from thermophilic fungus Thermomyces lanuginosus strain ATCC 34626. Enzyme Microbiology and Technology, 31 (3): 345 – 352.
Niehaus, F, Bertoldo, C, Kähler, M and Antranikian, G. (1999). Extremophiles as a source of novel enzymes for industrial application. Applied Microbiology and Biotechnology, 51 (6): 711 – 729.
303
Nigam, P. S., & Singh, A. (2011). Production of liquid biofuels from renewable resources. Progress in Energy and Combustion Science, 37(1), 52-68.
Norouzian, D., Akbarzadeh, A., Scharer, J. M., & Moo Young, M. (2006). Fungal glucoamylases. Biotechnology Advances, 24(1), 80-85.
Nweke, FI and Bokanga, M. (1994). Importance of cassava processing for production in Sub-Saharan Africa. Acta Horticulturae, No. 375: 401 – 412.
Nwokocha, L. M., Aviara, N. A., Senan, C., & Williams, P. A. (2009). A comparative study of some properties of cassava (Manihot esculenta, Crantz) and cocoyam (Colocasia esculenta, Linn) starches. Carbohydrate Polymers, 76(3), 362-367.
Nye, MM. (1991). The Mis-measure of manioc (Manihot esculenta, Euphorbiaceae). Economic Botany, 45 (1): 47 – 57.
O'Brien, G. M., Mbome, L., Taylor, A. J., & Poulter, N. H. (1992). Variations in cyanogen content of cassava during village processing in Cameroon. Food Chemistry, 44(2), 131-136.
O’Hair, SK (1995). Cassava. New Crop Factsheet. Purdue University, Center for New Crops and Plant Products. http://www.hort.purdue.edu/newcrop/CropFactSheets/cassava.html Accessed 02/15/2010
O’Hair, SK, Forbes, RB, Locascio, SJ, Rich, JR and Stanley, RL. (1983). Starch and Glucose Distribution within Cassava Roots as Affected by Cultivar and Location. Journal of Horticultural Science, 18 (5): 735 – 737.
Oke, OL. (1994). Eliminating cyanogens from cassava through processing: Technology and tradition. In: Bokanga et al., Editors. International workshop on cassava safety. Ibadan, Nigeria, 1st – 4th March 1994. Acta Horticulturae, No. 375, Pp. 163 – 174.
Okigbo, BN. (1980). Nutritional implications of projects giving high priority to the production of staples of low nutritive quality: The case for Cassava (Manihot esculenta, Crantz) in the Humid Tropics of West Africa. Food and Nutrition Bulletin, 2 (4): 1 – 10.
Olomo, V and Ajibola, O. (2003). Processing factors affecting the yield and physicochemical properties of starch from cassava chips and flour. Starch, 55, 476 – 481.
Olorunda, A. O., Aworh, O. C., & Numfor, F. A. (1981). Technical note: predicting quality of cassava products with the aid of chemical and rheological properties. International Journal of Food Science & Technology, 16(4), 447-450.

304
Olsen, KM and Schaal, BA. (1999). Evidence on the origin of Cassava: phylogeography of Manihot esculenta. Proceedings of the National Academy of Sciences of the USA, 96 (10): 5586 – 5591.
Olsen, K M, and Schaal, BA. (2001). Microsatellite variation in cassava (Manihot esculenta, Euphorbiaceae) and its wild relatives: further evidence for a southern Amazonian origin of domestication. American Journal of Botany, 88 (1): 131 – 142.
Olson, HS. (1995). Enzymatic production of glucose syrups. In: MW Kearsley and SZ Dziedzic (Eds.). Handbook of starch Hydrolysis Products and their Derivatives. Blackie Academic & Professional. London.
Onabolu, A, Abass, A and Bokanga, M. (1998). New food products from cassava. International Institute of Tropical Agriculture (IITA), Ibadan, Nigeria.
Ostergaard, J and Knudsen, SL. (1976). Use of sweetzyme in industrial continuous isomerization of various process alternatives and corresponding product types. Starch, 28 (10): 350 – 356.
Osuntokun, B. O., Aladetoyinbo, A., & Adeuja, A. O. G. (1970). Free-cyanide levels in tropical ataxic neuropathy. The Lancet, 296(7668), 372-373.
Osuntokun, BO. (1973). Ataxic Neuropathy Associated with High Cassava Diets in West Africa. In: Chronic Cassava Toxicity, Proceedings of an interdisciplinary workshop. London, England, 29 – 30 January, 1973. B. Nestle and R. MacIntyre, Editors. International Development Research Centre (IDRC), Ottawa, Canada. Pp. 127-138.
Osunsami, AT, Akingbala, JO and Oguntimein, GB. (1989). Effect of storage on starch content and modification of cassava starch. Starch. 41 (2): 54 – 57.
Ott, RL and Longnecker, M (2010). An introduction to statistical methods and data analysis, Sixth Edition. Brooks/Cole, Cengage Learning.
Oyeleke, S. B., & Oduwole, A. A. (2009). Production of amylase by bacteria isolated from a cassava waste dumpsite in Minna, Niger State, Nigeria. African Journal of Microbiology Research, 3(4): 143 – 146.
Oyenuga, VA. (1955). The composition and nutritive value of certain feedingstuffs in Nigeria I. Roots, Tubers, and Green Leaves. Empire Journal of Experimental Agriculture, 23 (90): 81 – 95.
Padmaja, G. (1989). Evaluation of techniques to reduce assayable tannin and cyanide in cassava leaves. Journal of Agricultural and Food Chemistry, 37(3), 712-716.
Palmer, TJ. (1975). Glucose Syrups in Food and Drink. Process Biochemistry, 10 (10): 19 – 20.

305
Pandey, A. (1992). Recent process developments in solid-state fermentation. Process Biochemistry, 27 (2): 109 – 117.
Pandey, A. (2003). Solid-state fermentation. Biochemical Engineering Journal, 13 (2): 81 – 84.
Pandey, A., Selvakumar, P., & Ashakumary, L. (1996). Performance of a column bioreactor for glucoamylase synthesis by Aspergillus niger in SSF. Process Biochemistry, 31(1), 43-46.
Pandey, A, Soccol, CR, Nigam, P, Soccol, VT, Vandenberghe, LPS and Mohan, R. (2000 A). Biotechnological potential of agro-industrial residues. II: Cassava bagasse. Bioresource Technology, 74 (1): 81 – 87.
Pandey, A., Nigam, P, Soccol, CRVT, Soccol, V, Singh, D and Mohan, R. (2000 B). Advances in microbial amylases. Biotechnology and Applied Biochemistry, 31: 135 – 152.
Paolucci-Jeanjean, D, Belleville, MP, Zakhia, N and Rios GM. (2000). Kinetics of Cassava Starch Hydrolysis with Termamyl Enzyme. Biotechnology and Bioengineering, 68 (1): 71 – 77.
Parawira, W, Murto, M, Read, JS and Mattiasson, B. (2005). Profile of hydrolases and biogas production during two-stage mesophilic anaerobic digestion of solid potato waste. Process Biochemistry, 40 (9), 2945 – 2952.
Parker, BL and Booth, RH. (1979). Storage of cassava chips (Manihot esculenta). Insect infestation and damage. Experimental Agriculture, 15 (2): 145 – 151.
Pastore, G. M., Park, Y. K., & Min, D. B. (1994). Production of fruity aroma by Neurospora from beiju. Mycological Research, 98(11), 1300-1302.
Pengthamkeerati, P, Numsomboon, S, Satapanajaru, T and Chairattanamanokorn, P. (2012). Production of a-Amylase by Aspergillus oryzae from Cassava Bagasse and Wastewater Sludge Under Solid-State Fermentation. Environmental Progress & Sustainable Energy, 31 (1): 122 – 129.
Pereira, JF, Seigler,DS and Splittstoesser, WE. (1981). Cyanogenesis in sweet and bitter cultivars of cassava [Cyanide toxicity]. HortScience, 16 (6): 776 – 777.
Pérez, S., & Bertoft, E. (2010). The molecular structures of starch components and their contribution to the architecture of starch granules: A comprehensive review. Starch‐Stärke, 62(8), 389-420.
Pestana, F., & Castillo, F. J. (1985). Glucoamylase production by Aspergillus awamori on rice flour medium and partial characterization of the enzyme. MIRCEN Journal of Applied Microbiology and Biotechnology, 1(3), 225-237.

306
Phillips, TP. (1982). An Overview of Cassava Consumption and Production. In Cassava toxicity and thyroid; research and public health issues; proceedings of a workshop held in Ottawa, Canada, 31 May – 2 June 1982. International Development Research Centre (IDRC) Monograph 207e, Pp 83 – 88. F Delange and R Ahluwalia, Editors. IDRC, Ottawa, Canada.
Phillips, TP, Taylor, DS, Sanni, L and Akoroda, MO. (2004). The Global Cassava Development Strategy. A cassava industrial revolution in Nigeria: The potential for a new industrial crop. International Fund for Agricultural Development [IFAD], Food and Agricultural Organization of the United Nations [FAO], Rome.
Plastipedia. (2011). Bio-based Plastics: Feedstocks, Production and the UK Market. http://www.bpf.co.uk/plastipedia/polymers/biobased_plastics_feedstocks_production_and_the_uk_market.aspx [Assessed Wednesday 1st June 2011].
Platt, BS. (1962). Tables of representative values of foods commonly used in tropical countries. London. HMSO, Medical Research Council. Special Report Series No. 302. {Cited by Latham, 1979}.
Polematidis, I., Koppar, A., Pullammanappallil, P., & Seaborn, S. (2008). Biogasification of sugarbeet processing by-products. Sugar Industry/Zuckerindustrie, 133(5), 323-329.
Pomeranz, Y, Rubenthaler, GL and Finney, KF. (1964). Use of Amyloglucosidase in Breadmaking. Food Technology, 18 (10): 138 – 140.
Pothiraj, C., Balaji, P., & Eyini, M. (2006). Enhanced production of cellulases by various fungal cultures in solid state fermentation of cassava waste. African Journal of Biotechnology, 5(20).
Prakash, B., Vidyasagar, M., Madhukumar, M. S., Muralikrishna, G., & Sreeramulu, K. (2009). Production, purification, and characterization of two extremely halotolerant, thermostable, and alkali-stable α-amylases from Chromohalobacter sp. TVSP 101. Process Biochemistry, 44(2), 210-215.
Prazeres, DMF and Cabral, JMS. (1994). Enzymatic membrane bioreactors and their applications. Enzyme Microb. Technol., Vol. 16 (September 1994): 738 – 750.
Priest, F. G. (1984). Extracellular enzymes (pp. 51-62). Washington, DC: American Society for Microbiology. [Also: Priest, F. G., (1984). Extracellular Enzymes. Molly Millars Lanes, Wokingham , Berkshire, England.]
Pullammanappallil, P. (2013). Closed-loop, energy-efficient biofuel production. Resource Engineering and Technology for a Sustainable World, 20 (4): 16 – 17.
PUROLITE. (2007). Corn Sweetener refining with ion exchange resins. The Purolite Company. 150 Monument Road, Bala Cynwyd, Pa 19004, USA.

307
Radley, JA. 1940. Starch and its derivatives. D. Van Nostrand Company, Inc., New York.
Ragauskas, A. J., Williams, CK, Davison, BH, Britovsek, G, Cairney, J, Eckert, CA, Frederick, WJ, Hallet, JP, Leak, DJ, Liotta, CL, Mielenz, JR, Murphy, R,Templer, and Tschaplinski, T. (2006). The path forward for biofuels and biomaterials. Science, 311 (5760): 484-489.
Raghavarao, K. S. M. S., Ranganathan, T. V., & Karanth, N. G. (2003). Some engineering aspects of solid-state fermentation. Biochemical Engineering Journal, 13(2), 127-135.
Rahardjo, Y. S., Weber, F. J., Haemers, S., Tramper, J., & Rinzema, A. (2005). Aerial mycelia of Aspergillus oryzae accelerate α-amylase production in a model solid-state fermentation system. Enzyme and microbial technology,36 (7), 900-902.
Rajagopalan, G and Krishnan, C. (2008). α-Amylase production from catabolite depressed Bacillus subtilis KCC103 utilizing sugarcane bagasse hydrolysate. Bioresource Technology, 99 (8): 3044 – 3050.
Rajendran, PG, Ravindran, CS, Nair, SG and Nayar, TVR. (2000). True cassava seeds (TCS) for rapid spread of the crop in non-traditional areas. Central Tuber Crops Research Institute (Indian Council of Agricultural Research), Thiruvananthapuram, Kerala, India. [Cited by Ceballos et al., 2004].
Rajendran, PG, Mohan, C, and Sreekumar, J. (2005). Standardisation of true cassava seed (TCS) programme with special emphasis on more homogeneous, CMD resistant progenies. Euphytica, 142 (1 - 2): 13 – 22.
Rajoka, M. I., & Yasmeen, A. (2005). Induction, and production studies of a novel glucoamylase of Aspergillus niger. World Journal of Microbiology and Biotechnology, 21(2), 179-187.
Ramadas, M., Holst, O., & Mattiasson, B. (1996). Production of amyloglucosidase by Aspergillus niger under different cultivation regimens. World Journal of Microbiology and Biotechnology, 12(3), 267-271.
Rama Mohan Reddy, P., Ramesh, B., Mrudula, S., Reddy, G., & Seenayya, G. (2003). Production of thermostable β-amylase by Clostridium thermosulfurogenes SV2 in solid-state fermentation: Optimization of nutrient levels using response surface methodology. Process Biochemistry, 39 (3), 267-277.
Rasiah, IA and Rehm, BH. (2009). One-step production of immobilized α-amylase in recombinant Escherichia coli. Applied and environmental microbiology, 75 (7): 2012 – 2016.

308
Rašper, V. (1969). Investigations on starches from major starch crops grown in Ghana I.—Hot paste viscosity and gel‐forming power. Journal of the Science of Food and Agriculture, 20(3), 165-171.
Rasper, V., Perry, G., & Duitschaever, C. L. (1974). Functional properties of non-wheat flour substitutes in composite flours. II. Amylolytic susceptibility of non-wheat starches. Canadian Institute of Food Science and Technology Journal, 7(3), 166-174.
Rattanachomsri, U, Tanapongpipat, S, Eurwilaichitr, L and Champreda, V. (2009). Simultaneous non-thermal saccharification of cassava pulp by multi-enzyme activity and ethanol fermentation by Candida tropicalis. Journal of Bioscience and Bioengineering, 107 (5): 488 – 493.
Ravindran, V. (1992). Preparation of cassava leaf products and their use as animal feeds. Roots, tubers, plantains and bananas in animal feeding. FAO Animal Production and Health Paper, (95).
Ravindran, V. (1993). Cassava leaves as animal feed: potential and limitations. Journal of the Science of Food and Agriculture, 61 (2): 141 – 150.
Reddy, OVS and Basappa, SC. (1996). Direct fermentation of cassava starch to ethanol by mixed cultures of Endomycopsis fibuligera and Zymomonas mobilis; synergism and limitations. Biotechnology Letters, 18 (11): 1315 – 1318.
Reichelt, JR. (1983). Starch. In: Industrial enzymology: the application of enzymes in industry. T. Godfrey & J. Reichelt, Editors. The Nature Press, Macmillan Publishers Ltd. Pp. 375 – 396.
Renewable Energy Policy Network for the 21st Century. (2011). Renewables 2011 Global Status Report. UNEP, Paris, France.
ReportLinker. (2009). World Enzyme Market. http://www.slideshare.net/ReportLinker/world-enzyme-market Assessed Wednesday 1st June 2011.
Rickard, JE, Asaoka, M and Blanshard, JMV. (1991). The physico- chemical properties of cassava starch. Tropical Science, 31 (2): 189 – 207.
Rickard, J. E., & Behn, K. R. (1987). Evaluation of acid and enzyme hydrolytic methods for the determination of cassava starch. Journal of the Science of Food and Agriculture, 41(4), 373-379.
Ring, S. G., Gee, J. M., Whittam, M., Orford, P., & Johnson, I. T. (1988). Resistant starch: Its chemical form in foodstuffs and effect on digestibility in vitro. Food Chemistry, 28(2), 97-109.

309
Roa, AC, Chavarriaga-Aguirre, P, Duque, M C, Maya, MM, Bonierbale, MW, Iglesias, C, and Tohme, J. (2000). Cross-species amplification of cassava (Manihot esculenta) (Euphorbiaceae) microsatellites: allelic polymorphism and degree of relationship. American Journal of Botany, 87 (11): 1647 – 1655.
Robertson, GL. (2006). Food Packaging: Principles and Practice. Second Edition. CRC, Taylor & Francis.
Roberts, SM, Turner, NJ, Willets, AJ and Turner, MK. (1995). Introduction to biocatalysis using enzymes and microorganisms. Cambridge University Press.
Robinson, T and Nigam, P. (2003). Bioreactor design for protein enrichment of agricultural residues by solid state fermentation. Biochemical Engineering Journal, 13 (2) 197 – 203.
Rogers, DJ. (1965). Some botanical and ethnological considerations of Manihot esculenta. Economic Botany, 19 (4): 369 – 377.
Rogers, DJ and Appan, SG. (1973). Flora neotropica monograph no. 13. Manihot, Manihotoides (Euphorbiaceae). New York: Heffner 275p. Illustrations, portraits, dot maps.
Rolland-Sabaté, A., Sánchez, T., Buléon, A., Colonna, P., Jaillais, B., Ceballos, H., & Dufour, D. (2012). Structural characterization of novel cassava starches with low and high-amylose contents in comparison with other commercial sources. Food Hydrocolloids, 27(1), 161-174.
Rosenthal, F. R. T., Nakamura, T., Espindola, A. M. C., & Jochimek, M. R. (1974). Structure of starch granules. Part 3. Some considerations on leguminosae and
tuberosae. Starch‐Stärke, 26(2), 50-56.
Roses, RP and Guerra, NP. (2009). Optimization of amylase production by Aspergillus niger in solid-state fermentation using sugarcane bagasse as solid support material. World Journal of Microbiology and Biotechnology, 25 (11): 1929 – 1939.
Rosling, H. (1988). Cassava toxicity and food security: A review of health effects of cyanide exposure from cassava and of ways to prevent such effects. Uppsala: International Child Health Unit. Uppsala University, 40pp (Cited by Lynam, 1994).
Ross, J. (2012). Attieke, a “new” staple. Minnesota Monthly, Monday 17th September 2012. http://www.minnesotamonthly.com/media/Blogs/Twin-Cities-Taste/September-2012/Attieke-a-New-Staple/ [Accessed Friday 13th September 2013].
310
Rouse, AH and Atkins, CD. (1955). Pectinesterase and pectin in commercial citrus Juices as determined by methods used at the citrus experiment station. Technical Bulletin 570, University of Florida Agricultural Experiment Stations. Beckenbach, JR, Director. http://ufdc.ufl.edu/UF00027100/00001/print?options=0JJ* Accessed 08/02/2012.
Rudolf, A, Alkasrawi, M, Zacchi, G and Lidén, G. (2005). A comparison between batch and fed-batch simultaneous saccharification and fermentation of steam pretreated spruce. Enzyme and Microbial Technology, 37 (2): 195 – 204.
Rudrappa, U. (2013). Cassava nutrition facts and health benefits - Nutrition and You. http://www.nutrition-and-you.com/cassava.html [Accessed 19th October 2013].
Ruijter, G. J., Visser, J., & Rinzema, A. (2004). Polyol accumulation by Aspergillus oryzae at low water activity in solid-state fermentation. Microbiology, 150 (4): 1095-1101.
Ruiz, MI, Sanchez, CI, Torrres, RG and Molina, DR. (2011). Enzymatic Hydrolysis of Cassava Starch for Production of Bioethanol with a Colombian Wild Yeast Strain. Journal of Brazilian Chemical Society, 22 (12): 2337 – 2343.
Sahir, A. H., Kumar, S., & Kumar, S. (2007). Modeling of a packed bed solid-state fermentation bioreactor using the N-tanks in series approach. Biochemical Engineering Journal, 35(1), 20-28.
Sahnoun, M., Bejar, S., Sayari, A., Triki, M. A., Kriaa, M., & Kammoun, R. (2012). Production, purification and characterization of two α-amylase isoforms from a newly isolated Aspergillus Oryzae strain S2. Process Biochemistry, 4(1), 18-25.
Sambatti, JBM, Martins, PS and Ando, A. (2001). Folk taxonomy and evolutionary dynamics of cassava: a case study in Ubatuba, Brazil. Economic Botany, 55 (1): 93 – 105.
Samie, N., Reddy, P. R., & Ashouri, M. (2012). Novel extracellular hyper acidophil and
thermostable α‐amylase from Micrococcus sp. NS 211. Starch‐Stärke, 64(2), 136-144.
Sanchez, H. D., Osella, C. A., & Torre, M. D. L. (2002). Optimization of Gluten‐Free Bread Prepared from Cornstarch, Rice Flour, and Cassava Starch. Journal of Food Science, 67(1), 416-419.
Sánchez, T., Salcedo, E., Ceballos, H., Dufour, D., Mafla, G., Morante, N., ... & Moreno, I. X. (2009). Screening of starch quality traits in cassava (Manihot esculenta Crantz). Starch‐Stärke, 61(1), 12-19.

311
Sandhu, K. S., & Singh, N. (2007). Some properties of corn starches II: Physicochemical, gelatinization, retrogradation, pasting and gel textural properties. Food Chemistry, 101(4), 1499-1507.
Sanguansri, P., & Augustin, M. A. (2006). Nanoscale materials development–a food industry perspective. Trends in Food Science & Technology, 17(10), 547-556.
Sani, A., Awe, F. A., & Akinyanju, J. A. (1992). Amylase synthesis in Aspergillus flavus and Aspergillus niger grown on cassava peel. Journal of Industrial Microbiology, 10 (1): 55-59.
Santisopasri, V., Kurotjanawong, K., Chotineeranat, S., Piyachomkwan, K., Sriroth, K., & Oates, C. G. (2001). Impact of water stress on yield and quality of cassava starch. Industrial Crops and Products, 13 (2): 115 – 129.
Sassner, P, Galbe, M and Zacchi, G. (2006). Bioethanol production based on simultaneous saccharification and fermentation of steam-pretreated Salix at high dry-matter content. Enzyme and Microbial Technology, 39 (4): 756 – 762.
Satyanarayana, T, Noorwez, SM, Kumar, S, Rao, JLUM, Ezhilvannan, M and Kaur, P. (2004). Development of an ideal starch saccharification process using amylolytic enzymes from thermophiles. Biochemical Society Transactions, 32 (Part 2): 276 – 278.
Saxena, R and Singh, R. (2011). Amylase production by solid-state fermentation of agro-industrial wastes using Bacillus sp. Brazilian Journal of Microbiology, 42(4), 1334 – 1342.
Scheidegger, AE. (1974).The physics of flow through porous media. Third Edition. University of Toronto Press.
Schiavone, DF, Teixeira, AA, Bucklin, RA and Sargent, SA. (2013). Design and performance evaluation of a solar convection dryer for drying tropical fruit. Applied Engineering in Agriculture, 29 (3): 391 – 401.
Searchinger, T., Heimlich, R., Houghton, R. A., Dong, F., Elobeid, A., Fabiosa, J., ... & Yu, T. H. (2008). Use of US croplands for biofuels increases greenhouse gases through emissions from land-use change. Science, 319 (5867): 1238-1240.
Segretain, C., Bories, A., Grassi, G., Delmon, B., Molle, J. F., & Zibetta, H. (1987). Fermentative trends and cyanide effects during anaerobic digestion of cassava by-products. In Biomass for energy and industry. 4th EC conference. Proceedings of the international conference, Orléans, France, 11-15 May, 1987. (pp. 808-813). Elsevier Applied Science Publishers Ltd.
Seibel, W., & Hu, R. (1994). Gelatinization characteristics of a cassava/corn starch based blend during extrusion cooking employing response surface methodology.
Starch‐Stärke, 46(6), 217-224.

312
Seigler, D. S., & Pereira, J. F. (1981). Modernized preparation of casave in the Ilanos orientales of Venezuela. Economic Botany, 35(3), 356-362.
Selvakumar, P., Ashakumary, L., & Pandey, A. (1998). Biosynthesis of glucoamylase from Aspergillus niger by solid-state fermentation using tea waste as the basis of a solid substrate. Bioresource technology, 65(1), 83-85.
Shamala, TR and Sreekantiah, KR. (1986). Saccharification of Tapioca Starch Residue with a Multienzyme Preparation of Aspergillus ustus. Starch/Starke, 38 (12): 428 – 432.
Shariffa, Y. N., Karim, A. A., Fazilah, A., & Zaidul, I. S. M. (2009). Enzymatic hydrolysis of granular native and mildly heat-treated tapioca and sweet potato starches at sub-gelatinization temperature. Food Hydrocolloids, 23(2), 434-440.
Shetty, JK, Chotani, G, Gang, D and Bates, D. (2007). Cassava as an alternative feedstock in the production of renewable transportation fuel. International Sugar Journal, 109 (1307): 663 – 677.
Shevel’kova, AN and Sinitsyn, AP. (1993). A study of the synergistic action of -
Amylase and Glucoamylase on soluble and insoluble amylose. Biochemistry (Moscow), 58 (10): 1548 – 1554.
Shivakumar, S. (2012). Co-production of alkaline protease and amylase of Bacillus sp Y in solid state cultivations. Research Journal of Biotechnology Vol, 7, 2.
Shuler, M., and F. Kargi. (2002). Part 3.3 Enzyme kinetics. In Bioprocess Engineering. Basic Concepts, 62-75. Intl. Series in the Physical and Chemical Engineering Sciences. Upper Saddle River, N.J.: Prentice Hall.
Siddhuraju, P., Vijayakumari, K and Janardhanan, K. (1992). Nutritional and chemical evaluation of raw seeds of the tribal pulse Vigna trilobata (L.) Verdc. International Journal of Food Sciences and Nutrition, 43 (2): 97 – 103.
Silva, TA, Alarcon, RF, Damasio, ARL, Michelin, M, Maller, A, Masui, DC, Terenzi, HF, Jorge, JA and Polizeli, MLTM. (2009). Use of cassava peel as carbon source for production of amylolytic enzymes by Aspergillus niveus. International Journal of Food Engineering, 5 (5), Article 1. DOI: 10.2202/1556-3758.1629
Silva, E. M., & Yang, S. T. (1998). Production of Amylases from Rice by Solid‐State Fermentation in a Gas− Solid Spouted‐Bed Bioreactor. Biotechnology Progress, 14(4), 580-587.
Singh, H., & Soni, S. K. (2001). Production of starch-gel digesting amyloglucosidase by Aspergillus oryzae HS-3 in solid state fermentation. Process Biochemistry, 37(5), 453-459.

313
Singhania, R. R., Sukumaran, R. K., Patel, A. K., Larroche, C., & Pandey, A. (2010). Advancement and comparative profiles in the production technologies using solid-state and submerged fermentation for microbial cellulases. Enzyme and Microbial Technology, 46(7), 541-549.
Sinha, SK and Nair, TVR. (1968). Studies on the variability of cyanogenic glucoside content in cassava tubers. Indian Journal of Agricultural Sciences, 38, 958 – 963.
Sivakumar, K., Karuppiah, V., Sethubathi, G. V., Thangaradjou, T., & Kannan, L. (2012). Response surface methodology for the optimization of α-amylase production by Streptomyces sp. ML12 using agricultural by products. Biologia, 67(1), 32-40.
Smeets, E. M., Faaij, A. P., Lewandowski, I. M., & Turkenburg, W. C. (2007). A bottom-up assessment and review of global bio-energy potentials to 2050. Progress in Energy and combustion science, 33(1), 56-106.
Smith, M. R., Lequerica, J. L., & Hart, M. R. (1985). Inhibition of methanogenesis and carbon metabolism in Methanosarcina sp. by cyanide. Journal of bacteriology, 162(1), 67-71.
Snow, P., & O'Dea, K. (1981). Factors affecting the rate of hydrolysis of starch in food. The American Journal of Clinical Nutrition, 34(12), 2721-2727.
Soares, M., Christen, P., Pandey, A., & Soccol, C. R. (2000). Fruity flavour production by Ceratocystis fimbriata grown on coffee husk in solid-state fermentation. Process Biochemistry, 35(8), 857-861.
Soccol, CR. (1996). Biotechnological products from cassava roots by solid state fermentation. Journal of Scientific and Industrial Research, 55 (5): 358 – 364.
Soccol, CR, Iloki, I, Marin, B and Raimbault, M. (1994 A). Comparative Production of Alpha-amylase, Glucoamylase and Protein Enrichment of Raw and Cooked Cassava by Rhizopus Strains in Submerged and Solid State Fermentations. Journal of Food Science and Technology, 31 (4): 320 – 323.
Soccol, C. R., Marin, B., Raimbault, M., & Lebeault, J. M. (1994 B). Breeding and growth of Rhizopus in raw cassava by solid state fermentation. Applied Microbiology and Biotechnology, 41(3), 330-336.
Sodhi, HK, Sharma, K, Gupta, JK and Soni, SK. (2005). Production of a thermostable α-amylase from Bacillus sp. PS-7 by solid state fermentation and its synergistic use in the hydrolysis of malt starch for alcohol production. Process Biochemistry, 40 (2): 525 – 534.
Sokari, TG. (1992). Improving the Nutritional Quality of Ogi and Gari. Applications of Biotechnology in Traditional Fermented Foods. National Academy Press, Washington, D. C. Pp. 93 – 99.
314
Solomon, B. (1978). Starch hydrolysis by industrial enzymes. In Advances in Biochemical Engineering, Volume 10. TK Ghose, A Fiechter and N Blakebrough, ed., Pp 131 – 177. Springer-Verlag, Berlin.
Soni, P. L., Sharma, H. W., Dobhal, N. P., Bisen, S. S., Srivastava, H. C., & Gharia, M. M. (1985). The starches of Dioscorea ballophylla and Amorphophallus campanulatus. Comparison with tapioca starch. Starch‐Stärke, 37(1), 6-9.
Soroka, W. (2002). Fundamentals of packaging technology. Third Edition. Institute of packaging professionals.
Souza, PMD and Magalhães, PO. (2010). Application of microbial α-amylase in industry-A review. Brazilian Journal of Microbiology, 41 (4): 850 – 861.
Spagnuolo, M., Crecchio, C., Pizzigallo, M. D. R., & Ruggiero, P. (1997). Synergistic effects of cellulolytic and pectinolytic enzymes in degrading sugar beet pulp. Bioresource Technology, 60(3), 215-222.
Spier, MG, Woiciechowski, AL, Vandenberghe, LPS and Soccol, CR. (2006). Production and characterization of amylases by Aspergillus niger under solid-state fermentation using agro industrials products. International Journal of Food Engineering, 2 (3): Article 6.
Sreekantiah,KR and Rao, BAS. (1980). Production of Ethyl Alcohol from Tubers. Journal of food science and technology, 17 (4): 194 – 195.
Srikanta, S, Jaleel, SA and Sreekantiah KR. (1987). Production of ethanol from tapioca (Manihot esculenta Crantz). Starch/Starke. 39 (4): 132 – 135.
Srikanta, S, Jaleel, SA, Ghildyal, NP, Lonsane, BK and Karanth, NG. (1987). Novel Technique for Saccharification of Cassava Fibrous Waste for Alcohol Production. Starch/Starke. 39 (7): 234 – 237.
Srikanta, S, Jaleel, SA, Kunhi, AAM, Rehana, F, Ghildyal, NP, Lonsane, BK and Karanth, NG. (1989). Downstream processing of the hydrolysate from cassava fibrous waste in the production of confectioner’s syrup. Starch, 41 (5): 196 – 200.
Srinorakutara, T, Kaewvimol, L and Saengow, L. (2006). Approach of Cassava Waste Pretreatments for Fuel Ethanol Production in Thailand. Journal of Science and Research Chula University, 31 (1), 77-84.
Sriroth, K., Santisopasri, V., Petchalanuwat, C., Kurotjanawong, K., Piyachomkwan, K and Oates, CG. (1999). Cassava starch granule structure-function properties: influence of time and conditions at harvest on four cultivars of cassava starch. Carbohydrate Polymers. 38 (2): 161 – 170.

315
Sriroth, K, Chollakup, R, Chotineeranat, S, Piyachomkwan, K and Oates, CG. (2000). Processing of Cassava waste for improved biomass utilization. Bioresource Technology, 71 (1): 63 – 69.
Srivastava, R. A. K., & Baruah, J. N. (1986). Culture conditions for production of thermostable amylase by Bacillus stearothermophilus. Applied and Environmental Microbiology, 52(1), 179-184.
Srivastava, R. A. K. (1987). Purification and chemical characterization of thermostable amylases produced by Bacillus stearothermophilus. Enzyme and Microbial Technology, 9(12), 749-754.
Stamford, TLM, Stamford, NP, Coelho, LCBB and Araújo, JM. (2002). Production and characterization of a thermostable glucoamylase from Streptosporangium sp. endophyte of maize leaves. Bioresource Technology, 83 (2): 105 – 109.
Steverson, E. M., Korus, R. A., Admassu, W. & Heimsch, R. C. (1984). Kinetics of the amylase system of Saccharomyces fibulegera. Enzyme and Microbial Technology, 6 (12): 549-554.
Stoppok, E., & Buchholz, K. (1985). Continuous anaerobic conversion of sugar beet pulp to biogas. Biotechnology letters, 7(2), 119-124.
Sugawara, E., Hashimoto, S., Sakurai, Y., & Kobayashi, A. (1994). Formation by yeast of the HEMF (4-hydroxy-2 (or 5)-ethyl-5 (or 2)-methyl-3 (2H)-furanone) aroma components in Miso with aging. Bioscience Biotechnology and Biochemistry, 58, 1134–1135. [Cited by Couto and Sanromam, 2006].
Sugawara, E., & Sakurai, Y. (1999). Effect of Media Constituents on the Formation by Halophilic Yeast of the 2 (or 5)-Ethyl-5 (or 2)-methyl-4-hydroxy-3 (2H)-furanone Aroma Component Specific to Miso. Bioscience, Biotechnology, and Biochemistry, 63(4), 749-752.
Sugimoto, T., & Shoji, H. (2012). Indigestible dextrin is an excellent inducer for α-amylase, α-glucosidase and glucoamylase production in a submerged culture of Aspergillus oryzae. Biotechnology Letters, 34(2), 347-351.
Sukara, E., & Doelle, H. W. (1989). A one-step process for the production of single-cell protein and amyloglucosidase. Applied microbiology and biotechnology, 30(2), 135-140.
Sumner, JB and Graham, VA. (1921). Dinitrosalicylic Acid: A reagent for the estimation of sugar in normal and diabetic urine. Journal of Biological Chemistry, 47 (1): 5 – 9.
Sumner, JB. (1924). The estimation of sugar in diabetic urine, using dinitrosalicylic acid. Journal of Biological Chemistry, 62 (2): 287 – 290.

316
Sumner, J. B., & Howell, S. F. (1935). A method for determination of saccharase activity. Journal of Biological Chemistry, 108 (1), 51-54.
Swain, MR and Ray, RC. (2007). Alpha-amylase production by Bacillus subtilis CM3 in solid state fermentation using cassava fibrous residue. Journal of Basic Microbiology, 47 (5): 517 – 525.
Swain, M. R., & Ray, R. C. (2009). Biocontrol and other beneficial activities of Bacillus subtilis isolated from cowdung microflora. Microbiological Research, 164(2), 121-130.
Swinkels, JJM. (1985). Composition and properties of commercial native starches. Starch, 37 (1): 1 – 5.
Syu, M. J., & Chen, Y. H. (1997). A study on the α-amylase fermentation performed by Bacillus amyloliquefaciens. Chemical Engineering Journal, 65(3), 237-247.
Takeda, Y., Shirasaka, K., & Hizukuri, S. (1984). Examination of the purity and structure of amylose by gel-permeation chromatography. Carbohydrate Research, 132(1), 83-92.
Takeda, Y., Hizukuri, S., & Juliano, B. O. (1986). Purification and structure of amylose from rice starch. Carbohydrate research, 148(2), 299-308.
Takeda, Y., Maruta, N., & Hizukuri, S. (1992). Examination of the structure of amylose by tritium labelling of the reducing terminal. Carbohydrate Research, 227 (6 April 1992): 113-120.
Tani, Y., Vongsuvanlert, V., & Kumnuanta, J. (1986). Raw cassava starch-digestive glucoamylase of Aspergillus sp. N-2 isolated from cassava chips. Journal of Fermentation Technology, 64(5), 405-410.
Tanyildizi, M. S., Özer, D., & Elibol, M. (2005). Optimization of α-amylase production by Bacillus sp. using response surface methodology. Process Biochemistry, 40 (7), 2291-2296.
Tewe, OO. (2004). Cassava for livestock feed in sub-Saharan Africa. FAO/IFAD, Rome.
The Royal Society. (2008). Sustainable biofuels: prospects and challenge. Policy document 01/08. ISBN 978 0 85403 662 2. The Royal Society, London, UK.
Thermo Fisher Scientific Inc. (2011). Modified Lowry Protein Assay Kit, No. 23240. Thermo Scientific, www.thermoscientific.com/pierce.
Thomson, A. M., Calvin, K. V., Chini, L. P., Hurtt, G., Edmonds, J. A., Bond-Lamberty, B., ... & Janetos, A. C. (2010). Climate mitigation and the future of tropical landscapes. Proceedings of the National Academy of Sciences, 107 (46): 19633-19638

317
Thompson, T. (1997), Do oats belong in a glúten-free diet? Journal of the American Dietetic Association, 97(12): 1413-1416.
Tomasik, P and Horton, D. (2012). Enzymatic conversions of starch. Advances in Carbohydrate Chemistry and Biochemistry, 68: 59 – 436.
Tonukari, N. J. (2004). Cassava and the future of starch. Electronic journal of biotechnology, 7(1), 5-8.
Tran, U. T., Okadome, H., Murata, M., Homma, S., & Ohtsubo, K. I. (2001). Comparison of Vietnamese and Japanese rice cultivars in terms of physicochemical properties. Food Science and Technology Research, 7(4), 323-330.
Tylleskär, T., Rosling, H., Banea, M., Bikangi, N., Cooke, R. D., & Poulter, N. H. (1992). Cassava cyanogens and konzo, an upper motoneuron disease found in Africa. The Lancet, 339(8787), 208-211.
Ubbink, J., & Mezzenga, R. (2006). Delivery of functionality in complex food systems: introduction. Trends in Food Science & Technology, 17 (5), 194-195.
Ueda, S. (1981). Fungal glucoamylases and raw starch digestion. Trends in Biochemical Sciences, 6, 89-90.
Ueda, S, Zenin, CT, Monteiro, DA and Park, YK. (1981). Production of Ethanol from Raw Cassava Starch by a Nonconventional Fermentation Method. Biotechnology and Bioengineering, 23 (2): 291 – 299.
Ueda, S., & Saha, B. C. (1983). Behaviour of Endomycopsis fibuligera glucoamylase towards raw starch. Enzyme and Microbial Technology, 5(3), 196-198.
Ugent, D, Pozorski, S, and Pozorski, T. (1986). Archaeological manioc (Manihot) from coastal Peru. Economic Botany, 40 (1): 78 – 102.
Uguru, G. C., Akinyanju, J. A., & Sani, A. (1997). The use of yam peel for growth of locally isolated Aspergillus niger and amylase production. Enzyme and Microbial Technology, 21 (1), 48-51.
Uhlig, H. (1998). Industrial Enzymes and their Applications. John Wiley & Sons, Inc.
United States Department of Agriculture (USDA). (2013). Sugar: World Markets and Trade. USDA, Foreign Agricultural Service. http://www.fas.usda.gov/psdonline/circulars/sugar.pdf; [Accessed 08/26/2013].
Vadivel, V and Janardhanan, K. (2001). Diversity in nutritional composition of wild jack bean (Canavalia ensiformis L. DC) seeds collected from south India. Food Chemistry, 74 (4): 507 – 511.

318
Valetudie, J. C., Colonna, P., Bouchet, B., & Gallant, D. J. (1993). Hydrolysis of Tropical Tuber Starches by Bacterial and Pancreatic α‐Amylases. Starch‐Stärke, 45(8), 270-276.
Van Den Burg, B. (2003). Extremophiles as a source for novel enzymes. Current Opinion in Microbiology, 6 (3): 213 – 218.
Van Den Heuvel, JC and Beeftink, HH. (1988). Effects of simultaneous inhibition by substrate and product. Biotechnology and Bioengineering, 31 (7): 718 – 724.
Van Der Maarel, M. J., Van Der Veen, B., Uitdehaag, J., Leemhuis, H., & Dijkhuizen, L. (2002). Properties and applications of starch-converting enzymes of the α-amylase family. Journal of Biotechnology, 94(2), 137-155.
Varalakshmi, KM, Kumudini, BS, Nandini, BN, Solomon, J, Suhas, R, Mahesh, B and Kavitha, AP. (2009). Production and Characterization of α-amylase from Aspergillus niger JGI 24 isolated in Bangalore. Polish Journal of Microbiology, 58 (1): 29 – 36.
Venkatesh, KV. (1997). Simultaneous saccharification and fermentation of cellulose to lactic acid. Bioresource Technology, 62 (3): 91 – 98.
Vihinen, M and Mantsala, P. (1989). Microbial amylolactic enzymes. Critical reviews in biochemistry and molecular biology, 24 (4): 329 – 418.
Vijayagopal, K, Balagopalan, C and Moorthy, SN. (1988). Gelatinization and liquefaction of cassava flour: Effect of temperature, substrate and enzyme concentrations. Starch, 40 (8): 300 – 302.
Viniegra-González, G, Favela-Torres, E, Aguilar, CN, Rómero-Gomez, SDJ, D az-God nez, G and Augur, C. (2003). Advantages of fungal enzyme production in solid state over liquid fermentation systems. Biochemical Engineering Journal, 13 (2): 157 – 167.
Visser, J and Voragen, AGJ. Editors. (1996). Pectins and Pectinases. Progress in Biotechnology Vol. 14: Proceedings of an International Symposium, Wageningen, The Netherlands, 3 – 7 December, 1995. Elsevier Science.
Vuilleumier, S. (1993). Worldwide production of high-fructose syrup and crystalline fructose. The American journal of clinical nutrition, 58(5), 733S-736S.
Waliszweski, KN, Alvarado, MG and Medina, JC. (1992). Kinetics of enzymic hydrolysis of cassava flour starch – optimization and modeling. International Journal of Food Science and Technology, 27 (4): 465 – 472.
Wanapat, M, Puramongkon, T and Siphuak, W. (2000). Feeding of cassava hay for lactating dairy cows. ASIAN AUSTRALASIAN JOURNAL OF ANIMAL SCIENCES, 13 (4): 478 – 482.

319
Wang, T. L., Bogracheva, T. Y., & Hedley, C. L. (1998). Starch as simple as A, B, C. Journal of Experimental Botany, 49 (320): 481-502.
Wankhede, DB and Ramteke, RS. (1982). Synergistic Digestibility of Several Native Starches by Amylolytic Enzymes. Starch/Starke, 34 (9): 309 – 312.
Westby, A. (2002). Cassava utilization, storage and small-scale processing. In: RI Hillocks, JM Thresh and AC Bellotti (Eds.). Cassava biology, production and utilization. CABI Publishing.
Westby, A., & Choo, B. (1994). Cyanogen reduction during lactic fermentation of cassava. In International Workshop on Cassava Safety. Acta Horticulturae, No. 375. Pp. 209 – 216.
Wheatley, C and Gomez, G. (1985). Evaluation of some quality characteristics in cassava storage roots. Qualitas plantarum, plant foods for human nutrition, 35 (2): 121 – 129.
Whistler, RL, Editor. (1964). Methods in carbohydrate chemistry. Vol. IV. London and New York, Academic Press.
Whistler, R. L., & Daniel, J. R. (1984). Molecular structure of starch. In: Starch: Chemistry and technology, RL Whistler, JN Bemiller and EF Paschall, Eds. Orlando, Academic Press. Pp. 153 – 182.
Whitaker, JR. (1994). Principles of Enzymology for the Food Sciences. Second Edition. Basel, Switzerland. Marcel Dekker, Inc.
White, WLB, McMahon, JM and Sayre, RT. (1994). Regulation of Cyanogenesis in Cassava. Acta Horticulturae, No. 375: 69 – 77.
White, W. L., Arias-Garzon, D. I., McMahon, J. M., & Sayre, R. T. (1998). Cyanogenesis in Cassava The Role of Hydroxynitrile Lyase in Root Cyanide Production. Plant Physiology, 116(4), 1219-1225.
Widowati, S and Hartojo, K. (2010). Production and use of cassava flour: A new product of future potential in Indonesia.http://webapp.ciat.cgiar.org/webciat/asia_cassava/pdf/proceedings_workshop_00/578.pdf Accessed 12/31/2010.
Wikipedia. (2010). High-fructose corn syrup. http://en.wikipedia.org/wiki/High-fructose_corn_syrup Accessed Tuesday 9th March 2010.
Wikipedia. (2013) A. Sugar. http://en.wikipedia.org/wiki/Sugar Accessed Sunday 1st September 2013.
Wikipedia. (2013 B). Casaba de yucca. http://es.wikipedia.org/wiki/Casabe_de_yuca Accessed Wednesday 11th September 2013.
320
Wilson, WM and Dufour, DL. (2002). Why “bitter” cassava? Productivity of “bitter” and “sweet” cassava in a Tukanoan Indian settlement in the Northwest Amazon. Economic Botany, 56 (1): 49 – 57.
Wiseman, A. (1973). Theoretical Analysis of Enzyme Uses in the Food Industry. Journal of Applied Chemistry and Biotechnology, 23 (1): 159.
Witt, PR. (1985). Liquefaction of starch. United States Patent No. 4540663.
Wyman, C. E. (1999). Biomass ethanol: technical progress, opportunities, and commercial challenges. Annual Review of Energy and the Environment, 24(1), 189-226.
Wyman, C. E., Dale, B. E., Elander, R. T., Holtzapple, M., Ladisch, M. R., & Lee, Y. Y. (2005). Coordinated development of leading biomass pretreatment technologies. Bioresource technology, 96(18), 1959-1966.
Yeoh,HH & Egan SV. (1997).An enzyme-based dip-stick for the estimation of cyanogenic potential of cassava flour. Food Chemistry, 60 (1): 119 – 122.
Yeoh, H. H., & Truong, V. D. (1996). Protein contents, amino acid compositions and nitrogen-to-protein conversion factors for cassava roots. Journal of the Science of Food and Agriculture, 70 (1), 51-54.
Yokote, Y, Kimura, K and Samejima, H. (1975). Production of high fructose syrup by glucose isomerase immobilized on phenol-formaldehyde resin. Starch, 27 (9): 302 – 306.
You, S., Fiedorowicz, M., & Lim, S. T. (1999). Molecular Characterization of Wheat Amylopectins by Multiangle Laser Light Scattering Analysis 1. Cereal chemistry, 76(1), 116-121.
Yuryev, V. P., Tomasik, P., & Bertoft, E. (Eds.). (2007). Starch: Achievements in understanding of structure and functionality. New York, Nova Science Publishers, Inc.
Zanin, G. M., & De Moraes, F. F. (1998). Thermal stability and energy of deactivation of free and immobilized amyloglucosidase in the saccharification of liquefied cassava starch. Applied biochemistry and biotechnology, 70(1), 383-394.
Zhang, B, He, PJ, Lü, F, Shao, LM and Wang, P. (2007). Extracellular enzyme activities during regulated hydrolysis of high-solid organic wastes. Water Research, 41 (19), 4468 – 4478.
Zhang, C., Xing, X. H., & Liu, M. S. (2004). Production of multienzymes consisting of alkaline amylase and cellulase by mixed alkalophilic culture and their potential use in the saccharification of sweet potato. Biochemical Engineering Journal, 19(2), 181-187.

321
Zhang, Q., He, J, Tian, M, Mao, Z, Tang, L, Zhang, J and Zhang, H. (2011). Enhancement of methane production from cassava residues by biological pretreatment using a constructed microbial consortium. Bioresource Technology, 102 (19), 8899 – 8906
Zhu, W., Lestander, T. A., Örberg, H., Wei, M., Hedman, B., Ren, J., Xie, G and Xiong, S. (2013). Cassava stems, a new resource to increase food and fuel production. GCB (Global Change Biology) Bioenergy. DOI: 10.1111/gcbb.12112
Zitnak, A, Hill, DC and Alexander, JC. (1977). Determination of linamarin in biological tissues. Analytical Biochemistry, 77 (1): 310 – 314.

322
BIOGRAPHICAL SKETCH
Samuel NwaneLe Aso [Sammy] was born in the Village of Elelenwo, Rivers
State, Nigeria. He started elementary education in the then St. Marks School Elelenwo.
His elementary education was interrupted by the Nigerian civil war from 1966 to 1969.
In 1970 he resumed elementary education and received the first school leaving
certificate in 1971. Sammy enrolled into County Grammar School Ikwerre/Etche in 1972
for secondary education; graduating in 1976 with the West African Examinations
Council (WAEC) certificate for secondary education.
In the fall of 1977 he enrolled into Utah State University, Logan, but transferred to
The University of Tennessee, Knoxville, in the summer of 1978. Sammy received his
bachelor’s degree in agricultural engineering from The University of Tennessee in
December 1981 and enrolled into the master’s degree program in the spring of 1982 at
the same institution. He received the Master of Science degree with concentration in
food engineering in August 1983.
Sammy immediately returned to Nigeria and on completion of National Youth
Service Corps (NYSC) program in 1984, served as the general manager of Erijoy
Nigeria Limited, a multi branch hotel/catering firm situated in Port Harcourt, Nigeria. He
joined Rivers State University of Science and Technology (RSUST) in 1991 as assistant
lecturer. Sammy rose through the ranks and became a senior lecturer in food
engineering at RSUST by 2006. In the spring of 2010, He commenced this Doctor of
Philosophy degree program in food engineering at the University of Florida.
The research interests of Sammy include life cycle assessment (LCA) of food
engineering systems; food irradiation; ohmic food processing; high pressure food
processing; heat pipe technology; and the engineering of consumables (especially food)

323
for extraterrestrial body-surface and micro-gravity environments such as Space Shuttle
Orbiters, International Space Station, Lunar and Martian Outposts, Asteroid Mining
Bases, as well as other ETI and Planet-Surface habitats. Sammy is a deep space
enthusiast and lover of space mementos.