ASEAN+ FORTNIGHTLY Highlights (4 – 15 Jan, 2021)
14
January 15, 2021 STRATEGY Regional THIS REPORT HAS BEEN PREPARED BY MAYBANK KIM ENG RESEARCH SEE PAGE 12 FOR IMPORTANT DISCLOSURES AND ANALYST CERTIFICATIONS ASEAN+ FORTNIGHTLY Highlights (4 – 15 Jan, 2021) Thailand: Riding the liquidity wave; Power sector initiation Sustained, flush liquidity will keep the SET at these high levels c.+3SD>10Y avg PE. But with earnings growth muted (+6% YoY in 2021E, +14.9% YoY in 2022E) and having many downside risks, including drag from a 2nd wave of COVID infections, there is no fundamental support to the lofty multiples i.e. now 23.6x FY21E PE. In the short term, we play the liquidity game and rotate among the momentum sectors: Banks, Consumer Finance, Energy, Petrochemicals, Tourism & Discretionary Retailing. However, by 2H21 economic outlook and valuation will again become factors in investing decisions. Pegging our THB65 2021 EPS to +1SD above 10-year mean PE, SET YE target is 1191.5pts (-22%), so we expect profit taking to occur into 2H21. Our tactical picks this month are a mixture of earnings recovery bets: CPALL, KBANK and yield/value: STGT, LH, DTAC, SCC, MTC and KKP. We reiterate our positive stance on the Property (note) and Banks (note) sectors, and initiated coverage on the Power sector with GULF, BRGIM and GPSC as Buys (note). Malaysia: Imposition of MCO, emergency; MISC upgraded The KLCI had a weak start to the year as concerns relating on political stability i.e. potential snap polls, and rising COVID-19 cases weighed. The government announced a new Movement Control Order (MCO) covering most of the country on Jan 13 th , for a period of two weeks (likely to be extended), followed by the imposition of a state of emergency for the first time since 1969, which effectively suspends Parliament (hence securing the current government in place) until at least August. While this MCO is less- restrictive of economic activities vs. the first iteration in 2Q20, it nonetheless poses a headwind for 2021E forecast KLCI earnings growth of +44.9% YoY (2020E: -11.3%). As articulated in our 2021 Market Outlook report “Goldilocks makes a comeback”, dated Dec 14, while Malaysia’s recovery story is shadowed by political and fiscal stresses, these are unlikely to derail an equities-favouring combination of accelerated earnings recovery, fiscal stimulus, ample liquidity, commodities price recovery and relative attraction vs. an increasingly pressured fixed income space. Hence our end-2021 KLCI target of 1,830 (+12%; 16x fwd. PE per historical mean), overweighting Mid-cap Financials (RHB, Allianz), Utilities (Tenaga, MFCB), Healthcare/Gloves (IHH, Hartalega), Construction (Gamuda), Plantations (KLK, BPlant), Tech/Semicon (Inari), Large-cap Oil & Gas (Dialog, Yinson) and Auto (BAuto). We recently upgraded shipper MISC to BUY, underpinned by bottoming tanker rates, robust ESG credentials and c.5% cash dividend yield. Singapore: Slow recovery, with some bright spots Singapore’s 2020 GDP contracted 5.8% (as expected) due to the sluggish Services sector. We maintain our +4.5% growth for 2021E, where the recovery could be ‘U’ shaped vs. ‘V’ from closed borders and slow herd-immunity. Tech sector is set for a strong 2021 with robust semiconductor spend expectations and limited lockdown impacts. Palm oil should be another bright spot given tight supplies and rising demand. On the other hand, Office REITs are likely to see more headwinds from demand erosion from WFH, slow growth and limited M&A. We seek to balance growth with some defense and also increase weightings to mid/small caps in 2021. Top Picks: AEM, AREIT, CD, FR, FRKN, MLT, SGX, ST, VMS, WIL. We initiate coverage on KREIT and SUN as SELLs, and downgrade HIP to SELL Indonesia: Moving into higher gear on structural positives We maintain our POSITIVE view on the market as the overall macro situation should continue to gradually improve in 2021, with GDP growth forecast of +5.3%. End-2021 JCI target of 6,900 (+7%) is based on 21.8x PER, 2SD above 10-year mean. Higher valuations are justified given structural changes in the economy (e.g. Omnibus Law, value-added process in mining sector). Foreign fund inflows are likely due to 1) foreign investors’ low exposure to Indonesia’s equity market (uninterrupted net foreign outflows trend since mid-2017); and 2) potential hunt for yields by global investors. We like sectors with exposure to economic recovery, FDI and nickel (INCO). Our Top Picks are: BJBR (attractive business model), KLBF (healthcare beneficiary), and SMGR (recovery play). Philippines: COVID-19 surge fear offset by vaccine optimism Despite fears of a surge in COVID-19 cases post the holiday season, the PSEi rallied as the Philippines entered into more vaccine supply deals. We set our 12-month PSEi target at 7,650 (+5%), reflecting a 36.9% FY21E earnings growth and PER of 19.3x. A second wave- induced lockdown remains to be a key risk to our thesis, while on the upside, passing of the CREATE Act stimulus would directly boost earnings via a 5ppt corporate income tax cut. We recommend a value, defensive basket, with strong recovery exposures. CNPF, URC, RLC and AC remain in our top buy list; we also take out BDO and add HOME, which should benefit more directly from the expected uptick in the property sector. Vietnam: “Fast and Furious” rally; +6.8% GDP growth in 2021 Strong liquidity from local retail (with phenomenal increase in F0 accounts, i.e. 400k new accounts opened in 2020, double that in 2019) has been driving up the market unabatedly since Nov’20, pushing market valuation close to peak 22x P/E recorded in early 2018. Market daily turnover reached nearly US$1b in 1HJan’21. Although we remain structurally positive, this rally is too rapid and we are observing extreme exuberance among local retail now. We thus recommend long-term investors time for better entry at correction points or accumulate stocks that have lagged and those with strong catalysts. Our top stock picks include: Banks: VPB, ACB and TCB/MBB, Real estate/IPs: NVL, KBC, GVR; Consumers: MWG, PNJ, MSN, QNS; Logistics: ACV, AST/SCS, GMD; Energy: PLX, NT2. On macro, 2020 GDP growth bucked the negative regional trend, at+2.7%; 2021 momentum is broad and strong, per region-leading +6.8% growth forecast. India: NIFTY firm at record 14,500; Correction is overdue NIFTY made a new all-time high of 14.5k this week, supported by continued optimism regarding vaccine availability driving a “V”-shaped recovery and better than expected corporate earnings. There is some excitement around the announcements in the central budget on 1 Feb. We maintain our NIFTY target at 11,383 which is still a 22% downside. We maintain that NIFTY is running ahead of actual earnings improvement, and at a PER of 27x 1-year forward, it more than discounts on-ground improvements. We recommend select sectors and stock where earnings visibility is good and valuations reasonable. Top BUYs are in the following sectors: Telecom (BHARTI), Software (TCS, INFO, HCLT, WPRO) and Cement (DALBHARA). SELLs are in Autos (MSIL, TTMT, MNDA) and City gas (MAHGL). Head of Regional Equity Research | Malaysia Anand Pathmakanthan (603) 2297 8783 [email protected] Indonesia Isnaputra Iskandar (62) 21 8066 8680 [email protected] Philippines Jacqui de Jesus (63) 2 8849 8844 [email protected] Singapore Thilan Wickramasinghe (65) 6231 5840 [email protected] Thailand Maria Lapiz (66) 2257 0250 [email protected] Vietnam Thanh Quan Trong (84 28) 44 555 888 x 8184 [email protected] India Jigar Shah (91) 22 4223 2632 [email protected] ASEAN+: Top BUY ideas Stock BB Ticker Price TP Upside (%) Malaysia Hartalega HART MK 12.30 20.60 67.5 RHB RHBBANK MK 5.46 6.70 22.7 Inari INRI MK 2.85 3.40 19.3 Singapore SingTel ST SP 2.51 2.88 14.7 SGX SGX SP 9.97 10.77 10.7 Frencken FRKN SP 1.37 1.39 1.5 Indonesia Bank Jabar BJBR IJ 1,685 1,800 6.8 Kalbe KLBF IJ 1,680 2,000 19.0 Semen Indo SMGR IJ 12,200 14,100 15.6 Thailand Kiatnakin KKP TB 56.5 65.0 15.0 Land & House LH TB 8.3 9.2 11.5 Kasikorn KBANK TB 119.5 140.0 17.2 Philippines Century Pac. CNPF PM 18.6 21.1 13.6 Univ Robina URC PM 158.2 175.0 10.6 Robin. Land RLC PM 22.0 27.4 24.5 Vietnam Vinamilk VNM VN 116,300 127,300 13.6 Asia Com Ba ACB VN 30,100 33,600 11.6 P.Nhuan Jew PNJ VN 82,900 85,000 4.9 India TCS TCS IN 3,173 3,600 13.5 Infosys INFO IN 566 750 32.6 Bharti Airtel BHARTI IN 1,064 1,230 15.6 Source: MKE, Factset – 14 Jan 2021
-
Upload
khangminh22 -
Category
Documents
-
view
3 -
download
0
Transcript of ASEAN+ FORTNIGHTLY Highlights (4 – 15 Jan, 2021)
January 15, 2021
ST
RAT
EG
Y
Regio
nal
THIS REPORT HAS BEEN PREPARED BY MAYBANK KIM ENG RESEARCH
SEE PAGE 12 FOR IMPORTANT DISCLOSURES AND ANALYST CERTIFICATIONS
ASEAN+ FORTNIGHTLY
Highlights (4 – 15 Jan, 2021)
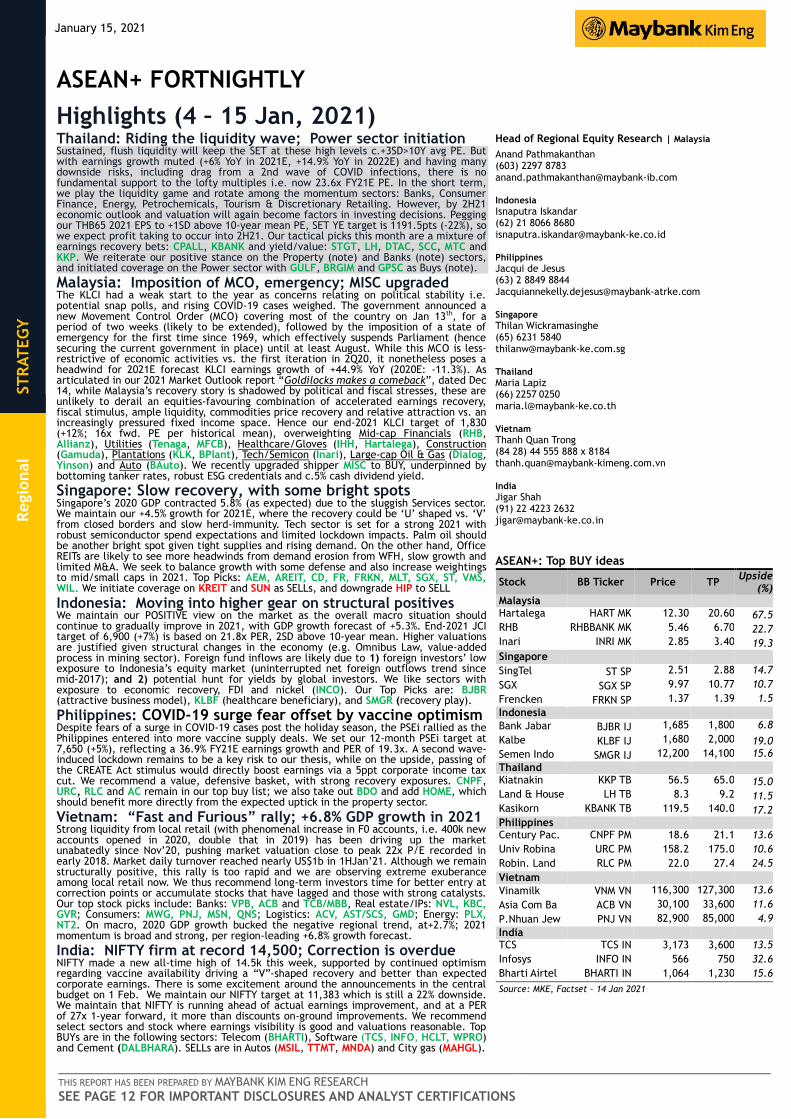
Thailand: Riding the liquidity wave; Power sector initiation Sustained, flush liquidity will keep the SET at these high levels c.+3SD>10Y avg PE. But with earnings growth muted (+6% YoY in 2021E, +14.9% YoY in 2022E) and having many downside risks, including drag from a 2nd wave of COVID infections, there is no fundamental support to the lofty multiples i.e. now 23.6x FY21E PE. In the short term, we play the liquidity game and rotate among the momentum sectors: Banks, Consumer Finance, Energy, Petrochemicals, Tourism & Discretionary Retailing. However, by 2H21 economic outlook and valuation will again become factors in investing decisions. Pegging our THB65 2021 EPS to +1SD above 10-year mean PE, SET YE target is 1191.5pts (-22%), so we expect profit taking to occur into 2H21. Our tactical picks this month are a mixture of earnings recovery bets: CPALL, KBANK and yield/value: STGT, LH, DTAC, SCC, MTC and KKP. We reiterate our positive stance on the Property (note) and Banks (note) sectors, and initiated coverage on the Power sector with GULF, BRGIM and GPSC as Buys (note).
Malaysia: Imposition of MCO, emergency; MISC upgraded The KLCI had a weak start to the year as concerns relating on political stability i.e. potential snap polls, and rising COVID-19 cases weighed. The government announced a new Movement Control Order (MCO) covering most of the country on Jan 13th, for a period of two weeks (likely to be extended), followed by the imposition of a state of emergency for the first time since 1969, which effectively suspends Parliament (hence securing the current government in place) until at least August. While this MCO is less-restrictive of economic activities vs. the first iteration in 2Q20, it nonetheless poses a headwind for 2021E forecast KLCI earnings growth of +44.9% YoY (2020E: -11.3%). As articulated in our 2021 Market Outlook report “Goldilocks makes a comeback”, dated Dec 14, while Malaysia’s recovery story is shadowed by political and fiscal stresses, these are unlikely to derail an equities-favouring combination of accelerated earnings recovery, fiscal stimulus, ample liquidity, commodities price recovery and relative attraction vs. an increasingly pressured fixed income space. Hence our end-2021 KLCI target of 1,830 (+12%; 16x fwd. PE per historical mean), overweighting Mid-cap Financials (RHB, Allianz), Utilities (Tenaga, MFCB), Healthcare/Gloves (IHH, Hartalega), Construction (Gamuda), Plantations (KLK, BPlant), Tech/Semicon (Inari), Large-cap Oil & Gas (Dialog, Yinson) and Auto (BAuto). We recently upgraded shipper MISC to BUY, underpinned by bottoming tanker rates, robust ESG credentials and c.5% cash dividend yield.
Singapore: Slow recovery, with some bright spots Singapore’s 2020 GDP contracted 5.8% (as expected) due to the sluggish Services sector. We maintain our +4.5% growth for 2021E, where the recovery could be ‘U’ shaped vs. ‘V’ from closed borders and slow herd-immunity. Tech sector is set for a strong 2021 with robust semiconductor spend expectations and limited lockdown impacts. Palm oil should be another bright spot given tight supplies and rising demand. On the other hand, Office REITs are likely to see more headwinds from demand erosion from WFH, slow growth and limited M&A. We seek to balance growth with some defense and also increase weightings to mid/small caps in 2021. Top Picks: AEM, AREIT, CD, FR, FRKN, MLT, SGX, ST, VMS, WIL. We initiate coverage on KREIT and SUN as SELLs, and downgrade HIP to SELL
Indonesia: Moving into higher gear on structural positives We maintain our POSITIVE view on the market as the overall macro situation should continue to gradually improve in 2021, with GDP growth forecast of +5.3%. End-2021 JCI target of 6,900 (+7%) is based on 21.8x PER, 2SD above 10-year mean. Higher valuations are justified given structural changes in the economy (e.g. Omnibus Law, value-added process in mining sector). Foreign fund inflows are likely due to 1) foreign investors’ low exposure to Indonesia’s equity market (uninterrupted net foreign outflows trend since mid-2017); and 2) potential hunt for yields by global investors. We like sectors with exposure to economic recovery, FDI and nickel (INCO). Our Top Picks are: BJBR (attractive business model), KLBF (healthcare beneficiary), and SMGR (recovery play).
Philippines: COVID-19 surge fear offset by vaccine optimism Despite fears of a surge in COVID-19 cases post the holiday season, the PSEi rallied as the Philippines entered into more vaccine supply deals. We set our 12-month PSEi target at 7,650 (+5%), reflecting a 36.9% FY21E earnings growth and PER of 19.3x. A second wave-induced lockdown remains to be a key risk to our thesis, while on the upside, passing of the CREATE Act stimulus would directly boost earnings via a 5ppt corporate income tax cut. We recommend a value, defensive basket, with strong recovery exposures. CNPF, URC, RLC and AC remain in our top buy list; we also take out BDO and add HOME, which should benefit more directly from the expected uptick in the property sector.
Vietnam: “Fast and Furious” rally; +6.8% GDP growth in 2021 Strong liquidity from local retail (with phenomenal increase in F0 accounts, i.e. 400k new accounts opened in 2020, double that in 2019) has been driving up the market unabatedly since Nov’20, pushing market valuation close to peak 22x P/E recorded in early 2018. Market daily turnover reached nearly US$1b in 1HJan’21. Although we remain structurally positive, this rally is too rapid and we are observing extreme exuberance among local retail now. We thus recommend long-term investors time for better entry at correction points or accumulate stocks that have lagged and those with strong catalysts. Our top stock picks include: Banks: VPB, ACB and TCB/MBB, Real estate/IPs: NVL, KBC, GVR; Consumers: MWG, PNJ, MSN, QNS; Logistics: ACV, AST/SCS, GMD; Energy: PLX, NT2. On macro, 2020 GDP growth bucked the negative regional trend, at+2.7%; 2021 momentum is broad and strong, per region-leading +6.8% growth forecast.
India: NIFTY firm at record 14,500; Correction is overdue NIFTY made a new all-time high of 14.5k this week, supported by continued optimism regarding vaccine availability driving a “V”-shaped recovery and better than expected corporate earnings. There is some excitement around the announcements in the central budget on 1 Feb. We maintain our NIFTY target at 11,383 which is still a 22% downside. We maintain that NIFTY is running ahead of actual earnings improvement, and at a PER of 27x 1-year forward, it more than discounts on-ground improvements. We recommend select sectors and stock where earnings visibility is good and valuations reasonable. Top BUYs are in the following sectors: Telecom (BHARTI), Software (TCS, INFO, HCLT, WPRO) and Cement (DALBHARA). SELLs are in Autos (MSIL, TTMT, MNDA) and City gas (MAHGL).
Head of Regional Equity Research | Malaysia
Anand Pathmakanthan (603) 2297 8783 [email protected] Indonesia
Isnaputra Iskandar (62) 21 8066 8680 [email protected] Philippines
Jacqui de Jesus (63) 2 8849 8844 [email protected] Singapore
Thilan Wickramasinghe (65) 6231 5840 [email protected] Thailand
Maria Lapiz (66) 2257 0250 [email protected] Vietnam
Thanh Quan Trong (84 28) 44 555 888 x 8184 [email protected] India
Jigar Shah (91) 22 4223 2632 [email protected] ASEAN+: Top BUY ideas
Stock BB Ticker Price TP Upside
(%) Malaysia Hartalega HART MK 12.30 20.60 67.5 RHB RHBBANK MK 5.46 6.70 22.7 Inari INRI MK 2.85 3.40 19.3
Singapore
SingTel ST SP 2.51 2.88 14.7
SGX SGX SP 9.97 10.77 10.7
Frencken FRKN SP 1.37 1.39 1.5
Indonesia
Bank Jabar BJBR IJ 1,685 1,800 6.8
Kalbe KLBF IJ 1,680 2,000 19.0
Semen Indo SMGR IJ 12,200 14,100 15.6
Thailand Kiatnakin KKP TB 56.5 65.0 15.0 Land & House LH TB 8.3 9.2 11.5 Kasikorn KBANK TB 119.5 140.0 17.2 Philippines Century Pac. CNPF PM 18.6 21.1 13.6
Univ Robina URC PM 158.2 175.0 10.6
Robin. Land RLC PM 22.0 27.4 24.5
Vietnam
Vinamilk VNM VN 116,300 127,300 13.6
Asia Com Ba ACB VN 30,100 33,600 11.6
P.Nhuan Jew PNJ VN 82,900 85,000 4.9
India TCS TCS IN 3,173 3,600 13.5
Infosys INFO IN 566 750 32.6
Bharti Airtel BHARTI IN 1,064 1,230 15.6
Source: MKE, Factset – 14 Jan 2021
January 15, 2021 2
ASEAN+ FORTNIGHTLY
Table of Contents ASEAN+: regional dashboard ............................................................................................................ 3
Strategy and macro highlights
THAILAND ................................................................................................................................... 4
MALAYSIA .................................................................................................................................... 5
SINGAPORE ................................................................................................................................. 6
INDONESIA .................................................................................................................................. 7
PHILIPPINES ................................................................................................................................ 8
VIETNAM .................................................................................................................................... 9
INDIA ........................................................................................................................................ 10

January 15, 2021 3
ASEAN+ FORTNIGHTLY
ASEAN+: regional dashboard Fig 1: ASEAN: regional market valuations
Index PER (x) Growth (%) ROE (%) P/B (x) Yield (%)
2020F 2021F 2020F 2021F 2020F 2021F 2020F 2021F 2020F 2021F
Malaysia 1,636 20.7 14.5 -12.0 43.0 8.0 11.0 1.6 1.5 2.8 3.7 Singapore 3,000 20.4 14.7 -38.0 39.0 6.0 7.0 1.1 1.1 3.5 4.1 Indonesia 6,428 22.4 17.0 -26.0 31.0 11.0 13.0 2.5 2.3 2.4 2.6 Thailand 1,536 25.3 23.6 -28.8 6.0 7.0 9.0 2.2 2.0 2.3 2.5 Philippines 7,273 26.3 19.3 -41.0 36.9 7.0 10.0 1.6 1.5 2.0 1.9 Vietnam 1,187 18.4 15.4 -7.0 25.0 13.0 16.0 2.4 2.3 1.5 1.5 India 14,596 34.3 24.6 -2.0 39.0 10.0 13.0 3.5 3.2 1.1 1.3 Source: Maybank KE , MSCI (14 Jan 2021)
Fig 2: Asia: market performance
Source: Bloomberg (as of 14 Jan 2021), Maybank KE (chart) Source: Bloomberg (as of 14 Jan 2021), Maybank KE (chart)
Fig 3: ASEAN: index targets, earnings and sector weightings
Index 12m Target Up/(Downside) Basis / Earnings growth / Overweights (OW) / Underweights (UW)
(pts) (pts) %
Malaysia (KLCI) 1,636 1,830 11.9%
16x fwd PER, in line with historical mean; MKE 2020E / 2021E KLCI earnings growth at -11.3% / +44.9%, respectively; OW: Utilities, Mid-cap Financials, Healthcare/Gloves, Plantations, Tech, Autos, Construction, Large-cap Oil & Gas, NFOs UW: Aviation, Mid-Cap O&G
Singapore (STI) 3,000 3,283 9.4%
Weighted bottom up fundamentals and target PE, PB top down valuation TP; MKE 2020E / 2021E earnings growth (per coverage universe) at -24% / +26%, respectively. OW: Consumer Staples, Technology, Industrial REITS, Land Transport,; UW: Industrials, Gaming, Hospitality REITS, Financials
Indonesia (JCI) 6,428 6,900 7.3% 22x fwd PER, in line with 2SD above historical mean; MKE 2020E / 2021E market earnings growth at -38% / +38%, respectively; OW: auto, cement, , property, nickel, industrial estate. UW: cigarette
Thailand (SET) 1,536 1,191 -22.4%
18.3x fwd PER, +1SD>10y average; MKE 2020E/2021E/2022E market earnings growth at -28.8% / +6.0% / 15%, respectively; OW: Tourism, Consumer Finance, Banks, ResProp, Energy, ICT, UW: Discretionary Retailers & Transport, IE N: AgriFoods, Contractors
Philippines (PSEi)
7,273 7,650 5.2% 19.3x fwd PER, close to 1SD above 10-year historical mean; MKE 2020E / 2021E market earnings growth at -41.4% / +36.9%, respectively. OW: Consumer staples, property; UW: Discretionary staples, Banks
Vietnam (VNINDEX)
1,187 1,350 13.7% 17.4x fwd PER, +1SD above 5-year mean; MKE 2021E market earnings growth at +28%, respectively; OW: Banks/Brokerage services, real estate, logistics, and consumer; UW: textiles, pharmaceuticals.
India 14,596 11,383 -22.0% 14x fwd PER, in line with historical mean; MKE 2020E / 2021E market earnings growth at +19.4% / +40.9%, respectively; OW: Private banks, Cement, Telcos, Software. UW: State banks, Passenger vehicles/Autos.
Source: Bloomberg (as of 14 Jan 2021), Maybank KE
Fig 4: ASEAN: foreign net sell comp Fig 5: Relative Performance
Source: Bloomberg (2020), Maybank KE Source: Bloomberg (as of 14 Jan 2021), Maybank KE
0.5
1.9
2.7
4.4
4.6
4.6
5.5
6.0
6.6
7.5
7.6
9.6
(4) (2) 0 2 4 6 8 10
Malaysia
Philippines
ShangHai
India
Japan
Hong Kong
Singapore
Thailand
Taiwan
Indonesia
Vietnam
Korea
2021 YTD % gain/(loss) in local currencies
0.2 1.8
3.5 4.1
4.6 4.6
5.2 6.2
6.4 6.7 6.9
7.8 8.8
(2) (1) 0 1 2 3 4 5 6 7 8 9 10
MalaysiaPhilippinesShangHai
JapanIndia
Hong KongSingapore
ThailandMSCI Asia ex Jap
IndonesiaTaiwan
VietnamKorea
2021 % gain/(loss) in USD terms
Ticker 1M 3M YTD 1YR 3YR 5YR
MSCI Asia ex-J MXASJ Index 10.1 19.7 6.4 26.0 20.7 96.6
MSCI EM MXEF Index 9.6 20.7 6.2 19.8 13.5 89.6
MSCI ASEAN MXSO Index 3.0 20.3 4.1 (6.3) (15.0) 22.2
Malaysia FBMKLCI FBMKLCI Index (1.6) 7.4 0.5 3.5 (10.3) 0.1
Singapore FSSTI FSSTI Index 5.0 17.4 5.5 (8.3) (14.8) 13.4
Indonesia JCI JCI Index 6.9 24.2 7.5 1.6 0.9 42.4
Thailand SET SET Index 4.1 21.5 6.0 (3.2) (15.1) 21.6
Philippines PCOMP PCOMP Index (0.1) 22.7 1.9 (6.7) (17.5) 13.5
Vietnam VNINDEX VNINDEX Index 11.6 26.3 7.6 22.8 13.1 114.7
India NIFTY Nifty Index 7.7 21.9 4.4 18.1 36.6 93.7
Benchmark
Indices
Performance (%) Performance (%)

January 15, 2021 4
ASEAN+ FORTNIGHTLY
THAILAND: strategy and macro highlights Fig 1: Thailand: market strategy and sector/stock positioning Market strategy: Sustained, flush liquidity will keep the SET at these high levels i.e. c.+3SD>10Y avg PE. But with earnings growth muted, +6% YoY in 2021,
+14.9% YoY in 2022, and having multiple potential downside risks, there is no fundamental support to the lofty multiples. In the 1H21, we recommend playing the liquidity game and rotate among the momentum sectors, namely Banks, Consumer Finance, Energy/Petrochemicals and Tourism Play, including Discretionary Retailing.
SET is off to a good start, MTD up 4.6%, closing at 1,535.98 pts and putting it at 23x 2021E PE, 20.6x 2022E PE. This is too pricey relative to earnings growth expectations. The 2nd wave infection has not triggered a hard lockdown like in 2Q20 but the 28 provinces labelled as red zones combined accounts for 75% of the total GDP. Given how brittle the recovery has been so far, the effect of the restrictions could be sizable. Google Mobility shows that, from the Nov-20 level, there already has been a 22% drop in retail & recreation traffic by the 1st week of Jan - 51% in transport and 16% office work. By these numbers, we are nearly back to the traffic during the 2Q20 lockdown. How much is the impact depends on how long the situation lasts but with daily new infections still in triple digits and vaccination plan very slow (200k doses by Feb, rising to 2m by March), low mobility could persists for some time. The high 1Q season when it comes to celebrations, from New Years to Valentines, will be a write-off this year. Apart from the 2nd wave, other downside risk factors for 2021 include acute water shortage (note), political instability and international pressures (currency watchlist and labor issues by the US, freedom rights by the EU).
Another handout is what the Government is thinking of; THB3.5k/month for two months to some 30m potential recipients is under considered along with some waiver on some utilities fees. Much smaller than in the 1st round so doubtful if this will mean much, though it is still better than nothing. Thailand’s fiscal finances are conservatively managed, limiting the extent and speed of financial support should the pandemic continue to debilitate the economy for longer.
Sector/stock positioning: That vaccination is slow in materializing - some reports says that herd immunity cannot be achieved this year -has not dented the Positive
view on the Tourism sector. We like MINT and CENTEL. 4Q20 performance of the ResProp will disappoint but we stay Positive as we look forward to 2021. Our favorites are still SPALI and LH. There is chance that some of the restructured NPL will show negative slippage but we believe the amount will be much smaller than in the 1st round, and Banks’ balance sheets are strong enough, so we remain Positive here with KBANK and TMB as top picks. We also like KKP and TISCO for their high dividend yields. The Energy and Petrochemical space gyrates from all sorts of news, from the USD movement to crude supply to product shortages and so on. We stay Positive on this sector during this liquidity-driven rally, and our top picks are PTTEP and PTTGC.
ICT remains a market laggard but their good dividend yields could attract some investor’s attention. We are Positive on the sector and have Buys on ADVANC, DTAC and INTUCH.
Another laggard that could begin to gain interest is the ConsMat space and SCC is our Top Pick for both yield and potential earnings upgrade driven by higher petchem spreads and normalization of construction activities in Indonesia, Vietnam, Philippines, Myanmar and other countries in the south Asian region that are its export destinations. SCCC is also a dividend play.
There is deep value in STGT with FY21 earnings to grow 2-fold and yield to hit 7.5%. With China locking down another city with 11m residents and lockdowns in many more countries, rubber gloves play could again become attractive.
We have initiated coverage of the Power sector with a Positive rating and Buys on GULF, BGRIM and GPSC. Source: Maybank KE
Fig 2: Thailand: Tactical Buys
BBg Code Mkt. cap (USDm)
Rec. Price (THB)
TP (THB) Upside
(%)
EPS grw. (%) PER (x) ROE (%) P/B (x) Yield (%)
20E 21E 20E 21E 20E 21E 20E 21E 20E 21E CPALL TB 17,819 BUY 59.5 79.0 32.8 (20.5) 16.0 29.5 25.3 18.7 19.9 5.3 4.8 1.8 2.0 DTAC TB 2,704 BUY 34.3 47.0 37.2 4.8 0.4 14.3 14.2 22.9 22.6 3.3 3.2 5.9 6.2 KBANK TB 9,439 BUY 119.5 140.0 17.2 (47.3) 29.0 14.0 10.9 5.0 6.2 0.7 0.7 2.5 2.9 KKP TB 1,595 BUY 56.5 65.0 15.0 (12.4) 10.0 9.1 8.3 11.6 11.9 1.0 1.0 4.9 5.3 LH TB 3,287 BUY 8.3 9.2 11.5 (26.5) 10.4 13.4 12.1 14.2 15.5 1.9 1.8 6.4 7.0 MTC TB 4,647 BUY 65.8 68.0 3.4 22.4 16.6 26.9 23.0 28.4 26.1 6.8 5.4 0.5 0.6 SCC TB 15,603 BUY 390.0 430.0 10.3 11.7 8.3 12.7 11.8 12.6 12.7 1.5 1.4 4.0 4.3 STGT TB 3,525 BUY 37.0 48.3 30.4 2,174.1 109.1 8.8 4.2 70.5 63.6 3.6 2.2 4.0 7.1
Source: MKE-ISR, Bloomberg
Fig 3: Thailand: Key macroeconomic Indicators
2015 2016 2017 2018 2019 2020E 2021E
Real GDP (%) 3.1 3.4 4.1 4.2 2.4 -6.2 5.0 Private Consumption (%) 2.3 2.9 3.1 4.6 4.5 -1.6 2.7 Government Consumption (%) 2.5 2.2 0.1 2.6 1.4 1.8 2.5 Gross Fixed Capital Formation (%) 4.4 2.9 1.8 3.8 2.2 -6.0 4.4 Exports of Goods & Services (%) 1.6 2.7 5.2 3.3 -2.6 -18.9 8.3 Imports of Goods & Services (%) 0.0 -1.0 6.2 8.3 -4.4 -15.4 6.1 Current Account Balance (% of GDP) 8.0 10.5 9.6 5.6 6.8 4.0 6.0 Fiscal Balance (% of GDP) (2.9) -2.8 -3.5 -3.0 -3.0 -5.1 -4.8 Inflation Rate (%, period average) (0.9) 0.2 0.7 1.1 0.7 -0.9 1.2 Unemployment Rate (%, period average) 0.9 1.0 1.2 1.1 1.1 2.0 1.6 Exchange Rate (per USD, end-period) 36.04 35.8 32.6 32.3 30.0 30.5 29.7 Benchmark Interest Rate (% p.a., end-period) 1.50 1.50 1.50 1.75 1.25 0.50 0.50 Source: MKE-ISR
Fig 4: SET’s 12M forward PER Fig 5: SET’s trailing P/B
Source: Bloomberg, Maybank KE Source: Bloomberg, Maybank KE
5
10
15
20
25
30
Jan-1
0
Jan-1
1
Jan-1
2
Jan-1
3
Jan-1
4
Jan-1
5
Jan-1
6
Jan-1
7
Jan-1
8
Jan-1
9
Jan-2
0
Jan-2
1
1-Yr Forwad PER Mean
+1SD -1SD(x)
1.0
1.5
2.0
2.5
3.0
Jan-1
0
Jan-1
1
Jan-1
2
Jan-1
3
Jan-1
4
Jan-1
5
Jan-1
6
Jan-1
7
Jan-1
8
Jan-1
9
Jan-2
0
Jan-2
1
SET P/B Mean
+1SD -1SD
(x)
January 15, 2021 5
ASEAN+ FORTNIGHTLY
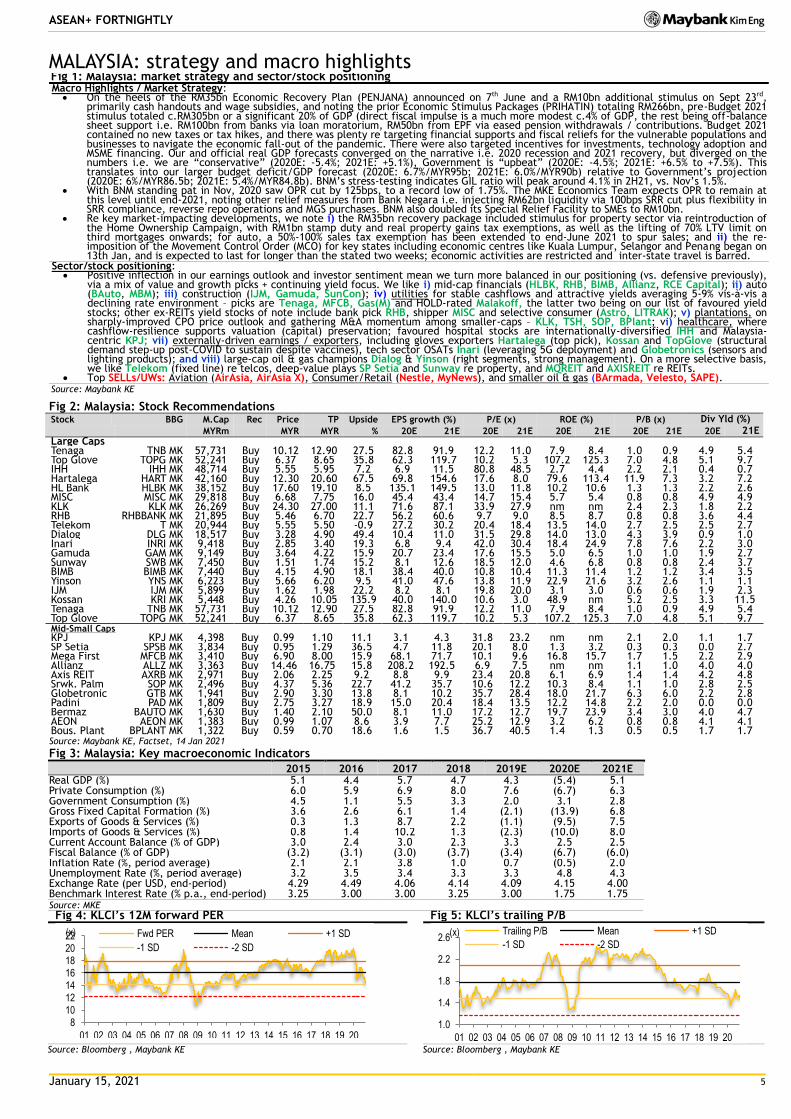
MALAYSIA: strategy and macro highlights Fig 1: Malaysia: market strategy and sector/stock positioning Macro Highlights / Market Strategy: On the heels of the RM35bn Economic Recovery Plan (PENJANA) announced on 7th June and a RM10bn additional stimulus on Sept 23rd,
primarily cash handouts and wage subsidies, and noting the prior Economic Stimulus Packages (PRIHATIN) totaling RM266bn, pre-Budget 2021 stimulus totaled c.RM305bn or a significant 20% of GDP (direct fiscal impulse is a much more modest c.4% of GDP, the rest being off-balance sheet support i.e. RM100bn from banks via loan moratorium, RM50bn from EPF via eased pension withdrawals / contributions. Budget 2021 contained no new taxes or tax hikes, and there was plenty re targeting financial supports and fiscal reliefs for the vulnerable populations and businesses to navigate the economic fall-out of the pandemic. There were also targeted incentives for investments, technology adoption and MSME financing. Our and official real GDP forecasts converged on the narrative i.e. 2020 recession and 2021 recovery, but diverged on the numbers i.e. we are “conservative” (2020E: -5.4%; 2021E: +5.1%), Government is “upbeat” (2020E: -4.5%; 2021E: +6.5% to +7.5%). This translates into our larger budget deficit/GDP forecast (2020E: 6.7%/MYR95b; 2021E: 6.0%/MYR90b) relative to Government’s projection (2020E: 6%/MYR86.5b; 2021E: 5.4%/MYR84.8b). BNM’s stress-testing indicates GIL ratio will peak around 4.1% in 2H21, vs. Nov’s 1.5%.
With BNM standing pat in Nov, 2020 saw OPR cut by 125bps, to a record low of 1.75%. The MKE Economics Team expects OPR to remain at this level until end-2021, noting other relief measures from Bank Negara i.e. injecting RM62bn liquidity via 100bps SRR cut plus flexibility in SRR compliance, reverse repo operations and MGS purchases. BNM also doubled its Special Relief Facility to SMEs to RM10bn.
Re key market-impacting developments, we note i) the RM35bn recovery package included stimulus for property sector via reintroduction of the Home Ownership Campaign, with RM1bn stamp duty and real property gains tax exemptions, as well as the lifting of 70% LTV limit on third mortgages onwards; for auto, a 50%-100% sales tax exemption has been extended to end-June 2021 to spur sales; and ii) the re-imposition of the Movement Control Order (MCO) for key states including economic centres like Kuala Lumpur, Selangor and Penang began on 13th Jan, and is expected to last for longer than the stated two weeks; economic activities are restricted and inter-state travel is barred.
Sector/stock positioning: Positive inflection in our earnings outlook and investor sentiment mean we turn more balanced in our positioning (vs. defensive previously),
via a mix of value and growth picks + continuing yield focus. We like i) mid-cap financials (HLBK, RHB, BIMB, Allianz, RCE Capital); ii) auto (BAuto, MBM); iii) construction (IJM, Gamuda, SunCon); iv) utilities for stable cashflows and attractive yields averaging 5-9% vis-à-vis a declining rate environment – picks are Tenaga, MFCB, Gas(M) and HOLD-rated Malakoff, the latter two being on our list of favoured yield stocks; other ex-REITs yield stocks of note include bank pick RHB, shipper MISC and selective consumer (Astro, LITRAK); v) plantations, on sharply-improved CPO price outlook and gathering M&A momentum among smaller-caps – KLK, TSH, SOP, BPlant; vi) healthcare, where cashflow-resilience supports valuation (capital) preservation; favoured hospital stocks are internationally-diversified IHH and Malaysia-centric KPJ; vii) externally-driven earnings / exporters, including gloves exporters Hartalega (top pick), Kossan and TopGlove (structural demand step-up post-COVID to sustain despite vaccines), tech sector OSATs Inari (leveraging 5G deployment) and Globetronics (sensors and lighting products); and viii) large-cap oil & gas champions Dialog & Yinson (right segments, strong management). On a more selective basis, we like Telekom (fixed line) re telcos, deep-value plays SP Setia and Sunway re property, and MQREIT and AXISREIT re REITs.
Top SELLs/UWs: Aviation (AirAsia, AirAsia X), Consumer/Retail (Nestle, MyNews), and smaller oil & gas (BArmada, Velesto, SAPE). Source: Maybank KE
Fig 2: Malaysia: Stock Recommendations
Stock BBG M.Cap Rec Price TP Upside EPS growth (%) P/E (x) ROE (%) P/B (x) Div Yld (%)
MYRm MYR MYR % 20E 21E 20E 21E 20E 21E 20E 21E 20E 21E Large Caps Tenaga TNB MK 57,731 Buy 10.12 12.90 27.5 82.8 91.9 12.2 11.0 7.9 8.4 1.0 0.9 4.9 5.4 Top Glove TOPG MK 52,241 Buy 6.37 8.65 35.8 62.3 119.7 10.2 5.3 107.2 125.3 7.0 4.8 5.1 9.7 IHH IHH MK 48,714 Buy 5.55 5.95 7.2 6.9 11.5 80.8 48.5 2.7 4.4 2.2 2.1 0.4 0.7 Hartalega HART MK 42,160 Buy 12.30 20.60 67.5 69.8 154.6 17.6 8.0 79.6 113.4 11.9 7.3 3.2 7.2 HL Bank HLBK MK 38,152 Buy 17.60 19.10 8.5 135.1 149.5 13.0 11.8 10.2 10.6 1.3 1.3 2.2 2.6 MISC MISC MK 29,818 Buy 6.68 7.75 16.0 45.4 43.4 14.7 15.4 5.7 5.4 0.8 0.8 4.9 4.9 KLK KLK MK 26,269 Buy 24.30 27.00 11.1 71.6 87.1 33.9 27.9 nm nm 2.4 2.3 1.8 2.2 RHB RHBBANK MK 21,895 Buy 5.46 6.70 22.7 56.2 60.6 9.7 9.0 8.5 8.7 0.8 0.8 3.6 4.4 Telekom T MK 20,944 Buy 5.55 5.50 -0.9 27.2 30.2 20.4 18.4 13.5 14.0 2.7 2.5 2.5 2.7 Dialog DLG MK 18,517 Buy 3.28 4.90 49.4 10.4 11.0 31.5 29.8 14.0 13.0 4.3 3.9 0.9 1.0 Inari INRI MK 9,418 Buy 2.85 3.40 19.3 6.8 9.4 42.0 30.4 18.4 24.9 7.8 7.6 2.2 3.0 Gamuda GAM MK 9,149 Buy 3.64 4.22 15.9 20.7 23.4 17.6 15.5 5.0 6.5 1.0 1.0 1.9 2.7 Sunway SWB MK 7,450 Buy 1.51 1.74 15.2 8.1 12.6 18.5 12.0 4.6 6.8 0.8 0.8 2.4 3.7 BIMB BIMB MK 7,440 Buy 4.15 4.90 18.1 38.4 40.0 10.8 10.4 11.3 11.4 1.2 1.2 3.4 3.5 Yinson YNS MK 6,223 Buy 5.66 6.20 9.5 41.0 47.6 13.8 11.9 22.9 21.6 3.2 2.6 1.1 1.1 IJM IJM MK 5,899 Buy 1.62 1.98 22.2 8.2 8.1 19.8 20.0 3.1 3.0 0.6 0.6 1.9 2.3 Kossan KRI MK 5,448 Buy 4.26 10.05 135.9 40.0 140.0 10.6 3.0 48.9 nm 5.2 2.5 3.3 11.5 Tenaga TNB MK 57,731 Buy 10.12 12.90 27.5 82.8 91.9 12.2 11.0 7.9 8.4 1.0 0.9 4.9 5.4 Top Glove TOPG MK 52,241 Buy 6.37 8.65 35.8 62.3 119.7 10.2 5.3 107.2 125.3 7.0 4.8 5.1 9.7 Mid-Small Caps KPJ KPJ MK 4,398 Buy 0.99 1.10 11.1 3.1 4.3 31.8 23.2 nm nm 2.1 2.0 1.1 1.7 SP Setia SPSB MK 3,834 Buy 0.95 1.29 36.5 4.7 11.8 20.1 8.0 1.3 3.2 0.3 0.3 0.0 2.7 Mega First MFCB MK 3,410 Buy 6.90 8.00 15.9 68.1 71.7 10.1 9.6 16.8 15.7 1.7 1.5 2.2 2.9 Allianz ALLZ MK 3,363 Buy 14.46 16.75 15.8 208.2 192.5 6.9 7.5 nm nm 1.1 1.0 4.0 4.0 Axis REIT AXRB MK 2,971 Buy 2.06 2.25 9.2 8.8 9.9 23.4 20.8 6.1 6.9 1.4 1.4 4.2 4.8 Srwk. Palm SOP MK 2,496 Buy 4.37 5.36 22.7 41.2 35.7 10.6 12.2 10.3 8.4 1.1 1.0 2.8 2.5 Globetronic GTB MK 1,941 Buy 2.90 3.30 13.8 8.1 10.2 35.7 28.4 18.0 21.7 6.3 6.0 2.2 2.8 Padini PAD MK 1,809 Buy 2.75 3.27 18.9 15.0 20.4 18.4 13.5 12.2 14.8 2.2 2.0 0.0 0.0 Bermaz BAUTO MK 1,630 Buy 1.40 2.10 50.0 8.1 11.0 17.2 12.7 19.7 23.9 3.4 3.0 4.0 4.7 AEON AEON MK 1,383 Buy 0.99 1.07 8.6 3.9 7.7 25.2 12.9 3.2 6.2 0.8 0.8 4.1 4.1 Bous. Plant BPLANT MK 1,322 Buy 0.59 0.70 18.6 1.6 1.5 36.7 40.5 1.4 1.3 0.5 0.5 1.7 1.7 Source: Maybank KE, Factset, 14 Jan 2021
Fig 3: Malaysia: Key macroeconomic Indicators
2015 2016 2017 2018 2019E 2020E 2021E Real GDP (%) 5.1 4.4 5.7 4.7 4.3 (5.4) 5.1 Private Consumption (%) 6.0 5.9 6.9 8.0 7.6 (6.7) 6.3 Government Consumption (%) 4.5 1.1 5.5 3.3 2.0 3.1 2.8 Gross Fixed Capital Formation (%) 3.6 2.6 6.1 1.4 (2.1) (13.9) 6.8 Exports of Goods & Services (%) 0.3 1.3 8.7 2.2 (1.1) (9.5) 7.5 Imports of Goods & Services (%) 0.8 1.4 10.2 1.3 (2.3) (10.0) 8.0 Current Account Balance (% of GDP) 3.0 2.4 3.0 2.3 3.3 2.5 2.5 Fiscal Balance (% of GDP) (3.2) (3.1) (3.0) (3.7) (3.4) (6.7) (6.0) Inflation Rate (%, period average) 2.1 2.1 3.8 1.0 0.7 (0.5) 2.0 Unemployment Rate (%, period average) 3.2 3.5 3.4 3.3 3.3 4.8 4.3 Exchange Rate (per USD, end-period) 4.29 4.49 4.06 4.14 4.09 4.15 4.00 Benchmark Interest Rate (% p.a., end-period) 3.25 3.00 3.00 3.25 3.00 1.75 1.75 Source: MKE Fig 4: KLCI’s 12M forward PER Fig 5: KLCI’s trailing P/B
Source: Bloomberg , Maybank KE Source: Bloomberg , Maybank KE
810121416182022
01 02 03 04 05 06 07 08 09 10 11 12 13 14 15 16 17 18 19 20
(x) Fwd PER Mean +1 SD
-1 SD -2 SD
1.0
1.4
1.8
2.2
2.6
01 02 03 04 05 06 07 08 09 10 11 12 13 14 15 16 17 18 19 20
(x) Trailing P/B Mean +1 SD
-1 SD -2 SD

January 15, 2021 6
ASEAN+ FORTNIGHTLY
SINGAPORE: strategy and macro highlights Fig 1: Singapore: market strategy and sector/stock positioning
Market strategy: 2020 GDP fell -5.8% (vs. +0.7% in 2019), which was in-line with MKE expectations. Manufacturing was the critical driver, with Services
continuing to see a slow pace of recovery given sluggishness of external oriented sectors such as transport, wholesale trade etc. We maintain our +4.5% GDP growth expectations for 2021E and see the recovery to be ‘U’ shaped vs. ‘V’ given the snail-pace easing of
border controls and the expected time taken to achieve herd-immunity. We remain constructive on Industrial REITs from continued capital inflows given strong liquidity and improved cashflow visibility from
overseas contributions. We expect upside risks from DPU-accretive M&A given low borrowing costs – especially for the larger REITs. We have initiated with a negative on Office REITs from weak structural trends such as demand erosion from WFH, recessionary
conditions and limited M&A opportunities. We expect tight palm oil supplies to last at least till mid-2021 from the confluence of under-invested capacity, bad weather and tight
inventories of substitutes. As a result, we expect our MYR2,500/t CPO ASP for 2021 to have upside risks going forward. Reports from global chipmakers and key customers point to robust spending on semiconductor equipment, while the recent lockdowns
in Malaysia are expected to have limited impact on the Singapore technology manufactures. 2021E could remain volatile, gyrated by massive liquidity, regional uncertainty and vaccine logistics. Singapore’s vaccine-optimism-
driven November re-rating was mostly a large-cap rally. Mid/small caps have staged less of a come-back. For sector weightings, we are NEGATIVE on the Banks, Consumer, Gaming, Developers and Industrials while we are POSITIVE on Tech,
Telcos, Land Transport, Plantations and REITS.
Sector/stock positioning: Volatility remains a critical concern. As a result, we seek to balance growth with some defense. We also look to increase weightings to
mid/small caps that have lagged. We add exposure to value through Financials (SGX), Telcos (ST), Transport (CD) and to structural growth through Tech (AEM, FRKN,
VMS) and Plantations (FR, WIL). For defense, we add Industrial REITS (AREIT, MLT). We initiate on KREIT and SUN with SELL ratings and downgrade HIP to SELL (from BUY) following its privatization offer
Source: Maybank KE
Fig 2: Singapore: stock recommendations
Stock BBG M.Cap Rec Price TP Ret. EPS gr. (%) P/E (x) ROE (%) P/B (x) Div Yld (%)
USD SGD SGD % 20E 21E 20E 21E 20E 21E 20E 21E 20E 21E
BUY (Large Caps)
AREIT AREIT SP 8,576 Buy 3.03 4.00 32.0 8.2 9.1 19.4 18.3 6.9 7.3 1.4 1.4 5.1 5.4
SGX SGX SP 8,055 Buy 9.97 10.77 8.0 (7) 2.2 23.7 22.5 34.9 33.7 8.4 7.7 3.2 3.4
MLT MLT SP 6,294 Buy 2.02 2.40 18.8 (18) 9.0 24.1 23.5 6.4 6.6 1.6 1.6 4.1 4.2
Wilmar WIL SP 25,008 Buy 5.18 6.80 31.3 10.1 6.6 18.4 15.6 8.4 8.7 1.5 1.4 5.5 4.0
SingTel ST SP 30,901 Buy 2.51 2.88 14.7 50.9 65.4 25.3 15.2 6.0 9.9 1.5 1.5 3.8 4.9
Comfortdelgro
CD SP 2,794 Buy 1.71 1.88 9.9 (72) 188 45.0 24.4 2.8 7.8 1.4 1.3 0.5 2.5
Venture VMS SP 4,407 Hold 20.08 23.27 15.9 (17) 18 19.7 16.1 11.9 13.4 2.3 2.1 3.7 3.7
BUY (SMID - M.Cap <USD2b) FirstRes FR SP 1,983 Buy 1.66 1.96 18.1 40.2 21.1 15.5 14.6 11.7 13.2 1.7 1.6 1.9 2.1
AEM AEM SP 808 Buy 3.87 5.05 30.5 78.6 9.7 11.7 10.7 56.0 43.2 5.3 3.9 2.1 2.3
Frencken FRKN SP 441 Buy 1.37 1.39 1.5 (3.4) 15.9 13.8 11.6 13.2 13.9 1.8 1.6 2.2 2.6
Source: Maybank Kim Eng, FactSet
Fig 3: Singapore: Key macroeconomic Indicators
2016 2017 2018 2019 2020E 2021E
Real GDP (%) 3.0 3.7 3.1 0.7 (5.8) 4.5
Private Consumption (%) 2.7 3.4 2.7 3.7 (13.3) 8.4
Government Consumption (%) 3.7 4.5 4.1 2.8 13.9 (3.2)
Gross Fixed Capital Formation (%) 1.1 6.4 (4.0) (0.2) (12.4) 6.3
Exports of Goods & Services (%) 0.0 5.7 5.1 (1.6) (6.9) 5.2
Imports of Goods & Services (%) 0.1 7.5 4.7 (1.7) (7.7) 4.9
Current Account Balance (% of GDP) 17.5 16.4 17.9 17.0 16.5 17.0
Fiscal Balance (% of GDP) 1.4 2.3 0.4 (0.3) (15.4) (4.0)
Inflation Rate (%, period average) (0.5) 0.6 0.4 0.6 (0.3) 0.5
Unemployment Rate (%, period average) 2.1 2.2 2.1 2.2 3.8 3.0
Exchange Rate (per USD, end-period) 1.45 1.34 1.36 1.35 1.32 1.28
3M SIBOR (% p.a., end-period) 0.97 1.50 1.89 1.77 0.41 0.40 Source: MKE
Fig 4: FSSTI 12M forward PER
Source: Bloomberg as of 14 Jan 2021, Maybank KE
Fig 5: FSSTI 12M forward P/B
Source: Bloomberg as of 14 Jan 2021, Maybank KE
10.0
12.0
14.0
16.0
18.0
20.0
22.0
Jan-1
1
Jan-1
2
Jan-1
3
Jan-1
4
Jan-1
5
Jan-1
6
Jan-1
7
Jan-1
8
Jan-1
9
Jan-2
0
Jan-2
1
x STI PE Mean +1sd
+2sd -1sd -2sd
0.8
1.0
1.2
1.4
1.6
1.8
Jan-1
1
Jan-1
2
Jan-1
3
Jan-1
4
Jan-1
5
Jan-1
6
Jan-1
7
Jan-1
8
Jan-1
9
Jan-2
0
Jan-2
1
x STI PB Mean +1sd
+2sd -1sd -2sd
January 15, 2021 7
ASEAN+ FORTNIGHTLY
INDONESIA: strategy and macro highlights Fig 1: Indonesia: market strategy and sector/stock positioning Market strategy:
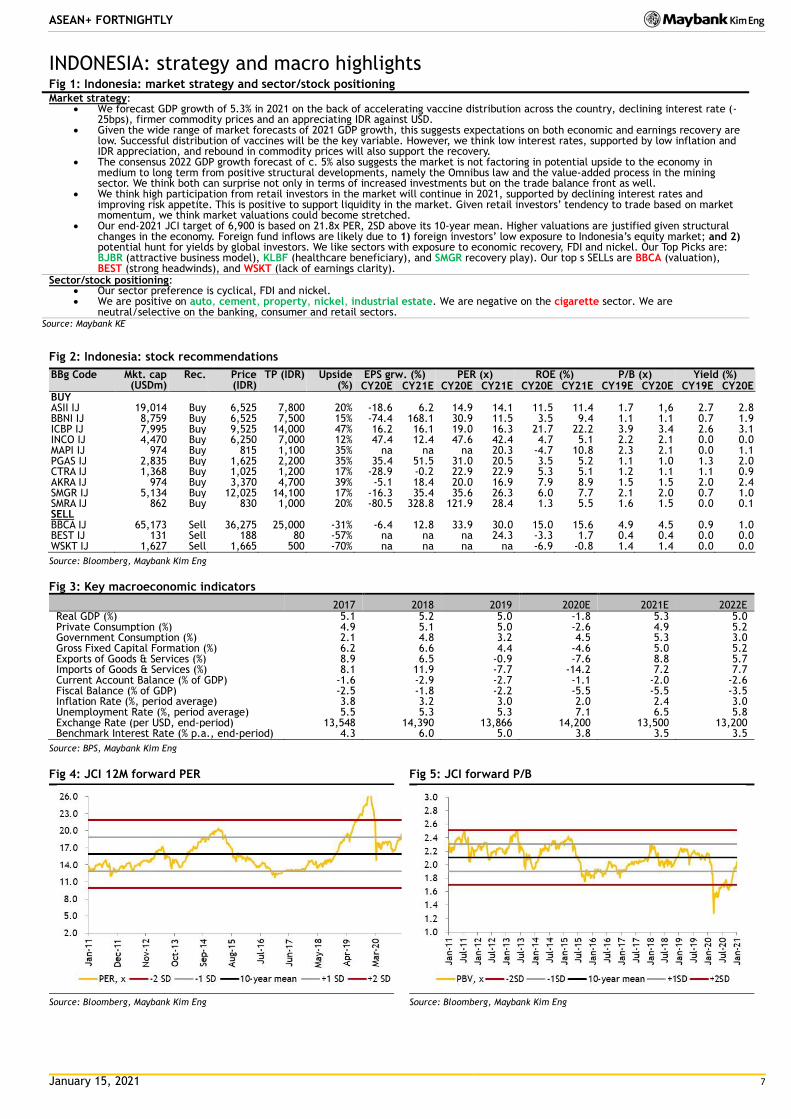
We forecast GDP growth of 5.3% in 2021 on the back of accelerating vaccine distribution across the country, declining interest rate (-25bps), firmer commodity prices and an appreciating IDR against USD.
Given the wide range of market forecasts of 2021 GDP growth, this suggests expectations on both economic and earnings recovery are low. Successful distribution of vaccines will be the key variable. However, we think low interest rates, supported by low inflation and IDR appreciation, and rebound in commodity prices will also support the recovery.
The consensus 2022 GDP growth forecast of c. 5% also suggests the market is not factoring in potential upside to the economy in medium to long term from positive structural developments, namely the Omnibus law and the value-added process in the mining sector. We think both can surprise not only in terms of increased investments but on the trade balance front as well.
We think high participation from retail investors in the market will continue in 2021, supported by declining interest rates and improving risk appetite. This is positive to support liquidity in the market. Given retail investors’ tendency to trade based on market momentum, we think market valuations could become stretched.
Our end-2021 JCI target of 6,900 is based on 21.8x PER, 2SD above its 10-year mean. Higher valuations are justified given structural changes in the economy. Foreign fund inflows are likely due to 1) foreign investors’ low exposure to Indonesia’s equity market; and 2) potential hunt for yields by global investors. We like sectors with exposure to economic recovery, FDI and nickel. Our Top Picks are: BJBR (attractive business model), KLBF (healthcare beneficiary), and SMGR recovery play). Our top s SELLs are BBCA (valuation), BEST (strong headwinds), and WSKT (lack of earnings clarity).
Sector/stock positioning: Our sector preference is cyclical, FDI and nickel. We are positive on auto, cement, property, nickel, industrial estate. We are negative on the cigarette sector. We are
neutral/selective on the banking, consumer and retail sectors. Source: Maybank KE
Fig 2: Indonesia: stock recommendations
BBg Code Mkt. cap (USDm)
Rec. Price (IDR)
TP (IDR) Upside (%)
EPS grw. (%) PER (x) ROE (%) P/B (x) Yield (%) CY20E CY21E CY20E CY21E CY20E CY21E CY19E CY20E CY19E CY20E
BUY ASII IJ 19,014 Buy 6,525 7,800 20% -18.6 6.2 14.9 14.1 11.5 11.4 1.7 1,6 2.7 2.8 BBNI IJ 8,759 Buy 6,525 7,500 15% -74.4 168.1 30.9 11.5 3.5 9.4 1.1 1.1 0.7 1.9 ICBP IJ 7,995 Buy 9,525 14,000 47% 16.2 16.1 19.0 16.3 21.7 22.2 3.9 3.4 2.6 3.1 INCO IJ 4,470 Buy 6,250 7,000 12% 47.4 12.4 47.6 42.4 4.7 5.1 2.2 2.1 0.0 0.0 MAPI IJ 974 Buy 815 1,100 35% na na na 20.3 -4.7 10.8 2.3 2.1 0.0 1.1 PGAS IJ 2,835 Buy 1,625 2,200 35% 35.4 51.5 31.0 20.5 3.5 5.2 1.1 1.0 1.3 2.0 CTRA IJ 1,368 Buy 1,025 1,200 17% -28.9 -0.2 22.9 22.9 5.3 5.1 1.2 1.1 1.1 0.9 AKRA IJ 974 Buy 3,370 4,700 39% -5.1 18.4 20.0 16.9 7.9 8.9 1.5 1.5 2.0 2.4 SMGR IJ 5,134 Buy 12,025 14,100 17% -16.3 35.4 35.6 26.3 6.0 7.7 2.1 2.0 0.7 1.0 SMRA IJ 862 Buy 830 1,000 20% -80.5 328.8 121.9 28.4 1.3 5.5 1.6 1.5 0.0 0.1 SELL BBCA IJ 65,173 Sell 36,275 25,000 -31% -6.4 12.8 33.9 30.0 15.0 15.6 4.9 4.5 0.9 1.0 BEST IJ 131 Sell 188 80 -57% na na na 24.3 -3.3 1.7 0.4 0.4 0.0 0.0 WSKT IJ 1,627 Sell 1,665 500 -70% na na na na -6.9 -0.8 1.4 1.4 0.0 0.0
Source: Bloomberg, Maybank Kim Eng
Fig 3: Key macroeconomic indicators
2017 2018 2019 2020E 2021E 2022E Real GDP (%) 5.1 5.2 5.0 -1.8 5.3 5.0 Private Consumption (%) 4.9 5.1 5.0 -2.6 4.9 5.2 Government Consumption (%) 2.1 4.8 3.2 4.5 5.3 3.0 Gross Fixed Capital Formation (%) 6.2 6.6 4.4 -4.6 5.0 5.2 Exports of Goods & Services (%) 8.9 6.5 -0.9 -7.6 8.8 5.7 Imports of Goods & Services (%) 8.1 11.9 -7.7 -14.2 7.2 7.7 Current Account Balance (% of GDP) -1.6 -2.9 -2.7 -1.1 -2.0 -2.6 Fiscal Balance (% of GDP) -2.5 -1.8 -2.2 -5.5 -5.5 -3.5 Inflation Rate (%, period average) 3.8 3.2 3.0 2.0 2.4 3.0 Unemployment Rate (%, period average) 5.5 5.3 5.3 7.1 6.5 5.8 Exchange Rate (per USD, end-period) 13,548 14,390 13,866 14,200 13,500 13,200 Benchmark Interest Rate (% p.a., end-period) 4.3 6.0 5.0 3.8 3.5 3.5
Source: BPS, Maybank Kim Eng
Fig 4: JCI 12M forward PER
Source: Bloomberg, Maybank Kim Eng
Fig 5: JCI forward P/B
Source: Bloomberg, Maybank Kim Eng

January 15, 2021 8
ASEAN+ FORTNIGHTLY
PHILIPPINES: strategy and macro highlights Fig 1: Philippines: market strategy and sector/stock positioning Market strategy:
The PSEi rallied by 1.7% in Dec 29 – Jan 12. Despite fears of a surge in COVID-19 cases after the holiday season as the Jan 11 count breached the 2,000 level, market sentiment remained positive as the Philippines enters more vaccine deals. Vaccine Czar Secretary Galvez stated that the government is aiming to start the vaccine rollout as early as Feb and that vaccination will likely begin in 2H21. The Philippines remains to have the 2nd highest number of total COVID-19 cases at 489,736 (22,114 active cases) compared to its ASEAN peers.
On the macro front, inflation accelerated further to 3.5% in Dec, from 3.3% in Nov, translating to 2.6% for FY20, which is within MKE estimates. Domestic demand continues to lag as exports rebounded but imports continue to fall and PMI data slowed further to 49.2 in Dec, from 49.9 in Nov. Nevertheless, the Bangko Sentral ng Pilipinas (BSP) stated that the FY21 GDP growth target of 6.5-7.5% is easily attainable amid easing restrictions and improvements in the healthcare system.
Foreign investors are net sellers at USD3.0m for the period of Dec 29 – Jan 12. Current market valuation of 19.3x on 12-month forward P/E is slightly above the 10Y mean of 18.4x.
Positive catalysts: faster earnings recovery, liquidity support from more RRR cuts, expected corporate tax cuts from CREATE Act, strong Peso, progress on infra build-up, and early vaccine rollouts. Risks: new strain of COVID-19 entering the country, spikes in inflation rate, and regulatory and external risks.
Near-term macro events that could impact our market/stock positioning include legislation on tax reforms (specifically the CREATE and FIST bills).
Sector/stock positioning: Our 12-month PSEi target is set at 7,650. This implies a PER of 19.3x, which is above the 10-year mean of 18.4x but is justified given the
double earnings outlook in FY21/22 of 36.9%/22.4%. As a second-wave induced lockdown is the key risk to our forecasts, we recommend a value portfolio with a balanced exposure to
staple/at-home consumption and recovery plays. While BDO [link] continues to be our top pick in the banking sector, we favor more direct recovery plays and as such, swap BDO out for HOME [link].
CNPF [link] and URC [link] are our preferred staples-or at-home consumption plays given both stocks’ high earnings visibility and strong and highly liquid balance sheets. CNPF and URC are poised to benefit the most from sustained spending on essential items but should also capture the uptick in discretionary spending both names’ wide product depth.
RLC [link], AC [link] and HOME are our recommended recovery plays. RLC is very minimally exposed to Philippine Offshore Gaming Operators (POGOs), which have been slowly exiting the country, and FY21E/22E will largely be driven by the recovery of its malls segment, especially as we expect a vaccine to be available by 2H21. Its earnings also stand to benefit from the group’s Chengdu residential project, which should start booking earnings by FY21E. AC, on the other hand, offers an NAV accretion story that should see an uplift from its property development segment, which should benefit from resumption of construction activity and vaccine availability, and its power generation business, which aims to double its attributable capacity to 5GW by 2025. Lastly, HOME should benefit from the improving outlook on the property sector and synergies with its affiliate Vista Land (VLL PM). Its soft categories (generally the moveable items in a home, including hardware, furniture, appliances, linens, etc) will continue to be supported by work-from-home and learn-from-home trends and will provide downside protection to HOME’s FY21 growth story, while a pick-up in property construction activities should boost demand for hard categories (tiles, plumbing, sanitary wares, construction materials, etc).
Our top underweight is fast food giant Jollibee Foods Corporation [link] as recovery remains to be underwhelming and this is further emphasized by the plethora of headwinds and risks the company’s operations face such as the re-imposition of lockdowns, protracted foot traffic recovery and negative effects of the shift to deliveries.
Source: Maybank Kim Eng
Fig 2: Philippines: stock recommendations
BBg Code
Mkt cap
Rec. Price TP Upsid
e EPS grw. (%) PER (x) ROE (%) P/B (x) Div. Yield (%)
(PHPm)
(PHP) (PHP) (%) CY20E CY21E CY20E CY21E CY20E CY21E CY20E CY21E CY20E CY21E
Top picks Century Pacific CNPF PM 1,370 BUY 18.6 21.1 13.6 25.6 8.7 16.0 14.7 18.0 17.0 2.9 2.5 2.0 1.4 Univl Robina URC PM 7,257 BUY 158.2 175.0 10.6 2.0 9.8 26.6 24.2 12.3 12.7 3.3 3.1 2.3 2.3 AllHome HOME PM 710 BUY 9.1 10.2 12.1 (30.6) 41.3 33.6 23.8 7.2 9.3 2.4 2.2 0.5 0.6 Robinsons Land RLC PM 2,378 BUY 22.0 27.4 24.5 (31.4) 74.2 13.6 7.8 5.5 8.8 0.7 0.7 3.2 3.2 Ayala Corp AC PM 10,968 BUY 840.0 959.0 14.2 (53.3) 36.5 32.1 23.5 5.7 7.1 1.6 1.5 1.1 0.5 Least preferred
Jollibee Foods JFC PM 4,587 SELL 199.0 165.0 -17.1 -chg +chg (24.9) 62.7 nm 14.8 5.9 5.6 0.3 0.5
Source: Maybank Kim Eng, Bloomberg as of 12 Jan closing price
Fig 3: Philippines: Key macroeconomic indicators
FY17 FY18 FY19 FY20E FY21E FY22E
Real GDP (%) 6.7 6.2 6.0 (7.8) 5.8 6.2 Private Consumption (%) 5.9 5.6 5.9 (6.4) 4.5 6.1 Government Consumption (%) 7.0 13.0 9.8 9.8 4.9 5.8 Gross Fixed Capital Formation (%) 9.5 12.9 4.1 (22.8) 5.6 9.2 Exports of Goods & Services (%) 19.5 11.5 2.4 (16.2) 3.2 6.4 Imports of Goods & Services (%) 18.1 16.0 2.0 (19.7) 6.9 7.9 Current Account Balance (% of GDP) (0.7) (2.6) (0.1) 2.0 1.0 0.0 Fiscal Balance (% of GDP) (2.2) (3.2) (3.4) (8.8) (8.1) (7.0) Inflation Rate (%, period average) 2.9 5.2 2.5 2.6 2.8 2.5 Unemployment Rate (%, period average) 5.7 5.3 5.1 10.4 7.5 6.5 Exchange Rate (per USD, end-period) 49.9 52.6 50.7 48.0 47.0 46.0 10-Year Government Bond Yield (%, end-period) 4.9 7.0 4.3 2.9 3.4 3.7 Benchmark Interest Rate (% p.a., end-period) 3.0 4.75 4.00 2.00 2.00 2.50
Source: CEIC, Maybank Kim Eng
Fig 4: PSEi’s 12M forward PER Fig 5: PSEi’s trailing P/B
Source: Bloomberg, Maybank Kim Eng Source: Bloomberg, Maybank KE
5.0
10.0
15.0
20.0
25.0
30.0
Jan-1
0
Jan-1
1
Jan-1
2
Jan-1
3
Jan-1
4
Jan-1
5
Jan-1
6
Jan-1
7
Jan-1
8
Jan-1
9
Jan-2
0
Jan-2
1
(x) 12M Fwd PE (LHS) 10Y Mean: 18.3x
+1SD: 20.8x -1SD: 15.8x
1.0
2.0
3.0
4.0
Dec-1
0
Dec-1
1
Dec-1
2
Dec-1
3
Dec-1
4
Dec-1
5
Dec-1
6
Dec-1
7
Dec-1
8
Dec-1
9
Dec-2
0
(x) Trail Pb (LHS) 10Y Mean: 2.3x+1SD: 2.7x -1SD: 1.9x

January 15, 2021 9
ASEAN+ FORTNIGHTLY
VIETNAM: strategy and macro highlights Fig 1: Vietnam: market strategy and sector/stock positioning
1.1 Market strategy: Our end-2021 target for the VNIndex is 1,350 pts, based on assumptions that EPS will grow 28% YoY and the index will end the year at 17.4
times its earnings in 2021. Although the target PER is 10% higher than the 5-year average of 16x, we think it is reasonable because there are similarities between the current period and 2017-2018 in terms of earnings growth and liquidity (which is actually stronger in 2021).
MKE economists forecast VN’s GDP growth to rebound to +6.8% in 2021 and remain strong at +6.7% in 2022 (vs. +2.9% in 2020), cementing Vietnam’s position as one of the best growth stories in ASEAN. Exports and manufacturing will remain the main growth engines. Private consumption (68% of GDP) and investment (32% of GDP) are recovering from the Covid-induced slowdown. Tourism & hospitality-related sectors may, however, remain under pressure near term, as border controls remain tight. Investments will return on the back of a pick-up in private investments and FDI. There are early signs of a capex recovery, as imports of capital goods rebounded back to pre-Covid levels while credit growth appear to be bottoming out. Public investments on the back of the infrastructure push will provide another leg up for growth.
According to data compiled by Bloomberg, 2021 earnings of companies listed on HOSE are estimated to jump 28% YoY for the 10-year high, which are thanks to the low base of 2020 and the acceleration of the economy in 2021. Sectors expected to see the strongest earnings growth include: Energy (44%), Consumer Discretionary (28%), Real estate (26%) and financials (22%).
Impending macro events that could impact our market positioning: (1) More positive progress on development and distribution of vaccines against Covid-19. Risk: (1) Biggest risk is possible vaccine delay or shorter-than-expected duration of vaccine protection, resulting in elevated global Covid cases, renewed lockdowns and a weak global economic recovery, and (2) Potential risk of VN being labelled as “currency manipulator” by US Treasury.
1.2 Sector/stock positioning: Although we remain positive on the broad stock market in 2021, unabated rally driven by exuberant retail sentiment has pushed the valuation
up too fast over Dec 20-Jan 21, close to the peak 22x P/E recorded in 2018. We thus recommend long-term investors time for better entry at correction points or accumulate stocks that have lagged and those with strong catalysts. Our top stock picks include: Banks: VPB, ACB and TCB/MBB, Real estate/IPs: NVL, KBC, GVR; Consumers: MWG, PNJ, MSN, QNS; Logistics: ACV, AST/SCS, GMD; Energy: PLX, NT2.
FFig 2: Vietnam: stock recommendations
BBg Mk. cap Rec. Price TP
Up
side EPS grw. (%) PER (x) ROE (%) P/B (x) Div. Yield (%)
Code (VNDb)
(VND) (VND) (%) CY19 CY20E CY19 CY20E CY19 CY20E CY19 CY20E CY19 CY20E
Overweights Vietcombank VCB VN 391,658 Buy 105,600 97,300 (7.9) 34.9 -11.8 23.6 26.7 23.2 16.9 4.8 4.2 - 0.8 Vinhomes VHM VN 340,135 Buy 103,400 102,000 (1.4) 49.7 31.8 16.3 12.3 43.1 41.5 5.3 3.8 - - Vinamilk VNM VN 243,026 Buy 116,300 127,300 13.6 3.5 8.0 23.0 21.3 39.7 40.1 7.4 8.2 4.6 3.9 Techcombank TCB VN 123,022 Buy 35,100 27,400 (21.9) -24.8 12.2 12.2 10.9 17.7 16.7 2.0 1.7 - - Vincom Retail VRE VN 83,394 Buy 36,700 33,400 (9.0) 27.8 -20.9 30.0 37.9 10.3 8.0 3.2 2.9 - - Asia Com. Ba ACB VN 65,063 Buy 30,100 33,600 11.6 18.1 11.0 10.8 9.7 24.2 21.5 1.8 1.9 - - PV Power POW VN 34,191 Buy 14,600 14,200 (2.7) 30.6 -14.1 13.6 15.9 9.8 7.7 1.2 1.1 - - P. Nhuan Jewel PNJ VN 18,855 Buy 82,900 85,000 4.9 24.9 -14.6 15.9 18.6 28.7 20.9 4.1 3.6 2.1 2.2 Gemadept GMD VN 10,955 Buy 36,350 31,600 (9.1) 18.5 -12.5 24.8 28.4 8.8 6.5 1.6 1.6 6.4 2.8 Nhon Trach P NT2 VN 7,413 Buy 25,750 28,400 10.3 -3.6 -19.7 9.8 12.2 19.3 15.1 1.8 1.9 9.2 7.8 Ha Tien 1 HT1 VN 7,192 Buy 18,850 18,000 2.9 16.1 -13.9 9.7 11.2 14.2 11.7 1.3 1.3 10.0 6.4 Least preferred
PetroViet Gas GAS VN 179,146 Hold 93,600 73,900 (15.7) 3.9 -32.9 15.0 22.4 25.4 16.3 3.7 3.6 4.8 4.0 MB Bank MBB VN 73,188 Hold 26,150 19,222 (26.5) 37.3 -6.2 8.4 9.0 22.1 19.0 1.6 1.5 3.3 - DHG Pharma DHG VN 13,833 Hold 105,800 107,700 5.2 6.0 22.4 22.4 18.3 19.6 22.0 4.1 3.7 - - Source: Maybank KE, Bloomberg
Fig 3: Vietnam: Key macroeconomic Indicators
2017 2018 2019 2020E 2021E 2022E
Real GDP (%) 6.8 7.1 7.0 2.9 6.8 6.7
Private Consumption (%) 7.3 7.3 7.4 0.6 7.0 7.1
Government Consumption (%) 7.3 6.3 5.8 6.2 6.0 6.3
Gross Fixed Capital Formation (%) 10.2 8.7 8.3 4.1 8.5 9.0
Exports of Goods & Services (%) 16.7 14.3 6.7 3.0 11.0 12.0
Imports of Goods & Services (%) 17.5 12.8 8.3 2.6 10.9 12.3
Current Account Balance (% of GDP) (0.7) 2.4 4.8 2.3 3.2 3.6
Fiscal Balance (% of GDP) (2.7) (2.8) (3.3) (5.8) (4.5) (3.5)
Inflation Rate (%) 3.5 3.5 2.8 3.2 3.0 3.3
Unemployment Rate (%) 2.2 2.2 2.2 2.7 2.5 2.2
Exchange Rate (per USD, end-period) 22,698 23,175 23,173 23,098 22,500 21,700
10-Year Government Bond Yield (%, end-period) 5.14 5.15 3.56 2.61 3.00 3.30
Benchmark Interest Rate (% p.a., end-period) 6.25 6.25 6.00 4.00 4.00 4.00
Source: CEIC, Maybank Kim Eng Note: 2020 values for real GDP growth, private & government consumption, GFCF, inflation rate, exchange rate, 10Y government bond
yield & benchmark interest rate are actual.
FFig 4: VN-Index 12M forward PER FFig 5: VN-Index trailing P/B
Source: Bloomberg, Maybank KE Source: Bloomberg, Maybank KE
8
13
18
23
Sep-1
0
Mar-
11
Sep-1
1
Mar-
12
Sep-1
2
Mar-
13
Sep-1
3
Mar-
14
Sep-1
4
Mar-
15
Sep-1
5
Mar-
16
Sep-1
6
Mar-
17
Sep-1
7
Mar-
18
Sep-1
8
Mar-
19
Sep-1
9
Mar-
20
Sep-2
0
Forward PE
VNINDEX 5y Avg. -2SD
-1SD +1SD +2SD
1
2
3
Sep-1
0
Mar-
11
Sep-1
1
Mar-
12
Sep-1
2
Mar-
13
Sep-1
3
Mar-
14
Sep-1
4
Mar-
15
Sep-1
5
Mar-
16
Sep-1
6
Mar-
17
Sep-1
7
Mar-
18
Sep-1
8
Mar-
19
Sep-1
9
Mar-
20
Sep-2
0
PB
VNINDEX 5y Avg. -2SD
-1SD +1SD +2SD
January 15, 2021 10
ASEAN+ FORTNIGHTLY
INDIA: strategy and macro highlights Fig 1:India: market strategy and sector/stock positioning
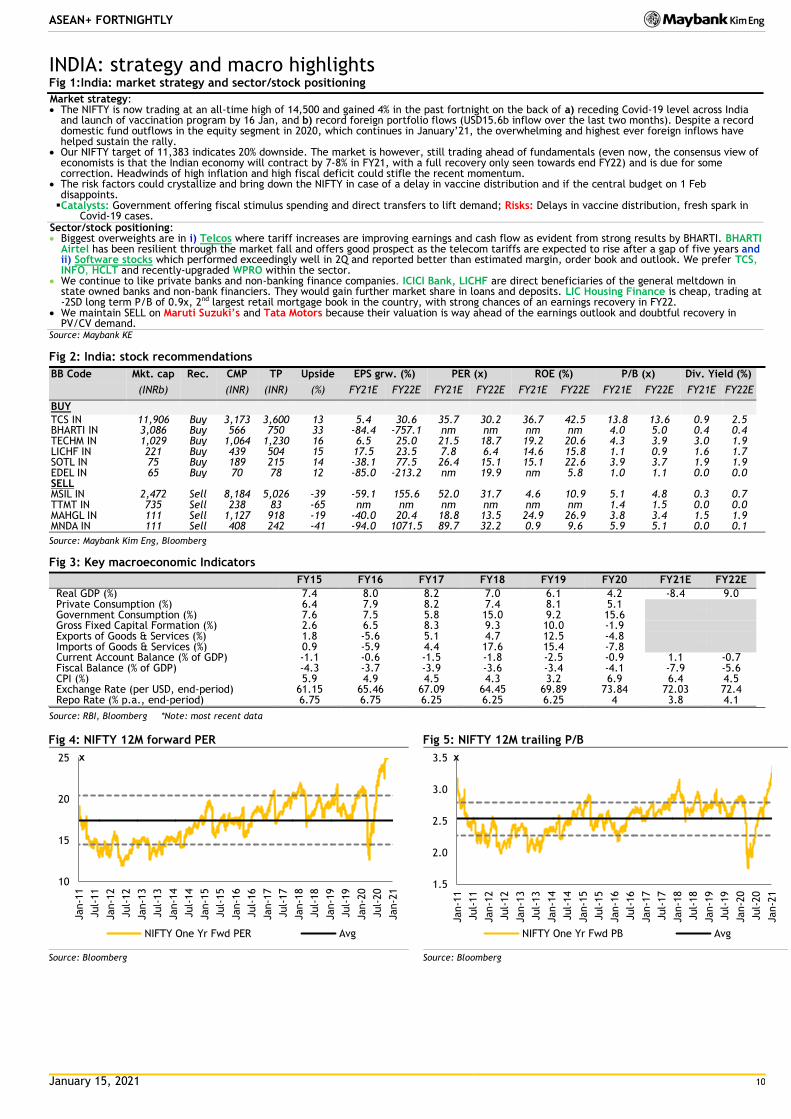
Market strategy: The NIFTY is now trading at an all-time high of 14,500 and gained 4% in the past fortnight on the back of a) receding Covid-19 level across India
and launch of vaccination program by 16 Jan, and b) record foreign portfolio flows (USD15.6b inflow over the last two months). Despite a record domestic fund outflows in the equity segment in 2020, which continues in January’21, the overwhelming and highest ever foreign inflows have helped sustain the rally.
Our NIFTY target of 11,383 indicates 20% downside. The market is however, still trading ahead of fundamentals (even now, the consensus view of economists is that the Indian economy will contract by 7-8% in FY21, with a full recovery only seen towards end FY22) and is due for some correction. Headwinds of high inflation and high fiscal deficit could stifle the recent momentum.
The risk factors could crystallize and bring down the NIFTY in case of a delay in vaccine distribution and if the central budget on 1 Feb disappoints. Catalysts: Government offering fiscal stimulus spending and direct transfers to lift demand; Risks: Delays in vaccine distribution, fresh spark in
Covid-19 cases. Sector/stock positioning: Biggest overweights are in i) Telcos where tariff increases are improving earnings and cash flow as evident from strong results by BHARTI. BHARTI
Airtel has been resilient through the market fall and offers good prospect as the telecom tariffs are expected to rise after a gap of five years and ii) Software stocks which performed exceedingly well in 2Q and reported better than estimated margin, order book and outlook. We prefer TCS, INFO, HCLT and recently-upgraded WPRO within the sector.
We continue to like private banks and non-banking finance companies. ICICI Bank, LICHF are direct beneficiaries of the general meltdown in state owned banks and non-bank financiers. They would gain further market share in loans and deposits. LIC Housing Finance is cheap, trading at -2SD long term P/B of 0.9x, 2nd largest retail mortgage book in the country, with strong chances of an earnings recovery in FY22.
We maintain SELL on Maruti Suzuki’s and Tata Motors because their valuation is way ahead of the earnings outlook and doubtful recovery in PV/CV demand.
Source: Maybank KE
Fig 2: India: stock recommendations
BB Code Mkt. cap Rec. CMP TP Upside EPS grw. (%) PER (x) ROE (%) P/B (x) Div. Yield (%)
(INRb) (INR) (INR) (%) FY21E FY22E FY21E FY22E FY21E FY22E FY21E FY22E FY21E FY22E
BUY TCS IN 11,906 Buy 3,173 3,600 13 5.4 30.6 35.7 30.2 36.7 42.5 13.8 13.6 0.9 2.5
BHARTI IN 3,086 Buy 566 750 33 -84.4 -757.1 nm nm nm nm 4.0 5.0 0.4 0.4 TECHM IN 1,029 Buy 1,064 1,230 16 6.5 25.0 21.5 18.7 19.2 20.6 4.3 3.9 3.0 1.9 LICHF IN 221 Buy 439 504 15 17.5 23.5 7.8 6.4 14.6 15.8 1.1 0.9 1.6 1.7 SOTL IN 75 Buy 189 215 14 -38.1 77.5 26.4 15.1 15.1 22.6 3.9 3.7 1.9 1.9 EDEL IN 65 Buy 70 78 12 -85.0 -213.2 nm 19.9 nm 5.8 1.0 1.1 0.0 0.0 SELL MSIL IN 2,472 Sell 8,184 5,026 -39 -59.1 155.6 52.0 31.7 4.6 10.9 5.1 4.8 0.3 0.7 TTMT IN 735 Sell 238 83 -65 nm nm nm nm nm nm 1.4 1.5 0.0 0.0 MAHGL IN 111 Sell 1,127 918 -19 -40.0 20.4 18.8 13.5 24.9 26.9 3.8 3.4 1.5 1.9 MNDA IN 111 Sell 408 242 -41 -94.0 1071.5 89.7 32.2 0.9 9.6 5.9 5.1 0.0 0.1
Source: Maybank Kim Eng, Bloomberg
Fig 3: Key macroeconomic Indicators
FY15 FY16 FY17 FY18 FY19 FY20 FY21E FY22E
Real GDP (%) 7.4 8.0 8.2 7.0 6.1 4.2 -8.4 9.0 Private Consumption (%) 6.4 7.9 8.2 7.4 8.1 5.1
Government Consumption (%) 7.6 7.5 5.8 15.0 9.2 15.6 Gross Fixed Capital Formation (%) 2.6 6.5 8.3 9.3 10.0 -1.9 Exports of Goods & Services (%) 1.8 -5.6 5.1 4.7 12.5 -4.8 Imports of Goods & Services (%) 0.9 -5.9 4.4 17.6 15.4 -7.8 Current Account Balance (% of GDP) -1.1 -0.6 -1.5 -1.8 -2.5 -0.9 1.1 -0.7
Fiscal Balance (% of GDP) -4.3 -3.7 -3.9 -3.6 -3.4 -4.1 -7.9 -5.6 CPI (%) 5.9 4.9 4.5 4.3 3.2 6.9 6.4 4.5 Exchange Rate (per USD, end-period) 61.15 65.46 67.09 64.45 69.89 73.84 72.03 72.4 Repo Rate (% p.a., end-period) 6.75 6.75 6.25 6.25 6.25 4 3.8 4.1
Source: RBI, Bloomberg *Note: most recent data
Fig 4: NIFTY 12M forward PER Fig 5: NIFTY 12M trailing P/B
Source: Bloomberg Source: Bloomberg
10
15
20
25
Jan-1
1
Jul-
11
Jan-1
2
Jul-
12
Jan-1
3
Jul-
13
Jan-1
4
Jul-
14
Jan-1
5
Jul-
15
Jan-1
6
Jul-
16
Jan-1
7
Jul-
17
Jan-1
8
Jul-
18
Jan-1
9
Jul-
19
Jan-2
0
Jul-
20
Jan-2
1
x
NIFTY One Yr Fwd PER Avg
1.5
2.0
2.5
3.0
3.5
Jan-1
1
Jul-
11
Jan-1
2
Jul-
12
Jan-1
3
Jul-
13
Jan-1
4
Jul-
14
Jan-1
5
Jul-
15
Jan-1
6
Jul-
16
Jan-1
7
Jul-
17
Jan-1
8
Jul-
18
Jan-1
9
Jul-
19
Jan-2
0
Jul-
20
Jan-2
1
x
NIFTY One Yr Fwd PB Avg
January 15, 2021 11
ASEAN+ FORTNIGHTLY
Research Offices
ECONOMICS
Suhaimi ILIAS Chief Economist Malaysia | Philippines | Global (603) 2297 8682 [email protected]
CHUA Hak Bin Regional Thematic Macroeconomist (65) 6231 5830 [email protected]
LEE Ju Ye Singapore | Thailand | Indonesia (65) 6231 5844 [email protected]
Linda LIU Singapore | Vietnam | Cambodia | Myanmar | Laos (65) 6231 5847 [email protected]
Dr Zamros DZULKAFLI (603) 2082 6818 [email protected]
Ramesh LANKANATHAN (603) 2297 8685 [email protected]
William POH (603) 2297 8683 [email protected]
FX
Saktiandi SUPAAT Head of FX Research (65) 6320 1379 [email protected]
Christopher WONG (65) 6320 1347 [email protected]
TAN Yanxi (65) 6320 1378 [email protected]
Fiona LIM (65) 6320 1374 [email protected]
STRATEGY
Anand PATHMAKANTHAN
ASEAN (603) 2297 8783 [email protected]
FIXED INCOME
Winson PHOON, ACA (65) 6812 8807 [email protected]
SE THO Mun Yi (603) 2074 7606 [email protected]
REGIONAL EQUITIES
Anand PATHMAKANTHAN Head of Regional Equity Research (603) 2297 8783 [email protected]
WONG Chew Hann, CA Head of ASEAN Equity Research (603) 2297 8686 [email protected]
ONG Seng Yeow Research, Technology & Innovation (65) 6231 5839 [email protected]
MALAYSIA
Anand PATHMAKANTHAN Head of Research (603) 2297 8783 [email protected] • Strategy
Desmond CH’NG, BFP, FCA (603) 2297 8680 [email protected] • Banking & Finance
LIAW Thong Jung (603) 2297 8688 [email protected] • Oil & Gas Services- Regional • Automotive
ONG Chee Ting, CA (603) 2297 8678 [email protected] • Plantations - Regional
YIN Shao Yang, CPA (603) 2297 8916 [email protected] • Gaming – Regional • Media • Aviation
TAN Chi Wei, CFA (603) 2297 8690 [email protected] • Power • Telcos
WONG Wei Sum, CFA (603) 2297 8679 [email protected] • Property
LEE Yen Ling (603) 2297 8691 [email protected] • Glove • Ports • Shipping • Healthcare • Petrochemicals
Kevin WONG (603) 2082 6824 [email protected] • REITs • Technology
Jade TAM (603) 2297 8687 [email protected] • Consumer Staples & Discretionary
Fahmi FARID (603) 2297 8676 [email protected] • Software
TEE Sze Chiah Head of Retail Research (603) 2082 6858 [email protected]
Nik Ihsan RAJA ABDULLAH, MSTA, CFTe (603) 2297 8694 [email protected] • Chartist
Amirah AZMI
(603) 2082 8769 [email protected] • Retail Research
SINGAPORE
Thilan WICKRAMASINGHE Head of Research (65) 6231 5840 [email protected] • Banking & Finance - Regional • Consumer
CHUA Su Tye (65) 6231 5842 [email protected] • REITs - Regional
LAI Gene Lih, CFA (65) 6231 5832 [email protected] • Technology • Healthcare
Kareen CHAN (65) 6231 5926 [email protected] • Transport • Telcos
TAN Chin Poh Head of Retail Research (65) 6231 5928 [email protected]
Eric ONG (65) 6231 5924 [email protected] • Retail Research
Matthew SHIM (65) 6231 5929 [email protected] • Retail Research
INDIA
Jigar SHAH Head of Research (91) 22 4223 2632 [email protected] • Strategy • Oil & Gas • Automobile • Cement
Neerav DALAL (91) 22 4223 2606 [email protected] • Software Technology • Telcos
Kshitiz PRASAD (91) 22 4223 2607 [email protected] • Banks
Vikram RAMALINGAM (91) 22 4223 2607 [email protected] • Automobile • Media
INDONESIA
Isnaputra ISKANDAR Head of Research (62) 21 8066 8680 [email protected] • Strategy • Metals & Mining • Cement • Autos • Consumer • Utility
Rahmi MARINA (62) 21 8066 8689 [email protected] • Banking & Finance
Aurellia SETIABUDI (62) 21 8066 8691 [email protected] • Property
Willy GOUTAMA (62) 21 8066 8500 [email protected] • Consumer
PHILIPPINES
Jacqui De JESUS Head of Research
(63) 2 8849 8844 [email protected] • Strategy • Conglomerates
Romel LIBO-ON (63) 2 8849 8844 [email protected] • Property
Fredrick De GUZMAN (63) 2 8849 8847 [email protected] • Consumer
Bernadine B BAUTISTA (63) 2 8849 8847 [email protected] • Utilities
Rachelleen RODRIGUEZ (63) 2 8849 8843 [email protected] • Banking & Finance
THAILAND
Maria LAPIZ Head of Institutional Research Dir (66) 2257 0250 | (66) 2658 6300 ext 1399 [email protected] • Strategy • Consumer • Materials • Services
Jesada TECHAHUSDIN, CFA (66) 2658 6300 ext 1395 [email protected] • Banking & Finance
Kaushal LADHA, CFA (66) 2658 6300 ext 1392 [email protected] • Oil & Gas – Regional • Petrochemicals - Regional • Utilities
Vanida GEISLER, CPA (66) 2658 6300 ext 1394 [email protected] • Property
Yuwanee PROMMAPORN (66) 2658 6300 ext 1393 Yuwanee.P @maybank-ke.co.th • Services
Ekachai TARAPORNTIP Head of Retail Research (66) 2658 5000 ext 1530 [email protected]
Surachai PRAMUALCHAROENKIT (66) 2658 5000 ext 1470 [email protected] • Auto • Conmat • Contractor • Steel
Suttatip PEERASUB (66) 2658 5000 ext 1430 [email protected] • Food & Beverage • Commerce
Jaroonpan WATTANAWONG (66) 2658 5000 ext 1404 [email protected] • Transportation • Small cap
Thanatphat SUKSRICHAVALIT (66) 2658 5000 ext 1401 [email protected] • Media • Electronics
Wijit ARAYAPISIT (66) 2658 5000 ext 1450 [email protected] • Strategist
Theerasate PROMPONG (66) 2658 5000 ext 1400 [email protected] • Equity Portfolio Strategist
Apiwat TAVESIRIVATE
(66) 2658 5000 ext 1310
• Chartist and TFEX
VIETNAM
Quan Trong Thanh (84 28) 44 555 888 ext 8184 [email protected] • Banks
Hoang Huy, CFA (84 28) 44 555 888 ext 8181 [email protected] • Strategy
Le Nguyen Nhat Chuyen (84 28) 44 555 888 ext 8082 [email protected] • Oil & Gas
Nguyen Thi Sony Tra Mi (84 28) 44 555 888 ext 8084 [email protected] • Consumer
Tyler Manh Dung Nguyen (84 28) 44 555 888 ext 8180 [email protected] • Utilities • Property
Nguyen Thi Ngan Tuyen Head of Retail Research (84 28) 44 555 888 ext 8081 [email protected] • Food & Beverage • Oil & Gas • Banking
Nguyen Thanh Lam (84 28) 44 555 888 ext 8086 [email protected] • Technical Analysis
January 15, 2021 12
ASEAN+ FORTNIGHTLY
APPENDIX I: TERMS FOR PROVISION OF REPORT, DISCLAIMERS AND DISCLOSURES
DISCLAIMERS This research report is prepared for general circulation and for information purposes only and under no circumstances should it be considered or intended as an offer to sell or a solicitation of an offer to buy the securities referred to herein. Investors should note that values of such securities, if any, may fluctuate and that each security’s price or value may rise or fall. Opinions or recommendations contained herein are in form of technical ratings and fundamental ratings. Technical ratings may differ from fundamental ratings as technical valuations apply different methodologies and are purely based on price and volume-related information extracted from the relevant jurisdiction’s stock exchange in the equity analysis. Accordingly, investors ’ returns may be less than the original sum invested. Past performance is not necessarily a guide to future performance. This report is not intended to provide personal investment advice and does not take into account the specific investment objectives, the financial situation and the particular needs of persons who may receive or read this report. Investors should therefore seek financial, legal and other advice regarding the appropriateness of investing in any securities or the investment strategies d iscussed or recommended in this report.
The information contained herein has been obtained from sources believed to be reliable but such sources have not been independently verified by Maybank Investment Bank Berhad, its subsidiary and affiliates (collectively, “MKE”) and consequently no representation is made as to the accuracy or completeness of this report by MKE and it should not be relied upon as such. Accordingly, MKE and its officers, directors, associates, connected parties and/or employees (collectively, “Representatives”) shall not be liable for any direct, indirect or consequential losses or damages that may arise from the use or reliance of this report. Any information, opinions or recommendations contained herein are subject to change at any time, without prior notice.
This report may contain forward looking statements which are often but not always identified by the use of words such as “ant icipate”, “believe”, “estimate”, “intend”, “plan”, “expect”, “forecast”, “predict” and “project” and statements that an event or result “may”, “will”, “can”, “should”, “could” or “might” occur or be achieved and other simi lar expressions. Such forward looking statements are based on assumptions made and information currently available to us and are subject to certain risks and uncertainties that could cause the actual results to differ materially from those expressed in any forward looking statements. Readers are cautioned not to place undue relevance on these forward-looking statements. MKE expressly disclaims any obligation to update or revise any such forward looking statements to reflect new information, events or circumstances af ter the date of this publication or to reflect the occurrence of unanticipated events.
MKE and its officers, directors and employees, including persons involved in the preparation or issuance of this report, may, to the extent permitted by law, f rom time to time participate or invest in financing transactions with the issuer(s) of the securities mentioned in this report, perform services for or solicit business from such issuers, and/or have a position or holding, or other material interest, or effect transactions, in such securities or options thereon, or other investments related thereto. In addition, it may make markets in the securities mentioned in the material presented in this report. One or more directors, officers and/or employees of MKE may be a director of the issue rs of the securities mentioned in this report to the extent permitted by law.
This report is prepared for the use of MKE’s clients and may not be reproduced, altered in any way, transmitted to, copied or distributed to any other party in whole or in part in any form or manner without the prior express written consent of MKE and MKE and its Representatives accepts no liability whatsoever for the actions of third parties in this respect.
This report is not directed to or intended for distribution to or use by any person or entity who is a citizen or resident of or located in any locality, state, country or other jurisdiction where such distribution, publication, availability or use would be contrary to law or regulation. This report is for distribution only under such circumstances as may be permitted by applicable law. The securities described herein may not be eligible for sale in all jurisdictions or to certain categories of investors. Without prejudice to the foregoing, the reader is to note that additional disclaimers, warnings or qualifications may apply based on geographical location of the person or entity receiving this report.
Malaysia Opinions or recommendations contained herein are in the form of technical ratings and fundamental ratings. Technical ratings may differ from fundamental ratings as technical valuations apply different methodologies and are purely based on price and volume-related information extracted from Bursa Malaysia Securities Berhad in the equity analysis.
Singapore This report has been produced as of the date hereof and the information herein may be subject to change. Maybank Kim Eng Research Pte. Ltd. (“Maybank KERPL”) in Singapore has no obligation to update such information for any recipient. For distribution in Singapore, recipients of this report are to contact Maybank KERPL in Singapore in respect of any matters arising from, or in connection with, this report. If the recipient of this report is not an accredited investor, expert investor or insti tutional investor (as defined under Section 4A of the Singapore Securities and Futures Act), Maybank KERPL shall be legally liable for the contents of this report, with such liability being limited to the extent (if any) as permitted by law.
Thailand Except as specifically permitted, no part of this presentation may be reproduced or distributed in any manner without the prior written permission of Maybank Kim Eng Securities (Thailand) Public Company Limited. Maybank Kim Eng Securities (Thailand) Public Company Limited (“MBKET”) accepts no liability whatsoeve r for the actions of third parties in this respect.
Due to different characteristics, objectives and strategies of institutional and retail investors, the research products of MBKET Institutional and Reta il Research departments may differ in either recommendation or target price, or both. MBKET reserves the rights to disseminate MBKET Retail Research reports to institutional investors who have requested to receive it. If you are an authorised recipient, you hereby tacitly acknowledge that the research reports from MBKET Retail Research are first pr oduced in Thai and there is a time lag in the release of the translated English version.
The disclosure of the survey result of the Thai Institute of Directors Association (“IOD”) regarding corporate governance is made pursuant to the policy of the Office of the Securities and Exchange Commission. The survey of the IOD is based on the information of a company listed on the Stock Exchange of Thailand and the market for Alternative Investment disclosed to the public and able to be accessed by a general public investor. The result, therefore, is from the perspective of a third party. It is not an evaluation of operation and is not based on inside information. The survey result is as of the date appearing in the Corporate Governance Report of Thai Listed Companies. As a result, the survey may be changed after that date. MBKET does not confirm nor certify the accuracy of such survey result.
The disclosure of the Anti-Corruption Progress Indicators of a listed company on the Stock Exchange of Thailand, which is assessed by Thaipat Institute, is made in order to comply with the policy and sustainable development plan for the listed companies of the Office of the Securities and Exchange Commission. Tha ipat Institute made this assessment based on the information received from the listed company, as stipulated in the form for the assessment of Anti-corruption which refers to the Annual Registration Statement (Form 56-1), Annual Report (Form 56-2), or other relevant documents or reports of such listed company. The assessment result is therefore made from the perspective of Thaipat Institute that is a third party. It is not an assessment of operation and is not based on any inside information. Since this assessment is only the assessment result as of the date appearing in the assessment result, it may be changed after that date or when there is any change to the relevant information. Nevertheless, MBKET does not confirm, verify, or certify the accuracy and completeness of the assessment result.
US This third-party research report is distributed in the United States (“US”) to Major US Institutional Investors (as defined in Rule 15a-6 under the Securities Exchange Act of 1934, as amended) only by Maybank Kim Eng Securities USA Inc (“Maybank KESUSA”), a broker-dealer registered in the US (registered under Section 15 of the Securities Exchange Act of 1934, as amended). All responsibility for the distribution of this report by Maybank KESUSA in the US shall be borne by Maybank KESUSA. This report is not directed at you if MKE is prohibited or restricted by any legislation or regulation in any jurisdiction from making it available to you. You should satisfy yourself before reading it that Maybank KESUSA is permitted to provide research material concerning investments to you under relevant legislation and regulations. All U.S. persons receiving and/or accessing this report and wishing to effect transactions in any security mentioned within must do so with: Maybank Kim Eng Securities USA Inc. 400 Park Avenue, 11th Floor, New York, New York 10022, 1-(212) 688-8886 and not with, the issuer of this report.
UK This document is being distributed by Maybank Kim Eng Securities (London) Ltd (“Maybank KESL”) which is authorized and regula ted, by the Financial Conduct Authority and is for Informational Purposes only. This document is not intended for distribution to anyone defined as a Retail Client under the Financial Services and Markets Act 2000 within the UK. Any

January 15, 2021 13
ASEAN+ FORTNIGHTLY
Disclosure of Interest
Malaysia: MKE and its Representatives may from time to time have positions or be materially interested in the securities referred to he rein and may further act as market maker or may have assumed an underwriting commitment or deal with such securities and may also perform or seek to perform investment banking services, advisory and other services for or relating to those companies. Singapore: As of 15 January 2021, Maybank KERPL and the covering analyst do not have any interest in any companies recommended in this research report. Thailand: MBKET may have a business relationship with or may possibly be an issuer of derivative warrants on the securities /companies mentioned in the research report. Therefore, Investors should exercise their own judgment before making any investment decisions. MBKET, its associates, directors, connected parties and/or employees may from time to time have interests and/or underwriting commitments in the securities mentioned in this report. Hong Kong: As of 15 January 2021, KESHK and the authoring analyst do not have any interest in any companies recommended in this research report. India: As of 15 January 2021, and at the end of the month immediately preceding the date of publication of the research report, KESI, authoring analyst or their associate / relative does not hold any financial interest or any actual or beneficial ownership in any shares or having any conflict of interest in the subject companies except as otherwise disclosed in the research report.
In the past twelve months KESI and authoring analyst or their associate did not receive any compensation or other benefits from the subject companies or third party in connection with the research report on any account what so ever except as otherwise disclosed in the research report.
MKE may have, within the last three years, served as manager or co-manager of a public offering of securities for, or currently may make a primary market in issues of, any or all of the entities mentioned in this report or may be providing, or have provided within the previous 12 months, significant advice or investment services in relation to the inves tment concerned or a related investment and may receive compensation for the services provided from the companies covered in this report.
OTHERS
Analyst Certification of Independence
The views expressed in this research report accurately reflect the analyst’s personal views about any and all of the subject securities or issuers; and no part of the research analyst’s compensation was, is or will be, directly or indirectly, related to the specific recommendations or views expressed in the report.
Reminder
Structured securities are complex instruments, typically involve a high degree of risk and are intended for sale only to soph isticated investors who are capable of understanding and assuming the risks involved. The market value of any structured security may be affected by changes in economic, financial and political factors (including, but not limited to, spot and forward interest and exchange rates), time to maturity, market conditions and volatility and the credit quality of any issuer or reference issuer. Any investor interested in purchasing a structured product should conduct its own analysis of the product and consult with its own professional advisers as to the risks involved in making such a purchase.
No part of this material may be copied, photocopied or duplicated in any form by any means or redistributed without the prior consent of MKE.
Definition of Ratings
Maybank Kim Eng Research uses the following rating system
BUY Return is expected to be above 10% in the next 12 months (including dividends)
HOLD Return is expected to be between 0% to 10% in the next 12 months (including dividends)
SELL Return is expected to be below 0% in the next 12 months (including dividends)
Applicability of Ratings
The respective analyst maintains a coverage universe of stocks, the list of which may be adjusted according to needs. Investment ratings are only applicable to the stocks which form part of the coverage universe. Reports on companies which are not part of the coverage do not carry investment ratings as we do not actively follow developments in these companies.
inclusion of a third party link is for the recipients convenience only, and that the firm does not take any responsibility fo r its comments or accuracy, and that access to such links is at the individuals own risk. Nothing in this report should be considered as constituting legal, accounting or tax advice, and that f or accurate guidance recipients should consult with their own independent tax advisers.
DISCLOSURES
Legal Entities Disclosures Malaysia: This report is issued and distributed in Malaysia by Maybank Investment Bank Berhad (15938- H) which is a Participating Organization of Bursa Malaysia Berhad and a holder of Capital Markets and Services License issued by the Securities Commission in Malaysia. Singapore: This report is distributed in Singapore by Maybank KERPL (Co. Reg No 198700034E) which is regulated by the Monetary Authority of Singapore. Indonesia: PT Maybank Kim Eng Securities (“PTMKES”) (Reg. No. KEP-251/PM/1992) is a member of the Indonesia Stock Exchange and is regulated by the Financial Services Authority (Indonesia). Thailand: MBKET (Reg. No.0107545000314) is a member of the Stock Exchange of Thailand and is regulated by the Ministry of Finance and the Securities and Exchange Commission. Philippines: Maybank ATRKES (Reg. No.01-2004-00019) is a member of the Philippines Stock Exchange and is regulated by the Securities and Exchange Commission. Vietnam: Maybank Kim Eng Securities Limited (License Number: 117/GP-UBCK) is licensed under the State Securities Commission of Vietnam. Hong Kong: KESHK (Central Entity No AAD284) is regulated by the Securities and Futures Commission. India: Kim Eng Securities India Private Limited (“KESI”) is a participant of the National Stock Exchange of India Limited and the Bombay Stock Exchange and is regulated by Securities and Exchange Board of India (“SEBI”) (Reg. No. INZ000010538). KESI is also registered with SEBI as Category 1 Merchant Banker (Reg. No. INM 000011708) and as Research Analyst (Reg No: INH000000057) US: Maybank KESUSA is a member of/ and is authorized and regulated by the FINRA – Broker ID 27861. UK: Maybank KESL (Reg No 2377538) is authorized and regulated by the Financial Conduct Authority.

January 15, 2021 14
ASEAN+ FORTNIGHTLY
Malaysia Maybank Investment Bank Berhad
(A Participating Organisation of
Bursa Malaysia Securities Berhad)
33rd Floor, Menara Maybank,
100 Jalan Tun Perak,
50050 Kuala Lumpur
Tel: (603) 2059 1888;
Fax: (603) 2078 4194
Singapore Maybank Kim Eng Securities Pte Ltd
Maybank Kim Eng Research Pte Ltd
50 North Canal Road
Singapore 059304
Tel: (65) 6336 9090
London Maybank Kim Eng Securities
(London) Ltd
PNB House
77 Queen Victoria Street
London EC4V 4AY, UK
Tel: (44) 20 7332 0221
Fax: (44) 20 7332 0302
New York Maybank Kim Eng Securities USA
Inc
400 Park Avenue, 11th Floor
New York, New York 10022,
U.S.A.
Tel: (212) 688 8886
Fax: (212) 688 3500
Stockbroking Business:
Level 8, Tower C, Dataran Maybank,
No.1, Jalan Maarof
59000 Kuala Lumpur
Tel: (603) 2297 8888
Fax: (603) 2282 5136
Hong Kong Kim Eng Securities (HK) Ltd
28/F, Lee Garden Three,
1 Sunning Road, Causeway Bay,
Hong Kong
Tel: (852) 2268 0800
Fax: (852) 2877 0104
Indonesia PT Maybank Kim Eng Securities
Sentral Senayan III, 22nd Floor
Jl. Asia Afrika No. 8
Gelora Bung Karno, Senayan
Jakarta 10270, Indonesia
Tel: (62) 21 2557 1188
Fax: (62) 21 2557 1189
India Kim Eng Securities India Pvt Ltd
1101, 11th floor, A Wing, Kanakia
Wall Street, Chakala, Andheri -
Kurla Road, Andheri East,
Mumbai City - 400 093, India
Tel: (91) 22 6623 2600
Fax: (91) 22 6623 2604
Philippines Maybank ATR Kim Eng Securities Inc.
17/F, Tower One & Exchange Plaza
Ayala Triangle, Ayala Avenue
Makati City, Philippines 1200
Tel: (63) 2 8849 8888
Fax: (63) 2 8848 5738
Thailand Maybank Kim Eng Securities
(Thailand) Public Company Limited
999/9 The Offices at Central World,
20th - 21st Floor,
Rama 1 Road Pathumwan,
Bangkok 10330, Thailand
Tel: (66) 2 658 6817 (sales)
Tel: (66) 2 658 6801 (research)
Vietnam Maybank Kim Eng Securities Limited
4A-15+16 Floor Vincom Center Dong
Khoi, 72 Le Thanh Ton St. District 1
Ho Chi Minh City, Vietnam
Tel : (84) 844 555 888
Fax : (84) 8 38 271 030
Saudi Arabia In association with
Anfaal Capital
Ground Floor, KANOO Building
No.1 - Al-Faisaliyah,Madina Road,
P.O.Box 126575 Jeddah 21352
Kingdom of Saudi Arabia
Tel: (966) 920023423
South Asia Sales Trading Kevin Foy
Regional Head Sales Trading
Tel: (65) 6636-3620
US Toll Free: 1-866-406-7447
North Asia Sales Trading Andrew Lee
Tel: (852) 2268 0283
US Toll Free: 1 877 837 7635
Indonesia Iwan Atmadjaja [email protected] (62) 21 8066 8555
London Greg Smith [email protected] Tel: (44) 207-332-0221
New York James Lynch [email protected] Tel: (212) 688 8886
India Sanjay Makhija [email protected] Tel: (91)-22-6623-2629
Philippines Keith Roy [email protected] Tel: (63) 2 848-5288
www.maybank-ke.com | www.maybank-keresearch.com