Ascorbic Acid/Retinol and/or Inflammatory Stimuli's Effect on ...
17
cells Article Ascorbic Acid/Retinol and/or Inflammatory Stimuli’s Effect on Proliferation/Differentiation Properties and Transcriptomics of Gingival Stem/Progenitor Cells Karim M. Fawzy El-Sayed 1,2,3, * ,† , Amira Bittner 1,† , Kristina Schlicht 4,5,† , Mohamed Mekhemar 1,† , Kim Enthammer 4,5 , Marc Höppner 6 , Martha Es-Souni 7 , Juliane Schulz 4,5,8 , Matthias Laudes 4,5,8 , Christian Graetz 1 , Christof E. Dörfer 1 and Dominik M. Schulte 4,5,8 Citation: Fawzy El-Sayed, K.M.; Bittner, A.; Schlicht, K.; Mekhemar, M.; Enthammer, K.; Höppner, M.; Es-Souni, M.; Schulz, J.; Laudes, M.; Graetz, C.; et al. Ascorbic Acid/Retinol and/or Inflammatory Stimuli’s Effect on Proliferation/Differentiation Properties and Transcriptomics of Gingival Stem/Progenitor Cells. Cells 2021, 10, 3310. https://doi.org/ 10.3390/cells10123310 Academic Editor: Kazuhito Satomura Received: 10 October 2021 Accepted: 18 November 2021 Published: 25 November 2021 Publisher’s Note: MDPI stays neutral with regard to jurisdictional claims in published maps and institutional affil- iations. Copyright: © 2021 by the authors. Licensee MDPI, Basel, Switzerland. This article is an open access article distributed under the terms and conditions of the Creative Commons Attribution (CC BY) license (https:// creativecommons.org/licenses/by/ 4.0/). 1 Clinic for Conservative Dentistry and Periodontology, School of Dental Medicine, Christian-Albrechts-University of Kiel, 24105 Kiel, Germany; [email protected] (A.B.); [email protected] (M.M.); [email protected] (C.G.); [email protected] (C.E.D.) 2 Oral Medicine and Periodontology Department, Faculty of Dentistry, Cairo University, Cairo 11553, Egypt 3 Stem Cells and Tissue Engineering Unit, Faculty of Dentistry, Cairo University, Cairo 11553, Egypt 4 Institute of Diabetes and Clinical Metabolic Research, School of Medicine, Christian-Albrechts-University of Kiel, 24104 Kiel, Germany; [email protected] (K.S.); [email protected] (K.E.); [email protected] (J.S.); [email protected] (M.L.); [email protected] (D.M.S.) 5 Division of Endocrinology, Diabetes and Clinical Nutrition, Department of Medicine I, School of Medicine, University Hospital of Schleswig-Holstein, 24105 Kiel, Germany 6 Institute of Clinical Molecular Biology, School of Medicine, Christian-Albrechts-University of Kiel, 24105 Kiel, Germany; [email protected] 7 Department of Orthodontics, School of Dental Medicine, University Clinic Schleswig-Holstein (UKSH), Christian-Albrechts University of Kiel, 24105 Kiel, Germany; [email protected] 8 Cluster of Excellence, Precision Medicine in Chronic Inflammation, School of Medicine, Christian-Albrechts-University of Kiel, 24105 Kiel, Germany * Correspondence: [email protected] † These authors contributed equally to this project. Abstract: The present study explored the effects of ascorbic-acid (AA)/retinol and timed inflam- mation on the stemness, the regenerative potential, and the transcriptomics profile of gingival mesenchymal stem/progenitor cells’ (G-MSCs). STRO-1 (mesenchymal stem cell marker) immuno- magnetically sorted G-MSCs were cultured in basic medium (control group), in basic medium with IL-1β (1 ng/mL), TNF-α (10 ng/mL) and IFN-γ (100 ng/mL, inflammatory-medium), in basic medium with AA (250 μmol/L) and retinol (20 μmol/L) (AA/retinol group) or in inflammatory medium with AA/retinol (inflammatory/AA/retinol group; n = 5/group). The intracellular levels of phosphorylated and total β-Catenin at 1 h, the expression of stemness genes over 7 days, the number of colony-forming units (CFUs) as well as the cellular proliferation aptitude over 14 days, and the G-MSCs’ multilineage differentiation potential were assessed. Next-generation sequencing was undertaken to elaborate on up-/downregulated genes and altered intracellular pathways. G- MSCs demonstrated all mesenchymal stem/progenitor cells characteristics. Controlled inflammation with AA/retinol significantly elevated NANOG (p < 0.05). The AA/retinol-mediated reduction in intracellular phosphorylated β-Catenin was restored through the effect of controlled inflammation (p < 0.05). Cellular proliferation was highest in the AA/retinol group (p < 0.05). AA/retinol coun- teracted the inflammation-mediated reduction in G-MSCs’ clonogenic ability and CFUs. Amplified chondrogenic differentiation was observed in the inflammatory/AA/retinol group. At 1 and 3 days, the differentially expressed genes were associated with development, proliferation, and migration (FOS, EGR1, SGK1, CXCL5, SIPA1L2, TFPI2, KRATP1-5), survival (EGR1, SGK1, TMEM132A), dif- ferentiation and mineral absorption (FOS, EGR1, MT1E, KRTAP1-5, ASNS, PSAT1), inflammation and MHC-II antigen processing (PER1, CTSS, CD74) and intracellular pathway activation (FKBP5, ZNF404). Less as well as more genes were activated the longer the G-MSCs remained in the inflam- matory medium or AA/retinol, respectively. Combined, current results point at possibly interesting Cells 2021, 10, 3310. https://doi.org/10.3390/cells10123310 https://www.mdpi.com/journal/cells
-
Upload
khangminh22 -
Category
Documents
-
view
0 -
download
0
Transcript of Ascorbic Acid/Retinol and/or Inflammatory Stimuli's Effect on ...

cells
Article
Ascorbic Acid/Retinol and/or Inflammatory Stimuli’s Effect onProliferation/Differentiation Properties and Transcriptomics ofGingival Stem/Progenitor Cells
Karim M. Fawzy El-Sayed 1,2,3,*,†, Amira Bittner 1,†, Kristina Schlicht 4,5,†, Mohamed Mekhemar 1,†,Kim Enthammer 4,5, Marc Höppner 6, Martha Es-Souni 7, Juliane Schulz 4,5,8, Matthias Laudes 4,5,8,Christian Graetz 1 , Christof E. Dörfer 1 and Dominik M. Schulte 4,5,8
�����������������
Citation: Fawzy El-Sayed, K.M.;
Bittner, A.; Schlicht, K.; Mekhemar,
M.; Enthammer, K.; Höppner, M.;
Es-Souni, M.; Schulz, J.; Laudes, M.;
Graetz, C.; et al. Ascorbic
Acid/Retinol and/or Inflammatory
Stimuli’s Effect on
Proliferation/Differentiation
Properties and Transcriptomics of
Gingival Stem/Progenitor Cells. Cells
2021, 10, 3310. https://doi.org/
10.3390/cells10123310
Academic Editor: Kazuhito Satomura
Received: 10 October 2021
Accepted: 18 November 2021
Published: 25 November 2021
Publisher’s Note: MDPI stays neutral
with regard to jurisdictional claims in
published maps and institutional affil-
iations.
Copyright: © 2021 by the authors.
Licensee MDPI, Basel, Switzerland.
This article is an open access article
distributed under the terms and
conditions of the Creative Commons
Attribution (CC BY) license (https://
creativecommons.org/licenses/by/
4.0/).
1 Clinic for Conservative Dentistry and Periodontology, School of Dental Medicine,Christian-Albrechts-University of Kiel, 24105 Kiel, Germany; [email protected] (A.B.);[email protected] (M.M.); [email protected] (C.G.);[email protected] (C.E.D.)
2 Oral Medicine and Periodontology Department, Faculty of Dentistry, Cairo University, Cairo 11553, Egypt3 Stem Cells and Tissue Engineering Unit, Faculty of Dentistry, Cairo University, Cairo 11553, Egypt4 Institute of Diabetes and Clinical Metabolic Research, School of Medicine, Christian-Albrechts-University
of Kiel, 24104 Kiel, Germany; [email protected] (K.S.); [email protected] (K.E.);[email protected] (J.S.); [email protected] (M.L.); [email protected] (D.M.S.)
5 Division of Endocrinology, Diabetes and Clinical Nutrition, Department of Medicine I, School of Medicine,University Hospital of Schleswig-Holstein, 24105 Kiel, Germany
6 Institute of Clinical Molecular Biology, School of Medicine, Christian-Albrechts-University of Kiel,24105 Kiel, Germany; [email protected]
7 Department of Orthodontics, School of Dental Medicine, University Clinic Schleswig-Holstein (UKSH),Christian-Albrechts University of Kiel, 24105 Kiel, Germany; [email protected]
8 Cluster of Excellence, Precision Medicine in Chronic Inflammation, School of Medicine,Christian-Albrechts-University of Kiel, 24105 Kiel, Germany
* Correspondence: [email protected]† These authors contributed equally to this project.
Abstract: The present study explored the effects of ascorbic-acid (AA)/retinol and timed inflam-mation on the stemness, the regenerative potential, and the transcriptomics profile of gingivalmesenchymal stem/progenitor cells’ (G-MSCs). STRO-1 (mesenchymal stem cell marker) immuno-magnetically sorted G-MSCs were cultured in basic medium (control group), in basic mediumwith IL-1β (1 ng/mL), TNF-α (10 ng/mL) and IFN-γ (100 ng/mL, inflammatory-medium), in basicmedium with AA (250 µmol/L) and retinol (20 µmol/L) (AA/retinol group) or in inflammatorymedium with AA/retinol (inflammatory/AA/retinol group; n = 5/group). The intracellular levelsof phosphorylated and total β-Catenin at 1 h, the expression of stemness genes over 7 days, thenumber of colony-forming units (CFUs) as well as the cellular proliferation aptitude over 14 days,and the G-MSCs’ multilineage differentiation potential were assessed. Next-generation sequencingwas undertaken to elaborate on up-/downregulated genes and altered intracellular pathways. G-MSCs demonstrated all mesenchymal stem/progenitor cells characteristics. Controlled inflammationwith AA/retinol significantly elevated NANOG (p < 0.05). The AA/retinol-mediated reduction inintracellular phosphorylated β-Catenin was restored through the effect of controlled inflammation(p < 0.05). Cellular proliferation was highest in the AA/retinol group (p < 0.05). AA/retinol coun-teracted the inflammation-mediated reduction in G-MSCs’ clonogenic ability and CFUs. Amplifiedchondrogenic differentiation was observed in the inflammatory/AA/retinol group. At 1 and 3 days,the differentially expressed genes were associated with development, proliferation, and migration(FOS, EGR1, SGK1, CXCL5, SIPA1L2, TFPI2, KRATP1-5), survival (EGR1, SGK1, TMEM132A), dif-ferentiation and mineral absorption (FOS, EGR1, MT1E, KRTAP1-5, ASNS, PSAT1), inflammationand MHC-II antigen processing (PER1, CTSS, CD74) and intracellular pathway activation (FKBP5,ZNF404). Less as well as more genes were activated the longer the G-MSCs remained in the inflam-matory medium or AA/retinol, respectively. Combined, current results point at possibly interesting
Cells 2021, 10, 3310. https://doi.org/10.3390/cells10123310 https://www.mdpi.com/journal/cells
Cells 2021, 10, 3310 2 of 17
interactions between controlled inflammation or AA/retinol affecting stemness, proliferation, anddifferentiation attributes of G-MSCs.
Keywords: inflammation; ascorbic acid; retinol; stem cell; gingiva
1. Introduction
Initiation of periodontitis generally necessitates the stimulation of the periodontalimmune system through a bacterial dysbiosis, consequently setting complex inflammatorycascades in motion, characterized by the liberation of a variety of pro-inflammatory cy-tokines, mainly tumor necrosis factor-alpha (TNF-α), interleukin (IL)-1 beta (IL-1β), IL-4,IL-6, IL-17 as well as interferon-gamma (IFN-γ) [1,2]. Although such pro-inflammatoryresponse is pivotal in combating the invading pathogens and in boosting subsequentperiodontal stem/progenitor cells-mediated reparative/regenerative endeavors, a long-lasting not adequately self-limiting pro-inflammatory insult could detrimentally affect thetooth-supporting and investing cellular components of the periodontium [3]. Clinically, gin-gival mesenchymal stem/progenitor cells (G-MSCs) are in constant immuno-regenerativecrosstalk with their surrounding micro-environment [4–6], with controlled and preciselytimed pro-inflammatory stimuli exerting positive effects on their stemness and repara-tive/regenerative attributes [7,8].
Ascorbic acid (AA) and retinol are antioxidants, with a multitude of significant hostinflammation-modulatory effects [9–12] on periodontal disease and the outcome of repar-ative/regenerative periodontal therapies [13,14]. While AA promotes wound healing andcollagen synthesis [12], AA and retinol boost cellular metabolism, proliferation, and differenti-ation, while impeding apoptosis [15–19]. Chronic periodontitis was found to be associatedwith a lower retinol intake in young Korean women [9] and low serum levels of a varietyof carotenoids, in particular beta-cryptoxanthin and beta-carotene, were demonstrated tobe connected with an elevated periodontitis prevalence in a sample of 1258, 60–70-year-oldWestern European men [10]. Every other day oral administration of all-trans retinoic acidin a Porphyromonas gingivalis-induced mice periodontitis model reduced the inflammatorycellular infiltrate, enhanced the T-regulatory cell activation, and arrested further periodontalinflammation-mediated tissue destruction [11].
Most strikingly, recent reports demonstrated the ability of AA and retinol, at specificconcentrations, to impact cellular epigenetics, through nuclear bases demethylation, with aresultant de-differentiation of adult cells into pluripotent ones [20,21], a perspective withgreat potential for periodontal reparative/regenerative endeavors. The current study’s aimwas to explore for the first time the effects of AA/retinol in isolation and combined withcontrolled and timed pro-inflammatory stimulation on stemness, proliferation, Wnt/β-catenin pathway activation, differentiation, and mRNA transcriptomics of G-MSCs in vitroand to elaborate on the associated intracellular pathways.
2. Materials and Methods2.1. G-MSCs’ Isolation, Characterization and Multilineage Differentiation
The study’s protocol was reviewed by the Ethical Committee of the Christian-AlbrechtsUniversity of Kiel, Kiel, Germany (IRB:513/17). Gingival connective tissue cells were iso-lated from free gingival collars from five healthy patients (Table 1 shows the donors’ ageand gender), and STRO-1 immuno-magnetically sorted to obtain G-MSCs as previouslydescribed [22]. Colony-forming units (CFUs), multilineage differentiation potential andCD14, CD34, CD45, CD73, CD90, and CD105 stemness marker expression were examinedon second passage G-MSCs (FACS-Calibur-E6370 and FACS-Comp5.1.1 software, BectonDickinson, Franklin Lakes, NJ, USA), as previously described [22].

Cells 2021, 10, 3310 3 of 17
Table 1. Donors’ gender and age.
Donor’s Number Gender Age
1 Male 182 Female 203 Female 194 Male 225 Male 20
2.2. Experimental Groups
Second passage G-MSCs were cultured in basic medium, consisting of Eagle’s minimum es-sential medium alpha modification (Sigma-Aldrich GmbH, Hamburg, Germany) supplementedwith antibiotics (100 U mL−1 penicillin, 100 µg mL−1 streptomycin) and 1% amphotericin(all from Biochrom, Berlin, Germany) (control group), in basic medium, with 1 ng/mL IL-1β,10 ng/mL TNF-α and 100 ng/mL IFN-γ (Pepro Tech Inc., Rocky Hill, NJ, USA) [5,6,8,23–25] (in-flammatory group), in basic medium with 250 µg/mL AA [21] and 20 µmol/L retinol [26](AA/retinol group), or in inflammatory medium with 250 µg/mL AA and 20 µmol/Lretinol (inflammatory/AA/retinol group). Media were exchanged three times per week.
2.3. G-MSCs’ mRNA Expression
NANOG, octamer-binding-transcription-factor-4A (OCT4A) and sex-determining-region-Y-box-2 (SOX2) stemness markers were assessed on mRNA level in the four groups(n = 5). mRNA isolation was carried out at 1, 3, 5, and 7 days (RNeasy kit, Qiagen, Hilden,Germany). cDNA was produced from RNA (1 µg/µL) by reverse transcription (QuantiTectReverse Transcription Kit, Qiagen, Hilden, Germany) in 20 µL reaction mixture (4 pmol ofeach primer, 10 µL of LightCycler Probes Master mixture (Roche, Indianapolis, IN, USA)and 5 µL specimen cDNA). Real-time polymerase chain reaction (rt-PCR; LightCycler96 Real-Time PCR System, Roche Molecular Biochemicals, Indianapolis, IN, USA) wasperformed. Nineteen potential reference genes (18S, ACTB, ALAS, β-2M, β-Globin, G6PDH,GAPDH, GUSB, HPRT1, IPO8, PBGD, PGK1, PPIA, RPL13A, RPLP0, SDHA, TBP, TFRC,and YWHAZ) were pre-examined for the most suitable reference gene, which would not bealtered by the experiment (NormFinder). Apart from PGK1, all tested genes were altered.Thus, PGK1 (a housekeeping gene) was deemed suitable to be utilized (Table 2). Relativequantification of all genes under examination was performed using the 2ˆ-∆∆Ct method intriplicate and averaged.
Table 2. Real-time PCR primers (Roche, Indianapolis, IN, USA).
Gene Gene Symbol Accession ID Assay ID
RUNX2 RUNX2 H. sapiens ENST00000359524 113380ACAN ACAN H. sapiens ENST00000439576 138057
ALP ALP H. sapiens ENST00000374840 103448LPL LPL H. sapiens ENST00000311322 113230
NANOG NANOG H. sapiens ENST00000229307 148147OCT4A OCT4 H. sapiens ENST00000259915 113034PGK1 PGK1 H. sapiens ENST00000373316 102083
PPARγ PPARγ H. sapiens ENST00000287820 110607SOX2 SOX2 H. sapiens ENST00000325404 111867
Abbreviations: ACAN: Aggrecan; ALP: alkaline phosphatase; LPL: lipoprotein lipase; OCT4A: octamer-bindingtranscription factor 4A; PGK1: Phosphoglycerate kinase-1; PPARγ: proliferator-activated receptor gamma;RUNX2: Runt-related transcription factor 2; SOX2: sex-determining region Y-box 2.
2.4. ELISA
SOX2, OCT4, and NANOG were measured using simple step ELISA Kits (ABCAM,Cambridge, UK). G-MSCs (n = 5) were cultivated on six-well plates and stimulated ac-cording to the defined groups, followed by PBS washing, 600 µL lysis buffer addition,
Cells 2021, 10, 3310 4 of 17
and aliquoting. ELISA measurements were carried out following the manufacturer’sinstructions. Quantitation of bound analyte was achieved photometrically through detec-tion of the colored oxidized TMB product at 450 nm (µQuant-spectrophotometer, BioTek;Mikrowin-software, Mikrotek Laborsysteme, Overath, Germany).
For evaluation of phosphorylated (pβ-catenin, pS45 ELISA Kit, Abcam, Cambridge, UK)and total (tβ-catenin, Abcam, Cambridge, UK) intracellular β-catenin levels, 8 × 10⁴ G-MSCswere cultivated per well in six-well plates until reaching 85% confluence. Subsequently,G-MSCs were stimulated for one hour in the different groups and washed with 3 × 350 µL1× wash buffer PT followed by the addition of 350 µL chilled 1× cell extraction Buffer.Fifty microliters standard or sample was mixed with 100 µL pβ-catenin or tβ-catenindetection antibody and incubated in the dark on a plate shaker (400 rpm, 37 ◦C, 5% CO2,15 min), followed by Stop Solution (100 µL) and 450 nm optical density (OD) measurements(MultiskanGO Microplate Spectrophotometer, Thermo Fisher, Langenselbold, Germany).Intracellular %pβ-catenin and %tβ-catenin were determined employing standard curves.All experiments were performed in duplicates and averaged.
2.5. mRNA Next-Generation Sequencing
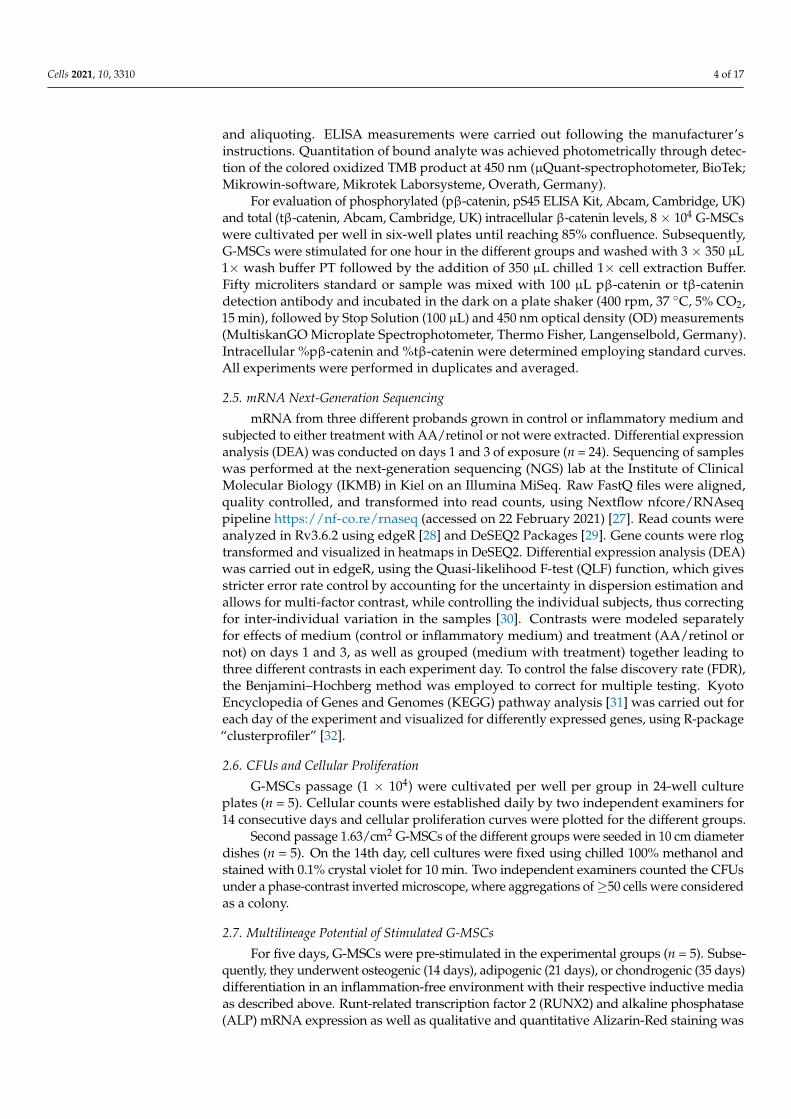
mRNA from three different probands grown in control or inflammatory medium andsubjected to either treatment with AA/retinol or not were extracted. Differential expressionanalysis (DEA) was conducted on days 1 and 3 of exposure (n = 24). Sequencing of sampleswas performed at the next-generation sequencing (NGS) lab at the Institute of ClinicalMolecular Biology (IKMB) in Kiel on an Illumina MiSeq. Raw FastQ files were aligned,quality controlled, and transformed into read counts, using Nextflow nfcore/RNAseqpipeline https://nf-co.re/rnaseq (accessed on 22 February 2021) [27]. Read counts wereanalyzed in Rv3.6.2 using edgeR [28] and DeSEQ2 Packages [29]. Gene counts were rlogtransformed and visualized in heatmaps in DeSEQ2. Differential expression analysis (DEA)was carried out in edgeR, using the Quasi-likelihood F-test (QLF) function, which givesstricter error rate control by accounting for the uncertainty in dispersion estimation andallows for multi-factor contrast, while controlling the individual subjects, thus correctingfor inter-individual variation in the samples [30]. Contrasts were modeled separatelyfor effects of medium (control or inflammatory medium) and treatment (AA/retinol ornot) on days 1 and 3, as well as grouped (medium with treatment) together leading tothree different contrasts in each experiment day. To control the false discovery rate (FDR),the Benjamini–Hochberg method was employed to correct for multiple testing. KyotoEncyclopedia of Genes and Genomes (KEGG) pathway analysis [31] was carried out foreach day of the experiment and visualized for differently expressed genes, using R-package“clusterprofiler” [32].
2.6. CFUs and Cellular Proliferation
G-MSCs passage (1 × 10⁴) were cultivated per well per group in 24-well cultureplates (n = 5). Cellular counts were established daily by two independent examiners for14 consecutive days and cellular proliferation curves were plotted for the different groups.
Second passage 1.63/cm2 G-MSCs of the different groups were seeded in 10 cm diameterdishes (n = 5). On the 14th day, cell cultures were fixed using chilled 100% methanol andstained with 0.1% crystal violet for 10 min. Two independent examiners counted the CFUsunder a phase-contrast inverted microscope, where aggregations of ≥50 cells were consideredas a colony.
2.7. Multilineage Potential of Stimulated G-MSCs
For five days, G-MSCs were pre-stimulated in the experimental groups (n = 5). Subse-quently, they underwent osteogenic (14 days), adipogenic (21 days), or chondrogenic (35 days)differentiation in an inflammation-free environment with their respective inductive mediaas described above. Runt-related transcription factor 2 (RUNX2) and alkaline phosphatase(ALP) mRNA expression as well as qualitative and quantitative Alizarin-Red staining was

Cells 2021, 10, 3310 5 of 17
conducted [33]. Lipoprotein lipase (LPL) and proliferator-activated receptor gamma (PPARγ)mRNA expression as well as quantitative and qualitative Oil-Red-O evaluation were exam-ined to confirm adipogenic differentiation [34]. Aggrecan (ACAN) mRNA expression andAlcian-Blue/nuclear-fast-red staining quantification were evaluated as evidence for chondro-genic differentiation [35]. All PCR primers were supplied by Roche and the real-time PCRwas conducted as described above in triplicate and averaged (Table 2).
2.8. Statistical Analysis
Normality of the data was examined, employing the Shapiro–Wilk Test. Data proved tobe not normally distributed. Hence, differences in %tβ-catenin, %pβ-catenin, CFUs, mRNAexpressions, and quantitative adipogenic, osteogenic, and chondrogenic differentiationbetween the experimental groups were examined, using the Friedman test (SPSS 23, IBM,Chicago, IL, USA). The significance level was set at p ≤ 0.05.
3. Results3.1. Characterization of G-MSCs
Fibroblast-like cell clusters grew out of adherent gingival connective tissue masses(Figure 1A). G-MSCs exhibited classical CFUs (Figure 1B), and were CD14−, CD34−, CD45−,CD73+, CD90+, and CD105+ (Figure 1C). Through osteogenic induction, G-MSCs depositedAlizarin-Red-positive calcified deposits, in distinction to their controls (Figure 1D,E). Adi-pogenic induction of G-MSCs formed Oil-Red-O-positive intracellular inclusion bodies, indistinction to their controls (Figure 1F,G). Chondrogenic induction of G-MSCs depositedAlcian-Blue/acid-fast-red-positive glycosaminoglycans, in distinction to their controls(Figure 1H,I).
Cells 2021, 10, x FOR PEER REVIEW 6 of 18
Figure 1. Phase contrast inverted microscopic picture of gingival cells growing out from a gingival connective tissue spec-imen (A). G-MSCs’ colony-forming units (CFUs) (B). G-MSCs surface markers’ expression flowcytometrically (C). Osteo-genic induction of G-MSCs (Alizarin-Red stained; (D)) and respective controls (E) Adipogenic induction of G-MSCs (Oil-Red-O stained; (F)) and respective controls (G). Chondrogenic induction of G-MSCs (Alcian Blue/acid-fast-red staining; (H)) and respective controls (I).
3.2. Stemness Markers’ Expression Regarding the expression of stemness genes, significant differences between the
groups were notable at day 1 for SOX2 expression, at day 5 for OCT4A expression and at days 5 and 7 for NANOG expression (p < 0.05). On the protein level, at day 1, significant differences were further evident for NANOG expression between groups (p < 0.05), with a synergistic effect of AA/retinol and inflammation evident only at day 3 (p < 0.05, Fried-man). No expressions were detected for SOX2 or OCT4 on the protein level (Figure 2).
Figure 1. Phase contrast inverted microscopic picture of gingival cells growing out from a gingival connective tissuespecimen (A). G-MSCs’ colony-forming units (CFUs) (B). G-MSCs surface markers’ expression flowcytometrically (C).Osteogenic induction of G-MSCs (Alizarin-Red stained; (D)) and respective controls (E) Adipogenic induction of G-MSCs(Oil-Red-O stained; (F)) and respective controls (G). Chondrogenic induction of G-MSCs (Alcian Blue/acid-fast-red staining;(H)) and respective controls (I).

Cells 2021, 10, 3310 6 of 17
3.2. Stemness Markers’ Expression
Regarding the expression of stemness genes, significant differences between thegroups were notable at day 1 for SOX2 expression, at day 5 for OCT4A expression and atdays 5 and 7 for NANOG expression (p < 0.05). On the protein level, at day 1, significantdifferences were further evident for NANOG expression between groups (p < 0.05), with asynergistic effect of AA/retinol and inflammation evident only at day 3 (p < 0.05, Friedman).No expressions were detected for SOX2 or OCT4 on the protein level (Figure 2).
Cells 2021, 10, x FOR PEER REVIEW 7 of 18
Figure 2. Cont.

Cells 2021, 10, 3310 7 of 17
Cells 2021, 10, x FOR PEER REVIEW 7 of 18
Figure 2. mRNA and protein expressions of stemness markers (NANOG, OCT4A, SOX2) in G-MSCs challenged byAA/retinol and inflammation at 1, 3, 5, and 7 days (box and whisker plots with medians/quartiles). Significant differ-ences denoted with asterisks (n = 5; * p < 0.05, Friedman test). Abbreviations: SOX2: sex-determining region Y-box 2;OCT4A: octamer-binding transcription factor 4A.
3.3. mRNA Next Generation Sequencing
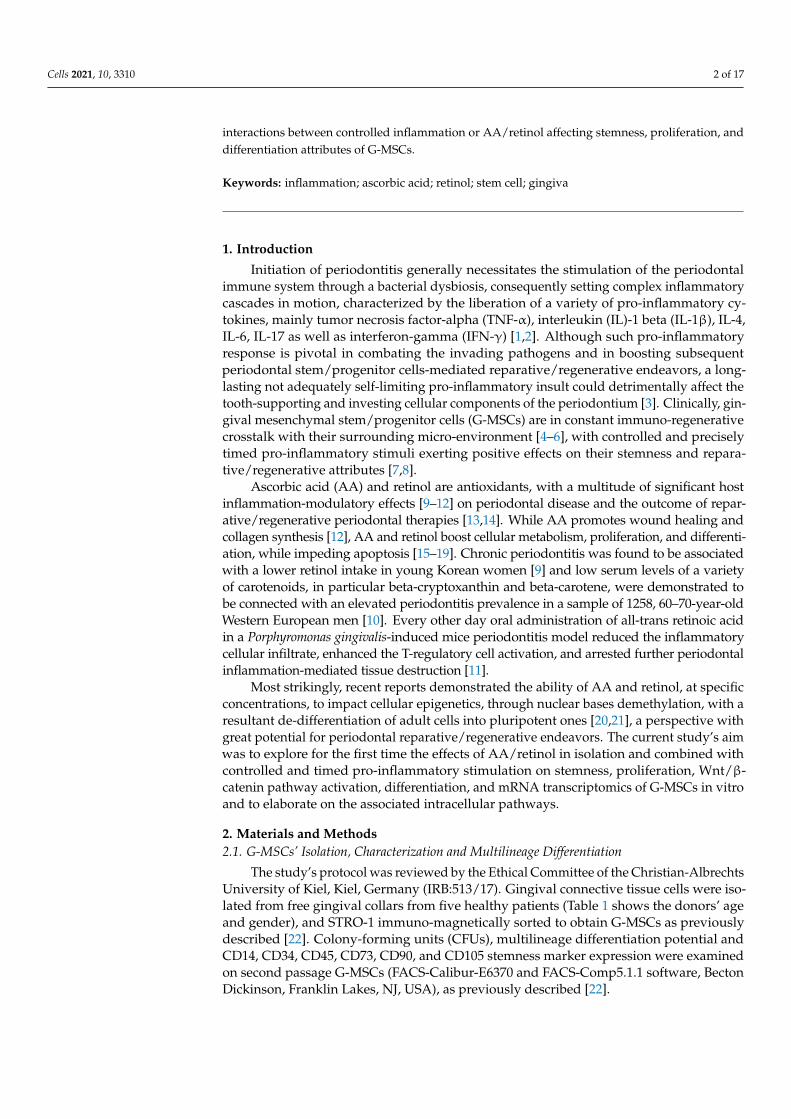
Rlog-transformed gene counts showed a clear cluster pattern depending on probands(Figure 3A,B and Figure S1), appearing to be the main source of variation in the geneexpression profiles. Further analysis was performed in edgeR, allowing for complex multi-factor designs and adjustment for the individual effect of different probands. Table 3provides an overview of the top three differentially expressed (DE) genes on days 1 and 3(A full list of DE genes for each effect is provided in Supplementary Table S1).
Table 3. Top three differentially expressed genes for the effect of growth medium, AA/retinol treatment, as well as thecombined effect of inflammatory medium and AA/retinol treatment. Effects have been adjusted for the influence of differentprobands. LogFC = log Fold Change, LogCPM = log counts per million. Correction for multiple testing was performed withthe Benjamini–Hochberg method, significance level was set to FDR < 0.05.
Ensemble Entrez ID GeneName LogFC p-Value FDR
Medium Treatment
Day 1
Treatment +medium
Gen 1 ENSG000001058257980 TFPI1 1.46 1.82 × 10⁻¹³ 1.41 × 10⁻⁹
Gen 2 ENSG0000013436310468 FST −0.43 5.48 × 10⁻¹³ 2.0 4× 10⁻⁹
Gen 3 ENSG000000960602289 FKBP5 1.54 6.66 × 10⁻¹³ 2.04 × 10⁻⁹
MediumGen 1 ENSG000001058257980 TFPI2 1.98 5.85 × 10⁻¹⁴ 9.06 × 10⁻¹⁰
Gen 2 ENSG000001637356374 CXCL5 3.86 5.63 × 10⁻¹² 4.36 × 10⁻⁸
Gen 3 ENSG000001631311520 CTSS 2.27 8.82 × 10⁻¹² 4.56 × 10⁻⁸
TreatmentGen 1 ENSG000000960602289 FKBP5 2.00 1.29 × 10⁻¹³ 2.00 × 10⁻⁹
Gen 2 ENSG0000013436310468 FST −1.52 1.74 × 10⁻¹² 1.25 × 10⁻⁸
Gen 3 ENSG000001697154493 MT1E 1.33 2.42 × 10⁻¹² 1.25 × 10⁻⁸
Day 3
Treatment +medium
Gen 1 ENSG000000960602289 FKBP5 2.00 1.67 × 10⁻¹² 1.21 × 10⁻⁸
Gen 2 ENSG0000013506929968 PSAT1 1.17 1.18 × 10⁻¹² 1.22 × 10⁻⁸
Gen 3 ENSG0000013436310468 ASNS 0.38 2.39 × 10⁻¹¹ 1.22 × 10⁻⁸
MediumGen 1 ENSG00000019582 972 CD74 1.89 3.20 × 10⁻¹² 4.88 × 10⁻⁸
Gen 2 ENSG000001631311520 CTSS 1.53 9.24 × 10⁻¹¹ 7.05 × 10⁻⁷
Gen 3 ENSG0000022185283895 KRTAP1-5 1.12 4.27 × 10⁻⁹ 1.83 × 10⁻⁵
TreatmentGen 1 ENSG000000960602289 FKBP5 2.52 3.32 × 10⁻¹⁴ 5.05 × 10⁻¹⁰
Gen 2 ENSG0000013436310468 FST −1.83 2.04 × 10⁻¹¹ 1.55 × 10⁻⁷
Gen 3 ENSG0000011699157568 SIPA1L2 −1.40 4.48 × 10⁻¹¹ 2.28 × 10⁻⁷
Cells 2021, 10, 3310 8 of 17
Cells 2021, 10, x FOR PEER REVIEW 8 of 18
Figure 2. mRNA and protein expressions of stemness markers (NANOG, OCT4A, SOX2) in G-MSCs challenged by AA/ret-inol and inflammation at 1, 3, 5, and 7 days (box and whisker plots with medians/quartiles). Significant differences denoted with asterisks (n = 5; * p < 0.05, Friedman test). Abbreviations: SOX2: sex-determining region Y-box 2; OCT4A: octamer-binding transcription factor 4A.
3.3. mRNA Next Generation Sequencing Rlog-transformed gene counts showed a clear cluster pattern depending on probands
(Figures 3A,B and S1), appearing to be the main source of variation in the gene expression profiles. Further analysis was performed in edgeR, allowing for complex multi-factor de-signs and adjustment for the individual effect of different probands. Table 3 provides an overview of the top three differentially expressed (DE) genes on days 1 and 3 (A full list of DE genes for each effect is provided in Supplementary Table S1).
Figure 3. Cont.
Cells 2021, 10, 3310 9 of 17
Cells 2021, 10, x FOR PEER REVIEW 9 of 18
Figure 3. Visualization of gene counts and differentially expressed genes: (A) Heatmap of rlog-transformed gene counts for all samples on day 1 of the experiment. Labels refer to type of medium, type of treatment and proband number. (B) Heatmap of rlog transformed gene counts for all samples on day 3 of the experiment. Labels refer to type of medium, type of treatment and proband number. (C) MD plot of differentially expressed genes for the overall effect of growth medium on day 1 of the experiment, type of treatment and proband id. (D) MD plot of differentially expressed genes for the effect of AA/retinol treatment on day 1 of the experiment, type of growth medium and proband id. (E) Top five significantly
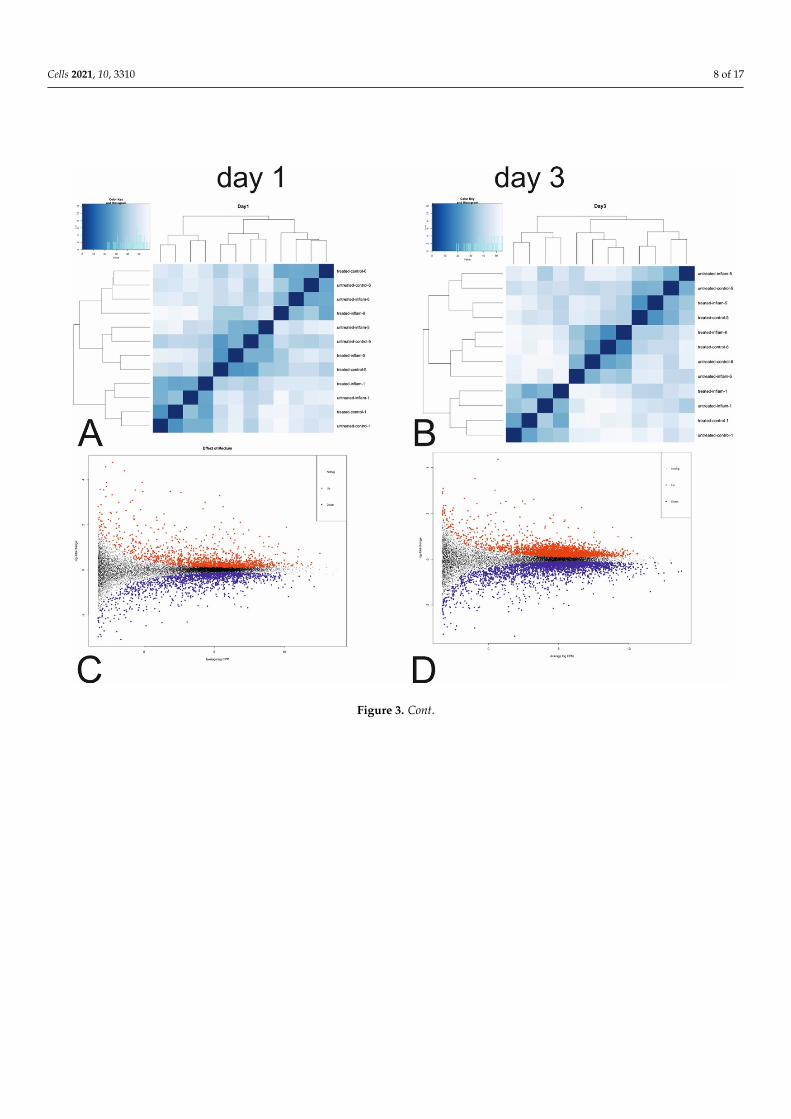
Figure 3. Visualization of gene counts and differentially expressed genes: (A) Heatmap of rlog-transformed gene countsfor all samples on day 1 of the experiment. Labels refer to type of medium, type of treatment and proband number.(B) Heatmap of rlog transformed gene counts for all samples on day 3 of the experiment. Labels refer to type of medium,type of treatment and proband number. (C) MD plot of differentially expressed genes for the overall effect of growthmedium on day 1 of the experiment, type of treatment and proband id. (D) MD plot of differentially expressed genes for theeffect of AA/retinol treatment on day 1 of the experiment, type of growth medium and proband id. (E) Top five significantlyrepresented pathways for the effects of AA/retinol treatment (lower section), medium (middle section) and the combinedeffect of both (upper section). Three patients were tested (n = 3) per day (days 1 and 3). Four replicates were carried out foreach measurement.
Cells 2021, 10, 3310 10 of 17
For the combined effect of inflammatory medium and AA/retinol treatment, adjustedfor the effect of proband, DEA resulted in 803 DE genes on day 1 and 729 DE genes onday 3. On day 1, the top three genes for this effect were the tissue factor pathway inhibitor(TFPI1), Folistatin (FST), and FKBP proryl isomerase (FKBP5). On day 3, the top DEgenes were FKBP5 and two genes involved in the transfer and synthesis of amino acidsserine (phosphoserine aminotransferase—PSAT1) and asparagine (asparagine synthetase—ASNS). When looking at the effect of inflammatory medium solely on day 1, adjustedfor proband and treatment, a total of 161 genes were significantly downregulated and182 genes were significantly upregulated. On day 3, this changed to 99 genes beingsignificantly downregulated and 90 genes significantly upregulated (Figure 3C,D). Thetop three DE genes on day 1 were, again TFPI1, followed by the C-X-C motif chemokineligand 5 (CXCL5) and cathepsin S (CTTS). On day 3, the top upregulated genes wereCD74, followed by CTTS and the keratin-associated protein (KRATP1-5), a gene that isassociated with developmental biology. Finally, when considering the effect of treatmentsolely on day 1, adjusted for proband and medium, a total of 182 genes were significantlydownregulated and 91 genes were significantly upregulated. On day 3, this changed to245 genes, being significantly downregulated and 104 genes significantly upregulated. Thetop 3 DE genes on day 1 were FKPB5, FST, and metallothionein 1E (MT1E). On day 3, thetop three genes were again FKBP5, FST, and SIPA1L2).
To validate this observation and to further explore the involvement of our entire DEgene list in cellular pathways, an overrepresentation analysis based on KEGG pathwayswas performed. Results of the pathway analysis for effects of medium, treatment, and theircombined effect are shown in Figure 3E (figure shows top five overrepresented pathwaysonly). Supplementary Table S2 provides the full list of overrepresented KEGG pathwaysfor each effect. To validate the results, we additionally performed functional pathwayanalyses, using Reactome and Wikipathway databases (Supplementary Table S3, for thecombined effect of treatment and medium). For obvious reasons, curation and annotationof pathways differ between the platforms. Yet, interesting commonalities with regard tothe activation of interleukin signaling and chemokine binding pathways (KEGG, Reactome,and Wikipathways) and mineral absorption (KEGG and Wikipathways) were observed.
3.4. Intracellular β-Catenin
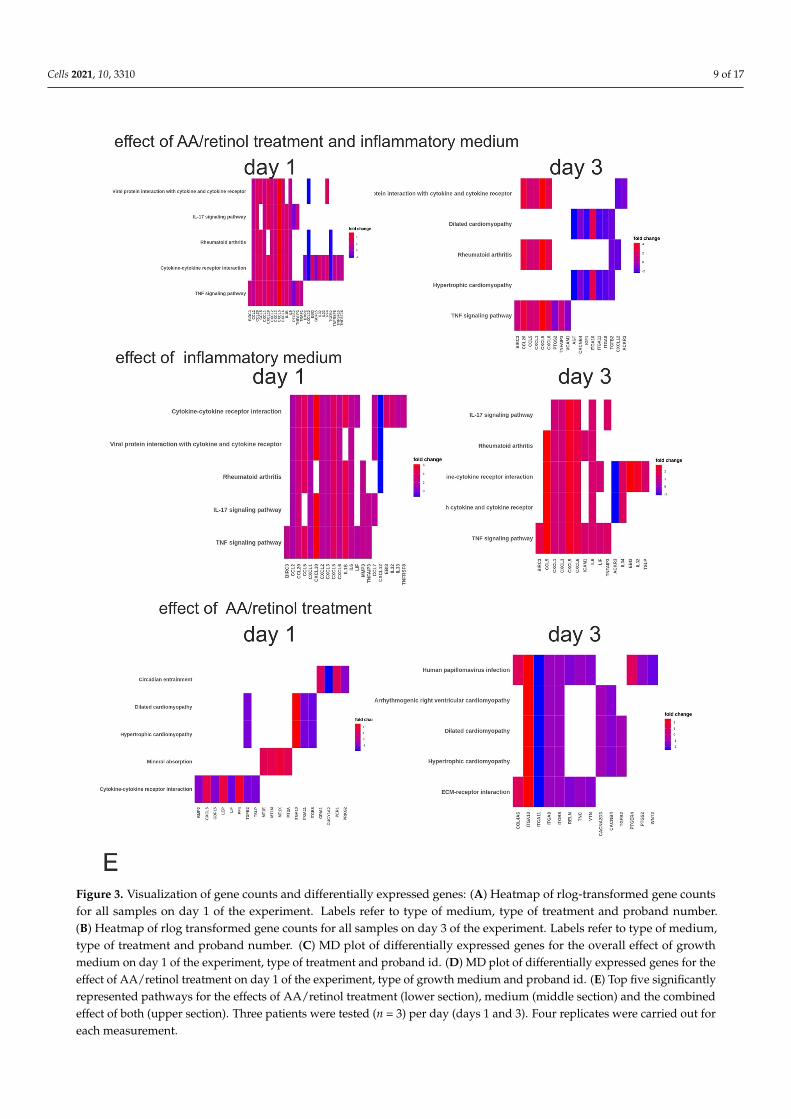
Significantly lower intracellular pβ-catenin was evident in the AA/retinol—comparedto the inflammatory/AA/retinol– and the inflammatory group (p < 0.05, Figure 4A).Intracellular tβ-catenin was similar between all groups (p > 0.05, Friedman, Figure 4B).
Cells 2021, 10, x FOR PEER REVIEW 11 of 18
To validate this observation and to further explore the involvement of our entire DE gene list in cellular pathways, an overrepresentation analysis based on KEGG pathways was performed. Results of the pathway analysis for effects of medium, treatment, and their combined effect are shown in Figure 3E (figure shows top five overrepresented path-ways only). Supplementary Table S2 provides the full list of overrepresented KEGG path-ways for each effect. To validate the results, we additionally performed functional path-way analyses, using Reactome and Wikipathway databases (Supplementary Table S3, for the combined effect of treatment and medium). For obvious reasons, curation and anno-tation of pathways differ between the platforms. Yet, interesting commonalities with re-gard to the activation of interleukin signaling and chemokine binding pathways (KEGG, Reactome, and Wikipathways) and mineral absorption (KEGG and Wikipathways) were observed.
3.4. Intracellular β-Catenin Significantly lower intracellular pβ-catenin was evident in the AA/retinol—com-
pared to the inflammatory/AA/retinol– and the inflammatory group (p < 0.05, Figure 4A). Intracellular tβ-catenin was similar between all groups (p > 0.05, Friedman, Figure 4B).
Figure 4. β-catenin expression, cellular proliferation and CFUs following AA/retinol and inflammatory stimulation of G-MSCs: ELISA examination of the phosphorylated (pβ-catenin) and total (tβ-catenin) intracellular β-catenin, following G-MSCs’ challenging by AA/retinol and inflammation ((A) and (B); box and whisker plots with medians/quartiles). GMSCs’ cell proliferatory graph of the AA/retinol and inflammation stimulated groups over 14 days ((C); box and whisker plots with medians/quartiles). CFUs assay/CFUs’ numbers following G-MSCs’ stimulation via ascorbic acid and inflammation ((D); box and whisker plots with medians/quartiles). Significant differences denoted with asterisks (n = 5, * p < 0.05; Fried-man test). Representative CFUs of the four experimental groups (E). CFUs; colony-forming units, pβ-catenin; phosphory-lated β-catenin, tβ-catenin; total (tβ-catenin) intracellular β-catenin.
Figure 4. Cont.

Cells 2021, 10, 3310 11 of 17
Cells 2021, 10, x FOR PEER REVIEW 11 of 18
To validate this observation and to further explore the involvement of our entire DE gene list in cellular pathways, an overrepresentation analysis based on KEGG pathways was performed. Results of the pathway analysis for effects of medium, treatment, and their combined effect are shown in Figure 3E (figure shows top five overrepresented path-ways only). Supplementary Table S2 provides the full list of overrepresented KEGG path-ways for each effect. To validate the results, we additionally performed functional path-way analyses, using Reactome and Wikipathway databases (Supplementary Table S3, for the combined effect of treatment and medium). For obvious reasons, curation and anno-tation of pathways differ between the platforms. Yet, interesting commonalities with re-gard to the activation of interleukin signaling and chemokine binding pathways (KEGG, Reactome, and Wikipathways) and mineral absorption (KEGG and Wikipathways) were observed.
3.4. Intracellular β-Catenin Significantly lower intracellular pβ-catenin was evident in the AA/retinol—com-
pared to the inflammatory/AA/retinol– and the inflammatory group (p < 0.05, Figure 4A). Intracellular tβ-catenin was similar between all groups (p > 0.05, Friedman, Figure 4B).
Figure 4. β-catenin expression, cellular proliferation and CFUs following AA/retinol and inflammatory stimulation of G-MSCs: ELISA examination of the phosphorylated (pβ-catenin) and total (tβ-catenin) intracellular β-catenin, following G-MSCs’ challenging by AA/retinol and inflammation ((A) and (B); box and whisker plots with medians/quartiles). GMSCs’ cell proliferatory graph of the AA/retinol and inflammation stimulated groups over 14 days ((C); box and whisker plots with medians/quartiles). CFUs assay/CFUs’ numbers following G-MSCs’ stimulation via ascorbic acid and inflammation ((D); box and whisker plots with medians/quartiles). Significant differences denoted with asterisks (n = 5, * p < 0.05; Fried-man test). Representative CFUs of the four experimental groups (E). CFUs; colony-forming units, pβ-catenin; phosphory-lated β-catenin, tβ-catenin; total (tβ-catenin) intracellular β-catenin.
Figure 4. β-catenin expression, cellular proliferation and CFUs following AA/retinol and inflammatory stimulation ofG-MSCs: ELISA examination of the phosphorylated (pβ-catenin) and total (tβ-catenin) intracellular β-catenin, followingG-MSCs’ challenging by AA/retinol and inflammation ((A,B); box and whisker plots with medians/quartiles). GMSCs’ cellproliferatory graph of the AA/retinol and inflammation stimulated groups over 14 days ((C); box and whisker plots withmedians/quartiles). CFUs assay/CFUs’ numbers following G-MSCs’ stimulation via ascorbic acid and inflammation ((D);box and whisker plots with medians/quartiles). Significant differences denoted with asterisks (n = 5, * p < 0.05; Friedmantest). Representative CFUs of the four experimental groups (E). CFUs; colony-forming units, pβ-catenin; phosphorylatedβ-catenin, tβ-catenin; total (tβ-catenin) intracellular β-catenin.
3.5. CFUs and Cellular Proliferation
Significant inter-group differences in cellular counts were evident from days 4 to 11,with the AA/retinol group demonstrating the highest cellular counts, followed by thecontrol-, the inflammatory/AA/retinol—and finally the inflammatory group (p < 0.05). At14 days, the numbers of CFUs were significantly higher in the AA/retinol—followed bythe inflammatory/AA/retinol group (p < 0.05, Friedman, Figure 4C–E).
3.6. Stimulated G-MCSs’ Multilineage Differentiation
G-MSCs in all experimental groups exhibited a remarkable multilineage differenti-ation aptitude, with a heightened differentiation potential irrespective of the treatmentgroup. However, the chondrogenic differentiation appeared to be significantly enhancedby the synergistic effect of inflammation and AA/retinol application in the inflamma-tory/AA/retinol group, compared to AA/retinol alone, with significantly higher ACANexpression and glycosaminoglycans deposition observed (p < 0.05, Friedman, Figure 5).

Cells 2021, 10, 3310 12 of 17
Cells 2021, 10, x FOR PEER REVIEW 13 of 18
Figure 5. G-MSCs multilineage differentiation following stimulation by AA/retinol and inflammation: Gene expressions of ALP and RUNX2 following a 14-day osteogenic stimulation ((A); box and whisker plots with medians/quartiles). Ca2+ Figure 5. G-MSCs multilineage differentiation following stimulation by AA/retinol and inflammation: Gene expressions of
ALP and RUNX2 following a 14-day osteogenic stimulation ((A); box and whisker plots with medians/quartiles). Ca2+ quan-tification and Alizarin-Red staining following a 14-day osteogenic induction of ascorbic acid and inflammation stimulatedG-MSCs ((B); box and whisker plots with medians/quartiles). LPL and PPARγ gene expression after 21 days of adipogenicstimulation of ascorbic acid and inflammation challenged G-MSCs ((C); box and whisker plots with medians/quartiles).Oil-Red-O staining and lipid amount quantification of ascorbic acid and inflammation stimulated G-MSCs after 21 daysof adipogenic stimulation ((D); box and whisker plots with medians/quartiles). ACAN gene expression following a35-day chondrogenic induction of ascorbic acid and inflammation stimulated G-MSCs ((E); box and whisker plots withmedians/quartiles). Alcian-blue/nuclear-fast-red staining of ascorbic acid and inflammation stimulated G-MSCs followinga 35-day chondrogenic induction (F) (n = 5, a circle represents an outlier, * p < 0.05, ** p < 0.01; Friedman test).

Cells 2021, 10, 3310 13 of 17
4. Discussion
Periodontal reparative/regenerative approaches rely chiefly on the reiteration of developmen-tal procedures, involving stem/progenitor cells’ proliferation, differentiation, and maturation [36].Clinically, these primary events occur under inflamed periodontal micro-environmental con-ditions, with inflammatory cytokines stage-managing the path of events [2,37,38]. Apart fromtheir important roles in periodontal repair/regeneration [13,14,39,40], AA and retinol exertanti-oxidative effects against periodontitis-induced tissue damages [41,42], demonstrateimmunomodulatory capabilities on stem/progenitor cells, dendritic cells, macrophages,T- and B-cells, and markedly downregulate IL-1α, IL-1β, IL-6, TNF-β, and nitric oxiderelease [43–46]. Most importantly, AA and retinol at specific concentrations, which were em-ployed in the current investigation, could drive cellular reprogramming/de-differentiationand pluripotency [19,20,47].
In accordance with earlier investigations [22,48–51], G-MSCs exhibited all characteristicmesenchymal stem/progenitor cells’ traits [52]. In line with a multitude of studies, revealingthe positive stimulatory effects of local, controlled, and well-timed micro-environmentalpro-inflammatory conditions on G-MSCs’ reparative/regenerative attributes [3,8,53], G-MSCswere challenged by periodontal pro-inflammatory cytokines; explicitly IL-1β, TNF-α, andIFN-γ, by AA/retinol or their combination and their stemness, proliferation, differentiationpotentials, mRNA transcriptomics, and associated gene pathways examined.
Although differences in NANOG, OCT4A, and SOX2 mRNA expressions were de-tectable between the groups at different time points, only NANOG was detectable onprotein level, in line with earlier reports on dissimilar NANOG, OCT4A, and SOX2 pro-tein and mRNA expression dynamics within mesenchymal stem/progenitor cells [54–56].This AA/retinol-induced increase in the NANOG, especially in the presence of controlledinflammatory stimuli at 3 days, could be ascribed primarily to the capability of AA andretinol to activate the ten-eleven translocation (TET) DNA demethylases, initiating in-tracellular epigenetic reprogramming with pluripotency amplification [20,57]. The ob-served synergistic effect suggests that controlled inflammation could have augmented thisAA/retinol-mediated effect. Pro-inflammatory stimuli further appeared to increase theAA/retinol-mediated decrease in phosphorylated β-catenin levels intracellularly, restoringthe G-MSCs’ stemness [58] and differentiation capacity [59].
According to the mRNA NGS results, it was noticeable that the top three differentiallyexpressed genes for all effects could be grouped under five categories, namely genes asso-ciated with developmental biology, cell proliferation, mitosis, and migration (FOS, EGR1,SGK1, CXCL5, SIPA1L2, TFPI2, KRATP1-5), with cell survival (EGR1, SGK1, TMEM132A),with cell differentiation and mineral absorption (FOS, EGR1, MT1E, KRTAP1-5, ASNS,PSAT1), with inflammation and MHC-class-II antigen processing (PER1, CTSS, CD74) andintracellular pathway activation (FKBP5, ZNF404). On day 1, the KEGG pathways of thecombined effect of treatment (AA/retinol or not) and medium (inflammation) were mainlycharacterized by an overexpression of genes in the C-motif chemokine ligand family (CCLand CXCL). The top five activated KEGG pathways affected the IL-17 and TNF signalingpathway, and cytokine/cytokine receptor interaction. On day 3, the overexpression ofC-Motif pathways remained. However, a downregulation of genes in the cardiomyopa-thy pathways, primarily characterized by genes from the alpha integrin family (ITGA10,ITGA11, ITGAB), which bind collagen and are involved in the degradation of the extra-cellular matrix [60,61], was observed. Examining exclusively the effect of inflammatorymedium, on day 1 the top five KEGG pathways were identical to those of the combinedeffect on day 1, although fold changes differed slightly. For the AA/retinol effect, on day 1an under-expression of genes in the integrin-alpha family was notable, with activation ofgenes in the mineral absorption pathway and overexpression of genes in the Metalloth-ionein family (MT1X, MT1E, etc.) [62]. On day 3, activation of the focal adhesion and ECMreceptor interaction pathways was observed, both of which regulate important biologicalprocesses on the cellular level including cellular differentiation, proliferation, motility, andadhesion [61,63]. Broadly speaking, the effect of inflammation seemed to lead to fewer
Cells 2021, 10, 3310 14 of 17
activated genes the longer the cells remained in the inflammatory medium, while the effectof treatment induced activation of more genes the longer the cells were stimulated viaAA/retinol, thus endorsing a positive impact of short-termed inflammatory stimuli with alonger AA/retinol stimulation.
Similar to earlier investigations [53,64,65], AA/retinol augmented G-MSCs’ cellularproliferation, especially between the 4th and 11th day, an effect that was clearly attenuatedby a combination with pro-inflammatory stimuli. The observed proliferation-inducingeffect could be ascribed to AA/retinol-induced upregulated gene expression of SIPA1L2and TFPI2 as well as AA’s ability to suppress cellular growth arrest encoding genes, namelygrowth arrest/DNA damage-inducible 45α (Gadd45a) and apoptosis inducing genes,namely caspase-1 [44] with an upregulation of the proliferation-related Fos-transcriptionalfactor [66]. Although, inflammatory stimuli, especially longer-term TNF-α challenges,could induce self-senescence of stem/progenitor cells, especially in the presence of IFN-γ,through changing the IFN-γ-activated, non-apoptotic form of TNF receptor superfamilymember 6 (Fas) signaling into a caspase 3- and caspase 8-associated pro-apoptotic cas-cade [67], significantly higher CFUs were observed over 14 days in the AA/retinol as wellas the inflammation/AA/retinol group, demonstrating that AA/retinol could counteractthe long-term detrimental effects of inflammation, maintaining the G-MSCs’ colonogenicself-renewal and CFUs production at low cellular densities.
AA and retinol are generally characterized by their ability to modulate cell growth,metabolism, and morphogenesis during osteogenesis [26,68,69] and extracellular matrixproduction [16]. Similar to earlier studies, inflammatory cytokines or AA/retinol short-term pre-stimuli did not attenuate the subsequent G-MSCs’ characteristic multilineagedifferentiation potentials [53,65]. Yet, the results regarding the osteogenic differentiationshould still be interpreted with caution, taking into consideration that osteogenic medianormally contain a specific concentration of AA, which could have possibly maskedany effect between the groups. Particularly their conjoint presence appeared beneficialregarding the G-MSCs’ chondrogenic differentiation capacity. In this context, the activationof genes of the mineral absorption pathway (MT1X, MT1E, KRTAP1-5, PSAT1) and thedownregulation of genes of the alpha integrin family (ITGA10, ITGA11, ITGAB) describedabove could have significantly contributed to this synergistic effect.
5. Conclusions
Combined, current results point at altered G-MSCs’ characteristics in the presenceof controlled inflammation or AA/retinol. Apart from the isolated modulatory effectsof inflammation or AA/retinol on G-MSCs, a synergistic effect of their conjoint pres-ence on the expression of the NANOG stemness marker was observed. The presence ofAA/retinol could counteract the inflammation-induced cellular senescence and maintainthe G-MSCs’ clonogenic abilities. On the other hand, controlled inflammation could restorethe AA/retinol-mediated reduction in intracellular phosphorylated β-catenin as well asenhance the AA/retinol-mediated G-MSC’s chondrogenic differentiation potential. The ob-served effects were associated with the activation of a multitude of differentially expressedgenes associated with development, proliferation and migration, survival, differentiationand mineral absorption, inflammation, and MHC-II antigen processing as well as intra-cellular pathway activation, with less as well as more genes activated the longer the cellsremained in the inflammatory medium or AA/retinol, respectively.
Supplementary Materials: The following are available online at https://www.mdpi.com/article/10.3390/cells10123310/s1, Table S1: A full list of differentially expressed genes for each effect. Table S2:A full list of overrepresented KEGG pathways for each effect. Table S3: A side by side comparisonof overrepresented KEGG, WIKIPATHWAYS and REACTOME pathways for each effect. Figure S1:PCA plot of gene expression data. Colors denote treatment with AA/retinol or no treatment. Shapesdenote control or inflammation medium.
Cells 2021, 10, 3310 15 of 17
Author Contributions: Conceptualization, K.M.F.E.-S., C.G., C.E.D. and D.M.S.; methodology,K.M.F.E.-S., K.S. and D.M.S.; formal analysis, K.M.F.E.-S., A.B., K.S., M.M., J.S. and M.E.-S.; in-vestigation, A.B., K.S., M.M., K.E., M.H. and M.E.-S.; writing—original draft preparation, K.M.F.E.-S.and K.S.; writing—review and editing, K.M.F.E.-S., C.G., M.L., C.E.D. and D.M.S.; supervision,K.M.F.E.-S., M.L., C.E.D. and D.M.S. All authors have read and agreed to the published version ofthe manuscript.
Funding: This study was funded by the Christian Albrechts University of Kiel, Germany.
Institutional Review Board Statement: The study was conducted according to the guidelines of theDeclaration of Helsinki, and approved by the Institutional Review Board of the Christian AlbrechtsUniversity of Kiel, Germany (IRB:513/17).
Informed Consent Statement: Informed consent was obtained from all subjects involved in the study.
Data Availability Statement: The data presented in this study are available on request from thecorresponding author.
Acknowledgments: The authors would like to thank Paymard-Stolz, Marx, Marquardt, Hartmann,Jemlich and Kruse for their excellent scientific support.
Conflicts of Interest: All authors declare no conflict of interest.
References1. Zhang, S.; Yu, N.; Arce, R.M. Periodontal inflammation: Integrating genes and dysbiosis. Periodontology 2020, 82, 129–142.
[CrossRef] [PubMed]2. Papapanou, P.N.; Susin, C. Periodontitis epidemiology: Is periodontitis under-recognized, over-diagnosed, or both? Periodontology
2017, 75, 45–51. [CrossRef] [PubMed]3. El-Sayed, K.M.F.; Elahmady, M.; Adawi, Z.; Aboushadi, N.; Elnaggar, A.; Eid, M.; Hamdy, N.; Sanaa, D.; Dörfer, C.E. The
periodontal stem/progenitor cell inflammatory-regenerative cross talk: A new perspective. J. Periodontal Res. 2019, 54, 81–94.[CrossRef] [PubMed]
4. Zhang, Q.; Shi, S.; Liu, Y.; Uyanne, J.; Shi, Y.; Shi, S.; Le, A.D. Mesenchymal Stem Cells Derived from Human Gingiva Are Capableof Immunomodulatory Functions and Ameliorate Inflammation-Related Tissue Destruction in Experimental Colitis. J. Immunol.2009, 183, 7787–7798. [CrossRef] [PubMed]
5. Fawzy-El-Sayed, K.; Mekhemar, M.; Adam-Klages, S.; Kabelitz, D.; Dorfer, C. TlR expression profile of human gingival margin-derived stem progenitor cells. Med. Oral Patol. Oral Cir. Bucal. 2016, 21, e30–e38. [CrossRef]
6. Mekhemar, M.K.; Adam-Klages, S.; Kabelitz, D.; Dörfer, C.E.; El-Sayed, K.F. TLR-induced immunomodulatory cytokine expressionby human gingival stem/progenitor cells. Cell. Immunol. 2018, 326, 60–67. [CrossRef]
7. Zhou, L.; Dörfer, C.E.; Chen, L.; El-Sayed, K.M.F. Porphyromonas gingivalislipopolysaccharides affect gingival stem/progenitorcells attributes through NF-κB, but not Wnt/β-catenin, pathway. J. Clin. Periodontol. 2017, 44, 1112–1122. [CrossRef]
8. Zhang, F.; Si, M.; Wang, H.; Mekhemar, M.K.; Dörfer, C.E.; El-Sayed, K.M.F. IL-1/TNF-αInflammatory and Anti-InflammatorySynchronization Affects Gingival Stem/Progenitor Cells’ Regenerative Attributes. Stem Cells Int. 2017, 2017, 1–9. [CrossRef]
9. Park, J.-A.; Lee, J.-H.; Jin, B.-H.; Bae, K.-H. Association of Some Vitamins and Minerals with Periodontitis in a NationallyRepresentative Sample of Korean Young Adults. Biol. Trace Element Res. 2017, 178, 171–179. [CrossRef]
10. Linden, G.J.; McClean, K.M.; Woodside, J.V.; Patterson, C.C.; Evans, A.; Young, I.S.; Kee, F. Antioxidants and periodontitis in60-70-year-old men. J. Clin. Periodontol. 2009, 36, 843–849. [CrossRef]
11. Wang, L.; Wang, J.; Jin, Y.; Gao, H.; Lin, X. Oral Administration of All-TransRetinoic Acid Suppresses Experimental Periodontitisby Modulating the Th17/Treg Imbalance. J. Periodontol. 2014, 85, 740–750. [CrossRef] [PubMed]
12. Nishida, M.; Grossi, S.G.; Dunford, R.G.; Ho, A.W.; Trevisan, M.; Genco, R.J. Dietary Vitamin C and the Risk for PeriodontalDisease. J. Periodontol. 2000, 71, 1215–1223. [CrossRef] [PubMed]
13. Chitsazi, M.; Faramarzie, M.; Sadighi, M.; Shirmohammadi, A.; Hashemzadeh, A. Effects of adjective use of melatonin andvitamin C in the treatment of chronic periodontitis: A randomized clinical trial. J. Dent. Res. Dent. Clin. Dent. Prospect. 2017, 11,236–240.
14. Sulaiman, A.E.A.; Shehadeh, R.M. Assessment of Total Antioxidant Capacity and the Use of Vitamin C in the Treatment ofNon-Smokers with Chronic Periodontitis. J. Periodontol. 2010, 81, 1547–1554. [CrossRef]
15. Bi, Y.; Gong, M.; Zhang, X.; Zhang, X.; Jiang, W.; Zhang, Y.; Chen, J.; Liu, Y.; He, T.-C.; Li, T. Pre-activation of retinoid signalingfacilitates neuronal differentiation of mesenchymal stem cells. Dev. Growth Differ. 2010, 52, 419–431. [CrossRef]
16. Yu, J.; Tu, Y.-K.; Tang, Y.-B.; Cheng, N.-C. Stemness and transdifferentiation of adipose-derived stem cells using l-ascorbic acid2-phosphate-induced cell sheet formation. Biomaterials 2014, 35, 3516–3526. [CrossRef] [PubMed]
17. Li, C.-J.; Sun, L.-Y.; Pang, C.-Y. Synergistic Protection of N-Acetylcysteine and Ascorbic Acid 2-Phosphate on Human MesenchymalStem Cells Against Mitoptosis, Necroptosis and Apoptosis. Sci. Rep. 2015, 5, 9819. [CrossRef]
Cells 2021, 10, 3310 16 of 17
18. Gao, Y.; Han, Z.; Li, Q.; Wu, Y.; Shi, X.; Ai, Z.; Du, J.; Li, W.; Guo, Z.; Zhang, Y. Vitamin C induces a pluripotent state in mouseembryonic stem cells by modulating microRNA expression. FEBS J. 2015, 282, 685–699. [CrossRef]
19. Esteban, M.A.; Pei, D. Vitamin C improves the quality of somatic cell reprogramming. Nat. Genet. 2012, 44, 366–367. [CrossRef]20. Hore, T.A. Modulating epigenetic memory through vitamins and TET: Implications for regenerative medicine and cancer
treatment. Epigenomics 2017, 9, 863–871. [CrossRef]21. Van Pham, P.; Tran, N.Y.; Phan, N.L.-C.; Vu, N.B.; Phan, N.K. Vitamin C stimulates human gingival stem cell proliferation and
expression of pluripotent markers. Vitr. Cell. Dev. Biol. Anim. 2015, 52, 218–227. [CrossRef] [PubMed]22. El-Sayed, K.M.F.; Paris, S.; Graetz, C.; Kassem, N.; Mekhemar, M.; Ungefroren, H.; Fändrich, F.; E Dorfer, C. Isolation and
characterisation of human gingival margin-derived STRO-1/MACS+ and MACS− cell populations. Int. J. Oral Sci. 2015, 7, 80–88.[CrossRef] [PubMed]
23. Sidney, L.E.; Kirkham, G.R.; Buttery, L.D. Comparison of Osteogenic Differentiation of Embryonic Stem Cells and PrimaryOsteoblasts Revealed by Responses to IL-1β, TNF-α, and IFN-γ. Stem Cells Dev. 2014, 23, 605–617. [CrossRef]
24. Fawzy-El-Sayed, K.M.; Klingebiel, P.; Dörfer, C.E. Toll-like Receptor Expression Profile of Human Dental Pulp Stem/ProgenitorCells. J. Endod. 2016, 42, 413–417. [CrossRef]
25. Fehrmann, C.; Dörfer, C.E.; El-Sayed, K.M.F. Toll-like Receptor Expression Profile of Human Stem/Progenitor Cells Form theApical Papilla. J. Endod. 2020, 46, 1623–1630. [CrossRef] [PubMed]
26. Zhang, S.; Chen, X.; Hu, Y.; Wu, J.; Cao, Q.; Chen, S.; Gao, Y. All-trans retinoic acid modulates Wnt3A-induced osteogenicdifferentiation of mesenchymal stem cells via activating the PI3K/AKT/GSK3β signalling pathway. Mol. Cell. Endocrinol. 2016,422, 243–253. [CrossRef]
27. Ewels, P.A.; Peltzer, A.; Fillinger, S.; Patel, H.; Alneberg, J.; Wilm, A.; Garcia, M.U.; Di Tommaso, P.; Nahnsen, S. The nf-coreframework for community-curated bioinformatics pipelines. Nat. Biotechnol. 2020, 38, 276–278. [CrossRef]
28. Robinson, M.D.; McCarthy, D.J.; Smyth, G.K. edgeR: A Bioconductor package for differential expression analysis of digital geneexpression data. Bioinformatics 2010, 26, 139–140. [CrossRef]
29. Love, M.I.; Huber, W.; Anders, S. Moderated estimation of fold change and dispersion for RNA-seq data with DESeq2. GenomeBiol. 2014, 15, 550. [CrossRef]
30. McCarthy, D.J.; Chen, Y.; Smyth, G.K. Differential expression analysis of multifactor RNA-Seq experiments with respect tobiological variation. Nucleic Acids Res. 2012, 40, 4288–4297. [CrossRef]
31. Kanehisa, M.; Goto, S. KEGG: Kyoto Encyclopedia of Genes and Genomes. Nucleic Acids Res. 2000, 28, 27–30. [CrossRef]32. Yu, G.; Wang, L.-G.; Han, Y.; He, Q.-Y. clusterProfiler: An R Package for Comparing Biological Themes Among Gene Clusters.
OMICS J. Integr. Biol. 2012, 16, 284–287. [CrossRef]33. Mahmood, M.; Li, Z.; Casciano, D.; Khodakovskaya, M.V.; Chen, T.; Karmakar, A.; Dervishi, E.; Xu, Y.; Mustafa, T.; Watanabe, F.;
et al. Nanostructural materials increase mineralization in bone cells and affect gene expression through miRNA regulation. J. Cell.Mol. Med. 2011, 15, 2297–2306. [CrossRef] [PubMed]
34. Sun, J.; Ye, X.; Xie, M.; Ye, J. Induction of triglyceride accumulation and mitochondrial maintenance in muscle cells by lactate. Sci.Rep. 2016, 6, 33732. [CrossRef] [PubMed]
35. Mekhemar, M.; Tölle, J.; Dörfer, C.; El-Sayed, K.F. TLR3 ligation affects differentiation and stemness properties of gingivalmesenchymal stem/progenitor cells. J. Clin. Periodontol. 2020, 47, 991–1005. [CrossRef]
36. El-Sayed, K.M.F.; Dörfer, C.E. Animal Models for Periodontal Tissue Engineering: A Knowledge-Generating Process. Tissue Eng.Part C: Methods 2017, 23, 900–925. [CrossRef]
37. Silva, T.; Garlet, G.; Fukada, S.; Silva, J.S.; Cunha, F.Q. Chemokines in Oral Inflammatory Diseases: Apical Periodontitis andPeriodontal Disease. J. Dent. Res. 2007, 86, 306–319. [CrossRef] [PubMed]
38. Lee, J.; Bin Lee, J.; Cha, J.; Choi, E.; Park, S.; Cho, K.S.; Kim, C. Chemokine in inflamed periodontal tissues activates healthyperiodontal-ligament stem cell migration. J. Clin. Periodontol. 2017, 44, 530–539. [CrossRef]
39. Rubin, M.B. Vitamins Wound Healing. Plast. Surg. Nurs. 1984, 4, 16–19. [CrossRef] [PubMed]40. Elbehwashy, M.T.; Hosny, M.M.; Elfana, A.; Nawar, A.; El-Sayed, K.F. Clinical and radiographic effects of ascorbic acid-augmented
platelet-rich fibrin versus platelet-rich fibrin alone in intra-osseous defects of stage-III periodontitis patients: A randomizedcontrolled clinical trial. Clin. Oral Investig. 2021, 25, 6309–6319. [CrossRef]
41. Chapple, I.L.C. Reactive oxygen species and antioxidants in inflammatory diseases. J. Clin. Periodontol. 1997, 24, 287–296.[CrossRef]
42. Alagl, A.; Bhat, S.G. Ascorbic acid: New role of an age-old micronutrient in the management of periodontal disease in olderadults. Geriatr. Gerontol. Int. 2014, 15, 241–254. [CrossRef]
43. Majewicz, J.; Rimbach, G.; Proteggente, A.R.; Lodge, J.K.; Kraemer, K.; Minihane, A.M. Dietary vitamin C down-regulatesinflammatory gene expression in apoE4 smokers. Biochem. Biophys. Res. Commun. 2005, 338, 951–955. [CrossRef]
44. Tomofuji, T.; Ekuni, D.; Sanbe, T.; Irie, K.; Azuma, T.; Maruyama, T.; Tamaki, N.; Murakami, J.; Kokeguchi, S.; Yamamoto, T.Effects of vitamin C intake on gingival oxidative stress in rat periodontitis. Free. Radic. Biol. Med. 2009, 46, 163–168. [CrossRef][PubMed]
45. Erkelens, M.N.; Mebius, R.E. Retinoic Acid and Immune Homeostasis: A Balancing Act. Trends Immunol. 2017, 38, 168–180.[CrossRef] [PubMed]
Cells 2021, 10, 3310 17 of 17
46. Abdelhamid, L.; Hussein, H.; Ghanem, M.; Eissa, N. Retinoic acid-mediated anti-inflammatory responses in equine immune cellsstimulated by LPS and allogeneic mesenchymal stem cells. Res. Veter. Sci. 2017, 114, 225–232. [CrossRef] [PubMed]
47. Gao, Y.; Yang, L.; Chen, L.; Wang, X.; Wu, H.; Ai, Z.; Du, J.; Liu, Y.; Shi, X.; Wu, Y.; et al. Vitamin C facilitates pluripotent stem cellmaintenance by promoting pluripotency gene transcription. Biochimie 2013, 95, 2107–2113. [CrossRef] [PubMed]
48. Tomar, G.B.; Srivastava, R.K.; Gupta, N.; Barhanpurkar, A.P.; Pote, S.T.; Jhaveri, H.M.; Mishra, G.C.; Wani, M.R. Human gingiva-derived mesenchymal stem cells are superior to bone marrow-derived mesenchymal stem cells for cell therapy in regenerativemedicine. Biochem. Biophys. Res. Commun. 2010, 393, 377–383. [CrossRef]
49. Fournier, B.P.; Ferre, F.C.; Couty, L.; Lataillade, J.-J.; Gourven, M.; Naveau, A.; Coulomb, B.; Lafont, A.; Gogly, B. MultipotentProgenitor Cells in Gingival Connective Tissue. Tissue Eng. Part A 2010, 16, 2891–2899. [CrossRef]
50. Jin, S.-H.; Lee, J.E.; Yun, J.-H.; Kim, I.; Ko, Y.; Park, J.B. Isolation and characterization of human mesenchymal stem cells fromgingival connective tissue. J. Periodontal Res. 2014, 50, 461–467. [CrossRef]
51. Gao, Y.; Zhao, G.; Jianliang, P.; Chen, X.; Pang, J.; Ke, J. Isolation and Multiple Differentiation Potential Assessment of HumanGingival Mesenchymal Stem Cells. Int. J. Mol. Sci. 2014, 15, 20982–20996. [CrossRef]
52. Dominici, M.; Le Blanc, K.; Mueller, I.; Slaper-Cortenbach, I.; Marini, F.; Krause, D.; Deans, R.; Keating, A.; Prockop, D.; Horwitz,E. Minimal criteria for defining multipotent mesenchymal stromal cells. The International Society for Cellular Therapy positionstatement. Cytotherapy 2006, 8, 315–317. [CrossRef]
53. El-Sayed, K.M.F.; Hein, D.; Dörfer, C.E. Retinol/inflammation affect stemness and differentiation potential of gingivalstem/progenitor cells via Wnt/β-catenin. J. Periodontal Res. 2019, 54, 413–423. [CrossRef]
54. Liu, Y.; Beyer, A.; Aebersold, R. On the Dependency of Cellular Protein Levels on mRNA Abundance. Cell 2016, 165, 535–550.[CrossRef]
55. Van den Berg, P.R.; Budnik, B.; Slavov, N.; Semrau, S. Dynamic post-transcriptional regulation during embryonic stem celldifferentiation. bioRxiv 2017, 123497. [CrossRef]
56. Reimegård, J.; Tarbier, M.; Danielsson, M.; Schuster, J.; Baskaran, S.; Panagiotou, S.; Dahl, N.; Friedländer, M.R.; Gallant, C.J. Acombined approach for single-cell mRNA and intracellular protein expression analysis. Commun. Biol. 2021, 4, 1–11. [CrossRef][PubMed]
57. Hore, T.A.; von Meyenn, F.; Ravichandran, M.; Bachman, M.; Ficz, G.; Oxley, D.; Santos, F.; Balasubramanian, S.; Jurkowski,T.P.; Reik, W. Retinol and ascorbate drive erasure of epigenetic memory and enhance reprogramming to naïve pluripotency bycomplementary mechanisms. Proc. Natl. Acad. Sci. USA 2016, 113, 12202–12207. [CrossRef] [PubMed]
58. Rasmussen, M.; Ortolano, N.A.; Romero-Morales, A.I.; Gama, V. Wnt Signaling and Its Impact on Mitochondrial and Cell CycleDynamics in Pluripotent Stem Cells. Genes 2018, 9, 109. [CrossRef]
59. Kong, X.; Liu, Y.; Ye, R.; Zhu, B.; Zhu, Y.; Liu, X.; Hu, C.-H.; Luo, H.; Zhang, Y.; Ding, Y.; et al. GSK3β is a checkpoint forTNF-α-mediated impaired osteogenic differentiation of mesenchymal stem cells in inflammatory microenvironments. Biochim.Biophys. Acta (BBA) Gen. Subj. 2013, 1830, 5119–5129. [CrossRef]
60. Lehnert, K.; Ni, J.; Leung, E.; Gough, S.; Morris, C.; Liu, D.; Wang, S.-X.; Langley, R.; Krissansen, G. The integrin α10 subunit:Expression pattern, partial gene structure, and chromosomal localization. Cytogenet. Genome Res. 1999, 87, 238–244. [CrossRef]
61. Bosman, F.T.; Stamenkovic, I. Functional structure and composition of the extracellular matrix. J. Pathol. 2003, 200, 423–428.[CrossRef]
62. Stennard, F.; Holloway, A.F.; Hamilton, J.; West, A.K. Characterisation of six additional human metallothionein genes. Biochim.Biophys. Acta (BBA) Gene Struct. Expr. 1994, 1218, 357–365. [CrossRef]
63. Petit, V.; Thiery, J.-P. Focal adhesions: Structure and dynamics. Biol. Cell 2000, 92, 477–494. [CrossRef]64. Yoo, H.G.; Chang, I.-Y.; Pyo, H.K.; Kang, Y.J.; Lee, S.H.; Kwon, O.; Cho, K.H.; Eun, H.C.; Kim, K.H. The Additive Effects of
Minoxidil and Retinol on Human Hair Growth in Vitro. Biol. Pharm. Bull. 2007, 30, 21–26. [CrossRef]65. El-Sayed, K.M.F.; Nguyen, N.; Dörfer, C.E. Ascorbic Acid, Inflammatory Cytokines (IL-1β/TNF-α/IFN-γ), or Their Combination’s
Effect on Stemness, Proliferation, and Differentiation of Gingival Mesenchymal Stem/Progenitor Cells. Stem Cells Int. 2020, 2020,1–14. [CrossRef]
66. Kim, J.H.; Kim, W.-K.; Sung, Y.K.; Kwack, M.H.; Song, S.Y.; Choi, J.-S.; Park, S.G.; Yi, T.; Lee, H.-J.; Kim, D.-D.; et al. The MolecularMechanism Underlying the Proliferating and Preconditioning Effect of Vitamin C on Adipose-Derived Stem Cells. Stem Cells Dev.2014, 23, 1364–1376. [CrossRef] [PubMed]
67. Liu, Y.; Wang, L.; Kikuiri, T.; Akiyama, K.; Chen, C.; Xu, X.; Yang, R.; Chen, W.; Wang, S.; Shi, S. Mesenchymal stem cell–basedtissue regeneration is governed by recipient T lymphocytes via IFN-γ and TNF-α. Nat. Med. 2011, 17, 1594–1601. [CrossRef]
68. Carinci, F.; Pezzetti, F.; Spina, A.M.; Palmieri, A.; Laino, G.; De Rosa, A.; Farina, E.; Illiano, F.; Stabellini, G.; Perrotti, V.; et al.Effect of Vitamin C on pre-osteoblast gene expression. Arch. Oral Biol. 2005, 50, 481–496. [CrossRef] [PubMed]
69. Ishikawa, S.; Iwasaki, K.; Komaki, M.; Ishikawa, I. Role of Ascorbic Acid in Periodontal Ligament Cell Differentiation.J. Periodontol. 2004, 75, 709–716. [CrossRef]