arXiv:astro-ph/0611063v1 2 Nov 2006 - Roderic
32
arXiv:astro-ph/0611063v1 2 Nov 2006 Five years of searches for point sources of astrophysical neutrinos with the AMANDA-II neutrino telescope A. Achterberg 31 , M. Ackermann 33 ∗ , J. Adams 11 , J. Ahrens 21 , K. Andeen 20 , D. W. Atlee 29 , J. N. Bahcall 25 † , X. Bai 23 , B. Baret 9 , S. W. Barwick 16 , R. Bay 5 , K. Beattie 7 , T. Becka 21 , J. K. Becker 13 , K.-H. Becker 32 , P. Berghaus 8 , D. Berley 12 , E. Bernardini 33∗ , D. Bertrand 8 , D. Z. Besson 17 , E. Blaufuss 12 , D. J. Boersma 20 , C. Bohm 27 , J. Bolmont 33 ,S.B¨oser 33 , O. Botner 30 , A. Bouchta 30 , J. Braun 20 , C. Burgess 27 , T. Burgess 27 , T. Castermans 22 , D. Chirkin 7 , B. Christy 12 , J. Clem 23 , D. F. Cowen 29,28 , M. V. D’Agostino 5 , A. Davour 30 , C. T. Day 7 , C. De Clercq 9 , L. Demir¨ors 23 , F. Descamps 14 , P. Desiati 20 , T. DeYoung 29 , J. C. Diaz-Velez 20 , J. Dreyer 13 , J. P. Dumm 20 , M. R. Duvoort 31 , W. R. Edwards 7 , R. Ehrlich 12 , J. Eisch 26 , R. W. Ellsworth 12 , P. A. Evenson 23 , O. Fadiran 3 , A. R. Fazely 4 , T. Feser 21 , K. Filimonov 5 , B. D. Fox 29 , T. K. Gaisser 23 , J. Gallagher 19 , R. Ganugapati 20 , H. Geenen 32 , L. Gerhardt 16 , A. Goldschmidt 7 , J. A. Goodman 12 , R. Gozzini 21 , S. Grullon 20 , A. Groß 15 , R. M. Gunasingha 4 , M. Gurtner 32 , A. Hallgren 30 , F. Halzen 20 , K. Han 11 , K. Hanson 20 , D. Hardtke 5 , R. Hardtke 26 , T. Harenberg 32 , J. E. Hart 29 , T. Hauschildt 23 , D. Hays 7 , J. Heise 31 , K. Helbing 32 , M. Hellwig 21 , P. Herquet 22 , G. C. Hill 20 , J. Hodges 20 , K. D. Hoffman 12 , B. Hommez 14 , K. Hoshina 20 , D. Hubert 9 , B. Hughey 20 , P. O. Hulth 27 , K. Hultqvist 27 , S. Hundertmark 27 , J.-P. H¨ ulß 32 , A. Ishihara 10 , J. Jacobsen 7 , G. S. Japaridze 3 , H. Johansson 27 , A. Jones 7 , J. M. Joseph 7 , K.-H. Kampert 32 , A. Karle 20 , H. Kawai 10 , J. L. Kelley 20 , M. Kestel 29 , N. Kitamura 20 , S. R. Klein 7 , S. Klepser 33 , G. Kohnen 22 , H. Kolanoski 6 , M. Kowalski 6 ,L.K¨opke 21 , M. Krasberg 20 , K. Kuehn 16 , H. Landsman 20 , H. Leich 33 , D. Leier 13 , M. Leuthold 1 , I. Liubarsky 18 , J. Lundberg 30 , J. L¨ unemann 13 , J. Madsen 26 , K. Mase 10 , H. S. Matis 7 , T. McCauley 7 , C. P. McParland 7 , A. Meli 13 , T. Messarius 13 , P. M´ esz´aros 29,28 , H. Miyamoto 10 , A. Mokhtarani 7 , T. Montaruli 20 ‡ , A. Morey 5 , R. Morse 20 , S. M. Movit 28 , K. M¨ unich 13 , R. Nahnhauer 33 , ∗ Corresponding authors: [email protected] (M. Ackermann) and [email protected] (E. Bernardini) † Deceased ‡ On leave from University of Bari, I-70126 Bari, Italy
-
Upload
khangminh22 -
Category
Documents
-
view
1 -
download
0
Transcript of arXiv:astro-ph/0611063v1 2 Nov 2006 - Roderic

arX
iv:a
stro
-ph/
0611
063v
1 2
Nov
200
6
Five years of searches for point sources of astrophysical neutrinos
with the AMANDA-II neutrino telescope
A. Achterberg31, M. Ackermann33∗, J. Adams11, J. Ahrens21, K. Andeen20, D. W. Atlee29,
J. N. Bahcall25†, X. Bai23, B. Baret9, S. W. Barwick16, R. Bay5, K. Beattie7, T. Becka21,
J. K. Becker13, K.-H. Becker32, P. Berghaus8, D. Berley12, E. Bernardini33∗, D. Bertrand8,
D. Z. Besson17, E. Blaufuss12, D. J. Boersma20, C. Bohm27, J. Bolmont33, S. Boser33,
O. Botner30, A. Bouchta30, J. Braun20, C. Burgess27, T. Burgess27, T. Castermans22,
D. Chirkin7, B. Christy12, J. Clem23, D. F. Cowen29,28, M. V. D’Agostino5, A. Davour30,
C. T. Day7, C. De Clercq9, L. Demirors23, F. Descamps14, P. Desiati20, T. DeYoung29,
J. C. Diaz-Velez20, J. Dreyer13, J. P. Dumm20, M. R. Duvoort31, W. R. Edwards7,
R. Ehrlich12, J. Eisch26, R. W. Ellsworth12, P. A. Evenson23, O. Fadiran3, A. R. Fazely4,
T. Feser21, K. Filimonov5, B. D. Fox29, T. K. Gaisser23, J. Gallagher19, R. Ganugapati20,
H. Geenen32, L. Gerhardt16, A. Goldschmidt7, J. A. Goodman12, R. Gozzini21, S. Grullon20,
A. Groß15, R. M. Gunasingha4, M. Gurtner32, A. Hallgren30, F. Halzen20, K. Han11,
K. Hanson20, D. Hardtke5, R. Hardtke26, T. Harenberg32, J. E. Hart29, T. Hauschildt23,
D. Hays7, J. Heise31, K. Helbing32, M. Hellwig21, P. Herquet22, G. C. Hill20, J. Hodges20,
K. D. Hoffman12, B. Hommez14, K. Hoshina20, D. Hubert9, B. Hughey20, P. O. Hulth27,
K. Hultqvist27, S. Hundertmark27, J.-P. Hulß32, A. Ishihara10, J. Jacobsen7,
G. S. Japaridze3, H. Johansson27, A. Jones7, J. M. Joseph7, K.-H. Kampert32, A. Karle20,
H. Kawai10, J. L. Kelley20, M. Kestel29, N. Kitamura20, S. R. Klein7, S. Klepser33,
G. Kohnen22, H. Kolanoski6, M. Kowalski6, L. Kopke21, M. Krasberg20, K. Kuehn16,
H. Landsman20, H. Leich33, D. Leier13, M. Leuthold1, I. Liubarsky18, J. Lundberg30,
J. Lunemann13, J. Madsen26, K. Mase10, H. S. Matis7, T. McCauley7, C. P. McParland7,
A. Meli13, T. Messarius13, P. Meszaros29,28, H. Miyamoto10, A. Mokhtarani7,
T. Montaruli20‡, A. Morey5, R. Morse20, S. M. Movit28, K. Munich13, R. Nahnhauer33,
∗ Corresponding authors: [email protected] (M. Ackermann) and [email protected] (E.
Bernardini)† Deceased‡ On leave from University of Bari, I-70126 Bari, Italy

2
J. W. Nam16, P. Nießen23, D. R. Nygren7, H. Ogelman20, A. Olivas12, S. Patton7,
C. Pena-Garay25, C. Perez de los Heros30, A. Piegsa21, D. Pieloth33, A. C. Pohl30,
R. Porrata5, J. Pretz12, P. B. Price5, G. T. Przybylski7, K. Rawlins2, S. Razzaque29,28,
E. Resconi15, W. Rhode13, M. Ribordy22, A. Rizzo9, S. Robbins32, P. Roth12, C. Rott29,
D. Rutledge29, D. Ryckbosch14, H.-G. Sander21, S. Sarkar24, S. Schlenstedt33, T. Schmidt12,
D.Schneider20, D. Seckel23, S. H. Seo29, S. Seunarine11, A. Silvestri16, A. J. Smith12,
M. Solarz5, C. Song20, J. E. Sopher7, G. M. Spiczak26, C. Spiering33, M. Stamatikos20,
T. Stanev23, P. Steffen33, T. Stezelberger7, R. G. Stokstad7, M. C. Stoufer7, S. Stoyanov23,
E. A. Strahler20, T. Straszheim12, K.-H. Sulanke33, G. W. Sullivan12, T. J. Sumner18,
I. Taboada5, O. Tarasova33, A. Tepe32, L. Thollander27, S. Tilav23, M. Tluczykont33,
P. A. Toale29, D. Turcan12, N. van Eijndhoven31, J. Vandenbroucke5, A. Van Overloop14,
B. Voigt33, W. Wagner29, C. Walck27, H. Waldmann33, M. Walter33, Y.-R. Wang20,
C. Wendt20, C. H. Wiebusch1, G. Wikstrom27, D. R. Williams29, R. Wischnewski33 ,
H. Wissing1, K. Woschnagg5, X. W. Xu26, G. Yodh16, S. Yoshida10, J. D. Zornoza20
1III Physikalisches Institut, RWTH Aachen University, D-52056, Aachen, Germany
2Dept. of Physics and Astronomy, University of Alaska Anchorage,
3211 Providence Dr., Anchorage, AK 99508, USA
3CTSPS, Clark-Atlanta University, Atlanta, GA 30314, USA
4Dept. of Physics, Southern University, Baton Rouge, LA 70813, USA
5Dept. of Physics, University of California, Berkeley, CA 94720, USA
6Institut fur Physik, Humboldt Universitat zu Berlin, D-12489 Berlin, Germany
7Lawrence Berkeley National Laboratory, Berkeley, CA 94720, USA
8Universite Libre de Bruxelles, Science Faculty CP230, B-1050 Brussels, Belgium
9Vrije Universiteit Brussel, Dienst ELEM, B-1050 Brussels, Belgium
10Dept. of Physics, Chiba University, Chiba 263-8522 Japan
11Dept. of Physics and Astronomy, University of Canterbury,
Private Bag 4800, Christchurch, New Zealand
12Dept. of Physics, University of Maryland, College Park, MD 20742, USA
13Dept. of Physics, Universitat Dortmund, D-44221 Dortmund, Germany
14Dept. of Subatomic and Radiation Physics,
3
University of Gent, B-9000 Gent, Belgium
15Max-Planck-Institut fur Kernphysik, D-69177 Heidelberg, Germany
16Dept. of Physics and Astronomy, University of California, Irvine, CA 92697, USA
17Dept. of Physics and Astronomy, University of Kansas, Lawrence, KS 66045, USA
18Blackett Laboratory, Imperial College, London SW7 2BW, UK
19Dept. of Astronomy, University of Wisconsin, Madison, WI 53706, USA
20Dept. of Physics, University of Wisconsin, Madison, WI 53706, USA
21Institute of Physics, University of Mainz,
Staudinger Weg 7, D-55099 Mainz, Germany
22University of Mons-Hainaut, 7000 Mons, Belgium
23Bartol Research Institute, University of Delaware, Newark, DE 19716, USA
24Dept. of Physics, University of Oxford,
1 Keble Road, Oxford OX1 3NP, UK
25Institute for Advanced Study, Princeton, NJ 08540, USA
26Dept. of Physics, University of Wisconsin, River Falls, WI 54022, USA
27Dept. of Physics, Stockholm University, SE-10691 Stockholm, Sweden
28Dept. of Astronomy and Astrophysics,
Pennsylvania State University, University Park, PA 16802, USA
29Dept. of Physics, Pennsylvania State University, University Park, PA 16802, USA
30Division of High Energy Physics, Uppsala University, S-75121 Uppsala, Sweden
31Dept. of Physics and Astronomy, Utrecht University/SRON,
NL-3584 CC Utrecht, The Netherlands
32Dept. of Physics, University of Wuppertal, D-42119 Wuppertal, Germany and
33DESY, D-15735 Zeuthen, Germany
(Dated: February 5, 2008)
We report the results of a five-year survey of the northern sky to search for point
sources of high energy neutrinos. The search was performed on the data collected
with the AMANDA-II neutrino telescope in the years 2000 to 2004, with a live-
time of 1001 days. The sample of selected events consists of 4282 upward going
muon tracks with high reconstruction quality and an energy larger than about 100

4
GeV. We found no indication of point sources of neutrinos and set 90% confidence
level flux upper limits for an all-sky search and also for a catalog of 32 selected
sources. For the all-sky search, our average (over declination and right ascension)
experimentally observed upper limit Φ0 =(
E1TeV
)γ· dΦ
dEto a point source flux of
muon and tau neutrino (detected as muons arising from taus) is Φ0νµ+νµ
+ Φ0ντ+ντ
=
11.1 · 10−11 TeV−1 cm−2 s−1, in the energy range between 1.6 TeV and 2.5 PeV for
a flavor ratio Φ0νµ+νµ
/Φ0ντ+ντ
= 1 and assuming a spectral index γ=2. It should
be noticed that this is the first time we set upper limits to the flux of muon and
tau neutrinos. In previous papers we provided muon neutrino upper limits only
neglecting the sensitivity to a signal from tau neutrinos, which improves the limits by
10% to 16%. The value of the average upper limit presented in this work corresponds
to twice the limit on the muon neutrino flux Φ0νµ+νµ
= 5.5 · 10−11 TeV−1 cm−2 s−1.
A stacking analysis for preselected active galactic nuclei and a search based on the
angular separation of the events were also performed. We report the most stringent
flux upper limits to date, including the results of a detailed assessment of systematic
uncertainties.
PACS numbers: 95.55.Vj, 95.75.Mn, 95.75.Pq, 95.80.+p, 95.85.Ry
I. INTRODUCTION
The search for high energy extraterrestrial neutrinos is the major focus of the Antarctic
Muon And Neutrino Detector Array (AMANDA) [1]. The goal is the understanding of the
origin of high energy cosmic rays. While a flux of charged particles is observed up to energies
of a few hundred EeV, high energy gamma rays with energies up to a few tens TeV have
been detected from several astrophysical objects. Remarkably, the nature of the high energy
processes leading to the observed particles and radiation is in most cases not known.
Neutrinos are expected to be emitted from a variety of astrophysical objects: galactic
objects like pulsars [2], accreting binary systems [3], particularly micro-quasars [4, 5, 6], and
supernova remnants [7], as well as from extragalactic objects like active galactic nuclei [8, 9],
particularly blazars [10, 11, 12, 13]. Reviews that include flux predictions of high energy
neutrinos from galactic and extragalactic objects can be found in [7] and [14]. To date no

5
extraterrestrial high energy neutrino flux has been observed [15, 16, 17, 18, 19]. Searches
for point sources of high energy neutrinos were presented by [20, 21, 22, 23, 24].
The search for cosmic neutrinos appears more challenging than the observation of cos-
mic rays and high energy gamma-rays, due to the much smaller cross section for neutrino
interaction. On the other hand, the small interaction cross section makes neutrinos rather
unique astronomical messengers: neutrinos point back to their origin and unlike gamma-rays
they can escape from dense matter regions and propagate freely over cosmological distances.
Their observation would provide an incontrovertible signature of hadron acceleration by
astrophysical objects.
In this paper we report the results of a search for point sources of high energy neutrinos
using data collected with AMANDA-II between 2000 and 2004.
II. DETECTION OF UPWARD GOING NEUTRINOS WITH AMANDA
The AMANDA-II detector is located at the Geographic South Pole and consists of an
array of photomultipliers to detect Cherenkov photons emitted by charged particles travers-
ing the polar ice. An individual detection unit (optical module) is assembled from an 8
inch diameter photomultiplier, providing good sensitivity to single photons, housed in a
pressure-resistant glass sphere, both optically coupled with transparent gel. The system has
been mechanically and optically stable since the first year of deployment (1996). Completed
in the year 2000, the detector includes 677 optical modules on 19 vertical strings, most of
which are deployed at depths between 1.5 and 2 kilometers [1]. Approximately 540 of the
optical modules that form the core of the detector array and showing stable performance
are used for this analysis.
The geometry of AMANDA-II is optimized to detect muon tracks induced by charged
current interactions of neutrinos with energies above 1 TeV. Neutrino induced muon tracks
may have ranges of several kilometers (about 8 km in ice at 10 TeV). They are reconstructed
from the arrival time of the Cherenkov photons at the optical modules. The energy threshold
depends on reconstruction methods and quality criteria. In this analysis 95% of the Monte
Carlo simulated atmospheric neutrinos have energies larger than about 100 GeV ([25, 26]).
The muon energy can be estimated from the number of detected Cherenkov photons. The
resolution in the logarithm of the energy, log10(E/GeV), is about 0.4 at energies above a
6
few TeV [27]. Above 1 TeV, the mean angular offset between the incoming neutrino and
the muon track is less than 0.8◦ [28]. The mean scattering angle due to multiple Coulomb-
scattering during propagation of the muon is an order of magnitude smaller [29].
Searches for astrophysical sources of neutrinos have to cope with a background of events
from the interaction of cosmic rays in the earth’s atmosphere. Decays of secondary mesons
induce a background of downward going muons and a more uniform background of neutrinos.
Typical trigger rates measured with AMANDA-II are O(109) events per year from downward
going atmospheric muons and O(103) muon tracks induced by atmospheric neutrinos, while
only a few events are predicted by models for astrophysical sources [30, 31]. Neutrino
candidates are selected by rejecting muon tracks reconstructed as downward going since
only neutrinos can cross the earth. This limits the sensitivity to the northern sky.
A point source would manifest itself as a localized excess of events over the background.
While the background is uniformly distributed in right ascension, the angular distribution of
an astrophysical signal would follow the detector point spread function. In order to achieve
a high signal-to-noise ratio, much effort was dedicated to improving the event reconstruction
and selection, and consequently the track angular resolution, over a wide energy range.
A series of reconstruction methods with increasing accuracy at the expense of increased
reconstruction time are applied. Fast pattern recognition procedures provide a first-guess
estimate of the track direction. Because of the scattering of the photons on dust and crystal
grains in the polar ice [32], complex reconstruction algorithms are necessary to measure
the direction with a good angular resolution. Based on maximum likelihood procedures
in a multi-parameter space using the first-guess results as starting point, high level recon-
structions aim at finding the best likelihood for a given event topology with respect to the
recorded hits [27].
About 0.1% of the downward going muons are wrongly reconstructed as upward going.
A selection based on event quality parameters is used to reduce these events by an addi-
tional four orders of magnitude. Yet an irreducible background remains from upward going
muons induced by atmospheric neutrinos together with a small fraction of mis-reconstructed
downward going muons plus possible signal events. Typical resolutions achieved in the re-
construction of the muon direction are between 1.5◦ and 2.5◦ degrees (median spatial angle),
depending on energy and declination.
In order to avoid biases in the event selection, the final event selection was developed

7
following a blind approach. In the search for point sources, where the event direction is
used to look for a signal, this is accomplished by optimizing cuts on a sample of events with
randomized right ascension. Accumulations of events due to signal would be averaged out,
while the dependency of the detection efficiency on declination is preserved. The background
is estimated from the detected events, by adopting a technique similar to the “off-source”
method in gamma-ray astronomy. The error of the background estimation is therefore small
and statistical only, independent of the detector simulation.
The detection efficiency for astrophysical neutrinos is studied with a complete Monte
Carlo description of neutrinos fluxes, propagation through the earth and interactions, of
the muon propagation and of the detector response [33]. The latter takes into account the
propagation of photons in the ice and the photon detection probability. The systematic
uncertainties in this modeling affect the signal efficiency and therefore the calculation of
flux upper limits or, in case of detection, the precision with which the cosmic neutrino flux
can be measured. Comparison of the final event sample to the Monte Carlo expectation for
atmospheric neutrinos allows the verification of the modeling accuracy and of the detection
efficiency. These aspects will be addressed in detail in Section V.
III. EVENT RECONSTRUCTION AND SELECTION
The searches reported in this paper use the data collected with the AMANDA-II detector
in the years 2000 to 2004. The austral-summer data (from November to February), taken
during the detector maintenance and station summer activity periods, are excluded. Periods
of overall detector instability are also discarded. The remaining live-time is 1001 days, after
correction for the intrinsic DAQ dead-time. The trigger used to collect this data requires at
least 24 optical modules (OM) recording one or more pulses above threshold (hits) within
2.5 µs.
Table I shows the first three filtering levels used to process the 8.9 ×10⁹ events used in
this analysis. The multi-level filtering is needed because the final reconstruction algorithms
are too CPU-intensive to use on the entire dataset. Sophistication and CPU demand per
event of these procedures increase with level, as does the tightness of cuts for background
rejection. The event passing rates in Table I are normalized to the number of triggered
events (8.9 ×10⁹). Level 1 and Level 2 of the event reconstruction and selection are based
8
on relatively loose cuts, in order to extract an event sample which is still useful for other
analyses.
Details of the pre-processing techniques (hit and optical module selection) and of the
reconstruction algorithms can be found in [27]. Before reconstruction, short pulses are
removed which can be ascribed to electronic noise. Hits from unstable optical modules are
also rejected based on their typical TDC and dark noise rates compared to the average (hit
and optical module selection in Table I). Events are required to have at least 24 modules
hit after this cleaning as in the hardware trigger (re-trigger in Table I).
Two fast pattern recognition algorithms are then applied to reconstruct the direction of
the muons: DirectWalk, described in [27], and JAMS. JAMS provides an enhanced down-
ward going muon track rejection power compared to previous results [34, 35]. The best guess
for the direction of a muon track is found from the distribution of hits projected on a plane
orthogonal to a candidate track direction. Only hits with a short delay compared to the
arrival time expected for the direction of the track hypothesis are considered. Photons gen-
erating such “direct” hits have undergone only a few scatters in the ice and have therefore
preserved the directional information. The track direction hypothesis is then varied and the
distribution of the hit projections studied. The direction with the largest and most isotropic
cluster of associated hits is chosen as JAMS result.
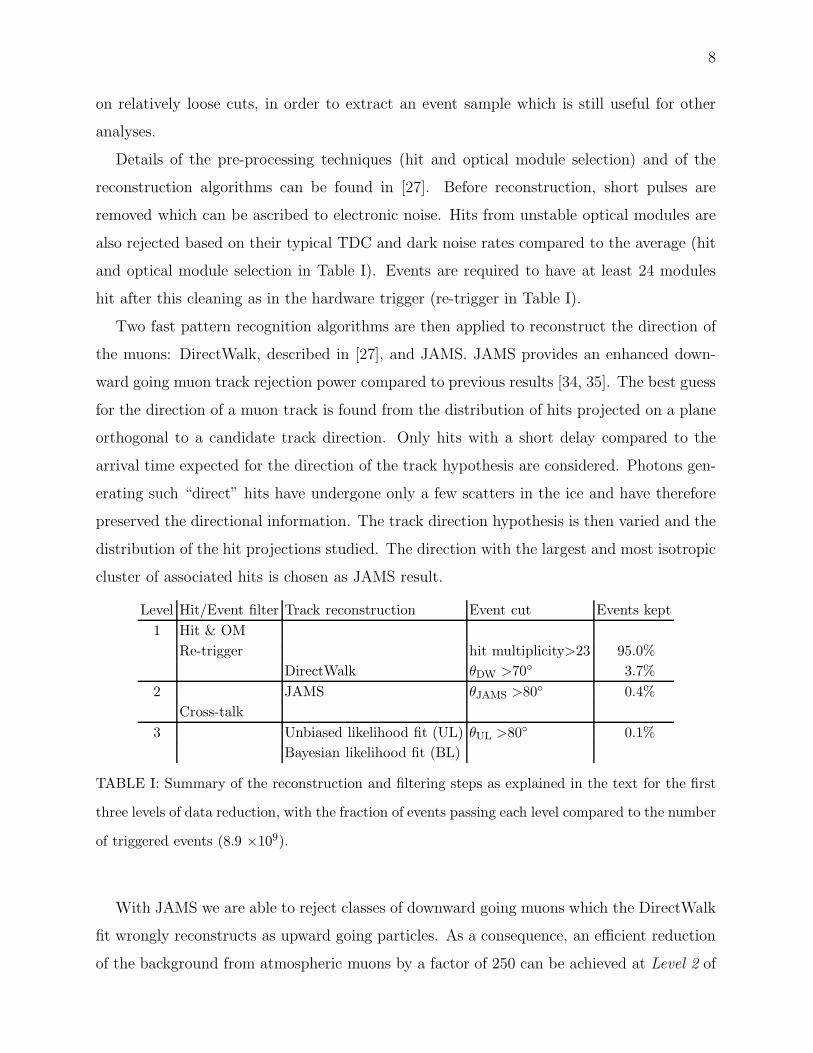
Level Hit/Event filter Track reconstruction Event cut Events kept
1 Hit & OM
Re-trigger hit multiplicity>23 95.0%
DirectWalk θDW >70◦ 3.7%
2 JAMS θJAMS >80◦ 0.4%
Cross-talk
3 Unbiased likelihood fit (UL) θUL >80◦ 0.1%
Bayesian likelihood fit (BL)
TABLE I: Summary of the reconstruction and filtering steps as explained in the text for the first
three levels of data reduction, with the fraction of events passing each level compared to the number
of triggered events (8.9 ×10⁹).
With JAMS we are able to reject classes of downward going muons which the DirectWalk
fit wrongly reconstructs as upward going particles. As a consequence, an efficient reduction
of the background from atmospheric muons by a factor of 250 can be achieved at Level 2 of
9
the event selection, applying angular cuts to the directions from both first-guess algorithms
(cfr. Table I). A filter based on the amplitude and duration of hits and on a talker-receiver
map is then applied to exclude pulses induced along twisted-pair cables when analog signals
are transmitted from optical modules to the surface (cross-talk in Table I).
Two iterative reconstructions follow: an unbiased likelihood fit (UL), seeded with the
result of JAMS and with 32 randomly chosen input directions, and a Bayesian likelihood
fit (BL), seeded with the results of UL and with 64 randomly chosen input directions.
The Bayesian fit incorporates a prior hypothesis with a parameterization of the MC zenith
distribution for atmospheric muons at the detector [27]. The final direction is defined by
the best likelihood found.
At Level 3 the data sample is reduced to 9.9 ×10⁶ tracks and is still dominated by
downward going muons, outnumbering neutrinos by three orders of magnitude. Fake events
due to non-simulated electronic artifacts are rejected after Level 3 with a filter sensitive to
correlated noise [36]. The event reconstruction and selection has proved to be stable with
respect to these detector instabilities.
Neutrino induced upward going tracks are selected after Level 3 by imposing event qual-
ity requirements based on the single track angular resolution and on topological parameters
describing the distribution of hits along the trajectories. Three independent parameters are
chosen: a) the event based angular resolution, proportional to the width of the likelihood
minimum and derived from the fit error matrix [37], b) the smoothness, a parameter de-
scribing the homogeneity of the hits along the track [27], and c) the ratio of the likelihoods
from the unbiased and the Bayesian reconstructions.
Distributions of these observables were constructed for both data and signal Monte Carlo
in 22 declination bands. Together with the search bin radius of the binned search defined in
Section VI, the parameter space of these variables is scanned to find the optimum selection
with respect to signal efficiency and residual background. The optimum selection provides
the best sensitivity as the average upper limit in absence of a signal [38, 39].
The optimum selection criteria determined with this method depend on the assumed
signal light deposited and therefore on the assumed signal energy spectrum and on the track
direction. We implemented event cut optimizations assuming different signal energy power-
law spectra dΦ
dE= Φ0 · (E/1 TeV)−γ, with Φ0 as normalization. Two spectral indices were
considered: γ=2, generally assumed to be the most likely for astrophysical beam dumps,

10
δsin 0 0.1 0.2 0.3 0.4 0.5 0.6 0.7 0.8 0.9 1
entr
ies
50
100
150
200
250
300
350
δsin 0 0.1 0.2 0.3 0.4 0.5 0.6 0.7 0.8 0.9 1
entr
ies
50
100
150
200
250
300
350
DataMC prediction (Lipari)MC prediction (Honda)
rate (Lipari)νSystematic uncertainty of atm-
rate (Honda)νSystematic uncertainty of atm-
FIG. 1: Declination angle distribution of the final event selection compared to the expectation
from Monte Carlo simulation of atmospheric neutrinos, including the systematic error band (see
Section V). The two extremes [25, 26] among different predictions are shown. Error bars on the
data point are statistical.
following Fermi shock acceleration of protons, and γ=3 as a possible extreme of softer
spectrum scenarios1. We chose cut values which are close to the individual optima and
provide a good sensitivity in both cases.
The optimum size of the circular search bins varies between 2.25◦ and 3.75◦ depending
on declination. These search bins contain 60% to 80% of the simulated signal, respectively.
IV. PROPERTIES OF THE FINAL EVENT SAMPLE
A final sample of 4282 upward going muon-like events survived the cuts. This is in agree-
ment with expectations from a Monte Carlo simulation of atmospheric neutrinos following
the parametrization in [25]. The central value of this parametrization yields 4600+300−1000(sys)
expected events. The systematic error is discussed in Section V.
We estimate the contamination from mis-reconstructed downward going events to be less
than 5%. This is obtained from the comparison of the event sample after Level 3 of the data
reduction to the prediction from atmospheric neutrinos, as a function of the quality of the
1 A γ=2 spectrum with a 1 TeV cutoff was also considered, however the optimum selection found is identical
to the γ=3 case. Therefore this case is omitted here.
11
reconstructed tracks [40].
Figure 1 compares the observed declination distribution to the one expected for atmo-
spheric neutrinos. Simulation results are given for two different parameterizations of atmo-
spheric neutrino fluxes [25, 26]. The systematic errors are indicated by shadowed areas (see
Section V). The angular distribution confirms that the background for sources other than
atmospheric neutrinos is small, within the model uncertainties.
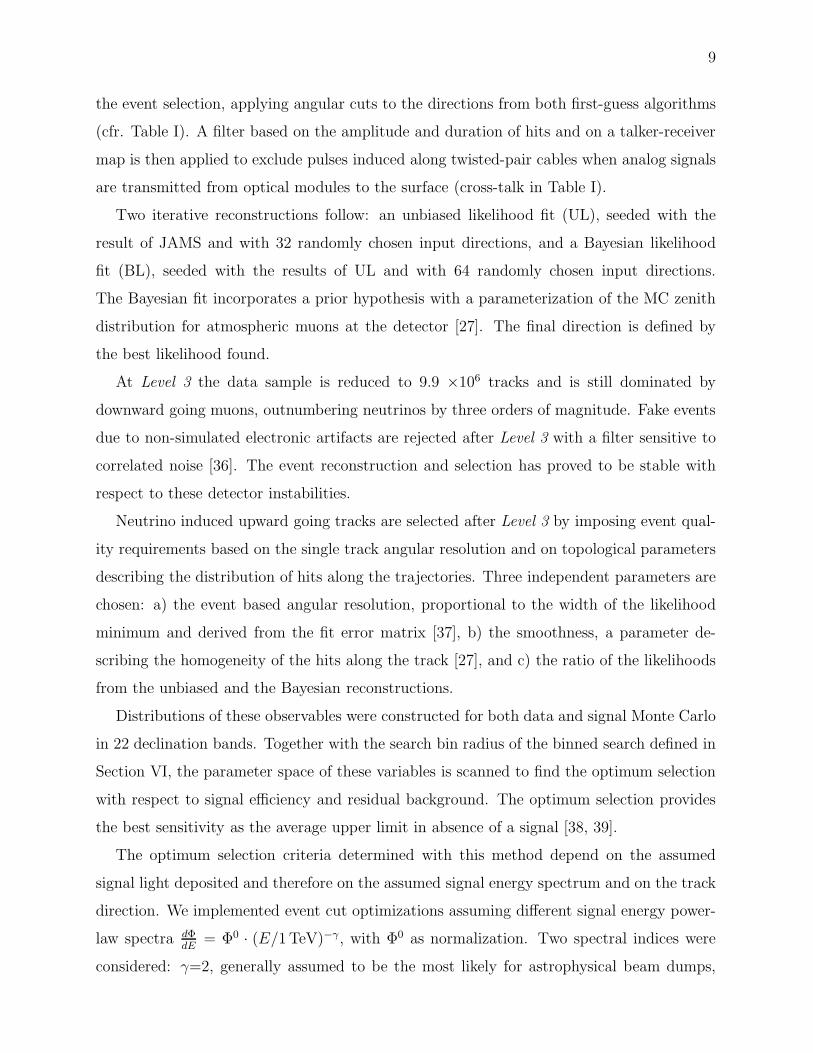
]ο∆Ψ [0 1 2 3 4 5 6 7
Cum
ulat
ive
even
t fra
ctio
n
0
0.1
0.2
0.3
0.4
0.5
0.6
0.7
0.8
0.9
1-2 E-3 E
atmospheric
]ο∆Ψ [0 1 2 3 4 5 6 7
Cum
ulat
ive
even
t fra
ctio
n
00.10.20.30.40.50.60.70.80.9
1
ο<δ<30ο 0 ο<δ<60ο 30 ο<δ<90ο 60
FIG. 2: Cumulative point spread function for the events passing the selection, for different simu-
lated energy spectra. The inset graph shows the dependence on declination, for a spectral index
γ=2. ∆Ψ is the space angle difference between the true and the reconstructed direction of simulated
events.
The average pointing resolution of the selected events can be estimated from the distribu-
tion of the directional difference between simulated neutrino tracks and reconstructed muon
tracks of Monte Carlo events. For a spectral index γ=2, the median value of the space angle
distribution is typically 2◦. Figure 2 shows the cumulative point spread function after the
final event cuts for different energy spectra. It can be seen that the angular resolution is
declination dependent.
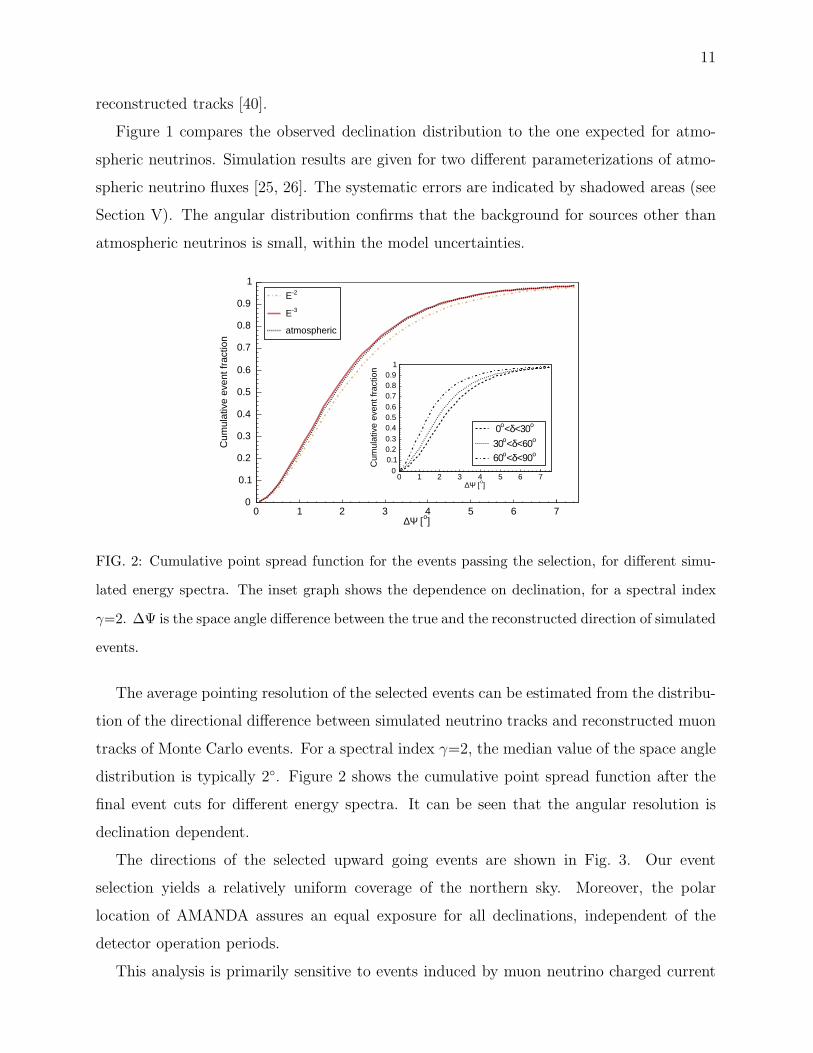
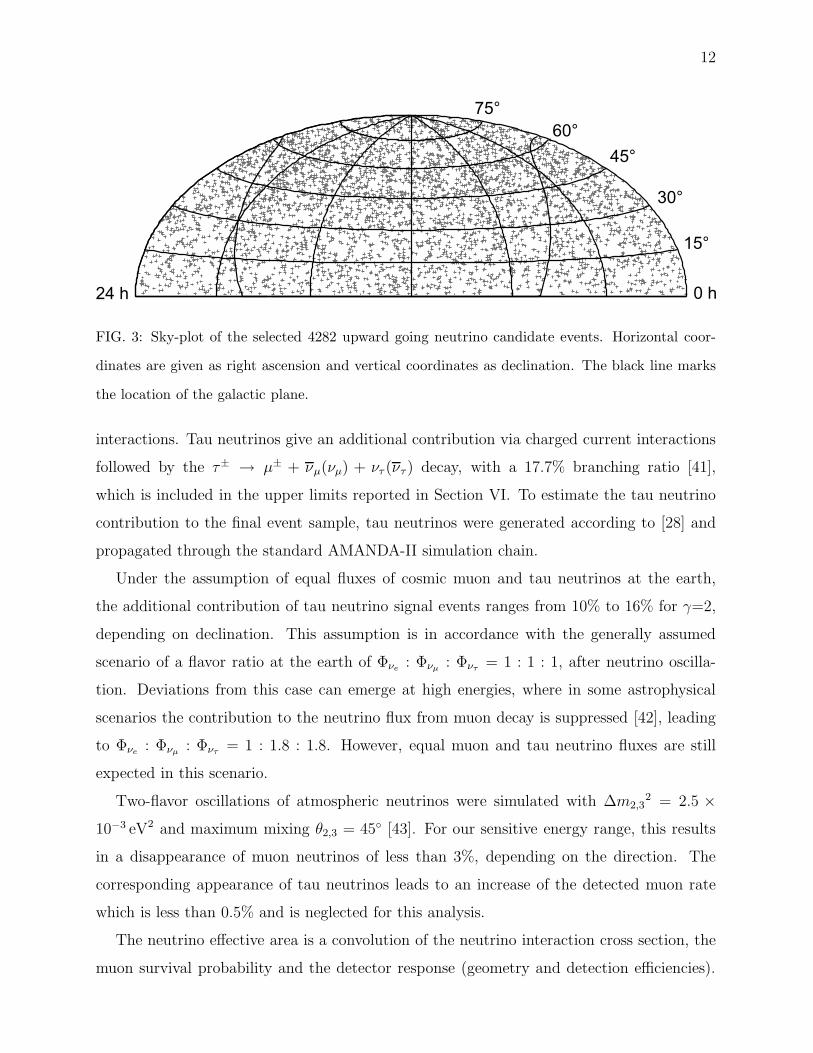
The directions of the selected upward going events are shown in Fig. 3. Our event
selection yields a relatively uniform coverage of the northern sky. Moreover, the polar
location of AMANDA assures an equal exposure for all declinations, independent of the
detector operation periods.
This analysis is primarily sensitive to events induced by muon neutrino charged current
12
0 h24 h
15°
75°
60°
45°
30°
FIG. 3: Sky-plot of the selected 4282 upward going neutrino candidate events. Horizontal coor-
dinates are given as right ascension and vertical coordinates as declination. The black line marks
the location of the galactic plane.
interactions. Tau neutrinos give an additional contribution via charged current interactions
followed by the τ± → µ± + νµ(νµ) + ντ (ντ ) decay, with a 17.7% branching ratio [41],
which is included in the upper limits reported in Section VI. To estimate the tau neutrino
contribution to the final event sample, tau neutrinos were generated according to [28] and
propagated through the standard AMANDA-II simulation chain.
Under the assumption of equal fluxes of cosmic muon and tau neutrinos at the earth,
the additional contribution of tau neutrino signal events ranges from 10% to 16% for γ=2,
depending on declination. This assumption is in accordance with the generally assumed
scenario of a flavor ratio at the earth of Φνe: Φνµ
: Φντ= 1 : 1 : 1, after neutrino oscilla-
tion. Deviations from this case can emerge at high energies, where in some astrophysical
scenarios the contribution to the neutrino flux from muon decay is suppressed [42], leading
to Φνe: Φνµ
: Φντ= 1 : 1.8 : 1.8. However, equal muon and tau neutrino fluxes are still
expected in this scenario.
Two-flavor oscillations of atmospheric neutrinos were simulated with ∆m2,32 = 2.5 ×
10−3 eV2 and maximum mixing θ2,3 = 45◦ [43]. For our sensitive energy range, this results
in a disappearance of muon neutrinos of less than 3%, depending on the direction. The
corresponding appearance of tau neutrinos leads to an increase of the detected muon rate
which is less than 0.5% and is neglected for this analysis.
The neutrino effective area is a convolution of the neutrino interaction cross section, the
muon survival probability and the detector response (geometry and detection efficiencies).

13
It depends on the neutrino energy and direction as shown in Figure 4 for muon neutrinos
(left) and tau neutrinos (right), including the earth shadowing effect.
E/GeV10
log2 3 4 5 6 7 8
2 e
ffect
ive
area
/ cm
µν
-210
-110
1
10
210
310
410
510
610Declination
° = 5 δ° = 25 δ° = 50 δ° = 75 δ
E/GeV10
log3 4 5 6 7 8 9
2 e
ffect
ive
area
/ cm
τν-210
-110
1
10
210
310
410
510
610Declination
° = 5 δ° = 25 δ° = 50 δ° = 75 δ
FIG. 4: Neutrino effective area as a function of the neutrino energy for different declinations for
muon neutrinos (left) and tau neutrinos (right) respectively. The decrease observed at high energies
on the left is due to neutrino absorption in the earth.
Because the event selection optimization allows wider spectral scenarios than in our pre-
vious point source searches [34, 35], the sample of selected up-going events contains a sig-
nificant contribution from low energy events (Eν <1 TeV). In a Monte Carlo simulation of
atmospheric neutrinos [25], 95% of the events have energies larger than about 100 GeV. The
median energy is about 500 GeV. Neutrinos from a source with a γ=2 spectrum, however,
are expected to carry a median energy of about 50 TeV, due to the cross-section, the muon
range and the detection and event selection efficiency, which leads to a steeply rising sensi-
tivity with energy. Table II shows relevant information on the energy distribution of Monte
Carlo events, for different input spectra.
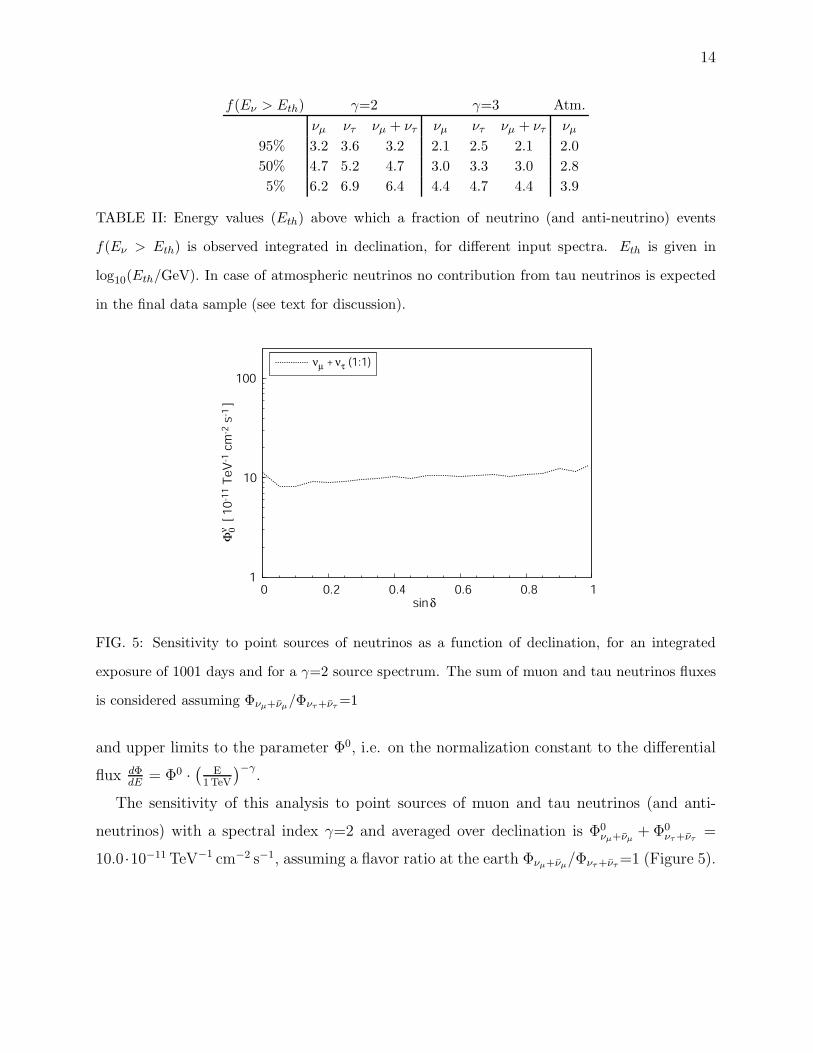
The limit setting capability of this analysis can be expressed by the sensitivity to neutrino
fluxes from point sources, introduced in Section III. The sensitivity is a function of the
background and describes the observation potential. In case no excess is detected over the
expected background, we calculate the upper limits to the neutrino flux, as a function of
both background and experimental observations. In this work we give both the sensitivity
14
f(Eν > Eth) γ=2 γ=3 Atm.
νµ ντ νµ + ντ νµ ντ νµ + ντ νµ
95% 3.2 3.6 3.2 2.1 2.5 2.1 2.0
50% 4.7 5.2 4.7 3.0 3.3 3.0 2.8
5% 6.2 6.9 6.4 4.4 4.7 4.4 3.9
TABLE II: Energy values (Eth) above which a fraction of neutrino (and anti-neutrino) events
f(Eν > Eth) is observed integrated in declination, for different input spectra. Eth is given in
log10(Eth/GeV). In case of atmospheric neutrinos no contribution from tau neutrinos is expected
in the final data sample (see text for discussion).
1
10
100
0 0.2 0.4 0.6 0.8 1
sin δ
νµ + ντ (1:1)
Φ0ν
ü[ 10
-11 T
eV
-1 c
m-2
s-1
]
FIG. 5: Sensitivity to point sources of neutrinos as a function of declination, for an integrated
exposure of 1001 days and for a γ=2 source spectrum. The sum of muon and tau neutrinos fluxes
is considered assuming Φνµ+νµ/Φντ+ντ
=1
and upper limits to the parameter Φ0, i.e. on the normalization constant to the differential
flux dΦ
dE= Φ0 ·
(
E
1TeV
)−γ.
The sensitivity of this analysis to point sources of muon and tau neutrinos (and anti-
neutrinos) with a spectral index γ=2 and averaged over declination is Φ0νµ+νµ
+ Φ0ντ+ντ
=
10.0·10−11 TeV−1 cm−2 s−1, assuming a flavor ratio at the earth Φνµ+νµ/Φντ+ντ
=1 (Figure 5).

15
V. SYSTEMATIC ERRORS
A. Overview
Three main classes of systematic errors affect the searches reported in this work: the un-
certainty in the optical module response (timing resolution and optical module sensitivity),
the uncertainty in the modeling of the neutrino and muon propagation and interaction, and
other simplifications in the simulation (propagation of photons in the ice, detector response
and neutrino-muon scattering angle).
We estimate the systematic error on the rate of high energy neutrinos by variations of
these quantities in the input to the simulation. The results typically depend on neutrino
energy and, therefore, on the assumptions on the cosmic neutrino energy spectrum. The
dominant error is due to the uncertainty in the optical module sensitivity. For a spectral
index γ=2 it contributes +2−9% of the total systematic error of +10
−15% [44].
Table III summarizes the systematic errors on the rate of high energy neutrinos estimated
for this analysis, for three assumed energy spectra: γ = 2, γ = 3 and atmospheric energy
spectrum, according to [25].
Class Source of uncertainty E−2 E−3 Atm.
1 Optical module timing resolution ±2% ±2% ±2%
Optical module sensitivity +2−9%
+5−17%
+6−19%
2 Neutrino cross section and rock density ±8% ±3% ±3%
Muon energy loss ±1% ±1% ±1%
3 Photon propagation in ice ±5% ±5% ±5%
Reconstruction bias +0−7%
+0−8%
+0−9%
Neutrino-muon scattering angle +0−1%
+0−8%
+0−13%
Sum +10
−15% +6
−21% +7
−25%
TABLE III: Summary of the systematic error in the measured rate of high energy muon neutrinos
due to the three classes of systematic uncertainties, for different assumption on the energy spectrum.
An independent confirmation of the estimate of the systematic errors summarized in
Table III is given by the agreement of the absolute flux prediction of atmospheric neutri-
nos to the experimental results. Figure 1 compares the zenith angle distribution for the
observed events and the Monte Carlo simulation for atmospheric neutrinos, including the
systematic error band. This confirmation is however limited by the theoretical uncertainty

16
on the absolute flux prediction of atmospheric neutrinos (up to 25% or more at the highest
energies [45]). The extremes of these predictions are shown in Figure 1 [25, 26], the dif-
ference representing the theoretical uncertainty due to the limited knowledge of the total
primary cosmic ray flux and of the hadronic interactions in the atmosphere. It can be seen
that the observed angular distribution and the event rate range between the two extremes.
The theoretical uncertainty on the atmospheric neutrino flux prediction does not affect our
searches for point sources, as the background is measured from the data.
The total systematic error in the neutrino rate (the sum in Table III) is asymmetric, while
in the upper limit calculation errors are assumed to be Gaussian. In the limits reported in
section VI we therefore round up the total error on the neutrino rate to 15% for γ = 2 and
20% for γ = 3. The main classes of systematic uncertainties are discussed in detail in the
next sections2.
B. Optical module response
Two sources of uncertainty are related to the response of the optical modules: the timing
resolution and the optical module sensitivity. The first can influence the accuracy of the
track reconstruction while the second affects the effective area.
The timing of the optical modules, measured using YAG laser pulses, is better than 5
ns [1]. The impact on the rate of selected upward going events of this intrinsic resolution
is less than 2%, independent of the spectral index. This uncertainty is also checked by
comparing the measured and the expected arrival time of photons for downward going muon
tracks.
The optical module sensitivity depends on the photomultiplier quantum efficiency, on the
transmission properties of the glass sphere coupled to the optical gel and on the propagation
of photons in the local (re-frozen) ice surrounding the optical modules. A nominal value of
the optical module sensitivity is an input parameter in the detector simulation.
A conservative overall uncertainty on the optical module sensitivity of 30% or more
(including the uncertainties on the properties of the re-frozen ice) was used in previous works
(e.g.[16, 33, 46]). This was dominated by the uncertainty on the optical gel transmittance
2 In order to apply a symmetric systematic error on the limits a shift of 2.5% (7%) was also applied to the
signal prediction, respectively for γ=2 (3).
17
based on laboratory measurements performed on a series of spare samples. This uncertainty
can however be largely reduced by comparison of the measured and simulated zenith angle
distribution of the selected upward going events. Due to the inhomogeneous distribution of
the optical modules in the detector – arranged along strings in a cylindrical structure with
larger vertical dimension compared to the horizontal ones – reconstructed muon tracks are
differently affected by the optical module sensitivity according to their direction. We studied
the effect varying the nominal value of the optical module sensitivity in the Monte Carlo
simulation within a range of ± 30%. Comparing the angular distribution of simulated and
observed events, we found a 1σ range of the best fit sensitivity corresponding to 100+3−10% of
the nominal value used in the detector simulation. The impact on the rate of high energy
neutrino events is +2−9% for γ=2 (Table III). This result is stable with respect to the other
sources of systematic uncertainty. This estimate also includes the systematic error due to
the uncertainty of the absolute light yield from secondary cascades along the muon track.
C. Neutrino and muon propagation and interaction
The number of high energy muons passing through the AMANDA-II detector for a given
flux of neutrinos depends on the neutrino absorption in the earth and on the rate of neutrino
interactions in the column of ice and bedrock surrounding the detector and acting as target
for the production of detectable muons. Limited geophysical measurements are available to
determine the rock density at the South Pole. Typical rock samples are found to vary by
10% around the nominal density of 2650 kg/m3 [47] used in the Monte Carlo simulation for
this analysis. This uncertainty alters the signal prediction for a neutrino flux with a spectral
index of γ=2 by 2% for nearly horizontal events (δ = 0◦ to 30◦) and 7% for nearly vertical
events (δ = 60◦ to 90◦). For softer spectra this uncertainty has a negligible effect. Most
detectable muons are produced in the ice surrounding the detector, which has a well known
density, rather than in the bedrock. This error includes the impact of this uncertainty on
the muon propagation.
An uncertainty of 3% is estimated for the charged current deep-inelastic neutrino-nucleon
scattering and therefore for the corresponding muon event rates. This uncertainty is esti-
mated from the error table on the Parton Density Functions in the range between 100 GeV
and 1 PeV, as reported in [48] and the prescription for the error analysis in [49].
18
For a spectral index γ=2, these two sources of uncertainty together give an overall error
of 4% (8%) for horizontal (vertical) events.
The rate of muons crossing the detector also depends on the muon energy loss. The
processes considered in the Monte Carlo simulation for the energy loss and the production
of secondaries are ionization, bremsstrahlung, pair production, photo-nuclear interaction
and decay, known within an uncertainty between 1% for muon energies of about 1TeV and
a few percent for higher energies [50]. A higher uncertainty can affect the tau energy loss
at high energies [51]. However, due to the short lifetime of taus, the impact of this error
on the rate of detected events is expected to be smaller than the case of muon tracks. The
resulting systematic error of the absolute event rate is 1% for a variation of the cross sections
by ± 2%.
D. Other simplifications in the simulation
The glacial ice contains impurities which reflect past climatological changes. Calibration
light sources were used to map the absorption and the scattering length of the ice and de-
velop a wavelength and depth-dependent model of its optical properties [32]. A detailed
photon propagation in the simulation is, however, computationally intensive. Therefore
past AMANDA analyses used a simplified model, averaging the ice properties over the
wavelengths of the Cherenkov spectrum and over the depths covered by AMANDA, opti-
mized for the best agreement in the timing properties of observed and simulated downward
going tracks. A comparison of the results for this analysis using the “average” model to
more recent developments (i.e. a detailed depth-dependent simulation based on the results
in [32]) gives a variation in the passing rate of the final events of 5% or less.
Residual and non-identified sources of systematic uncertainties appear when comparing
the observed and the simulated cut parameter distributions at the final level, assuming
that the sample is dominated by atmospheric neutrinos. A certain level of mismatch is
observed for the angular resolution and the smoothness parameter. This is likely due to
inaccuracies in the simulation of the detector response, e.g. non simulated cross-talk and
noise hits, affecting the quality of the reconstructed tracks. A small residual fraction of mis-
reconstructed downward going muons might also be present in the data. This is included in
the background estimation and does not affect the simulation of the signal and the relative

19
systematic uncertainty.
A conservative estimate of residual non-identified sources of systematic uncertainties was
done by applying a scaling factor to both the smoothness and the angular resolution pa-
rameters, to obtain a good agreement between data and Monte Carlo simulation at the final
level. The scaling factors necessary to obtain a good agreement in the angular resolution
and in the smoothness are 1.1 and 1.07, respectively. The final event sample changes by 9%
or less when using the scaled parameters rather than the unscaled (7% for γ=2).
An additional systematic uncertainty is finally due to neglecting the neutrino-muon scat-
tering angle in the simulation. In this work a neutrino induced muon is simulated as collinear
to the direction of the parent neutrino, but the energy dependent average angle might ex-
ceed the size of the search bins [52] at energies below 1 TeV. For a spectral index γ=2 the
systematic overestimation of the event rate when neglecting the neutrino-muon angle is less
than 1%. The tau neutrino signal prediction for this work uses a neutrino generator which
properly accounts for the neutrino-muon angle [28] and is therefore free of this systematic
error. Table III reports the impact of this uncertainty on the final event rates also for the
case of atmospheric neutrinos, as an example of soft spectrum. This uncertainty is however
not included in in Figure 1, since it only affects searches for point sources.
VI. SEARCH FOR INDIVIDUAL POINT SOURCES IN THE NORTHERN SKY
A search for point sources of neutrinos is performed with the sample of 4282 upward
going events by looking for excesses of events from the directions of known objects and by
performing a survey of the full northern sky. This analysis is sensitive to a point source
that would manifest itself as a statistically significant cluster of events within an angular
bin consistent with the point spread function of the detector. Both surveys are based on
circular search bins of a size optimized together with the event selection as described in
Section III.
A. Selected source candidates
First, a sample of 32 neutrino source candidates are tested for an excess of events. The
source list (Table IV) includes galactic and extragalactic objects which are identified sources

20
of high energy gamma-rays located in the field of view of AMANDA-II. Any source that
accelerates charged hadrons to high energies is also a possible source of detectable neutrinos
from meson decay: high energy hadrons will interact with other nuclei or the ambient photon
fields producing hadronic showers. In these scenarios, high energy photons and neutrinos
are expected to be produced simultaneously, with correlated rates.
We consider five blazars confirmed as TeV gamma-ray sources [10, 12], eight blazars
confirmed as (or with indications of being) GeV gamma-ray sources [13], eight galactic X-
ray binaries classified as micro-quasars and one neutron star binary system [3], six galactic
supernova remnants and pulsars. We also consider individually selected objects, like an
EGRET source with high detected flux above 100 MeV [53], a TeV gamma-ray active galactic
nucleus (M87), the bright and closest active galactic nucleus NGC 1275 and an HEGRA TeV
gamma-ray source with indications of hadronic emission [54, 55].
We estimate the number of expected background events per bin (nb) from the event
density as a function of declination. Because of the rotation of the earth, any azimuth-
dependent variation in the event rate is averaged out and the background density is expected
to be uniform in right ascension. We average the event densities over right ascension in
declination bands of width comparable to the search bin radius. The statistical uncertainty
in the background per search bin (σb) depends on the declination and the largest value is 7%.
The background estimate is not affected by systematic uncertainties, since it is independent
of the Monte Carlo description of the detection efficiency.
For each search bin, the number of observed events nobs is compared to nb. If no sta-
tistically significant excess is found, we calculate flux upper limits, which depend on the
assumed source location and energy spectrum. The statistical significance of the observa-
tions is evaluated with 100 equivalent simulated experiments, using the same data sample
and randomizing the events in right ascension independently for each experiment. An excess
parameter ξ is defined as:
ξ = − log10(P ) (1)
where P is the binomial probability of observing nobs events in the search bin, given Nband
events in the declination band used for the background estimation:
P (nobs|Nband) =
(
Nband
nobs
)
· pnobs · (1 − p)Nband−nobs ,
where p is the probability of a background event in the given search bin. The parameter

21
FIG. 6: Sky map of the significance obtained by scanning of the northern sky to search for event
clusters. The significance is positive for excesses and negative for deficits of events compared to
the expected background.
p depends on the area of the search bin compared to the declination band. The distribu-
tion of the excess parameter for the source candidates agrees with the expectation for a
purely atmospheric neutrino sample, simulated with the 100 samples with randomized right
ascension (Figure 7).
The highest observed significance, with 8 observed events compared to 4.7 expected back-
ground events (ξ=0.95, ∼1.2σ), is at the location of the GeV blazar 3C273. The second
highest excess (ξ=0.84, ∼1.1σ) is from the direction of the Crab Nebula, with 10 observed
events compared to 6.7 expected background events.
For the directions of all selected source candidates, the observations are compatible with
statistical fluctuations of the background. In Table IV we report flux upper limits for the
spectral indices γ=2 and γ=3, following the Feldman and Cousins ordering principle [39]
and including a Bayesian treatment of systematic errors [56, 57]. The validity range of
these limits – here defined as the 90% energy containment region – is between 1.6 TeV
and 2.5 PeV for γ=2 and between 0.1 TeV and 25 TeV for γ=3 (see Table II). The flux
upper limits on the sum of muon and tau neutrinos are calculated under the assumption
of a flavor ratio Φνµ+νµ/Φντ+ντ
=1 at the earth. Please note that in previous publications
of the AMANDA collaboration point source limits were presented only on the flux of muon
neutrinos, neglecting the sensitivity to tau neutrinos (i.e. assuming sντ= 0). Both limit
representations, the former and the current one, can be calculated and converted into each
other from the values of the event upper limit µ90 and the expected number of signal events

22
γ = 2z }| {
γ = 3z }| {
Candidate δ α r nobs nb µ90 sνµsντ
Φ0νµ
+ Φ0ντ
µ90 sνµsντ
Φ0νµ
+ Φ0ντ
TeV blazars
Markarian 421 38.2 11.1 3.25 6 7.4 4.1 0.97 0.15 7.4 4.1 0.15 0.01 51
Markarian 501 39.8 16.9 3.00 8 6.4 7.9 0.93 0.14 14.7 8.3 0.15 0.01 102
1ES 1426+428 42.7 14.5 2.75 5 5.5 4.8 0.90 0.13 9.4 4.8 0.16 0.01 58
1ES 2344+514 51.7 23.8 2.50 4 6.2 3.1 0.89 0.15 5.9 3.1 0.19 0.01 29
1ES 1959+650 65.1 20.0 2.25 5 4.8 5.6 0.71 0.11 13.5 5.6 0.21 0.02 48
GeV blazars
3C 273 2.1 12.5 3.75 8 4.7 9.6 0.96 0.10 18.0 9.8 0.04 ∼ 0 427
QSO 0528+134 13.4 5.5 3.50 4 6.1 3.2 1.06 0.14 5.3 3.2 0.08 0.01 72
QSO 0235+164 16.6 2.6 3.50 7 6.1 6.7 1.03 0.14 11.4 7.1 0.09 0.01 145
QSO 1611+343 34.4 16.2 3.25 6 7.0 4.5 0.95 0.15 8.3 4.8 0.14 0.01 65
QSO 1633+382 38.2 16.6 3.25 9 7.4 8.1 0.97 0.15 14.6 8.3 0.15 0.01 103
QSO 0219+428 42.9 2.4 2.75 5 5.5 4.9 0.89 0.13 9.6 4.8 0.16 0.01 58
QSO 0954+556 55.0 9.9 2.50 2 6.7 1.4 0.91 0.15 2.7 1.4 0.20 0.01 12
QSO 0716+714 71.3 7.4 2.25 1 4.0 1.2 0.70 0.13 3.0 1.2 0.20 0.02 11
Other AGNs
M 87 12.4 12.5 3.50 6 6.1 5.3 1.07 0.14 8.7 5.7 0.08 0.01 134
NGC 1275 41.5 3.3 3.00 4 6.8 2.7 0.95 0.14 5.0 2.8 0.16 0.01 31
Micro-quasars and neutron star binaries
SS433 5.0 19.2 3.75 4 6.1 3.1 1.16 0.13 4.8 3.1 0.06 ∼ 0 96
GRS 1915+105 10.9 19.3 3.50 7 6.1 6.8 1.08 0.14 11.2 7.1 0.07 ∼ 0 184
AO 0535+26 26.3 5.7 3.50 7 6.5 6.4 0.99 0.14 11.3 6.7 0.11 0.01 112
GRO J0422+32 32.9 4.4 3.25 9 6.7 9.0 0.94 0.14 16.7 9.0 0.14 0.01 123
Cygnus X-1 35.2 20.0 3.25 8 7.0 7.3 0.95 0.15 13.2 7.3 0.14 0.01 96
Cygnus X-3 41.0 20.5 3.00 7 6.5 6.4 0.95 0.14 11.8 6.8 0.16 0.01 80
XTE J1118+480 48.0 11.3 2.75 3 7.1 1.5 0.97 0.14 2.8 1.5 0.19 0.01 15
CI Cam 56.0 4.3 2.50 9 6.3 9.4 0.91 0.14 17.8 9.5 0.20 0.01 88
LS I +61 303 61.2 2.7 2.25 5 4.8 5.6 0.75 0.13 12.6 5.6 0.20 0.01 50
SNR and pulsars
SGR 1900+14 9.3 19.1 3.50 5 5.7 4.8 1.09 0.13 7.8 4.8 0.07 ∼ 0 127
Geminga 17.9 6.6 3.50 3 6.2 2.0 1.01 0.14 3.5 2.0 0.10 0.01 38
Crab Nebula 22.0 5.6 3.50 10 6.7 10.1 0.98 0.15 17.8 10.4 0.10 0.01 192
PSR 1951+32 32.9 19.9 3.25 4 6.7 2.7 0.94 0.14 5.0 2.7 0.14 0.01 38
Cassiopeia A 58.8 23.4 2.50 5 6.0 4.4 0.86 0.13 8.9 4.4 0.20 0.01 41
PSR J0205+6449 64.8 2.1 2.25 1 4.7 1.3 0.72 0.11 3.1 1.3 0.21 0.02 11
Unidentified high energy gamma-ray sources
3EG J0450+1105 11.4 4.8 3.50 8 5.9 8.4 1.08 0.14 13.8 8.6 0.08 ∼ 0 218
TeV J2032+4131 41.5 20.5 3.00 7 6.8 6.1 0.95 0.14 11.2 6.5 0.16 0.01 76
TABLE IV: Flux upper limits for selected neutrino source candidates: source directions (declination
δ in degrees and right ascension α in hours), search bin size (r in degrees), number of observed events
(nobs) and expected background (nb). µ90 is the event upper limit at 90% CL (different for γ=2 and
γ=3 because of different systematic errors) and sνµ(sντ
) is the expected number of events from
muon (tau) neutrino and anti-neutrino interactions for a differential flux dΦdE
= 10−11 · ( E1 TeV
)−γ
TeV−1 cm−2 s−1. The 90% CL upper limits (Φ0νµ
+ Φ0ντ
, neutrino and anti-neutrinos) are given in
units of 10−11 TeV−1 cm−2 s−1, for both spectral indices γ=2 and γ=3.

23
(P)10
= -logξ0 0.5 1 1.5 2 2.5 3
num
ber
of s
ourc
es
0
2
4
6
8
10Excess parameter distribution
Randomized events
Candidate sources
FIG. 7: Excess parameter (ξ) distribution from the search for neutrinos from pre-selected objects.
The results of each individual observation (data points) are compared to the expected distribution
from 1000 simulated equivalent experiments with randomized right ascension (filled histogram).
from muon (tau) neutrinos and antineutrinos sνµ(sντ
) given in Table IV:
Φ0νµ+νµ
=1
2
(
Φ0νµ+νµ
+ Φ0ντ +ντ
)
=µ90
sνµ+ sντ
10−11 TeV−1 cm−2 s−1,
All limits include a systematic uncertainty of 15% (20%) in the signal prediction for
γ=2 (3) (see Section V) and a statistical error of 7% in the background estimation.
B. Northern sky survey
A full scan of the northern sky is also performed to look for any localized event cluster,
using a grid of circular search sky bins centered at distances of 0.5◦. The bin size is chosen
according to the optimization results reported in Section III. The strong bin correlation in
this method ensures a high detection chance without a high trial factor penalty and does
not require grid-shifts to account for boundary leaking effects [58].
The background per bin is estimated in the same way as in the search for neutrinos from

24
FIG. 8: Map of the 90% CL upper limits to the muon and tau neutrino flux from the survey of
the northern sky, for a spectral index γ=2. Limits are given on the normalization factor Φ0 to the
flux dΦdE
= Φ0 · ( E1 TeV
)−γ
.
known candidates, but a singularity arises at the pole, where this method is not reliable.
We therefore limited this search to events with declination below 85◦, giving 4251 remaining
upgoing muons. The statistical significance of any deviation is evaluated with the same
technique as above. Simulations with randomized events are performed using the same grid
of search bins, to account for the trial factor and the bin-to-bin correlations.
Figure 6 shows the distribution of observed significances, in standard deviations. All
observed excesses and deficits are compatible with statistical fluctuations of background.
The highest positive deviation corresponds to about 3.7σ. The probability of such a deviation
or higher due to background, estimated with 100 equivalent sky surveys of events with
randomized right ascension, is 69%.
Also in this case we give the neutrino flux upper limits as a function of declination and
right ascension including the systematic uncertainty discussed in Section V. The results for a
spectral index γ=2 are shown in Fig. 8. The experimentally observed upper limit for γ=2 (av-
eraged over declination and right ascension) is Φ0νµ+νµ
+ Φ0ντ+ντ
= 10.6·10−11 TeV−1 cm−2 s−1,
without systematic error and Φ0νµ+νµ
+ Φ0ντ+ντ
= 11.1 · 10−11 TeV−1 cm−2 s−1 with sys-
tematic error. The first can be compared to the sensitivity (Φ0νµ+νµ
+ Φ0ντ+ντ
= 10.0 ·
10−11 TeV−1 cm−2 s−1), which gives the expected average upper limit before the experimental
observations are performed. The agreement between the two quantities is an independent
confirmation of the compatibility of the experimental observations with the estimated back-

25
ground.
The results of this sky survey are compared to those from an analysis using an independent
cluster search algorithm that is based on an un-binned likelihood procedure in which the
events are weighted with the individual track angular resolution [59]. The two methods yield
consistent results for the significance map.
VII. SEARCH FOR SPATIALLY CORRELATED AND CUMULATIVE
EXCESSES
As no statistically significant accumulation of events could be established in the sky map,
two searches for cumulative effects are also made. The first search aims at detecting correla-
tions between spatial event coordinates, independent of source candidates; the second tests
the cumulative significance of pre-defined catalogs of objects (source stacking). The purpose
is to search for an excess of events from the sum of several sources, where the individual
fluxes are below the detector sensitivity but the integrated signal yields a significant excess
over the background.
A. Search for an excess at small event separation angles
The combined effect from several weak sources can be observed as an excess of event pairs
at a small angular distance, consistent with the point spread function of the detector. The
number of individual sources and their location would remain undefined.
We look for angular correlations in the final event sample by comparing the distribution
of the squared separation angle of event pairs to a template distribution expected for at-
mospheric neutrinos. The latter is obtained from 10000 neutrino samples randomizing the
right ascension of the 4282 observed events. This properly takes into account the expected
declination distribution, which is not uniform because of the effective area and the angular
distribution of primary cosmic rays 3.
The distribution of the separation angle between event pairs is shown in Figure 9, with
the corresponding 1σ confidence belt. The potential to identify a signal contribution with
3 Please note that this randomization technique implies that the statistical test described below is insensitive
to potential sources at declinations higher than δ ≈ 85◦.

26
2 / deg2θ0 100 200 300 400 500 600 700 800 900
pairs
N
4000
4500
5000
5500
6000
2 / deg2θ0 100 200 300 400 500 600 700 800 900
pairs
N
4000
4500
5000
5500
6000
randomized events68% confidence belt5 sources, 10 ev/src20 sources, 10 ev/srcdata
0 10 20 30 40 505800
5900
6000
6100
6200
6300
0 10 20 30 40 505800
5900
6000
6100
6200
6300
FIG. 9: Distribution of the separation angle between event pairs for the experimental data and for
two samples consisting of the original data plus signal events following the point spread function
of the detector (5 and 20 sources respectively, each contributing 10 neutrinos on average). The
distribution expected for a pure atmospheric sample is also shown (randomized events) with a 1σ
confidence belt.
this method is also shown for the cases of 5 and 20 sources respectively, each contributing on
average 10 neutrinos to the final event sample. An accumulation at small separation angles
would be expected.
In order to detect a signal at a 3σ level, a reduced χ2 value of more than 1.31 should
be found in the comparison of the data with the template. The reduced χ2 value obtained
with the observed event sample is 203/223 for 223 degrees of freedom and the probability
to obtain a larger or equal value is 81%. No indications of a contribution from an ensemble
of weak neutrino sources is therefore found by this test. The probability of a 3σ detection
would be 11% and 65% for 5 and 20 sources, respectively.
In an alternative approach the sky-map is tested for correlated events and distortions of
the angular distribution resulting from many weak sources. The sky-map is decomposed by
means of spherical harmonics and the power spectrum of their coefficients is analyzed. This
study will be presented elsewhere.

27
B. Source stacking results
The final data set has been searched for a signal due to the cumulative neutrino flux from
generic classes of active galactic nuclei. Recently, a source stacking analysis was performed
on data collected in the year 2000 [34, 60], defining samples of 10 classes of active galactic
nuclei, according to phenomenological selection criteria. The event sample extracted in this
work yields an increase in sensitivity by a factor 4 compared to [34, 60].
The number of sources in each class was optimized assuming a linear correlation between
the photon and the neutrino flux. The size of circular search bins was optimized according
to the point spread function of this analysis.
For each source class sample, the cumulative signal and the background expectation
are determined as the sum of the corresponding quantities of the individual sources. To
ensure a statistically correct treatment of overlapping search bins, events in the overlap area
contribute only once to the cumulative signal. The background estimation is also corrected
for the bin correlations.
None of the classes tested show a statistically significant excess over the background
expectations. Table V reports the 90% confidence level upper limits to the cumulative
neutrino flux, following the Feldman and Cousins ordering principle [39] and including a
Bayesian treatment of systematic errors [56, 57]. The limits include a systematic error
of 15% in the signal prediction (see Section V) and a statistical error in the background
estimation between 3% and 7%, depending on declination (Section VI). The limits do not
include the contribution from tau neutrinos.
VIII. SUMMARY
We have performed a search for point sources of high energy neutrinos in the northern sky
with the data collected with the AMANDA-II telescope in the years 2000 to 2004. Improved
event reconstruction and selection techniques have been applied, with special emphasis on
the energy spectrum of the Monte Carlo events passing the selection cuts and aiming at
good sensitivity to a large variety of possible signal energy spectra.
We selected the largest event sample ever extracted from data collected with a neutrino
telescope, consisting of 4282 upward going muon tracks with good reconstruction qual-

28
AGN class Nsrc nobs nb µ90 Φ0νµ
Φ0νµ
/Nsrc
GeV blazars 8 17 25.7 2.7 2.7 0.34
unidentified GeV sources 22 75 77.5 14.1 16.5 0.75
IR blazars 11 40 43.0 9.3 10.6 0.96
keV blazars (HEAO-A) 3 9 14.0 2.7 3.6 1.18
keV blazars (ROSAT) 8 31 33.4 8.3 9.7 1.20
TeV blazars 5 19 23.6 4.7 5.5 1.11
GPS and CSS 8 24 29.5 5.0 5.9 0.74
FR-I galaxies 1 3 3.1 4.3 4.1 4.11
FR-I without M87 17 40 57.2 2.7 2.9 0.17
FR-II galaxies 17 77 68.5 25.5 30.4 1.79
radio-weak quasars 11 35 41.6 5.6 6.7 0.61
TABLE V: Results of the stacking analysis for each AGN class: number of sources (Nsrc), num-
ber of expected background events (nb) and number of observed events (nobs). µ90 is the cu-
mulative event upper limit and Φ0νµ
is the upper limit to the cumulative muon flux, in units of
10−11 TeV−1 cm−2 s−1, for a spectral index γ=2. The last column gives the limits divided by the
number of sources (Φ0νµ
/Nsrc). These limits do not include the contribution of tau neutrinos.
ity. This is in agreement with a Monte Carlo simulation of atmospheric neutrinos yield-
ing 4600+300−1000(sys) events (Figure 1). The effects of oscillations of atmospheric neutrinos,
yielding muon neutrino disappearance and tau neutrino appearance are negligible and the
contribution of tau neutrinos to this event sample is below 0.5%.
In contrast to that, we emphasize that in case of cosmic neutrinos a contribution from
tau neutrinos is expected in the sample of up-going muon tracks selected in this analysis,
depending on declination and energy spectrum. We therefore also estimated the contribution
from charged current interactions of tau neutrinos followed by tau decay into a muon (with a
17.7% branching ratio). Under the assumption Φνµ+νµ/Φντ+ντ
=1 at the earth, the additional
contribution to the event sample from tau neutrinos, ranges from 10% to 16% for γ=2,
depending on declination.
The sensitivity to a point source flux of muon and tau neutrinos (and anti-neutrinos)
is Φ0νµ+νµ
+ Φ0ντ+ντ
= 10.0 · 10−11 TeV−1 cm−2 s−1, for 1001 effective days of exposure, in
the energy range between 1.6 TeV and 2.5 PeV and assuming a flavor ratio at earth of
Φ0νµ+νµ
/Φ0ντ+ντ
= 1. This is the declination-averaged sensitivity on the normalization factor
Φ0 to the flux dΦ
dE= Φ0 · ( E
1TeV)−γ
, assuming γ=2. The representation is different from our
previous papers, where the sensitivity was given to the integrated muon neutrino flux and
29
additionally the contribution from tau neutrinos was neglected. For this work the sensitivity
to the muon neutrino component of the flux would be Φ0νµ+νµ
= 1/2 (Φ0νµ+νµ
+ Φ0ντ+ντ
) =
5.0 · 10−11 TeV−1 cm−2 s−1.
The average experimentally observed upper limit of this analysis for γ=2, averaged over
declination and right ascension, is Φ0νµ+νµ
+ Φ0ντ+ντ
= 10.6 · 10−11 TeV−1 cm−2 s−1, without
systematic error and Φ0νµ+νµ
+ Φ0ντ +ντ
= 11.1·10−11 TeV−1 cm−2 s−1, including the systematic
error, consistent with the expected sensitivity. An overall improvement of approximately four
(1.5) times is achieved compared to the sensitivity after 197 (607) days of exposure [34, 35],
when neglecting the sensitivity to tau neutrinos in this comparison. The improvement is
due to the longer live-time and a refined event selection yielding a higher signal efficiency
and a better background rejection power.
We searched the sample of 4282 up-going muon tracks for a signal of cosmic origin, testing
first individual directions. Table IV reports the results of the searches on a catalog of 32
selected sources. The highest excess, with a pre-trial significance of 1.2σ, corresponds to the
direction of the blazar 3C 273. The highest excess from the full northern sky corresponds
to a pre-trial significance of 3.7σ (Figure 6). The probability of such a deviation or higher
due to background is 69%. We also performed a search based on the angular separation of
the events (Figure 9) and a stacking analysis of selected active galactic nuclei (Table V).
No indication of point sources of neutrinos was found. Therefore we present flux upper
limits for the 32 source candidates, assuming spectral indices γ=2 and γ=3, at a 90%
confidence level (Table IV). Additionally we provide a map of the flux upper limit for γ=2
for the full northern sky. We give the most stringent flux upper limits to date.
IX. ACKNOWLEDGMENTS
We acknowledge the support from the following agencies: National Science Foundation-
Office of Polar Program, National Science Foundation-Physics Division, University of Wis-
consin Alumni Research Foundation, Department of Energy, and National Energy Research
Scientific Computing Center (supported by the Office of Energy Research of the Department
of Energy), the NSF-supported TeraGrid system at the San Diego Supercomputer Center
(SDSC), and the National Center for Supercomputing Applications (NCSA); Swedish Re-
search Council, Swedish Polar Research Secretariat, and Knut and Alice Wallenberg Foun-

30
dation, Sweden; German Ministry for Education and Research, Deutsche Forschungsgemein-
schaft (DFG), Germany; Fund for Scientific Research (FNRS-FWO), Flanders Institute to
encourage scientific and technological research in industry (IWT), Belgian Federal Office for
Scientific, Technical and Cultural affairs (OSTC); the Netherlands Organisation for Scien-
tific Research (NWO); M. Ribordy acknowledges the support of the SNF (Switzerland); J.
D. Zornoza acknowledges the Marie Curie OIF Program (contract 007921).
[1] E. Andres et al. (The AMANDA Collaboration), Astropart. Phys. 13, 1 (2000).
[2] B. Link and F. Burgio, Phys. Rev. Lett. 94, 181101 (2005).
[3] L. Anchordoqui et al., Astrophys. J. 589, 481 (2003).
[4] F. Aharonian et al., J. Phys. Conf. 39, 408 (2006).
[5] D. Torres and F. Halzen (2006), submitted to Astron. Astrophys., astro-ph/0607368.
[6] C. Distefano et al., Astrophys. J. 575, 378 (2002).
[7] W. Bednarek et al., New Astron. Rev. 49, 1 (2005).
[8] F. Stecker, Phys. Rev. D 72, 107301 (2005).
[9] J. Alvarez-Muniz and P. Meszaros, Phys. Rev. D 70, 123001 (2004).
[10] K. Mannheim, Phys. Rev. D 63, 023003 (2001).
[11] A. Muecke and R. J. Protheroe, Astropart. Phys. 15, 121 (2001).
[12] A. Muecke et al., Astropart. Phys. 18, 593 (2003).
[13] A. Neronov and D. Semikoz, Phys. Rev. D 66, 123003 (2002).
[14] J. Learned and K. Mannheim, Ann. Rev. Nucl. Part. Sci. 50, 679 (2000).
[15] J. Ahrens et al. (The AMANDA Collaboration), Phys. Rev. Lett. 90, 251101 (2003).
[16] M. Ackermann et al. (The AMANDA Collaboration), Astropart. Phys. 22, 127 (2004).
[17] V. Aynutdinov et al., Astropart. Phys. 25, 140 (2006).
[18] W. Rhode et al., Astropart. Phys. 4, 217 (1996).
[19] M. Ambrosio et al., Astropart. Phys. 19, 1 (2003).
[20] K. Abe et al. (2006), submitted.
[21] M. Ambrosio et al., Astrophys. J. 546, 1038 (2001).
[22] R. Svoboda et al., Astrophys. J. 444, 415 (1995).
[23] H. Adarkar et al., Astrophys. J. 380, 235 (1993).

31
[24] Y. Oyama et al., Phys. Rev. D 39, 1481 (1989).
[25] P. Lipari, Astropart. Phys. 1, 195 (1993).
[26] M. Honda et al., Phys. Rev. D 70, 043008 (2004).
[27] J. Ahrens et al. (The AMANDA Collaboration), Nucl. Instrum. Meth. A 524, 169 (2004).
[28] A. Gazizov and M. Kowalski, Comput. Phys. Commun. 172, 203 (2005).
[29] K. Hagiwara et al., Phys. Rev. D 66, 010001 (2002).
[30] T. Gaisser et al., Phys. Rept. 258, 173 (1995).
[31] F. Halzen and D. Hooper, Rept. Prog. Phys. 65, 1025 (2002).
[32] M. Ackermann et al. (The AMANDA Collaboration), J. Geophys. Res. 111, D13203 (2006).
[33] J. Ahrens et al. (The AMANDA Collaboration), Astrophys. J. 583, 1040 (2003).
[34] J. Ahrens et al. (The AMANDA Collaboration), Phys. Rev. Lett. 92, 071102 (2004).
[35] M. Ackermann et al. (The AMANDA Collaboration), Phys. Rev. D 71, 077102 (2005).
[36] A. Pohl, Licentiate thesis, Uppsala Universitet (2004).
[37] T. Neunhoffer, Astropart. Phys. 25, 220 (2006).
[38] G. Hill and K. Rawlins, Astropart. Phys. 19, 393 (2003).
[39] G. Feldman and R. Cousins, Phys. Rev. D 57, 3873 (1998).
[40] J. Ahrens et al. (The AMANDA Collaboration), Phys. Rev. D 66, 012005 (2002).
[41] S. Eidelman et al., Phys. Lett. B B592, 1 (2004), http://pdg.lbl.gov.
[42] T. Kashti and E. Waxman, Phys. Rev. Lett. 95, 181101 (2005).
[43] Y. Ashie et al., Phys. Rev. D 71, 112005 (2005).
[44] M. Ackermann, Ph.D. thesis, Humboldt-Universitat, Berlin (2006).
[45] T. Gaisser and M. Honda, Ann. Rev. Nucl. Part. Sci. 52, 153 (2002).
[46] J. Ahrens et al. (The AMANDA Collaboration), Phys. Rev. D 67, 012003 (2003).
[47] W. Lowry, Fundamentals of Geophysics (Cambridge University Press, 1997).
[48] E. Berger et al. (The CTEQ Collaboration) (2005), uRL, www.phys.psu.edu/ cteq/.
[49] J. Pumplin et al., Journal of High Energy Physics 07 (2002).
[50] E. Bugaev, I. Sokalski, and S. Klimushin (2000), hep-ph/0010323.
[51] E. Bugaev et al., Astropart. Phys. 21, 491 (2004).
[52] T. Gaisser, Cosmic rays and Particle physics (Cambridge University Press, 1990).
[53] R. Hartman et al., Astrophys. J. Suppl. Ser. 123, 79 (1999).
[54] F. Aharonian et al., Astron. Astrophys. 370, 112 (2001).
32
[55] Y. Butt et al., Astrophys. J. 497, 494 (2003).
[56] G. Hill, Phys. Rev. D 67, 118101 (2003).
[57] J. Conrad et al., Phys. Rev. D 67, 012002 (2003).
[58] T. Hauschildt, Ph.D. thesis, Humboldt-Universitat, Berlin (2004).
[59] T. Neunhoffer and L. Kopke, Nucl. Instrum. Meth. A 558, 561 (2006).
[60] A. Achterberg et al. (The IceCube Collaboration) (2006), On the selection of AGN neutrino
source candidates for a source stacking analysis with neutrino telescopes, accepted by As-
tropart. Phys.